UNITED STATES
SECURITIES AND EXCHANGE COMMISSION
Washington, D.C. 20549
FORM N-CSR
CERTIFIED SHAREHOLDER REPORT OF REGISTERED
MANAGEMENT INVESTMENT COMPANIES
Investment Company Act file number 811-07896
GAMCO Global Series Funds, Inc.
(Exact name of registrant as specified in charter)
One Corporate Center
Rye, New York 10580-1422
(Address of principal executive offices) (Zip code)
Bruce N. Alpert
Gabelli Funds, LLC
One Corporate Center
Rye, New York 10580-1422
(Name and address of agent for service)
Registrant’s telephone number, including area code: 1-800-422-3554
Date of fiscal year end: December 31
Date of reporting period: December 31, 2011
Form N-CSR is to be used by management investment companies to file reports with the Commission not later than 10 days after the transmission to stockholders of any report that is required to be transmitted to stockholders under Rule 30e-1 under the Investment Company Act of 1940 (17 CFR 270.30e-1). The Commission may use the information provided on Form N-CSR in its regulatory, disclosure review, inspection, and policymaking roles.
A registrant is required to disclose the information specified by Form N-CSR, and the Commission will make this information public. A registrant is not required to respond to the collection of information contained in Form N-CSR unless the Form displays a currently valid Office of Management and Budget (“OMB”) control number. Please direct comments concerning the accuracy of the information collection burden estimate and any suggestions for reducing the burden to Secretary, Securities and Exchange Commission, 100 F Street, NE, Washington, DC 20549. The OMB has reviewed this collection of information under the clearance requirements of 44 U.S.C. § 3507.
Item 1. Reports to Stockholders.
The Report to Shareholders is attached herewith.
The GAMCO Vertumnus Fund
Annual Report — December 31, 2011

Mario J. Gabelli, CFA
To Our Shareholders,
The Sarbanes-Oxley Act requires a fund’s principal executive and financial officers to certify the entire contents of the semiannual and annual shareholder reports in a filing with the Securities and Exchange Commission (“SEC”) on Form N-CSR. This certification would cover the portfolio manager’s commentary and subjective opinions if they are attached to or a part of the financial statements. Many of these comments and opinions would be difficult or impossible to certify.
Because we do not want our portfolio managers to eliminate their opinions and/or restrict their commentary to historical facts, we have separated their commentary from the financial statements and investment portfolio and have sent it to you separately. Both the commentary and the financial statements, including the portfolio of investments, will be available on our website at www.gabelli.com.
Performance Discussion (Unaudited)
For the year ended December 31, 2011, the net asset value (“NAV”) per Class AAA Share of The GAMCO Vertumnus Fund declined 6.9% compared with decreases of 5.7% and 7.6% for the Bank of America Merrill Lynch Global 300 Convertible Index and the Morgan Stanley Capital International (“MSCI”) World Free Index, respectively. See page 2 for additional performance information.
Enclosed are the schedule of investments and financial statements as of December 31, 2011.
In the face of a number of macro shocks and increased global uncertainty, convertibles the world over underperformed in 2011. Convertible returns generally moved in tandem with their respective equity markets throughout the year. The combination of this year’s major events: the earthquake and nuclear disaster in Fukushima, the political brinksmanship over the debt ceiling in the U.S. which led to the country losing its AAA rating, and the ongoing European sovereign debt crisis, combined to make this an especially harsh period for the asset class. The combination of major negative events, headline driven volatility of markets, and credit spread widening all worked to drive convertibles lower.
After outperforming in 2010, the U.S. convertibles market declined in 2011, losing 5.2% on a total return basis, trailing the Dow Jones Industrials Average, S&P 500, Russell 1000, U.S. Treasuries, and both high grade and high yield corporate bonds.
Summarizing constituent performance for 2011 by quality, size, and type, using component data from Barclay’s Convertibles Index, reveals the following: on a ratings basis, investment grade converts outperformed speculative grade (high yield and non-rated) converts by a wide margin. This performance was likely attributable to the widening of credit spreads, especially during periods of extreme market volatility such as the third quarter. By market capitalization, convertible securities of mid cap companies had 2011 total returns of (2.4)%, suffering less than both large caps and small caps, which were down (7.2)% and (4.6)%, respectively. A comparison by convertible type style shows that cash-pay and preferreds fared better than both zero coupon and mandatories in 2011.
Selected holdings that contributed positively to performance in 2011 were Merck & Co. (2.0% of net assets as of December 31, 2011), the second largest healthcare company in the world; Pfizer Inc., (1.1%), the world’s largest pharmaceutical company; and Roche Holdings (2.3%) based in Switzerland, one the world’s leading healthcare companies. Some of our weaker performing stocks during the year were JPMorgan Chase & Co., a leading financial services firm, and Telekom Austria (0.4%), the largest communications company in Austria.
We appreciate your confidence and trust.
| | |
| | Sincerely yours, |
| |
| |  |
| |
February 22, 2012 | | Bruce N. Alpert President |
Comparative Results
| | | | | | | | | | | | | | | | |
Average Annual Returns through December 31, 2011 (a) (Unaudited) | |
| | | 1 Year | | | 5 Year | | | 10 Year | | | Since
Inception
(2/3/94) | |
Class AAA (GAGCX) | | | (6.88 | )% | | | (1.92 | )% | | | 3.21 | % | | | 4.15 | % |
Bank Of America Merrill Lynch Global 300 Convertible Index | | | (5.67 | ) | | | 2.83 | | | | 5.97 | | | | 6.18 | (d) |
MSCI World Free Index | | | (7.63 | ) | | | (4.43 | ) | | | 1.66 | | | | 3.51 | (e) |
Lipper Convertible Securities Fund Average | | | (5.23 | ) | | | 2.56 | | | | 5.10 | | | | 6.89 | |
Class A (GAGAX) | | | (6.65 | ) | | | (1.86 | ) | | | 3.27 | | | | 4.17 | |
With sales charge (b) | | | (12.02 | ) | | | (3.01 | ) | | | 2.66 | | | | 3.83 | |
Class C (GACCX) | | | (7.55 | ) | | | (2.72 | ) | | | 2.46 | | | | 3.71 | |
With contingent deferred sales charge (c) | | | (8.47 | ) | | | (2.72 | ) | | | 2.46 | | | | 3.71 | |
Class I (GAGIX) | | | (6.37 | ) | | | (1.68 | ) | | | 3.34 | | | | 4.22 | |
In the current prospectus dated April 29, 2011, the gross expense ratios for Class AAA, A, C, and I Shares are 2.87%, 2.87%, 3.62%, and 2.62%, respectively, and the net expense ratios in the current prospectus for these share classes are 2.02%, 2.02%, 2.77%, and 1.77%, respectively. Class AAA and Class I Shares do not have a sales charge. See page 9 for the expense ratios for the year ended December 31, 2011. The maximum sales charge for Class A and C Shares is 5.75% and 1.00%, respectively.
| | (a) | Returns represent past performance and do not guarantee future results. Total returns and average annual returns reflect changes in share price, reinvestment of dividends and are net of expenses. Investment returns and the principal value of an investment will fluctuate. When shares are redeemed, they may be worth more or less than their original cost. The Fund imposes a 2% redemption fee on shares sold or exchanged within seven days after the date of purchase. Current performance may be lower or higher than the performance data presented. Returns would have been lower had the Adviser not reimbursed certain expenses of the Fund. Visit www.gabelli.com for performance information as of the most recent month end. Investors should carefully consider the investment objectives, risks, charges, and expenses of the Fund before investing. The prospectus contains information about these and other matters and should be read carefully before investing. Investing in foreign securities involves risks not ordinarily associated with investments in domestic issues, including currency fluctuation, economic and political risks. The Class AAA Share NAVs are used to calculate performance for the periods prior to the issuance of Class A Shares, Class C Shares, and Class I Shares on May 2, 2001, November 26, 2001, and January 11, 2008, respectively. The actual performance of the Class C Shares would have been lower due to the additional expenses associated with this class of shares. The actual performance of the Class I Shares would have been higher due to lower expenses related to this class of shares. The Bank of America Merrill Lynch Global 300 Convertible Index is an unmanaged global convertible index composed of companies representative of the market structure of countries in North America, Europe, and the Asia/Pacific region. The MSCI World Free Index is an unmanaged free float adjusted market capitalization weighted index composed of companies representative of the market structure of developed market countries in North America, Europe, and the Asia/Pacific region. The Lipper Convertible Securities Fund Average reflects the performance of mutual funds classified in this particular category. Dividends are considered reinvested. You cannot invest directly in an index. | |
| | (b) | Performance results include the effect of the maximum 5.75% sales charge at the beginning of the period. | |
| | (c) | Assuming payment of the 1% maximum contingent deferred sales charge imposed on redemptions made within one year of purchase. | |
| | (d) | There is no data available for the Bank of America Merrill Lynch Global 300 Convertible Index prior to December 31, 1994. | |
| | (e) | MSCI World Free Index since inception performance is as of January 31, 1994. | |
COMPARISON OF CHANGE IN VALUE OF A $10,000 INVESTMENT IN THE GAMCO VERTUMNUS FUND (CLASS AAA SHARES), LIPPER CONVERTIBLE SECURITIES FUND AVERAGE, AND MSCI WORLD FREE INDEX (Unaudited)
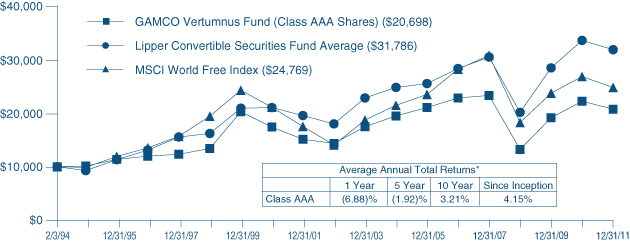
| * | Past performance is not predictive of future results. The performance tables and graph do not reflect the deduction of taxes that a shareholder would pay on Fund distributions or the redemption of Fund shares. |
2
The GAMCO Vertumnus Fund
Disclosure of Fund Expenses (Unaudited)
For the Six Month Period from July 1, 2011 through December 31, 2011
Expense Table
We believe it is important for you to understand the impact of fees and expenses regarding your investment. All mutual funds have operating expenses. As a shareholder of a fund, you incur ongoing costs, which include costs for portfolio management, administrative services, and shareholder reports (like this one), among others. Operating expenses, which are deducted from a fund’s gross income, directly reduce the investment return of a fund. When a fund’s expenses are expressed as a percentage of its average net assets, this figure is known as the expense ratio. The following examples are intended to help you understand the ongoing costs (in dollars) of investing in your Fund and to compare these costs with those of other mutual funds. The examples are based on an investment of $1,000 made at the beginning of the period shown and held for the entire period.
The Expense Table below illustrates your Fund’s costs in two ways:
Actual Fund Return: This section provides information about actual account values and actual expenses. You may use this section to help you to estimate the actual expenses that you paid over the period after any fee waivers and expense reimbursements. The “Ending Account Value” shown is derived from the Fund’s actual return during the past six months, and the “Expenses Paid During Period” shows the dollar amount that would have been paid by an investor who started with $1,000 in the Fund. You may use this information, together with the amount you invested, to estimate the expenses that you paid over the period.
To do so, simply divide your account value by $1,000 (for example, an $8,600 account value divided by $1,000 = 8.6), then multiply the result by the number given for your Fund under the heading “Expenses Paid During Period” to estimate the expenses you paid during this period.
Hypothetical 5% Return: This section provides information about hypothetical account values and hypothetical expenses based on the Fund’s actual expense ratio. It assumes a hypothetical annualized return of 5% before expenses during the period shown.
In this case – because the hypothetical return used is not the Fund’s actual return – the results do not apply to your investment and you cannot use the hypothetical account value and expense to estimate the actual ending account balance or expenses you paid for the period. This example is useful in making comparisons of the ongoing costs of investing in the Fund and other funds. To do so, compare this 5% hypothetical example with the 5% hypothetical examples that appear in shareholder reports of other funds.
Please note that the expenses shown in the table are meant to highlight your ongoing costs only and do not reflect any transactional costs such as sales charges (loads), redemption fees, or exchange fees, if any, which would be described in the Prospectus. If these costs were applied to your account, your costs would be higher. Therefore, the 5% hypothetical return is useful in comparing ongoing costs only, and will not help you determine the relative total costs of owning different funds. The “Annualized Expense Ratio” represents the actual expenses for the last six months and may be different from the expense ratio in the Financial Highlights which is for the year ended December 31, 2011.
| | | | | | | | | | | | | | | | |
| | | Beginning
Account
Value
07/01/11 | | | Ending
Account
Value
12/31/11 | | | Annualized
Expense
Ratio | | | Expenses
Paid
During
Period* | |
The GAMCO Vertumnus Fund | | | | | | | | | |
Actual Fund Return | | | | | | | | | |
| Class AAA | | | $1,000.00 | | | | $ 924.60 | | | | 2.02 | % | | | $ 9.80 | |
| Class A | | | $1,000.00 | | | | $ 924.70 | | | | 2.01 | % | | | $ 9.75 | |
| Class C | | | $1,000.00 | | | | $ 920.70 | | | | 2.76 | % | | | $ 13.36 | |
| Class I | | | $1,000.00 | | | | $ 926.20 | | | | 1.77 | % | | | $ 8.59 | |
Hypothetical 5% Return | | | | | | | | | | | | | |
| Class AAA | | | $1,000.00 | | | | $1,015.02 | | | | 2.02 | % | | | $ 10.26 | |
| Class A | | | $1,000.00 | | | | $1,015.07 | | | | 2.01 | % | | | $ 10.21 | |
| Class C | | | $1,000.00 | | | | $1,011.29 | | | | 2.76 | % | | | $ 13.99 | |
| Class I | | | $1,000.00 | | | | $1,016.28 | | | | 1.77 | % | | | $ 9.00 | |
* Expenses are equal to the Fund’s annualized expense ratio for the last six months multiplied by the average account value over the period, multiplied by the number of days in the most recent fiscal half year (184 days), then divided by 365.
3
Summary of Portfolio Holdings (Unaudited)
The following table presents portfolio holdings as a percent of net assets as of December 31, 2011:
The GAMCO Vertumnus Fund
| | | | |
Telecommunications | | | 15.2% | |
Metals and Mining | | | 12.5% | |
Computer Hardware | | | 12.1% | |
Health Care | | | 12.1% | |
Energy and Utilities | | | 11.6% | |
Financial Services | | | 8.3% | |
Diversified Industrial | | | 6.5% | |
Commercial Services | | | 5.1% | |
Business Services | | | 3.6% | |
Aerospace | | | 2.2% | |
| | | | |
Consumer Products | | | 1.9% | |
Electronics | | | 1.8% | |
Computer Software and Services | | | 1.8% | |
Aviation | | | 1.4% | |
Entertainment | | | 1.3% | |
Food and Beverage | | | 1.0% | |
U.S. Government Obligations | | | 0.9% | |
Retail | | | 0.7% | |
Broadcasting | | | 0.0% | |
Other Assets and Liabilities (Net) | | | 0.0% | |
| | | | |
| | | 100.0% | |
| | | | |
The Fund files a complete schedule of portfolio holdings with the SEC for the first and third quarters of each fiscal year on Form N-Q. Shareholders may obtain this information at www.gabelli.com or by calling the Fund at 800-GABELLI (800-422-3554). The Fund’s Form N-Q is available on the SEC’s website at www.sec.gov and may also be reviewed and copied at the SEC’s Public Reference Room in Washington, DC. Information on the operation of the Public Reference Room may be obtained by calling 800-SEC-0330.
Proxy Voting
The Fund files Form N-PX with its complete proxy voting record for the twelve months ended June 30th, no later than August 31st of each year. A description of the Fund’s proxy voting policies, procedures, and how the Fund voted proxies relating to portfolio securities is available without charge, upon request, by (i) calling 800-GABELLI (800-422-3554); (ii) writing to The Gabelli Funds at One Corporate Center, Rye, NY 10580-1422; or (iii) visiting the SEC’s website at www.sec.gov.
4
The GAMCO Vertumnus Fund
Schedule of Investments — December 31, 2011
| | | | | | | | | | | | |
Principal
Amount | | | | | Cost | | | Market
Value | |
| | | | | | | | | | | | |
| | |
| | | | CONVERTIBLE CORPORATE BONDS — 85.3% | | | | | |
| | | | Aviation — 1.4% | | | | | | | | |
| $ | 50,000 | | | Textron Inc., Ser. TXT, Cv., 4.500%, 05/01/13 | | $ | 50,000 | | | $ | 77,000 | |
| | | | | | | | | | | | |
| | | |
| | | | Broadcasting — 0.0% | | | | | | | | |
| | 400,000 | | | Citadel Broadcasting Corp., Sub. Deb. Cv., Escrow, 4.000%, 02/11/20† (a) | | | 0 | | | | 0 | |
| | | | | | | | | | | | |
| | | |
| | | | Business Services — 3.6% | | | | | | | | |
| | 200,000 | | | The Interpublic Group of Companies Inc., Cv.,
4.250%, 03/15/23 | | | 189,036 | | | | 203,250 | |
| | | | | | | | | | | | |
| | | |
| | | | Commercial Services — 5.1% | | | | | | | | |
| | 300,000 | | | The Providence Service Corp., Sub. Deb. Cv.,
6.500%, 05/15/14 | | | 281,186 | | | | 289,500 | |
| | | | | | | | | | | | |
| | | |
| | | | Computer Hardware — 12.1% | | | | | | | | |
| | 700,000 | | | SanDisk Corp., Cv.,
1.000%, 05/15/13 (b) | | | 598,801 | | | | 685,125 | |
| | | | | | | | | | | | |
| | |
| | | | Computer Software and Services — 1.8% | | | | | |
| | 100,000 | | | Mentor Graphics Corp., Sub. Deb. Cv., 4.000%, 04/01/31 (c) | | | 99,005 | | | | 101,625 | |
| | | | | | | | | | | | |
| | | |
| | | | Consumer Products — 1.9% | | | | | | | | |
| | 400,000 | | | Eastman Kodak Co., Cv., 7.000%, 04/01/17 | | | 318,464 | | | | 107,000 | |
| | | | | | | | | | | | |
| | | |
| | | | Diversified Industrial — 6.5% | | | | | | | | |
| | 200,000 | | | GenCorp Inc., Sub. Deb. Cv., 4.063%, 12/31/39 | | | 168,108 | | | | 181,250 | |
| | 200,000 | | | Griffon Corp., Sub. Deb. Cv., 4.000%, 01/15/17 (c) | | | 200,000 | | | | 190,000 | |
| | | | | | | | | | | | |
| | | | | | | 368,108 | | | | 371,250 | |
| | | | | | | | | | | | |
| | | |
| | | | Electronics — 0.9% | | | | | | | | |
| | 52,000 | | | Advanced Micro Devices Inc., Cv., 5.750%, 08/15/12 | | | 49,414 | | | | 52,780 | |
| | | | | | | | | | | | |
| | | |
| | | | Energy and Utilities — 10.4% | | | | | | | | |
| | 350,000 | | | Covanta Holding Corp., Cv., 3.250%, 06/01/14 | | | 350,000 | | | | 366,625 | |
| | 300,000 | | | JA Solar Holdings Co. Ltd., Cv., 4.500%, 05/15/13 | | | 294,471 | | | | 222,000 | |
| | | | | | | | | | | | |
| | | | | | | 644,471 | | | | 588,625 | |
| | | | | | | | | | | | |
| | | |
| | | | Entertainment — 1.3% | | | | | | | | |
| | 50,000 | | | Take-Two Interactive Software Inc., Cv., 4.375%, 06/01/14 | | | 50,000 | | | | 72,125 | |
| | | | | | | | | | | | |
| | | |
| | | | Financial Services — 7.8% | | | | | | | | |
| | 200,000 | | | CompuCredit Holdings Corp., Cv., 3.625%, 05/30/25 | | | 100,643 | | | | 197,000 | |
| | 250,000 | | | Janus Capital Group Inc., Cv., 3.250%, 07/15/14 | | | 250,000 | | | | 246,875 | |
| | | | | | | | | | | | |
| | | | | | | 350,643 | | | | 443,875 | |
| | | | | | | | | | | | |
| | | | | | | | | | | | |
Principal
Amount | | | | | Cost | | | Market
Value | |
| | | | | | | | | | | | |
| | | |
| | | | Health Care — 6.7% | | | | | | | | |
| $ | 400,000 | | | Chemed Corp., Cv., 1.875%, 05/15/14 | | $ | 374,880 | | | $ | 377,000 | |
| | | | | | | | | | | | |
| | | |
| | | | Metals and Mining — 12.5% | | | | | | | | |
| | 100,000 | | | Alcoa Inc., Cv.,
5.250%, 03/15/14 | | | 100,000 | | | | 151,750 | |
| | 200,000 | | | Kinross Gold Corp., Cv., 1.750%, 03/15/28 (c) | | | 202,111 | | | | 196,250 | |
| | 250,000 | | | Newmont Mining Corp., Ser. B, Cv., 1.625%, 07/15/17 (b) | | | 328,551 | | | | 361,875 | |
| | | | | | | | | | | | |
| | | | | | | 630,662 | | | | 709,875 | |
| | | | | | | | | | | | |
| | | |
| | | | Telecommunications — 13.3% | | | | | | | | |
| | 450,000 | | | NII Holdings Inc., Cv., 3.125%, 06/15/12 | | | 447,679 | | | | 455,063 | |
| | 20,000,000 | (d) | | Softbank Corp., Cv., 1.500%, 03/31/13 | | | 239,403 | | | | 300,284 | |
| | | | | | | | | | | | |
| | | | | | | 687,082 | | | | 755,347 | |
| | | | | | | | | | | | |
| | | | TOTAL CONVERTIBLE CORPORATE BONDS | | | 4,691,752 | | | | 4,834,377 | |
| | | | | | | | | | | | |
| | | |
| | | | CORPORATE BONDS — 1.9% | | | | | | | | |
| | | | Energy and Utilities — 1.2% | | | | | | | | |
| | 200,000 | | | Texas Competitive Electric Holdings Co. LLC, Ser. B, 10.250%, 11/01/15 | | | 130,168 | | | | 70,000 | |
| | | | | | | | | | | | |
| | | |
| | | | Retail — 0.7% | | | | | | | | |
| | 1,900,000 | | | The Great Atlantic & Pacific Tea Co. Inc., 5.125%, 06/15/12† | | | 33,250 | | | | 38,000 | |
| | | | | | | | | | | | |
| | | | TOTAL CORPORATE BONDS | | | 163,418 | | | | 108,000 | |
| | | | | | | | | | | | |
Shares | | | | | | | | | |
| | | |
| | | | COMMON STOCKS — 11.9% | | | | | | | | |
| | | | Aerospace — 2.2% | | | | | | | | |
| | 1,000 | | | Goodrich Corp. | | | 120,875 | | | | 123,700 | |
| | | | | | | | | | | | |
| | | |
| | | | Electronics — 0.9% | | | | | | | | |
| | 1,000 | | | Netlogic Microsystems Inc.† | | | 48,164 | | | | 49,570 | |
| | | | | | | | | | | | |
| | | |
| | | | Financial Services — 0.5% | | | | | | | | |
| | 500 | | | Royal Bank of Canada | | | 27,160 | | | | 25,480 | |
| | | | | | | | | | | | |
| | | |
| | | | Food and Beverage — 1.0% | | | | | | | | |
| | 1,000 | | | Nestlé SA | | | 54,883 | | | | 57,490 | |
| | | | | | | | | | | | |
| | | |
| | | | Health Care — 5.4% | | | | | | | | |
| | 3,000 | | | Merck & Co. Inc. | | | 102,332 | | | | 113,100 | |
| | 3,000 | | | Pfizer Inc. | | | 54,795 | | | | 64,920 | |
| | 3,000 | | | Roche Holding AG, ADR | | | 112,245 | | | | 127,650 | |
| | | | | | | | | | | | |
| | | | | | | 269,372 | | | | 305,670 | |
| | | | | | | | | | | | |
See accompanying notes to financial statements.
5
The GAMCO Vertumnus Fund
Schedule of Investments (Continued) — December 31, 2011
| | | | | | | | | | | | |
Shares | | | | | Cost | | | Market
Value | |
| | | | | | | | | | | | |
| | | |
| | | | COMMON STOCKS (Continued) | | | | | | | | |
| | | | Telecommunications — 1.9% | | | | | | | | |
| | 1,000 | | | AT&T Inc. | | $ | 28,721 | | | $ | 30,240 | |
| | 2,000 | | | Telekom Austria AG | | | 25,486 | | | | 23,912 | |
| | 2,000 | | | Vodafone Group plc, ADR | | | 51,310 | | | | 56,060 | |
| | | | | | | | | | | | |
| | | | | | | 105,517 | | | | 110,212 | |
| | | | | | | | | | | | |
| | | | TOTAL COMMON STOCKS | | | 625,971 | | | | 672,122 | |
| | | | | | | | | | | | |
Principal
Amount | | | | | | | | | |
| | |
| | | | U.S. GOVERNMENT OBLIGATIONS — 0.9% | | | | | |
| | $50,000 | | | U.S. Treasury Bill, 0.035%††, 05/17/12 | | | 49,993 | | | | 49,994 | |
| | | | | | | | | | | | |
| | | | TOTAL INVESTMENTS — 100.0% | | $ | 5,531,134 | | | | 5,664,493 | |
| | | | | | | | | | | | |
| | | | Other Assets and Liabilities (Net) — 0.0% | | | | (1,266 | ) |
| | | | | | | | | | | | |
| | | | NET ASSETS — 100.0% | | | $ | 5,663,227 | |
| | | | | | | | | | | | |
| (a) | Security fair valued under procedures established by the Board of Directors. The procedures may include reviewing available financial information about the company and reviewing the valuation of comparable securities and other factors on a regular basis. At December 31, 2011, the fair valued security had no market value. |
| (b) | Securities, or a portion thereof, with a market value of $974,625 were pledged as collateral for securities sold on short sales during the year. |
| (c) | Security exempt from registration under Rule 144A of the Securities Act of 1933, as amended. These securities may be resold in transactions exempt from registration, normally to qualified institutional buyers. At December 31, 2011, the market value of Rule 144A securities amounted to $487,875 or 8.61% of net assets. |
| (d) | Principal amount denoted in Japanese Yen. |
| † | Non-income producing security. |
| †† | Represents annualized yield at date of purchase. |
| ADR | American Depositary Receipt |
See accompanying notes to financial statements.
6
The GAMCO Vertumnus Fund
Statement of Assets and Liabilities
December 31, 2011
| | | | |
Assets: | | | | |
Investments, at value (cost $5,531,134) | | $ | 5,664,493 | |
Foreign currency, at value (cost $1) | | | 1 | |
Cash | | | 4,725 | |
Receivable for Fund shares sold | | | 1,632 | |
Receivable from Adviser | | | 10,934 | |
Dividends and interest receivable | | | 46,632 | |
Prepaid expense | | | 19,524 | |
| | | | |
Total Assets | | | 5,747,941 | |
| | | | |
Liabilities: | | | | |
Payable to broker | | | 620 | |
Payable for Fund shares redeemed | | | 29,727 | |
Payable for distribution fees | | | 1,236 | |
Payable for shareholder communications expenses | | | 23,285 | |
Payable for legal and audit fees | | | 19,278 | |
Other accrued expenses | | | 10,568 | |
| | | | |
Total Liabilities | | | 84,714 | |
| | | | |
Net Assets (applicable to 1,517,271
shares outstanding) | | $ | 5,663,227 | |
| | | | |
Net Assets Consist of: | | | | |
Paid-in capital | | $ | 7,316,647 | |
Accumulated net investment income | | | 2,657 | |
Accumulated net realized loss on investments, securities sold short, and foreign currency transactions | | | (1,789,398 | ) |
Net unrealized appreciation on investments | | | 133,359 | |
Net unrealized depreciation on foreign currency translations | | | (38 | ) |
| | | | |
Net Assets | | $ | 5,663,227 | |
| | | | |
Shares of Capital Stock, each at $0.001 par value: | |
Class AAA: | | | | |
Net Asset Value, offering, and redemption price per share ($5,269,216 ÷ 1,410,999 shares outstanding; 75,000,000 shares authorized) | | | $3.73 | |
| | | | |
Class A: | | | | |
Net Asset Value and redemption price per share ($297,085 ÷ 79,244 shares outstanding; 50,000,000 shares authorized) | | | $3.75 | |
| | | | |
Maximum offering price per share (NAV÷ 0.9425, based on maximum sales charge of 5.75% of the offering price) | | | $3.98 | |
| | | | |
Class C: | | | | |
Net Asset Value and offering price per share ($41,539 ÷ 12,254 shares outstanding; 25,000,000 shares authorized) | | | $3.39 | (a) |
| | | | |
Class I: | | | | |
Net Asset Value, offering, and redemption price per share ($55,387 ÷ 14,774 shares outstanding; 25,000,000 shares authorized) | | | $3.75 | |
| | | | |
| (a) | Redemption price varies based on the length of time held. |
Statement of Operations
For the Year Ended December 31, 2011
| | | | |
Investment Income: | | | | |
Dividends (net of foreign withholding taxes of $1,797) | | $ | 33,585 | |
Interest | | | 311,243 | |
| | | | |
Total Investment Income | | | 344,828 | |
| | | | |
Expenses: | | | | |
Investment advisory fees | | | 73,175 | |
Distribution fees – Class AAA | | | 16,091 | |
Distribution fees – Class A | | | 1,760 | |
Distribution fees – Class C | | | 1,204 | |
Shareholder communications expenses | | | 49,253 | |
Custodian fees | | | 35,341 | |
Registration expenses | | | 28,183 | |
Shareholder services fees | | | 17,282 | |
Legal and audit fees | | | 11,644 | |
Directors’ fees | | | 1,948 | |
Interest expense | | | 1,464 | |
Miscellaneous expenses | | | 10,738 | |
| | | | |
Total Expenses | | | 248,083 | |
| | | | |
Less: | | | | |
Expenses reimbursed by Adviser (See Note 3) | | | (99,508 | ) |
| | | | |
Total Reimbursements | | | (99,508 | ) |
| | | | |
Net Expenses | | | 148,575 | |
| | | | |
Net Investment Income | | | 196,253 | |
| | | | |
Net Realized and Unrealized Gain/(Loss) on Investments, Securities Sold Short, and Foreign Currency: | | | | |
Net realized gain on investments | | | 217,418 | |
Net realized gain on securities sold short | | | 46,859 | |
Net realized loss on foreign currency transactions | | | (54 | ) |
| | | | |
Net realized gain on investments, securities sold short, and foreign currency transactions | | | 264,223 | |
| | | | |
Net change in unrealized appreciation/depreciation: | | | | |
on investments | | | (876,172 | ) |
on foreign currency translations | | | (55 | ) |
| | | | |
Net change in unrealized appreciation/depreciation on investments and foreign currency translations | | | (876,227 | ) |
| | | | |
Net Realized and Unrealized Gain/(Loss) on Investments, Securities Sold Short, and Foreign Currency | | | (612,004 | ) |
| | | | |
Net Decrease in Net Assets Resulting from Operations | | $ | (415,751 | ) |
| | | | |
See accompanying notes to financial statements.
7
The GAMCO Vertumnus Fund
Statement of Changes in Net Assets
| | | | | | | | |
| | | Year Ended
December 31, 2011 | | | Year Ended
December 31, 2010 | |
Operations: | | | | | | | | |
Net investment income | | $ | 196,253 | | | $ | 187,336 | |
Net realized gain on investments, securities sold short, and foreign currency transactions | | | 264,223 | | | | 50,517 | |
Net change in appreciation/depreciation on investments and foreign currency translations | | | (876,227 | ) | | | 1,082,289 | |
| | | | | | | | |
Net Increase/(Decrease) in Net Assets Resulting from Operations | | | (415,751 | ) | | | 1,320,142 | |
| | | | | | | | |
Distributions to Shareholders: | | | | | | | | |
Net investment income | | | | | | | | |
Class AAA | | | (177,101 | ) | | | (199,211 | ) |
Class A | | | (15,427 | ) | | | (17,989 | ) |
Class B* | | | — | | | | (33 | ) |
Class C | | | (2,326 | ) | | | (3,686 | ) |
Class I | | | (1,859 | ) | | | (1,777 | ) |
| | | | | | | | |
Total Distributions to Shareholders | | | (196,713 | ) | | | (222,696 | ) |
| | | | | | | | |
Capital Share Transactions: | | | | | | | | |
Class AAA | | | (2,196,773 | ) | | | (672,695 | ) |
Class A | | | (773,043 | ) | | | 589,714 | |
Class B* | | | (1,671 | ) | | | 33 | |
Class C | | | (113,913 | ) | | | (21,895 | ) |
Class I | | | (8,827 | ) | | | (5,991 | ) |
| | | | | | | | |
Net Decrease in Net Assets from Capital Share Transactions | | | (3,094,227 | ) | | | (110,834 | ) |
| | | | | | | | |
Redemption Fees | | | 12 | | | | — | |
| | | | | | | | |
Net Increase/(Decrease) in Net Assets | | | (3,706,679 | ) | | | 986,612 | |
Net Assets: | | | | | | | | |
Beginning of period | | | 9,369,906 | | | | 8,383,294 | |
| | | | | | | | |
End of period (including undistributed net investment income of $2,657 and $0, respectively) | | $ | 5,663,227 | | | $ | 9,369,906 | |
| | | | | | | | |
| * | Class B Shares were fully redeemed and closed on July 5, 2011. |
See accompanying notes to financial statements.
8
The GAMCO Vertumnus Fund
Financial Highlights
Selected data for a share of capital stock outstanding throughout each period:
| | | | | | | | | | | | | | | | | | | | | | | | | | | | | | | | | | | | | | | | | | | | | | | | | | | | | | | | | | | | | | | | | | | | |
| | | | | | Income (Loss)
from Investment Operations | | | Distributions | | | | | | Ratios to Average Net Assets/
Supplemental Data | |
Period Ended
December 31 | | Net Asset
Value,
Beginning
of Period | | | Net
Investment
Income
(Loss)(a) | | | Net
Realized
and
Unrealized
Gain (Loss)
on
Investments | | | Total from
Investment
Operations | | | Net
Investment
Income | | | Net
Realized
Gain on
Investments | | | Return
of
Capital | | | Total
Distributions | | | Redemption
Fees(a)(b) | | | Net Asset
Value,
End of
Period | | | Total
Return† | | | Net Assets
End of
Period (in
000’s) | | | Net
Investment
Income
(Loss) | | | Operating
Expenses
Before
Reimburse-
ment | | | Operating
Expenses
Net of
Reimburse-
ment (c) | | | Dividend
Expense on
Securities
Sold Short | | | Portfolio
Turnover
Rate | |
Class AAA | |
2011 | | $ | 4.13 | | | $ | 0.11 | | | $ | (0.39 | ) | | $ | (0.28 | ) | | $ | (0.12 | ) | | | — | | | | — | | | $ | (0.12 | ) | | $ | 0.00 | | | $ | 3.73 | | | | (6.9 | )% | | $ | 5,269 | | | | 2.72 | % | | | 3.38 | % | | | 2.02 | % | | | — | | | | 45 | % |
2010 | | | 3.64 | | | | 0.08 | | | | 0.51 | | | | 0.59 | | | | (0.10 | ) | | | — | | | | — | | | | (0.10 | ) | | | — | | | | 4.13 | | | | 16.3 | | | | 8,018 | | | | 2.11 | | | | 2.87 | | | | 2.02 | | | | 0.01 | % | | | 68 | |
2009 | | | 2.62 | | | | 0.12 | | | | 1.03 | | | | 1.15 | | | | (0.13 | ) | | | — | | | | — | | | | (0.13 | ) | | | 0.00 | | | | 3.64 | | | | 44.7 | | | | 7,681 | | | | 3.87 | | | | 3.37 | | | | 2.04 | | | | — | | | | 62 | |
2008 | | | 4.77 | | | | 0.08 | | | | (2.11 | ) | | | (2.03 | ) | | | (0.12 | ) | | | — | | | | — | | | | (0.12 | ) | | | 0.00 | | | | 2.62 | | | | (43.2 | ) | | | 4,000 | | | | 1.88 | | | | 3.38 | | | | 2.02 | | | | — | | | | 110 | |
2007 | | | 5.48 | | | | (0.04 | ) | | | 0.16 | | | | 0.12 | | | | (0.19 | ) | | $ | (0.51 | ) | | $ | (0.13 | ) | | | (0.83 | ) | | | 0.00 | | | | 4.77 | | | | 2.1 | | | | 9,294 | | | | (0.70 | ) | | | 2.46 | | | | 2.12 | | | | — | | | | 141 | |
Class A | |
2011 | | $ | 4.14 | | | $ | 0.10 | | | $ | (0.37 | ) | | $ | (0.27 | ) | | $ | (0.12 | ) | | | — | | | | — | | | $ | (0.12 | ) | | $ | 0.00 | | | $ | 3.75 | | | | (6.7 | )% | | $ | 297 | | | | 2.47 | % | | | 3.38 | % | | | 2.02 | % | | | — | | | | 45 | % |
2010 | | | 3.65 | | | | 0.08 | | | | 0.51 | | | | 0.59 | | | | (0.10 | ) | | | — | | | | — | | | | (0.10 | ) | | | — | | | | 4.14 | | | | 16.3 | | | | 1,115 | | | | 2.16 | | | | 2.87 | | | | 2.02 | | | | 0.01 | % | | | 68 | |
2009 | | | 2.63 | | | | 0.12 | | | | 1.03 | | | | 1.15 | | | | (0.13 | ) | | | — | | | | — | | | | (0.13 | ) | | | 0.00 | | | | 3.65 | | | | 44.5 | | | | 472 | | | | 3.71 | | | | 3.37 | | | | 2.04 | | | | — | | | | 62 | |
2008 | | | 4.78 | | | | 0.10 | | | | (2.13 | ) | | | (2.03 | ) | | | (0.12 | ) | | | — | | | | — | | | | (0.12 | ) | | | 0.00 | | | | 2.63 | | | | (43.1 | ) | | | 196 | | | | 2.78 | | | | 3.38 | | | | 2.02 | | | | — | | | | 110 | |
2007 | | | 5.49 | | | | (0.04 | ) | | | 0.16 | | | | 0.12 | | | | (0.19 | ) | | $ | (0.51 | ) | | $ | (0.13 | ) | | | (0.83 | ) | | | 0.00 | | | | 4.78 | | | | 2.1 | | | | 57 | | | | (0.69 | ) | | | 2.45 | | | | 2.12 | | | | — | | | | 141 | |
Class C | |
2011 | | $ | 3.76 | | | $ | 0.07 | | | $ | (0.35 | ) | | $ | (0.28 | ) | | $ | (0.09 | ) | | | — | | | | — | | | $ | (0.09 | ) | | $ | 0.00 | | | $ | 3.39 | | | | (7.6 | )% | | $ | 42 | | | | 1.82 | % | | | 4.13 | % | | | 2.77 | % | | | — | | | | 45 | % |
2010 | | | 3.33 | | | | 0.05 | | | | 0.45 | | | | 0.50 | | | | (0.07 | ) | | | — | | | | — | | | | (0.07 | ) | | | — | | | | 3.76 | | | | 15.1 | | | | 166 | | | | 1.33 | | | | 3.62 | | | | 2.77 | | | | 0.01 | % | | �� | 68 | |
2009 | | | 2.41 | | | | 0.09 | | | | 0.94 | | | | 1.03 | | | | (0.11 | ) | | | — | | | | — | | | | (0.11 | ) | | | 0.00 | | | | 3.33 | | | | 43.5 | | | | 162 | | | | 2.96 | | | | 4.12 | | | | 2.79 | | | | — | | | | 62 | |
2008 | | | 4.43 | | | | 0.04 | | | | (1.94 | ) | | | (1.90 | ) | | | (0.12 | ) | | | — | | | | — | | | | (0.12 | ) | | | 0.00 | | | | 2.41 | | | | (43.6 | ) | | | 86 | | | | 1.11 | | | | 4.13 | | | | 2.77 | | | | — | | | | 110 | |
2007 | | | 5.19 | | | | (0.09 | ) | | | 0.16 | | | | 0.07 | | | | (0.19 | ) | | $ | (0.51 | ) | | $ | (0.13 | ) | | | (0.83 | ) | | | 0.00 | | | | 4.43 | | | | 1.2 | | | | 82 | | | | (1.65 | ) | | | 3.19 | | | | 2.87 | | | | — | | | | 141 | |
Class I | |
2011 | | $ | 4.14 | | | $ | 0.12 | | | $ | (0.38 | ) | | $ | (0.26 | ) | | $ | (0.13 | ) | | | — | | | | — | | | $ | (0.13 | ) | | $ | 0.00 | | | $ | 3.75 | | | | (6.4 | )% | | $ | 55 | | | | 3.01 | % | | | 3.13 | % | | | 1.77 | % | | | — | | | | 45 | % |
2010 | | | 3.66 | | | | 0.09 | | | | 0.50 | | | | 0.59 | | | | (0.11 | ) | | | — | | | | — | | | | (0.11 | ) | | | — | | | | 4.14 | | | | 16.4 | | | | 69 | | | | 2.37 | | | | 2.62 | | | | 1.77 | | | | 0.01 | % | | | 68 | |
2009 | | | 2.63 | | | | 0.13 | | | | 1.04 | | | | 1.17 | | | | (0.14 | ) | | | — | | | | — | | | | (0.14 | ) | | | 0.00 | | | | 3.66 | | | | 45.2 | | | | 67 | | | | 3.97 | | | | 3.12 | | | | 1.79 | | | | — | | | | 62 | |
2008(d) | | | 4.62 | | | | 0.08 | | | | (1.95 | ) | | | (1.87 | ) | | | (0.12 | ) | | | — | | | | — | | | | (0.12 | ) | | | 0.00 | | | | 2.63 | | | | (41.2 | ) | | | 29 | | | | 2.14 | (e) | | | 3.13 | (e) | | | 1.77 | (e) | | | — | | | | 110 | |
| † | | Total return represents aggregate total return of a hypothetical $1,000 investment at the beginning of the period and sold at the end of the period including reinvestment of distributions and does not reflect the applicable sales charges. Total return for a period of less than one year is not annualized. |
| (a) | | Per share amounts have been calculated using the average shares outstanding method. |
| (b) | | Amount represents less than $0.005 per share. |
| (c) | | The Fund incurred interest expense during the years ended December 31, 2011, 2010, 2008, and 2007. If interest expense had not been incurred, the ratios of operating expenses to average net assets would have been 2.00%, 2.01%, 2.00%, and 2.00% (Class AAA and Class A), 2.75%, 2.76%, 2.75%, and 2.75% (Class C), 1.75%, 1.76%, and 1.75% (Class I), respectively. For the year ended December 31, 2009, the effect of the interest expense was minimal. The Fund also incurred tax expense during the year ended December 31, 2009. If tax expense had not been incurred, the ratios of operating expenses to average net assets would have been 2.00% (Class AAA and Class A), 2.75% (Class C), and 1.75% (Class I), respectively. |
| (d) | | From the commencement of offering Class I Shares on January 11, 2008 through December 31, 2008. |
See accompanying notes to financial statements.
9
The GAMCO Vertumnus Fund
Notes to Financial Statements
1. Organization. Effective February 7, 2011, the Fund changed its name to The GAMCO Vertumnus Fund from the GAMCO Global Convertible Securities Fund, with a corresponding change in the name of each of its Classes of Shares. Coincident with the Board’s approval of these name changes, the Board also adopted a change to one of the Fund’s non-fundamental investment policies in order to give the portfolio manager enhanced investment management flexibility. Consequently, the Fund is no longer required to invest at least 40% of its total net assets in non-U.S. securities or related investments thereof, but the Fund will continue to invest in securities of issuers, or related investments thereof, located in at least three countries.
The GAMCO Vertumnus Fund, a series of GAMCO Global Series Funds, Inc. (the “Corporation”), was incorporated on July 16, 1993 in Maryland. The Fund is a non-diversified open-end management investment company registered under the Investment Company Act of 1940, as amended (the “1940 Act”), and one of four separately managed portfolios (collectively, the “Portfolios”) of the Corporation. The Fund’s primary objective is to obtain a high level of total return through a combination of income and capital appreciation. The Fund commenced investment operations on February 3, 1994.
2. Significant Accounting Policies. The Fund’s financial statements are prepared in accordance with U.S. Generally Accepted Accounting Principles (“GAAP”), which may require the use of management estimates and assumptions. Actual results could differ from those estimates. The following is a summary of significant accounting policies followed by the Fund in the preparation of its financial statements.
Security Valuation. Portfolio securities listed or traded on a nationally recognized securities exchange or traded in the U.S. over-the-counter market for which market quotations are readily available are valued at the last quoted sale price or a market’s official closing price as of the close of business on the day the securities are being valued. If there were no sales that day, the security is valued at the average of the closing bid and asked prices or, if there were no asked prices quoted on that day, then the security is valued at the closing bid price on that day. If no bid or asked prices are quoted on such day, the security is valued at the most recently available price or, if the Board of Directors (the “Board”) so determines, by such other method as the Board shall determine in good faith to reflect its fair market value. Portfolio securities traded on more than one national securities exchange or market are valued according to the broadest and most representative market, as determined by Gabelli Funds, LLC (the “Adviser”).
Portfolio securities primarily traded on a foreign market are generally valued at the preceding closing values of such securities on the relevant market, but may be fair valued pursuant to procedures established by the Board if market conditions change significantly after the close of the foreign market, but prior to the close of business on the day the securities are being valued. Debt instruments with remaining maturities of sixty days or less that are not credit impaired are valued at amortized cost, unless the Board determines such amount does not reflect the securities’ fair value, in which case these securities will be fair valued as determined by the Board. Debt instruments having a maturity greater than sixty days for which market quotations are readily available are valued at the average of the latest bid and asked prices. If there were no asked prices quoted on such day, the security is valued using the closing bid price. U.S. government obligations with maturities greater than sixty days are normally valued using a model that incorporates market observable data such as reported sales of similar securities, broker quotes, yields, bids, offers, and reference data. Certain securities are valued principally using dealer quotations.
10
The GAMCO Vertumnus Fund
Notes to Financial Statements (Continued)
Securities and assets for which market quotations are not readily available are fair valued as determined by the Board. Fair valuation methodologies and procedures may include, but are not limited to: analysis and review of available financial and non-financial information about the company; comparisons with the valuation and changes in valuation of similar securities, including a comparison of foreign securities with the equivalent U.S. dollar value ADR securities at the close of the U.S. exchange; and evaluation of any other information that could be indicative of the value of the security.
The inputs and valuation techniques used to measure fair value of the Fund’s investments are summarized into three levels as described in the hierarchy below:
| | • | | Level 1 — quoted prices in active markets for identical securities; |
| | • | | Level 2 — other significant observable inputs (including quoted prices for similar securities, interest rates, prepayment speeds, credit risk, etc.); and |
| | • | | Level 3 — significant unobservable inputs (including the Fund’s determinations as to the fair value of investments). |
A financial instrument’s level within the fair value hierarchy is based on the lowest level of any input both individually and in the aggregate that is significant to the fair value measurement. The inputs or methodology used for valuing securities are not necessarily an indication of the risk associated with investing in those securities. The summary of the Fund’s investments in securities by inputs used to value the Fund’s investments as of December 31, 2011 is as follows:
| | | | | | | | | | | | | | | | |
| | | Valuation Inputs | | | | |
| | | Level 1
Quoted Prices | | | Level 2 Other Significant
Observable Inputs | | | Level 3 Significant
Unobservable Inputs | | | Total Market Value
at 12/31/11 | |
INVESTMENTS IN SECURITIES: | | | | | | | | | | | | | | | | |
ASSETS (Market Value): | | | | | | | | | | | | | | | | |
Convertible Corporate Bonds (a) | | | — | | | $ | 4,834,377 | | | $ | 0 | | | $ | 4,834,377 | |
Corporate Bonds (a) | | | — | | | | 108,000 | | | | — | | | | 108,000 | |
Common Stocks (a) | | $ | 672,122 | | | | — | | | | — | | | | 672,122 | |
U.S. Government Obligations | | | — | | | | 49,994 | | | | — | | | | 49,994 | |
TOTAL INVESTMENTS IN SECURITIES – ASSETS | | $ | 672,122 | | | $ | 4,992,371 | | | $ | 0 | | | $ | 5,664,493 | |
(a) Please refer to the Schedule of Investments for the industry classifications of these portfolio holdings.
At December 31, 2010, the market value of Level 2 securities was $7,183,469, or 81.06% of total investments. The Providence Service Corp. convertible corporate bond was appropriately listed as a Level 1 security at that time. However, the security did not trade on December 30, 2011 and was valued at the most recently available price, resulting in a transfer of the bond to a Level 2 security. The beginning of period value of the securities that transferred from Level 1 to Level 2 during the year amounted to $300,000, or 5.30% of total investments.
The Fund’s policy is to recognize transfers among Levels as of the beginning of the reporting period.
In May 2011, the Financial Accounting Standards Board issued Accounting Standards Update (“ASU”) No. 2011-04 “Amendments to Achieve Common Fair Value Measurement and Disclosure Requirements in U.S. GAAP and International Financial Reporting Standards (“IFRS”).” ASU 2011-04 includes common requirements
11
The GAMCO Vertumnus Fund
Notes to Financial Statements (Continued)
for measurement of and disclosure about fair value between U.S. GAAP and IFRS. ASU 2011-04 will require reporting entities to disclose the following information for fair value measurements categorized within Level 3 of the fair value hierarchy: quantitative information about the unobservable inputs used in the fair value measurement, the valuation processes used by the reporting entity, and a narrative description of the sensitivity of the fair value measurement to changes in unobservable inputs and the interrelationships between those unobservable inputs. In addition, ASU 2011-04 will require reporting entities to make disclosures about amounts and reasons for all transfers into and out of Level 1 and Level 2 fair value measurements. The new and revised disclosures are effective for interim and annual reporting periods beginning after December 15, 2011. At this time, management is evaluating the implications of ASU 2011-04 and its impact on the financial statements.
Derivative Financial Instruments.
The Fund may engage in various portfolio investment strategies by investing in a number of derivative financial instruments for the purposes of hedging against changes in the value of its portfolio securities and in the value of securities it intends to purchase or hedging against a specific transaction with respect to either the currency in which the transaction is denominated or another currency. Investing in certain derivative financial instruments, including participation in the options, futures, or swap markets, entails certain execution, liquidity, hedging, tax, and securities, interest, credit, or currency market risks. Losses may arise if the Adviser’s prediction of movements in the direction of the securities, foreign currency, and interest rate markets is inaccurate. Losses may also arise if the counterparty does not perform its duties under a contract, or that, in the event of default, the Fund may be delayed in or prevented from obtaining payments or other contractual remedies owed to it under derivative contracts. The creditworthiness of the counterparties is closely monitored in order to minimize these risks. Participation in derivative transactions involves investment risks, transaction costs, and potential losses to which the Fund would not be subject absent the use of these strategies. The consequences of these risks, transaction costs, and losses may have a negative impact on the Fund’s ability to pay distributions.
The Fund’s derivative contracts held at December 31, 2011, if any, are not accounted for as hedging instruments under GAAP and are disclosed in the Schedule of Investments together with the related counterparty.
Securities Sold Short. The Fund may enter into short sale transactions. Short selling involves selling securities that may or may not be owned and, at times, borrowing the same securities for delivery to the purchaser, with an obligation to replace such borrowed securities at a later date. The proceeds received from short sales are recorded as liabilities and the Fund records an unrealized gain or loss to the extent of the difference between the proceeds received and the value of an open short position on the day of determination. The Fund records a realized gain or loss when the short position is closed out. By entering into a short sale, the Fund bears the market risk of an unfavorable change in the price of the security sold short. Dividends on short sales are recorded as an expense by the Fund on the ex-dividend date and interest expense is recorded on the accrual basis. The broker retains collateral for the value of the open positions, which is adjusted periodically as the value of the position fluctuates. At December 31, 2011, there were no short sales outstanding.
12
The GAMCO Vertumnus Fund
Notes to Financial Statements (Continued)
Foreign Currency Translations. The books and records of the Fund are maintained in U.S. dollars. Foreign currencies, investments, and other assets and liabilities are translated into U.S. dollars at current exchange rates. Purchases and sales of investment securities, income, and expenses are translated at the exchange rate prevailing on the respective dates of such transactions. Unrealized gains and losses that result from changes in foreign exchange rates and/or changes in market prices of securities have been included in unrealized appreciation/depreciation on investments and foreign currency translations. Net realized foreign currency gains and losses resulting from changes in exchange rates include foreign currency gains and losses between trade date and settlement date on investment securities transactions, foreign currency transactions, and the difference between the amounts of interest and dividends recorded on the books of the Fund and the amounts actually received. The portion of foreign currency gains and losses related to fluctuation in exchange rates between the initial purchase trade date and subsequent sale trade date is included in realized gain/(loss) on investments.
Foreign Securities. The Fund may directly purchase securities of foreign issuers. Investing in securities of foreign issuers involves special risks not typically associated with investing in securities of U.S. issuers. The risks include possible revaluation of currencies, the inability to repatriate funds, less complete financial information about companies, and possible future adverse political and economic developments. Moreover, securities of many foreign issuers and their markets may be less liquid and their prices more volatile than securities of comparable U.S. issuers.
Foreign Taxes. The Fund may be subject to foreign taxes on income, gains on investments, or currency repatriation, a portion of which may be recoverable. The Fund will accrue such taxes and recoveries as applicable, based upon its current interpretation of tax rules and regulations that exist in the markets in which it invests.
Restricted and Illiquid Securities. The Fund may invest up to 15% of its net assets in securities for which the markets are illiquid. Illiquid securities include securities the disposition of which is subject to substantial legal or contractual restrictions. The sale of illiquid securities often requires more time and results in higher brokerage charges or dealer discounts and other selling expenses than does the sale of securities eligible for trading on national securities exchanges or in the over-the-counter markets. Restricted securities may sell at a price lower than similar securities that are not subject to restrictions on resale. Securities freely saleable among qualified institutional investors under special rules adopted by the SEC may be treated as liquid if they satisfy liquidity standards established by the Board. The continued liquidity of such securities is not as well assured as that of publicly traded securities, and accordingly the Board will monitor their liquidity. The Fund held no illiquid securities at December 31, 2011. For the restricted securities the Fund held as of December 31, 2011, refer to the Schedule of Investments.
Securities Transactions and Investment Income. Securities transactions are accounted for on the trade date with realized gain or loss on investments determined by using the identified cost method. Interest income (including amortization of premium and accretion of discount) is recorded on the accrual basis. Premiums and discounts on debt securities are amortized using the effective yield to maturity method. Dividend income is recorded on the ex-dividend date, except for certain dividends from foreign securities that are recorded as soon after the ex-dividend date as the Fund becomes aware of such dividends.
13
The GAMCO Vertumnus Fund
Notes to Financial Statements (Continued)
Determination of Net Asset Value and Calculation of Expenses. Certain administrative expenses are common to, and allocated among, various affiliated funds. Such allocations are made on the basis of each fund’s average net assets or other criteria directly affecting the expenses as determined by the Adviser pursuant to procedures established by the Board.
In calculating the NAV per share of each class, investment income, realized and unrealized gains and losses, redemption fees, and expenses other than class specific expenses are allocated daily to each class of shares based upon the proportion of net assets of each class at the beginning of each day. Distribution expenses are borne solely by the class incurring the expense.
Custodian Fee Credits and Interest Expense. When cash balances are maintained in the custody account, the Fund receives credits which are used to offset custodian fees. The gross expenses paid under the custody arrangement are included in custodian fees in the Statement of Operations with the corresponding expense offset, if any, shown as “Custodian fee credits.” When cash balances are overdrawn, the Fund is charged an overdraft fee equal to 2.00% above the federal funds rate on outstanding balances. This amount, if any, would be included in the Statement of Operations.
Distributions to Shareholders. Distributions to shareholders are recorded on the ex-dividend date. Distributions to shareholders are based on income and capital gains as determined in accordance with federal income tax regulations, which may differ from income and capital gains as determined under GAAP. These differences are primarily due to differing treatments of income and gains on various investment securities and foreign currency transactions held by the Fund and timing differences. Distributions from net investment income for federal income tax purposes include net realized gains on foreign currency transactions. These book/tax differences are either temporary or permanent in nature. To the extent these differences are permanent; adjustments are made to the appropriate capital accounts in the period when the differences arise. Permanent differences were primarily due to the tax treatment of currency gains and losses, adjustments on investments in hybrid securities, and conversion of premiums from securities sold. These reclassifications have no impact on the NAV of the Fund. For the year ended December 31, 2011, reclassifications were made to decrease accumulated distributions in excess of net investment income by $10,038 and increase accumulated net realized loss on investments, securities sold short, and foreign currency transactions by $10,038.
The tax character of distributions paid during the years ended December 31, 2011 and December 31, 2010 was as follows:
| | | | | | | | |
| | | Year Ended
December 31, 2011 | | | Year Ended
December 31, 2010 | |
Distributions paid from: | | | | | | | | |
Ordinary income | | $ | 196,713 | | | $ | 222,696 | |
Provision for Income Taxes. The Fund intends to continue to qualify as a regulated investment company under Subchapter M of the Internal Revenue Code of 1986, as amended (the “Code”). It is the policy of the Fund to comply with the requirements of the Code applicable to regulated investment companies and to distribute substantially all of its net investment company taxable income and net capital gains. Therefore, no provision for federal income taxes is required.
14
The GAMCO Vertumnus Fund
Notes to Financial Statements (Continued)
As of December 31, 2011, the components of accumulated earnings/losses on a tax basis were as follows:
| | | | |
Accumulated capital loss carryforwards | | $ | (1,789,374 | ) |
Undistributed ordinary income | | | 5,429 | |
Net unrealized appreciation on investments and foreign currency translations | | | 130,525 | |
| | | | |
Total | | $ | (1,653,420 | ) |
| | | | |
At December 31, 2011, the Fund had net capital loss carryforwards for federal income tax purposes which are available to reduce future required distributions of net capital gains to shareholders. Under the Regulated Investment Company Modernization Act of 2010, the Fund will be permitted to carry forward for an unlimited period capital losses incurred in years beginning after December 22, 2010. In addition, these losses must be utilized prior to the losses incurred in pre-enactment taxable years. As a result of the rule, pre-enactment capital loss carryforwards may have an increased likelihood of expiring unused. Additionally, post enactment capital losses that are carried forward will retain their character as either short-term or long-term capital losses rather than being considered all short-term as under previous law.
| | | | |
Capital Loss Carryforward Available through 2016 | | $ | 1,409,463 | |
Capital Loss Carryforward Available through 2017 | | | 379,911 | |
| | | | |
Total Capital Loss Carryforwards | | $ | 1,789,374 | |
| | | | |
During the year ended December 31, 2011, the Fund utilized capital loss carryforwards of $254,185.
At December 31, 2011, the temporary difference between book basis and tax basis net unrealized appreciation on investments was primarily due to deferral of losses from wash sales for tax purposes, adjustments on income from investments in defaulted securities, and taxable bond premiums added back for current and prior years.
The following summarizes the tax cost of investments and the related net unrealized appreciation at December 31, 2011:
| | | | | | | | | | | | | | | | |
| | | Cost | | | Gross
Unrealized
Appreciation | | | Gross
Unrealized
Depreciation | | | Net
Unrealized
Appreciation | |
Investments | | $ | 5,533,930 | | | $ | 500,002 | | | $ | (369,439 | ) | | $ | 130,563 | |
15
The GAMCO Vertumnus Fund
Notes to Financial Statements (Continued)
The Fund is required to evaluate tax positions taken or expected to be taken in the course of preparing the Fund’s tax returns to determine whether the tax positions are “more-likely-than-not” of being sustained by the applicable tax authority. Income tax and related interest and penalties would be recognized by the Fund as tax expense in the Statement of Operations if the tax positions were deemed not to meet the more-likely-than-not threshold. For the year ended December 31, 2011, the Fund did not incur any income tax, interest, or penalties. As of December 31, 2011, the Adviser has reviewed all open tax years and concluded that there was no impact to the Fund’s net assets or results of operations. Tax years ended December 31, 2008 through December 31, 2011 remains subject to examination by the Internal Revenue Service and state taxing authorities. On an ongoing basis, the Adviser will monitor the Fund’s tax positions to determine if adjustments to this conclusion are necessary.
3. Investment Advisory Agreement and Other Transactions. The Fund has entered into an investment advisory agreement (the “Advisory Agreement”) with the Adviser which provides that the Fund will pay the Adviser a fee, computed daily and paid monthly, at the annual rate of 1.00% of the value of its average daily net assets. In accordance with the Advisory Agreement, the Adviser provides a continuous investment program for the Fund’s portfolio, oversees the administration of all aspects of the Fund’s business and affairs, and pays the compensation of all Officers and Directors of the Fund who are affiliated persons of the Adviser.
The Adviser has contractually agreed to waive its investment advisory fee and/or to reimburse expenses of the Fund to the extent necessary to maintain the annualized total operating expenses of the Fund (excluding brokerage, acquired fund fees and expenses, interest, taxes, and extraordinary expenses) until at least May 1, 2013, at no more than 2.00%, 2.00%, 2.75%, and 1.75% of the value of the Fund’s average daily net assets for Class AAA, Class A, Class C, and Class I, respectively. For the year ended December 31, 2011, the Adviser reimbursed the Fund in the amount of $99,508. In addition, the Fund has agreed, during the two year period following any waiver or reimbursement by the Adviser, to repay such amount to the extent, after giving effect to the repayment, such adjusted annualized total operating expenses of the Fund would not exceed 2.00%, 2.00%, 2.75%, and 1.75% of the value of the Fund’s average daily net assets for Class AAA, Class A, Class C, and Class I, respectively. The agreements are renewable annually. At December 31, 2011, the cumulative amount which the Fund may repay the Adviser is $175,614.
| | | | |
For the year ended December 31, 2010, expiring December 31, 2012 | | $ | 76,106 | |
For the year ended December 31, 2011, expiring December 31, 2013 | | | 99,508 | |
| | | | |
| | $ | 175,614 | |
| | | | |
The Corporation pays each Director who is not considered to be an affiliated person an annual retainer of $6,000 plus $1,000 for each Board meeting attended and each Director is reimbursed by the Corporation for any out of pocket expenses incurred in attending meetings. All Board committee members receive $1,000 per meeting attended. The Chairman of the Audit Committee receives an annual fee of $3,000, and the Lead Director receives an annual fee of $2,000. A Director may receive a single meeting fee, allocated among the participating funds, for participation in certain meetings held on behalf of multiple funds. Directors who are directors or employees of the Adviser or an affiliated company receive no compensation or expense reimbursement from the Corporation.
16
The GAMCO Vertumnus Fund
Notes to Financial Statements (Continued)
4. Distribution Plan. The Fund’s Board has adopted a distribution plan (the “Plan”) for each class of shares, except for Class I Shares, pursuant to Rule 12b-1 under the 1940 Act. G.distributors, LLC serves as successor “Distributor” to Gabelli & Company, Inc. (“Gabelli & Co.”) effective August 1, 2011, both affiliates of the Fund. Under the Class AAA, Class A, and Class C Share Plans, payments are authorized to the Distributor at annual rates of 0.25%, 0.25%, and 1.00%, respectively, of the average daily net assets of those classes, the annual limitations under each Plan. Such payments are accrued daily and paid monthly.
5. Portfolio Securities. Purchases and sales of securities during the year ended December 31, 2011, other than short-term securities and U.S. Government obligations, aggregated $3,175,983 and $4,618,746, respectively.
6. Transactions with Affiliates. During the year ended December 31, 2011, the Fund paid brokerage commissions on security trades of $1,869 to Gabelli & Co. Additionally, the current and former Distributors informed the Fund that they retained a total of $1,027 from investors representing commissions (sales charges and underwriting fees) on sales and redemptions of Fund shares.
The cost of calculating the Fund’s NAV per share is a Fund expense pursuant to the Advisory Agreement. The Adviser did not seek a reimbursement during the year ended December 31, 2011.
7. Line of Credit. The Fund participates in an unsecured line of credit of up to $75,000,000 under which it may borrow up to 10% of its net assets from the custodian for temporary borrowing purposes. Borrowings under this arrangement bear interest at the higher of the sum of the LIBOR rate plus 125 basis points or the sum of the federal funds rate plus 125 basis points at the time of borrowing. This amount, if any, would be included in “interest expense” in the Statement of Operations. At December 31, 2011, there were no borrowings outstanding under the line of credit.
The average daily amount of borrowings outstanding under the line of credit during the year ended December 31, 2011 was $71,860 with a weighted average interest rate of 1.44%. The maximum amount borrowed at any time during the year ended December 31, 2011 was $908,000.
8. Capital Stock. The Fund offers four classes of shares – Class AAA Shares, Class A Shares, Class C Shares, and Class I Shares. Class AAA Shares are offered without a front-end sales charge only to investors who acquire them directly from the Distributor, through selected broker/dealers, or the transfer agent. Class I Shares are offered without a sales charge, solely to certain institutions, directly through the Distributor, or brokers that have entered into selling agreements specifically with respect to Class I Shares. Class A Shares are subject to a maximum front-end sales charge of 5.75%. Class B shares were fully redeemed on July 5, 2011. Class C Shares are subject to a 1.00% CDSC for one year after purchase.
The Fund imposes a redemption fee of 2.00% on all classes of shares that are redeemed or exchanged on or before the seventh day after the date of a purchase. The redemption fee is deducted from the proceeds otherwise payable to the redeeming shareholders and is retained by the Fund as an increase in paid-in capital. The redemption fees retained by the Fund during the year ended December 31, 2011 amounted to $12. There were no redemption fees retained by the Fund during the year ended December 31, 2010. The redemption fee does not apply to redemptions of shares where (i) the shares were purchased through automatic reinvestment of distributions, (ii) the redemption was initiated by the Fund, (iii) the shares were purchased through programs
17
The GAMCO Vertumnus Fund
Notes to Financial Statements (Continued)
that collect the redemption fee at the program level and remit them to the Fund, or (iv) the shares were purchased through programs that the Adviser determines to have appropriate anti-short-term trading policies in place or as to which the Adviser has received assurances that look-through redemption fee procedures or effective anti-short-term trading policies and procedures are in place.
Transactions in shares of capital stock were as follows:
| | | | | | | | | | | | | | | | |
| | | Year Ended
December 31, 2011 | | | Year Ended
December 31, 2010 | |
| | | Shares | | | Amount | | | Shares | | | Amount | |
Class AAA | | | | | | | | | | | | | | | | |
Shares sold | | | 200,889 | | | $ | 820,736 | | | | 1,209,301 | | | $ | 4,645,361 | |
Shares issued upon reinvestment of distributions | | | 41,264 | | | | 160,875 | | | | 47,458 | | | | 187,767 | |
Shares redeemed | | | (774,668 | ) | | | (3,178,384 | ) | | | (1,421,079 | ) | | | (5,505,823 | ) |
| | | | | | | | | | | | | | | | |
Net decrease | | | (532,515 | ) | | $ | (2,196,773 | ) | | | (164,320 | ) | | $ | (672,695 | ) |
| | | | | | | | | | | | | | | | |
| | | | |
Class A | | | | | | | | | | | | | | | | |
Shares sold | | | 88,466 | | | $ | 364,309 | | | | 215,094 | | | $ | 883,882 | |
Shares issued upon reinvestment of distributions | | | 1,582 | | | | 6,268 | | | | 1,890 | | | | 7,577 | |
Shares redeemed | | | (280,211 | ) | | | (1,143,620 | ) | | | (76,753 | ) | | | (301,745 | ) |
| | | | | | | | | | | | | | | | |
Net increase/(decrease) | | | (190,163 | ) | | $ | (773,043 | ) | | | 140,231 | | | $ | 589,714 | |
| | | | | | | | | | | | | | | | |
| | | | |
Class B* | | | | | | | | | | | | | | | | |
Shares issued upon reinvestment of distributions | | | 5 | | | $ | 17 | | | | 9 | | | $ | 33 | |
Shares redeemed | | | (460 | ) | | | (1,688 | ) | | | — | | | | — | |
| | | | | | | | | | | | | | | | |
Net increase/(decrease) | | | (455 | ) | | $ | (1,671 | ) | | | 9 | | | $ | 33 | |
| | | | | | | | | | | | | | | | |
| | | | |
Class C | | | | | | | | | | | | | | | | |
Shares sold | | | 38,267 | | | $ | 132,535 | | | | 27,328 | | | $ | 94,614 | |
Shares issued upon reinvestment of distributions | | | 631 | | | | 2,276 | | | | 759 | | | | 2,743 | |
Shares redeemed | | | (70,700 | ) | | | (248,724 | ) | | | (32,721 | ) | | | (119,252 | ) |
| | | | | | | | | | | | | | | | |
Net decrease | | | (31,802 | ) | | $ | (113,913 | ) | | | (4,634 | ) | | $ | (21,895 | ) |
| | | | | | | | | | | | | | | | |
| | | | |
Class I | | | | | | | | | | | | | | | | |
Shares sold | | | 946 | | | $ | 3,922 | | | | 1,957 | | | $ | 7,844 | |
Shares issued upon reinvestment of distributions | | | 469 | | | | 1,829 | | | | 440 | | | | 1,752 | |
Shares redeemed | | | (3,422 | ) | | | (14,578 | ) | | | (3,931 | ) | | | (15,587 | ) |
| | | | | | | | | | | | | | | | |
Net decrease | | | (2,007 | ) | | $ | (8,827 | ) | | | (1,534 | ) | | $ | (5,991 | ) |
| | | | | | | | | | | | | | | | |
* Class B Shares were fully redeemed on July 5, 2011. | | | | | | | | | | | | | | | | |
9. Indemnifications. The Fund enters into contracts that contain a variety of indemnifications. The Fund’s maximum exposure under these arrangements is unknown. However, the Fund has not had prior claims or losses pursuant to these contracts. Management has reviewed the Fund’s existing contracts and expects the risk of loss to be remote.
18
The GAMCO Vertumnus Fund
Notes to Financial Statements (Continued)
10. Other Matters. On April 24, 2008, the Adviser entered into a settlement with the SEC to resolve an inquiry regarding prior frequent trading in shares of the GAMCO Global Growth Fund (the “Global Growth Fund”) by one investor who was banned from the Global Growth Fund in August 2002. Under the terms of the settlement, the Adviser, without admitting or denying the SEC’s findings and allegations, paid $16 million (which included a $5 million civil monetary penalty). On the same day, the SEC filed a civil action in the U.S. District Court for the Southern District of New York against the Executive Vice President and Chief Operating Officer of the Adviser, alleging violations of certain federal securities laws arising from the same matter. The officer, who also is an officer of the Global Growth Fund and other funds in the Gabelli/GAMCO complex, including this Fund, denies the allegations and is continuing in his positions with the Adviser and the funds. The settlement by the Adviser did not have, and the resolution of the action against the officer is not expected to have, a material adverse impact on the Adviser or its ability to fulfill its obligations under the Advisory Agreement.
11. Subsequent Events. Management has evaluated the impact on the Fund of all subsequent events occurring through the date the financial statements were issued and has determined that there were no subsequent events requiring recognition or disclosure in the financial statements.
19
The GAMCO Vertumnus Fund
Report of Independent Registered Public Accounting Firm
To the shareholders and Board of Directors of
GAMCO Global Series Funds, Inc.
We have audited the accompanying statement of assets and liabilities, including the schedule of investments, of The GAMCO Vertumnus Fund (the “Fund”), one of the series constituting GAMCO Global Series Funds, Inc., as of December 31, 2011, and the related statement of operations for the year then ended, the statements of changes in net assets for each of the two years in the period then ended, and the financial highlights for each of the periods indicated therein. These financial statements and financial highlights are the responsibility of the Fund’s management. Our responsibility is to express an opinion on these financial statements and financial highlights based on our audits.
We conducted our audits in accordance with the standards of the Public Company Accounting Oversight Board (United States). Those standards require that we plan and perform the audit to obtain reasonable assurance about whether the financial statements and financial highlights are free of material misstatement. We were not engaged to perform an audit of the Fund’s internal control over financial reporting. Our audits included consideration of internal control over financial reporting as a basis for designing audit procedures that are appropriate in the circumstances, but not for the purpose of expressing an opinion on the effectiveness of the Fund’s internal control over financial reporting. Accordingly, we express no such opinion. An audit also includes examining, on a test basis, evidence supporting the amounts and disclosures in the financial statements and financial highlights, assessing the accounting principles used and significant estimates made by management, and evaluating the overall financial statement presentation. Our procedures included confirmation of securities owned as of December 31, 2011, by correspondence with the Fund’s custodian and brokers, or by other appropriate auditing procedures where replies from brokers were not received. We believe that our audits provide a reasonable basis for our opinion.
In our opinion, the financial statements and financial highlights referred to above present fairly, in all material respects, the financial position of The GAMCO Vertumnus Fund, one of the series of GAMCO Global Series Funds, Inc., at December 31, 2011, the results of its operations for the year then ended, the changes in its net assets for each of the two years in the period then ended, and its financial highlights for each of the periods indicated therein, in conformity with U.S. generally accepted accounting principles.

Philadelphia, Pennsylvania
February 27, 2012
20
The GAMCO Vertumnus Fund
Board Consideration and Re-Approval of Investment Advisory Agreement (Unaudited)
During the six months ended December 31, 2011, the Board of Directors of the Corporation approved the continuation of the investment advisory agreement with the Adviser for the Fund on the basis of the recommendation by the directors (the “Independent Board Members”) who are not “interested persons” of the Fund. The following paragraphs summarize the material information and factors considered by the Independent Board Members as well as their conclusions relative to such factors.
Nature, Extent, and Quality of Services. The Independent Board Members considered information regarding the portfolio manager, the depth of the analyst pool available to the Adviser and the Fund’s portfolio manager, the scope of supervisory, administrative, shareholder, and other services supervised or provided by the Adviser, and the absence of significant service problems reported to the Board. The Independent Board Members noted the experience, length of service, and reputation of the Fund’s portfolio manager.
Investment Performance. The Independent Board Members reviewed the short and medium-term performance of the Fund against a peer group of convertible securities funds, noting that the Fund’s performance for the one, three, and five year periods was poor. The Independent Board Members also acknowledged the limitations of the peer group selected because there was only one other dedicated global convertible fund in the peer group.
Profitability. The Independent Board Members reviewed summary data regarding the lack of profitability of the Fund to the Adviser both with an administrative overhead charge and without such a charge. The Independent Board Members also noted that affiliated brokers of the Adviser received distribution fees and minor amounts of sales commissions.
Economies of Scale. The Independent Board Members discussed the major elements of the Adviser’s cost structure and the relationship of those elements to potential economies of scale and reviewed rudimentary data relating to the impact of 20% growth in the Fund on the Adviser’s profitability.
Sharing of Economies of Scale. The Independent Board Members noted that the investment advisory fee schedule for the Fund does not take into account any potential economies of scale that may develop.
Service and Cost Comparisons. The Independent Board Members compared the expense ratios of the investment advisory fee, other expenses, and total expenses of the Fund with similar expense ratios of the peer group of convertible securities funds and noted that the Adviser’s advisory fee includes substantially all administrative services of the Fund as well as investment advisory services. The Independent Board Members noted that the Fund’s expense ratios, after voluntary expense reimbursements, were significantly higher than and the Fund’s size was significantly lower than average within this group. The Independent Board Members also noted that all but one of the peer group were domestic convertible funds, thereby limiting the usefulness of peer group comparisons. The Independent Board Members compared the advisory fee for other funds managed by the Adviser and noted that neither the Adviser nor any of its affiliates manage other global convertible securities accounts.
Conclusions. The Independent Board Members concluded that the Fund enjoyed highly experienced portfolio management services and good ancillary services, but had a relatively poor performance record. The Independent Board Members also concluded that the Fund’s expense ratios were reasonable, particularly in light of the lack of profitability to the Adviser of managing the Fund, and that economies of scale were not a significant factor in their thinking at this time. The Independent Board Members did not view the potential profitability of ancillary services as material to their decision. On the basis of the foregoing and without assigning particular weight to any single conclusion, the Independent Board Members determined to recommend continuation of the investment advisory agreement to the full Board.
21
The GAMCO Vertumnus Fund
Additional Fund Information (Unaudited)
The business and affairs of the Corporation are managed under the direction of the Corporation’s Board of Directors. Information pertaining to the Directors and officers of the Corporation is set forth below. The Fund’s Statement of Additional Information includes additional information about the Fund’s Directors and is available without charge, upon request, by calling 800-GABELLI (800-422-3554) or by writing to The GAMCO Vertumnus Fund at One Corporate Center, Rye, NY 10580-1422.
| | | | | | | | |
Name, Position(s)
Address1
and Age | | Term of Office
and Length of
Time Served2 | | Number of Funds
in Fund Complex
Overseen by Director | | Principal Occupation(s)
During Past Five Years | | Other Directorships
Held by Director4 |
|
INTERESTED DIRECTORS3: |
Mario J. Gabelli, CFA Director and
Chief Investment Officer Age: 69 | | Since 1993 | | 27 | | Chairman, Chief Executive Officer, and Chief Investment Officer–Value Portfolios of GAMCO Investors, Inc. and Chief Investment Officer–Value Portfolios of Gabelli Funds, LLC and GAMCO Asset Management Inc.; Director/Trustee or Chief Investment Officer of other registered investment companies in the Gabelli/GAMCO Funds Complex; Chief Executive Officer of GGCP, Inc. | | Director of Morgan Group Holdings, Inc. (holding company); Chairman of the Board and Chief Executive Officer of LICT Corp. (multimedia and communication services company); Director of CIBL, Inc. (broadcasting and wireless communications); Director of RLJ Acquisition Inc. (blank check company) |
John D. Gabelli Director
Age: 67 | | Since 1993 | | 10 | | Senior Vice President of Gabelli & Company, Inc. | | — |
|
INDEPENDENT DIRECTORS5: |
E. Val Cerutti Director Age: 72 | | Since 2001 | | 7 | | Chief Executive Officer of Cerutti Consultants, Inc. | | Director of The LGL Group, Inc. (diversified manufacturing) (1990-2009) |
Anthony J. Colavita Director Age: 76 | | Since 1993 | | 35 | | President of the law firm of Anthony J. Colavita, P.C. | | — |
Arthur V. Ferrara Director Age: 81 | | Since 2001 | | 8 | | Former Chairman of the Board and Chief Executive Officer of The Guardian Life Insurance Company of America (1992-1995) | | — |
Werner J. Roeder, MD Director Age: 71 | | Since 1993 | | 22 | | Medical Director of Lawrence Hospital and practicing private physician | | — |
Anthonie C. van Ekris Director Age: 77 | | Since 1993 | | 20 | | Chairman of BALMAC International, Inc. (commodities and futures trading) | | Director of Aurado Energy Inc. (oil and gas operations) through 2005 |
Salvatore J. Zizza Director Age: 66 | | Since 2004 | | 29 | | Chairman (since 1978) of Zizza & Company, Ltd. (financial consulting); Chairman (since 2006) of Metropolitan Paper Recycling, Inc. (recycling); Chairman (since 2000) of BAM Inc. (manufacturing); Chairman (since 2009) of E-Corp English (business services) | | Non-Executive Chairman and Director of Harbor BioSciences, Inc. (biotechnology); Vice Chairman and Director of Trans-Lux Corporation (business services); Chairman and Chief Executive Officer of General Employment Enterprises, Inc. (staffing); Director of Bion Environmental Technologies (technology) (2005-2008); Director of Earl Schieb Inc. (automotive painting) through April 2009. |
22
The GAMCO Vertumnus Fund
Additional Fund Information (Continued) (Unaudited)
| | | | |
Name, Position(s)
Address1
and Age | | Term of Office
and Length of
Time Served2 | | Principal Occupation(s)
During Past Five Years |
| | |
OFFICERS: | | | | |
Bruce N. Alpert President, Secretary, and Acting Chief Compliance Officer
Age: 60 | | Since 2003 Since November 2011 | | Executive Vice President and Chief Operating Officer of Gabelli Funds, LLC since 1988; Officer of all of the registered investment companies in the Gabelli/GAMCO Funds Complex; Director of Teton Advisors, Inc. since 1998; Chairman of Teton Advisors, Inc. 2008-2010; President of Teton Advisors, Inc. 1998-2008; Senior Vice President of GAMCO Investors, Inc. since 2008 |
Agnes Mullady Treasurer Age: 53 | | Since 2006 | | President and Chief Operating Officer of the Open-End Fund Division of Gabelli Funds, LLC since September 2010; Senior Vice President of GAMCO Investors, Inc. since 2009; Vice President of Gabelli Funds, LLC since 2007; Officer of all of the registered investment companies in the Gabelli/GAMCO Funds Complex |
| | 1 | Address: One Corporate Center, Rye, NY 10580-1422, unless otherwise noted. |
| | 2 | Each Director will hold office for an indefinite term until the earliest of (i) the next meeting of shareholders, if any, called for the purpose of considering the election or re-election of such Director and until the election and qualification of his or her successor, if any, elected at such meeting, or (ii) the date a Director resigns or retires, or a Director is removed by the Board of Directors or shareholders, in accordance with the Corporation’s By-Laws and Articles of Incorporation. Each officer will hold office for an indefinite term until the date he or she resigns or retires or until his or her successor is elected and qualified. |
| | 3 | “Interested person” of the Corporation as defined in the 1940 Act. Messrs. Gabelli are each considered an “interested person” because of their affiliation with Gabelli Funds, LLC which acts as the Corporation’s investment adviser. Mario J. Gabelli and John D. Gabelli are brothers. |
| | 4 | This column includes only directorships of companies required to report to the SEC under the Securities Exchange Act of 1934, as amended, i.e., public companies, or other investment companies registered under the 1940 Act. |
| | 5 | Directors who are not interested persons are considered “Independent” Directors. |
2011 TAX NOTICE TO SHAREHOLDERS (Unaudited)
For the year ended December 31, 2011, the Fund paid to shareholders ordinary income distributions (comprised of net investment income) totaling $0.119, $0.118, $0.037, $0.089, and $0.130 per share for Class AAA, Class A, Class B, Class C, and Class I, respectively. For the year ended December 31, 2011, 5.44% of the ordinary income distribution qualifies for the dividends received deduction available to corporations. The Fund designates 17.14% of the ordinary income distribution as qualified dividend income pursuant to the Jobs and Growth Tax Relief Reconciliation Act of 2003. The Fund designates 88.29% of the ordinary income distributions as qualified interest income pursuant to the Tax Relief, Unemployment Insurance Reauthorization, and Job Creation Act of 2010.
U.S. Government Income:
The percentage of the ordinary income distribution paid by the Fund during 2011 which was derived from U.S. Treasury securities was 0.04%. Such income is exempt from state and local tax in all states. However, many states, including New York and California, allow a tax exemption for a portion of the income earned only if a mutual fund has invested at least 50% of its assets at the end of each quarter of the Fund’s fiscal year in U.S. Government securities. The Fund did not meet this strict requirement in 2011. The percentage of U.S. Government securities held as of December 31, 2011 was 0.88%. Due to the diversity in state and local tax law, it is recommended that you consult your personal tax adviser as to the applicability of the information provided to your specific situation.
All designations are based on financial information available as of the date of this annual report and, accordingly, are subject to change. For each item, it is the intention of the Fund to designate the maximum amount permitted under the Internal Revenue Code and the regulations thereunder.
23
GAMCO Global Series Funds, Inc.
The GAMCO Vertumnus Fund
One Corporate Center
Rye, New York 10580-1422
800-GABELLI
800-422-3554
fax: 914-921-5118
website: www.gabelli.com
e-mail: info@gabelli.com
Net Asset Value per share available daily by calling
800-GABELLI after 7:00 P.M.
| | |
| Board of Directors |
Mario J. Gabelli, CFA Chairman and Chief Executive Officer GAMCO Investors, Inc. E. Val Cerutti Chief Executive Officer Cerutti Consultants, Inc. Anthony J. Colavita President Anthony J. Colavita, P.C. Arthur V. Ferrara Former Chairman and Chief Executive Officer Guardian Life Insurance Company of America | | John D. Gabelli Senior Vice President Gabelli & Company, Inc. Werner J. Roeder, MD Medical Director Lawrence Hospital Anthonie C. van Ekris Chairman BALMAC International, Inc. Salvatore J. Zizza Chairman Zizza & Co., Ltd. |
|
| Officers |
Bruce N. Alpert President, Secretary, and Acting Chief Compliance Officer | | Agnes Mullady Treasurer |
|
Custodian, Transfer Agent, and Dividend Disbursing Agent |
| State Street Bank and Trust Company |
|
| Distributor |
| G.distributors, LLC |
|
| Legal Counsel |
| Skadden, Arps, Slate, Meagher & Flom LLP |
This report is submitted for the general information of the shareholders of The GAMCO Vertumnus Fund. It is not authorized for distribution to prospective investors unless preceded or accompanied by an effective prospectus.
GAB441Q411AR
GAMCO
The
GAMCO
Vertumnus
Fund
ANNUAL REPORT
DECEMBER 31, 2011
The GAMCO Global Growth Fund
Annual Report — December 31, 2011

Morningstar® rated The GAMCO Global Growth Fund Class AAA Shares 4 stars overall and 4 stars for the three and five year periods ended December 31, 2011 among 697, 697, and 490 World Stock funds, respectively. Morningstar RatingTM is based on risk adjusted returns.

Caesar Bryan

Howard F. Ward, CFA
To Our Shareholders,
The Sarbanes-Oxley Act requires a fund’s principal executive and financial officers to certify the entire contents of the semiannual and annual shareholder reports in a filing with the Securities and Exchange Commission (“SEC”) on Form N-CSR. This certification would cover the portfolio managers’ commentary and subjective opinions if they are attached to or a part of the financial statements. Many of these comments and opinions would be difficult or impossible to certify.
Because we do not want our portfolio managers to eliminate their opinions and/or restrict their commentary to historical facts, we have separated their commentary from the financial statements and investment portfolio and have sent it to you separately. Both the commentary and the financial statements, including the portfolio of investments, will be available on our website at www.gabelli.com.
Performance Discussion (Unaudited)
For the year ended December 31, 2011, the net asset value (“NAV”) per Class AAA Share of The GAMCO Global Growth Fund declined 4.2% compared with a decrease of 7.0% for the Morgan Stanley Capital International (“MSCI”) All Country (“AC”) World Free Index. See page 3 for additional performance information.
Enclosed are the schedule of investments and financial statements as of December 31, 2011.
For all of 2011, only three of the twenty-four major national indices provided positive returns, led by Ireland (+13.7%). New Zealand (+5.5%) was the second best performer, followed by the U.S. (+1.4%). Greece (-62.8%) had the worst performance of the year, followed by Austria (-36.4%), Finland (-31.9%), Israel (-28.0%), Italy (-23.2%), Portugal
(-23.1%), Germany (-18.1%), Singapore (-17.9%), France (-16.9%), Hong Kong, Denmark and Sweden (-16.0%), Japan
(-14.3%), Canada (-12.7%), Spain (-12.3%), the Netherlands (-12.1%), Australia (-11.0%), Belgium (-10.6%), Norway
(-10.0%), Switzerland (-6.8%) and the United Kingdom (-2.6%). Among the twenty-one emerging market countries, only Indonesia (+4.0%) posted a positive yearly result. All four of the largest emerging markets posted yearly declines. The worst performer was India (-38.0%), followed by Brazil (-24.9%), Russia (-20.9%), and China (-20.3%).
Performance for the year was dampened by the Fund’s investment in gold mining shares, which failed to keep pace with the rising price of gold bullion. The Fund was also hurt by its overweight in Energy shares, as the price of oil rose sharply in the first four months of the year and then fell precipitously, hurting oil centric holdings. Meanwhile, the price of natural gas failed to sustain a rally, weighing on the Fund’s natural gas holdings. The Fund’s underweight in the Consumer Discretionary stocks penalized results for the year.
The list of fifteen largest detractors from performance for the year is dominated by energy and gold mining shares. In Energy, the list includes Suncor Energy Inc. (2.2% of net assets as of December 31, 2011), Hess Corp. (0.9%), and Ultra Petroleum Corp. (0.4%). The gold miners were Agnico-Eagle Mines Ltd., Barrick Gold Corp., and Freeport-McMoRan Copper & Gold Inc. (0.5%). Producer Durables that hurt the most were PACCAR Inc. (0.6%), Schneider Electric (0.8%), and Siemens (1.5%). Rounding out the most negative fifteen detractors are The Mosaic Co. (1.0%), Xstrata (0.6%), Cheung Kong Holdings (0.5%), Swire Pacific Ltd. (1.0%), Christian Dior (1.4%), and The Swatch Group (1.6%).
Our investments in Technology, Consumer Discretionary, and Consumer Staples made the largest positive contribution to performance for the year. Apple Inc. (4.1%) made the largest single contribution, as it was our largest holding; Google Inc. (2.8%), another top five holding and IBM Corp (1.1%), a bellwether technology company, also made the list of top fifteen contributors. Our biggest Consumer Discretionary contributors were Starbucks Corp. (1.1%), NIKE Inc. (1.1%), and Home Depot (0.8%). Diageo (2.0%) and The Coca-Cola Company (1.7%) anchored the contribution from Consumer Staples. Rounding out the top fifteen were Visa Inc. (1.1%), MasterCard Company (0.8%), Continental Resources, Precision Castparts Corp. (1.4%), Chesapeake Energy, ITT, and Brigham Exploration.
We appreciate your confidence and trust.
| | | | | | |
| | | | Sincerely yours, 
| | |
| | | |
| February 22, 2012 | | | | Bruce N. Alpert President | | |
Comparative Results
| | | | | | | | | | | | | | | | |
Average Annual Returns through December 31, 2011 (a) (Unaudited) | |
| | | 1 Year | | | 5 Year | | | 10 Year | | | Since
Inception
(2/7/94) | |
Class AAA (GICPX) | | | (4.23 | )% | | | 0.54 | % | | | 4.35 | % | | | 7.89 | % |
MSCI AC World Free Index | | | (6.95 | ) | | | (1.35 | ) | | | 4.77 | | | | N/A | |
Lipper Global Large Cap Growth Fund Average | | | (6.68 | ) | | | (1.48 | ) | | | 3.02 | | | | N/A | |
Class A (GGGAX) | | | (4.19 | ) | | | 0.55 | | | | 4.35 | | | | 7.90 | |
With sales charge (b) | | | (9.70 | ) | | | (0.63 | ) | | | 3.73 | | | | 7.54 | |
Class C (GGGCX) | | | (4.92 | ) | | | (0.21 | ) | | | 3.55 | | | | 7.36 | |
With contingent deferred sales charge (c) | | | (5.87 | ) | | | (0.21 | ) | | | 3.55 | | | | 7.36 | |
Class I (GAGIX) | | | (3.94 | ) | | | 0.77 | | | | 4.47 | | | | 7.96 | |
In the current prospectus dated April 29, 2011, the expense ratios for Class AAA, A, C, and I Shares are 1.87%, 1.87%, 2.62%, and 1.62%, respectively. See page 10 for the expense ratios for the year ended December 31, 2011. Class AAA and Class I Shares do not have a sales charge. The maximum sales charge for Class A and C Shares is 5.75% and 1.00%, respectively.
| | (a) | Returns represent past performance and do not guarantee future results. Total returns and average annual returns reflect changes in share price, reinvestment of distributions, and are net of expenses. Investment returns and the principal value of an investment will fluctuate. When shares are redeemed, they may be worth more or less than their original cost. The Fund imposes a 2% redemption fee on shares sold or exchanged within seven days after the date of purchase. Current performance may be lower or higher than the performance data presented. Visit www.gabelli.com for performance information as of the most recent month end. Investors should carefully consider the investment objectives, risks, charges, and expenses of the Fund before investing. The prospectus contains information about these and other matters and should be read carefully before investing. Investing in foreign securities involves risks not ordinarily associated with investments in domestic issues, including currency fluctuation, economic, and political risks. The Class AAA Share NAVs are used to calculate performance for the periods prior to the issuance of Class A Shares, Class C Shares, and Class I Shares on March 2, 2000, March 12, 2000, and January 11, 2008, respectively. The actual performance of the Class C Shares would have been lower for the periods starting prior to November 23, 2001, due to the additional expenses associated with the class of shares. The actual performance of Class I Shares would have been higher due to lower expenses related to this class of shares. The MSCI AC World Free Index is an unmanaged free float adjusted market capitalization weighted index that is designed to measure the equity market performance of developed and emerging markets. The MSCI AC World Free Index consists of 45 country indices comprising 24 developed and 21 emerging market country indices. The Lipper Global Large Cap Growth Fund Average reflects the performance of mutual funds classified in this particular category. Dividends are considered reinvested. You cannot invest directly in an index. | |
| | (b) | Performance results include the effect of the maximum 5.75% sales charge at the beginning of the period. | |
| | (c) | Assuming payment of the 1% maximum contingent deferred sales charge imposed on redemptions made within one year of purchase. | |
COMPARISON OF CHANGE IN VALUE OF A $10,000 INVESTMENT IN
THE GAMCO GLOBAL GROWTH FUND (CLASS AAA SHARES), MSCI AC WORLD FREE INDEX, AND LIPPER GLOBAL LARGE CAP GROWTH FUND AVERAGE (Unaudited)
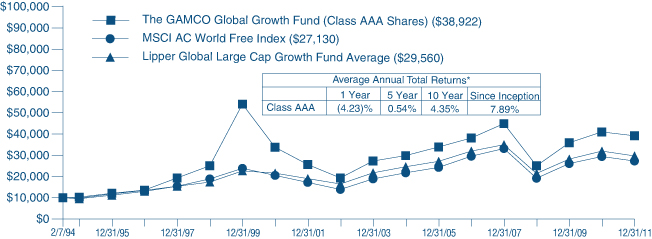
| * | Past performance is not predictive of future results. The performance tables and graph do not reflect the deduction of taxes that a shareholder would pay on Fund distributions or the redemption of Fund shares. |
3
The GAMCO Global Growth Fund
Disclosure of Fund Expenses (Unaudited)
For the Six Month Period from July 1, 2011 through December 31, 2011
Expense Table
We believe it is important for you to understand the impact of fees and expenses regarding your investment. All mutual funds have operating expenses. As a shareholder of a fund, you incur ongoing costs, which include costs for portfolio management, administrative services, and shareholder reports (like this one), among others. Operating expenses, which are deducted from a fund’s gross income, directly reduce the investment return of a fund. When a fund’s expenses are expressed as a percentage of its average net assets, this figure is known as the expense ratio. The following examples are intended to help you understand the ongoing costs (in dollars) of investing in your Fund and to compare these costs with those of other mutual funds. The examples are based on an investment of $1,000 made at the beginning of the period shown and held for the entire period.
The Expense Table below illustrates your Fund’s costs in two ways:
Actual Fund Return: This section provides information about actual account values and actual expenses. You may use this section to help you to estimate the actual expenses that you paid over the period after any fee waivers and expense reimbursements. The “Ending Account Value” shown is derived from the Fund’s actual return during the past six months, and the “Expenses Paid During Period” shows the dollar amount that would have been paid by an investor who started with $1,000 in the Fund. You may use this information, together with the amount you invested, to estimate the expenses that you paid over the period.
To do so, simply divide your account value by $1,000 (for example, an $8,600 account value divided by $1,000 = 8.6), then multiply the result by the number given for your Fund under the heading “Expenses Paid During Period” to estimate the expenses you paid during this period.
Hypothetical 5% Return: This section provides information about hypothetical account values and hypothetical expenses based on the Fund’s actual expense ratio. It assumes a hypothetical annualized return of 5% before expenses during the period shown.
In this case – because the hypothetical return used is not the Fund’s actual return – the results do not apply to your investment and you cannot use the hypothetical account value and expense to estimate the actual ending account balance or expenses you paid for the period. This example is useful in making comparisons of the ongoing costs of investing in the Fund and other funds. To do so, compare this 5% hypothetical example with the 5% hypothetical examples that appear in shareholder reports of other funds.
Please note that the expenses shown in the table are meant to highlight your ongoing costs only and do not reflect any transactional costs such as sales charges (loads), redemption fees, or exchange fees, if any, which would be described in the Prospectus. If these costs were applied to your account, your costs would be higher. Therefore, the 5% hypothetical return is useful in comparing ongoing costs only, and will not help you determine the relative total costs of owning different funds. The “Annualized Expense Ratio” represents the actual expenses for the last six months and may be different from the expense ratio in the Financial Highlights which is for the year ended December 31, 2011.
| | | | | | | | | | | | | | | | |
| | | Beginning
Account Value
07/01/11 | | | Ending
Account Value
12/31/11 | | | Annualized
Expense
Ratio | | | Expenses
Paid During
Period* | |
The GAMCO Global Growth Fund | |
Actual Fund Return | | | | | | | | | | | | | | | | |
| Class AAA | | | $1,000.00 | | | | $ 934.70 | | | | 1.86 | % | | | $ 9.07 | |
| Class A | | | $1,000.00 | | | | $ 934.70 | | | | 1.86 | % | | | $ 9.07 | |
| Class C | | | $1,000.00 | | | | $ 931.20 | | | | 2.61 | % | | | $12.70 | |
| Class I | | | $1,000.00 | | | | $ 935.90 | | | | 1.61 | % | | | $ 7.86 | |
Hypothetical 5% Return | | | | | | | | | |
| Class AAA | | | $1,000.00 | | | | $1,015.83 | | | | 1.86 | % | | | $ 9.45 | |
| Class A | | | $1,000.00 | | | | $1,015.83 | | | | 1.86 | % | | | $ 9.45 | |
| Class C | | | $1,000.00 | | | | $1,012.05 | | | | 2.61 | % | | | $13.24 | |
| Class I | | | $1,000.00 | | | | $1,017.09 | | | | 1.61 | % | | | $ 8.19 | |
| * | Expenses are equal to the Fund’s annualized expense ratio for the last six months multiplied by the average account value over the period, multiplied by the number of days in the most recent fiscal half year (184 days), then divided by 365. |
4
Summary of Portfolio Holdings (Unaudited)
The following table presents portfolio holdings as a percent of net assets as of December 31, 2011:
The GAMCO Global Growth Fund
| | | | |
Consumer Staples | | | 17.3% | |
Industrials | | | 15.9% | |
Information Technology | | | 14.8% | |
Energy | | | 14.6% | |
Consumer Discretionary | | | 14.2% | |
| | | | |
Health Care | | | 10.0% | |
Materials | | | 5.3% | |
Financials | | | 4.8% | |
U.S. Government Obligations | | | 3.3% | |
Other Assets and Liabilities (Net) | | | (0.2)% | |
| | | | |
| | | 100.0% | |
| | | | |
The Fund files a complete schedule of portfolio holdings with the SEC for the first and third quarters of each fiscal year on Form N-Q. Shareholders may obtain this information at www.gabelli.com or by calling the Fund at 800-GABELLI (800-422-3554). The Fund’s Form N-Q is available on the SEC’s website at www.sec.gov and may also be reviewed and copied at the SEC’s Public Reference Room in Washington, DC. Information on the operation of the Public Reference Room may be obtained by calling 800-SEC-0330.
Proxy Voting
The Fund files Form N-PX with its complete proxy voting record for the twelve months ended June 30th, no later than August 31st of each year. A description of the Fund’s proxy voting policies, procedures, and how the Fund voted proxies relating to portfolio securities is available without charge, upon request, by (i) calling 800-GABELLI (800-422-3554); (ii) writing to The Gabelli Funds at One Corporate Center, Rye, NY 10580-1422; or (iii) visiting the SEC’s website at www.sec.gov.
5
The GAMCO Global Growth Fund
Schedule of Investments — December 31, 2011
| | | | | | | | | | | | |
Shares | | | | | Cost | | | Market
Value | |
| | | | | | | | | | | | |
| |
| | | | COMMON STOCKS — 96.9% | |
| | | | CONSUMER STAPLES — 17.3% | |
| | 7,000 | | | Beam Inc. | | $ | 318,636 | | | $ | 358,610 | |
| | 4,000 | | | Colgate-Palmolive Co. | | | 321,180 | | | | 369,560 | |
| | 5,300 | | | Costco Wholesale Corp. | | | 295,184 | | | | 441,596 | |
| | 19,371 | | | Danone | | | 1,190,588 | | | | 1,217,692 | |
| | 80,000 | | | Davide Campari - Milano SpA | | | 218,032 | | | | 532,712 | |
| | 55,500 | | | Diageo plc | | | 926,227 | | | | 1,212,274 | |
| | 6,000 | | | Diageo plc, ADR | | | 508,472 | | | | 524,520 | |
| | 11,300 | | | Mead Johnson Nutrition Co. | | | 804,540 | | | | 776,649 | |
| | 21,400 | | | Nestlé SA | | | 978,088 | | | | 1,230,278 | |
| | 4,100 | | | PepsiCo Inc. | | | 260,424 | | | | 272,035 | |
| | 9,456 | | | Pernod-Ricard SA | | | 724,159 | | | | 877,004 | |
| | 46,000 | | | Tesco plc | | | 395,588 | | | | 288,214 | |
| | 14,500 | | | The Coca-Cola Co. | | | 798,902 | | | | 1,014,565 | |
| | 3,000 | | | The Estee Lauder Companies Inc., Cl. A | | | 289,775 | | | | 336,960 | |
| | 6,000 | | | The Procter & Gamble Co. | | | 375,271 | | | | 400,260 | |
| | 5,000 | | | Whole Foods Market Inc. | | | 303,512 | | | | 347,900 | |
| | 11,100 | | | Woolworths Ltd. | | | 182,007 | | | | 284,962 | |
| | | | | | | | | | | | |
| | | | TOTAL CONSUMER STAPLES | | | 8,890,585 | | | | 10,485,791 | |
| | | | | | | | | | | | |
| |
| | | | INDUSTRIALS — 15.9% | |
| | 4,000 | | | C.H. Robinson Worldwide Inc. | | | 271,882 | | | | 279,120 | |
| | 4,500 | | | Caterpillar Inc. | | | 459,740 | | | | 407,700 | |
| | 3,900 | | | Cummins Inc. | | | 385,533 | | | | 343,278 | |
| | 8,000 | | | Eaton Corp. | | | 298,109 | | | | 348,240 | |
| | 7,000 | | | Emerson Electric Co. | | | 356,369 | | | | 326,130 | |
| | 3,700 | | | FANUC Corp. | | | 325,019 | | | | 566,273 | |
| | 3,700 | | | Flowserve Corp. | | | 310,108 | | | | 367,484 | |
| | 20,000 | | | General Electric Co. | | | 339,909 | | | | 358,200 | |
| | 8,500 | | | Honeywell International Inc. | | | 372,908 | | | | 461,975 | |
| | 39,000 | | | Jardine Matheson Holdings Ltd. | | | 1,038,818 | | | | 1,834,950 | |
| | 5,100 | | | Joy Global Inc. | | | 390,556 | | | | 382,347 | |
| | 15,000 | | | Komatsu Ltd. | | | 470,971 | | | | 350,591 | |
| | 10,500 | | | PACCAR Inc. | | | 357,985 | | | | 393,435 | |
| | 5,100 | | | Precision Castparts Corp. | | | 606,804 | | | | 840,429 | |
| | 9,600 | | | Schneider Electric SA | | | 730,399 | | | | 505,440 | |
| | 5,000 | | | Secom Co. Ltd. | | | 186,467 | | | | 230,609 | |
| | 9,300 | | | Siemens AG | | | 912,722 | | | | 889,979 | |
| | 3,300 | | | Union Pacific Corp. | | | 290,036 | | | | 349,602 | |
| | 5,000 | | | United Technologies Corp. | | | 270,444 | | | | 365,450 | |
| | | | | | | | | | | | |
| | | | TOTAL INDUSTRIALS | | | 8,374,779 | | | | 9,601,232 | |
| | | | | | | | | | | | |
| |
| | | | INFORMATION TECHNOLOGY — 14.8% | |
| | 6,200 | | | Apple Inc.† | | | 1,348,159 | | | | 2,511,000 | |
| | 5,500 | | | Canon Inc. | | | 302,383 | | | | 243,666 | |
| | 22,000 | | | EMC Corp.† | | | 486,996 | | | | 473,880 | |
| | 2,600 | | | Google Inc., Cl. A† | | | 1,332,417 | | | | 1,679,340 | |
| | 3,700 | | | International Business Machines Corp. | | | 453,961 | | | | 680,356 | |
| | | | | | | | | | | | |
Shares | | | | | Cost | | | Market
Value | |
| | | | | | | | | | | | |
| | 3,400 | | | Keyence Corp. | | $ | 638,916 | | | $ | 819,852 | |
| | 1,300 | | | MasterCard Inc., Cl. A | | | 203,703 | | | | 484,666 | |
| | 29,500 | | | Microsoft Corp. | | | 798,381 | | | | 765,820 | |
| | 11,500 | | | QUALCOMM Inc. | | | 597,549 | | | | 629,050 | |
| | 6,700 | | | Visa Inc., Cl. A | | | 474,435 | | | | 680,251 | |
| | | | | | | | | | | | |
| | | | TOTAL INFORMATION TECHNOLOGY | | | 6,636,900 | | | | 8,967,881 | |
| | | | | | | | | | | | |
| |
| | | | ENERGY — 14.6% | |
| | 4,000 | | | Cabot Oil & Gas Corp. | | | 247,000 | | | | 303,600 | |
| | 41,000 | | | Cenovus Energy Inc. | | | 1,519,853 | | | | 1,361,200 | |
| | 10,500 | | | ConocoPhillips | | | 823,838 | | | | 765,135 | |
| | 8,000 | | | Continental Resources Inc.† | | | 430,196 | | | | 533,680 | |
| | 9,100 | | | EOG Resources Inc. | | | 914,981 | | | | 896,441 | |
| | 8,000 | | | Halliburton Co. | | | 322,776 | | | | 276,080 | |
| | 9,800 | | | Hess Corp. | | | 494,990 | | | | 556,640 | |
| | 9,700 | | | Occidental Petroleum Corp. | | | 768,598 | | | | 908,890 | |
| | 10,000 | | | Saipem SpA | | | 240,421 | | | | 425,160 | |
| | 14,400 | | | Schlumberger Ltd. | | | 1,066,160 | | | | 983,664 | |
| | 7,500 | | | Southwestern Energy Co.† | | | 325,665 | | | | 239,550 | |
| | 47,000 | | | Suncor Energy Inc. | | | 2,011,058 | | | | 1,355,010 | |
| | 8,000 | | | Ultra Petroleum Corp.† | | | 390,945 | | | | 237,040 | |
| | | | | | | | | | | | |
| | | | TOTAL ENERGY | | | 9,556,481 | | | | 8,842,090 | |
| | | | | | | | | | | | |
| |
| | | | CONSUMER DISCRETIONARY — 14.2% | |
| | 600 | | | Amazon.com Inc.† | | | 41,899 | | | | 103,860 | |
| | 11,000 | | | CBS Corp., Cl. B, Non-Voting | | | 300,773 | | | | 298,540 | |
| | 7,400 | | | Christian Dior SA | | | 835,233 | | | | 877,388 | |
| | 3,500 | | | Coach Inc. | | | 143,687 | | | | 213,640 | |
| | 19,000 | | | Comcast Corp., Cl. A, Special | | | 441,624 | | | | 447,640 | |
| | 18,014 | | | Compagnie Financiere Richemont SA, Cl. A | | | 721,035 | | | | 911,152 | |
| | 9,000 | | | DIRECTV, Cl. A† | | | 450,561 | | | | 384,840 | |
| | 9,800 | | | Hennes & Mauritz AB, Cl. B | | | 283,153 | | | | 315,130 | |
| | 15,500 | | | Johnson Controls Inc. | | | 498,631 | | | | 484,530 | |
| | 9,000 | | | Macy’s Inc. | | | 262,832 | | | | 289,620 | |
| | 6,900 | | | NIKE Inc., Cl. B | | | 502,808 | | | | 664,953 | |
| | 13,000 | | | Nikon Corp. | | | 312,574 | | | | 289,489 | |
| | 500 | | | priceline.com Inc.† | | | 239,857 | | | | 233,855 | |
| | 2,000 | | | Ralph Lauren Corp. | | | 107,888 | | | | 276,160 | |
| | 14,700 | | | Starbucks Corp. | | | 551,013 | | | | 676,347 | |
| | 11,000 | | | The Home Depot Inc. | | | 392,512 | | | | 462,440 | |
| | 14,600 | | | The Swatch Group AG | | | 995,383 | | | | 973,023 | |
| | 6,000 | | | Tiffany & Co. | | | 383,863 | | | | 397,560 | |
| | 7,000 | | | Viacom Inc., Cl. B | | | 345,539 | | | | 317,870 | |
| | | | | | | | | | | | |
| | | | TOTAL CONSUMER DISCRETIONARY | | | 7,810,865 | | | | 8,618,037 | |
| | | | | | | | | | | | |
| |
| | | | HEALTH CARE — 10.0% | |
| | 5,000 | | | Abbott Laboratories | | | 273,362 | | | | 281,150 | |
| | 4,700 | | | Allergan Inc. | | | 388,946 | | | | 412,378 | |
| | 6,700 | | | Becton, Dickinson and Co. | | | 525,607 | | | | 500,624 | |
| | 6,600 | | | Hisamitsu Pharmaceutical Co. Inc. | | | 159,368 | | | | 279,537 | |
See accompanying notes to financial statements.
6
The GAMCO Global Growth Fund
Schedule of Investments (Continued) — December 31, 2011
| | | | | | | | | | | | |
Shares | | | | | Cost | | | Market
Value | |
| | | | | | | | | | | | |
| |
| | | | COMMON STOCKS (Continued) | |
| | | | HEALTH CARE (Continued) | |
| | 700 | | | Intuitive Surgical Inc.† | | $ | 267,792 | | | $ | 324,107 | |
| | 11,000 | | | Johnson & Johnson | | | 733,850 | | | | 721,380 | |
| | 10,000 | | | Novartis AG, ADR | | | 626,517 | | | | 571,700 | |
| | 1,000 | | | Novo Nordisk A/S, ADR | | | 113,696 | | | | 115,260 | |
| | 4,600 | | | Novo Nordisk A/S, Cl. B | | | 312,679 | | | | 528,616 | |
| | 12,000 | | | Roche Holding AG, ADR | | | 478,130 | | | | 510,600 | |
| | 2,600 | | | Roche Holding AG, Genusschein | | | 255,977 | | | | 440,669 | |
| | 9,700 | | | St. Jude Medical Inc. | | | 411,911 | | | | 332,710 | |
| | 9,100 | | | Stryker Corp. | | | 543,640 | | | | 452,361 | |
| | 4,400 | | | Takeda Pharmaceutical Co. Ltd. | | | 214,043 | | | | 193,218 | |
| | 6,000 | | | Varian Medical Systems Inc.† | | | 304,745 | | | | 402,780 | |
| | | | | | | | | | | | |
| | | | TOTAL HEALTH CARE | | | 5,610,263 | | | | 6,067,090 | |
| | | | | | | | | | | | |
| |
| | | | MATERIALS — 5.3% | |
| | 6,950 | | | Anglo American plc | | | 272,680 | | | | 256,772 | |
| | 6,000 | | | BHP Billiton plc | | | 95,357 | | | | 174,944 | |
| | 6,000 | | | E. I. du Pont de Nemours and Co. | | | 278,954 | | | | 274,680 | |
| | 7,800 | | | Freeport-McMoRan Copper & Gold Inc. | | | 372,471 | | | | 286,962 | |
| | 9,000 | | | Goldcorp Inc. | | | 347,878 | | | | 398,250 | |
| | 5,000 | | | Monsanto Co. | | | 253,690 | | | | 350,350 | |
| | 3,300 | | | Rio Tinto plc | | | 104,593 | | | | 160,152 | |
| | 12,000 | | | The Mosaic Co. | | | 692,337 | | | | 605,160 | |
| | 40,000 | | | Tokai Carbon Co. Ltd. | | | 164,086 | | | | 217,228 | |
| | 5,200 | | | Vale SA, ADR | | | 93,597 | | | | 111,540 | |
| | 23,598 | | | Xstrata plc | | | 186,896 | | | | 358,412 | |
| | | | | | | | | | | | |
| | | | TOTAL MATERIALS | | | 2,862,539 | | | | 3,194,450 | |
| | | | | | | | | | | | |
| |
| | | | FINANCIALS — 4.8% | |
| | 2,100 | | | BlackRock Inc. | | | 441,368 | | | | 374,304 | |
| | 25,000 | | | Cheung Kong (Holdings) Ltd. | | | 386,389 | | | | 297,427 | |
| | 1,533 | | | China Life Insurance Co. Ltd., ADR | | | 35,142 | | | | 56,675 | |
| | 8,000 | | | Julius Baer Group Ltd.† | | | 276,686 | | | | 312,914 | |
| | 17,300 | | | Schroders plc | | | 253,505 | | | | 353,028 | |
| | 24,000 | | | Standard Chartered plc | | | 419,802 | | | | 525,158 | |
| | 50,000 | | | Swire Pacific Ltd., Cl. A | | | 554,772 | | | | 603,546 | |
| | 32,000 | | | The Charles Schwab Corp. | | | 489,437 | | | | 360,320 | |
| | | | | | | | | | | | |
| | | | TOTAL FINANCIALS | | | 2,857,101 | | | | 2,883,372 | |
| | | | | | | | | | | | |
| | | | TOTAL COMMON STOCKS | | | 52,599,513 | | | | 58,659,943 | |
| | | | | | | | | | | | |
Principal
Amount | | | | | | | | | |
| |
| | | | U.S. GOVERNMENT OBLIGATIONS — 3.3% | |
| | $1,990,000 | | | U.S. Treasury Bills,
0.000% to 0.055%††,
03/08/12 to 06/14/12 | | | 1,989,772 | | | | 1,989,776 | |
| | | | | | | | | | | | |
| | | | TOTAL INVESTMENTS — 100.2% | | $ | 54,589,285 | | | | 60,649,719 | |
| | | | | | | | | | | | |
| | | | Other Assets and Liabilities (Net) — (0.2)% | | | | (117,915 | ) |
| | | | | | | | | | | | |
| | | | NET ASSETS — 100.0% | | | $ | 60,531,804 | |
| | | | | | | | | | | | |
| † | Non-income producing security. |
| †† | Represents annualized yield at date of purchase. |
| ADR | American Depositary Receipt |
| | | | | | | | |
Geographic Diversification | | % of
Market
Value | | | Market
Value | |
North America | | | 64.6 | % | | $ | 39,181,966 | |
Europe | | | 24.9 | | | | 15,088,189 | |
Japan | | | 5.2 | | | | 3,190,464 | |
Asia/Pacific | | | 5.1 | | | | 3,077,560 | |
Latin America | | | 0.2 | | | | 111,540 | |
| | | | | | | | |
| | | 100.0 | % | | $ | 60,649,719 | |
| | | | | | | | |
See accompanying notes to financial statements.
7
The GAMCO Global Growth Fund
Statement of Assets and Liabilities
December 31, 2011
| | | | |
Assets: | | | | |
Investments, at value (cost $54,589,285) | | $ | 60,649,719 | |
Receivable for Fund shares sold | | | 1,088 | |
Dividends receivable | | | 95,821 | |
Prepaid expense | | | 31,337 | |
| | | | |
Total Assets | | | 60,777,965 | |
| | | | |
Liabilities: | | | | |
Payable to custodian | | | 41,391 | |
Payable for Fund shares redeemed | | | 29,364 | |
Payable for investment advisory fees | | | 50,960 | |
Payable for distribution fees | | | 12,870 | |
Payable for accounting fees | | | 3,750 | |
Payable for shareholder communications expenses | | | 32,976 | |
Payable for audit fees | | | 31,267 | |
Payable for shareholder services fees | | | 14,925 | |
Payable for legal fees | | | 13,180 | |
Other accrued expenses | | | 15,478 | |
| | | | |
Total Liabilities | | | 246,161 | |
| | | | |
Net Assets (applicable to 2,596,629 shares outstanding) | | $ | 60,531,804 | |
| | | | |
Net Assets Consist of: | | | | |
Paid-in capital | | $ | 52,583,963 | |
Accumulated net investment loss | | | (93,624 | ) |
Accumulated net realized gain on investments and foreign currency transactions | | | 1,979,983 | |
Net unrealized appreciation on investments | | | 6,060,434 | |
Net unrealized appreciation on foreign currency translations | | | 1,048 | |
| | | | |
Net Assets | | $ | 60,531,804 | |
| | | | |
Shares of Capital Stock, each at $0.001 par value: | | | | |
Class AAA: | | | | |
Net Asset Value, offering, and redemption price per share ($58,753,210 ÷ 2,519,243 shares outstanding; 75,000,000 shares authorized) | | | $23.32 | |
| | | | |
Class A: | | | | |
Net Asset Value and redemption price per share ($976,043 ÷ 41,842 shares outstanding; 50,000,000 shares authorized) | | | $23.33 | |
| | | | |
Maximum offering price per share (NAV÷ 0.9425, based on maximum sales charge of 5.75% of the offering price) | | | $24.75 | |
| | | | |
Class C: | | | | |
Net Asset Value and offering price per share ($354,189 ÷ 16,367 shares outstanding; 25,000,000 shares authorized) | | | $21.64 | (a) |
| | | | |
Class I: | | | | |
Net Asset Value, offering, and redemption price per share ($448,362 ÷ 19,177 shares outstanding; 25,000,000 shares authorized) | | | $23.38 | |
| | | | |
| (a) | Redemption price varies based on the length of time held. |
Statement of Operations
For the Year Ended December 31, 2011
| | | | |
Investment Income: | | | | |
Dividends (net of foreign withholding taxes of $35,444) | | $ | 1,161,556 | |
Interest | | | 273 | |
| | | | |
Total Investment Income | | | 1,161,829 | |
| | | | |
Expenses: | | | | |
Investment advisory fees | | | 643,276 | |
Distribution fees – Class AAA | | | 156,238 | |
Distribution fees – Class A | | | 2,529 | |
Distribution fees – Class C | | | 3,677 | |
Shareholder services fees | | | 88,378 | |
Shareholder communications expenses | | | 70,571 | |
Custodian fees | | | 58,966 | |
Accounting fees | | | 45,000 | |
Registration expenses | | | 41,346 | |
Directors’ fees | | | 16,990 | |
Legal and audit fees | | | 16,176 | |
Interest expense | | | 661 | |
Miscellaneous expenses | | | 40,085 | |
| | | | |
Total Expenses | | | 1,183,893 | |
| | | | |
Net Investment Loss | | | (22,064 | ) |
| | | | |
Net Realized and Unrealized Gain/(Loss) on Investments and Foreign Currency: | | | | |
Net realized gain on investments | | | 6,461,569 | |
Net realized gain on foreign currency transactions | | | 829 | |
| | | | |
Net realized gain on investments and foreign currency transactions | | | 6,462,398 | |
| | | | |
Net change in unrealized appreciation: | |
on investments | | | (9,156,844 | ) |
on foreign currency translations | | | (2,697 | ) |
| | | | |
Net change in unrealized appreciation on investments and foreign currency translations | | | (9,159,541 | ) |
| | | | |
Net Realized and Unrealized Gain/(Loss) on Investments and Foreign Currency | | | (2,697,143 | ) |
| | | | |
Net Decrease in Net Assets Resulting from Operations | | $ | (2,719,207 | ) |
| | | | |
See accompanying notes to financial statements.
8
The GAMCO Global Growth Fund
Statement of Changes in Net Assets
| | | | | | | | |
| | | Year Ended
December 31, 2011 | | | Year Ended
December 31, 2010 | |
Operations: | | | | | | | | |
Net investment loss | | $ | (22,064 | ) | | $ | (274,372 | ) |
Net realized gain on investments and foreign currency transactions | | | 6,462,398 | | | | 678,767 | |
Net change in unrealized appreciation/depreciation on investments and foreign currency translations | | | (9,159,541 | ) | | | 8,300,358 | |
| | | | | | | | |
Net Increase/(Decrease) in Net Assets Resulting from Operations | | | (2,719,207 | ) | | | 8,704,753 | |
| | | | | | | | |
Capital Share Transactions: | | | | | | | | |
Class AAA | | | (6,380,437 | ) | | | (7,971,576 | ) |
Class A | | | (182,335 | ) | | | (61,885 | ) |
Class B* | | | (3,498 | ) | | | (143,585 | ) |
Class C | | | (184 | ) | | | 22,263 | |
Class I | | | 5,865 | | | | (42,208 | ) |
| | | | | | | | |
Net Decrease in Net Assets from Capital Share Transactions | | | (6,560,589 | ) | | | (8,196,991 | ) |
| | | | | | | | |
Redemption Fees | | | 55 | | | | 5 | |
| | | | | | | | |
Net Increase/(Decrease) in Net Assets | | | (9,279,741 | ) | | | 507,767 | |
Net Assets: | | | | | | | | |
Beginning of period | | | 69,811,545 | | | | 69,303,778 | |
| | | | | | | | |
End of period (including undistributed net investment income of $0 and $0, respectively) | | $ | 60,531,804 | | | $ | 69,811,545 | |
| | | | | | | | |
| * | | Class B Shares were fully redeemed and closed on May 3, 2011. |
See accompanying notes to financial statements.
9
The GAMCO Global Growth Fund
Financial Highlights
Selected data for a share of capital stock outstanding throughout each period:
| | | | | | | | | | | | | | | | | | | | | | | | | | | | | | | | | | | | | | | | | | | | | | | | | | | | | | | | |
| | | | | | Income (Loss)
from Investment Operations | | | Distributions | | | | | | | | | | | | | | | Ratios to Average Net Assets/
Supplemental Data | |
Period
Ended December
31
| | Net Asset
Value,
Beginning
of Period | | | Net
Investment
Income
(Loss)(a) | | | Net
Realized
and
Unrealized
Gain
(Loss)
on
Investments | | | Total
from
Investment
Operations | | | Net
Investment
Income | | | Return
of
Capital | | | Total
Distributions | | | Redemption
Fees
(a)(b) | | | Net
Asset
Value,
End of
Period | | | Total
Return† | | | Net Assets
End of
Period
(in 000’s) | | | Net
Investment
Income
(Loss) | | | Operating
Expenses (c) | | | Portfolio
Turnover
Rate | |
Class AAA | | | | | | | | | | | | | | | | | | | | | | | | | | | | | | | | | | | | | | | | | | | | | | | | | | | | | |
2011 | | $ | 24.35 | | | $ | (0.01 | ) | | $ | (1.02 | ) | | $ | (1.03 | ) | | | — | | | | — | | | | — | | | $ | 0.00 | | | $ | 23.32 | | | | (4.2 | )% | | $ | 58,753 | | | | (0.03 | )% | | | 1.84 | % | | | 45 | % |
2010 | | | 21.31 | | | | (0.09 | ) | | | 3.13 | | | | 3.04 | | | | — | | | | — | | | | — | | | | 0.00 | | | | 24.35 | | | | 14.3 | | | | 67,782 | | | | (0.42 | ) | | | 1.87 | | | | 34 | |
2009 | | | 14.91 | | | | (0.05 | ) | | | 6.45 | | | | 6.40 | | | | — | | | | — | | | | — | | | | 0.00 | | | | 21.31 | | | | 42.9 | | | | 67,292 | | | | (0.29 | ) | | | 1.97 | | | | 45 | |
2008 | | | 26.89 | | | | (0.02 | ) | | | (11.86 | ) | | | (11.88 | ) | | $ | (0.10 | ) | | | — | | | $ | (0.10 | ) | | | 0.00 | | | | 14.91 | | | | (44.2 | ) | | | 51,441 | | | | (0.07 | ) | | | 1.80 | | | | 67 | |
2007 | | | 22.93 | | | | 0.09 | | | | 3.96 | | | | 4.05 | | | | (0.09 | ) | | | — | | | | (0.09 | ) | | | 0.00 | | | | 26.89 | | | | 17.7 | | | | 104,421 | | | | 0.37 | | | | 1.74 | | | | 42 | |
Class A | | | | | | | | | | | | | | | | | | | | | | | | | | | | | | | | | | | | | | | | | | | | | | | | | | | | | |
2011 | | $ | 24.35 | | | $ | (0.01 | ) | | $ | (1.01 | ) | | $ | (1.02 | ) | | | — | | | | — | | | | — | | | $ | 0.00 | | | $ | 23.33 | | | | (4.2 | )% | | $ | 976 | | | | (0.04 | )% | | | 1.84 | % | | | 45 | % |
2010 | | | 21.31 | | | | (0.09 | ) | | | 3.13 | | | | 3.04 | | | | — | | | | — | | | | — | | | | 0.00 | | | | 24.35 | | | | 14.3 | | | | 1,193 | | | | (0.42 | ) | | | 1.87 | | | | 34 | |
2009 | | | 14.91 | | | | (0.06 | ) | | | 6.46 | | | | 6.40 | | | | — | | | | — | | | | — | | | | 0.00 | | | | 21.31 | | | | 42.9 | | | | 1,115 | | | | (0.32 | ) | | | 1.97 | | | | 45 | |
2008 | | | 26.88 | | | | (0.02 | ) | | | (11.86 | ) | | | (11.88 | ) | | $ | (0.09 | ) | | | — | | | $ | (0.09 | ) | | | 0.00 | | | | 14.91 | | | | (44.2 | ) | | | 1,006 | | | | (0.09 | ) | | | 1.80 | | | | 67 | |
2007 | | | 22.93 | | | | 0.11 | | | | 3.95 | | | | 4.06 | | | | (0.11 | ) | | | — | | | | (0.11 | ) | | | 0.00 | | | | 26.88 | | | | 17.7 | | | | 2,224 | | | | 0.43 | | | | 1.74 | | | | 42 | |
Class C | | | | | | | | | | | | | | | | | | | | | | | | | | | | | | | | | | | | | | | | | | | | | | | | | | | | | |
2011 | | $ | 22.76 | | | $ | (0.17 | ) | | $ | (0.95 | ) | | $ | (1.12 | ) | | | — | | | | — | | | | — | | | $ | 0.00 | | | $ | 21.64 | | | | (4.9 | )% | | $ | 354 | | | | (0.77 | )% | | | 2.59 | % | | | 45 | % |
2010 | | | 20.07 | | | | (0.23 | ) | | | 2.92 | | | | 2.69 | | | | — | | | | — | | | | — | | | | 0.00 | | | | 22.76 | | | | 13.4 | | | | 374 | | | | (1.17 | ) | | | 2.62 | | | | 34 | |
2009 | | | 14.15 | | | | (0.19 | ) | | | 6.11 | | | | 5.92 | | | | — | | | | — | | | | — | | | | 0.00 | | | | 20.07 | | | | 41.8 | | | | 317 | | | | (1.11 | ) | | | 2.72 | | | | 45 | |
2008 | | | 25.54 | | | | (0.21 | ) | | | (11.18 | ) | | | (11.39 | ) | | | — | | | | — | | | | — | | | | 0.00 | | | | 14.15 | | | | (44.6 | ) | | | 168 | | | | (0.98 | ) | | | 2.55 | | | | 67 | |
2007 | | | 21.87 | | | | (0.03 | ) | | | 3.70 | | | | 3.67 | | | | — | | | | — | | | | — | | | | 0.00 | | | | 25.54 | | | | 16.8 | | | | 428 | | | | (0.11 | ) | | | 2.49 | | | | 42 | |
Class I | | | | | | | | | | | | | | | | | | | | | | | | | | | | | | | | | | | | | | | | | | | | | | | | | | | | | |
2011 | | $ | 24.34 | | | $ | 0.05 | | | $ | (1.01 | ) | | $ | (0.96 | ) | | | — | | | | — | | | | — | | | $ | 0.00 | | | $ | 23.38 | | | | (3.9 | )% | | $ | 449 | | | | 0.21 | % | | | 1.59 | % | | | 45 | % |
2010 | | | 21.25 | | | | (0.04 | ) | | | 3.13 | | | | 3.09 | | | | — | | | | — | | | | — | | | | 0.00 | | | | 24.34 | | | | 14.5 | | | | 460 | | | | (0.17 | ) | | | 1.62 | | | | 34 | |
2009 | | | 14.83 | | | | 0.00 | (b) | | | 6.44 | | | | 6.44 | | | $ | (0.00 | )(b) | | $ | (0.02 | ) | | $ | (0.02 | ) | | | 0.00 | | | | 21.25 | | | | 43.4 | | | | 441 | | | | 0.02 | | | | 1.72 | | | | 45 | |
2008(d) | | | 25.35 | | | | 0.06 | | | | (10.36 | ) | | | (10.30 | ) | | | (0.22 | ) | | | — | | | | (0.22 | ) | | | 0.00 | | | | 14.83 | | | | (40.6 | ) | | | 737 | | | | 0.28 | (e) | | | 1.55 | (e) | | | 67 | |
| † | | Total return represents aggregate total return of a hypothetical $1,000 investment at the beginning of the period and sold at the end of the period including reinvestment of distributions and does not reflect applicable sales charges. Total return for a period of less than one year is not annualized. |
| (a) | | Per share amounts have been calculated using the average shares outstanding method. |
| (b) | | Amount represents less than $0.005 per share. |
| (c) | | The Fund incurred interest expense during the year ended December 31, 2007. If interest expense had not been incurred, the ratios of operating expenses to average net assets would have been 1.73% (Class AAA and Class A), and 2.48% (Class C), respectively. For the years ended December 31, 2011, 2010, 2009, and 2008, the effect of interest expense was minimal. |
| (d) | | From the commencement of offering Class I Shares on January 11, 2008 through December 31, 2008. |
See accompanying notes to financial statements.
10
The GAMCO Global Growth Fund
Notes to Financial Statements
1. Organization. The GAMCO Global Growth Fund, a series of GAMCO Global Series Funds, Inc. (the “Corporation”), was incorporated on July 16, 1993 in Maryland. The Fund is a non-diversified open-end management investment company registered under the Investment Company Act of 1940, as amended (the “1940 Act”), and one of four separately managed portfolios (collectively, the “Portfolios”) of the Corporation. The Fund’s primary objective is capital appreciation. The Fund commenced investment operations on February 7, 1994.
2. Significant Accounting Policies. The Fund’s financial statements are prepared in accordance with U.S. Generally Accepted Accounting Principles (“GAAP”), which may require the use of management estimates and assumptions. Actual results could differ from those estimates. The following is a summary of significant accounting policies followed by the Fund in the preparation of its financial statements.
Security Valuation. Portfolio securities listed or traded on a nationally recognized securities exchange or traded in the U.S. over-the-counter market for which market quotations are readily available are valued at the last quoted sale price or a market’s official closing price as of the close of business on the day the securities are being valued. If there were no sales that day, the security is valued at the average of the closing bid and asked prices or, if there were no asked prices quoted on that day, then the security is valued at the closing bid price on that day. If no bid or asked prices are quoted on such day, the security is valued at the most recently available price or, if the Board of Directors (the “Board”) so determines, by such other method as the Board shall determine in good faith to reflect its fair market value. Portfolio securities traded on more than one national securities exchange or market are valued according to the broadest and most representative market, as determined by Gabelli Funds, LLC (the “Adviser”).
Portfolio securities primarily traded on a foreign market are generally valued at the preceding closing values of such securities on the relevant market, but may be fair valued pursuant to procedures established by the Board if market conditions change significantly after the close of the foreign market, but prior to the close of business on the day the securities are being valued. Debt instruments with remaining maturities of sixty days or less that are not credit impaired are valued at amortized cost, unless the Board determines such amount does not reflect the securities’ fair value, in which case these securities will be fair valued as determined by the Board. Debt instruments having a maturity greater than sixty days for which market quotations are readily available are valued at the average of the latest bid and asked prices. If there were no asked prices quoted on such day, the security is valued using the closing bid price. U.S. government obligations with maturities greater than sixty days are normally valued using a model that incorporates market observable data such as reported sales of similar securities, broker quotes, yields, bids, offers, and reference data. Certain securities are valued principally using dealer quotations.
Securities and assets for which market quotations are not readily available are fair valued as determined by the Board. Fair valuation methodologies and procedures may include, but are not limited to: analysis and review of available financial and non-financial information about the company; comparisons with the valuation and changes in valuation of similar securities, including a comparison of foreign securities with the equivalent U.S. dollar value ADR securities at the close of the U.S. exchange; and evaluation of any other information that could be indicative of the value of the security.
The Fund employs a fair value model to adjust prices to reflect events affecting the values of certain portfolio securities occur between the close of trading on the principal market for such securities (foreign exchanges and
11
The GAMCO Global Growth Fund
Notes to Financial Statements (Continued)
over-the-counter markets) at the time at which net asset values of the Fund are determined. If the Fund’s valuation committee believes that a particular event would materially affect net asset value, further adjustment is considered.
The inputs and valuation techniques used to measure fair value of the Fund’s investments are summarized into three levels as described in the hierarchy below:
| | • | | Level 1 — quoted prices in active markets for identical securities; |
| | • | | Level 2 — other significant observable inputs (including quoted prices for similar securities, interest rates, prepayment speeds, credit risk, etc.); and |
| | • | | Level 3 — significant unobservable inputs (including the Fund’s determinations as to the fair value of investments). |
A financial instrument’s level within the fair value hierarchy is based on the lowest level of any input both individually and in the aggregate that is significant to the fair value measurement. The inputs or methodology used for valuing securities are not necessarily an indication of the risk associated with investing in those securities. The summary of the Fund’s investments in securities by inputs used to value the Fund’s investments as of December 31, 2011 is as follows:
| | | | | | | | | | | | |
| | | Valuation Inputs | | | | |
| | | Level 1
Quoted Prices | | | Level 2 Other Significant
Observable Inputs | | | Total Market Value
at 12/31/11 | |
INVESTMENTS IN SECURITIES: | | | | | | | | | | | | |
ASSETS (Market Value): | | | | | | | | | | | | |
Common Stocks: | | | | | | | | | | | | |
Consumer Staples | | $ | 10,485,791 | | | | — | | | $ | 10,485,791 | |
Industrials | | | 9,601,232 | | | | — | | | | 9,601,232 | |
Information Technology | | | 8,967,881 | | | | — | | | | 8,967,881 | |
Energy | | | 8,842,090 | | | | — | | | | 8,842,090 | |
Consumer Discretionary | | | 8,618,037 | | | | — | | | | 8,618,037 | |
Health Care | | | 6,067,090 | | | | — | | | | 6,067,090 | |
Materials | | | 3,194,450 | | | | — | | | | 3,194,450 | |
Financials | | | 2,883,372 | | | | — | | | | 2,883,372 | |
Total Common Stocks | | | 58,659,943 | | | | — | | | | 58,659,943 | |
U.S. Government Obligations | | | — | | | $ | 1,989,776 | | | | 1,989,776 | |
TOTAL INVESTMENTS IN SECURITIES – ASSETS | | $ | 58,659,943 | | | $ | 1,989,776 | | | $ | 60,649,719 | |
The Fund did not have significant transfers between Level 1 and Level 2 during the year ended December 31, 2011. The Fund’s policy is to recognize transfers among Levels as of the beginning of the reporting period.
There were no Level 3 investments held at December 31, 2011 or December 31, 2010.
In May 2011, the Financial Accounting Standards Board issued Accounting Standards Update (“ASU”) No. 2011-04 “Amendments to Achieve Common Fair Value Measurement and Disclosure Requirements in U.S. GAAP and International Financial Reporting Standards (“IFRS”).” ASU 2011-04 includes common requirements for measurement of and disclosure about fair value between U.S. GAAP and IFRS. ASU 2011-04 will require
12
The GAMCO Global Growth Fund
Notes to Financial Statements (Continued)
reporting entities to disclose the following information for fair value measurements categorized within Level 3 of the fair value hierarchy: quantitative information about the unobservable inputs used in the fair value measurement, the valuation processes used by the reporting entity, and a narrative description of the sensitivity of the fair value measurement to changes in unobservable inputs and the interrelationships between those unobservable inputs. In addition, ASU 2011-04 will require reporting entities to make disclosures about amounts and reasons for all transfers into and out of Level 1 and Level 2 fair value measurements. The new and revised disclosures are effective for interim and annual reporting periods beginning after December 15, 2011. At this time, management is evaluating the implications of ASU 2011-04 and its impact on the financial statements.
Derivative Financial Instruments.
The Fund may engage in various portfolio investment strategies by investing in a number of derivative financial instruments for the purposes of hedging against changes in the value of its portfolio securities and in the value of securities it intends to purchase or hedging against a specific transaction with respect to either the currency in which the transaction is denominated or another currency. Investing in certain derivative financial instruments, including participation in the options, futures, or swap markets, entails certain execution, liquidity, hedging, tax, and securities, interest, credit, or currency market risks. Losses may arise if the Adviser’s prediction of movements in the direction of the securities, foreign currency, and interest rate markets is inaccurate. Losses may also arise if the counterparty does not perform its duties under a contract, or that, in the event of default, the Fund may be delayed in or prevented from obtaining payments or other contractual remedies owed to it under derivative contracts. The creditworthiness of the counterparties is closely monitored in order to minimize these risks. Participation in derivative transactions involves investment risks, transaction costs, and potential losses to which the Fund would not be subject absent the use of these strategies. The consequences of these risks, transaction costs, and losses may have a negative impact on the Fund’s ability to pay distributions.
The Fund’s derivative contracts held at December 31, 2011, if any, are not accounted for as hedging instruments under GAAP and are disclosed in the Schedule of Investments together with the related counterparty.
Foreign Currency Translations. The books and records of the Fund are maintained in U.S. dollars. Foreign currencies, investments, and other assets and liabilities are translated into U.S. dollars at current exchange rates. Purchases and sales of investment securities, income, and expenses are translated at the exchange rate prevailing on the respective dates of such transactions. Unrealized gains and losses that result from changes in foreign exchange rates and/or changes in market prices of securities have been included in unrealized appreciation/depreciation on investments and foreign currency translations. Net realized foreign currency gains and losses resulting from changes in exchange rates include foreign currency gains and losses between trade date and settlement date on investment securities transactions, foreign currency transactions, and the difference between the amounts of interest and dividends recorded on the books of the Fund and the amounts actually received. The portion of foreign currency gains and losses related to fluctuation in exchange rates between the initial purchase trade date and subsequent sale trade date is included in realized gain/(loss) on investments.
13
The GAMCO Global Growth Fund
Notes to Financial Statements (Continued)
Foreign Securities. The Fund may directly purchase securities of foreign issuers. Investing in securities of foreign issuers involves special risks not typically associated with investing in securities of U.S. issuers. The risks include possible revaluation of currencies, the inability to repatriate funds, less complete financial information about companies, and possible future adverse political and economic developments. Moreover, securities of many foreign issuers and their markets may be less liquid and their prices more volatile than securities of comparable U.S. issuers.
Foreign Taxes. The Fund may be subject to foreign taxes on income, gains on investments, or currency repatriation, a portion of which may be recoverable. The Fund will accrue such taxes and recoveries as applicable, based upon its current interpretation of tax rules and regulations that exist in the markets in which it invests.
Securities Transactions and Investment Income. Securities transactions are accounted for on the trade date with realized gain or loss on investments determined by using the identified cost method. Interest income (including amortization of premium and accretion of discount) is recorded on the accrual basis. Premiums and discounts on debt securities are amortized using the effective yield to maturity method. Dividend income is recorded on the ex-dividend date, except for certain dividends from foreign securities that are recorded as soon after the ex-dividend date as the Fund becomes aware of such dividends.
Determination of Net Asset Value and Calculation of Expenses. Certain administrative expenses are common to, and allocated among, various affiliated funds. Such allocations are made on the basis of each fund’s average net assets or other criteria directly affecting the expenses as determined by the Adviser pursuant to procedures established by the Board.
In calculating NAV per share of each class, investment income, realized and unrealized gains and losses, redemption fees, and expenses other than class specific expenses are allocated daily to each class of shares based upon the proportion of net assets of each class at the beginning of each day. Distribution expenses are borne solely by the class incurring the expense.
Custodian Fee Credits and Interest Expense. When cash balances are maintained in the custody account, the Fund receives credits which are used to offset custodian fees. The gross expenses paid under the custody arrangement are included in custodian fees in the Statement of Operations with the corresponding expense offset, if any, shown as “Custodian fee credits.” When cash balances are overdrawn, the Fund is charged an overdraft fee equal to 2.00% above the federal funds rate on outstanding balances. This amount, if any, would be included in the Statement of Operations.
Distributions to Shareholders. Distributions to shareholders are recorded on the ex-dividend date. Distributions to shareholders are based on income and capital gains as determined in accordance with federal income tax regulations, which may differ from income and capital gains as determined under GAAP. These differences are primarily due to differing treatments of income and gains on various investment securities and foreign currency transactions held by the Fund, timing differences, and differing characterizations of distributions made by the Fund. Distributions from net investment income for federal income tax purposes include net realized gains on foreign currency transactions. These book/tax differences are either temporary or permanent in nature. To the extent these differences are permanent, adjustments are made to the appropriate capital accounts in the period when the differences arise. Permanent differences were primarily due to the tax
14
The GAMCO Global Growth Fund
Notes to Financial Statements (Continued)
treatment of currency gains and losses and a write-off of the current year net operating loss. These reclassifications have no impact on the NAV of the Fund. For the year ended December 31, 2011, reclassifications were made to decrease accumulated net investment loss by $22,063 and decrease accumulated net realized gain on investments and foreign currency transactions by $829, with an offsetting adjustment to paid-in capital.
No distributions were made during the years ended December 31, 2011 and December 31, 2010.
Provision for Income Taxes. The Fund intends to continue to qualify as a regulated investment company under Subchapter M of the Internal Revenue Code of 1986, as amended (the “Code”). It is the policy of the Fund to comply with the requirements of the Code applicable to regulated investment companies and to distribute substantially all of its net investment company taxable income and net capital gains. Therefore, no provision for federal income taxes is required.
As of December 31, 2011, the components of accumulated earnings/losses on a tax basis were as follows:
| | | | |
Accumulated capital loss carryforwards | | $ | (468,404 | ) |
Net unrealized appreciation on investments and foreign currency translations | | | 8,416,245 | |
| | | | |
Total | | $ | 7,947,841 | |
| | | | |
At December 31, 2011, the Fund had net capital loss carryforwards for federal income tax purposes which are available to reduce future required distributions of net capital gains to shareholders. Under the Regulated Investment Company Modernization Act of 2010, the Fund will be permitted to carry forward for an unlimited period capital losses incurred in years beginning after December 22, 2010. In addition, these losses must be utilized prior to the losses incurred in pre-enactment taxable years. As a result of the rule, pre-enactment capital loss carryforwards may have an increased likelihood of expiring unused. Additionally, post enactment capital losses that are carried forward will retain their character as either short-term or long-term capital losses rather than being considered all short-term as under previous law.
| | | | |
Capital Loss Carryforward Available through 2017 | | $ | 468,404 | |
| | | | |
Total Capital Loss Carryforwards | | $ | 468,404 | |
| | | | |
During the year ended December 31, 2011, the Fund utilized capital loss carryforwards of $3,808,503.
At December 31, 2011, the temporary difference between book basis and tax basis net unrealized appreciation on investments was primarily due to deferral of losses from wash sales for tax purposes, mark-to-market adjustments on investments in passive foreign investment companies, and adjustments on securities with litigation gain.
The following summarizes the tax cost of investments and the related net unrealized appreciation at December 31, 2011:
| | | | | | | | | | | | | | | | |
| | | Cost | | | Gross
Unrealized
Appreciation | | | Gross
Unrealized
Depreciation | | | Net
Unrealized
Appreciation | |
Investments | | $ | 52,234,522 | | | $ | 13,658,374 | | | $ | (5,243,177 | ) | | $ | 8,415,197 | |
15
The GAMCO Global Growth Fund
Notes to Financial Statements (Continued)
The Fund is required to evaluate tax positions taken or expected to be taken in the course of preparing the Fund’s tax returns to determine whether the tax positions are “more-likely-than-not” of being sustained by the applicable tax authority. Income tax and related interest and penalties would be recognized by the Fund as tax expense in the Statement of Operations if the tax positions were deemed not to meet the more-likely-than-not threshold. For the year ended December 31, 2011, the Fund did not incur any income tax, interest, or penalties. As of December 31, 2011, the Adviser has reviewed all open tax years and concluded that there was no impact to the Fund’s net assets or results of operations. Tax years ended December 31, 2008 through December 31, 2011 remain subject to examination by the Internal Revenue Service and state taxing authorities. On an ongoing basis, the Adviser will monitor the Fund’s tax positions to determine if adjustments to this conclusion are necessary.
On December 2, 2011, the Fund received a cash payment of approximately $2.9 million as part of a settlement agreement between CIBC and the SEC. This cash payment represents the Fund’s share of the disgorgement and civil penalties, plus any accrued interest, payable by CIBC and distributed to recipient funds, as opposed to the underlying shareholders, in response to certain allegations of market timing and late trading that took place between 1999 and 2003. During that period, CIBC provided funding for certain hedge funds which took advantage of numerous mutual funds through late trading, account masking, and frequent trading that violated certain securities laws. The Fund recognized the cash received as realized gain in the Statement of Operations for financial reporting purposes.
3. Investment Advisory Agreement and Other Transactions. The Fund has entered into an investment advisory agreement (the “Advisory Agreement”) with the Adviser which provides that the Fund will pay the Adviser a fee, computed daily and paid monthly, at the annual rate of 1.00% of the value of its average daily net assets. In accordance with the Advisory Agreement, the Adviser provides a continuous investment program for the Fund’s portfolio, oversees the administration of all aspects of the Fund’s business and affairs, and pays the compensation of all Officers and Directors of the Fund who are affiliated persons of the Adviser.
The Corporation pays each Director who is not considered to be an affiliated person an annual retainer of $6,000 plus $1,000 for each Board meeting attended and each Director is reimbursed by the Corporation for any out of pocket expenses incurred in attending meetings. All Board committee members receive $1,000 per meeting attended. The Chairman of the Audit Committee receives an annual fee of $3,000, and the Lead Director receives an annual fee of $2,000. A Director may receive a single meeting fee, allocated among the participating funds, for participation in certain meetings held on behalf of multiple funds. Directors who are directors or employees of the Adviser or an affiliated company receive no compensation or expense reimbursement from the Corporation.
4. Distribution Plan. The Fund’s Board has adopted a distribution plan (the “Plan”) for each class of shares, except for Class I Shares, pursuant to Rule 12b-1 under the 1940 Act. G.distributors, LLC serves as successor “Distributor” to Gabelli & Company, Inc. (“Gabelli & Co.”) effective August 1, 2011, both affiliates of the Fund. Under the Class AAA, Class A, and Class C Share Plans, payments are authorized to the Distributor at annual rates of 0.25%, 0.25%, and 1.00%, respectively, of the average daily net assets of those classes, the annual limitations under each Plan. Such payments are accrued daily and paid monthly.
16
The GAMCO Global Growth Fund
Notes to Financial Statements (Continued)
5. Portfolio Securities. Purchases and sales of securities during the year ended December 31, 2011, other than short-term securities and U.S. Government obligations, aggregated $29,277,133 and $34,644,532, respectively.
6. Transactions with Affiliates. During the year ended December 31, 2011, the Fund paid brokerage commissions on security trades of $9,608 to Gabelli & Co. Additionally, the current and former Distributors informed the Fund that they retained a total of $119 from investors representing commissions (sales charges and underwriting fees) on sales and redemptions of Fund shares.
The cost of calculating the Fund’s NAV per share is a Fund expense pursuant to the Advisory Agreement. During the year ended December 31, 2011, the Fund paid or accrued $45,000 to the Adviser in connection with the cost of computing the Fund’s NAV.
7. Line of Credit. The Fund participates in an unsecured line of credit of up to $75,000,000 under which it may borrow up to 10% of its net assets from the custodian for temporary borrowing purposes. Borrowings under this arrangement bear interest at the higher of the sum of the LIBOR rate plus 125 basis points or the sum of the federal funds rate plus 125 basis points at the time of borrowing. This amount, if any, would be included in “interest expense” in the Statement of Operations. At December 31, 2011, there were no borrowings outstanding under the line of credit.
The average daily amount of borrowings outstanding under the line of credit during year ended December 31, 2011 was $17,556 with a weighted average interest rate of 1.46%. The maximum amount borrowed at any time during the year ended December 31, 2011 was $788,000.
8. Capital Stock. The Fund offers four classes of shares – Class AAA Shares, Class A Shares, Class C Shares, and Class I Shares. Class AAA Shares are offered without a sales charge only to investors who acquire them directly from the Distributor, through selected broker/dealers, or the transfer agent. Class I Shares are offered without a sales charge, solely to certain institutions, directly through the Distributor, or brokers that have entered into selling agreements specifically with respect to Class I Shares. Class A Shares are subject to a maximum front-end sales charge of 5.75%. Class C Shares are subject to a 1.00% CDSC for one year after purchase. Class B Shares were fully redeemed on May 3, 2011.
The Fund imposes a redemption fee of 2.00% on all classes of shares that are redeemed or exchanged on or before the seventh day after the date of a purchase. The redemption fee is deducted from the proceeds otherwise payable to the redeeming shareholders and is retained by the Fund as an increase in paid-in capital. The redemption fees retained by the Fund during the years ended December 31, 2011 and December 31, 2010 amounted to $55 and $5 respectively. The redemption fee does not apply to redemptions of shares where (i) the shares were purchased through automatic reinvestment of distributions, (ii) the redemption was initiated by the Fund, (iii) the shares were purchased through programs that collect the redemption fee at the program level and remit them to the Fund, or (iv) the shares were purchased through programs that the Adviser determines to have appropriate anti-short-term trading policies in place or as to which the Adviser has received assurances that look-through redemption fee procedures or effective anti-short-term trading policies and procedures are in place.
17
The GAMCO Global Growth Fund
Notes to Financial Statements (Continued)
Transactions in shares of capital stock were as follows:
| | | | | | | | | | | | | | | | |
| | | Year Ended
December 31, 2011 | | | Year Ended
December 31, 2010 | |
| | | Shares | | | Amount | | | Shares | | | Amount | |
Class AAA | | | | | | | | | | | | | | | | |
Shares sold | | | 87,627 | | | $ | 2,057,625 | | | | 104,470 | | | $ | 2,220,670 | |
Shares redeemed | | | (352,596 | ) | | | (8,438,062 | ) | | | (478,582 | ) | | | (10,192,246 | ) |
| | | | | | | | | | | | | | | | |
Net decrease | | | (264,969 | ) | | $ | (6,380,437 | ) | | | (374,112 | ) | | $ | (7,971,576 | ) |
| | | | | | | | | | | | | | | | |
| | | | |
Class A | | | | | | | | | | | | | | | | |
Shares sold | | | 5,044 | | | $ | 116,380 | | | | 10,635 | | | $ | 241,369 | |
Shares redeemed | | | (12,195 | ) | | | (298,715 | ) | | | (13,959 | ) | | | (303,254 | ) |
| | | | | | | | | | | | | | | | |
Net decrease | | | (7,151 | ) | | $ | (182,335 | ) | | | (3,324 | ) | | $ | (61,885 | ) |
| | | | | | | | | | | | | | | | |
| | | | |
Class B* | | | | | | | | | | | | | | | | |
Shares redeemed | | | (144 | ) | | $ | (3,498 | ) | | | (6,762 | ) | | $ | (143,585 | ) |
| | | | | | | | | | | | | | | | |
Net decrease | | | (144 | ) | | $ | (3,498 | ) | | | (6,762 | ) | | $ | (143,585 | ) |
| | | | | | | | | | | | | | | | |
| | | | |
Class C | | | | | | | | | | | | | | | | |
Shares sold | | | 1,278 | | | $ | 29,675 | | | | 6,639 | | | $ | 140,999 | |
Shares redeemed | | | (1,321 | ) | | | (29,859 | ) | | | (6,035 | ) | | | (118,736 | ) |
| | | | | | | | | | | | | | | | |
Net increase/(decrease) | | | (43 | ) | | $ | (184 | ) | | | 604 | | | $ | 22,263 | |
| | | | | | | | | | | | | | | | |
| | | | |
Class I | | | | | | | | | | | | | | | | |
Shares sold | | | 3,792 | | | $ | 91,108 | | | | 3,019 | | | $ | 63,403 | |
Shares redeemed | | | (3,493 | ) | | | (85,243 | ) | | | (4,883 | ) | | | (105,611 | ) |
| | | | | | | | | | | | | | | | |
Net increase/(decrease) | | | 299 | | | $ | 5,865 | | | | (1,864 | ) | | $ | (42,208 | ) |
| | | | | | | | | | | | | | | | |
| * | Class B Shares were fully redeemed on May 3, 2011. |
9. Indemnifications. The Fund enters into contracts that contain a variety of indemnifications. The Fund’s maximum exposure under these arrangements is unknown. However, the Fund has not had prior claims or losses pursuant to these contracts. Management has reviewed the Fund’s existing contracts and expects the risk of loss to be remote.
10. Other Matters. On April 24, 2008, the Adviser entered into a settlement with the SEC to resolve an inquiry regarding prior frequent trading in shares of the Fund by one investor who was banned from the Fund in August 2002. Under the terms of the settlement, the Adviser, without admitting or denying the SEC’s findings and allegations, paid $16 million (which included a $5 million civil monetary penalty). On the same day, the SEC filed a civil action in the U.S. District Court for the Southern District of New York against the Executive Vice President and Chief Operating Officer of the Adviser, alleging violations of certain federal securities laws arising from the same matter. The officer, who is also an officer of the Fund and other funds in the Gabelli/GAMCO complex, denies the allegations and is continuing in his positions with the Adviser and the funds. The settlement by the Adviser did not have, and the resolution of the action against the officer is not expected to have, a material adverse impact on the Adviser or its ability to fulfill its obligations under the Advisory Agreement.
18
The GAMCO Global Growth Fund
Notes to Financial Statements (Continued)
11. Subsequent Events. Management has evaluated the impact on the Fund of all subsequent events occurring through the date the financial statements were issued and has determined that there were no subsequent events requiring recognition or disclosure in the financial statements.
Morningstar Rating™ is based on risk-adjusted returns. The Overall Morningstar Rating is derived from a weighted average of the performance figures associated with a fund’s three, five, and ten year (if applicable) Morningstar Rating metrics. For funds with at least a three year history, a Morningstar Rating is based on a risk-adjusted return measure (including the effects of sales charges, loads, and redemption fees) placing more emphasis on downward variations and rewarding consistent performance. That accounts for variations in a fund’s monthly performance. The top 10% of funds in each category receive 5 stars, the next 22.5% 4 stars, the next 35% 3 stars, the next 22.5% 2 stars, and the bottom 10% 1 star. (Each share class is counted as a fraction of one fund within this scale and rated separately, which may cause slight variations in the distribution percentages.) Morningstar Rating is for the AAA Share class only; other classes may have different performance characteristics. Ratings reflect relative performance. Results for certain periods were negative. ©2012 Morningstar, Inc. All Rights Reserved. The information contained herein: (1) is proprietary to Morningstar and/or its content providers ; (2) may not be copied or distributed; and (3) is not warranted to be accurate, complete or timely. Neither Morningstar nor its content providers are responsible for any damages or losses arising from any use of this information.
19
The GAMCO Global Growth Fund
Report of Independent Registered Public Accounting Firm
To the Shareholders and Board of Directors of
GAMCO Global Series Funds, Inc.
We have audited the accompanying statement of assets and liabilities, including the schedule of investments, of The GAMCO Global Growth Fund (the “Fund”), one of the series constituting GAMCO Global Series Funds, Inc., as of December 31, 2011, and the related statement of operations for the year then ended, the statements of changes in net assets for each of the two years in the period then ended, and the financial highlights for each of the periods indicated therein. These financial statements and financial highlights are the responsibility of the Fund’s management. Our responsibility is to express an opinion on these financial statements and financial highlights based on our audits.
We conducted our audits in accordance with the standards of the Public Company Accounting Oversight Board (United States). Those standards require that we plan and perform the audit to obtain reasonable assurance about whether the financial statements and financial highlights are free of material misstatement. We were not engaged to perform an audit of the Fund’s internal control over financial reporting. Our audits included consideration of internal control over financial reporting as a basis for designing audit procedures that are appropriate in the circumstances, but not for the purpose of expressing an opinion on the effectiveness of the Fund’s internal control over financial reporting. Accordingly, we express no such opinion. An audit also includes examining, on a test basis, evidence supporting the amounts and disclosures in the financial statements and financial highlights, assessing the accounting principles used and significant estimates made by management, and evaluating the overall financial statement presentation. Our procedures included confirmation of securities owned as of December 31, 2011, by correspondence with the Fund’s custodian and brokers, or by other appropriate auditing procedures where replies from brokers were not received. We believe that our audits provide a reasonable basis for our opinion.
In our opinion, the financial statements and financial highlights referred to above present fairly, in all material respects, the financial position of The GAMCO Global Growth Fund, one of the series constituting GAMCO Global Series Funds, Inc., at December 31, 2011, the results of its operations for the year then ended, the changes in its net assets for each of the two years in the period then ended, and its financial highlights for each of the periods indicated therein, in conformity with U.S. generally accepted accounting principles.

Philadelphia, Pennsylvania
February 27, 2012
20
The GAMCO Global Growth Fund
Board Consideration and Re-Approval of Investment Advisory Agreement (Unaudited)
During the six months ended December 31, 2011, the Board of Directors of the Corporation approved the continuation of the investment advisory agreement with the Adviser for the Fund on the basis of the recommendation by the directors (the “Independent Board Members”) who are not “interested persons” of the Fund. The following paragraphs summarize the material information and factors considered by the Independent Board Members as well as their conclusions relative to such factors.
Nature, Extent, and Quality of Services. The Independent Board Members considered information regarding the Fund’s portfolio managers, the depth of the analyst pool available to the Adviser and the portfolio managers, the scope of supervisory, administrative, shareholder, and other services supervised or provided by the Adviser, and the absence of significant service problems reported to the Board. The Independent Board Members noted the experience, length of service, and reputation of the Fund’s portfolio managers.
Investment Performance. The Independent Board Members reviewed the short, medium, and long-term performance of the Fund against a peer group of global large cap growth funds, noting its fourth quartile performance for the one year period, third quartile performance for the three year period, and average performance for the five year period.
Profitability. The Independent Board Members reviewed summary data regarding the profitability of the Fund to the Adviser both with a pro rata administrative overhead charge and with a standalone administrative charge. The Independent Board Members also noted that affiliated brokers of the Adviser received distribution fees and minor amounts of sales commissions.
Economies of Scale. The Independent Board Members discussed the major elements of the Adviser’s cost structure and the relationship of those elements to potential economies of scale and reviewed rudimentary data relating to the impact of 20% growth in the Fund on the Adviser’s profitability.
Sharing of Economies of Scale. The Independent Board Members noted that the investment advisory fee schedule for the Fund does not take into account any potential economies of scale that may develop.
Service and Cost Comparisons. The Independent Board Members compared the expense ratios of the investment advisory fee, other expenses, and total expenses of the Fund with similar expense ratios of the peer group of global multi-cap core funds and noted that the Adviser’s advisory fee includes substantially all administrative services of the Fund as well as investment advisory services. The Independent Board Members noted that the Fund’s expense ratios were significantly higher than and the Fund’s size was lower than average within this group. The Independent Board Members compared the advisory fee with the fees for other funds managed by the Adviser and considered fees charged by an affiliated adviser for general equity institutional accounts and unregistered funds.
Conclusions. The Independent Board Members concluded that the Fund enjoyed highly experienced portfolio management services and good ancillary services and a reasonable performance record. The Independent Board Members also concluded that the Fund’s expense ratios and the profitability to the Adviser of managing the Fund were reasonable, and that economies of scale were not a significant factor in their thinking at this time. The Independent Board Members did not view the potential profitability of ancillary services as material to their decision. On the basis of the foregoing and without assigning particular weight to any single conclusion, the Independent Board Members determined to recommend continuation of the investment advisory agreement to the full Board.
21
The GAMCO Global Growth Fund
Additional Fund Information (Unaudited)
The business and affairs of the Corporation are managed under the direction of the Corporation’s Board of Directors. Information pertaining to the Directors and officers of the Corporation is set forth below. The Fund’s Statement of Additional Information includes additional information about the Fund’s Directors and is available without charge, upon request, by calling 800-GABELLI (800-422-3554) or by writing to The GAMCO Global Growth Fund at One Corporate Center, Rye, NY 10580-1422.
| | | | | | | | |
Name, Position(s)
Address1
and Age | | Term of Office
and Length of
Time Served2 | | Number of Funds in
Fund Complex
Overseen by Director | | Principal Occupation(s)
During Past Five Years | | Other Directorships
Held by Director4 |
| | | |
INTERESTED DIRECTORS3: | | | | | | |
Mario J. Gabelli, CFA Director and
Chief Investment Officer Age: 69 | | Since 1993 | | 27 | | Chairman, Chief Executive Officer, and Chief Investment Officer–Value Portfolios of GAMCO Investors, Inc. and Chief Investment Officer–Value Portfolios of Gabelli Funds, LLC, and GAMCO Asset Management Inc.; Director/Trustee or Chief Investment Officer of other registered investment companies in the Gabelli/GAMCO Funds Complex; Chief Executive Officer of GGCP, Inc. | | Director of Morgan Group Holdings, Inc. (holding company); Chairman of the Board and Chief Executive Officer of LICT Corp. (multimedia and communication services company); Director of CIBL, Inc. (broadcasting and wireless communications); Director of RLJ Acquisition Inc. (blank check company) |
John D. Gabelli Director Age: 67 | | Since 1993 | | 10 | | Senior Vice President of Gabelli & Company, Inc. | | — |
| | | |
INDEPENDENT DIRECTORS5: | | | | | | |
E. Val Cerutti Director Age: 72 | | Since 2001 | | 7 | | Chief Executive Officer of Cerutti Consultants, Inc. | | Director of The LGL Group, Inc. (diversified manufacturing) (1990-2009) |
Anthony J. Colavita Director Age: 76 | | Since 1993 | | 35 | | President of the law firm of Anthony J. Colavita, P.C. | | — |
Arthur V. Ferrara Director Age: 81 | | Since 2001 | | 8 | | Former Chairman of the Board and Chief Executive Officer of The Guardian Life Insurance Company of America (1992-1995) | | — |
Werner J. Roeder, MD Director Age: 71 | | Since 1993 | | 22 | | Medical Director of Lawrence Hospital and practicing private physician | | — |
Anthonie C. van Ekris Director Age: 77 | | Since 1993 | | 20 | | Chairman of BALMAC International, Inc. (commodities and futures trading) | | Director of Aurado Energy Inc. (oil and gas operations) through 2005 |
Salvatore J. Zizza Director Age: 66 | | Since 2004 | | 29 | | Chairman (since 1978) of Zizza & Company, Ltd. (financial consulting); Chairman (since 2006) of Metropolitan Paper Recycling, Inc. (recycling); Chairman (since 2000) of BAM Inc. (manufacturing); Chairman (since 2009) of E-Corp English (business services) | | Non-Executive Chairman and Director of Harbor BioSciences, Inc. (biotechnology); Vice Chairman and Director of Trans-Lux Corporation (business services); Chairman and Chief Executive Officer of General Employment Enterprises, Inc. (staffing); Director of Bion Environmental Technologies (technology) (2005-2008); Director of Earl Schieb Inc. (automotive painting) through April 2009. |
22
The GAMCO Global Growth Fund
Additional Fund Information (Unaudited) (Continued)
| | | | |
Name, Position(s)
Address1
and Age | | Term of Office
and Length of
Time Served2 | | Principal Occupation(s) During Past Five Years |
| | |
OFFICERS: | | | | |
Bruce N. Alpert
President, Secretary, and Acting Chief Compliance Officer Age: 60 | |
Since 1993 Since November 2011 | | Executive Vice President and Chief Operating Officer of Gabelli Funds, LLC since 1988, Officer of all of the registered investment companies in the Gabelli/GAMCO Funds complex. Director of Teton Advisors, Inc. since 1998; Chairman of Teton Advisors, Inc. 2008 to 2010; President of Teton Advisors, Inc. 1998 through 2008; Senior Vice President of GAMCO Investors, Inc. since 2008 |
Agnes Mullady
Treasurer Age: 53 | | Since 2006 | | President and Chief Operating Officer of the Open-End Fund Division of Gabelli Funds, LLC since September 2010; Senior Vice President of GAMCO Investors, Inc. since 2009; Vice President of Gabelli Funds, LLC since 2007; Officer of all of the registered investment companies in the Gabelli/GAMCO Funds Complex |
| | 1 | Address: One Corporate Center, Rye, NY 10580-1422, unless otherwise noted. |
| | 2 | Each Director will hold office for an indefinite term until the earliest of (i) the next meeting of shareholders, if any, called for the purpose of considering the election or re-election of such Director and until the election and qualification of his or her successor, if any, elected at such meeting, or (ii) the date a Director resigns or retires, or a Director is removed by the Board of Directors or shareholders, in accordance with the Corporation’s By-Laws and Articles of Incorporation. Each officer will hold office for an indefinite term until the date he or she resigns or retires or until his or her successor is elected and qualified. |
| | 3 | “Interested person” of the Corporation as defined in the 1940 Act. Messrs. Gabelli are each considered an “interested person” because of their affiliation with Gabelli Funds, LLC which acts as the Corporation’s investment adviser. Mario J. Gabelli and John D. Gabelli are brothers. |
| | 4 | This column includes only directorships of companies required to report to the SEC under the Securities Exchange Act of 1934, as amended, i.e., public companies, or other investment companies registered under the 1940 Act. |
| | 5 | Directors who are not interested persons are considered “Independent” Directors. |
23
GAMCO Global Series Funds, Inc.
The GAMCO Global Growth Fund
One Corporate Center
Rye, New York 10580-1422
800-GABELLI
800-422-3554
fax: 914-921-5118
website: www.gabelli.com
e-mail: info@gabelli.com
Net Asset Value per share available daily by calling
800-GABELLI after 7:00 P.M.
| | |
| Board of Directors |
Mario J. Gabelli, CFA Chairman and Chief Executive Officer GAMCO Investors, Inc. E. Val Cerutti Chief Executive Officer Cerutti Consultants, Inc. Anthony J. Colavita Attorney-at-Law Anthony J. Colavita, P.C. Inc. Arthur V. Ferrara Former Chairman and Chief Executive Officer Guardian Life Insurance Company of America | | John D. Gabelli Senior Vice President Gabelli & Company, Inc. Werner J. Roeder, MD Medical Director Lawrence Hospital Anthonie C. van Ekris Chairman BALMAC International, Inc. Salvatore J. Zizza Chairman Zizza & Co., Ltd. |
|
| Officers |
Bruce N. Alpert President, Secretary, and Acting Chief Compliance Officer | | Agnes Mullady Treasurer |
|
Custodian, Transfer Agent, and
Dividend Disbursing Agent |
| State Street Bank and Trust Company |
|
| Distributor |
| G.distributors, LLC |
|
| Legal Counsel |
| Skadden, Arps, Slate, Meagher & Flom LLP |
This report is submitted for the general information of the shareholders of The GAMCO Global Growth Fund. It is not authorized for distribution to prospective investors unless preceded or accompanied by an effective prospectus.
GAB442Q411AR
GAMCO
The
GAMCO
Global Growth
Fund
Morningstar® rated The GAMCO Global Growth Fund Class AAA Shares 4 stars overall and 4 stars for the three and five year periods ended December 31, 2011 among 697, 697, and 490 World Stock funds, respectively. Morningstar RatingTM is based on risk adjusted returns.
ANNUAL REPORT
DECEMBER 31, 2011
The GAMCO Global Opportunity Fund
Annual Report — December 31, 2011

Morningstar® rated The GAMCO Global Opportunity Fund Class AAA Shares 4 stars overall and 4 stars for the five and ten year periods ended December 31, 2011 among 697, 490, and 275 World Stock funds, respectively. Morningstar RatingTM is based on risk-adjusted returns.

Caesar Bryan
To Our Shareholders,
The Sarbanes-Oxley Act requires a fund’s principal executive and financial officers to certify the entire contents of the semiannual and annual shareholder reports in a filing with the Securities and Exchange Commission (“SEC”) on Form N-CSR. This certification would cover the portfolio manager’s commentary and subjective opinions if they are attached to or a part of the financial statements. Many of these comments and opinions would be difficult or impossible to certify.
Because we do not want our portfolio managers to eliminate their opinions and/or restrict their commentary to historical facts, we have separated their commentary from the financial statements and investment portfolio and have sent it to you separately. Both the commentary and the financial statements, including the portfolio of investments, will be available on our website at www.gabelli.com.
Performance Discussion (Unaudited)
For the year ended December 31, 2011, the net asset value (“NAV”) per Class AAA Share of The GAMCO Global Opportunity Fund declined 9.5% compared with a decrease of 7.0% for the Morgan Stanley Capital International (“MSCI”) All Country (“AC”) World Free Index. See page 2 for additional performance information.
Enclosed are the schedule of investments and financial statements as of December 31, 2011.
For all of 2011, only three of the twenty-four major national indices provided positive returns, led by Ireland (+13.7%). New Zealand (+5.5%) was the second best performer, followed by the U.S. (+1.4%). Greece (-62.8%) had the worst performance of the year, followed by Austria (-36.4%), Finland (-31.9%), Israel (-28.0%), Italy (-23.2%), Portugal (-23.1%), Germany (-18.1%), Singapore (-17.9%), France (-16.9%), Hong Kong, Denmark & Sweden (-16.0%), Japan (-14.3%), Canada (-12.7%), Spain (-12.3%), the Netherlands (-12.1%), Australia (-11.0%), Belgium (-10.6%), Norway (-10.0%), Switzerland (-6.8%), and the United Kingdom (-2.6%). Among the twenty-one emerging market countries, only Indonesia (+4.0%) posted a positive yearly result. All four of the largest emerging markets posted yearly declines. The worst performer was India (-38.0%), followed by Brazil (-24.9%), Russia (-20.9%) and China (-20.3%).
We purchase attractively valued companies that we believe have the opportunity to grow earnings more rapidly than average within that company’s local market. We pay close attention to a company’s market position, management, and balance sheet, with particular emphasis on the ability of the company to finance its growth. Generally, we value a company relative to its local market, but where appropriate, we attempt to benefit from valuation discrepancies between markets. Our primary focus is on security selection and not country allocation, but the Fund will remain well diversified by sector and geography. Country allocation is likely to reflect broad economic, financial, and currency trends, as well as relative size of the market.
Selected holdings that contributed positively to performance in 2011 were Precision Castparts Corp. (4.6% of net assets as of December 31, 2011) a manufacturer of investment castings and forgings primarily for the aerospace and industrial gas turbine markets; British American Tobacco (4.5%), an international tobacco company; and Google Inc. (4.8%), widely recognized as the world’s leading Internet search engine. Some of our weaker performing stocks during the year were Antofagasta (4.4%), a Chilean based copper miner; Cie Financiere Richemont SA (4.3%), which owns several of the world’s leading companies in the field of luxury goods, with particular strengths in jewelry, watches, and premium accessories; and Gold Fields Ltd. (4.3%), a South African based gold mining company with a significant portion of its assets in West Africa and Australia.
We appreciate your confidence and trust.
Sincerely yours,

Bruce N. Alpert
President
February 22, 2012
Comparative Results
| | | | | | | | | | | | | | | | |
Average Annual Returns through December 31, 2011 (a) (Unaudited) | |
| | | 1 Year | | | 5 Year | | | 10 Year | | | Since
Inception
(5/11/98) | |
Class AAA (GABOX) | | | (9.46 | )% | | | (0.18 | )% | | | 6.13 | % | | | 5.95 | % |
MSCI AC World Free Index | | | (6.95 | ) | | | (1.35 | ) | | | 4.77 | | | | N.A. | |
Lipper Global Large-Cap Growth Fund Average | | | (6.68 | ) | | | (1.48 | ) | | | 3.02 | | | | 1.48 | (e) |
Lipper Global Multi-Cap Growth Fund Average | | | (11.85 | ) | | | (0.18 | ) | | | 5.02 | | | | 6.21 | (f) |
Class A (GOCAX) | | | (9.45 | ) | | | (0.17 | ) | | | 6.16 | | | | 5.95 | |
With sales charge (b) | | | (14.65 | ) | | | (1.34 | ) | | | 5.53 | | | | 5.49 | |
Class B (36464T703) | | | (10.10 | ) | | | (0.92 | ) | | | 5.35 | | | | 5.31 | |
With contingent deferred sales charge (c) | | | (14.60 | ) | | | (1.32 | ) | | | 5.35 | | | | 5.31 | |
Class C (GGLCX) | | | (10.14 | ) | | | (0.97 | ) | | | 5.68 | | | | 5.61 | |
With contingent deferred sales charge (d) | | | (11.04 | ) | | | (0.97 | ) | | | 5.68 | | | | 5.61 | |
Class I (GLOIX) | | | (9.22 | ) | | | 0.04 | | | | 6.24 | | | | 6.03 | |
In the current prospectus dated April 29, 2011, the gross expense ratios for Class AAA, A, B, C, and I Shares are 2.66%, 2.66%, 3.41%, 3.41%, and 2.41%, respectively, and the net expense ratios in the current prospectus for these share classes are 2.01%, 2.01%, 2.76%, 2.76%, and 1.76%, respectively. See page 9 for the expense ratios for the year ended December 31, 2011. Class AAA and Class I Shares do not have a sales charge. The maximum sales charge for Class A, B, and C Shares is 5.75%, 5.00%, and 1.00%, respectively.
| | (a) | Returns represent past performance and do not guarantee future results. Total returns and average annual returns reflect changes in share price and reinvestment of distributions and are net of expenses. Investment returns and the principal value of an investment will fluctuate. When shares are redeemed, they may be worth more or less than their original cost. The Fund imposes a 2% redemption fee on shares sold or exchanged within seven days after the date of purchase. Current performance may be lower or higher than the performance data presented. Visit www.gabelli.com for performance information as of the most recent month end. Investors should carefully consider the investment objectives, risks, charges, and expenses of the Fund before investing. The prospectus contains information about these and other matters and should be read carefully before investing. The Class AAA Share NAVs per share are used to calculate performance for the periods prior to the issuance of Class A Shares, Class B Shares, Class C Shares, and Class I Shares on March 12, 2000, August 16, 2000, November 23, 2001, and January 11, 2008, respectively. The actual performance of the Class B Shares and Class C Shares would have been lower for the periods starting prior to August 16, 2000 and November 23, 2001, respectively, due to the additional expenses associated with these classes of shares. The actual performance of the Class I Shares would have been higher due to lower expenses related to this class of shares. Returns would have been lower had the Adviser not reimbursed certain expenses of the Fund. The MSCI AC World Free Index is an unmanaged free float adjusted market capitalization weighted index that is designed to measure the equity market performance of developed and emerging markets. The MSCI AC World Free Index consists of 45 country indices comprising 24 developed and 21 emerging market country indices. The Lipper Global Multi-Cap Growth Fund Average and the Lipper Global Large-Cap Growth Fund Average reflect the average performance of mutual funds classified in those particular categories. Dividends are considered reinvested. You cannot invest directly in an index. | |
| | (b) | Performance results include the effect of the maximum 5.75% sales charge at the beginning of the period. | |
| | (c) | Assuming payment of the maximum contingent deferred sales charge (CDSC). The maximum CDSC for Class B Shares is 5% which is gradually reduced to 0% after six years. | |
| | (d) | Assuming payment of the 1% maximum CDSC imposed on redemptions made within one year of purchase. | |
| | (e) | Lipper Global Large-Cap Growth Fund Average since inception performance is as of June 30, 1998. | |
| | (f) | Lipper Global Multi-Cap Growth Fund Average since inception performance is as of September 30, 1998. | |
COMPARISON OF CHANGE IN VALUE OF A $10,000 INVESTMENT IN
THE GAMCO GLOBAL OPPORTUNITY FUND (CLASS AAA SHARES), LIPPER GLOBAL MULTI-CAP GROWTH FUND AVERAGE,
AND MSCI AC WORLD FREE INDEX (Unaudited)
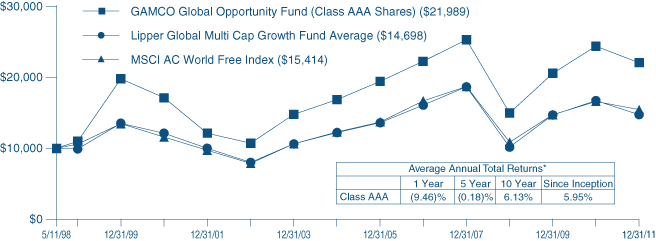
| * | Past performance is not predictive of future results. The performance tables and graph do not reflect the deduction of taxes that a shareholder would pay on Fund distributions or the redemption of Fund shares. |
2
The GAMCO Global Opportunity Fund
Disclosure of Fund Expenses (Unaudited)
For the Six Month Period from July 1, 2011 through December 31, 2011
Expense Table
We believe it is important for you to understand the impact of fees and expenses regarding your investment. All mutual funds have operating expenses. As a shareholder of a fund, you incur ongoing costs, which include costs for portfolio management, administrative services, and shareholder reports (like this one), among others. Operating expenses, which are deducted from a fund’s gross income, directly reduce the investment return of a fund. When a fund’s expenses are expressed as a percentage of its average net assets, this figure is known as the expense ratio. The following examples are intended to help you understand the ongoing costs (in dollars) of investing in your Fund and to compare these costs with those of other mutual funds. The examples are based on an investment of $1,000 made at the beginning of the period shown and held for the entire period.
The Expense Table below illustrates your Fund’s costs in two ways:
Actual Fund Return: This section provides information about actual account values and actual expenses. You may use this section to help you to estimate the actual expenses that you paid over the period after any fee waivers and expense reimbursements. The “Ending Account Value” shown is derived from the Fund’s actual return during the past six months, and the “Expenses Paid During Period” shows the dollar amount that would have been paid by an investor who started with $1,000 in the Fund. You may use this information, together with the amount you invested, to estimate the expenses that you paid over the period.
To do so, simply divide your account value by $1,000 (for example, an $8,600 account value divided by $1,000 = 8.6), then multiply the result by the number given for your Fund under the heading “Expenses Paid During Period” to estimate the expenses you paid during this period.
Hypothetical 5% Return: This section provides information about hypothetical account values and hypothetical expenses based on the Fund’s actual expense ratio. It assumes a hypothetical annualized return of 5% before expenses during the period shown.
In this case – because the hypothetical return used is not the Fund’s actual return – the results do not apply to your investment and you cannot use the hypothetical account value and expense to estimate the actual ending account balance or expenses you paid for the period. This example is useful in making comparisons of the ongoing costs of investing in the Fund and other funds. To do so, compare this 5% hypothetical example with the 5% hypothetical examples that appear in shareholder reports of other funds.
Please note that the expenses shown in the table are meant to highlight your ongoing costs only and do not reflect any transactional costs such as sales charges (loads), redemption fees, or exchange fees, if any, which would be described in the Prospectus. If these costs were applied to your account, your costs would be higher. Therefore, the 5% hypothetical return is useful in comparing ongoing costs only, and will not help you determine the relative total costs of owning different funds. The “Annualized Expense Ratio” represents the actual expenses for the last six months and may be different from the expense ratio in the Financial Highlights which is for the year ended December 31, 2011.
| | | | | | | | | | | | | | | | |
| | | Beginning
Account Value
07/01/11 | | | Ending
Account Value
12/31/11 | | | Annualized
Expense
Ratio | | | Expenses
Paid During
Period* | |
The GAMCO Global Opportunity Fund | |
Actual Fund Return | | | | | | | | | | | | | |
| Class AAA | | | $1,000.00 | | | | $ 885.50 | | | | 2.01 | % | | | $ 9.55 | |
| Class A | | | $1,000.00 | | | | $ 886.00 | | | | 2.01 | % | | | $ 9.56 | |
| Class B | | | $1,000.00 | | | | $ 882.40 | | | | 2.76 | % | | | $13.10 | |
| Class C | | | $1,000.00 | | | | $ 882.60 | | | | 2.76 | % | | | $13.10 | |
| Class I | | | $1,000.00 | | | | $ 887.00 | | | | 1.76 | % | | | $ 8.37 | |
Hypothetical 5% Return | | | | | | | | | | | | | |
| Class AAA | | | $1,000.00 | | | | $1,015.07 | | | | 2.01 | % | | | $10.21 | |
| Class A | | | $1,000.00 | | | | $1,015.07 | | | | 2.01 | % | | | $10.21 | |
| Class B | | | $1,000.00 | | | | $1,011.29 | | | | 2.76 | % | | | $13.99 | |
| Class C | | | $1,000.00 | | | | $1,011.29 | | | | 2.76 | % | | | $13.99 | |
| Class I | | | $1,000.00 | | | | $1,016.33 | | | | 1.76 | % | | | $ 8.94 | |
| * | Expenses are equal to the Fund’s annualized expense ratio for the last six months multiplied by the average account value over the period, multiplied by the number of days in the most recent fiscal half year (184 days), then divided by 365. |
3
Summary of Portfolio Holdings (Unaudited)
The following table presents portfolio holdings as a percent of net assets as of December 31, 2011:
The GAMCO Global Opportunity Fund
| | | | |
Consumer Staples | | | 20.9% | |
Industrials | | | 18.5% | |
Materials | | | 16.7% | |
Energy | | | 10.7% | |
Information Technology | | | 9.5% | |
Consumer Discretionary | | | 8.4% | |
| | | | |
Health Care | | | 8.0% | |
Financial Services | | | 5.5% | |
Telecommunication Services | | | 1.9% | |
Other Assets and Liabilities (Net) | | | (0.1)% | |
| | | | |
| | | 100.0% | |
| | | | |
The Fund files a complete schedule of portfolio holdings with the SEC for the first and third quarters of each fiscal year on Form N-Q. Shareholders may obtain this information at www.gabelli.com or by calling the Fund at 800-GABELLI (800-422-3554). The Fund’s Form N-Q is available on the SEC’s website at www.sec.gov and may also be reviewed and copied at the SEC’s Public Reference Room in Washington, DC. Information on the operation of the Public Reference Room may be obtained by calling 800-SEC-0330.
Proxy Voting
The Fund files Form N-PX with its complete proxy voting record for the twelve months ended June 30th, no later than August 31st of each year. A description of the Fund’s proxy voting policies, procedures, and how the Fund voted proxies relating to portfolio securities is available without charge, upon request, by (i) calling 800-GABELLI (800-422-3554); (ii) writing to The Gabelli Funds at One Corporate Center, Rye, NY 10580-1422; or (iii) visiting the SEC’s website at www.sec.gov.
4
The GAMCO Global Opportunity Fund
Schedule of Investments — December 31, 2011
| | | | | | | | | | | | |
Shares | | | | | Cost | | | Market
Value | |
| | | | | | | | | | | | |
| |
| | | | COMMON STOCKS — 100.1% | |
| | | | CONSUMER STAPLES — 20.9% | |
| | 2,000 | | | Beam Inc. | | $ | 99,825 | | | $ | 102,460 | |
| | 10,113 | | | British American Tobacco plc | | | 304,112 | | | | 479,878 | |
| | 1,300 | | | Danone | | | 77,722 | | | | 81,720 | |
| | 7,000 | | | Diageo plc | | | 97,896 | | | | 152,899 | |
| | 2,280 | | | Dr Pepper Snapple Group Inc. | | | 54,395 | | | | 90,014 | |
| | 5,000 | | | General Mills Inc. | | | 124,002 | | | | 202,050 | |
| | 3,000 | | | Heineken Holding NV | | | 140,229 | | | | 122,772 | |
| | 3,000 | | | Mead Johnson Nutrition Co. | | | 129,424 | | | | 206,190 | |
| | 2,560 | | | Pernod-Ricard SA | | | 210,796 | | | | 237,429 | |
| | 2,500 | | | Philip Morris International Inc. | | | 87,133 | | | | 196,200 | |
| | 4,500 | | | Sara Lee Corp. | | | 58,320 | | | | 85,140 | |
| | 3,000 | | | The Procter & Gamble Co. | | | 165,846 | | | | 200,130 | |
| | 2,750 | | | Wesfarmers Ltd. | | | 79,950 | | | | 82,975 | |
| | | | | | | | | | | | |
| | | | TOTAL CONSUMER STAPLES | | | 1,629,650 | | | | 2,239,857 | |
| | | | | | | | | | | | |
| |
| | | | INDUSTRIALS — 18.5% | |
| | 1,000 | | | Bucher Industries AG | | | 200,187 | | | | 174,811 | |
| | 16,000 | | | China Merchants Holdings (International) Co. Ltd. | | | 53,313 | | | | 46,455 | |
| | 4,500 | | | CNH Global NV† | | | 129,912 | | | | 161,955 | |
| | 1,000 | | | FANUC Corp. | | | 101,606 | | | | 153,047 | |
| | 2,000 | | | Fortune Brands Home & Security Inc.† | | | 28,156 | | | | 34,060 | |
| | 4,300 | | | Jardine Matheson Holdings Ltd. | | | 137,142 | | | | 202,315 | |
| | 3,600 | | | Komatsu Ltd. | | | 76,536 | | | | 84,142 | |
| | 3,000 | | | L-3 Communications Holdings Inc. | | | 127,720 | | | | 200,040 | |
| | 2,500 | | | Lockheed Martin Corp. | | | 61,439 | | | | 202,250 | |
| | 4,000 | | | Mitsui & Co. Ltd. | | | 86,284 | | | | 62,206 | |
| | 3,000 | | | Precision Castparts Corp. | | | 44,475 | | | | 494,370 | |
| | 1,000 | | | SMC Corp. | | | 124,202 | | | | 161,362 | |
| | | | | | | | | | | | |
| | | | TOTAL INDUSTRIALS | | | 1,170,972 | | | | 1,977,013 | |
| | | | | | | | | | | | |
| |
| | | | MATERIALS — 16.7% | |
| | 1,200 | | | Agnico-Eagle Mines Ltd. | | | 74,720 | | | | 43,584 | |
| | 25,000 | | | Antofagasta plc | | | 29,913 | | | | 471,720 | |
| | 3,600 | | | BHP Billiton plc | | | 114,493 | | | | 104,966 | |
| | 30,000 | | | Gold Fields Ltd., ADR | | | 129,937 | | | | 457,500 | |
| | 3,000 | | | Impala Platinum Holdings Ltd. | | | 115,739 | | | | 62,192 | |
| | 2,500 | | | Monsanto Co. | | | 174,388 | | | | 175,175 | |
| | 2,000 | | | Newcrest Mining Ltd.(a) | | | 60,284 | | | | 60,620 | |
| | 1,830 | | | Rio Tinto plc | | | 77,490 | | | | 88,812 | |
| | 10,000 | | | Sanyo Special Steel Co. Ltd. | | | 65,922 | | | | 53,008 | |
| | 400 | | | Syngenta AG† | | | 114,992 | | | | 117,109 | |
| | 10,000 | | | Xstrata plc | | | 231,303 | | | | 151,882 | |
| | | | | | | | | | | | |
| | | | TOTAL MATERIALS | | | 1,189,181 | | | | 1,786,568 | |
| | | | | | | | | | | | |
| |
| | | | ENERGY — 10.7% | |
| | 10,000 | | | BP plc | | | 74,437 | | | | 71,515 | |
| | 1,200 | | | EOG Resources Inc. | | | 133,358 | | | | 118,212 | |
| | 4,000 | | | Imperial Oil Ltd. | | | 134,921 | | | | 178,218 | |
| | | | | | | | | | | | |
Shares | | | | | Cost | | | Market
Value | |
| | | | | | | | | | | | |
| | 1,200 | | | Occidental Petroleum Corp. | | $ | 124,971 | | | $ | 112,440 | |
| | 2,500 | | | Saipem SpA | | | 52,708 | | | | 106,290 | |
| | 5,700 | | | Schlumberger Ltd. | | | 188,837 | | | | 389,367 | |
| | 6,000 | | | Suncor Energy Inc. | | | 101,766 | | | | 172,980 | |
| | | | | | | | | | | | |
| | | | TOTAL ENERGY | | | 810,998 | | | | 1,149,022 | |
| | | | | | | | | | | | |
| |
| | | | INFORMATION TECHNOLOGY — 9.5% | |
| | 2,000 | | | Canon Inc. | | | 103,501 | | | | 88,606 | |
| | 800 | | | Google Inc., Cl. A† | | | 272,473 | | | | 516,720 | |
| | 2,800 | | | Hoya Corp. | | | 75,713 | | | | 60,314 | |
| | 500 | | | Keyence Corp. | | | 102,612 | | | | 120,566 | |
| | 9,000 | | | Microsoft Corp. | | | 236,625 | | | | 233,640 | |
| | | | | | | | | | | | |
| | | | TOTAL INFORMATION TECHNOLOGY | | | 790,924 | | | | 1,019,846 | |
| | | | | | | | | | | | |
| |
| | | | CONSUMER DISCRETIONARY — 8.4% | |
| | 1,500 | | | AMC Networks Inc., Cl. A† | | | 12,414 | | | | 56,370 | |
| | 6,000 | | | Cablevision Systems Corp., Cl. A | | | 33,564 | | | | 85,320 | |
| | 2,500 | | | Christian Dior SA | | | 150,289 | | | | 296,415 | |
| | 9,000 | | | Compagnie Financiere Richemont SA, Cl. A | | | 110,329 | | | | 455,222 | |
| | | | | | | | | | | | |
| | | | TOTAL CONSUMER DISCRETIONARY | | | 306,596 | | | | 893,327 | |
| | | | | | | | | | | | |
| |
| | | | HEALTH CARE — 8.0% | |
| | 2,000 | | | Cochlear Ltd. | | | 76,509 | | | | 126,827 | |
| | 4,400 | | | Novartis AG | | | 174,161 | | | | 251,549 | |
| | 2,000 | | | Roche Holding AG, Genusschein | | | 160,735 | | | | 338,976 | |
| | 3,000 | | | St. Jude Medical Inc. | | | 115,598 | | | | 102,900 | |
| | 1,200 | | | Tsumura & Co. | | | 36,484 | | | | 35,390 | |
| | | | | | | | | | | | |
| | | | TOTAL HEALTH CARE | | | 563,487 | | | | 855,642 | |
| | | | | | | | | | | | |
| |
| | | | FINANCIAL SERVICES — 5.5% | |
| | 5,000 | | | Cheung Kong (Holdings) Ltd. | | | 63,610 | | | | 59,486 | |
| | 16,000 | | | Hongkong Land Holdings Ltd. | | | 62,764 | | | | 72,640 | |
| | 10,000 | | | Kinnevik Investment AB, Cl. B | | | 230,284 | | | | 194,855 | |
| | 7,000 | | | Schroders plc | | | 129,941 | | | | 142,844 | |
| | 10,000 | | | Swire Pacific Ltd., Cl. A | | | 112,741 | | | | 120,709 | |
| | | | | | | | | | | | |
| | | | TOTAL FINANCIAL SERVICES | | | 599,340 | | | | 590,534 | |
| | | | | | | | | | | | |
| |
| | | | TELECOMMUNICATION SERVICES — 1.9% | |
| | 2,300 | | | Telephone & Data Systems Inc. | | | 45,066 | | | | 59,547 | |
| | 2,300 | | | Telephone & Data Systems Inc., Special | | | 41,599 | | | | 54,763 | |
| | 2,000 | | | United States Cellular Corp.† | | | 107,123 | | | | 87,260 | |
| | | | | | | | | | | | |
| | | | TOTAL TELECOMMUNICATION SERVICES | | | 193,788 | | | | 201,570 | |
| | | | | | | | | | | | |
| | | | TOTAL COMMON STOCKS | | | 7,254,936 | | | | 10,713,379 | |
| | | | | | | | | | | | |
| | | | TOTAL INVESTMENTS — 100.1% | | $ | 7,254,936 | | | | 10,713,379 | |
| | | | | | | | | | | | |
| | | | Other Assets and Liabilities (Net) — (0.1)% | | | | (13,318 | ) |
| | | | | | | | | | | | |
| | | | NET ASSETS — 100.0% | | | $ | 10,700,061 | |
| | | | | | | | | | | | |
See accompanying notes to financial statements.
5
The GAMCO Global Opportunity Fund
Schedule of Investments (Continued) — December 31, 2011
| (a) | Security fair valued under procedures established by the Board of Directors. The procedures may include reviewing available financial information about the company and reviewing the valuation of comparable securities and other factors on a regular basis. At December 31, 2011, the market value of the fair valued security amounted to $60,620 or 0.57% of net assets. |
| † | Non-income producing security. |
| ADR | American Depositary Receipt |
| | | | | | | | |
Geographic Diversification | | % of
Market
Value | | | Market
Value | |
North America | | | 41.1 | % | | $ | 4,399,401 | |
Europe | | | 39.2 | | | | 4,203,619 | |
Japan | | | 7.6 | | | | 818,641 | |
Asia/Pacific | | | 7.2 | | | | 772,026 | |
South Africa | | | 4.9 | | | | 519,692 | |
| | | | | | | | |
| | | 100.0 | % | | $ | 10,713,379 | |
| | | | | | | | |
See accompanying notes to financial statements.
6
The GAMCO Global Opportunity Fund
Statement of Assets and Liabilities
December 31, 2011
| | | | |
Assets: | | | | |
Investments, at value (cost $7,254,936) | | $ | 10,713,379 | |
Cash | | | 45 | |
Receivable for investments sold | | | 161,001 | |
Receivable for Fund shares sold | | | 400 | |
Dividends receivable | | | 18,500 | |
Prepaid expense | | | 16,822 | |
| | | | |
Total Assets | | | 10,910,147 | |
| | | | |
Liabilities: | | | | |
Payable for Fund shares redeemed | | | 5,902 | |
Payable for investment advisory fees | | | 3,901 | |
Payable for distribution fees | | | 2,228 | |
Line of credit payable | | | 144,000 | |
Payable for shareholder communications expenses | | | 20,037 | |
Payable for legal and audit fees | | | 18,289 | |
Other accrued expenses | | | 15,729 | |
| | | | |
Total Liabilities | | | 210,086 | |
| | | | |
Net Assets (applicable to 605,501 shares outstanding) | | $ | 10,700,061 | |
| | | | |
Net Assets Consist of: | | | | |
Paid-in capital | | $ | 9,711,755 | |
Accumulated distributions in excess of net investment income | | | (1,090 | ) |
Accumulated net realized loss on investments and foreign currency transactions | | | (2,469,232 | ) |
Net unrealized appreciation on investments | | | 3,458,443 | |
Net unrealized appreciation on foreign currency translations | | | 185 | |
| | | | |
Net Assets | | $ | 10,700,061 | |
| | | | |
Shares of Capital Stock, each at $0.001 par value: | |
Class AAA: | | | | |
Net Asset Value, offering, and redemption price per share ($10,258,011 ÷ 580,454 shares outstanding; 75,000,000 shares authorized) | | | $17.67 | |
| | | | |
Class A: | | | | |
Net Asset Value and redemption price per share ($166,195 ÷ 9,440 shares outstanding; 50,000,000 shares authorized) | | | $17.61 | |
| | | | |
Maximum offering price per share (NAV ÷ 0.9425, based on maximum sales charge of 5.75% of the offering price) | | | $18.68 | |
| | | | |
Class B: | | | | |
Net Asset Value and offering price per share ($1,661 ÷ 99.3 shares outstanding; 25,000,000 shares authorized) | | | $16.73 | (a) |
| | | | |
Class C: | | | | |
Net Asset Value and offering price per share ($14,559 ÷ 838.5 shares outstanding; 25,000,000 shares authorized) | | | $17.36 | (a) |
| | | | |
Class I: | | | | |
Net Asset Value, offering, and redemption price per share ($259,635 ÷ 14,669 shares outstanding; 25,000,000 shares authorized) | | | $17.70 | |
| | | | |
| (a) | Redemption price varies based on the length of time held. |
Statement of Operations
For the Year Ended December 31, 2011
| | | | |
Investment Income: | | | | |
Dividends (net of foreign withholding taxes of $7,546) | | $ | 281,250 | |
Interest | | | 74 | |
| | | | |
Total Investment Income | | | 281,324 | |
| | | | |
Expenses: | | | | |
Investment advisory fees | | | 125,505 | |
Distribution fees – Class AAA | | | 29,956 | |
Distribution fees – Class A | | | 416 | |
Distribution fees – Class B | | | 18 | |
Distribution fees – Class C | | | 172 | |
Shareholder communications expenses | | | 38,904 | |
Custodian fees | | | 34,202 | |
Registration expenses | | | 27,921 | |
Shareholder services fees | | | 17,581 | |
Legal and audit fees | | | 11,184 | |
Directors’ fees | | | 3,370 | |
Interest expense | | | 1,224 | |
Miscellaneous expenses | | | 35,106 | |
| | | | |
Total Expenses | | | 325,559 | |
| | | | |
Less: | | | | |
Expenses reimbursed by Adviser (See Note 3) | | | (74,140 | ) |
| | | | |
Net Expenses | | | 251,419 | |
| | | | |
Net Investment Income | | | 29,905 | |
| | | | |
Net Realized and Unrealized Gain/(Loss) on Investments and Foreign Currency: | | | | |
Net realized gain on investments | | | 939,338 | |
Net realized gain on foreign currency transactions | | | 400 | |
| | | | |
Net realized gain on investments and foreign currency transactions | | | 939,738 | |
| | | | |
Net change in unrealized appreciation: | | | | |
on investments | | | (2,183,571 | ) |
on foreign currency translations | | | (1,307 | ) |
| | | | |
Net change in unrealized appreciation on investments and foreign currency translations | | | (2,184,878 | ) |
| | | | |
Net Realized and Unrealized Gain/(Loss) on Investments and Foreign Currency | | | (1,245,140 | ) |
| | | | |
Net Decrease in Net Assets Resulting from Operations | | $ | (1,215,235 | ) |
| | | | |
See accompanying notes to financial statements.
7
The GAMCO Global Opportunity Fund
Statement of Changes in Net Assets
| | | | | | | | |
| | | Year Ended
December 31, 2011 | | | Year Ended
December 31, 2010 | |
Operations: | | | | | | | | |
Net investment income/(loss) | | $ | 29,905 | | | $ | (18,178 | ) |
Net realized gain on investments and foreign currency transactions | | | 939,738 | | | | 804,549 | |
Net change in unrealized appreciation/depreciation on investments and foreign currency translations | | | (2,184,878 | ) | | | 1,432,703 | |
| | | | | | | | |
Net Increase/(Decrease) in Net Assets Resulting from Operations | | | (1,215,235 | ) | | | 2,219,074 | |
| | | | | | | | |
Distributions to Shareholders: | | | | | | | | |
Net investment income | | | | | | | | |
Class AAA | | | (28,241 | ) | | | — | |
Class A | | | (529 | ) | | | — | |
Class I | | | (1,465 | ) | | | — | |
| | | | | | | | |
Total Distributions to Shareholders | | | (30,235 | ) | | | — | |
| | | | | | | | |
Capital Share Transactions: | | | | | | | | |
Class AAA | | | (1,820,986 | ) | | | (2,154,210 | ) |
Class A | | | 17,334 | | | | (23,788 | ) |
Class B | | | — | | | | (727 | ) |
Class C | | | 479 | | | | 3,986 | |
Class I | | | (84,416 | ) | | | 235 | |
| | | | | | | | |
Net Decrease in Net Assets from Capital Share Transactions | | | (1,887,589 | ) | | | (2,174,504 | ) |
| | | | | | | | |
Redemption Fees | | | 1 | | | | 5 | |
| | | | | | | | |
Net Increase/(Decrease) in Net Assets | | | (3,133,058 | ) | | | 44,575 | |
Net Assets: | | | | | | | | |
Beginning of period | | | 13,833,119 | | | | 13,788,544 | |
| | | | | | | | |
End of period (including undistributed net investment income of $0 and $0, respectively) | | $ | 10,700,061 | | | $ | 13,833,119 | |
| | | | | | | | |
See accompanying notes to financial statements.
8
The GAMCO Global Opportunity Fund
Financial Highlights
Selected data for a share of capital stock outstanding throughout each period:
| | | | | | | | | | | | | | | | | | | | | | | | | | | | | | | | | | | | | | | | | | | | | | | | | | | | | | | | | | | | |
| | | | | | Income (Loss)
from Investment Operations | | | Distributions | | | | | | | | | | | | | | | Ratios to Average Net Assets/
Supplemental Data | |
Period Ended
December 31 | | Net Asset
Value,
Beginning
of Period | | | Net
Investment
Income
(Loss)(a) | | | Net
Realized
and
Unrealized
Gain (Loss)
on
Investments | | | Total from
Investment
Operations | | | Net
Investment
Income | | | Return of
Capital(b) | | | Total
Distributions | | | Redemption
Fees(a)(b) | | | Net
Asset
Value,
End of
Period | | | Total
Return† | | | Net
Assets
End of
Period
(in 000’s) | | | Net
Investment
Income
(Loss) | | | Operating
Expenses
Before
Reimburse-
ment(c) | | | Operating
Expenses
Net of
Reimburse-
ment(d) | | | Portfolio
Turnover
Rate | |
Class AAA | | | | | | | | | | | | | | | | | | | | | | | | | | | | | | | | | | | | | | | | | | | | | | | | | | | | | |
2011 | | $ | 19.57 | | | $ | 0.04 | | | $ | (1.89 | ) | | $ | (1.85 | ) | | $ | (0.05 | ) | | | — | | | $ | (0.05 | ) | | $ | 0.00 | | | $ | 17.67 | | | | (9.5 | )% | | $ | 10,258 | | | | 0.23 | % | | | 2.60 | % | | | 2.01 | % | | | 7 | % |
2010 | | | 16.53 | | | | (0.02 | ) | | | 3.06 | | | | 3.04 | | | | — | | | | — | | | | — | | | | 0.00 | | | | 19.57 | | | | 18.4 | | | | 13,263 | | | | (0.15 | ) | | | 2.66 | | | | 2.01 | | | | 5 | |
2009 | | | 12.18 | | | | 0.02 | | | | 4.54 | | | | 4.56 | | | | (0.21 | ) | | $ | 0.00 | | | | (0.21 | ) | | | 0.00 | | | | 16.53 | | | | 37.4 | | | | 13,280 | | | | 0.16 | | | | 2.72 | | | | 2.05 | | | | 8 | |
2008 | | | 20.59 | | | | 0.14 | | | | (8.54 | ) | | | (8.40 | ) | | | (0.01 | ) | | | — | | | | (0.01 | ) | | | 0.00 | | | | 12.18 | | | | (40.8 | ) | | | 11,843 | | | | 0.83 | | | | 2.25 | | | | 2.01 | | | | 14 | |
2007 | | | 18.22 | | | | 0.17 | | | | 2.31 | | | | 2.48 | | | | (0.11 | ) | | | 0.00 | | | | (0.11 | ) | | | 0.00 | | | | 20.59 | | | | 13.6 | | | | 22,507 | | | | 0.84 | | | | 2.03 | | | | 2.03 | | | | 20 | |
Class A | | | | | | | | | | | | | | | | | | | | | | | | | | | | | | | | | | | | | | | | | | | | | | | | | | | | | |
2011 | | $ | 19.51 | | | $ | 0.04 | | | $ | (1.88 | ) | | $ | (1.84 | ) | | $ | (0.06 | ) | | | — | | | $ | (0.06 | ) | | $ | 0.00 | | | $ | 17.61 | | | | (9.5 | )% | | $ | 166 | | | | 0.22 | % | | | 2.60 | % | | | 2.01 | % | | | 7 | % |
2010 | | | 16.48 | | | | (0.00 | )(b) | | | 3.03 | | | | 3.03 | | | | — | | | | — | | | | — | | | | 0.00 | | | | 19.51 | | | | 18.4 | | | | 166 | | | | (0.03 | ) | | | 2.66 | | | | 2.01 | | | | 5 | |
2009 | | | 12.14 | | | | 0.01 | | | | 4.54 | | | | 4.55 | | | | (0.21 | ) | | $ | 0.00 | | | | (0.21 | ) | | | 0.00 | | | | 16.48 | | | | 37.5 | | | | 171 | | | | 0.11 | | | | 2.72 | | | | 2.05 | | | | 8 | |
2008 | | | 20.54 | | | | 0.12 | | | | (8.51 | ) | | | (8.39 | ) | | | (0.01 | ) | | | — | | | | (0.01 | ) | | | 0.00 | | | | 12.14 | | | | (40.8 | ) | | | 120 | | | | 0.69 | | | | 2.25 | | | | 2.01 | | | | 14 | |
2007 | | | 18.17 | | | | 0.18 | | | | 2.31 | | | | 2.49 | | | | (0.12 | ) | | | 0.00 | | | | (0.12 | ) | | | 0.00 | | | | 20.54 | | | | 13.7 | | | | 233 | | | | 0.91 | | | | 2.03 | | | | 2.03 | | | | 20 | |
Class B | | | | | | | | | | | | | | | | | | | | | | | | | | | | | | | | | | | | | | | | | | | | | | | | | | | | | |
2011 | | $ | 18.61 | | | $ | (0.09 | ) | | $ | (1.79 | ) | | $ | (1.88 | ) | | | — | | | | — | | | | — | | | | — | | | $ | 16.73 | | | | (10.1 | )% | | $ | 2 | | | | (0.53 | )% | | | 3.35 | % | | | 2.76 | % | | | 7 | % |
2010 | | | 15.84 | | | | (0.16 | ) | | | 2.93 | | | | 2.77 | | | | — | | | | — | | | | — | | | | — | | | | 18.61 | | | | 17.5 | | | | 2 | | | | (0.99 | ) | | | 3.41 | | | | 2.76 | | | | 5 | |
2009 | | | 11.67 | | | | (0.06 | ) | | | 4.31 | | | | 4.25 | | | $ | (0.08 | ) | | $ | 0.00 | | | $ | (0.08 | ) | | $ | 0.00 | | | | 15.84 | | | | 36.4 | | | | 2 | | | | (0.50 | ) | | | 3.47 | | | | 2.80 | | | | 8 | |
2008 | | | 19.86 | | | | 0.01 | | | | (8.20 | ) | | | (8.19 | ) | | | — | | | | — | | | | — | | | | — | | | | 11.67 | | | | (41.2 | ) | | | 3 | | | | 0.05 | | | | 3.00 | | | | 2.76 | | | | 14 | |
2007 | | | 17.61 | | | | (0.08 | ) | | | 2.33 | | | | 2.25 | | | | — | | | | — | | | | — | | | | 0.00 | | | | 19.86 | | | | 12.8 | | | | 6 | | | | (0.45 | ) | | | 2.78 | | | | 2.78 | | | | 20 | |
Class C | | | | | | | | | | | | | | | | | | | | | | | | | | | | | | | | | | | | | | | | | | | | | | | | | | | | | |
2011 | | $ | 19.32 | | | $ | (0.07 | ) | | $ | (1.89 | ) | | $ | (1.96 | ) | | | — | | | | — | | | | — | | | | — | | | $ | 17.36 | | | | (10.1 | )% | | $ | 14 | | | | (0.40 | )% | | | 3.35 | % | | | 2.76 | % | | | 7 | % |
2010 | | | 16.44 | | | | (0.16 | ) | | | 3.04 | | | | 2.88 | | | | — | | | | — | | | | — | | | | — | | | | 19.32 | | | | 17.5 | | | | 16 | | | | (0.95 | ) | | | 3.41 | | | | 2.76 | | | | 5 | |
2009 | | | 12.20 | | | | (0.23 | ) | | | 4.67 | | | | 4.44 | | | $ | (0.20 | ) | | $ | 0.00 | | | $ | (0.20 | ) | | $ | 0.00 | | | | 16.44 | | | | 36.4 | | | | 10 | | | | (1.49 | ) | | | 3.47 | | | | 2.80 | | | | 8 | |
2008 | | | 20.77 | | | | (0.00 | )(b) | | | (8.57 | ) | | | (8.57 | ) | | | — | | | | — | | | | — | | | | — | | | | 12.20 | | | | (41.3 | ) | | | 1 | | | | (0.01 | ) | | | 3.00 | | | | 2.76 | | | | 14 | |
2007 | | | 18.45 | | | | 0.03 | | | | 2.29 | | | | 2.32 | | | | — | | | | — | | | | — | | | | 0.00 | | | | 20.77 | | | | 12.6 | | | | 4 | | | | 0.14 | | | | 2.78 | | | | 2.78 | | | | 20 | |
Class I | | | | | | | | | | | | | | | | | | | | | | | | | | | | | | | | | | | | | | | | | | | | | | | | | | | | | |
2011 | | $ | 19.61 | | | $ | 0.10 | | | $ | (1.91 | ) | | $ | (1.81 | ) | | $ | (0.10 | ) | | | — | | | $ | (0.10 | ) | | $ | 0.00 | | | $ | 17.70 | | | | (9.2 | )% | | $ | 260 | | | | 0.55 | % | | | 2.35 | % | | | 1.76 | % | | | 7 | % |
2010 | | | 16.52 | | | | 0.02 | | | | 3.07 | | | | 3.09 | | | | — | | | | — | | | | — | | | | 0.00 | | | | 19.61 | | | | 18.7 | | | | 386 | | | | 0.09 | | | | 2.41 | | | | 1.76 | | | | 5 | |
2009 | | | 12.17 | | | | 0.06 | | | | 4.54 | | | | 4.60 | | | | (0.25 | ) | | $ | 0.00 | | | | (0.25 | ) | | | 0.00 | | | | 16.52 | | | | 37.8 | | | | 326 | | | | 0.45 | | | | 2.47 | | | | 1.80 | | | | 8 | |
2008(e) | | | 19.75 | | | | 0.22 | | | | (7.74 | ) | | | (7.52 | ) | | | (0.06 | ) | | | — | | | | (0.06 | ) | | | 0.00 | | | | 12.17 | | | | (38.1 | ) | | | 395 | | | | 1.41 | (f) | | | 2.00 | (f) | | | 1.76 | (f) | | | 14 | |
| † | | Total return represents aggregate total return of a hypothetical $1,000 investment at the beginning of the period and sold at the end of the period including reinvestment of distributions and does not reflect applicable sales charges. Total return for a period of less than one year is not annualized. |
| (a) | | Per share amounts have been calculated using the average shares outstanding method. |
| (b) | | Amount represents less than $0.005 per share. |
| (c) | | Under an expense deferral agreement with the Adviser, the Fund repaid the Adviser $15,233 during 2007, representing previously reimbursed expenses from the Adviser. During the year ended December 31, 2007, had such payments not been made, the expense ratios would have been 1.96% (Class AAA and Class A), 2.71% (Class B and Class C), respectively. |
| (d) | | The Fund incurred interest expense during the years ended December 31, 2011, 2010, 2009, 2008, and 2007. If interest expense had not been incurred, the ratios of operating expenses to average net assets would have been 2.00%, 2.00%, 2.04%, 2.00%, and 2.00% (Class AAA and Class A), 2.75%, 2.75%, 2.79%, 2.75%, and 2.75% (Class B and Class C), and 1.75%, 1.75%, 1.79% and 1.75% (Class I), respectively. The Fund also incurred tax expense during the year ended December 31, 2009. If tax expense had not been incurred, the ratios of operating expenses to average net assets would have been 2.01% (Class AAA, and Class A), 2.76% (Class B, and Class C), and 1.76% (Class I), respectively. |
| (e) | | From the commencement of offering Class I Shares on January 11, 2008 through December 31, 2008. |
See accompanying notes to financial statements.
9
The GAMCO Global Opportunity Fund
Notes to Financial Statements
1. Organization. The GAMCO Global Opportunity Fund, a series of GAMCO Global Series Funds, Inc. (the “Corporation”), was incorporated on July 16, 1993 in Maryland. The Fund is a non-diversified open-end management investment company registered under the Investment Company Act of 1940, as amended (the “1940 Act”), and one of four separately managed portfolios (collectively, the “Portfolios”) of the Corporation. The Fund’s primary objective is capital appreciation. The Fund commenced investment operations on May 11, 1998.
2. Significant Accounting Policies. The Fund’s financial statements are prepared in accordance with U.S. Generally Accepted Accounting Principles (“GAAP”), which may require the use of management estimates and assumptions. Actual results could differ from those estimates. The following is a summary of significant accounting policies followed by the Fund in the preparation of its financial statements.
Security Valuation. Portfolio securities listed or traded on a nationally recognized securities exchange or traded in the U.S. over-the-counter market for which market quotations are readily available are valued at the last quoted sale price or a market’s official closing price as of the close of business on the day the securities are being valued. If there were no sales that day, the security is valued at the average of the closing bid and asked prices or, if there were no asked prices quoted on that day, then the security is valued at the closing bid price on that day. If no bid or asked prices are quoted on such day, the security is valued at the most recently available price or, if the Board of Directors (the “Board”) so determines, by such other method as the Board shall determine in good faith to reflect its fair market value. Portfolio securities traded on more than one national securities exchange or market are valued according to the broadest and most representative market, as determined by Gabelli Funds, LLC (the “Adviser”).
Portfolio securities primarily traded on a foreign market are generally valued at the preceding closing values of such securities on the relevant market, but may be fair valued pursuant to procedures established by the Board if market conditions change significantly after the close of the foreign market, but prior to the close of business on the day the securities are being valued. Debt instruments with remaining maturities of sixty days or less that are not credit impaired are valued at amortized cost, unless the Board determines such amount does not reflect the securities’ fair value, in which case these securities will be fair valued as determined by the Board. Debt instruments having a maturity greater than sixty days for which market quotations are readily available are valued at the average of the latest bid and asked prices. If there were no asked prices quoted on such day, the security is valued using the closing bid price. U.S. government obligations with maturities greater than sixty days are normally valued using a model that incorporates market observable data such as reported sales of similar securities, broker quotes, yields, bids, offers, and reference data. Certain securities are valued principally using dealer quotations.
Securities and assets for which market quotations are not readily available are fair valued as determined by the Board. Fair valuation methodologies and procedures may include, but are not limited to: analysis and review of available financial and non-financial information about the company; comparisons with the valuation and changes in valuation of similar securities, including a comparison of foreign securities with the equivalent U.S. dollar value ADR securities at the close of the U.S. exchange; and evaluation of any other information that could be indicative of the value of the security.
The Fund employs a fair value model to adjust prices to reflect events affecting the values of certain portfolio securities which occur between the close of trading on the principal market for such securities (foreign exchanges and over-the-counter markets) at the time at which net asset values of the Fund are determined.
10
The GAMCO Global Opportunity Fund
Notes to Financial Statements (Continued)
If the Fund’s valuation committee believes that a particular event would materially affect net asset value, further adjustment is considered.
The inputs and valuation techniques used to measure fair value of the Fund’s investments are summarized into three levels as described in the hierarchy below:
| | • | | Level 1 — quoted prices in active markets for identical securities; |
| | • | | Level 2 — other significant observable inputs (including quoted prices for similar securities, interest rates, prepayment speeds, credit risk, etc.); and |
| | • | | Level 3 — significant unobservable inputs (including the Fund’s determinations as to the fair value of investments). |
A financial instrument’s level within the fair value hierarchy is based on the lowest level of any input both individually and in the aggregate that is significant to the fair value measurement. The inputs or methodology used for valuing securities are not necessarily an indication of the risk associated with investing in those securities. The summary of the Fund’s investments in securities by inputs used to value the Fund’s investments as of December 31, 2011 is as follows:
| | | | | | | | | | | | |
| | | Valuation Inputs | | | | |
| | | Level 1
Quoted Prices | | | Level 2 Other Significant
Observable Inputs | | | Total Market Value
at 12/31/11 | |
INVESTMENTS IN SECURITIES: | | | | | | | | | | | | |
ASSETS (Market Value): | | | | | | | | | | | | |
Common Stocks: | | | | | | | | | | | | |
Consumer Staples | | $ | 2,239,857 | | | | — | | | $ | 2,239,857 | |
Industrials | | | 1,977,013 | | | | — | | | | 1,977,013 | |
Materials | | | 1,725,948 | | | $ | 60,620 | | | | 1,786,568 | |
Energy | | | 1,149,022 | | | | — | | | | 1,149,022 | |
Information Technology | | | 1,019,846 | | | | — | | | | 1,019,846 | |
Consumer Discretionary | | | 893,327 | | | | — | | | | 893,327 | |
Health Care | | | 855,642 | | | | — | | | | 855,642 | |
Financial Services | | | 590,534 | | | | — | | | | 590,534 | |
Telecommunication Services | | | 201,570 | | | | — | | | | 201,570 | |
Total Common Stocks | | | 10,652,759 | | | | 60,620 | | | | 10,713,379 | |
TOTAL INVESTMENTS IN SECURITIES – ASSETS | | $ | 10,652,759 | | | $ | 60,620 | | | $ | 10,713,379 | |
The Fund did not have significant transfers between Level 1 and Level 2 during the year ended December 31, 2011. The Fund’s policy is to recognize transfers among Levels as of the beginning of the reporting period.
There were no Level 3 investments held at December 31, 2011 or December 31, 2010.
In May 2011, the Financial Accounting Standards Board issued Accounting Standards Update (“ASU”) No. 2011-04 “Amendments to Achieve Common Fair Value Measurement and Disclosure Requirements in U.S. GAAP and International Financial Reporting Standards (“IFRS”).” ASU 2011-04 includes common requirements for measurement of and disclosure about fair value between U.S. GAAP and IFRS. ASU 2011-04 will require reporting entities to disclose the following information for fair value measurements categorized within Level 3 of
11
The GAMCO Global Opportunity Fund
Notes to Financial Statements (Continued)
the fair value hierarchy: quantitative information about the unobservable inputs used in the fair value measurement, the valuation processes used by the reporting entity, and a narrative description of the sensitivity of the fair value measurement to changes in unobservable inputs and the interrelationships between those unobservable inputs. In addition, ASU 2011-04 will require reporting entities to make disclosures about amounts and reasons for all transfers into and out of Level 1 and Level 2 fair value measurements. The new and revised disclosures are effective for interim and annual reporting periods beginning after December 15, 2011. At this time, management is evaluating the implications of ASU 2011-04 and its impact on the financial statements.
Derivative Financial Instruments.
The Fund may engage in various portfolio investment strategies by investing in a number of derivative financial instruments for the purposes of hedging against a specific transaction with respect to either the currency in which the transaction is denominated or another currency. Investing in certain derivative financial instruments, including participation in the options, futures, or swap markets, entails certain execution, liquidity, hedging, tax, and securities, interest, credit, or currency market risks. Losses may arise if the Adviser’s prediction of movements in the direction of the securities, foreign currency, and interest rate markets is inaccurate. Losses may also arise if the counterparty does not perform its duties under a contract, or that, in the event of default, the Fund may be delayed in or prevented from obtaining payments or other contractual remedies owed to it under derivative contracts. The creditworthiness of the counterparties is closely monitored in order to minimize these risks. Participation in derivative transactions involves investment risks, transaction costs, and potential losses to which the Fund would not be subject absent the use of these strategies. The consequences of these risks, transaction costs, and losses may have a negative impact on the Fund’s ability to pay distributions.
The Fund’s derivative contracts held at December 31, 2011, if any, are not accounted for as hedging instruments under GAAP and are disclosed in the Schedule of Investments together with the related counterparty.
Foreign Currency Translations. The books and records of the Fund are maintained in U.S. dollars. Foreign currencies, investments, and other assets and liabilities are translated into U.S. dollars at current exchange rates. Purchases and sales of investment securities, income, and expenses are translated at the exchange rate prevailing on the respective dates of such transactions. Unrealized gains and losses that result from changes in foreign exchange rates and/or changes in market prices of securities have been included in unrealized appreciation/depreciation on investments and foreign currency translations. Net realized foreign currency gains and losses resulting from changes in exchange rates include foreign currency gains and losses between trade date and settlement date on investment securities transactions, foreign currency transactions, and the difference between the amounts of interest and dividends recorded on the books of the Fund and the amounts actually received. The portion of foreign currency gains and losses related to fluctuation in exchange rates between the initial purchase trade date and subsequent sale trade date is included in realized gain/(loss) on investments.
Foreign Securities. The Fund may directly purchase securities of foreign issuers. Investing in securities of foreign issuers involves special risks not typically associated with investing in securities of U.S. issuers. The risks include possible revaluation of currencies, the inability to repatriate funds, less complete financial information about companies, and possible future adverse political and economic developments. Moreover, securities of many foreign issuers and their markets may be less liquid and their prices more volatile than securities of comparable U.S. issuers.
12
The GAMCO Global Opportunity Fund
Notes to Financial Statements (Continued)
Foreign Taxes. The Fund may be subject to foreign taxes on income, gains on investments, or currency repatriation, a portion of which may be recoverable. The Fund will accrue such taxes and recoveries as applicable, based upon its current interpretation of tax rules and regulations that exist in the markets in which it invests.
Securities Transactions and Investment Income. Securities transactions are accounted for on the trade date with realized gain or loss on investments determined by using the identified cost method. Interest income (including amortization of premium and accretion of discount) is recorded on the accrual basis. Premiums and discounts on debt securities are amortized using the effective yield to maturity method. Dividend income is recorded on the ex-dividend date, except for certain dividends from foreign securities that are recorded as soon after the ex-dividend date as the Fund becomes aware of such dividends.
Determination of Net Asset Value and Calculation of Expenses. Certain administrative expenses are common to, and allocated among, various affiliated funds. Such allocations are made on the basis of each fund’s average net assets or other criteria directly affecting the expenses as determined by the Adviser pursuant to procedures established by the Board.
In calculating the NAV per share of each class, investment income, realized and unrealized gains and losses, redemption fees, and expenses other than class specific expenses are allocated daily to each class of shares based upon the proportion of net assets of each class at the beginning of each day. Distribution expenses are borne solely by the class incurring the expense.
Custodian Fee Credits and Interest Expense. When cash balances are maintained in the custody account, the Fund receives credits which are used to offset custodian fees. The gross expenses paid under the custody arrangement are included in custodian fees in the Statement of Operations with the corresponding expense offset, if any, shown as “Custodian fee credits.” When cash balances are overdrawn, the Fund is charged an overdraft fee equal to 2.00% above the federal funds rate on outstanding balances. This amount, if any, would be included in the Statement of Operations.
Distributions to Shareholders. Distributions to shareholders are recorded on the ex-dividend date. Distributions to shareholders are based on income and capital gains as determined in accordance with federal income tax regulations, which may differ from income and capital gains as determined under GAAP. These differences are primarily due to differing treatments of income and gains on various investment securities and foreign currency transactions held by the Fund, timing differences, and differing characterizations of distributions made by the Fund. Distributions from net investment income for federal income tax purposes include net realized gains on foreign currency transactions. These book/tax differences are either temporary or permanent in nature. To the extent these differences are permanent, adjustments are made to the appropriate capital accounts in the period when the differences arise. Permanent differences were primarily due to the tax treatment of currency gains and losses and the expiration of capital loss carryforwards. These reclassifications have no impact on the NAV of the Fund. For the year ended December 31, 2011, reclassifications were made to increase accumulated distributions in excess of net investment income by $400 and decrease accumulated net realized loss on investments and foreign currency transactions by $349,153, with an offsetting adjustment to paid-in capital.
The tax character of distributions paid during the year ended December 31, 2011 was $30,235 of ordinary income. No distributions were made during the year ended December 31, 2010.
13
The GAMCO Global Opportunity Fund
Notes to Financial Statements (Continued)
Provision for Income Taxes. The Fund intends to continue to qualify as a regulated investment company under Subchapter M of the Internal Revenue Code of 1986, as amended (the “Code”). It is the policy of the Fund to comply with the requirements of the Code applicable to regulated investment companies and to distribute substantially all of its net investment company taxable income and net capital gains. Therefore, no provision for federal income taxes is required.
As of December 31, 2011, the components of accumulated earnings/losses on a tax basis were as follows:
| | | | |
Accumulated capital loss carryforwards | | $ | (2,469,205 | ) |
Undistributed ordinary income | | | 70 | |
Net unrealized appreciation on investments and foreign currency translations | | | 3,457,441 | |
| | | | |
Total | | $ | 988,306 | |
| | | | |
At December 31, 2011, the Fund had net capital loss carryforwards for federal income tax purposes which are available to reduce future required distributions of net capital gains to shareholders. Under the Regulated Investment Company Modernization Act of 2010, the Fund will be permitted to carry forward for an unlimited period capital losses incurred in years beginning after December 22, 2010. In addition, these losses must be utilized prior to the losses incurred in pre-enactment taxable years. As a result of the rule, pre-enactment capital loss carryforwards may have an increased likelihood of expiring unused. Additionally, post enactment capital losses that are carried forward will retain their character as either short-term or long-term capital losses rather than being considered all short-term as under previous law.
| | | | |
Capital Loss Carryforward Available through 2012 | | $ | 1,201,151 | |
Capital Loss Carryforward Available through 2016 | | | 1,170,048 | |
Capital Loss Carryforward Available through 2017 | | | 98,006 | |
| | | | |
Total Capital Loss Carryforwards | | $ | 2,469,205 | |
| | | | |
During the year ended December 31, 2011, the Fund utilized capital loss carryforwards of $939,338, and $349,553 of capital loss carryforwards expired for the Fund.
At December 31, 2011, the temporary difference between book basis and tax basis net unrealized appreciation on investments was primarily due to deferral of losses from wash sales for tax purposes and mark-to-market adjustments on investments in passive foreign investment companies.
The following summarizes the tax cost of investments and the related net unrealized appreciation at December 31, 2011:
| | | | | | | | | | | | | | | | |
| | | Cost | | | Gross
Unrealized
Appreciation | | | Gross
Unrealized
Depreciation | | | Net
Unrealized
Appreciation | |
Investments | | $ | 7,256,123 | | | $ | 3,855,843 | | | $ | (398,587 | ) | | $ | 3,457,256 | |
The Fund is required to evaluate tax positions taken or expected to be taken in the course of preparing the Fund’s tax returns to determine whether the tax positions are “more-likely-than-not” of being sustained by the applicable tax authority. Income tax and related interest and penalties would be recognized by the Fund as tax
14
The GAMCO Global Opportunity Fund
Notes to Financial Statements (Continued)
expense in the Statement of Operations if the tax positions were deemed not to meet the more-likely-than-not threshold. For the year ended December 31, 2011, the Fund did not incur any income tax, interest, or penalties.
As of December 31, 2011, the Adviser has reviewed all open tax years and concluded that there was no impact to the Fund’s net assets or results of operations. Tax years ended December 31, 2008 through December 31, 2011 remain subject to examination by the Internal Revenue Service and state taxing authorities. On an ongoing basis, the Adviser will monitor the Fund’s tax positions to determine if adjustments to this conclusion are necessary.
3. Investment Advisory Agreement and Other Transactions. The Fund has entered into an investment advisory agreement (the “Advisory Agreement”) with the Adviser which provides that the Fund will pay the Adviser a fee, computed daily and paid monthly, at the annual rate of 1.00% of the value of its average daily net assets. In accordance with the Advisory Agreement, the Adviser provides a continuous investment program for the Fund’s portfolio, oversees the administration of all aspects of the Fund’s business and affairs, and pays the compensation of all Officers and Directors of the Fund who are affiliated persons of the Adviser.
The Adviser has contractually agreed to waive its investment advisory fee and/or to reimburse expenses of the Fund to the extent necessary to maintain the annualized total operating expenses of the Fund (excluding brokerage, acquired fund fees and expenses, interest, taxes, and extraordinary expenses) until at least May 1, 2013, at no more than 2.00%, 2.00%, 2.75%, 2.75%, and 1.75% of the value of the Fund’s average daily net assets for Class AAA, Class A, Class B, Class C, and Class I, respectively. For the year ended December 31, 2011, the Adviser reimbursed the Fund in the amount of $74,140. In addition, the Fund has agreed, during the two year period following any waiver or reimbursement by the Adviser, to repay such amount to the extent, that after giving the effect to the repayment, such adjusted annualized total operating expenses of the Fund would not exceed 2.00%, 2.00%, 2.75%, 2.75%, and 1.75% of the value of the Fund’s average daily net assets for Class AAA, Class A, Class B, Class C, and Class I, respectively. The agreements are renewable annually. At December 31, 2011, the cumulative amount which the Fund may repay the Adviser is $158,814.
| | | | |
For the year ended December 31, 2010, expiring December 31, 2012 | | $ | 84,674 | |
For the year ended December 31, 2011, expiring December 31, 2013 | | | 74,140 | |
| | | | |
| | $ | 158,814 | |
| | | | |
The Corporation pays each Director who is not considered to be an affiliated person an annual retainer of $6,000 plus $1,000 for each Board meeting attended and each Director is reimbursed by the Corporation for any out of pocket expenses incurred in attending meetings. All Board committee members receive $1,000 per meeting attended. The Chairman of the Audit Committee receives an annual fee of $3,000 and the Lead Director receives an annual fee of $2,000. A Director may receive a single meeting fee, allocated among the participating funds, for participation in certain meetings held on behalf of multiple funds. Directors who are directors or employees of the Adviser or an affiliated company receive no compensation or expense reimbursement from the Corporation.
4. Distribution Plan. The Fund’s Board has adopted a distribution plan (the “Plan”) for each class of shares, except for Class I Shares, pursuant to Rule 12b-1 under the 1940 Act. G.distributors, LLC serves as successor “Distributor” to Gabelli & Company, Inc. (“Gabelli & Co.”) effective August 1, 2011, both affiliates of the Fund. Under the Class AAA, Class A, Class B, and Class C Share Plans, payments are authorized to the Distributor at annual rates of 0.25%, 0.25%, 1.00%, and 1.00%, respectively, of the average daily net assets of those classes, the annual limitations under each Plan. Such payments are accrued daily and paid monthly.
15
The GAMCO Global Opportunity Fund
Notes to Financial Statements (Continued)
5. Portfolio Securities. Purchases and sales of securities during the year ended December 31, 2011, other than short-term securities and U.S. Government obligations, aggregated $841,350 and $2,713,575, respectively.
6. Transactions with Affiliates. During the year ended December 31, 2011, the Fund paid brokerage commissions on security trades of $222 to Gabelli & Co. Additionally, the current and former Distributors informed the Fund that they retained a total of $288 from investors representing commissions (sales charges and underwriting fees) on sales and redemptions of Fund shares.
The cost of calculating the Fund’s NAV per share is a Fund expense pursuant to the Advisory Agreement. The Adviser did not seek a reimbursement during the year ended December 31, 2011.
7. Line of Credit. The Fund participates in an unsecured line of credit of up to $75,000,000 under which it may borrow up to 10% of its net assets from the custodian for temporary borrowing purposes. Borrowings under this arrangement bear interest at the higher of the sum of the LIBOR rate plus 125 basis points or the sum of the federal funds rate plus 125 basis points at the time of borrowing. This amount, if any, would be included in “interest expense” in the Statement of Operations. At December 31, 2011, borrowings outstanding under the line of credit amounted to $144,000.
The average daily amount of borrowings outstanding under the line of credit during the year ended December 31, 2011 was $59,211 with a weighted average interest rate of 1.41%. The maximum amount borrowed at any time during the year ended December 31, 2011 was $778,000.
8. Capital Stock. The Fund offers five classes of shares – Class AAA Shares, Class A Shares, Class B Shares, Class C Shares, and Class I Shares. Class AAA Shares are offered without a sales charge only to investors who acquire them directly from the Distributor, through selected broker/dealers, or the transfer agent. Class I Shares are offered without a sales charge, solely to certain institutions, directly through the Distributor, or brokers that have entered into selling agreements specifically with respect to Class I Shares. Class A Shares are subject to a maximum front-end sales charge of 5.75%. Class B Shares are subject to a contingent deferred sales charge (“CDSC”) upon redemption within six years of purchase and automatically convert to Class A Shares approximately eight years after the original purchase. The applicable Class B CDSC is equal to a percentage declining from 5% of the lesser of the NAV per share at the date of the original purchase or at the date of redemption, based on the length of time held. Class C Shares are subject to a 1.00% CDSC for one year after purchase. Class B Shares are available only through exchange of Class B Shares of other funds distributed by the Distributor.
The Fund imposes a redemption fee of 2.00% on all classes of shares that are redeemed or exchanged on or before the seventh day after the date of a purchase. The redemption fee is deducted from the proceeds otherwise payable to the redeeming shareholders and is retained by the Fund as an increase in paid-in capital. The redemption fees retained by the Fund during the years ended December 31, 2011 and December 31, 2010 amounted to $1 and $5, respectively. The redemption fee does not apply to redemptions of shares where (i) the shares were purchased through automatic reinvestment of distributions, (ii) the redemption was initiated by the Fund, (iii) the shares were purchased through programs that collect the redemption fee at the program level and remit them to the Fund, or (iv) the shares were purchased through programs that the Adviser determines to
16
The GAMCO Global Opportunity Fund
Notes to Financial Statements (Continued)
have appropriate anti-short-term trading policies in place or as to which the Adviser has received assurances that look-through redemption fee procedures or effective anti-short-term trading policies and procedures are in place.
Transactions in shares of capital stock were as follows:
| | | | | | | | | | | | | | | | |
| | | Year Ended
December 31, 2011 | | | Year Ended
December 31, 2010 | |
| | | Shares | | | Amount | | | Shares | | | Amount | |
Class AAA | | | | | | | | | | | | | | | | |
Shares sold | | | 29,330 | | | $ | 562,362 | | | | 32,736 | | | $ | 561,316 | |
Shares issued upon reinvestment of distributions | | | 1,472 | | | | 25,699 | | | | — | | | | — | |
Shares redeemed | | | (127,989 | ) | | | (2,409,047 | ) | | | (158,464 | ) | | | (2,715,526 | ) |
| | | | | | | | | | | | | | | | |
Net decrease | | | (97,187 | ) | | $ | (1,820,986 | ) | | | (125,728 | ) | | $ | (2,154,210 | ) |
| | | | | | | | | | | | | | | | |
| | | | |
Class A | | | | | | | | | | | | | | | | |
Shares sold | | | 1,250 | | | $ | 23,791 | | | | 3,355 | | | $ | 56,732 | |
Shares issued upon reinvestment of distributions | | | 26 | | | | 459 | | | | — | | | | — | |
Shares redeemed | | | (349 | ) | | | (6,916 | ) | | | (5,183 | ) | | | (80,520 | ) |
| | | | | | | | | | | | | | | | |
Net increase/(decrease) | | | 927 | | | $ | 17,334 | | | | (1,828 | ) | | $ | (23,788 | ) |
| | | | | | | | | | | | | | | | |
| | | | |
Class B | | | | | | | | | | | | | | | | |
Shares redeemed | | | — | | | $ | — | | | | (48 | ) | | $ | (727 | ) |
| | | | | | | | | | | | | | | | |
Net decrease | | | — | | | $ | — | | | | (48 | ) | | $ | (727 | ) |
| | | | | | | | | | | | | | | | |
| | | | |
Class C | | | | | | | | | | | | | | | | |
Shares sold | | | 499 | | | $ | 10,000 | | | | 213 | | | $ | 3,986 | |
Shares redeemed | | | (499 | ) | | | (9,521 | ) | | | — | | | | — | |
| | | | | | | | | | | | | | | | |
Net increase | | | — | | | $ | 479 | | | | 213 | | | $ | 3,986 | |
| | | | | | | | | | | | | | | | |
| | | | |
Class I | | | | | | | | | | | | | | | | |
Shares sold | | | 3,139 | | | $ | 61,245 | | | | 2,089 | | | $ | 34,066 | |
Shares issued upon reinvestment of distributions | | | 84 | | | | 1,459 | | | | — | | | | — | |
Shares redeemed | | | (8,237 | ) | | | (147,120 | ) | | | (2,095 | ) | | | (33,831 | ) |
| | | | | | | | | | | | | | | | |
Net increase/(decrease) | | | (5,014 | ) | | $ | (84,416 | ) | | | (6 | ) | | $ | 235 | |
| | | | | | | | | | | | | | | | |
9. Indemnifications. The Fund enters into contracts that contain a variety of indemnifications. The Fund’s maximum exposure under these arrangements is unknown. However, the Fund has not had prior claims or losses pursuant to these contracts. Management has reviewed the Fund’s existing contracts and expects the risk of loss to be remote.
10. Other Matters. On April 24, 2008, the Adviser entered into a settlement with the SEC to resolve an inquiry regarding prior frequent trading in shares of the GAMCO Global Growth Fund (the “Global Growth Fund”) by one investor who was banned from the Global Growth Fund in August 2002. Under the terms of the settlement, the Adviser, without admitting or denying the SEC’s findings and allegations, paid $16 million (which included a $5 million civil monetary penalty). On the same day, the SEC filed a civil action in the U.S. District Court for the
17
The GAMCO Global Opportunity Fund
Notes to Financial Statements (Continued)
Southern District of New York against the Executive Vice President and Chief Operating Officer of the Adviser, alleging violations of certain federal securities laws arising from the same matter. The officer, who is also an officer of the Global Growth Fund and other funds in the Gabelli/GAMCO complex, including this Fund, denies the allegations and is continuing in his positions with the Adviser and the funds. The settlement by the Adviser did not have, and the resolution of the action against the officer is not expected to have, a material adverse impact on the Adviser or its ability to fulfill its obligations under the Advisory Agreement.
11. Subsequent Events. Management has evaluated the impact on the Fund of all subsequent events occurring through the date the financial statements were issued and has determined that there were no subsequent events requiring recognition or disclosure in the financial statements.
Morningstar Rating™ is based on risk-adjusted returns. The Overall Morningstar Rating is derived from a weighted average of the performance figures associated with a fund’s three, five, and ten year (if applicable) Morningstar Rating metrics. For funds with at least a three year history, a Morningstar Rating is based on a risk-adjusted return measure (including the effects of sales charges, loads, and redemption fees) placing more emphasis on downward variations and rewarding consistent performance. That accounts for variations in a fund’s monthly performance. The top 10% of funds in each category receive 5 stars, the next 22.5% 4 stars, the next 35% 3 stars, the next 22.5% 2 stars, and the bottom 10% 1 star. (Each share class is counted as a fraction of one fund within this scale and rated separately, which may cause slight variations in the distribution percentages.) Morningstar Rating is for the AAA Share class only; other classes may have different performance characteristics. Ratings reflect relative performance. Results for certain periods were negative. ©2012 Morningstar, Inc. All Rights Reserved. The information contained herein: (1) is proprietary to Morningstar and/or its content providers ; (2) may not be copied or distributed; and (3) is not warranted to be accurate, complete or timely. Neither Morningstar nor its content providers are responsible for any damages or losses arising from any use of this information.
18
Report of Independent Registered Public Accounting Firm
To the Shareholders and Board of Directors of
GAMCO Global Series Funds, Inc.
We have audited the accompanying statement of assets and liabilities, including the schedule of investments, of The GAMCO Global Opportunity Fund (the “Fund”), one of the series constituting GAMCO Global Series Funds, Inc., as of December 31, 2011, and the related statement of operations for the year then ended, the statements of changes in net assets for each of the two years in the period then ended, and the financial highlights for each of the periods indicated therein. These financial statements and financial highlights are the responsibility of the Fund’s management. Our responsibility is to express an opinion on these financial statements and financial highlights based on our audits.
We conducted our audits in accordance with the standards of the Public Company Accounting Oversight Board (United States). Those standards require that we plan and perform the audit to obtain reasonable assurance about whether the financial statements and financial highlights are free of material misstatement. We were not engaged to perform an audit of the Fund’s internal control over financial reporting. Our audits included consideration of internal control over financial reporting as a basis for designing audit procedures that are appropriate in the circumstances, but not for the purpose of expressing an opinion on the effectiveness of the Fund’s internal control over financial reporting. Accordingly, we express no such opinion. An audit also includes examining, on a test basis, evidence supporting the amounts and disclosures in the financial statements and financial highlights, assessing the accounting principles used and significant estimates made by management, and evaluating the overall financial statement presentation. Our procedures included confirmation of securities owned as of December 31, 2011, by correspondence with the Fund’s custodian. We believe that our audits provide a reasonable basis for our opinion.
In our opinion, the financial statements and financial highlights referred to above present fairly, in all material respects, the financial position of The GAMCO Global Opportunity Fund, one of the series constituting GAMCO Global Series Funds, Inc., at December 31, 2011, the results of its operations for the year then ended, the changes in its net assets for each of the two years in the period then ended, and its financial highlights for each of the periods indicated therein, in conformity with U.S. generally accepted accounting principles.

Philadelphia, Pennsylvania
February 27, 2012
19
The GAMCO Global Opportunity Fund
Board Consideration and Re-Approval of Investment Advisory Agreement (Unaudited)
During the six months ended December 31, 2011, the Board of Directors of the Corporation approved the continuation of the investment advisory agreement with the Adviser for the Fund on the basis of the recommendation by the directors (the “Independent Board Members”) who are not “interested persons” of the Fund. The following paragraphs summarize the material information and factors considered by the Independent Board Members as well as their conclusions relative to such factors.
Nature, Extent, and Quality of Services. The Independent Board Members considered information regarding the Fund’s portfolio managers, the depth of the analyst pool available to the Adviser and the portfolio managers, the scope of supervisory, administrative, shareholder, and other services supervised or provided by the Adviser, and the absence of significant service problems reported to the Board. The Independent Board Members noted the experience, length of service, and reputation of the Fund’s portfolio managers.
Investment Performance. The Independent Board Members reviewed the short and medium-term performance of the Fund against a peer group of global multi-cap core funds, noting the Fund’s top half performance for the one year period, top quintile performance for the three year period, and top third performance for the five year period.
Profitability. The Independent Board Members reviewed summary data regarding the lack of profitability of the Fund to the Adviser both with and without the expense reimbursement arrangement in effect. The Independent Board Members also noted that affiliated brokers of the Adviser received distribution fees and minor amounts of sales commissions.
Economies of Scale. The Independent Board Members discussed the major elements of the Adviser’s cost structure and the relationship of those elements to potential economies of scale and reviewed rudimentary data relating to the impact of 20% growth in the Fund on the Adviser’s profitability.
Sharing of Economies of Scale. The Independent Board Members noted that the investment advisory fee schedule for the Fund does not take into account any potential economies of scale that may develop or any losses or diminished profitability to the Adviser in prior years.
Service and Cost Comparisons. The Independent Board Members compared the expense ratios of the investment advisory fee, other expenses, and total expenses of the Fund with similar expense ratios of the peer group of global multi-cap growth funds and noted that the Adviser’s management fee includes substantially all administrative services of the Fund as well as investment advisory services. The Independent Board Members noted that the Fund’s expense ratios after waivers were moderately higher than and the Fund’s size was significantly lower than average within this group and that the Adviser had been waiving substantial portions of its fees in order to make the Fund a more attractive investment. The Independent Board Members compared the advisory fee with the fees for other funds managed by the Adviser and considered fees charged by an affiliated adviser for general equity institutional accounts and unregistered funds.
Conclusions. The Independent Board Members concluded that the Fund enjoyed highly experienced portfolio management services, good ancillary services, and an acceptable performance record. The Independent Board Members also concluded that the Fund’s expense ratios were reasonable, particularly in light of the lack of profitability to the Adviser of managing the Fund, and that economies of scale were not a factor in their thinking at this time. The Independent Board Members did not view the potential profitability of ancillary services as material to their decision. On the basis of the foregoing and without assigning particular weight to any single conclusion, the Independent Board Members determined to recommend continuation of the investment advisory agreement to the full Board.
20
The GAMCO Global Opportunity Fund
Additional Fund Information (Unaudited)
The business and affairs of the Corporation are managed under the direction of the Corporation’s Board of Directors. Information pertaining to the Directors and officers of the Corporation is set forth below. The Fund’s Statement of Additional Information includes additional information about the Fund’s Directors and is available without charge, upon request, by calling 800-GABELLI (800-422-3554) or by writing to The GAMCO Global Opportunity Fund at One Corporate Center, Rye, NY 10580-1422.
| | | | | | | | |
Name, Position(s) Address1 and Age | | Term of Office
and Length of
Time Served2 | | Number of Funds
in Fund Complex
Overseen by Director | | Principal Occupation(s)
During Past Five Years | | Other Directorships
Held by Director4 |
| | | |
INTERESTED DIRECTORS3: | | | | | | |
Mario J. Gabelli, CFA Director and Chief Investment Officer Age: 69 | | Since 1993 | | 27 | | Chairman, Chief Executive Officer, and Chief Investment Officer–Value Portfolios of GAMCO Investors, Inc. and Chief Investment Officer–Value Portfolios of Gabelli Funds, LLC, and GAMCO Asset Management Inc.; Director/Trustee or Chief Investment Officer of other registered investment companies in the Gabelli/GAMCO Funds Complex; Chief Executive Officer of GGCP, Inc. | | Director of Morgan Group Holdings, Inc. (holding company); Chairman of the Board and Chief Executive Officer of LICT Corp. (multimedia and communication services company); Director of CIBL, Inc. (broadcasting and wireless communications); Director of RLJ Acquisition Inc. (blank check company) |
John D. Gabelli Director Age: 67 | | Since 1993 | | 10 | | Senior Vice President of Gabelli & Company, Inc. | | — |
| | | |
INDEPENDENT DIRECTORS5: | | | | | | |
E. Val Cerutti Director Age: 72 | | Since 2001 | | 7 | | Chief Executive Officer of Cerutti Consultants, Inc. | | Director of The LGL Group, Inc. (diversified manufacturing) (1990-2009) |
Anthony J. Colavita Director Age: 76 | | Since 1993 | | 35 | | President of the law firm of Anthony J. Colavita, P.C. | | — |
Arthur V. Ferrara Director Age: 81 | | Since 2001 | | 8 | | Former Chairman of the Board and Chief Executive Officer of The Guardian Life Insurance Company of America (1992-1995) | | — |
Werner J. Roeder, MD Director Age: 71 | | Since 1993 | | 22 | | Medical Director of Lawrence Hospital and practicing private physician | | — |
Anthonie C. van Ekris Director Age: 77 | | Since 1993 | | 20 | | Chairman of BALMAC International, Inc. (commodities and futures trading) | | Director of Aurado Energy Inc. (oil and gas operations) through 2005 |
21
The GAMCO Global Opportunity Fund
Additional Fund Information (Continued) (Unaudited)
| | | | | | | | |
Name, Position(s) Address1 and Age | | Term of Office
and Length of
Time Served2 | | Number of Funds
in Fund Complex
Overseen by Director | | Principal Occupation(s)
During Past Five Years | | Other Directorships
Held by Director4 |
Salvatore J. Zizza Director Age: 66 | | Since 2004 | | 29 | | Chairman (since 1978) of Zizza & Company, Ltd. (financial consulting); Chairman (since 2006) of Metropolitan Paper Recycling, Inc. (recycling); Chairman (since 2000) of BAM Inc. (manufacturing); Chairman (since 2009) of E-Corp English (business services) | | Non-Executive Chairman and Director of Harbor BioSciences, Inc. (biotechnology); Vice Chairman and Director of Trans-Lux Corporation (business services); Chairman and Chief Executive Officer of General Employment Enterprises, Inc. (staffing); Director of Bion Environmental Technologies (technology) (2005-2008); Director of Earl Schieb Inc. (automotive painting) through April 2009. |
| | | | |
Name, Position(s)
Address1
and Age | | Term of Office
and Length of
Time Served2 | | Principal Occupation(s)
During Past Five Years |
| | |
OFFICERS: | | | | |
Bruce N. Alpert President, Secretary, and
Acting Chief Compliance Officer Age: 60 | | Since 1993 Since November 2011 | | Executive Vice President and Chief Operating Officer of Gabelli Funds, LLC since 1988, Officer of all of the registered investment companies in the Gabelli/GAMCO Funds complex. Director of Teton Advisors, Inc. since 1998; Chairman of Teton Advisors, Inc. 2008 to 2010; President of Teton Advisors, Inc. 1998 through 2008; Senior Vice President of GAMCO Investors, Inc. since 2008 |
Agnes Mullady Treasurer Age: 53 | | Since 2006 | | President and Chief Operating Officer of the Open-End Fund Division of Gabelli Funds, LLC since September 2010; Senior Vice President of GAMCO Investors, Inc. since 2009; Vice President of Gabelli Funds, LLC since 2007; Officer of all of the registered investment companies in the Gabelli/GAMCO Funds Complex |
| | 1 | Address: One Corporate Center, Rye, NY 10580-1422, unless otherwise noted. |
| | 2 | Each Director will hold office for an indefinite term until the earliest of (i) the next meeting of shareholders, if any, called for the purpose of considering the election or re-election of such Director and until the election and qualification of his or her successor, if any, elected at such meeting, or (ii) the date a Director resigns or retires, or a Director is removed by the Board of Directors or shareholders, in accordance with the Corporation’s By-Laws and Articles of Incorporation. Each officer will hold office for an indefinite term until the date he or she resigns or retires or until his or her successor is elected and qualified. |
| | 3 | “Interested person” of the Corporation as defined in the 1940 Act. Messrs. Gabelli are each considered an “interested person” because of their affiliation with Gabelli Funds, LLC which acts as the Corporation’s investment adviser. Mario J. Gabelli and John D. Gabelli are brothers. |
| | 4 | This column includes only directorships of companies required to report to the SEC under the Securities Exchange Act of 1934, as amended, i.e., public companies, or other investment companies registered under the 1940 Act. |
| | 5 | Directors who are not interested persons are considered “Independent” Directors. |
22
The GAMCO Global Opportunity Fund
Additional Fund Information (Continued) (Unaudited)
2011 TAX NOTICE TO SHAREHOLDERS (Unaudited)
For the year ended December 31, 2011, the Fund paid to shareholders ordinary income distributions (comprised of net investment income) totaling $0.049, $0.056, and $0.100 per share for Class AAA, Class A, and Class I, respectively. For the year ended December 31, 2011, 100% of the ordinary income distribution qualifies for the dividends received deduction available to corporations. The Fund designates 100% of the ordinary income distribution as qualified dividend income pursuant to the Jobs and Growth Tax Relief Reconciliation Act of 2003. Also for the year 2011, the Fund passed through foreign tax credits of $0.021 per share to Class AAA, Class A, and Class I.
All designations are based on financial information available as of the date of this annual report and, accordingly, are subject to change. For each item, it is the intention of the Fund to designate the maximum amount permitted under the Internal Revenue Code and the regulations thereunder.
23
GAMCO Global Series Funds, Inc.
The GAMCO Global Opportunity Fund
One Corporate Center
Rye, New York 10580-1422
800-GABELLI
800-422-3554
fax: 914-921-5118
website: www.gabelli.com
e-mail: info@gabelli.com
Net Asset Value per share available daily by calling
800-GABELLI after 7:00 P.M.
| | |
| Board of Directors |
Mario J. Gabelli, CFA Chairman and Chief Executive Officer GAMCO Investors, Inc. E. Val Cerutti Chief Executive Officer Cerutti Consultants, Inc. Anthony J. Colavita President Anthony J. Colavita, P.C. Arthur V. Ferrara Former Chairman and Chief Executive Officer Guardian Life Insurance Company of America | | John D. Gabelli Senior Vice President Gabelli & Company, Inc. Werner J. Roeder, MD Medical Director Lawrence Hospital Anthonie C. van Ekris Chairman BALMAC International, Inc. Salvatore J. Zizza Chairman Zizza & Co., Ltd. |
| |
| |
| |
|
| Officers |
Bruce N. Alpert President, Secretary, and Acting Chief Compliance Officer | | Agnes Mullady Treasurer |
|
Custodian, Transfer Agent, and Dividend Disbursing Agent |
| State Street Bank and Trust Company |
|
| Distributor |
| G.distributors, LLC |
|
| Legal Counsel |
| Skadden, Arps, Slate, Meagher & Flom LLP |
This report is submitted for the general information of the shareholders of The GAMCO Global Opportunity Fund. It is not authorized for distribution to prospective investors unless preceded or accompanied by an effective prospectus.
GAB403Q411AR
GAMCO
The
GAMCO Global Opportunity Fund
Morningstar® rated The GAMCO Global Opportunity Fund Class AAA Shares 4 stars overall and 4 stars for the five and ten year periods ended December 31, 2011 among 697, 490 and 275 World Stock funds, respectively. Morningstar RatingTM is based on risk-adjusted returns.
ANNUAL REPORT
DECEMBER 31, 2011
The GAMCO Global Telecommunications Fund
Annual Report — December 31, 2011
| | | | |

Mario J. Gabelli, CFA | | 
Sergey Dluzhevskiy, CFA, CPA | | 
Evan Miller, CFA |
To Our Shareholders,
The Sarbanes-Oxley Act requires a fund’s principal executive and financial officers to certify the entire contents of the semiannual and annual shareholder reports in a filing with the Securities and Exchange Commission (“SEC”) on Form N-CSR. This certification would cover the portfolio managers’ commentary and subjective opinions if they are attached to or a part of the financial statements. Many of these comments and opinions would be difficult or impossible to certify.
Because we do not want our portfolio managers to eliminate their opinions and/or restrict their commentary to historical facts, we have separated their commentary from the financial statements and investment portfolio and have sent it to you separately. Both the commentary and the financial statements, including the portfolio of investments, will be available on our website at www.gabelli.com.
Performance Discussion (Unaudited)
For the year ended December 31, 2011, the net asset value (“NAV”) per Class AAA Share of The GAMCO Global Telecommunications Fund decreased 6.7% compared with an increase of 0.1% for the Morgan Stanley Capital International (“MSCI”) All Country (“AC”) World Telecommunication Services Index. See page 2 for additional performance information.
Enclosed are the schedule of investments and financial statements as of December 31, 2011.
2011 began much as 2010 had ended for the telecommunications sector, with the group lagging the performance of the broader index through the end of February 2011. The sector rally and outperformance in the closing two weeks of the first quarter can be attributed to: The rotation into defensive names that followed the concerns about Japan, escalating unease in the Middle East, and the surprise announcement on March 2, 2011 by AT&T (2.6% of net assets as of December 31, 2011) of an agreed acquisition of T-Mobile USA from Deutsche Telekom (2.5%).
The global telecommunications sector was not shielded from the market volatility experienced in the second quarter. The sector tracked the broader markets during the quarter, rallying sharply to the end of April, then dropping to 2011 lows on June 16, and finally rebounding in the last two weeks of the quarter.
The global telecommunications sector outperformed broader markets in the third quarter, exhibiting characteristic defensiveness in the face of a sharp sell-off in global equities.
The pattern of the telecommunications sector underperforming equity markets was again evident in the fourth quarter. The 3.9% gain in the sector compares with a 7.3% gain for the broader MSCI global index. The underperformance of the group was evident across all geographies in the quarter.
Our approach is multifaceted. We purchase companies that are attractively valued relative to what we estimate a buyer would be willing to pay for the entire company in a private transaction. When the gap between a company’s Private Market Value (“PMV”) and public market value widens, our risk/reward parameters improve. To maximize returns, our decision process requires the expectation of a trigger that will promote a reduction in this gap. However, we will not invest in just any “cheap” company. For most of our holdings, our selection is based on “bottom up” fundamental analysis, which requires strong cash flow and earnings power, positive industry dynamics, and good management with a track record of growing value for their shareholders.
Selected holdings that contributed positively to performance in 2011 were DISH Network Corp. (2.4%), the third largest pay TV provider in the U.S. with nearly 14 million subscribers; Verizon Communications Inc. (4.0%), one of the world’s leading telecommunications services companies; and Rogers Communications Inc. (3.2%), one of the few companies in North America to offer consumers the “Quadruple Play” of video, high speed data, and fixed and wireless telephony through a wholly owned plant. The company, founded by late telecom pioneer Ted Rogers, is Canada’s largest cable and wireless company. Some of our weaker performing stocks during the year were Sprint Nextel Corp. (1.2%), which operates the third largest national wireless carrier in the United States; America Movil SAB de CV (3.6%), a leading wireless services provider in Latin America; and Cablevision Systems Corp. (1.3%), one of the leading broadband providers in the New York metropolitan area, with nearly three million customers.
We appreciate your confidence and trust.
| | |
| | Sincerely yours, |
| |
| |  |
| | Bruce N. Alpert |
| February 22, 2012 | | President |
Comparative Results
| | | | | | | | | | | | | | | | |
Average Annual Returns through December 31, 2011 (a) (Unaudited) | |
| | | 1 Year | | | 5 Year | | | 10 Year | | | Since
Inception
(11/1/93) | |
Class AAA (GABTX) | | | (6.74 | )% | | | (1.92 | )% | | | 4.08 | % | | | 7.33 | % |
MSCI AC World Telecommunication Services Index | | | 0.09 | | | | 1.72 | | | | 4.20 | | | | N/A | |
MSCI AC World Free Index | | | (6.95 | ) | | | (1.35 | ) | | | 4.77 | | | | N/A | |
Class A (GTCAX) | | | (6.77 | ) | | | (1.91 | ) | | | 4.09 | | | | 7.34 | |
With sales charge (b) | | | (12.13 | ) | | | (3.07 | ) | | | 3.48 | | | | 6.98 | |
Class B (GTCBX) | | | (7.42 | ) | | | (2.66 | ) | | | 3.30 | | | | 6.82 | |
With contingent deferred sales charge (c) | | | (12.05 | ) | | | (3.05 | ) | | | 3.30 | | | | 6.82 | |
Class C (GTCCX) | | | (7.41 | ) | | | (2.66 | ) | | | 3.30 | | | | 6.82 | |
With contingent deferred sales charge (d) | | | (8.34 | ) | | | (2.66 | ) | | | 3.30 | | | | 6.82 | |
Class I (GGTIX) | | | (6.47 | ) | | | (1.72 | ) | | | 4.19 | | | | 7.39 | |
In the current prospectus dated April 29, 2011, the expense ratios for Class AAA, A, B, C, and I Shares are 1.62%, 1.62%, 2.37%, 2.37%, and 1.37%, respectively. Class AAA and Class I Shares do not have a sales charge. See page 11 for the expense ratios for the year ended December 31, 2011. The maximum sales charge for Class A, B, and C Shares is 5.75%, 5.00%, and 1.00%, respectively.
| | (a) | Returns represent past performance and do not guarantee future results. Total returns and average annual returns reflect changes in share price, reinvestment of distributions, and are net of expenses. Investment returns and the principal value of an investment will fluctuate. When shares are redeemed, they may be worth more or less than their original cost. The Fund imposes a 2% redemption fee on shares sold or exchanged within seven days after the date of purchase. Current performance may be lower or higher than performance data presented. Visit www.gabelli.com for performance information as of the most recent month end. Investors should carefully consider the investment objectives, risks, charges, and expenses of the Fund before investing. The prospectus contains information about these and other matters and should be read carefully before investing. Investing in foreign securities involves risks not ordinarily associated with investments in domestic issues, including currency fluctuation, economic, and political risks. The Class AAA Share NAVs per share are used to calculate performance for the periods prior to the issuance of Class A Shares, Class B Shares, Class C Shares, and Class I Shares on March 12, 2000, March 13, 2000, June 2, 2000, and January 11, 2008, respectively. The actual performance for the Class B Shares and Class C Shares would have been lower due to the additional expenses associated with these classes of shares. The MSCI AC World Telecommunication Services Index is an unmanaged index that measures the performance of the global telecommunication securities from around the world. The MSCI AC World Free Index is a free float adjusted market capitalization weighted index that is designed to measure the equity market performance of developed and emerging markets. The MSCI AC World Free Index consists of 45 country indices comprising 24 developed and 21 emerging market country indices. Dividends are considered reinvested. You cannot invest directly in an index. | |
| | (b) | Performance results include the effect of the maximum 5.75% sales charge at the beginning of the period. | |
| | (c) | Assuming payment of the maximum contingent deferred sales charge (CDSC). The maximum CDSC for Class B Shares is 5% which is gradually reduced to 0% after six years. | |
| | (d) | Assuming payment of the 1% maximum CDSC imposed on redemptions made within one year of purchase. | |
COMPARISON OF CHANGE IN VALUE OF A $10,000 INVESTMENT IN
THE GAMCO GLOBAL TELECOMMUNICATIONS FUND (CLASS AAA SHARES) AND MSCI AC WORLD FREE INDEX (Unaudited)
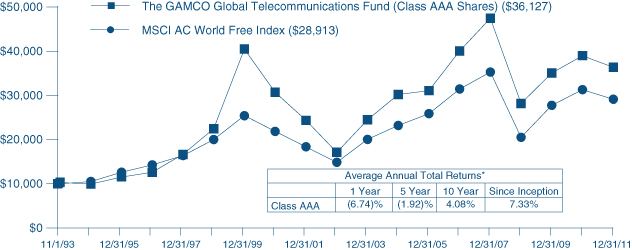
| * | Past performance is not predictive of future results. The performance tables and graph do not reflect the deduction of taxes that a shareholder would pay on Fund distributions or the redemption of Fund shares. |
2
The GAMCO Global Telecommunications Fund
Disclosure of Fund Expenses (Unaudited)
For the Six Month Period from July 1, 2011 through December 31, 2011
Expense Table
We believe it is important for you to understand the impact of fees and expenses regarding your investment. All mutual funds have operating expenses. As a shareholder of a fund, you incur ongoing costs, which include costs for portfolio management, administrative services, and shareholder reports (like this one), among others. Operating expenses, which are deducted from a fund’s gross income, directly reduce the investment return of a fund. When a fund’s expenses are expressed as a percentage of its average net assets, this figure is known as the expense ratio. The following examples are intended to help you understand the ongoing costs (in dollars) of investing in your Fund and to compare these costs with those of other mutual funds. The examples are based on an investment of $1,000 made at the beginning of the period shown and held for the entire period.
The Expense Table below illustrates your Fund’s costs in two ways:
Actual Fund Return: This section provides information about actual account values and actual expenses. You may use this section to help you to estimate the actual expenses that you paid over the period after any fee waivers and expense reimbursements. The “Ending Account Value” shown is derived from the Fund’s actual return during the past six months, and the “Expenses Paid During Period” shows the dollar amount that would have been paid by an investor who started with $1,000 in the Fund. You may use this information, together with the amount you invested, to estimate the expenses that you paid over the period.
To do so, simply divide your account value by $1,000 (for example, an $8,600 account value divided by $1,000 = 8.6), then multiply the result by the number given for your Fund under the heading “Expenses Paid During Period” to estimate the expenses you paid during this period.
Hypothetical 5% Return: This section provides information about hypothetical account values and hypothetical expenses based on the Fund’s actual expense ratio. It assumes a hypothetical annualized return of 5% before expenses during the period shown.
In this case – because the hypothetical return used is not the Fund’s actual return – the results do not apply to your investment and you cannot use the hypothetical account value and expense to estimate the actual ending account balance or expenses you paid for the period. This example is useful in making comparisons of the ongoing costs of investing in the Fund and other funds. To do so, compare this 5% hypothetical example with the 5% hypothetical examples that appear in shareholder reports of other funds.
Please note that the expenses shown in the table are meant to highlight your ongoing costs only and do not reflect any transactional costs such as sales charges (loads), redemption fees, or exchange fees, if any, which would be described in the Prospectus. If these costs were applied to your account, your costs would be higher. Therefore, the 5% hypothetical return is useful in comparing ongoing costs only, and will not help you determine the relative total costs of owning different funds. The “Annualized Expense Ratio” represents the actual expenses for the last six months and may be different from the expense ratio in the Financial Highlights which is for the year ended December 31, 2011.
| | | | | | | | | | | | | | | | |
| | | Beginning
Account Value
07/01/11 | | | Ending
Account Value
12/31/11 | | | Annualized
Expense
Ratio | | | Expenses
Paid During
Period* | |
The GAMCO Global Telecommunications Fund | |
Actual Fund Return | |
| Class AAA | | | $1,000.00 | | | | $ 864.00 | | | | 1.61 | % | | | $ 7.56 | |
| Class A | | | $1,000.00 | | | | $ 863.80 | | | | 1.62 | % | | | $ 7.61 | |
| Class B | | | $1,000.00 | | | | $ 860.90 | | | | 2.37 | % | | | $11.12 | |
| Class C | | | $1,000.00 | | | | $ 860.90 | | | | 2.36 | % | | | $11.07 | |
| Class I | | | $1,000.00 | | | | $ 865.30 | | | | 1.36 | % | | | $ 6.39 | |
Hypothetical 5% Return | |
| Class AAA | | | $1,000.00 | | | | $1,017.09 | | | | 1.61 | % | | | $ 8.19 | |
| Class A | | | $1,000.00 | | | | $1,017.04 | | | | 1.62 | % | | | $ 8.24 | |
| Class B | | | $1,000.00 | | | | $1,013.26 | | | | 2.37 | % | | | $12.03 | |
| Class C | | | $1,000.00 | | | | $1,013.31 | | | | 2.36 | % | | | $11.98 | |
| Class I | | | $1,000.00 | | | | $1,018.35 | | | | 1.36 | % | | | $ 6.92 | |
| * | Expenses are equal to the Fund’s annualized expense ratio for the last six months multiplied by the average account value over the period, multiplied by the number of days in the most recent fiscal half year (184 days), then divided by 365. |
3
Summary of Portfolio Holdings (Unaudited)
The following table presents portfolio holdings as a percent of net assets as of December 31, 2011:
The GAMCO Global Telecommunications Fund
| | | | |
| |
Diversified Telecommunications Services | | | 46.2% | |
Wireless Telecommunications Services | | | 34.0% | |
| | | | |
Other | | | 19.9% | |
Other Assets and Liabilities (Net) | | | (0.1)% | |
| | | | |
| | | 100.0% | |
| | | | |
The Fund files a complete schedule of portfolio holdings with the SEC for the first and third quarters of each fiscal year on Form N-Q. Shareholders may obtain this information at www.gabelli.com or by calling the Fund at 800-GABELLI (800-422-3554). The Fund’s Form N-Q is available on the SEC’s website at www.sec.gov and may also be reviewed and copied at the SEC’s Public Reference Room in Washington, DC. Information on the operation of the Public Reference Room may be obtained by calling 800-SEC-0330.
Proxy Voting
The Fund files Form N-PX with its complete proxy voting record for the twelve months ended June 30th, no later than August 31st of each year. A description of the Fund’s proxy voting policies, procedures, and how the Fund voted proxies relating to portfolio securities is available without charge, upon request, by (i) calling 800-GABELLI (800-422-3554); (ii) writing to The Gabelli Funds at One Corporate Center, Rye, NY 10580-1422; or (iii) visiting the SEC’s website at www.sec.gov.
4
The GAMCO Global Telecommunications Fund
Schedule of Investments — December 31, 2011
| | | | | | | | | | | | |
Shares | | | | | Cost | | | Market
Value | |
| | | | | | | | | | | | |
| | | |
| | | | COMMON STOCKS — 99.3% | | | | | | | | |
| | | | DIVERSIFIED TELECOMMUNICATIONS SERVICES — 46.2% | |
| | | | Africa/Middle East — 0.5% | | | | | | | | |
| | 37,000 | | | Maroc Telecom SA | | $ | 631,188 | | | $ | 601,941 | |
| | 200,000 | | | Pakistan Telecommunication
Co. Ltd. (a) | | | 155,766 | | | | 23,112 | |
| | 9,100 | | | Telkom SA Ltd. | | | 115,338 | | | | 32,747 | |
| | | | | | | | | | | | |
| | | | | | | 902,292 | | | | 657,800 | |
| | | | | | | | | | | | |
| | | |
| | | | Asia/Pacific — 5.1% | | | | | | | | |
| | 225,000 | | | Asia Satellite Telecommunications
Holdings Ltd. | | | 487,155 | | | | 451,935 | |
| | 5,280 | | | Chorus Ltd., ADR† | | | 66,752 | | | | 63,202 | |
| | 170,000 | | | First Pacific Co. Ltd. | | | 92,079 | | | | 176,860 | |
| | 9,000 | | | First Pacific Co. Ltd., ADR | | | 7,324 | | | | 46,170 | |
| | 5,500 | | | KT Corp., ADR† | | | 101,752 | | | | 86,020 | |
| | 90,000 | | | PCCW Ltd. | | | 74,681 | | | | 30,940 | |
| | 36,500 | | | Philippine Long Distance Telephone Co., ADR | | | 554,603 | | | | 2,103,130 | |
| | 18,860 | | | PT Telekomunikasi Indonesia, ADR | | | 196,056 | | | | 579,756 | |
| | 797,000 | | | Singapore Telecommunications Ltd. | | | 602,743 | | | | 1,898,716 | |
| | 26,400 | | | Telecom Corp. of New Zealand Ltd., ADR | | | 223,475 | | | | 210,936 | |
| | 375,000 | | | Telekom Malaysia Berhad | | | 519,351 | | | | 586,751 | |
| | 1,800 | | | Telstra Corp. Ltd., ADR | | | 35,478 | | | | 30,690 | |
| | 1,865,000 | | | True Corp. Public Co. Ltd.† | | | 742,862 | | | | 159,604 | |
| | 8,075 | | | TT&T Public Co. Ltd., GDR† (a)(b)(c) | | | 100,542 | | | | 226 | |
| | | | | | | | | | | | |
| | | | | | | 3,804,853 | | | | 6,424,936 | |
| | | | | | | | | | | | |
| | | |
| | | | Europe — 19.2% | | | | | | | | |
| | 11,250 | | | Belgacom SA | | | 358,520 | | | | 352,941 | |
| | 10,000 | | | BT Group plc, ADR | | | 362,500 | | | | 296,400 | |
| | 419,000 | | | Cable & Wireless Worldwide plc | | | 431,016 | | | | 105,739 | |
| | 85,000 | | | Colt Group SA† | | | 160,239 | | | | 120,322 | |
| | 280,000 | | | Deutsche Telekom AG, ADR | | | 4,401,668 | | | | 3,206,000 | |
| | 38,000 | | | Elisa Oyj | | | 302,078 | | | | 793,296 | |
| | 25,000 | | | France Telecom SA, ADR | | | 647,110 | | | | 391,500 | |
| | 3,807 | | | Hellenic Telecommunications
Organization SA | | | 61,405 | | | | 14,190 | |
| | 25,900 | | | Hellenic Telecommunications Organization SA, ADR | | | 153,418 | | | | 44,807 | |
| | 2,100 | | | Iliad SA | | | 235,095 | | | | 259,154 | |
| | 53,000 | | | Koninklijke KPN NV, ADR | | | 447,743 | | | | 631,760 | |
| | 1,500 | | | Magyar Telekom Telecommunications
plc, ADR | | | 22,920 | | | | 15,900 | |
| | | | | | | | | | | | |
Shares | | | | | Cost | | | Market
Value | |
| | | | | | | | | | | | |
| | 45,000 | | | Portugal Telecom SGPS SA | | $ | 630,500 | | | $ | 259,173 | |
| | 30,000 | | | Portugal Telecom SGPS SA, ADR | | | 135,026 | | | | 173,100 | |
| | 9,300 | | | Rostelecom OJSC, ADR† | | | 110,099 | | | | 266,445 | |
| | 84,600 | | | Sistema JSFC, GDR (d) | | | 1,650,891 | | | | 1,422,126 | |
| | 100,000 | | | Sonaecom SGPS SA | | | 156,503 | | | | 157,251 | |
| | 43,000 | | | Swisscom AG, ADR | | | 1,020,452 | | | | 1,630,560 | |
| | 8,000 | | | Tele2 AB, Cl. B | | | 149,341 | | | | 155,651 | |
| | 860,000 | | | Telecom Italia SpA | | | 3,165,934 | | | | 924,947 | |
| | 21,000 | | | Telecom Italia SpA, ADR | | | 578,887 | | | | 223,650 | |
| | 281,000 | | | Telefonica SA, ADR | | | 2,592,798 | | | | 4,830,390 | |
| | 118,000 | | | Telekom Austria AG | | | 2,067,912 | | | | 1,410,838 | |
| | 62,000 | | | Telenor ASA | | | 964,417 | | | | 1,016,946 | |
| | 483,000 | | | TeliaSonera AB | | | 1,560,870 | | | | 3,282,439 | |
| | 243,000 | | | VimpelCom Ltd., ADR | | | 588,245 | | | | 2,301,210 | |
| | | | | | | | | | | | |
| | | | | | | 22,955,587 | | | | 24,286,735 | |
| | | | | | | | | | | | |
| | | |
| | | | Japan — 0.9% | | | | | | | | |
| | 17,000 | | | Nippon Telegraph & Telephone Corp. | | | 777,883 | | | | 869,105 | |
| | 12,000 | | | Nippon Telegraph & Telephone Corp., ADR | | | 248,769 | | | | 303,960 | |
| | | | | | | | | | | | |
| | | | | | | 1,026,652 | | | | 1,173,065 | |
| | | | | | | | | | | | |
| | | |
| | | | Latin America — 3.7% | | | | | | | | |
| | 26,000 | | | Brasil Telecom SA | | | 244,222 | | | | 162,949 | |
| | 16,034 | | | Brasil Telecom SA, ADR | | | 480,681 | | | | 285,245 | |
| | 6,490 | | | Brasil Telecom SA, Cl. C, ADR | | | 103,757 | | | | 40,238 | |
| | 44 | | | Brasil Telecom SA, Preference | | | 474 | | | | 257 | |
| | 37,415,054 | | | Cable & Wireless Jamaica
Ltd.† (e) | | | 499,070 | | | | 86,936 | |
| | 500 | | | Maxcom Telecomunicaciones SAB de CV, ADR† | | | 1,832 | | | | 875 | |
| | 13,500 | | | Tele Norte Leste Participacoes SA | | | 286,958 | | | | 155,320 | |
| | 20,193 | | | Tele Norte Leste Participacoes SA, ADR | | | 280,811 | | | | 192,035 | |
| | 148,000 | | | Telecom Argentina SA, ADR | | | 507,854 | | | | 2,646,240 | |
| | 18,270 | | | Telefonica Brasil SA | | | 359,468 | | | | 468,100 | |
| | 12,266 | | | Telefonica Brasil SA, ADR | | | 334,573 | | | | 335,230 | |
| | 5,046 | | | Telefonica Brasil SA, Preference | | | 158,523 | | | | 140,403 | |
| | 6,361 | | | Telefonica SA | | | 108,406 | | | | 110,195 | |
| | 3,355 | | | Telemar Norte Leste SA, Preference, Cl. A | | | 148,531 | | | | 80,545 | |
| | | | | | | | | | | | |
| | | | | | | 3,515,160 | | | | 4,704,568 | |
| | | | | | | | | | | | |
| | | |
| | | | North America — 16.8% | | | | | | | | |
| | 8,000 | | | AboveNet Inc.† | | | 402,362 | | | | 520,080 | |
| | 111,000 | | | AT&T Inc. | | | 3,569,123 | | | | 3,356,640 | |
| | 30,000 | | | Atlantic Tele-Network Inc. | | | 99,861 | | | | 1,171,500 | |
See accompanying notes to financial statements.
5
The GAMCO Global Telecommunications Fund
Schedule of Investments (Continued) — December 31, 2011
| | | | | | | | | | | | |
Shares | | | | | Cost | | | Market
Value | |
| | | | | | | | | | | | |
| |
| | | | COMMON STOCKS (Continued) | |
| | | | DIVERSIFIED TELECOMMUNICATIONS SERVICES (Continued) | |
| | | | North America (Continued) | |
| | 3,000 | | | Bell Aliant Inc. (a) | | $ | 82,912 | | | $ | 84,191 | |
| | 29,000 | | | CenturyLink Inc. | | | 838,808 | | | | 1,078,800 | |
| | 760,000 | | | Cincinnati Bell Inc.† | | | 3,597,719 | | | | 2,302,800 | |
| | 2,989 | | | Consolidated Communications Holdings Inc. | | | 56,970 | | | | 56,940 | |
| | 10,000 | | | E.Spire Communications
Inc.† (c) | | | 50,000 | | | | 0 | |
| | 25,000 | | | EarthLink Inc. | | | 215,154 | | | | 161,000 | |
| | 4,000 | | | Equinix Inc.† | | | 319,373 | | | | 405,600 | |
| | 54,000 | | | General Communication Inc.,
Cl. A† | | | 243,330 | | | | 528,660 | |
| | 50,000 | | | Internap Network Services Corp.† | | | 279,653 | | | | 297,000 | |
| | 7,000 | | | Manitoba Telecom Services Inc. | | | 257,638 | | | | 203,867 | |
| | 22,422 | | | McLeodUSA Inc., Cl. A† (c) | | | 78,420 | | | | 110 | |
| | 130,000 | | | McLeodUSA Inc., Cl. A,
Escrow† (c) | | | 0 | | | | 0 | |
| | 27,600 | | | New ULM Telecom Inc. | | | 335,020 | | | | 193,200 | |
| | 20,000 | | | NorthPoint Communications Group Inc.† | | | 11,250 | | | | 6 | |
| | 33,000 | | | Shenandoah Telecommunications Co. | | | 138,825 | | | | 345,840 | |
| | 34,500 | | | TELUS Corp. | | | 656,234 | | | | 1,951,980 | |
| | 23,000 | | | TELUS Corp., Non-Voting | | | 573,944 | | | | 1,233,590 | |
| | 96,000 | | | tw telecom inc.† | | | 1,876,719 | | | | 1,860,480 | |
| | 127,000 | | | Verizon Communications Inc. | | | 4,217,799 | | | | 5,095,240 | |
| | 36,000 | | | Windstream Corp. | | | 456,696 | | | | 422,640 | |
| | | | | | | | | | | | |
| | | | | | | 18,357,810 | | | | 21,270,164 | |
| | | | | | | | | | | | |
| | | | TOTAL DIVERSIFIED TELECOMMUNICATIONS SERVICES | | | 50,562,354 | | | | 58,517,268 | |
| | | | | | | | | | | | |
| |
| | | | WIRELESS TELECOMMUNICATIONS SERVICES — 33.2% | |
| | | | Africa/Middle East — 0.8% | | | | | |
| | 4,000 | | | Econet Wireless Zimbabwe Ltd. | | | 20,147 | | | | 16,000 | |
| | 21,000 | | | MTN Group Ltd. | | | 328,298 | | | | 373,900 | |
| | 222,440 | | | Orascom Telecom Holding SAE,
GDR† (d) | | | 1,735,223 | | | | 642,852 | |
| | | | | | | | | | | | |
| | | | | | | 2,083,668 | | | | 1,032,752 | |
| | | | | | | | | | | | |
| | | |
| | | | Asia/Pacific — 4.1% | | | | | | | | |
| | 263,000 | | | Axiata Group Berhad | | | 673,179 | | | | 426,442 | |
| | 51,000 | | | China Mobile Ltd., ADR | | | 609,791 | | | | 2,472,990 | |
| | 57,200 | | | China Unicom Hong Kong Ltd., ADR | | | 399,025 | | | | 1,208,636 | |
| | 666 | | | Hutchison Telecommunications Hong Kong Holdings Ltd. | | | 63 | | | | 256 | |
| | | | | | | | | | | | |
Shares | | | | | Cost | | | Market
Value | |
| | | | | | | | | | | | |
| | 4,800 | | | PT Indosat Tbk, ADR | | $ | 38,553 | | | $ | 151,440 | |
| | 66,500 | | | SK Telecom Co. Ltd., ADR | | | 936,413 | | | | 905,065 | |
| | 200,000 | | | Time dotCom Berhad† | | | 82,477 | | | | 45,741 | |
| | | | | | | | | | | | |
| | | | | | | 2,739,501 | | | | 5,210,570 | |
| | | | | | | | | | | | |
| | | |
| | | | Europe — 7.7% | | | | | | | | |
| | 31,000 | | | Bouygues SA | | | 877,795 | | | | 976,762 | |
| | 309,000 | | | Cable & Wireless
Communications plc | | | 184,030 | | | | 183,312 | |
| | 30,300 | | | Millicom International Cellular SA, SDR | | | 2,275,779 | | | | 3,035,702 | |
| | 13,000 | | | Mobile TeleSystems OJSC, ADR | | | 216,127 | | | | 190,840 | |
| | 107,000 | | | Turkcell Iletisim Hizmetleri A/S, ADR† | | | 2,212,088 | | | | 1,258,320 | |
| | 101,000 | | | Vivendi SA | | | 2,751,894 | | | | 2,211,765 | |
| | 65,000 | | | Vodafone Group plc, ADR | | | 1,732,724 | | | | 1,821,950 | |
| | | | | | | | | | | | |
| | | | | | | 10,250,437 | | | | 9,678,651 | |
| | | | | | | | | | | | |
| | | |
| | | | Japan — 3.3% | | | | | | | | |
| | 375 | | | KDDI Corp. | | | 1,622,570 | | | | 2,411,654 | |
| | 985 | | | NTT DoCoMo Inc. | | | 1,646,543 | | | | 1,810,803 | |
| | | | | | | | | | | | |
| | | | | | | 3,269,113 | | | | 4,222,457 | |
| | | | | | | | | | | | |
| | | |
| | | | Latin America — 5.5% | | | | | | | | |
| | 201,700 | | | America Movil SAB de CV, Cl. L, ADR | | | 741,329 | | | | 4,558,420 | |
| | 17,500 | | | Grupo Iusacell SA de CV† (c) | | | 29,040 | | | | 0 | |
| | 49,000 | | | NII Holdings Inc.† | | | 1,731,496 | | | | 1,043,700 | |
| | 150,000 | | | Tim Participacoes SA | | | 616,034 | | | | 743,064 | |
| | 23,536 | | | Tim Participacoes SA, ADR | | | 493,999 | | | | 607,229 | |
| | | | | | | | | | | | |
| | | | | | | 3,611,898 | | | | 6,952,413 | |
| | | | | | | | | | | | |
| | | |
| | | | North America — 11.8% | | | | | | | | |
| | 113,000 | | | Clearwire Corp., Cl. A† | | | 481,058 | | | | 219,220 | |
| | 1,200 | | | Leap Wireless International Inc.† | | | 22,015 | | | | 11,148 | |
| | 44,500 | | | MetroPCS Communications Inc.† | | | 510,450 | | | | 386,260 | |
| | 300 | | | Nextwave Wireless Inc.† | | | 115 | | | | 24 | |
| | 107,000 | | | Rogers Communications
Inc., Cl. B | | | 353,135 | | | | 4,120,570 | |
| | 650,000 | | | Sprint Nextel Corp.† | | | 5,097,433 | | | | 1,521,000 | |
| | 80,000 | | | Telephone & Data Systems Inc. | | | 2,061,826 | | | | 2,071,200 | |
| | 59,100 | | | Telephone & Data Systems Inc., Special | | | 1,257,811 | | | | 1,407,171 | |
| | 119,200 | | | United States Cellular Corp.† | | | 5,679,368 | | | | 5,200,696 | |
| | | | | | | | | | | | |
| | | | | | | 15,463,211 | | | | 14,937,289 | |
| | | | | | | | | | | | |
| | | | TOTAL WIRELESS TELECOMMUNICATIONS SERVICES | | | 37,417,828 | | | | 42,034,132 | |
| | | | | | | | | | | | |
| | | |
| | | | OTHER — 19.9% | | | | | | | | |
| | | | Africa/Middle East — 0.0% | | | | | | | | |
| | 1,009 | | | Kingdom Financial Holdings
Ltd., Cl. L† (c) | | | 0 | | | | 0 | |
See accompanying notes to financial statements.
6
The GAMCO Global Telecommunications Fund
Schedule of Investments (Continued) — December 31, 2011
| | | | | | | | | | | | |
Shares | | | | | Cost | | | Market
Value | |
| | | | | | | | | | | | |
| |
| | | | COMMON STOCKS (Continued) | |
| | | | OTHER (Continued) | | | | | | | | |
| | | | Africa/Middle East (Continued) | | | | | | | | |
| | 504 | | | Meikles Ltd.† | | $ | 204 | | | $ | 82 | |
| | | | | | | | | | | | |
| | | | | | | 204 | | | | 82 | |
| | | | | | | | | | | | |
| | | |
| | | | Asia/Pacific — 0.5% | | | | | | | | |
| | 19,065 | | | Austar United Communications Ltd.† | | | 34,838 | | | | 23,302 | |
| | 70,000 | | | C.P. Pokphand Co., ADR | | | 58,725 | | | | 208,600 | |
| | 26,000 | | | Himachal Futuristic Communications,
GDR† (a)(c) | | | 141,200 | | | | 19,475 | |
| | 4,000(f) | | | Hutchison Port Holdings Trust | | | 4,040 | | | | 2,480 | |
| | 40,000 | | | Hutchison Whampoa Ltd. | | | 396,391 | | | | 335,024 | |
| | 250,000 | | | Time Engineering Berhad | | | 105,104 | | | | 20,899 | |
| | | | | | | | | | | | |
| | | | | | | 740,298 | | | | 609,780 | |
| | | | | | | | | | | | |
| | | |
| | | | Europe — 2.7% | | | | | | | | |
| | 12,000 | | | BCB Holdings Ltd.† | | | 22,433 | | | | 5,032 | |
| | 9,000 | | | British Sky Broadcasting
Group plc | | | 101,392 | | | | 102,381 | |
| | 1,000 | | | British Sky Broadcasting Group plc, ADR | | | 24,267 | | | | 45,290 | |
| | 9,000 | | | E.ON AG | | | 126,255 | | | | 194,176 | |
| | 56,000 | | | G4S plc | | | 0 | | | | 236,377 | |
| | 96,000 | | | GN Store Nord A/S | | | 526,185 | | | | 808,678 | |
| | 20,000 | | | InterXion Holding NV† | | | 257,684 | | | | 269,000 | |
| | 4,300 | | | Kinnevik Investment
AB, Cl. A | | | 79,047 | | | | 83,350 | |
| | 51,500 | | | Kinnevik Investment
AB, Cl. B | | | 1,013,170 | | | | 1,003,502 | |
| | 14,000 | | | Nokia OYJ, ADR | | | 33,545 | | | | 67,480 | |
| | 16,082 | | | PostNL NV, ADR | | | 215,949 | | | | 50,980 | |
| | 900 | | | Shellshock Ltd.† | | | 521 | | | | 545 | |
| | 21,000 | | | Telegraaf Media Groep NV | | | 453,308 | | | | 270,433 | |
| | 5,000 | | | ThyssenKrupp AG | | | 91,947 | | | | 114,703 | |
| | 16,181 | | | TNT Express NV, ADR | | | 892 | | | | 119,092 | |
| | 12,000 | | | Waterloo Investment Holdings
Ltd.† (c) | | | 1,432 | | | | 745 | |
| | 4,000 | | | Zon Multimedia Servicos de Telecomunicacoes e Multimedia SGPS SA | | | 39,320 | | | | 12,021 | |
| | 8,000 | | | Zon Multimedia Servicos de Telecomunicacoes e Multimedia SGPS SA, ADR | | | 114,800 | | | | 23,680 | |
| | | | | | | | | | | | |
| | | | | | | 3,102,147 | | | | 3,407,465 | |
| | | | | | | | | | | | |
| | | |
| | | | Japan — 0.3% | | | | | | | | |
| | 72,000 | | | Furukawa Electric Co. Ltd. | | | 350,157 | | | | 165,571 | |
| | 21,000 | | | Tokyo Broadcasting System Holdings Inc. | | | 479,469 | | | | 270,105 | |
| | | | | | | | | | | | |
| | | | | | | 829,626 | | | | 435,676 | |
| | | | | | | | | | | | |
| | | | | | | | | | | | |
Shares | | | | | Cost | | | Market
Value | |
| | | | | | | | | | | | |
| | | |
| | | | Latin America — 0.3% | | | | | | | | |
| | 25,693 | | | Contax Participacoes SA, ADR | | $ | 11,050 | | | $ | 51,900 | |
| | 15,000 | | | Grupo Televisa SA, ADR | | | 353,331 | | | | 315,900 | |
| | 1,224 | | | Shellproof Ltd.† | | | 1,210 | | | | 808 | |
| | | | | | | | | | | | |
| | | | | | | 365,591 | | | | 368,608 | |
| | | | | | | | | | | | |
| | | |
| | | | North America — 16.1% | | | | | | | | |
| | 80,000 | | | Adelphia Communications Corp.,
Cl. A† (c) | | | 66,496 | | | | 0 | |
| | 80,000 | | | Adelphia Communications Corp., Cl. A, Escrow† (c) | | | 0 | | | | 0 | |
| | 80,000 | | | Adelphia Recovery Trust† | | | 0 | | | | 400 | |
| | 28,250 | | | AMC Networks Inc., Cl. A† | | | 635,459 | | | | 1,061,635 | |
| | 1,400 | | | Amphenol Corp., Cl. A | | | 5,729 | | | | 63,546 | |
| | 2,100 | | | Ascent Capital Group
Inc., Cl. A† | | | 27,089 | | | | 106,512 | |
| | 112,000 | | | Cablevision Systems
Corp., Cl. A | | | 1,657,660 | | | | 1,592,640 | |
| | 11,434 | | | CanWest Global Communications Corp., Cl. A, Canada† (c) | | | 131,317 | | | | 495 | |
| | 23,566 | | | CanWest Global Communications Corp., Cl. A, United States† (c) | | | 322,321 | | | | 1,060 | |
| | 7,400 | | | Cogeco Inc. | | | 144,351 | | | | 351,495 | |
| | 15,000 | | | Comcast Corp., Cl. A, Special | | | 304,294 | | | | 353,400 | |
| | 4,000 | | | Convergys Corp.† | | | 53,716 | | | | 51,080 | |
| | 113,000 | | | DIRECTV, Cl. A† | | | 2,905,004 | | | | 4,831,880 | |
| | 5,000 | | | Discovery Communications
Inc., Cl. C† | | | 41,011 | | | | 188,500 | |
| | 107,000 | | | DISH Network Corp., Cl. A | | | 1,829,599 | | | | 3,047,360 | |
| | 14,400 | | | EchoStar Corp., Cl. A† | | | 319,212 | | | | 301,536 | |
| | 6,000 | | | Fisher Communications Inc.† | | | 183,823 | | | | 172,980 | |
| | 400 | | | Google Inc., Cl. A† | | | 149,671 | | | | 258,360 | |
| | 30,800 | | | Liberty Global Inc., Cl. A† | | | 604,638 | | | | 1,263,724 | |
| | 49,000 | | | Liberty Global Inc., Cl. C† | | | 1,214,257 | | | | 1,936,480 | |
| | 14,000 | | | Liberty Interactive Corp., Cl. A† | | | 182,051 | | | | 227,010 | |
| | 18,500 | | | Liberty Media Corp. - Liberty Capital,
Cl. A† | | | 157,954 | | | | 1,443,925 | |
| | 45,000 | | | LSI Corp.† | | | 316,203 | | | | 267,750 | |
| | 1,000 | | | NCM Services Inc.† | | | 1,375 | | | | 35 | |
| | 2,000 | | | News Corp., Cl. B | | | 21,050 | | | | 36,360 | |
| | 2,524 | | | Orbital Sciences Corp.† | | | 16,208 | | | | 36,674 | |
| | 24,000 | | | Pendrell Corp.† | | | 37,119 | | | | 61,440 | |
| | 6,000 | | | SCANA Corp. | | | 158,756 | | | | 270,360 | |
| | 4,500 | | | SJW Corp. | | | 70,456 | | | | 106,380 | |
| | 22,000 | | | The Madison Square Garden Co.,
Cl. A† | | | 439,316 | | | | 630,080 | |
| | 4,400 | | | Time Warner Cable Inc. | | | 270,440 | | | | 279,708 | |
| | 14,000 | | | Time Warner Inc. | | | 495,214 | | | | 505,960 | |
| | 1,200 | | | TiVo Inc.† | | | 9,684 | | | | 10,764 | |
| | 47 | | | Xanadoo Co., Cl. A† | | | 23,394 | | | | 12,220 | |
See accompanying notes to financial statements.
7
The GAMCO Global Telecommunications Fund
Schedule of Investments (Continued) — December 31, 2011
| | | | | | | | | | | | |
Shares | | | | | Cost | | | Market
Value | |
| | | | | | | | | | | | |
| |
| | | | COMMON STOCKS (Continued) | |
| | | | OTHER (Continued) | | | | | | | | |
| | | | North America (Continued) | | | | | | | | |
| | 57,000 | | | Yahoo! Inc.† | | $ | 1,343,217 | | | $ | 919,410 | |
| | | | | | | | | | | | |
| | | | | | | 14,138,084 | | | | 20,391,159 | |
| | | | | | | | | | | | |
| | | | TOTAL OTHER | | | 19,175,950 | | | | 25,212,770 | |
| | | | | | | | | | | | |
| | | | TOTAL COMMON STOCKS | | | 107,156,132 | | | | 125,764,170 | |
| | | | | | | | | | | | |
| | | |
| | | | RIGHTS — 0.0% | | | | | | | | |
| | | | DIVERSIFIED TELECOMMUNICATIONS SERVICES — 0.0% | |
| | | | Asia/Pacific — 0.0% | | | | | | | | |
| | 2,571 | | | PCCW Ltd., expire 10/04/12† (c) | | | 0 | | | | 0 | |
| | | | | | | | | | | | |
| | | |
| | | | WARRANTS — 0.8% | | | | | | | | |
| | | | WIRELESS TELECOMMUNICATIONS SERVICES — 0.8% | |
| | | | Asia/Pacific — 0.8% | | | | | | | | |
| | 160,000 | | | Bharti Airtel Ltd., expire
09/19/13† (a)(c) | | | 1,019,856 | | | | 1,035,711 | |
| | | | | | | | | | | | |
| | | | TOTAL INVESTMENTS — 100.1% | | $ | 108,175,988 | | | | 126,799,881 | |
| | | | | | | | | | | | |
| | | | Other Assets and Liabilities (Net) — (0.1)% | | | | (122,410 | ) |
| | | | | | | | | | | | |
| | | | NET ASSETS — 100.0% | | | | | | $ | 126,677,471 | |
| | | | | | | | | | | | |
| (a) | Security exempt from registration under Rule 144A of the Securities Act of 1933, as amended. These securities may be resold in transactions exempt from registration, normally to qualified institutional buyers. At December 31, 2011, the market value of Rule 144A securities amounted to $1,162,715 or 0.92% of net assets. |
| (c) | Security fair valued under procedures established by the Board of Directors. The procedures may include reviewing available financial information about the company and reviewing the valuation of comparable securities and other factors on a regular basis. At December 31, 2011, the market value of fair valued securities amounted to $1,057,822 or 0.84%of net assets. |
| (d) | Security purchased pursuant to Regulation S under the Securities Act of 1933, which exempts from registration securities offered and sold outside of the United States. Such securities cannot be sold in the United States without either an effective registration statement filed pursuant to the Securities Act of 1933, or pursuant to an exemption from registration. At December 31, 2011, the market value of Regulation S securities amounted to $2,064,978 or 1.63% of net assets, which was valued under methods approved by the Board of Directors as follows: |
| | | | | | | | | | | | | | | | |
Acquisition
Shares | | | Issuer | | Acquisition
Date | | | Acquisition
Cost | | | 12/31/11
Carrying
Value
Per Unit | |
| | 222,440 | | | Orascom Telecom Holding SAE, GDR | | | 06/22/07 | | | $ | 1,735,223 | | | $ | 2.8900 | |
| | 84,600 | | | Sistema JSFC, GDR | | | 02/09/05 | | | | 1,650,891 | | | | 16.8100 | |
| (e) | At December 31, 2011, the Fund held an investment in a restricted security amounting to $86,936 or 0.07% of net assets, which was valued under methods approved by the Board of Directors as follows: |
| | | | | | | | | | | | | | | | |
Acquisition
Shares | | | Issuer | | Acquisition
Date | | | Acquisition
Cost | | | 12/31/11
Carrying
Value
Per Unit | |
| | 37,415,054 | | | Cable & Wireless Jamaica Ltd. | | | 03/10/94 | | | $ | 499,070 | | | $ | 0.0023 | |
| † | Non-income producing security. |
| ADR | American Depositary Receipt |
| GDR | Global Depositary Receipt |
| JSFC | Joint Stock Financial Corporation |
| OJSC | Open Joint Stock Company |
| SDR | Swedish Depositary Receipt |
| | | | | | | | |
|
| | |
Geographic Diversification | | % of
Market
Value | | | Market
Value | |
North America | | | 44.6 | % | | $ | 56,598,612 | |
Europe | | | 29.5 | | | | 37,372,851 | |
Asia/Pacific | | | 10.5 | | | | 13,280,997 | |
Latin America | | | 9.5 | | | | 12,025,589 | |
Japan | | | 4.6 | | | | 5,831,198 | |
Africa/Middle East | | | 1.3 | | | | 1,690,634 | |
| | | | | | | | |
| | | 100.0 | % | | $ | 126,799,881 | |
| | | | | | | | |
See accompanying notes to financial statements.
8
The GAMCO Global Telecommunications Fund
Statement of Assets and Liabilities
December 31, 2011
| | | | |
Assets: | | | | |
Investments, at value (cost $108,175,988) | | $ | 126,799,881 | |
Foreign currency, at value (cost $24) | | | 24 | |
Receivable for investments sold | | | 2,583,687 | |
Receivable for Fund shares sold | | | 12,666 | |
Dividends receivable | | | 340,846 | |
Prepaid expense | | | 31,147 | |
| | | | |
Total Assets | | | 129,768,251 | |
| | | | |
Liabilities: | | | | |
Payable to custodian | | | 199 | |
Payable for Fund shares redeemed | | | 127,314 | |
Payable for investment advisory fees | | | 109,342 | |
Payable for distribution fees | | | 27,790 | |
Payable for accounting fees | | | 3,750 | |
Line of credit payable | | | 2,713,000 | |
Other accrued expenses | | | 109,385 | |
| | | | |
Total Liabilities | | | 3,090,780 | |
| | | | |
Net Assets (applicable to 6,812,351 shares outstanding) | | $ | 126,677,471 | |
| | | | |
Net Assets Consist of: | | | | |
Paid-in capital | | $ | 118,717,287 | |
Accumulated distributions in excess of net investment income | | | (247,516 | ) |
Accumulated net realized loss on investments and foreign currency transactions | | | (10,418,971 | ) |
Net unrealized appreciation on investments | | | 18,623,893 | |
Net unrealized appreciation on foreign currency translations | | | 2,778 | |
| | | | |
Net Assets | | $ | 126,677,471 | |
| | | | |
Shares of Capital Stock, each at $0.001 par value: | |
Class AAA: | | | | |
Net Asset Value, offering, and redemption price per share ($123,918,804 ÷ 6,662,677 shares outstanding; 75,000,000 shares authorized) | | | $18.60 | |
| | | | |
Class A: | | | | |
Net Asset Value and redemption price per share ($1,373,764 ÷ 73,889 shares outstanding; 50,000,000 shares authorized) | | | $18.59 | |
| | | | |
Maximum offering price per share (NAV ÷ 0.9425, based on maximum sales charge of 5.75% of the offering price) | | | $19.72 | |
| | | | |
Class B: | | | | |
Net Asset Value and offering price per share ($37,517 ÷ 2,047 shares outstanding; 25,000,000 shares authorized) | | | $18.33 | (a) |
| | | | |
Class C: | | | | |
Net Asset Value and offering price per share ($843,011 ÷ 46,588 shares outstanding; 25,000,000 shares authorized) | | | $18.10 | (a) |
| | | | |
Class I: | | | | |
Net Asset Value, offering, and redemption price per share ($504,375 ÷ 27,150 shares outstanding; 25,000,000 shares authorized) | | | $18.58 | |
| | | | |
| (a) | Redemption price varies based on the length of time held. |
Statement of Operations
For the Year Ended December 31, 2011
| | | | |
Investment Income: | | | | |
Dividends (net of foreign withholding taxes of $519,822) | | $ | 5,382,393 | |
Interest | | | 403 | |
| | | | |
Total Investment Income | | | 5,382,796 | |
| | | | |
Expenses: | | | | |
Investment advisory fees | | | 1,497,276 | |
Distribution fees – Class AAA | | | 366,343 | |
Distribution fees – Class A | | | 4,348 | |
Distribution fees – Class B | | | 557 | |
Distribution fees – Class C | | | 9,159 | |
Shareholder services fees | | | 169,241 | |
Shareholder communications expenses | | | 102,321 | |
Custodian fees | | | 92,126 | |
Accounting fees | | | 45,000 | |
Registration expenses | | | 41,523 | |
Directors’ fees | | | 40,359 | |
Legal and audit fees | | | 17,784 | |
Interest expense | | | 3,281 | |
Miscellaneous expenses | | | 20,786 | |
| | | | |
Total Expenses | | | 2,410,104 | |
| | | | |
Net Investment Income | | | 2,972,692 | |
| | | | |
Net Realized and Unrealized Gain/(Loss) on Investments and Foreign Currency: | | | | |
Net realized gain on investments | | | 9,339,202 | |
Net realized gain on foreign currency transactions | | | 7,183 | |
| | | | |
Net realized gain on investments and foreign currency transactions | | | 9,346,385 | |
| | | | |
Net change in unrealized depreciation: | | | | |
on investments | | | (21,940,739 | ) |
on foreign currency translations | | | (4,631 | ) |
| | | | |
Net change in unrealized appreciation on investments and foreign currency translations | | | (21,945,370 | ) |
| | | | |
Net Realized and Unrealized Gain/(Loss) on Investments and Foreign Currency | | | (12,598,985 | ) |
| | | | |
Net Decrease in Net Assets Resulting from Operations | | $ | (9,626,293 | ) |
| | | | |
See accompanying notes to financial statements.
9
The GAMCO Global Telecommunications Fund
Statement of Changes in Net Assets
| | | | | | | | |
| | | Year Ended
December 31, 2011 | | | Year Ended
December 31, 2010 | |
Operations: | | | | | | | | |
Net investment income | | $ | 2,972,692 | | | $ | 2,696,140 | |
Net realized gain on investments and foreign currency transactions | | | 9,346,385 | | | | 6,651,636 | |
Net change in unrealized appreciation/depreciation on investments and foreign currency translations | | | (21,945,370 | ) | | | 6,763,686 | |
| | | | | | | | |
Net Increase/(Decrease) in Net Assets Resulting from Operations | | | (9,626,293 | ) | | | 16,111,462 | |
| | | | | | | | |
Distributions to Shareholders: | | | | | | | | |
Net investment income | | | | | | | | |
Class AAA | | | (2,913,898 | ) | | | (2,735,566 | ) |
Class A | | | (32,052 | ) | | | (33,548 | ) |
Class B | | | (466 | ) | | | (684 | ) |
Class C | | | (13,892 | ) | | | (11,034 | ) |
Class I | | | (13,295 | ) | | | (8,256 | ) |
| | | | | | | | |
Total Distributions to Shareholders | | | (2,973,603 | ) | | | (2,789,088 | ) |
| | | | | | | | |
Capital Share Transactions: | | | | | | | | |
Class AAA | | | (18,004,284 | ) | | | (14,099,904 | ) |
Class A | | | (424,038 | ) | | | 187,998 | |
Class B | | | (31,328 | ) | | | (33,858 | ) |
Class C | | | 34,360 | | | | 165,685 | |
Class I | | | 146,762 | | | | (22,444 | ) |
| | | | | | | | |
Net Decrease in Net Assets from Capital Share Transactions | | | (18,278,528 | ) | | | (13,802,523 | ) |
| | | | | | | | |
Redemption Fees | | | 1,617 | | | | (131 | ) |
| | | | | | | | |
Net Decrease in Net Assets | | | (30,876,807 | ) | | | (480,280 | ) |
Net Assets: | | | | | | | | |
Beginning of period | | | 157,554,278 | | | | 158,034,558 | |
| | | | | | | | |
End of period (including undistributed net investment income of $0 and $0, respectively) | | $ | 126,677,471 | | | $ | 157,554,278 | |
| | | | | | | | |
See accompanying notes to financial statements.
10
The GAMCO Global Telecommunications Fund
Financial Highlights
Selected data for a share of capital stock outstanding throughout each period:
| | | | | | | | | | | | | | | | | | | | | | | | | | | | | | | | | | | | | | | | | | | | | | | | | | | | | | | | |
| | | | | | Income (Loss)
from Investment Operations | | | Distributions | | | | | | | | | | | | | | | Ratios to Average Net Assets/
Supplemental Data | |
Period Ended
December 31 | | Net Asset
Value,
Beginning
of Period | | | Net
Investment
Income(a) | | | Net
Realized
and
Unrealized
Gain (Loss)
on
Investments | | | Total from
Investment
Operations | | | Net
Investment
Income | | | Return
of
Capital(b) | | | Total
Distributions | | | Redemption
Fees(a)(b) | | | Net Asset
Value,
End of
Period | | | Total
Return† | | | Net Assets
End of Period
(in 000’s) | | | Net
Investment
Income | | | Operating
Expenses(c) | | | Portfolio
Turnover
Rate†† | |
Class AAA | | | | | | | | | | | | | | | | | | | | | | | | | | | | | | | | | | | | | | | | | | | | | | | | | |
2011 | | $ | 20.43 | | | $ | 0.41 | | | $ | (1.79 | ) | | $ | (1.38 | ) | | $ | (0.45 | ) | | | — | | | $ | (0.45 | ) | | $ | 0.00 | | | $ | 18.60 | | | | (6.7 | )% | | $ | 123,919 | | | | 1.99 | % | | | 1.61 | % | | | 5 | % |
2010 | | | 18.71 | | | | 0.34 | | | | 1.75 | | | | 2.09 | | | | (0.37 | ) | | | — | | | | (0.37 | ) | | | (0.00 | ) | | | 20.43 | | | | 11.2 | | | | 154,280 | | | | 1.76 | | | | 1.62 | | | | 6 | |
2009 | | | 15.31 | | | | 0.30 | | | | 3.46 | | | | 3.76 | | | | (0.36 | ) | | $ | 0.00 | | | | (0.36 | ) | | | 0.00 | | | | 18.71 | | | | 24.6 | | | | 155,352 | | | | 1.88 | | | | 1.69 | | | | 4 | |
2008 | | | 26.34 | | | | 0.32 | | | | (11.02 | ) | | | (10.70 | ) | | | (0.33 | ) | | | — | | | | (0.33 | ) | | | 0.00 | | | | 15.31 | | | | (40.6 | ) | | | 139,761 | | | | 1.51 | | | | 1.59 | | | | 3 | |
2007 | | | 22.46 | | | | 0.25 | | | | 3.86 | | | | 4.11 | | | | (0.23 | ) | | | — | | | | (0.23 | ) | | | 0.00 | | | | 26.34 | | | | 18.3 | | | | 307,368 | | | | 0.98 | | | | 1.50 | | | | 11 | |
Class A | | | | | | | | | | | | | | | | | | | | | | | | | | | | | | | | | | | | | | | | | | | | | | | | | |
2011 | | $ | 20.42 | | | $ | 0.45 | | | $ | (1.84 | ) | | $ | (1.39 | ) | | $ | (0.44 | ) | | | — | | | $ | (0.44 | ) | | $ | 0.00 | | | $ | 18.59 | | | | (6.8 | )% | | $ | 1,374 | | | | 2.17 | % | | | 1.61 | % | | | 5 | % |
2010 | | | 18.70 | | | | 0.36 | | | | 1.73 | | | | 2.09 | | | | (0.37 | ) | | | — | | | | (0.37 | ) | | | (0.00 | ) | | | 20.42 | | | | 11.2 | | | | 1,901 | | | | 1.87 | | | | 1.62 | | | | 6 | |
2009 | | | 15.31 | | | | 0.29 | | | | 3.46 | | | | 3.75 | | | | (0.36 | ) | | $ | 0.00 | | | | (0.36 | ) | | | 0.00 | | | | 18.70 | | | | 24.5 | | | | 1,523 | | | | 1.81 | | | | 1.69 | | | | 4 | |
2008 | | | 26.32 | | | | 0.32 | | | | (11.00 | ) | | | (10.68 | ) | | | (0.33 | ) | | | — | | | | (0.33 | ) | | | 0.00 | | | | 15.31 | | | | (40.6 | ) | | | 1,130 | | | | 1.52 | | | | 1.59 | | | | 3 | |
2007 | | | 22.43 | | | | 0.23 | | | | 3.89 | | | | 4.12 | | | | (0.23 | ) | | | — | | | | (0.23 | ) | | | 0.00 | | | | 26.32 | | | | 18.4 | | | | 2,728 | | | | 0.89 | | | | 1.50 | | | | 11 | |
Class B | | | | | | | | | | | | | | | | | | | | | | | | | | | | | | | | | | | | | | | | | | | | | | | | | |
2011 | | $ | 20.05 | | | $ | 0.23 | | | $ | (1.72 | ) | | $ | (1.49 | ) | | $ | (0.23 | ) | | | — | | | $ | (0.23 | ) | | $ | 0.00 | | | $ | 18.33 | | | | (7.4 | )% | | $ | 37 | | | | 1.16 | % | | | 2.36 | % | | | 5 | % |
2010 | | | 18.36 | | | | 0.19 | | | | 1.69 | | | | 1.88 | | | | (0.19 | ) | | | — | | | | (0.19 | ) | | | (0.00 | ) | | | 20.05 | | | | 10.3 | | | | 72 | | | | 1.02 | | | | 2.37 | | | | 6 | |
2009 | | | 15.03 | | | | 0.18 | | | | 3.38 | | | | 3.56 | | | | (0.23 | ) | | $ | 0.00 | | | | (0.23 | ) | | | 0.00 | | | | 18.36 | | | | 23.7 | | | | 99 | | | | 1.13 | | | | 2.44 | | | | 4 | |
2008 | | | 25.67 | | | | 0.20 | | | | (10.74 | ) | | | (10.54 | ) | | | (0.10 | ) | | | — | | | | (0.10 | ) | | | 0.00 | | | | 15.03 | | | | (41.0 | ) | | | 102 | | | | 0.95 | | | | 2.34 | | | | 3 | |
2007 | | | 21.90 | | | | 0.06 | | | | 3.75 | | | | 3.81 | | | | (0.04 | ) | | | — | | | | (0.04 | ) | | | 0.00 | | | | 25.67 | | | | 17.4 | | | | 297 | | | | 0.26 | | | | 2.25 | | | | 11 | |
Class C | | | | | | | | | | | | | | | | | | | | | | | | | | | | | | | | | | | | | | | | | | | | | | | | | |
2011 | | $ | 19.88 | | | $ | 0.25 | | | $ | (1.73 | ) | | $ | (1.48 | ) | | $ | (0.30 | ) | | | — | | | $ | (0.30 | ) | | $ | 0.00 | | | $ | 18.10 | | | | (7.4 | )% | | $ | 843 | | | | 1.27 | % | | | 2.36 | % | | | 5 | % |
2010 | | | 18.25 | | | | 0.19 | | | | 1.69 | | | | 1.88 | | | | (0.25 | ) | | | — | | | | (0.25 | ) | | | (0.00 | ) | | | 19.88 | | | | 10.3 | | | | 890 | | | | 1.04 | | | | 2.37 | | | | 6 | |
2009 | | | 14.96 | | | | 0.17 | | | | 3.36 | | | | 3.53 | | | | (0.24 | ) | | $ | 0.00 | | | | (0.24 | ) | | | 0.00 | | | | 18.25 | | | | 23.6 | | | | 659 | | | | 1.08 | | | | 2.44 | | | | 4 | |
2008 | | | 25.50 | | | | 0.15 | | | | (10.61 | ) | | | (10.46 | ) | | | (0.08 | ) | | | — | | | | (0.08 | ) | | | 0.00 | | | | 14.96 | | | | (41.0 | ) | | | 563 | | | | 0.73 | | | | 2.34 | | | | 3 | |
2007 | | | 21.76 | | | | 0.05 | | | | 3.72 | | | | 3.77 | | | | (0.03 | ) | | | — | | | | (0.03 | ) | | | 0.00 | | | | 25.50 | | | | 17.3 | | | | 2,122 | | | | 0.19 | | | | 2.25 | | | | 11 | |
Class I | | | | | | | | | | | | | | | | | | | | | | | | | | | | | | | | | | | | | | | | | | | | | | | | | |
2011 | | $ | 20.41 | | | $ | 0.44 | | | $ | (1.77 | ) | | $ | (1.33 | ) | | $ | (0.50 | ) | | | — | | | $ | (0.50 | ) | | $ | 0.00 | | | $ | 18.58 | | | | (6.5 | )% | | $ | 504 | | | | 2.17 | % | | | 1.36 | % | | | 5 | % |
2010 | | | 18.70 | | | | 0.39 | | | | 1.74 | | | | 2.13 | | | | (0.42 | ) | | | — | | | | (0.42 | ) | | | (0.00 | ) | | | 20.41 | | | | 11.4 | | | | 411 | | | | 2.06 | | | | 1.37 | | | | 6 | |
2009 | | | 15.30 | | | | 0.35 | | | | 3.45 | | | | 3.80 | | | | (0.40 | ) | | $ | 0.00 | | | | (0.40 | ) | | | 0.00 | | | | 18.70 | | | | 24.8 | | | | 402 | | | | 2.17 | | | | 1.44 | | | | 4 | |
2008(d) | | | 25.53 | | | | 0.35 | | | | (10.19 | ) | | | (9.84 | ) | | | (0.39 | ) | | | — | | | | (0.39 | ) | | | 0.00 | | | | 15.30 | | | | (38.5 | ) | | | 416 | | | | 1.78 | (e) | | | 1.34 | (e) | | | 3 | |
| † | | Total return represents aggregate total return of a hypothetical $1,000 investment at the beginning of the period and sold at the end of the period including reinvestment of distributions and does not reflect applicable sales charges. Total return for a period of less than one year is not annualized. |
| †† | | Effective in 2008, a change in accounting policy was adopted with regard to the calculation of the portfolio turnover rate to include cash proceeds due to mergers. Had this policy been adopted retroactively, the portfolio turnover rate for the year ended December 31, 2007 would have been 25%. |
| (a) | | Per share amounts have been calculated using the average shares outstanding method. |
| (b) | | Amount represents less than $0.005 per share. |
| (c) | | The Fund incurred interest expense during the year ended December 31, 2008. If interest expense had not been incurred, the ratio of operating expenses to average net assets would have been 1.57% (Class AAA and Class A), 2.32% (Class B and Class C), and 1.32% (Class I), respectively. For the years ended December 31, 2011, 2010, 2009, and 2007, the effect of interest expense was minimal. |
| (d) | | From the commencement of offering Class I Shares on January 11, 2008 through December 31, 2008. |
See accompanying notes to financial statements.
11
The GAMCO Global Telecommunications Fund
Notes to Financial Statements
1. Organization. The GAMCO Global Telecommunications Fund, a series of GAMCO Global Series Funds, Inc. (the “Corporation”), was incorporated on July 16, 1993 in Maryland. The Fund is a non-diversified open-end management investment company registered under the Investment Company Act of 1940, as amended (the “1940 Act”), and one of four separately managed portfolios (collectively, the “Portfolios”) of the Corporation. The Fund’s primary objective is capital appreciation. The Fund commenced investment operations on November 1, 1993.
2. Significant Accounting Policies. The Fund’s financial statements are prepared in accordance with U.S. Generally Accepted Accounting Principles (“GAAP”), which may require the use of management estimates and assumptions. Actual results could differ from those estimates. The following is a summary of significant accounting policies followed by the Fund in the preparation of its financial statements.
Security Valuation. Portfolio securities listed or traded on a nationally recognized securities exchange or traded in the U.S. over-the-counter market for which market quotations are readily available are valued at the last quoted sale price or a market’s official closing price as of the close of business on the day the securities are being valued. If there were no sales that day, the security is valued at the average of the closing bid and asked prices or, if there were no asked prices quoted on that day, then the security is valued at the closing bid price on that day. If no bid or asked prices are quoted on such day, the security is valued at the most recently available price or, if the Board of Directors (the “Board”) so determines, by such other method as the Board shall determine in good faith to reflect its fair market value. Portfolio securities traded on more than one national securities exchange or market are valued according to the broadest and most representative market, as determined by Gabelli Funds, LLC (the “Adviser”).
Portfolio securities primarily traded on a foreign market are generally valued at the preceding closing values of such securities on the relevant market, but may be fair valued pursuant to procedures established by the Board if market conditions change significantly after the close of the foreign market, but prior to the close of business on the day the securities are being valued. Debt instruments with remaining maturities of sixty days or less that are not credit impaired are valued at amortized cost, unless the Board determines such amount does not reflect the securities’ fair value, in which case these securities will be fair valued as determined by the Board. Debt instruments having a maturity greater than sixty days for which market quotations are readily available are valued at the average of the latest bid and asked prices. If there were no asked prices quoted on such day, the security is valued using the closing bid price. U.S. government obligations with maturities greater than sixty days are normally valued using a model that incorporates market observable data such as reported sales of similar securities, broker quotes, yields, bids, offers, and reference data. Certain securities are valued principally using dealer quotations.
Securities and assets for which market quotations are not readily available are fair valued as determined by the Board. Fair valuation methodologies and procedures may include, but are not limited to: analysis and review of available financial and non-financial information about the company; comparisons with the valuation and changes in valuation of similar securities, including a comparison of foreign securities with the equivalent U.S. dollar value ADR securities at the close of the U.S. exchange; and evaluation of any other information that could be indicative of the value of the security.
12
The GAMCO Global Telecommunications Fund
Notes to Financial Statements (Continued)
The inputs and valuation techniques used to measure fair value of the Fund’s investments are summarized into three levels as described in the hierarchy below:
| | • | | Level 1 — quoted prices in active markets for identical securities; |
| | • | | Level 2 — other significant observable inputs (including quoted prices for similar securities, interest rates, prepayment speeds, credit risk, etc.); and |
| | • | | Level 3 — significant unobservable inputs (including the Fund’s determinations as to the fair value of investments). |
A financial instrument’s level within the fair value hierarchy is based on the lowest level of any input both individually and in the aggregate that is significant to the fair value measurement. The inputs or methodology used for valuing securities are not necessarily an indication of the risk associated with investing in those securities. The summary of the Fund’s investments in securities by inputs used to value the Fund’s investments as of December 31, 2011 is as follows:
| | | | | | | | | | | | | | | | |
| | | Valuation Inputs | | | | |
| | | Level 1
Quoted Prices | | | Level 2 Other Significant
Observable Inputs | | | Level 3 Significant
Unobservable Inputs | | | Total Market Value
at 12/31/11 | |
INVESTMENTS IN SECURITIES: | | | | | | | | | | | | | | | | |
ASSETS (Market Value): | | | | | | | | | | | | | | | | |
Common Stocks: | | | | | | | | | | | | | | | | |
DIVERSIFIED TELECOMMUNICATIONS SERVICES | | | | | | | | | | | | | | | | |
Asia/Pacific | | $ | 6,265,106 | | | $ | 159,604 | | | $ | 226 | | | $ | 6,424,936 | |
North America | | | 21,270,054 | | | | — | | | | 110 | | | | 21,270,164 | |
Other Regions (a) | | | 30,822,168 | | | | — | | | | — | | | | 30,822,168 | |
WIRELESS TELECOMMUNICATIONS SERVICES | | | | | | | | | | | | | | | | |
Latin America | | | 6,952,413 | | | | — | | | | 0 | | | | 6,952,413 | |
Other Regions (a) | | | 35,081,719 | | | | — | | | | — | | | | 35,081,719 | |
OTHER | | | | | | | | | | | | | | | | |
Africa/Middle East | | | 82 | | | | — | | | | 0 | | | | 82 | |
Asia/Pacific | | | 590,305 | | | | 19,475 | | | | — | | | | 609,780 | |
Europe | | | 3,406,720 | | | | — | | | | 745 | | | | 3,407,465 | |
North America | | | 20,390,664 | | | | 495 | | | | 0 | | | | 20,391,159 | |
Other Regions (a) | | | 804,284 | | | | — | | | | — | | | | 804,284 | |
Total Common Stocks | | | 125,583,515 | | | | 179,574 | | | | 1,081 | | | | 125,764,170 | |
Rights (a) | | | — | | | | — | | | | 0 | | | | 0 | |
Warrants (a) | | | — | | | | 1,035,711 | | | | — | | | | 1,035,711 | |
TOTAL INVESTMENTS IN SECURITIES – ASSETS | | $ | 125,583,515 | | | $ | 1,215,285 | | | $ | 1,081 | | | $ | 126,799,881 | |
| (a) | Please refer to the Schedule of Investments for the regional classifications of these portfolio holdings. |
The Fund did not have significant transfers between Level 1 and Level 2 during the year ended December 31, 2011. The Fund’s policy is to recognize transfers among Levels as of the beginning of the reporting period.
13
The GAMCO Global Telecommunications Fund
Notes to Financial Statements (Continued)
The following table reconciles Level 3 investments for which significant unobservable inputs were used to determine fair value:
| | | | | | | | | | | | | | | | | | | | | | | | | | | | | | | | | | | | | | | | |
| | | Balance
as of
12/31/10 | | | Accrued
discounts/
(premiums) | | | Realized
gain/
(loss) | | | Change in
unrealized
appreciation/
depreciation† | | | Purchases | | | Sales | | | Transfers
into
Level 3 | | | Transfers
out of
Level 3 | | | Balance
as of
12/31/11 | | | Net change
in unrealized
appreciation/
depreciation
during the
period on
Level 3
investments
still held at
12/31/11† | |
INVESTMENTS IN SECURITIES: | | | | | | | | | | | | | | | | | | | | | | | | | | | | | | | | | | | | | | | | |
ASSETS (Market Value): | | | | | | | | | | | | | | | | | | | | | | | | | | | | | | | | | | | | | | | | |
Common Stocks: | | | | | | | | | | | | | | | | | | | | | | | | | | | | | | | | | | | | | | | | |
DIVERSIFIED TELECOMMUNICATIONS SERVICES | | | | | | | | | | | | | | | | | | | | | | | | | | | | | | | | | | | | | | | | |
Asia/Pacific | | $ | — | | | $ | — | | | $ | — | | | $ | (121 | ) | | $ | — | | | $ | — | | | $ | 347 | | | $ | — | | | $ | 226 | | | $ | (121 | ) |
North America | | | 110 | | | | — | | | | — | | | | — | | | | — | | | | — | | | | — | | | | — | | | | 110 | | | | — | |
WIRELESS TELECOMMUNICATIONS SERVICES | | | | | | | | | | | | | | | | | | | | | | | | | | | | | | | | | | | | | | | | |
Latin America | | | 0 | | | | — | | | | — | | | | — | | | | — | | | | — | | | | — | | | | — | | | | 0 | | | | — | |
OTHER | | | | | | | | | | | | | | | | | | | | | | | | | | | | | | | | | | | | | | | | |
Africa/Middle East | | | — | | | | — | | | | — | | | | — | | | | 0 | | | | — | | | | — | | | | — | | | | 0 | | | | — | |
Europe | | | — | | | | — | | | | — | | | | (687 | ) | | | 1,432 | | | | — | | | | — | | | | — | | | | 745 | | | | (687 | ) |
North America | | | 1,582 | | | | — | | | | — | | | | — | | | | — | | | | — | | | | — | | | | (1,582 | ) | | | 0 | | | | | |
Total Common Stocks | | | 1,692 | | | | — | | | | — | | | | (808 | ) | | | 1,432 | | | | — | | | | 347 | | | | (1,582 | ) | | | 1,081 | | | | (808 | ) |
Rights: | | | | | | | | | | | | | | | | | | | | | | | | | | | | | | | | | | | | | | | | |
DIVERSIFIED TELECOMMUNICATIONS SERVICES | | | | | | | | | | | | | | | | | | | | | | | | | | | | | | | | | | | | | | | | |
Asia/Pacific | | | — | | | | — | | | | — | | | | — | | | | 0 | | | | — | | | | — | | | | — | | | | 0 | | | | — | |
TOTAL INVESTMENTS IN SECURITIES | | $ | 1,692 | | | $ | — | | | $ | — | | | $ | (808 | ) | | $ | 1,432 | | | $ | — | | | $ | 347 | | | $ | (1,582 | ) | | $ | 1,081 | | | $ | (808 | ) |
| † | Net change in unrealized appreciation/depreciation on investments is included in the related amounts in the Statement of Operations. |
In May 2011, the Financial Accounting Standards Board issued Accounting Standards Update (“ASU”) No. 2011-04 “Amendments to Achieve Common Fair Value Measurement and Disclosure Requirements in U.S. GAAP and International Financial Reporting Standards (“IFRS”).” ASU 2011-04 includes common requirements for measurement of and disclosure about fair value between U.S. GAAP and IFRS. ASU 2011-04 will require reporting entities to disclose the following information for fair value measurements categorized within Level 3 of the fair value hierarchy: quantitative information about the unobservable inputs used in the fair value measurement, the valuation processes used by the reporting entity, and a narrative description of the sensitivity of the fair value measurement to changes in unobservable inputs and the interrelationships between those unobservable inputs. In addition, ASU 2011-04 will require reporting entities to make disclosures about amounts and reasons for all transfers into and out of Level 1 and Level 2 fair value measurements. The new and revised disclosures are effective for interim and annual reporting periods beginning after December 15, 2011. At this time, management is evaluating the implications of ASU 2011-04 and its impact on the financial statements.
14
The GAMCO Global Telecommunications Fund
Notes to Financial Statements (Continued)
Derivative Financial Instruments.
The Fund may engage in various portfolio investment strategies by investing in a number of derivative financial instruments for the purposes of hedging against changes in the value of its portfolio securities and in the value of securities it intends to purchase or hedging against a specific transaction with respect to either the currency in which the transaction is denominated or another currency. Investing in certain derivative financial instruments, including participation in the options, futures, or swap markets, entails certain execution, liquidity, hedging, tax, and securities, interest, credit, or currency market risks. Losses may arise if the Adviser’s prediction of movements in the direction of the securities, foreign currency, and interest rate markets is inaccurate. Losses may also arise if the counterparty does not perform its duties under a contract, or that, in the event of default, the Fund may be delayed in or prevented from obtaining payments or other contractual remedies owed to it under derivative contracts. The creditworthiness of the counterparties is closely monitored in order to minimize these risks. Participation in derivative transactions involves investment risks, transaction costs, and potential losses to which the Fund would not be subject absent the use of these strategies. The consequences of these risks, transaction costs, and losses may have a negative impact on the Fund’s ability to pay distributions.
The Fund’s derivative contracts held at December 31, 2011, if any, are not accounted for as hedging instruments under GAAP and are disclosed in the Schedule of Investments together with the related counterparty.
Foreign Currency Translations. The books and records of the Fund are maintained in U.S. dollars. Foreign currencies, investments, and other assets and liabilities are translated into U.S. dollars at current exchange rates. Purchases and sales of investment securities, income, and expenses are translated at the exchange rate prevailing on the respective dates of such transactions. Unrealized gains and losses that result from changes in foreign exchange rates and/or changes in market prices of securities have been included in unrealized appreciation/depreciation on investments and foreign currency translations. Net realized foreign currency gains and losses resulting from changes in exchange rates include foreign currency gains and losses between trade date and settlement date on investment securities transactions, foreign currency transactions, and the difference between the amounts of interest and dividends recorded on the books of the Fund and the amounts actually received. The portion of foreign currency gains and losses related to fluctuation in exchange rates between the initial purchase trade date and subsequent sale trade date is included in realized gain/(loss) on investments.
Foreign Securities. The Fund may directly purchase securities of foreign issuers. Investing in securities of foreign issuers involves special risks not typically associated with investing in securities of U.S. issuers. The risks include possible revaluation of currencies, the inability to repatriate funds, less complete financial information about companies, and possible future adverse political and economic developments. Moreover, securities of many foreign issuers and their markets may be less liquid and their prices more volatile than securities of comparable U.S. issuers.
Foreign Taxes. The Fund may be subject to foreign taxes on income, gains on investments, or currency repatriation, a portion of which may be recoverable. The Fund will accrue such taxes and recoveries as applicable, based upon its current interpretation of tax rules and regulations that exist in the markets in which it invests.
15
The GAMCO Global Telecommunications Fund
Notes to Financial Statements (Continued)
Restricted and Illiquid Securities. The Fund may invest up to 15% of its net assets in securities for which the markets are illiquid. Illiquid securities include securities the disposition of which is subject to substantial legal or contractual restrictions. The sale of illiquid securities often requires more time and results in higher brokerage charges or dealer discounts and other selling expenses than does the sale of securities eligible for trading on national securities exchanges or in the over-the-counter markets. Restricted securities may sell at a price lower than similar securities that are not subject to restrictions on resale. Securities freely saleable among qualified institutional investors under special rules adopted by the SEC may be treated as liquid if they satisfy liquidity standards established by the Board. The continued liquidity of such securities is not as well assured as that of publicly traded securities, and accordingly the Board will monitor their liquidity. For the restricted and illiquid securities the Fund held as of December 31, 2011, refer to the Schedule of Investments.
Concentration Risks. The Fund may invest a high percentage of its assets in specific sectors of the market in order to achieve a potentially greater investment return. As a result, the Fund may be more susceptible to economic, political, and regulatory developments in a particular sector of the market, positive or negative, and may experience increased volatility to the Fund’s NAV and a magnified effect in its total return.
Securities Transactions and Investment Income. Securities transactions are accounted for on the trade date with realized gain or loss on investments determined by using the identified cost method. Interest income (including amortization of premium and accretion of discount) is recorded on the accrual basis. Premiums and discounts on debt securities are amortized using the effective yield to maturity method. Dividend income is recorded on the ex-dividend date, except for certain dividends from foreign securities that are recorded as soon after the ex-dividend date as the Fund becomes aware of such dividends.
Determination of Net Asset Value and Calculation of Expenses. Certain administrative expenses are common to, and allocated among, various affiliated funds. Such allocations are made on the basis of each fund’s average net assets or other criteria directly affecting the expenses as determined by the Adviser pursuant to procedures established by the Board.
In calculating the NAV per share of each class, investment income, realized and unrealized gains and losses, redemption fees, and expenses other than class specific expenses are allocated daily to each class of shares based upon the proportion of net assets of each class at the beginning of each day. Distribution expenses are borne solely by the class incurring the expense.
Custodian Fee Credits and Interest Expense. When cash balances are maintained in the custody account, the Fund receives credits which are used to offset custodian fees. The gross expenses paid under the custody arrangement are included in custodian fees in the Statement of Operations with the corresponding expense offset, if any, shown as “Custodian fee credits.” When cash balances are overdrawn, the Fund is charged an overdraft fee equal to 2.00% above the federal funds rate on outstanding balances. This amount, if any, would be included in the Statement of Operations.
Distributions to Shareholders. Distributions to shareholders are recorded on the ex-dividend date. Distributions to shareholders are based on income and capital gains as determined in accordance with federal income tax regulations, which may differ from income and capital gains as determined under GAAP. These differences are primarily due to differing treatments of income and gains on various investment securities and foreign currency
16
The GAMCO Global Telecommunications Fund
Notes to Financial Statements (Continued)
transactions held by the Fund, timing differences, and differing characterizations of distributions made by the Fund. Distributions from net investment income include net realized gains on foreign currency transactions. These book/tax differences are either temporary or permanent in nature. To the extent these differences are permanent, adjustments are made to the appropriate capital accounts in the period when the differences arise. Permanent differences were primarily due to the tax treatment of currency gains and losses, expired capital loss carryforwards, and recharacterization of distributions. These reclassifications have no impact on the NAV of the Fund. For the year ended December 31, 2011, reclassifications were made to decrease accumulated distributions in excess of net investment income by $6,733 and decrease accumulated net realized loss on investments and foreign currency transactions by $2,662,179, with an offsetting adjustment to paid-in capital.
The tax character of distributions paid during the years ended December 31, 2011 and December 31, 2010 was as follows:
| | | | | | | | |
| | | Year Ended
December 31, 2011 | | | Year Ended
December 31, 2010 | |
Distributions paid from: | | | | | | | | |
Ordinary income | | $ | 2,973,603 | | | $ | 2,789,088 | |
| | | | | | | | |
Total distributions paid | | $ | 2,973,603 | | | $ | 2,789,088 | |
| | | | | | | | |
Provision for Income Taxes. The Fund intends to continue to qualify as a regulated investment company under Subchapter M of the Internal Revenue Code of 1986, as amended (the “Code”). It is the policy of the Fund to comply with the requirements of the Code applicable to regulated investment companies and to distribute substantially all of its net investment company taxable income and net capital gains. Therefore, no provision for federal income taxes is required.
As of December 31, 2011, the components of accumulated earnings/losses on a tax basis were as follows:
| | | | |
Accumulated capital loss carryforwards | | $ | (7,871,572 | ) |
Undistributed ordinary income | | | 6,116 | |
Net unrealized appreciation on investments and foreign currency translations | | | 15,825,640 | |
| | | | |
Total | | $ | 7,960,184 | |
| | | | |
At December 31, 2011, the Fund had net capital loss carryforwards for federal income tax purposes which are available to reduce future required distributions of net capital gains to shareholder. Under the Regulated Investment Company Modernization Act of 2010, the Fund will be permitted to carry forward for an unlimited period capital losses incurred in years beginning after December 22, 2010. In addition, these losses must be utilized prior to the losses incurred in pre-enactment taxable years. As a result of the rule, pre-enactment capital loss carryforwards may have an increased likelihood of expiring unused. Additionally, post enactment capital losses that are carried forward will retain their character as either short-term or long-term capital losses rather than being considered all short-term as under previous law.
| | | | |
Capital Loss Carryforward Available through 2012 | | $ | 3,314,655 | |
Capital Loss Carryforward Available through 2016 | | | 250,132 | |
Capital Loss Carryforward Available through 2017 | | | 4,306,785 | |
| | | | |
Total Capital Loss Carryforwards | | $ | 7,871,572 | |
| | | | |
17
The GAMCO Global Telecommunications Fund
Notes to Financial Statements (Continued)
During the year ended December 31, 2011, the Fund utilized capital loss carryforwards of $9,242,174 and $2,667,965 of capital loss carryforwards expired for the Fund.
At December 31, 2011, the temporary difference between book basis and tax basis net unrealized appreciation on investments was primarily due to deferral of losses from wash sales for tax purposes and mark-to-market adjustments on investments in passive foreign investment companies.
The following summarizes the tax cost of investments and the related net unrealized appreciation at December 31, 2011:
| | | | | | | | | | | | | | | | |
| | | Cost | | | Gross
Unrealized
Appreciation | | | Gross
Unrealized
Depreciation | | | Net
Unrealized
Appreciation | |
Investments | | $ | 110,977,019 | | | $ | 38,985,075 | | | $ | (23,162,213 | ) | | $ | 15,822,862 | |
The Fund is required to evaluate tax positions taken or expected to be taken in the course of preparing the Fund’s tax returns to determine whether the tax positions are “more-likely-than-not” of being sustained by the applicable tax authority. Income tax and related interest and penalties would be recognized by the Fund as tax expense in the Statement of Operations if the tax positions were deemed not to meet the more-likely-than-not threshold. For the year ended December 31, 2011, the Fund did not incur any income tax, interest, or penalties. As of December 31, 2011, the Adviser has reviewed all open tax years and concluded that there was no impact to the Fund’s net assets or results of operations. Tax years ended December 31, 2008 through December 31, 2011 remain subject to examination by the Internal Revenue Service and state taxing authorities. On an ongoing basis, the Adviser will monitor the Fund’s tax positions to determine if adjustments to this conclusion are necessary.
3. Investment Advisory Agreement and Other Transactions. The Fund has entered into an investment advisory agreement (the “Advisory Agreement”) with the Adviser which provides that the Fund will pay the Adviser a fee, computed daily and paid monthly, at the annual rate of 1.00% of the value of its average daily net assets. In accordance with the Advisory Agreement, the Adviser provides a continuous investment program for the Fund’s portfolio, oversees the administration of all aspects of the Fund’s business and affairs, and pays the compensation of all Officers and Directors of the Fund who are affiliated persons of the Adviser.
The Corporation pays each Director who is not considered to be an affiliated person an annual retainer of $6,000 plus $1,000 for each Board meeting attended and each Director is reimbursed by the Corporation for any out of pocket expenses incurred in attending meetings. All Board committee members receive $1,000 per meeting attended. The Chairman of the Audit Committee receives an annual fee $3,000, and the Lead Director receives an annual fee of $2,000. A Director may receive a single meeting fee, allocated among the participating funds, for participation in certain meetings held on behalf of multiple funds. Directors who are directors or employees of the Adviser or an affiliated company receive no compensation or expense reimbursement from the Corporation.
4. Distribution Plan. The Fund’s Board has adopted a distribution plan (the “Plan”) for each class of shares, except for Class I Shares, pursuant to Rule 12b-1 under the 1940 Act. G.distributors, LLC serves as successor “Distributor” to Gabelli & Company, Inc. (“Gabelli & Co.”) effective August 1, 2011, both affiliates of the Fund. Under the Class AAA, Class A, Class B, and Class C Share Plans, payments are authorized to the Distributor at annual rates of 0.25%, 0.25%, 1.00%, and 1.00%, respectively, of the average daily net assets of those classes, the annual limitations under each Plan. Such payments are accrued daily and paid monthly.
18
The GAMCO Global Telecommunications Fund
Notes to Financial Statements (Continued)
5. Portfolio Securities. Purchases and sales of securities during the year ended December 31, 2011, other than short-term securities and U.S. Government obligations, aggregated $6,635,382 and $24,549,977, respectively.
6. Transactions with Affiliates. During the year ended December 31, 2011, the Fund paid brokerage commissions on security trades of $14,250 to Gabelli & Co. Additionally, the current and former Distributors informed the Fund that they retained a total of $1,515 from investors representing commissions (sales charges and underwriting fees) on sales and redemptions of Fund shares.
The cost of calculating the Fund’s NAV per share is a Fund expense pursuant to the Advisory Agreement. During the year ended December 31, 2011, the Fund paid or accrued $45,000 to the Adviser in connection with the cost of computing the Fund’s NAV.
7. Line of Credit. The Fund participates in an unsecured line of credit of up to $75,000,000 under which it may borrow up to 10% of its net assets from the custodian for temporary borrowing purposes. Borrowings under this arrangement bear interest at the higher of the sum of the LIBOR rate plus 125 basis points or the sum of the federal funds rate plus 125 basis points at the time of borrowing. This amount, if any, would be included in “interest expense” in the Statement of Operations. At December 31, 2011, borrowings outstanding under the line of credit amounted to $2,713,000.
The average daily amount of borrowings outstanding under the line of credit during the year ended December 31, 2011 was $255,732 with a weighted average interest rate of 1.41%. The maximum amount borrowed at any time during the year ended December 31, 2011 was $2,713,000.
8. Capital Stock. The Fund offers five classes of shares – Class AAA Shares, Class A Shares, Class B Shares, Class C Shares, and Class I Shares. Class AAA Shares are offered without a sales charge only to investors who acquire them directly from the Distributor, through selected broker/dealers, or the transfer agent. Class I Shares are offered without a sales charge, solely to certain institutions, directly through the Distributor, or brokers that have entered into selling agreements specifically with respect to Class I Shares. Class A Shares are subject to a maximum front-end sales charge of 5.75%. Class B Shares are subject to a contingent deferred sales charge (“CDSC”) upon redemption within six years of purchase and automatically convert to Class A Shares approximately eight years after the original purchase. The applicable Class B CDSC is equal to a percentage declining from 5% of the lesser of the NAV per share at the date of the original purchase or at the date of redemption, based on the length of time held. Class C Shares are subject to a 1.00% CDSC for one year after purchase. Class B Shares are available only through exchange of Class B Shares of other funds distributed by the Distributor.
The Fund imposes a redemption fee of 2.00% on all classes of shares that are redeemed or exchanged on or before the seventh day after the date of a purchase. The redemption fee is deducted from the proceeds otherwise payable to the redeeming shareholders and is retained by the Fund as an increase in paid-in capital. The redemption fees retained by the Fund during the years ended December 31, 2011 and December 31, 2010 amounted to $1,617 and ($131), respectively. The redemption fee does not apply to redemptions of shares where (i) the shares were purchased through automatic reinvestment of distributions, (ii) the redemption was initiated by the Fund, (iii) the shares were purchased through programs that collect the redemption fee at the
19
The GAMCO Global Telecommunications Fund
Notes to Financial Statements (Continued)
program level and remit them to the Fund, or (iv) the shares were purchased through programs that the Adviser determines to have appropriate anti-short-term trading policies in place or as to which the Adviser has received assurances that look-through redemption fee procedures or effective anti-short-term trading policies and procedures are in place.
Transactions in shares of capital stock were as follows:
| | | | | | | | | | | | | | | | |
| | | Year Ended
December 31, 2011 | | | Year Ended
December 31, 2010 | |
| | | Shares | | | Amount | | | Shares | | | Amount | |
Class AAA | | | | | | | | | | | | | | | | |
Shares sold | | | 594,920 | | | $ | 12,571,285 | | | | 666,415 | | | $ | 12,512,680 | |
Shares issued upon reinvestment of distributions | | | 150,288 | | | | 2,756,275 | | | | 127,366 | | | | 2,598,261 | |
Shares redeemed | | | (1,635,082 | ) | | | (33,331,844 | ) | | | (1,542,428 | ) | | | (29,210,845 | ) |
| | | | | | | | | | | | | | | | |
Net decrease | | | (889,874 | ) | | $ | (18,004,284 | ) | | | (748,647 | ) | | $ | (14,099,904 | ) |
| | | | | | | | | | | | | | | | |
| | | | |
Class A | | | | | | | | | | | | | | | | |
Shares sold | | | 43,102 | | | $ | 915,987 | | | | 44,347 | | | $ | 832,442 | |
Shares issued upon reinvestment of distributions | | | 1,388 | | | | 25,449 | | | | 1,192 | | | | 24,308 | |
Shares redeemed | | | (63,737 | ) | | | (1,365,474 | ) | | | (33,811 | ) | | | (668,752 | ) |
| | | | | | | | | | | | | | | | |
Net increase/(decrease) | | | (19,247 | ) | | $ | (424,038 | ) | | | 11,728 | | | $ | 187,998 | |
| | | | | | | | | | | | | | | | |
| | | | |
Class B | | | | | | | | | | | | | | | | |
Shares issued upon reinvestment of distributions | | | 8 | | | $ | 141 | | | | 19 | | | $ | 370 | |
Shares redeemed | | | (1,568 | ) | | | (31,469 | ) | | | (1,827 | ) | | | (34,228 | ) |
| | | | | | | | | | | | | | | | |
Net decrease | | | (1,560 | ) | | $ | (31,328 | ) | | | (1,808 | ) | | $ | (33,858 | ) |
| | | | | | | | | | | | | | | | |
| | | | |
Class C | | | | | | | | | | | | | | | | |
Shares sold | | | 9,017 | | | $ | 185,261 | | | | 16,520 | | | $ | 309,349 | |
Shares issued upon reinvestment of distributions | | | 592 | | | | 10,550 | | | | 404 | | | | 8,018 | |
Shares redeemed | | | (7,775 | ) | | | (161,451 | ) | | | (8,298 | ) | | | (151,682 | ) |
| | | | | | | | | | | | | | | | |
Net increase | | | 1,834 | | | $ | 34,360 | | | | 8,626 | | | $ | 165,685 | |
| | | | | | | | | | | | | | | | |
| | | | |
Class I | | | | | | | | | | | | | | | | |
Shares sold | | | 10,809 | | | $ | 224,516 | | | | 8,880 | | | $ | 170,254 | |
Shares issued upon reinvestment of distributions | | | 724 | | | | 13,274 | | | | 405 | | | | 8,238 | |
Shares redeemed | | | (4,520 | ) | | | (91,028 | ) | | | (10,631 | ) | | | (200,936 | ) |
| | | | | | | | | | | | | | | | |
Net increase/(decrease) | | | 7,013 | | | $ | 146,762 | | | | (1,346 | ) | | $ | (22,444 | ) |
| | | | | | | | | | | | | | | | |
9. Indemnifications. The Fund enters into contracts that contain a variety of indemnifications. The Fund’s maximum exposure under these arrangements is unknown. However, the Fund has not had prior claims or losses pursuant to these contracts. Management has reviewed the Fund’s existing contracts and expects the risk of loss to be remote.
20
The GAMCO Global Telecommunications Fund
Notes to Financial Statements (Continued)
10. Other Matters. On April 24, 2008, the Adviser entered into a settlement with the SEC to resolve an inquiry regarding prior frequent trading in shares of the GAMCO Global Growth Fund (the “Global Growth Fund”) by one investor who was banned from the Global Growth Fund in August 2002. Under the terms of the settlement, the Adviser, without admitting or denying the SEC’s findings and allegations, paid $16 million (which included a $5 million civil monetary penalty). On the same day, the SEC filed a civil action in the U.S. District Court for the Southern District of New York against the Executive Vice President and Chief Operating Officer of the Adviser, alleging violations of certain federal securities laws arising from the same matter. The officer, who also is an officer of the Global Growth Fund and other funds in the Gabelli/GAMCO complex, including this Fund, denies the allegations and is continuing in his positions with the Adviser and the funds. The settlement by the Adviser did not have, and the resolution of the action against the officer is not expected to have, a material adverse impact on the Adviser or its ability to fulfill its obligations under the Advisory Agreement.
11. Subsequent Events. Management has evaluated the impact on the Fund of all subsequent events occurring through the date the financial statements were issued and has determined that there were no subsequent events requiring recognition or disclosure in the financial statements.
21
The GAMCO Global Telecommunications Fund
Report of Independent Registered Public Accounting Firm
To the Shareholders and Board of Directors of
GAMCO Global Series Funds, Inc.
We have audited the accompanying statement of assets and liabilities, including the schedule of investments, of The GAMCO Global Telecommunications Fund (the “Fund”), one of the series constituting GAMCO Global Series Funds, Inc., as of December 31, 2011, and the related statement of operations for the year then ended, the statements of changes in net assets for each of the two years in the period then ended, and the financial highlights for each of the periods indicated therein. These financial statements and financial highlights are the responsibility of the Fund’s management. Our responsibility is to express an opinion on these financial statements and financial highlights based on our audits.
We conducted our audits in accordance with the standards of the Public Company Accounting Oversight Board (United States). Those standards require that we plan and perform the audit to obtain reasonable assurance about whether the financial statements and financial highlights are free of material misstatement. We were not engaged to perform an audit of the Fund’s internal control over financial reporting. Our audits included consideration of internal control over financial reporting as a basis for designing audit procedures that are appropriate in the circumstances, but not for the purpose of expressing an opinion on the effectiveness of the Fund’s internal control over financial reporting. Accordingly, we express no such opinion and significant estimates made by management, and evaluating the overall financial statement presentation. Our procedures included confirmation of securities owned as of December 31, 2011, by correspondence with the Fund’s custodian. We believe that our audits provide a reasonable basis for our opinion.
In our opinion, the financial statements and financial highlights referred to above present fairly, in all material respects, the financial position of The GAMCO Global Telecommunications Fund, one of the series constituting GAMCO Global Series Funds, Inc., at December 31, 2011, the results of its operations for the year then ended, the changes in its net assets for each of the two years in the period then ended, and its financial highlights for each of the periods indicated therein, in conformity with U.S. generally accepted accounting principles.

Philadelphia, Pennsylvania
February 27, 2012
22
The GAMCO Global Telecommunications Fund
Board Consideration and Re-Approval of Investment Advisory Agreement (Unaudited)
During the six months ended December 31, 2011, the Board of Directors of the Corporation approved the continuation of the investment advisory agreement with the Adviser for the Fund on the basis of the recommendation by the directors (the “Independent Board Members”) who are not “interested persons” of the Fund. The following paragraphs summarize the material information and factors considered by the Independent Board Members as well as their conclusions relative to such factors.
Nature, Extent, and Quality of Services. The Independent Board Members considered information regarding the Fund’s portfolio managers, the depth of the analyst pool available to the Adviser and the Fund’s portfolio managers, the scope of supervisory, administrative, shareholder, and other services supervised or provided by the Adviser, and the absence of significant service problems reported to the Board. The Independent Board Members noted the experience, length of service, and reputation of the Fund’s portfolio managers.
Investment Performance. The Independent Board Members reviewed the short, medium, and long-term performance of the Fund against a peer group of global telecommunications funds, noting that the Fund’s performance was in the lowest quartile in its peer group for the one and three year periods and was average for the five year period.
Profitability. The Independent Board Members reviewed summary data regarding the profitability of the Fund to the Adviser both with a pro rata administrative charge and with a standalone administrative charge. The Independent Board Members also noted that a substantial portion of the Fund’s portfolio transactions were executed by an affiliated broker of the Adviser and that affiliated brokers received distribution fees and minor amounts of sales commissions.
Economies of Scale. The Independent Board Members discussed the major elements of the Adviser’s cost structure and the relationship of those elements to potential economies of scale and reviewed rudimentary data relating to the impact of 20% growth in the Fund on the Adviser’s profitability.
Sharing of Economies of Scale. The Independent Board Members noted that the investment management fee schedule for the Fund does not take into account any potential economies of scale that may develop.
Service and Cost Comparisons. The Independent Board Members compared the expense ratios of the investment advisory fee, other expenses, and total expenses of the Fund with similar expense ratios of the Lipper peer group of telecommunication funds and noted that the Adviser’s advisory fee includes substantially all administrative services of the Fund as well as investment advisory services of the Adviser. The Independent Board Members noted that the Fund’s expense ratio was above average and the Fund’s size was below average within this group. The Board Members compared the advisory fee with the fees for other funds managed by the Adviser and considered fees charged by an affiliated adviser for general equity institutional accounts and unregistered funds.
Conclusions. The Independent Board Members concluded that the Fund enjoyed highly experienced portfolio management services, good ancillary services, and a performance record that was satisfactory. The Independent Board Members also concluded that the Fund’s expense ratios and the profitability to the Adviser of managing the Fund were reasonable, and that economies of scale were not a significant factor in their thinking at this time. The Independent Board Members did not view the potential profitability of ancillary services as material to their decision. On the basis of the foregoing and without assigning particular weight to any single conclusion, the Independent Board Members determined to recommend continuation of the investment advisory agreement to the full Board.
23
The GAMCO Global Telecommunications Fund
Additional Fund Information (Unaudited)
The business and affairs of the Corporation are managed under the direction of the Corporation’s Board of Directors. Information pertaining to the Directors and officers of the Corporation is set forth below. The Corporation’s Statement of Additional Information includes additional information about the Fund’s Directors and is available without charge, upon request, by calling 800-GABELLI (800-422-3554) or by writing to The GAMCO Global Telecommunications Fund at One Corporate Center, Rye, NY 10580-1422.
| | | | | | | | |
Name, Position(s)
Address1
and Age | | Term of Office
and Length of
Time Served2 | | Number of Funds
in Fund Complex
Overseen by Director | | Principal Occupation(s)
During Past Five Years | | Other Directorships
Held by Director4 |
| | |
INTERESTED DIRECTORS3: | | | | |
Mario J. Gabelli, CFA Director and
Chief Investment Officer Age: 69 | | Since 1993 | | 27 | | Chairman, Chief Executive Officer, and Chief Investment Officer–Value Portfolios of GAMCO Investors, Inc. and Chief Investment Officer–Value Portfolios of Gabelli Funds, LLC, and GAMCO Asset Management Inc.; Director/Trustee or Chief Investment Officer of other registered investment companies in the Gabelli/GAMCO Funds Complex; Chief Executive Officer of GGCP, Inc. | | Director of Morgan Group Holdings, Inc. (holding company); Chairman of the Board and Chief Executive Officer of LICT Corp. (multimedia and communication services company); Director of CIBL, Inc. (broadcasting and wireless communications); Director of RLJ Acquisition Inc. (blank check company) |
John D. Gabelli Director
Age: 67 | | Since 1993 | | 10 | | Senior Vice President of Gabelli & Company, Inc. | | — |
| | |
INDEPENDENT DIRECTORS5: | | | | |
E. Val Cerutti
Director
Age: 72 | | Since 2001 | | 7 | | Chief Executive Officer of Cerutti Consultants, Inc. | | Director of The LGL Group, Inc. (diversified manufacturing) (1990-2009) |
Anthony J. Colavita Director
Age: 76 | | Since 1993 | | 35 | | President of the law firm of Anthony J. Colavita, P.C. | | — |
Arthur V. Ferrara Director
Age: 81 | | Since 2001 | | 8 | | Former Chairman of the Board and Chief Executive Officer of The Guardian Life Insurance Company of America (1992-1995) | | — |
Werner J. Roeder, MD Director
Age: 71 | | Since 1993 | | 22 | | Medical Director of Lawrence Hospital and practicing private physician | | — |
Anthonie C. van Ekris Director
Age: 77 | | Since 1993 | | 20 | | Chairman of BALMAC International, Inc. (commodities and futures trading) | | Director of Aurado Energy Inc. (oil and gas operations) through 2005 |
Salvatore J. Zizza Director
Age: 66 | | Since 2004 | | 29 | | Chairman (since 1978) of Zizza & Company, Ltd. (financial consulting); Chairman (since 2006) of Metropolitan Paper Recycling, Inc. (recycling); Chairman (since 2000) of BAM Inc. (manufacturing); Chairman (since 2009) of E-Corp English (business services) | | Non-Executive Chairman and Director of Harbor BioSciences, Inc. (biotechnology); Vice Chairman and Director of Trans-Lux Corporation (business services); Chairman and Chief Executive Officer of General Employment Enterprises, Inc. (staffing); Director of Bion Environmental Technologies (technology) (2005-2008); Director of Earl Schieb Inc. (automotive painting) through April 2009. |
24
The GAMCO Global Telecommunications Fund
Additional Fund Information (Continued) (Unaudited)
| | | | |
Name, Position(s)
Address1
and Age | | Term of Office
and Length of
Time Served2 | | Principal Occupation(s)
During Past Five Years |
| | |
OFFICERS: | | | | |
Bruce N. Alpert President, Secretary, and Acting Chief Compliance Officer Age: 60 | | Since 2003 Since November 2011 | | Executive Vice President and Chief Operating Officer of Gabelli Funds, LLC since 1988; Officer of all of the registered investment companies in the Gabelli/GAMCO Funds Complex; Director of Teton Advisors, Inc. since 1998; Chairman of Teton Advisors, Inc. 2008-2010; President of Teton Advisors, Inc. 1998-2008; Senior Vice President of GAMCO Investors, Inc. since 2008 |
Agnes Mullady Treasurer Age: 53 | | Since 2006 | | President and Chief Operating Officer of the Open-End Fund Division of Gabelli Funds, LLC since September 2010; Senior Vice President of GAMCO Investors, Inc. since 2009; Vice President of Gabelli Funds, LLC since 2007; Officer of all of the registered investment companies in the Gabelli/GAMCO Funds Complex |
| | 1 | Address: One Corporate Center, Rye, NY 10580-1422, unless otherwise noted. |
| | 2 | Each Director will hold office for an indefinite term until the earliest of (i) the next meeting of shareholders, if any, called for the purpose of considering the election or re-election of such Director and until the election and qualification of his or her successor, if any, elected at such meeting, or (ii) the date a Director resigns or retires, or a Director is removed by the Board of Directors or shareholders, in accordance with the Corporation’s By-Laws and Articles of Incorporation. Each Officer will hold office for an indefinite term until the date he or she resigns or retires or until his or her successor is elected and qualified. |
| | 3 | “Interested person” of the Corporation as defined in the 1940 Act. Messrs. Gabelli are each considered an “interested person” because of their affiliation with Gabelli Funds, LLC which acts as the Corporation’s investment adviser. Mario J. Gabelli and John D. Gabelli are brothers. |
| | 4 | This column includes only directorships of companies required to report to the SEC under the Securities Exchange Act of 1934, as amended, i.e., public companies, or other investment companies registered under the 1940 Act. |
| | 5 | Directors who are not interested persons are considered “Independent” Directors. |
2011 TAX NOTICE TO SHAREHOLDERS (Unaudited)
For the year ended December 31, 2011, the Fund paid to shareholders ordinary income distributions (comprised of net investment income) totaling $0.446, $0.442, $0.229, $0.302, and $0.502 per share for Class AAA, Class A, Class B, Class C, and Class I, respectively. For the year ended December 31, 2011, 30.21% of the ordinary income distribution qualifies for the dividends received deduction available to corporations. The Fund designates 100% of the ordinary income distribution as qualified dividend income pursuant to the Jobs and Growth Tax Relief Reconciliation Act of 2003. The Fund designates 0.01% of the ordinary income distribution as qualified interest income pursuant to the Tax Relief, Unemployment Insurance Reauthorization, and Job Creation Act of 2010. Also for the year 2011, the Fund passed through foreign tax credits of $.081 per share to Class AAA, Class A, Class B, Class C, and Class I.
All designations are based on financial information available as of the date of this annual report and, accordingly, are subject to change. For each item, it is the intention of the Fund to designate the maximum amount permitted under the Internal Revenue Code and the regulations thereunder.
25
Gabelli/GAMCO Funds and Your Personal Privacy
Who are we?
The Gabelli/GAMCO Funds are investment companies registered with the Securities and Exchange Commission under the Investment Company Act of 1940. We are managed by Gabelli Funds, LLC, which is affiliated with GAMCO Investors, Inc. GAMCO Investors, Inc. is a publicly held company that has subsidiaries that provide investment advisory or brokerage services for a variety of clients.
What kind of non-public information do we collect about you if you become a fund shareholder?
If you apply to open an account directly with us, you will be giving us some non-public information about yourself. The non-public information we collect about you is:
| • | | Information you give us on your application form. This could include your name, address, telephone number, social security number, bank account number, and other information. |
| • | | Information about your transactions with us, any transactions with our affiliates, and transactions with the entities we hire to provide services to you. This would include information about the shares that you buy or redeem. If we hire someone else to provide services—like a transfer agent—we will also have information about the transactions that you conduct through them. |
What information do we disclose and to whom do we disclose it?
We do not disclose any non-public personal information about our customers or former customers to anyone other than our affiliates, our service providers who need to know such information, and as otherwise permitted by law. If you want to find out what the law permits, you can read the privacy rules adopted by the Securities and Exchange Commission. They are in volume 17 of the Code of Federal Regulations, Part 248. The Commission often posts information about its regulations on its website, www.sec.gov.
What do we do to protect your personal information?
We restrict access to non-public personal information about you to the people who need to know that information in order to provide services to you or the fund and to ensure that we are complying with the laws governing the securities business. We maintain physical, electronic, and procedural safeguards to keep your personal information confidential.
GABELLI FAMILY OF FUNDS
VALUE
Gabelli Asset Fund
Seeks to invest primarily in a diversified portfolio of common stocks selling at significant discounts to their private market value. The Fund’s primary objective is growth of capital. (Multiclass)
Team Managed
Gabelli Dividend Growth Fund (formerly Gabelli Blue Chip Value Fund)
Seeks to invest at least 80% of its net assets in dividend paying stocks. (Multiclass)
Portfolio Manager: Barbara G. Marcin, CFA
GAMCO Westwood Equity Fund
Seeks to invest primarily in the common stock of well seasoned companies that have recently reported positive earnings surprises and are trading below Westwood’s proprietary growth rate estimates. The Fund’s primary objective is capital appreciation. (Multiclass)
Team Managed
FOCUSED VALUE ��
Gabelli Value Fund
Seeks to invest in securities of companies believed to be undervalued. The Fund’s primary objective is long-term capital appreciation. (Multiclass)
Team Managed
Gabelli Focus Five Fund (formerly Gabelli Woodland Small Cap Value Fund)
Seeks to invest primarily in the common stocks of smaller companies (market capitalizations generally less than $3.0 billion) believed to be undervalued with shareholder oriented management teams that are employing strategies to grow the company’s value. The Fund’s primary objective is capital appreciation. (Multiclass) Team Managed
SMALL CAP
Gabelli Small Cap Growth Fund
Seeks to invest primarily in common stock of smaller companies (market capitalizations at the time of investment of $2 billion or less) believed to have rapid revenue and earnings growth potential. The Fund’s primary objective is capital appreciation. (Multiclass)
Portfolio Manager: Mario J. Gabelli, CFA
GAMCO Westwood SmallCap Equity Fund
Seeks to invest primarily in smaller capitalization equity securities – market caps of $2.5 billion or less. The Fund’s primary objective is long-term capital appreciation. (Multiclass)
Portfolio Manager: Nicholas F. Galluccio
GROWTH
GAMCO Growth Fund
Seeks to invest primarily in large cap stocks believed to have favorable, yet undervalued, prospects for earnings growth. The Fund’s primary objective is capital appreciation. (Multiclass)
Portfolio Manager: Howard F. Ward, CFA
GAMCO International Growth Fund
Seeks to invest in the equity securities of foreign issuers with long-term capital appreciation potential. The Fund offers investors global diversification. (Multiclass)
Portfolio Manager: Caesar Bryan
AGGRESSIVE GROWTH
GAMCO Global Growth Fund
Seeks capital appreciation through a disciplined investment program focusing on the globalization and interactivity of the world’s marketplace. The Fund invests in companies at the forefront of accelerated growth. The Fund’s primary objective is capital appreciation. (Multiclass)
Team Managed
GAMCO Westwood
Mighty MitesSM Fund
Seeks to invest in micro-cap companies that have market capitalizations of $500 million or less. The Fund’s primary objective is long-term capital appreciation. (Multiclass)
Team Managed
EQUITY INCOME
Gabelli Equity Income Fund
Seeks to invest primarily in equity securities with above average market yields. The Fund pays monthly dividends and seeks a high level of total return with an emphasis on income. (Multiclass)
Portfolio Manager: Mario J. Gabelli, CFA
GAMCO Westwood Balanced Fund
Seeks to invest in a balanced and diversified portfolio of stocks and bonds. The Fund’s primary objective is both capital appreciation and current income. (Multiclass) Team Managed
GAMCO Westwood Income Fund
Seeks to provide a high level of current income as well as long-term capital appreciation by investing in income producing equity and fixed income securities. (Multiclass)
Portfolio Manager: Barbara G. Marcin, CFA
SPECIALTY EQUITY
GAMCO Vertumnus Fund
Seeks to invest principally in bonds and preferred stocks which are convertible into common stock of foreign and domestic companies. The Fund’s primary objective is total return through a combination of current income and capital appreciation. (Multiclass)
Portfolio Manager: Mario J. Gabelli, CFA
GAMCO Global Opportunity Fund
Seeks to invest in common stock of companies which have rapid growth in revenues and earnings and potential for above average capital appreciation or are undervalued. The Fund’s primary objective is capital appreciation. (Multiclass) Team Managed
Gabelli SRI Green Fund
Seeks to invest in common and preferred stocks meeting guidelines for social responsibility (avoiding defense contractors and manufacturers of alcohol, abortifacients, gaming, and tobacco products) and sustainability (companies engaged in climate change, energy security and independence, natural resource shortages, organic living, and urbanization). The Fund’s primary objective is capital appreciation. (Multiclass)
Team Managed
SECTOR
GAMCO Global Telecommunications Fund
Seeks to invest in telecommunications companies throughout the world – targeting undervalued companies with strong earnings and cash flow dynamics. The Fund’s primary objective is capital appreciation. (Multiclass) Team Managed
Gabelli Gold Fund (formerly GAMCO Gold Fund)
Seeks to invest in a global portfolio of equity securities of gold mining and related companies. The Fund’s objective is long-term capital appreciation. Investment in gold stocks is considered speculative and is affected by a variety of worldwide economic, financial, and political factors. (Multiclass)
Portfolio Manager: Caesar Bryan
Gabelli Utilities Fund
Seeks to provide a high level of total return through a combination of capital appreciation and current income. (Multiclass)
Portfolio Manager: Mario J. Gabelli, CFA
MERGER AND ARBITRAGE
Gabelli ABC Fund
Seeks to invest in securities with attractive opportunities for appreciation or investment income. The Fund’s primary objective is total return in various market conditions without excessive risk of capital loss. (No-load)
Portfolio Manager: Mario J. Gabelli, CFA
Gabelli Enterprise Mergers and Acquisitions Fund
Seeks to invest in securities believed to be likely acquisition targets within 12–18 months or in arbitrage transactions of publicly announced mergers or other corporate reorganizations. The Fund’s primary objective is capital appreciation. (Multiclass)
Portfolio Manager: Mario J. Gabelli, CFA
CONTRARIAN
GAMCO Mathers Fund
Seeks long-term capital appreciation in various market conditions without excessive risk of capital loss. (No-load)
Portfolio Manager: Henry Van der Eb, CFA
Comstock Capital Value Fund
Seeks capital appreciation and current income. The Fund may use either long or short positions to achieve its objective. (Multiclass)
Portfolio Managers: Charles L. Minter Martin Weiner, CFA
FIXED INCOME
GAMCO Westwood Intermediate Bond Fund
Seeks to invest in a diversified portfolio of bonds with various maturities. The Fund’s primary objective is total return. (Multiclass)
Portfolio Manager: Mark R. Freeman, CFA
CASH MANAGEMENT-MONEY MARKET
Gabelli U.S. Treasury Money Market Fund
Seeks to invest exclusively in short-term U.S. Treasury securities. The Fund’s primary objective is to provide high current income consistent with the preservation of principal and liquidity. (No-load)
Co-Portfolio Managers: Judith A. Raneri
Ronald S. Eaker
An investment in the above Money Market Fund is neither insured nor guaranteed by the Federal Deposit Insurance Corporation or any government agency. Although the Fund seeks to preserve the value of your investment at $1.00 per share, it is possible to lose money by investing in the Fund.
The Funds may invest in foreign securities which involve risks not ordinarily associated with investments in domestic issues, including currency fluctuation, economic, and political risks.
To receive a prospectus, call 800-GABELLI (800-422-3554). Investors should carefully consider the investment objectives, risks, charges, and expenses of a fund before investing. The prospectus contains more information about these and other matters and should be read carefully before investing. Distributed by G.distributors, LLC,
One Corporate Center, Rye, NY 10580.
GAMCO Global Series Funds, Inc.
The GAMCO Global
Telecommunications Fund
One Corporate Center
Rye, New York 10580-1422
800-GABELLI
800-422-3554
fax: 914-921-5118
website: www.gabelli.com
e-mail: info@gabelli.com
Net Asset Value per share available daily by calling
800-GABELLI after 7:00 P.M.
| | |
| Board of Directors |
Mario J. Gabelli, CFA Chairman and Chief Executive Officer GAMCO Investors, Inc. E. Val Cerutti Chief Executive Officer Cerutti Consultants, Inc. Anthony J. Colavita President Anthony J. Colavita, P.C. Arthur V. Ferrara Former Chairman and Chief Executive Officer Guardian Life Insurance Company of America | | John D. Gabelli Senior Vice President Gabelli & Company, Inc. Werner J. Roeder, MD Medical Director Lawrence Hospital Anthonie C. van Ekris Chairman BALMAC International, Inc. Salvatore J. Zizza Chairman Zizza & Co., Ltd. |
|
Officers |
Bruce N. Alpert President, Secretary, and Acting Chief Compliance Officer | | Agnes Mullady Treasurer |
|
Custodian, Transfer Agent, and Dividend Disbursing
Agent |
| State Street Bank and Trust Company |
|
| Distributor |
| G.distributors, LLC |
|
| Legal Counsel |
| Skadden, Arps, Slate, Meagher & Flom LLP |
This report is submitted for the general information of the shareholders of The GAMCO Global Telecommunications Fund. It is not authorized for distribution to prospective investors unless preceded or accompanied by an effective prospectus.
GAB401Q411AR

The
GAMCO
Global
Telecommunications
Fund
ANNUAL REPORT
DECEMBER 31, 2011
Item 2. Code of Ethics.
| | (a) | The registrant, as of the end of the period covered by this report, has adopted a code of ethics that applies to the registrant’s principal executive officer, principal financial officer, principal accounting officer or controller, or persons performing similar functions, regardless of whether these individuals are employed by the registrant or a third party. |
| | (c) | There have been no amendments, during the period covered by this report, to a provision of the code of ethics that applies to the registrant’s principal executive officer, principal financial officer, principal accounting officer or controller, or persons performing similar functions, regardless of whether these individuals are employed by the registrant or a third party, and that relates to any element of the code of ethics description. |
| | (d) | The registrant has not granted any waivers, including an implicit waiver, from a provision of the code of ethics that applies to the registrant’s principal executive officer, principal financial officer, principal accounting officer or controller, or persons performing similar functions, regardless of whether these individuals are employed by the registrant or a third party, that relates to one or more of the items set forth in paragraph (b) of this item’s instructions. |
Item 3. Audit Committee Financial Expert.
As of the end of the period covered by the report, the registrant’s Board of Directors has determined that Salvatore J. Zizza is qualified to serve as an audit committee financial expert serving on its audit committee and that he is “independent,” as defined by Item 3 of Form N-CSR.
Item 4. Principal Accountant Fees and Services.
Audit Fees
| | (a) | The aggregate fees billed for each of the last two fiscal years for professional services rendered by the principal accountant for the audit of the registrant’s annual financial statements or services that are normally provided by the accountant in connection with statutory and regulatory filings or engagements for those fiscal years are $88,000 for 2010 and $88,000 for 2011. |
Audit-Related Fees
| | (b) | The aggregate fees billed in each of the last two fiscal years for assurance and related services by the principal accountant that are reasonably related to the performance of the audit of the registrant’s financial statements and are not reported under paragraph (a) of this Item are $0 for 2010 and $0 for 2011. |
Tax Fees
| | (c) | The aggregate fees billed in each of the last two fiscal years for professional services rendered by the principal accountant for tax compliance, tax advice, and tax planning are $12,400 for 2010 and $12,800 for 2011. Tax fees represent tax compliance services provided in connection with the review of the Registrant’s tax returns. |
All Other Fees
| | (d) | The aggregate fees billed in each of the last two fiscal years for products and services provided by the principal accountant, other than the services reported in paragraphs (a) through (c) of this Item are $0 for 2010 and $0 for 2011. |
| | (e)(1) | Disclose the audit committee’s pre-approval policies and procedures described in paragraph (c)(7) of Rule 2-01 of Regulation S-X. |
Pre-Approval Policies and Procedures. The Audit Committee (“Committee”) of the registrant is responsible for pre-approving (i) all audit and permissible non-audit services to be provided by the independent registered public accounting firm to the registrant and (ii) all permissible non-audit services to be provided by the independent registered public accounting firm to the Adviser, Gabelli Funds, LLC, and any affiliate of Gabelli Funds, LLC (“Gabelli”) that provides services to the registrant (a “Covered Services Provider”) if the independent registered public accounting firm’s engagement related directly to the operations and financial reporting of the registrant. The Committee may delegate its responsibility to pre-approve any such audit and permissible non-audit services to the Chairperson of the Committee, and the Chairperson must report to the Committee, at its next regularly scheduled meeting after the Chairperson’s pre-approval of such services, his or her decision(s). The Committee may also establish detailed pre-approval policies and procedures for pre-approval of such services in accordance with applicable laws, including the delegation of some or all of the Committee’s pre-approval responsibilities to the other persons (other than Gabelli or the registrant’s officers). Pre-approval by the Committee of any permissible non-audit services is not required so long as: (i) the permissible non-audit services were not recognized by the registrant at the time of the engagement to be non-audit services; and (ii) such services are promptly brought to the attention of the Committee and approved by the Committee or Chairperson prior to the completion of the audit.
| | (e)(2) | The percentage of services described in each of paragraphs (b) through (d) of this Item that were approved by the audit committee pursuant to paragraph (c)(7)(i)(C) of Rule 2-01 of Regulation S-X are as follows: |
| | (f) | The percentage of hours expended on the principal accountant’s engagement to audit the registrant’s financial statements for the most recent fiscal year that were attributed to work performed by persons other than the principal accountant’s full-time, permanent employees was 0%. |
| | (g) | The aggregate non-audit fees billed by the registrant’s accountant for services rendered to the registrant, and rendered to the registrant’s investment adviser (not including any sub-adviser whose role is primarily portfolio management and is subcontracted with or overseen by another investment adviser), and any entity controlling, controlled by, or under common control with the adviser that provides ongoing services to the registrant for each of the last two fiscal years of the registrant was $17,400 for 2010 and $59,100 for 2011. |
| | (h) | The registrant’s audit committee of the board of directors has considered whether the provision of non-audit services that were rendered to the registrant’s investment adviser (not including any sub-adviser whose role is primarily portfolio management and is subcontracted with or overseen by another investment adviser), and any entity controlling, controlled by, or under common control with the investment adviser that provides ongoing services to the registrant that were not pre-approved pursuant to paragraph (c)(7)(ii) of Rule 2-01 of Regulation S-X is compatible with maintaining the principal accountant’s independence. |
Item 5. Audit Committee of Listed registrants.
Not applicable.
Item 6. Investments.
| | (a) | Schedule of Investments in securities of unaffiliated issuers as of the close of the reporting period is included as part of the report to shareholders filed under Item 1 of this form. |
Item 7. Disclosure of Proxy Voting Policies and Procedures for Closed-End Management Investment Companies.
Not applicable.
Item 8. Portfolio Managers of Closed-End Management Investment Companies.
Not applicable.
Item 9. Purchases of Equity Securities by Closed-End Management Investment Company and Affiliated Purchasers.
Not applicable.
Item 10. Submission of Matters to a Vote of Security Holders.
There have been no material changes to the procedures by which the shareholders may recommend nominees to the registrant’s Board of Directors, where those changes were implemented after the registrant last provided disclosure in response to the requirements of Item 407(c)(2)(iv) of Regulation S-K (17 CFR 229.407) (as required by Item 22(b)(15) of Schedule 14A (17 CFR 240.14a-101)), or this Item.
Item 11. Controls and Procedures.
| | (a) | The registrant’s principal executive and principal financial officers, or persons performing similar functions, have concluded that the registrant’s disclosure controls and procedures (as defined in Rule 30a-3(c) under the Investment Company Act of 1940, as amended (the “1940 Act”) (17 CFR 270.30a-3(c))) are effective, as of a date within 90 days of the filing date of the report that includes the disclosure required by this paragraph, based on their evaluation of these controls and procedures required by Rule 30a-3(b) under the 1940 Act (17 CFR 270.30a-3(b)) and Rules 13a-15(b) or 15d-15(b) under the Securities Exchange Act of 1934, as amended (17 CFR 240.13a-15(b) or 240.15d-15(b)). |
| | (b) | There were no changes in the registrant’s internal control over financial reporting (as defined in Rule 30a-3(d) under the 1940 Act (17 CFR 270.30a-3(d)) that occurred during the registrant’s second fiscal quarter of the period covered by this report that has materially affected, or is reasonably likely to materially affect, the registrant’s internal control over financial reporting. |
Item 12. Exhibits.
| | (a)(1) | Code of ethics, or any amendment thereto, that is the subject of disclosure required by Item 2 is attached hereto. |
| | (a)(2) | Certifications pursuant to Rule 30a-2(a) under the 1940 Act and Section 302 of the Sarbanes-Oxley Act of 2002 are attached hereto. |
| | (b) | Certifications pursuant to Rule 30a-2(b) under the 1940 Act and Section 906 of the Sarbanes- Oxley Act of 2002 are attached hereto. |
SIGNATURES
Pursuant to the requirements of the Securities Exchange Act of 1934 and the Investment Company Act of 1940, the registrant has duly caused this report to be signed on its behalf by the undersigned, thereunto duly authorized.
| | | | |
| (Registrant) | | GAMCO Global Series Funds, Inc. | | |
| | | | |
| By (Signature and Title)* | | /s/ Bruce N. Alpert | | |
| | Bruce N. Alpert, Principal Executive Officer | | |
Date 3/9/12
Pursuant to the requirements of the Securities Exchange Act of 1934 and the Investment Company Act of 1940, this report has been signed below by the following persons on behalf of the registrant and in the capacities and on the dates indicated.
| | | | |
| By (Signature and Title)* | | /s/ Bruce N. Alpert | | |
| | Bruce N. Alpert, Principal Executive Officer | | |
Date 3/9/12
| | | | |
| By (Signature and Title)* | | /s/ Agnes Mullady | | |
| | Agnes Mullady, Principal Financial Officer and Treasurer | | |
Date 3/9/12
| * | Print the name and title of each signing officer under his or her signature. |