UNITED STATES
SECURITIES AND EXCHANGE COMMISSION
Washington, D.C. 20549
FORM N-CSR
CERTIFIED SHAREHOLDER REPORT OF REGISTERED MANAGEMENT
INVESTMENT COMPANIES
Investment Company Act file number 811-07896
GAMCO Global Series Funds, Inc.
(Exact name of registrant as specified in charter)
One Corporate Center
Rye, New York 10580-1422
(Address of principal executive offices) (Zip code)
Bruce N. Alpert
Gabelli Funds, LLC
One Corporate Center
Rye, New York 10580-1422
(Name and address of agent for service)
Registrant’s telephone number, including area code: 1-800-422-3554
Date of fiscal year end: December 31
Date of reporting period: December 31, 2014
Form N-CSR is to be used by management investment companies to file reports with the Commission not later than 10 days after the transmission to stockholders of any report that is required to be transmitted to stockholders under Rule 30e-1 under the Investment Company Act of 1940 (17 CFR 270.30e-1). The Commission may use the information provided on Form N-CSR in its regulatory, disclosure review, inspection, and policymaking roles.
A registrant is required to disclose the information specified by Form N-CSR, and the Commission will make this information public. A registrant is not required to respond to the collection of information contained in Form N-CSR unless the Form displays a currently valid Office of Management and Budget (“OMB”) control number. Please direct comments concerning the accuracy of the information collection burden estimate and any suggestions for reducing the burden to Secretary, Securities and Exchange Commission, 100 F Street, NE, Washington, DC 20549. The OMB has reviewed this collection of information under the clearance requirements of 44 U.S.C. § 3507.
Item 1. Reports to Stockholders.
The Report to Shareholders is attached herewith.
| | |
The Gabelli Global Rising Income and Dividend Fund Annual Report — December 31, 2014 | | 
Mario J. Gabelli, CFA Portfolio Manager |
To Our Shareholders,
For the year ended December 31, 2014, the net asset value (“NAV”) per Class AAA Share of The Gabelli Global Rising Income and Dividend Fund increased 1.6% compared with increases of 3.7% and 4.9% for the Bank of America Merrill Lynch Global 300 Convertible Index and the Morgan Stanley Capital International (“MSCI”) World Index, respectively. See page 3 for additional performance information.
Enclosed are the financial statements, including the schedule of investments, as of December 31, 2014.
Performance Discussion (Unaudited)
Most of the headline grabbing events of 2014 took place outside the United States, such as the rise of ISIS in the Middle East and the outbreak of Ebola in West Africa. Japan slipped back into recession and China showed signs of slowing growth as its economy makes the transition from investment led growth to more consumption led growth. Every dollar spent on investment in China has a bigger impact on job creation than a dollar spent on consumption. Countries that export commodities to China are seeing their growth slow too. The falling price of crude oil, acting with the sanctions imposed upon Russia, are destroying Russian wealth via lower stock prices, lower ruble prices, and less investment in Russia. The ruble has fallen about 45% relative to the dollar to a new low.
In Europe, the spotlight has been on Mario Draghi, the head of the European Central Bank. Europe’s recovery has lost momentum and talk of looming deflation has returned. Draghi has promised to “do whatever it takes” to sustain the recovery and the euro, implying a change in policy to full scale quantitative easing (QE).
The U.S., too, will benefit from the roughly 50% decline in the price of crude since last June. Every one cent decline in the price of a gallon of gasoline translates into an extra billion dollars of consumer free cash flow, mitigating the effect of stagnated wages. The monthly payroll report for November was the best in years. Growth has accelerated as inflation has declined, signifying a true decoupling from the weakness infiltrating many overseas economies.
Selected holdings that contributed positively to performance in 2014 were Berkshire Hathaway Inc., Cl. A (1.7% of net assets as of December 31, 2014), a diversified company with major interests in GEICO, life insurance, annuity sales, and sales of jewelry; Hillshire Brands Co.(acquired by Tyson Foods on August 29, 2014), which produces, distributes, and markets chicken, beef, pork, prepared foods, and related allied products worldwide; and Sony Corp., ADR (1.2%), which designs, develops, manufactures, and sells electronic equipment, instruments, and devices for consumer, professional, and industrial markets worldwide. Some of our weaker performing securities were Eastman Kodak Co. (0.4%), a technology company, providing products and services in entertainment imaging and commercial films worldwide; Yashili International Holdings Ltd. (0.3%), an investment holding company,
engaging in the manufacture and sale of dairy and nourishment products in the People’s Republic of China; and Kinnevik Investment AB, Cl. A (1.1%), an investment company owning positions in the communications, e-commerce, entertainment, and financial services sectors.
We appreciate your confidence and trust.
|
Sincerely yours, |
|

|
Bruce N. Alpert |
|
President |
February 20, 2015
2
Comparative Results
| | | | | | | | | | | | | | | | | | | | |
| Average Annual Returns through December 31, 2014 (a) (Unaudited) | | Since |
| | | 1 Year | | 5 Year | | 10 Year | | Inception
(2/3/94) |
Class AAA (GAGCX) | | | | 1.59 | % | | | | 5.66 | % | | | | 2.60 | % | | | | 4.50 | % |
Bank of America Merrill Lynch Global 300 Convertible Index | | | | 3.66 | | | | | 7.64 | | | | | 6.18 | | | | | N/A | (d) |
MSCI World Index | | | | 4.94 | | | | | 10.20 | | | | | 6.03 | | | | | 6.66 | (e) |
Lipper Convertible Securities Fund Average | | | | 6.14 | | | | | 10.18 | | | | | 6.80 | | | | | 7.78 | |
Class A (GAGAX) | | | | 1.61 | | | | | 5.68 | | | | | 2.63 | | | | | 4.53 | |
With sales charge (b) | | | | (4.23 | ) | | | | 4.43 | | | | | 2.03 | | | | | 4.22 | |
Class C (GACCX) | | | | 0.92 | | | | | 4.17 | | | | | 1.49 | | | | | 3.86 | |
With contingent deferred sales charge (c) | | | | (0.08 | ) | | | | 4.17 | | | | | 1.49 | | | | | 3.86 | |
Class I (GAGIX) | | | | 1.90 | | | | | 5.90 | | | | | 2.80 | | | | | 4.59 | |
| | | | | | |
In the current prospectuses dated April 30, 2014, the gross expense ratios for Class AAA, A, C, and I Shares are 2.31%, 2.31%, 3.06%, and 2.06%, respectively, and the net expense ratios for these share classes after contractual reimbursements by Gabelli Funds, LLC, (the “Adviser”) are 2.00%, 2.00%, 2.75%, and 1.75%, respectively. See page 11 for the expense ratios for the year ended December 31, 2014. Class AAA and Class I Shares do not have a sales charge. The maximum sales charge for Class A and Class C Shares is 5.75% and 1.00%, respectively. (a) Returns represent past performance and do not guarantee future results. Total returns and average annual returns reflect changes in share price, reinvestment of distributions, and are net of expenses. Investment returns and the principal value of an investment will fluctuate. When shares are redeemed, they may be worth more or less than their original cost. Current performance may be lower or higher than the performance data presented. Visit www.gabelli.com for performance information as of the most recent month end. Returns would have been lower had the Adviser not reimbursed certain expenses of the Fund. The Fund imposes a 2% redemption fee on shares sold or exchanged within seven days after the date of purchase. Investors should carefully consider the investment objectives, risks, charges, and expenses of the Fund before investing. The prospectuses contain information about these and other matters and should be read carefully before investing. To obtain a prospectus, please visit our website at www.gabelli.com. The Class AAA Share NAVs are used to calculate performance for the periods prior to the issuance of Class A Shares, Class C Shares, and Class I Shares on May 2, 2001, November 26, 2001, and January 11, 2008, respectively. The actual performance of the Class A Shares and Class C Shares would have been lower due to the additional fees and expenses associated with these classes of shares. The actual performance of the Class I Shares would have been higher due to lower expenses related to this class of shares. The Bank of America Merrill Lynch Global 300 Convertible Index is an unmanaged global convertible index composed of companies representative of the market structure of countries in North America, Europe, and the Asia/Pacific region. The MSCI World Index is an unmanaged adjusted market capitalization weighted index composed of companies representative of the market structure of developed market countries in North America, Europe, and the Asia/Pacific region. The Lipper Convertible Securities Fund Average reflects the average performance of mutual funds classified in this particular category. Dividends are considered reinvested. You cannot invest directly in an index. |
(b) Performance results include the effect of the maximum 5.75% sales charge at the beginning of the period. |
(c) ��Assuming payment of the 1% maximum contingent deferred sales charge imposed on redemptions made within one year of purchase. |
(d) There is no data available for the Bank of America Merrill Lynch Global 300 Convertible Index prior to December 31, 1994. |
(e) MSCI World Index since inception performance is as of January 31, 1994. |
COMPARISON OF CHANGE IN VALUE OF A $10,000 INVESTMENT IN
THE GABELLI GLOBAL RISING INCOME AND DIVIDEND FUND (CLASS AAA SHARES),
LIPPER CONVERTIBLE SECURITIES FUND AVERAGE, AND MSCI WORLD INDEX (Unaudited)
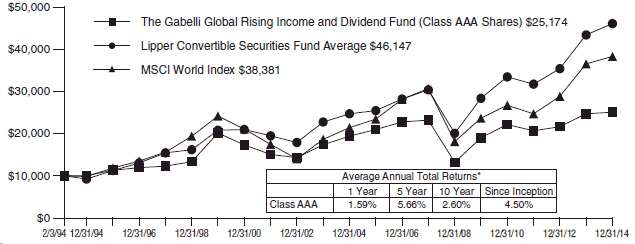
| * | Past performance is not predictive of future results. The performance tables and graph do not reflect the deduction of taxes that a shareholder would pay on Fund distributions or the redemption of Fund shares. |
3
The Gabelli Global Rising Income and Dividend Fund
Disclosure of Fund Expenses (Unaudited)
For the Six Month Period from July 1, 2014 through December 31, 2014 Expense Table
We believe it is important for you to understand the impact of fees and expenses regarding your investment. All mutual funds have operating expenses. As a shareholder of a fund, you incur ongoing costs, which include costs for portfolio management, administrative services, and shareholder reports (like this one), among others. Operating expenses, which are deducted from a fund’s gross income, directly reduce the investment return of a fund. When a fund’s expenses are expressed as a percentage of its average net assets, this figure is known as the expense ratio. The following examples are intended to help you understand the ongoing costs (in dollars) of investing in your Fund and to compare these costs with those of other mutual funds. The examples are based on an investment of $1,000 made at the beginning of the period shown and held for the entire period.
The Expense Table below illustrates your Fund’s costs in two ways:
Actual Fund Return: This section provides information about actual account values and actual expenses. You may use this section to help you to estimate the actual expenses that you paid over the period after any fee waivers and expense reimbursements. The “Ending Account Value” shown is derived from the Fund’s actual return during the past six months, and the “Expenses Paid During Period” shows the dollar amount that would have been paid by an investor who started with $1,000 in the Fund. You may use this information, together with the amount you invested, to estimate the expenses that you paid over the period.
To do so, simply divide your account value by $1,000 (for example, an $8,600 account value divided by $1,000 = 8.6), then multiply the result by the number given for your Fund under the heading “Expenses Paid During Period” to estimate the expenses you paid during this period.
Hypothetical 5% Return: This section provides information about hypothetical account values and
hypothetical expenses based on the Fund’s actual expense ratio. It assumes a hypothetical annualized return of 5% before expenses during the period shown. In this case – because the hypothetical return used is not the Fund’s actual return – the results do not apply to your investment and you cannot use the hypothetical account value and expense to estimate the actual ending account balance or expenses you paid for the period. This example is useful in making comparisons of the ongoing costs of investing in the Fund and other funds. To do so, compare this 5% hypothetical example with the 5% hypothetical examples that appear in shareholder reports of other funds.
Please note that the expenses shown in the table are meant to highlight your ongoing costs only and do not reflect any transactional costs such as sales charges (loads), redemption fees, or exchange fees, if any, which are described in the Prospectus. If these costs were applied to your account, your costs would be higher. Therefore, the 5% hypothetical return is useful in comparing ongoing costs only, and will not help you determine the relative total costs of owning different funds. The “Annualized Expense Ratio” represents the actual expenses for the last six months and may be different from the expense ratio in the Financial Highlights which is for the year ended December 31, 2014.
| | | | | | | | | | | | | | | | |
| | | Beginning
Account Value
07/01/14 | | | Ending
Account Value
12/31/14 | | | Annualized
Expense
Ratio | | | Expenses
Paid During
Period* | |
The Gabelli Global Rising Income and Dividend Fund | |
Actual Fund Return | | | | | | | | | |
Class AAA | | | $1,000.00 | | | | $ 985.10 | | | | 2.02 | % | | | $10.11 | |
Class A | | | $1,000.00 | | | | $ 984.90 | | | | 2.02 | % | | | $10.11 | |
Class C | | | $1,000.00 | | | | $ 982.00 | | | | 2.77 | % | | | $13.84 | |
Class I | | | $1,000.00 | | | | $ 986.90 | | | | 1.77 | % | | | $ 8.86 | |
Hypothetical 5% Return | | | | | |
Class AAA | | | $1,000.00 | | | | $1,015.02 | | | | 2.02 | % | | | $10.26 | |
Class A | | | $1,000.00 | | | | $1,015.02 | | | | 2.02 | % | | | $10.26 | |
Class C | | | $1,000.00 | | | | $1,011.24 | | | | 2.77 | % | | | $14.04 | |
Class I | | | $1,000.00 | | | | $1,016.28 | | | | 1.77 | % | | | $ 9.00 | |
| * | Expenses are equal to the Fund’s annualized expense ratio for the last six months multiplied by the average account value over the period, multiplied by the number of days in the most recent fiscal half year (184 days), then divided by 365. |
4
Summary of Portfolio Holdings (Unaudited)
The following table presents portfolio holdings as a percent of net assets as of December 31, 2014:
The Gabelli Global Rising Income and Dividend Fund
| | | | |
| Long Positions | | Percent | |
U.S. Government Obligations | | | 56.0 | % |
Financial Services | | | 9.4 | % |
Food and Beverage | | | 6.0 | % |
Diversified Industrial | | | 4.3 | % |
Telecommunications | | | 3.8 | % |
Health Care | | | 3.5 | % |
Specialty Chemicals | | | 2.4 | % |
Energy and Utilities | | | 1.6 | % |
Automotive: Parts and Accessories | | | 1.5 | % |
Hotels and Gaming | | | 1.4 | % |
Cable and Satellite | | | 1.2 | % |
Electronics | | | 1.2 | % |
Automotive | | | 1.2 | % |
Consumer Products | | | 1.0 | % |
Wireless Communications | | | 1.0 | % |
Metals and Mining | | | 0.6 | % |
Semiconductors | | | 0.6 | % |
| | | | |
Computer Software and Services | | | 0.6 | % |
Equipment and Supplies | | | 0.5 | % |
Retail | | | 0.5 | % |
Building and Construction | | | 0.4 | % |
Entertainment | | | 0.4 | % |
Energy and Energy Services | | | 0.2 | % |
Consumer Staples | | | 0.2 | % |
Machinery | | | 0.1 | % |
Consumer Services | | | 0.1 | % |
Broadcasting | | | 0.0 | % |
Other Assets & Liabilities (Net) | | | 0.4 | % |
| |
Short Positions | | | | |
Health Care | | | (0.1 | )% |
| | | | |
| | | 100.0 | % |
| | | | |
The Fund files a complete schedule of portfolio holdings with the Securities and Exchange Commission (the “SEC”) for the first and third quarters of each fiscal year on Form N-Q. Shareholders may obtain this information at www.gabelli.com or by calling the Fund at 800-GABELLI (800-422-3554).The Fund’s Form N-Q is available on the SEC’s website at www.sec.gov and may also be reviewed and copied at the SEC’s Public Reference Room in Washington, DC. Information on the operation of the Public Reference Room may be obtained by calling 800-SEC-0330.
Proxy Voting
The Fund files Form N-PX with its complete proxy voting record for the twelve months ended June 30, no later than August 31 of each year. A description of the Fund’s proxy voting policies, procedures, and how the Fund voted proxies relating to portfolio securities is available without charge, upon request, by (i) calling 800-GABELLI (800-422-3554); (ii) writing to The Gabelli Funds at One Corporate Center, Rye, NY 10580-1422; or (iii) visiting the SEC’s website at www.sec.gov.
5
The Gabelli Global Rising Income and Dividend Fund
Schedule of Investments — December 31, 2014
| | | | | | | | | | | | |
Principal Amount | | | | | Cost | | | Market Value | |
| | | | CONVERTIBLE CORPORATE BONDS — 4.3% | | | | | |
| | | | Automotive — 1.2% | | | | | | | | |
| | | | Navistar International Corp., Sub. Deb., | | | | | |
| | $ 200,000 | | | 4.500%, 10/15/18(a) | | $ | 199,225 | | | $ | 192,750 | |
| | 300,000 | | | 4.750%, 04/15/19(a) | | | 300,000 | | | | 288,375 | |
| | | | | | | | | | | | |
| | | | | | | 499,225 | | | | 481,125 | |
| | | | | | | | | | | | |
| | | | Broadcasting — 0.0% | | | | | |
| | 400,000 | | | Citadel Broadcasting Corp., Escrow, Sub. Deb., | | | | | | | | |
| | | | Zero Coupon, 02/11/20† | | | 0 | | | | 0 | |
| | | | | | | | | | | | |
| | |
| | | | Building and Construction — 0.4% | | | | | |
| | 200,000 | | | Layne Christensen Co., | | | | | | | | |
| | | | 4.250%, 11/15/18(a) | | | 200,000 | | | | 161,500 | |
| | | | | | | | | | | | |
| |
| | | | Computer Software and Services — 0.4% | |
| | 100,000 | | | Mentor Graphics Corp., Sub. Deb., | | | 99,117 | | | | 120,250 | |
| | | | 4.000%, 04/01/31 | | | | | | | | |
| | 10,000 | | | VeriSign Inc., STEP, | | | | | | | | |
| | | | 4.086%, 08/15/37 | | | 13,478 | | | | 17,181 | |
| | | | | | | | | | | | |
| | | | | | | 112,595 | | | | 137,431 | |
| | | | | | | | | | | | |
| | |
| | | | Consumer Services — 0.1% | | | | | |
| | 50,000 | | | Ascent Capital Group Inc., | | | | | | | | |
| | | | 4.000%, 07/15/20 | | | 51,397 | | | | 41,344 | |
| | | | | | | | | | | | |
| | |
| | | | Diversified Industrial — 1.6% | | | | | |
| | 150,000 | | | GenCorp Inc., Sub. Deb., | | | | | | | | |
| | | | 4.063%, 12/31/39 | | | 131,634 | | | | 304,687 | |
| | 300,000 | | | Griffon Corp., Sub. Deb., | | | | | | | | |
| | | | 4.000%, 01/15/17(a) | | | 299,445 | | | | 339,562 | |
| | | | | | | | | | | | |
| | | | | | | 431,079 | | | | 644,249 | |
| | | | | | | | | | | | |
| | |
| | | | Metals and Mining — 0.6% | | | | | |
| | 250,000 | | | Newmont Mining Corp., Ser. B, | | | | | | | | |
| | | | 1.625%, 07/15/17 | | | 315,011 | | | | 254,531 | |
| | | | | | | | | | | | |
| | | | TOTAL CONVERTIBLE CORPORATE BONDS | | | 1,609,307 | | | | 1,720,180 | |
| | | | | | | | | | | | |
| | |
| | | | CORPORATE BONDS — 0.0% | | | | | |
| | | | Energy and Utilities — 0.0% | | | | | |
| | 200,000 | | | Texas Competitive Electric
Holdings Co. LLC, Ser. B, | | | | | | | | |
| | | | 10.250%, 11/01/15† | | | 155,799 | | | | 20,000 | |
| | | | | | | | | | | | |
| | | |
Shares | | | | | | | | | |
| | | | COMMON STOCKS — 39.2% | | | | | |
| | | | Automotive: Parts and Accessories — 1.5% | |
| | 2,000 | | | Dana Holding Corp. | | | 44,404 | | | | 43,480 | |
| | 1,500 | | | Federal-Mogul Holdings Corp.† | | | 15,561 | | | | 24,135 | |
| | 500 | | | Genuine Parts Co. | | | 42,897 | | | | 53,285 | |
| | 3,000 | | | TRW Automotive Holdings Corp.† | | | 305,836 | | | | 308,550 | |
| | 1,500 | | | Visteon Corp.† | | | 158,858 | | | | 160,290 | |
| | | | | | | | | | | | |
| | | | | | | 567,556 | | | | 589,740 | |
| | | | | | | | | | | | |
| | | | | | | | | | | | |
Shares | | | | | Cost | | | Market Value | |
| | | | Building and Construction — 0.0% | |
| | 500 | | | Chofu Seisakusho Co. Ltd. | | $ | 11,059 | | | $ | 12,899 | |
| | | | | | | | | | | | |
| | | | Cable and Satellite — 1.2% | | | | | | | | |
| | 3,500 | | | Rogers Communications Inc., Cl. B | | | 140,653 | | | | 136,010 | |
| | 44,000 | | | Sky Deutschland AG† | | | 366,620 | | | | 357,788 | |
| | | | | | | | | | | | |
| | | | | | | 507,273 | | | | 493,798 | |
| | | | | | | | | | | | |
| | | | Computer Software and Services — 0.2% | |
| | 10,083 | | | Global Sources Ltd.† | | | 70,304 | | | | 64,128 | |
| | | | | | | | | | | | |
| | | | Consumer Products — 1.0% | | | | | | | | |
| | 7,112 | | | Eastman Kodak Co.† | | | 73,383 | | | | 154,402 | |
| | 2,000 | | | Hunter Douglas NV | | | 85,525 | | | | 83,445 | |
| | 1,000 | | | L’Oreal SA | | | 166,923 | | | | 168,560 | |
| | | | | | | | | | | | |
| | | | | | | 325,831 | | | | 406,407 | |
| | | | | | | | | | | | |
| | | | Consumer Staples — 0.2% | | | | | | | | |
| | 3,000 | | | Unicharm Corp. | | | 54,052 | | | | 72,934 | |
| | | | | | | | | | | | |
| | | |
| | | | Diversified Industrial — 2.7% | | | | | | | | |
| | 4,680 | | | Ampco-Pittsburgh Corp. | | | 84,830 | | | | 90,090 | |
| | 7,000 | | | General Electric Co.(b) | | | 167,090 | | | | 176,890 | |
| | 6,000 | | | Jardine Matheson Holdings Ltd. | | | 320,312 | | | | 365,700 | |
| | 11,000 | | | Jardine Strategic Holdings Ltd. | | | 368,065 | | | | 376,200 | |
| | 2,075 | | | Textron Inc. | | | 51,917 | | | | 87,378 | |
| | | | | | | | | | | | |
| | | | | | | 992,214 | | | | 1,096,258 | |
| | | | | | | | | | | | |
| | | |
| | | | Electronics — 1.2% | | | | | | | | |
| | 24,000 | | | Sony Corp., ADR(b) | | | 456,410 | | | | 491,280 | |
| | | | | | | | | | | | |
| |
| | | | Energy and Energy Services — 0.2% | |
| | 1,500 | | | BP plc, ADR | | | 62,399 | | | | 57,180 | |
| | 500 | | | Cameron International Corp.† | | | 25,271 | | | | 24,975 | |
| | 1,000 | | | Weatherford International plc† | | | 11,620 | | | | 11,450 | |
| | | | | | | | | | | | |
| | | | | | | 99,290 | | | | 93,605 | |
| | | | | | | | | | | | |
| | | |
| | | | Energy and Utilities — 1.6% | | | | | | | | |
| | 3,500 | | | Dresser-Rand Group Inc.† | | | 285,590 | | | | 286,300 | |
| | 1,000 | | | National Fuel Gas Co. | | | 67,180 | | | | 69,530 | |
| | 1,000 | | | Severn Trent plc | | | 27,057 | | | | 31,266 | |
| | 25,000 | | | Talisman Energy Inc. | | | 196,550 | | | | 195,750 | |
| | 3,000 | | | TECO Energy Inc.(b) | | | 53,285 | | | | 61,470 | |
| | | | | | | | | | | | |
| | | | | | | 629,662 | | | | 644,316 | |
| | | | | | | | | | | | |
| | | |
| | | | Entertainment — 0.4% | | | | | | | | |
| | 6,000 | | | Vivendi SA | | | 153,415 | | | | 150,216 | |
| | | | | | | | | | | | |
| |
| | | | Equipment and Supplies — 0.5% | |
| | 1,000 | | | Graco Inc. | | | 60,917 | | | | 80,180 | |
| | 4,000 | | | Mueller Industries Inc. | | | 111,182 | | | | 136,560 | |
| | | | | | | | | | | | |
| | | | | | | 172,099 | | | | 216,740 | |
| | | | | | | | | | | | |
| | | |
| | | | Financial Services — 9.4% | | | | | | | | |
| | 7,000 | | | American International Group Inc.(b) | | | 235,556 | | | | 392,070 | |
| | 3 | | | Berkshire Hathaway Inc., Cl. A† | | | 358,105 | | | | 678,000 | |
See accompanying notes to financial statements.
6
The Gabelli Global Rising Income and Dividend Fund
Schedule of Investments (Continued) — December 31, 2014
| | | | | | | | | | | | |
Shares | | | | | Cost | | | Market Value | |
| | | | COMMON STOCKS (Continued) | |
| | | | Financial Services (Continued) | |
| | 3,500 | | | Citigroup Inc.(b) | | $ | 159,667 | | | $ | 189,385 | |
| | 2,000 | | | Deutsche Bank AG | | | 66,179 | | | | 60,040 | |
| | 3,000 | | | Exor SpA | | | 99,014 | | | | 123,571 | |
| | 8,000 | | | GAM Holding AG | | | 131,092 | | | | 144,840 | |
| | 13,000 | | | Kinnevik Investment AB, Cl. A | | | 426,857 | | | | 431,913 | |
| | 3,500 | | | Legg Mason Inc.(b) | | | 94,123 | | | | 186,795 | |
| | 10,001 | | | Protective Life Corp. | | | 694,213 | | | | 696,570 | |
| | 2,000 | | | T. Rowe Price Group Inc. | | | 148,674 | | | | 171,720 | |
| | 6,000 | | | The Bank of New York Mellon Corp. | | | 164,432 | | | | 243,420 | |
| | 1,500 | | | The PNC Financial Services Group Inc. | | | 102,907 | | | | 136,845 | |
| | 1,000 | | | UBS Group AG | | | 18,530 | | | | 17,050 | |
| | 1,000 | | | W. R. Berkley Corp. | | | 37,130 | | | | 51,260 | |
| | 5,000 | | | Wells Fargo & Co.(b) | | | 171,100 | | | | 274,100 | |
| | | | | | | | | | | | |
| | | | | | | 2,907,579 | | | | 3,797,579 | |
| | | | | | | | | | | | |
| | | | Food and Beverage — 5.8% | | | | | |
| | 2,000 | | | Chr. Hansen Holding A/S | | | 80,872 | | | | 89,139 | |
| | 2,000 | | | Danone SA | | | 149,857 | | | | 131,775 | |
| | 40,000 | | | Davide Campari-Milano SpA | | | 320,086 | | | | 249,755 | |
| | 2,400 | | | Diageo plc | | | 74,974 | | | | 69,146 | |
| | 1,000 | | | Diageo plc, ADR | | | 116,790 | | | | 114,090 | |
| | 2,500 | | | General Mills Inc.(b) | | | 124,421 | | | | 133,325 | |
| | 2,000 | | | Heineken NV | | | 133,144 | | | | 142,665 | |
| | 2,500 | | | Kellogg Co.(b) | | | 127,291 | | | | 163,600 | |
| | 3,300 | | | Kerry Group plc, Cl. A | | | 252,442 | | | | 231,444 | |
| | 6,000 | | | Kikkoman Corp. | | | 104,672 | | | | 148,572 | |
| | 1,000 | | | Kraft Foods Group Inc. | | | 58,355 | | | | 62,660 | |
| | 5,000 | | | Maple Leaf Foods Inc. | | | 82,969 | | | | 83,792 | |
| | 300 | | | McCormick & Co. Inc., Cl. V | | | 20,892 | | | | 22,550 | |
| | 1,200 | | | McCormick & Co. Inc., Non-Voting | | | 83,799 | | | | 89,160 | |
| | 5,500 | | | Nestlé SA | | | 380,473 | | | | 403,566 | |
| | 600 | | | Pernod Ricard SA | | | 70,696 | | | | 66,984 | |
| | 400,000 | | | Yashili International Holdings Ltd. | | | 170,861 | | | | 112,964 | |
| | | | | | | | | | | | |
| | | | | | | 2,352,594 | | | | 2,315,187 | |
| | | | | | | | | | | | |
| | | | Health Care — 3.5% | | | | | | | | |
| | 200 | | | Becton, Dickinson and Co. | | | 20,442 | | | | 27,832 | |
| | 3,500 | | | Bristol-Myers Squibb Co.(b) | | | 118,262 | | | | 206,605 | |
| | 532 | | | Chemed Corp. | | | 46,380 | | | | 56,408 | |
| | 4,000 | | | Cubist Pharmaceuticals Inc.†. | | | 401,320 | | | | 402,600 | |
| | 2,800 | | | ICU Medical Inc.† | | | 176,046 | | | | 229,320 | |
| | 1,000 | | | Patterson Companies Inc. | | | 33,669 | | | | 48,100 | |
| | 8,000 | | | Pfizer Inc.(b) | | | 187,223 | | | | 249,200 | |
| | 5,000 | | | Roche Holding AG, ADR | | | 93,345 | | | | 169,950 | |
| | | | | | | | | | | | |
| | | | | | | 1,076,687 | | | | 1,390,015 | |
| | | | | | | | | | | | |
| | | | Hotels and Gaming — 1.4% | | | | | |
| | 5,000 | | | International Game Technology | | | 85,900 | | | | 86,250 | |
| | 142,000 | | | Mandarin Oriental International Ltd. | | | 239,523 | | | | 237,850 | |
| | | | | | | | | | | | |
Shares | | | | | Cost | | | Market Value | |
| | 170,000 | | | The Hongkong & Shanghai Hotels Ltd. | | $ | 259,646 | | | $ | 252,107 | |
| | | | | | | | | | | | |
| | | | | | | 585,069 | | | | 576,207 | |
| | | | | | | | | | | | |
| | | | Machinery — 0.1% | | | | | | | | |
| | 6,500 | | | CNH Industrial NV | | | 72,224 | | | | 52,698 | |
| | | | | | | | | | | | |
| | | | Retail — 0.5% | | | | | | | | |
| | 500 | | | Macy’s Inc. | | | 28,880 | | | | 32,875 | |
| | 2,200 | | | Walgreens Boots Alliance Inc. | | | 135,948 | | | | 167,640 | |
| | | | | | | | | | | | |
| | | | | | | 164,828 | | | | 200,515 | |
| | | | | | | | | | | | |
| | | | Semiconductors — 0.6% | |
| | 6,000 | | | International Rectifier Corp.† | | | 237,260 | | | | 239,400 | |
| | | | | | | | | | | | |
| | | | Specialty Chemicals — 2.4% | |
| | 1,500 | | | Chemtura Corp.† | | | 34,583 | | | | 37,095 | |
| | 500 | | | E. I. du Pont de Nemours and Co. | | | 21,750 | | | | 36,970 | |
| | 4,600 | | | International Flavors & Fragrances Inc. | | | 460,634 | | | | 466,256 | |
| | 3,000 | | | Sigma-Aldrich Corp. | | | 410,551 | | | | 411,810 | |
| | | | | | | | | | | | |
| | | | | | | 927,518 | | | | 952,131 | |
| | | | | | | | | | | | |
| | | | Telecommunications — 3.8% | |
| | 2,000 | | | Belgacom SA | | | 55,818 | | | | 72,845 | |
| | 500 | | | CenturyLink Inc.(b) | | | 15,295 | | | | 19,790 | |
| | 30,000 | | | Jazztel plc† | | | 492,507 | | | | 455,585 | |
| | 50,000 | | | Koninklijke KPN NV | | | 139,515 | | | | 159,001 | |
| | 15,000 | | | Portugal Telecom SGPS SA, ADR | | | 33,014 | | | | 15,900 | |
| | 29,000 | | | Telefonica Deutschland Holding AG | | | 161,360 | | | | 154,894 | |
| | 3,300 | | | Verizon Communications Inc.(b) | | | 158,780 | | | | 154,374 | |
| | 15,000 | | | Vodafone Group plc, ADR | | | 665,554 | | | | 512,550 | |
| | | | | | | | | | | | |
| | | | | | | 1,721,843 | | | | 1,544,939 | |
| | | | | | | | | | | | |
| | | | Wireless Communications — 1.0% | |
| | 200,000 | | | Cable & Wireless Communications plc | | | 137,141 | | | | 154,738 | |
| | 3,000 | | | Millicom International Cellular SA, SDR | | | 258,280 | | | | 224,166 | |
| | | | | | | | | | | | |
| | | | | | | 395,421 | | | | 378,904 | |
| | | | | | | | | | | | |
| | | |
| | | | TOTAL COMMON STOCKS | | | 14,480,188 | | | | 15,779,896 | |
| | | | | | | | | | | | |
| | | | CONVERTIBLE PREFERRED STOCKS — 0.2% | |
| | | | Food and Beverage — 0.2% | |
| | 800 | | | Post Holdings Inc. | | | | | | | | |
| | | | 0.094%, 3.750%(a) | | | 80,000 | | | | 84,489 | |
| | | | | | | | | | | | |
| | | |
| | | | WARRANTS — 0.0% | | | | | | | | |
| | | | Consumer Products — 0.0% | |
| | 334 | | | Eastman Kodak Co., expire | | | | | | | | |
| | | | 09/03/18† | | | 0 | | | | 2,538 | |
See accompanying notes to financial statements.
7
The Gabelli Global Rising Income and Dividend Fund
Schedule of Investments (Continued) — December 31, 2014
| | | | | | | | | | | | |
Shares | | | | | Cost | | | Market Value | |
| | | | WARRANTS (Continued) | | | | | | | | |
| | | | Consumer Products (Continued) | |
| | 334 | | | Eastman Kodak Co., expire
09/03/18† | | $ | 0 | | | $ | 2,071 | |
| | | | | | | | | | | | |
| | | | TOTAL WARRANTS | | | 0 | | | | 4,609 | |
| | | | | | | | | | | | |
| | | | | | | | | | | | |
Principal Amount | | | | | | | | | |
| | | | U.S. GOVERNMENT OBLIGATIONS — 56.0% | |
| | $22,586,000 | | | U.S. Treasury Bills,
0.000% to 0.105%††,
01/02/15 to 06/25/15 | | | 22,580,967 | | | | 22,578,950 | |
| | | | | | | | | | | | |
| | | | TOTAL INVESTMENTS — 99.7% | | $ | 38,906,261 | | | | 40,188,124 | |
| | | | | | | | | | | | |
| |
| | | | SECURITIES SOLD SHORT — (0.1)% | |
| | | | (Proceeds received $47,976) | | | | (56,408 | ) |
| | |
| | | | Other Assets and Liabilities (Net) — 0.4% | | | | 154,535 | |
| | | | | | | | | | | | |
| | |
| | | | NET ASSETS — 100.0% | | | $ | 40,286,251 | |
| | | | | | | | | | | | |
| | | | | | | | | | | | |
Shares | | | | | Proceeds | | | Market Value | |
| |
| | | | SECURITIES SOLD SHORT — (0.1)% | |
| | | | Health Care — (0.1)% | |
| | 532 | | | Chemed Corp. | | $ | 47,976 | | | $ | 56,408 | |
| | | | | | | | | | | | |
| (a) | Security exempt from registration under Rule 144A of the Securities Act of 1933, as amended. These securities may be resold in transactions exempt from registration, normally to qualified institutional buyers. At December 31, 2014, the market value of Rule 144A securities amounted to $1,066,676 or 2.65% of net assets. |
| (b) | Securities, or a portion thereof, with a value of $2,460,874 were deposited with the broker as collateral for securities sold short. |
| † | Non-income producing security. |
| †† | Represents annualized yield at date of purchase. |
| ADR | American Depositary Receipt |
| SDR | Swedish Depositary Receipt |
| STEP | Step coupon security. The rate disclosed is that in effect at December 31, 2014 |
See accompanying notes to financial statements.
8
The Gabelli Global Rising Income and Dividend Fund
Statement of Assets and Liabilities
December 31, 2014
| | | | |
Assets: | | | | |
Investments, at value (cost $38,906,261) | | | $40,188,124 | |
Foreign currency, at value (cost $136,081) | | | 137,275 | |
Cash | | | 21,701 | |
Deposit at brokers (including proceeds from securities sold short of $47,976) | | | 175,191 | |
Dividends and interest receivable | | | 41,436 | |
Prepaid expenses | | | 17,699 | |
| | | | |
Total Assets | | | 40,581,426 | |
| | | | |
Liabilities: | | | | |
Securities sold short, at value | | | 56,408 | |
Payable for investments purchased | | | 164,086 | |
Payable for investment advisory fees | | | 27,316 | |
Payable for distribution fees | | | 2,848 | |
Payable for legal and audit fees | | | 21,961 | |
Other accrued expenses | | | 22,556 | |
| | | | |
Total Liabilities | | | 295,175 | |
| | | | |
Net Assets | | | | |
(applicable to 1,824,872 shares outstanding) | | | $40,286,251 | |
| | | | |
Net Assets Consist of: | | | | |
Paid-in capital | | | $40,071,305 | |
Accumulated distributions in excess of net investment income | | | (110,007 | ) |
Accumulated net realized loss on investments and foreign currency transactions | | | (949,065 | ) |
Net unrealized appreciation on investments | | | 1,281,863 | |
Net unrealized depreciation on securities sold short | | | (8,432 | ) |
Net unrealized appreciation on foreign currency translations | | | 587 | |
| | | | |
Net Assets | | | $40,286,251 | |
| | | | |
| | | | |
Shares of Capital Stock, each at $0.001 par value: | | | | |
Class AAA: | | | | |
Net Asset Value, offering, and redemption price per share ($12,368,101 ÷ 561,877 shares outstanding; 75,000,000 shares authorized) | | | $22.01 | |
| | | | |
Class A: | | | | |
Net Asset Value and redemption price per share ($365,158 ÷ 16,521 shares outstanding; 50,000,000 shares authorized) | | | $22.10 | |
| | | | |
Maximum offering price per share (NAV ÷ 0.9425, based on maximum sales charge of 5.75% of the offering price) | | | $23.45 | |
| | | | |
Class C: | | | | |
Net Asset Value and offering price per share ($154,942 ÷ 8,169 shares outstanding; 25,000,000 shares authorized) | | | $18.97 | |
| | | | |
Class I: | | | | |
Net Asset Value, offering, and redemption price per share ($27,398,050 ÷ 1,238,305 shares outstanding; 25,000,000 shares authorized) | | | $22.13 | |
| | | | |
Statement of Operations
For the Year Ended December 31, 2014
| | | | |
Investment Income: | | | | |
Dividends (net of foreign withholding taxes of $7,764) | | $ | 616,446 | |
Interest | | | 69,368 | |
| | | | |
Total Investment Income | | | 685,814 | |
| | | | |
Expenses: | | | | |
Investment advisory fees | | | 180,150 | |
Distribution fees - Class AAA | | | 33,726 | |
Distribution fees - Class A. | | | 913 | |
Distribution fees - Class C | | | 607 | |
Shareholder communications expenses | | | 36,553 | |
Custodian fees | | | 31,429 | |
Registration expenses | | | 27,487 | |
Legal and audit fees | | | 22,773 | |
Shareholder services fees | | | 13,833 | |
Directors’ fees | | | 5,454 | |
Interest expense | | | 2,809 | |
Dividends expense on securities sold short | | | 340 | |
Service fees for securities sold short (see note 2) | | | 529 | |
Miscellaneous expenses | | | 13,991 | |
| | | | |
Total Expenses | | | 370,594 | |
| | | | |
Less: | | | | |
Expenses reimbursed by Adviser (See Note 3) | | | (16,424 | ) |
| | | | |
Net Expenses | | | 354,170 | |
| | | | |
Net Investment Income | | | 331,644 | |
| | | | |
Net Realized and Unrealized Gain/(Loss) on Investments, Securities Sold Short, and Foreign Currency: | | | | |
Net realized gain on investments. | | | 854,565 | |
Net realized loss on securities sold short | | | (1,644 | ) |
Net realized gain on foreign currency transactions | | | 5,219 | |
| | | | |
Net realized gain/(loss) on investments, securities sold short, and foreign currency transactions | | | 858,140 | |
| | | | |
Net change in unrealized appreciation/depreciation: | | | | |
on investments | | | (1,117,950 | ) |
on securities sold short | | | (8,432 | ) |
on foreign currency translations | | | 13,817 | |
| | | | |
Net change in unrealized appreciation/depreciation on investments, securities sold short, and foreign currency translations | | | (1,112,565 | ) |
| | | | |
Net Realized and Unrealized Gain/(Loss) on Investments, Securities Sold Short, and Foreign Currency | | | (254,425 | ) |
| | | | |
Net Decrease in Net Assets Resulting from Operations | | $ | 77,219 | |
| | | | |
See accompanying notes to financial statements.
9
The Gabelli Global Rising Income and Dividend Fund
Statement of Changes in Net Assets
| | | | | | | | | | |
| | | Year Ended
December 31, 2014 | | Year Ended
December 31, 2013 |
Operations: | | | | | | | | | | |
Net investment income | | | | $ 331,644 | | | | | $ 23,778 | |
Net realized gain/(loss) on investments, securities sold short, and foreign currency transactions | | | | 858,140 | | | | | (164,786 | ) |
Net change in unrealized appreciation/depreciation on investments, securities sold short, and foreign currency translations | | | | (1,112,565 | ) | | | | 2,151,545 | |
| | | | | | | | | | |
Net Increase in Net Assets Resulting from Operations | | | | 77,219 | | | | | 2,010,537 | |
| | | | | | | | | | |
Distributions to Shareholders: | | | | | | | | | | |
Net investment income | | | | | | | | | | |
Class AAA | | | | (140,957 | ) | | | | (63,621 | ) |
Class A | | | | (4,244 | ) | | | | (1,169 | ) |
Class C | | | | (1,921 | ) | | | | (38 | ) |
Class I | | | | (187,951 | ) | | | | (14,035 | ) |
| | | | | | | | | | |
| | | | (335,073 | ) | | | | (78,863 | ) |
| | | | | | | | | | |
Net realized gain | | | | | | | | | | |
Class AAA | | | | (59,887 | ) | | | | — | |
Class A | | | | (1,768 | ) | | | | — | |
Class C | | | | (867 | ) | | | | — | |
Class I | | | | (64,441 | ) | | | | — | |
| | | | | | | | | | |
| | | | (126,963 | ) | | | | — | |
| | | | | | | | | | |
Return of Capital | | | | | | | | | | |
Class AAA | | | | — | | | | | (4,145 | ) |
Class A | | | | — | | | | | (76 | ) |
Class C | | | | — | | | | | (3 | ) |
Class I | | | | — | | | | | (914 | ) |
| | | | | | | | | | |
| | | | — | | | | | (5,138 | ) |
| | | | | | | | | | |
Total Distributions to Shareholders | | | | (462,036 | ) | | | | (84,001 | ) |
| | | | | | | | | | |
| | |
Capital Share Transactions: | | | | | | | | | | |
Class AAA | | | | (5,035,019 | ) | | | | 7,877,981 | |
Class A | | | | 37,019 | | | | | 57,400 | |
Class C | | | | 145,673 | | | | | (15,058 | ) |
Class I | | | | 25,140,199 | | | | | 389,331 | |
| | | | | | | | | | |
Net Increase in Net Assets from Capital Share Transactions | | | | 20,287,872 | | | | | 8,309,654 | |
| | | | | | | | | | |
Redemption Fees | | | | — | | | | | 10 | |
| | | | | | | | | | |
Net Increase in Net Assets | | | | 19,903,055 | | | | | 10,236,200 | |
Net Assets: | | | | | | | | | | |
Beginning of year | | | | 20,383,196 | | | | | 10,146,996 | |
| | | | | | | | | | |
End of year (including undistributed net investment income of $0 and $0, respectively) | | | | $40,286,251 | | | | | $20,383,196 | |
| | | | | | | | | | |
See accompanying notes to financial statements.
10
The Gabelli Global Rising Income and Dividend Fund
Financial Highlights
Selected data for a share of capital stock outstanding throughout each year:
| | | | | | | | | | | | | | | | | | | | | | | | | | | | | | | | | | | | | | | | | | | | | | | | | | | | | | | | | | | | | | | | | | | | | | | | | | | | | | | | |
| | | | | Income (Loss)
from Investment Operations | | Distributions | | | | | | | | Ratios to Average Net Assets/
Supplemental Data |
For Year Ended December 31† | | Net Asset
Value,
Beginning
of Year | | Net
Investment
Income
(Loss)(a) | | Net
Realized
and
Unrealized
Gain (Loss)
on
Investments | | Total from
Investment
Operations | | Net Investment Income | | Net
Realized
Gain on
Investments | | Return of Capital | | Total
Distributions | | Redemption Fees (a)(b) | | Net Asset Value, End of Year | | Total
Return†† | | Net Assets End of Year (in 000’s) | | Net Investment Income (Loss) | | Operating Expenses Before Reimburse- ment | | Operating Expenses Net of Reimburse- ment(c) | | Portfolio Turnover Rate |
Class AAA | | | | | | | | | | | | | | | | | | | | | | | | | | | | | | | | | | | | | | | | | | | | | | | | | | | | | | | | | | | | | | | | | | | | | | | | | | | | | | | | |
2014 | | | | $22.02 | | | | | $0.48 | | | | | $(0.13 | ) | | | | $0.35 | | | | | $(0.25 | ) | | | | $(0.11 | ) | | | | — | | | | | $(0.36 | ) | | | | — | | | | | $22.01 | | | | | 1.6 | % | | | | $12,368 | | | | | 2.15 | % | | | | 2.11 | % | | | | 2.02 | % | | | | 63 | % |
2013 | | | | 19.35 | | | | | 0.01 | | | | | 2.75 | | | | | 2.76 | | | | | (0.08 | ) | | | | (0.01 | ) | | | | $(0.01 | ) | | | | (0.09 | ) | | | | $0.00 | | | | | 22.02 | | | | | 14.3 | | | | | 17,459 | | | | | 0.11 | | | | | 2.31 | | | | | 2.00 | | | | | 80 | |
2012 | | | | 18.65 | | | | | 0.10 | | | | | 0.80 | | | | | 0.90 | | | | | (0.20 | ) | | | | — | | | | | — | | | | | (0.20 | ) | | | | 0.00 | | | | | 19.35 | | | | | 4.8 | | | | | 7,942 | | | | | 0.48 | | | | | 2.77 | | | | | 2.00 | | | | | 134 | |
2011 | | | | 20.65 | | | | | 0.55 | | | | | (1.95 | ) | | | | (1.40 | ) | | | | (0.60 | ) | | | | — | | | | | — | | | | | (0.60 | ) | | | | 0.00 | | | | | 18.65 | | | | | (6.9 | ) | | | | 5,269 | | | | | 2.72 | | | | | 3.38 | | | | | 2.02 | | | | | 45 | |
2010 | | | | 18.20 | | | | | 0.40 | | | | | 2.55 | | | | | 2.95 | | | | | (0.50 | ) | | | | — | | | | | — | | | | | (0.50 | ) | | | | — | | | | | 20.65 | | | | | 16.3 | | | | | 8,018 | | | | | 2.11 | | | | | 2.87 | | | | | 2.02 | | | | | 68 | |
Class A | | | | | | | | | | | | | | | | | | | | | | | | | | | | | | | | | | | | | | | | | | | | | | | | | | | | | | | | | | | | | | | | | | | | | | | | | | | | | | | | |
2014 | | | | $22.11 | | | | | $0.36 | | | | | $0.00 | (b) | | | | $0.36 | | | | | $(0.26 | ) | | | | $(0.11 | ) | | | | — | | | | | $(0.37 | ) | | | | — | | | | | $22.10 | | | | | 1.6 | % | | | | $ 365 | | | | | 1.60 | % | | | | 2.11 | % | | | | 2.02 | % | | | | 63 | % |
2013 | | | | 19.40 | | | | | 0.01 | | | | | 2.78 | | | | | 2.79 | | | | | (0.07 | ) | | | | (0.01 | ) | | | | $(0.01 | ) | | | | (0.08 | ) | | | | $0.00 | | | | | 22.11 | | | | | 14.4 | | | | | 332 | | | | | 0.21 | | | | | 2.31 | | | | | 2.00 | | | | | 80 | |
2012 | | | | 18.75 | | | | | 0.15 | | | | | 0.70 | | | | | 0.85 | | | | | (0.20 | ) | | | | — | | | | | — | | | | | (0.20 | ) | | | | 0.00 | | | | | 19.40 | | | | | 4.5 | | | | | 238 | | | | | 0.74 | | | | | 2.77 | | | | | 2.00 | | | | | 134 | |
2011 | | | | 20.70 | | | | | 0.50 | | | | | (1.85 | ) | | | | (1.35 | ) | | | | (0.60 | ) | | | | — | | | | | — | | | | | (0.60 | ) | | | | 0.00 | | | | | 18.75 | | | | | (6.7 | ) | | | | 297 | | | | | 2.47 | | | | | 3.38 | | | | | 2.02 | | | | | 45 | |
2010 | | | | 18.25 | | | | | 0.40 | | | | | 2.55 | | | | | 2.95 | | | | | (0.50 | ) | | | | — | | | | | — | | | | | (0.50 | ) | | | | — | | | | | 20.70 | | | | | 16.3 | | | | | 1,115 | | | | | 2.16 | | | | | 2.87 | | | | | 2.02 | | | | | 68 | |
Class C | | | | | | | | | | | | | | | | | | | | | | | | | | | | | | | | | | | | | | | | | | | | | | | | | | | | | | | | | | | | | | | | | | | | | | | | | | | | | | | | |
2014 | | | | $19.14 | | | | | $(0.06 | ) | | | | $0.24 | | | | | $0.18 | | | | | $(0.24 | ) | | | | $(0.11 | ) | | | | — | | | | | $(0.35 | ) | | | | — | | | | | $18.97 | | | | | 0.9 | % | | | | $ 155 | | | | | (0.29 | )% | | | | 2.86 | % | | | | 2.77 | % | | | | 63 | % |
2013 | | | | 17.15 | | | | | (0.07 | ) | | | | 2.16 | | | | | 2.09 | | | | | (0.09 | ) | | | | (0.01 | ) | | | | $(0.01 | ) | | | | (0.10 | ) | | | | $0.00 | | | | | 19.14 | | | | | 12.2 | | | | | 8 | | | | | (0.82 | ) | | | | 3.06 | | | | | 2.75 | | | | | 80 | |
2012 | | | | 16.95 | | | | | 0.10 | | | | | 0.20 | | | | | 0.30 | | | | | (0.10 | ) | | | | — | | | | | — | | | | | (0.10 | ) | | | | 0.00 | | | | | 17.15 | | | | | 1.7 | | | | | 23 | | | | | 0.71 | | | | | 3.52 | | | | | 2.75 | | | | | 134 | |
2011 | | | | 18.80 | | | | | 0.35 | | | | | (1.75 | ) | | | | (1.40 | ) | | | | (0.45 | ) | | | | — | | | | | — | | | | | (0.45 | ) | | | | 0.00 | | | | | 16.95 | | | | | (7.6 | ) | | | | 42 | | | | | 1.82 | | | | | 4.13 | | | | | 2.77 | | | | | 45 | |
2010 | | | | 16.65 | | | | | 0.25 | | | | | 2.25 | | | | | 2.50 | | | | | (0.35 | ) | | | | — | | | | | — | | | | | (0.35 | ) | | | | — | | | | | 18.80 | | | | | 15.1 | | | | | 166 | | | | | 1.33 | | | | | 3.62 | | | | | 2.77 | | | | | 68 | |
Class I | | | | | | | | | | | | | | | | | | | | | | | | | | | | | | | | | | | | | | | | | | | | | | | | | | | | | | | | | | | | | | | | | | | | | | | | | | | | | | | | |
2014 | | | | $22.13 | | | | | $0.19 | | | | | $0.23 | | | | | $0.42 | | | | | $(0.31 | ) | | | | $(0.11 | ) | | | | — | | | | | $(0.42 | ) | | | | — | | | | | $22.13 | | | | | 1.9 | % | | | | $27,398 | | | | | 0.87 | % | | | | 1.86 | % | | | | 1.77 | % | | | | 63 | % |
2013 | | | | 19.40 | | | | | 0.03 | | | | | 2.83 | | | | | 2.86 | | | | | (0.12 | ) | | | | (0.01 | ) | | | | $(0.01 | ) | | | | (0.13 | ) | | | | $0.00 | | | | | 22.13 | | | | | 14.7 | | | | | 2,584 | | | | | 0.49 | | | | | 2.06 | | | | | 1.75 | | | | | 80 | |
2012 | | | | 18.75 | | | | | (0.10 | ) | | | | 1.00 | | | | | 0.90 | | | | | (0.25 | ) | | | | — | | | | | — | | | | | (0.25 | ) | | | | 0.00 | | | | | 19.40 | | | | | 4.7 | | | | | 1,944 | | | | | (0.45 | ) | | | | 2.52 | | | | | 1.75 | | | | | 134 | |
2011 | | | | 20.70 | | | | | 0.60 | | | | | (1.90 | ) | | | | (1.30 | ) | | | | (0.65 | ) | | | | — | | | | | — | | | | | (0.65 | ) | | | | 0.00 | | | | | 18.75 | | | | | (6.4 | ) | | | | 55 | | | | | 3.01 | | | | | 3.13 | | | | | 1.77 | | | | | 45 | |
2010 | | | | 18.30 | | | | | 0.45 | | | | | 2.50 | | | | | 2.95 | | | | | (0.55 | ) | | | | — | | | | | — | | | | | (0.55 | ) | | | | — | | | | | 20.70 | | | | | 16.4 | | | | | 69 | | | | | 2.37 | | | | | 2.62 | | | | | 1.77 | | | | | 68 | |
| † | All per share amounts and net asset values have been adjusted as a result of the 1 for 5 reverse stock split on August 9, 2013. (See note 8) |
| †† | Total return represents aggregate total return of a hypothetical $1,000 investment at the beginning of the year and sold at the end of the year including reinvestment of distributions and does not reflect applicable sales charges. |
| (a) | Per share amounts have been calculated using the average shares outstanding method. |
| (b) | Amount represents less than $0.005 per share. |
| (c) | The Fund incurred interest expense during the years ended December 31, 2014, 2011 and 2010. If interest expense had not been incurred, the ratios of operating expenses to average net assets would have been 2.00%, 2.00%, and 2.01% (Class AAA and Class A), 2.76%, 2.75%, and 2.76% (Class C), and 1.76%, 1.75%, and 1.76% (Class I), respectively. For the years ended December 31, 2013 and 2012, the effect of the interest expense was minimal. |
See accompanying notes to financial statements.
11
The Gabelli Global Rising Income and Dividend Fund
Notes to Financial Statements
1. Organization. The Gabelli Global Rising Income and Dividend Fund, a series of GAMCO Global Series Funds, Inc. (the “Corporation”), was incorporated on July 16, 1993 in Maryland. The Fund is a non-diversified open-end management investment company registered under the Investment Company Act of 1940, as amended (the “1940 Act”), and one of four separately managed portfolios (collectively, the “Portfolios”) of the Corporation. The Fund’s primary objective is to obtain a high level of total return through a combination of income and capital appreciation. The Fund commenced investment operations on February 3, 1994.
In conjunction with the Fund’s name change, the Fund implemented a policy to invest, under normal circumstances, at least 80% of its net assets in dividend paying securities.
2. Significant Accounting Policies. As an investment company, the Fund follows the investment company accounting and reporting guidance, which is part of U.S. generally accepted accounting principles (“GAAP”) that may require the use of management estimates and assumptions in the preparation of its financial statements. Actual results could differ from those estimates. The following is a summary of significant accounting policies followed by the Fund in the preparation of its financial statements.
Security Valuation. Portfolio securities listed or traded on a nationally recognized securities exchange or traded in the U.S. over-the-counter market for which market quotations are readily available are valued at the last quoted sale price or a market’s official closing price as of the close of business on the day the securities are being valued. If there were no sales that day, the security is valued at the average of the closing bid and asked prices or, if there were no asked prices quoted on that day, then the security is valued at the closing bid price on that day. If no bid or asked prices are quoted on such day, the security is valued at the most recently available price or, if the Board of Directors (the “Board”) so determines, by such other method as the Board shall determine in good faith to reflect its fair market value. Portfolio securities traded on more than one national securities exchange or market are valued according to the broadest and most representative market, as determined by Gabelli Funds, LLC (the “Adviser”).
Portfolio securities primarily traded on a foreign market are generally valued at the preceding closing values of such securities on the relevant market, but may be fair valued pursuant to procedures established by the Board if market conditions change significantly after the close of the foreign market, but prior to the close of business on the day the securities are being valued. Debt instruments with remaining maturities of sixty days or less that are not credit impaired are valued at amortized cost, unless the Board determines such amount does not reflect the securities’ fair value, in which case these securities will be fair valued as determined by the Board. Debt instruments having a maturity greater than sixty days for which market quotations are readily available are valued at the average of the latest bid and asked prices. If there were no asked prices quoted on such day, the security is valued using the closing bid price. U.S. government obligations with maturities greater than sixty days are normally valued using a model that incorporates market observable data such as reported sales of similar securities, broker quotes, yields, bids, offers, and reference data. Certain securities are valued principally using dealer quotations.
Securities and assets for which market quotations are not readily available are fair valued as determined by the Board. Fair valuation methodologies and procedures may include, but are not limited to: analysis and review of available financial and non-financial information about the company; comparisons with the valuation and changes in valuation of similar securities, including a comparison of foreign securities with the equivalent U.S.
12
The Gabelli Global Rising Income and Dividend Fund
Notes to Financial Statements (Continued)
dollar value American Depositary Receipt securities at the close of the U.S. exchange; and evaluation of any other information that could be indicative of the value of the security.
The inputs and valuation techniques used to measure fair value of the Fund’s investments are summarized into three levels as described in the hierarchy below:
| | — | | Level 1 — quoted prices in active markets for identical securities; |
| | — | | Level 2 — other significant observable inputs (including quoted prices for similar securities, interest rates, prepayment speeds, credit risk, etc.); and |
| | — | | Level 3 — significant unobservable inputs (including the Board’s determinations as to the fair value of investments). |
A financial instrument’s level within the fair value hierarchy is based on the lowest level of any input both individually and in the aggregate that is significant to the fair value measurement. The inputs or methodology used for valuing securities are not necessarily an indication of the risk associated with investing in those securities. The summary of the Fund’s investments in securities by inputs used to value the Fund’s investments as of December 31, 2014 is as follows:
| | | | | | | | | | | | | | | | | | | | |
| | | Valuation Inputs | | |
| | | Level 1
Quoted Prices | | Level 2 Other Significant
Observable Inputs | | Level 3 Significant
Unobservable Inputs | | Total Market Value
at 12/31/14 |
INVESTMENTS IN SECURITIES: | | | | | | | | | | | | | | | | | | | | |
ASSETS (Market Value): | | | | | | | | | | | | | | | | | | | | |
Convertible Corporate Bonds (a) | | | | — | | | | | $ 1,720,180 | | | | | $0 | | | | | $ 1,720,180 | |
Corporate Bonds (a) | | | | — | | | | | 20,000 | | | | | — | | | | | 20,000 | |
Common Stocks (a) | | | | $15,779,896 | | | | | — | | | | | — | | | | | 15,779,896 | |
Convertible Preferred Stocks (a) | | | | — | | | | | 84,489 | | | | | — | | | | | 84,489 | |
Warrants (a) | | | | 4,609 | | | | | — | | | | | — | | | | | 4,609 | |
U.S. Government Obligations | | | | — | | | | | 22,578,950 | | | | | — | | | | | 22,578,950 | |
TOTAL INVESTMENTS IN SECURITIES – ASSETS | | | | $15,784,505 | | | | | $24,403,619 | | | | | $0 | | | | | $40,188,124 | |
LIABILITIES (Market Value): | | | | | | | | | | | | | | | | | | | | |
Securities Sold Short(a) | | | | $ (56,408 | ) | | | | — | | | | | — | | | | | $ (56,408 | ) |
TOTAL INVESTMENTS IN SECURITIES - LIABILITIES | | | | $ (56,408 | ) | | | | — | | | | | — | | | | | $ (56,408 | ) |
| (a) | Please refer to the Schedule of Investments for the industry classifications of these portfolio holdings. |
The Fund did not have material transfers among Level 1, Level 2, and Level 3 during the year ended December 31, 2014. The Fund’s policy is to recognize transfers among Levels as of the beginning of the reporting period.
Additional Information to Evaluate Qualitative Information.
General. The Fund uses recognized industry pricing services – approved by the Board and unaffiliated with the Adviser – to value most of its securities, and uses broker quotes provided by market makers of securities not valued by these and other recognized pricing sources. Several different pricing feeds are received to value domestic equity securities, international equity securities, preferred equity securities, and fixed income securities. The data within these feeds is ultimately sourced from major stock exchanges and trading systems where these securities trade. The prices supplied by external sources are checked by obtaining quotations or actual transaction prices from market participants. If a price obtained from the pricing source is deemed unreliable, prices will be sought from another pricing service or from a broker/dealer that trades that security or similar securities.
13
The Gabelli Global Rising Income and Dividend Fund
Notes to Financial Statements (Continued)
Fair Valuation. Fair valued securities may be common and preferred equities, warrants, options, rights, and fixed income obligations. Where appropriate, Level 3 securities are those for which market quotations are not available, such as securities not traded for several days, or for which current bids are not available, or which are restricted as to transfer. Among the factors to be considered to fair value a security are recent prices of comparable securities that are publicly traded, reliable prices of securities not publicly traded, the use of valuation models, current analyst reports, valuing the income or cash flow of the issuer, or cost if the preceding factors do not apply. A significant change in the unobservable inputs could result in a lower or higher value in Level 3 securities. The circumstances of Level 3 securities are frequently monitored to determine if fair valuation measures continue to apply.
The Adviser reports quarterly to the Board the results of the application of fair valuation policies and procedures. These include back testing the prices realized in subsequent trades of these fair valued securities to fair values previously recognized.
Derivative Financial Instruments. The Fund may engage in various portfolio investment strategies by investing in a number of derivative financial instruments for the purposes of increasing the income of the Fund, hedging against changes in the value of its portfolio securities and in the value of securities it intends to purchase, or hedging against a specific transaction with respect to either the currency in which the transaction is denominated or another currency. Investing in certain derivative financial instruments, including participation in the options, futures, or swap markets, entails certain execution, liquidity, hedging, tax, and securities, interest, credit, or currency market risks. Losses may arise if the Adviser’s prediction of movements in the direction of the securities, foreign currency, and interest rate markets is inaccurate. Losses may also arise if the counterparty does not perform its duties under a contract, or that, in the event of default, the Fund may be delayed in or prevented from obtaining payments or other contractual remedies owed to it under derivative contracts. The creditworthiness of the counterparties is closely monitored in order to minimize these risks. Participation in derivative transactions involves investment risks, transaction costs, and potential losses to which the Fund would not be subject absent the use of these strategies. The consequences of these risks, transaction costs, and losses may have a negative impact on the Fund’s ability to pay distributions.
Collateral requirements differ by type of derivative. Collateral requirements are set by the broker or exchange clearing house for exchange traded derivatives, while collateral terms are contract specific for derivatives traded over-the-counter. Securities pledged to cover obligations of the Fund under derivative contracts are noted in the Schedule of Investments. Cash collateral, if any, pledged for the same purpose will be reported separately in the Statement of Assets and Liabilities.
The Fund’s policy with respect to offsetting is that, absent an event of default by the counterparty or a termination of the agreement, the master agreement does not result in an offset of reported amounts of financial assets and financial liabilities in the Statement of Assets and Liabilities across transactions between the Fund and the applicable counterparty. The enforceability of the right to offset may vary by jurisdiction.
The Fund’s derivative contracts held at December 31, 2014, if any, are not accounted for as hedging instruments under GAAP and are disclosed in the Schedule of Investments together with the related counterparty.
Forward Foreign Exchange Contracts. The Fund may engage in forward foreign exchange contracts for the purpose of hedging a specific transaction with respect to either the currency in which the transaction is
14
The Gabelli Global Rising Income and Dividend Fund
Notes to Financial Statements (Continued)
denominated or another currency as deemed appropriate by the Adviser. Forward foreign exchange contracts are valued at the forward rate and are marked-to-market daily. The change in market value is included in unrealized appreciation/depreciation on investments and foreign currency translations. When the contract is closed, the Fund records a realized gain or loss equal to the difference between the value of the contract at the time it was opened and the value at the time it was closed.
The use of forward foreign exchange contracts does not eliminate fluctuations in the underlying prices of the Fund’s portfolio securities, but it does establish a rate of exchange that can be achieved in the future. Although forward foreign exchange contracts limit the risk of loss due to a decline in the value of the hedged currency, they also limit any potential gain that might result should the value of the currency increase. As of December 31, 2014, the fund held no forward foreign exchange contracts.
The Fund’s volume of activity in forward foreign currency contracts which were held through May 28, 2014 had an average monthly notional amount of approximately $583,333, while held.
Securities Sold Short. The Fund may enter into short sale transactions. Short selling involves selling securities that may or may not be owned and, at times, borrowing the same securities for delivery to the purchaser, with an obligation to replace such borrowed securities at a later date. The proceeds received from short sales are recorded as liabilities and the Fund records an unrealized gain or loss to the extent of the difference between the proceeds received and the value of an open short position on the day of determination. The Fund records a realized gain or loss when the short position is closed out. By entering into a short sale, the Fund bears the market risk of an unfavorable change in the price of the security sold short. Dividends on short sales are recorded as an expense by the Fund on the ex-dividend date and interest expense is recorded on the accrual basis. The broker retains collateral for the value of the open positions, which is adjusted periodically as the value of the position fluctuates. Securities sold short and details of collateral at December 31, 2014 are reflected within the Schedule of Investments. For the year ended December 31, 2014, the Fund incurred $529 in service fees related to its short sales positions. The amount is included in the Statement of Operations - Expenses: Service fees for securities sold short.
Foreign Currency Translations. The books and records of the Fund are maintained in U.S. dollars. Foreign currencies, investments, and other assets and liabilities are translated into U.S. dollars at current exchange rates. Purchases and sales of investment securities, income, and expenses are translated at the exchange rate prevailing on the respective dates of such transactions. Unrealized gains and losses that result from changes in foreign exchange rates and/or changes in market prices of securities have been included in unrealized appreciation/depreciation on investments and foreign currency translations. Net realized foreign currency gains and losses resulting from changes in exchange rates include foreign currency gains and losses between trade date and settlement date on investment securities transactions, foreign currency transactions, and the difference between the amounts of interest and dividends recorded on the books of the Fund and the amounts actually received. The portion of foreign currency gains and losses related to fluctuation in exchange rates between the initial purchase trade date and subsequent sale trade date is included in realized gain/(loss) on investments.
Foreign Securities. The Fund may directly purchase securities of foreign issuers. Investing in securities of foreign issuers involves special risks not typically associated with investing in securities of U.S. issuers. The
15
The Gabelli Global Rising Income and Dividend Fund
Notes to Financial Statements (Continued)
risks include possible revaluation of currencies, the inability to repatriate funds, less complete financial information about companies, and possible future adverse political and economic developments. Moreover, securities of many foreign issuers and their markets may be less liquid and their prices more volatile than those of securities of comparable U.S. issuers.
Foreign Taxes. The Fund may be subject to foreign taxes on income, gains on investments, or currency repatriation, a portion of which may be recoverable. The Fund will accrue such taxes and recoveries as applicable, based upon its current interpretation of tax rules and regulations that exist in the markets in which it invests.
Restricted Securities. The Fund may invest up to 15% of its net assets in securities for which the markets are restricted. Restricted securities include securities whose disposition is subject to substantial legal or contractual restrictions. The sale of restricted securities often requires more time and results in higher brokerage charges or dealer discounts and other selling expenses than does the sale of securities eligible for trading on national securities exchanges or in the over-the-counter markets. Restricted securities may sell at a price lower than similar securities that are not subject to restrictions on resale. Securities freely saleable among qualified institutional investors under special rules adopted by the SEC may be treated as liquid if they satisfy liquidity standards established by the Board. The continued liquidity of such securities is not as well assured as that of publicly traded securities, and accordingly the Board will monitor their liquidity. For the restricted securities the Fund held as of December 31, 2014, refer to the Schedule of Investments.
Securities Transactions and Investment Income. Securities transactions are accounted for on the trade date with realized gain or loss on investments determined by using the identified cost method. Interest income (including amortization of premium and accretion of discount) is recorded on the accrual basis. Premiums and discounts on debt securities are amortized using the effective yield to maturity method. Dividend income is recorded on the ex-dividend date, except for certain dividends from foreign securities that are recorded as soon after the ex-dividend date as the Fund becomes aware of such dividends.
Determination of Net Asset Value and Calculation of Expenses. Certain administrative expenses are common to, and allocated among, various affiliated funds. Such allocations are made on the basis of each fund’s average net assets or other criteria directly affecting the expenses as determined by the Adviser pursuant to procedures established by the Board.
In calculating the NAV per share of each class, investment income, realized and unrealized gains and losses, redemption fees, and expenses other than class specific expenses are allocated daily to each class of shares based upon the proportion of net assets of each class at the beginning of each day. Distribution expenses are borne solely by the class incurring the expense.
Distributions to Shareholders. Distributions to shareholders are recorded on the ex-dividend date. Distributions to shareholders are based on income and capital gains as determined in accordance with federal income tax regulations, which may differ from income and capital gains as determined under GAAP. These differences are primarily due to differing treatments of income and gains on various investment securities and foreign currency transactions held by the Fund, timing differences, and differing characterizations of distributions made by the Fund. Distributions from net investment income for federal income tax purposes include net realized gains on foreign currency transactions. These book/tax differences are either temporary or permanent in nature. To the extent these differences are permanent; adjustments are made to the appropriate capital accounts in
16
The Gabelli Global Rising Income and Dividend Fund
Notes to Financial Statements (Continued)
the period when the differences arise. Permanent differences were primarily due to the tax treatment of currency gains and losses, recharacterization of distributions, and adjustment on bond conversion rates. These reclassifications have no impact on the NAV of the Fund. For the year ended December 31, 2014, reclassifications were made to decrease accumulated distributions in excess of net investment income by $7,034 and decrease accumulated net realized loss on investments and foreign currency transactions by $21,438, with an offsetting adjustment to paid-in capital.
The tax character of distributions paid during the years ended December 31, 2014 and 2013 was as follows:
| | | | | | | | | | |
| | | Year Ended
December 31, 2014 | | Year Ended
December 31, 2013 |
Distributions paid from:. | | | | | | | | | | |
Ordinary income | | | | $426,840 | | | | | $78,863 | |
Net long term capital gains | | | | 35,196 | | | | | — | |
Return of capital | | | | — | | | | | 5,138 | |
| | | | | | | | | | |
Total | | | | $462,036 | | | | | $84,001 | |
| | | | | | | | | | |
Provision for Income Taxes. The Fund intends to continue to qualify as a regulated investment company under Subchapter M of the Internal Revenue Code of 1986, as amended (the “Code”). It is the policy of the Fund to comply with the requirements of the Code applicable to regulated investment companies and to distribute substantially all of its net investment company taxable income and net capital gains. Therefore, no provision for federal income taxes is required.
As of December 31, 2014, the components of accumulated earnings/losses on a tax basis were as follows:
| | | | |
Accumulated capital loss carryforwards | | $ | (916,272 | ) |
Undistributed ordinary income | | | 56,137 | |
Net unrealized appreciation on investments, securities sold short, and foreign currency translations | | | 1,075,081 | |
| | | | |
Total | | $ | 214,946 | |
| | | | |
At December 31, 2014, the Fund had net capital loss carryforwards for federal income tax purposes which are available to reduce future required distributions of net capital gains to shareholders. Under the Regulated Investment Company Modernization Act of 2010, the Fund is permitted to carry forward for an unlimited period capital losses incurred in years beginning after December 22, 2010. In addition, these losses must be utilized prior to the losses incurred in pre-enactment taxable years. As a result of the rule, pre-enactment capital loss carryforwards may have an increased likelihood of expiring unused. Additionally, post enactment capital losses that are carried forward will retain their character as either short term or long term capital losses rather than being considered all short term as under previous law. The Fund has a capital loss carryforward available through 2016 of $916,272.
During the year ended December 31, 2014, the Fund utilized capital loss carryforwards of $785,369.
At December 31, 2014, the differences between book basis and tax basis unrealized appreciation were primarily due to deferral of losses from wash sales for tax purposes, mark-to-market adjustments on investments in passive foreign investment companies, and adjustments on income from an investment in a defaulted security.
17
The Gabelli Global Rising Income and Dividend Fund
Notes to Financial Statements (Continued)
The following summarizes the tax cost of investments and the related net unrealized appreciation/depreciation at December 31, 2014:
| | | | | | | | | | | | | | | | | | | | |
| | | Cost
(Proceeds) | | Gross
Unrealized
Appreciation | | Gross
Unrealized
Depreciation | | Net Unrealized
Appreciation/
Depreciation |
Investments | | | | $39,105,198 | | | | | $2,045,382 | | | | | $(962,456 | ) | | | | $1,082,926 | |
Securities sold short | | | | (47,976 | ) | | | | — | | | | | (8,432 | ) | | | | (8,432 | ) |
| | | | | | | | | | | | | | | | | | | | |
| | | | | | | | | $2,045,382 | | | | | $(970,888 | ) | | | | $1,074,494 | |
| | | | | | | | | | | | | | | | | | | | |
The Fund is required to evaluate tax positions taken or expected to be taken in the course of preparing the Fund’s tax returns to determine whether the tax positions are “more-likely-than-not” of being sustained by the applicable tax authority. Income tax and related interest and penalties would be recognized by the Fund as tax expense in the Statement of Operations if the tax positions were deemed not to meet the more-likely-than-not threshold. For the year ended December 31, 2014, the Fund did not incur any interest or penalties. As of December 31, 2014, the Adviser has reviewed all open tax years and concluded that there was no impact to the Fund’s net assets or results of operations. The Fund’s federal and state tax returns for the prior three fiscal years remain open, subject to examination. On an ongoing basis, the Adviser will monitor the Fund’s tax positions to determine if adjustments to this conclusion are necessary.
3. Investment Advisory Agreement and Other Transactions. The Fund has entered into an investment advisory agreement (the “Advisory Agreement”) with the Adviser which provides that the Fund will pay the Adviser a fee, computed daily and paid monthly, at the annual rate of 1.00% of the value of its average daily net assets. In accordance with the Advisory Agreement, the Adviser provides a continuous investment program for the Fund’s portfolio, oversees the administration of all aspects of the Fund’s business and affairs, and pays the compensation of all Officers and Directors of the Fund who are affiliated persons of the Adviser.
The Adviser has contractually agreed to waive its investment advisory fee and/or to reimburse expenses of the Fund to the extent necessary to maintain the annualized total operating expenses of the Fund (excluding brokerage, acquired fund fees and expenses, interest, taxes, and extraordinary expenses) until at least May 1, 2015, at no more than 2.00%, 2.00%, 2.75%, and 1.75% of the value of the Fund’s average daily net assets for Class AAA, Class A, Class C, and Class I Shares, respectively. For the year ended December 31, 2014, the Adviser reimbursed the Fund in the amount of $16,424. In addition, the Fund has agreed, during the two year period following any waiver or reimbursement by the Adviser, to repay such amount to the extent, after giving effect to the repayment, such adjusted annualized total operating expenses of the Fund would not exceed 2.00%, 2.00%, 2.75%, and 1.75% of the value of the Fund’s average daily net assets for Class AAA, Class A, Class C, and Class I, respectively. The agreement is renewable annually. For the year ended December 31, 2014, the cumulative amount which the Fund may repay the Adviser is $62,315.
| | | | |
For the year ended December 31, 2013, expiring December 31, 2015 | | $ | 45,891 | |
For the year ended December 31, 2014, expiring December 31, 2016 | | | 16,424 | |
| | | | |
| | $ | 62,315 | |
| | | | |
The Corporation pays each Director who is not considered to be an affiliated person an annual retainer of $6,000 plus $1,000 for each Board meeting attended, and they are reimbursed for any out of pocket expenses incurred in attending meetings. All Board committee members receive $1,000 per meeting attended. The Chairman of the Audit Committee receives an annual fee of $3,000, and the Lead Director receives an annual fee of
18
The Gabelli Global Rising Income and Dividend Fund
Notes to Financial Statements (Continued)
$2,000. A Director may receive a single meeting fee, allocated among the participating funds, for attending certain meetings held on behalf of multiple funds. Directors who are directors or employees of the Adviser or an affiliated company receive no compensation or expense reimbursement from the Corporation.
4. Distribution Plan. The Fund’s Board has adopted a distribution plan (the “Plan”) for each class of shares, except for Class I Shares, pursuant to Rule 12b-1 under the 1940 Act. Under the Class AAA, Class A, and Class C Share Plans, payments are authorized to G.distributors, LLC (the “Distributor”), an affiliate of the Adviser, at annual rates of 0.25%, 0.25%, and 1.00%, respectively, of the average daily net assets of those classes, the annual limitations under each Plan. Such payments are accrued daily and paid monthly.
5. Portfolio Securities. Purchases and sales of securities during the year ended December 31, 2014, other than short term securities and U.S. Government obligations, aggregated $10,126,958 and $11,419,826, respectively.
6. Transactions with Affiliates. During the year ended December 31, 2014, the Fund paid brokerage commissions on security trades of $6,149 to G.research, Inc., an affiliate of the Adviser. Additionally the Distributor retained a total of $773 from investors representing commissions (sales charges and underwriting fees) on sales and redemptions of Fund shares.
The cost of calculating the Fund’s NAV per share is a Fund expense pursuant to the Advisory Agreement. The Adviser did not seek a reimbursement during the year ended December 31, 2014.
7. Line of Credit. The Fund participates in an unsecured line of credit of up to $75,000,000 under which it may borrow up to 10% of its net assets from the custodian for temporary borrowing purposes. Borrowings under this arrangement bear interest at the higher of the sum of the overnight LIBOR rate plus 100 basis points or the sum of the federal funds rate plus 100 basis points at the time of borrowing. This amount, if any, would be included in “Interest expense” in the Statement of Operations. At December 31, 2014, there were no borrowings under the line of credit.
The average daily amount of borrowings under the line of credit during the year ended was $94,907 with a weighted average interest rate of 1.11%. The maximum amount borrowed at any time during the year ended December 31, 2014 was $1,994,000.
8. Capital Stock. The Fund offers four classes of shares – Class AAA Shares, Class A Shares, Class C Shares, and Class I Shares. Class AAA Shares are offered without a front-end sales charge only to investors who acquire them directly from the Distributor, through selected broker/dealers, or the transfer agent. Class I Shares are offered without a sales charge, directly through the Distributor or brokers that have entered into selling agreements specifically with respect to Class I Shares. Class A Shares are subject to a maximum front-end sales charge of 5.75%. Class C Shares are subject to a 1.00% contingent deferred sales charge for one year after purchase.
The Fund imposes a redemption fee of 2.00% on all classes of shares that are redeemed or exchanged on or before the seventh day after the date of a purchase. The redemption fee is deducted from the proceeds otherwise payable to the redeeming shareholders and is retained by the Fund as an increase in paid-in capital. The redemption fees retained by the Fund during the years ended December 31, 2014 and 2013, if any, can be found in the Statement of Changes in Net Assets under Redemption Fees.
19
The Gabelli Global Rising Income and Dividend Fund
Notes to Financial Statements (Continued)
The Fund effected a 1 for 5 reverse stock split on August 9, 2013, as approved by the Board of Directors. The net asset value of each share class increased proportionately at that time.
Transactions in shares of capital stock were as follows:
| | | | | | | | | | | | | | | | |
| | | Year Ended
December 31, 2014 | | | Year Ended
December 31, 2013 | |
| | | Shares | | | Amount | | | Shares | | | Amount | |
Class AAA | | | | | | | | | | | | | | | | |
Shares sold | | | 161,281 | | | $ | 3,587,504 | | | | 2,745,296 | | | $ | 11,467,597 | |
Shares issued upon reinvestment of distributions | | | 8,885 | | | | 196,352 | | | | 3,048 | | | | 66,457 | |
Shares redeemed | | | (401,243 | ) | | | (8,818,875 | ) | | | (616,741 | ) | | | (3,656,073 | ) |
Shares reduced by 1 for 5 reverse stock split | | | — | | | | — | | | | (3,392,985 | ) | | | — | |
| | | | | | | | | | | | | | | | |
Net increase/(decrease) | | | (231,077 | ) | | $ | (5,035,019 | ) | | | (1,261,382 | ) | | $ | 7,877,981 | |
| | | | | | | | | | | | | | | | |
Class A | | | | | | | | | | | | | | | | |
Shares sold | | | 11,717 | | | $ | 261,055 | | | | 22,485 | | | $ | 240,386 | |
Shares issued upon reinvestment of distributions | | | 242 | | | | 5,370 | | | | 46 | | | | 997 | |
Shares redeemed | | | (10,443 | ) | | | (229,406 | ) | | | (23,364 | ) | | | (183,983 | ) |
Shares reduced by 1 for 5 reverse stock split | | | — | | | | — | | | | (45,520 | ) | | | — | |
| | | | | | | | | | | | | | | | |
Net increase/(decrease) | | | 1,516 | | | $ | 37,019 | | | | (46,353 | ) | | $ | 57,400 | |
| | | | | | | | | | | | | | | | |
Class C | | | | | | | | | | | | | | | | |
Shares sold | | | 7,619 | | | $ | 142,923 | | | | 476 | | | $ | 8,996 | |
Shares issued upon reinvestment of distributions | | | 144 | | | | 2,750 | | | | 2 | | | | 41 | |
Shares redeemed | | | — | | | | — | | | | (6,610 | ) | | | (24,095 | ) |
Shares reduced by 1 for 5 reverse stock split | | | — | | | | — | | | | (29 | ) | | | — | |
| | | | | | | | | | | | | | | | |
Net increase/(decrease) | | | 7,763 | | | $ | 145,673 | | | | (6,161 | ) | | $ | (15,058 | ) |
| | | | | | | | | | | | | | | | |
Class I | | | | | | | | | | | | | | | | |
Shares sold | | | 1,119,728 | | | $ | 25,096,991 | | | | 43,420 | | | $ | 919,938 | |
Shares issued upon reinvestment of distributions | | | 11,350 | | | | 252,079 | | | | 678 | | | | 14,856 | |
Shares redeemed | | | (9,556 | ) | | | (208,871 | ) | | | (115,354 | ) | | | (545,463 | ) |
Shares reduced by 1 for 5 reverse stock split | | | — | | | | — | | | | (312,742 | ) | | | — | |
| | | | | | | | | | | | | | | | |
Net increase/(decrease) | | | 1,121,522 | | | $ | 25,140,199 | | | | (383,998 | ) | | $ | 389,331 | |
| | | | | | | | | | | | | | | | |
9. Significant Shareholder. As of December 31, 2014, approximately 89% of the Fund was beneficially owned by the Adviser and its affiliates.
10. Indemnifications. The Fund enters into contracts that contain a variety of indemnifications. The Fund’s maximum exposure under these arrangements is unknown. However, the Fund has not had prior claims or losses pursuant to these contracts. Management has reviewed the Fund’s existing contracts and expects the risk of loss to be remote.
11. Subsequent Events. Management has evaluated the impact on the Fund of all subsequent events occurring through the date the financial statements were issued and has determined that there were no subsequent events requiring recognition or disclosure in the financial statements.
20
The Gabelli Global Rising Income and Dividend Fund
Report of Independent Registered Public Accounting Firm
To the Board of Directors of GAMCO Global Series Funds, Inc. and the
Shareholders of The Gabelli Global Rising Income and Dividend Fund
We have audited the accompanying statement of assets and liabilities, including the schedule of investments, of The Gabelli Global Rising Income and Dividend Fund (the “Fund”), one of the series constituting GAMCO Global Series Funds, Inc., as of December 31, 2014, and the related statement of operations for the year then ended, the statements of changes in net assets for each of the two years in the period then ended, and the financial highlights for each of the five years in the period then ended. These financial statements and financial highlights are the responsibility of the Fund’s management. Our responsibility is to express an opinion on these financial statements and financial highlights based on our audits.
We conducted our audits in accordance with the standards of the Public Company Accounting Oversight Board (United States). Those standards require that we plan and perform the audit to obtain reasonable assurance about whether the financial statements and financial highlights are free of material misstatement. We were not engaged to perform an audit of the Fund’s internal control over financial reporting. Our audits included consideration of internal control over financial reporting as a basis for designing audit procedures that are appropriate in the circumstances, but not for the purpose of expressing an opinion on the effectiveness of the Fund’s internal control over financial reporting. Accordingly, we express no such opinion. An audit also includes examining, on a test basis, evidence supporting the amounts and disclosures in the financial statements and financial highlights, assessing the accounting principles used and significant estimates made by management, and evaluating the overall financial statement presentation. Our procedures included confirmation of securities owned as of December 31, 2014, by correspondence with the Fund’s custodian and brokers, or by other appropriate auditing procedures where replies from brokers were not received. We believe that our audits provide a reasonable basis for our opinion.
In our opinion, the financial statements and financial highlights referred to above present fairly, in all material respects, the financial position of the Fund at December 31, 2014, the results of its operations for the year then ended, the changes in its net assets for each of the two years in the period then ended, and its financial highlights for each of the five years in the period then ended, in conformity with U.S. generally accepted accounting principles.

New York, New York
February 25, 2015
21
The Gabelli Global Rising Income and Dividend Fund
Board Consideration and Re-Approval of Investment Advisory Agreements (Unaudited)
During the six months ended December 31, 2014, the Board of Directors of the Corporation approved the continuation of the investment advisory agreement with the Adviser for the Fund on the basis of the recommendation by the directors (the “Independent Board Members”) who are not “interested persons” of the Fund. The following paragraphs summarize the material information and factors considered by the Independent Board Members as well as their conclusions relative to such factors.
Nature, Extent, and Quality of Services. The Independent Board Members considered information regarding the portfolio manager, the depth of the analyst pool available to the Adviser and the Fund’s portfolio manager, the scope of supervisory, administrative, shareholder, and other services supervised or provided by the Adviser, and the absence of significant service problems reported to the Board. The Independent Board Members noted the experience, length of service, and reputation of the Fund’s portfolio manager.
Investment Performance. The Independent Board Members reviewed the short and medium term performance of the Fund against a peer group of convertible securities funds. The Independent Board Members noted that the Fund had substantially changed its investment strategy early in the year and that consequently comparisons with convertible securities funds would no longer be relevant for periods since the transition to the new strategy focusing on common equity securities expected to increase dividends over time. The Independent Board Members noted that the Fund’s performance for the short period since the change has improved and also noted that, in relation to the historical peer group, the Fund’s performance for the one, three, and five year periods was poor. The Independent Board Members also acknowledged the limitations of the peer group selected because there was only one other dedicated global convertible fund in the peer group.
Profitability. The Independent Board Members reviewed summary data regarding the lack of profitability of the Fund to the Adviser both with an administrative overhead charge and without such a charge. The Independent Board Members also noted that a portion of the Fund’s portfolio transactions were executed by an affiliated broker of the Adviser and that another affiliated broker of the Adviser received distribution fees and minor amounts of sales commissions.
Economies of Scale. The Independent Board Members discussed the major elements of the Adviser’s cost structure and the relationship of those elements to potential economies of scale and reviewed rudimentary data relating to the impact of 20% growth in the Fund on the Adviser’s profitability.
Sharing of Economies of Scale. The Independent Board Members noted that the investment management fee schedule for the Fund does not take into account any potential economies of scale that may develop.
Service and Cost Comparisons. The Independent Board Members compared the expense ratios of the investment management fee, other expenses, and total expenses of the Fund with similar expense ratios of the peer group of convertible securities funds and noted that the Adviser’s management fee includes substantially all administrative services of the Fund as well as investment advisory services. The Independent Board Members noted that the Fund’s expense ratios, after voluntary expense reimbursements, were significantly higher than and the Fund’s size was significantly lower than average within this group. The Independent Board Members also noted that all but one of the peer group were domestic convertible funds, thereby limiting the usefulness of peer group comparisons. The Independent Board Members were presented with, but did not consider to be material to their decision, various information comparing the advisory fee with the fee for other types of accounts managed by the Adviser.
22
The Gabelli Global Rising Income and Dividend Fund
Board Consideration and Re-Approval of Investment Advisory Agreements (Unaudited) (Continued)
Conclusions. The Independent Board Members concluded that the Fund enjoyed highly experienced portfolio management services, good ancillary services but had a relatively poor performance record and had substantially changed its investment focus in 2013. The Independent Board Members also concluded that the Fund’s expense ratios were reasonable, particularly in light of the lack of profitability to the Adviser of managing the Fund, and that economies of scale were not a significant factor in their thinking at this time. The Independent Board Members did not view the potential profitability of ancillary services as material to their decision. On the basis of the foregoing and without assigning particular weight to any single conclusion, the Independent Board Members determined to recommend continuation of the investment management agreement to the full Board of Directors.
23
The Gabelli Global Rising Income and Dividend Fund
Additional Fund Information (Unaudited)
The business and affairs of the Fund are managed under the direction of the Corporation’s Board of Directors. Information pertaining to the Directors and officers of the Fund is set forth below. The Corporation’s Statement of Additional Information includes additional information about the Fund’s Directors and is available without charge, upon request, by calling 800-GABELLI (800-422-3554) or by writing to The Gabelli Global Rising Income and Dividend Fund at One Corporate Center, Rye, NY 10580-1422.
| | | | | | | | |
Name, Position(s) Address1 and Age | | Term of Office and Length of Time Served2 | | Number of Funds in Fund Complex Overseen by Director | | Principal Occupation(s) During Past Five Years | | Other Directorships Held by Director4 |
| | | | |
INTERESTED DIRECTORS3 : | | | | | | | | |
| | | | |
Mario J. Gabelli, CFA Director and Chief Investment Officer Age: 72 | | Since 1993 | | 28 | | Chairman, Chief Executive Officer, and Chief Investment Officer–Value Portfolios of GAMCO Investors, Inc., and Chief Investment Officer– Value Portfolios of Gabelli Funds, LLC and GAMCO Asset Management Inc.; Director/ Trustee or Chief Investment Officer of other registered investment companies in the Gabelli/ GAMCO Fund Complex; Chief Executive Officer of GGCP, Inc. | | Director of Morgan Group Holdings, Inc. (holding company); Chairman of the Board and Chief Executive Officer of LICT Corp. (multimedia and communication services); Director of CIBL, Inc. (broadcasting and wireless communications); Director of ICTC Group, Inc. (communications); Director of RLJ Acquisition Inc. (blank check company) (2011-2012) |
John D. Gabelli Director Age: 70 | | Since 1993 | | 10 | | Senior Vice President of G.research, Inc. | | — |
| | | | |
INDEPENDENT DIRECTORS5 : | | | | | | | | |
| | | | |
E. Val Cerutti Director Age: 75 | | Since 2001 | | 7 | | Chief Executive Officer of Cerutti Consultants, Inc. | | Director of LGL Group, Inc. (diversified manufacturing) (1990-2009) |
| | | | |
Anthony J. Colavita Director Age: 79 | | Since 1993 | | 37 | | President of the law firm of Anthony J. Colavita, P.C. | | — |
| | | | |
Arthur V. Ferrara Director Age: 84 | | Since 2001 | | 8 | | Former Chairman of the Board and Chief Executive Officer of The Guardian Life Insurance Company of America (1993 – 1995) | | — |
| | | | |
Werner J. Roeder, MD Director Age: 74 | | Since 1993 | | 23 | | Former Medical Director of Lawrence Hospital and practicing private physician | | — |
| | | | |
Anthonie C. van Ekris Director Age: 80 | | Since 1993 | | 20 | | Chairman and Chief Executive Officer of BALMAC International, Inc. (commodities and futures trading) | | — |
| | | | |
Salvatore J. Zizza Director Age: 69 | | Since 2004 | | 31 | | Chairman of Zizza & Associates Corp. (financial consulting); Chairman of Metropolitan Paper Recycling, Inc. (recycling) (since 2005); Chairman of Harbor Diversified, Inc. (pharmaceuticals) (since 1999); Chairman of BAM (semiconductor and aerospace manufacturing) (since 2000); Chairman of Bergen Cove Realty Inc. (since 2002) | | Director and Vice Chairman of Trans-Lux Corporation (business services); Director and Chairman of Harbor Diversified, Inc. (pharmaceuticals); Chairman of Bion Environmental Technologies (technology) (2005-2007); Director, Chairman, and CEO of General Employment Enterprises (staffing services) (2009-2012) |
24
The Gabelli Global Rising Income and Dividend Fund
Additional Fund Information (Continued) (Unaudited)
| | | | |
Name, Position(s) Address1 and Age | | Term of Office and Length of Time Served2 | | Principal Occupation(s) During Past Five Years |
| | |
OFFICERS: | | | | |
| | |
Bruce N. Alpert President Age: 63 | | Since 2003 | | Executive Vice President and Chief Operating Officer of Gabelli Funds, LLC since 1988; and an Officer of registered investment companies in the Gabelli/GAMCO Fund Complex; Director of Teton Advisors, Inc. 1998-2012; Chairman of Teton Advisors, Inc. 2008-2010; President of Teton Advisors, Inc. 1998-2008; Senior Vice President of GAMCO Investors, Inc. since 2008 |
| | |
Andrea R. Mango Secretary Age: 42 | | Since November 2013 | | Counsel of Gabelli Funds, LLC; Corporate Vice President within the Corporate Compliance Department of New York Life Insurance Company 2011-2013; Vice President and Counsel of Deutsche Bank 2006-2011 |
| | |
Agnes Mullady Treasurer Age: 56 | | Since 2006 | | President and Chief Operating Officer of the Open-End Fund Division of Gabelli Funds, LLC since September 2010; Senior Vice President of GAMCO Investors, Inc. since 2009; Vice President of Gabelli Funds, LLC since 2007; Officer of all of the registered investment companies in the Gabelli/GAMCO Fund Complex |
| | |
Richard J. Walz Chief Compliance Officer Age: 55 | | Since November 2013 | | Chief Compliance Officer of the Gabelli/GAMCO Fund Complex; Chief Compliance Officer of AEGON USA Investment Management LLC 2011-2013; Chief Compliance Officer of Cutwater Asset Management 2004-2011 |
| 1 | Address: One Corporate Center, Rye, NY 10580-1422, unless otherwise noted. |
| 2 | Each Director will hold office for an indefinite term until the earliest of (i) the next meeting of shareholders, if any, called for the purpose of considering the election or re-election of such Director and until the election and qualification of his or her successor, if any, elected at such meeting, or (ii) the date a Director resigns or retires, or a Director is removed by the Board of Directors or shareholders, in accordance with the Corporation’s By-Laws and Articles of Incorporation. Each officer will hold office for an indefinite term until the date he or she resigns or retires or until his or her successor is elected and qualified. |
| 3 | “Interested person” of the Corporation as defined in the 1940 Act. Messrs. Gabelli are each considered an “interested person” because of their affiliation with Gabelli Funds, LLC which acts as the Corporation’s investment adviser. Mario J. Gabelli and John D. Gabelli are brothers. |
| 4 | This column includes only directorships of companies required to report to the SEC under the Securities Exchange Act of 1934, as amended, i.e., public companies, or other investment companies registered under the 1940 Act. |
| 5 | Directors who are not interested persons are considered “Independent” Directors. |
25
| | | | |
| | | |
| | | Gabelli/GAMCO Funds and Your Personal Privacy | | |
| | | Who are we? The Gabelli/GAMCO Funds are investment companies registered with the Securities and Exchange Commission under the Investment Company Act of 1940. We are managed by Gabelli Funds, LLC and GAMCO Asset Management Inc., which are affiliated with GAMCO Investors, Inc. GAMCO Investors, Inc. is a publicly held company that has subsidiaries that provide investment advisory or brokerage services for a variety of clients. What kind of non-public information do we collect about you if you become a fund shareholder? If you apply to open an account directly with us, you will be giving us some non-public information about yourself. The non-public information we collect about you is: — Information you give us on your application form. This could include your name, address, telephone number, social security number, bank account number, and other information. — Information about your transactions with us, any transactions with our affiliates, and transactions with the entities we hire to provide services to you. This would include information about the shares that you buy or redeem. If we hire someone else to provide services — like a transfer agent — we will also have information about the transactions that you conduct through them. What information do we disclose and to whom do we disclose it? We do not disclose any non-public personal information about our customers or former customers to anyone other than our affiliates, our service providers who need to know such information, and as otherwise permitted by law. If you want to find out what the law permits, you can read the privacy rules adopted by the Securities and Exchange Commission. They are in volume 17 of the Code of Federal Regulations, Part 248. The Commission often posts information about its regulations on its website, www.sec.gov. What do we do to protect your personal information? We restrict access to non-public personal information about you to the people who need to know that information in order to provide services to you or the fund and to ensure that we are complying with the laws governing the securities business. We maintain physical, electronic, and procedural safeguards to keep your personal information confidential. | | |
THE GABELLI GLOBAL RISING INCOME AND DIVIDEND FUND
One Corporate Center
Rye, NY 10580-1422
Portfolio Manager Biography
Mario J. Gabelli, CFA, is Chairman and Chief Executive Officer of GAMCO Investors, Inc. that he founded in 1977 and Chief Investment Officer – Value Portfolios of Gabelli Funds, LLC and GAMCO Asset Management Inc. Mr. Gabelli is a summa cum laude graduate of Fordham University and holds an MBA degree from Columbia Business School and Honorary Doctorates from Fordham University and Roger Williams University.
| | |
2014 TAX NOTICE TO SHAREHOLDERS (Unaudited) For the year ended December 31, 2014, the Fund paid to shareholders ordinary income distributions (comprised of net investment income) totaling $0.254, $0.259, $0.239, and $0.315 per share for Class AAA, Class A, Class C, and Class I Shares, respectively. For the year ended December 31, 2014, 28.74% of the ordinary income distribution qualifies for the dividends received deduction available to corporations. The Fund designates 100% of the ordinary income distribution as qualified dividend income pursuant to the Jobs and Growth Tax Relief Reconciliation Act of 2003. The Fund designates 7.69% of the ordinary income distribution as qualified interest income pursuant to the Tax Relief, Unemployment Reauthorization, and Job Creation Act of 2010. U.S. Government Income: |
The percentage of the ordinary income distribution paid by the Fund during the year ended December 31, 2014 which was derived from U.S. Treasury securities was 0.09%. Such income is exempt from state and local tax in all states. However, many states, including New York and California, allow a tax exemption for a portion of the income earned only if a mutual fund has invested at least 50% of its assets at the end of each quarter of the Fund’s fiscal year in U.S. Government securities. The Fund did not meet this strict requirement in 2014. The percentage of U.S. Government securities held as of December 31, 2014 was 56.05%. Due to the diversity in state and local tax law, it is recommended that you consult your personal tax adviser as to the applicability of the information provided to your specific situation. |
| | | |
All designations are based on financial information available as of the date of this annual report and, accordingly, are subject to change. For each item, it is the intention of the Fund to designate the maximum amount permitted under the Internal Revenue Code and the regulations thereunder. |
|
We have separated the portfolio manager’s commentary from the financial statements and investment portfolio due to corporate governance regulations stipulated by the Sarbanes-Oxley Act of 2002. We have done this to ensure that the content of the portfolio manager’s commentary is unrestricted. The financial statements and investment portfolio are mailed separately from the commentary. Both the commentary and the financial statements, including the portfolio of investments, will be available on our website at www.gabelli.com |
GAMCO Global Series Funds, Inc.
THE GABELLI GLOBAL RISING INCOME
AND DIVIDEND FUND
One Corporate Center
Rye, New York 10580-1422
t 800-GABELLI (800-422-3554)
f 914-921-5118
e info@gabelli.com
GABELLI.COM
Net Asset Value per share available daily
by calling 800-GABELLI after 7:00 P.M.
| | |
| BOARD OF DIRECTORS | | |
| |
| Mario J. Gabelli, CFA | | Salvatore J. Zizza |
Chairman and | | Chairman, |
Chief Executive Officer, | | Zizza & Associates Corp. |
GAMCO Investors, Inc. | | |
| | OFFICERS |
E. Val Cerutti Chief Executive Officer, Cerutti Consultants, Inc. Anthony J. Colavita President, Anthony J. Colavita, P.C. Arthur V. Ferrara Former Chairman and Chief Executive Officer, Guardian Life Insurance Company of America John D. Gabelli Senior Vice President, G.research, Inc. Werner J. Roeder, MD Former Medical Director, Lawrence Hospital | | Bruce N. Alpert President Andrea R. Mango Secretary Agnes Mullady Treasurer Richard J. Walz Chief Compliance Officer DISTRIBUTOR G.distributors, LLC CUSTODIAN, TRANSFER AGENT, AND DIVIDEND DISBURSING AGENT State Street Bank and Trust Company |
|
|
|
|
|
|
|
|
|
|
|
|
|
| |
Anthonie C. van Ekris Chairman, BALMAC International, Inc. | | LEGAL COUNSEL |
| Skadden, Arps, Slate, Meagher & |
| Flom LLP |
| | |
This report is submitted for the general information of the shareholders of The Gabelli Global Rising Income and Dividend Fund. It is not authorized for distribution to prospective investors unless preceded or accompanied by an effective prospectus. |
GAB441Q414AR
The GAMCO Global Growth Fund
Annual Report — December 31, 2014
(Y)our Portfolio Management Team

Morningstar® rated The GAMCO Global Growth Fund Class AAA Shares 4 stars overall and 4 stars for the three, five, and ten year periods ended December 31, 2014, among 881, 881, 688, and 346 World Stock funds, respectively. Morningstar RatingTM is based on risk-adjusted returns.
To Our Shareholders,
For the year ended December 31, 2014, the net asset value (“NAV”) per Class AAA Share of The GAMCO Global Growth Fund increased 3.9% compared with an increase of 4.2% for the Morgan Stanley Capital International (“MSCI”) All Country (“AC”) World Index. See page 3 for additional performance information.
Enclosed are the financial statements, including the schedule of investments, as of December 31, 2014.
Performance Discussion (Unaudited)
For the year, 9 of 23 major national indices provided positive returns. Countries posting positive returns for 2014 were led by Israel (+22.8%), followed by the United States (+12.7%), New Zealand (+7.3%), Denmark (+6.2%), Hong Kong (+5.1%), Belgium (+4.1%), Singapore (+3.0%), Ireland (+2.3%), and Canada (+1.5%). Countries posting negative returns for 2014 were led by Portugal (-38.2%), followed by Austria (+29.8%), Norway (-22.0%), Germany (-10.4%), France (-9.9%), Italy (-9.5%), Sweden (-7.5%), the United Kingdom (-5.4%), Spain (-4.7%), Japan (-4.0%), the Netherlands (-3.5%), Australia (-3.4%), Finland (-0.7%), and Switzerland (-0.1%). Within emerging markets, 12 of 21 countries posted positive yearly results. Of the four largest emerging markets, India (+21.9%) posted the best yearly return, followed by China (+4.7%), Brazil (-17.4%), and Russia (-48.5%).
Most of the headline grabbing events of 2014 took place outside the United States, such as the Ukrainian conflict, the rise of ISIS in the Middle East, and the outbreak of Ebola in West Africa. Japan slipped back into recession as confidence in Abenomics waned. It is difficult to expand an economy when your population is shrinking, no matter how much stimulus you employ. China is slowing as its economy makes the transition from investment (think construction) led growth to more consumption led growth. The U.S. will benefit from the roughly 50% decline in the price of crude since last June. Every one cent decline in the price of a gallon of gasoline translates into an extra billion dollars of consumer free cash flow.
Selected holdings that contributed positively to performance in 2014 were: Visa Inc. (1.4% of net assets as December 31, 2014), a payments technology company, operating as a retail electronic payments network worldwide; Naspers Ltd. (1.3%), providing ecommerce and other Internet services, pay-television, and print media services worldwide; CVS Health Corp. (1.1%) a provider of integrated pharmacy health care services. Some of our weaker performing holdings during the year were Pioneer Natural Resources Co. (1.0%), a large independent oil and gas company; Continental Resources Inc. (0.9%), engaged in the exploration, development, and production of crude oil and natural gas; and Boulder Brands Inc. (no longer held in the portfolio).
We appreciate your confidence and trust.
|
Sincerely yours, |
|

|
|
Bruce N. Alpert |
President |
February 20, 2015
2
Comparative Results
| | | | | | | | | | | | | | | | |
Average Annual Returns through December 31, 2014 (a) (Unaudited) | |
| | | 1 Year | | | 5 Year | | | 10 Year | | | Since
Inception
(2/7/94) | |
Class AAA (GICPX) | | | 3.90 | % | | | 11.55 | % | | | 7.57 | % | | | 9.07 | % |
MSCI AC World Index | | | 4.16 | | | | 9.17 | | | | 6.09 | | | | 6.74 | (d) |
Lipper Global Large-Cap Growth Fund Classification | | | 2.79 | | | | 10.67 | | | | 7.14 | | | | 9.87 | |
Class A (GGGAX) | | | 3.90 | | | | 11.56 | | | | 7.57 | | | | 9.08 | |
With sales charge (b) | | | (2.07 | ) | | | 10.24 | | | | 6.94 | | | | 8.78 | |
Class C (GGGCX) | | | 3.12 | | | | 10.72 | | | | 6.77 | | | | 8.50 | |
With contingent deferred sales charge (c) | | | 2.12 | | | | 10.72 | | | | 6.77 | | | | 8.50 | |
Class I (GGGIX) | | | 4.32 | | | | 11.87 | | | | 7.79 | | | | 9.18 | |
In the current prospectuses dated April 30, 2014, as amended August 25, 2014, the expense ratios for Class AAA, A, C, and I Shares are 1.77%, 1.77%, 2.52%, and 1.52%, respectively, and the net expense ratios for these share classes after contractual reimbursements by Gabelli Funds, LLC, (the “Adviser”) are 1.77%, 1.77%, 2.52%, and 1.00%, respectively. See page 11 for the expense ratios for the year ended December 31, 2014. Class AAA and Class I Shares do not have a sales charge. The maximum sales charge for Class A and Class C Shares is 5.75% and 1.00%, respectively.
| | (a) | Returns represent past performance and do not guarantee future results. Total returns and average annual returns reflect changes in share price, reinvestment of distributions, and are net of expenses. Investment returns and the principal value of an investment will fluctuate. When shares are redeemed, they may be worth more or less than their original cost. Current performance may be lower or higher than the performance data presented. Visit www.gabelli.com for performance information as of the most recent month end. Returns for Class I Shares would have been lower had the Adviser not reimbursed certain expenses. The Fund imposes a 2% redemption fee on shares sold or exchanged within seven days after the date of purchase. Investors should carefully consider the investment objectives, risks, charges, and expenses of the Fund before investing. The prospectuses contain information about these and other matters and should be read carefully before investing. To obtain a prospectus, please visit our website at www.gabelli.com. Investing in foreign securities involves risks not ordinarily associated with investments in domestic issues, including currency fluctuation, economic, and political risks. The Class AAA Share NAVs are used to calculate performance for the periods prior to the issuance of Class A Shares, Class C Shares, and Class I Shares on March 2, 2000, March 12, 2000, and January 11, 2008, respectively. The actual performance of the Class A and Class C Shares would have been lower due to the additional fees and expenses associated with these classes of shares. The actual performance of Class I Shares would have been higher due to lower expenses related to this class of shares. The MSCI AC World Index is an unmanaged market capitalization weighted index that is designed to measure the equity market performance of developed and emerging markets. The MSCI AC World Index consists of 45 country indices comprising 24 developed and 21 emerging market country indices. The Lipper Global Large-Cap Growth Fund Classification reflects the performance of mutual funds classified in this particular category. Dividends are considered reinvested. You cannot invest directly in an index. | |
| | (b) | Performance results include the effect of the maximum 5.75% sales charge at the beginning of the period. | |
| | (c) | Assuming payment of the 1% maximum contingent deferred sales charge imposed on redemptions made within one year of purchase. | |
| | (d) | MSCI AC World Index since inception performance is a blend of Gross excluding applicable taxes and Net Performance. This benchmark’s Net performance began on December 29. 2000. | |
COMPARISON OF CHANGE IN VALUE OF A $10,000 INVESTMENT IN
THE GAMCO GLOBAL GROWTH FUND (CLASS AAA SHARES), MSCI AC WORLD INDEX, AND
LIPPER GLOBAL LARGE-CAP GROWTH FUND CLASSIFICATION (Unaudited)
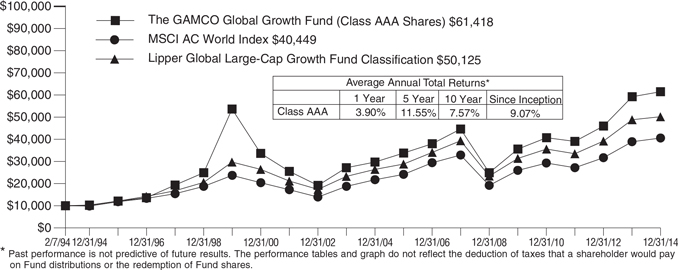
3
| | |
The GAMCO Global Growth Fund Disclosure of Fund Expenses (Unaudited) | | |
| For the Six Month Period from July 1, 2014 through December 31, 2014 | | Expense Table |
We believe it is important for you to understand the impact of fees and expenses regarding your investment. All mutual funds have operating expenses. As a shareholder of a fund, you incur ongoing costs, which include costs for portfolio management, administrative services, and shareholder reports (like this one), among others. Operating expenses, which are deducted from a fund’s gross income, directly reduce the investment return of a fund. When a fund’s expenses are expressed as a percentage of its average net assets, this figure is known as the expense ratio. The following examples are intended to help you understand the ongoing costs (in dollars) of investing in your Fund and to compare these costs with those of other mutual funds. The examples are based on an investment of $1,000 made at the beginning of the period shown and held for the entire period.
The Expense Table below illustrates your Fund’s costs in two ways:
Actual Fund Return: This section provides information about actual account values and actual expenses. You may use this section to help you to estimate the actual expenses that you paid over the period after any fee waivers and expense reimbursements. The “Ending Account Value” shown is derived from the Fund’s actual return during the past six months, and the “Expenses Paid During Period” shows the dollar amount that would have been paid by an investor who started with $1,000 in the Fund. You may use this information, together with the amount you invested, to estimate the expenses that you paid over the period.
To do so, simply divide your account value by $1,000 (for example, an $8,600 account value divided by $1,000 = 8.6), then multiply the result by the number given for your Fund under the heading “Expenses Paid During Period” to estimate the expenses you paid during this period.
Hypothetical 5% Return: This section provides information about hypothetical account values and
hypothetical expenses based on the Fund’s actual expense ratio. It assumes a hypothetical annualized return of 5% before expenses during the period shown. In this case – because the hypothetical return used is not the Fund’s actual return – the results do not apply to your investment and you cannot use the hypothetical account value and expense to estimate the actual ending account balance or expenses you paid for the period. This example is useful in making comparisons of the ongoing costs of investing in the Fund and other funds. To do so, compare this 5% hypothetical example with the 5% hypothetical examples that appear in shareholder reports of other funds.
Please note that the expenses shown in the table are meant to highlight your ongoing costs only and do not reflect any transactional costs such as sales charges (loads), redemption fees, or exchange fees, if any, which are described in the Prospectus. If these costs were applied to your account, your costs would be higher. Therefore, the 5% hypothetical return is useful in comparing ongoing costs only, and will not help you determine the relative total costs of owning different funds. The “Annualized Expense Ratio” represents the actual expenses for the last six months and may be different from the expense ratio in the Financial Highlights which is for the year ended December 31, 2014.
| | | | | | | | |
| | | Beginning Account Value
07/01/14 | | Ending Account Value
12/31/14 | | Annualized Expense
Ratio | | Expenses Paid During
Period* |
The GAMCO Global Growth Fund | | | | |
Actual Fund Return |
Class AAA | | $1,000.00 | | $ 995.20 | | 1.70% | | $ 8.55 |
Class A | | $1,000.00 | | $ 995.20 | | 1.70% | | $ 8.55 |
Class C | | $1,000.00 | | $ 991.70 | | 2.45% | | $12.30 |
Class I | | $1,000.00 | | $ 998.20 | | 1.13% | | $ 5.69 |
Hypothetical 5% Return | | | | |
Class AAA | | $1,000.00 | | $1,016.64 | | 1.70% | | $ 8.64 |
Class A | | $1,000.00 | | $1,016.64 | | 1.70% | | $ 8.64 |
Class C | | $1,000.00 | | $1,012.85 | | 2.45% | | $12.43 |
Class I | | $1,000.00 | | $1,019.51 | | 1.13% | | $ 5.75 |
| * | Expenses are equal to the Fund’s annualized expense ratio for the last six months multiplied by the average account value over the period, multiplied by the number of days in the most recent fiscal half year (184 days), then divided by 365. |
4
Summary of Portfolio Holdings (Unaudited)
The following table presents portfolio holdings as a percent of net assets as of December 31, 2014:
The GAMCO Global Growth Fund
| | | | |
Consumer Discretionary | | | 19.6 | % |
Financials | | | 16.4 | % |
Information Technology | | | 15.8 | % |
Industrials | | | 12.8 | % |
Consumer Staples | | | 12.0 | % |
Health Care | | | 11.7 | % |
Energy | | | 6.3 | % |
| | | | |
Materials | | | 2.7 | % |
Telecommunication Services | | | 2.5 | % |
Utilities | | | 0.5 | % |
Other Assets and Liabilities (Net) | | | (0.3 | )% |
| | | | |
| | | 100.0 | % |
| | | | |
The Fund files a complete schedule of portfolio holdings with the Securities and Exchange Commission (the “SEC”) for the first and third quarters of each fiscal year on Form N-Q. Shareholders may obtain this information at www.gabelli.com or by calling the Fund at 800-GABELLI (800-422-3554). The Fund’s Form N-Q is available on the SEC’s website at www.sec.gov and may also be reviewed and copied at the SEC’s Public Reference Room in Washington, DC. Information on the operation of the Public Reference Room may be obtained by calling 800-SEC-0330.
Proxy Voting
The Fund files Form N-PX with its complete proxy voting record for the twelve months ended June 30, no later than August 31 of each year. A description of the Fund’s proxy voting policies, procedures, and how the Fund voted proxies relating to portfolio securities is available without charge, upon request, by (i) calling 800-GABELLI (800-422-3554); (ii) writing to The Gabelli Funds at One Corporate Center, Rye, NY 10580-1422; or (iii) visiting the SEC’s website at www.sec.gov.
Morningstar Rating™ is based on risk-adjusted returns. The Overall Morningstar Rating is derived from a weighted average of the performance figures associated with a fund’s three, five, and ten year (if applicable) Morningstar Rating metrics. For funds with at least a three year history, a Morningstar Rating is based on a risk-adjusted return measure (including the effects of sales charges, loads, and redemption fees) placing more emphasis on downward variations and rewarding consistent performance. For each fund with at least a three year history, Morningstar calculates a Morningstar Rating based on a Morningstar Risk-Adjusted Return measure (including the effects of sales charges, loads, and redemption fees) that accounts for variation in a fund’s monthly performance, placing more emphasis on downward variations and rewarding consistent performance. The top 10% of funds in each category receive 5 stars, the next 22.5% 4 stars, the next 35% 3 stars, the next 22.5% 2 stars, and the bottom 10% 1 star. (Each share class is counted as a fraction of one fund within this scale and rated separately, which may cause slight variations in the distribution percentages.) Morningstar Rating is for the AAA Share class only; other classes may have different performance characteristics. Ratings reflect relative performance. Results for certain periods were negative. © 2015 Morningstar, Inc. All Rights Reserved. The information contained herein: (1) is proprietary to Morningstar and/or its content providers; (2) may not be copied or distributed; and (3) is not warranted to be accurate, complete, or timely. Neither Morningstar nor its content providers are responsible for any damages or losses arising from any use of this information.
5
The GAMCO Global Growth Fund
Schedule of Investments — December 31, 2014
| | | | | | | | | | | | |
Shares | | | | | Cost | | | Market
Value | |
| | | | COMMON STOCKS — 100.3% | |
| | | | CONSUMER DISCRETIONARY — 19.6% | |
| | 1,400 | | | Amazon.com Inc.† | | $ | 285,786 | | | $ | 434,490 | |
| | 600 | | | AutoZone Inc.† | | | 228,024 | | | | 371,466 | |
| | 1,900 | | | Bayerische Motoren Werke AG | | | 243,443 | | | | 205,045 | |
| | 10,200 | | | CBS Corp., Cl. B, Non-Voting | | | 365,262 | | | | 564,468 | |
| | 2,500 | | | Christian Dior SA | | | 370,238 | | | | 427,846 | |
| | 7,200 | | | Comcast Corp., Cl. A, Special | | | 256,687 | | | | 414,468 | |
| | 5,114 | | | Compagnie Financiere Richemont SA | | | 301,457 | | | | 453,400 | |
| | 4,800 | | | DIRECTV† | | | 236,558 | | | | 416,160 | |
| | 8,000 | | | Discovery Communications Inc., Cl. A† | | | 253,331 | | | | 275,600 | |
| | 8,000 | | | Discovery Communications Inc., Cl. C† | | | 243,397 | | | | 269,760 | |
| | 26,000 | | | Fuji Heavy Industries Ltd. | | | 625,850 | | | | 920,036 | |
| | 34,100 | | | Grupo Televisa SAB, ADR | | | 1,191,922 | | | | 1,161,446 | |
| | 8,800 | | | Hennes & Mauritz AB, Cl. B | | | 260,623 | | | | 365,596 | |
| | 246 | | | Hermes International | | | 86,195 | | | | 87,597 | |
| | 8,300 | | | Lennar Corp., Cl. A | | | 356,189 | | | | 371,923 | |
| | 17,800 | | | Liberty Global plc, Cl. A† | | | 703,327 | | | | 893,649 | |
| | 11,800 | | | Liberty Global plc, Cl. C† | | | 431,146 | | | | 570,058 | |
| | 11,000 | | | Luxottica Group SpA | | | 578,259 | | | | 603,009 | |
| | 2,200 | | | LVMH Moet Hennessy Louis Vuitton SA | | | 432,743 | | | | 348,485 | |
| | 5,500 | | | Macy’s Inc. | | | 161,017 | | | | 361,625 | |
| | 5,000 | | | Michael Kors Holdings Ltd.† | | | 480,958 | | | | 375,500 | |
| | 8,800 | | | Naspers Ltd., Cl. N | | | 1,041,696 | | | | 1,138,326 | |
| | 5,500 | | | NIKE Inc., Cl. B | | | 335,583 | | | | 528,825 | |
| | 2,300 | | | Ralph Lauren Corp. | | | 154,491 | | | | 425,868 | |
| | 7,800 | | | Starbucks Corp. | | | 300,600 | | | | 639,990 | |
| | 4,000 | | | Tata Motors Ltd., ADR | | | 165,280 | | | | 169,120 | |
| | 6,000 | | | The Home Depot Inc. | | | 297,016 | | | | 629,820 | |
| | 330 | | | The Priceline Group Inc.† | | | 195,050 | | | | 376,269 | |
| | 5,300 | | | The Swatch Group AG | | | 411,688 | | | | 458,459 | |
| | 5,000 | | | The TJX Companies Inc. | | | 288,224 | | | | 342,900 | |
| | 4,700 | | | Tiffany & Co. | | | 288,044 | | | | 502,242 | |
| | 1,700 | | | Time Warner Cable Inc. | | | 223,805 | | | | 258,502 | |
| | 5,000 | | | Time Warner Inc. | | | 404,290 | | | | 427,100 | |
| | 16,600 | | | Twenty-First Century Fox Inc., Cl. A | | | 386,211 | | | | 637,523 | |
| | 5,300 | | | Viacom Inc., Cl. B | | | 251,199 | | | | 398,825 | |
| | | | | | | | | | | | |
| | | |
| | | | TOTAL CONSUMER DISCRETIONARY | | | 12,835,589 | | | | 16,825,396 | |
| | | | | | | | | | | | |
| |
| | | | FINANCIALS — 16.4% | |
| | 24,000 | | | American International Group Inc. | | | 1,064,262 | | | | 1,344,240 | |
| | 29,500 | | | Bank of America Corp. | | | 241,717 | | | | 527,755 | |
| | 800 | | | BlackRock Inc. | | | 250,127 | | | | 286,048 | |
| | 35,000 | | | Cheung Kong (Holdings) Ltd. | | | 562,423 | | | | 586,139 | |
| | 9,000 | | | Citigroup Inc. | | | 473,132 | | | | 486,990 | |
| | 9,000 | | | HDFC Bank Ltd., ADR | | | 425,693 | | | | 456,750 | |
| | 33,500 | | | ICICI Bank Ltd., ADR | | | 343,589 | | | | 386,925 | |
| | 31,700 | | | JPMorgan Chase & Co. | | | 1,087,263 | | | | 1,983,786 | |
| | | | | | | | | | | | |
Shares | | | | | Cost | | | Market
Value | |
| | 8,000 | | | Julius Baer Group Ltd. | | $ | 276,686 | | | $ | 365,264 | |
| | 33,000 | | | Kinnevik Investment AB, Cl. B | | | 1,328,838 | | | | 1,073,134 | |
| | 49,200 | | | Morgan Stanley | | | 739,297 | | | | 1,908,960 | |
| | 17,300 | | | Schroders plc | | | 253,505 | | | | 719,029 | |
| | 142,000 | | | Skandinaviska Enskilda Banken AB, Cl. A | | | 938,890 | | | | 1,803,196 | |
| | 50,000 | | | Swire Pacific Ltd., Cl. A | | | 554,772 | | | | 649,024 | |
| | 7,800 | | | The Goldman Sachs Group Inc. | | | 768,443 | | | | 1,511,874 | |
| | | | | | | | | | | | |
| | | |
| | | | TOTAL FINANCIALS | | | 9,308,637 | | | | 14,089,114 | |
| | | | | | | | | | | | |
| |
| | | | INFORMATION TECHNOLOGY — 15.8% | |
| | 7,500 | | | Adobe Systems Inc.† | | | 498,467 | | | | 545,250 | |
| | 5,500 | | | Alibaba Group Holding Ltd., ADR† | | | 510,615 | | | | 571,670 | |
| | 15,310 | | | Apple Inc. | | | 1,036,647 | | | | 1,689,918 | |
| | 5,500 | | | Baidu Inc., ADR† | | | 1,013,931 | | | | 1,253,835 | |
| | 6,900 | | | Check Point Software Technologies Ltd.† | | | 352,456 | | | | 542,133 | |
| | 17,200 | | | Facebook Inc., Cl. A† | | | 984,832 | | | | 1,341,944 | |
| | 810 | | | Google Inc., Cl. A† | | | 238,018 | | | | 429,835 | |
| | 1,110 | | | Google Inc., Cl. C† | | | 398,489 | | | | 584,304 | |
| | 6,000 | | | Infosys Ltd., ADR | | | 163,191 | | | | 188,760 | |
| | 2,900 | | | Keyence Corp. | | | 508,627 | | | | 1,292,225 | |
| | 16,000 | | | MasterCard Inc., Cl. A | | | 367,500 | | | | 1,378,560 | |
| | 19,600 | | | Microsoft Corp. | | | 559,833 | | | | 910,420 | |
| | 5,800 | | | NXP Semiconductor NV† | | | 367,540 | | | | 443,120 | |
| | 240 | | | Samsung Electronics Co. Ltd., GDR | | | 171,051 | | | | 145,200 | |
| | 14,000 | | | Taiwan Semiconductor | | | | | | | | |
| | | | Manufacturing Co. Ltd., ADR | | | 304,354 | | | | 313,320 | |
| | 15,200 | | | Tencent Holdings Ltd. | | | 221,619 | | | | 219,928 | |
| | 10,000 | | | Texas Instruments Inc. | | | 451,045 | | | | 534,650 | |
| | 4,500 | | | Visa Inc., Cl. A | | | 319,901 | | | | 1,179,900 | |
| | | | | | | | | | | | |
| | | |
| | | | TOTAL INFORMATION TECHNOLOGY | | | 8,468,116 | | | | 13,564,972 | |
| | | | | | | | | | | | |
| |
| | | | INDUSTRIALS — 12.8% | |
| | 3,000 | | | 3M Co. | | | 391,880 | | | | 492,960 | |
| | 7,900 | | | B/E Aerospace Inc.† | | | 419,046 | | | | 458,358 | |
| | 2,700 | | | Cummins Inc. | | | 296,692 | | | | 389,259 | |
| | 8,800 | | | Delta Air Lines Inc. | | | 395,745 | | | | 432,872 | |
| | 5,600 | | | Eaton Corp. plc | | | 310,736 | | | | 380,576 | |
| | 4,500 | | | Emerson Electric Co. | | | 248,114 | | | | 277,785 | |
| | 3,700 | | | FANUC Corp. | | | 325,019 | | | | 610,057 | |
| | 4,500 | | | Flowserve Corp. | | | 136,674 | | | | 269,235 | |
| | 6,600 | | | Fortune Brands Home & Security Inc. | | | 294,058 | | | | 298,782 | |
| | 18,000 | | | General Electric Co. | | | 409,574 | | | | 454,860 | |
| | 8,000 | | | Honeywell International Inc. | | | 397,245 | | | | 799,360 | |
| | 11,500 | | | Jardine Matheson Holdings Ltd. | | | 326,458 | | | | 698,790 | |
| | 8,500 | | | Nielsen NV | | | 269,086 | | | | 380,205 | |
| | 5,000 | | | PACCAR Inc. | | | 227,193 | | | | 340,050 | |
| | 4,500 | | | Pentair plc | | | 353,806 | | | | 298,890 | |
| | 4,700 | | | Precision Castparts Corp. | | | 561,811 | | | | 1,132,136 | |
| | 6,600 | | | Schneider Electric SA | | | 512,415 | | | | 480,674 | |
See accompanying notes to financial statements.
6
The GAMCO Global Growth Fund
Schedule of Investments (Continued) — December 31, 2014
| | | | | | | | | | | | |
Shares | | | | | Cost | | | Market Value | |
| | | | COMMON STOCKS (Continued) | |
| | | | INDUSTRIALS (Continued) | |
| | 5,000 | | | Secom Co. Ltd. | | $ | 186,467 | | | $ | 287,273 | |
| | 3,300 | | | Siemens AG | | | 312,596 | | | | 370,274 | |
| | 2,300 | | | The Boeing Co. | | | 284,340 | | | | 298,954 | |
| | 10,800 | | | Union Pacific Corp. | | | 585,960 | | | | 1,286,604 | |
| | 4,400 | | | United Technologies Corp. | | | 240,973 | | | | 506,000 | |
| | | | | | | | | | | | |
| | | |
| | | | TOTAL INDUSTRIALS | | | 7,485,888 | | | | 10,943,954 | |
| | | | | | | | | | | | |
| |
| | | | CONSUMER STAPLES — 12.0% | |
| | 4,000 | | | Brown-Forman Corp., Cl. B | | | 314,268 | | | | 351,360 | |
| | 4,300 | | | Colgate-Palmolive Co. | | | 168,724 | | | | 297,517 | |
| | 4,800 | | | Costco Wholesale Corp. | | | 291,401 | | | | 680,400 | |
| | 9,900 | | | CVS Health Corp. | | | 659,284 | | | | 953,469 | |
| | 4,671 | | | Danone SA | | | 318,161 | | | | 305,382 | |
| | 40,000 | | | Davide Campari-Milano SpA | | | 129,297 | | | | 249,677 | |
| | 13,500 | | | Diageo plc | | | 264,904 | | | | 386,736 | |
| | 3,700 | | | Henkel AG & Co. KGaA | | | 291,308 | | | | 358,414 | |
| | 2,700 | | | L’Oreal SA | | | 439,604 | | | | 451,905 | |
| | 3,300 | | | Mead Johnson Nutrition Co. | | | 242,574 | | | | 331,782 | |
| | 10,000 | | | Mondelēz International Inc., Cl. A | | | 317,025 | | | | 363,250 | |
| | 17,600 | | | Nestlé SA. | | | 959,492 | | | | 1,283,058 | |
| | 2,300 | | | PepsiCo Inc. | | | 146,092 | | | | 217,488 | |
| | 4,156 | | | Pernod Ricard SA | | | 388,417 | | | | 461,889 | |
| | 5,000 | | | Reckitt Benckiser Group plc | | | 354,393 | | | | 404,970 | |
| | 6,900 | | | Seven & i Holdings Co. Ltd. | | | 266,683 | | | | 248,202 | |
| | 5,300 | | | The Coca-Cola Co. | | | 139,884 | | | | 223,766 | |
| | 4,000 | | | The Estee Lauder Companies Inc., Cl. A | | | 194,665 | | | | 304,800 | |
| | 10,000 | | | The Hain Celestial Group Inc.† | | | 426,422 | | | | 582,900 | |
| | 12,700 | | | The WhiteWave Foods Co.† | | | 373,053 | | | | 444,373 | |
| | 9,900 | | | Unicharm Corp. | | | 187,592 | | | | 237,294 | |
| | 4,800 | | | United Natural Foods Inc.† | | | 356,815 | | | | 371,160 | |
| | 110,000 | | | Wal-Mart de Mexico SAB de CV, Cl. V | | | 284,627 | | | | 236,496 | |
| | 7,600 | | | Whole Foods Market Inc. | | | 272,301 | | | | 383,192 | |
| | 6,100 | | | Woolworths Ltd. | | | 100,022 | | | | 151,583 | |
| | | | | | | | | | | | |
| | | |
| | | | TOTAL CONSUMER STAPLES | | | 7,887,008 | | | | 10,281,063 | |
| | | | | | | | | | | | |
| |
| | | | HEALTH CARE — 11.7% | |
| | 10,000 | | | Abbott Laboratories | | | 301,411 | | | | 450,200 | |
| | 3,200 | | | Amgen Inc. | | | 286,180 | | | | 509,728 | |
| | 5,300 | | | Bayer AG | | | 621,913 | | | | 722,437 | |
| | 4,800 | | | Becton, Dickinson and Co. | | | 393,415 | | | | 667,968 | |
| | 900 | | | Biogen Idec Inc.† | | | 131,439 | | | | 305,505 | |
| | 6,500 | | | Bristol-Myers Squibb Co. | | | 332,611 | | | | 383,695 | |
| | 3,100 | | | Celgene Corp.† | | | 118,425 | | | | 346,766 | |
| | 18,500 | | | Dr. Reddy’s Laboratories Ltd., ADR | | | 767,140 | | | | 933,325 | |
| | 4,200 | | | Gilead Sciences Inc.† | | | 242,193 | | | | 395,892 | |
| | 5,000 | | | Indivior plc† | | | 7,232 | | | | 11,643 | |
| | 6,500 | | | Johnson & Johnson | | | 431,742 | | | | 679,705 | |
| | 3,500 | | | McKesson Corp. | | | 633,707 | | | | 726,530 | |
| | 5,500 | | | Merck & Co. Inc. | | | 320,579 | | | | 312,345 | |
| | 11,500 | | | Novartis AG, ADR | | | 714,938 | | | | 1,065,590 | |
| | | | | | | | | | | | |
Shares | | | | | Cost | | | Market Value | |
| | 12,500 | | | Novo Nordisk A/S, Cl. B | | $ | 229,203 | | | $ | 528,747 | |
| | 800 | | | Regeneron Pharmaceuticals Inc.† | | | 248,781 | | | | 328,200 | |
| | 18,000 | | | Roche Holding AG, ADR | | | 391,670 | | | | 611,820 | |
| | 2,600 | | | Roche Holding AG, Genusschein | | | 255,977 | | | | 704,450 | |
| | 7,000 | | | Sanofi, ADR | | | 323,285 | | | | 319,270 | |
| | | | | | | | | | | | |
| | | |
| | | | TOTAL HEALTH CARE | | | 6,751,841 | | | | 10,003,816 | |
| | | | | | | | | | | | |
| |
| | | | ENERGY — 6.3% | |
| | 13,400 | | | BP plc, ADR | | | 583,208 | | | | 510,808 | |
| | 9,500 | | | ConocoPhillips | | | 561,991 | | | | 656,070 | |
| | 19,100 | | | Continental Resources Inc.† | | | 944,050 | | | | 732,676 | |
| | 11,800 | | | EOG Resources Inc. | | | 583,324 | | | | 1,086,426 | |
| | 6,100 | | | Occidental Petroleum Corp. | | | 500,953 | | | | 491,721 | |
| | 5,800 | | | Pioneer Natural Resources Co. | | | 640,062 | | | | 863,330 | |
| | 5,700 | | | Royal Dutch Shell plc, Cl. A, ADR | | | 394,864 | | | | 381,615 | |
| | 5,500 | | | Schlumberger Ltd. | | | 393,097 | | | | 469,755 | |
| | 13,500 | | | Statoil ASA, ADR | | | 330,693 | | | | 237,735 | |
| | | | | | | | | | | | |
| | | |
| | | | TOTAL ENERGY | | | 4,932,242 | | | | 5,430,136 | |
| | | | | | | | | | | | |
| |
| | | | MATERIALS — 2.7% | |
| | 5,500 | | | E. I. du Pont de Nemours and Co. | | | 258,935 | | | | 406,670 | |
| | 3,300 | | | Ecolab Inc. | | | 294,898 | | | | 344,916 | |
| | 3,100 | | | Monsanto Co. | | | 211,327 | | | | 370,357 | |
| | 2,700 | | | PPG Industries Inc. | | | 435,401 | | | | 624,105 | |
| | 2,200 | | | The Sherwin-Williams Co. | | | 328,878 | | | | 578,688 | |
| | | | | | | | | | | | |
| | | |
| | | | TOTAL MATERIALS | | | 1,529,439 | | | | 2,324,736 | |
| | | | | | | | | | | | |
| |
| | | | TELECOMMUNICATION SERVICES — 2.5% | |
| | 50,000 | | | MTN Group Ltd. | | | 1,121,706 | | | | 951,127 | |
| | 12,800 | | | SoftBank Corp. | | | 960,380 | | | | 761,898 | |
| | 8,223 | | | Verizon Communications Inc. | | | 399,911 | | | | 384,672 | |
| | | | | | | | | | | | |
| | | |
| | | | TOTAL TELECOMMUNICATION SERVICES | | | 2,481,997 | | | | 2,097,697 | |
| | | | | | | | | | | | |
| |
| | | | UTILITIES — 0.5% | |
| | 4,200 | | | NextEra Energy Inc. | | | 397,368 | | | | 446,418 | |
| | | | | | | | | | | | |
| | | | TOTAL COMMON STOCKS | | | 62,078,125 | | | | 86,007,302 | |
| | | | | | | | | | | | |
| | | | TOTAL INVESTMENTS — 100.3% | | $ | 62,078,125 | | | | 86,007,302 | |
| | | | | | | | | | | | |
| | | | Other Assets and Liabilities (Net) — (0.3)% | | | | (215,129 | ) |
| | | | | | | | | | | | |
| | | | NET ASSETS — 100.0% | | | $ | 85,792,173 | |
| | | | | | | | | | | | |
| † | Non-income producing security. |
| ADR | American Depositary Receipt |
| GDR | Global Depositary Receipt |
See accompanying notes to financial statements.
7
The GAMCO Global Growth Fund
Schedule of Investments (Continued) — December 31, 2014
| | | | | | | | |
Geographic Diversification | | % of Market Value | | | Market
Value | |
North America | | | 59.5 | % | | $ | 51,177,473 | |
Europe | | | 23.1 | | | | 19,885,581 | |
Asia/Pacific | | | 8.3 | | | | 7,099,868 | |
Japan | | | 5.1 | | | | 4,356,985 | |
South Africa | | | 2.4 | | | | 2,089,453 | |
Latin America | | | 1.6 | | | | 1,397,942 | |
| | | | | | | | |
| | | 100.0 | % | | $ | 86,007,302 | |
| | | | | | | | |
See accompanying notes to financial statements.
8
The GAMCO Global Growth Fund
Statement of Assets and Liabilities
December 31, 2014
| | | | |
Assets: | | | | |
Investments, at value (cost $62,078,125) | | $ | 86,007,302 | |
Receivable for Fund shares sold | | | 161,690 | |
Dividends receivable | | | 103,719 | |
Prepaid expenses | | | 19,151 | |
| | | | |
Total Assets | | | 86,291,862 | |
| | | | |
Liabilities: | | | | |
Payable to custodian | | | 5,884 | |
Payable for Fund shares redeemed | | | 72,981 | |
Payable for investment advisory fees | | | 72,894 | |
Payable for distribution fees | | | 18,938 | |
Payable for accounting fees | | | 11,250 | |
Line of credit payable | | | 236,000 | |
Payable for legal and audit fees | | | 35,261 | |
Other accrued expenses | | | 46,481 | |
| | | | |
Total Liabilities | | | 499,689 | |
| | | | |
Net Assets (applicable to 2,843,805 shares outstanding) | | $ | 85,792,173 | |
| | | | |
Net Assets Consist of: | | | | |
Paid-in capital | | $ | 60,765,858 | |
Accumulated net investment income | | | 7,585 | |
Accumulated net realized gain on investments and foreign currency transactions | | | 1,095,003 | |
Net unrealized appreciation on investments | | | 23,929,177 | |
Net unrealized depreciation on foreign currency translations | | | (5,450 | ) |
| | | | |
Net Assets | | $ | 85,792,173 | |
| | | | |
Shares of Capital Stock, each at $0.001 par value: | | | | |
Class AAA: | | | | |
Net Asset Value, offering, and redemption price per share ($78,139,669 ÷ 2,584,756 shares outstanding; 75,000,000 shares authorized) | | $ | 30.23 | |
| | | | |
Class A: | | | | |
Net Asset Value and redemption price per share ($3,724,958 ÷ 123,265 shares outstanding; 50,000,000 shares authorized) | | $ | 30.22 | |
| | | | |
Maximum offering price per share (NAV ÷ 0.9425, based on maximum sales charge of 5.75% of the offering price) | | $ | 32.06 | |
| | | | |
Class C: | | | | |
Net Asset Value and offering price per share ($1,609,198 ÷ 59,579 shares outstanding; 25,000,000 shares authorized) | | $ | 27.01 | (a) |
| | | | |
Class I: | | | | |
Net Asset Value, offering, and redemption price per share ($2,318,348 ÷ 76,205 shares outstanding; 25,000,000 shares authorized) | | $ | 30.42 | |
| | | | |
| (a) | Redemption price varies based on the length of time held. |
Statement of Operations
For the Year Ended December 31, 2014
| | | | |
Investment Income: | | | | |
Dividends (net of foreign withholding taxes of $68,895) | | $ | 1,839,636 | |
Interest | | | 157 | |
| | | | |
Total Investment Income | | | 1,839,793 | |
| | | | |
| |
Expenses: | | | | |
Investment advisory fees | | | 837,449 | |
Distribution fees - Class AAA | | | 194,208 | |
Distribution fees - Class A | | | 6,918 | |
Distribution fees - Class C | | | 13,981 | |
Shareholder services fees | | | 83,483 | |
Shareholder communications expenses | | | 60,259 | |
Custodian fees | | | 53,464 | |
Accounting fees | | | 45,000 | |
Registration expenses | | | 43,337 | |
Legal and audit fees | | | 36,527 | |
Directors’ fees | | | 24,343 | |
Interest expense | | | 456 | |
Miscellaneous expenses | | | 45,204 | |
| | | | |
Total Expenses | | | 1,444,629 | |
| | | | |
Less: | | | | |
Expense reimbursements (See Note 3) | | | (3,489 | ) |
| | | | |
Net Expenses | | | 1,441,140 | |
| | | | |
Net Investment Income | | | 398,653 | |
| | | | |
Net Realized and Unrealized Gain/(Loss) on Investments and Foreign Currency: | | | | |
Net realized gain on investments | | | 5,252,855 | |
Net realized loss on foreign currency transactions | | | (4,113 | ) |
| | | | |
Net realized gain on investments and foreign currency transactions | | | 5,248,742 | |
| | | | |
Net change in unrealized appreciation/depreciation on investments | | | (2,445,485 | ) |
on foreign currency translations | | | (7,332 | ) |
| | | | |
Net change in unrealized appreciation/depreciation on investments and foreign currency translations | | | (2,452,817 | ) |
| | | | |
Net Realized and Unrealized Gain/(Loss) on Investments and Foreign Currency | | | 2,795,925 | |
| | | | |
Net Increase in Net Assets Resulting from Operations | | $ | 3,194,578 | |
| | | | |
See accompanying notes to financial statements.
9
The GAMCO Global Growth Fund
Statement of Changes in Net Assets
| | | | | | | | |
| | | Year Ended
December 31, 2014 | | | Year Ended
December 31, 2013 | |
Operations: | | | | | | | | |
Net investment income/(loss) | | $ | 398,653 | | | $ | (19,956 | ) |
Net realized gain on investments and foreign currency transactions | | | 5,248,742 | | | | 6,349,362 | |
Net change in unrealized appreciation/depreciation on investments and foreign currency translations | | | (2,452,817 | ) | | | 12,009,839 | |
| | | | | | | | |
Net Increase in Net Assets Resulting from Operations | | | 3,194,578 | | | | 18,339,245 | |
| | | | | | | | |
Distributions to Shareholders: | | | | | | | | |
Net investment income | | | | | | | | |
Class AAA | | | (287,957 | ) | | | — | |
Class A | | | (15,924 | ) | | | — | |
Class I | | | (17,649 | ) | | | — | |
| | | | | | | | |
| | | (321,530 | ) | | | — | |
| | | | | | | | |
Net realized gain | | | | | | | | |
Class AAA | | | (4,906,469 | ) | | | (6,526,402 | ) |
Class A | | | (232,385 | ) | | | (157,638 | ) |
Class C | | | (112,849 | ) | | | (94,160 | ) |
Class I | | | (144,141 | ) | | | (112,618 | ) |
| | | | | | | | |
| | | (5,395,844 | ) | | | (6,890,818 | ) |
| | | | | | | | |
Total Distributions to Shareholders | | | (5,717,374 | ) | | | (6,890,818 | ) |
| | | | | | | | |
| | |
Capital Share Transactions: | | | | | | | | |
Class AAA | | | 4,618,460 | | | | 2,061,580 | |
Class A | | | 1,980,815 | | | | 482,236 | |
Class C | | | 639,201 | | | | 344,241 | |
Class I | | | 1,064,939 | | | | 357,914 | |
| | | | | | | | |
Net Increase in Net Assets from Capital Share Transactions | | | 8,303,415 | | | | 3,245,971 | |
| | | | | | | | |
| | |
Redemption Fees | | | 957 | | | | 494 | |
| | | | | | | | |
Net Increase in Net Assets | | | 5,781,576 | | | | 14,694,892 | |
Net Assets: | | | | | | | | |
Beginning of year | | | 80,010,597 | | | | 65,315,705 | |
| | | | | | | | |
End of year (including undistributed net investment income of $7,585 and $0, respectively) | | $ | 85,792,173 | | | $ | 80,010,597 | |
| | | | | | | | |
See accompanying notes to financial statements.
10
The GAMCO Global Growth Fund
Financial Highlights
Selected data for a share of capital stock outstanding throughout each year:
| | | | | | | | | | | | | | | | | | | | | | | | | | | | | | | | | | | | | | | | | | | | | | | | | | | | | | | | | | | | |
| | | | | | Income (Loss)
from Investment Operations | | | Distributions | | | | | | | | | | | | Ratios to Average Net Assets/
Supplemental Data | |
Year Ended
December 31 | | Net Asset
Value,
Beginning
of Year | | | Net
Investment
Income
(Loss)(a) | | | Net
Realized
and
Unrealized
Gain (Loss)
on
Investments | | | Total from
Investment
Operations | | | Net
Investment
Income | | | Net
Realized
Gain | | | Total
Distributions | | | Redemption
Fees (a)(b) | | | Net
Asset
Value,
End of
Year | | | Total
Return† | | | Net
Assets
End of Year
(in 000’s) | | | Net
Investment
Income
(Loss) | | | Operating
Expenses
Before
Reimburse-
ment | | | Operating
Expenses
Net of
Reimburse-
ment | | | Portfolio
Turnover
Rate | |
Class AAA | | | | | | | | | | | | | | | | | | | | | | | | | | | | | | | | | | | | | | | | | | | | | | | | | | | | | | | | | |
2014 | | | $31.12 | | | | $0.15 | | | | $1.09 | | | | $1.24 | | | | $(0.12 | ) | | | $(2.01 | ) | | | $(2.13 | ) | | | $0.00 | | | | $30.23 | | | | 3.9 | % | | | $78,140 | | | | 0.48 | % | | | 1.72 | % | | | 1.72 | % | | | 29 | % |
2013 | | | 26.54 | | | | (0.01 | ) | | | 7.50 | | | | 7.49 | | | | — | | | | (2.91 | ) | | | (2.91 | ) | | | 0.00 | | | | 31.12 | | | | 28.8 | | | | 75,773 | | | | (0.02 | ) | | | 1.77 | | | | 1.77 | | | | 25 | |
2012 | | | 23.32 | | | | 0.02 | | | | 4.16 | | | | 4.18 | | | | (0.02 | ) | | | (0.94 | ) | | | (0.96 | ) | | | 0.00 | | | | 26.54 | | | | 18.0 | | | | 62,746 | | | | 0.09 | | | | 1.90 | | | | 1.90 | | | | 42 | |
2011 | | | 24.35 | | | | (0.01 | ) | | | (1.02 | ) | | | (1.03 | ) | | | — | | | | — | | | | — | | | | 0.00 | | | | 23.32 | | | | (4.2 | ) | | | 58,753 | | | | (0.03 | ) | | | 1.84 | | | | 1.84 | | | | 45 | |
2010 | | | 21.31 | | | | (0.09 | ) | | | 3.13 | | | | 3.04 | | | | — | | | | — | | | | — | | | | 0.00 | | | | 24.35 | | | | 14.3 | | | | 67,782 | | | | (0.42 | ) | | | 1.87 | | | | 1.87 | | | | 34 | |
Class A | | | | | | | | | | | | | | | | | | | | | | | | | | | | | | | | | | | | | | | | | | | | | | | | | | | | | | | | | |
2014 | | | $31.13 | | | | $0.13 | | | | $1.11 | | | | $1.24 | | | | $(0.14 | ) | | | $(2.01 | ) | | | $(2.15 | ) | | | $0.00 | | | | $30.22 | | | | 3.9 | % | | | $ 3,725 | | | | 0.40 | % | | | 1.72 | % | | | 1.72 | % | | | 29 | % |
2013 | | | 26.54 | | | | (0.01 | ) | | | 7.51 | | | | 7.50 | | | | — | | | | (2.91 | ) | | | (2.91 | ) | | | 0.00 | | | | 31.13 | | | | 28.8 | | | | 1,872 | | | | (0.05 | ) | | | 1.77 | | | | 1.77 | | | | 25 | |
2012 | | | 23.33 | | | | 0.02 | | | | 4.16 | | | | 4.18 | | | | (0.03 | ) | | | (0.94 | ) | | | (0.97 | ) | | | 0.00 | | | | 26.54 | | | | 17.9 | | | | 1,161 | | | | 0.07 | | | | 1.90 | | | | 1.90 | | | | 42 | |
2011 | | | 24.35 | | | | (0.01 | ) | | | (1.01 | ) | | | (1.02 | ) | | | — | | | | — | | | | — | | | | 0.00 | | | | 23.33 | | | | (4.2 | ) | | | 976 | | | | (0.04 | ) | | | 1.84 | | | | 1.84 | | | | 45 | |
2010 | | | 21.31 | | | | (0.09 | ) | | | 3.13 | | | | 3.04 | | | | — | | | | — | | | | — | | | | 0.00 | | | | 24.35 | | | | 14.3 | | | | 1,193 | | | | (0.42 | ) | | | 1.87 | | | | 1.87 | | | | 34 | |
Class C | | | | | | | | | | | | | | | | | | | | | | | | | | | | | | | | | | | | | | | | | | | | | | | | | | | | | | | | | |
2014 | | | $28.12 | | | | $(0.11 | ) | | | $1.01 | | | | $0.90 | | | | — | | | | $(2.01 | ) | | | $(2.01 | ) | | | $0.00 | | | | $27.01 | | | | 3.1 | % | | | $ 1,609 | | | | (0.37 | )% | | | 2.47 | % | | | 2.47 | % | | | 29 | % |
2013 | | | 24.39 | | | | (0.22 | ) | | | 6.86 | | | | 6.64 | | | | — | | | | (2.91 | ) | | | (2.91 | ) | | | 0.00 | | | | 28.12 | | | | 27.8 | | | | 1,036 | | | | (0.79 | ) | | | 2.52 | | | | 2.52 | | | | 25 | |
2012 | | | 21.64 | | | | (0.17 | ) | | | 3.86 | | | | 3.69 | | | | — | | | | (0.94 | ) | | | (0.94 | ) | | | 0.00 | | | | 24.39 | | | | 17.1 | | | | 603 | | | | (0.72 | ) | | | 2.65 | | | | 2.65 | | | | 42 | |
2011 | | | 22.76 | | | | (0.17 | ) | | | (0.95 | ) | | | (1.12 | ) | | | — | | | | — | | | | — | | | | 0.00 | | | | 21.64 | | | | (4.9 | ) | | | 354 | | | | (0.77 | ) | | | 2.59 | | | | 2.59 | | | | 45 | |
2010 | | | 20.07 | | | | (0.23 | ) | | | 2.92 | | | | 2.69 | | | | — | | | | — | | | | — | | | | 0.00 | | | | 22.76 | | | | 13.4 | | | | 374 | | | | (1.17 | ) | | | 2.62 | | | | 2.62 | | | | 34 | |
Class I | | | | | | | | | | | | | | | | | | | | | | | | | | | | | | | | | | | | | | | | | | | | | | | | | | | | | | | | | |
2014 | | | $31.30 | | | | $0.27 | | | | $1.11 | | | | $1.38 | | | | $(0.25 | ) | | | $(2.01 | ) | | | $(2.26 | ) | | | $0.00 | | | | $30.42 | | | | 4.3 | % | | | $ 2,318 | | | | 0.85 | % | | | 1.47 | % | | | 1.28 | % | | | 29 | % |
2013 | | | 26.61 | | | | 0.07 | | | | 7.53 | | | | 7.60 | | | | — | | | | (2.91 | ) | | | (2.91 | ) | | | 0.00 | | | | 31.30 | | | | 29.1 | | | | 1,330 | | | | 0.22 | | | | 1.52 | | | | 1.52 | | | | 25 | |
2012 | | | 23.38 | | | | 0.08 | | | | 4.18 | | | | 4.26 | | | | (0.09 | ) | | | (0.94 | ) | | | (1.03 | ) | | | 0.00 | | | | 26.61 | | | | 18.3 | | | | 805 | | | | 0.30 | | | | 1.65 | | | | 1.65 | | | | 42 | |
2011 | | | 24.34 | | | | 0.05 | | | | (1.01 | ) | | | (0.96 | ) | | | — | | | | — | | | | — | | | | 0.00 | | | | 23.38 | | | | (3.9 | ) | | | 449 | | | | 0.21 | | | | 1.59 | | | | 1.59 | | | | 45 | |
2010 | | | 21.25 | | | | (0.04 | ) | | | 3.13 | | | | 3.09 | | | | — | | | | — | | | | — | | | | 0.00 | | | | 24.34 | | | | 14.5 | | | | 460 | | | | (0.17 | ) | | | 1.62 | | | | 1.62 | | | | 34 | |
| † | Total return represents aggregate total return of a hypothetical $1,000 investment at the beginning of the year and sold at the end of the year including reinvestment of distributions and does not reflect applicable sales charges. |
| (a) | Per share amounts have been calculated using the average shares outstanding method. |
| (b) | Amount represents less than $0.005 per share. |
See accompanying notes to financial statements.
11
The GAMCO Global Growth Fund
Notes to Financial Statements
1. Organization. The GAMCO Global Growth Fund, a series of GAMCO Global Series Funds, Inc. (the “Corporation”), was incorporated on July 16, 1993 in Maryland. The Fund is a non-diversified open-end management investment company registered under the Investment Company Act of 1940, as amended (the “1940 Act”), and one of four separately managed portfolios (collectively, the “Portfolios”) of the Corporation. The Fund’s primary objective is capital appreciation. The Fund commenced investment operations on February 7, 1994.
2. Significant Accounting Policies. As an investment company, the Fund follows the investment company accounting and reporting guidance, which is part of U.S. generally accepted accounting principles (“GAAP”) that may require the use of management estimates and assumptions in the preparation of its financial statements. Actual results could differ from those estimates. The following is a summary of significant accounting policies followed by the Fund in the preparation of its financial statements.
Security Valuation. Portfolio securities listed or traded on a nationally recognized securities exchange or traded in the U.S. over-the-counter market for which market quotations are readily available are valued at the last quoted sale price or a market’s official closing price as of the close of business on the day the securities are being valued. If there were no sales that day, the security is valued at the average of the closing bid and asked prices or, if there were no asked prices quoted on that day, then the security is valued at the closing bid price on that day. If no bid or asked prices are quoted on such day, the security is valued at the most recently available price or, if the Board of Directors (the “Board”) so determines, by such other method as the Board shall determine in good faith to reflect its fair market value. Portfolio securities traded on more than one national securities exchange or market are valued according to the broadest and most representative market, as determined by Gabelli Funds, LLC (the “Adviser”).
Portfolio securities primarily traded on a foreign market are generally valued at the preceding closing values of such securities on the relevant market, but may be fair valued pursuant to procedures established by the Board if market conditions change significantly after the close of the foreign market, but prior to the close of business on the day the securities are being valued. Debt instruments with remaining maturities of sixty days or less that are not credit impaired are valued at amortized cost, unless the Board determines such amount does not reflect the securities’ fair value, in which case these securities will be fair valued as determined by the Board. Debt instruments having a maturity greater than sixty days for which market quotations are readily available are valued at the average of the latest bid and asked prices. If there were no asked prices quoted on such day, the security is valued using the closing bid price. U.S. government obligations with maturities greater than sixty days are normally valued using a model that incorporates market observable data such as reported sales of similar securities, broker quotes, yields, bids, offers, and reference data. Certain securities are valued principally using dealer quotations.
Securities and assets for which market quotations are not readily available are fair valued as determined by the Board. Fair valuation methodologies and procedures may include, but are not limited to: analysis and review of available financial and non-financial information about the company; comparisons with the valuation and changes in valuation of similar securities, including a comparison of foreign securities with the equivalent U.S. dollar value American Depositary Receipt securities at the close of the U.S. exchange; and evaluation of any other information that could be indicative of the value of the security.
The Fund employs a fair value model to adjust prices to reflect events affecting the values of certain portfolio securities which occur between the close of trading on the principal market for such securities (foreign exchanges
12
The GAMCO Global Growth Fund
Notes to Financial Statements (Continued)
and over-the-counter markets) at the time when net asset values of the Fund are determined. If the Fund’s valuation committee believes that a particular event would materially affect net asset value, further adjustment is considered.
The inputs and valuation techniques used to measure fair value of the Fund’s investments are summarized into three levels as described in the hierarchy below:
| | — | | Level 1 — quoted prices in active markets for identical securities; |
| | — | | Level 2 — other significant observable inputs (including quoted prices for similar securities, interest rates, prepayment speeds, credit risk, etc.); and |
| | — | | Level 3 — significant unobservable inputs (including the Board’s determinations as to the fair value of investments). |
A financial instrument’s level within the fair value hierarchy is based on the lowest level of any input both individually and in the aggregate that is significant to the fair value measurement. The inputs or methodology used for valuing securities are not necessarily an indication of the risk associated with investing in those securities. The summary of the Fund’s investments in securities by inputs used to value the Fund’s investments as of December 31, 2014 is as follows:
| | | | | | | | | | | | |
| | | Valuation Inputs | | | Total Market Value
at 12/31/14 | |
| | | Level 1
Quoted Prices | | | Level 2 Other Significant
Observable Inputs | | |
INVESTMENTS IN SECURITIES: | | | | | | | | | | | | |
ASSETS (Market Value): | | | | | | | | | | | | |
Common Stocks | | | | | | | | | | | | |
Consumer Discretionary | | | $12,276,056 | | | | $ 4,549,340 | | | | $16,825,396 | |
Financials | | | 8,893,328 | | | | 5,195,786 | | | | 14,089,114 | |
Information Technology | | | 12,052,819 | | | | 1,512,153 | | | | 13,564,972 | |
Industrials | | | 8,496,886 | | | | 2,447,068 | | | | 10,943,954 | |
Consumer Staples | | | 5,741,953 | | | | 4,539,110 | | | | 10,281,063 | |
Health Care | | | 8,048,182 | | | | 1,955,634 | | | | 10,003,816 | |
Energy | | | 5,430,136 | | | | — | | | | 5,430,136 | |
Materials | | | 2,324,736 | | | | — | | | | 2,324,736 | |
Telecommunication Services | | | 384,672 | | | | 1,713,025 | | | | 2,097,697 | |
Utilities | | | 446,418 | | | | — | | | | 446,418 | |
Total Common Stocks | | | 64,095,186 | | | | 21,912,116 | | | | 86,007,302 | |
TOTAL INVESTMENTS IN SECURITIES – ASSETS | | | $64,095,186 | | | | $21,912,116 | | | | $86,007,302 | |
During the year ended December 31, 2014, certain foreign securities were transferred from Level 1 to Level 2 due to the application of fair value procedures resulting from volatility in U.S. markets after the close of the foreign markets. The beginning of period value of the securities that transferred from Level 1 to Level 2 during the period amounted to $19,919,457 or 24.90% of net assets as of December 31, 2013. The Fund’s policy is to recognize transfers among Levels as of the beginning of the reporting period.
There were no Level 3 investments held at December 31, 2014 or 2013.
13
The GAMCO Global Growth Fund
Notes to Financial Statements (Continued)
Additional Information to Evaluate Qualitative Information.
General. The Fund uses recognized industry pricing services – approved by the Board and unaffiliated with the Adviser – to value most of its securities, and uses broker quotes provided by market makers of securities not valued by these and other recognized pricing sources. Several different pricing feeds are received to value domestic equity securities, international equity securities, preferred equity securities, and fixed income securities. The data within these feeds is ultimately sourced from major stock exchanges and trading systems where these securities trade. The prices supplied by external sources are checked by obtaining quotations or actual transaction prices from market participants. If a price obtained from the pricing source is deemed unreliable, prices will be sought from another pricing service or from a broker/dealer that trades that security or similar securities.
Fair Valuation. Fair valued securities may be common and preferred equities, warrants, options, rights, and fixed income obligations. Where appropriate, Level 3 securities are those for which market quotations are not available, such as securities not traded for several days, or for which current bids are not available, or which are restricted as to transfer. Among the factors to be considered to fair value a security are recent prices of comparable securities that are publicly traded, reliable prices of securities not publicly traded, the use of valuation models, current analyst reports, valuing the income or cash flow of the issuer, or cost if the preceding factors do not apply. The circumstances of Level 3 securities are frequently monitored to determine if fair valuation measures continue to apply.
The Adviser reports quarterly to the Board the results of the application of fair valuation policies and procedures. These include back testing the prices realized in subsequent trades of these fair valued securities to fair values previously recognized.
Foreign Currency Translations. The books and records of the Fund are maintained in U.S. dollars. Foreign currencies, investments, and other assets and liabilities are translated into U.S. dollars at current exchange rates. Purchases and sales of investment securities, income, and expenses are translated at the exchange rate prevailing on the respective dates of such transactions. Unrealized gains and losses that result from changes in foreign exchange rates and/or changes in market prices of securities have been included in unrealized appreciation/depreciation on investments and foreign currency translations. Net realized foreign currency gains and losses resulting from changes in exchange rates include foreign currency gains and losses between trade date and settlement date on investment securities transactions, foreign currency transactions, and the difference between the amounts of interest and dividends recorded on the books of the Fund and the amounts actually received. The portion of foreign currency gains and losses related to fluctuation in exchange rates between the initial purchase trade date and subsequent sale trade date is included in realized gain/(loss) on investments.
Foreign Securities. The Fund may directly purchase securities of foreign issuers. Investing in securities of foreign issuers involves special risks not typically associated with investing in securities of U.S. issuers. The risks include possible revaluation of currencies, the inability to repatriate funds, less complete financial information about companies, and possible future adverse political and economic developments. Moreover, securities of many foreign issuers and their markets may be less liquid and their prices more volatile than securities of comparable U.S. issuers.
14
The GAMCO Global Growth Fund
Notes to Financial Statements (Continued)
Foreign Taxes. The Fund may be subject to foreign taxes on income, gains on investments, or currency repatriation, a portion of which may be recoverable. The Fund will accrue such taxes and recoveries as applicable, based upon its current interpretation of tax rules and regulations that exist in the markets in which it invests.
Securities Transactions and Investment Income. Securities transactions are accounted for on the trade date with realized gain or loss on investments determined by using the identified cost method. Interest income (including amortization of premium and accretion of discount) is recorded on the accrual basis. Premiums and discounts on debt securities are amortized using the effective yield to maturity method. Dividend income is recorded on the ex-dividend date, except for certain dividends from foreign securities that are recorded as soon after the ex-dividend date as the Fund becomes aware of such dividends.
Determination of Net Asset Value and Calculation of Expenses. Certain administrative expenses are common to, and allocated among, various affiliated funds. Such allocations are made on the basis of each fund’s average net assets or other criteria directly affecting the expenses as determined by the Adviser pursuant to procedures established by the Board.
In calculating NAV per share of each class, investment income, realized and unrealized gains and losses, redemption fees, and expenses other than class specific expenses are allocated daily to each class of shares based upon the proportion of net assets of each class at the beginning of each day. Distribution expenses are borne solely by the class incurring the expense.
Distributions to Shareholders. Distributions to shareholders are recorded on the ex-dividend date. Distributions to shareholders are based on income and capital gains as determined in accordance with federal income tax regulations, which may differ from income and capital gains as determined under GAAP. These differences are primarily due to differing treatments of income and gains on various investment securities and foreign currency transactions held by the Fund, timing differences, and differing characterizations of distributions made by the Fund. Distributions from net investment income for federal income tax purposes include net realized gains on foreign currency transactions. These book/tax differences are either temporary or permanent in nature. To the extent these differences are permanent, adjustments are made to the appropriate capital accounts in the period when the differences arise. Permanent differences were primarily due to the tax treatment of currency gains and losses and reclassifications of gains on investments in passive foreign investment companies. These reclassifications have no impact on the NAV of the Fund. For the year ended December 31, 2014, reclassifications were made to increase accumulated net investment income by $22,743 and decrease accumulated net realized gain on investments and foreign currency transactions by $22,743.
The tax character of distributions paid during the years ended December 31, 2014 and 2013 was as follows:
| | | | | | | | |
| | | Year Ended
December 31, 2014 | | | Year Ended
December 31, 2013 | |
Distributions paid from: | | | | | | | | |
Ordinary income (inclusive of short term capital gains) | | $ | 321,530 | | | $ | 803,626 | |
Net long term capital gains | | | 5,395,844 | | | | 6,087,192 | |
| | | | | | | | |
Total distributions paid | | $ | 5,717,374 | | | $ | 6,890,818 | |
| | | | | | | | |
Provision for Income Taxes. The Fund intends to continue to qualify as a regulated investment company under Subchapter M of the Internal Revenue Code of 1986, as amended (the “Code”). It is the policy of the
15
The GAMCO Global Growth Fund
Notes to Financial Statements (Continued)
Fund to comply with the requirements of the Code applicable to regulated investment companies and to distribute substantially all of its net investment company taxable income and net capital gains. Therefore, no provision for federal income taxes is required.
At December 31, 2014, the components of accumulated earnings/losses on a tax basis were as follows:
| | | | |
Undistributed ordinary income | | $ | 73,010 | |
Undistributed long term capital gains | | | 66 | |
Net unrealized appreciation on investments and foreign currency translations | | | 24,953,239 | |
| | | | |
Total | | $ | 25,026,315 | |
| | | | |
Under the Regulated Investment Company Modernization Act of 2010, the Fund is permitted to carry forward for an unlimited period capital losses incurred. Post enactment capital losses that are carried forward will retain their character as either short term or long term capital losses.
At December 31, 2014, the differences between book basis and tax basis unrealized appreciation on investments were primarily due to basis adjustments for litigation gains.
The following summarizes the tax cost of investments and the related net unrealized appreciation at December 31, 2014:
| | | | | | | | | | | | | | | | |
| | | Cost | | | Gross
Unrealized
Appreciation | | | Gross
Unrealized
Depreciation | | | Net Unrealized
Appreciation | |
Investments | | | $61,048,613 | | | | $26,532,941 | | | | $(1,574,252 | ) | | | $24,958,689 | |
The Fund is required to evaluate tax positions taken or expected to be taken in the course of preparing the Fund’s tax returns to determine whether the tax positions are “more-likely-than-not” of being sustained by the applicable tax authority. Income tax and related interest and penalties would be recognized by the Fund as tax expense in the Statement of Operations if the tax positions were deemed not to meet the more-likely-than-not threshold. During the year ended December 31, 2014, the Fund did not incur any income tax, interest, or penalties. As of December 31, 2014, the Adviser has reviewed all open tax years and concluded that there was no impact to the Fund’s net assets or results of operations. The Fund’s federal and state tax returns for the prior three fiscal years remain open, subject to examination. On an ongoing basis, the Adviser will monitor the Fund’s tax positions to determine if adjustments to this conclusion are necessary.
3. Investment Advisory Agreement and Other Transactions. The Fund has entered into an investment advisory agreement (the “Advisory Agreement”) with the Adviser which provides that the Fund will pay the Adviser a fee, computed daily and paid monthly, at the annual rate of 1.00% of the value of its average daily net assets. In accordance with the Advisory Agreement, the Adviser provides a continuous investment program for the Fund’s portfolio, oversees the administration of all aspects of the Fund’s business and affairs, and pays the compensation of all Officers and Directors of the Fund who are affiliated persons of the Adviser.
The Adviser, effective August 25, 2014, has contractually agreed to waive its investment advisory fee and/or reimburse expenses of Class I Shares to the extent necessary to maintain the total operating expenses (excluding brokerage, acquired fund fees and expenses, interest, taxes, and extraordinary expenses) until at least April 30, 2016 at no more than 1.00% of the value of its average daily net assets. For the year ended December 31, 2014, the Adviser reimbursed the Fund in the amount of $3,489.
16
The GAMCO Global Growth Fund
Notes to Financial Statements (Continued)
The Corporation pays each Director who is not considered to be an affiliated person an annual retainer of $6,000 plus $1,000 for each Board meeting attended and they are reimbursed for any out of pocket expenses incurred in attending meetings. All Board committee members receive $1,000 per meeting attended. The Chairman of the Audit Committee receives an annual fee of $3,000, and the Lead Director receives an annual fee of $2,000. A Director may receive a single meeting fee, allocated among the participating funds, for attending certain meetings held on behalf of multiple funds. Directors who are directors or employees of the Adviser or an affiliated company receive no compensation or expense reimbursement from the Corporation.
4. Distribution Plan. The Fund’s Board has adopted a distribution plan (the “Plan”) for each class of shares, except for Class I Shares, pursuant to Rule 12b-1 under the 1940 Act. Under the Class AAA, Class A, and Class C Share Plans, payments are authorized to G.distributors, LLC (the “Distributor”), an affiliate of the Adviser, at annual rates of 0.25%, 0.25%, and 1.00%, respectively, of the average daily net assets of those classes, the annual limitations under each Plan. Such payments are accrued daily and paid monthly.
5. Portfolio Securities. Purchases and sales of securities during the year ended December 31, 2014, other than short term securities and U.S. Government obligations, aggregated $27,523,819 and $24,122,961, respectively.
6. Transactions with Affiliates. During the year ended December 31, 2014, the Fund paid brokerage commissions on security trades of $969 to G.research, Inc, an affiliate of the Adviser. Additionally the Distributor retained a total of $7,241 from investors representing commissions (sales charges and underwriting fees) on sales and redemptions of Fund shares.
The cost of calculating the Fund’s NAV per share is a Fund expense pursuant to the Advisory Agreement. During the year ended December 31, 2014, the Fund paid or accrued $45,000 to the Adviser in connection with the cost of computing the Fund’s NAV.
7. Line of Credit. The Fund participates in an unsecured line of credit of up to $75,000,000 under which it may borrow up to 10% of its net assets from the custodian for temporary borrowing purposes. Borrowings under this arrangement bear interest at the higher of the sum of the overnight LIBOR rate plus 100 basis points or the sum of the federal funds rate plus 100 basis points at the time of borrowing. This amount, if any, would be included in “Interest expense” in the Statement of Operations. At December 31, 2014, borrowings of $236,000 were outstanding under the line of credit.
The average daily amount of borrowings outstanding under the line of credit during the year ended December 31, 2014 was $3,266 with a weighted average interest rate of 1.12%. The maximum amount borrowed at any time during the year ended December 31, 2014 was $365,000.
8. Capital Stock. The Fund offers four classes of shares – Class AAA Shares, Class A Shares, Class C Shares, and Class I Shares. Class AAA Shares are offered without a sales charge only to investors who acquire them directly from the Distributor, through selected broker/dealers, or the transfer agent. Class I Shares are offered without a sales charge, directly through the Distributor or brokers that have entered into selling agreements specifically with respect to Class I Shares. Class A Shares are subject to a maximum front-end sales charge of 5.75%. Class C Shares are subject to a 1.00% contingent deferred sales charge for one year after purchase.
17
The GAMCO Global Growth Fund
Notes to Financial Statements (Continued)
The Fund imposes a redemption fee of 2.00% on all classes of shares that are redeemed or exchanged on or before the seventh day after the date of a purchase. The redemption fee is deducted from the proceeds otherwise payable to the redeeming shareholders and is retained by the Fund as an increase in paid-in capital. The redemption fees retained by the Fund during the years ended December 31, 2014 and 2013, if any, can be found in the Statement of Changes in Net Assets under Redemption Fees.
Transactions in shares of capital stock were as follows:
| | | | | | | | | | | | | | | | |
| | | Year Ended
December 31, 2014 | | | Year Ended
December 31, 2013 | |
| | | Shares | | | Amount | | | Shares | | | Amount | |
Class AAA | | | | | | | | | | | | | | | | |
Shares sold | | | 216,691 | | | $ | 6,869,063 | | | | 107,327 | | | $ | 3,156,052 | |
Shares issued upon reinvestment of distributions | | | 163,133 | | | | 4,995,128 | | | | 210,633 | | | | 6,262,104 | |
Shares redeemed | | | (229,790 | ) | | | (7,245,731 | ) | | | (247,595 | ) | | | (7,356,576 | ) |
| | | | | | | | | | | | | | | | |
Net increase | | | 150,034 | | | $ | 4,618,460 | | | | 70,365 | | | $ | 2,061,580 | |
| | | | | | | | | | | | | | | | |
Class A | | | | | | | | | | | | | | | | |
Shares sold | | | 70,786 | | | $ | 2,230,553 | | | | 17,658 | | | $ | 528,418 | |
Shares issued upon reinvestment of distributions | | | 5,659 | | | | 173,227 | | | | 4,401 | | | | 130,840 | |
Shares redeemed | | | (13,320 | ) | | | (422,965 | ) | | | (5,676 | ) | | | (177,022 | ) |
| | | | | | | | | | | | | | | | |
Net increase | | | 63,125 | | | $ | 1,980,815 | | | | 16,383 | | | $ | 482,236 | |
| | | | | | | | | | | | | | | | |
Class C | | | | | | | | | | | | | | | | |
Shares sold | | | 27,286 | | | $ | 771,995 | | | | 16,076 | | | $ | 454,556 | |
Shares issued upon reinvestment of distributions | | | 2,801 | | | | 76,632 | | | | 2,188 | | | | 58,876 | |
Shares redeemed | | | (7,350 | ) | | | (209,426 | ) | | | (6,142 | ) | | | (169,191 | ) |
| | | | | | | | | | | | | | | | |
Net increase | | | 22,737 | | | $ | 639,201 | | | | 12,122 | | | $ | 344,241 | |
| | | | | | | | | | | | | | | | |
Class I | | | | | | | | | | | | | | | | |
Shares sold | | | 38,577 | | | $ | 1,225,607 | | | | 16,483 | | | $ | 483,470 | |
Shares issued upon reinvestment of distributions | | | 4,076 | | | | 125,588 | | | | 3,395 | | | | 101,456 | |
Shares redeemed | | | (8,917 | ) | | | (286,256 | ) | | | (7,668 | ) | | | (227,012 | ) |
| | | | | | | | | | | | | | | | |
Net increase | | | 33,736 | | | $ | 1,064,939 | | | | 12,210 | | | $ | 357,914 | |
| | | | | | | | | | | | | | | | |
9. Indemnifications. The Fund enters into contracts that contain a variety of indemnifications. The Fund’s maximum exposure under these arrangements is unknown. However, the Fund has not had prior claims or losses pursuant to these contracts. Management has reviewed the Fund’s existing contracts and expects the risk of loss to be remote.
10. Subsequent Events. Management has evaluated the impact on the Fund of all subsequent events occurring through the date the financial statements were issued and has determined that there were no subsequent events requiring recognition or disclosure in the financial statements.
18
The GAMCO Global Growth Fund
Report of Independent Registered Public Accounting Firm
To the Board of Directors of GAMCO Global Series Funds, Inc. and the
Shareholders of The GAMCO Global Growth Fund
We have audited the accompanying statement of assets and liabilities, including the schedule of investments, of The GAMCO Global Growth Fund (the “Fund”), one of the series constituting GAMCO Global Series Funds, Inc., as of December 31, 2014, and the related statement of operations for the year then ended, the statements of changes in net assets for each of the two years in the period then ended, and the financial highlights for each of the five years in the period then ended. These financial statements and financial highlights are the responsibility of the Fund’s management. Our responsibility is to express an opinion on these financial statements and financial highlights based on our audits.
We conducted our audits in accordance with the standards of the Public Company Accounting Oversight Board (United States). Those standards require that we plan and perform the audit to obtain reasonable assurance about whether the financial statements and financial highlights are free of material misstatement. We were not engaged to perform an audit of the Fund’s internal control over financial reporting. Our audits included consideration of internal control over financial reporting as a basis for designing audit procedures that are appropriate in the circumstances, but not for the purpose of expressing an opinion on the effectiveness of the Fund’s internal control over financial reporting. Accordingly, we express no such opinion. An audit also includes examining, on a test basis, evidence supporting the amounts and disclosures in the financial statements and financial highlights, assessing the accounting principles used and significant estimates made by management, and evaluating the overall financial statement presentation. Our procedures included confirmation of securities owned as of December 31, 2014, by correspondence with the Fund’s custodian. We believe that our audits provide a reasonable basis for our opinion.
In our opinion, the financial statements and financial highlights referred to above present fairly, in all material respects, the financial position of the Fund at December 31, 2014, the results of its operations for the year then ended, the changes in its net assets for each of the two years in the period then ended, and its financial highlights for each of the five years in the period then ended, in conformity with U.S. generally accepted accounting principles.

New York, New York
February 25, 2015
19
The GAMCO Global Growth Fund
Board Consideration and Re-Approval of Investment Advisory Agreements (Unaudited)
During the six months ended December 31, 2014, the Board of Directors of the Corporation approved the continuation of the investment advisory agreement with the Adviser for the Fund on the basis of the recommendation by the directors (the “Independent Board Members”) who are not “interested persons” of the Fund. The following paragraphs summarize the material information and factors considered by the Independent Board Members as well as their conclusions relative to such factors.
Nature, Extent, and Quality of Services. The Independent Board Members considered information regarding the Fund’s portfolio managers, the depth of the analyst pool available to the Adviser and the portfolio managers, the scope of supervisory, administrative, shareholder, and other services supervised or provided by the Adviser and the absence of significant service problems reported to the Board. The Independent Board Members noted the experience, length of service, and reputation of the Fund’s portfolio managers.
Investment Performance. The Independent Board Members reviewed the short, medium, and long term performance of the Fund against a peer group of global large cap growth funds, noting its top quartile performance for the one, three, and five year periods.
Profitability. The Independent Board Members reviewed summary data regarding the profitability of the Fund to the Adviser both with a pro rata administrative overhead charge and with a standalone administrative charge. The Independent Board Members also noted that a portion of the Fund’s portfolio transactions were executed by an affiliated broker of the Adviser and that another affiliated broker of the Adviser received distribution fees and minor amounts of sales commissions.
Economies of Scale. The Independent Board Members discussed the major elements of the Adviser’s cost structure and the relationship of those elements to potential economies of scale and reviewed rudimentary data relating to the impact of 20% growth in the Fund on the Adviser’s profitability.
Sharing of Economies of Scale. The Independent Board Members noted that the investment management fee schedule for the Fund does not take into account any potential economies of scale that may develop.
Service and Cost Comparisons. The Independent Board Members compared the expense ratios of the investment management fee, other expenses, and total expenses of the Fund with similar expense ratios of the peer group of global large cap growth funds and noted that the Adviser’s management fee includes substantially all administrative services of the Fund as well as investment advisory services. The Independent Board Members noted that the Fund’s expense ratios were significantly higher than and the Fund’s size was lower than average within this group. The Independent Board Members were presented with, but did not consider to be material to their decision, various information comparing the advisory fee with the fee for other types of accounts managed by the Adviser.
Conclusions. The Independent Board Members concluded that the Fund enjoyed highly experienced portfolio management services and good ancillary services and a reasonable performance record. The Independent Board Members also concluded that the Fund’s expense ratios and the profitability to the Adviser of managing the Fund were reasonable, and that economies of scale were not a significant factor in their thinking at this time. The Independent Board Members did not view the potential profitability of ancillary services as material to their decision. On the basis of the foregoing and without assigning particular weight to any single conclusion, the Independent Board Members determined to recommend continuation of the investment management agreement to the full Board of Directors.
20
The GAMCO Global Growth Fund
Additional Fund Information (Unaudited)
The business and affairs of the Fund are managed under the direction of the Corporation’s Board of Directors. Information pertaining to the Directors and officers of the Fund is set forth below. The Corporation’s Statement of Additional Information includes additional information about the Fund’s Directors and is available without charge, upon request, by calling 800-GABELLI (800-422-3554) or by writing to The GAMCO Global Growth Fund at One Corporate Center, Rye, NY 10580-1422.
| | | | | | | | |
Name, Position(s) Address1 and Age | | Term of Office
and Length of
Time Served2 | | Number of Funds
in Fund Complex
Overseen by Director | | Principal Occupation(s)
During Past Five Years | | Other Directorships Held by Director4 |
| | |
INTERESTED DIRECTORS3 : | | | | |
| | | | |
Mario J. Gabelli, CFA Director and Chief Investment Officer Age: 72 | | Since 1993 | | 28 | | Chairman, Chief Executive Officer, and Chief Investment Officer–Value Portfolios of GAMCO Investors, Inc., and Chief Investment Officer–Value Portfolios of Gabelli Funds, LLC and GAMCO Asset Management Inc.; Director/Trustee or Chief Investment Officer of other registered investment companies in the Gabelli/GAMCO Fund Complex; Chief Executive Officer of GGCP, Inc. | | Director of Morgan Group Holdings, Inc. (holding company); Chairman of the Board and Chief Executive Officer of LICT Corp. (multimedia and communication services); Director of CIBL, Inc. (broadcasting and wireless communications); Director of ICTC Group, Inc. (communications); Director of RLJ Acquisition Inc. (blank check company) (2011-2012) |
| | | | |
John D. Gabelli Director Age: 70 | | Since 1993 | | 10 | | Senior Vice President of G.research, Inc. | | — |
| | | | |
INDEPENDENT DIRECTORS5: | | | | | | | | |
| | | | |
E. Val Cerutti Director Age: 75 | | Since 2001 | | 7 | | Chief Executive Officer of Cerutti Consultants, Inc. | | Director of LGL Group, Inc. (diversified manufacturing) (1990-2009) |
| | | | |
Anthony J. Colavita Director Age: 79 | | Since 1993 | | 37 | | President of the law firm of Anthony J. Colavita, P.C. | | — |
| | | | |
Arthur V. Ferrara Director Age: 84 | | Since 2001 | | 8 | | Former Chairman of the Board and Chief Executive Officer of The Guardian Life Insurance Company of America (1993 – 1995) | | — |
| | | | |
Werner J. Roeder, MD Director Age: 74 | | Since 1993 | | 23 | | Former Medical Director of Lawrence Hospital and practicing private physician | | — |
| | | | |
Anthonie C. van Ekris Director Age: 80 | | Since 1993 | | 20 | | Chairman and Chief Executive Officer of BALMAC International, Inc. (commodities and futures trading) | | — |
| | | | |
Salvatore J. Zizza Director Age: 69 | | Since 2004 | | 31 | | Chairman of Zizza & Associates Corp. (financial consulting); Chairman of Metropolitan Paper Recycling, Inc. (recycling) (since 2005); Chairman of Harbor Diversified, Inc. (pharmaceuticals) (since 1999); Chairman of BAM (semiconductor and aerospace manufacturing) (since 2000); Chairman of Bergen Cove Realty Inc. (since 2002) | | Director and Vice Chairman of Trans-Lux Corporation (business services); Director and Chairman of Harbor Diversified, Inc. (pharmaceuticals); Chairman of Bion Environmental Technologies (technology) (2005-2007); Director, Chairman, and CEO of General Employment Enterprises (staffing services) (2009-2012) |
21
The GAMCO Global Growth Fund
Additional Fund Information (Continued) (Unaudited)
| | | | |
Name, Position(s) Address1 and Age | | Term of Office and Length of
Time Served2 | | Principal Occupation(s) During Past Five Years |
| | |
OFFICERS: | | | | |
| | |
Bruce N. Alpert President Age: 63 | | Since 2003 | | Executive Vice President and Chief Operating Officer of Gabelli Funds, LLC since 1988; and an Officer of registered investment companies in the Gabelli/GAMCO Fund Complex; Director of Teton Advisors, Inc. 1998-2012; Chairman of Teton Advisors, Inc. 2008-2010; President of Teton Advisors, Inc. 1998-2008; Senior Vice President of GAMCO Investors, Inc. since 2008 |
| | |
Andrea R. Mango Secretary Age: 42 | | Since November
2013 | | Counsel of Gabelli Funds, LLC; Corporate Vice President within the Corporate Compliance Department of New York Life Insurance Company 2011-2013; Vice President and Counsel of Deutsche Bank 2006-2011 |
| | |
Agnes Mullady Treasurer Age: 56 | | Since 2006 | | President and Chief Operating Officer of the Open-End Fund Division of Gabelli Funds, LLC since September 2010; Senior Vice President of GAMCO Investors, Inc. since 2009; Vice President of Gabelli Funds, LLC since 2007; Officer of all of the registered investment companies in the Gabelli/GAMCO Fund Complex |
| | |
Richard J. Walz Chief Compliance Officer Age: 55 | | Since November
2013 | | Chief Compliance Officer of the Gabelli/GAMCO Fund Complex; Chief Compliance Officer of AEGON USA Investment Management LLC 2011-2013; Chief Compliance Officer of Cutwater Asset Management 2004-2011 |
| 1 | Address: One Corporate Center, Rye, NY 10580-1422, unless otherwise noted. |
| 2 | Each Director will hold office for an indefinite term until the earliest of (i) the next meeting of shareholders, if any, called for the purpose of considering the election or re-election of such Director and until the election and qualification of his or her successor, if any, elected at such meeting, or (ii) the date a Director resigns or retires, or a Director is removed by the Board of Directors or shareholders, in accordance with the Fund’s By-Laws and Articles of Incorporation. Each officer will hold office for an indefinite term until the date he or she resigns or retires or until his or her successor is elected and qualified. |
| 3 | “Interested person” of the Corporation as defined in the 1940 Act. Messers. Gabelli are each considered an “interested person” because of their affiliation with Gabelli Funds, LLC which acts as the Corporation’s investment adviser. Mario J. Gabelli and John D. Gabelli are brothers. |
| 4 | This column includes only directorships of companies required to report to the SEC under the Securities Exchange Act of 1934, as amended, i.e., public companies, or other investment companies registered under the 1940 Act. |
| 5 | Directors who are not interested persons are considered “Independent” Directors. |
22
THE GAMCO GLOBAL GROWTH FUND
One Corporate Center
Rye, NY 10580-1422
Portfolio Management Team Biographies
Caesar M. P. Bryan joined GAMCO Asset Management in 1994. He is a member of the global investment team of Gabelli Funds, LLC and portfolio manager of several funds within the Gabelli/GAMCO Fund Complex. Prior to joining Gabelli, Mr. Bryan was a portfolio manager at Lexington Management. He began his investment career in 1979 at Samuel Montagu Company, the London based merchant bank. Mr. Bryan graduated from the University of Southampton in England with a Bachelor of Law and is a member of the English Bar.
Howard F. Ward, CFA, joined Gabelli Funds in 1995 and currently serves as GAMCO’s Chief Investment Officer of Growth Equities as well as a Gabelli Funds, LLC portfolio manager for several funds within the Gabelli/GAMCO Fund Complex. Prior to joining Gabelli, Mr. Ward served as Managing Director and Lead Portfolio Manager for several Scudder mutual funds. He also was an Investment Officer in the Institutional Investment Department with Brown Brothers, Harriman & Co. for four years. Mr. Ward received his B.A. in Economics from Northwestern University.
2014 TAX NOTICE TO SHAREHOLDERS (Unaudited)
For the year ended December 31, 2014, the Fund paid to shareholders ordinary income distributions (comprised of net investment income and short term capital gains) totaling $0.118, $0.138, and $0.247 per share for Class AAA, Class A, and Class I Shares, respectively, and long term capital gains totaling $5,395,844, or the maximum allowable. The distribution of long term capital gains has been designated as a capital gain dividend by the Fund’s Board of Directors. For the year ended December 31, 2014, 100% of the ordinary income distribution qualifies for the dividends received deduction available to corporations. The Fund designates 100% of the ordinary income distribution as qualified dividend income pursuant to the Jobs and Growth Tax Relief Reconciliation Act of 2003. The Fund designates 0.01% of the ordinary income distribution as qualified interest income pursuant to the Tax Relief, Unemployment Reauthorization, and Job Creation Act of 2010.
U.S. Government Income:
The percentage of the ordinary income distribution paid by the Fund during the year ended December 31, 2014 which was derived from U.S. Treasury securities was 0.01%. The percentage of U.S. Government securities held as of December 31, 2014 was 0.00%. Due to the diversity in state and local tax law, it is recommended that you consult your personal tax adviser as to the applicability of the information provided to your specific situation.
All designations are based on financial information available as of the date of this annual report and, accordingly, are subject to change. For each item, it is the intention of the Fund to designate the maximum amount permitted under the Internal Revenue Code and the regulations thereunder.
We have separated the portfolio managers’ commentary from the financial statements and investment portfolio due to corporate governance regulations stipulated by the Sarbanes-Oxley Act of 2002. We have done this to ensure that the content of the portfolio managers’ commentary is unrestricted. The financial statements and investment portfolio are mailed separately from the commentary. Both the commentary and the financial statements, including the portfolio of investments, will be available on our website at www.gabelli.com.
GAMCO Global Series Funds, Inc.
THE GAMCO GLOBAL GROWTH FUND
One Corporate Center
Rye, New York 10580-1422
t 800-GABELLI (800-422-3554)
f 914-921-5118
e info@gabelli.com
GABELLI.COM
Net Asset Value per share available daily
by calling 800-GABELLI after 7:00 P.M.
| | |
| BOARD OF DIRECTORS | | |
| |
Mario J. Gabelli, CFA Chairman and Chief Executive Officer, GAMCO Investors, Inc. E. Val Cerutti Chief Executive Officer, Cerutti Consultants, Inc. Anthony J. Colavita President, Anthony J. Colavita, P.C. Arthur V. Ferrara Former Chairman and Chief Executive Officer, Guardian Life Insurance Company of America John D. Gabelli Senior Vice President, G.research, Inc. Werner J. Roeder, MD Former Medical Director, Lawrence Hospital Anthonie C. van Ekris Chairman, BALMAC International, Inc. | | Salvatore J. Zizza Chairman, Zizza & Associates Corp. OFFICERS Bruce N. Alpert President Andrea R. Mango Secretary Agnes Mullady Treasurer Richard J. Walz Chief Compliance Officer DISTRIBUTOR G.distributors, LLC CUSTODIAN, TRANSFER AGENT, AND DIVIDEND DISBURSING AGENT State Street Bank and Trust Company LEGAL COUNSEL Skadden, Arps, Slate, Meagher & Flom LLP |
|
|
|
|
|
|
|
|
|
|
|
|
|
|
|
|
|
|
|
This report is submitted for the general information of the shareholders of The GAMCO Global Growth Fund. It is not authorized for distribution to prospective investors unless preceded or accompanied by an effective prospectus.


Morningstar® rated The GAMCO Global Growth Fund Class AAA Shares 4 stars overall and 4 stars for the three, five, and ten year periods ended December 31, 2014 among 881, 881, 688, and 346 World Stock funds, respectively. Morningstar RatingTM is based on risk-adjusted returns.
GAB442Q414AR
| | |
The GAMCO Global Opportunity Fund Annual Report — December 31, 2014 | |  |
|
To Our Shareholders,
For the year ended December 31, 2014, the net asset value (“NAV”) per Class AAA Share of The GAMCO Global Opportunity Fund decreased 1.2% compared with an increase of 4.2% for the Morgan Stanley Capital International (“MSCI”) All Country (“AC”) World Index. See page 2 for additional performance information.
Enclosed are the financial statements, including the schedule of investments, as of December 31, 2014.
Performance Discussion (Unaudited)
For the year, 9 of 23 major national indices provided positive returns. Countries posting positive returns for 2014 were led by Israel (+22.8%), followed by the United States (+12.7%), New Zealand (+7.3%), Denmark (+6.2%), Hong Kong (+5.1%), Belgium (+4.1%), Singapore (+3.0%), Ireland (+2.3%), and Canada (+1.5%). Countries posting negative returns for 2014 were led by Portugal (-38.2%), followed by Austria (+29.8%), Norway (-22.0%), Germany (-10.4%), France (-9.9%), Italy (-9.5%), Sweden (-7.5%), the United Kingdom (-5.4%), Spain (-4.7%), Japan (-4.0%), the Netherlands (-3.5%) Australia (-3.4%), Finland (-0.7%), and Switzerland (-0.1%) Within emerging markets, 12 of 21 countries posted positive yearly results. Of the four largest emerging markets, India (+21.9%) posted the best yearly return, followed by China (+4.7%), Brazil (-17.4%), and Russia (-48.5%).
We purchase attractively valued companies that we believe have the opportunity to grow earnings more rapidly than average within that company’s local market. We pay close attention to company’s position, management, and balance sheet, with particular emphasis on the ability of the company to finance its growth. Generally, we value a company relative to its local market, but where appropriate, we attempt to benefit from valuation discrepancies between markets. Our primary focus is on security selection and not country allocation, but the Fund will remain diversified by sector and geography. Country allocation is likely to reflect broad economic, financial, and currency trends, as well as relative size of the market.
Selected holdings that contributed positively to performance in 2014 were: Lockheed Martin Corp. (4.3% of net assets as December 31, 2014), a security and aerospace company; Dr. Pepper Snapple Group Inc. (1.5%), manufacturer and distributor of non-alcoholic beverages; and Hillshire Brands Co. (no longer held in the portfolio). Some of our weaker performing holdings during the year were: Kinnevik Investments AB (2.9%), headquartered in Stockholm, Sweden is an investment company managing a portfolio of listed holdings, primarily in the telecommunications and media sectors, CNH Industrial NV (0.8%), a producer of agricultural and construction equipment; and Pioneer Natural Resources Co. (no longer held in the portfolio).
We appreciate your confidence and trust.
|
Sincerely yours, |
|

Bruce N. Alpert |
President |
February 20, 2015
Comparative Results
| | | | | | | | | | | | | | | | | | |
| Average Annual Returns through December 31, 2014 (a) (Unaudited) | | | Since | | | |
| | | | | | | | | | | | Inception | | | |
| | | 1 Year | | | 5 Year | | | 10 Year | | | (5/11/98) | | | |
Class AAA (GABOX) | | | (1.17 | )% | | | 7.71 | % | | | 5.86 | % | | | 6.77 | % | | |
MSCI AC World Index | | | 4.16 | | | | 9.17 | | | | 6.09 | | | | 4.88 | (d) | | |
Lipper Global Large-Cap Growth Fund Classification | | | 2.79 | | | | 10.67 | | | | 7.14 | | | | 6.27 | | | |
Lipper Global Multi-Cap Growth Fund Classification | | | 2.22 | | | | 9.33 | | | | 5.60 | | | | 5.32 | | | |
Class A (GOCAX) | | | (1.21 | ) | | | 7.70 | | | | 5.86 | | | | 6.77 | | | |
With sales charge (b) | | | (6.89 | ) | | | 6.43 | | | | 5.24 | | | | 6.39 | | | |
Class C (GGLCX) | | | (1.97 | ) | | | 6.89 | | | | 5.07 | | | | 6.35 | | | |
With contingent deferred sales charge (c) | | | (2.95 | ) | | | 6.89 | | | | 5.07 | | | | 6.35 | | | |
Class I (GLOIX) | | | (0.71 | ) | | | 8.03 | | | | 6.08 | | | | 6.90 | | | |
| | | | | | | | | | |
In the current prospectuses dated April 30, 2014, as amended August 25, 2014, the gross expense ratios for Class AAA, A, C, and I Shares are 2.74%, 2.74%, 3.49%, and 2.49%, respectively, and the net expense ratios in the current prospectuses after contractual reimbursements by Gabelli Funds, LLC, (the “Adviser”) for these share classes are 2.00%, 2.00%, 2.75%, and 1.00%, respectively. See page 10 for the expense ratios for the year ended December 31, 2014. Class AAA and Class I Shares do not have a sales charge. The maximum sales charge for Class A Shares and Class C Shares is 5.75% and 1.00%, respectively. (a) Returns represent past performance and do not guarantee future results. Total returns and average annual returns reflect changes in share price, reinvestment of distributions, and are net of expenses. Investment returns and the principal value of an investment will fluctuate. When shares are redeemed, they may be worth more or less than their original cost. Current performance may be lower or higher than the performance data presented. Visit www.gabelli.com for performance information as of the most recent month end. Returns would have been lower had the Adviser not reimbursed certain expenses of the Fund. The Fund imposes a 2% redemption fee on shares sold or exchanged within seven days after the date of purchase. Investors should carefully consider the investment objectives, risks, charges, and expenses of the Fund before investing. The prospectuses contain information about these and other matters and should be read carefully before investing. To obtain a prospectus, please visit our website at www.gabelli.com. The Class AAA Share NAVs per share are used to calculate performance for the periods prior to the issuance of Class A Shares, Class C Shares, and Class I Shares on March 12, 2000, November 23, 2001, and January 11, 2008, respectively. The actual performance of the Class A Shares and Class C Shares would have been lower due to the additional fees and expenses associated with these classes of shares. The actual performance of the Class I Shares would have been higher due to lower expenses related to this class of shares. The MSCI AC World Index is an unmanaged free float adjusted market capitalization weighted index that is designed to measure the equity market performance of developed and emerging markets. The MSCI AC World Index consists of 45 country indices comprising 24 developed and 21 emerging market country indices. The Lipper Global Large-Cap Growth Fund Classification and the Lipper Global Multi-Cap Growth Fund Classification reflect the average performance of mutual funds classified in those particular categories. Dividends are considered reinvested. You cannot invest directly in an index. (b) Performance results include the effect of the maximum 5.75% sales charge at the beginning of the period. (c) Assuming payment of the 1% maximum contingent deferred sales charge imposed on redemptions made within one year of purchase. (d) MSCI AC World Index since inception performance is a blend of Gross excluding applicable taxes and Net Performance. This benchmark’s Net performance began on December 29, 2000. | | |
2
COMPARISON OF CHANGE IN VALUE OF A $10,000 INVESTMENT IN
THE GAMCO GLOBAL OPPORTUNITY FUND (CLASS AAA SHARES), LIPPER GLOBAL
MULTI-CAP GROWTH FUND CLASSIFICATION, AND MSCI AC WORLD INDEX (Unaudited)
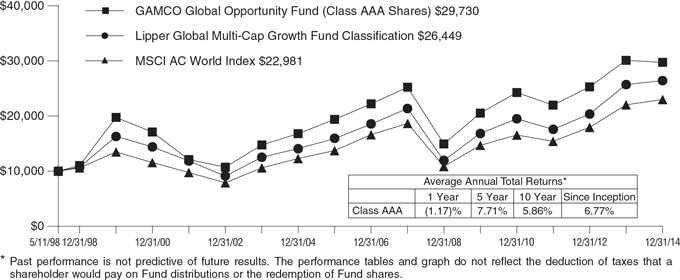
3
| | | | |
| The GAMCO Global Opportunity Fund | | | | |
| Disclosure of Fund Expenses (Unaudited) | | | | |
| For the Six Month Period from July 1, 2014 through December 31, 2014 | | | Expense Table | |
We believe it is important for you to understand the impact of fees and expenses regarding your investment. All mutual funds have operating expenses. As a shareholder of a fund, you incur ongoing costs, which include costs for portfolio management, administrative services, and shareholder reports (like this one), among others. Operating expenses, which are deducted from a fund’s gross income, directly reduce the investment return of a fund. When a fund’s expenses are expressed as a percentage of its average net assets, this figure is known as the expense ratio. The following examples are intended to help you understand the ongoing costs (in dollars) of investing in your Fund and to compare these costs with those of other mutual funds. The examples are based on an investment of $1,000 made at the beginning of the period shown and held for the entire period.
The Expense Table below illustrates your Fund’s costs in two ways:
Actual Fund Return: This section provides information about actual account values and actual expenses. You may use this section to help you to estimate the actual expenses that you paid over the period after any fee waivers and expense reimbursements. The “Ending Account Value” shown is derived from the Fund’s actual return during the past six months, and the “Expenses Paid During Period” shows the dollar amount that would have been paid by an investor who started with $1,000 in the Fund. You may use this information, together with the amount you invested, to estimate the expenses that you paid over the period.
To do so, simply divide your account value by $1,000 (for example, an $8,600 account value divided by $1,000 = 8.6), then multiply the result by the number given for your Fund under the heading “Expenses Paid During Period” to estimate the expenses you paid during this period.
Hypothetical 5% Return: This section provides information about hypothetical account values and
hypothetical expenses based on the Fund’s actual expense ratio. It assumes a hypothetical annualized return of 5% before expenses during the period shown. In this case – because the hypothetical return used is not the Fund’s actual return – the results do not apply to your investment and you cannot use the hypothetical account value and expense to estimate the actual ending account balance or expenses you paid for the period. This example is useful in making comparisons of the ongoing costs of investing in the Fund and other funds. To do so, compare this 5% hypothetical example with the 5% hypothetical examples that appear in shareholder reports of other funds.
Please note that the expenses shown in the table are meant to highlight your ongoing costs only and do not reflect any transactional costs such as sales charges (loads), redemption fees, or exchange fees, if any, which are described in the Prospectus. If these costs were applied to your account, your costs would be higher. Therefore, the 5% hypothetical return is useful in comparing ongoing costs only, and will not help you determine the relative total costs of owning different funds. The “Annualized Expense Ratio” represents the actual expenses for the last six months and may be different from the expense ratio in the Financial Highlights which is for the year ended December 31, 2014.
| | | | | | | | | | | | |
| | | Beginning
Account Value
07/01/14 | | Ending
Account Value
12/31/14 | | | Annualized
Expense
Ratio | | Expenses
Paid During
Period* | |
| |
The GAMCO Global Opportunity Fund | | | | | | | |
| |
Actual Fund Return | | | | | | | | | | |
Class AAA | | $1,000.00 | | | $ 932.40 | | | 2.00% | | | $ 9.74 | |
Class A | | $1,000.00 | | | $ 932.50 | | | 2.00% | | | $ 9.74 | |
Class C | | $1,000.00 | | | $ 928.40 | | | 2.75% | | | $13.37 | |
Class I | | $1,000.00 | | | $ 935.70 | | | 1.22% | | | $ 5.95 | |
Hypothetical 5% Return | | | | | | | | | | |
Class AAA | | $1,000.00 | | | $1,015.12 | | | 2.00% | | | $10.16 | |
Class A | | $1,000.00 | | | $1,015.12 | | | 2.00% | | | $10.16 | |
Class C | | $1,000.00 | | | $1,011.34 | | | 2.75% | | | $13.94 | |
Class I | | $1,000.00 | | | $1,019.06 | | | 1.22% | | | $ 6.21 | |
| * | Expenses are equal to the Fund’s annualized expense ratio for the last six months multiplied by the average account value over the period, multiplied by the number of days in the most recent fiscal half year (184 days), then divided by 365. |
4
Summary of Portfolio Holdings (Unaudited)
The following table presents portfolio holdings as a percent of net assets as of December 31, 2014:
The GAMCO Global Opportunity Fund
| | | | |
Industrials | | | 20.6 | % |
Consumer Staples | | | 20.6 | % |
Consumer Discretionary | | | 15.9 | % |
Information Technology | | | 10.6 | % |
Materials | | | 10.0 | % |
Health Care | | | 9.0 | % |
| | | | |
Financials | | | 7.0 | % |
Energy | | | 5.2 | % |
Telecommunication Services | | | 1.1 | % |
Other Assets and Liabilities (Net) | | | 0.0 | % |
| | | | |
| | | 100.0 | % |
| | | | |
The Fund files a complete schedule of portfolio holdings with the Securities and Exchange Commission (the “SEC”) for the first and third quarters of each fiscal year on Form N-Q. Shareholders may obtain this information at www.gabelli.com or by calling the Fund at 800-GABELLI (800-422-3554). The Fund’s Form N-Q is available on the SEC’s website at www.sec.gov and may also be reviewed and copied at the SEC’s Public Reference Room in Washington, DC. Information on the operation of the Public Reference Room may be obtained by calling 800-SEC-0330.
Proxy Voting
The Fund files Form N-PX with its complete proxy voting record for the twelve months ended June 30, no later than August 31 of each year. A description of the Fund’s proxy voting policies, procedures, and how the Fund voted proxies relating to portfolio securities is available without charge, upon request, by (i) calling 800-GABELLI (800-422-3554); (ii) writing to The Gabelli Funds at One Corporate Center, Rye, NY 10580-1422; or (iii) visiting the SEC’s website at www.sec.gov.
5
The GAMCO Global Opportunity Fund
Schedule of Investments — December 31, 2014
| | | | | | | | | | | | |
| Shares | | | | | Cost | | | Market Value | |
| | | | COMMON STOCKS — 100.0% | |
| | | | INDUSTRIALS — 20.6% | |
| | 11,484 | | | CNH Industrial NV | | $ | 86,608 | | | $ | 92,561 | |
| | 1,100 | | | FANUC Corp. | | | 120,160 | | | | 181,368 | |
| | 4,300 | | | Jardine Matheson Holdings Ltd. | | | 137,142 | | | | 261,287 | |
| | 3,600 | | | Komatsu Ltd. | | | 76,536 | | | | 79,589 | |
| | 2,500 | | | L-3 Communications Holdings Inc. | | | 102,176 | | | | 315,525 | |
| | 2,500 | | | Lockheed Martin Corp. | | | 61,439 | | | | 481,425 | |
| | 2,600 | | | Precision Castparts Corp. | | | 38,545 | | | | 626,288 | |
| | 1,000 | | | SMC Corp. | | | 124,202 | | | | 262,224 | |
| | | | | | | | | | | | |
| | | | TOTAL INDUSTRIALS | | | 746,808 | | | | 2,300,267 | |
| | | | | | | | | | | | |
| |
| | | | CONSUMER STAPLES — 20.6% | |
| | 1,500 | | | Associated British Foods plc | | | 65,359 | | | | 73,334 | |
| | 5,750 | | | British American Tobacco plc | | | 143,939 | | | | 311,598 | |
| | 1,300 | | | Danone SA | | | 77,722 | | | | 84,992 | |
| | 7,000 | | | Diageo plc | | | 97,896 | | | | 200,530 | |
| | 2,280 | | | Dr Pepper Snapple Group Inc. | | | 54,395 | | | | 163,430 | |
| | 3,000 | | | General Mills Inc. | | | 74,401 | | | | 159,990 | |
| | 3,000 | | | Heineken Holding NV | | | 140,229 | | | | 187,805 | |
| | 2,000 | | | Japan Tobacco Inc. | | | 71,426 | | | | 55,046 | |
| | 3,000 | | | Mead Johnson Nutrition Co. | | | 129,424 | | | | 301,620 | |
| | 1,910 | | | Pernod Ricard SA | | | 147,275 | | | | 212,273 | |
| | 2,150 | | | Philip Morris International Inc. | | | 74,934 | | | | 175,117 | |
| | 3,300 | | | Shiseido Co. Ltd. | | | 61,010 | | | | 46,281 | |
| | 2,000 | | | The Procter & Gamble Co. | | | 110,564 | | | | 182,180 | |
| | 2,000 | | | Toyo Suisan Kaisha Ltd. | | | 67,311 | | | | 64,398 | |
| | 3,000 | | | Unicharm Corp. | | | 56,797 | | | | 71,907 | |
| | | | | | | | | | | | |
| | | | TOTAL CONSUMER STAPLES | | | 1,372,682 | | | | 2,290,501 | |
| | | | | | | | | | | | |
| |
| | | | CONSUMER DISCRETIONARY — 15.9% | |
| | 1,500 | | | AMC Networks Inc., Cl. A† | | | 12,414 | | | | 95,655 | |
| | 150,000 | | | China Travel International Investment Hong Kong Ltd. | | | 51,119 | | | | 51,822 | |
| | 2,200 | | | Christian Dior SA | | | 132,254 | | | | 376,505 | |
| | 5,500 | | | Compagnie Financiere Richemont SA | | | 71,324 | | | | 487,622 | |
| | 3,000 | | | DIRECTV† | | | 145,601 | | | | 260,100 | |
| | 124 | | | Hermes International | | | 43,449 | | | | 44,154 | |
| | 2,000 | | | Honda Motor Co. Ltd. | | | 80,136 | | | | 58,677 | |
| | 6,000 | | | Liberty Interactive Corp., Cl. A† | | | 88,266 | | | | 176,520 | |
| | 808 | | | Liberty TripAdvisor Holdings Inc., Cl. A† | | | 7,640 | | | | 21,735 | |
| | 1,661 | | | Liberty Ventures, Cl. A† | | | 23,217 | | | | 62,653 | |
| | 6,000 | | | Rakuten Inc.† | | | 75,333 | | | | 83,435 | |
| | 30,000 | | | SJM Holdings Ltd. | | | 60,348 | | | | 47,427 | |
| | | | | | | | | | | | |
| | | | TOTAL CONSUMER DISCRETIONARY | | | 791,101 | | | | 1,766,305 | |
| | | | | | | | | | | | |
| |
| | | | INFORMATION TECHNOLOGY — 10.6% | |
| | 550 | | | Google Inc., Cl. A† | | | 96,781 | | | | 291,863 | |
| | 550 | | | Google Inc., Cl. C† | | | 96,782 | | | | 289,520 | |
| | 500 | | | Keyence Corp. | | | 93,284 | | | | 222,797 | |
| | 7,000 | | | Microsoft Corp. | | | 185,025 | | | | 325,150 | |
| | | | | | | | | | | | |
| Shares | | | | | Cost | | | Market Value | |
| | 15,000 | | | Yahoo! Japan Corp. | | $ | 86,673 | | | $ | 53,759 | |
| | | | | | | | | | | | |
| | | | TOTAL INFORMATION TECHNOLOGY | | | 558,545 | | | | 1,183,089 | |
| | | | | | | | | | | | |
| | | | MATERIALS — 10.0% | | | | | | |
| | 2,200 | | | Agnico Eagle Mines Ltd. | | | 126,105 | | | | 54,758 | |
| | 22,000 | | | Antofagasta plc | | | 26,323 | | | | 256,344 | |
| | 3,600 | | | BHP Billiton plc | | | 114,493 | | | | 77,153 | |
| | 15,250 | | | Glencore plc | | | 82,406 | | | | 70,391 | |
| | 2,500 | | | Monsanto Co. | | | 174,388 | | | | 298,675 | |
| | 6,000 | | | Newcrest Mining Ltd.† | | | 100,652 | | | | 53,496 | |
| | 1,830 | | | Rio Tinto plc | | | 77,490 | | | | 84,358 | |
| | 800 | | | Shin-Etsu Chemical Co. Ltd. | | | 56,179 | | | | 52,080 | |
| | 400 | | | Syngenta AG | | | 114,992 | | | | 128,663 | |
| | 5,000 | | | Toray Industries Inc. | | | 40,762 | | | | 39,950 | |
| | | | | | | | | | | | |
| | | | TOTAL MATERIALS | | | 913,790 | | | | 1,115,868 | |
| | | | | | | | | | | | |
| |
| | | | HEALTH CARE — 9.0% | |
| | 1,000 | | | AstraZeneca plc, ADR | | | 71,933 | | | | 70,380 | |
| | 4,400 | | | Novartis AG | | | 174,161 | | | | 408,071 | |
| | 1,500 | | | Novo Nordisk A/S, Cl. B | | | 71,802 | | | | 63,450 | |
| | 1,700 | | | Roche Holding AG, Genusschein | | | 136,625 | | | | 460,602 | |
| | | | | | | | | | | | |
| | | | TOTAL HEALTH CARE | | | 454,521 | | | | 1,002,503 | |
| | | | | | | | | | | | |
| |
| | | | FINANCIALS — 7.0% | |
| | 5,000 | | | Cheung Kong (Holdings) Ltd. | | | 63,610 | | | | 83,734 | |
| | 70,000 | | | China Minsheng Banking Corp. Ltd., Cl. H | | | 82,207 | | | | 91,513 | |
| | 5,000 | | | Ichiyoshi Securities Co. Ltd. | | | 58,224 | | | | 53,784 | |
| | 10,000 | | | Kinnevik Investment AB, Cl. B | | | 230,284 | | | | 325,192 | |
| | 5,500 | | | Schroders plc | | | 100,679 | | | | 228,593 | |
| | | | | | | | | | | | |
| | | | TOTAL FINANCIALS | | | 535,004 | | | | 782,816 | |
| | | | | | | | | | | | |
| | | |
| | | | ENERGY — 5.2% | | | | | | | | |
| | 1,000 | | | EOG Resources Inc. | | | 55,566 | | | | 92,070 | |
| | 1,200 | | | Occidental Petroleum Corp. | | | 119,973 | | | | 96,732 | |
| | 4,500 | | | Schlumberger Ltd. | | | 149,207 | | | | 384,345 | |
| | | | | | | | | | | | |
| | | | TOTAL ENERGY | | | 324,746 | | | | 573,147 | |
| | | | | | | | | | | | |
| |
| | | | TELECOMMUNICATION SERVICES — 1.1% | |
| | 1,300 | | | SoftBank Corp. | | | 99,407 | | | | 77,380 | |
| | 2,000 | | | Vivendi SA | | | 48,497 | | | | 49,781 | |
| | | | | | | | | | | | |
| | | | TOTAL TELECOMMUNICATION SERVICES | | | 147,904 | | | | 127,161 | |
| | | | | | | | | | | | |
| | | |
| | | | TOTAL COMMON STOCKS | | | 5,845,101 | | | | 11,141,657 | |
| | | | | | | | | | | | |
| | | |
| | | | TOTAL INVESTMENTS — 100.0% | | $ | 5,845,101 | | | | 11,141,657 | |
| | | | | | | | | | | | |
| | | | Other Assets and Liabilities (Net) — 0.0% | | | | 3,727 | |
| | | | | | | | | | | | |
| | | | NET ASSETS — 100.0% | | | | | | $ | 11,145,384 | |
| | | | | | | | | | | | |
| † | Non-income producing security. |
See accompanying notes to financial statements.
6
The GAMCO Global Opportunity Fund
Schedule of Investments (Continued) — December 31, 2014
| | | | | | | | |
| Geographic Diversification | | % of
Market Value | | | Market Value | |
North America | | | 43.6 | % | | $ | 4,855,352 | |
Europe | | | 37.8 | | | | 4,217,200 | |
Japan | | | 12.6 | | | | 1,402,674 | |
Asia/Pacific | | | 6.0 | | | | 666,431 | |
| | | | | | | | |
| | | 100.0 | % | | $ | 11,141,657 | |
| | | | | | | | |
See accompanying notes to financial statements.
7
The GAMCO Global Opportunity Fund
Statement of Assets and Liabilities
December 31, 2014
| | | | |
Assets: | | | | |
Investments, at value (cost $5,845,101) | | $ | 11,141,657 | |
Cash | | | 14,916 | |
Receivable for investments sold | | | 3,878 | |
Receivable for Fund shares sold | | | 100 | |
Dividends receivable | | | 30,752 | |
Prepaid expenses | | | 14,409 | |
| | | | |
Total Assets | | | 11,205,712 | |
| | | | |
Liabilities: | | | | |
Foreign currency, at value (cost $88) | | | 88 | |
Payable for Fund shares redeemed | | | 1,476 | |
Payable for investment advisory fees | | | 9,428 | |
Payable for distribution fees | | | 2,276 | |
Payable for legal and audit fees | | | 20,947 | |
Payable for shareholder communications expenses | | | 11,972 | |
Other accrued expenses | | | 14,141 | |
| | | | |
Total Liabilities | | | 60,328 | |
| | | | |
Net Assets (applicable to 470,034 shares outstanding) | | $ | 11,145,384 | |
| | | | |
Net Assets Consist of: | | | | |
Paid-in capital | | $ | 6,367,451 | |
Accumulated net investment income | | | 39,854 | |
Accumulated net realized loss on investments and foreign currency transactions | | | (556,649 | ) |
Net unrealized appreciation on investments | | | 5,296,556 | |
Net unrealized depreciation on foreign currency translations | | | (1,828 | ) |
| | | | |
Net Assets | | $ | 11,145,384 | |
| | | | |
Shares of Capital Stock, each at $0.001 par value: | | | | |
Class AAA: | | | | |
Net Asset Value, offering, and redemption price per share ($10,226,075 ÷ 431,374 shares outstanding; 75,000,000 shares authorized) | | | $23.71 | |
Class A: | | | | |
Net Asset Value and redemption price per share ($220,413 ÷ 9,334 shares outstanding; 50,000,000 shares authorized) | | | $23.61 | |
Maximum offering price per share (NAV ÷ 0.9425, based on maximum sales charge of 5.75% of the offering price) | | | $25.05 | |
Class C: | | | | |
Net Asset Value and offering price per share ($30,943 ÷ 1,349 shares outstanding; 25,000,000 shares authorized) | | | $22.94 | (a) |
Class I: | | | | |
Net Asset Value, offering, and redemption price per share ($667,953 ÷ 27,977.2 shares outstanding; 25,000,000 shares authorized) | | | $23.87 | |
| (a) | Redemption price varies based on the length of time held. |
Statement of Operations
For the Year Ended December 31, 2014
| | | | |
Investment Income: | | | | |
Dividends (net of foreign withholding taxes of $6,615) | | $ | 273,793 | |
Interest | | | 24 | |
| | | | |
Total Investment Income | | | 273,817 | |
| | | | |
Expenses: | | | | |
Investment advisory fees | | | 117,415 | |
Distribution fees - Class AAA | | | 27,070 | |
Distribution fees - Class A | | | 597 | |
Distribution fees - Class C | | | 193 | |
Shareholder communications expenses | | | 30,790 | |
Registration expenses | | | 29,569 | |
Custodian fees | | | 25,587 | |
Legal and audit fees | | | 21,938 | |
Shareholder services fees | | | 21,094 | |
Directors’ fees | | | 3,460 | |
Interest expense | | | 448 | |
Miscellaneous expenses | | | 39,300 | |
| | | | |
Total Expenses | | | 317,461 | |
| | | | |
Less: | | | | |
Expenses reimbursed by Adviser (See Note 3) | | | (85,469 | ) |
| | | | |
Net Expenses | | | 231,992 | |
| | | | |
Net Investment Income | | | 41,825 | |
| | | | |
Net Realized and Unrealized Gain/(Loss) on Investments and Foreign Currency: | | | | |
Net realized gain on investments | | | 442,795 | |
Net realized loss on foreign currency transactions | | | (916 | ) |
| | | | |
Net realized gain on investments and foreign currency transactions | | | 441,879 | |
| | | | |
Net change in unrealized appreciation/depreciation on investments | | | (608,061 | ) |
on foreign currency translations | | | (2,384 | ) |
| | | | |
Net change in unrealized appreciation/depreciation on investments and foreign currency translations | | | (610,445 | ) |
| | | | |
Net Realized and Unrealized Gain/(Loss) on Investments and Foreign Currency | | | (168,566 | ) |
| | | | |
Net Decrease in Net Assets Resulting from Operations | | $ | (126,741 | ) |
| | | | |
See accompanying notes to financial statements.
8
The GAMCO Global Opportunity Fund
Statement of Changes in Net Assets
| | | | | | | | |
| | | Year Ended
December 31, 2014 | | | Year Ended
December 31, 2013 | |
Operations: | | | | | | | | |
Net investment income | | $ | 41,825 | | | $ | 12,938 | |
Net realized gain on investments and foreign currency transactions | | | 441,879 | | | | 268,748 | |
Net change in unrealized appreciation/depreciation on investments and foreign currency translations | | | (610,445 | ) | | | 1,644,460 | |
| | | | | | | | |
Net Increase/(Decrease) in Net Assets Resulting from Operations | | | (126,741 | ) | | | 1,926,146 | |
| | | | | | | | |
Distributions to Shareholders: | | | | | | | | |
Net investment income | | | | | | | | |
Class AAA | | | — | | | | (11,196 | ) |
Class A | | | — | | | | (206 | ) |
Class I | | | — | | | | (2,106 | ) |
| | | | | | | | |
Total Distributions to Shareholders | | | — | | | | (13,508 | ) |
| | | | | | | | |
| | |
Capital Share Transactions: | | | | | | | | |
Class AAA | | | (777,455 | ) | | | (297,720 | ) |
Class A | | | (14,693 | ) | | | (22,579 | ) |
Class C | | | 11,306 | | | | — | |
Class I | | | 33,546 | | | | 2,377 | |
| | | | | | | | |
Net Decrease in Net Assets from Capital Share Transactions | | | (747,296 | ) | | | (317,922 | ) |
| | | | | | | | |
| | |
Net Increase/(Decrease) in Net Assets | | | (874,037 | ) | | | 1,594,716 | |
Net Assets: | | | | | | | | |
Beginning of year | | | 12,019,421 | | | | 10,424,705 | |
| | | | | | | | |
End of year (including undistributed net investment income of $39,854 and $0, respectively) | | $ | 11,145,384 | | | $ | 12,019,421 | |
| | | | | | | | |
See accompanying notes to financial statements.
9
The GAMCO Global Opportunity Fund
Financial Highlights
Selected data for a share of capital stock outstanding throughout each year:
| | | | | | | | | | | | | | | | | | | | | | | | | | | | | | | | | | | | | | | | | | | | | | | | | | | | | | | | | | |
| | | | | | Income (Loss) from Investment
Operations | | | Distributions | | | | | | | | | | | | Ratios to Average Net Assets/ Supplemental Data | |
Year Ended December 31 | | Net Asset
Value,
Beginning of Year | | | Net
Investment
Income (Loss)(a) | | | Net
Realized
and
Unrealized
Gain (Loss)
on Investments | | | Total from
Investment
Operations | | | Net
Investment Income | | | Return
of Capital(b) | | Total Distributions | | | Redemption Fees(a)(b) | | | Net
Asset
Value,
End of Year | | | Total Return† | | | Net Assets
End of
Year (in 000’s) | | | Net
Investment
Income (Loss) | | | Operating
Expenses
Before
Reimburse- ment | | | Operating
Expenses
Net of
Reimburse- ment(c) | | | Portfolio
Turnover
Rate | |
Class AAA | | | | | | | | | | | | | | | | | | | | | | | | | | | | | | | | | | | | | | | | | | | | | | | | | | | | | | | | | | |
2014 | | $ | 23.99 | | | $ | 0.08 | | | $ | (0.36 | ) | | $ | (0.28 | ) | | | — | | | — | | | — | | | | — | | | $ | 23.71 | | | | (1.2 | )% | | $ | 10,226 | | | | 0.33 | % | | | 2.72 | % | | | 2.00 | % | | | 9 | % |
2013 | | | 20.19 | | | | 0.02 | | | | 3.80 | | | | 3.82 | | | $ | (0.02 | ) | | — | | $ | (0.02 | ) | | | — | | | | 23.99 | | | | 18.9 | | | | 11,121 | | | | 0.10 | | | | 2.74 | | | | 2.00 | | | | 5 | |
2012 | | | 17.67 | | | | 0.12 | | | | 2.53 | | | | 2.65 | | | | (0.13 | ) | | — | | | (0.13 | ) | | $ | 0.00 | | | | 20.19 | | | | 15.0 | | | | 9,651 | | | | 0.65 | | | | 2.91 | | | | 2.00 | | | | 6 | |
2011 | | | 19.57 | | | | 0.04 | | | | (1.89 | ) | | | (1.85 | ) | | | (0.05 | ) | | — | | | (0.05 | ) | | | 0.00 | | | | 17.67 | | | | (9.5 | ) | | | 10,258 | | | | 0.23 | | | | 2.60 | | | | 2.01 | | | | 7 | |
2010 | | | 16.53 | | | | (0.02 | ) | | | 3.06 | | | | 3.04 | | | | — | | | — | | | — | | | | 0.00 | | | | 19.57 | | | | 18.4 | | | | 13,263 | | | | (0.15 | ) | | | 2.66 | | | | 2.01 | | | | 5 | |
Class A | | | | | | | | | | | | | | | | | | | | | | | | | | | | | | | | | | | | | | | | | | | | | | | | | | | | | | | | | | |
2014 | | $ | 23.90 | | | $ | 0.08 | | | $ | (0.37 | ) | | $ | (0.29 | ) | | | — | | | — | | | — | | | | — | | | $ | 23.61 | | | | (1.2 | )% | | $ | 220 | | | | 0.35 | % | | | 2.72 | % | | | 2.00 | % | | | 9 | % |
2013 | | | 20.11 | | | | 0.03 | | | | 3.78 | | | | 3.81 | | | $ | (0.02 | ) | | — | | $ | (0.02 | ) | | | — | | | | 23.90 | | | | 19.0 | | | | 238 | | | | 0.13 | | | | 2.74 | | | | 2.00 | | | | 5 | |
2012 | | | 17.61 | | | | 0.11 | | | | 2.53 | | | | 2.64 | | | | (0.14 | ) | | — | | | (0.14 | ) | | $ | 0.00 | | | | 20.11 | | | | 15.0 | | | | 220 | | | | 0.57 | | | | 2.91 | | | | 2.00 | | | | 6 | |
2011 | | | 19.51 | | | | 0.04 | | | | (1.88 | ) | | | (1.84 | ) | | | (0.06 | ) | | — | | | (0.06 | ) | | | 0.00 | | | | 17.61 | | | | (9.5 | ) | | | 166 | | | | 0.22 | | | | 2.60 | | | | 2.01 | | | | 7 | |
2010 | | | 16.48 | | | | (0.00 | )(b) | | | 3.03 | | | | 3.03 | | | | — | | | — | | | — | | | | 0.00 | | | | 19.51 | | | | 18.4 | | | | 166 | | | | (0.03 | ) | | | 2.66 | | | | 2.01 | | | | 5 | |
Class C | | | | | | | | | | | | | | | | | | | | | | | | | | | | | | | | | | | | | | | | | | | | | | | | | | | | | | | | | | |
2014 | | $ | 23.40 | | | $ | (0.04 | ) | | $ | (0.42 | ) | | $ | (0.46 | ) | | | — | | | — | | | — | | | | — | | | $ | 22.94 | | | | (2.0 | )% | | $ | 31 | | | | (0.17 | )% | | | 3.46 | % | | | 2.75 | % | | | 9 | % |
2013 | | | 19.82 | | | | (0.14 | ) | | | 3.72 | | | | 3.58 | | | | — | | | — | | | — | | | | — | | | | 23.40 | | | | 18.1 | | | | 19 | | | | (0.65 | ) | | | 3.49 | | | | 2.75 | | | | 5 | |
2012 | | | 17.36 | | | | (0.02 | ) | | | 2.48 | | | | 2.46 | | | $ | (0.00 | )(b) | | — | | $ | (0.00 | )(b) | | | — | | | | 19.82 | | | | 14.2 | | | | 17 | | | | (0.12 | ) | | | 3.66 | | | | 2.75 | | | | 6 | |
2011 | | | 19.32 | | | | (0.07 | ) | | | (1.89 | ) | | | (1.96 | ) | | | — | | | — | | | — | | | | — | | | | 17.36 | | | | (10.1 | ) | | | 14 | | | | (0.40 | ) | | | 3.35 | | | | 2.76 | | | | 7 | |
2010 | | | 16.44 | | | | (0.16 | ) | | | 3.04 | | | | 2.88 | | | | — | | | — | | | — | | | | — | | | | 19.32 | | | | 17.5 | | | | 16 | | | | (0.95 | ) | | | 3.41 | | | | 2.76 | | | | 5 | |
Class I | | | | | | | | | | | | | | | | | | | | | | | | | | | | | | | | | | | | | | | | | | | | | | | | | | | | | | | | | | |
2014 | | $ | 24.04 | | | $ | 0.21 | | | $ | (0.38 | ) | | $ | (0.17 | ) | | | — | | | — | | | — | | | | — | | | $ | 23.87 | | | | (0.7 | )% | | $ | 668 | | | | 0.86 | % | | | 2.46 | % | | | 1.48 | % | | | 9 | % |
2013 | | | 20.23 | | | | 0.08 | | | | 3.81 | | | | 3.89 | | | $ | (0.08 | ) | | — | | $ | (0.08 | ) | | | — | | | | 24.04 | | | | 19.2 | | | | 641 | | | | 0.35 | | | | 2.49 | | | | 1.75 | | | | 5 | |
2012 | | | 17.70 | | | | 0.17 | | | | 2.55 | | | | 2.72 | | | | (0.19 | ) | | — | | | (0.19 | ) | | $ | 0.00 | | | | 20.23 | | | | 15.4 | | | | 537 | | | | 0.90 | | | | 2.66 | | | | 1.75 | | | | 6 | |
2011 | | | 19.61 | | | | 0.10 | | | | (1.91 | ) | | | (1.81 | ) | | | (0.10 | ) | | — | | | (0.10 | ) | | | 0.00 | | | | 17.70 | | | | (9.2 | ) | | | 260 | | | | 0.55 | | | | 2.35 | | | | 1.76 | | | | 7 | |
2010 | | | 16.52 | | | | 0.02 | | | | 3.07 | | | | 3.09 | | | | — | | | — | | | — | | | | 0.00 | | | | 19.61 | | | | 18.7 | | | | 386 | | | | 0.09 | | | | 2.41 | | | | 1.76 | | | | 5 | |
| † | Total return represents aggregate total return of a hypothetical $1,000 investment at the beginning of the year and sold at the end of the year including reinvestment of distributions and does not reflect applicable sales charges. |
| (a) | Per share amounts have been calculated using the average shares outstanding method. |
| (b) | Amount represents less than $0.005 per share. |
| (c) | The Fund incurred interest expense during the years ended December 31, 2011 and 2010. If interest expense had not been incurred, the ratios of operating expenses to average net assets would have been 2.00% and 2.00% (Class AAA and Class A), 2.75% and 2.75% (Class C), and 1.75% and 1.75% (Class I), respectively. For the years ended 2014, 2013, and 2012 the effect of interest expense was minimal. |
See accompanying notes to financial statements.
10
The GAMCO Global Opportunity Fund
Notes to Financial Statements
1. Organization. The GAMCO Global Opportunity Fund, a series of GAMCO Global Series Funds, Inc. (the “Corporation”), was incorporated on July 16, 1993 in Maryland. The Fund is a non-diversified open-end management investment company registered under the Investment Company Act of 1940, as amended (the “1940 Act”), and one of four separately managed portfolios (collectively, the “Portfolios”) of the Corporation. The Fund’s primary objective is capital appreciation. The Fund commenced investment operations on May 11, 1998.
2. Significant Accounting Policies. As an investment company, the Fund follows the investment company accounting and reporting guidance, which is part of U.S. generally accepted accounting principles (“GAAP”) that may require the use of management estimates and assumptions in the preparation of its financial statements. Actual results could differ from those estimates. The following is a summary of significant accounting policies followed by the Fund in the preparation of its financial statements.
Security Valuation. Portfolio securities listed or traded on a nationally recognized securities exchange or traded in the U.S. over-the-counter market for which market quotations are readily available are valued at the last quoted sale price or a market’s official closing price as of the close of business on the day the securities are being valued. If there were no sales that day, the security is valued at the average of the closing bid and asked prices or, if there were no asked prices quoted on that day, then the security is valued at the closing bid price on that day. If no bid or asked prices are quoted on such day, the security is valued at the most recently available price or, if the Board of Directors (the “Board”) so determines, by such other method as the Board shall determine in good faith to reflect its fair market value. Portfolio securities traded on more than one national securities exchange or market are valued according to the broadest and most representative market, as determined by Gabelli Funds, LLC (the “Adviser”).
Portfolio securities primarily traded on a foreign market are generally valued at the preceding closing values of such securities on the relevant market, but may be fair valued pursuant to procedures established by the Board if market conditions change significantly after the close of the foreign market, but prior to the close of business on the day the securities are being valued. Debt instruments with remaining maturities of sixty days or less that are not credit impaired are valued at amortized cost, unless the Board determines such amount does not reflect the securities’ fair value, in which case these securities will be fair valued as determined by the Board. Debt instruments having a maturity greater than sixty days for which market quotations are readily available are valued at the average of the latest bid and asked prices. If there were no asked prices quoted on such day, the security is valued using the closing bid price. U.S. government obligations with maturities greater than sixty days are normally valued using a model that incorporates market observable data such as reported sales of similar securities, broker quotes, yields, bids, offers, and reference data. Certain securities are valued principally using dealer quotations.
Securities and assets for which market quotations are not readily available are fair valued as determined by the Board. Fair valuation methodologies and procedures may include, but are not limited to: analysis and review of available financial and non-financial information about the company; comparisons with the valuation and changes in valuation of similar securities, including a comparison of foreign securities with the equivalent U.S. dollar value American Depositary Receipt securities at the close of the U.S. exchange; and evaluation of any other information that could be indicative of the value of the security.
The Fund employs a fair value model to adjust prices to reflect events affecting the values of certain portfolio securities which occur between the close of trading on the principal market for such securities (foreign exchanges
11
The GAMCO Global Opportunity Fund
Notes to Financial Statements (Continued)
and over-the-counter markets) at the time when net asset values of the Fund are determined. If the Fund’s valuation committee believes that a particular event would materially affect net asset value, further adjustment is considered.
The inputs and valuation techniques used to measure fair value of the Fund’s investments are summarized into three levels as described in the hierarchy below:
| | — | | Level 1 — quoted prices in active markets for identical securities; |
| | — | | Level 2 — other significant observable inputs (including quoted prices for similar securities, interest rates, prepayment speeds, credit risk, etc.); and |
| | — | | Level 3 — significant unobservable inputs (including the Board’s determinations as to the fair value of investments). |
A financial instrument’s level within the fair value hierarchy is based on the lowest level of any input both individually and in the aggregate that is significant to the fair value measurement. The inputs or methodology used for valuing securities are not necessarily an indication of the risk associated with investing in those securities. The summary of the Fund’s investments in securities by inputs used to value the Fund’s investments as of December 31, 2014 is as follows:
| | | | | | | | | | | | |
| | | Valuation Inputs | | | Total Market Value
at 12/31/14 | |
| | Level 1
Quoted Prices | | | Level 2 Other Significant
Observable Inputs | | |
INVESTMENTS IN SECURITIES: | | | | | | | | | | | | |
ASSETS (Market Value): | | | | | | | | | | | | |
Common Stocks: | | | | | | | | | | | | |
Industrials | | | $ 1,515,799 | | | | $ 784,468 | | | | $ 2,300,267 | |
Consumer Staples | | | 982,337 | | | | 1,308,164 | | | | 2,290,501 | |
Consumer Discretionary | | | 616,663 | | | | 1,149,642 | | | | 1,766,305 | |
Information Technology | | | 906,533 | | | | 276,556 | | | | 1,183,089 | |
Materials | | | 353,433 | | | | 762,435 | | | | 1,115,868 | |
Health Care | | | 70,380 | | | | 932,123 | | | | 1,002,503 | |
Financials | | | — | | | | 782,816 | | | | 782,816 | |
Energy | | | 573,147 | | | | — | | | | 573,147 | |
Telecommunication Services(a) | | | — | | | | 127,161 | | | | 127,161 | |
| |
Total Common Stocks | | | 5,018,292 | | | | 6,123,365 | | | | 11,141,657 | |
| |
TOTAL INVESTMENTS IN SECURITIES – ASSETS | | $ | 5,018,292 | | | | $6,123,365 | | | | $11,141,657 | |
| |
| (a) | Please refer to the Schedule of Investments for the industry classifications of these portfolio holdings. |
During the year ended December 31, 2014, certain foreign securities were transferred from Level 1 to Level 2 due to the application of fair value procedures resulting from volatility in U.S. markets after the close of the foreign markets. The beginning of period value of the securities that transferred from Level 1 to Level 2 during the period amounted to $5,801,199 or 48.27% of net assets as of December 31, 2013. The Fund’s policy is to recognize transfers among Levels as of the beginning of the reporting period.
There were no Level 3 investments held at December 31, 2014 or December 31, 2013.
Additional Information to Evaluate Qualitative Information.
General. The Fund uses recognized industry pricing services – approved by the Board and unaffiliated with the Adviser – to value most of its securities, and uses broker quotes provided by market makers of securities not valued by these and other recognized pricing sources. Several different pricing feeds are received to value domestic equity securities, international equity securities, preferred equity securities, and fixed income securities.
12
The GAMCO Global Opportunity Fund
Notes to Financial Statements (Continued)
The data within these feeds is ultimately sourced from major stock exchanges and trading systems where these securities trade. The prices supplied by external sources are checked by obtaining quotations or actual transaction prices from market participants. If a price obtained from the pricing source is deemed unreliable, prices will be sought from another pricing service or from a broker/dealer that trades that security or similar securities.
Fair Valuation. Fair valued securities may be common and preferred equities, warrants, options, rights, and fixed income obligations. Where appropriate, Level 3 securities are those for which market quotations are not available, such as securities not traded for several days, or for which current bids are not available, or which are restricted as to transfer. Among the factors to be considered to fair value a security are recent prices of comparable securities that are publicly traded, reliable prices of securities not publicly traded, the use of valuation models, current analyst reports, valuing the income or cash flow of the issuer, or cost if the preceding factors do not apply. The circumstances of Level 3 securities are frequently monitored to determine if fair valuation measures continue to apply.
The Adviser reports quarterly to the Board the results of the application of fair valuation policies and procedures. These include back testing the prices realized in subsequent trades of these fair valued securities to fair values previously recognized.
Foreign Currency Translations. The books and records of the Fund are maintained in U.S. dollars. Foreign currencies, investments, and other assets and liabilities are translated into U.S. dollars at current exchange rates. Purchases and sales of investment securities, income, and expenses are translated at the exchange rate prevailing on the respective dates of such transactions. Unrealized gains and losses that result from changes in foreign exchange rates and/or changes in market prices of securities have been included in unrealized appreciation/depreciation on investments and foreign currency translations. Net realized foreign currency gains and losses resulting from changes in exchange rates include foreign currency gains and losses between trade date and settlement date on investment securities transactions, foreign currency transactions, and the difference between the amounts of interest and dividends recorded on the books of the Fund and the amounts actually received. The portion of foreign currency gains and losses related to fluctuation in exchange rates between the initial purchase trade date and subsequent sale trade date is included in realized gain/(loss) on investments.
Foreign Securities. The Fund may directly purchase securities of foreign issuers. Investing in securities of foreign issuers involves special risks not typically associated with investing in securities of U.S. issuers. The risks include possible revaluation of currencies, the inability to repatriate funds, less complete financial information about companies, and possible future adverse political and economic developments. Moreover, securities of many foreign issuers and their markets may be less liquid and their prices more volatile than securities of comparable U.S. issuers.
Foreign Taxes. The Fund may be subject to foreign taxes on income, gains on investments, or currency repatriation, a portion of which may be recoverable. The Fund will accrue such taxes and recoveries as applicable, based upon its current interpretation of tax rules and regulations that exist in the markets in which it invests.
Securities Transactions and Investment Income. Securities transactions are accounted for on the trade date with realized gain or loss on investments determined by using the identified cost method. Interest income (including amortization of premium and accretion of discount) is recorded on the accrual basis. Premiums and discounts on debt securities are amortized using the effective yield to maturity method. Dividend income is recorded on
13
The GAMCO Global Opportunity Fund
Notes to Financial Statements (Continued)
the ex-dividend date, except for certain dividends from foreign securities that are recorded as soon after the ex-dividend date as the Fund becomes aware of such dividends.
Determination of Net Asset Value and Calculation of Expenses. Certain administrative expenses are common to, and allocated among, various affiliated funds. Such allocations are made on the basis of each fund’s average net assets or other criteria directly affecting the expenses as determined by the Adviser pursuant to procedures established by the Board.
In calculating the NAV per share of each class, investment income, realized and unrealized gains and losses, redemption fees, and expenses other than class specific expenses are allocated daily to each class of shares based upon the proportion of net assets of each class at the beginning of each day. Distribution expenses are borne solely by the class incurring the expense.
Distributions to Shareholders. Distributions to shareholders are recorded on the ex-dividend date. Distributions to shareholders are based on income and capital gains as determined in accordance with federal income tax regulations, which may differ from income and capital gains as determined under GAAP. These differences are primarily due to differing treatments of income and gains on various investment securities and foreign currency transactions held by the Fund, timing differences, and differing characterizations of distributions made by the Fund. Distributions from net investment income for federal income tax purposes include net realized gains on foreign currency transactions. These book/tax differences are either temporary or permanent in nature. To the extent these differences are permanent, adjustments are made to the appropriate capital accounts in the period when the differences arise. Permanent differences are primarily due to the tax treatment of currency gains and losses. These reclassifications have no impact on the NAV of the Fund. For the year ended December 31, 2014, reclassifications were made to decrease accumulated net investment income by $916 and decrease accumulated net realized loss on investments and foreign currency transactions by $916.
The tax character of distributions paid during the year ended December 31, 2013 was ordinary income of $13,508.
Provision for Income Taxes. The Fund intends to continue to qualify as a regulated investment company under Subchapter M of the Internal Revenue Code of 1986, as amended (the “Code”). It is the policy of the Fund to comply with the requirements of the Code applicable to regulated investment companies and to distribute substantially all of its net investment company taxable income and net capital gains. Therefore, no provision for federal income taxes is required.
At December 31, 2014, the components of accumulated earnings/losses on a tax basis were as follows:
| | | | |
Undistributed ordinary income | | $ | 40,909 | |
Accumulated capital loss carryforwards | | | (556,614 | ) |
Net unrealized appreciation on investments and foreign currency translations | | | 5,293,638 | |
| | | | |
Total | | $ | 4,777,933 | |
| | | | |
At December 31, 2014, the Fund had net capital loss carryforwards for federal income tax purposes which are available to reduce future required distributions of net capital gains to shareholders. Under the Regulated Investment Company Modernization Act of 2010, the Fund is permitted to carry forward for an unlimited period capital losses incurred in years beginning after December 22, 2010. In addition, these losses must be utilized prior to the losses incurred in pre-enactment taxable years. As a result of the rule, pre-enactment capital loss carryforwards
14
The GAMCO Global Opportunity Fund
Notes to Financial Statements (Continued)
may have an increased likelihood of expiring unused. Additionally, post enactment capital losses that are carried forward will retain their character as either short term or long term capital losses rather than being considered all short term as under previous law.
| | | | |
Capital loss carryforward available through 2016 | | $ | 458,608 | |
Capital loss carryforward available through 2017 | | | 98,006 | |
| | | | |
Total capital loss carryforwards | | $ | 556,614 | |
| | | | |
During the year ended December 31, 2014, the Fund utilized capital loss carryforwards of $442,803.
At December 31, 2014, the differences between book basis and tax basis unrealized appreciation were primarily due to mark-to-market adjustments on investments in passive foreign investment companies.
The following summarizes the tax cost of investments and the related unrealized appreciation at December 31, 2014:
| | | | | | | | |
| | | Cost | | Gross
Unrealized
Appreciation | | Gross
Unrealized
Depreciation | | Net Unrealized
Appreciation |
Investments | | $5,846,191 | | $5,630,257 | | $(334,791) | | $5,295,466 |
The Fund is required to evaluate tax positions taken or expected to be taken in the course of preparing the Fund’s tax returns to determine whether the tax positions are “more-likely-than-not” of being sustained by the applicable tax authority. Income tax and related interest and penalties would be recognized by the Fund as tax expense in the Statement of Operations if the tax positions were deemed not to meet the more-likely-than-not threshold. During the year ended December 31, 2014, the Fund did not incur any income tax, interest, or penalties. As of December 31, 2014, the Adviser has reviewed all open tax years and concluded that there was no impact to the Fund’s net assets or results of operations. The Fund’s federal and state tax returns for the prior three years remain open, subject to examination. On an ongoing basis, the Adviser will monitor the Fund’s tax positions to determine if adjustments to this conclusion are necessary.
3. Investment Advisory Agreement and Other Transactions. The Fund has entered into an investment advisory agreement (the “Advisory Agreement”) with the Adviser which provides that the Fund will pay the Adviser a fee, computed daily and paid monthly, at the annual rate of 1.00% of the value of its average daily net assets. In accordance with the Advisory Agreement, the Adviser provides a continuous investment program for the Fund’s portfolio, oversees the administration of all aspects of the Fund’s business and affairs, and pays the compensation of all Officers and Directors of the Fund who are affiliated persons of the Adviser.
The Adviser has contractually agreed to waive its investment advisory fee and/or to reimburse expenses of the Fund to the extent necessary to maintain the annualized total operating expenses of the Fund (excluding brokerage, acquired fund fees and expenses, interest, taxes, and extraordinary expenses) until at least May 1, 2015, at no more than 2.00%, 2.00%, 2.75%, and 1.00% of the value of the Fund’s average daily net assets for Class AAA, Class A, Class C, and Class I, respectively. For the year ended December 31, 2014, the Adviser reimbursed the Fund in the amount of $85,469. In addition, the Fund has agreed, during the two year period following any waiver or reimbursement by the Adviser, to repay such amount to the extent, that after giving the effect to the repayment, such adjusted annualized total operating expenses of the Fund would not exceed 2.00%, 2.00%, 2.75%, and 1.00% (effective August 25, 2014, 1.75% prior to August 25, 2014) of the value of
15
The GAMCO Global Opportunity Fund
Notes to Financial Statements (Continued)
the Fund’s average daily net assets for Class AAA, Class A, Class C, and Class I, respectively. The agreement is renewable annually. At December 31, 2014, the cumulative amount which the Fund may repay the Adviser is $167,402.
| | | | |
For the year ended December 31, 2013, expiring December 31, 2015 | | $ | 81,933 | |
For the year ended December 31, 2014, expiring December 31, 2016 | | | 85,469 | |
| | | | |
| | $ | 167,402 | |
| | | | |
The Corporation pays each Director who is not considered to be an affiliated person an annual retainer of $6,000 plus $1,000 for each Board meeting attended, and they are reimbursed for any out of pocket expenses incurred in attending meetings. All Board committee members receive $1,000 per meeting attended. The Chairman of the Audit Committee receives an annual fee of $3,000 and the Lead Director receives an annual fee of $2,000. A Director may receive a single meeting fee, allocated among the participating funds, for attending certain meetings held on behalf of multiple funds. Directors who are directors or employees of the Adviser or an affiliated company receive no compensation or expense reimbursement from the Corporation.
4. Distribution Plan. The Fund’s Board has adopted a distribution plan (the “Plan”) for each class of shares, except for Class I Shares, pursuant to Rule 12b-1 under the 1940 Act. Under the Class AAA, Class A, and Class C Share Plans, payments are authorized to G.distributors, LLC (the “Distributor”), an affiliate of the Adviser, at annual rates of 0.25%, 0.25%, and 1.00%, respectively, of the average daily net assets of those classes, the annual limitations under each Plan. Such payments are accrued daily and paid monthly.
5. Portfolio Securities. Purchases and sales of securities during the year ended December 31, 2014, other than short term securities and U.S. Government obligations, aggregated $1,038,944 and $1,687,664, respectively.
6. Transactions with Affiliates. During the year ended December 31, 2014, the Fund paid brokerage commissions on security trades of $210 to G.research, Inc., an affiliate of the Adviser. Additionally, the Distributor retained a total of $75 from investors representing commissions (sales charges and underwriting fees) on sales and redemptions of Fund shares.
The cost of calculating the Fund’s NAV per share is a Fund expense pursuant to the Advisory Agreement. The Adviser did not seek a reimbursement during the year ended December 31, 2014.
7. Line of Credit. The Fund participates in an unsecured line of credit of up to $75,000,000 under which it may borrow up to 10% of its net assets from the custodian for temporary borrowing purposes. Borrowings under this arrangement bear interest at the higher of the sum of the overnight LIBOR rate plus 100 basis points or the sum of the federal funds rate plus 100 basis points at the time of borrowing. This amount, if any, would be included in “Interest expense” in the Statement of Operations. At December 31, 2014, there were no borrowings outstanding under the line of credit.
The average daily amount of borrowings outstanding under the line of credit during the year ended December 31, 2014 was $10,123 with a weighted average interest rate of 1.11%. The maximum amount borrowed at any time during the year ended December 31, 2014 was $143,000.
8. Capital Stock. The Fund offers four classes of shares – Class AAA Shares, Class A Shares, Class C Shares, and Class I Shares. Class AAA Shares are offered without a sales charge only to investors who acquire them
16
The GAMCO Global Opportunity Fund
Notes to Financial Statements (Continued)
directly from the Distributor, through selected broker/dealers, or the transfer agent. Class I Shares are offered without a sales charge, directly through the Distributor or brokers that have entered into selling agreements specifically with respect to Class I Shares. Class A Shares are subject to a maximum front-end sales charge of 5.75%. Class C Shares are subject to a 1.00% contingent deferred sales charge for one year after purchase.
The Fund imposes a redemption fee of 2.00% on all classes of shares that are redeemed or exchanged on or before the seventh day after the date of a purchase. The redemption fee is deducted from the proceeds otherwise payable to the redeeming shareholders and is retained by the Fund as an increase in paid-in capital. The redemption fees retained by the Fund during the years ended December 31, 2014 and 2013, if any, can be found in the Statement of Changes in Net Assets under Redemption Fees.
Transactions in shares of capital stock were as follows:
| | | | | | | | | | | | | | | | |
| | | Year Ended
December 31, 2014 | | | Year Ended
December 31, 2013 | |
| | | Shares | | | Amount | | | Shares | | | Amount | |
Class AAA | | | | | | | | | | | | | | | | |
Shares sold | | | 18,562 | | | $ | 450,515 | | | | 24,418 | | | $ | 548,609 | |
Shares issued upon reinvestment of distributions | | | — | | | | — | | | | 463 | | | | 10,939 | |
Shares redeemed | | | (50,704 | ) | | | (1,227,970 | ) | | | (39,394 | ) | | | (857,268 | ) |
| | | | | | | | | | | | | | | | |
Net decrease | | | (32,142 | ) | | $ | (777,455 | ) | | | (14,513 | ) | | $ | (297,720 | ) |
| | | | | | | | | | | | | | | | |
Class A | | | | | | | | | | | | | | | | |
Shares sold | | | 1,337 | | | $ | 31,947 | | | | 1,377 | | | $ | 29,743 | |
Shares issued upon reinvestment of distributions | | | — | | | | — | | | | 7 | | | | 173 | |
Shares redeemed | | | (1,957 | ) | | | (46,640 | ) | | | (2,380 | ) | | | (52,495 | ) |
| | | | | | | | | | | | | | | | |
Net decrease | | | (620 | ) | | $ | (14,693 | ) | | | (996 | ) | | $ | (22,579 | ) |
| | | | | | | | | | | | | | | | |
Class C | | | | | | | | | | | | | | | | |
Shares sold | | | 903 | | | $ | 20,720 | | | | — | | | $ | — | |
Shares redeemed | | | (393 | ) | | | (9,414 | ) | | | — | | | | — | |
| | | | | | | | | | | | | | | | |
Net increase | | | 510 | | | $ | 11,306 | | | | — | | | $ | — | |
| | | | | | | | | | | | | | | | |
Class I | | | | | | | | | | | | | | | | |
Shares sold | | | 4,245 | | | $ | 104,869 | | | | 3,077 | | | $ | 65,337 | |
Shares issued upon reinvestment of distributions | | | — | | | | — | | | | 86 | | | | 2,041 | |
Shares redeemed | | | (2,943 | ) | | | (71,323 | ) | | | (3,024 | ) | | | (65,001 | ) |
| | | | | | | | | | | | | | | | |
Net increase | | | 1,302 | | | $ | 33,546 | | | | 139 | | | $ | 2,377 | |
| | | | | | | | | | | | | | | | |
9. Indemnifications. The Fund enters into contracts that contain a variety of indemnifications. The Fund’s maximum exposure under these arrangements is unknown. However, the Fund has not had prior claims or losses pursuant to these contracts. Management has reviewed the Fund’s existing contracts and expects the risk of loss to be remote.
10. Subsequent Events. Management has evaluated the impact on the Fund of all subsequent events occurring through the date the financial statements were issued and has determined that there were no subsequent events requiring recognition or disclosure in the financial statements.
17
The GAMCO Global Opportunity Fund
Report of Independent Registered Public Accounting Firm
To the Board of Directors of GAMCO Global Series Funds, Inc. and the
Shareholders of The GAMCO Global Opportunity Fund
We have audited the accompanying statement of assets and liabilities, including the schedule of investments, of The GAMCO Global Opportunity Fund (the “Fund”), one of the series constituting GAMCO Global Series Funds, Inc., as of December 31, 2014, and the related statement of operations for the year then ended, the statements of changes in net assets for each of the two years in the period then ended, and the financial highlights for each of the five years in the period then ended. These financial statements and financial highlights are the responsibility of the Fund’s management. Our responsibility is to express an opinion on these financial statements and financial highlights based on our audits.
We conducted our audits in accordance with the standards of the Public Company Accounting Oversight Board (United States). Those standards require that we plan and perform the audit to obtain reasonable assurance about whether the financial statements and financial highlights are free of material misstatement. We were not engaged to perform an audit of the Fund’s internal control over financial reporting. Our audits included consideration of internal control over financial reporting as a basis for designing audit procedures that are appropriate in the circumstances, but not for the purpose of expressing an opinion on the effectiveness of the Fund’s internal control over financial reporting. Accordingly, we express no such opinion. An audit also includes examining, on a test basis, evidence supporting the amounts and disclosures in the financial statements and financial highlights, assessing the accounting principles used and significant estimates made by management, and evaluating the overall financial statement presentation. Our procedures included confirmation of securities owned as of December 31, 2014, by correspondence with the Fund’s custodian. We believe that our audits provide a reasonable basis for our opinion.
In In our opinion, the financial statements and financial highlights referred to above present fairly, in all material respects, the financial position of the Fund at December 31, 2014, the results of its operations for the year then ended, the changes in its net assets for each of the two years in the period then ended, and its financial highlights for each of the five years in the period then ended, in conformity with U.S. generally accepted accounting principles.

New York, New York
February 25, 2015
18
The GAMCO Global Opportunity Fund
Board Consideration and Re-Approval of Investment Advisory Agreements (Unaudited)
During the six months ended December 31, 2014, the Board of Directors of the Corporation approved the continuation of the investment advisory agreement with the Adviser for the Fund on the basis of the recommendation by the directors (the “Independent Board Members”) who are not “interested persons” of the Fund. The following paragraphs summarize the material information and factors considered by the Independent Board Members as well as their conclusions relative to such factors.
Nature, Extent, and Quality of Services. The Independent Board Members considered information regarding the Fund’s portfolio managers, the depth of the analyst pool available to the Adviser and the portfolio manager, the scope of supervisory, administrative, shareholder, and other services supervised or provided by the Adviser, and the absence of significant service problems reported to the Board. The Independent Board Members noted the experience, length of service and reputation of the Fund’s portfolio manager.
Investment Performance. The Independent Board Members reviewed the short and medium term performance of the Fund against a peer group of global multi-cap growth funds, noting the Fund’s fourth quartile performance for the one year period and third quartile performance for the three and five year periods.
Profitability. The Independent Board Members reviewed summary data regarding the lack of profitability of the Fund to the Adviser both with and without the expense reimbursement arrangement in effect. The Independent Board Members also noted that that a portion of the Fund’s portfolio transactions were executed by an affiliated broker of the Adviser and that another affiliated broker of the Adviser received distribution fees and minor amounts of sales commissions.
Economies of Scale. The Independent Board Members discussed the major elements of the Adviser’s cost structure and the relationship of those elements to potential economies of scale and reviewed rudimentary data relating to the impact of 20% growth in the Fund on the Adviser’s profitability.
Sharing of Economies of Scale. The Independent Board Members noted that the investment management fee schedule for the Fund does not take into account any potential economies of scale that may develop or any losses or diminished profitability to the Adviser in prior years.
Service and Cost Comparisons. The Independent Board Members compared the expense ratios of the investment management fee, other expenses, and total expenses of the Fund with similar expense ratios of the peer group of global multi-cap growth funds and noted that the Adviser’s management fee includes substantially all administrative services of the Fund as well as investment advisory services. The Independent Board Members noted that the Fund’s expense ratios after waivers were moderately higher than and the Fund’s size was significantly lower than average within this group and that the Adviser had been waiving substantial portions of its fees in order to make the Fund a more attractive investment. The Independent Board Members were presented with, but did not consider to be material to their decision, various information comparing the advisory fee with the fee for other types of accounts managed by the Adviser.
Conclusions. The Independent Board Members concluded that the Fund enjoyed highly experienced portfolio management services, good ancillary services, and an acceptable performance record. The Independent Board Members also concluded that the Fund’s expense ratios were reasonable, particularly in light of the lack of profitability to the Adviser of managing the Fund, and that economies of scale were not a factor in their thinking at this time. The Independent Board Members did not view the potential profitability of ancillary services as material to their decision. On the basis of the foregoing and without assigning particular weight to any single conclusion, the Independent Board Members determined to recommend continuation of the investment management agreement to the full Board of Directors.
19
The GAMCO Global Opportunity Fund
Additional Fund Information (Unaudited)
The business and affairs of the Fund are managed under the direction of the Corporation’s Board of Directors. Information pertaining to the Directors and officers of the Fund is set forth below. The Corporation’s Statement of Additional Information includes additional information about the Fund’s Directors and is available without charge, upon request, by calling 800-GABELLI (800-422-3554) or by writing to The GAMCO Global Opportunity Fund at One Corporate Center, Rye, NY 10580-1422.
| | | | | | | | |
Name, Position(s)
Address1
and Age | | Term of Office
and Length of
Time Served2 | | Number of Funds
in Fund Complex
Overseen by Director | | Principal Occupation(s)
During Past Five Years | | Other Directorships
Held by Director4 |
| | |
| INTERESTED DIRECTORS3: | | | | |
| | | | |
Mario J. Gabelli, CFA Director and Chief Investment Officer Age: 72 | | Since 1993 | | 28 | | Chairman, Chief Executive Officer, and Chief Investment Officer–Value Portfolios of GAMCO Investors, Inc., and Chief Investment Officer–Value Portfolios of Gabelli Funds, LLC and GAMCO Asset Management Inc.; Director/ Trustee or Chief Investment Officer of other registered investment companies in the Gabelli/ GAMCO Fund Complex; Chief Executive Officer of GGCP, Inc. | | Director of Morgan Group Holdings, Inc. (holding company); Chairman of the Board and Chief Executive Officer of LICT Corp. (multimedia and communication services); Director of CIBL, Inc. (broadcasting and wireless communications); Director of ICTC Group, Inc. (communications); Director of RLJ Acquisition Inc. (blank check company) (2011-2012) |
| | | | |
John D. Gabelli Director Age: 70 | | Since 1993 | | 10 | | Senior Vice President of G.research, Inc. | | — |
| | | |
| INDEPENDENT DIRECTORS5: | | | | | | |
| | | | |
E. Val Cerutti Director Age: 75 | | Since 2001 | | 7 | | Chief Executive Officer of Cerutti Consultants, Inc. | | Director of LGL Group, Inc. (diversified manufacturing) (1990-2009) |
| | | | |
Anthony J. Colavita Director Age: 79 | | Since 1993 | | 37 | | President of the law firm of Anthony J. Colavita, P.C. | | — |
| | | | |
Arthur V. Ferrara Director Age: 84 | | Since 2001 | | 8 | | Former Chairman of the Board and Chief Executive Officer of The Guardian Life Insurance Company of America (1993 –1995) | | — |
| | | | |
Werner J. Roeder, MD Director Age: 74 | | Since 1993 | | 23 | | Former Medical Director of Lawrence Hospital and practicing private physician | | — |
| | | | |
Anthonie C. van Ekris Director Age: 80 | | Since 1993 | | 20 | | Chairman and Chief Executive Officer of BALMAC International, Inc. (commodities and futures trading) | | — |
| | | | |
Salvatore J. Zizza Director Age: 69 | | Since 2004 | | 31 | | Chairman of Zizza & Associates Corp. (financial consulting); Chairman of Metropolitan Paper Recycling, Inc. (recycling) (since 2005); Chairman of Harbor Diversified, Inc. (pharmaceuticals) (since 1999); Chairman of BAM (semiconductor and aerospace manufacturing) (since 2000); Chairman of Bergen Cove Realty Inc. (since 2002) | | Director and Vice Chairman of Trans-Lux Corporation (business services); Director and Chairman of Harbor Diversified, Inc. (pharmaceuticals); Chairman of Bion Environmental Technologies (technology) (2005-2007); Director, Chairman, and CEO of General Employment Enterprises (staffing services) (2009-2012) |
20
The GAMCO Global Opportunity Fund
Additional Fund Information (Continued) (Unaudited)
| | | | |
Name, Position(s)
Address1
and Age | | Term of Office
and Length of
Time Served2 | | Principal Occupation(s)
During Past Five Years |
OFFICERS: | | | | |
| | |
Bruce N. Alpert
President
Age: 63 | | Since 2003 | | Executive Vice President and Chief Operating Officer of Gabelli Funds, LLC since 1988; and an Officer of registered investment companies in the Gabelli/GAMCO Fund Complex; Director of Teton Advisors, Inc. 1998-2012; Chairman of Teton Advisors, Inc. 2008-2010; President of Teton Advisors, Inc. 1998-2008; Senior Vice President of GAMCO Investors, Inc. since 2008 |
| | |
Andrea R. Mango Secretary
Age: 42 | | Since November
2013 | | Counsel of Gabelli Funds, LLC; Corporate Vice President within the Corporate Compliance Department of New York Life Insurance Company 2011-2013; Vice President and Counsel of Deutsche Bank 2006-2011 |
| | |
Agnes Mullady
Treasurer
Age: 56 | | Since 2006 | | President and Chief Operating Officer of the Open-End Fund Division of Gabelli Funds, LLC since September 2010; Senior Vice President of GAMCO Investors, Inc. since 2009; Vice President of Gabelli Funds, LLC since 2007; Officer of all of the registered investment companies in the Gabelli/GAMCO Fund Complex |
| | |
Richard J. Walz
Chief Compliance Officer Age: 55 | | Since November
2013 | | Chief Compliance Officer of the Gabelli/GAMCO Fund Complex; Chief Compliance Officer of AEGON USA Investment Management LLC 2011-2013; Chief Compliance Officer of Cutwater Asset Management 2004-2011 |
| 1 | Address: One Corporate Center, Rye, NY 10580-1422, unless otherwise noted. |
| 2 | Each Director will hold office for an indefinite term until the earliest of (i) the next meeting of shareholders, if any, called for the purpose of considering the election or re-election of such Director and until the election and qualification of his or her successor, if any, elected at such meeting, or (ii) the date a Director resigns or retires, or a Director is removed by the Board of Directors or shareholders, in accordance with the Fund’s By-Laws and Articles of Incorporation. Each officer will hold office for an indefinite term until the date he or she resigns or retires or until his or her successor is elected and qualified. |
| 3 | “Interested person” of the Corporation as defined in the 1940 Act. Messrs. Gabelli are each considered an “interested person” because of their affiliation with Gabelli Funds, LLC which acts as the Corporation’s investment adviser. Mario J. Gabelli and John D. Gabelli are brothers. |
| 4 | This column includes only directorships of companies required to report to the SEC under the Securities Exchange Act of 1934, as amended, i.e., public companies, or other investment companies registered under the 1940 Act. |
| 5 | Directors who are not interested persons are considered “Independent” Directors. |
21
Gabelli/GAMCO Funds and Your Personal Privacy
Who are we?
The Gabelli/GAMCO Funds are investment companies registered with the Securities and Exchange Commission under the Investment Company Act of 1940. We are managed by Gabelli Funds, LLC and GAMCO Asset Management Inc., which are affiliated with GAMCO Investors, Inc. GAMCO Investors, Inc. is a publicly held company that has subsidiaries that provide investment advisory or brokerage services for a variety of clients.
What kind of non-public information do we collect about you if you become a fund shareholder?
If you apply to open an account directly with us, you will be giving us some non-public information about yourself. The non-public information we collect about you is:
| | — | | Information you give us on your application form. This could include your name, address, telephone number, social security number, bank account number, and other information. | |
| | — | | Information about your transactions with us, any transactions with our affiliates, and transactions with the entities we hire to provide services to you. This would include information about the shares that you buy or redeem. If we hire someone else to provide services — like a transfer agent — we will also have information about the transactions that you conduct through them. | |
What information do we disclose and to whom do we disclose it?
We do not disclose any non-public personal information about our customers or former customers to anyone other than our affiliates, our service providers who need to know such information, and as otherwise permitted by law. If you want to find out what the law permits, you can read the privacy rules adopted by the Securities and Exchange Commission. They are in volume 17 of the Code of Federal Regulations, Part 248. The Commission often posts information about its regulations on its website, www.sec.gov.
What do we do to protect your personal information?
We restrict access to non-public personal information about you to the people who need to know that information in order to provide services to you or the fund and to ensure that we are complying with the laws governing the securities business. We maintain physical, electronic, and procedural safeguards to keep your personal information confidential.
THE GAMCO GLOBAL OPPORTUNITY FUND
One Corporate Center
Rye, NY 10580-1422
Portfolio Manager Biography
Caesar M. P. Bryan joined GAMCO Asset Management in 1994. He is a member of the global investment team of Gabelli Funds, LLC and portfolio manager of several funds within the Gabelli/GAMCO Fund Complex. Prior to joining Gabelli, Mr. Bryan was a portfolio manager at Lexington Management. He began his investment career in 1979 at Samuel Montagu Company, the London based merchant bank. Mr. Bryan graduated from the University of Southampton in England with a Bachelor of Law and is a member of the English Bar.
We have separated the portfolio manager’s commentary from the financial statements and investment portfolio due to corporate governance regulations stipulated by the Sarbanes-Oxley Act of 2002. We have done this to ensure that the content of the portfolio manager’s commentary is unrestricted. The financial statements and investment portfolio are mailed separately from the commentary. Both the commentary and the financial statements, including the portfolio of investments, will be available on our website at www.gabelli.com.
GAMCO Global Series Funds, Inc.
THE GAMCO GLOBAL OPPORTUNITY FUND
One Corporate Center
Rye, New York 10580-1422
t 800-GABELLI (800-422-3554)
f 914-921-5118
e info@gabelli.com
GABELLI.COM
Net Asset Value per share available daily
by calling 800-GABELLI after 7:00 P.M.
| | |
BOARD OF DIRECTORS | | |
Mario J. Gabelli, CFA Chairman and Chief Executive Officer, GAMCO Investors, Inc. E. Val Cerutti Chief Executive Officer, Cerutti Consultants, Inc. Anthony J. Colavita President, Anthony J. Colavita, P.C. Arthur V. Ferrara Former Chairman and Chief Executive Officer, Guardian Life Insurance Company of America John D. Gabelli Senior Vice President, G.research, Inc. Werner J. Roeder, MD Former Medical Director, Lawrence Hospital Anthonie C. van Ekris Chairman, BALMAC International, Inc. | | Salvatore J. Zizza Chairman, Zizza & Associates Corp. OFFICERS Bruce N. Alpert President Andrea R. Mango Secretary Agnes Mullady Treasurer Richard J. Walz Chief Compliance Officer DISTRIBUTOR G.distributors, LLC CUSTODIAN, TRANSFER AGENT, AND DIVIDEND DISBURSING AGENT State Street Bank and Trust Company LEGAL COUNSEL Skadden, Arps, Slate, Meagher & Flom LLP |
| |
| |
| |
| |
| |
| |
| |
| |
| |
| |
| |
| |
| |
| |
| |
| |
| |
| |
| |
| |
| |
| |
| |
This report is submitted for the general information of the shareholders of The GAMCO Global Opportunity Fund. It is not authorized for distribution to prospective investors unless preceded or accompanied by an effective prospectus.
GAB403Q414AR
The GAMCO Global Telecommunications Fund
Annual Report — December 31, 2014
(Y)our Portfolio Management Team

Mario J. Gabelli,CFA Evan D. Miller, CFA Sergey Dluzhevskiy, CFA, CPA
To Our Shareholders,
For the year ended December 31, 2014, the net asset value (“NAV”) per Class AAA Share of The GAMCO Global Telecommunications Fund decreased 1.3% compared with a decrease of 1.5% for the Morgan Stanley Capital International (“MSCI”) All Country (“AC”) World Telecommunication Services Index. See page 3 for additional performance information.
Enclosed are the financial statements, including the schedule of investments, as of December 31, 2014.
Performance Discussion (Unaudited)
The telecommunications sector lagged the broader market in fourth quarter, which recorded a small gain of 0.6% largely owing to a year-end rally that followed the sharp sell-off in October. Telecoms underperformed in each quarter of 2014, and the cumulative loss of 1.5% compares with a 4.2% gain in the MSCI AC World Index. For 2014, the telecommunications sector proved to be the weakest performing major industry group, with the exceptions of Energy and Materials.
The prolonged investor aversion to telecoms appears somewhat curious in view of the performance of the two most closely ‘related’ sectors of Information Technology (“IT”) and Utilities, with these groups having gained 14.7% and 12.0%, respectively, during 2014. Despite the increasing sophistication of telecommunications services and their critical role in ‘information and communications technology or technologies ( ICT) solutions’ for businesses, and massive global adoption of consumer mobile data applications delivered over smartphones and larger screens, the sector was no substitute for IT. And despite the defensive characteristics and attractive dividends paid by many of the largest cap telecommunication companies, the sector did not benefit from the demand for current returns in utilities. There were a number of bright spots for the group in fourth quarter, most notably in Europe, though these gains were negated by the weak absolute and relative performance of North American telecommunication companies.
Following nine months of flat performance, European telecommunication companies rallied by 7.2% in the fourth quarter, substantially outperforming the broader European market which was unchanged. Mobile service revenue figures reported in the quarter (third quarter results) showed the strongest gains in more than two years virtually across the whole of Europe. Contributing factors were 4G migration (a mobile communications
standard allowing wireless internet access at a much higher speed), and the ability to translate the corresponding data growth into revenue gains.
2014 was a challenging year in the world of telecommunications. Nonetheless, it brought with it a number of developments. The demand for mobile data – from users in remote rural areas checking weather forecasts and crop prices, to the most sophisticated high end user multimedia applications, to the explosion of machine to machine connectivity – continues to exceed all but the most optimistic of forecasts.
Selected holdings that contributed positively to performance in 2014 were: Cablevision Systems Corp., Cl. A (2.1% of net assets as of December 31, 2014) owns and operates cable television systems in the United States; Yahoo! Inc. (1.4%) operates as a technology company worldwide; Atlantic Tele-Network Inc. (1.3%) provides wireless and wireline telecommunications services.
Some of our weaker performing stocks during the year were: VimpelCom Ltd ADR (0.8%), among the top ten telecommunications operators worldwide with operations spanning Russia and the CIS, Italy, and the Middle East/Asia; Sistema JSFC, GDR (0.3%) is the largest publicly traded diversified company in Russia and the CIS; and Sprint Corp. (0.3%) provides wireless and wireline communications services to consumers, businesses, and government users.
We appreciate your confidence and trust.
Sincerely yours,

Bruce N. Alpert
President
February 20, 2015
2
Comparative Results
| | | | | | | | | | | | |
| | | Average Annual Returns through December 31, 2014 (a) (Unaudited) | | Since | | |
| | | | | 1 Year | | 5 Year | | 10 Year | | Inception
(11/1/93) | | |
| | Class AAA (GABTX) | | (1.28)% | | 7.16% | | 5.07% | | 7.82% | | |
| | MSCI AC World Telecommunication Services Index. | | (1.53) | | 7.98 | | 5.98 | | N/A | | |
| | MSCI AC World Index. | | 4.16 | | 9.17 | | 6.09 | | 6.97(d) | | |
| | Class A (GTCAX) | | (1.30) | | 7.16 | | 5.08 | | 7.83 | | |
| | With sales charge (b) | | (6.97) | | 5.89 | | 4.46 | | 7.53 | | |
| | Class C (GTCCX) | | (2.04) | | 6.36 | | 4.28 | | 7.27 | | |
| | With contingent deferred sales charge (c) | | (3.02) | | 6.36 | | 4.28 | | 7.27 | | |
| | Class I (GTTIX) | | (1.06) | | 7.43 | | 5.26 | | 7.92 | | |
| | | | | | | | | | | | |
| | In the current prospectuses dated April 30, 2014, the expense ratios for Class AAA, A, C, and I Shares are 1.64%, 1.64%, 2.39%, and 1.39%, respectively. See page 11 for the expense ratios for the year ended December 31, 2014. Class AAA and Class I Shares do not have a sales charge. The maximum sales charge for Class A and Class C Shares is 5.75% and 1.00%, respectively. (a) Returns represent past performance and do not guarantee future results. Total returns and average annual returns reflect changes in share price, reinvestment of distributions, and are net of expenses. Investment returns and the principal value of an investment will fluctuate. When shares are redeemed, they may be worth more or less than their original cost. Current performance may be lower or higher than the performance data presented. Visit www.gabelli.com for performance information as of the most recent month end. The Fund imposes a 2% redemption fee on shares sold or exchanged within seven days after the date of purchase. Investors should carefully consider the investment objectives, risks, charges, and expenses of the Fund before investing. The prospectuses contain information about these and other matters and should be read carefully before investing. To obtain a prospectus, please visit our website at www.gabelli.com. Investing in foreign securities involves risks not ordinarily associated with investments in domestic issues, including currency fluctuation, economic, and political risks. The Class AAA Share NAVs per share are used to calculate performance for the periods prior to the issuance of Class A Shares, Class C Shares, and Class I Shares on March 12, 2000, June 2, 2000, and January 11, 2008, respectively. The actual performance for the Class A Shares and Class C Shares would have been lower due to the additional fees and expenses associated with these classes of shares. The actual performance of the Class I Shares would have been higher due to lower expenses related to this class of shares. The MSCI AC World Telecommunication Services Index is an unmanaged index that measures the performance of the global telecommunication securities from around the world. The MSCI AC World Index is an unmanaged market capitalization weighted index that is designed to measure the equity market performance of developed and emerging markets. The MSCI AC World Index consists of 45 country indices comprising 24 developed and 21 emerging market country indices. Dividends are considered reinvested. You cannot invest directly in an index. (b) Performance results include the effect of the maximum 5.75% sales charge at the beginning of the period. (c) Assuming payment of the 1% maximum contingent deferred sales charge imposed on redemptions made within one year of purchase. (d) MSCI AC World Index since inception performance is a blend of Gross excluding applicable taxes and Net Performance. This benchmark’s Net performance began on December 29, 2000. | | |
COMPARISON OF CHANGE IN VALUE OF A $10,000 INVESTMENT IN
THE GAMCO GLOBAL TELECOMMUNICATIONS FUND (CLASS AAA SHARES)
AND MSCI AC WORLD INDEX (Unaudited)
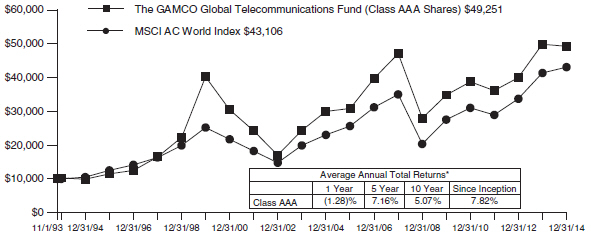
| * | Past performance is not predictive of future results. The performance tables and graph do not reflect the deduction of taxes that a shareholder would pay on fund distributions or the redemption of fund shares. |
3
| | |
The GAMCO Global Telecommunications Fund Disclosure of Fund Expenses (Unaudited) | | |
| For the Six Month Period from July 1, 2014 through December 31, 2014 | | Expense Table |
We believe it is important for you to understand the impact of fees and expenses regarding your investment. All mutual funds have operating expenses. As a shareholder of a fund, you incur ongoing costs, which include costs for portfolio management, administrative services, and shareholder reports (like this one), among others. Operating expenses, which are deducted from a fund’s gross income, directly reduce the investment return of a fund. When a fund’s expenses are expressed as a percentage of its average net assets, this figure is known as the expense ratio. The following examples are intended to help you understand the ongoing costs (in dollars) of investing in your Fund and to compare these costs with those of other mutual funds. The examples are based on an investment of $1,000 made at the beginning of the period shown and held for the entire period.
The Expense Table below illustrates your Fund’s costs in two ways:
Actual Fund Return: This section provides information about actual account values and actual expenses. You may use this section to help you to estimate the actual expenses that you paid over the period after any fee waivers and expense reimbursements. The “Ending Account Value” shown is derived from the Fund’s actual return during the past six months, and the “Expenses Paid During Period” shows the dollar amount that would have been paid by an investor who started with $1,000 in the Fund. You may use this information, together with the amount you invested, to estimate the expenses that you paid over the period.
To do so, simply divide your account value by $1,000 (for example, an $8,600 account value divided by $1,000 = 8.6), then multiply the result by the number given for your Fund under the heading “Expenses Paid During Period” to estimate the expenses you paid during this period.
Hypothetical 5% Return: This section provides information about hypothetical account values and
hypothetical expenses based on the Fund’s actual expense ratio. It assumes a hypothetical annualized return of 5% before expenses during the period shown. In this case – because the hypothetical return used is not the Fund’s actual return – the results do not apply to your investment and you cannot use the hypothetical account value and expense to estimate the actual ending account balance or expenses you paid for the period. This example is useful in making comparisons of the ongoing costs of investing in the Fund and other funds. To do so, compare this 5% hypothetical example with the 5% hypothetical examples that appear in shareholder reports of other funds.
Please note that the expenses shown in the table are meant to highlight your ongoing costs only and do not reflect any transactional costs such as sales charges (loads), redemption fees, or exchange fees, if any, which are described in the Prospectus. If these costs were applied to your account, your costs would be higher. Therefore, the 5% hypothetical return is useful in comparing ongoing costs only, and will not help you determine the relative total costs of owning different funds. The “Annualized Expense Ratio” represents the actual expenses for the last six months and may be different from the expense ratio in the Financial Highlights which is for the year ended December 31, 2014.
| | | | | | | | |
| | | Beginning
Account Value
07/01/14 | | Ending
Account Value
12/31/14 | | Annualized
Expenses
Ratio | | Expense Paid During
Period* |
The GAMCO Global Telecommunications Fund |
Actual Fund Return |
Class AAA | | $1,000.00 | | $ 956.80 | | 1.60% | | $ 7.89 |
Class A | | $1,000.00 | | $ 956.60 | | 1.60% | | $ 7.89 |
Class C | | $1,000.00 | | $ 953.20 | | 2.35% | | $11.57 |
Class I | | $1,000.00 | | $ 957.70 | | 1.35% | | $ 6.66 |
Hypothetical 5% Return | | | | |
Class AAA | | $1,000.00 | | $1,017.14 | | 1.60% | | $ 8.13 |
Class A | | $1,000.00 | | $1,017.14 | | 1.60% | | $ 8.13 |
Class C | | $1,000.00 | | $1,013.36 | | 2.35% | | $11.93 |
Class I | | $1,000.00 | | $1,018.40 | | 1.35% | | $ 6.87 |
| * | Expenses are equal to the Fund’s annualized expense ratio for the last six months multiplied by the average account value over the period, multiplied by the number of days in the most recent fiscal half year (184 days), then divided by 365. |
4
Summary of Portfolio Holdings (Unaudited)
The following table presents portfolio holdings as a percent of net assets as of December 31, 2014:
The GAMCO Global Telecommunications Fund
| | |
Diversified Telecommunications Services | | 44.8% |
Other | | 28.8% |
Wireless Telecommunications Services | | 28.0% |
| | | | |
U.S. Government Obligations | | | 3.0 | % |
Other Assets and Liabilities (Net) | | | (4.6 | )% |
| | | | |
| | | 100.0 | % |
| | | | |
The Fund files a complete schedule of portfolio holdings with the Securities and Exchange Commission (the “SEC”) for the first and third quarters of each fiscal year on Form N-Q. Shareholders may obtain this information at www.gabelli.com or by calling the Fund at 800-GABELLI (800-422-3554).The Fund’s Form N-Q is available on the SEC’s website at www.sec.gov and may also be reviewed and copied at the SEC’s Public Reference Room in Washington, DC. Information on the operation of the Public Reference Room may be obtained by calling 800-SEC-0330.
Proxy Voting
The Fund files Form N-PX with its complete proxy voting record for the twelve months ended June 30, no later than August 31 of each year. A description of the Fund’s proxy voting policies, procedures, and how the Fund voted proxies relating to portfolio securities is available without charge, upon request, by (i) calling 800-GABELLI (800-422-3554); (ii) writing to The Gabelli Funds at One Corporate Center, Rye, NY 10580-1422; or (iii) visiting the SEC’s website at www.sec.gov.
5
The GAMCO Global Telecommunications Fund
Schedule of Investments — December 31, 2014
| | | | | | | | | | | | |
Shares | | | | | Cost | | | Market Value | |
| |
| | | | COMMON STOCKS — 100.9% | |
| | | | DIVERSIFIED TELECOMMUNICATIONS SERVICES — 44.8% | |
| | | | Africa/Middle East — 0.4% | |
| | 30,000 | | | Maroc Telecom | | $ | 519,312 | | | $ | 378,263 | |
| | 200,000 | | | Pakistan Telecommunication Co. Ltd.(a) | | | 155,766 | | | | 45,819 | |
| | | | | | | | | | | | |
| | | | | | | 675,078 | | | | 424,082 | |
| | | | | | | | | | | | |
| |
| | | | Asia/Pacific — 5.3% | |
| | 225,000 | | | Asia Satellite Telecommunications Holdings Ltd. | | | 487,155 | | | | 789,204 | |
| | 9,600 | | | DiGi.Com Berhad | | | 14,361 | | | | 16,940 | |
| | 170,000 | | | First Pacific Co. Ltd. | | | 92,079 | | | | 168,583 | |
| | 4,100 | | | First Pacific Co. Ltd., ADR | | | 3,337 | | | | 19,973 | |
| | 90,000 | | | PCCW Ltd. | | | 74,681 | | | | 61,511 | |
| | 24,000 | | | Philippine Long Distance Telephone Co., ADR | | | 343,529 | | | | 1,518,960 | |
| | 14,000 | | | PT Telekomunikasi Indonesia, ADR | | | 112,952 | | | | 633,220 | |
| | 645,000 | | | Singapore Telecommunications Ltd. | | | 488,360 | | | | 1,898,992 | |
| | 280,000 | | | Telekom Malaysia Berhad | | | 355,221 | | | | 550,951 | |
| | 1,930,027 | | | True Corp. Public Co. Ltd., Cl. F† | | | 483,646 | | | | 651,164 | |
| | 8,075 | | | TT&T Public Co. Ltd., GDR†(a)(b)(c) | | | 100,542 | | | | 242 | |
| | | | | | | | | | | | |
| | | | | | | 2,555,863 | | | | 6,309,740 | |
| | | | | | | | | | | | |
| |
| | | | Europe — 15.1% | |
| | 14,000 | | | Belgacom SA | | | 428,402 | | | | 509,916 | |
| | 220,000 | | | Colt Group SA† | | | 398,277 | | | | 459,476 | |
| | 10,000 | | | Com Hem Holding AB† | | | 72,498 | | | | 80,815 | |
| | 215,000 | | | Deutsche Telekom AG, ADR | | | 3,876,225 | | | | 3,416,350 | |
| | 4,507 | | | Hellenic Telecommunications Organization SA† | | | 63,853 | | | | 49,629 | |
| | 4,000 | | | Hellenic Telecommunications Organization SA, ADR† | | | 27,642 | | | | 21,440 | |
| | 1,800 | | | Iliad SA | | | 199,312 | | | | 432,788 | |
| | 20,000 | | | Koninklijke KPN NV | | | 52,583 | | | | 63,600 | |
| | 6,000 | | | Mobistar SA† | | | 138,906 | | | | 142,339 | |
| | 13,000 | | | Orange SA, ADR | | | 333,730 | | | | 219,960 | |
| | 20,000 | | | Portugal Telecom SGPS SA | | | 173,692 | | | | 20,910 | |
| | 35,000 | | | Portugal Telecom SGPS SA, ADR | | | 146,776 | | | | 37,100 | |
| | 3,700 | | | Rostelecom OJSC, ADR | | | 79,931 | | | | 33,633 | |
| | 70,000 | | | Sistema JSFC, GDR | | | 1,286,482 | | | | 364,700 | |
| | 62,000 | | | Sky Deutschland AG† | | | 543,932 | | | | 504,157 | |
| | 28,000 | | | Swisscom AG, ADR | | | 699,547 | | | | 1,468,460 | |
| | 14,500 | | | Tele2 AB, Cl. B | | | 224,910 | | | | 176,610 | |
| | 650,000 | | | Telecom Italia SpA† | | | 2,471,280 | | | | 693,723 | |
| | 14,000 | | | Telecom Italia SpA, ADR† | | | 528,665 | | | | 147,560 | |
| | 254,131 | | | Telefonica SA, ADR | | | 2,577,962 | | | | 3,611,202 | |
| | 115,000 | | | Telekom Austria AG | | | 1,252,826 | | | | 768,003 | |
| | 56,000 | | | Telenor ASA | | | 850,079 | | | | 1,138,334 | |
| | 427,000 | | | TeliaSonera AB | | | 1,312,808 | | | | 2,760,652 | |
| | | | | | | | | | | | |
Shares | | | | | Cost | | | Market
Value | |
| | | |
| | 225,000 | | | VimpelCom Ltd., ADR | | $ | 568,479 | | | $ | 939,375 | |
| | | | | | | | | | | | |
| | | | | | | 18,308,797 | | | | 18,060,732 | |
| | | | | | | | | | | | |
| |
| | | | Japan — 0.7% | |
| | 12,000 | | | Nippon Telegraph & Telephone Corp. | | | 442,005 | | | | 622,241 | |
| | 9,000 | | | Nippon Telegraph & Telephone Corp., ADR | | | 191,035 | | | | 230,490 | |
| | | | | | | | | | | | |
| | | | | | | 633,040 | | | | 852,731 | |
| | | | | | | | | | | | |
| |
| | | | Latin America — 2.0% | |
| | 37,415,054 | | | LIME† | | | 499,070 | | | | 157,089 | |
| | 3,300 | | | Oi SA, ADR† | | | 321,405 | | | | 10,527 | |
| | 90,000 | | | Telecom Argentina SA, ADR | | | 341,454 | | | | 1,741,500 | |
| | 16,705 | | | Telefonica Brasil SA | | | 345,912 | | | | 250,682 | |
| | 6,221 | | | Telefonica Brasil SA, ADR | | | 44,430 | | | | 109,987 | |
| | 2,566 | | | Telefonica Brasil SA, Preference | | | 71,247 | | | | 45,225 | |
| | 6,714 | | | Telefonica SA | | | 113,227 | | | | 96,842 | |
| | | | | | | | | | | | |
| | | | | | | 1,736,745 | | | | 2,411,852 | |
| | | | | | | | | | | | |
| |
| | | | North America — 21.3% | |
| | 57,500 | | | AT&T Inc. | | | 1,707,891 | | | | 1,931,425 | |
| | 23,000 | | | Atlantic Tele-Network Inc. | | | 74,111 | | | | 1,554,570 | |
| | 28,000 | | | CenturyLink Inc. | | | 857,809 | | | | 1,108,240 | |
| | 785,000 | | | Cincinnati Bell Inc.† | | | 3,546,260 | | | | 2,504,150 | |
| | 85,000 | | | EarthLink Holdings Corp. | | | 452,416 | | | | 373,150 | |
| | 3,721 | | | Equinix Inc. | | | 314,651 | | | | 843,662 | |
| | 40,000 | | | Frontier Communications Corp. | | | 169,744 | | | | 266,800 | |
| | 50,000 | | | General Communication Inc., Cl. A† | | | 225,330 | | | | 687,500 | |
| | 55,000 | | | Internap Corp.† | | | 320,300 | | | | 437,800 | |
| | 73,400 | | | Level 3 Communications Inc.† | | | 1,994,385 | | | | 3,624,492 | |
| | 9,000 | | | Lumos Networks Corp. | | | 145,349 | | | | 151,380 | |
| | 28,600 | | | New ULM Telecom Inc. | | | 339,090 | | | | 208,780 | |
| | 37,000 | | | Shenandoah Telecommunications Co. | | | 209,718 | | | | 1,156,250 | |
| | 128,514 | | | Telephone & Data Systems Inc. | | | 2,942,673 | | | | 3,244,979 | |
| | 60,500 | | | TELUS Corp. | | | 693,465 | | | | 2,181,395 | |
| | 105,000 | | | Verizon Communications Inc. | | | 3,641,240 | | | | 4,911,900 | |
| | 24,000 | | | Windstream Holdings Inc. | | | 288,818 | | | | 197,760 | |
| | | | | | | | | | | | |
| | | | | | | 17,923,250 | | | | 25,384,233 | |
| | | | | | | | | | | | |
| | | |
| | | | TOTAL DIVERSIFIED TELECOM- MUNICATIONS SERVICES | | | 41,832,773 | | | | 53,443,370 | |
| | | | | | | | | | | | |
| | | | OTHER — 28.8% | |
| | | | Africa/Middle East — 0.0% | |
| | 1,008 | | | Kingdom Financial Holdings Ltd., Cl. L† | | | 0 | | | | 0 | |
| | 504 | | | Meikles Ltd.† | | | 203 | | | | 78 | |
| | | | | | | | | | | | |
| | | | | | | 203 | | | | 78 | |
| | | | | | | | | | | | |
| |
| | | | Asia/Pacific — 0.7% | |
| | 68,000 | | | C.P. Pokphand Co. Ltd., ADR | | | 52,895 | | | | 182,036 | |
See accompanying notes to financial statements.
6
The GAMCO Global Telecommunications Fund
Schedule of Investments (Continued) — December 31, 2014
| | | | | | | | | | | | |
Shares | | | | | Cost | | | Market
Value | |
| |
| | | | COMMON STOCKS (Continued) | |
| | | | OTHER (Continued) | |
| | | | Asia/Pacific (Continued) | |
| | 11,500 | | | CJ Hellovision Co. Ltd. | | $ | 141,436 | | | $ | 101,906 | |
| | 250,000 | | | Dagang NeXchange Berhad† | | | 105,104 | | | | 18,233 | |
| | 40,000 | | | Hutchison Whampoa Ltd. | | | 396,391 | | | | 460,369 | |
| | 15,000 | | | SKY Perfect JSAT Holdings Inc. | | | 69,205 | | | | 89,539 | |
| | | | | | | | | | | | |
| | | | | | | 765,031 | | | | 852,083 | |
| | | | | | | | | | | | |
| |
| | | | Europe — 7.7% | |
| | 34,500 | | | CDON Group AB† | | | 165,857 | | | | 77,448 | |
| | 17,250 | | | CDON Group AB, BTA† | | | 29,782 | | | | 38,945 | |
| | 56,000 | | | G4S plc | | | 0 | | | | 242,556 | |
| | 56,000 | | | GN Store Nord A/S | | | 380,893 | | | | 1,226,560 | |
| | 1,224 | | | Gusbourne plc† | | | 1,210 | | | | 1,269 | |
| | 20,000 | | | InterXion Holding NV† | | | 282,187 | | | | 546,800 | |
| | 4,600 | | | Kinnevik Investment AB, Cl. A | | | 116,764 | | | | 152,831 | |
| | 78,000 | | | Kinnevik Investment AB, Cl. B | | | 1,947,375 | | | | 2,554,457 | |
| | 14,000 | | | Liberty Global plc, Cl. A† | | | 156,201 | | | | 702,870 | |
| | 61,500 | | | Liberty Global plc, Cl. C† | | | 619,054 | | | | 2,971,065 | |
| | 50,228 | | | NOS SGPS | | | 356,129 | | | | 318,236 | |
| | 18,035 | | | PostNL NV, ADR† | | | 215,936 | | | | 67,271 | |
| | 13,000 | | | Telecity Group plc | | | 149,186 | | | | 163,006 | |
| | 21,000 | | | Telegraaf Media Groep NV† | | | 453,308 | | | | 154,754 | |
| | 12,000 | | | Waterloo Investment Holdings Ltd.† | | | 1,432 | | | | 748 | |
| | | | | | | | | | | | |
| | | | | | | 4,875,314 | | | | 9,218,816 | |
| | | | | | | | | | | | |
| |
| | | | Japan — 0.3% | |
| | 72,000 | | | Furukawa Electric Co. Ltd. | | | 350,157 | | | | 120,821 | |
| | 15,000 | | | Tokyo Broadcasting System Holdings Inc. | | | 237,742 | | | | 177,826 | |
| | | | | | | | | | | | |
| | | | | | | 587,899 | | | | 298,647 | |
| | | | | | | | | | | | |
| |
| | | | Latin America — 0.4% | |
| | 15,000 | | | Grupo Televisa SAB, ADR | | | 353,331 | | | | 510,900 | |
| | 900 | | | Shellshock Ltd.† | | | 521 | | | | 954 | |
| | | | | | | | | | | | |
| | | | | | | 353,852 | | | | 511,854 | |
| | | | | | | | | | | | |
| |
| | | | North America — 19.7% | |
| | 18,000 | | | AMC Networks Inc., Cl. A† | | | 499,530 | | | | 1,147,860 | |
| | 1,200 | | | Ascent Capital Group Inc., Cl. A† | | | 20,324 | | | | 63,516 | |
| | 118,500 | | | Cablevision Systems Corp., Cl. A | | | 1,773,357 | | | | 2,445,840 | |
| | 7,400 | | | Cogeco Inc. | | | 144,351 | | | | 389,172 | |
| | 12,000 | | | Comcast Corp., Cl. A, Special | | | 235,713 | | | | 690,780 | |
| | 4,000 | | | Convergys Corp. | | | 53,716 | | | | 81,480 | |
| | 16,500 | | | CyrusOne Inc. | | | 308,323 | | | | 454,575 | |
| | 69,500 | | | DIRECTV† | | | 1,785,484 | | | | 6,025,650 | |
| | 68,000 | | | DISH Network Corp., Cl. A† | | | 1,519,117 | | | | 4,956,520 | |
| | 11,000 | | | EchoStar Corp., Cl. A† | | | 311,530 | | | | 577,500 | |
| | 34,000 | | | Gogo Inc.† | | | 627,513 | | | | 562,020 | |
| | 160 | | | Google Inc., Cl. A† | | | 33,265 | | | | 84,906 | |
| | 3,125 | | | Liberty Broadband Corp., Cl. A† | | | 9,703 | | | | 156,531 | |
| | 3,750 | | | Liberty Broadband Corp., Cl. C† | | | 13,307 | | | | 186,825 | |
| | | | | | | | | | | | |
Shares | | | | | Cost | | | Market Value | |
| | | |
| | 12,000 | | | Liberty Interactive Corp., Cl. A† | | $ | 116,973 | | | $ | 353,040 | |
| | 12,500 | | | Liberty Media Corp., Cl. A† | | | 29,110 | | | | 440,875 | |
| | 15,000 | | | Liberty Media Corp., Cl. C† | | | 42,140 | | | | 525,450 | |
| | 1,706 | | | Liberty Ventures, Cl. A† | | | 20,642 | | | | 64,350 | |
| | 4,000 | | | Rackspace Hosting Inc.† | | | 131,788 | | | | 187,240 | |
| | 3,000 | | | SJW Corp. | | | 46,068 | | | | 96,360 | |
| | 3,000 | | | Starz, Cl. A† | | | 4,889 | | | | 89,100 | |
| | 18,000 | | | The Madison Square Garden Co., Cl. A† | | | 395,985 | | | | 1,354,680 | |
| | 2,500 | | | Time Warner Cable Inc. | | | 215,560 | | | | 380,150 | |
| | 4,000 | | | Time Warner Inc. | | | 124,256 | | | | 341,680 | |
| | 2,000 | | | Twenty-First Century Fox Inc., Cl. B | | | 18,524 | | | | 73,780 | |
| | 34,000 | | | Yahoo! Inc.† | | | 749,484 | | | | 1,717,340 | |
| | | | | | | | | | | | |
| | | | | | | 9,230,652 | | | | 23,447,220 | |
| | | | | | | | | | | | |
| | | | TOTAL OTHER | | | 15,812,951 | | | | 34,328,698 | |
| | | | | | | | | | | | |
| |
| | | | WIRELESS TELECOMMUNICATIONS SERVICES — 27.3% | |
| | | | Africa/Middle East — 0.9% | |
| | 40,000 | | | Econet Wireless Zimbabwe Ltd. | | | 20,147 | | | | 24,000 | |
| | 175,000 | | | Global Telecom Holding, GDR† | | | 989,364 | | | | 498,750 | |
| | 20,000 | | | MTN Group Ltd. | | | 312,992 | | | | 382,806 | |
| | 175,000 | | | Orascom Telecom Media and Technology Holding SAE, GDR†(a) | | | 384,753 | | | | 152,250 | |
| | | | | | | | | | | | |
| | | | | | | 1,707,256 | | | | 1,057,806 | |
| | | | | | | | | | | | |
| |
| | | | Asia/Pacific — 3.2% | |
| | 120,000 | | | Axiata Group Berhad | | | 226,659 | | | | 241,956 | |
| | 39,000 | | | China Mobile Ltd., ADR | | | 469,468 | | | | 2,293,980 | |
| | 41,500 | | | China Unicom Hong Kong Ltd., ADR | | | 281,456 | | | | 558,175 | |
| | 666 | | | Hutchison Telecommunications Hong Kong Holdings Ltd. | | | 63 | | | | 282 | |
| | 240,000 | | | PT Indosat Tbk† | | | 38,553 | | | | 78,482 | |
| | 22,000 | | | SK Telecom Co. Ltd., ADR | | | 424,743 | | | | 594,220 | |
| | 40,000 | | | TIME dotCom Berhad† | | | 81,175 | | | | 55,827 | |
| | | | | | | | | | | | |
| | | | | | | 1,522,117 | | | | 3,822,922 | |
| | | | | | | | | | | | |
| |
| | | | Europe — 7.3% | |
| | 19,500 | | | Bouygues SA | | | 565,376 | | | | 707,409 | |
| | 950,000 | | | Cable & Wireless Communications plc | | | 566,695 | | | | 735,006 | |
| | 6,000 | | | MegaFon OAO, GDR | | | 161,802 | | | | 82,680 | |
| | 28,000 | | | Millicom International Cellular SA, SDR | | | 2,244,433 | | | | 2,092,219 | |
| | 10,500 | | | Mobile TeleSystems OJSC, ADR | | | 176,038 | | | | 75,390 | |
| | 106,000 | | | Turkcell Iletisim Hizmetleri A/S, ADR† | | | 2,057,688 | | | | 1,602,720 | |
| | 84,000 | | | Vivendi SA | | | 2,289,992 | | | | 2,103,024 | |
| | 39,455 | | | Vodafone Group plc, ADR | | | 1,815,538 | | | | 1,348,177 | |
| | | | | | | | | | | | |
| | | | | | | 9,877,562 | | | | 8,746,625 | |
| | | | | | | | | | | | |
See accompanying notes to financial statements.
7
The GAMCO Global Telecommunications Fund
Schedule of Investments (Continued) — December 31, 2014
| | | | | | | | | | | | |
Shares | | | | | Cost | | | Market Value | |
| | | | COMMON STOCKS (Continued) | |
| | | | WIRELESS TELECOMMUNICATIONS SERVICES (Continued) | |
| | | | Japan — 4.5% | |
| | 69,000 | | | KDDI Corp. | | $ | 1,544,215 | | | $ | 4,399,340 | |
| | 65,000 | | | NTT DoCoMo Inc. | | | 1,033,152 | | | | 959,426 | |
| | | | | | | | | | | | |
| | | | | | | 2,577,367 | | | | 5,358,766 | |
| | | | | | | | | | | | |
| |
| | | | Latin America — 3.9% | |
| | 160,000 | | | America Movil SAB de CV, Cl. L, ADR | | | 579,759 | | | | 3,548,800 | |
| | 50,000 | | | NII Holdings Inc.† | | | 19,113 | | | | 925 | |
| | 150,000 | | | Tim Participacoes SA | | | 616,034 | | | | 664,736 | |
| | 18,156 | | | Tim Participacoes SA, ADR | | | 397,815 | | | | 403,245 | |
| | | | | | | | | | | | |
| | | | | | | 1,612,721 | | | | 4,617,706 | |
| | | | | | | | | | | | |
| |
| | | | North America — 7.5% | |
| | 25,000 | | | NTELOS Holdings Corp. | | | 113,267 | | | | 104,750 | |
| | 70,000 | | | Rogers Communications Inc., Cl. B | | | 302,612 | | | | 2,720,200 | |
| | 78,226 | | | Sprint Corp.† | | | 517,985 | | | | 324,638 | |
| | 44,000 | | | T-Mobile US Inc.† | | | 802,779 | | | | 1,185,360 | |
| | 115,200 | | | United States Cellular Corp.† | | | 5,452,275 | | | | 4,588,416 | |
| | | | | | | | | | | | |
| | | | | | | 7,188,918 | | | | 8,923,364 | |
| | | | | | | | | | | | |
| | | |
| | | | TOTAL WIRELESS TELECOMMUNICATIONS SERVICES | | | 24,485,941 | | | | 32,527,189 | |
| | | | | | | | | | | | |
| | | | TOTAL COMMON STOCKS | | | 82,131,665 | | | | 120,299,257 | |
| | | | | | | | | | | | |
| |
| | | | RIGHTS — 0.0% | |
| | | | OTHER — 0.0% | |
| | | | North America — 0.0% | |
| | 1,375 | | | Liberty Broadband Corp., expire 01/09/15† | | | 0 | | | | 13,062 | |
| | | | | | | | | | | | |
| |
| | | | WIRELESS TELECOMMUNICATIONS SERVICES — 0.0% | |
| | | | North America — 0.0% | |
| | 2,300 | | | Nextwave Wireless Inc., CPR† | | | 0 | | | | 106 | |
| | | | | | | | | | | | |
| | | |
| | | | TOTAL RIGHTS | | | 0 | | | | 13,168 | |
| | | | | | | | | | | | |
| |
| | | | WARRANTS — 0.7% | |
| | | | WIRELESS TELECOMMUNICATIONS SERVICES — 0.7% | |
| | | | Asia/Pacific — 0.7% | |
| | 151,500 | | | Bharti Airtel Ltd., expire 08/04/16†(a) | | | 723,367 | | | | 847,572 | |
| | | | | | | | | | | | |
| | | | | | | | | | | | |
Principal
Amount | | | | | Cost | | | Market Value | |
| | | | U.S. GOVERNMENT OBLIGATIONS — 3.0% | |
| | $3,612,000 | | | U.S. Treasury Bills, 0.060%††, 05/07/15 | | $ | 3,611,241 | | | $ | 3,611,498 | |
| | | | | | | | | | | | |
| | | | TOTAL INVESTMENTS — 104.6% | | $ | 86,466,273 | | | | 124,771,495 | |
| | | | | | | | | | | | |
| | | | Other Assets and Liabilities (Net) — (4.6)% | | | | (5,511,581 | ) |
| | | | | | | | | | | | |
| | | | NET ASSETS — 100.0% | | | $ | 119,259,914 | |
| | | | | | | | | | | | |
| (a) | Security exempt from registration under Rule 144A of the Securities Act of 1933, as amended. These securities may be resold in transactions exempt from registration, normally to qualified institutional buyers. At December 31, 2014, the market value of Rule 144A securities amounted to $1,045,883 or 0.88% of net assets. |
| (c) | At December 31, 2014, the Fund held an investment in a restricted security amounting to $242 or 0.00% of net assets, which was valued under methods approved by the Board of Directors as follows: |
| | | | | | | | | | | | |
Acquisition
Shares | | | Issuer | | Acquisition
Date | | Acquisition
Cost | | 12/31/14
Carrying
Value
Per
Share | |
| | 8,075 | | | TT&T Public Co. Ltd., GDR | | 03/31/94 | | $100,542 | | $ | 0.0300 | |
| † | Non-income producing security. |
| †† | Represents annualized yield at date of purchase. |
| ADR | American Depositary Receipt |
| CPR | Contingent Payment Right |
| GDR | Global Depositary Receipt |
| JSFC | Joint Stock Financial Corporation |
| OJSC | Open Joint Stock Company |
| SDR | Swedish Depositary Receipt |
| | | | | | | | |
Geographic Diversification | | %of
Market
Value | | | Market Value | |
| North America | | | 49.2 | % | | $ | 61,379,483 | |
Europe | | | 28.9 | | | | 36,026,173 | |
Asia/Pacific | | | 9.5 | | | | 11,832,317 | |
Latin America | | | 6.0 | | | | 7,541,412 | |
Japan | | | 5.2 | | | | 6,510,144 | |
Africa/Middle East | | | 1.2 | | | | 1,481,966 | |
| | | | | | | | |
| | | 100.0 | % | | $ | 124,771,495 | |
| | | | | | | | |
See accompanying notes to financial statements.
8
The GAMCO Global Telecommunications Fund
Statement of Assets and Liabilities
December 31, 2014
| | | | |
Assets: | | | | |
Investments, at value (cost $86,466,273) | | $ | 124,771,495 | |
Cash | | | 14,589 | |
Deposit at brokers | | | 684 | |
Receivable for Fund shares sold | | | 40 | |
Dividends receivable | | | 170,200 | |
Prepaid expenses | | | 19,000 | |
| | | | |
Total Assets | | | 124,976,008 | |
| | | | |
Liabilities: | | | | |
Payable for Fund shares redeemed | | | 5,455,491 | |
Payable for investment advisory fees | | | 107,368 | |
Payable for distribution fees | | | 26,883 | |
Payable for accounting fees | | | 11,250 | |
Deferred tax liabilities | | | 25,320 | |
Other accrued expenses | | | 89,782 | |
| | | | |
Total Liabilities | | | 5,716,094 | |
| | | | |
Net Assets | | | | |
(applicable to 5,048,318 shares outstanding) | | $ | 119,259,914 | |
| | | | |
Net Assets Consist of: | | | | |
Paid-in capital | | $ | 81,666,491 | |
Accumulated distributions in excess of net investment income | | | (254,957 | ) |
Accumulated distributions in excess of net realized gain on investments and foreign currency transactions | | | (428,235 | ) |
Net unrealized appreciation on investments (a) . | | | 38,279,902 | |
Net unrealized depreciation on foreign currency translations | | | (3,287 | ) |
| | | | |
Net Assets | | $ | 119,259,914 | |
| | | | |
| | | | |
| |
Shares of Capital Stock, each at $0.001 par value: | | | | |
Class AAA: | | | | |
Net Asset Value, offering, and redemption price per share ($115,860,115 ÷ 4,903,572 shares outstanding; 150,000,000 shares authorized) | | $ | 23.63 | |
| | | | |
Class A: | | | | |
Net Asset Value and redemption price per share ($1,113,603 ÷ 47,164 shares outstanding; 50,000,000 shares authorized) | | $ | 23.61 | |
| | | | |
Maximum offering price per share (NAV ÷ 0.9425, based on maximum sales charge of 5.75% of the offering price) | | $ | 25.05 | |
| | | | |
Class C: | | | | |
Net Asset Value and offering price per share ($620,871 ÷ 27,020 shares outstanding; 50,000,000 shares authorized) | | $ | 22.98 | (b) |
| | | | |
Class I: | | | | |
Net Asset Value, offering, and redemption price per share ($1,665,325 ÷ 70,562 shares outstanding; 50,000,000 shares authorized) | | $ | 23.60 | |
| | | | |
| (a) | Includes deferred Thailand capital gains tax of $25,320. |
| (b) | Redemption price varies based on the length of time held. |
Statement of Operations
For the Year Ended December 31, 2014
| | | | | |
Investment Income: | | | | | |
Dividends (net of foreign withholding taxes of | | | | | |
$226,444) | | | $ | 4,009,190 | |
Interest | | | | 3,599 | |
| | | | | |
Total Investment Income | | | | 4,012,789 | |
| | | | | |
Expenses: | | | | | |
Investment advisory fees | | | | 1,321,494 | |
Distribution fees - Class AAA | | | | 322,020 | |
Distribution fees - Class A | | | | 3,150 | |
Distribution fees - Class C | | | | 7,130 | |
Shareholder services fees | | | | 139,660 | |
Shareholder communications expenses | | | | 77,082 | |
Custodian fees | | | | 71,928 | |
Accounting fees | | | | 45,000 | |
Registration expenses | | | | 44,559 | |
Directors’ fees | | | | 39,743 | |
Legal and audit fees | | | | 37,275 | |
Interest expense | | | | 2,039 | |
Miscellaneous expenses | | | | 20,770 | |
| | | | | |
Total Expenses | | | | 2,131,850 | |
| | | | | |
Net Investment Income | | | | 1,880,939 | |
| | | | | |
Net Realized and Unrealized Gain/(Loss) on Investments and Foreign Currency: | | | | | |
Net realized gain on investments | | | | 4,884,737 | |
Net realized loss on foreign currency transactions | | | | (8,717 | ) |
| | | | | |
Net realized gain on investments and foreign currency transactions | | | | 4,876,020 | |
| | | | | |
Net change in unrealized appreciation/depreciation: | | | | | |
on investments (a) | | | | (9,555,110 | ) |
on foreign currency translations | | | | (4,272 | ) |
| | | | | |
Net change in unrealized appreciation on investments and foreign currency translations | | | | (9,559,382 | ) |
| | | | | |
Net Realized and Unrealized Gain/(Loss) on Investments and Foreign Currency | | | | (4,683,362 | ) |
| | | | | |
Net Decrease in Net Assets Resulting from Operations | | | $ | (2,802,423 | ) |
| | | | | |
See accompanying notes to financial statements.
9
The GAMCO Global Telecommunications Fund
Statement of Changes in Net Assets
| | | | | | | | |
| | | Year Ended
December 31, 2014 | | | Year Ended
December 31, 2013 | |
Operations: | | | | | | | | |
Net investment income | | $ | 1,880,939 | | | $ | 2,117,349 | |
Net realized gain on investments and foreign currency transactions | | | 4,876,020 | | | | 3,168,539 | |
Net change in unrealized appreciation on investments and foreign currency translations | | | (9,559,382 | ) | | | 23,228,528 | |
| | | | | | | | |
Net Increase/(Decrease) in Net Assets Resulting from Operations | | | (2,802,423 | ) | | | 28,514,416 | |
| | | | | | | | |
Distributions to Shareholders: | | | | | | | | |
Net investment income | | | | | | | | |
Class AAA | | | (1,873,318 | ) | | | (1,997,741 | ) |
Class A | | | (17,175 | ) | | | (24,843 | ) |
Class C | | | (4,514 | ) | | | (5,520 | ) |
Class I | | | (30,082 | ) | | | (30,326 | ) |
| | | | | | | | |
| | | (1,925,089 | ) | | | (2,058,430 | ) |
| | | | | | | | |
Net realized gain | | | | | | | | |
Class AAA | | | (2,652,047 | ) | | | — | |
Class A | | | (24,549 | ) | | | — | |
Class C | | | (14,064 | ) | | | — | |
Class I | | | (36,335 | ) | | | — | |
| | | | | | | | |
| | | (2,726,995 | ) | | | — | |
| | | | | | | | |
Total Distributions to Shareholders | | | (4,652,084 | ) | | | (2,058,430 | ) |
| | | | | | | | |
| | |
Capital Share Transactions: | | | | | | | | |
Class AAA | | | (14,414,703 | ) | | | (5,880,360 | ) |
Class A | | | (507,286 | ) | | | 101,754 | |
Class C | | | (157,933 | ) | | | (178,963 | ) |
Class I | | | (54,318 | ) | | | 461,049 | |
| | | | | | | | |
Net Decrease in Net Assets from Capital Share Transactions | | | (15,134,240 | ) | | | (5,496,520 | ) |
| | | | | | | | |
| | |
Redemption Fees | | | 1,094 | | | | 70 | |
| | | | | | | | |
Net Increase/(Decrease) in Net Assets | | | (22,587,653 | ) | | | 20,959,536 | |
Net Assets: | | | | | | | | |
Beginning of year | | | 141,847,567 | | | | 120,888,031 | |
| | | | | | | | |
End of year (including undistributed net investment income of $0 and $0, respectively) | | $ | 119,259,914 | | | $ | 141,847,567 | |
| | | | | | | | |
See accompanying notes to financial statements.
10
The GAMCO Global Telecommunications Fund
Financial Highlights
Selected data for a share of capital stock outstanding throughout each year:
| | | | | | | | | | | | | | | | | | | | | | | | | | | | | | | | | | | | | | | | | | | | | | | | |
| | | | | | Income (Loss)
from Investment Operations | | | Distributions | | | | | | | | | | | | | | Ratios to Average Net Assets
Supplemental Data |
Year Ended
December 31 | | Net Asset
Value,
Beginning
of Year | | | Net
Investment
Income(a) | | | Net
Realized
and
Unrealized
Gain (Loss)
on
Investments | | | Total from
Investment
Operations | | | Net
Investment
Income | | | Net
Realized
Gain | | | Total
Distributions | | | Redemption
Fees(a)(b) | | | Net Asset
Value,
End of
Year | | | Total
Return† | | Net Assets
End of Year
(in 000’s) | | | Net
Investment
Income | | Operating
Expenses | | Portfolio
Turnover
Rate |
Class AAA | | | | | | | | | | | | | | | | | | | | | | | | | | | | | | | | | | | | | | | | | | | | | | | | |
2014 | | | $24.85 | | | | $0.35 | | | | $(0.66 | ) | | | $(0.31 | ) | | | $(0.38) | | | | $(0.53) | | | | $(0.91) | | | | $0.00 | | | | $23.63 | | | (1.3)% | | | $115,860 | | | 1.43% | | 1.61% | | 3% |
2013 | | | 20.20 | | | | 0.37 | | | | 4.65 | | | | 5.02 | | | | (0.37) | | | | — | | | | (0.37) | | | | 0.00 | | | | 24.85 | | | 24.9 | | | 137,545 | | | 1.66 | | 1.64 | | 3 |
2012 | | | 18.60 | | | | 0.33 | | | | 1.64 | | | | 1.97 | | | | (0.37) | | | | — | | | | (0.37) | | | | 0.00 | | | | 20.20 | | | 10.6 | | | 117,767 | | | 1.71 | | 1.70 | | 2 |
2011 | | | 20.43 | | | | 0.41 | | | | (1.79 | ) | | | (1.38 | ) | | | (0.45) | | | | — | | | | (0.45) | | | | 0.00 | | | | 18.60 | | | (6.7) | | | 123,919 | | | 1.99 | | 1.61 | | 5 |
2010 | | | 18.71 | | | | 0.34 | | | | 1.75 | | | | 2.09 | | | | (0.37) | | | | — | | | | (0.37) | | | | (0.00 | ) | | | 20.43 | | | 11.2 | | | 154,280 | | | 1.76 | | 1.62 | | 6 |
Class A | | | | | | | | | | | | | | | | | | | | | | | | | | | | | | | | | | | | | | | | | | | | | | | | |
2014 | | | $24.83 | | | | $0.39 | | | | $(0.70 | ) | | | $(0.31 | ) | | | $(0.38) | | | | $(0.53) | | | | $(0.91) | | | | $0.00 | | | | $23.61 | | | (1.3)% | | | $1,114 | | | 1.53% | | 1.61% | | 3% |
2013 | | | 20.19 | | | | 0.36 | | | | 4.65 | | | | 5.01 | | | | (0.37) | | | | — | | | | (0.37) | | | | 0.00 | | | | 24.83 | | | 24.8 | | | 1,678 | | | 1.61 | | 1.64 | | 3 |
2012 | | | 18.59 | | | | 0.32 | | | | 1.65 | | | | 1.97 | | | | (0.37) | | | | — | | | | (0.37) | | | | 0.00 | | | | 20.19 | | | 10.6 | | | 1,290 | | | 1.65 | | 1.70 | | 2 |
2011 | | | 20.42 | | | | 0.45 | | | | (1.84 | ) | | | (1.39 | ) | | | (0.44) | | | | — | | | | (0.44) | | | | 0.00 | | | | 18.59 | | | (6.8) | | | 1,374 | | | 2.17 | | 1.61 | | 5 |
2010 | | | 18.70 | | | | 0.36 | | | | 1.73 | | | | 2.09 | | | | (0.37) | | | | — | | | | (0.37) | | | | (0.00 | ) | | | 20.42 | | | 11.2 | | | 1,901 | | | 1.87 | | 1.62 | | 6 |
Class C | | | | | | | | | | | | | | | | | | | | | | | | | | | | | | | | | | | | | | | | | | | | | | | | |
2014 | | | $24.17 | | | | $0.19 | | | | $(0.67 | ) | | | $(0.48 | ) | | | $(0.18) | | | | $(0.53) | | | | $(0.71) | | | | $0.00 | | | | $22.98 | | | (2.0)% | | | $621 | | | 0.76% | | 2.36% | | 3% |
2013 | | | 19.64 | | | | 0.20 | | | | 4.50 | | | | 4.70 | | | | (0.17) | | | | — | | | | (0.17) | | | | 0.00 | | | | 24.17 | | | 23.9 | | | 814 | | | 0.92 | | 2.39 | | 3 |
2012 | | | 18.10 | | | | 0.19 | | | | 1.58 | | | | 1.77 | | | | (0.23) | | | | — | | | | (0.23) | | | | 0.00 | | | | 19.64 | | | 9.8 | | | 815 | | | 0.99 | | 2.45 | | 2 |
2011 | | | 19.88 | | | | 0.25 | | | | (1.73 | ) | | | (1.48 | ) | | | (0.30) | | | | — | | | | (0.30) | | | | 0.00 | | | | 18.10 | | | (7.4) | | | 843 | | | 1.27 | | 2.36 | | 5 |
2010 | | | 18.25 | | | | 0.19 | | | | 1.69 | | | | 1.88 | | | | (0.25) | | | | — | | | | (0.25) | | | | (0.00 | ) | | | 19.88 | | | 10.3 | | | 890 | | | 1.04 | | 2.37 | | 6 |
Class I | | | | | | | | | | | | | | | | | | | | | | | | | | | | | | | | | | | | | | | | | | | | | | | | |
2014 | | | $24.83 | | | | $0.37 | | | | $(0.62 | ) | | | $(0.25 | ) | | | $(0.45) | | | | $(0.53) | | | | $(0.98) | | | | $0.00 | | | | $23.60 | | | (1.1)% | | | $1,665 | | | 1.45% | | 1.36% | | 3% |
2013 | | | 20.18 | | | | 0.43 | | | | 4.64 | | | | 5.07 | | | | (0.42) | | | | — | | | | (0.42) | | | | 0.00 | | | | 24.83 | | | 25.2 | | | 1,811 | | | 1.94 | | 1.39 | | 3 |
2012 | | | 18.58 | | | | 0.39 | | | | 1.63 | | | | 2.02 | | | | (0.42) | | | | — | | | | (0.42) | | | | 0.00 | | | | 20.18 | | | 10.9 | | | 1,016 | | | 1.96 | | 1.45 | | 2 |
2011 | | | 20.41 | | | | 0.44 | | | | (1.77 | ) | | | (1.33 | ) | | | (0.50) | | | | — | | | | (0.50) | | | | 0.00 | | | | 18.58 | | | (6.5) | | | 504 | | | 2.17 | | 1.36 | | 5 |
2010 | | | 18.70 | | | | 0.39 | | | | 1.74 | | | | 2.13 | | | | (0.42) | | | | — | | | | (0.42) | | | | (0.00 | ) | | | 20.41 | | | 11.4 | | | 411 | | | 2.06 | | 1.37 | | 6 |
| † | Total return represents aggregate total return of a hypothetical $1,000 investment at the beginning of the year and sold at the end of the year including reinvestment of distributions and does not reflect applicable sales charges. |
| (a) | Per share amounts have been calculated using the average shares outstanding method. |
| (b) | Amount represents less than $0.005 per share. |
See accompanying notes to financial statements.
11
The GAMCO Global Telecommunications Fund
Notes to Financial Statements
1. Organization. The GAMCO Global Telecommunications Fund, a series of GAMCO Global Series Funds, Inc. (the “Corporation”), was incorporated on July 16, 1993 in Maryland. The Fund is a non-diversified open-end management investment company registered under the Investment Company Act of 1940, as amended (the “1940 Act”), and one of four separately managed portfolios (collectively, the “Portfolios”) of the Corporation. The Fund’s primary objective is capital appreciation. The Fund commenced investment operations on November 1, 1993.
The Fund may invest a high percentage of its assets in specific sectors of the market in order to achieve a potentially greater investment return. As a result, the Fund may be more susceptible to economic, political, and regulatory developments in a particular sector of the market, positive or negative, and may experience increased volatility to the Fund’s NAV and a magnified effect in its total return.
2. Significant Accounting Policies. As an investment company, the Fund follows the investment company accounting and reporting guidance, which is part of U.S. generally accepted accounting principles (“GAAP”) that may require the use of management estimates and assumptions in the preparation of its financial statements. Actual results could differ from those estimates. The following is a summary of significant accounting policies followed by the Fund in the preparation of its financial statements.
Security Valuation. Portfolio securities listed or traded on a nationally recognized securities exchange or traded in the U.S. over-the-counter market for which market quotations are readily available are valued at the last quoted sale price or a market’s official closing price as of the close of business on the day the securities are being valued. If there were no sales that day, the security is valued at the average of the closing bid and asked prices or, if there were no asked prices quoted on that day, then the security is valued at the closing bid price on that day. If no bid or asked prices are quoted on such day, the security is valued at the most recently available price or, if the Board of Directors (the “Board”) so determines, by such other method as the Board shall determine in good faith to reflect its fair market value. Portfolio securities traded on more than one national securities exchange or market are valued according to the broadest and most representative market, as determined by Gabelli Funds, LLC (the “Adviser”).
Portfolio securities primarily traded on a foreign market are generally valued at the preceding closing values of such securities on the relevant market, but may be fair valued pursuant to procedures established by the Board if market conditions change significantly after the close of the foreign market, but prior to the close of business on the day the securities are being valued. Debt instruments with remaining maturities of sixty days or less that are not credit impaired are valued at amortized cost, unless the Board determines such amount does not reflect the securities’ fair value, in which case these securities will be fair valued as determined by the Board. Debt instruments having a maturity greater than sixty days for which market quotations are readily available are valued at the average of the latest bid and asked prices. If there were no asked prices quoted on such day, the security is valued using the closing bid price. U.S. government obligations with maturities greater than sixty days are normally valued using a model that incorporates market observable data such as reported sales of similar securities, broker quotes, yields, bids, offers, and reference data. Certain securities are valued principally using dealer quotations.
Securities and assets for which market quotations are not readily available are fair valued as determined by the Board. Fair valuation methodologies and procedures may include, but are not limited to: analysis and review of available financial and non-financial information about the company; comparisons with the valuation and
12
The GAMCO Global Telecommunications Fund
Notes to Financial Statements (Continued)
changes in valuation of similar securities, including a comparison of foreign securities with the equivalent U.S. dollar value American Depositary Receipt securities at the close of the U.S. exchange; and evaluation of any other information that could be indicative of the value of the security.
The inputs and valuation techniques used to measure fair value of the Fund’s investments are summarized into three levels as described in the hierarchy below:
| | — | | Level 1 — quoted prices in active markets for identical securities; |
| | — | | Level 2 — other significant observable inputs (including quoted prices for similar securities, interest rates, prepayment speeds, credit risk, etc.); and |
| | — | | Level 3 — significant unobservable inputs (including the Board’s determinations as to the fair value of investments). |
A financial instrument’s level within the fair value hierarchy is based on the lowest level of any input both individually and in the aggregate that is significant to the fair value measurement. The inputs or methodology used for valuing securities are not necessarily an indication of the risk associated with investing in those securities. The summary of the Fund’s investments in securities by inputs used to value the Fund’s investments as of December 31, 2014 is as follows:
| | | | | | | | | | | | | | | | |
| | | Valuation Inputs | | | | |
| | | Level 1 | | | Level 2 Other Significant | | | Level 3 Significant | | | Total Market Value | |
| | | Quoted Prices | | | Observable Inputs | | | Unobservable Inputs | | | at 12/31/14 | |
INVESTMENTS IN SECURITIES: | | | | | | | | | | | | | | | | |
ASSETS (Market Value): | | | | | | | | | | | | | | | | |
Common Stocks: | | | | | | | | | | | | | | | | |
DIVERSIFIED TELECOMMUNICATIONS | | | | | | | | | | | | | | | | |
SERVICES | | | | | | | | | | | | | | | | |
Asia/Pacific | | | $ 5,658,334 | | | | $ 651,164 | | | | $ 242 | | | | $ 6,309,740 | |
Other Regions (a) | | | 47,133,630 | | | | — | | | | — | | | | 47,133,630 | |
OTHER | | | | | | | | | | | | | | | | |
Africa/Middle East | | | 78 | | | | — | | | | 0 | | | | 78 | |
Europe | | | 9,218,068 | | | | — | | | | 748 | | | | 9,218,816 | |
Other Regions (a) | | | 25,109,804 | | | | — | | | | — | | | | 25,109,804 | |
WIRELESS TELECOMMUNICATIONS | | | | | | | | | | | | | | | | |
SERVICES | | | | | | | | | | | | | | | | |
All Regions (a) | | | 32,527,189 | | | | — | | | | — | | | | 32,527,189 | |
| |
Total Common Stocks | | | 119,647,103 | | | | 651,164 | | | | 990 | | | | 120,299,257 | |
| |
Rights (a) | | | 13,062 | | | | — | | | | 106 | | | | 13,168 | |
Warrants (a) | | | — | | | | 847,572 | | | | — | | | | 847,572 | |
U.S. Government Obligations | | | — | | | | 3,611,498 | | | | — | | | | 3,611,498 | |
| |
TOTAL INVESTMENTS IN SECURITIES – ASSETS | | | $119,660,165 | | | | $5,110,234 | | | | $1,096 | | | | $124,771,495 | |
| |
| (a) | Please refer to the Schedule of Investments for the regional classifications of these portfolio holdings. |
The Fund did not have material transfers among Level 1, Level 2, and Level 3 during the year ended December 31, 2014. The Fund’s policy is to recognize transfers among Levels as of the beginning of the reporting period.
Additional Information to Evaluate Qualitative Information.
General. The Fund uses recognized industry pricing services – approved by the Board and unaffiliated with the Adviser – to value most of its securities, and uses broker quotes provided by market makers of securities not valued by these and other recognized pricing sources. Several different pricing feeds are received to value
13
The GAMCO Global Telecommunications Fund
Notes to Financial Statements (Continued)
domestic equity securities, international equity securities, preferred equity securities, and fixed income securities. The data within these feeds is ultimately sourced from major stock exchanges and trading systems where these securities trade. The prices supplied by external sources are checked by obtaining quotations or actual transaction prices from market participants. If a price obtained from the pricing source is deemed unreliable, prices will be sought from another pricing service or from a broker/dealer that trades that security or similar securities.
Fair Valuation. Fair valued securities may be common and preferred equities, warrants, options, rights, and fixed income obligations. Where appropriate, Level 3 securities are those for which market quotations are not available, such as securities not traded for several days, or for which current bids are not available, or which are restricted as to transfer. Among the factors to be considered to fair value a security are recent prices of comparable securities that are publicly traded, reliable prices of securities not publicly traded, the use of valuation models, current analyst reports, valuing the income or cash flow of the issuer, or cost if the preceding factors do not apply. A significant change in the unobservable inputs could result in a lower or higher value in Level 3 securities. The circumstances of Level 3 securities are frequently monitored to determine if fair valuation measures continue to apply.
The Adviser reports quarterly to the Board the results of the application of fair valuation policies and procedures. These include back testing the prices realized in subsequent trades of these fair valued securities to fair values previously recognized.
Foreign Currency Translations. The books and records of the Fund are maintained in U.S. dollars. Foreign currencies, investments, and other assets and liabilities are translated into U.S. dollars at current exchange rates. Purchases and sales of investment securities, income, and expenses are translated at the exchange rate prevailing on the respective dates of such transactions. Unrealized gains and losses that result from changes in foreign exchange rates and/or changes in market prices of securities have been included in unrealized appreciation/depreciation on investments and foreign currency translations. Net realized foreign currency gains and losses resulting from changes in exchange rates include foreign currency gains and losses between trade date and settlement date on investment securities transactions, foreign currency transactions, and the difference between the amounts of interest and dividends recorded on the books of the Fund and the amounts actually received. The portion of foreign currency gains and losses related to fluctuation in exchange rates between the initial purchase trade date and subsequent sale trade date is included in realized gain/(loss) on investments.
Foreign Securities. The Fund may directly purchase securities of foreign issuers. Investing in securities of foreign issuers involves special risks not typically associated with investing in securities of U.S. issuers. The risks include possible revaluation of currencies, the inability to repatriate funds, less complete financial information about companies, and possible future adverse political and economic developments. Moreover, securities of many foreign issuers and their markets may be less liquid and their prices more volatile than securities of comparable U.S. issuers.
Foreign Taxes. The Fund may be subject to foreign taxes on income, gains on investments, or currency repatriation, a portion of which may be recoverable. The Fund will accrue such taxes and recoveries as applicable, based upon its current interpretation of tax rules and regulations that exist in the markets in which it invests.
14
The GAMCO Global Telecommunications Fund
Notes to Financial Statements (Continued)
Restricted Securities. The Fund may invest up to 15% of its net assets in securities for which the markets are restricted. Restricted securities include securities whose disposition is subject to substantial legal or contractual restrictions. The sale of restricted securities often requires more time and results in higher brokerage charges or dealer discounts and other selling expenses than does the sale of securities eligible for trading on national securities exchanges or in the over-the-counter markets. Restricted securities may sell at a price lower than similar securities that are not subject to restrictions on resale. Securities freely saleable among qualified institutional investors under special rules adopted by the SEC may be treated as liquid if they satisfy liquidity standards established by the Board. The continued liquidity of such securities is not as well assured as that of publicly traded securities, and accordingly the Board will monitor their liquidity. For the restricted securities the Fund held as of December 31, 2014, refer to the Schedule of Investments.
Securities Transactions and Investment Income. Securities transactions are accounted for on the trade date with realized gain or loss on investments determined by using the identified cost method. Interest income (including amortization of premium and accretion of discount) is recorded on the accrual basis. Premiums and discounts on debt securities are amortized using the effective yield to maturity method. Dividend income is recorded on the ex-dividend date, except for certain dividends from foreign securities that are recorded as soon after the ex-dividend date as the Fund becomes aware of such dividends.
Determination of Net Asset Value and Calculation of Expenses. Certain administrative expenses are common to, and allocated among, various affiliated funds. Such allocations are made on the basis of each fund’s average net assets or other criteria directly affecting the expenses as determined by the Adviser pursuant to procedures established by the Board.
In calculating the NAV per share of each class, investment income, realized and unrealized gains and losses, redemption fees, and expenses other than class specific expenses are allocated daily to each class of shares based upon the proportion of net assets of each class at the beginning of each day. Distribution expenses are borne solely by the class incurring the expense.
Distributions to Shareholders. Distributions to shareholders are recorded on the ex-dividend date. Distributions to shareholders are based on income and capital gains as determined in accordance with federal income tax regulations, which may differ from income and capital gains as determined under GAAP. These differences are primarily due to differing treatments of income and gains on various investment securities and foreign currency transactions held by the Fund, timing differences, and differing characterizations of distributions made by the Fund. Distributions from net investment income for federal income tax purposes include net realized gains on foreign currency transactions. These book/tax differences are either temporary or permanent in nature. To the extent these differences are permanent, adjustments are made to the appropriate capital accounts in the period when the differences arise. Permanent differences were primarily due to the tax treatment of currency gains and losses and recharacterization of distributions. These reclassifications have no impact on the NAV of the Fund. For the year ended December 31, 2014, reclassifications were made to increase accumulated distributions in excess of net investment income by $5,809 and decrease accumulated distributions in excess of net realized gain on investments and foreign currency transactions by $5,809.
15
The GAMCO Global Telecommunications Fund
Notes to Financial Statements (Continued)
The tax character of distributions paid during the years ended December 31, 2014 and 2013 was as follows:
| | | | |
| | | Year Ended
December 31, 2014 | | Year Ended
December 31, 2013 |
Distributions paid from: | | | | |
Ordinary income | | $1,922,181 | | $2,058,430 |
Net long term capital gains | | 2,729,903 | | — |
| | | | |
Total distributions paid | | $4,652,084 | | $2,058,430 |
| | | | |
Provision for Income Taxes. The Fund intends to continue to qualify as a regulated investment company under Subchapter M of the Internal Revenue Code of 1986, as amended (the “Code”). It is the policy of the Fund to comply with the requirements of the Code applicable to regulated investment companies and to distribute substantially all of its net investment company taxable income and net capital gains. Therefore, no provision for federal income taxes is required.
As of December 31, 2014, the components of accumulated earnings/losses on a tax basis were as follows:
| | | | |
Undistributed long term capital gains | | $ | 152 | |
Net unrealized appreciation on investments and foreign currency translations | | | 37,593,271 | |
| | | | |
Total | | $ | 37,593,423 | |
| | | | |
During the year ended December 31, 2014, the Fund utilized capital loss carryforwards of $2,004,152.
Under the Regulated Investment Company Modernization Act of 2010, the Fund is permitted to carry forward for an unlimited period capital losses incurred. As a result of the rule, post-enactment capital losses that are carried forward will retain their character as either short term or long term capital losses.
At December 31, 2014, the temporary differences between book basis and tax basis unrealized appreciation were primarily due to deferral of losses from wash sales for tax purposes and mark-to-market adjustments on investments no longer considered a passive foreign investment company.
The following summarizes the tax cost of investments and the related net unrealized appreciation at December 31, 2014.
| | | | | | | | | | | | | | | | |
| | | Cost | | | Gross
Unrealized
Appreciation | | | Gross
Unrealized
Depreciation | | | Net Unrealized
Appreciation | |
Investments | | | $87,149,617 | | | | $49,985,765 | | | | $(12,363,887) | | | | $37,621,878 | |
The Fund is required to evaluate tax positions taken or expected to be taken in the course of preparing the Fund’s tax returns to determine whether the tax positions are “more-likely-than-not” of being sustained by the applicable tax authority. Income tax and related interest and penalties would be recognized by the Fund as tax expense in the Statement of Operations if the tax positions were deemed not to meet the more-likely-than-not threshold. For the year ended December 31, 2014, the Fund did not incur any income tax, interest, or penalties. As of December 31, 2014, the Adviser has reviewed all open tax years and concluded that there was no impact to the Fund’s net assets or results of operations. The Fund’s federal and state tax returns for the prior three years remain open, subject to examination. On an ongoing basis, the Adviser will monitor the Fund’s tax positions to determine if adjustments to this conclusion are necessary.
3. Investment Advisory Agreement and Other Transactions. The Fund has entered into an investment advisory agreement (the “Advisory Agreement”) with the Adviser which provides that the Fund will pay the Adviser a fee, computed daily and paid monthly, at the annual rate of 1.00% of the value of its average daily
16
The GAMCO Global Telecommunications Fund
Notes to Financial Statements (Continued)
net assets. In accordance with the Advisory Agreement, the Adviser provides a continuous investment program for the Fund’s portfolio, oversees the administration of all aspects of the Fund’s business and affairs, and pays the compensation of all Officers and Directors of the Fund who are affiliated persons of the Adviser.
The Corporation pays each Director who is not considered to be an affiliated person an annual retainer of $6,000 plus $1,000 for each Board meeting attended and they are reimbursed for any out of pocket expenses incurred in attending meetings. All Board committee members receive $1,000 per meeting attended. The Chairman of the Audit Committee receives an annual fee $3,000, and the Lead Director receives an annual fee of $2,000. A Director may receive a single meeting fee, allocated among the participating funds, for attending certain meetings held on behalf of multiple funds. Directors who are directors or employees of the Adviser or an affiliated company receive no compensation or expense reimbursement from the Corporation.
4. Distribution Plan. The Fund’s Board has adopted a distribution plan (the “Plan”) for each class of shares, except for Class I Shares, pursuant to Rule 12b-1 under the 1940 Act. Under the Class AAA, Class A, and Class C Share Plans, payments are authorized to G.distributors, LLC (the “Distributor”), an affiliate of the Fund, at annual rates of 0.25%, 0.25%, and 1.00%, respectively, of the average daily net assets of those classes, the annual limitations under each Plan. Such payments are accrued daily and paid monthly.
5. Portfolio Securities. Purchases and sales of securities during the year ended December 31, 2014, other than short term securities and U.S. Government obligations, aggregated $4,482,920 and $18,133,738, respectively.
6. Transactions with Affiliates. During the year ended December 31, 2014, the Fund paid brokerage commissions on security trades of $5,036 to G.research, Inc., an affiliate of the Adviser. Additionally, the Distributor retained a total of $780 from investors representing commissions (sales charges and underwriting fees) on sales and redemptions of Fund shares.
The cost of calculating the Fund’s NAV per share is a Fund expense pursuant to the Advisory Agreement. During the year ended December 31, 2014, the Fund paid or accrued $45,000 to the Adviser in connection with the cost of computing the Fund’s NAV.
7. Line of Credit. The Fund participates in an unsecured line of credit of up to $75,000,000 under which it may borrow up to 10% of its net assets from the custodian for temporary borrowing purposes. Borrowings under this arrangement bear interest at the higher of the sum of the overnight LIBOR rate plus 100 basis points or the sum of the federal funds rate plus 100 basis points at the time of borrowing. This amount, if any, would be included in “Interest expense” in the Statement of Operations. At December 31, 2014, there were no borrowings outstanding under the line of credit.
The average daily amount of borrowings outstanding under the line of credit during the year ended December 31, 2014 was $108,715 with a weighted average interest rate of 1.11%. The maximum amount borrowed at any time during the year ended December 31, 2014 was $5,102,000.
8. Capital Stock. The Fund offers four classes of shares – Class AAA Shares, Class A Shares, Class C Shares, and Class I Shares. Class AAA Shares are offered without a sales charge only to investors who acquire them directly from the Distributor, through selected broker/dealers, or the transfer agent. Class I Shares are offered without a sales charge, directly through the Distributor or brokers that have entered into selling agreements specifically with respect to Class I Shares. Class A Shares are subject to a maximum front-end sales charge of 5.75%. Class C Shares are subject to a 1.00% contingent deferred sales charge for one year after purchase.
17
The GAMCO Global Telecommunications Fund
Notes to Financial Statements (Continued)
The Fund imposes a redemption fee of 2.00% on all classes of shares that are redeemed or exchanged on or before the seventh day after the date of a purchase. The redemption fee is deducted from the proceeds otherwise payable to the redeeming shareholders and is retained by the Fund as an increase in paid-in capital. The redemption fees retained by the Fund during the years ended December 31, 2014 and 2013, if any, can be found in the Statement of Changes in Net Assets under Redemption Fees.
Transactions in shares of capital stock were as follows:
| | | | | | | | | | | | | | | | |
| | | Year Ended
December 31, 2013 | | | Year Ended
December 31, 2014 | |
| | | Shares | | | Amount | | | Shares | | | Amount | |
Class AAA | | | | | | | | | | | | | | | | |
Shares sold | | | 898,354 | | | $ | 22,616,057 | | | | 446,317 | | | $ | 10,341,793 | |
Shares issued upon reinvestment of distributions | | | 180,409 | | | | 4,308,183 | | | | 77,707 | | | | 1,902,271 | |
Shares redeemed | | | (1,709,727 | ) | | | (41,338,943 | ) | | | (819,427 | ) | | | (18,124,424 | ) |
| | | | | | | | | | | | | | | | |
Net decrease | | | (630,964 | ) | | $ | (14,414,703 | ) | | | (295,403 | ) | | $ | (5,880,360 | ) |
| | | | | | | | | | | | | | | | |
Class A | | | | | | | | | | | | | | | | |
Shares sold | | | 9,650 | | | $ | 234,172 | | | | 15,376 | | | $ | 356,740 | |
Shares issued upon reinvestment of distributions | | | 1,395 | | | | 33,285 | | | | 908 | | | | 22,210 | |
Shares redeemed | | | (31,457 | ) | | | (774,743 | ) | | | (12,604 | ) | | | (277,196 | ) |
| | | | | | | | | | | | | | | | |
Net increase/decrease | | | (20,412 | ) | | $ | (507,286 | ) | | | 3,680 | | | $ | 101,754 | |
| | | | | | | | | | | | | | | | |
Class C | | | | | | | | | | | | | | | | |
Shares sold | | | 2,301 | | | $ | 54,683 | | | | 4,790 | | | $ | 103,151 | |
Shares issued upon reinvestment of distributions | | | 586 | | | | 13,606 | | | | 178 | | | | 4,241 | |
Shares redeemed | | | (9,527 | ) | | | (226,222 | ) | | | (12,817 | ) | | | (286,355 | ) |
| | | | | | | | | | | | | | | | |
Net decrease | | | (6,640 | ) | | $ | (157,933 | ) | | | (7,849 | ) | | $ | (178,963 | ) |
| | | | | | | | | | | | | | | | |
Class I | | | | | | | | | | | | | | | | |
Shares sold | | | 31,248 | | | $ | 779,755 | | | | 46,604 | | | $ | 1,012,058 | |
Shares issued upon reinvestment of distributions | | | 2,167 | | | | 51,691 | | | | 1,015 | | | | 24,827 | |
Shares redeemed | | | (35,803 | ) | | | (885,764 | ) | | | (24,986 | ) | | | (575,836 | ) |
| | | | | | | | | | | | | | | | |
Net increase/decrease | | | (2,388 | ) | | $ | (54,318 | ) | | | 22,633 | | | $ | 461,049 | |
| | | | | | | | | | | | | | | | |
9. Indemnifications. The Fund enters into contracts that contain a variety of indemnifications. The Fund’s maximum exposure under these arrangements is unknown. However, the Fund has not had prior claims or losses pursuant to these contracts. Management has reviewed the Fund’s existing contracts and expects the risk of loss to be remote.
10. Subsequent Events. Management has evaluated the impact on the Fund of all subsequent events occurring through the date the financial statements were issued and has determined that there were no subsequent events requiring recognition or disclosure in the financial statements.
18
The GAMCO Global Telecommunications Fund
Report of Independent Registered Public Accounting Firm
To the Board of Directors of GAMCO Global Series Funds, Inc. and the
Shareholders of The GAMCO Global Telecommunications Fund
We have audited the accompanying statement of assets and liabilities, including the schedule of investments, of The GAMCO Global Telecommunications Fund (the “Fund”), one of the series constituting GAMCO Global Series Funds, Inc., as of December 31, 2014, and the related statement of operations for the year then ended, the statements of changes in net assets for each of the two years in the period then ended, and the financial highlights for each of the five years in the period then ended. These financial statements and financial highlights are the responsibility of the Fund’s management. Our responsibility is to express an opinion on these financial statements and financial highlights based on our audits.
We conducted our audits in accordance with the standards of the Public Company Accounting Oversight Board (United States). Those standards require that we plan and perform the audit to obtain reasonable assurance about whether the financial statements and financial highlights are free of material misstatement. We were not engaged to perform an audit of the Fund’s internal control over financial reporting. Our audits included consideration of internal control over financial reporting as a basis for designing audit procedures that are appropriate in the circumstances, but not for the purpose of expressing an opinion on the effectiveness of the Fund’s internal control over financial reporting. Accordingly, we express no such opinion. An audit also includes examining, on a test basis, evidence supporting the amounts and disclosures in the financial statements and financial highlights, assessing the accounting principles used and significant estimates made by management, and evaluating the overall financial statement presentation. Our procedures included confirmation of securities owned as of December 31, 2014, by correspondence with the Fund’s custodian and brokers or by other appropriate auditing procedures where replies from brokers were not received. We believe that our audits provide a reasonable basis for our opinion.
In our opinion, the financial statements and financial highlights referred to above present fairly, in all material respects, the financial position of the Fund at December 31, 2014, the results of its operations for the year then ended, the changes in its net assets for each of the two years in the period then ended, and its financial highlights for each of the five years in the period then ended, in conformity with U.S. generally accepted accounting principles.

New York, New York
February 25, 2015
19
The GAMCO Global Telecommunications Fund
Board Consideration and Re-Approval of Investment Advisory Agreements (Unaudited)
During the six months ended December 31, 2014, the Board of Directors of the Corporation approved the continuation of the investment advisory agreement with the Adviser for the Fund on the basis of the recommendation by the directors (the “Independent Board Members”) who are not “interested persons” of the Fund. The following paragraphs summarize the material information and factors considered by the Independent Board Members as well as their conclusions relative to such factors.
Nature, Extent, and Quality of Services. The Independent Board Members considered information regarding the Fund’s portfolio managers, the depth of the analyst pool available to the Adviser and the Fund’s portfolio managers, the scope of supervisory, administrative, shareholder, and other services supervised or provided by the Adviser and the absence of significant service problems reported to the Board. The Independent Board Members noted the experience, length of service, and reputation of the Fund’s portfolio managers.
Investment Performance. The Independent Board Members reviewed the short, medium, and long term performance of the Fund against a peer group of global telecommunications funds, noting that the Fund’s performance was in the third quartile in its peer group for the one, three, and five year periods.
Profitability. The Independent Board Members reviewed summary data regarding the profitability of the Fund to the Adviser both with a pro rata administrative charge and with a standalone administrative charge. The Independent Board Members also noted that a substantial portion of the Fund’s portfolio transactions were executed by an affiliated broker of the Adviser and that another affiliated broker received distribution fees and minor amounts of sales commissions.
Economies of Scale. The Independent Board Members discussed the major elements of the Adviser’s cost structure and the relationship of those elements to potential economies of scale and reviewed rudimentary data relating to the impact of 20% growth in the Fund on the Adviser’s profitability.
Sharing of Economies of Scale. The Independent Board Members noted that the investment management fee schedule for the Fund does not take into account any potential economies of scale that may develop.
Service and Cost Comparisons. The Independent Board Members compared the expense ratios of the investment management fee, other expenses, and total expenses of the Fund with similar expense ratios of the Lipper peer group of telecommunication funds and noted that the Adviser’s management fee includes substantially all administrative services of the Fund as well as investment advisory services of the Adviser. The Independent Board Members noted that the Fund’s expense ratio was above average and the Fund’s size was below average within this group. The Independent Board Members were presented with, but did not consider to be material to their decision, various information comparing the advisory fee with the fee for other types of accounts managed by the Adviser.
Conclusions. The Independent Board Members concluded that the Fund enjoyed highly experienced portfolio management services, good ancillary services, and a performance record that was satisfactory. The Independent Board Members also concluded that the Fund’s expense ratios and the profitability to the Adviser of managing the Fund were reasonable, and that economies of scale were not a significant factor in their thinking at this time. The Independent Board Members did not view the potential profitability of ancillary services as material to their decision. On the basis of the foregoing and without assigning particular weight to any single conclusion, the Independent Board Members determined to recommend continuation of the investment management agreement to the full Board of Directors.
20
The GAMCO Global Telecommunications Fund
Additional Fund Information (Unaudited)
The business and affairs of the Fund are managed under the direction of the Corporation’s Board of Directors. Information pertaining to the Directors and officers of the Fund is set forth below. The Corporation’s Statement of Additional Information includes additional information about the Fund’s Directors and is available without charge, upon request, by calling 800-GABELLI (800-422-3554) or by writing to The GAMCO Global Telecommunications Fund at One Corporate Center, Rye, NY 10580-1422.
| | | | | | | | |
Name, Position(s) Address1 and Age | | Term of Office and Length of Time Served2 | | Number of Funds in Fund Complex Overseen by Director | | Principal Occupation(s) During Past Five Years | | Other Directorships Held by Director4 |
| | |
| INTERESTED DIRECTORS3 : | | | | |
| | | | |
Mario J. Gabelli, CFA Director and Chief Investment Officer Age: 72 | | Since 1993 | | 28 | | Chairman, Chief Executive Officer, and Chief Investment Officer–Value Portfolios of GAMCO Investors, Inc., and Chief Investment Officer– Value Portfolios of Gabelli Funds, LLC and GAMCO Asset Management Inc.; Director/ Trustee or Chief Investment Officer of other registered investment companies in the Gabelli/ GAMCO Fund Complex; Chief Executive Officer of GGCP, Inc. | | Director of Morgan Group Holdings, Inc. (holding company); Chairman of the Board and Chief Executive Officer of LICT Corp. (multimedia and communication services); Director of CIBL, Inc. (broadcasting and wireless communications); Director of ICTC Group, Inc. (communications); Director of RLJ Acquisition Inc. (blank check company) (2011-2012) |
| | | | |
John D. Gabelli Director Age: 70 | | Since 1993 | | 10 | | Senior Vice President of G.research, Inc. | | — |
| | |
| INDEPENDENT DIRECTORS5 : | | | | |
| | | | |
E. Val Cerutti Director Age: 75 | | Since 2001 | | 7 | | Chief Executive Officer of Cerutti Consultants, Inc. | | Director of LGL Group, Inc. (diversified manufacturing) (1990-2009) |
| | | | |
Anthony J. Colavita Director Age: 79 | | Since 1993 | | 37 | | President of the law firm of Anthony J. Colavita, P.C. | | — |
| | | | |
Arthur V. Ferrara Director Age: 84 | | Since 2001 | | 8 | | Former Chairman of the Board and Chief Executive Officer of The Guardian Life Insurance Company of America (1993 –1995) | | — |
| | | | |
Werner J. Roeder, MD Director Age: 74 | | Since 1993 | | 23 | | Former Medical Director of Lawrence Hospital and practicing private physician | | — |
| | | | |
Anthonie C. van Ekris Director Age: 80 | | Since 1993 | | 20 | | Chairman and Chief Executive Officer of BALMAC International, Inc. (commodities and futures trading) | | — |
| | | | |
Salvatore J. Zizza Director Age: 69 | | Since 2004 | | 31 | | Chairman of Zizza & Associates Corp. (financial consulting); Chairman of Metropolitan Paper Recycling, Inc. (recycling) (since 2005); Chairman of Harbor Diversified, Inc. (pharmaceuticals) (since 1999); Chairman of BAM (semiconductor and aerospace manufacturing) (since 2000); Chairman of Bergen Cove Realty Inc. (since 2002) | | Director and Vice Chairman of Trans-Lux Corporation (business services); Director and Chairman of Harbor Diversified, Inc. (pharmaceuticals); Chairman of Bion Environmental Technologies (technology) (2005-2007); Director, Chairman, and CEO of General Employment Enterprises (staffing services) (2009-2012) |
21
The GAMCO Global Telecommunications Fund
Additional Fund Information (Continued) (Unaudited)
| | | | |
Name, Position(s) Address1 and Age | | Term of Office and Length of Time Served2 | | Principal Occupation(s) During Past Five Years |
| | |
OFFICERS: | | | | |
| | |
Bruce N. Alpert President Age: 63 | | Since 2003 | | Executive Vice President and Chief Operating Officer of Gabelli Funds, LLC since 1988; and an Officer of registered investment companies in the Gabelli/GAMCO Fund Complex; Director of Teton Advisors, Inc. 1998-2012; Chairman of Teton Advisors, Inc. 2008-2010; President of Teton Advisors, Inc. 1998-2008; Senior Vice President of GAMCO Investors, Inc. since 2008 |
| | |
Andrea R. Mango Secretary Age: 42 | | Since November 2013 | | Counsel of Gabelli Funds, LLC; Corporate Vice President within the Corporate Compliance Department of New York Life Insurance Company 2011-2013; Vice President and Counsel of Deutsche Bank 2006-2011 |
| | |
Agnes Mullady Treasurer Age: 56 | | Since 2006 | | President and Chief Operating Officer of the Open-End Fund Division of Gabelli Funds, LLC since September 2010; Senior Vice President of GAMCO Investors, Inc. since 2009; Vice President of Gabelli Funds, LLC since 2007; Officer of all of the registered investment companies in the Gabelli/GAMCO Fund Complex |
| | |
Richard J. Walz Chief Compliance Officer Age: 55 | | Since November 2013 | | Chief Compliance Officer of the Gabelli/GAMCO Fund Complex; Chief Compliance Officer of AEGON USA Investment Management LLC 2011-2013; Chief Compliance Officer of Cutwater Asset Management 2004-2011 |
| 1 | Address: One Corporate Center, Rye, NY 10580-1422, unless otherwise noted. |
| 2 | Each Director will hold office for an indefinite term until the earliest of (i) the next meeting of shareholders, if any, called for the purpose of considering the election or re-election of such Director and until the election and qualification of his or her successor, if any, elected at such meeting, or (ii) the date a Director resigns or retires, or a Director is removed by the Board of Directors or shareholders, in accordance with the Corporation’s By-Laws and Articles of Incorporation. Each officer will hold office for an indefinite term until the date he or she resigns or retires or until his or her successor is elected and qualified. |
| 3 | “Interested person” of the Corporation as defined in the 1940 Act. Messrs. Gabelli are each considered an “interested person” because of their affiliation with Gabelli Funds, LLC which acts as the Corporation’s investment adviser. Mario J. Gabelli and John D. Gabelli are brothers. |
| 4 | This column includes only directorships of companies required to report to the SEC under the Securities Exchange Act of 1934, as amended, i.e., public companies, or other investment companies registered under the 1940 Act. |
| 5 | Directors who are not interested persons are considered “Independent” Directors. |
22
THE GAMCO GLOBAL TELECOMMUNICATIONS FUND
One Corporate Center
Rye, NY 10580-1422
Portfolio Management Team Biographies
Mario J. Gabelli, CFA, is Chairman and Chief Executive Officer of GAMCO Investors, Inc. that he founded in 1977 and Chief Investment Officer – Value Portfolios of Gabelli Funds, LLC and GAMCO Asset Management Inc. Mr. Gabelli is a summa cum laude graduate of Fordham University and holds an MBA degree from Columbia Business School and Honorary Doctorates from Fordham University and Roger Williams University.
Evan D. Miller, CFA, joined G.research, Inc. in 2002 as a research analyst following the telecommunications industry on a global basis. Currently, he continues to specialize in the industry and also serves as a portfolio manager of Gabelli Funds, LLC and of the Fund. Prior to joining Gabelli, his career spanned nearly a quarter century in the telecommunications industry with corporate strategy and business development positions. Mr. Miller holds an M.B.A. in Finance from the University of Chicago and a B.A. in Economics from Northwestern University.
Sergey Dluzhevskiy, CFA, CPA, joined G.research, Inc. in 2005 as a research analyst covering the North American telecommunications industry. Currently, he continues to specialize in the industry and also serves as a portfolio manager of Gabelli Funds, LLC and of the Fund. Prior to joining Gabelli, Mr. Dluzhevskiy was a senior accountant at Deloitte. He received his undergraduate degree from Case Western Reserve University and a Master’s of Business Administration at the Wharton School of the University of Pennsylvania.
2014 TAX NOTICE TO SHAREHOLDERS (Unaudited)
For the year ended December 31, 2014, the Fund paid to shareholders ordinary income distributions (comprised of net investment income) totaling $0.377, $0.373, $0.171, and $0.442, per share for Class AAA, Class A, Class C, and Class I Shares, respectively, and long term capital gains totaling $2,729,903, or the maximum allowable. The distribution of long term capital gains has been designated as a capital gain dividend by the Fund’s Board of Directors. For the year ended December 31, 2014, 40.19% of the ordinary income distribution qualifies for the dividends received deduction available to corporations. The Fund designates 100% of the ordinary income distribution as qualified dividend income pursuant to the Jobs and Growth Tax Relief Reconciliation Act of 2003. The Fund designates 0.03% of the ordinary income distribution as qualified interest income pursuant to the Tax Relief, Unemployment Reauthorization, and Job Creation Act of 2010. Also for the year 2014, the Fund passed through foreign tax credits of $0.039 per share to Class AAA, Class A, Class C, and Class I Shares.
U.S. Government Income:
The percentage of the ordinary income distribution paid by the Fund during the year ended December 31, 2014 which was derived from U.S. Treasury securities was 0.03%. Such income is exempt from state and local tax in all states. However, many states, including New York and California, allow a tax exemption for a portion of the income earned only if a mutual fund has invested at least 50% of its assets at the end of each quarter of the Fund’s fiscal year in U.S. Government securities. The Fund did not meet this strict requirement in 2014. The percentage of U.S. Government securities held as of December 31, 2014 was 3.03%. Due to the diversity in state and local tax law, it is recommended that you consult your personal tax adviser as to the applicability of the information provided to your specific situation.
All designations are based on financial information available as of the date of this annual report and, accordingly, are subject to change. For each item, it is the intention of the Fund to designate the maximum amount permitted under the Internal Revenue Code and the regulations thereunder.
We have separated the portfolio managers’ commentary from the financial statements and investment portfolio due to corporate governance regulations stipulated by the Sarbanes-Oxley Act of 2002. We have done this to ensure that the content of the portfolio managers’ commentary is unrestricted. Both the commentary and the financial statements, including the portfolio of investments, will be available on our website at www.gabelli.com.
| | |
GAMCO Global Series Funds, Inc. |
THE GAMCO GLOBAL TELECOMMUNICATIONS FUND |
One Corporate Center |
Rye, New York 10580-1422 |
|
t 800-GABELLI (800-422-3554) |
f 914-921-5118 |
e info@gabelli.com |
GABELLI.COM |
|
Net Asset Value per share available daily by calling 800-GABELLI after 7:00 P.M. |
| |
BOARD OF DIRECTORS | | |
Mario J. Gabelli, CFA Chairman and Chief Executive Officer, GAMCO Investors, Inc. E. Val Cerutti Chief Executive Officer, Cerutti Consultants, Inc. Anthony J. Colavita President, Anthony J. Colavita, P.C. Arthur V. Ferrara Former Chairman and Chief Executive Officer, Guardian Life Insurance Company of America John D. Gabelli Senior Vice President, G.research, Inc. Werner J. Roeder, MD Former Medical Director, Lawrence Hospital Anthonie C. van Ekris Chairman, BALMAC International, Inc. | | Salvatore J. Zizza Chairman, Zizza & Associates Corp. OFFICERS Bruce N. Alpert President Andrea R. Mango Secretary Agnes Mullady Treasurer Richard J. Walz Chief Compliance Officer DISTRIBUTOR G.distributors, LLC CUSTODIAN, TRANSFER AGENT, AND DIVIDEND DISBURSING AGENT State Street Bank and Trust Company LEGAL COUNSEL Skadden, Arps, Slate, Meagher & Flom LLP |
This report is submitted for the general information of the shareholders of The GAMCO Global Telecommunications Fund. It is not authorized for distribution to prospective investors unless preceded or accompanied by an effective prospectus. |
|
|
GAB401Q414AR |
Item 2. Code of Ethics.
| | (a) | The registrant, as of the end of the period covered by this report, has adopted a code of ethics that applies to the registrant’s principal executive officer, principal financial officer, principal accounting officer or controller, or persons performing similar functions, regardless of whether these individuals are employed by the registrant or a third party. |
| | (c) | There have been no amendments, during the period covered by this report, to a provision of the code of ethics that applies to the registrant’s principal executive officer, principal financial officer, principal accounting officer or controller, or persons performing similar functions, regardless of whether these individuals are employed by the registrant or a third party, and that relates to any element of the code of ethics description. |
| | (d) | The registrant has not granted any waivers, including an implicit waiver, from a provision of the code of ethics that applies to the registrant’s principal executive officer, principal financial officer, principal accounting officer or controller, or persons performing similar functions, regardless of whether these individuals are employed by the registrant or a third party, that relates to one or more of the items set forth in paragraph (b) of this item’s instructions. |
Item 3. Audit Committee Financial Expert.
As of the end of the period covered by the report, the registrant’s Board of Directors has determined that Salvatore J. Zizza is qualified to serve as an audit committee financial expert serving on its audit committee and that he is “independent,” as defined by Item 3 of Form N-CSR.
Item 4. Principal Accountant Fees and Services.
Audit Fees
| | (a) | The aggregate fees billed for each of the last two fiscal years for professional services rendered by the principal accountant for the audit of the registrant’s annual financial statements or services that are normally provided by the accountant in connection with statutory and regulatory filings or engagements for those fiscal years are $96,850 for 2013 and $99,900 for 2014. |
Audit-Related Fees
| | (b) | The aggregate fees billed in each of the last two fiscal years for assurance and related services by the principal accountant that are reasonably related to the performance of the audit of the registrant’s financial statements and are not reported under paragraph (a) of this Item are $0 for 2013 and $0 for 2014. |
Tax Fees
| | (c) | The aggregate fees billed in each of the last two fiscal years for professional services rendered by the principal accountant for tax compliance, tax advice, and tax planning are $15,596 for 2013 and $17,208 for 2014. Tax fees represent tax compliance services provided in connection with the review of the Registrant’s tax returns and fees relate to Passive Foreign Investment Company identification database subscription fees, billed on an annual basis. |
All Other Fees
| | (d) | The aggregate fees billed in each of the last two fiscal years for products and services provided by the principal accountant, other than the services reported in paragraphs (a) through (c) of this Item are $0 for 2013 and $0 for 2014. |
| (e)(1) | Disclose the audit committee’s pre-approval policies and procedures described in paragraph (c)(7) of Rule 2-01 of Regulation S-X. |
Pre-Approval Policies and Procedures. The Audit Committee (“Committee”) of the registrant is responsible for pre-approving (i) all audit and permissible non-audit services to be provided by the independent registered public accounting firm to the registrant and (ii) all permissible non-audit services to be provided by the independent registered public accounting firm to the Adviser, Gabelli Funds, LLC, and any affiliate of Gabelli Funds, LLC (“Gabelli”) that provides services to the registrant (a “Covered Services Provider”) if the independent registered public accounting firm’s engagement related directly to the operations and financial reporting of the registrant. The Committee may delegate its responsibility to pre-approve any such audit and permissible non-audit services to the Chairperson of the Committee, and the Chairperson must report to the Committee, at its next regularly scheduled meeting after the Chairperson’s pre-approval of such services, his or her decision(s). The Committee may also establish detailed pre-approval policies and procedures for pre-approval of such services in accordance with applicable laws, including the delegation of some or all of the Committee’s pre-approval responsibilities to the other persons (other than Gabelli or the registrant’s officers). Pre-approval by the Committee of any permissible non-audit services is not required so long as: (i) the permissible non-audit services were not recognized by the registrant at the time of the engagement to be non-audit services; and (ii) such services are promptly brought to the attention of the Committee and approved by the Committee or Chairperson prior to the completion of the audit.
| (e)(2) | The percentage of services described in each of paragraphs (b) through (d) of this Item that were approved by the audit committee pursuant to paragraph (c)(7)(i)(C) of Rule 2-01 of Regulation S-X are as follows: |
(b) N/A
(c) 100%
(d) N/A
| | (f) | The percentage of hours expended on the principal accountant’s engagement to audit the registrant’s financial statements for the most recent fiscal year that were attributed to work performed by persons other than the principal accountant’s full-time, permanent employees was 0%. |
| | (g) | The aggregate non-audit fees billed by the registrant’s accountant for services rendered to the registrant, and rendered to the registrant’s investment adviser (not including any sub-adviser whose role is primarily portfolio management and is subcontracted with or overseen by another investment adviser), and any entity controlling, controlled by, or under common control with the adviser that provides ongoing services to the registrant for each of the last two fiscal years of the registrant was $43,720 for 2013 and $48,145 for 2014. |
| | (h) | The registrant’s audit committee of the board of directors has considered whether the provision of non-audit services that were rendered to the registrant’s investment adviser (not including any sub-adviser whose role is primarily portfolio management and is subcontracted with or overseen by another investment adviser), and any entity controlling, controlled by, or under common control with the investment adviser that provides ongoing services to the registrant that were not pre-approved pursuant to paragraph (c)(7)(ii) of Rule 2-01 of Regulation S-X is compatible with maintaining the principal accountant’s independence. |
Item 5. Audit Committee of Listed registrants.
Not applicable.
Item 6. Investments.
| (a) | Schedule of Investments in securities of unaffiliated issuers as of the close of the reporting period is included as part of the report to shareholders filed under Item 1 of this form. |
| Item 7. | Disclosure of Proxy Voting Policies and Procedures for Closed-End Management Investment Companies. |
Not applicable.
Item 8. Portfolio Managers of Closed-End Management Investment Companies.
Not applicable.
| Item 9. | Purchases of Equity Securities by Closed-End Management Investment Company and Affiliated Purchasers. |
Not applicable.
Item 10. Submission of Matters to a Vote of Security Holders.
There have been no material changes to the procedures by which the shareholders may recommend nominees to the registrant’s Board of Directors, where those changes were implemented after the registrant last provided disclosure in response to the requirements of Item 407(c)(2)(iv) of Regulation S-K (17 CFR 229.407) (as required by Item 22(b)(15) of Schedule 14A (17 CFR 240.14a-101)), or this Item.
Item 11. Controls and Procedures.
| | (a) | The registrant’s principal executive and principal financial officers, or persons performing similar functions, have concluded that the registrant’s disclosure controls and procedures (as defined in Rule 30a-3(c) under the Investment Company Act of 1940, as amended (the “1940 Act”) (17 CFR 270.30a-3(c))) are effective, as of a date within 90 days of the filing date of the report that includes the disclosure required by this paragraph, based on their evaluation of these controls and procedures required by Rule 30a-3(b) under the 1940 Act (17 CFR 270.30a-3(b)) and Rules 13a-15(b) or 15d-15(b) under the Securities Exchange Act of 1934, as amended (17 CFR 240.13a-15(b) or 240.15d-15(b)). |
| | (b) | There were no changes in the registrant’s internal control over financial reporting (as defined in Rule 30a-3(d) under the 1940 Act (17 CFR 270.30a-3(d)) that occurred during the registrant’s second fiscal quarter of the period covered by this report that has materially affected, or is reasonably likely to materially affect, the registrant’s internal control over financial reporting. |
Item 12. Exhibits.
| | (a)(1) | Code of ethics, or any amendment thereto, that is the subject of disclosure required by Item 2 is attached hereto. |
| | (a)(2) | Certifications pursuant to Rule 30a-2(a) under the 1940 Act and Section 302 of the Sarbanes-Oxley Act of 2002 are attached hereto. |
| | (b) | Certifications pursuant to Rule 30a-2(b) under the 1940 Act and Section 906 of the Sarbanes- Oxley Act of 2002 are attached hereto. |
(12.other) Not applicable.
SIGNATURES
Pursuant to the requirements of the Securities Exchange Act of 1934 and the Investment Company Act of 1940, the registrant has duly caused this report to be signed on its behalf by the undersigned, thereunto duly authorized.
|
| (Registrant) GAMCO Global Series Funds, Inc. |
|
| By (Signature and Title)* /s/ Bruce N. Alpert |
Bruce N. Alpert, Principal Executive Officer |
|
| Date 3/06/2015 |
Pursuant to the requirements of the Securities Exchange Act of 1934 and the Investment Company Act of 1940, this report has been signed below by the following persons on behalf of the registrant and in the capacities and on the dates indicated.
|
|
| By (Signature and Title)* /s/ Bruce N. Alpert |
Bruce N. Alpert, Principal Executive Officer |
|
| Date 3/06/2015 |
|
| By (Signature and Title)* /s/ Agnes Mullady |
Agnes Mullady, Principal Financial Officer and Treasurer |
|
| Date 3/06/2015 |
* Print the name and title of each signing officer under his or her signature.