UNITED STATES
SECURITIES AND EXCHANGE COMMISSION
Washington, D.C. 20549
FORM N-CSR
CERTIFIED SHAREHOLDER REPORT OF REGISTERED MANAGEMENT
INVESTMENT COMPANIES
Investment Company Act file number 811-07896
GAMCO Global Series Funds, Inc.
(Exact name of registrant as specified in charter)
One Corporate Center
Rye, New York 10580-1422
(Address of principal executive offices) (Zip code)
Bruce N. Alpert
Gabelli Funds, LLC
One Corporate Center
Rye, New York 10580-1422
(Name and address of agent for service)
Registrant’s telephone number, including area code: 1-800-422-3554
Date of fiscal year end: December 31
Date of reporting period: December 31, 2017
Form N-CSR is to be used by management investment companies to file reports with the Commission not later than 10 days after the transmission to stockholders of any report that is required to be transmitted to stockholders under Rule 30e-1 under the Investment Company Act of 1940 (17 CFR 270.30e-1). The Commission may use the information provided on Form N-CSR in its regulatory, disclosure review, inspection, and policymaking roles.
A registrant is required to disclose the information specified by Form N-CSR, and the Commission will make this information public. A registrant is not required to respond to the collection of information contained in Form N-CSR unless the Form displays a currently valid Office of Management and Budget (“OMB”) control number. Please direct comments concerning the accuracy of the information collection burden estimate and any suggestions for reducing the burden to Secretary, Securities and Exchange Commission, 450 Fifth Street, NW, Washington, DC 20549-0609. The OMB has reviewed this collection of information under the clearance requirements of 44 U.S.C. § 3507.
Item 1. Reports to Stockholders.
The Report to Shareholders is attached herewith.
The Gabelli Global Rising Income and Dividend Fund
Annual Report — December 31, 2017
To Our Shareholders,
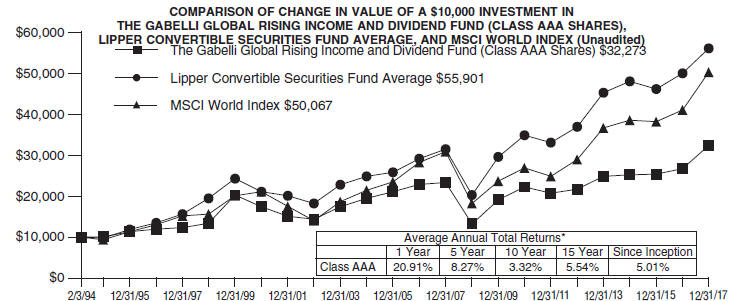
For the year ended December 31, 2017, the net asset value (“NAV”) per Class AAA Share of The Gabelli Global Rising Income and Dividend Fund increased 20.9% compared with increases of 13.1% and 22.4% for the ICE Bank of America Merrill Lynch Global 300 Convertible Index and the Morgan Stanley Capital International (“MSCI”) World Index, respectively. Other classes of shares are available. See page 2 for performance information for all classes of shares.
Enclosed are the financial statements, including the schedule of investments, as of December 31, 2017.
Performance Discussion (Unaudited)
The Fund’s investment objective is to provide investors with a high level of total return through a combination of current income and appreciation of capital.
The Fund’s investment strategy is to invest 80% of its net assets in dividend paying securities (such as common and preferred stock) or other income producing securities (such as fixed-income securities and securities that are convertible into common stock). The Fund will primarily invest in common stocks of foreign and domestic issuers that the Fund’s portfolio manager believes are likely to pay dividends and income and have the potential for above average capital appreciation and dividend increases.
After a sluggish start to the year, the U.S. economy grew at a faster than anticipated 3.1% and 3.3% in the second and third quarters, respectively. At 4.1%, unemployment stands at a ten-year low while consumer wealth of nearly $97 trillion is at an all-time high. Housing starts of 1.3 million units continue their steady increase, but remain comfortably below the prior peak of 2.2 million units. The U.S. is in its ninth year of economic expansion, making this the third longest expansion at 101 months, trailing only 1961-1969 and 1991-2001 (those expansions were 106 and 120 months, respectively). Perhaps as important, the global economy is in synchronized expansion. For all of 2017, the Eurozone is set to grow 2.2%, its fastest since 2007 while Japan has accelerated to 1.5%; China is likely to post growth of 6.7%. The stock market rose in the latter half of the year, following President Trump’s agenda on tax reform, deregulation, and fiscal stimulus. The Federal Reserve raised the Federal Funds rate for the fifth time since October of 2014, now ranging from 1.25%-1.50%.
Selected holdings that contributed positively to performance in 2017 were: Millicom Intl Cellular SDR (3.2% of net assets as of December 31, 2017) which benefitted from higher revenue and core business growth; Remy Cointreau (2.8%) which had double digit sales growth, robust demand, and higher operating profit margins which lifted performance; and Sony Corp. (4.5%) whose restructuring efforts, streamlining of unprofitable electronics businesses and the capitalization on the spread of smartphones with its image sensors hiked profits.
Some of our weaker performing securities were: The E.W. Scripps Co. (0.7%) which had a decline in television, radio and digital revenues; Sistema PJSC GDR (0.6%) reported credit ratings downgrade and pending lawsuits; and General Electric Co. (0.3%) which had a change in its CEO, and announced it would be reducing its dividend by half and begin selling off a majority of its core businesses.
Thank you for your investment in the Gabelli Global Rising Income and Dividend Fund.
We appreciate your confidence and trust.
Comparative Results
| | | | | | | | | | | | | | | | | | | | |
| | | |
| Average Annual Returns through December 31, 2017 (a) (Unaudited) | | | Since | | |
| | | | | | | | | | | | | | | Inception | | |
| | | 1 Year | | | 5 Year | | | 10 Year | | | 15 Year | | | (2/3/94) | | |
Class AAA (GAGCX) | | | 20.91% | | | | 8.27% | | | | 3.32% | | | | 5.54% | | | 5.01 % | | |
ICE Bank of America Merrill Lynch Global 300 Convertible Index | | | 13.08 | | | | 9.91 | | | | 6.32 | | | | 7.15 | | | N/A(b) | | |
MSCI World Index | | | 22.40 | | | | 11.64 | | | | 5.03 | | | | 8.87 | | | 6.98(c) | | |
Lipper Convertible Securities Fund Average | | | 12.12 | | | | 8.73 | | | | 5.93 | | | | 7.78 | | | 7.46 | | |
Class A (GAGAX) | | | 20.93 | | | | 8.26 | | | | 3.32 | | | | 5.55 | | | 5.03 | | |
With sales charge (d) | | | 13.98 | | | | 6.99 | | | | 2.71 | | | | 5.14 | | | 4.76 | | |
Class C (GACCX) | | | 19.98 | | | | 7.20 | | | | 2.18 | | | | 4.51 | | | 4.33 | | |
With contingent deferred sales charge (e) | | | 18.98 | | | | 7.20 | | | | 2.18 | | | | 4.51 | | | 4.33 | | |
Class I (GAGIX) | | | 21.68 | | | | 8.65 | | | | 3.62 | | | | 5.75 | | | 5.13 | | |
In the current prospectuses dated April 28, 2017, the gross expense ratios for Class AAA, A, C, and I Shares are 1.61%, 1.61%, 2.36%, and 1.36%, respectively, and the net expense ratios for these share classes after contractual reimbursements by Gabelli Funds, LLC (the “Adviser”) are 1.61%, 1.61%, 2.36%, and 1.00%, respectively. See page 10 for the expense ratios for the year ended December 31, 2017. Class AAA and Class I Shares do not have a sales charge. The maximum sales charge for Class A Shares and Class C Shares is 5.75% and 1.00%, respectively. (a) Returns represent past performance and do not guarantee future results. Total returns and average annual returns reflect changes in share price, reinvestment of distributions, and are net of expenses. Investment returns and the principal value of an investment will fluctuate. When shares are redeemed, they may be worth more or less than their original cost. Current performance may be lower or higher than the performance data presented. Visit www.gabelli.com for performance information as of the most recent month end. Returns would have been lower had the Adviser not reimbursed certain expenses of the Fund. The Fund imposes a 2% redemption fee on shares sold or exchanged within seven days after the date of purchase. Investors should carefully consider the investment objectives, risks, charges, and expenses of the Fund before investing. The prospectuses contain information about these and other matters and should be read carefully before investing. To obtain a prospectus, please visit our website at www.gabelli.com. Investing in foreign securities involves risks not ordinarily associated with investments in domestic issues, including currency fluctuation, economic, and political risks. The Class AAA Share NAVs are used to calculate performance for the periods prior to the issuance of Class A Shares, Class C Shares, and Class I Shares on May 2, 2001, November 26, 2001, and January 11, 2008, respectively. The actual performance of the Class A Shares and Class C Shares would have been lower due to the additional fees and expenses associated with these classes of shares. The actual performance of the Class I Shares would have been higher due to lower expenses related to this class of shares. The ICE Bank of America Merrill Lynch Global 300 Convertible Index is an unmanaged global convertible index composed of companies representative of the market structure of countries in North America, Europe, and the Asia/Pacific region. The MSCI World Index is a free float adjusted market capitalization weighted index that is designed to measure the equity market performance of developed markets. The Lipper Convertible Securities Fund Average reflects the average performance of mutual funds classified in this particular category. Dividends are considered reinvested. You cannot invest directly in an index. (b) There are no data available for the ICE Bank of America Merrill Lynch Global 300 Convertible Index prior to December 31, 1994. (c) MSCI World Index since inception performance is as of January 31, 1994. (d) Performance results include the effect of the maximum 5.75% sales charge at the beginning of the period. (e) Assuming payment of the 1% maximum contingent deferred sales charge imposed on redemptions made within one year of purchase. | | |
| * | Past performance is not predictive of future results. The performance tables and graph do not reflect the deduction of taxes that a shareholder would pay on Fund distributions or the redemption of Fund shares. |
2
| | |
| The Gabelli Global Rising Income and Dividend Fund | | |
| Disclosure of Fund Expenses (Unaudited) | | |
For the Six Month Period from July 1, 2017 through December 31, 2017 | | Expense Table |
We believe it is important for you to understand the impact of fees and expenses regarding your investment. All mutual funds have operating expenses. As a shareholder of a fund, you incur ongoing costs, which include costs for portfolio management, administrative services, and shareholder reports (like this one), among others. Operating expenses, which are deducted from a fund’s gross income, directly reduce the investment return of a fund. When a fund’s expenses are expressed as a percentage of its average net assets, this figure is known as the expense ratio. The following examples are intended to help you understand the ongoing costs (in dollars) of investing in your Fund and to compare these costs with those of other mutual funds. The examples are based on an investment of $1,000 made at the beginning of the period shown and held for the entire period.
The Expense Table below illustrates your Fund’s costs in two ways:
Actual Fund Return: This section provides information about actual account values and actual expenses. You may use this section to help you to estimate the actual expenses that you paid over the period after any fee waivers and expense reimbursements. The “Ending Account Value” shown is derived from the Fund’s actual return during the past six months, and the “Expenses Paid During Period” shows the dollar amount that would have been paid by an investor who started with $1,000 in the Fund. You may use this information, together with the amount you invested, to estimate the expenses that you paid over the period.
To do so, simply divide your account value by $1,000 (for example, an $8,600 account value divided by $1,000 = 8.6), then multiply the result by the number given for your Fund under the heading “Expenses Paid During Period” to estimate the expenses you paid during this period.
Hypothetical 5% Return: This section provides information about hypothetical account values and
hypothetical expenses based on the Fund’s actual expense ratio. It assumes a hypothetical annualized return of 5% before expenses during the period shown. In this case – because the hypothetical return used is not the Fund’s actual return – the results do not apply to your investment and you cannot use the hypothetical account value and expense to estimate the actual ending account balance or expenses you paid for the period. This example is useful in making comparisons of the ongoing costs of investing in the Fund and other funds. To do so, compare this 5% hypothetical example with the 5% hypothetical examples that appear in shareholder reports of other funds.
Please note that the expenses shown in the table are meant to highlight your ongoing costs only and do not reflect any transactional costs such as sales charges (loads), redemption fees, or exchange fees, if any, which are described in the Prospectus. If these costs were applied to your account, your costs would be higher. Therefore, the 5% hypothetical return is useful in comparing ongoing costs only, and will not help you determine the relative total costs of owning different funds. The “Annualized Expense Ratio” represents the actual expenses for the last six months and may be different from the expense ratio in the Financial Highlights which is for the year ended December 31, 2017.
| | | | | | | | | | | | |
| | | Beginning | | Ending | | Annualized | | | Expenses | |
| | | Account Value | | Account Value | | Expense | | | Paid During | |
| | | 07/01/17 | | 12/31/17 | | Ratio | | | Period* | |
The Gabelli Global Rising Income and Dividend Fund | |
Actual Fund Return | | | | | | | | |
Class AAA | | $1,000.00 | | $1,075.60 | | | 1.65% | | | | $ 8.63 | |
Class A | | $1,000.00 | | $1,075.70 | | | 1.65% | | | | $ 8.63 | |
Class C | | $1,000.00 | | $1,071.40 | | | 2.39% | | | | $12.48 | |
Class I | | $1,000.00 | | $1,079.20 | | | 1.00% | | | | $ 5.24 | |
Hypothetical 5% Return | | | | | | | | |
Class AAA | | $1,000.00 | | $1,016.89 | | | 1.65% | | | | $ 8.39 | |
Class A | | $1,000.00 | | $1,016.89 | | | 1.65% | | | | $ 8.39 | |
Class C | | $1,000.00 | | $1,013.16 | | | 2.39% | | | | $12.13 | |
Class I | | $1,000.00 | | $1,020.16 | | | 1.00% | | | | $ 5.09 | |
| * | Expenses are equal to the Fund’s annualized expense ratio for the last six months multiplied by the average account value over the period, multiplied by the number of days in the most recent fiscal half year (184 days), then divided by 365. |
3
Summary of Portfolio Holdings (Unaudited)
The following table presents portfolio holdings as a percent of net assets as of December 31, 2017:
The Gabelli Global Rising Income and Dividend Fund
| | | | |
U.S. Government Obligations | | | 21.9% | |
Food and Beverage | | | 14.5% | |
Financial Services | | | 11.8% | |
Telecommunications | | | 6.4% | |
Electronics | | | 4.7% | |
Health Care | | | 4.0% | |
Diversified Industrial | | | 3.9% | |
Consumer Products | | | 3.7% | |
Machinery | | | 3.2% | |
Cable and Satellite | | | 3.2% | |
Wireless Communications | | | 3.2% | |
Energy and Utilities | | | 2.9% | |
Building and Construction | | | 2.2% | |
Automotive: Parts and Accessories | | | 2.0% | |
Automotive | | | 1.6% | |
Entertainment | | | 1.6% | |
Hotels and Gaming | | | 1.5% | |
| | | | |
Computer Software and Services | | | 1.2 | % |
Specialty Chemicals | | | 1.1 | % |
Retail | | | 0.9 | % |
Energy and Energy Services | | | 0.8 | % |
Publishing | | | 0.7 | % |
Equipment and Supplies | | | 0.6 | % |
Aerospace and Defense | | | 0.6 | % |
Consumer Services | | | 0.6 | % |
Business Services | | | 0.5 | % |
Industrials | | | 0.3 | % |
Broadcasting | | | 0.2 | % |
Aviation: Parts and Services | | | 0.0 | %* |
Other Assets and Liabilities (Net) | | | 0.2 | % |
| | | | |
| | | 100.0 | % |
| | | | |
| * | Amount represents less than 0.05%. |
The Fund files a complete schedule of portfolio holdings with the Securities and Exchange Commission (the “SEC”) for the first and third quarters of each fiscal year on Form N-Q. Shareholders may obtain this information at www.gabelli.com or by calling the Fund at 800-GABELLI (800-422-3554). The Fund’s Form N-Q is available on the SEC’s website at www.sec.gov and may also be reviewed and copied at the SEC’s Public Reference Room in Washington, DC. Information on the operation of the Public Reference Room may be obtained by calling 800-SEC-0330.
Proxy Voting
The Fund files Form N-PX with its complete proxy voting record for the twelve months ended June 30, no later than August 31 of each year. A description of the Fund’s proxy voting policies, procedures, and how the Fund voted proxies relating to portfolio securities is available without charge, upon request, by (i) calling 800-GABELLI (800-422-3554); (ii) writing to The Gabelli Funds at One Corporate Center, Rye, NY 10580-1422; or (iii) visiting the SEC’s website at www.sec.gov.
4
The Gabelli Global Rising Income and Dividend Fund
Schedule of Investments — December 31, 2017
| | | | | | | | | | | | |
| Principal | | | | | | | | Market | |
Amount | | | | | Cost | | | Value | |
| |
| | | | CONVERTIBLE CORPORATE BONDS — 1.9% | |
| | | | Automotive — 1.1% | | | | | | | | |
| | | | Navistar International Corp., Sub. Deb., | | | | | |
| | $ 450,000 | | | 4.500%, 10/15/18 | | $ | 441,787 | | | $ | 466,031 | |
| | 300,000 | | | 4.750%, 04/15/19 | | | 300,000 | | | | 325,875 | |
| | | | | | | | | | | | |
| | | | | | | 741,787 | | | | 791,906 | |
| | | | | | | | | | | | |
| | |
| | | | Building and Construction — 0.3% | | | | | |
| | 250,000 | | | Layne Christensen Co., | | | | | | | | |
| | | | 4.250%, 11/15/18 | | | 247,107 | | | | 244,219 | |
| | | | | | | | | | | | |
| | | | Computer Software and Services — 0.1% | |
| | 10,000 | | | VeriSign Inc., STEP, | | | | | | | | |
| | | | 4.702%, 08/15/37 | | | 13,073 | | | | 33,438 | |
| | | | | | | | | | | | |
| | | | Consumer Services — 0.1% | | | | | |
| | 100,000 | | | Ascent Capital Group Inc., | | | | | | | | |
| | | | 4.000%, 07/15/20 | | | 90,266 | | | | 79,437 | |
| | | | | | | | | | | | |
| | | | Energy and Utilities — 0.3% | | | | | |
| | 200,000 | | | Chart Industries Inc., | | | | | | | | |
| | | | 1.000%, 11/15/24(a) | | | 200,000 | | | | 210,125 | |
| | | | | | | | | | | | |
| | | | TOTAL CONVERTIBLE CORPORATE BONDS | | | 1,292,233 | | | | 1,359,125 | |
| | | | | | | | | | | | |
| | | |
Shares | | | | | | | | | |
| | | | MANDATORY CONVERTIBLE SECURITIES — 0.3% | |
| | | | Telecommunications — 0.3% | | | | | |
| | 20,000 | | | Frontier Communications Corp., | | | | | | | | |
| | | | 11.125%, Ser. A, 06/29/18 | | | 281,644 | | | | 216,400 | |
| | | | | | | | | | | | |
| | |
| | | | COMMON STOCKS — 75.7% | | | | | |
| | | | Aerospace and Defense — 0.6% | | | | | |
| | 3,000 | | | Orbital ATK Inc. | | | 399,560 | | | | 394,500 | |
| | | | | | | | | | | | |
| | | |
| | | | Automotive — 0.5% | | | | | | | | |
| | 4,000 | | | General Motors Co. | | | 131,794 | | | | 163,960 | |
| | 1,000 | | | Volkswagen AG | | | 167,644 | | | | 202,414 | |
| | | | | | | | | | | | |
| | | | | | | 299,438 | | | | 366,374 | |
| | | | | | | | | | | | |
| |
| | | | Automotive: Parts and Accessories — 2.0% | |
| | 17,000 | | | Dana Inc. | | | 291,299 | | | | 544,170 | |
| | 4,000 | | | Federal-Mogul Holdings Corp.†(b) | | | 37,917 | | | | 40,000 | |
| | 2,000 | | | Genuine Parts Co. | | | 179,604 | | | | 190,020 | |
| | 3,500 | | | Linamar Corp. | | | 154,365 | | | | 203,846 | |
| | 13,000 | | | Uni-Select Inc. | | | 295,233 | | | | 293,819 | |
| | 1,000 | | | Visteon Corp.† | | | 59,844 | | | | 125,140 | |
| | | | | | | | | | | | |
| | | | | | | 1,018,262 | | | | 1,396,995 | |
| | | | | | | | | | | | |
| | | | Aviation: Parts and Services — 0.0% | | | | | |
| | 200 | | | Curtiss-Wright Corp. | | | 17,951 | | | | 24,370 | |
| | | | | | | | | | | | |
| | | | Broadcasting — 0.2% | | | | | |
| | 353 | | | Cumulus Media Inc., Cl. A† | | | 28 | | | | 26 | |
| | 4,000 | | | Tribune Media Co., Cl. A | | | 170,480 | | | | 169,880 | |
| | | | | | | | | | | | |
| | | | | | | 170,508 | | | | 169,906 | |
| | | | | | | | | | | | |
| | | | | | | | | | | | |
| | | | | | | | | Market | |
Shares | | | | | Cost | | | Value | |
| | |
| | | | Building and Construction — 1.9% | | | | | |
| | 29,000 | | | Armstrong Flooring Inc.† | | $ | 541,690 | | | $ | 490,680 | |
| | 500 | | | Chofu Seisakusho Co. Ltd. | | | 11,059 | | | | 11,542 | |
| | 4,000 | | | GCP Applied Technologies Inc.† | | | 122,569 | | | | 127,600 | |
| | 9,000 | | | Herc Holdings Inc.† | | | 296,654 | | | | 563,490 | |
| | 2,865 | | | Johnson Controls International plc | | | 102,586 | | | | 109,185 | |
| | 1,020 | | | Lennar Corp., Cl. B | | | 36,499 | | | | 52,714 | |
| | | | | | | | | | | | |
| | | | | | | 1,111,057 | | | | 1,355,211 | |
| | | | | | | | | | | | |
| | |
| | | | Business Services — 0.5% | | | | | |
| | 200 | | | Boyd Group Income Fund | | | 14,694 | | | | 16,052 | |
| | 8,000 | | | JCDecaux SA | | | 266,400 | | | | 322,567 | |
| | | | | | | | | | | | |
| | | | | | | 281,094 | | | | 338,619 | |
| | | | | | | | | | | | |
| | |
| | | | Cable and Satellite — 3.2% | | | | | |
| | 500 | | | EchoStar Corp., Cl. A† | | | 26,760 | | | | 29,950 | |
| | 1,000 | | | Liberty Global plc, Cl. A† | | | 32,167 | | | | 35,840 | |
| | 3,000 | | | Liberty Global plc, Cl. C† | | | 102,756 | | | | 101,520 | |
| | 1,000 | | | Liberty Global plc LiLAC, Cl. A† | | | 21,774 | | | | 20,150 | |
| | 20,000 | | | Rogers Communications Inc., Cl. B | | | 707,828 | | | | 1,018,600 | |
| | 75,000 | | | Sky plc† | | | 972,692 | | | | 1,024,762 | |
| | | | | | | | | | | | |
| | | | | | | 1,863,977 | | | | 2,230,822 | |
| | | | | | | | | | | | |
| | | | Computer Software and Services — 1.1% | |
| | 1,000 | | | AVEVA Group plc | | | 32,213 | | | | 37,332 | |
| | 50,000 | | | Hewlett Packard Enterprise Co. | | | 702,526 | | | | 718,000 | |
| | | | | | | | | | | | |
| | | | | | | 734,739 | | | | 755,332 | |
| | | | | | | | | | | | |
| | |
| | | | Consumer Products — 3.7% | | | | | |
| | 1,000 | | | Eastman Kodak Co.† | | | 326 | | | | 3,100 | |
| | 12,500 | | | Essity AB, Cl. A† | | | 338,141 | | | | 353,068 | |
| | 8,234 | | | Hunter Douglas NV | | | 344,086 | | | | 715,278 | |
| | 2,000 | | | L’Oreal SA | | | 335,032 | | | | 443,823 | |
| | 1,500 | | | Salvatore Ferragamo SpA | | | 29,710 | | | | 39,865 | |
| | 25,000 | | | Scandinavian Tobacco Group A/S | | | 414,936 | | | | 483,504 | |
| | 5,000 | | | Svenska Cellulosa AB, Cl. A | | | 32,874 | | | | 57,905 | |
| | 8,800 | | | Swedish Match AB | | | 282,573 | | | | 346,718 | |
| | 7,000 | | | Unicharm Corp. | | | 139,942 | | | | 181,997 | |
| | | | | | | | | | | | |
| | | | | | | 1,917,620 | | | | 2,625,258 | |
| | | | | | | | | | | | |
| | |
| | | | Consumer Services — 0.5% | | | | | |
| | 12,000 | | | Ashtead Group plc | | | 239,543 | | | | 322,739 | |
| | | | | | | | | | | | |
| | | | Diversified Industrial — 3.9% | | | | | |
| | 5,000 | | | Aerojet Rocketdyne Holdings Inc.† | | | 49,073 | | | | 156,000 | |
| | 10,000 | | | Ampco-Pittsburgh Corp. | | | 157,561 | | | | 124,000 | |
| | 6,600 | | | Bouygues SA | | | 280,073 | | | | 342,971 | |
| | 500 | | | Crane Co. | | | 37,572 | | | | 44,610 | |
| | 2,500 | | | EnPro Industries Inc. | | | 169,932 | | | | 233,775 | |
| | 12,000 | | | General Electric Co. | | | 298,823 | | | | 209,400 | |
| | 7,500 | | | Jardine Matheson Holdings Ltd. | | | 400,456 | | | | 455,625 | |
| | 17,000 | | | Jardine Strategic Holdings Ltd. | | | 580,912 | | | | 672,860 | |
| | 16,000 | | | Myers Industries Inc. | | | 252,055 | | | | 312,000 | |
| | 3,000 | | | Textron Inc. | | | 97,157 | | | | 169,770 | |
See accompanying notes to financial statements.
5
The Gabelli Global Rising Income and Dividend Fund
Schedule of Investments (Continued) — December 31, 2017
| | | | | | | | | | | | |
| | | | | | | | | Market | |
Shares | | | | | Cost | | | Value | |
| |
| | | | COMMON STOCKS (Continued) | |
| | | | Diversified Industrial (Continued) | |
| | 1,000 | | | Trinity Industries Inc. | | $ | 27,359 | | | $ | 37,460 | |
| | | | | | | | | | | | |
| | | | | | | 2,350,973 | | | | 2,758,471 | |
| | | | | | | | | | | | |
| | |
| | | | Electronics — 4.7% | | | | | |
| | 2,200 | | | Agilent Technologies Inc. | | | 97,284 | | | | 147,334 | |
| | 38,000 | | | Sony Corp. | | | 1,056,755 | | | | 1,714,258 | |
| | 32,000 | | | Sony Corp., ADR | | | 694,806 | | | | 1,438,400 | |
| | 1,500 | | | Stratasys Ltd.† | | | 29,905 | | | | 29,940 | |
| | | | | | | | | | | | |
| | | | | | | 1,878,750 | | | | 3,329,932 | |
| | | | | | | | | | | | |
| | |
| | | | Energy and Energy Services — 0.8% | | | | | |
| | 6,000 | | | BP plc, ADR | | | 202,748 | | | | 252,180 | |
| | 800 | | | Chart Industries Inc.† | | | 27,314 | | | | 37,488 | |
| | 66,000 | | | Weatherford International plc† | | | 311,923 | | | | 275,220 | |
| | | | | | | | | | | | |
| | | | | | | 541,985 | | | | 564,888 | |
| | | | | | | | | | | | |
| | |
| | | | Energy and Utilities — 2.6% | | | | | |
| | 12,000 | | | Cameco Corp. | | | 117,430 | | | | 110,760 | |
| | 3,000 | | | National Fuel Gas Co. | | | 164,089 | | | | 164,730 | |
| | 15,000 | | | National Grid plc, ADR | | | 1,051,245 | | | | 882,150 | |
| | 11,803 | | | Royal Dutch Shell plc, Cl. B | | | 268,347 | | | | 399,749 | |
| | 10,000 | | | Severn Trent plc | | | 288,286 | | | | 291,902 | |
| | 200,000 | | | Texas Competitive Electric Holdings Co. LLC, Escrow†(b) | | | 0 | | | | 0 | |
| | | | | | | | | | | | |
| | | | | | | 1,889,397 | | | | 1,849,291 | |
| | | | | | | | | | | | |
| | |
| | | | Entertainment — 1.6% | | | | | |
| | 9,000 | | | Discovery Communications Inc., Cl. A† | | | 235,500 | | | | 201,420 | |
| | 7,000 | | | Grupo Televisa SAB, ADR | | | 164,131 | | | | 130,690 | |
| | 14,000 | | | International Game Technology plc | | | 282,147 | | | | 371,140 | |
| | 68,000 | | | ITV plc | | | 190,177 | | | | 151,946 | |
| | 8,000 | | | Viacom Inc., Cl. B | | | 232,719 | | | | 246,480 | |
| | 2,000 | | | Vivendi SA. | | | 48,473 | | | | 53,801 | |
| | | | | | | | | | | | |
| | | | | | | 1,153,147 | | | | 1,155,477 | |
| | | | | | | | | | | | |
| | |
| | | | Equipment and Supplies — 0.6% | | | | | |
| | 4,500 | | | Graco Inc. | | | 100,232 | | | | 203,490 | |
| | 7,000 | | | Mueller Industries Inc. | | | 205,869 | | | | 248,010 | |
| | | | | | | | | | | | |
| | | | | | | 306,101 | | | | 451,500 | |
| | | | | | | | | | | | |
| | |
| | | | Financial Services — 11.8% | | | | | |
| | 1,000 | | | American Express Co. | | | 80,155 | | | | 99,310 | |
| | 8,800 | | | American International Group Inc. | | | 341,298 | | | | 524,304 | |
| | 3 | | | Berkshire Hathaway Inc., Cl. A† | | | 358,105 | | | | 892,800 | |
| | 15,000 | | | Citigroup Inc. | | | 809,386 | | | | 1,116,150 | |
| | 6,000 | | | Comerica Inc | | | 269,538 | | | | 520,860 | |
| | 17,000 | | | Deutsche Bank AG | | | 305,139 | | | | 323,510 | |
| | 4,200 | | | EXOR NV | | | 156,204 | | | | 257,511 | |
| | 27,000 | | | FinecoBank Banca Fineco SpA | | | 182,261 | | | | 276,499 | |
| | 45,000 | | | GAM Holding AG | | | 649,994 | | | | 727,333 | |
| | 3,000 | | | H&R Block Inc. | | | 60,919 | | | | 78,660 | |
| | | | | | | | | | | | |
| | | | | | | | | Market | |
Shares | | | | | Cost | | | Value | |
| | | |
| | 2,200 | | | Julius Baer Group Ltd | | $ | 114,955 | | | $ | 134,558 | |
| | 17,000 | | | Kinnevik AB, Cl. A | | | 537,255 | | | | 592,910 | |
| | 500 | | | Kinnevik AB, Cl. B | | | 15,085 | | | | 16,902 | |
| | 3,500 | | | Legg Mason Inc. | | | 94,123 | | | | 146,930 | |
| | 5,000 | | | Morgan Stanley | | | 122,102 | | | | 262,350 | |
| | 30,000 | | | Nets A/S† | | | 774,732 | | | | 789,079 | |
| | 16,000 | | | Resona Holdings Inc. | | | 82,393 | | | | 95,581 | |
| | 2,600 | | | T. Rowe Price Group Inc | | | 190,037 | | | | 272,818 | |
| | 10,000 | | | The Bank of New York Mellon Corp. | | | 315,339 | | | | 538,600 | |
| | 1,500 | | | The PNC Financial Services Group Inc. | | | 102,907 | | | | 216,435 | |
| | 4,000 | | | UBS Group AG. | | | 67,474 | | | | 73,560 | |
| | 1,000 | | | W. R. Berkley Corp. | | | 37,130 | | | | 71,650 | |
| | 5,000 | | | Wells Fargo & Co. | | | 171,100 | | | | 303,350 | |
| | | | | | | | | | | | |
| | | | | | | 5,837,631 | | | | 8,331,660 | |
| | | | | | | | | | | | |
| | |
| | | | Food and Beverage — 14.5% | | | | | |
| | 7,600 | | | Chr. Hansen Holding A/S | | | 328,955 | | | | 712,879 | |
| | 7,500 | | | Danone SA | | | 528,728 | | | | 629,469 | |
| | 130,000 | | | Davide Campari-Milano SpA | | | 483,830 | | | | 1,005,291 | |
| | 6,000 | | | Diageo plc, ADR | | | 665,409 | | | | 876,180 | |
| | 4,200 | | | Fomento Economico Mexicano SAB de CV, ADR | | | 336,358 | | | | 394,380 | |
| | 2,500 | | | General Mills Inc. | | | 124,421 | | | | 148,225 | |
| | 2,000 | | | Heineken NV | | | 133,144 | | | | 208,605 | |
| | 2,500 | | | Kellogg Co. | | | 127,291 | | | | 169,950 | |
| | 4,000 | | | Kerry Group plc, Cl. A | | | 300,765 | | | | 449,031 | |
| | 6,000 | | | Kikkoman Corp. | | | 104,672 | | | | 242,822 | |
| | 14,000 | | | Maple Leaf Foods Inc., Toronto | �� | | 243,879 | | | | 398,950 | |
| | 1,500 | | | McCormick & Co. Inc., Cl. V | | | 133,799 | | | | 153,360 | |
| | 1,500 | | | McCormick & Co. Inc., Non-Voting | | | 106,428 | | | | 152,865 | |
| | 200 | | | National Beverage Corp. | | | 11,204 | | | | 19,488 | |
| | 16,000 | | | Nestlé SA | | | 1,149,833 | | | | 1,375,956 | |
| | 160,000 | | | Parmalat SpA | | | 539,479 | | | | 595,124 | |
| | 3,500 | | | Pernod Ricard SA | | | 398,941 | | | | 554,119 | |
| | 14,000 | | | Remy Cointreau SA | | | 1,034,431 | | | | 1,940,152 | |
| | 1,000 | | | The Kraft Heinz Co. | | | 56,416 | | | | 77,760 | |
| | 500 | | | Yakult Honsha Co. Ltd | | | 34,879 | | | | 37,719 | |
| | 450,000 | | | Yashili International Holdings Ltd.† | | | 153,029 | | | | 86,396 | |
| | | | | | | | | | | | |
| | | | | | | 6,995,891 | | | | 10,228,721 | |
| | | | | | | | | | | | |
| | |
| | | | Health Care — 4.0% | | | | | |
| | 17,000 | | | Advanced Accelerator Applications SA, ADR† | | | 1,382,577 | | | | 1,387,540 | |
| | 3,500 | | | Bristol-Myers Squibb Co. | | | 118,263 | | | | 214,480 | |
| | 1,800 | | | ICU Medical Inc.† | | | 108,041 | | | | 388,800 | |
| | 4,000 | | | Idorsia Ltd.† | | | 41,180 | | | | 104,469 | |
| | 1,500 | | | Johnson & Johnson | | | 169,964 | | | | 209,580 | |
| | 1,000 | | | Patterson Cos., Inc. | | | 33,669 | | | | 36,130 | |
| | 8,000 | | | Pfizer Inc. | | | 187,223 | | | | 289,760 | |
| | 5,000 | | | Roche Holding AG, ADR | | | 93,345 | | | | 157,900 | |
| | | | | | | | | | | | |
| | | | | | | 2,134,262 | | | | 2,788,659 | |
| | | | | | | | | | | | |
See accompanying notes to financial statements.
6
The Gabelli Global Rising Income and Dividend Fund
Schedule of Investments (Continued) — December 31, 2017
| | | | | | | | | | | | |
| | | | | | | | | Market | |
Shares | | | | | Cost | | | Value | |
| | |
| | | | COMMON STOCKS (Continued) | | | | | |
| | | | Hotels and Gaming — 1.5% | | | | | |
| | 237,500 | | | Mandarin Oriental International Ltd | | $ | 380,503 | | | $ | 479,750 | |
| | 150,000 | | | NYX Gaming Group Ltd.† | | | 287,550 | | | | 284,010 | |
| | 180,000 | | | The Hongkong & Shanghai Hotels Ltd | | | 270,882 | | | | 267,252 | |
| | 200 | | | Wynn Resorts Ltd | | | 19,669 | | | | 33,718 | |
| | | | | | | | | | | | |
| | | | | | | 958,604 | | | | 1,064,730 | |
| | | | | | | | | | | | |
| | |
| | | | Industrials — 0.3% | | | | | |
| | 3,000 | | | Nilfisk Holding A/S† | | | 129,510 | | | | 175,512 | |
| | | | | | | | | | | | |
| | |
| | | | Machinery — 3.2% | | | | | |
| | 102,000 | | | CNH Industrial NV, Borsa Italiana | | | 974,433 | | | | 1,367,033 | |
| | 50,000 | | | CNH Industrial NV, New York | | | 444,471 | | | | 670,000 | |
| | 1,000 | | | Mueller Water Products Inc., Cl. A | | | 11,460 | | | | 12,530 | |
| | 2,400 | | | NKT A/S† | | | 96,745 | | | | 109,581 | |
| | 4,000 | | | Twin Disc Inc.† | | | 63,171 | | | | 106,280 | |
| | | | | | | | | | | | |
| | | | | | | 1,590,280 | | | | 2,265,424 | |
| | | | | | | | | | | | |
| | |
| | | | Publishing — 0.7% | | | | | |
| | 30,000 | | | The E.W. Scripps Co., Cl. A† | | | 556,298 | | | | 468,900 | |
| | | | | | | | | | | | |
| | |
| | | | Retail — 0.9% | | | | | |
| | 4,000 | | | Hertz Global Holdings Inc.† | | | 43,791 | | | | 88,400 | |
| | 6,000 | | | J.C. Penney Co. Inc.† | | | 41,063 | | | | 18,960 | |
| | 8,000 | | | Macy’s Inc. | | | 198,348 | | | | 201,520 | |
| | 2,000 | | | Nathan’s Famous Inc. | | | 124,109 | | | | 151,000 | |
| | 2,200 | | | Walgreens Boots Alliance Inc. | | | 135,948 | | | | 159,764 | |
| | | | | | | | | | | | |
| | | | | | | 543,259 | | | | 619,644 | |
| | | | | | | | | | | | |
| | |
| | | | Specialty Chemicals — 1.1% | | | | | |
| | 700 | | | Ashland Global Holdings Inc. | | | 35,829 | | | | 49,840 | |
| | 4,000 | | | International Flavors & Fragrances Inc. | | | 413,216 | | | | 610,440 | |
| | 200 | | | The Chemours Co. | | | 1,720 | | | | 10,012 | |
| | 4,000 | | | Valvoline Inc. | | | 83,077 | | | | 100,240 | |
| | | | | | | | | | | | |
| | | | | | | 533,842 | | | | 770,532 | |
| | | | | | | | | | | | |
| | |
| | | | Telecommunications — 6.1% | | | | | |
| | 1,000 | | | CenturyLink Inc. | | | 19,109 | | | | 16,680 | |
| | 5,000 | | | Cincinnati Bell Inc.† | | | 83,830 | | | | 104,250 | |
| | 3,000 | | | Deutsche Telekom AG, ADR | | | 53,860 | | | | 52,983 | |
| | 7,000 | | | Harris Corp. | | | 549,658 | | | | 991,550 | |
| | 50,000 | | | Koninklijke KPN NV | | | 139,515 | | | | 174,458 | |
| | 60,000 | | | Pharol SGPS SA, ADR† | | | 30,852 | | | | 14,850 | |
| | 2,000 | | | Proximus SA | | | 55,818 | | | | 65,632 | |
| | 100,000 | | | Sistema PJSC FC, GDR | | | 584,599 | | | | 417,000 | |
| | 90,000 | | | Sprint Corp.† | | | 574,200 | | | | 530,100 | |
| | 54,000 | | | Telefonica Deutschland Holding AG | | | 300,437 | | | | 271,218 | |
| | 60,000 | | | VEON Ltd., ADR | | | 247,056 | | | | 230,400 | |
| | 3,300 | | | Verizon Communications Inc. | | | 158,780 | | | | 174,669 | |
| | | | | | | | | | | | |
| | | | | | | | | Market | |
Shares | | | | | Cost | | | Value | |
| | | |
| | 40,000 | | | Vodafone Group plc, ADR | | $ | 1,381,428 | | | $ | 1,276,000 | |
| | | | | | | | | | | | |
| | | | | | | 4,179,142 | | | | 4,319,790 | |
| | | | | | | | | | | | |
| | |
| | | | Wireless Communications — 3.2% | | | | | |
| | 33,000 | | | Millicom International Cellular SA, SDR | | | 2,129,714 | | | | 2,228,670 | |
| | | | | | | | | | | | |
| | | | TOTAL COMMON STOCKS | | | 41,762,535 | | | | 53,351,927 | |
| | | | | | | | | | | | |
| | | |
Principal
Amount | | | | | | | | | |
| | | | U.S. GOVERNMENT OBLIGATIONS — 21.9% | |
| | $15,504,000 | | | U.S. Treasury Bills, | | | | | | | | |
| | | | 1.048% to 1.471%††, | | | | | |
| | | | 01/04/18 to 06/14/18 | | | 15,461,864 | | | | 15,462,060 | |
| | | | | | | | | | | | |
| | | | TOTAL INVESTMENTS — 99.8% | | $ | 58,798,276 | | | | 70,389,512 | |
| | | | | | | | | | | | |
| | | | Other Assets and Liabilities (Net) — 0.2% | | | | 142,454 | |
| | | | | | | | | | | | |
| | |
| | | | NET ASSETS — 100.0% | | | $ | 70,531,966 | |
| | | | | | | | | | | | |
| (a) | Security exempt from registration under Rule 144A of the Securities Act of 1933, as amended. This security may be resold in transactions exempt from registration, normally to qualified institutional buyers. At December 31, 2017, the market value of the Rule 144A security amounted to $210,125 or 0.30% of total net assets. |
| (b) | Security is valued using significant unobservable inputs and is classified as Level 3 in the fair value hierarchy. |
| † | Non-income producing security. |
| †† | Represents annualized yield at date of purchase. |
| ADR | American Depositary Receipt |
| GDR | Global Depositary Receipt |
| SDR | Swedish Depositary Receipt |
| STEP | Step coupon security. The rate disclosed is that in effect at December 31, 2017. |
| | | | | | | | |
| | | % of | | | | |
| | | Market | | | Market | |
Geographic Diversification | | Value | | | Value | |
United States | | | 48.2 | % | | $ | 33,944,620 | |
Europe | | | 38.7 | | | | 27,247,914 | |
Japan | | | 5.3 | | | | 3,722,319 | |
Latin America | | | 4.5 | | | | 3,165,380 | |
Canada | | | 2.9 | | | | 2,042,027 | |
Asia/Pacific | | | 0.4 | | | | 267,252 | |
| | | | | | | | |
| | | 100.0 | % | | $ | 70,389,512 | |
| | | | | | | | |
See accompanying notes to financial statements.
7
The Gabelli Global Rising Income and Dividend Fund
Statement of Assets and Liabilities
December 31, 2017
| | | | |
Assets: | | | | |
Investments, at value (cost $58,798,276) | | $ | 70,389,512 | |
Foreign currency, at value (cost $74) | | | 74 | |
Cash | | | 2,279 | |
Deposit at brokers | | | 17 | |
Receivable for Fund shares sold | | | 54,472 | |
Receivable from Adviser | | | 46,278 | |
Dividends and interest receivable | | | 141,855 | |
Prepaid expenses | | | 30,562 | |
| | | | |
Total Assets. | | | 70,665,049 | |
| | | | |
Liabilities: | | | | |
Payable for Fund shares redeemed | | | 4,520 | |
Payable for investment advisory fees | | | 58,902 | |
Payable for accounting fees. | | | 3,750 | |
Payable for distribution fees | | | 3,365 | |
Payable for legal and audit fees | | | 25,084 | |
Payable for shareholder communications expenses | | | 19,782 | |
Payable to custodian | | | 6,249 | |
Payable for shareholder services fees | | | 7,203 | |
Other accrued expenses. | | | 4,228 | |
| | | | |
Total Liabilities | | | 133,083 | |
| | | | |
Net Assets
(applicable to 2,595,727 shares outstanding) | | $ | 70,531,966 | |
| | | | |
Net Assets Consist of: | | | | |
Paid-in capital | | $ | 59,108,559 | |
Accumulated distributions in excess of net investment income | | | (121,234 | ) |
Accumulated distributions in excess of net realized gain on investments and foreign currency transactions | | | (47,349 | ) |
Net unrealized appreciation on investments | | | 11,591,236 | |
Net unrealized appreciation on foreign currency translations | | | 754 | |
| | | | |
Net Assets | | $ | 70,531,966 | |
| | | | |
Shares of Capital Stock, each at $0.001 par value: | | | | |
Class AAA: | | | | |
Net Asset Value, offering, and redemption price per share ($7,671,735 ÷ 282,010 shares outstanding; 75,000,000 shares authorized) | | $ | 27.20 | |
| | | | |
Class A: | | | | |
Net Asset Value and redemption price per share ($1,177,702 ÷ 43,202 shares outstanding; 50,000,000 shares authorized) | | $ | 27.26 | |
| | | | |
Maximum offering price per share (NAV ÷ 0.9425, based on maximum sales charge of 5.75% of the offering price) | | $ | 28.92 | |
| | | | |
Class C: | | | | |
Net Asset Value and offering price per share ($2,127,564 ÷ 92,770 shares outstanding; 25,000,000 shares authorized) | | $ | 22.93 | (a) |
| | | | |
Class I: | | | | |
Net Asset Value, offering, and redemption price per share ($59,554,965 ÷ 2,177,745 shares outstanding; 25,000,000 shares authorized) | | $ | 27.35 | |
| | | | |
Statement of Operations
For the Year Ended December 31, 2017
| | | | |
| Investment Income: | | | |
Dividends (net of foreign withholding taxes of $53,458) | | $ | 789,679 | |
Interest | | | 177,591 | |
Other Income* | | | 54 | |
| | | | |
Total Investment Income | | | 967,324 | |
| | | | |
Expenses: | | | | |
Investment advisory fees | | | 555,604 | |
Distribution fees - Class AAA | | | 14,920 | |
Distribution fees - Class A | | | 1,500 | |
Distribution fees - Class C | | | 10,630 | |
Shareholder communications expenses | | | 38,276 | |
Legal and audit fees | | | 35,441 | |
Registration expenses | | | 33,796 | |
Accounting fees | | | 22,500 | |
Custodian fees | | | 22,139 | |
Shareholder services fees | | | 22,113 | |
Directors’ fees | | | 16,346 | |
Interest expense | | | 2,668 | |
Tax expense | | | 49 | |
Miscellaneous expenses | | | 14,420 | |
| | | | |
Total Expenses | | | 790,402 | |
| | | | |
Less: | | | | |
Expense reimbursements (See Note 3) | | | (175,468 | ) |
Expenses paid indirectly by broker (See Note 6) | | | (1,627 | ) |
| | | | |
Total Reimbursements and Credits | | | (177,095 | ) |
| | | | |
Net Expenses | | | 613,307 | |
| | | | |
Net Investment Income | | | 354,017 | |
| | | | |
Net Realized and Unrealized Gain on Investments, Securities Sold Short, and Foreign Currency: | | | | |
Net realized gain on investments | | | 822,951 | |
Net realized gain on securities sold short | | | 122,090 | |
Net realized gain on foreign currency transactions | | | 36,297 | |
| | | | |
Net realized gain/(loss) on investments, securities sold short, and foreign currency transactions | | | 981,338 | |
| | | | |
Net change in unrealized appreciation/depreciation: | | | | |
on investments | | | 9,150,698 | |
on foreign currency translations | | | 29,025 | |
| | | | |
Net change in unrealized appreciation/depreciation on investments and foreign currency translations | | | 9,179,723 | |
| | | | |
Net Realized and Unrealized Gain on Investments, Securities Sold Short, and Foreign Currency | | | 10,161,061 | |
| | | | |
Net Increase in Net Assets Resulting from Operations | | $ | 10,515,078 | |
| | | | |
| * | The Fund received a reimbursement of custody expenses paid in prior years. |
| (a) | Redemption price varies based on the length of time held. |
See accompanying notes to financial statements.
8
The Gabelli Global Rising Income and Dividend Fund
Statement of Changes in Net Assets
| | | | | | | | | | |
| | | Year Ended | | Year Ended |
| | | December 31, 2017 | | December 31, 2016 |
Operations: | | | | | | | | | | |
Net investment income | | | $ | 354,017 | | | | $ | 574,050 | |
Net realized gain/(loss) on investments, securities sold short, and foreign currency transactions | | | | 981,338 | | | | | (130,671 | ) |
Net change in unrealized appreciation on investments and foreign currency translations | | | | 9,179,723 | | | | | 1,809,729 | |
| | | | | | | | | | |
Net Increase in Net Assets Resulting from Operations | | | | 10,515,078 | | | | | 2,253,108 | |
| | | | | | | | | | |
Distributions to Shareholders: | | | | | | | | | | |
Net investment income | | | | | | | | | | |
Class AAA | | | | (21,185 | ) | | | | (46,389 | ) |
Class A | | | | (4,058 | ) | | | | (4,545 | ) |
Class C | | | | — | | | | | (4,052 | ) |
Class I | | | | (454,847 | ) | | | | (505,002 | ) |
| | | | | | | | | | |
| | | | (480,090 | ) | | | | (559,988 | ) |
| | | | | | | | | | |
Net realized gain | | | | | | | | | | |
Class AAA | | | | (75,308 | ) | | | | — | |
Class A | | | | (11,590 | ) | | | | — | |
Class C | | | | (21,976 | ) | | | | — | |
Class I | | | | (581,717 | ) | | | | — | |
| | | | | | | | | | |
| | | | (690,591 | ) | | | | — | |
| | | | | | | | | | |
Return of Capital | | | | | | | | | | |
Class AAA | | | | (4,860 | ) | | | | — | |
Class A | | | | (748 | ) | | | | — | |
Class C | | | | (2,002 | ) | | | | — | |
Class I | | | | (36,958 | ) | | | | — | |
| | | | | | | | | | |
| | | | (44,568 | ) | | | | — | |
| | | | | | | | | | |
Total Distributions to Shareholders | | | | (1,215,249 | ) | | | | (559,988 | ) |
| | | | | | | | | | |
| | |
Capital Share Transactions: | | | | | | | | | | |
Class AAA | | | | 2,085,925 | | | | | (2,597,345 | ) |
Class A | | | | 602,574 | | | | | (238,041 | ) |
Class C | | | | 1,245,252 | | | | | 94,979 | |
Class I | | | | 14,154,937 | | | | | (590,741 | ) |
| | | | | | | | | | |
Net Increase/(Decrease) in Net Assets from Capital Share Transactions | | | | 18,088,688 | | | | | (3,331,148 | ) |
| | | | | | | | | | |
| | |
Redemption Fees | | | | 3 | | | | | — | |
| | | | | | | | | | |
Net Increase/(Decrease) in Net Assets | | | | 27,388,520 | | | | | (1,638,028 | ) |
Net Assets: | | | | | | | | | | |
Beginning of year | | | | 43,143,446 | | | | | 44,781,474 | |
| | | | | | | | | | |
End of year (including undistributed net investment income of $0 and $0, respectively) | | | $ | 70,531,966 | | | | $ | 43,143,446 | |
| | | | | | | | | | |
See accompanying notes to financial statements.
9
The Gabelli Global Rising Income and Dividend Fund
Financial Highlights
Selected data for a share of capital stock outstanding throughout each year:
| | | | | | | | | | | | | | | | | | | | | | | | | | | | | | | | | | | | | | | | | | | | | | | | | | | | | | | | | | | | | | | | |
| | | | | | Income (Loss)
from Investment Operations | | | Distributions | | | | | | | | | | | | Ratios to Average Net Assets/
Supplemental Data | |
Year Ended December 31† | | Net Asset Value, Beginning of Year | | | Net Investment Income (Loss)(a) | | | Net Realized and Unrealized Gain (Loss) on Investments | | | Total from Investment Operations | | | Net Investment Income | | | Net Realized Gain | | | Return of Capital | | | Total Distributions | | | Redemption Fees (a)(b) | | | Net Asset Value, End of Year | | | Total Return†† | | | Net Assets End of Year (in 000’s) | | | Net Investment Income (Loss) | | | Operating Expenses Before Reimburse- ment | | | Operating Expenses Net of Reimburse- ment(c) | | | Portfolio Turnover Rate | |
Class AAA | | | | | | | | | | | | | | | | | | | | | | | | | | | | | | | | | | | | | | | | | | | | | | | | | | | | | | | | | | | | | | | | |
2017 | | | $22.80 | | | | $ 0.03 | | | | $ 4.74 | | | | $ 4.77 | | | | $(0.07) | | | | $(0.28) | | | | $(0.02) | | | | $(0.37) | | | | $0.00 | | | | $27.20 | | | | 20.9% | | | | $7,672 | | | | 0.12 | % | | | 1.62% | | | | 1.62%(d) | | | | 24% | |
2016 | | | 21.85 | | | | 0.27 | | | | 0.91 | | | | 1.18 | | | | (0.23) | | | | — | | | | — | | | | (0.23) | | | | — | | | | 22.80 | | | | 5.4 | | | | 4,598 | | | | 1.21 | | | | 1.61 | | | | 1.61(d)(e) | | | | 52 | |
2015 | | | 22.01 | | | | (0.09) | | | | 0.22 | | | | 0.13 | | | | — | | | | (0.29) | | | | — | | | | (0.29) | | | | — | | | | 21.85 | | | | 0.6 | | | | 7,121 | | | | (0.41 | ) | | | 1.75 | | | | 1.75(d)(f) | | | | 167 | |
2014 | | | 22.02 | | | | 0.48 | | | | (0.13) | | | | 0.35 | | | | (0.25) | | | | (0.11) | | | | — | | | | (0.36) | | | | — | | | | 22.01 | | | | 1.6 | | | | 12,368 | | | | 2.15 | | | | 2.11 | | | | 2.02 | | | | 63 | |
2013 | | | 19.35 | | | | 0.01 | | | | 2.75 | | | | 2.76 | | | | (0.08) | | | | — | | | | (0.01) | | | | (0.09) | | | | 0.00 | | | | 22.02 | | | | 14.3 | | | | 17,459 | | | | 0.11 | | | | 2.31 | | | | 2.00 | | | | 80 | |
Class A | | | | | | | | | | | | | | | | | | | | | | | | | | | | | | | | | | | | | | | | | | | | | | | | | | | | | | | | | | | | | | | | |
2017 | | | $22.86 | | | | $ 0.05 | | | | $ 4.74 | | | | $ 4.79 | | | | $(0.09) | | | | $(0.28) | | | | $(0.02) | | | | $(0.39) | | | | $0.00 | | | | $27.26 | | | | 20.9% | | | | $1,178 | | | | 0.18 | % | | | 1.62% | | | | 1.62%(d) | | | | 24% | |
2016 | | | 21.90 | | | | 0.25 | | | | 0.93 | | | | 1.18 | | | | (0.22) | | | | — | | | | — | | | | (0.22) | | | | — | | | | 22.86 | | | | 5.4 | | | | 480 | | | | 1.15 | | | | 1.61 | | | | 1.61(d)(e) | | | | 52 | |
2015 | | | 22.10 | | | | (0.10) | | | | 0.19 | | | | 0.09 | | | | — | | | | (0.29) | | | | — | | | | (0.29) | | | | — | | | | 21.90 | | | | 0.4 | | | | 694 | | | | (0.44 | ) | | | 1.75 | | | | 1.75(d)(f) | | | | 167 | |
2014 | | | 22.11 | | | | 0.36 | | | | 0.00(b) | | | | 0.36 | | | | (0.26) | | | | (0.11) | | | | — | | | | (0.37) | | | | — | | | | 22.10 | | | | 1.6 | | | | 365 | | | | 1.60 | | | | 2.11 | | | | 2.02 | | | | 63 | |
2013 | | | 19.40 | | | | 0.01 | | | | 2.78 | | | | 2.79 | | | | (0.07) | | | | — | | | | (0.01) | | | | (0.08) | | | | 0.00 | | | | 22.11 | | | | 14.4 | | | | 332 | | | | 0.21 | | | | 2.31 | | | | 2.00 | | | | 80 | |
Class C | | | | | | | | | | | | | | | | | | | | | | | | | | | | | | | | | | | | | | | | | | | | | | | | | | | | | | | | | | | | | | | | |
2017 | | | $19.36 | | | | $(0.14) | | | | $4.01 | | | | $ 3.87 | | | | $ — | | | | $(0.28) | | | | $(0.02) | | | | $(0.30) | | | | $0.00 | | | | $22.93 | | | | 20.0% | | | | $2,127 | | | | (0.62 | )% | | | 2.37% | | | | 2.37%(d) | | | | 24% | |
2016 | | | 18.61 | | | | 0.06 | | | | 0.80 | | | | 0.86 | | | | (0.11) | | | | — | | | | — | | | | (0.11) | | | | — | | | | 19.36 | | | | 4.6 | | | | 721 | | | | 0.31 | | | | 2.36 | | | | 2.36(d)(e) | | | | 52 | |
2015 | | | 18.97 | | | | (0.24) | | | | 0.17 | | | | (0.07) | | | | — | | | | (0.29) | | | | — | | | | (0.29) | | | | — | | | | 18.61 | | | | (0.4) | | | | 595 | | | | (1.26 | ) | | | 2.50 | | | | 2.20(d)(f) | | | | 167 | |
2014 | | | 19.14 | | | | (0.06) | | | | 0.24 | | | | 0.18 | | | | (0.24) | | | | (0.11) | | | | — | | | | (0.35) | | | | — | | | | 18.97 | | | | 0.9 | | | | 155 | | | | (0.29 | ) | | | 2.86 | | | | 2.77 | | | | 63 | |
2013 | | | 17.15 | | | | (0.07) | | | | 2.16 | | | | 2.09 | | | | (0.09) | | | | — | | | | (0.01) | | | | (0.10) | | | | 0.00 | | | | 19.14 | | | | 12.2 | | | | 8 | | | | (0.82 | ) | | | 3.06 | | | | 2.75 | | | | 80 | |
Class I | | | | | | | | | | | | | | | | | | | | | | | | | | | | | | | | | | | | | | | | | | | | | | | | | | | | | | | | | | | | | | | | |
2017 | | | $22.89 | | | | $ 0.19 | | | | $4.78 | | | | $ 4.97 | | | | $(0.21) | | | | $(0.28) | | | | (0.02) | | | | $(0.51) | | | | $0.00 | | | | $27.35 | | | | 21.7% | | | | $59,555 | | | | 0.74 | % | | | 1.37% | | | | 1.00%(d)(g) | | | | 24% | |
2016 | | | 21.94 | | | | 0.31 | | | | 0.95 | | | | 1.26 | | | | (0.31) | | | | — | | | | — | | | | (0.31) | | | | — | | | | 22.89 | | | | 5.8 | | | | 37,344 | | | | 1.39 | | | | 1.36 | | | | 1.27(d)(e)(g) | | | | 52 | |
2015 | | | 22.13 | | | | (0.04) | | | | 0.17 | | | | 0.13 | | | | (0.03) | | | | (0.29) | | | | — | | | | (0.32) | | | | — | | | | 21.94 | | | | 0.6 | | | | 36,371 | | | | (0.19 | ) | | | 1.50 | | | | 1.50(d)(f) | | | | 167 | |
2014 | | | 22.13 | | | | 0.19 | | | | 0.23 | | | | 0.42 | | | | (0.31) | | | | (0.11) | | | | — | | | | (0.42) | | | | — | | | | 22.13 | | | | 1.9 | | | | 27,398 | | | | 0.87 | | | | 1.86 | | | | 1.77 | | | | 63 | |
2013 | | | 19.40 | | | | 0.03 | | | | 2.83 | | | | 2.86 | | | | (0.12) | | | | — | | | | (0.01) | | | | (0.13) | | | | 0.00 | | | | 22.13 | | | | 14.7 | | | | 2,584 | | | | 0.49 | | | | 2.06 | | | | 1.75 | | | | 80 | |
| | † | All per share amounts and net asset values have been adjusted as a result of the 1 for 5 reverse stock split on August 9, 2013. |
| | †† | Total return represents aggregate total return of a hypothetical $1,000 investment at the beginning of the year and sold at the end of the year including reinvestment of distributions and does not reflect the applicable sales charges. |
| | (a) | Per share amounts have been calculated using the average shares outstanding method. |
| | (b) | Amount represents less than $0.005 per share. |
| | (c) | The Fund incurred interest expense during the year ended December 31, 2014. If interest expense had not been incurred, the ratios of operating expenses to average net assets would have been 2.00% (Class AAA and Class A), 2.76% (Class C), and 1.76% (Class I). For the years ended December 31, 2017, 2016, 2015, and 2013, the effect of the interest expense was minimal. |
| | (d) | The Fund received credits from a designated broker who agreed to pay certain Fund operating expenses. During the year ended December 31, 2017 and 2016, there was no impact to the expenses ratio. For the year ended December 31, 2015, if credits had not been incurred, the ratios of operating expenses to average net assets would have been 1.76% (Class AAA and Class A), 2.51% (Class C), and 1.51% (Class I). |
| | (e) | During the year ended December 31, 2016, the Fund received reimbursements of custody expenses paid in prior years. Had such reimbursement (allocated by relative net asset values of the Fund’s share classes) been included in this period, the expense ratios would have been 1.46% (Class AAA), 1.44% (Class A), 2.20% (Class C), and 1.10% (Class I). |
| | (f) | Under an expense deferral agreement with the Adviser, the Adviser recovered from the Fund $62,315 for the year ended December 31, 2015, representing previously reimbursed expenses from the Adviser. Had such payment not been made, the expense ratio would have been 1.61% (Class AAA and Class A), 2.36% (Class C), and 1.36% (Class I). |
| | (g) | Under an expense reimbursement agreement with the Adviser, the Adviser reimbursed certain Class I expenses to the Fund of $175,468 and $36,018 for the years ended December 31, 2017 and 2016, respectively. |
See accompanying notes to financial statements.
10
The Gabelli Global Rising Income and Dividend Fund
Notes to Financial Statements
1. Organization. The Gabelli Global Rising Income and Dividend Fund, a series of GAMCO Global Series Funds, Inc. (the “Corporation”), was incorporated on July 16, 1993 in Maryland. The Fund is a non-diversified open-end management investment company registered under the Investment Company Act of 1940, as amended (the “1940 Act”), and one of four separately managed portfolios (collectively, the “Portfolios”) of the Corporation. The Fund’s primary objective is to obtain a high level of total return through a combination of income and capital appreciation. The Fund commenced investment operations on February 3, 1994.
2. Significant Accounting Policies. As an investment company, the Fund follows the investment company accounting and reporting guidance, which is part of U.S. generally accepted accounting principles (“GAAP”) that may require the use of management estimates and assumptions in the preparation of its financial statements. Actual results could differ from those estimates. The following is a summary of significant accounting policies followed by the Fund in the preparation of its financial statements.
Security Valuation. Portfolio securities listed or traded on a nationally recognized securities exchange or traded in the U.S. over-the-counter market for which market quotations are readily available are valued at the last quoted sale price or a market’s official closing price as of the close of business on the day the securities are being valued. If there were no sales that day, the security is valued at the average of the closing bid and asked prices or, if there were no asked prices quoted on that day, then the security is valued at the closing bid price on that day. If no bid or asked prices are quoted on such day, the security is valued at the most recently available price or, if the Board of Directors (the “Board”) so determines, by such other method as the Board shall determine in good faith to reflect its fair market value. Portfolio securities traded on more than one national securities exchange or market are valued according to the broadest and most representative market, as determined by Gabelli Funds, LLC (the “Adviser”).
Portfolio securities primarily traded on a foreign market are generally valued at the preceding closing values of such securities on the relevant market, but may be fair valued pursuant to procedures established by the Board if market conditions change significantly after the close of the foreign market, but prior to the close of business on the day the securities are being valued. Debt obligations for which market quotations are readily available are valued at the average of the latest bid and asked prices. If there were no asked prices quoted on such day, the security is valued using the closing bid price. Such debt obligations are valued through prices provided by a Pricing Service approved by the Board. Certain securities are valued principally using dealer quotations.
Securities and assets for which market quotations are not readily available are fair valued as determined by the Board. Fair valuation methodologies and procedures may include, but are not limited to: analysis and review of available financial and non-financial information about the company; comparisons with the valuation and changes in valuation of similar securities, including a comparison of foreign securities with the equivalent U.S. dollar value American Depositary Receipt securities at the close of the U.S. exchange; and evaluation of any other information that could be indicative of the value of the security.
The inputs and valuation techniques used to measure fair value of the Fund’s investments are summarized into three levels as described in the hierarchy below:
| | ● | | Level 1 — quoted prices in active markets for identical securities; |
11
The Gabelli Global Rising Income and Dividend Fund
Notes to Financial Statements (Continued)
| | ● | | Level 2 — other significant observable inputs (including quoted prices for similar securities, interest rates, prepayment speeds, credit risk, etc.); and |
| | ● | | Level 3 — significant unobservable inputs (including the Board’s determinations as to the fair value of investments). |
A financial instrument’s level within the fair value hierarchy is based on the lowest level of any input both individually and in the aggregate that is significant to the fair value measurement. The inputs or methodology used for valuing securities are not necessarily an indication of the risk associated with investing in those securities. The summary of the Fund’s investments in securities by inputs used to value the Fund’s investments as of December 31, 2017 is as follows:
| | | | | | | | | | | | | | | | | | | | |
| | | Level 1 | | Level 2 Other Significant | | Level 3 Significant | | Total Market Value |
| | | Quoted Prices | | Observable Inputs | | Unobservable Inputs | | at 12/31/17 |
INVESTMENTS IN SECURITIES: | | | | | | | | | | | | | | | | | | | | |
ASSETS (Market Value): | | | | | | | | | | | | | | | | | | | | |
Common Stocks: | | | | | | | | | | | | | | | | | | | | |
Automotive: Parts and Accessories | | | $ | 1,356,995 | | | | | — | | | | $ | 40,000 | | | | $ | 1,396,995 | |
Energy and Utilities | | | | 1,849,291 | | | | | — | | | | | 0 | | | | | 1,849,291 | |
Food and Beverage | | | | 10,075,361 | | | | $ | 153,360 | | | | | — | | | | | 10,228,721 | |
Other Industries (a) | | | | 39,876,920 | | | | | — | | | | | — | | | | | 39,876,920 | |
Total Common Stocks | | | | 53,158,567 | | | | | 153,360 | | | | | 40,000 | | | | | 53,351,927 | |
Convertible Corporate Bonds (a) | | | | — | | | | | 1,359,125 | | | | | — | | | | | 1,359,125 | |
Mandatory Convertible Securities (a) | | | | 216,400 | | | | | — | | | | | — | | | | | 216,400 | |
U.S. Government Obligations | | | | — | | | | | 15,462,060 | | | | | — | | | | | 15,462,060 | |
TOTAL INVESTMENTS IN
SECURITIES – ASSETS | | | $ | 53,374,967 | | | | $ | 16,974,545 | | | | $ | 40,000 | | | | $ | 70,389,512 | |
| (a) | Please refer to the Schedule of Investments for the industry classifications of these portfolio holdings. |
The Fund did not have material transfers among Level 1, Level 2, and Level 3 during the year ended December 31, 2017. The Fund’s policy is to recognize transfers among Levels as of the beginning of the reporting period.
Additional Information to Evaluate Qualitative Information.
General. The Fund uses recognized industry pricing services – approved by the Board and unaffiliated with the Adviser – to value most of its securities, and uses broker quotes provided by market makers of securities not valued by these and other recognized pricing sources. Several different pricing feeds are received to value domestic equity securities, international equity securities, preferred equity securities, and fixed income securities. The data within these feeds are ultimately sourced from major stock exchanges and trading systems where these securities trade. The prices supplied by external sources are checked by obtaining quotations or actual transaction prices from market participants. If a price obtained from the pricing source is deemed unreliable, prices will be sought from another pricing service or from a broker/dealer that trades that security or similar securities.
Fair Valuation. Fair valued securities may be common or preferred equities, warrants, options, rights, or fixed income obligations. Where appropriate, Level 3 securities are those for which market quotations are not available, such as securities not traded for several days, or for which current bids are not available, or which are restricted as to transfer. When fair valuing a security, factors to consider include recent prices of comparable securities that are publicly traded, reliable prices of securities not publicly traded, the use of valuation models, current analyst reports, valuing the income or cash flow of the issuer, or cost if the preceding factors do not
12
The Gabelli Global Rising Income and Dividend Fund
Notes to Financial Statements (Continued)
apply. A significant change in the unobservable inputs could result in a lower or higher value in Level 3 securities. The circumstances of Level 3 securities are frequently monitored to determine if fair valuation measures continue to apply.
The Adviser reports quarterly to the Board the results of the application of fair valuation policies and procedures. These may include backtesting the prices realized in subsequent trades of these fair valued securities to fair values previously recognized.
Derivative Financial Instruments. The Fund may engage in various portfolio investment strategies by investing in derivative financial instruments for the purposes of increasing the income of the Fund, hedging against changes in the value of its portfolio securities and in the value of securities it intends to purchase, or hedging against a specific transaction with respect to either the currency in which the transaction is denominated or another currency. Investing in certain derivative financial instruments, including participation in the options, futures, or swap markets, entails certain execution, liquidity, hedging, tax, and securities, interest, credit, or currency market risks. Losses may arise if the Adviser’s prediction of movements in the direction of the securities, foreign currency, and interest rate markets is inaccurate. Losses may also arise if the counterparty does not perform its duties under a contract, or that, in the event of default, the Fund may be delayed in or prevented from obtaining payments or other contractual remedies owed to it under derivative contracts. The creditworthiness of the counterparties is closely monitored in order to minimize these risks. Participation in derivative transactions involves investment risks, transaction costs, and potential losses to which the Fund would not be subject absent the use of these strategies. The consequences of these risks, transaction costs, and losses may have a negative impact on the Fund’s ability to pay distributions.
Collateral requirements differ by type of derivative. Collateral requirements are set by the broker or exchange clearing house for exchange traded derivatives, while collateral terms are contract specific for derivatives traded over-the-counter. Securities pledged to cover obligations of the Fund under derivative contracts are noted in the Schedule of Investments. Cash collateral, if any, pledged for the same purpose will be reported separately in the Statement of Assets and Liabilities.
The Fund’s policy with respect to offsetting is that, absent an event of default by the counterparty or a termination of the agreement, the master agreement does not result in an offset of reported amounts of financial assets and financial liabilities in the Statement of Assets and Liabilities across transactions between the Fund and the applicable counterparty. The enforceability of the right to offset may vary by jurisdiction.
The Fund’s derivative contracts held at December 31, 2017, if any, are not accounted for as hedging instruments under GAAP and are disclosed in the Schedule of Investments together with the related counterparty.
Forward Foreign Exchange Contracts. The Fund may engage in forward foreign exchange contracts for the purpose of hedging a specific transaction with respect to either the currency in which the transaction is denominated or another currency as deemed appropriate by the Adviser. Forward foreign exchange contracts are valued at the forward rate and are marked-to-market daily. The change in market value is included in unrealized appreciation/depreciation on investments and foreign currency translations. When the contract is closed, the Fund records a realized gain or loss equal to the difference between the value of the contract at the time it was opened and the value at the time it was closed.
13
The Gabelli Global Rising Income and Dividend Fund
Notes to Financial Statements (Continued)
The use of forward foreign exchange contracts does not eliminate fluctuations in the underlying prices of the Fund’s portfolio securities, but it does establish a rate of exchange that can be achieved in the future. Although forward foreign exchange contracts limit the risk of loss due to a decline in the value of the hedged currency, they also limit any potential gain that might result should the value of the currency increase. As of December 31, 2017, the Fund held no forward foreign exchange contracts.
Securities Sold Short. The Fund may enter into short sale transactions. Short selling involves selling securities that may or may not be owned and, at times, borrowing the same securities for delivery to the purchaser, with an obligation to replace such borrowed securities at a later date. The proceeds received from short sales are recorded as liabilities and the Fund records an unrealized gain or loss to the extent of the difference between the proceeds received and the value of an open short position on the day of determination. The Fund records a realized gain or loss when the short position is closed out. By entering into a short sale, the Fund bears the market risk of an unfavorable change in the price of the security sold short. Dividends on short sales are recorded as an expense by the Fund on the ex-dividend date and interest expense is recorded on the accrual basis. The broker retains collateral for the value of the open positions, which is adjusted periodically as the value of the position fluctuates. At December 31, 2017, there were no short sales outstanding.
Foreign Currency Translations. The books and records of the Fund are maintained in U.S. dollars. Foreign currencies, investments, and other assets and liabilities are translated into U.S. dollars at current exchange rates. Purchases and sales of investment securities, income, and expenses are translated at the exchange rate prevailing on the respective dates of such transactions. Unrealized gains and losses that result from changes in foreign exchange rates and/or changes in market prices of securities have been included in unrealized appreciation/depreciation on investments and foreign currency translations. Net realized foreign currency gains and losses resulting from changes in exchange rates include foreign currency gains and losses between trade date and settlement date on investment securities transactions, foreign currency transactions, and the difference between the amounts of interest and dividends recorded on the books of the Fund and the amounts actually received. The portion of foreign currency gains and losses related to fluctuation in exchange rates between the initial purchase trade date and subsequent sale trade date is included in realized gain/(loss) on investments.
Foreign Securities. The Fund may directly purchase securities of foreign issuers. Investing in securities of foreign issuers involves special risks not typically associated with investing in securities of U.S. issuers. The risks include possible revaluation of currencies, the inability to repatriate funds, less complete financial information about companies, and possible future adverse political and economic developments. Moreover, securities of many foreign issuers and their markets may be less liquid and their prices more volatile than those of securities of comparable U.S. issuers.
Foreign Taxes. The Fund may be subject to foreign taxes on income, gains on investments, or currency repatriation, a portion of which may be recoverable. The Fund will accrue such taxes and recoveries as applicable, based upon its current interpretation of tax rules and regulations that exist in the markets in which it invests.
Restricted Securities. The Fund may invest up to 15% of its net assets in securities for which the markets are restricted. Restricted securities include securities whose disposition is subject to substantial legal or contractual restrictions. The sale of restricted securities often requires more time and results in higher brokerage charges
14
The Gabelli Global Rising Income and Dividend Fund
Notes to Financial Statements (Continued)
or dealer discounts and other selling expenses than does the sale of securities eligible for trading on national securities exchanges or in the over-the-counter markets. Restricted securities may sell at a price lower than similar securities that are not subject to restrictions on resale. Securities freely saleable among qualified institutional investors under special rules adopted by the SEC may be treated as liquid if they satisfy liquidity standards established by the Board. The continued liquidity of such securities is not as well assured as that of publicly traded securities, and accordingly the Board will monitor their liquidity. For the restricted securities the Fund held as of December 31, 2017, refer to the Schedule of Investments.
Securities Transactions and Investment Income. Securities transactions are accounted for on the trade date with realized gain or loss on investments determined by using the identified cost method. Interest income (including amortization of premium and accretion of discount) is recorded on the accrual basis. Premiums and discounts on debt securities are amortized using the effective yield to maturity method. Dividend income is recorded on the ex-dividend date, except for certain dividends from foreign securities that are recorded as soon after the ex-dividend date as the Fund becomes aware of such dividends.
Determination of Net Asset Value and Calculation of Expenses. Certain administrative expenses are common to, and allocated among, various affiliated funds. Such allocations are made on the basis of each fund’s average net assets or other criteria directly affecting the expenses as determined by the Adviser pursuant to procedures established by the Board.
In calculating the NAV per share of each class, investment income, realized and unrealized gains and losses, redemption fees, and expenses other than class specific expenses are allocated daily to each class of shares based upon the proportion of net assets of each class at the beginning of each day. Distribution expenses are borne solely by the class incurring the expense.
Distributions to Shareholders. Distributions to shareholders are recorded on the ex-dividend date. Distributions to shareholders are based on income and capital gains as determined in accordance with federal income tax regulations, which may differ from income and capital gains as determined under GAAP. These differences are primarily due to differing treatments of income and gains on various investment securities and foreign currency transactions held by the Fund, timing differences, and differing characterizations of distributions made by the Fund. Distributions from net investment income for federal income tax purposes include net realized gains on foreign currency transactions. These book/tax differences are either temporary or permanent in nature. To the extent these differences are permanent, adjustments are made to the appropriate capital accounts in the period when the differences arise. Permanent differences were primarily due to reversals of mark-to-market relating to investments considered no longer to be passive foreign investments, defaulted security accruals, reclasses of realized foreign currency and treatment of sales relating to passive foreign investment companies. These reclassifications have no impact on the NAV of the Fund. For the year ended December 31, 2017, reclassifications were made to decrease accumulated distributions in excess of net investment income by $127,533 and increase accumulated distributions in excess of net realized gain on investments and foreign currency transactions by $127,484, with an offsetting adjustment to paid-in capital.
15
The Gabelli Global Rising Income and Dividend Fund
Notes to Financial Statements (Continued)
The tax character of distributions paid during the years ended December 31, 2017 and 2016 were as follows:
| | | | | | | | | | |
| | | Year Ended | | Year Ended |
| | | December 31, 2017 | | December 31, 2016 |
Distributions paid from: | | | | | | | | | | |
Ordinary income | | | | $ 922,020 | | | | | $559,988 | |
Net long term capital gains | | | | 248,661 | | | | | — | |
Return of capital | | | | 44,568 | | | | | — | |
| | | | | | | | | | |
Total | | | | $1,215,249 | | | | | $559,988 | |
| | | | | | | | | | |
Provision for Income Taxes. The Fund intends to continue to qualify as a regulated investment company under Subchapter M of the Internal Revenue Code of 1986, as amended (the “Code”). It is the policy of the Fund to comply with the requirements of the Code applicable to regulated investment companies and to distribute substantially all of its net investment company taxable income and net capital gains. Therefore, no provision for federal income taxes is required.
At December 31, 2017, the components of accumulated earnings/losses on a tax basis were as follows:
| | | | |
Net unrealized appreciation on investments, securities sold short, and foreign currency translations | | $ | 11,423,407 | |
| | | | |
Total | | $ | 11,423,407 | |
| | | | |
The Fund has utilized capital loss carry forward of $179,441.
At December 31, 2017, the differences between book basis and tax basis unrealized appreciation were primarily due to deferral of losses from wash sales for tax purposes, mark-to-market adjustments on investments in passive foreign investment companies.
The following summarizes the tax cost of investments and the related net unrealized appreciation at December 31, 2017:
| | | | | | | | | | |
| | | | | | Gross | | Gross | | |
| | | | | | Unrealized | | Unrealized | | Net Unrealized |
| | | Cost | | | Appreciation | | Depreciation | | Appreciation |
Investments | | $ | 58,966,860 | | | $12,689,248 | | $(1,266,596) | | $11,422,652 |
The Fund is required to evaluate tax positions taken or expected to be taken in the course of preparing the Fund’s tax returns to determine whether the tax positions are “more-likely-than-not” of being sustained by the applicable tax authority. Income tax and related interest and penalties would be recognized by the Fund as tax expense in the Statement of Operations if the tax positions were deemed not to meet the more-likely-than-not threshold. As of December 31, 2017, the Adviser has reviewed all open tax years and concluded that there was no impact to the Fund’s net assets or results of operations. The Fund’s federal and state tax returns for the prior three fiscal years remain open, subject to examination. On an ongoing basis, the Adviser will monitor the Fund’s tax positions to determine if adjustments to this conclusion are necessary.
3. Investment Advisory Agreement and Other Transactions. The Fund has entered into an investment advisory agreement (the “Advisory Agreement”) with the Adviser which provides that the Fund will pay the Adviser a fee, computed daily and paid monthly, at the annual rate of 1.00% of the value of its average daily net assets. In accordance with the Advisory Agreement, the Adviser provides a continuous investment program for the Fund’s portfolio, oversees the administration of all aspects of the Fund’s business and affairs, and pays the compensation of all Officers and Directors of the Fund who are affiliated persons of the Adviser.
16
The Gabelli Global Rising Income and Dividend Fund
Notes to Financial Statements (Continued)
The Adviser has contractually agreed to waive its investment advisory fee and/or to reimburse expenses of the Fund to the extent necessary to maintain the annualized total operating expenses of the Fund (excluding brokerage, acquired fund fees and expenses, interest, taxes, and extraordinary expenses) until at least April 30, 2019, at no more than 2.00%, 2.00%, 2.75%, and 1.00% of the value of the Fund’s average daily net assets for Class AAA, Class A, Class C, and Class I Shares, respectively. The agreement is renewable annually. In addition, the Fund has agreed, during the two year period following any waiver or reimbursement by the Adviser, to repay such amount to the extent, after giving effect to the repayment, such adjusted annualized total operating expenses of the Fund would not exceed 1.00% of the value of the Fund’s average daily net assets for Class I. This arrangement is in effect through April 30, 2018. For the year ended December 31, 2017, the Adviser reimbursed certain Class I expenses in the amount of $175,468. At December 31, 2017, the cumulative amount which the Class I Shares may repay the Adviser, subject to the terms above, is $211,486:
| | | | |
For the year ended December 31, 2016, expiring December 31, 2018 | | $ | 36,018 | |
For the year ended December 31, 2017, expiring December 31, 2019 | | | 175,468 | |
| | | | |
| | $ | 211,486 | |
| | | | |
The Corporation pays each Director who is not considered to be an affiliated person an annual retainer of $6,000 plus $1,000 for each Board meeting attended, and they are reimbursed for any out of pocket expenses incurred in attending meetings. All Board committee members receive $1,000 per meeting attended. The Chairman of the Audit Committee receives an annual fee of $3,000, and the Lead Director receives an annual fee of $2,000. A Director may receive a single meeting fee, allocated among the participating funds, for attending certain meetings held on behalf of multiple funds. Directors who are directors or employees of the Adviser or an affiliated company receive no compensation or expense reimbursement from the Corporation.
4. Distribution Plan. The Fund’s Board has adopted a distribution plan (the “Plan”) for each class of shares, except for Class I Shares, pursuant to Rule 12b-1 under the 1940 Act. Under the Class AAA, Class A, and Class C Share Plans, payments are authorized to G.distributors, LLC (the “Distributor”), an affiliate of the Adviser, at annual rates of 0.25%, 0.25%, and 1.00%, respectively, of the average daily net assets of those classes, the annual limitations under each Plan. Such payments are accrued daily and paid monthly.
5. Portfolio Securities. Purchases and sales of securities during the year ended December 31, 2017, other than short term securities and U.S. Government obligations, aggregated $20,987,590 and $10,566,348, respectively.
6. Transactions with Affiliates and Other Arrangements. During the year ended December 31, 2017, the Fund paid brokerage commissions on security trades of $12,113 to G.research, LLC, an affiliate of the Adviser. Additionally, the Distributor retained a total of $3,725 from investors representing commissions (sales charges and underwriting fees) on sales and redemptions of Fund shares.
The Fund received credits from a designated broker who agreed to pay certain Fund operating expenses. The amount of such expenses paid through this directed brokerage arrangement during this period was $1,627.
The cost of calculating the Fund’s NAV per share is a Fund expense pursuant to the Advisory Agreement. The Adviser did not seek a reimbursement during the year ended December 31, 2017.
7. Line of Credit. The Fund participates in an unsecured line of credit which expires on March 8, 2018 and may be renewed annually, of up to $75,000,000 under which it may borrow up to 10% of its net assets from
17
The Gabelli Global Rising Income and Dividend Fund
Notes to Financial Statements (Continued)
the custodian for temporary borrowing purposes. Borrowings under this arrangement bear interest at a floating rate equal to the higher of the overnight Federal Funds rate plus 125 basis points or the 30-day LIBOR plus 125 basis points in effect on that day. This amount, if any, would be included in “Interest expense” in the Statement of Operations. During the year ended December 31, 2017, there were no borrowings under the line of credit.
8. Capital Stock. The Fund offers four classes of shares – Class AAA Shares, Class A Shares, Class C Shares, and Class I Shares. Class AAA and Class I Shares are offered without a sales charge. Class A Shares are subject to a maximum front-end sales charge of 5.75%, and Class C Shares are subject to a 1.00% contingent deferred sales charge for one year after purchase.
The Fund imposes a redemption fee of 2.00% on all classes of shares that are redeemed or exchanged on or before the seventh day after the date of a purchase. The redemption fee is deducted from the proceeds otherwise payable to the redeeming shareholders and is retained by the Fund as an increase in paid-in capital. The redemption fees retained by the Fund during the years ended December 31, 2017 and 2016, if any, can be found in the Statement of Changes in Net Assets under Redemption Fees.
Transactions in shares of capital stock were as follows:
| | | | | | | | | | | | | | | | |
| | | Year Ended | | | Year Ended | |
| | | December 31, 2017 | | | December 31, 2016 | |
| | | Shares | | | Amount | | | Shares | | | Amount | |
Class AAA | | | | | | | | | | | | | | | | |
Shares sold | | | 95,643 | | | $ | 2,480,225 | | | | 19,227 | | | $ | 430,814 | |
Shares issued upon reinvestment of distributions | | | 3,606 | | | | 97,910 | | | | 1,932 | | | | 43,974 | |
Shares redeemed. | | | (18,890 | ) | | | (492,210 | ) | | | (145,369 | ) | | | (3,072,133 | ) |
| | | | | | | | | | | | | | | | |
Net increase/(decrease) | | | 80,359 | | | $ | 2,085,925 | | | | (124,210 | ) | | $ | (2,597,345 | ) |
| | | | | | | | | | | | | | | | |
Class A | | | | | | | | | | | | | | | | |
Shares sold | | | 31,272 | | | $ | 836,369 | | | | 3,017 | | | $ | 66,861 | |
Shares issued upon reinvestment of distributions | | | 554 | | | | 15,065 | | | | 166 | | | | 3,780 | |
Shares redeemed. | | | (9,621 | ) | | | (248,860 | ) | | | (13,902 | ) | | | (308,682 | ) |
| | | | | | | | | | | | | | | | |
Net increase/(decrease) | | | 22,205 | | | $ | 602,574 | | | | (10,719 | ) | | $ | (238,041 | ) |
| | | | | | | | | | | | | | | | |
Class C | | | | | | | | | | | | | | | | |
Shares sold | | | 73,832 | | | $ | 1,646,473 | | | | 18,543 | | | $ | 347,754 | |
Shares issued upon reinvestment of distributions | | | 1,028 | | | | 23,527 | | | | 201 | | | | 3,879 | |
Shares redeemed. | | | (19,350 | ) | | | (424,748 | ) | | | (13,476 | ) | | | (256,654 | ) |
| | | | | | | | | | | | | | | | |
Net increase | | | 55,510 | | | $ | 1,245,252 | | | | 5,268 | | | $ | 94,979 | |
| | | | | | | | | | | | | | | | |
Class I | | | | | | | | | | | | | | | | |
Shares sold | | | 682,988 | | | $ | 17,585,070 | | | | 27,866 | | | $ | 604,931 | |
Shares issued upon reinvestment of distributions | | | 39,338 | | | | 1,073,522 | | | | 22,101 | | | | 505,002 | |
Shares redeemed. | | | (175,822 | ) | | | (4,503,655 | ) | | | (76,266 | ) | | | (1,700,674 | ) |
| | | | | | | | | | | | | | | | |
Net increase/(decrease) | | | 546,504 | | | $ | 14,154,937 | | | | (26,299 | ) | | $ | (590,741 | ) |
| | | | | | | | | | | | | | | | |
9. Significant Shareholder. As of December 31, 2017, approximately 62% of the Fund was beneficially owned by the Adviser and its affiliates.
10. Indemnifications. The Fund enters into contracts that contain a variety of indemnifications. The Fund’s maximum exposure under these arrangements is unknown. However, the Fund has not had prior claims or losses pursuant to these contracts. Management has reviewed the Fund’s existing contracts and expects the risk of loss to be remote.
18
The Gabelli Global Rising Income and Dividend Fund
Notes to Financial Statements (Continued)
11. Subsequent Events. Management has evaluated the impact on the Fund of all subsequent events occurring through the date the financial statements were issued and has determined that there were no subsequent events requiring recognition or disclosure in the financial statements.
19
The Gabelli Global Rising Income and Dividend Fund
Report of Independent Registered Public Accounting Firm
To the Shareholders and the Board of Directors of
The Gabelli Global Rising Income and Dividend Fund
Opinion on the Financial Statements
We have audited the accompanying statement of assets and liabilities of The Gabelli Global Rising Income and Dividend Fund (the “Fund”) (one of the funds constituting GAMCO Global Series Funds, Inc. (the “Corporation”)), including the schedule of investments, as of December 31, 2017, and the related statement of operations for the year then ended, the statements of changes in net assets for each of the two years in the period then ended, the financial highlights for each of the five years in the period then ended and the related notes (collectively referred to as the “financial statements”). In our opinion, the financial statements present fairly, in all material respects, the financial position of the Fund (one of the funds constituting GAMCO Global Series Funds, Inc.) at December 31, 2017, the results of its operations for the year then ended, the changes in its net assets for each of the two years in the period then ended and its financial highlights for each of the five years in the period then ended, in conformity with U.S. generally accepted accounting principles.
Basis for Opinion
These financial statements are the responsibility of the Corporation’s management. Our responsibility is to express an opinion on the Fund’s financial statements based on our audits. We are a public accounting firm registered with the Public Company Accounting Oversight Board (United States) (“PCAOB”) and are required to be independent with respect to the Corporation in accordance with the U.S. federal securities laws and the applicable rules and regulations of the Securities and Exchange Commission and the PCAOB.
We conducted our audits in accordance with the standards of the PCAOB. Those standards require that we plan and perform the audit to obtain reasonable assurance about whether the financial statements and financial highlights are free of material misstatement, whether due to error or fraud. The Corporation is not required to have, nor were we engaged to perform, an audit of the Corporation’s internal control over financial reporting. As part of our audits, we are required to obtain an understanding of internal control over financial reporting, but not for the purpose of expressing an opinion on the effectiveness of the Corporation’s internal control over financial reporting. Accordingly, we express no such opinion.
Our audits included performing procedures to assess the risks of material misstatement of the financial statements, whether due to error or fraud, and performing procedures that respond to those risks. Such procedures included examining, on a test basis, evidence regarding the amounts and disclosures in the financial statements. Our procedures included confirmation of securities owned as of December 31, 2017, by correspondence with the custodian. Our audits also included evaluating the accounting principles used and significant estimates made by management, as well as evaluating the overall presentation of the financial statements. We believe that our audits provide a reasonable basis for our opinion.

We have served as the auditor of one or more Gabelli/GAMCO Funds investment companies since 1992.
Philadelphia, Pennsylvania
February 28, 2018
20
The Gabelli Global Rising Income and Dividend Fund
Board Consideration and Re-Approval of Investment Advisory Agreement (Unaudited)
During the six months ended December 31, 2017, the Board of Directors of the Corporation approved the continuation of the investment advisory agreement with the Adviser for the Fund on the basis of the recommendation by the directors (the “Independent Board Members”) who are not “interested persons” of the Fund. The following paragraphs summarize the material information and factors considered by the Independent Board Members as well as their conclusions relative to such factors.
Nature, Extent, and Quality of Services. The Independent Board Members considered information regarding the portfolio managers, the depth of the analyst pool available to the Adviser and the Fund’s portfolio managers, the scope of supervisory, administrative, shareholder and other services supervised or provided by the Adviser and the absence of significant service problems reported to the Board. The Independent Board Members noted the experience, length of service and reputation of the Fund’s portfolio managers.
Investment Performance. The Independent Board Members reviewed the short, medium, and long term performance of the Fund (as of September 30, 2017) against a peer group of seven other comparable funds prepared by the Adviser (the “Adviser Peer Group”), and against a peer group prepared by Broadridge (the “Broadridge Performance Peer Group”) consisting of all retail and institutional global equity income funds, regardless of asset size or primary channel of distribution, as represented by the Lipper Global Equity Income Fund Index. The Independent Board Members noted that the Fund’s performance was in the first (highest) quartile for the one year period, the second quartile for the three year period, and the fourth (lowest) quartile for the five and ten year periods, as measured against the Adviser Peer Group. Against the Broadridge Performance Peer Group, the Independent Board Members noted that the Fund’s performance was in the first (highest) quintile for the one and three year periods, and the fourth quintile for the five and ten year periods. The Independent Board Members discussed the peer groups in relation to the Fund’s shift in strategy several years ago, and also noted the resulting limited utility of the five year peer performance comparison.
Profitability. The Independent Board Members reviewed summary data regarding the profitability of the Fund to the Adviser both with a pro rata administrative overhead charge and with a stand alone administrative charge. The Independent Board Members also noted that a portion of the Fund’s portfolio transactions were executed by an affiliated broker of the Adviser and that another affiliated broker of the Adviser received distribution fees and minor amounts of sales commissions.
Economies of Scale. The Independent Board Members discussed the major elements of the Adviser’s cost structure, the relationship of those elements to potential economies of scale and reviewed data provided by the Adviser.
Sharing of Economies of Scale. The Independent Board Members noted that the investment management fee schedule for the Fund does not take into account any potential economies of scale that may develop.
Service and Cost Comparisons. The Independent Board Members compared the expense ratios of the investment management fee, other expenses and total expenses of the Fund to similar expense ratios of the Adviser Peer Group and a peer group of nine other global equity income funds selected by Broadridge (the “Broadridge Expense Peer Group”), and noted that the Adviser’s management fee includes substantially all administrative services of the Fund as well as investment advisory services. The Board Members noted that the Fund’s total expense ratio was the highest of both peer groups and that, although the Fund’s size was significantly lower than the average of the Adviser Peer Group, the Fund’s size was only slightly lower than the average of the
21
The Gabelli Global Rising Income and Dividend Fund
Board Consideration and Re-Approval of Investment Advisory Agreement (Unaudited) (Continued)
Broadridge Expense Peer Group. The Independent Board Members also noted that the advisory fee structure was the same as that in effect for most of the Gabelli funds. The Independent Board Members were presented with, but did not consider to be material to their decision, various information comparing the advisory fee to the fee for other types of accounts managed by the Adviser.
Conclusions. The Independent Board Members concluded that the Fund enjoyed highly experienced portfolio management services, good ancillary services and had an acceptable performance record since it had substantially changed its investment focus in 2014. The Independent Board Members also concluded that the Fund’s expense ratios and profitability to the Adviser were reasonable, and that economies of scale were not a significant factor in their thinking at this time. The Board Members did not view the potential profitability of ancillary services as material to their decision. On the basis of the foregoing and without assigning particular weight to any single conclusion, the Independent Board Members determined to recommend continuation of the investment management agreement to the full Board.
Based on a consideration of all these factors in their totality, the Board Members, including all of the Independent Board Members, determined that each Fund’s advisory fee was fair and reasonable with respect to the quality of services provided and in light of the other factors described above that the Board deemed relevant. Accordingly, the Board Members determined to approve the continuation of each Fund’s Advisory Agreement. The Board Members based their decision on evaluations of all these factors as a whole and did not consider any one factor as all-important or controlling.
22
The Gabelli Global Rising Income and Dividend Fund
Additional Fund Information (Unaudited)
The business and affairs of the Fund are managed under the direction of the Corporation’s Board of Directors. Information pertaining to the Directors and officers of the Fund is set forth below. The Corporation’s Statement of Additional Information includes additional information about the Fund’s Directors and is available without charge, upon request, by calling 800-GABELLI (800-422-3554) or by writing to The Gabelli Global Rising Income and Dividend Fund at One Corporate Center, Rye, NY 10580-1422.
| | | | | | | | |
Name, Position(s) Address1 and Age | | Term of Office and Length of Time Served2 | | Number of Funds in Fund Complex Overseen by Director | | Principal Occupation(s) During Past Five Years | | Other Directorships Held by Director3 |
| | | | |
| INTERESTED DIRECTORS4 : | | | | | | | | |
| | | | |
Mario J. Gabelli, CFA Director and Chief Investment Officer Age: 75 | | Since 1993 | | 32 | | Chairman, Chief Executive Officer, and Chief Investment Officer– Value Portfolios of GAMCO Investors, Inc. and Chief Investment Officer– Value Portfolios of Gabelli Funds, LLC and GAMCO Asset Management Inc.; Director/ Trustee or Chief Investment Officer of other registered investment companies within the Gabelli/GAMCO Fund Complex; Chief Executive Officer of GGCP, Inc.; Executive Chairman of Associated Capital Group, Inc. | | Director of Morgan Group Holdings, Inc. (holding company); Chairman of the Board and Chief Executive Officer of LICT Corp. (multimedia and communication services company); Director of CIBL, Inc. (broadcasting and wireless communications); Director of ICTC Group Inc. (communications) |
John D. Gabelli Director Age: 73 | | Since 1993 | | 10 | | Senior Vice President of G.research, LLC | | — |
| | | | |
INDEPENDENT DIRECTORS5 : | | | | | | | | |
| | | | |
E. Val Cerutti Director Age: 78 | | Since 2001 | | 7 | | Chief Executive Officer of Cerutti Consultants, Inc. | | Director of The LGL Group, Inc. (diversified manufacturing) (1990-2009) |
| | | | |
Anthony J. Colavita Director Age: 82 | | Since 1993 | | 28 | | President of the law firm of Anthony J. Colavita, P.C. | | — |
| | | | |
Arthur V. Ferrara Director Age: 87 | | Since 2001 | | 8 | | Former Chairman of the Board and Chief Executive Officer of The Guardian Life Insurance Company of America (1993-1995) | | — |
| | | | |
Werner J. Roeder Director Age: 77 | | Since 1993 | | 23 | | Retired physician; Former Vice President of Medical Affairs (Medical Director) of New York Presbyterian/Lawrence Hospital (1999-2014) | | — |
| | | | |
Anthonie C. van Ekris Director Age: 83 | | Since 1993 | | 22 | | Chairman and Chief Executive Officer of BALMAC International, Inc. (global import/ export company) | | — |
| | | | |
Salvatore J. Zizza Director Age: 72 | | Since 2004 | | 30 | | President of Zizza & Associates Corp. (private holding company); Chairman of Harbor Diversified, Inc. (pharmaceuticals); Chairman of BAM (semiconductor and aerospace manufacturing); Chairman of Bergen Cove Realty Inc.; Chairman of Metropolitan Paper Recycling Inc. (recycling) (2005-2014) | | Director and Vice Chairman of Trans-Lux Corporation (business services); Director and Chairman of Harbor Diversified Inc. (pharmaceuticals) |
23
The Gabelli Global Rising Income and Dividend Fund
Additional Fund Information (Continued) (Unaudited)
| | | | | | | | |
Name, Position(s) Address1 and Age | | | | Term of Office and Length of Time Served2 | | | | Principal Occupation(s) During Past Five Years |
| | | | |
OFFICERS: | | | | | | | | |
| | | | |
Bruce N. Alpert President Age: 66 | | | | Since 2003 | | | | Executive Vice President and Chief Operating Officer of Gabelli Funds, LLC since 1988; Officer of registered investment companies within the Gabelli/GAMCO Fund Complex; Senior Vice President of GAMCO Investors, Inc. since 2008 |
| | | | |
John C. Ball Treasurer Age: 41 | | | | Since 2017 | | | | Treasurer of all the registered investment companies within the Gabelli/GAMCO Fund Complex since 2017; Vice President and Assistant Treasurer of AMG Funds, 2014-2017; Vice President of State Street Corporation, 2007-2014 |
| | | | |
Agnes Mullady Vice President Age: 59 | | | | Since 2006 | | | | Officer of all of the registered investment companies within the Gabelli/GAMCO Fund Complex since 2006; President and Chief Operating Officer of the Fund Division of Gabelli Funds, LLC since 2015; Chief Executive Officer of G.distributors, LLC since 2010; Senior Vice President of GAMCO Investors, Inc. since 2009; Vice President of Gabelli Funds, LLC since 2007; Executive Vice President of Associated Capital Group, Inc. since 2016 |
| | | | |
Andrea R. Mango Secretary Age: 45 | | | | Since 2013 | | | | Vice President of GAMCO Investors, Inc. since 2016; Counsel of Gabelli Funds, LLC since 2013; Secretary of all registered investment companies within the Gabelli/GAMCO Fund Complex since 2013; Vice President of all closed-end funds within the Gabelli/GAMCO Fund Complex since 2014; Corporate Vice President within the Corporate Compliance Department of New York Life Insurance Company, 2011-2013 |
| | | | |
Richard J. Walz Chief Compliance Officer Age: 58 | | | | Since 2013 | | | | Chief Compliance Officer of all of the registered investment companies within the Gabelli/GAMCO Fund Complex since 2013; Chief Compliance Officer of AEGON USA Investment Management, 2011-2013 |
| 1 | Address: One Corporate Center, Rye, NY 10580-1422, unless otherwise noted. |
| 2 | Each Director will hold office for an indefinite term until the earliest of (i) the next meeting of shareholders, if any, called for the purpose of considering the election or re-election of such Director and until the election and qualification of his or her successor, if any, elected at such meeting, or (ii) the date a Director resigns or retires, or a Director is removed by the Board of Directors or shareholders, in accordance with the Corporation’s By-Laws and Articles of Incorporation. Each officer will hold office for an indefinite term until the date he or she resigns or retires or until his or her successor is elected and qualified. |
| 3 | This column includes only directorships of companies required to report to the SEC under the Securities Exchange Act of 1934, as amended, i.e., public companies, or other investment companies registered under the 1940 Act. |
| 4 | “Interested person” of the Corporation as defined in the 1940 Act. Messrs. Mario J. Gabelli and John D. Gabelli, who are brothers, are each considered an “interested person” because of their affiliation with Gabelli Funds, LLC which acts as the Corporation’s investment adviser. |
| 5 | Directors who are not interested persons are considered “Independent” Directors. |
24
| | | | |
| | | Gabelli/GAMCO Funds and Your Personal Privacy | | |
| | | Who are we? The Gabelli/GAMCO Funds are investment companies registered with the Securities and Exchange Commission under the Investment Company Act of 1940. We are managed by Gabelli Funds, LLC and GAMCO Asset Management Inc., which are affiliated with GAMCO Investors, Inc. that is a publicly held company with subsidiaries and affiliates that provide investment advisory services for a variety of clients. What kind of non-public information do we collect about you if you become a fund shareholder? If you apply to open an account directly with us, you will be giving us some non-public information about yourself. The non-public information we collect about you is: ● Information you give us on your application form. This could include your name, address, telephone number, social security number, bank account number, and other information. ● Information about your transactions with us, any transactions with our affiliates, and transactions with the entities we hire to provide services to you. This would include information about the shares that you buy or redeem. If we hire someone else to provide services — like a transfer agent — we will also have information about the transactions that you conduct through them. What information do we disclose and to whom do we disclose it? We do not disclose any non-public personal information about our customers or former customers to anyone other than our affiliates, our service providers who need to know such information, and as otherwise permitted by law. If you want to find out what the law permits, you can read the privacy rules adopted by the Securities and Exchange Commission. They are in volume 17 of the Code of Federal Regulations, Part 248. The Commission often posts information about its regulations on its website, www.sec.gov. What do we do to protect your personal information? We restrict access to non-public personal information about you to the people who need to know that information in order to provide services to you or the fund and to ensure that we are complying with the laws governing the securities business. We maintain physical, electronic, and procedural safeguards to keep your personal information confidential. | | |
This page was intentionally left blank.
THE GABELLI GLOBAL RISING INCOME AND DIVIDEND FUND
One Corporate Center
Rye, NY 10580-1422
Portfolio Manager Biography
Mario J. Gabelli, CFA, is Chairman, Chief Executive Officer, and Chief Investment Officer - Value Portfolios of GAMCO Investors, Inc. that he founded in 1977, and Chief Investment Officer - Value Portfolios of Gabelli Funds, LLC and GAMCO Asset Management Inc. He is also Executive Chairman of Associated Capital Group, Inc. Mr. Gabelli is a summa cum laude graduate of Fordham University and holds an MBA degree from Columbia Business School and Honorary Doctorates from Fordham University and Roger Williams University.
2017 TAX NOTICE TO SHAREHOLDERS (Unaudited)
For the year ended December 31, 2017, the Fund paid to shareholders ordinary income distributions (comprised of net investment income and short term capital gains) totaling $0.246, $0.266, $0.174, and $0.387 per share for Class AAA, Class A, Class C, and Class I Shares, respectively, and long term capital gains totaling $248,661, or the maximum allowable. For the year ended December 31, 2017, 27.52% of the ordinary income distribution qualifies for the dividends received deduction available to corporations. The Fund designates 76.79% of the ordinary income distribution as qualified dividend income pursuant to the Jobs and Growth Tax Relief Reconciliation Act of 2003. The Fund designates 21.89% of the ordinary income distribution as qualified interest income pursuant to the Tax Relief, Unemployment Reauthorization, and Job Creation Act of 2010. Also for the year 2017, the Fund passed through foreign tax credits of $0.018, $0.018, $0.018, and $0.018 per share to Class AAA, Class A, Class C, and Class I Shares, respectively.
U.S. Government Income:
The percentage of the ordinary income distribution paid by the Fund during the year ended December 31, 2017 which was derived from U.S. Treasury securities was 3.71%. Such income is exempt from state and local tax in all states. However, many states, including New York and California, allow a tax exemption for a portion of the income earned only if a mutual fund has invested at least 50% of its assets at the end of each quarter of the Fund’s fiscal year in U.S. Government securities. The Fund did not meet this strict requirement in 2017. The percentage of U.S. Government securities held as of December 31, 2017 was 21.92%. Due to the diversity in state and local tax law, it is recommended that you consult your personal tax adviser as to the applicability of the information provided to your specific situation.
All designations are based on financial information available as of the date of this annual report and, accordingly, are subject to change. For each item, it is the intention of the Fund to designate the maximum amount permitted under the Internal Revenue Code and the regulations thereunder.
We have separated the portfolio manager’s commentary from the financial statements and investment portfolio due to corporate governance regulations stipulated by the Sarbanes-Oxley Act of 2002. We have done this to ensure that the content of the portfolio manager’s commentary is unrestricted. Both the commentary and the financial statements, including the portfolio of investments, will be available on our website at www.gabelli.com.
|
GAMCO Global Series Funds, Inc. |
THE GABELLI GLOBAL RISING INCOME |
AND DIVIDEND FUND |
One Corporate Center |
Rye, New York 10580-1422 |
|
t 800-GABELLI (800-422-3554) |
f 914-921-5118 |
e info@gabelli.com |
GABELLI.com |
|
Net Asset Value per share available daily by calling 800-GABELLI after 7:00 P.M. |
| | |
| |
| BOARD OF DIRECTORS | | OFFICERS |
| |
Mario J. Gabelli, CFA Chairman and Chief Executive Officer, GAMCO Investors, Inc. Executive Chairman, Associated Capital Group, Inc. E. Val Cerutti Chief Executive Officer, Cerutti Consultants, Inc. Anthony J. Colavita President, Anthony J. Colavita, P.C. Arthur V. Ferrara Former Chairman and Chief Executive Officer, Guardian Life Insurance Company of America John D. Gabelli Senior Vice President, G.research, LLC Werner J. Roeder Former Medical Director, Lawrence Hospital Anthonie C. van Ekris Chairman, BALMAC International, Inc. Salvatore J. Zizza Chairman, Zizza & Associates Corp. | | Bruce N. Alpert President John C. Ball Treasurer Agnes Mullady Vice President Andrea R. Mango Secretary Richard J. Walz Chief Compliance Officer DISTRIBUTOR G.distributors, LLC CUSTODIAN State Street Bank and Trust Company TRANSFER AGENT AND DIVIDEND DISBURSING AGENT DST Asset Manager Solutions, Inc. LEGAL COUNSEL Skadden, Arps, Slate, Meagher & Flom LLP |
This report is submitted for the general information of the shareholders of The Gabelli Global Rising Income and Dividend Fund. It is not authorized for distribution to prospective investors unless preceded or accompanied by an effective prospectus. |
|
| |
| GAB441Q417AR |

The GAMCO Global Growth Fund
Annual Report — December 31, 2017
(Y)our Portfolio Management Team
| | |
 |
| Caesar M. P. Bryan | | Howard F. Ward, CFA |
To Our Shareholders,
For the year ended December 31, 2017, the net asset value (“NAV”) per Class I Share of The GAMCO Global Growth Fund increased 29.8% compared with an increase of 24.0% for the Morgan Stanley Capital International (“MSCI”) All Country (“AC”) World Index. Other classes of shares are available. See page 3 for performance information for all classes of shares.
Enclosed are the financial statements, including the schedule of investments, as of December 31, 2017.
Performance Discussion (Unaudited)
The Fund’s investment objective is to provide investors with appreciation of capital. Current income is a secondary objective of the Fund.
The Fund’s investment strategy is to invest at least 65% of its total assets in common stocks of companies which the portfolio managers believe are likely to have rapid growth in revenues and earnings and potential for above average capital appreciation or are undervalued. The Fund invests primarily in common stocks of foreign and domestic small-capitalization, mid-capitalization, and large-capitalization issuers. As a “global” fund, the Fund invests in securities of issuers, located in at least three countries, and at least 40% of the Fund’s total net assets are invested in securities of non-U.S. issuers.
After a sluggish start to the year, the U.S. economy grew at a faster than anticipated 3.1% and 3.3% in the second and third quarters, respectively. At 4.1%, unemployment stands at a ten-year low while consumer wealth of nearly $97 trillion is at an all-time high. Housing starts of 1.3 million units continue their steady increase, but remain comfortably below the prior peak of 2.2 million units. The U.S. is in its ninth year of economic expansion, making this the third longest expansion at 101 months, trailing only 1961-1969 and 1991-2001 (those expansions were 106 and 120 months, respectively). Perhaps as important, the global economy is in synchronized expansion, which benefited the Fund. For all of 2017, the Eurozone is set to grow 2.2%, its fastest since 2007 while Japan has accelerated to 1.5%; China is likely to post growth of 6.7%. The stock market rose in the latter half of the year, following President Trump’s agenda on tax reform, deregulation, and fiscal stimulus. The Federal Reserve raised the Federal Funds rate for the fifth time since October of 2014, now ranging from 1.25%-1.50%.
Selected holdings that contributed positively to performance in 2017 were: Tencent Holding Ltd. (4.9% of net assets as of December 31, 2017) which had strong business and revenue growth across multiple business lines including games, digital content, online advertising and payment related services; Facebook Inc. (4.5%) had robust top line growth and digital advertising spending continued to grow at a relatively fast pace; and Keyence Corp. (3.7%) which had record sales, high profit metrics and a relatively strong balance sheet.
Some of our weaker performing holdings during the year were: Schlumberger Ltd. (no longer held as of December 31, 2017) which declined on the ensuing restructuring of the dynamics in the energy markets, as well as the transition to natural gas and renewables and unconventional drilling methods have taken their toll on exploration and production; Celgene Corp. (no longer held) which pipeline setbacks have hampered much of the company’s potential upside; and Subaru Corp. (no longer held) which had inspection scandals, a series of compliance failings in regards to quality control, prompting calls for better governance.
Thank you for your investment in The GAMCO Global Growth Fund.
We appreciate your confidence and trust.
2
Comparative Results
| | | | | | | | | | |
Average Annual Returns through December 31, 2017 (a) (Unaudited) | | Since
Inception |
| | | 1 Year | | 5 Year | | 10 Year | | 15 Year | | (2/7/94) |
Class I (GGGIX) | | 29.84% | | 12.14% | | 6.36% | | 10.24% | | 9.24% |
Class AAA (GICPX) | | 29.02 | | 11.53 | | 5.92 | | 9.94 | | 9.05 |
MSCI AC World Index | | 23.97 | | 10.80 | | 4.65 | | 9.00 | | 7.32(b) |
Lipper Global Large-Cap Growth Fund Classification | | 28.42 | | 11.18 | | 5.40 | | 9.65 | | 7.60 |
Class A (GGGAX) | | 28.98 | | 11.53 | | 5.92 | | 9.94 | | 9.06 |
With sales charge (c) | | 21.56 | | 10.22 | | 5.30 | | 9.51 | | 8.79 |
Class C (GGGCX) | | 28.04 | | 10.69 | | 5.13 | | 9.11 | | 8.44 |
With contingent deferred sales charge (d) | | 27.04 | | 10.69 | | 5.13 | | 9.11 | | 8.44 |
In the current prospectuses dated April 28, 2017, the gross expense ratios for Class AAA, A, C, and I Shares are 1.72%, 1.72%, 2.47%, and 1.47%, respectively, and the net expense ratios for these share classes after contractual reimbursements by Gabelli Funds, LLC, (the “Adviser”) are 1.72%, 1.72%, 2.47%, and 1.00%, respectively. See page 10 for the expense ratios for the year ended December 31, 2017. Class AAA and Class I Shares do not have a sales charge. The maximum sales charge for Class A Shares and Class C Shares is 5.75% and 1.00%, respectively. (a) Returns represent past performance and do not guarantee future results. Total returns and average annual returns reflect changes in share price, reinvestment of distributions, and are net of expenses. Investment returns and the principal value of an investment will fluctuate. When shares are redeemed, they may be worth more or less than their original cost. Current performance may be lower or higher than the performance data presented. Visit www.gabelli.com for performance information as of the most recent month end. Returns for Class I Shares would have been lower had the Adviser not reimbursed certain expenses. The Fund imposes a 2% redemption fee on shares sold or exchanged within seven days after the date of purchase. Investors should carefully consider the investment objectives, risks, charges, and expenses of the Fund before investing. The prospectuses contain information about these and other matters and should be read carefully before investing. To obtain a prospectus, please visit our website at www.gabelli.com. Investing in foreign securities involves risks not ordinarily associated with investments in domestic issues, including currency fluctuation, economic, and political risks. The Class AAA Share NAVs are used to calculate performance for the periods prior to the issuance of Class A Shares, Class C Shares, and Class I Shares on March 2, 2000, March 12, 2000, and January 11, 2008, respectively. The actual performance of the Class A and Class C Shares would have been lower due to the additional fees and expenses associated with these classes of shares. The actual performance of Class I Shares would have been higher due to lower expenses related to this class of shares. The MSCI AC World Index is an unmanaged market capitalization weighted index that is designed to measure the equity market performance of developed and emerging markets. The MSCI AC World Index consists of 45 country indices comprising 24 developed and 21 emerging market country indices. The Lipper Global Large-Cap Growth Fund Classification reflects the performance of mutual funds classified in this particular category. Dividends are considered reinvested. You cannot invest directly in an index. (b) MSCI AC World Index since inception performance is a blend of Gross Performance excluding applicable taxes and Net Performance. This benchmark’s Net Performance began on December 29, 2000. (c) Performance results include the effect of the maximum 5.75% sales charge at the beginning of the period. (d) Assuming payment of the 1% maximum contingent deferred sales charge imposed on redemptions made within one year of purchase. |
COMPARISON OF CHANGE IN VALUE OF A $10,000 INVESTMENT IN
THE GAMCO GLOBAL GROWTH FUND (CLASS AAA SHARES), MSCI AC WORLD INDEX, AND
LIPPER GLOBAL LARGE-CAP GROWTH FUND CLASSIFICATION (Unaudited)
| * | Past performance is not predictive of future results. The performance tables and graph do not reflect the deduction of taxes that a shareholder would pay on Fund distributions or the redemption of Fund shares. |
3
| | | | |
| The GAMCO Global Growth Fund | | | | |
| Disclosure of Fund Expenses (Unaudited) | | | | |
| For the Six Month Period from July 1, 2017 through December 31, 2017 | | | Expense Table | |
We believe it is important for you to understand the impact of fees and expenses regarding your investment. All mutual funds have operating expenses. As a shareholder of a fund, you incur ongoing costs, which include costs for portfolio management, administrative services, and shareholder reports (like this one), among others. Operating expenses, which are deducted from a fund’s gross income, directly reduce the investment return of a fund. When a fund’s expenses are expressed as a percentage of its average net assets, this figure is known as the expense ratio. The following examples are intended to help you understand the ongoing costs (in dollars) of investing in your Fund and to compare these costs with those of other mutual funds. The examples are based on an investment of $1,000 made at the beginning of the period shown and held for the entire period.
The Expense Table below illustrates your Fund’s costs in two ways:
Actual Fund Return: This section provides information about actual account values and actual expenses. You may use this section to help you to estimate the actual expenses that you paid over the period after any fee waivers and expense reimbursements. The “Ending Account Value” shown is derived from the Fund’s actual return during the past six months, and the “Expenses Paid During Period” shows the dollar amount that would have been paid by an investor who started with $1,000 in the Fund. You may use this information, together with the amount you invested, to estimate the expenses that you paid over the period.
To do so, simply divide your account value by $1,000 (for example, an $8,600 account value divided by $1,000 = 8.6), then multiply the result by the number given for your Fund under the heading “Expenses Paid During Period” to estimate the expenses you paid during this period.
Hypothetical 5% Return: This section provides information about hypothetical account values and
hypothetical expenses based on the Fund’s actual expense ratio. It assumes a hypothetical annualized return of 5% before expenses during the period shown. In this case – because the hypothetical return used is not the Fund’s actual return – the results do not apply to your investment and you cannot use the hypothetical account value and expense to estimate the actual ending account balance or expenses you paid for the period. This example is useful in making comparisons of the ongoing costs of investing in the Fund and other funds. To do so, compare this 5% hypothetical example with the 5% hypothetical examples that appear in shareholder reports of other funds.
Please note that the expenses shown in the table are meant to highlight your ongoing costs only and do not reflect any transactional costs such as sales charges (loads), redemption fees, or exchange fees, if any, which are described in the Prospectus. If these costs were applied to your account, your costs would be higher. Therefore, the 5% hypothetical return is useful in comparing ongoing costs only, and will not help you determine the relative total costs of owning different funds. The “Annualized Expense Ratio” represents the actual expenses for the last six months and may be different from the expense ratio in the Financial Highlights which is for the year ended December 31, 2017.
| | | | | | | | | | | | | | | | |
| | | Beginning
Account Value
07/01/17 | | | Ending
Account Value
12/31/17 | | | Annualized
Expense
Ratio | | | Expenses
Paid During
Period* | |
The GAMCO Global Growth Fund | | | | | | | | | |
Actual Fund Return | | | | | | | | | | | | | |
Class AAA | | | $1,000.00 | | | | $1,121.80 | | | | 1.63% | | | | $ 8.72 | |
Class A | | | $1,000.00 | | | | $1,121.80 | | | | 1.63% | | | | $ 8.72 | |
Class C | | | $1,000.00 | | | | $1,117.60 | | | | 2.37% | | | | $12.65 | |
Class I | | | $1,000.00 | | | | $1,125.30 | | | | 1.00% | | | | $ 5.36 | |
Hypothetical 5% Return | | | | | | | | | |
Class AAA | | | $1,000.00 | | | | $1,016.99 | | | | 1.63% | | | | $ 8.29 | |
Class A | | | $1,000.00 | | | | $1,016.99 | | | | 1.63% | | | | $ 8.29 | |
Class C | | | $1,000.00 | | | | $1,013.26 | | | | 2.37% | | | | $12.03 | |
Class I | | | $1,000.00 | | | | $1,020.16 | | | | 1.00% | | | | $ 5.09 | |
| * | Expenses are equal to the Fund’s annualized expense ratio for the last six months multiplied by the average account value over the period, multiplied by the number of days in the most recent fiscal half year (184 days), then divided by 365. |
4
Summary of Portfolio Holdings (Unaudited)
The following table presents portfolio holdings as a percent of net assets as of December 31, 2017:
The GAMCO Global Growth Fund
| | | | |
Information Technology | | | 36.4 | % |
Consumer Discretionary | | | 19.1 | % |
Health Care | | | 12.8 | % |
Industrials | | | 11.3 | % |
Consumer Staples | | | 8.3 | % |
Financials | | | 6.0 | % |
Real Estate | | | 3.6 | % |
| | | | |
Materials | | | 2.3 | % |
U.S. Government Obligations | | | 0.4 | % |
Other Assets and Liabilities (Net) | | | (0.2 | )% |
| | | | |
| | | 100.0 | % |
| | | | |
The Fund files a complete schedule of portfolio holdings with the Securities and Exchange Commission (the “SEC”) for the first and third quarters of each fiscal year on Form N-Q. Shareholders may obtain this information at www.gabelli.com or by calling the Fund at 800-GABELLI (800-422-3554).The Fund’s Form N-Q is available on the SEC’s website at www.sec.gov and may also be reviewed and copied at the SEC’s Public Reference Room in Washington, DC. Information on the operation of the Public Reference Room may be obtained by calling 800-SEC-0330.
Proxy Voting
The Fund files Form N-PX with its complete proxy voting record for the twelve months ended June 30, no later than August 31 of each year. A description of the Fund’s proxy voting policies, procedures, and how the Fund voted proxies relating to portfolio securities is available without charge, upon request, by (i) calling 800-GABELLI (800-422-3554); (ii) writing to The Gabelli Funds at One Corporate Center, Rye, NY 10580-1422; or (iii) visiting the SEC’s website at www.sec.gov.
5
The GAMCO Global Growth Fund
Schedule of Investments — December 31, 2017
| | | | | | | | | | | | |
| Shares | | | | | Cost | | | Market Value | |
| | | | COMMON STOCKS — 99.8% | |
| | | | INFORMATION TECHNOLOGY — 36.4% | |
| | 13,900 | | | Adobe Systems Inc.† | | $ | 1,028,959 | | | $ | 2,435,836 | |
| | 19,100 | | | Alibaba Group Holding Ltd., ADR† | | | 2,415,064 | | | | 3,293,413 | |
| | 810 | | | Alphabet Inc., Cl. A† | | | 238,018 | | | | 853,254 | |
| | 2,731 | | | Alphabet Inc., Cl. C† | | | 1,789,062 | | | | 2,857,718 | |
| | 11,210 | | | Apple Inc. | | | 860,406 | | | | 1,897,068 | |
| | 7,000 | | | Applied Materials Inc. | | | 346,230 | | | | 357,840 | |
| | 2,200 | | | Broadcom Ltd. | | | 547,432 | | | | 565,180 | |
| | 22,400 | | | Facebook Inc., Cl. A† | | | 1,881,948 | | | | 3,952,704 | |
| | 5,000 | | | Fiserv Inc.† | | | 510,859 | | | | 655,650 | |
| | 5,800 | | | Keyence Corp. | | | 508,627 | | | | 3,249,132 | |
| | 8,600 | | | Mastercard Inc., Cl. A | | | 124,678 | | | | 1,301,696 | |
| | 39,700 | | | Microsoft Corp. | | | 1,498,643 | | | | 3,395,938 | |
| | 2,500 | | | NVIDIA Corp. | | | 414,253 | | | | 483,750 | |
| | 1,600 | | | Palo Alto Networks Inc.† | | | 244,125 | | | | 231,904 | |
| | 6,600 | | | PayPal Holdings Inc.† | | | 383,489 | | | | 485,892 | |
| | 83,200 | | | Tencent Holdings Ltd. | | | 2,023,652 | | | | 4,323,544 | |
| | 17,000 | | | Visa Inc., Cl. A | | | 301,339 | | | | 1,938,340 | |
| | | | | | | | | | | | |
| | | | TOTAL INFORMATION | |
| | | | TECHNOLOGY | | | 15,116,784 | | | | 32,278,859 | |
| | | | | | | | | | | | |
| | | | CONSUMER DISCRETIONARY — 19.1% | |
| | 6,300 | | | adidas AG | | | 1,326,301 | | | | 1,263,492 | |
| | 1,730 | | | Amazon.com Inc.† | | | 875,314 | | | | 2,023,183 | |
| | 1,100 | | | Charter Communications Inc., Cl. A† | | | 375,340 | | | | 369,556 | |
| | 2,000 | | | Christian Dior SE | | | 290,698 | | | | 730,826 | |
| | 11,700 | | | Comcast Corp., Cl. A | | | 229,725 | | | | 468,585 | |
| | 3,114 | | | Compagnie Financiere Richemont SA | | | 172,841 | | | | 282,176 | |
| | 26,500 | | | Luxottica Group SpA | | | 1,406,624 | | | | 1,626,362 | |
| | 8,300 | | | LVMH Moet Hennessy Louis Vuitton SE | | | 1,464,557 | | | | 2,443,871 | |
| | 1,500 | | | Netflix Inc.† | | | 237,320 | | | | 287,940 | |
| | 11,500 | | | NIKE Inc., Cl. B | | | 457,202 | | | | 719,325 | |
| | 22,600 | | | Starbucks Corp. | | | 1,009,747 | | | | 1,297,918 | |
| | 9,800 | | | The Home Depot Inc. | | | 885,410 | | | | 1,857,394 | |
| | 240 | | | The Priceline Group Inc.† | | | 261,679 | | | | 417,058 | |
| | 23,700 | | | The Swatch Group AG | | | 1,487,996 | | | | 1,811,945 | |
| | 12,600 | | | The Walt Disney Co. | | | 1,287,983 | | | | 1,354,626 | |
| | | | | | | | | | | | |
| | | | TOTAL CONSUMER | |
| | | | DISCRETIONARY | | | 11,768,737 | | | | 16,954,257 | |
| | | | | | | | | | | | |
| | | | HEALTH CARE — 12.8% | |
| | 9,000 | | | Abbott Laboratories | | | 425,372 | | | | 513,630 | |
| | 3,500 | | | AbbVie Inc. | | | 241,249 | | | | 338,485 | |
| | 5,400 | | | Becton, Dickinson and Co. | | | 727,612 | | | | 1,155,924 | |
| | 900 | | | Biogen Inc.† | | | 134,354 | | | | 286,713 | |
| | 3,800 | | | Bristol-Myers Squibb Co. | | | 235,126 | | | | 232,864 | |
| | 5,900 | | | Danaher Corp. | | | 389,624 | | | | 547,638 | |
| | 6,500 | | | Humana Inc. | | | 1,576,846 | | | | 1,612,455 | |
| | 9,500 | | | Johnson & Johnson | | | 826,778 | | | | 1,327,340 | |
| | 2,600 | | | Roche Holding AG, Genusschein | | | 255,977 | | | | 657,704 | |
| | | | | | | | | | | | |
| Shares | | | | | Cost | | | Market Value | |
| | 3,200 | | | Thermo Fisher Scientific Inc. | | $ | 419,737 | | | $ | 607,616 | |
| | 11,800 | | | UnitedHealth Group Inc. | | | 1,769,694 | | | | 2,601,428 | |
| | 20,600 | | | Zoetis Inc. | | | 1,148,479 | | | | 1,484,024 | |
| | | | | | | | | | | | |
| | | | TOTAL HEALTH CARE | | | 8,150,848 | | | | 11,365,821 | |
| | | | | | | | | | | | |
| | | | INDUSTRIALS — 11.3% | | | | | | | | |
| | 2,500 | | | 3M Co. | | | 326,567 | | | | 588,425 | |
| | 12,700 | | | FANUC Corp. | | | 2,546,634 | | | | 3,050,029 | |
| | 2,900 | | | Honeywell International Inc. | | | 300,960 | | | | 444,744 | |
| | 27,500 | | | Jardine Matheson Holdings Ltd. | | | 1,334,238 | | | | 1,670,625 | |
| | 2,300 | | | Parker-Hannifin Corp. | | | 404,814 | | | | 459,034 | |
| | 5,000 | | | Rockwell Automation Inc. | | | 951,742 | | | | 981,750 | |
| | 1,600 | | | Roper Technologies Inc. | | | 394,257 | | | | 414,400 | |
| | 5,700 | | | Secom Co. Ltd. | | | 278,963 | | | | 430,352 | |
| | 7,200 | | | Siemens AG | | | 752,777 | | | | 1,003,408 | |
| | 3,200 | | | The Boeing Co. | | | 576,984 | | | | 943,712 | |
| | | | | | | | | | | | |
| | | | TOTAL INDUSTRIALS | | | 7,867,936 | | | | 9,986,479 | |
| | | | | | | | | | | | |
| | | | CONSUMER STAPLES — 8.3% | | | | | | | | |
| | 2,400 | | | Costco Wholesale Corp. | | | 155,909 | | | | 446,688 | |
| | 10,200 | | | Danone SA | | | 854,243 | | | | 856,078 | |
| | 80,000 | | | Davide Campari-Milano SpA | | | 129,297 | | | | 618,641 | |
| | 5,000 | | | Henkel AG & Co. KGaA | | | 548,486 | | | | 599,923 | |
| | 8,700 | | | L’Oreal SA | | | 1,510,867 | | | | 1,930,631 | |
| | 20,600 | | | Nestlé SA | | | 1,197,710 | | | | 1,771,543 | |
| | 5,156 | | | Pernod Ricard SA | | | 497,413 | | | | 816,297 | |
| | 9,900 | | | Unicharm Corp. | | | 187,592 | | | | 257,396 | |
| | | | | | | | | | | | |
| | | | TOTAL CONSUMER STAPLES | | | 5,081,517 | | | | 7,297,197 | |
| | | | | | | | | | | | |
| | | | FINANCIALS — 6.0% | | | | | | | | |
| | 8,000 | | | First Republic Bank | | | 592,077 | | | | 693,120 | |
| | 17,500 | | | HDFC Bank Ltd., ADR | | | 1,269,782 | | | | 1,779,225 | |
| | 13,300 | | | JPMorgan Chase & Co. | | | 655,026 | | | | 1,422,302 | |
| | 19,300 | | | Schroders plc | | | 345,422 | | | | 916,194 | |
| | 10,100 | | | The Charles Schwab Corp. | | | 275,570 | | | | 518,837 | |
| | | | | | | | | | | | |
| | | | TOTAL FINANCIALS | | | 3,137,877 | | | | 5,329,678 | |
| | | | | | | | | | | | |
| | | | REAL ESTATE — 3.6% | | | | | | | | |
| | 10,500 | | | American Tower Corp. | | | 1,250,467 | | | | 1,498,035 | |
| | 11,800 | | | Crown Castle International Corp. | | | 1,142,963 | | | | 1,309,918 | |
| | 2,400 | | | SBA Communications Corp.† | | | 267,159 | | | | 392,064 | |
| | | | | | | | | | | | |
| | | | TOTAL REAL ESTATE | | | 2,660,589 | | | | 3,200,017 | |
| | | | | | | | | | | | |
| | | | MATERIALS — 2.3% | | | | | | | | |
| | 3,300 | | | Ecolab Inc. | | | 294,898 | | | | 442,794 | |
| | 3,900 | | | The Sherwin-Williams Co. | | | 869,418 | | | | 1,599,156 | |
| | | | | | | | | | | | |
| | | | TOTAL MATERIALS | | | 1,164,316 | | | | 2,041,950 | |
| | | | | | | | | | | | |
| | | | TOTAL COMMON STOCKS | | | 54,948,604 | | | | 88,454,258 | |
| | | | | | | | | | | | |
See accompanying notes to financial statements.
6
The GAMCO Global Growth Fund
Schedule of Investments (Continued) — December 31, 2017
| | | | | | | | | | | | |
Principal Amount | | | | | Cost | | | Market Value | |
| | | | U.S. GOVERNMENT OBLIGATIONS — 0.4% | | | | | | | | |
| | $ 395,000 | | | U.S. Treasury Bills, 1.259%
to 1.324%††, 03/08/18 to 03/15/18 | | $ | 394,005 | | | $ | 394,023 | |
| | | | | | | | | | | | |
| | | |
| | | | TOTAL INVESTMENTS — 100.2% | | $ | 55,342,609 | | | | 88,848,281 | |
| | | | | | | | | | | | |
| | | | Other Assets and Liabilities (Net) — (0.2)% | | | | | | | (221,552) | |
| | | | NET ASSETS — 100.0% | | | | | | $ | 88,626,729 | |
| | |
| † | | Non-income producing security. |
| †† | | Represents annualized yield at date of purchase. |
| ADR | | American Depositary Receipt |
| | | | | | | | | | | | |
| | | % of
Market | | | | | | Market | |
Geographic Diversification | | Value | | | | | | Value | |
United States | | | 59.5 | % | | | | | | $ | 52,900,294 | |
Europe | | | 19.5 | | | | | | | | 17,329,091 | |
Latin America | | | 10.5 | | | | | | | | 9,287,582 | |
Japan | | | 7.9 | | | | | | | | 6,986,909 | |
Asia/Pacific | | | 2.6 | | | | | | | | 2,344,405 | |
| | | | | | | | | | | | |
| | | 100.0 | % | | | | | | $ | 88,848,281 | |
| | | | | | | | | | | | |
See accompanying notes to financial statements.
7
The GAMCO Global Growth Fund
Statement of Assets and Liabilities
December 31, 2017
| | | | |
| |
Assets: | | | | |
Investments, at value (cost $55,342,609) | | $ | 88,848,281 | |
Receivable for Fund shares sold | | | 27,260 | |
Receivable from Adviser | | | 1,685 | |
Dividends receivable | | | 83,009 | |
Prepaid expenses | | | 34,577 | |
| | | | |
Total Assets | | | 88,994,812 | |
| | | | |
Liabilities: | | | | |
Payable to custodian | | | 89,566 | |
Payable for Fund shares redeemed | | | 85,295 | |
Payable for investment advisory fees | | | 75,226 | |
Payable for distribution fees | | | 18,524 | |
Payable for accounting fees | | | 3,750 | |
Payable for legal and audit fees | | | 27,550 | |
Payable for shareholder services fees | | | 24,604 | |
Payable for shareholder communications expenses | | | 24,035 | |
Other accrued expenses | | | 19,533 | |
| | | | |
Total Liabilities | | | 368,083 | |
| | | | |
Net Assets (applicable to 2,656,936 shares outstanding) | | $ | 88,626,729 | |
| | | | |
Net Assets Consist of: | | | | |
Paid-in capital | | $ | 55,058,789 | |
Accumulated distributions in excess of net investment income | | | (45,595 | ) |
Accumulated net realized gain on investments and foreign currency transactions | | | 107,380 | |
Net unrealized appreciation on investments | | | 33,505,672 | |
Net unrealized appreciation on foreign currency translations | | | 483 | |
| | | | |
Net Assets | | $ | 88,626,729 | |
| | | | |
| | | | | | |
Shares of Capital Stock, each at $0.001 par value: | | | | | | |
Class AAA: | | | | | | |
Net Asset Value, offering, and redemption price per share ($77,828,888 ÷ 2,328,997 shares outstanding; 75,000,000 shares authorized) | | | | $ | 33.42 | |
| | | | | | |
Class A: | | | | | | |
Net Asset Value and redemption price per share ($3,651,550 ÷ 109,298 shares outstanding; 50,000,000 shares authorized) | | | | $ | 33.41 | |
| | | | | | |
Maximum offering price per share (NAV ÷ 0.9425, based on maximum sales charge of 5.75% of the offering price) | | | | $ | 35.45 | |
| | | | | | |
Class C: | | | | | | |
Net Asset Value and offering price per share ($1,478,762 ÷ 51,465 shares outstanding; 25,000,000 shares authorized) | | | | $ | 28.73 | (a) |
| | | | | | |
Class I: | | | | | | |
Net Asset Value, offering, and redemption price per share ($5,667,529 ÷ 167,176 shares outstanding; 25,000,000 shares authorized) | | | | $ | 33.90 | |
| | | | | | |
Statement of Operations
For the Year Ended December 31, 2017
| | | | |
| |
Investment Income: | | | | |
Dividends (net of foreign withholding taxes of $49,790) | | $ | 999,412 | |
Interest | | | 7,066 | |
Other Income* | | | 300 | |
| | | | |
Total Investment Income | | | 1,006,778 | |
| | | | |
Expenses: | | | | |
Investment advisory fees | | | 810,318 | |
Distribution fees - Class AAA | | | 179,722 | |
Distribution fees - Class A | | | 8,167 | |
Distribution fees - Class C | | | 11,889 | |
Shareholder services fees | | | 80,828 | |
Shareholder communications expenses | | | 52,357 | |
Registration expenses | | | 48,043 | |
Accounting fees | | | 45,000 | |
Legal and audit fees | | | 36,589 | |
Directors’ fees | | | 24,027 | |
Custodian fees | | | 19,399 | |
Interest expense | | | 1,241 | |
Miscellaneous expenses | | | 32,433 | |
| | | | |
Total Expenses | | | 1,350,013 | |
| | | | |
Less: | | | | |
Expenses paid indirectly by broker (See Note 6) | | | (1,822 | ) |
Expense reimbursements (See Note 3) | | | (19,466 | ) |
| | | | |
Total Credits and Reimbursements | | | (21,288 | ) |
| | | | |
Net Expenses | | | 1,328,725 | |
| | | | |
Net Investment Loss | | | (321,947 | ) |
| | | | |
Net Realized and Unrealized Gain/(Loss) on Investments and Foreign Currency: | | | | |
Net realized gain on investments | | | 2,801,809 | |
Net realized loss on foreign currency transactions | | | (1,795 | ) |
| | | | |
Net realized gain on investments and foreign currency transactions | | | 2,800,014 | |
| | | | |
Net change in unrealized appreciation/depreciation on investments | | | 17,833,014 | |
on foreign currency translations | | | 7,444 | |
| | | | |
Net change in unrealized appreciation on investments and foreign currency translations | | | 17,840,458 | |
| | | | |
Net Realized and Unrealized Gain/(Loss) on Investments and Foreign Currency | | | 20,640,472 | |
| | | | |
Net Increase in Net Assets Resulting from Operations | | $ | 20,318,525 | |
| | | | |
| * | The Fund received a reimbursement of custody expenses paid in prior years. |
| (a) | Redemption price varies based on the length of time held. |
See accompanying notes to financial statements.
8
The GAMCO Global Growth Fund
Statement of Changes in Net Assets
| | | | | | | | | | |
| | | Year Ended
December 31, 2017 | | Year Ended
December 31, 2016 |
Operations: | | | | | | | | | | |
Net investment income/(loss) | | | $ | (321,947 | ) | | | $ | 354,244 | |
Net realized gain on investments and foreign currency transactions | | | | 2,800,014 | | | | | 4,524,627 | |
Net change in unrealized appreciation on investments and foreign currency translations | | | | 17,840,458 | | | | | (4,051,722 | ) |
| | | | | | | | | | |
Net Increase in Net Assets Resulting from Operations. | | | | 20,318,525 | | | | | 827,149 | |
| | | | | | | | | | |
Distributions to Shareholders: | | | | | | | | | | |
Net investment income | | | | | | | | | | |
Class AAA | | | | — | | | | | (301,150 | ) |
Class A | | | | — | | | | | (14,857 | ) |
Class I | | | | — | | | | | (36,608 | ) |
| | | | | | | | | | |
| | | | — | | | | | (352,615 | ) |
| | | | | | | | | | |
Net realized gain | | | | | | | | | | |
Class AAA | | | | (2,380,131 | ) | | | | (3,988,932 | ) |
Class A | | | | (111,791 | ) | | | | (191,788 | ) |
Class C | | | | (52,550 | ) | | | | (87,574 | ) |
Class I | | | | (170,813 | ) | | | | (184,475 | ) |
| | | | | | | | | | |
| | | | (2,715,285 | ) | | | | (4,452,769 | ) |
| | | | | | | | | | |
Return of capital | | | | | | | | | | |
Class AAA | | | | (8,896 | ) | | | | — | |
Class A | | | | (418 | ) | | | | — | |
Class C | | | | (196 | ) | | | | — | |
Class I | | | | (638 | ) | | | | — | |
| | | | | | | | | | |
| | | | (10,148 | ) | | | | — | |
| | | | | | | | | | |
Total Distributions to Shareholders | | | | (2,725,433 | ) | | | | (4,805,384 | ) |
| | | | | | | | | | |
| | |
Capital Share Transactions: | | | | | | | | | | |
Class AAA | | | | (2,418,247 | ) | | | | (4,746,537 | ) |
Class A | | | | (201,553 | ) | | | | (251,070 | ) |
Class C | | | | 11,902 | | | | | (579,341 | ) |
Class I | | | | 1,717,886 | | | | | 24,257 | |
| | | | | | | | | | |
Net Decrease in Net Assets from Capital Share Transactions | | | | (890,012 | ) | | | | (5,552,691 | ) |
| | | | | | | | | | |
| | |
Redemption Fees | | | | 4 | | | | | — | |
| | | | | | | | | | |
Net Increase/(Decrease) in Net Assets | | | | 16,703,084 | | | | | (9,530,926 | ) |
Net Assets: | | | | | | | | | | |
Beginning of year | | | | 71,923,645 | | | | | 81,454,571 | |
| | | | | | | | | | |
End of year (including undistributed net investment income of $0 and $0, respectively) | | | $ | 88,626,729 | | | | $ | 71,923,645 | |
| | | | | | | | | | |
See accompanying notes to financial statements.
9
The GAMCO Global Growth Fund
Financial Highlights
Selected data for a share of capital stock outstanding throughout each year:
| | | | | | | | | | | | | | | | | | | | | | | | | | | | | | | | | | | | | | | | | | | | | | | | | | | | | | | | | | |
| | | | | | Income (Loss)
from Investment Operations | | | Distributions | | | | | | | | | | | Ratios to Average Net Assets/
Supplemental Data |
Year Ended December 31 | | Net Asset Value, Beginning of Year | | | Net Investment Income (Loss)(a) | | | Net Realized and Unrealized Gain (Loss) on Investments | | | Total from Investment Operations | | | Net Investment Income | | | Net Realized Gain | | | Return of Captial | | | Total Distributions | | | Redemption Fees (a)(b) | | | Net Asset Value, End of Year | | Total Return† | | | Net Assets End of Year (in 000’s) | | | Net Investment Income (Loss) | | | Operating Expenses Before Reimbursement | | | Operating Expenses Net of Reimbursement | | Portfolio Turnover Rate |
Class AAA | | | | | | | | | | | | | | | | | | | | | | | | | | | | | | | | | | | | | | | | | | | |
2017 | | | $26.72 | | | | $(0.13) | | | | $ 7.89 | | | | $ 7.76 | | | | — | | | | $(1.05) | | | | $(0.01) | | | | $ (1.06) | | | | $ 0.00 | | | $ 33.42 | | | 29.0 | % | | | $ 77,829 | | | | (0.42)% | | | | 1.67% | | | 1.67%(c) | | 43% |
2016 | | | 28.27 | | | | 0.12 | | | | 0.22 | | | | 0.34 | | | | $(0.13) | | | | (1.76) | | | | — | | | | (1.89) | | | | — | | | 26.72 | | | 1.2 | | | | 64,574 | | | | 0.44 | | | | 1.72 | | | 1.72(c)(d) | | 63 |
2015 | | | 30.23 | | | | (0.03) | | | | (0.31) | | | | (0.34) | | | | (0.02) | | | | (1.60) | | | | — | | | | (1.62) | | | | 0.00 | | | 28.27 | | | (1.2 | ) | | | 72,882 | | | | (0.10) | | | | 1.68 | | | 1.68(c) | | 53 |
2014 | | | 31.12 | | | | 0.15 | | | | 1.09 | | | | 1.24 | | | | (0.12) | | | | (2.01) | | | | — | | | | (2.13) | | | | 0.00 | | | 30.23 | | | 3.9 | | | | 78,140 | | | | 0.48 | | | | 1.72 | | | 1.72 | | 29 |
2013 | | | 26.54 | | | | (0.01) | | | | 7.50 | | | | 7.49 | | | | — | | | | (2.91) | | | | — | | | | (2.91) | | | | 0.00 | | | 31.12 | | | 28.8 | | | | 75,773 | | | | (0.02) | | | | 1.77 | | | 1.77 | | 25 |
Class A | | | | | | | | | | | | | | | | | | | | | | | | | | | | | | | | | | | | | | | | | | | | | | | | | | | | | | | | | | |
2017 | | | $26.72 | | | | $(0.13) | | | | $ 7.88 | | | | $ 7.75 | | | | — | | | | $(1.05) | | | | $(0.01) | | | | $(1.06) | | | | $0.00 | | | $33.41 | | | 29.0 | % | | | $3,652 | | | | (0.43)% | | | | 1.67% | | | 1.67%(c) | | 43% |
2016 | | | 28.26 | | | | 0.12 | | | | 0.23 | | | | 0.35 | | | | $(0.14) | | | | (1.75) | | | | — | | | | (1.89) | | | | — | | | 26.72 | | | 1.3 | | | | 3,143 | | | | 0.44 | | | | 1.72 | | | 1.72(c)(d) | | 63 |
2015 | | | 30.22 | | | | (0.03) | | | | (0.32) | | | | (0.35) | | | | (0.01) | | | | (1.60) | | | | — | | | | (1.61) | | | | 0.00 | | | 28.26 | | | (1.2 | ) | | | 3,580 | | | | (0.08) | | | | 1.68 | | | 1.68(c) | | 53 |
2014 | | | 31.13 | | | | 0.13 | | | | 1.11 | | | | 1.24 | | | | (0.14) | | | | (2.01) | | | | — | | | | (2.15) | | | | 0.00 | | | 30.22 | | | 3.9 | | | | 3,725 | | | | 0.40 | | | | 1.72 | | | 1.72 | | 29 |
2013 | | | 26.54 | | | | (0.01) | | | | 7.51 | | | | 7.50 | | | | — | | | | (2.91) | | | | — | | | | (2.91) | | | | 0.00 | | | 31.13 | | | 28.8 | | | | 1,872 | | | | (0.05) | | | | 1.77 | | | 1.77 | | 25 |
Class C | | | | | | | | | | | | | | | | | | | | | | | | | | | | | | | | | | | | | | | | | | | | | | | | | | | | | | | | | | |
2017 | | | $23.26 | | | | $(0.32) | | | | $ 6.85 | | | | $ 6.53 | | | | — | | | | $(1.05) | | | | $(0.01) | | | | $(1.06) | | | | $0.00 | | | $28.73 | | | 28.0 | % | | | $1,479 | | | | (1.19)% | | | | 2.42% | | | 2.42%(c) | | 43% |
2016 | | | 24.91 | | | | (0.07) | | | | 0.18 | | | | 0.11 | | | | — | | | | (1.76) | | | | — | | | | (1.76) | | | | — | | | 23.26 | | | 0.4 | | | | 1,232 | | | | (0.30) | | | | 2.47 | | | 2.47(c)(d) | | 63 |
2015 | | | 27.01 | | | | (0.23) | | | | (0.27) | | | | (0.50) | | | | — | | | | (1.60) | | | | — | | | | (1.60) | | | | 0.00 | | | 24.91 | | | (1.9 | ) | | | 1,891 | | | | (0.86) | | | | 2.43 | | | 2.43(c) | | 53 |
2014 | | | 28.12 | | | | (0.11) | | | | 1.01 | | | | 0.90 | | | | — | | | | (2.01) | | | | — | | | | (2.01) | | | | 0.00 | | | 27.01 | | | 3.1 | | | | 1,609 | | | | (0.37) | | | | 2.47 | | | 2.47 | | 29 |
2013 | | | 24.39 | | | | (0.22) | | | | 6.86 | | | | 6.64 | | | | — | | | | (2.91) | | | | — | | | | (2.91) | | | | 0.00 | | | 28.12 | | | 27.8 | | | | 1,036 | | | | (0.79) | | | | 2.52 | | | 2.52 | | 25 |
Class I | | | | | | | | | | | | | | | | | | | | | | | | | | | | | | | | | | | | | | | | | | | | | | | | | | | | | | | | | | |
2017 | | | $26.92 | | | | $ 0.07 | | | | $ 7.97 | | | | $ 8.04 | | | | — | | | | $(1.05) | | | | $(0.01) | | | | $(1.06) | | | | $0.00 | | | $33.90 | | | 29.8 | % | | | $5,667 | | | | 0.24% | | | | 1.42% | | | 1.00%(c)(e) | | 43% |
2016 | | | 28.47 | | | | 0.33 | | | | 0.23 | | | | 0.56 | | | | $(0.35) | | | | (1.76) | | | | — | | | | (2.11) | | | | — | | | 26.92 | | | 2.0 | | | | 2,975 | | | | 1.18 | | | | 1.47 | | | 1.00(c)(d)(e) | | 63 |
2015 | | | 30.42 | | | | 0.17 | | | | (0.30) | | | | (0.13) | | | | (0.22) | | | | (1.60) | | | | — | | | | (1.82) | | | | 0.00 | | | 28.47 | | | (0.5 | ) | | | 3,102 | | | | 0.54 | | | | 1.43 | | | 1.00(c)(e) | | 53 |
2014 | | | 31.30 | | | | 0.27 | | | | 1.11 | | | | 1.38 | | | | (0.25) | | | | (2.01) | | | | — | | | | (2.26) | | | | 0.00 | | | 30.42 | | | 4.3 | | | | 2,318 | | | | 0.85 | | | | 1.47 | | | 1.28(e) | | 29 |
2013 | | | 26.61 | | | | 0.07 | | | | 7.53 | | | | 7.60 | | | | — | | | | (2.91) | | | | — | | | | (2.91) | | | | 0.00 | | | 31.30 | | | 29.1 | | | | 1,330 | | | | 0.22 | | | | 1.52 | | | 1.52 | | 25 |
| | |
| † | | Total return represents aggregate total return of a hypothetical $1,000 investment at the beginning of the year and sold at the end of the year including reinvestment of distributions and does not reflect the applicable sales charges. |
| (a) | | Per share amounts have been calculated using the average shares outstanding method. |
| (b) | | Amount represents less than $0.005 per share. |
| (c) | | The Fund received credits from a designated broker who agreed to pay certain Fund operating expenses. For the years ended December 31, 2017, 2016, and 2015, there was no impact on the expense ratios. |
| (d) | | During the year ended December 31, 2016, the Fund received reimbursements of custody expenses paid in prior years. Had such reimbursement (allocated by relative net asset values of the Fund’s share classes) been included in that period, the expense ratios would have been 1.20% (Class AAA) , 1.21% (Class A), 1.96% (Class C), and 0.47% (Class I) |
| (e) | | Under an expense reimbursement agreement with the Adviser, the Adviser reimbursed certain Class I expenses to the Fund of $19,466, $14,648, $12,486, and $3,489 for the years ended December 31, 2017, 2016, 2015, and 2014, respectively. |
See accompanying notes to financial statements.
10
The GAMCO Global Growth Fund
Notes to Financial Statements
1. Organization. The GAMCO Global Growth Fund, a series of GAMCO Global Series Funds, Inc. (the “Corporation”), was incorporated on July 16, 1993 in Maryland. The Fund is a non-diversified open-end management investment company registered under the Investment Company Act of 1940, as amended (the “1940 Act”), and one of four separately managed portfolios (collectively, the “Portfolios”) of the Corporation. The Fund’s primary objective is capital appreciation. The Fund commenced investment operations on February 7, 1994.
2. Significant Accounting Policies. As an investment company, the Fund follows the investment company accounting and reporting guidance, which is part of U.S. generally accepted accounting principles (“GAAP”) that may require the use of management estimates and assumptions in the preparation of its financial statements. Actual results could differ from those estimates. The following is a summary of significant accounting policies followed by the Fund in the preparation of its financial statements.
Security Valuation. Portfolio securities listed or traded on a nationally recognized securities exchange or traded in the U.S. over-the-counter market for which market quotations are readily available are valued at the last quoted sale price or a market’s official closing price as of the close of business on the day the securities are being valued. If there were no sales that day, the security is valued at the average of the closing bid and asked prices or, if there were no asked prices quoted on that day, then the security is valued at the closing bid price on that day. If no bid or asked prices are quoted on such day, the security is valued at the most recently available price or, if the Board of Directors (the “Board”) so determines, by such other method as the Board shall determine in good faith to reflect its fair market value. Portfolio securities traded on more than one national securities exchange or market are valued according to the broadest and most representative market, as determined by Gabelli Funds, LLC (the “Adviser”).
Portfolio securities primarily traded on a foreign market are generally valued at the preceding closing values of such securities on the relevant market, but may be fair valued pursuant to procedures established by the Board if market conditions change significantly after the close of the foreign market, but prior to the close of business on the day the securities are being valued. Debt obligations for which market quotations are readily available are valued at the average of the latest bid and asked prices. If there were no asked prices quoted on such day, the security is valued using the closing bid price. Such debt obligations are valued through prices provided by a Pricing Service approved by the Board. Certain securities are valued principally using dealer quotations.
Securities and assets for which market quotations are not readily available are fair valued as determined by the Board. Fair valuation methodologies and procedures may include, but are not limited to: analysis and review of available financial and non-financial information about the company; comparisons with the valuation and changes in valuation of similar securities, including a comparison of foreign securities with the equivalent U.S. dollar value American Depositary Receipt securities at the close of the U.S. exchange; and evaluation of any other information that could be indicative of the value of the security.
The Fund employs a fair value model to adjust prices to reflect events affecting the values of certain portfolio securities which occur between the close of trading on the principal market for such securities (foreign exchanges and over-the-counter markets) at the time when net asset values of the Fund are determined. If the Fund’s valuation committee believes that a particular event would materially affect net asset value, further adjustment is considered.
11
The GAMCO Global Growth Fund
Notes to Financial Statements (Continued)
The inputs and valuation techniques used to measure fair value of the Fund’s investments are summarized into three levels as described in the hierarchy below:
| | ● | | Level 1 — quoted prices in active markets for identical securities; |
| | ● | | Level 2 — other significant observable inputs (including quoted prices for similar securities, interest rates, prepayment speeds, credit risk, etc.); and |
| | ● | | Level 3 — significant unobservable inputs (including the Board’s determinations as to the fair value of investments). |
A financial instrument’s level within the fair value hierarchy is based on the lowest level of any input both individually and in the aggregate that is significant to the fair value measurement. The inputs or methodology used for valuing securities are not necessarily an indication of the risk associated with investing in those securities. The closing price is adjusted from the local close, therefore, such securities are classified as Level 2 in the fair value hierarchy presented below. The summary of the Fund’s investments in securities by inputs used to value the Fund’s investments as of December 31, 2017 is as follows:
| | | | | | | | | | | | |
| | | Valuation Inputs | | | | |
| | | Level 1
Quoted Prices | | | Level 2 Other Significant
Observable Inputs | | | Total Market Value
at 12/31/17 | |
INVESTMENTS IN SECURITIES: | | | | | | | | | | | | |
ASSETS (Market Value): | | | | | | | | | | | | |
Common Stocks (a) | | | $88,454,258 | | | | — | | | | $88,454,258 | |
U.S. Government Obligations | | | — | | | | $394,023 | | | | 394,023 | |
TOTAL INVESTMENTS IN SECURITIES – ASSETS | | | $88,454,258 | | | | $394,023 | | | | $88,848,281 | |
| (a) | Please refer to the Schedule of Investments for the industry classifications of these portfolio holdings. |
The Fund did not have transfers between Level 1 and Level 2 during the year ended December 31, 2017. The Fund’s policy is to recognize transfers among Levels as of the beginning of the reporting period.
There were no Level 3 investments held at December 31, 2017 or December 31, 2016.
Additional Information to Evaluate Qualitative Information.
General. The Fund uses recognized industry pricing services – approved by the Board and unaffiliated with the Adviser – to value most of its securities, and uses broker quotes provided by market makers of securities not valued by these and other recognized pricing sources. Several different pricing feeds are received to value domestic equity securities, international equity securities, preferred equity securities, and fixed income securities. The data within these feeds are ultimately sourced from major stock exchanges and trading systems where these securities trade. The prices supplied by external sources are checked by obtaining quotations or actual transaction prices from market participants. If a price obtained from the pricing source is deemed unreliable, prices will be sought from another pricing service or from a broker/dealer that trades that security or similar securities.
Fair Valuation. Fair valued securities may be common or preferred equities, warrants, options, rights, or fixed income obligations. Where appropriate, Level 3 securities are those for which market quotations are not available, such as securities not traded for several days, or for which current bids are not available, or which are restricted as to transfer. When fair valuing a security, factors to consider include recent prices of comparable securities that are publicly traded, reliable prices of securities not publicly traded, the use of valuation models,
12
The GAMCO Global Growth Fund
Notes to Financial Statements (Continued)
current analyst reports, valuing the income or cash flow of the issuer, or cost if the preceding factors do not apply. The circumstances of Level 3 securities are frequently monitored to determine if fair valuation measures continue to apply.
The Adviser reports quarterly to the Board the results of the application of fair valuation policies and procedures. These may include backtesting the prices realized in subsequent trades of these fair valued securities to fair values previously recognized.
Foreign Currency Translations. The books and records of the Fund are maintained in U.S. dollars. Foreign currencies, investments, and other assets and liabilities are translated into U.S. dollars at current exchange rates. Purchases and sales of investment securities, income, and expenses are translated at the exchange rate prevailing on the respective dates of such transactions. Unrealized gains and losses that result from changes in foreign exchange rates and/or changes in market prices of securities have been included in unrealized appreciation/depreciation on investments and foreign currency translations. Net realized foreign currency gains and losses resulting from changes in exchange rates include foreign currency gains and losses between trade date and settlement date on investment securities transactions, foreign currency transactions, and the difference between the amounts of interest and dividends recorded on the books of the Fund and the amounts actually received. The portion of foreign currency gains and losses related to fluctuation in exchange rates between the initial purchase trade date and subsequent sale trade date is included in realized gain/(loss) on investments.
Foreign Securities. The Fund may directly purchase securities of foreign issuers. Investing in securities of foreign issuers involves special risks not typically associated with investing in securities of U.S. issuers. The risks include possible revaluation of currencies, the inability to repatriate funds, less complete financial information about companies, and possible future adverse political and economic developments. Moreover, securities of many foreign issuers and their markets may be less liquid and their prices more volatile than securities of comparable U.S. issuers.
Foreign Taxes. The Fund may be subject to foreign taxes on income, gains on investments, or currency repatriation, a portion of which may be recoverable. The Fund will accrue such taxes and recoveries as applicable, based upon its current interpretation of tax rules and regulations that exist in the markets in which it invests.
Securities Transactions and Investment Income. Securities transactions are accounted for on the trade date with realized gain or loss on investments determined by using the identified cost method. Interest income (including amortization of premium and accretion of discount) is recorded on an accrual basis. Premiums and discounts on debt securities are amortized using the effective yield to maturity method. Dividend income is recorded on the ex-dividend date, except for certain dividends from foreign securities that are recorded as soon after the ex-dividend date as the Fund becomes aware of such dividends.
Determination of Net Asset Value and Calculation of Expenses. Certain administrative expenses are common to, and allocated among, various affiliated funds. Such allocations are made on the basis of each fund’s average net assets or other criteria directly affecting the expenses as determined by the Adviser pursuant to procedures established by the Board.
13
The GAMCO Global Growth Fund
Notes to Financial Statements (Continued)
In calculating NAV per share of each class, investment income, realized and unrealized gains and losses, redemption fees, and expenses other than class specific expenses are allocated daily to each class of shares based upon the proportion of net assets of each class at the beginning of each day. Distribution expenses are borne solely by the class incurring the expense.
Distributions to Shareholders. Distributions to shareholders are recorded on the ex-dividend date. Distributions to shareholders are based on income and capital gains as determined in accordance with federal income tax regulations, which may differ from income and capital gains as determined under GAAP. These differences are primarily due to differing treatments of income and gains on various investment securities and foreign currency transactions held by the Fund, timing differences, and differing characterizations of distributions made by the Fund. Distributions from net investment income for federal income tax purposes include net realized gains on foreign currency transactions. These book/tax differences are either temporary or permanent in nature. To the extent these differences are permanent, adjustments are made to the appropriate capital accounts in the period when the differences arise. Permanent differences were primarily due to net operating losses. These reclassifications have no impact on the NAV of the Fund. These reclassifications have no impact on the NAV of the Fund. For the year ended December 31, 2017, reclassifications were made to decrease accumulated distributions in excess of net investment income by $321,947 and increase accumulated net realized gain on investments and foreign currency transactions by $1,023, with an offsetting adjustment to paid-in capital.
The tax character of distributions paid during the years ended December 31, 2017 and 2016 was as follows:
| | | | | | | | | | |
| | | Year Ended
December 31, 2017 | | Year Ended
December 31, 2016 |
Distributions paid from: | | | | | | | | | | |
Ordinary income (inclusive of short term capital gains) | | | | — | | | | $ | 352,241 | |
Net long term capital gains | | | $ | 2,715,285 | | | | | 4,453,143 | |
Return of capital | | | | 10,148 | | | | | — | |
| | | | | | | | | | |
Total distributions paid | | | $ | 2,725,433 | | | | $ | 4,805,384 | |
| | | | | | | | | | |
Provision for Income Taxes. The Fund intends to continue to qualify as a regulated investment company under Subchapter M of the Internal Revenue Code of 1986, as amended (the “Code”). It is the policy of the Fund to comply with the requirements of the Code applicable to regulated investment companies and to distribute substantially all of its net investment company taxable income and net capital gains. Therefore, no provision for federal income taxes is required.
At December 31, 2017, the components of accumulated earnings/losses on a tax basis were as follows:
| | | | |
Net unrealized appreciation on investments and foreign currency translations | | | $33,567,940 | |
| | | | |
Total | | | $33,567,940 | |
| | | | |
The Fund is permitted to carry capital losses forward for an unlimited period. Capital losses that are carried forward will retain their character as either short term or long term capital losses.
At December 31, 2017, the temporary difference between book basis and tax basis net unrealized appreciation on investments was due to deferral of losses from wash sales for tax purposes, mark-to-market adjustments on investments no longer considered a passive foreign investment company and basis adjustments for litigation gains.
14
The GAMCO Global Growth Fund
Notes to Financial Statements (Continued)
The following summarizes the tax cost of investments and the related net unrealized appreciation at December 31, 2017:
| | | | | | | | | | | | | | | | | | | | |
| | | Cost | | Gross
Unrealized
Appreciation | | Gross
Unrealized
Depreciation | | Net Unrealized
Appreciation |
Investments | | | | $55,280,824 | | | | | $33,994,299 | | | | | $(426,842) | | | | | $33,567,457 | |
The Fund is required to evaluate tax positions taken or expected to be taken in the course of preparing the Fund’s tax returns to determine whether the tax positions are “more-likely-than-not” of being sustained by the applicable tax authority. Income tax and related interest and penalties would be recognized by the Fund as tax expense in the Statement of Operations if the tax positions were deemed not to meet the more-likely-than-not threshold. During the year ended December 31, 2017, the Fund did not incur any income tax, interest, or penalties. As of December 31, 2017, the Adviser has reviewed all open tax years and concluded that there was no impact to the Fund’s net assets or results of operations. The Fund’s federal and state tax returns for the prior three fiscal years remain open, subject to examination. On an ongoing basis, the Adviser will monitor the Fund’s tax positions to determine if adjustments to this conclusion are necessary.
3. Investment Advisory Agreement and Other Transactions. The Fund has entered into an investment advisory agreement (the “Advisory Agreement”) with the Adviser which provides that the Fund will pay the Adviser a fee, computed daily and paid monthly, at the annual rate of 1.00% of the value of its average daily net assets. In accordance with the Advisory Agreement, the Adviser provides a continuous investment program for the Fund’s portfolio, oversees the administration of all aspects of the Fund’s business and affairs, and pays the compensation of all Officers and Directors of the Fund who are affiliated persons of the Adviser.
The Adviser has contractually agreed to waive its investment advisory fee and/or reimburse expenses of Class I Shares to the extent necessary to maintain the total operating expenses (excluding brokerage, acquired fund fees and expenses, interest, taxes, and extraordinary expenses) until at least April 30, 2019 at no more than 1.00% of the value of its average daily net assets. For the year ended December 31, 2017, the Adviser reimbursed certain Class I Share expenses in the amount of $19,466. In addition, the Fund has agreed, during the two year period following any waiver or reimbursement by the Adviser, to repay such amount to the extent, that after giving effect to the repayment, such adjusted annualized total operating expenses of the Fund would not exceed 1.00% of the value of the Fund’s average daily net assets for Class I Shares. The agreement is renewable annually. At December 31, 2017, the cumulative amount which the Class I Shares may repay the Adviser, subject to the terms above, is $34,114:
| | | | |
For the year ended December 31, 2016, expiring December 31, 2018 | | $ | 14,648 | |
For the year ended December 31, 2017, expiring December 31, 2019 | | | 19,466 | |
| | | | |
| | $ | 34,114 | |
| | | | |
The Corporation pays each Director who is not considered to be an affiliated person an annual retainer of $6,000 plus $1,000 for each Board meeting attended and they are reimbursed for any out of pocket expenses incurred in attending meetings. All Board committee members receive $1,000 per meeting attended. The Chairman of the Audit Committee receives an annual fee of $3,000, and the Lead Director receives an annual fee of $2,000. A Director may receive a single meeting fee, allocated among the participating funds, for attending certain meetings held on behalf of multiple funds. Directors who are directors or employees of the Adviser or an affiliated company receive no compensation or expense reimbursement from the Corporation.
15
The GAMCO Global Growth Fund
Notes to Financial Statements (Continued)
4. Distribution Plan. The Fund’s Board has adopted a distribution plan (the “Plan”) for each class of shares, except for Class I Shares, pursuant to Rule 12b-1 under the 1940 Act. Under the Class AAA, Class A, and Class C Share Plans, payments are authorized to G.distributors, LLC (the “Distributor”), an affiliate of the Adviser, at annual rates of 0.25%, 0.25%, and 1.00%, respectively, of the average daily net assets of those classes, the annual limitations under each Plan. Such payments are accrued daily and paid monthly.
5. Portfolio Securities. Purchases and sales of securities during the year ended December 31, 2017, other than short term securities and U.S. Government obligations, aggregated $34,180,773 and $38,062,347, respectively.
6. Transactions with Affiliates and Other Arrangements. During the year ended December 31, 2017, the Distributor retained a total of $2,889 from investors representing commissions (sales charges and underwriting fees) on sales and redemptions of Fund shares.
The Fund received credits from a designated broker who agreed to pay certain Fund operating expenses. The amount of such expenses paid through this directed brokerage arrangement during this period was $1,822.
The cost of calculating the Fund’s NAV per share is a Fund expense pursuant to the Advisory Agreement. During the year ended December 31, 2017, the Fund paid or accrued $45,000 to the Adviser in connection with the cost of computing the Fund’s NAV.
7. Line of Credit. The Fund participates in an unsecured line of credit which expires on March 8, 2018 and may be renewed annually, of up to $75,000,000 under which it may borrow up to 10% of its net assets from the custodian for temporary borrowing purposes. Borrowings under this arrangement bear interest at a floating rate equal to the higher of the overnight Federal Funds rate plus 125 basis points or the 30-day LIBOR plus 125 basis points in effect on that day. This amount, if any, would be included in “Interest expense” in the Statement of Operations. At December 31, 2017, there were no borrowings outstanding under the line of credit.
The average daily amount of borrowings outstanding under the line of credit during the year ended December 31, 2017 was $10,384, with a weighted average interest rate of 2.25%. The maximum amount borrowed at any time during the year ended December 31, 2017 was $575,000.
8. Capital Stock. The Fund offers four classes of shares – Class AAA Shares, Class A Shares, Class C Shares, and Class I Shares. Class AAA and Class I Shares are offered without a sales charge. Class A Shares are subject to a maximum front-end sales charge of 5.75%, and Class C Shares are subject to a 1.00% contingent deferred sales charge for one year after purchase.
The Fund imposes a redemption fee of 2.00% on all classes of shares that are redeemed or exchanged on or before the seventh day after the date of a purchase. The redemption fee is deducted from the proceeds otherwise payable to the redeeming shareholders and is retained by the Fund as an increase in paid-in capital. The redemption fees retained by the Fund during the years ended December 31, 2017 and 2016, if any, can be found in the Statement of Changes in Net Assets under Redemption Fees.
16
The GAMCO Global Growth Fund
Notes to Financial Statements (Continued)
Transactions in shares of capital stock were as follows:
| | | | | | | | | | | | | | | | | | | | |
| | | Year Ended
December 31, 2017 | | | | | | Year Ended
December 31, 2016 | |
| | | Shares | | | Amount | | | | | | Shares | | | Amount | |
Class AAA | | | | | | | | | | | | | | | | | | | | |
Shares sold | | | 64,253 | | | $ | 2,025,875 | | | | | | | | 29,107 | | | $ | 807,388 | |
Shares issued upon reinvestment of distributions | | | 68,510 | | | | 2,294,414 | | | | | | | | 154,161 | | | | 4,123,795 | |
Shares redeemed | | | (220,273 | ) | | | (6,738,536 | ) | | | | | | | (345,138 | ) | | | (9,677,720 | ) |
| | | | | | | | | | | | | | | | | | | | |
Net (decrease) | | | (87,510 | ) | | $ | (2,418,247 | ) | | | | | | | (161,870 | ) | | $ | (4,746,537 | ) |
| | | | | | | | | | | | | | | | | | | | |
Class A | | | | | | | | | | | | | | | | | | | | |
Shares sold | | | 19,835 | | | $ | 647,298 | | | | | | | | 27,660 | | | $ | 762,766 | |
Shares issued upon reinvestment of distributions | | | 3,257 | | | | 109,034 | | | | | | | | 7,246 | | | | 193,744 | |
Shares redeemed | | | (31,457 | ) | | | (957,885 | ) | | | | | | | (43,912 | ) | | | (1,207,580 | ) |
| | | | | | | | | | | | | | | | | | | | |
Net (decrease) | | | (8,365 | ) | | $ | (201,553 | ) | | | | | | | (9,006 | ) | | $ | (251,070 | ) |
| | | | | | | | | | | | | | | | | | | | |
Class C | | | | | | | | | | | | | | | | | | | | |
Shares sold | | | 13,126 | | | $ | 377,266 | | | | | | | | 10,325 | | | $ | 248,345 | |
Shares issued upon reinvestment of distributions | | | 1,563 | | | | 45,008 | | | | | | | | 3,100 | | | | 72,195 | |
Shares redeemed | | | (16,162 | ) | | | (410,372 | ) | | | | | | | (36,423 | ) | | | (899,881 | ) |
| | | | | | | | | | | | | | | | | | | | |
Net increase/(decrease) | | | (1,473 | ) | | $ | 11,902 | | | | | | | | (22,998 | ) | | $ | (579,341 | ) |
| | | | | | | | | | | | | | | | | | | | |
Class I | | | | | | | | | | | | | | | | | | | | |
Shares sold | | | 105,822 | | | $ | 3,127,493 | | | | | | | | 44,336 | | | $ | 1,222,360 | |
Shares issued upon reinvestment of distributions | | | 4,652 | | | | 158,034 | | | | | | | | 7,076 | | | | 190,623 | |
Shares redeemed | | | (53,821 | ) | | | (1,567,641 | ) | | | | | | | (49,851 | ) | | | (1,388,726 | ) |
| | | | | | | | | | | | | | | | | | | | |
Net increase | | | 56,653 | | | $ | 1,717,886 | | | | | | | | 1,561 | | | $ | 24,257 | |
| | | | | | | | | | | | | | | | | | | | |
9. Indemnifications. The Fund enters into contracts that contain a variety of indemnifications. The Fund’s maximum exposure under these arrangements is unknown. However, the Fund has not had prior claims or losses pursuant to these contracts. Management has reviewed the Fund’s existing contracts and expects the risk of loss to be remote.
10. Subsequent Events. Management has evaluated the impact on the Fund of all subsequent events occurring through the date the financial statements were issued and has determined that there were no subsequent events requiring recognition or disclosure in the financial statements.
17
The GAMCO Global Growth Fund
Report of Independent Registered Public Accounting Firm
To the Shareholders and the Board of Directors of
The GAMCO Global Growth Fund
Opinion on the Financial Statements
We have audited the accompanying statement of assets and liabilities of The GAMCO Global Growth Fund (the “Fund”) (one of the funds constituting GAMCO Global Series Funds, Inc. (the “Corporation”)), including the schedule of investments, as of December 31, 2017, and the related statement of operations for the year then ended, the statements of changes in net assets for each of the two years in the period then ended, the financial highlights for each of the five years in the period then ended and the related notes (collectively referred to as the “financial statements”). In our opinion, the financial statements present fairly, in all material respects, the financial position of the Fund (one of the funds constituting GAMCO Global Series Funds, Inc.) at December 31, 2017, the results of its operations for the year then ended, the changes in its net assets for each of the two years in the period then ended and its financial highlights for each of the five years in the period then ended, in conformity with U.S. generally accepted accounting principles.
Basis for Opinion
These financial statements are the responsibility of the Corporation’s management. Our responsibility is to express an opinion on the Fund’s financial statements based on our audits. We are a public accounting firm registered with the Public Company Accounting Oversight Board (United States) (“PCAOB”) and are required to be independent with respect to the Corporation in accordance with the U.S. federal securities laws and the applicable rules and regulations of the Securities and Exchange Commission and the PCAOB.
We conducted our audits in accordance with the standards of the PCAOB. Those standards require that we plan and perform the audit to obtain reasonable assurance about whether the financial statements and financial highlights are free of material misstatement, whether due to error or fraud. The Corporation is not required to have, nor were we engaged to perform, an audit of the Corporation’s internal control over financial reporting. As part of our audits, we are required to obtain an understanding of internal control over financial reporting, but not for the purpose of expressing an opinion on the effectiveness of the Corporation’s internal control over financial reporting. Accordingly, we express no such opinion.
Our audits included performing procedures to assess the risks of material misstatement of the financial statements, whether due to error or fraud, and performing procedures that respond to those risks. Such procedures included examining, on a test basis, evidence regarding the amounts and disclosures in the financial statements. Our procedures included confirmation of securities owned as of December 31, 2017, by correspondence with the custodian. Our audits also included evaluating the accounting principles used and significant estimates made by management, as well as evaluating the overall presentation of the financial statements. We believe that our audits provide a reasonable basis for our opinion.

We have served as the auditor of one or more Gabelli/GAMCO Funds investment companies since 1992.
Philadelphia, Pennsylvania
February 28, 2018
18
The GAMCO Global Growth Fund
Board Consideration and Re-Approval of Investment Advisory Agreement (Unaudited)
During the six months ended December 31, 2017, the Board of Directors of the Corporation approved the continuation of the investment advisory agreement with the Adviser for the Fund on the basis of the recommendation by the directors (the “Independent Board Members”) who are not “interested persons” of the Fund. The following paragraphs summarize the material information and factors considered by the Independent Board Members as well as their conclusions relative to such factors.
Nature, Extent, and Quality of Services. The Independent Board Members considered information regarding the Fund’s portfolio managers, the depth of the analyst pool available to the Adviser and the portfolio managers, the scope of supervisory, administrative, shareholder, and other services supervised or provided by the Adviser and the absence of significant service problems reported to the Board. The Independent Board Members noted the experience, length of service, and reputation of the Fund’s portfolio managers.
Investment Performance. The Independent Board Members reviewed the short, medium, and long term performance of the Fund (as of September 30, 2017) against a peer group of seven other comparable funds prepared by the Adviser (the “Adviser Peer Group”), and against a peer group prepared by Broadridge (the “Broadridge Performance Peer Group”) consisting of all retail and institutional global large cap growth funds, regardless of asset size or primary channel of distribution, as represented by the Lipper Global Large Cap Growth Index. The Independent Board Members noted that the Fund’s performance was in the first (highest) quartile for the one and five year periods, the second quartile for the three year period, and the first quartile for the ten year period, as measured against the Adviser Peer Group. Against the Broadridge Performance Peer Group, the Independent Board Members noted that the Fund’s performance was in the third quintile for the one and five year periods, the fourth quintile for the three year period, and the second quintile for the ten year period.
Profitability. The Independent Board Members reviewed summary data regarding the profitability of the Fund to the Adviser both with a pro rata administrative overhead charge and with a stand alone administrative charge. The Independent Board Members also noted that a portion of the Fund’s portfolio transactions were executed by an affiliated broker of the Adviser and that another affiliated broker of the Adviser received distribution fees and minor amounts of sales commissions.
Economies of Scale. The Independent Board Members discussed the major elements of the Adviser’s cost structure, the relationship of those elements to potential economies of scale and reviewed data provided by the Adviser.
Sharing of Economies of Scale. The Independent Board Members noted that the investment management fee schedule for the Fund does not take into account any potential economies of scale that may develop.
Service and Cost Comparisons. The Independent Board Members compared the expense ratios of the investment management fee, other expenses, and total expenses of the Fund with similar expense ratios of the Adviser Peer Group and a peer group of eight other global large cap growth funds selected by Broadridge, and noted that the Adviser’s management fee includes substantially all administrative services of the Fund as well as investment advisory services. The Independent Board Members noted that the Fund’s total expense ratio was the highest of both peer groups, but that the Fund’s size was below average within each peer group. The Independent Board Members also noted that the advisory fee structure was the same as that in effect for most
19
The GAMCO Global Growth Fund
Board Consideration and Re-Approval of Investment Advisory Agreement (Unaudited) (Continued)
of the Gabelli funds. The Independent Board Members were presented with, but did not consider to be material to their decision, various information comparing the advisory fee with the fee for other types of accounts managed by the Adviser.
Conclusions. The Independent Board Members concluded that the Fund enjoyed highly experienced portfolio management services and good ancillary services and an acceptable performance record. The Independent Board Members also concluded that the Fund’s expense ratios and the profitability to the Adviser of managing the Fund were reasonable, and that economies of scale were not a significant factor in their thinking at this time. The Independent Board Members did not view the potential profitability of ancillary services as material to their decision. On the basis of the foregoing and without assigning particular weight to any single conclusion, the Independent Board Members determined to recommend continuation of the investment management agreement to the full Board.
Based on a consideration of all these factors in their totality, the Board Members, including all of the Independent Board Members, determined that each Fund’s advisory fee was fair and reasonable with respect to the quality of services provided and in light of the other factors described above that the Board deemed relevant. Accordingly, the Board Members determined to approve the continuation of each Fund’s Advisory Agreement. The Board Members based their decision on evaluations of all these factors as a whole and did not consider any one factor as all-important or controlling.
20
The GAMCO Global Growth Fund
Additional Fund Information (Unaudited)
The business and affairs of the Fund are managed under the direction of the Corporation’s Board of Directors. Information pertaining to the Directors and officers of the Fund is set forth below. The Corporation’s Statement of Additional Information includes additional information about the Fund’s Directors and is available without charge, upon request, by calling 800-GABELLI (800-422-3554) or by writing to The GAMCO Global Growth Fund at One Corporate Center, Rye, NY 10580-1422.
| | | | | | | | |
Name, Position(s) Address1 and Age | | Term of Office and Length of Time Served2 | | Number of Funds in Fund Complex Overseen by Director | | Principal Occupation(s) During Past Five Years | | Other Directorships Held by Director3 |
|
INTERESTED DIRECTORS4: |
| | | | |
Mario J. Gabelli, CFA Director and Chief Investment Officer Age: 75 | | Since 1993 | | 32 | | Chairman, Chief Executive Officer, and Chief Investment Officer– Value Portfolios of GAMCO Investors, Inc. and Chief Investment Officer–Value Portfolios of Gabelli Funds, LLC and GAMCO Asset Management Inc.; Director/Trustee or Chief Investment Officer of other registered investment companies within the Gabelli/GAMCO Fund Complex; Chief Executive Officer of GGCP, Inc.; Executive Chairman of Associated Capital Group, Inc. | | Director of Morgan Group Holdings, Inc. (holding company); Chairman of the Board and Chief Executive Officer of LICT Corp. (multimedia and communication services company); Director of CIBL, Inc. (broadcasting and wireless communications); Director of ICTC Group Inc. (communications) |
| | | | |
John D. Gabelli Director Age: 73 | | Since 1993 | | 10 | | Senior Vice President of G.research, LLC | | — |
|
INDEPENDENT DIRECTORS5: |
| | | | |
E. Val Cerutti Director Age: 78 | | Since 2001 | | 7 | | Chief Executive Officer of Cerutti Consultants, Inc. | | Director of The LGL Group, Inc. (diversified manufacturing) (1990-2009) |
| | | | |
Anthony J. Colavita Director Age: 82 | | Since 1993 | | 28 | | President of the law firm of Anthony J. Colavita, P.C. | | — |
| | | | |
Arthur V. Ferrara Director Age: 87 | | Since 2001 | | 8 | | Former Chairman of the Board and Chief Executive Officer of The Guardian Life Insurance Company of America (1993-1995) | | — |
| | | | |
Werner J. Roeder Director Age: 77 | | Since 1993 | | 23 | | Retired physician; Former Vice President of Medical Affairs (Medical Director) of New York Presbyterian/Lawrence Hospital (1999-2014) | | — |
| | | | |
Anthonie C. van Ekris Director Age: 83 | | Since 1993 | | 22 | | Chairman and Chief Executive Officer of BALMAC International, Inc. (global import/ export company) | | — |
| | | | |
Salvatore J. Zizza Director Age: 72 | | Since 2004 | | 30 | | President of Zizza & Associates Corp. (private holding company); Chairman of Harbor Diversified, Inc. (pharmaceuticals); Chairman of BAM (semiconductor and aerospace manufacturing); Chairman of Bergen Cove Realty Inc.; Chairman of Metropolitan Paper Recycling Inc. (recycling) (2005-2014) | | Director and Vice Chairman of Trans-Lux Corporation (business services); Director and Chairman of Harbor Diversified Inc. (pharmaceuticals) |
21
The GAMCO Global Growth Fund
Additional Fund Information (Continued) (Unaudited)
| | | | |
Name, Position(s) Address1 and Age | | Term of Office and Length of Time Served2 | | Principal Occupation(s) During Past Five Years |
|
OFFICERS: |
| | |
Bruce N. Alpert President Age: 66 | | Since 2003 | | Executive Vice President and Chief Operating Officer of Gabelli Funds, LLC since 1988; Officer of registered
investment companies within the Gabelli/GAMCO Fund Complex; Senior Vice President of GAMCO Investors,
Inc. since 2008 |
| | |
John C. Ball Treasurer Age: 41 | | Since 2017 | | Treasurer of all the registered investment companies within the Gabelli/GAMCO Fund Complex since 2017; Vice President and Assistant Treasurer of AMG Funds, 2014-2017; Vice President of State Street Corporation, 2007-2014 |
| | |
Agnes Mullady Vice President Age: 59 | | Since 2006 | | Officer of all of the registered investment companies within the Gabelli/GAMCO Fund Complex since 2006; President and Chief Operating Officer of the Fund Division of Gabelli Funds, LLC since 2015; Chief Executive Officer of G.distributors, LLC since 2010; Senior Vice President of GAMCO Investors, Inc. since 2009; Vice President of Gabelli Funds, LLC since 2007; Executive Vice President of Associated Capital Group, Inc. since 2016 |
| | |
Andrea R. Mango Secretary Age: 45 | | Since 2013 | | Vice President of GAMCO Investors, Inc. since 2016; Counsel of Gabelli Funds, LLC since 2013; Secretary of all registered investment companies within the Gabelli/GAMCO Fund Complex since 2013; Vice President of all closed-end funds within the Gabelli/GAMCO Fund Complex since 2014; Corporate Vice President within the Corporate Compliance Department of New York Life Insurance Company, 2011-2013 |
| | |
Richard J. Walz Chief Compliance Officer Age: 58 | | Since 2013 | | Chief Compliance Officer of all of the registered investment companies within the Gabelli/ GAMCO Fund Complex since 2013; Chief Compliance Officer of AEGON USA Investment Management, 2011-2013 |
| 1 | Address: One Corporate Center, Rye, NY 10580-1422, unless otherwise noted. |
| 2 | Each Director will hold office for an indefinite term until the earliest of (i) the next meeting of shareholders, if any, called for the purpose of considering the election or re-election of such Director and until the election and qualification of his or her successor, if any, elected at such meeting, or (ii) the date a Director resigns or retires, or a Director is removed by the Board of Directors or shareholders, in accordance with the Fund’s By-Laws and Articles of Incorporation. Each officer will hold office for an indefinite term until the date he or she resigns or retires or until his or her successor is elected and qualified. |
| 3 | This column includes only directorships of companies required to report to the SEC under the Securities Exchange Act of 1934, as amended, i.e., public companies, or other investment companies registered under the 1940 Act. |
| 4 | “Interested person” of the Corporation as defined in the 1940 Act. Messrs. Mario J. Gabelli and John D. Gabelli, who are brothers, are each considered an “interested person” because of their affiliation with Gabelli Funds, LLC which acts as the Corporation’s investment adviser. |
| 5 | Directors who are not interested persons are considered “Independent” Directors. |
22
THE GAMCO GLOBAL GROWTH FUND
One Corporate Center
Rye, NY 10580-1422
Portfolio Management Team Biographies
Caesar M. P. Bryan joined GAMCO Asset Management in 1994. He is a member of the global investment team of Gabelli Funds, LLC and portfolio manager of several funds within the Gabelli/GAMCO Fund Complex. Prior to joining Gabelli, Mr. Bryan was a portfolio manager at Lexington Management. He began his investment career at Samuel Montagu Company, the London based merchant bank. Mr. Bryan graduated from the University of Southampton in England with a Bachelor of Law and is a member of the English Bar.
Howard F. Ward, CFA, joined Gabelli Funds in 1995 and currently serves as GAMCO’s Chief Investment Officer of Growth Equities as well as a Gabelli Funds, LLC portfolio manager for several funds within the Gabelli/GAMCO Fund Complex. Prior to joining Gabelli, Mr. Ward served as Managing Director and Lead Portfolio Manager for several Scudder mutual funds. He also was an Investment Officer in the Institutional Investment Department with Brown Brothers, Harriman & Co. Mr. Ward received his BA in Economics from Northwestern University.
| | | | |
| | | 2017 TAX NOTICE TO SHAREHOLDERS (Unaudited) For the year ended December 31, 2017, the Fund paid to shareholders long term capital gains totaling $2,715,285, or the maximum allowable. The distribution of long term capital gains has been designated as a capital gain dividend by the Fund’s Board of Directors. All designations are based on financial information available as of the date of this annual report and, accordingly, are subject to change. For each item, it is the intention of the Fund to designate the maximum amount permitted under the Internal Revenue Code and the regulations thereunder. | | |
| | | | |
| | | We have separated the portfolio managers’ commentary from the financial statements and investment portfolio due to corporate governance regulations stipulated by the Sarbanes-Oxley Act of 2002. We have done this to ensure that the content of the portfolio managers’ commentary is unrestricted. The financial statements and investment portfolio are mailed separately from the commentary. Both the commentary and the financial statements, including the portfolio of investments, will be available on our website at www.gabelli.com. | | |
GAMCO Global Series Funds, Inc.
THE GAMCO GLOBAL GROWTH FUND
One Corporate Center
Rye, New York 10580-1422
| | |
| t | | 800-GABELLI (800-422-3554) |
| f | | 914-921-5118 |
| e | | info@gabelli.com |
| | GABELLI.com |
Net Asset Value per share available daily
by calling 800-GABELLI after 7:00 P.M.
| | |
BOARD OF DIRECTORS | | OFFICERS |
Mario J. Gabelli, CFA Chairman and Chief Executive Officer, GAMCO Investors, Inc. Executive Chairman, Associated Capital Group, Inc. E. Val Cerutti Chief Executive Officer, Cerutti Consultants, Inc. Anthony J. Colavita President, Anthony J. Colavita, P.C. Arthur V. Ferrara Former Chairman and Chief Executive Officer, Guardian Life Insurance Company of America John D. Gabelli Senior Vice President, G.research, LLC Werner J. Roeder Former Medical Director, Lawrence Hospital Anthonie C. van Ekris Chairman, BALMAC International, Inc. Salvatore J. Zizza Chairman, Zizza & Associates Corp. | | Bruce N. Alpert President John C. Ball Treasurer Agnes Mullady Vice President Andrea R. Mango Secretary Richard J. Walz Chief Compliance Officer DISTRIBUTOR G.distributors, LLC CUSTODIAN State Street Bank and Trust Company TRANSFER AGENT, AND DIVIDEND DISBURSING AGENT DST Asset Manager Solutions, Inc. LEGAL COUNSEL Skadden, Arps, Slate, Meagher & Flom LLP |
|
This report is submitted for the general information of the shareholders of The GAMCO Global Growth Fund. It is not authorized for distribution to prospective investors unless preceded or accompanied by an effective prospectus. |

| | |
The Gabelli International Small Cap Fund Annual Report — December 31, 2017 | | 
Caesar M. P. Bryan Portfolio Manager |
To Our Shareholders,
For the year ended December 31, 2017, the net asset value (“NAV”) per Class AAA Share of The Gabelli International Small Cap Fund increased 28.1% compared with an increase of 24.0% for the Morgan Stanley Capital International (“MSCI”) All Country (“AC”) World Index. Other classes of shares are available. See page 2 for performance information for all classes of shares.
Enclosed are the financial statements, including the schedule of investments, as of December 31, 2017.
Performance Discussion (Unaudited)
The Fund’s objective is to provide investors with appreciation of capital. Current income is a secondary objective of the Fund.
The Fund’s investment strategy is to invest primarily in a portfolio of common stocks of non-U.S. companies. Under normal market conditions, the Fund will invest at least 80% of its net assets in the stocks of “small cap companies.” Gabelli Funds, LLC, the Adviser currently characterizes small capitalization companies as those with total common stock market values of $3 billion or less at the time of investment.
The Fund may invest in non-U.S. markets throughout the world, including emerging markets. Ordinarily, the Fund will invest in the securities of at least five countries outside the U.S.
In selecting investments, the Adviser seeks issuers with a dominant market share or niche franchise in growing and/or consolidating industries. The Adviser considers for purchase the stocks of small capitalization companies with experienced management, strong balance sheets, and rising free cash flow and earnings. The Adviser’s goal is to invest long term in the stocks of companies trading at reasonable market valuations relative to perceived economic worth.
For the first time on record, according to Bank of America Merrill Lynch (BAML), global equity markets rallied in all twelve months of 2017. Possibly the biggest surprise over recent months has been the improvement in the pace of economic growth in the eurozone. Eurozone growth was faster than the U.S. in 2017. Synchronized global growth is usually good for the Japanese economy as demand for exports accelerates. In November, Japanese industrial production grew 3.7% compared with a year ago. Unemployment is low and companies are starting to raise wages which should be positive for domestic consumption.
Selected holdings that contributed positively to performance in 2017 were: Keyence Corp. (4.1% of net assets as of December 31, 2017) had record sales, high profit metrics and a relative strong balance sheet; Christian Dior SE (3.9%) all business groups within Christian Dior recorded double digit organic growth; and SMC Corp. (3.4%) whose sales have more than doubled since 2009 with minimal debt on the company’s balance sheet.
Some of our weaker performing holdings during the year were: JINS Inc. (1.1%) which saw shortfall in its overseas operations largely from the U.S. and China; Norway Royal Salmon ASA (0.6%) where a rare fish disease ISA (Infectious Salmon Anaemia) caused a downward revision in the company’s harvest volumes;
and Schlumberger Ltd. (no longer held as of December 31, 2017) which declined on the ensuing restructuring of the dynamics in the energy markets, as well as the transition to natural gas and renewables and unconventional drilling methods have taken their toll on exploration and production.
Thank you for your investment in The Gabelli International Small Cap Fund.
We appreciate your confidence and trust.
Comparative Results
| | | | | | | | | | | | | | | | | | | | | | | | | |
| Average Annual Returns through December 31, 2017 (a) (Unaudited) | | | | Since |
| | | | | | | | | | | Inception |
| | | 1 Year | | 5 Year | | 10 Year | | 15 Year | | (5/11/98) |
Class AAA (GABOX) | | | | 28.09 | % | | | | 8.81 | % | | | | 4.35 | % | | | | 8.90 | % | | | | 7.12 | % |
MSCI EAFE Small Cap Index | | | | 33.01 | | | | | 12.25 | | | | | 5.77 | | | | | 12.24 | | | | | 8.89 | (b) |
MSCI AC World Index | | | | 23.97 | | | | | 10.80 | | | | | 4.65 | | | | | 9.00 | | | | | 5.89 | (c) |
Lipper Global Large-Cap Growth Fund Classification | | | | 28.42 | | | | | 11.18 | | | | | 5.40 | | | | | 9.65 | | | | | 6.21 | |
Lipper Global Multi-Cap Growth Fund Classification | | | | 28.45 | | | | | 11.71 | | | | | 4.84 | | | | | 8.63 | | | | | 5.01 | |
Class A (GOCAX) | | | | 27.74 | | | | | 8.74 | | | | | 4.31 | | | | | 8.88 | | | | | 7.10 | |
With sales charge (d) | | | | 20.39 | | | | | 7.46 | | | | | 3.70 | | | | | 8.45 | | | | | 6.78 | |
Class C (GGLCX) | | | | 26.79 | | | | | 8.03 | | | | | 3.58 | | | | | 8.24 | | | | | 6.65 | |
With contingent deferred sales charge (e) | | | | 25.79 | | | | | 8.03 | | | | | 3.58 | | | | | 8.24 | | | | | 6.65 | |
Class I (GLOIX) | | | | 29.02 | | | | | 9.42 | | | | | 4.78 | | | | | 9.20 | | | | | 7.34 | |
In the current prospectuses dated April 28, 2017 as amended on September 6, 2017, the gross expense ratios for Class AAA, A, C, and I Shares are 2.80%, 2.80%, 3.55%, and 2.55%, respectively, and the net expense ratios for these share classes after contractual reimbursements by Gabelli Funds, LLC, (the “Adviser”) are 1.00%, 2.01%, 2.76%, and 1.00%, respectively. See page 10 for the expense ratios for the year ended December 31, 2017. Class AAA and Class I Shares do not have a sales charge. The maximum sales charge for Class A Shares and Class C Shares is 5.75% and 1.00%, respectively.
| | (a) | Returns represent past performance and do not guarantee future results. Total returns and average annual returns reflect changes in share price, reinvestment of distributions, and are net of expenses. Investment returns and the principal value of an investment will fluctuate. When shares are redeemed, they may be worth more or less than their original cost. Current performance may be lower or higher than the performance data presented. Visit www.gabelli.com for performance information as of the most recent month end. Returns would have been lower had the Adviser not reimbursed certain expenses of the Fund. The Fund imposes a 2% redemption fee on shares sold or exchanged within seven days after the date of purchase. Investors should carefully consider the investment objectives, risks, charges, and expenses of the Fund before investing. The prospectuses contain information about these and other matters and should be read carefully before investing. To obtain a prospectus, please visit our website at www.gabelli.com. Investing in foreign securities involves risks not ordinarily associated with investments in domestic issues, including currency fluctuation, economic, and political risks. The Class AAA Share NAVs are used to calculate performance for the periods prior to the issuance of Class A Shares, Class C Shares, and Class I Shares on March 12, 2000, November 23, 2001, and January 11, 2008, respectively. The actual performance of the Class A Shares and Class C Shares would have been lower due to the additional fees and expenses associated with these classes of shares. The actual performance of the Class I Shares would have been higher due to lower expenses related to this class of shares. The MSCI EAFE Small Cap Index has 2,304 constituents and captures small cap representation across Developed Markets countries around the world, excluding the U.S. and Canada. The MSCI AC World Index is an unmanaged market capitalization weighted index that is designed to measure the equity market performance of developed and emerging markets. The MSCI AC World Index consists of 45 country indices comprising 24 developed and 21 emerging market country indices. The Lipper Global Large-Cap Growth Fund Classification and the Lipper Global Multi-Cap Growth Fund Classification reflect the average performance of mutual funds classified in those particular categories. Dividends are considered reinvested. You cannot invest directly in an index. | |
| | (b) | MSCI EAFE Small Cap Index performance as of inception of Index December 31, 1998. | |
| | (c) | MSCI AC World Index since inception performance is a blend of Gross Performance excluding applicable taxes and Net Performance. This benchmark’s Net Performance began on December 29, 2000. | |
| | (d) | Performance results include the effect of the maximum 5.75% sales charge at the beginning of the period. | |
| | (e) | Assuming payment of the 1% maximum contingent deferred sales charge imposed on redemptions made within one year of purchase. | |
2
COMPARISON OF CHANGE IN VALUE OF A $10,000 INVESTMENT IN
THE GABELLI INTERNATIONAL SMALL CAP FUND (CLASS AAA SHARES), LIPPER GLOBAL
MULTI-CAP GROWTH FUND CLASSIFICATION, AND MSCI AC WORLD INDEX (Unaudited)
| * | Past performance is not predictive of future results. The performance tables and graph do not reflect the deduction of taxes that a shareholder would pay on Fund distributions or the redemption of Fund shares. |
3
| | |
| The Gabelli International Small Cap Fund | | |
Disclosure of Fund Expenses (Unaudited) | | |
For the Six Month Period from July 1, 2017 through December 31, 2017 | | Expense Table |
We believe it is important for you to understand the impact of fees and expenses regarding your investment. All mutual funds have operating expenses. As a shareholder of a fund, you incur ongoing costs, which include costs for portfolio management, administrative services, and shareholder reports (like this one), among others. Operating expenses, which are deducted from a fund’s gross income, directly reduce the investment return of a fund. When a fund’s expenses are expressed as a percentage of its average net assets, this figure is known as the expense ratio. The following examples are intended to help you understand the ongoing costs (in dollars) of investing in your Fund and to compare these costs with those of other mutual funds. The examples are based on an investment of $1,000 made at the beginning of the period shown and held for the entire period.
The Expense Table below illustrates your Fund’s costs in two ways:
Actual Fund Return: This section provides information about actual account values and actual expenses. You may use this section to help you to estimate the actual expenses that you paid over the period after any fee waivers and expense reimbursements. The “Ending Account Value” shown is derived from the Fund’s actual return during the past six months, and the “Expenses Paid During Period” shows the dollar amount that would have been paid by an investor who started with $1,000 in the Fund. You may use this information, together with the amount you invested, to estimate the expenses that you paid over the period.
To do so, simply divide your account value by $1,000 (for example, an $8,600 account value divided by $1,000 = 8.6), then multiply the result by the number given for your Fund under the heading “Expenses Paid During Period” to estimate the expenses you paid during this period.
Hypothetical 5% Return: This section provides information about hypothetical account values and
hypothetical expenses based on the Fund’s actual expense ratio. It assumes a hypothetical annualized return of 5% before expenses during the period shown. In this case – because the hypothetical return used is not the Fund’s actual return – the results do not apply to your investment and you cannot use the hypothetical account value and expense to estimate the actual ending account balance or expenses you paid for the period. This example is useful in making comparisons of the ongoing costs of investing in the Fund and other funds. To do so, compare this 5% hypothetical example with the 5% hypothetical examples that appear in shareholder reports of other funds.
Please note that the expenses shown in the table are meant to highlight your ongoing costs only and do not reflect any transactional costs such as sales charges (loads), redemption fees, or exchange fees, if any, which are described in the Prospectus. If these costs were applied to your account, your costs would be higher. Therefore, the 5% hypothetical return is useful in comparing ongoing costs only, and will not help you determine the relative total costs of owning different funds. The “Annualized Expense Ratio” represents the actual expenses for the last six months and may be different from the expense ratio in the Financial Highlights which is for the year ended December 31, 2017.
| | | | | | | | | | | | | | | | |
| | | Beginning Account Value 07/01/17 | | | Ending Account Value 12/31/17 | | | Annualized Expense Ratio | | | Expenses Paid During Period* | |
The Gabelli International Small Cap Fund | | | | | | | | | |
Actual Fund Return | | | | | | | | | | | | | |
Class AAA | | | $1,000.00 | | | | $1,116.00 | | | | 1.35% | | | | $ 7.20 | |
Class A | | | $1,000.00 | | | | $1,112.50 | | | | 2.00% | | | | $10.65 | |
Class C | | | $1,000.00 | | | | $1,108.70 | | | | 2.75% | | | | $14.62 | |
Class I | | | $1,000.00 | | | | $1,118.20 | | | | 1.00% | | | | $ 5.34 | |
Hypothetical 5% Return | | | | | | | | | | | | | |
Class AAA | | | $1,000.00 | | | | $1,018.40 | | | | 1.35% | | | | $ 6.87 | |
Class A | | | $1,000.00 | | | | $1,015.12 | | | | 2.00% | | | | $10.16 | |
Class C | | | $1,000.00 | | | | $1,011.34 | | | | 2.75% | | | | $13.94 | |
Class I | | | $1,000.00 | | | | $1,020.16 | | | | 1.00% | | | | $ 5.09 | |
| * | Expenses are equal to the Fund’s annualized expense ratio for the last six months multiplied by the average account value over the period, multiplied by the number of days in the most recent fiscal half year (184 days), then divided by 365. |
4
Summary of Portfolio Holdings (Unaudited)
The following table presents portfolio holdings as a percent of net assets as of December 31, 2017:
The Gabelli International Small Cap Fund
| | | | |
Consumer Discretionary | | | 29.6 | % |
Industrials | | | 23.4 | % |
Consumer Staples | | | 20.0 | % |
Materials | | | 10.9 | % |
Financials | | | 8.7 | % |
Information Technology | | | 7.0 | % |
| | | | |
Health Care | | | 2.6 | % |
Real Estate | | | 1.2 | % |
Telecommunication Services | | | 0.6 | % |
Other Assets and Liabilities (Net) | | | (4.0 | )% |
| | | | |
| | | 100.0 | % |
| | | | |
The Fund files a complete schedule of portfolio holdings with the Securities and Exchange Commission (the “SEC”) for the first and third quarters of each fiscal year on Form N-Q. Shareholders may obtain this information at www.gabelli.com or by calling the Fund at 800-GABELLI (800-422-3554).The Fund’s Form N-Q is available on the SEC’s website at www.sec.gov and may also be reviewed and copied at the SEC’s Public Reference Room in Washington, DC. Information on the operation of the Public Reference Room may be obtained by calling 800-SEC-0330.
Proxy Voting
The Fund files Form N-PX with its complete proxy voting record for the twelve months ended June 30, no later than August 31 of each year. A description of the Fund’s proxy voting policies, procedures, and how the Fund voted proxies relating to portfolio securities is available without charge, upon request, by (i) calling 800-GABELLI (800-422-3554); (ii) writing to The Gabelli Funds at One Corporate Center, Rye, NY 10580-1422; or (iii) visiting the SEC’s website at www.sec.gov.
5
The Gabelli International Small Cap Fund
Schedule of Investments — December 31, 2017
| | | | | | | | | | |
Shares | | | | Cost | | | Market Value | |
| | | |
| | COMMON STOCKS — 103.0% | | | | | | | | |
| | CONSUMER DISCRETIONARY — 29.6% | | | | | |
55,000 | | AA plc | | $ | 117,992 | | | $ | 126,239 | |
5,555 | | AcadeMedia AB† | | | 39,150 | | | | 43,848 | |
3,000 | | Accell Group | | | 83,317 | | | | 84,337 | |
3,000 | | Amer Sports Oyj | | | 71,715 | | | | 83,113 | |
175,000 | | Banyan Tree Holdings Ltd.† | | | 83,897 | | | | 73,928 | |
1,150 | | Christian Dior SE | | | 69,133 | | | | 420,225 | |
4,500 | | Compagnie Financiere Richemont SA | | | 58,511 | | | | 407,769 | |
40,000 | | Entertainment One Ltd. | | | 159,066 | | | | 175,789 | |
1,400 | | Evolution Gaming Group AB | | | 89,207 | | | | 99,072 | |
250 | | Hermes International | | | 84,929 | | | | 133,858 | |
30,000 | | HT&E Ltd. | | | 55,068 | | | | 44,006 | |
1,150 | | Hunter Douglas NV | | | 94,649 | | | | 99,899 | |
2,200 | | JINS Inc. | | | 125,148 | | | | 115,980 | |
20,000 | | Ladbrokes Coral Group plc | | | 31,326 | | | | 49,118 | |
808 | | Liberty TripAdvisor Holdings Inc., Cl. A† | | | 7,641 | | | | 7,615 | |
20,000 | | Luk Fook Holdings International Ltd. | | | 73,164 | | | | 85,884 | |
7,500 | | Manchester United plc, Cl. A | | | 133,996 | | | | 148,500 | |
25,000 | | Mandarin Oriental International Ltd. | | | 61,939 | | | | 50,500 | |
4,000 | | Modern Times Group MTG AB, Cl. B | | | 151,395 | | | | 168,132 | |
140,000 | | NagaCorp. Ltd. | | | 91,176 | | | | 108,411 | |
7,000 | | Scandic Hotels Group AB | | | 95,146 | | | | 100,480 | |
2,500 | | Sony Corp. | | | 64,950 | | | | 112,780 | |
1,500 | | Ted Baker plc | | | 51,319 | | | | 54,904 | |
1,500 | | Tod’s SpA | | | 95,471 | | | | 109,606 | |
10,000 | | Treatt plc | | | 57,375 | | | | 62,107 | |
25,000 | | William Hill plc | | | 83,648 | | | | 108,687 | |
13,000 | | Zojirushi Corp. | | | 123,057 | | | | 132,452 | |
| | | | | | | | | | |
| | TOTAL CONSUMER DISCRETIONARY | | | 2,253,385 | | | | 3,207,239 | |
| | | | | | | | | | |
| | | |
| | INDUSTRIALS — 23.4% | | | | | | | | |
10,000 | | Aida Engineering Ltd. | | | 116,191 | | | | 122,476 | |
30,000 | | Chemring Group plc | | | 73,508 | | | | 74,427 | |
2,000 | | Clarkson plc | | | 78,000 | | | | 77,255 | |
1,100 | | FANUC Corp. | | | 120,160 | | | | 264,176 | |
4,300 | | Jardine Matheson Holdings Ltd. | | | 137,142 | | | | 261,225 | |
3,600 | | Komatsu Ltd. | | | 76,536 | | | | 130,293 | |
4,000 | | Loomis AB, Cl. B | | | 148,615 | | | | 168,034 | |
600 | | Nidec Corp. | | | 55,269 | | | | 84,189 | |
2,500 | | Nilfisk Holding A/S† | | | 117,766 | | | | 146,260 | |
20,000 | | Rotork plc | | | 68,942 | | | | 72,071 | |
2,000 | | Shima Seiki Manufacturing Ltd. | | | 101,334 | | | | 126,381 | |
900 | | SMC Corp. | | | 111,781 | | | | 370,464 | |
10,000 | | Sodick Co. Ltd. | | | 123,377 | | | | 130,109 | |
17,000 | | Talgo SA | | | 79,799 | | | | 86,873 | |
5,000 | | Teraoka Seisakusho Co. Ltd. | | | 36,335 | | | | 37,719 | |
18,000 | | Toshiba Machine Co. Ltd. | | | 96,626 | | | | 134,351 | |
500 | | Warehouses De Pauw CVA | | | 56,435 | | | | 56,051 | |
| | | | | | | | | | |
Shares | | | | Cost | | | Market Value | |
| | | |
6,000 | | Workspace Group plc | | $ | 72,186 | | | $ | 81,171 | |
4,000 | | Yushin Precision Equipment Co. Ltd. | | | 109,039 | | | | 114,134 | |
| | | | | | | | | | |
| | TOTAL INDUSTRIALS | | | 1,779,041 | | | | 2,537,659 | |
| | | | | | | | | | |
| | |
| | CONSUMER STAPLES — 20.0% | | | | | |
1,300 | | Danone SA | | | 77,722 | | | | 109,108 | |
2,280 | | Dr Pepper Snapple Group Inc. | | | 54,395 | | | | 221,297 | |
2,000 | | Heineken Holding NV | | | 93,486 | | | | 197,951 | |
15,000 | | Hotel Chocolat Group Ltd. | | | 62,401 | | | | 74,933 | |
1,300 | | Interparfums SA | | | 52,337 | | | | 53,891 | |
2,700 | | Kameda Seika Co. Ltd. | | | 112,789 | | | | 123,887 | |
3,000 | | Kato Sangyo Co. Ltd. | | | 90,690 | | | | 109,962 | |
1,200 | | Laurent-Perrier Group | | | 113,180 | | | | 119,951 | |
2,000 | | Milbon Co. Ltd. | | | 59,956 | | | | 67,273 | |
1,300 | | Naturex† | | | 138,918 | | | | 138,152 | |
4,000 | | Norway Royal Salmon ASA | | | 86,224 | | | | 65,525 | |
1,910 | | Pernod Ricard SA | | | 147,275 | | | | 302,391 | |
80,000 | | Premier Foods plc† | | | 43,658 | | | | 46,175 | |
17,000 | | PZ Cussons plc | | | 73,179 | | | | 74,251 | |
4,500 | | Refresco Group NV | | | 92,744 | | | | 106,906 | |
4,000 | | Sakata Seed Corp. | | | 118,342 | | | | 138,806 | |
25,000 | | Stock Spirits Group plc | | | 85,774 | | | | 90,713 | |
1,000 | | Viscofan SA | | | 59,782 | | | | 66,004 | |
3,000 | | Wessanen | | | 54,309 | | | | 61,840 | |
| | | | | | | | | | |
| | TOTAL CONSUMER STAPLES | | | 1,617,161 | | | | 2,169,016 | |
| | | | | | | | | | |
| | |
| | MATERIALS — 10.9% | | | | | |
19,850 | | Alamos Gold Inc., Cl. A | | | 146,707 | | | | 129,223 | |
25,000 | | AuRico Metals Inc.† | | | 28,180 | | | | 35,525 | |
18,000 | | B2Gold Corp.† | | | 51,262 | | | | 55,800 | |
20,000 | | Centamin plc | | | 41,669 | | | | 42,746 | |
75 | | Conzzeta AG | | | 72,600 | | | | 78,198 | |
3,000 | | Detour Gold Corp.† | | | 42,313 | | | | 35,354 | |
3,000 | | Endeavour Mining Corp.† | | | 60,421 | | | | 61,050 | |
12,000 | | Hochschild Mining plc | | | 46,101 | | | | 42,773 | |
3,000 | | JSP Corp. | | | 98,745 | | | | 102,773 | |
3,000 | | Labrador Iron Ore Royalty Corp. | | | 51,466 | | | | 64,916 | |
4,000 | | MAG Silver Corp.† | | | 51,468 | | | | 49,440 | |
30,000 | | Northern Dynasty Minerals Ltd.† | | | 55,344 | | | | 53,100 | |
15,000 | | OceanaGold Corp. | | | 50,106 | | | | 38,835 | |
4,000 | | Osisko Gold Royalties Ltd. | | | 57,390 | | | | 46,240 | |
10,000 | | Sekisui Plastics Co. Ltd. | | | 117,335 | | | | 131,795 | |
20,000 | | SEMAFO Inc.† | | | 55,436 | | | | 56,400 | |
5,000 | | T Hasegawa Co Ltd. | | | 97,468 | | | | 104,282 | |
2,000 | | Torex Gold Resources Inc.† | | | 35,750 | | | | 18,982 | |
25,000 | | Westgold Resources Ltd.† | | | 38,443 | | | | 34,526 | |
| | | | | | | | | | |
| | TOTAL MATERIALS | | | 1,198,204 | | | | 1,181,958 | |
| | | | | | | | | | |
| | |
| | FINANCIALS — 8.7% | | | | | |
30,000 | | Brewin Dolphin Holdings plc | | | 141,892 | | | | 157,967 | |
10,000 | | GAM Holding AG | | | 154,701 | | | | 161,630 | |
4,000 | | Kinnevik AB, Cl. B | | | 92,113 | | | | 135,217 | |
See accompanying notes to financial statements.
6
The Gabelli International Small Cap Fund
Schedule of Investments (Continued) — December 31, 2017
| | | | | | | | | | |
Shares | | | | Cost | | | Market Value | |
| | COMMON STOCKS (Continued) | | | | | | | | |
| | FINANCIALS (Continued) | | | | | | | | |
17,000 | | Polar Capital Holdings plc | | $ | 103,340 | | | $ | 124,575 | |
3,000 | | Rothschild & Co. | | | 107,282 | | | | 109,912 | |
3,600 | | Schroders plc | | | 63,614 | | | | 170,896 | |
5,000 | | Tamburi Investment Partners SpA | | | 32,853 | | | | 33,326 | |
20,000 | | Xafinity plc | | | 46,034 | | | | 51,711 | |
| | | | | | | | | | |
| | TOTAL FINANCIALS | | | 741,829 | | | | 945,234 | |
| | | | | | | | | | |
| | |
| | INFORMATION TECHNOLOGY — 7.0% | | | | | |
24,285 | | Equiniti Group plc | | | 90,810 | | | | 93,545 | |
800 | | Keyence Corp. | | | 74,627 | | | | 448,156 | |
6,000 | | NetEnt AB | | | 54,844 | | | | 41,326 | |
12,000 | | SafeCharge International Group Ltd. | | | 47,694 | | | | 47,957 | |
6,000 | | Topcon Corp. | | | 108,068 | | | | 129,772 | |
| | | | | | | | | | |
| | | TOTAL INFORMATION TECHNOLOGY | | 376,043 | | | 760,756 | |
| | | | | | | | | | |
| | | |
| | HEALTH CARE — 1.6% | | | | | | | | |
3,000 | | AddLife AB | | | 60,059 | | | | 62,354 | |
1,000 | | DBV Technologies SA† | | | 90,328 | | | | 50,268 | |
25,000 | | Nanosonics Ltd.† | | | 53,385 | | | | 54,032 | |
| | | | | | | | | | |
| | TOTAL HEALTH CARE | | | 203,772 | | | | 166,654 | |
| | | | | | | | | | |
| | | |
| | REAL ESTATE — 1.2% | | | | | | | | |
25,000 | | Impact Healthcare Reit plc | | | 34,145 | | | | 34,555 | |
4,000 | | PATRIZIA Immobilien AG† | | | 88,694 | | | | 92,796 | |
| | | | | | | | | | |
| | TOTAL REAL ESTATE | | | 122,839 | | | | 127,351 | |
| | | | | | | | | | |
| | |
| | TELECOMMUNICATION SERVICES — 0.6% | | | | | |
15,000 | | Sistema PJSC FC, GDR | | | 56,644 | | | | 62,550 | |
| | | | | | | | | | |
| | | |
| | TOTAL COMMON STOCKS | | | 8,348,918 | | | | 11,158,417 | |
| | | | | | | | | | |
| | | |
| | PREFERRED STOCKS — 1.0% | | | | | | | | |
| | Health Care — 1.0% | | | | | | | | |
1,200 | | Draegerwerk AG & Co. | | | | | | | | |
| | KGaA, 0.190% | | | 107,545 | | | | 104,099 | |
| | | | | | | | | | |
| | | | | | | | | | |
Shares | | | | Cost | | | Market Value | |
| | RIGHTS — 0.0% | | | | | | | | |
| | Financials — 0.0% | | | | | | | | |
| 1,538 | | Xafinity plc, | | | | | | | | |
| | expire 01/04/18† | | $ | 0 | | | $ | 447 | |
| | | | | | | | | | |
| | | |
| | TOTAL INVESTMENTS — 104.0% | | $ | 8,456,463 | | | | 11,262,963 | |
| | | | | | | | | | |
| | Other Assets and Liabilities (Net) — (4.0)% | | | | (434,705 | ) |
| | | | | | | | | | |
| | NET ASSETS — 100.0% | | | | | | $ | 10,828,258 | |
| | | | | | | | | | |
| † | Non-income producing security. |
| GDR | Global Depositary Receipt |
| | | | | | | | |
Geographic Diversification | | % of Market Value | | | Market Value | |
| | |
Europe | | | 53.5 | % | | $ | 6,020,153 | |
Japan | | | 28.7 | | | | 3,232,210 | |
Latin America | | | 7.2 | | | | 815,589 | |
Canada | | | 6.8 | | | | 759,606 | |
United States | | | 2.0 | | | | 228,912 | |
Asia/Pacific | | | 1.8 | | | | 206,493 | |
| | | | | | | | |
| | | 100.0 | % | | $ | 11,262,963 | |
| | | | | | | | |
See accompanying notes to financial statements.
7
The Gabelli International Small Cap Fund
Statement of Assets and Liabilities
December 31, 2017
| | | | |
Assets: | | | | |
Investments, at value (cost $8,456,463) | | $ | 11,262,963 | |
Cash | | | 181 | |
Receivable for Fund shares sold | | | 27,120 | |
Receivable from Adviser | | | 59,157 | |
Dividends receivable | | | 32,960 | |
Prepaid expenses | | | 15,838 | |
| | | | |
Total Assets | | | 11,398,219 | |
| | | | |
Liabilities: | | | | |
Payable for investment advisory fees | | | 18,196 | |
Payable for distribution fees | | | 1,944 | |
Line of credit payable | | | 482,000 | |
Other accrued expenses | | | 67,821 | |
| | | | |
Total Liabilities | | | 569,961 | |
| | | | |
Net Assets (applicable to 581,634 shares outstanding) | | $ | 10,828,258 | |
| | | | |
Net Assets Consist of: | | | | |
Paid-in capital | | $ | 8,036,988 | |
Accumulated distributions in excess of net investment income | | | (15,488 | ) |
Net unrealized appreciation on investments | | | 2,806,500 | |
Net unrealized appreciation on foreign currency translations | | | 258 | |
| | | | |
Net Assets | | $ | 10,828,258 | |
| | | | |
Shares of Capital Stock, each at $0.001 par value: | | | | |
Class AAA: | | | | |
Net Asset Value, offering, and redemption price per share ($8,599,208 ÷ 463,445 shares outstanding; 75,000,000 shares authorized) | | | $18.55 | |
Class A: | | | | |
Net Asset Value and redemption price per share ($154,638 ÷ 8,386 shares outstanding; 50,000,000 shares authorized) | | | $18.44 | |
Maximum offering price per share (NAV ÷ 0.9425, based on maximum sales charge of 5.75% of the offering price) | | | $19.56 | |
Class C: | | | | |
Net Asset Value and offering price per share ($43,619 ÷ 2,527 shares outstanding; 25,000,000 shares authorized) | | | $17.26 | (a) |
Class I: | | | | |
Net Asset Value, offering, and redemption price per share ($2,030,793 ÷ 107,276 shares outstanding; 25,000,000 shares authorized) | | | $18.93 | |
| (a) | Redemption price varies based on the length of time held. |
Statement of Operations
For the Year Ended December 31, 2017
| | | | |
Investment Income: | | | | |
Dividends (net of foreign withholding taxes of $12,957) | | $ | 184,784 | |
Interest | | | 1,819 | |
Other Income* | | | 15 | |
| | | | |
Total Investment Income | | | 186,618 | |
| | | | |
Expenses: | | | | |
Investment advisory fees | | | 102,321 | |
Distribution fees - Class AAA | | | 20,461 | |
Distribution fees - Class A | | | 461 | |
Distribution fees - Class C | | | 419 | |
Legal and audit fees | | | 58,183 | |
Registration expenses | | | 29,876 | |
Shareholder communications expenses | | | 27,176 | |
Shareholder services fees | | | 21,850 | |
Custodian fees | | | 6,543 | |
Directors’ fees | | | 3,031 | |
Interest expense | | | 173 | |
Miscellaneous expenses | | | 33,371 | |
| | | | |
Total Expenses | | | 303,865 | |
| | | | |
Less: | | | | |
Expenses reimbursed by Adviser (See Note 3) | | | (144,403 | ) |
| | | | |
Net Expenses | | | 159,462 | |
| | | | |
Net Investment Income | | | 27,156 | |
| | | | |
Net Realized and Unrealized Gain/(Loss) on Investments and Foreign Currency: | | | | |
Net realized gain on investments | | | 3,941,541 | |
Net realized gain on foreign currency transactions | | | 322 | |
| | | | |
Net realized gain on investments and foreign currency transactions | | | 3,941,863 | |
| | | | |
Net change in unrealized appreciation/(depreciation) on investments | | | (1,455,377 | ) |
on foreign currency translations | | | 1,545 | |
| | | | |
Net change in unrealized appreciation/(depreciation) on investments and foreign currency translations | | | (1,453,832 | ) |
| | | | |
Net Realized and Unrealized Gain/(Loss)on Investments and Foreign Currency | | | 2,488,031 | |
| | | | |
Net Increase in Net Assets Resulting from Operations | | $ | 2,515,187 | |
| | | | |
| * | The Fund received a reimbursement of custody expenses paid in prior years. |
See accompanying notes to financial statements.
8
The Gabelli International Small Cap Fund
Statement of Changes in Net Assets
| | | | | | | | | | |
| | | Year Ended December 31, 2017 | | Year Ended December 31, 2016 |
Operations: | | | | | | | | | | |
Net investment income | | | $ | 27,156 | | | | $ | 113,553 | |
Net realized gain on investments and foreign currency transactions | | | | 3,941,863 | | | | | 371,859 | |
Net change in unrealized depreciation on investments and foreign currency translations | | | | (1,453,832 | ) | | | | (384,821 | ) |
| | | | | | | | | | |
Net Increase in Net Assets Resulting from Operations. | | | | 2,515,187 | | | | | 100,591 | |
| | | | | | | | | | |
Distributions to Shareholders: | | | | | | | | | | |
Net investment income | | | | | | | | | | |
Class AAA | | | | (42,189 | ) | | | | (93,645 | ) |
Class A | | | | (388 | ) | | | | (1,905 | ) |
Class C | | | | — | | | | | (440 | ) |
Class I | | | | (21,566 | ) | | | | (19,219 | ) |
| | | | | | | | | | |
| | | | (64,143 | ) | | | | (115,209 | ) |
| | | | | | | | | | |
Net realized gain | | | | | | | | | | |
Class AAA | | | | (3,138,343 | ) | | | | (333,251 | ) |
Class A | | | | (61,407 | ) | | | | (7,242 | ) |
Class C | | | | (15,963 | ) | | | | (1,741 | ) |
Class I | | | | (701,317 | ) | | | | (52,445 | ) |
| | | | | | | | | | |
| | | | (3,917,030 | ) | | | | (394,679 | ) |
| | | | | | | | | | |
Total Distributions to Shareholders | | | | (3,981,173 | ) | | | | (509,888 | ) |
| | | | | | | | | | |
| | |
Capital Share Transactions: | | | | | | | | | | |
Class AAA | | | | 2,003,345 | | | | | (485,664 | ) |
Class A | | | | 6,401 | | | | | (9,618 | ) |
Class C | | | | 10,561 | | | | | (9,886 | ) |
Class I | | | | 1,059,355 | | | | | 47,799 | |
| | | | | | | | | | |
Net Increase/(Decrease) in Net Assets from Capital Share Transactions | | | | 3,079,662 | | | | | (457,369 | ) |
| | | | | | | | | | |
| | |
Redemption Fees | | | | — | | | | | 1 | |
| | | | | | | | | | |
Net Increase/(Decrease) in Net Assets | | | | 1,613,676 | | | | | (866,665 | ) |
Net Assets: | | | | | | | | | | |
Beginning of year | | | | 9,214,582 | | | | | 10,081,247 | |
| | | | | | | | | | |
End of year (including undistributed net investment income of $0 and $0, respectively) | | | $ | 10,828,258 | | | | $ | 9,214,582 | |
| | | | | | | | | | |
See accompanying notes to financial statements.
9
The Gabelli International Small Cap Fund
Financial Highlights
Selected data for a share of capital stock outstanding throughout each year:
| | | | | | | | | | | | | | | | | | | | | | | | | | | | | | | | | | | | | | | | | | | | | | | | | | | | | | | | | | | | | | | | | | | | | | | | | | | |
| | | | | Income (Loss)
from Investment Operations | | Distributions | | | | | | | | Ratios to Average Net Assets/
Supplemental Data |
Year Ended December 31 | | Net Asset Value, Beginning of Year | | Net Investment Income (Loss)(a) | | Net Realized and Unrealized Gain (Loss) on Investments | | Total from Investment Operations | | Net Investment Income | | Net Realized Gain | | Total Distributions | | Redemption Fees(a)(b) | | Net Asset Value, End of Year | | Total Return† | | Net Assets End of Year (in 000’s) | | Net Investment Income (Loss) | | Operating Expenses Before Reimburse- ment | | Operating Expenses Net of Reimburse- ment(c) | | Portfolio Turnover Rate |
Class AAA | | | | | | | | | | | | | | | | | | | | | | | | | | | | | | | | | | | | | | | | | | | | | | | | | | | | | | | | | | | | | | | | | | | | | | | | | | | |
2017 | | | | $22.41 | | | | | $ 0.04 | | | | | $ 6.19 | | | | $ | 6.23 | | | | | $(0.13 | ) | | | $ | (9.96 | ) | | | $ | (10.09 | ) | | | | — | | | | $ | 18.55 | | | | | 28.1 | % | | | $ | 8,599 | | | | | 0.16 | % | | | | 3.01 | % | | | | 1.67 | % | | | | 71 | % |
2016 | | | | 23.45 | | | | | 0.27 | | | | | (0.02 | ) | | | | 0.25 | | | | | (0.28 | ) | | | | (1.01 | ) | | | | (1.29 | ) | | | $ | 0.00 | | | | | 22.41 | | | | | 1.1 | | | | | 7,764 | | | | | 1.14 | | | | | 2.80 | | | | | 1.38 | (d)(e) | | | | 4 | |
2015 | | | | 23.71 | | | | | 0.01 | | | | | 0.05 | | | | | 0.06 | | | | | (0.11 | ) | | | | (0.21 | ) | | | | (0.32 | ) | | | | 0.00 | | | | | 23.45 | | | | | 0.2 | | | | | 8,596 | | | | | 0.03 | | | | | 2.67 | | | | | 2.02 | (d)(f) | | | | 7 | |
2014 | | | | 23.99 | | | | | 0.08 | | | | | (0.36 | ) | | | | (0.28 | ) | | | | — | | | | | — | | | | | — | | | | | — | | | | | 23.71 | | | | | (1.2 | ) | | | | 10,226 | | | | | 0.33 | | | | | 2.72 | | | | | 2.00 | | | | | 9 | |
2013 | | | | 20.19 | | | | | 0.02 | | | | | 3.80 | | | | | 3.82 | | | | | (0.02 | ) | | | | — | | | | | (0.02 | ) | | | | — | | | | | 23.99 | | | | | 18.9 | | | | | 11,121 | | | | | 0.10 | | | | | 2.74 | | | | | 2.00 | | | | | 5 | |
Class A | | | | | | | | | | | | | | | | | | | | | | | | | | | | | | | | | | | | | | | | | | | | | | | | | | | | | | | | | | | | | | | | | | | | | | | | | | | |
2017 | | | | $22.33 | | | | | $ (0.05 | ) | | | | $ 6.18 | | | | $ | 6.13 | | | | | $(0.06 | ) | | | $ | (9.96 | ) | | | $ | (10.02 | ) | | | | — | | | | $ | 18.44 | | | | | 27.7 | % | | | $ | 155 | | | | | (0.19 | )% | | | | 3.01 | % | | | | 2.00 | % | | | | 71 | % |
2016 | | | | 23.35 | | | | | 0.27 | | | | | (0.01 | ) | | | | 0.26 | | | | | (0.27 | ) | | | | (1.01 | ) | | | | (1.28 | ) | | | $ | 0.00 | | | | | 22.33 | | | | | 1.1 | | | | | 166 | | | | | 1.14 | | | | | 2.80 | | | | | 1.39 | (d)(e) | | | | 4 | |
2015 | | | | 23.61 | | | | | 0.02 | | | | | 0.03 | | | | | 0.05 | | | | | (0.10 | ) | | | | (0.21 | ) | | | | (0.31 | ) | | | | 0.00 | | | | | 23.35 | | | | | 0.1 | | | | | 183 | | | | | 0.08 | | | | | 2.67 | | | | | 2.02 | (d)(f) | | | | 7 | |
2014 | | | | 23.90 | | | | | 0.08 | | | | | (0.37 | ) | | | | (0.29 | ) | | | | — | | | | | — | | | | | — | | | | | — | | | | | 23.61 | | | | | (1.2 | ) | | | | 220 | | | | | 0.35 | | | | | 2.72 | | | | | 2.00 | | | | | 9 | |
2013 | | | | 20.11 | | | | | 0.03 | | | | | 3.78 | | | | | 3.81 | | | | | (0.02 | ) | | | | — | | | | | (0.02 | ) | | | | — | | | | | 23.90 | | | | | 19.0 | | | | | 238 | | | | | 0.13 | | | | | 2.74 | | | | | 2.00 | | | | | 5 | |
Class C | | | | | | | | | | | | | | | | | | | | | | | | | | | | | | | | | | | | | | | | | | | | | | | | | | | | | | | | | | | | | | | | | | | | | | | | | | | |
2017 | | | | $21.52 | | | | | $ (0.23 | ) | | | | $ 5.93 | | | | $ | 5.70 | | | | | — | | | | $ | (9.96 | ) | | | $ | (9.96 | ) | | | | — | | | | $ | 17.26 | | | | | 26.8 | % | | | $ | 43 | | | | | (0.92 | )% | | | | 3.76 | % | | | | 2.75 | % | | | | 71 | % |
2016 | | | | 22.60 | | | | | 0.20 | | | | | (0.01 | ) | | | | 0.19 | | | | | $(0.26 | ) | | | | (1.01 | ) | | | | (1.27 | ) | | | $ | 0.00 | | | | | 21.52 | | | | | 0.9 | | | | | 39 | | | | | 0.87 | | | | | 3.55 | | | | | 1.66 | (d)(e) | | | | 4 | |
2015 | | | | 22.94 | | | | | (0.17 | ) | | | | 0.04 | | | | | (0.13 | ) | | | | — | | | | | (0.21 | ) | | | | (0.21 | ) | | | | 0.00 | | | | | 22.60 | | | | | 0.6 | | | | | 51 | | | | | (0.75 | ) | | | | 3.42 | | | | | 2.77 | (d)(f) | | | | 7 | |
2014 | | | | 23.40 | | | | | (0.04 | ) | | | | (0.42 | ) | | | | (0.46 | ) | | | | — | | | | | — | | | | | — | | | | | — | | | | | 22.94 | | | | | (2.0 | ) | | | | 31 | | | | | (0.17 | ) | | | | 3.46 | | | | | 2.75 | | | | | 9 | |
2013 | | | | 19.82 | | | | | (0.14 | ) | | | | 3.72 | | | | | 3.58 | | | | | — | | | | | — | | | | | — | | | | | — | | | | | 23.40 | | | | | 18.1 | | | | | 19 | | | | | (0.65 | ) | | | | 3.49 | | | | | 2.75 | | | | | 5 | |
Class I | | | | | | | | | | | | | | | | | | | | | | | | | | | | | | | | | | | | | | | | | | | | | | | | | | | | | | | | | | | | | | | | | | | | | | | | | | | |
2017 | | | | $22.68 | | | | | $ 0.21 | | | | | $ 6.31 | | | | $ | 6.52 | | | | | $(0.31 | ) | | | $ | (9.96 | ) | | | $ | (10.27 | ) | | | | — | | | | $ | 18.93 | | | | | 29.0 | % | | | $ | 2,031 | | | | | 0.82 | % | | | | 2.76 | % | | | | 1.00 | % | | | | 71 | % |
2016 | | | | 23.71 | | | | | 0.36 | | | | | (0.01 | ) | | | | 0.35 | | | | | (0.37 | ) | | | | (1.01 | ) | | | | (1.38 | ) | | | $ | 0.00 | | | | | 22.68 | | | | | 1.5 | | | | | 1,246 | | | | | 1.50 | | | | | 2.55 | | | | | 1.01 | (d)(e) | | | | 4 | |
2015 | | | | 23.87 | | | | | 0.21 | | | | | 0.08 | | | | | 0.29 | | | | | (0.24 | ) | | | | (0.21 | ) | | | | (0.45 | ) | | | | 0.00 | | | | | 23.71 | | | | | 1.2 | | | | | 1,251 | | | | | 0.88 | | | | | 2.42 | | | | | 1.02 | (d)(f) | | | | 7 | |
2014 | | | | 24.04 | | | | | 0.21 | | | | | (0.38 | ) | | | | (0.17 | ) | | | | — | | | | | — | | | | | — | | | | | — | | | | | 23.87 | | | | | (0.7 | ) | | | | 668 | | | | | 0.86 | | | | | 2.46 | | | | | 1.48 | | | | | 9 | |
2013 | | | | 20.23 | | | | | 0.08 | | | | | 3.81 | | | | | 3.89 | | | | | (0.08 | ) | | | | — | | | | | (0.08 | ) | | | | — | | | | | 24.04 | | | | | 19.2 | | | | | 641 | | | | | 0.35 | | | | | 2.49 | | | | | 1.75 | | | | | 5 | |
| † | Total return represents aggregate total return of a hypothetical $1,000 investment at the beginning of the year and sold at the end of the year including reinvestment of distributions and does not reflect the applicable sales charges. |
| (a) | Per share amounts have been calculated using the average shares outstanding method. |
| (b) | Amount represents less than $0.005 per share. |
| (c) | The Fund incurred interest expense for the years ended December 31, 2017, 2016, 2015, 2014, and 2013 and the effect of interest expense was minimal. |
| (d) | The Fund incurred tax expense for the years ended December 31, 2016 and 2015. If tax expense had not been incurred, the ratios of operating expenses to average net assets would have been 1.37% and 2.00% (Class AAA), and 1.38% and 2.00% (Class A), 1.65% and 2.75% (Class C), and 1.00% and 1.00% (Class I), respectively. |
| (e) | During the year ended December 31, 2016, the Fund received reimbursements of custody expenses paid in prior years. Had such reimbursement (allocated by relative net asset values of the Fund’s share classes) been included in this period, the expense ratios would have been 1.17% (Class AAA), 1.18% (Class A), 1.45% (Class C), and 0.80% (Class I). |
| (f) | The Fund received credits from a designated broker who agreed to pay certain Fund operating expenses. For the year ended December 31, 2015, had such payments not been made, the expense ratios would have been 2.03% (Class AAA and Class A), 2.78% (Class C), and 1.03% (Class I). |
See accompanying notes to financial statements.
10
The Gabelli International Small Cap Fund
Notes to Financial Statements
1. Organization. Effective September 5, 2017, The GAMCO Global Opportunities Fund changed its name to The Gabelli International Small Cap Fund with a corresponding change in the name of each of its Classes of Shares. The Fund, a series of GAMCO Global Series Funds, Inc. (the “Corporation”), was incorporated on July 16, 1993 in Maryland. The Fund is a non-diversified open-end management investment company registered under the Investment Company Act of 1940, as amended (the “1940 Act”), and one of four separately managed portfolios (collectively, the “Portfolios”) of the Corporation. The Fund’s primary objective is capital appreciation. The Fund commenced investment operations on May 11, 1998.
2. Significant Accounting Policies. As an investment company, the Fund follows the investment company accounting and reporting guidance, which is part of U.S. generally accepted accounting principles (“GAAP”) that may require the use of management estimates and assumptions in the preparation of its financial statements. Actual results could differ from those estimates. The following is a summary of significant accounting policies followed by the Fund in the preparation of its financial statements.
Security Valuation. Portfolio securities listed or traded on a nationally recognized securities exchange or traded in the U.S. over-the-counter market for which market quotations are readily available are valued at the last quoted sale price or a market’s official closing price as of the close of business on the day the securities are being valued. If there were no sales that day, the security is valued at the average of the closing bid and asked prices or, if there were no asked prices quoted on that day, then the security is valued at the closing bid price on that day. If no bid or asked prices are quoted on such day, the security is valued at the most recently available price or, if the Board of Directors (the “Board”) so determines, by such other method as the Board shall determine in good faith to reflect its fair market value. Portfolio securities traded on more than one national securities exchange or market are valued according to the broadest and most representative market, as determined by Gabelli Funds, LLC (the “Adviser”).
Portfolio securities primarily traded on a foreign market are generally valued at the preceding closing values of such securities on the relevant market, but may be fair valued pursuant to procedures established by the Board if market conditions change significantly after the close of the foreign market, but prior to the close of business on the day the securities are being valued. Debt obligations for which market quotations are readily available are valued at the average of the latest bid and asked prices. If there were no asked prices quoted on such day, the security is valued using the closing bid price. Such debt obligations are valued through prices provided by a Pricing Service approved by the Board. Certain securities are valued principally using dealer quotations.
Securities and assets for which market quotations are not readily available are fair valued as determined by the Board. Fair valuation methodologies and procedures may include, but are not limited to: analysis and review of available financial and non-financial information about the company; comparisons with the valuation and changes in valuation of similar securities, including a comparison of foreign securities with the equivalent U.S. dollar value American Depositary Receipt securities at the close of the U.S. exchange; and evaluation of any other information that could be indicative of the value of the security.
The Fund employs a fair value model to adjust prices to reflect events affecting the values of certain portfolio securities which occur between the close of trading on the principal market for such securities (foreign exchanges and over-the-counter markets) at the time when net asset values of the Fund are determined. If the Fund’s valuation committee believes that a particular event would materially affect net asset value, further adjustment is considered.
11
The Gabelli International Small Cap Fund
Notes to Financial Statements (Continued)
The inputs and valuation techniques used to measure fair value of the Fund’s investments are summarized into three levels as described in the hierarchy below:
| | · | | Level 1 — quoted prices in active markets for identical securities; |
| | · | | Level 2 — other significant observable inputs (including quoted prices for similar securities, interest rates, prepayment speeds, credit risk, etc.); and |
| | · | | Level 3 — significant unobservable inputs (including the Board’s determinations as to the fair value of investments). |
A financial instrument’s level within the fair value hierarchy is based on the lowest level of any input both individually and in the aggregate that is significant to the fair value measurement. The inputs or methodology used for valuing securities are not necessarily an indication of the risk associated with investing in those securities. If fair value is adjusted from the local close, such securities are classified as Level 2 in the fair value hierarchy presented below. The summary of the Fund’s investments in securities by inputs used to value the Fund’s investments as of December 31, 2017 is as follows:
| | | | | | | | | | | | |
| | | Valuation Inputs | | | | |
| | | Level 1 | | | Level 2 Other Significant | | | Total Market Value | |
| | | Quoted Prices | | | Observable Inputs | | | at 12/31/17 | |
INVESTMENTS IN SECURITIES: | | | | | | | | | | | | |
ASSETS (Market Value): | | | | | | | | | | | | |
Common Stocks (a) | | | $11,158,417 | | | | — | | | | $11,158,417 | |
Preferred Stocks (a) | | | 104,099 | | | | — | | | | 104,099 | |
Rights (a) | | | — | | | | $447 | | | | 447 | |
TOTAL INVESTMENTS IN SECURITIES – ASSETS | | | $11,262,516 | | | | $447 | | | | $11,262,963 | |
| (a) | Please refer to the Schedule of Investments (“SOI”) for the industry classifications of these portfolio holdings. |
The Fund did not have transfers between Level 1 and Level 2 during the year ended December 31, 2017.The Fund’s policy is to recognize transfers among Levels as of the beginning of the reporting period.
There were no Level 3 investments held at December 31, 2017 or December 31, 2016.
Additional Information to Evaluate Qualitative Information.
General. The Fund uses recognized industry pricing services – approved by the Board and unaffiliated with the Adviser – to value most of its securities, and uses broker quotes provided by market makers of securities not valued by these and other recognized pricing sources. Several different pricing feeds are received to value domestic equity securities, international equity securities, preferred equity securities, and fixed income securities. The data within these feeds are ultimately sourced from major stock exchanges and trading systems where these securities trade. The prices supplied by external sources are checked by obtaining quotations or actual transaction prices from market participants. If a price obtained from the pricing source is deemed unreliable, prices will be sought from another pricing service or from a broker/dealer that trades that security or similar securities.
12
The Gabelli International Small Cap Fund
Notes to Financial Statements (Continued)
Fair Valuation. Fair valued securities may be common or preferred equities, warrants, options, rights, or fixed income obligations. Where appropriate, Level 3 securities are those for which market quotations are not available, such as securities not traded for several days, or for which current bids are not available, or which are restricted as to transfer. When fair valuing a security, factors to consider include recent prices of comparable securities that are publicly traded, reliable prices of securities not publicly traded, the use of valuation models, current analyst reports, valuing the income or cash flow of the issuer, or cost if the preceding factors do not apply. A significant change in the unobservable inputs could result in a lower or higher value in level 3 securities. The circumstances of Level 3 securities are frequently monitored to determine if fair valuation measures continue to apply.
The Adviser reports quarterly to the Board the results of the application of fair valuation policies and procedures. These may include backtesting the prices realized in subsequent trades of these fair valued securities to fair values previously recognized.
Foreign Currency Translations. The books and records of the Fund are maintained in U.S. dollars. Foreign currencies, investments, and other assets and liabilities are translated into U.S. dollars at current exchange rates. Purchases and sales of investment securities, income, and expenses are translated at the exchange rate prevailing on the respective dates of such transactions. Unrealized gains and losses that result from changes in foreign exchange rates and/or changes in market prices of securities have been included in unrealized appreciation/depreciation on investments and foreign currency translations. Net realized foreign currency gains and losses resulting from changes in exchange rates include foreign currency gains and losses between trade date and settlement date on investment securities transactions, foreign currency transactions, and the difference between the amounts of interest and dividends recorded on the books of the Fund and the amounts actually received. The portion of foreign currency gains and losses related to fluctuation in exchange rates between the initial purchase trade date and subsequent sale trade date is included in realized gain/(loss) on investments.
Foreign Securities. The Fund may directly purchase securities of foreign issuers. Investing in securities of foreign issuers involves special risks not typically associated with investing in securities of U.S. issuers. The risks include possible revaluation of currencies, the inability to repatriate funds, less complete financial information about companies, and possible future adverse political and economic developments. Moreover, securities of many foreign issuers and their markets may be less liquid and their prices more volatile than securities of comparable U.S. issuers.
Foreign Taxes. The Fund may be subject to foreign taxes on income, gains on investments, or currency repatriation, a portion of which may be recoverable. The Fund will accrue such taxes and recoveries as applicable, based upon its current interpretation of tax rules and regulations that exist in the markets in which it invests.
Securities Transactions and Investment Income. Securities transactions are accounted for on the trade date with realized gain or loss on investments determined by using the identified cost method. Interest income (including amortization of premium and accretion of discount) is recorded on an accrual basis. Premiums and discounts on debt securities are amortized using the effective yield to maturity method. Dividend income is recorded on the ex-dividend date, except for certain dividends from foreign securities that are recorded as soon after the ex-dividend date as the Fund becomes aware of such dividends.
13
The Gabelli International Small Cap Fund
Notes to Financial Statements (Continued)
Determination of Net Asset Value and Calculation of Expenses. Certain administrative expenses are common to, and allocated among, various affiliated funds. Such allocations are made on the basis of each fund’s average net assets or other criteria directly affecting the expenses as determined by the Adviser pursuant to procedures established by the Board.
In calculating the NAV per share of each class, investment income, realized and unrealized gains and losses, redemption fees, and expenses other than class specific expenses are allocated daily to each class of shares based upon the proportion of net assets of each class at the beginning of each day. Distribution expenses are borne solely by the class incurring the expense.
Distributions to Shareholders. Distributions to shareholders are recorded on the ex-dividend date. Distributions to shareholders are based on income and capital gains as determined in accordance with federal income tax regulations, which may differ from income and capital gains as determined under GAAP. These differences are primarily due to differing treatments of income and gains on various investment securities and foreign currency transactions held by the Fund, timing differences, and differing characterizations of distributions made by the Fund. Distributions from net investment income for federal income tax purposes include net realized gains on foreign currency transactions. These book/tax differences are either temporary or permanent in nature. To the extent these differences are permanent, adjustments are made to the appropriate capital accounts in the period when the differences arise. Permanent differences were primarily due to the sale of passive foreign investment companies and recharacterization of foreign currency. These reclassifications have no impact on the NAV of the Fund. These reclassifications have no impact on the NAV of the Fund. For the year ended December 31, 2017, reclassifications were made to decrease accumulated distributions in excess of net investment income by $24,833 and decrease accumulated net realized gain on investments and foreign currency transactions by $24,833.
The tax character of distributions paid during the years ended December 31, 2017 and 2016 was as follows:
| | | | | | | | | | |
| | | Year Ended | | Year Ended |
| | | December 31, 2017 | | December 31, 2016 |
Distributions paid from: | | | | | | | | | | |
Ordinary income | | | $ | 64,666 | | | | $ | 115,209 | |
Net long-term capital gains | | | | 3,916,507 | | | | | 394,679 | |
| | | | | | | | | | |
Total distributions paid | | | $ | 3,981,173 | | | | $ | 509,888 | |
| | | | | | | | | | |
Provision for Income Taxes. The Fund intends to continue to qualify as a regulated investment company under Subchapter M of the Internal Revenue Code of 1986, as amended (the “Code”). It is the policy of the Fund to comply with the requirements of the Code applicable to regulated investment companies and to distribute substantially all of its net investment company taxable income and net capital gains. Therefore, no provision for federal income taxes is required.
As of December 31, 2017, the components of accumulated earnings/losses on a tax basis were as follows:
| | | | |
Undistributed ordinary income | | $ | 7,110 | |
Net unrealized appreciation on investments and foreign currency translations | | | 2,784,160 | |
| | | | |
Total | | $ | 2,791,270 | |
| | | | |
At December 31, 2017, the differences between book basis and tax basis unrealized appreciation were primarily due to mark-to-market adjustments on investments in passive foreign investment companies.
14
The Gabelli International Small Cap Fund
Notes to Financial Statements (Continued)
The following summarizes the tax cost of investments and the related net unrealized appreciation at December 31, 2017:
| | | | | | | | |
| | | | | Gross | | Gross | | |
| | | | | Unrealized | | Unrealized | | Net Unrealized |
| | | Cost | | Appreciation | | Depreciation | | Appreciation |
Investments | | $8,479,061 | | $3,117,119 | | $(333,217) | | $2,783,902 |
The Fund is required to evaluate tax positions taken or expected to be taken in the course of preparing the Fund’s tax returns to determine whether the tax positions are “more-likely-than-not” of being sustained by the applicable tax authority. Income tax and related interest and penalties would be recognized by the Fund as tax expense in the Statement of Operations if the tax positions were deemed not to meet the more-likely-than-not threshold. As of December 31, 2017, the Adviser has reviewed all open tax years and concluded that there was no impact to the Fund’s net assets or results of operations. The Fund’s federal and state tax returns for the prior three fiscal years remain open, subject to examination. On an ongoing basis, the Adviser will monitor the Fund’s tax positions to determine if adjustments to this conclusion are necessary.
3. Investment Advisory Agreement and Other Transactions. The Fund has entered into an investment advisory agreement (the “Advisory Agreement”) with the Adviser which provides that the Fund will pay the Adviser a fee, computed daily and paid monthly, at the annual rate of 1.00% of the value of its average daily net assets. In accordance with the Advisory Agreement, the Adviser provides a continuous investment program for the Fund’s portfolio, oversees the administration of all aspects of the Fund’s business and affairs, and pays the compensation of all Officers and Directors of the Fund who are affiliated persons of the Adviser.
The Adviser has contractually agreed to waive its investment advisory fee and/or to reimburse expenses of the Fund to the extent necessary to maintain the annualized total operating expenses of the Fund (excluding brokerage costs, acquired fund fees and expenses, interest, taxes, and extraordinary expenses) until at least April 30, 2019, at no more than 2.00%, 2.00%, 2.75%, and 1.00% of the value of the Fund’s average daily net assets for Class AAA, Class A, Class C, and Class I, respectively. The agreement is renewable annually. Effective September 5, 2017, the Adviser modified this agreement with respect to Class AAA Shares to waive its advisory fee and/or reimburse expenses in excess of 1% (with the same foregoing exclusions) of the value of the average Class AAA daily net assets. This arrangement is in effect through April 30, 2019. For the year ended December 31, 2017, the Adviser reimbursed the Fund in the amount of $144,403. In addition, the Fund has agreed, during the two year period following any waiver or reimbursement by the Adviser, to repay such amount to the extent, that after giving effect to the repayment, such adjusted annualized total operating expenses of the Fund would not exceed the foregoing respective percentage limitations, as amended, after giving effect to the recovery by the Adviser. At December 31, 2017, the cumulative amount which the Fund may repay the Adviser, subject to the terms above, is $282,280.
| | | | |
For the year ended December 31, 2016, expiring December 31, 2018 | | $ | 137,877 | |
For the year ended December 31, 2017, expiring December 31, 2019 | | | 144,403 | |
| | | | |
| | $ | 282,280 | |
| | | | |
The Corporation pays each Director who is not considered to be an affiliated person an annual retainer of $6,000 plus $1,000 for each Board meeting attended, and they are reimbursed for any out of pocket expenses incurred in attending meetings. All Board committee members receive $1,000 per meeting attended. The Chairman of the Audit Committee receives an annual fee of $3,000 and the Lead Director receives an annual fee of $2,000. A Director may receive a single meeting fee, allocated among the participating funds, for attending certain meetings held on behalf of multiple funds. Directors who are directors or employees of the Adviser or an affiliated company receive no compensation or expense reimbursement from the Corporation.
15
The Gabelli International Small Cap Fund
Notes to Financial Statements (Continued)
4. Distribution Plan. The Fund’s Board has adopted a distribution plan (the “Plan”) for each class of shares, except for Class I Shares, pursuant to Rule 12b-1 under the 1940 Act. Under the Class AAA, Class A, and Class C Share Plans, payments are authorized to G.distributors, LLC (the “Distributor”), an affiliate of the Adviser, at annual rates of 0.25%, 0.25%, and 1.00%, respectively, of the average daily net assets of those classes, the annual limitations under each Plan. Such payments are accrued daily and paid monthly.
5. Portfolio Securities. Purchases and sales of securities during the year ended December 31, 2017, other than short term securities and U.S. Government obligations, aggregated $7,125,699 and $7,511,191, respectively.
6. Transactions with Affiliates and Other Arrangements. During the year ended December 31, 2017, the Fund paid $306 in brokerage commissions on security trades to G.research, LLC, an affiliate of the Adviser. Additionally, the Distributor retained a total of $88 from investors representing commissions (sales charges and underwriting fees) on sales and redemptions of Fund shares.
The cost of calculating the Fund’s NAV per share is a Fund expense pursuant to the Advisory Agreement. The Adviser did not seek a reimbursement during the year ended December 31, 2017.
7. Line of Credit. The Fund participates in an unsecured line of credit which expires on March 8, 2018 and may be renewed annually, of up to $75,000,000 under which it may borrow up to 10% of its net assets from the custodian for temporary borrowing purposes. Borrowings under this arrangement bear interest at a floating rate equal to the higher of the overnight Federal Funds rate plus 125 basis points or the 30-day LIBOR plus 125 basis points in effect on that day. This amount, if any, would be included in “Interest expense” in the Statement of Operations. At December 31, 2017, the amount of $482,000 borrowings was outstanding under the line of credit.
The average daily amount of borrowings outstanding under the line of credit during the year ended December 31, 2017 was $5,301 with a weighted average interest rate of 2.85%. The maximum amount borrowed at any time during the year ended December 31, 2017 was $489,000.
8. Capital Stock. The Fund offers four classes of shares – Class AAA Shares, Class A Shares, Class C Shares, and Class I Shares. Class AAA and Class I Shares are offered without a sales charge. Class A Shares are subject to a maximum front-end sales charge of 5.75%, and Class C Shares are subject to a 1.00% contingent deferred sales charge for one year after purchase.
The Fund imposes a redemption fee of 2.00% on all classes of shares that are redeemed or exchanged on or before the seventh day after the date of a purchase. The redemption fee is deducted from the proceeds otherwise payable to the redeeming shareholders and is retained by the Fund as an increase in paid-in capital. The redemption fees retained by the Fund during the years ended December 31, 2017 and 2016, if any, can be found in the Statement of Changes in Net Assets under Redemption Fees.
16
The Gabelli International Small Cap Fund
Notes to Financial Statements (Continued)
Transactions in shares of capital stock were as follows:
| | | | | | | | | | | | | | | | |
| | | Year Ended | | | Year Ended | |
| | | December 31, 2017 | | | December 31, 2016 | |
| | | Shares | | | Amount | | | Shares | | | Amount | |
Class AAA | | | | | | | | | | | | | | | | |
Shares sold | | | 44,474 | | | $ | 1,136,137 | | | | 7,369 | | | $ | 174,340 | |
Shares issued upon reinvestment of distributions | | | 169,887 | | | | 3,132,713 | | | | 18,818 | | | | 420,567 | |
Shares redeemed | | | (97,413 | ) | | | (2,265,505 | ) | | | (46,341 | ) | | | (1,080,571 | ) |
| | | | | | | | | | | | | | | | |
Net increase/(decrease) | | | 116,948 | | | $ | 2,003,345 | | | | (20,154 | ) | | $ | (485,664 | ) |
| | | | | | | | | | | | | | | | |
| | | | |
Class A | | | | | | | | | | | | | | | | |
Shares sold | | | 1,219 | | | $ | 32,358 | | | | 1,797 | | | $ | 42,329 | |
Shares issued upon reinvestment of distributions | | | 3,371 | | | | 61,795 | | | | 411 | | | | 9,147 | |
Shares redeemed | | | (3,648 | ) | | | (87,752 | ) | | | (2,601 | ) | | | (61,094 | ) |
| | | | | | | | | | | | | | | | |
Net increase/(decrease) | | | 942 | | | $ | 6,401 | | | | (393 | ) | | $ | (9,618 | ) |
| | | | | | | | | | | | | | | | |
| | | | |
Class C | | | | | | | | | | | | | | | | |
Shares sold | | | — | | | $ | — | | | | 40 | | | $ | 900 | |
Shares issued upon reinvestment of distributions | | | 925 | | | | 15,865 | | | | 101 | | | | 2,169 | |
Shares redeemed | | | (217 | ) | | | (5,304 | ) | | | (575 | ) | | | (12,955 | ) |
| | | | | | | | | | | | | | | | |
Net increase/(decrease) | | | 708 | | | $ | 10,561 | | | | (434 | ) | | $ | (9,886 | ) |
| | | | | | | | | | | | | | | | |
| | | | |
Class I | | | | | | | | | | | | | | | | |
Shares sold | | | 19,808 | | | $ | 470,240 | | | | 1,133 | | | $ | 26,926 | |
Shares issued upon reinvestment of distributions | | | 38,129 | | | | 717,200 | | | | 3,152 | | | | 71,307 | |
Shares redeemed | | | (5,575 | ) | | | (128,085 | ) | | | (2,115 | ) | | | (50,434 | ) |
| | | | | | | | | | | | | | | | |
Net increase | | | 52,362 | | | $ | 1,059,355 | | | | 2,170 | | | $ | 47,799 | |
| | | | | | | | | | | | | | | | |
9. Indemnifications. The Fund enters into contracts that contain a variety of indemnifications. The Fund’s maximum exposure under these arrangements is unknown. However, the Fund has not had prior claims or losses pursuant to these contracts. Management has reviewed the Fund’s existing contracts and expects the risk of loss to be remote.
10. Subsequent Events. Management has evaluated the impact on the Fund of all other subsequent events occurring through the date the financial statements were issued and has determined that there were no subsequent events requiring recognition or disclosure in the financial statements.
17
The Gabelli International Small Cap Fund
Report of Independent Registered Public Accounting Firm
To the Shareholders and the Board of Directors of
The Gabelli International Small Cap Fund
Opinion on the Financial Statements
We have audited the accompanying statement of assets and liabilities of The Gabelli International Small Cap Fund (the “Fund”) (one of the funds constituting GAMCO Global Series Funds, Inc. (the “Corporation”)), including the schedule of investments, as of December 31, 2017, and the related statement of operations for the year then ended, the statements of changes in net assets for each of the two years in the period then ended, the financial highlights for each of the five years in the period then ended and the related notes (collectively referred to as the “financial statements”). In our opinion, the financial statements present fairly, in all material respects, the financial position of the Fund (one of the funds constituting GAMCO Global Series Funds, Inc.) at December 31, 2017, the results of its operations for the year then ended, the changes in its net assets for each of the two years in the period then ended and its financial highlights for each of the five years in the period then ended, in conformity with U.S. generally accepted accounting principles.
Basis for Opinion
These financial statements are the responsibility of the Corporation’s management. Our responsibility is to express an opinion on the Fund’s financial statements based on our audits. We are a public accounting firm registered with the Public Company Accounting Oversight Board (United States) (“PCAOB”) and are required to be independent with respect to the Corporation in accordance with the U.S. federal securities laws and the applicable rules and regulations of the Securities and Exchange Commission and the PCAOB.
We conducted our audits in accordance with the standards of the PCAOB. Those standards require that we plan and perform the audit to obtain reasonable assurance about whether the financial statements and financial highlights are free of material misstatement, whether due to error or fraud. The Corporation is not required to have, nor were we engaged to perform, an audit of the Corporation’s internal control over financial reporting. As part of our audits, we are required to obtain an understanding of internal control over financial reporting, but not for the purpose of expressing an opinion on the effectiveness of the Corporation’s internal control over financial reporting. Accordingly, we express no such opinion.
Our audits included performing procedures to assess the risks of material misstatement of the financial statements, whether due to error or fraud, and performing procedures that respond to those risks. Such procedures included examining, on a test basis, evidence regarding the amounts and disclosures in the financial statements. Our procedures included confirmation of securities owned as of December 31, 2017, by correspondence with the custodian. Our audits also included evaluating the accounting principles used and significant estimates made by management, as well as evaluating the overall presentation of the financial statements. We believe that our audits provide a reasonable basis for our opinion.

We have served as the auditor of one or more Gabelli/GAMCO Funds investment companies since 1992.
Philadelphia, Pennsylvania
February 28, 2018
18
The Gabelli International Small Cap Fund
Board Consideration and Re-Approval of Investment Advisory Agreement (Unaudited)
During the six months ended December 31, 2017, the Board of Directors of the Corporation approved the continuation of the investment advisory agreement with the Adviser for the Fund on the basis of the recommendation by the directors (the “Independent Board Members”) who are not “interested persons” of the Fund. The following paragraphs summarize the material information and factors considered by the Independent Board Members as well as their conclusions relative to such factors.
Nature, Extent, and Quality of Services. The Independent Board Members considered information regarding the Fund’s portfolio managers, the depth of the analyst pool available to the Adviser and the portfolio manager, the scope of supervisory, administrative, shareholder, and other services supervised or provided by the Adviser, and the absence of significant service problems reported to the Board. The Independent Board Members noted the experience, length of service, and reputation of the Fund’s portfolio manager.
Investment Performance. The Independent Board Members reviewed the short, medium, and long term performance of the Fund (as of September 30, 2017) against a peer group of eight other comparable funds prepared by the Adviser (the “Adviser Peer Group”), and against a peer group prepared by Broadridge (the “Broadridge Performance Peer Group”) consisting of all retail and institutional international small/mid cap core funds, regardless of asset size or primary channel of distribution, as represented by the Lipper International Small/Mid Cap Core Index. The Independent Board Members noted that the Fund’s performance was in the third quartile for the one, three, and five year periods, and the fourth quartile for the ten year period, as measured against the Adviser Peer Group. Against the Broadridge Performance Peer Group, the Independent Board Members noted that the Fund’s performance was in the fifth (lowest) quintile for the one year period, the fourth quintile for the three year period, the third quintile for the five year period, and the second quintile for the ten year period.
Profitability. The Independent Board Members reviewed summary data regarding the profitability of the Fund to the Adviser both with a pro rata administrative overhead charge and with a stand alone administrative charge. The Independent Board Members also noted that a portion of the Fund’s portfolio transactions were executed by an affiliated broker of the Adviser and that another affiliated broker of the Adviser received distribution fees and minor amounts of sales commissions.
Economies of Scale. The Independent Board Members discussed the major elements of the Adviser’s cost structure, the relationship of those elements to potential economies of scale and reviewed data provided by the Adviser.
Sharing of Economies of Scale. The Independent Board Members noted that the investment management fee schedule for the Fund does not take into account any potential economies of scale that may develop or any losses or diminished profitability to the Adviser in prior years.
Service and Cost Comparisons. The Independent Board Members compared the expense ratios of the investment management fee, other expenses, and total expenses of the Fund with similar expense ratios of the Adviser Peer Group and a peer group of eight other international small/mid cap core funds selected by Broadridge (the “Broadridge Expense Peer Group”), and noted that the Adviser’s management fee includes substantially all administrative services of the Fund as well as investment advisory services. The Independent Board Members noted that the Fund’s total expense ratio after waivers was average compared to the Adviser Peer Group, but that it was higher than most of the funds included in the Broadridge Expense Peer Group. The Independent Board Members discussed how the Fund’s size was significantly lower than average within both peer groups
19
The Gabelli International Small Cap Fund
Board Consideration and Re-Approval of Investment Advisory Agreement (Unaudited) (Continued)
and that the Adviser had been waiving substantial portions of its fees in order to make the Fund a more attractive investment, and noted the Adviser’s recent determination to waive fees even further. The Independent Board Members also noted that the advisory fee structure was the same as that in effect for most of the Gabelli funds. The Independent Board Members were presented with, but did not consider to be material to their decision, various information comparing the advisory fee to the fee for other types of accounts managed by the Adviser.
Conclusions. The Independent Board Members concluded that the Fund enjoyed highly experienced portfolio management services, good ancillary services, and an acceptable performance record. The Independent Board Members also concluded that the Fund’s expense ratios were reasonable, particularly in light of the Adviser’s commitment to making the Fund more attractive through further expense waivers, and that economies of scale were not a factor in their thinking at this time. The Independent Board Members did not view the potential profitability of ancillary services as material to their decision. On the basis of the foregoing and without assigning particular weight to any single conclusion, the Independent Board Members determined to recommend continuation of the investment management agreement to the full Board.
Based on a consideration of all these factors in their totality, the Board Members, including all of the Independent Board Members, determined that each Fund’s advisory fee was fair and reasonable with respect to the quality of services provided and in light of the other factors described above that the Board deemed relevant. Accordingly, the Board Members determined to approve the continuation of each Fund’s Advisory Agreement. The Board Members based their decision on evaluations of all these factors as a whole and did not consider any one factor as all-important or controlling.
20
The Gabelli International Small Cap Fund
Additional Fund Information (Unaudited)
The business and affairs of the Fund are managed under the direction of the Corporation’s Board of Directors. Information pertaining to the Directors and officers of the Fund is set forth below. The Corporation’s Statement of Additional Information includes additional information about the Fund’s Directors and is available without charge, upon request, by calling 800-GABELLI (800-422-3554) or by writing to The Gabelli International Small Cap Fund at One Corporate Center, Rye, NY 10580-1422.
| | | | | | | | |
Name, Position(s) Address1 and Age | | Term of Office and Length of Time Served2 | | Number of Funds in Fund Complex Overseen by Director | | Principal Occupation(s) During Past Five Years | | Other Directorships Held by Director3 |
| | | | |
INTERESTED DIRECTORS4: | | | | | | | | |
| | | | |
Mario J. Gabelli, CFA Director and Chief Investment Officer Age: 75 | | Since 1993 | | 32 | | Chairman, Chief Executive Officer, and Chief Investment Officer– Value Portfolios of GAMCO Investors, Inc. and Chief Investment Officer– Value Portfolios of Gabelli Funds, LLC and GAMCO Asset Management Inc.; Director/ Trustee or Chief Investment Officer of other registered investment companies within the Gabelli/GAMCO Fund Complex; Chief Executive Officer of GGCP, Inc.; Executive Chairman of Associated Capital Group, Inc. | | Director of Morgan Group Holdings, Inc. (holding company); Chairman of the Board and Chief Executive Officer of LICT Corp. (multimedia and communication services company); Director of CIBL, Inc. (broadcasting and wireless communications); Director of ICTC Group Inc. (communications) |
| | | | |
John D. Gabelli Director Age: 73 | | Since 1993 | | 10 | | Senior Vice President of G.research, LLC | | — |
| | | | |
| INDEPENDENT DIRECTORS5: | | | | | | | | |
| | | | |
E. Val Cerutti Director Age: 78 | | Since 2001 | | 7 | | Chief Executive Officer of Cerutti Consultants, Inc. | | Director of The LGL Group, Inc. (diversified manufacturing) (1990-2009) |
| | | | |
Anthony J. Colavita Director Age: 82 | | Since 1993 | | 28 | | President of the law firm of Anthony J. Colavita, P.C. | | — |
| | | | |
Arthur V. Ferrara Director Age: 87 | | Since 2001 | | 8 | | Former Chairman of the Board and Chief Executive Officer of The Guardian Life Insurance Company of America (1993-1995) | | — |
| | | | |
Werner J. Roeder Director Age: 77 | | Since 1993 | | 23 | | Retired physician; Former Vice President of Medical Affairs (Medical Director) of New York Presbyterian/Lawrence Hospital (1999-2014) | | — |
| | | | |
Anthonie C. van Ekris Director Age: 83 | | Since 1993 | | 22 | | Chairman and Chief Executive Officer of BALMAC International, Inc. (global import/ export company) | | — |
| | | | |
Salvatore J. Zizza Director Age: 72 | | Since 2004 | | 30 | | President of Zizza & Associates Corp. (private holding company); Chairman of Harbor Diversified, Inc. (pharmaceuticals); Chairman of BAM (semiconductor and aerospace manufacturing); Chairman of Bergen Cove Realty Inc.; Chairman of Metropolitan Paper Recycling Inc. (recycling) (2005-2014) | | Director and Vice Chairman of Trans-Lux Corporation (business services); Director and Chairman of Harbor Diversified Inc. (pharmaceuticals) |
21
The Gabelli International Small Cap Fund
Additional Fund Information (Continued) (Unaudited)
| | | | |
Name, Position(s) Address1 and Age | | Term of Office
and Length of Time Served2 | | Principal Occupation(s) During Past Five Years |
| | |
OFFICERS: | | | | |
| | |
Bruce N. Alpert President Age: 66 | | Since 2003 | | Executive Vice President and Chief Operating Officer of Gabelli Funds, LLC since 1988; Officer of registered investment companies within the Gabelli/GAMCO Fund Complex; Senior Vice President of GAMCO Investors, Inc. since 2008 |
| | |
John C. Ball Treasurer Age: 41 | | Since 2017 | | Treasurer of all the registered investment companies within the Gabelli/GAMCO Fund Complex since 2017; Vice President and Assistant Treasurer of AMG Funds, 2014-2017; Vice President of State Street Corporation, 2007-2014 |
| | |
Agnes Mullady Vice President Age: 59 | | Since 2006 | | Officer of all of the registered investment companies within the Gabelli/GAMCO Fund Complex since 2006; President and Chief Operating Officer of the Fund Division of Gabelli Funds, LLC since 2015; Chief Executive Officer of G.distributors, LLC since 2010; Senior Vice President of GAMCO Investors, Inc. since 2009; Vice President of Gabelli Funds, LLC since 2007; Executive Vice President of Associated Capital Group, Inc. since 2016 |
| | |
Andrea R. Mango Secretary Age: 45 | | Since 2013 | | Vice President of GAMCO Investors, Inc. since 2016; Counsel of Gabelli Funds, LLC since 2013; Secretary of all registered investment companies within the Gabelli/GAMCO Fund Complex since 2013; Vice President of all closed-end funds within the Gabelli/GAMCO Fund Complex since 2014; Corporate Vice President within the Corporate Compliance Department of New York Life Insurance Company, 2011-2013 |
| | |
Richard J. Walz Chief Compliance Officer Age: 58 | | Since 2013 | | Chief Compliance Officer of all of the registered investment companies within the Gabelli/ GAMCO Fund Complex since 2013; Chief Compliance Officer of AEGON USA Investment Management, 2011-2013 |
| 1 | Address: One Corporate Center, Rye, NY 10580-1422, unless otherwise noted. |
| 2 | Each Director will hold office for an indefinite term until the earliest of (i) the next meeting of shareholders, if any, called for the purpose of considering the election or re-election of such Director and until the election and qualification of his or her successor, if any, elected at such meeting, or (ii) the date a Director resigns or retires, or a Director is removed by the Board of Directors or shareholders, in accordance with the Fund’s By-Laws and Articles of Incorporation. Each officer will hold office for an indefinite term until the date he or she resigns or retires or until his or her successor is elected and qualified. |
| 3 | This column includes only directorships of companies required to report to the SEC under the Securities Exchange Act of 1934, as amended, i.e., public companies, or other investment companies registered under the 1940 Act. |
| 4 | “Interested person” of the Corporation as defined in the 1940 Act. Messrs. Mario J. Gabelli and John D. Gabelli, who are brothers, are each considered an “interested person” because of their affiliation with Gabelli Funds, LLC which acts as the Corporation’s investment adviser. |
| 5 | Directors who are not interested persons are considered “Independent” Directors. |
22
THE GABELLI INTERNATIONAL SMALL CAP FUND
One Corporate Center
Rye, NY 10580-1422
Portfolio Manager Biography
Caesar M. P. Bryan joined GAMCO Asset Management in 1994. He is a member of the global investment team of Gabelli Funds, LLC and portfolio manager of several funds within the Gabelli/GAMCO Fund Complex. Prior to joining Gabelli, Mr. Bryan was a portfolio manager at Lexington Management. He began his investment career at Samuel Montagu Company, the London based merchant bank. Mr. Bryan graduated from the University of Southampton in England with a Bachelor of Law and is a member of the English Bar.
2017 TAX NOTICE TO SHAREHOLDERS (Unaudited)
For the year ended December 31, 2017, the Fund paid to shareholders ordinary income distributions (comprised of net investment income) totaling $0.135, $0.064, $0.001, and $0.308 per share for Class AAA, Class A, Class C, and Class I Shares, respectively, and long term capital gains totaling $3,916,507. For the year ended December 31, 2017, 72.93% of the ordinary income distribution qualifies for the dividends received deduction available to corporations. The Fund designates 100% of the ordinary income distribution as qualified dividend income pursuant to the Jobs and Growth Tax Relief Reconciliation Act of 2003. The Fund designates 0.75% of the ordinary income distribution as qualified interest income pursuant to the Tax Relief, Unemployment Reauthorization, and Job Creation Act of 2010. Also for the year 2017, the Fund passed through foreign tax credits of $0.028, $0.028, $0.028, and $0.028 per share to Class AAA, Class A, Class C, and Class I Shares, respectively.
U.S. Government Income:
The percentage of the ordinary income distribution paid by the Fund during the year ended December 31, 2017 which was derived from U.S. Treasury securities was 0.33%. Such income is exempt from state and local tax in all states. However, many states, including New York and California, allow a tax exemption for a portion of the income earned only if a mutual fund has invested at least 50% of its assets at the end of each quarter of the Fund’s fiscal year in U.S. Government securities. The Fund did not meet this strict requirement in 2017. The percentage of U.S. Government securities held as of December 31, 2017 was 0.00%. Due to the diversity in state and local tax law, it is recommended that you consult your personal tax adviser as to the applicability of the information provided to your specific situation.
All designations are based on financial information available as of the date of this annual report and, accordingly, are subject to change. For each item, it is the intention of the Fund to designate the maximum amount permitted under the Internal Revenue Code and the regulations thereunder.
We have separated the portfolio manager’s commentary from the financial statements and investment portfolio due to corporate governance regulations stipulated by the Sarbanes-Oxley Act of 2002. We have done this to ensure that the content of the portfolio manager’s commentary is unrestricted. Both the commentary and the financial statements, including the portfolio of investments, will be available on our website at www.gabelli.com.
GAMCO Global Series Funds, Inc.
THE GABELLI INTERNATIONAL SMALL CAP FUND
One Corporate Center
Rye, New York 10580-1422
| t | 800-GABELLI (800-422-3554) |
Net Asset Value per share available daily
by calling 800-GABELLI after 7:00 P.M.
| | |
BOARD OF DIRECTORS | | OFFICERS |
| Mario J. Gabelli, CFA | | Bruce N. Alpert |
| Chairman and | | President |
| Chief Executive Officer, | | |
| GAMCO Investors, Inc. | | John C. Ball |
| Executive Chairman, | | Treasurer |
| Associated Capital Group, Inc. | | |
E. Val Cerutti | | Agnes Mullady |
| Chief Executive Officer, | | Vice President |
| Cerutti Consultants, Inc. | | |
Anthony J. Colavita | | Andrea R. Mango Secretary |
| President, | |
| Anthony J. Colavita, P.C. | | Richard J. Walz |
| | Chief Compliance Officer |
| Arthur V. Ferrara | | |
| Former Chairman and | | DISTRIBUTOR |
| Chief Executive Officer, | | G.distributors, LLC |
| Guardian Life Insurance | | |
| Company of America | | CUSTODIAN |
| |
| John D. Gabelli | | State Street Bank and Trust |
| Senior Vice President, | | Company |
| G.research, LLC | | |
| |
| Werner J. Roeder | | TRANSFER AGENT AND |
| Former Medical Director, | | DIVIDEND DISBURSING AGENT |
| Lawrence Hospital | | DST Asset Manager Solutions, Inc. |
Anthonie C. van Ekris | |
| Chairman, | | |
| BALMAC International, Inc. | | LEGAL COUNSEL |
Salvatore J. Zizza | | Skadden, Arps, Slate, Meagher & Flom LLP |
| Chairman, | |
| Zizza & Associates Corp. | | |
This report is submitted for the general information of the shareholders of The Gabelli International Small Cap Fund. It is not authorized for distribution to prospective investors unless preceded or accompanied by an effective prospectus.
GAB403Q417AR
The Gabelli Global Content & Connectivity Fund
Annual Report — December 31, 2017
(Y)our Portfolio Management Team
| | | | | | |
 | |  | |  | |  |
| | | |
| Mario J. Gabelli, CFA | | Evan D. Miller, CFA | | Sergey Dluzhevskiy, CFA, CPA | | Brett Harriss |
| Chief Investment Officer | | Portfolio Manager
BA, Northwestern University
MBA, Booth School of Business,
University of Chicago | | Portfolio Manager BS, Case Western Reserve University MBA, The Wharton School, University of Pennsylvania | | Portfolio Manager BA, Columbia University MBA, Columbia Business School, Columbia University |
To Our Shareholders,
For the year ended December 31, 2017, the net asset value (“NAV”) per Class AAA Share of The Gabelli Global Content & Connectivity Fund increased 13.4% compared with an increase of 8.6% for the Morgan Stanley Capital International (“MSCI”) All Country (“AC”) World Telecommunication Services Index. Other classes of shares are available. See page 3 for performance information for all classes of shares.
Enclosed are the financial statements, including the schedule of investments, as of December 31, 2017.
Performance Discussion (Unaudited)
The Fund’s objective is to provide investors with appreciation of capital. Current income is a secondary objective of Fund.
The Fund’s investment strategy is to invest its net assets in common stocks of companies in the telecommunications, media, and information technology industries which Gabelli Funds, LLC, the Adviser believes are likely to have rapid growth in revenues and earnings and potential for above average capital appreciation or are undervalued. The Fund invests primarily in common stocks of foreign and domestic small-capitalization, mid-capitalization, and large-capitalization issuers. As a global fund, the Fund invests in securities of issuers, located in at least three countries, and at least 40% of the Fund is invested in securities of non-U.S. issuers. In selecting investments, the Adviser considers the market price of the issuer’s securities, its balance sheet characteristics and the perceived strength of its management.
During the fourth quarter the MSCI AC World Index was up 5.8%, driven by investor optimism about improving global economy, strong corporate earnings growth, and renewed merger & acquisition (M&A) activity. Once again in the fourth quarter, as had been the case throughout 2017, the global telecommunications sector trailed the broad market with a 2.1% quarterly gain. For the year, the telecom sector was up 8.3%, lagging the 24.3% gain for the broad index.
2017 saw a flurry of M&A activity within media, benefiting the Fund. Discovery Communication (1.8% of net assets as of December 31, 2017) agreed to purchase Scripps Networks and Twenty-First Century Fox (2.1%) agreed to sell assets to The Walt Disney Company. This follows AT&T’s (0.7%) agreement to purchase Time Warner (1.2%), announced in late 2016. Driving this consolidation is the emergence of Internet television services like Netflix and Amazon Prime which have redefined scale.
In Europe, after a two year lull in M&A activity (in no small part owing to positions taken by local and EU regulators) the closing days of 2017 saw the announced combination of Netherlands-based subsidiaries of Tele2 and Deutsche Telekom (1.9%) as well as the proposed acquisition of cable operator UPC Austria (a subsidiary of Liberty Global (0.1%)) by T-Mobile Austria. The rationale for M&A in Europe remains strong, with the oversupply of mobile players and a growing demand for converged broadband/fixed/mobile/TV packages.
Selected holdings that contributed positively to performance in 2017 were: Vodafone Group (2.3% of net assets as of December 31, 2017) which was ahead after reporting half year results to September 30 that beat expectations in virtually all major markets; Twenty First Century Fox, Inc. (2.1%) which agreed to be acquired by The Walt Disney Company in an all stock transaction and Uniti Group, Inc. (1.4%) whose top line sales increased and its strategic acquisitions of smaller fiber and cell tower operators increased performance.
Some of our weaker performing stocks during the year were: Dish Network Corp. (2.8%) which was impacted by increased concerns over Pay-TV subscriber losses amid weaker NFL ratings, increased competition from over-the-top services, and the announcement that its co-founder Charlie Ergen would be stepping down as CEO (but will remain as Chairman); US Cellular Corp. (2.1%) which declined mainly because of eroding revenues; and Sprint Corp (0.6%) which was impacted by the decline in sales growth, operating margins and earnings. In addition, its long speculated merger with T-Mobile (3.2%) fell through.
Thank you for your investment in The Gabelli Global Content and Connectivity Fund.
We appreciate your confidence and trust.
2
Comparative Results
| | | | | | | | | | | | | | | | | | | | | | | | | |
Average Annual Returns through December 31, 2017 (a) (Unaudited) | | Since |
| | | | | | | | | | | Inception |
| | | 1 Year | | 5 Year | | 10 Year | | 15 Year | | (11/1/93) |
Class AAA (GABTX) | | | | 13.38 | % | | | | 6.95 | % | | | | 1.73 | % | | | | 8.24 | % | | | | 7.38 | % |
MSCI AC World Telecommunication Services Index | | | | 8.56 | | | | | 6.83 | | | | | 2.64 | | | | | 8.13 | | | | | N/A | |
MSCI AC World Index | | | | 23.97 | | | | | 10.80 | | | | | 4.65 | | | | | 9.00 | | | | | 7.52 | (b) |
Class A (GTCAX) | | | | 13.39 | | | | | 6.92 | | | | | 1.72 | | | | | 8.23 | | | | | 7.38 | |
With sales charge (c) | | | | 6.87 | | | | | 5.66 | | | | | 1.12 | | | | | 7.80 | | | | | 7.12 | |
Class C (GTCCX) | | | | 12.53 | | | | | 6.14 | | | | | 0.97 | | | | | 7.42 | | | | | 6.80 | |
With contingent deferred sales charge (d) | | | | 11.53 | | | | | 6.14 | | | | | 0.97 | | | | | 7.42 | | | | | 6.80 | |
Class I (GTTIX) | | | | 14.20 | | | | | 7.32 | | | | | 2.04 | | | | | 8.46 | | | | | 7.52 | |
Class T (GGTTX) | | | | 13.44 | | | | | 6.96 | | | | | 1.73 | | | | | 8.24 | | | | | 7.38 | |
With sales charge (e) | | | | 10.60 | | | | | 6.42 | | | | | 1.48 | | | | | 8.06 | | | | | 7.18 | |
| | In the current prospectuses dated April 28, 2017 as amended June 22, 2017, the gross expense ratios for Class AAA, A, C, I and T Shares are 1.65%, 1.65%, 2.40%, 1.40% and 1.65%, respectively, and the net expense ratios for these share classes after contractual reimbursements by Gabelli Funds, LLC. (the “Adviser”) are 1.65%, 1.65%, 2.40%, 1.00%, and 1.65%, respectively. See page 11 for the expense ratios for the year ended December 31, 2017. Class AAA and Class I Shares do not have a sales charge. The maximum sales charge for Class A Shares, Class C Shares, and Class T Shares is 5.75%, 1.00%, and 2.50%, respectively. | |
| | (a) | Returns represent past performance and do not guarantee future results. Total returns and average annual returns reflect changes in share price, reinvestment of distributions, and are net of expenses. Investment returns and the principal value of an investment will fluctuate. When shares are redeemed, they may be worth more or less than their original cost. Current performance may be lower or higher than the performance data presented. Visit www.gabelli.com for performance information as of the most recent month end. Returns for Class I Shares would have been lower had the Adviser not reimbursed certain expenses. The Fund imposes a 2% redemption fee on shares sold or exchanged within seven days of purchase. Investors should carefully consider the investment objectives, risks, charges, and expenses of the Fund before investing. The prospectuses contain information about these and other matters and should be read carefully before investing. To obtain a prospectus, please visit our website at www.gabelli.com. Investing in foreign securities involves risks not ordinarily associated with investments in domestic issues, including currency fluctuation, economic, and political risks. The Class AAA Share NAVs are used to calculate performance for the periods prior to the issuance of Class A Shares, Class C Shares, Class I Shares, and Class T Shares on March 12, 2000, June 2, 2000, January 11, 2008, and July 5, 2017, respectively. The actual performance for the Class A Shares, Class C Shares, Class T Shares would have been lower due to the additional fees and expenses associated with these classes of shares. The actual performance of the Class I Shares would have been higher due to lower expenses related to this class of shares. The MSCI AC World Telecommunication Services Index is an unmanaged index that measures the performance of the global telecommunication securities from around the world. The MSCI AC World Index is an unmanaged market capitalization weighted index that is designed to measure the equity market performance of developed and emerging markets. The MSCI AC World Index consists of 45 country indices comprising 24 developed and 21 emerging market country indices. Dividends are considered reinvested. You cannot invest directly in an index. | |
| | (b) | MSCI AC World Index since inception performance is a blend of Gross Performance excluding applicable taxes and Net Performance. This benchmark’s Net Performance began on December 29, 2000. | |
| | (c) | Performance results include the effect of the maximum 5.75% sales charge at the beginning of the period. | |
| | (d) | Assuming payment of the 1% maximum contingent deferred sales charge imposed on redemptions made within one year of purchase. | |
| | (e) | Performance results include the effect of the maximum 2.50% sales charge at the beginning of the period. | |
3
COMPARISON OF CHANGE IN VALUE OF A $10,000 INVESTMENT IN
THE GABELLI GLOBAL CONTENT & CONECTIVITY FUND (CLASS AAA SHARES)
AND MSCI AC WORLD INDEX (Unaudited)
| * | Past performance is not predictive of future results. The performance tables and graph do not reflect the deduction of taxes that a shareholder would pay on fund distributions or the redemption of fund shares. |
4
The Gabelli Global Content & Connectivity Fund
Disclosure of Fund Expenses (Unaudited)
For the Six Month Period from July 1, 2017 through December 31, 2017 Expense Table
We believe it is important for you to understand the impact of fees and expenses regarding your investment. All mutual funds have operating expenses. As a shareholder of a fund, you incur ongoing costs, which include costs for portfolio management, administrative services, and shareholder reports (like this one), among others. Operating expenses, which are deducted from a fund’s gross income, directly reduce the investment return of a fund. When a fund’s expenses are expressed as a percentage of its average net assets, this figure is known as the expense ratio. The following examples are intended to help you understand the ongoing costs (in dollars) of investing in your Fund and to compare these costs with those of other mutual funds. The examples are based on an investment of $1,000 made at the beginning of the period shown and held for the entire period.
The Expense Table below illustrates your Fund’s costs in two ways:
Actual Fund Return: This section provides information about actual account values and actual expenses. You may use this section to help you to estimate the actual expenses that you paid over the period after any fee waivers and expense reimbursements. The “Ending Account Value” shown is derived from the Fund’s actual return during the past six months, and the “Expenses Paid During Period” shows the dollar amount that would have been paid by an investor who started with $1,000 in the Fund. You may use this information, together with the amount you invested, to estimate the expenses that you paid over the period.
To do so, simply divide your account value by $1,000 (for example, an $8,600 account value divided by $1,000 = 8.6), then multiply the result by the number given for your Fund under the heading “Expenses Paid During Period” to estimate the expenses you paid during this period.
Hypothetical 5% Return: This section provides information about hypothetical account values and hypothetical expenses based on the Fund’s actual expense ratio. It assumes a hypothetical annualized return of 5% before expenses during the period shown. In this
case – because the hypothetical return used is not the Fund’s actual return – the results do not apply to your investment and you cannot use the hypothetical account value and expense to estimate the actual ending account balance or expenses you paid for the period. This example is useful in making comparisons of the ongoing costs of investing in the Fund and other funds. To do so, compare this 5% hypothetical example with the 5% hypothetical examples that appear in shareholder reports of other funds.
Please note that the expenses shown in the table are meant to highlight your ongoing costs only and do not reflect any transactional costs such as sales charges (loads), redemption fees, or exchange fees, if any, which are described in the Prospectus. If these costs were applied to your account, your costs would be higher. Therefore, the 5% hypothetical return is useful in comparing ongoing costs only, and will not help you determine the relative total costs of owning different funds. The “Annualized Expense Ratio” represents the actual expenses for the last six months and may be different from the expense ratio in the Financial Highlights which is for the year ended December 31, 2017.
| | | | | | | | | | | | | | | | | | | | |
| | | Beginning
Account Value
07/01/17 | | Ending
Account Value
12/31/17 | | Annualized
Expense
Ratio | | Expenses
Paid During
Period* |
The Gabelli Global Content & Connectivity Fund | |
Actual Fund Return | |
Class AAA | | | $ | 1,000.00 | | | | $ | 1,045.80 | | | | | 1.79 | % | | | $ | 9.23 | |
Class A | | | $ | 1,000.00 | | | | $ | 1,045.90 | | | | | 1.79 | % | | | $ | 9.23 | |
Class C | | | $ | 1,000.00 | | | | $ | 1,041.90 | | | | | 2.54 | % | | | $ | 13.07 | |
Class I | | | $ | 1,000.00 | | | | $ | 1,050.30 | | | | | 1.00 | % | | | $ | 5.17 | |
Class T** | | | $ | 1,000.00 | | | | $ | 1,044.40 | | | | | 1.73 | % | | | $ | 8.72 | |
Hypothetical 5% Return | |
Class AAA | | | $ | 1,000.00 | | | | $ | 1,016.18 | | | | | 1.79 | % | | | $ | 9.10 | |
Class A | | | $ | 1,000.00 | | | | $ | 1,016.18 | | | | | 1.79 | % | | | $ | 9.10 | |
Class C | | | $ | 1,000.00 | | | | $ | 1,012.40 | | | | | 2.54 | % | | | $ | 12.88 | |
Class I | | | $ | 1,000.00 | | | | $ | 1,020.16 | | | | | 1.00 | % | | | $ | 5.09 | |
Class T | | | $ | 1,000.00 | | | | $ | 1,016.48 | | | | | 1.73 | % | | | $ | 8.79 | |
| * | Expenses are equal to the Fund’s annualized expense ratio for the last six months multiplied by the average account value over the period, multiplied by the number of days in the most recent fiscal half year (184 days), then divided by 365. |
| ** | Class T Shares use a beginning account value date of 07/05/17, and Class T Share expenses are equal to the Fund’s annualized expense ratio for the period since inception multiplied by the number of days since inception (180 days), then divided by 365. |
5
Summary of Portfolio Holdings (Unaudited)
The following table presents portfolio holdings as a percent of net assets as of December 31, 2017:
The Gabelli Global Content & Connectivity Fund
| | | | |
Telecommunications Services | | | 53.4 | % |
Media | | | 23.1 | % |
Information Technology | | | 8.1 | % |
U.S. Government Obligations | | | 0.8 | % |
Other | | | 14.7 | % |
| | | | |
Other Assets and Liabilities (Net) | | | (0.1 | )% |
| | | | |
| | | 100.0 | % |
| | | | |
The Fund files a complete schedule of portfolio holdings with the Securities and Exchange Commission (the “SEC”) for the first and third quarters of each fiscal year on Form N-Q. Shareholders may obtain this information at www.gabelli.com or by calling the Fund at 800-GABELLI (800-422-3554).The Fund’s Form N-Q is available on the SEC’s website at www.sec.gov and may also be reviewed and copied at the SEC’s Public Reference Room in Washington, DC. Information on the operation of the Public Reference Room may be obtained by calling 800-SEC-0330.
Proxy Voting
The Fund files Form N-PX with its complete proxy voting record for the twelve months ended June 30, no later than August 31 of each year. A description of the Fund’s proxy voting policies, procedures, and how the Fund voted proxies relating to portfolio securities is available without charge, upon request, by (i) calling 800-GABELLI (800-422-3554); (ii) writing to The Gabelli Funds at One Corporate Center, Rye, NY 10580-1422; or (iii) visiting the SEC’s website at www.sec.gov.
6
The Gabelli Global Content & Connectivity Fund
Schedule of Investments — December 31, 2017
| | | | | | | | | | | | |
Shares | | | | | Cost | | | Market Value | |
| | |
| | | | COMMON STOCKS — 96.3% | | | | | |
| | | | TELECOMMUNICATION SERVICES — 52.7% | |
| | | | Alternative Carriers — 2.5% | | | | | |
| | 230,000 | | | Asia Satellite Telecommunications Holdings Ltd. | | $ | 467,377 | | | $ | 208,426 | |
| | 101,500 | | | CenturyLink Inc. | | | 1,751,245 | | | | 1,693,020 | |
| | 1,900 | | | Iliad SA | | | 225,836 | | | | 455,372 | |
| | 28,000 | | | TIME dotCom Berhad | | | 56,823 | | | | 62,960 | |
| | | | | | | | | | | | |
| | | | | | | 2,501,281 | | | | 2,419,778 | |
| | | | | | | | | | | | |
| |
| | | | Integrated Telecommunication Services — 27.1% | |
| | 17,600 | | | AT&T Inc. | | | 315,070 | | | | 684,288 | |
| | 2,900 | | | ATN International Inc. | | | 8,922 | | | | 160,254 | |
| | 37,415,054 | | | Cable & Wireless Jamaica Ltd.† | | | 499,070 | | | | 375,426 | |
| | 16,400 | | | China Unicom Hong Kong Ltd., ADR† | | | 104,722 | | | | 221,892 | |
| | 72,500 | | | Cincinnati Bell Inc.† | | | 1,281,076 | | | | 1,511,625 | |
| | 107,000 | | | Deutsche Telekom AG, ADR | | | 1,957,387 | | | | 1,889,727 | |
| | 45,000 | | | General Communication Inc., Cl. A† | | | 238,470 | | | | 1,755,900 | |
| | 3,107 | | | Hellenic Telecommunications Organization SA | | | 43,544 | | | | 42,871 | |
| | 2,000 | | | Hellenic Telecommunications Organization SA, ADR | | | 16,157 | | | | 13,630 | |
| | 666 | | | Hutchison Telecommunications Hong Kong Holdings Ltd. | | | 63 | | | | 268 | |
| | 15,000 | | | Koninklijke KPN NV | | | 39,437 | | | | 52,337 | |
| | 31,000 | | | Maroc Telecom | | | 513,944 | | | | 446,715 | |
| | 29,448 | | | New ULM Telecom Inc. | | | 345,467 | | | | 521,819 | |
| | 21,200 | | | Nippon Telegraph & Telephone Corp. | | | 390,438 | | | | 997,393 | |
| | 3,100 | | | Nippon Telegraph & Telephone Corp., ADR | | | 59,883 | | | | 146,444 | |
| | 1,700 | | | Oi SA, ADR† | | | 5,338 | | | | 1,700 | |
| | 29,100 | | | Orange SA, ADR | | | 484,952 | | | | 506,340 | |
| | 200,000 | | | Pakistan Telecommunication Co. Ltd. | | | 29,365 | | | | 23,652 | |
| | 90,000 | | | PCCW Ltd. | | | 74,681 | | | | 52,298 | |
| | 50,000 | | | Pharol SGPS SA† | | | 20,575 | | | | 14,998 | |
| | 45,500 | | | Pharol SGPS SA, ADR† | | | 10,300 | | | | 11,261 | |
| | 12,000 | | | Proximus SA | | | 364,978 | | | | 393,790 | |
| | 9,700 | | | PT Telekomunikasi Indonesia, ADR | | | 21,613 | | | | 312,534 | |
| | 3,500 | | | Rostelecom PJSC, ADR | | | 26,144 | | | | 23,309 | |
| | 332,500 | | | Singapore Telecommunications Ltd. | | | 252,099 | | | | 887,529 | |
| | 14,300 | | | Swisscom AG, ADR | | | 350,631 | | | | 762,619 | |
| | 26,200 | | | Telecom Argentina SA, ADR | | | 95,115 | | | | 959,706 | |
| | 230,000 | | | Telecom Italia SpA† | | | 724,225 | | | | 198,833 | |
| | 39,000 | | | Telecom Italia SpA, ADR† | | | 729,144 | | | | 336,570 | |
| | 395 | | | Telefonica Brasil SA | | | 7,066 | | | | 4,906 | |
| | 5,021 | | | Telefonica Brasil SA, ADR | | | 27,844 | | | | 74,461 | |
| | 2,266 | | | Telefonica Brasil SA, Preference | | | 52,573 | | | | 33,214 | |
| | 3,935 | | | Telefonica SA | | | 58,513 | | | | 38,361 | |
| | | | | | | | | | | | |
Shares | | | | | Cost | | | Market Value | |
| | | |
| | 129,000 | | | Telefonica SA, ADR | | $ | 500,105 | | | $ | 1,248,720 | |
| | 89,800 | | | Telekom Austria AG | | | 787,598 | | | | 832,770 | |
| | 252,000 | | | Telekom Malaysia
Berhad | | | 311,587 | | | | 392,291 | |
| | 44,800 | | | Telenor ASA | | | 655,155 | | | | 959,774 | |
| | 80,000 | | | Telephone & Data Systems Inc. | | | 1,556,130 | | | | 2,224,000 | |
| | 128,000 | | | Telesites SAB de CV† | | | 97,176 | | | | 97,127 | |
| | 259,000 | | | Telia Co. AB | | | 556,485 | | | | 1,154,009 | |
| | 44,700 | | | TELUS Corp., Toronto | | | 517,411 | | | | 1,693,408 | |
| | 1,958,977 | | | True Corp. Public Co. Ltd.† | | | 483,646 | | | | 372,681 | |
| | 24,225 | | | TT&T Public Co.
Ltd.(a)(b) | | | 100,542 | | | | 0 | |
| | 71,000 | | | Verizon Communications Inc. | | | 2,333,527 | | | | 3,758,030 | |
| | 50,000 | | | Windstream Holdings Inc. | | | 290,568 | | | | 92,500 | |
| | | | | | | | | | | | |
| | | | | | | 17,338,736 | | | | 26,281,980 | |
| | | | | | | | | | | | |
| |
| | | | Wireless Telecommunication Services — 23.1% | |
| | 96,500 | | | America Movil SAB de CV, Cl. L, ADR | | | 339,050 | | | | 1,654,975 | |
| | 99,000 | | | Axiata Group Berhad | | | 177,577 | | | | 134,299 | |
| | 14,700 | | | China Mobile Ltd., ADR | | | 175,676 | | | | 742,938 | |
| | 9,600 | | | DiGi.Com Berhad | | | 14,361 | | | | 12,098 | |
| | 72,808 | | | Econet Wireless Zimbabwe Ltd. | | | 21,788 | | | | 61,887 | |
| | 850,000 | | | Global Telecom Holding SAE, GDR† | | | 436,129 | | | | 354,724 | |
| | 95,600 | | | KDDI Corp. | | | 766,291 | | | | 2,379,500 | |
| | 29,500 | | | Millicom International Cellular SA, SDR | | | 1,843,389 | | | | 1,992,296 | |
| | 32,900 | | | NTT DoCoMo Inc. | | | 513,500 | | | | 776,986 | |
| | 175,000 | | | Orascom Telecom Media and Technology Holding SAE, GDR | | | 384,753 | | | | 28,175 | |
| | 18,000 | | | PLDT Inc., ADR | | | 242,214 | | | | 541,440 | |
| | 240,000 | | | PT Indosat Tbk | | | 38,552 | | | | 84,909 | |
| | 26,500 | | | Rogers Communications Inc., Cl. B | | | 87,440 | | | | 1,349,645 | |
| | 18,500 | | | Shenandoah Telecommunications Co. | | | 65,507 | | | | 625,300 | |
| | 125,000 | | | Sistema PJSC FC, GDR | | | 819,437 | | | | 521,250 | |
| | 17,700 | | | SK Telecom Co. Ltd., ADR | | | 305,249 | | | | 494,007 | |
| | 6,700 | | | SoftBank Group Corp. | | | 456,990 | | | | 530,410 | |
| | 96,200 | | | Sprint Corp.† | | | 536,246 | | | | 566,618 | |
| | 115,000 | | | Tim Participacoes SA | | | 295,699 | | | | 454,162 | |
| | 15,156 | | | Tim Participacoes SA, ADR | | | 331,245 | | | | 292,662 | |
| | 49,000 | | | T-Mobile US Inc.† | | | 1,074,686 | | | | 3,111,990 | |
| | 55,000 | | | Turkcell Iletisim Hizmetleri A/S, ADR | | | 616,764 | | | | 561,000 | |
| | 55,300 | | | United States Cellular Corp.† | | | 2,078,210 | | | | 2,080,939 | |
| | 205,000 | | | VEON Ltd., ADR | | | 385,603 | | | | 787,200 | |
| | 71,000 | | | Vodafone Group plc, ADR | | | 2,383,615 | | | | 2,264,900 | |
| | | | | | | | | | | | |
| | | | | | | 14,389,971 | | | | 22,404,310 | |
| | | | | | | | | | | | |
| | | | TOTAL TELECOMMUNICATION SERVICES | | | 34,229,988 | | | | 51,106,068 | |
| | | | | | | | | | | | |
See accompanying notes to financial statements.
7
The Gabelli Global Content & Connectivity Fund
Schedule of Investments (Continued) — December 31, 2017
| | | | | | | | | | | | |
Shares | | | | | Cost | | | Market Value | |
| | |
| | | | COMMON STOCKS (Continued) | | | | | |
| | | | MEDIA — 23.1% | |
| | | | Advertising — 0.5% | |
| | 70,000 | | | National CineMedia Inc. | | $ | 416,459 | | | $ | 480,200 | |
| | | | | | | | | | | | |
| |
| | | | Broadcasting — 4.4% | |
| | 5,500 | | | AMC Networks Inc., Cl. A† | | | 133,859 | | | | 297,440 | |
| | 14,000 | | | CBS Corp., Cl. B, Non-Voting | | | 779,939 | | | | 826,000 | |
| | 14,000 | | | Discovery Communications Inc., Cl. A† | | | 243,726 | | | | 313,320 | |
| | 66,000 | | | Discovery Communications Inc., Cl. C† | | | 1,264,296 | | | | 1,397,220 | |
| | 20,700 | | | Grupo Televisa SAB, ADR | | | 454,584 | | | | 386,469 | |
| | 19,000 | | | Sinclair Broadcast Group Inc., Cl. A | | | 563,914 | | | | 719,150 | |
| | 15,000 | | | Tokyo Broadcasting System Holdings Inc. | | | 237,742 | | | | 374,617 | |
| | | | | | | | | | | | |
| | | | | | | 3,678,060 | | | | 4,314,216 | |
| | | | | | | | | | | | |
| |
| | | | Cable and Satellite — 13.2% | |
| | 19,000 | | | Altice NV, Cl. A† | | | 273,474 | | | | 199,383 | |
| | 14,000 | | | Altice USA Inc., Cl. A† | | | 321,275 | | | | 297,220 | |
| | 733 | | | Charter Communications Inc., Cl. A† | | | 92,055 | | | | 246,259 | |
| | 7,400 | | | Cogeco Inc. | | | 144,351 | | | | 532,835 | |
| | 53,000 | | | Comcast Corp., Cl. A | | | 1,431,222 | | | | 2,122,650 | |
| | 57,500 | | | DISH Network Corp., Cl. A† | | | 1,443,788 | | | | 2,745,625 | |
| | 3,125 | | | Liberty Broadband Corp., Cl. A† | | | 9,703 | | | | 265,781 | |
| | 4,050 | | | Liberty Broadband Corp., Cl. C† | | | 66,963 | | | | 344,898 | |
| | 21,840 | | | Liberty Global plc, Cl. A† | | | 400,786 | | | | 782,746 | |
| | 68,500 | | | Liberty Global plc, Cl. C† | | | 909,178 | | | | 2,318,040 | |
| | 3,000 | | | Liberty Global plc LiLAC, Cl. A† | | | 47,614 | | | | 60,450 | |
| | 3,444 | | | Liberty Global plc LiLAC, Cl. C† | | | 36,730 | | | | 68,501 | |
| | 7,500 | | | Liberty Media Corp. - Liberty SiriusXM, Cl. A† | | | 202,738 | | | | 297,450 | |
| | 6,500 | | | Liberty Media Corp. - Liberty SiriusXM, Cl. C† | | | 246,139 | | | | 257,790 | |
| | 11,000 | | | MSG Networks Inc., Cl. A† | | | 67,634 | | | | 222,750 | |
| | 4,300 | | | Naspers Ltd., Cl. N | | | 1,015,660 | | | | 1,199,378 | |
| | 1,400 | | | NOS SGPS SA | | | 11,293 | | | | 9,207 | |
| | 50,000 | | | Sky plc† | | | 624,040 | | | | 683,174 | |
| | 13,305 | | | Videocon d2h Ltd., ADR† | | | 116,036 | | | | 126,531 | |
| | | | | | | | | | | | |
| | | | | | | 7,460,679 | | | | 12,780,668 | |
| | | | | | | | | | | | |
| |
| | | | Movies and Entertainment — 4.9% | |
| | 4,700 | | | Liberty Media Corp.- Liberty Braves, Cl. A† | | | 87,096 | | | | 103,635 | |
| | 5,655 | | | Liberty Media Corp.- Liberty Braves, Cl. C† | | | 94,200 | | | | 125,654 | |
| | 4,700 | | | The Madison Square Garden Co, Cl. A† | | | 229,871 | | | | 990,995 | |
| | 13,000 | | | Time Warner Inc. | | | 1,292,839 | | | | 1,189,110 | |
| | | | | | | | | | | | |
Shares | | | | | Cost | | | Market Value | |
| | 5,000 | | | Twenty-First Century Fox Inc., Cl. A | | $ | 137,521 | | | $ | 172,650 | |
| | 54,500 | | | Twenty-First Century Fox Inc., Cl. B | | | 1,435,825 | | | | 1,859,540 | |
| | 10,000 | | | Viacom Inc., Cl. B | | | 250,923 | | | | 308,100 | |
| | | | | | | | | | | | |
| | | | | | | 3,528,275 | | | | 4,749,684 | |
| | | | | | | | | | | | |
| |
| | | | Publishing — 0.1% | |
| | 19,000 | | | Telegraaf Media Groep NV† | | | 400,798 | | | | 119,696 | |
| | | | | | | | | | | | |
| | | |
| | | | TOTAL MEDIA | | | 15,484,271 | | | | 22,444,464 | |
| | | | | | | | | | | | |
| | | |
| | | | OTHER — 14.7% | | | | | | | | |
| | | | Other — 11.1% | | | | | | | | |
| | 6,000 | | | American Express Co. | | | 566,533 | | | | 595,860 | |
| | 500 | | | Axalta Coating Systems Ltd.† | | | 16,568 | | | | 16,180 | |
| | 10,500 | | | Bouygues SA | | | 294,446 | | | | 545,636 | |
| | 68,000 | | | C.P. Pokphand Co. Ltd., ADR | | | 52,895 | | | | 133,960 | |
| | 27,360 | | | CK Asset Holdings Ltd. | | | 150,629 | | | | 239,181 | |
| | 27,360 | | | CK Hutchison Holdings Ltd. | | | 245,763 | | | | 343,539 | |
| | 11,000 | | | EchoStar Corp., Cl. A† | | | 311,530 | | | | 658,900 | |
| | 650 | | | FANUC Corp. | | | 151,561 | | | | 156,104 | |
| | 97,500 | | | First Pacific Co. Ltd. | | | 48,559 | | | | 66,141 | |
| | 4,100 | | | First Pacific Co. Ltd., ADR | | | 3,337 | | | | 13,817 | |
| | 2,700 | | | Furukawa Electric Co. Ltd. | | | 73,580 | | | | 133,233 | |
| | 45,000 | | | G4S plc | | | 0 | | | | 162,220 | |
| | 35,000 | | | GN Store Nord A/S | | | 215,953 | | | | 1,130,997 | |
| | 1,768 | | | Gusbourne plc† | | | 1,486 | | | | 1,110 | |
| | 18,000 | | | InterXion Holding NV† | | | 250,160 | | | | 1,060,740 | |
| | 2,656 | | | Kinnevik AB, Cl. A | | | 87,946 | | | | 92,633 | |
| | 79,000 | | | Kinnevik AB, Cl. B | | | 1,938,266 | | | | 2,670,539 | |
| | 26,000 | | | Liberty Interactive Corp. QVC Group, Cl. A† | | | 407,439 | | | | 634,920 | |
| | 1,450 | | | Liberty Media Corp.- Liberty Formula One, Cl. A† | | | 2,157 | | | | 47,444 | |
| | 2,500 | | | Liberty Media Corp.- Liberty Formula One, Cl. C† | | | 15,205 | | | | 85,400 | |
| | 35,000 | | | Liberty Ventures, Cl. A† | | | 1,665,855 | | | | 1,898,400 | |
| | 900 | | | Marlowe plc† | | | 521 | | | | 4,648 | |
| | 504 | | | Meikles Ltd.† | | | 203 | | | | 142 | |
| | 500 | | | National Grid plc, ADR | | | 31,569 | | | | 29,405 | |
| | 18,035 | | | PostNL NV, ADR | | | 215,936 | | | | 88,202 | |
| | 12,000 | | | Waterloo Investment Holdings Ltd.†(a) | | | 1,432 | | | | 600 | |
| | | | | | | | | | | | |
| | | | | | | 6,749,529 | | | | 10,809,951 | |
| | | | | | | | | | | | |
| |
| | | | Specialized Real Estate Investment Trusts — 3.6% | |
| | 13,000 | | | CyrusOne Inc. | | | 215,924 | | | | 773,890 | |
| | 3,000 | | | Equinix Inc. | | | 347,334 | | | | 1,359,660 | |
| | 77,000 | | | Uniti Group Inc. | | | 1,378,480 | | | | 1,369,830 | |
| | | | | | | | | | | | |
| | | | | | | 1,941,738 | | | | 3,503,380 | |
| | | | | | | | | | | | |
| | | | TOTAL OTHER | | | 8,691,267 | | | | 14,313,331 | |
| | | | | | | | | | | | |
See accompanying notes to financial statements.
8
The Gabelli Global Content & Connectivity Fund
Schedule of Investments (Continued) — December 31, 2017
| | | | | | | | | | | | |
Shares | | | | | Cost | | | Market Value | |
| | |
| | | | COMMON STOCKS (Continued) | | | | | |
| | | | INFORMATION TECHNOLOGY — 5.8% | |
| | | | Data Processing & Outsourced Services — 0.7% | |
| | 2,500 | | | Mastercard Inc., Cl. A | | $ | 366,266 | | | $ | 378,400 | |
| | 2,500 | | | Visa Inc., Cl. A. | | | 274,176 | | | | 285,050 | |
| | | | | | | | | | | | |
| | | | | | | 640,442 | | | | 663,450 | |
| | | | | | | | | | | | |
| |
| | | | Electronic Equipment & Instruments — 0.1% | |
| | 200 | | | Keyence Corp. | | | 112,804 | | | | 112,039 | |
| | | | | | | | | | | | |
| |
| | | | Internet Software and Services — 3.9% | |
| | 1,600 | | | Alphabet Inc., Cl. C† | | | 1,573,170 | | | | 1,674,240 | |
| | 170 | | | CommerceHub Inc., Cl. A† | | | 1,802 | | | | 3,738 | |
| | 241 | | | CommerceHub Inc., Cl. C† | | | 2,514 | | | | 4,962 | |
| | 10,300 | | | Facebook Inc., Cl. A† | | | 1,797,040 | | | | 1,817,538 | |
| | 15,500 | | | Gogo Inc.† | | | 148,207 | | | | 174,840 | |
| | 2,330 | | | Internap Corp.† | | | 15,839 | | | | 36,604 | |
| | 330 | | | Liberty Expedia Holdings Inc., Cl. A† | | | 11,353 | | | | 14,629 | |
| | | | | | | | | | | | |
| | | | | | | 3,549,925 | | | | 3,726,551 | |
| | | | | | | | | | | | |
| |
| | | | IT Consulting and Other Services — 0.0% | |
| | 280,000 | | | Dagang NeXchange Berhad | | | 43,162 | | | | 33,556 | |
| | | | | | | | | | | | |
| |
| | | | Systems Software — 0.3% | |
| | 3,500 | | | Microsoft Corp. | | | 268,248 | | | | 299,390 | |
| | | | | | | | | | | | |
| |
| | | | Technology Hardware — 0.8% | |
| | 4,500 | | | Apple Inc. | | | 725,518 | | | | 761,535 | |
| | | | | | | | | | | | |
| | | | TOTAL INFORMATION TECHNOLOGY | | | 5,340,099 | | | | 5,596,521 | |
| | | | | | | | | | | | |
| | | | TOTAL COMMON STOCKS | | | 63,745,625 | | | | 93,460,384 | |
| | | | | | | | | | | | |
| |
| | | | CLOSED-END FUNDS — 2.3% | |
| | | | Information Technology — 2.3% | |
| | 31,800 | | | Altaba Inc.† | | | 685,922 | | | | 2,221,230 | |
| | | | | | | | | | | | |
| |
| | | | WARRANTS — 0.7% | |
| | | | TELECOMMUNICATION SERVICES — 0.7% | |
| | | | Wireless Telecommunication Services — 0.7% | |
| | 81,000 | | | Bharti Airtel Ltd., expire 11/30/20†(c) | | | 443,540 | | | | 672,300 | |
| | | | | | | | | | | | |
| | | | | | | | | | | | |
Principal Amount | | | | | Cost | | | Market Value | |
| |
| | | | CORPORATE BONDS — 0.0% | |
| | | | TELECOMMUNICATION SERVICES — 0.0% | |
| | $ 32,808 | | | Econet Wireless Zimbabwe Ltd., 5.000%, 06/01/23 | | $ | 1,592 | | | $ | 1,532 | |
| | | | | | | | | | | | |
| |
| | | | U.S. GOVERNMENT OBLIGATIONS — 0.8% | |
| | 800,000 | | | U.S. Treasury Bills, 1.327% to 1.334%††, 03/15/18 to 03/22/18 | | | 797,798 | | | | 797,858 | |
| | | | | | | | | | | | |
| | | | TOTAL INVESTMENTS — 100.1% | | $ | 65,674,477 | | | | 97,153,304 | |
| | | | | | | | | | | | |
| | | | Other Assets and Liabilities
(Net) — (0.1)% | | | | | | | (103,366 | ) |
| | | | | | | | | | | | |
| | | | NET ASSETS — 100.0% | | | $ | 97,049,938 | |
| | | | | | | | | | | | |
| (a) | Security is valued using significant unobservable inputs and is classified as Level 3 in the fair value hierarchy. |
| (b) | At December 31, 2017, the Fund held an investment in a restricted and illiquid security amounting to $0 or 0.0% of total net assets, which was valued under methods approved by the Board of Directors as follows: |
| | | | | | | | | | | | |
Acquisition Shares | | | Issuer | | Acquisition
Date | | Acquisition
Cost | | | 12/31/17
Carrying
Value
Per
Share |
| | 24,225 | | | TT&T Public Co. Ltd. | | 03/31/94 | | | $ 100,542 | | | — |
| (c) | Security exempt from registration under Rule 144A of the Securities Act of 1933, as amended. This security may be resold in transactions exempt from registration, normally to qualified institutional buyers. At December 31, 2017, the market value of the Rule 144A security amounted to $672,300 or 0.69% of total net assets. |
| † | Non-income producing security. |
| †† | Represents annualized yield at date of purchase. |
| ADR | American Depositary Receipt |
| GDR | Global Depositary Receipt |
| SDR | Swedish Depositary Receipt |
| | | | | | | | |
Geographic Diversification | | % of
Market
Value | | | Market
Value | |
North America | | | 55.4 | % | | $ | 53,841,458 | |
Europe | | | 26.2 | | | | 25,421,080 | |
Latin America | | | 6.3 | | | | 6,144,120 | |
Japan | | | 5.8 | | | | 5,606,726 | |
Asia/Pacific | | | 4.6 | | | | 4,495,614 | |
Africa/Middle East | | | 1.7 | | | | 1,644,306 | |
| | | | | | | | |
| | | 100.0 | % | | $ | 97,153,304 | |
| | | | | | | | |
See accompanying notes to financial statements.
9
The Gabelli Global Content & Connectivity Fund
Statement of Assets and Liabilities
December 31, 2017
| | | | |
Assets: | | | | |
Investments, at value (cost $65,674,477) | | $ | 97,153,304 | |
Foreign currency, at value (cost $1,661) | | | 1,586 | |
Receivable for Fund shares sold | | | 1,368 | |
Receivable from Adviser | | | 10,271 | |
Dividends receivable | | | 219,766 | |
Prepaid expenses | | | 43,187 | |
| | | | |
Total Assets | | | 97,429,482 | |
| | | | |
Liabilities: | | | | |
Payable to custodian | | | 5,659 | |
Payable for Fund shares redeemed | | | 152,579 | |
Payable for investment advisory fees | | | 82,101 | |
Payable for distribution fees | | | 17,766 | |
Payable for accounting fees | | | 3,750 | |
Payable for legal and audit fees | | | 39,466 | |
Payable for shareholder services fees | | | 33,416 | |
Payable for shareholder communications expenses | | | 30,849 | |
Other accrued expenses | | | 13,958 | |
| | | | |
Total Liabilities | | | 379,544 | |
| | | | |
Net Assets | | | | |
(applicable to 4,458,551 shares outstanding) | | $ | 97,049,938 | |
| | | | |
Net Assets Consist of: | | | | |
Paid-in capital | | $ | 66,825,853 | |
Accumulated distributions in excess of net investment income | | | (247,868 | ) |
Accumulated distributions in excess of net realized gain on investments and foreign currency transactions | | | (1,007,614 | ) |
Net unrealized appreciation on investments | | | 31,478,827 | |
Net unrealized appreciation on foreign currency translations | | | 740 | |
| | | | |
Net Assets | | $ | 97,049,938 | |
| | | | |
Shares of Capital Stock, each at $0.001 par value: | | | | |
Class AAA: | | | | |
Net Asset Value, offering, and redemption price per share ($81,831,715 ÷ 3,758,580 shares outstanding; 150,000,000 shares authorized) | | $ | 21.77 | |
| | | | |
Class A: | | | | |
Net Asset Value and redemption price per share ($575,915 ÷ 26,251 shares outstanding; 50,000,000 shares authorized) | | $ | 21.94 | |
| | | | |
Maximum offering price per share (NAV ÷ 0.9425, based on maximum sales charge of 5.75% of the offering price) | | $ | 23.28 | |
| | | | |
Class C: | | | | |
Net Asset Value and offering price per share ($266,655 ÷ 12,648 shares outstanding; 50,000,000 shares authorized) | | $ | 21.08 | (b) |
| | | | |
Class I: | | | | |
Net Asset Value, offering, and redemption price per share ($14,374,608 ÷ 661,024 shares outstanding; 50,000,000 shares authorized) | | $ | 21.75 | |
| | | | |
Class T: | | | | |
Net Asset Value and redemption price per share ($1,045 ÷ 48 shares outstanding; 50,000,000 shares authorized) | | $ | 21.75 | (c) |
| | | | |
Maximum offering price per share (NAV ÷ 0.975, based on maximum sales charge of 2.50% of the offering price) | | $ | 22.31 | |
| | | | |
| (a) | Includes net change of $(2,681) in deferred Pakistan capital gains tax on unrealized appreciation during the year ended December 31, 2017. |
| (b) | Redemption price varies based on the length of time held. |
| (c) | The net asset value is calculated using unrounded net assets of $1044.50 divided by the unrounded shares outstanding of 48.02. |
Statement of Operations
For the Year Ended December 31, 2017
| | | | |
Investment Income: | | | | |
Dividends (net of foreign withholding taxes of $192,738) | | $ | 2,154,811 | |
Interest | | | 3,314 | |
Other Income* | | | 318 | |
| | | | |
Total Investment Income | | | 2,158,443 | |
| | | | |
Expenses: | | | | |
Investment advisory fees | | | 975,338 | |
Distribution fees - Class AAA | | | 212,141 | |
Distribution fees - Class A | | | 1,480 | |
Distribution fees - Class C | | | 2,759 | |
Distribution fees - Class T | | | 1 | |
Shareholder services fees | | | 114,564 | |
Legal and audit fees | | | 80,204 | |
Shareholder communications expenses | | | 78,811 | |
Registration expenses | | | 55,786 | |
Accounting fees | | | 45,000 | |
Custodian fees | | | 44,222 | |
Directors’ fees | | | 29,596 | |
Interest expense | | | 1,337 | |
Miscellaneous expenses | | | 18,227 | |
| | | | |
Total Expenses | | | 1,659,466 | |
| | | | |
Less: | | | | |
Expenses paid indirectly by broker (See Note 6) | | | (1,982 | ) |
Expense reimbursements (See Note 3) | | | (56,231 | ) |
| | | | |
Total Credits and Reimbursements | | | (58,213 | ) |
| | | | |
Net Expenses | | | 1,601,253 | |
| | | | |
Net Investment Income | | | 557,190 | |
| | | | |
Net Realized and Unrealized Gain/(Loss) on Investments and Foreign Currency: | | | | |
Net realized gain on investments | | | 5,316,276 | |
Net realized loss on foreign currency transactions | | | (8,101 | ) |
| | | | |
Net realized gain on investments and foreign currency transactions | | | 5,308,175 | |
| | | | |
Net change in unrealized appreciation/(depreciation): | | | | |
on investments (a) | | | 6,461,723 | |
on foreign currency translations | | | 6,293 | |
| | | | |
Net change in unrealized appreciation on investments and foreign currency translations | | | 6,468,016 | |
| | | | |
Net Realized and Unrealized Gain/(Loss) on Investments and Foreign Currency | | | 11,776,191 | |
| | | | |
Net Increase in Net Assets Resulting from Operations | | $ | 12,333,381 | |
| | | | |
| * | The Fund received a reimbursement of custody expenses paid in prior years. |
See accompanying notes to financial statements.
10
The Gabelli Global Content & Connectivity Fund
Statement of Changes in Net Assets
| | | | | | | | |
| | | Year Ended
December 31, 2017 | | | Year Ended
December 31, 2016 | |
Operations: | | | | | | | | |
Net investment income | | $ | 557,190 | | | $ | 1,243,759 | |
Net realized gain on investments and foreign currency transactions | | | 5,308,175 | | | | 4,982,345 | |
Net change in unrealized appreciation/(depreciation) on investments and foreign currency translations | | | 6,468,016 | | | | (3,216,384 | ) |
| | | | | | | | |
Net Increase in Net Assets Resulting from Operations | | | 12,333,381 | | | | 3,009,720 | |
| | | | | | | | |
Distributions to Shareholders: | | | | | | | | |
Net investment income | | | | | | | | |
Class AAA | | | (487,554 | ) | | | (1,163,838 | ) |
Class A | | | (3,428 | ) | | | (2,890 | ) |
Class C | | | — | | | | (1,507 | ) |
Class I | | | (181,188 | ) | | | (89,810 | ) |
Class T | | | (8 | ) | | | — | |
| | | | | | | | |
| | | (672,178 | ) | | | (1,258,045 | ) |
| | | | | | | | |
Net realized gain | | | | | | | | |
Class AAA | | | (4,479,876 | ) | | | (4,630,068 | ) |
Class A | | | (31,428 | ) | | | (34,850 | ) |
Class C | | | (15,261 | ) | | | (17,760 | ) |
Class I | | | (790,279 | ) | | | (293,288 | ) |
Class T | | | (57 | ) | | | — | |
| | | | | | | | |
| | | (5,316,901 | ) | | | (4,975,966 | ) |
| | | | | | | | |
Return of capital | | | | | | | | |
Class AAA | | | — | | | | (78,376 | ) |
Class A | | | — | | | | (195 | ) |
Class C | | | — | | | | (101 | ) |
Class I | | | — | | | | (6,048 | ) |
Class T | | | — | | | | — | |
| | | | | | | | |
| | | — | | | | (84,720 | ) |
| | | | | | | | |
Total Distributions to Shareholders | | | (5,989,079 | ) | | | (6,318,731 | ) |
| | | | | | | | |
| | |
Capital Share Transactions: | | | | | | | | |
Class AAA | | | (11,913,609 | ) | | | (9,903,085 | ) |
Class A | | | (125,364 | ) | | | (619,337 | ) |
Class C | | | (80,307 | ) | | | (101,536 | ) |
Class I | | | 7,580,673 | | | | 4,854,670 | |
Class T | | | 1,064 | | | | — | |
| | | | | | | | |
Net Decrease in Net Assets from Capital Share Transactions | | | (4,537,543 | ) | | | (5,769,288 | ) |
| | | | | | | | |
| | |
Redemption Fees | | | — | | | | 5,759 | |
| | | | | | | | |
Net Increase/(Decrease) in Net Assets | | | 1,806,759 | | | | (9,072,540 | ) |
Net Assets: | | | | | | | | |
Beginning of year | | | 95,243,179 | | | | 104,315,719 | |
| | | | | | | | |
End of year (including undistributed net investment income of $0 and $0, respectively) | | $ | 97,049,938 | | | $ | 95,243,179 | |
| | | | | | | | |
See accompanying notes to financial statements.
11
The Gabelli Global Content & Connectivity Fund
Financial Highlights
Selected data for a share of capital stock outstanding throughout each period:
| | | | | | | | | | | | | | | | | | | | | | | | | | | | | | | | | | | | | | | | | | | | | | | | | | | | | | | | | | | | | | | | | | | | | | | | | | | | | | | | |
| | | | | Income (Loss)
from Investment Operations | | Distributions | | | | | | | | Ratios to Average Net Assets
Supplemental Data |
Year Ended
December 31 | | Net Asset
Value,
Beginning
of Year | | Net
Investment
Income
(Loss)(a) | | Net
Realized
and
Unrealized
Gain (Loss)
on
Investments | | Total from
Investment
Operations | | Net
Investment
Income | | Net
Realized
Gain | | Return of
Capital | | Total
Distributions | | Redemption
Fees(a)(b) | | Net Asset
Value,
End of
Year | | Total
Return† | | Net Assets
End of Year
(in 000’s) | | Net
Investment
Income | | Operating
Expenses
Before
Reimbursement | | Operating
Expenses
Net of
Reimbursement | | Portfolio
Turnover
Rate |
Class AAA | | | | | | | | | | | | | | | | | | | | | | | | | | | | | | | | | | | | | | | | | | | | | | | | | | | | | | | | | | | | | | | | | | | | | | | | | | | | | | | | |
2017 | | | $ | 20.43 | | | | $ | 0.11 | | | | $ | 2.63 | | | | $ | 2.74 | | | | $ | (0.14 | ) | | | $ | (1.26 | ) | | | | — | | | | $ | (1.40 | ) | | | | — | | | | $ | 21.77 | | | | | 13.4 | % | | | $ | 81,832 | | | | | 0.48 | % | | | | 1.73 | % | | | | 1.73 | %(c) | | | | 22 | % |
2016 | | | | 21.30 | | | | | 0.27 | | | | | 0.29 | | | | | 0.56 | | | | | (0.28 | ) | | | | (1.13 | ) | | | $ | (0.02 | ) | | | | (1.43 | ) | | | $ | 0.00 | | | | | 20.43 | | | | | 2.7 | | | | | 87,893 | | | | | 1.23 | | | | | 1.65 | | | | | 1.65 | (c)(d) | | | | 9 | |
2015 | | | | 23.63 | | | | | 0.26 | | | | | (0.82 | ) | | | | (0.56 | ) | | | | (0.27 | ) | | | | (1.49 | ) | | | | (0.01 | ) | | | | (1.77 | ) | | | | 0.00 | | | | | 21.30 | | | | | (2.5 | ) | | | | 101,187 | | | | | 1.08 | | | | | 1.63 | | | | | 1.63 | (c) | | | | 5 | |
2014 | | | | 24.85 | | | | | 0.35 | | | | | (0.66 | ) | | | | (0.31 | ) | | | | (0.38 | ) | | | | (0.53 | ) | | | | — | | | | | (0.91 | ) | | | | 0.00 | | | | | 23.63 | | | | | (1.3 | ) | | | | 115,860 | | | | | 1.43 | | | | | 1.61 | | | | | 1.61 | | | | | 3 | |
2013 | | | | 20.20 | | | | | 0.37 | | | | | 4.65 | | | | | 5.02 | | | | | (0.37 | ) | | | | — | | | | | — | | | | | (0.37 | ) | | | | 0.00 | | | | | 24.85 | | | | | 24.9 | | | | | 137,545 | | | | | 1.66 | | | | | 1.64 | | | | | 1.64 | | | | | 3 | |
Class A | | | | | | | | | | | | | | | | | | | | | | | | | | | | | | | | | | | | | | | | | | | | | | | | | | | | | | | | | | | | | | | | | | | | | | | | | | | | | | | | |
2017 | | | $ | 20.58 | | | | $ | 0.10 | | | | $ | 2.66 | | | | $ | 2.76 | | | | $ | (0.14 | ) | | | $ | (1.26 | ) | | | | — | | | | $ | (1.40 | ) | | | | — | | | | $ | 21.94 | | | | | 13.4 | % | | | $ | 576 | | | | | 0.43 | % | | | | 1.73 | % | | | | 1.73 | %(c) | | | | 22 | % |
2016 | | | | 21.29 | | | | | 0.15 | | | | | 0.38 | | | | | 0.53 | | | | | (0.09 | ) | | | | (1.13 | ) | | | $ | (0.02 | ) | | | | (1.24 | ) | | | $ | 0.00 | | | | | 20.58 | | | | | 2.5 | | | | | 661 | | | | | 0.68 | | | | | 1.65 | | | | | 1.65 | (c)(d) | | | | 9 | |
2015 | | | | 23.61 | | | | | 0.26 | | | | | (0.81 | ) | | | | (0.55 | ) | | | | (0.27 | ) | | | | (1.49 | ) | | | | (0.01 | ) | | | | (1.77 | ) | | | | 0.00 | | | | | 21.29 | | | | | (2.5 | ) | | | | 846 | | | | | 1.08 | | | | | 1.63 | | | | | 1.63 | (c) | | | | 5 | |
2014 | | | | 24.83 | | | | | 0.39 | | | | | (0.70 | ) | | | | (0.31 | ) | | | | (0.38 | ) | | | | (0.53 | ) | | | | — | | | | | (0.91 | ) | | | | 0.00 | | | | | 23.61 | | | | | (1.3 | ) | | | | 1,114 | | | | | 1.53 | | | | | 1.61 | | | | | 1.61 | | | | | 3 | |
2013 | | | | 20.19 | | | | | 0.36 | | | | | 4.65 | | | | | 5.01 | | | | | (0.37 | ) | | | | — | | | | | — | | | | | (0.37 | ) | | | | 0.00 | | | | | 24.83 | | | | | 24.8 | | | | | 1,678 | | | | | 1.61 | | | | | 1.64 | | | | | 1.64 | | | | | 3 | |
Class C | | | | | | | | | | | | | | | | | | | | | | | | | | | | | | | | | | | | | | | | | | | | | | | | | | | | | | | | | | | | | | | | | | | | | | | | | | | | | | | | |
2017 | | | $ | 19.85 | | | | $ | (0.06 | ) | | | $ | 2.55 | | | | $ | 2.49 | | | | | — | | | | $ | (1.26 | ) | | | | — | | | | $ | (1.26 | ) | | | | — | | | | $ | 21.08 | | | | | 12.5 | % | | | $ | 267 | | | | | (0.28 | )% | | | | 2.48 | % | | | | 2.48 | %(c) | | | | 22 | % |
2016 | | | | 20.71 | | | | | 0.09 | | | | | 0.30 | | | | | 0.39 | | | | $ | (0.10 | ) | | | | (1.13 | ) | | | $ | (0.02 | ) | | | | (1.25 | ) | | | $ | 0.00 | | | | | 19.85 | | | | | 1.9 | | | | | 328 | | | | | 0.42 | | | | | 2.40 | | | | | 2.40 | (c)(d) | | | | 9 | |
2015 | | | | 22.98 | | | | | 0.08 | | | | | (0.79 | ) | | | | (0.71 | ) | | | | (0.06 | ) | | | | (1.49 | ) | | | | (0.01 | ) | | | | (1.56 | ) | | | | 0.00 | | | | | 20.71 | | | | | (3.2 | ) | | | | 441 | | | | | 0.36 | | | | | 2.38 | | | | | 2.38 | (c) | | | | 5 | |
2014 | | | | 24.17 | | | | | 0.19 | | | | | (0.67 | ) | | | | (0.48 | ) | | | | (0.18 | ) | | | | (0.53 | ) | | | | — | | | | | (0.71 | ) | | | | 0.00 | | | | | 22.98 | | | | | (2.0 | ) | | | | 621 | | | | | 0.76 | | | | | 2.36 | | | | | 2.36 | | | | | 3 | |
2013 | | | | 19.64 | | | | | 0.20 | | | | | 4.50 | | | | | 4.70 | | | | | (0.17 | ) | | | | — | | | | | — | | | | | (0.17 | ) | | | | 0.00 | | | | | 24.17 | | | | | 23.9 | | | | | 814 | | | | | 0.92 | | | | | 2.39 | | | | | 2.39 | | | | | 3 | |
Class I | | | | | | | | | | | | | | | | | | | | | | | | | | | | | | | | | | | | | | | | | | | | | | | | | | | | | | | | | | | | | | | | | | | | | | | | | | | | | | | | |
2017 | | | $ | 20.40 | | | | $ | 0.28 | | | | $ | 2.62 | | | | $ | 2.90 | | | | $ | (0.29 | ) | | | $ | (1.26 | ) | | | | — | | | | $ | (1.55 | ) | | | | — | | | | $ | 21.75 | | | | | 14.2 | % | | | $ | 14,374 | | | | | 1.26 | % | | | | 1.48 | % | | | | 1.00 | %(c)(e) | | | | 22 | % |
2016 | | | | 21.27 | | | | | 0.30 | | | | | 0.33 | | | | | 0.63 | | | | | (0.35 | ) | | | | (1.13 | ) | | | $ | (0.02 | ) | | | | (1.50 | ) | | | $ | 0.00 | | | | | 20.40 | | | | | 3.0 | | | | | 6,361 | | | | | 1.41 | | | | | 1.40 | | | | | 1.35 | (c)(d)(e) | | | | 9 | |
2015 | | | | 23.60 | | | | | 0.30 | | | | | (0.79 | ) | | | | (0.49 | ) | | | | (0.34 | ) | | | | (1.49 | ) | | | | (0.01 | ) | | | | (1.84 | ) | | | | 0.00 | | | | | 21.27 | | | | | (2.2 | ) | | | | 1,842 | | | | | 1.26 | | | | | 1.38 | | | | | 1.38 | (c) | | | | 5 | |
2014 | | | | 24.83 | | | | | 0.37 | | | | | (0.62 | ) | | | | (0.25 | ) | | | | (0.45 | ) | | | | (0.53 | ) | | | | — | | | | | (0.98 | ) | | | | 0.00 | | | | | 23.60 | | | | | (1.1 | ) | | | | 1,665 | | | | | 1.45 | | | | | 1.36 | | | | | 1.36 | | | | | 3 | |
2013 | | | | 20.18 | | | | | 0.43 | | | | | 4.64 | | | | | 5.07 | | | | | (0.42 | ) | | | | — | | | | | — | | | | | (0.42 | ) | | | | 0.00 | | | | | 24.83 | | | | | 25.2 | | | | | 1,811 | | | | | 1.94 | | | | | 1.39 | | | | | 1.39 | | | | | 3 | |
Class T(f) | | | | | | | | | | | | | | | | | | | | | | | | | | | | | | | | | | | | | | | | | | | | | | | | | | | | | | | | | | | | | | | | | | | | | | | | | | | | | | | | |
2017 | | | $ | 22.19 | | | | $ | 0.02 | | | | $ | 0.97 | | | | $ | 0.99 | | | | $ | (0.17 | ) | | | $ | (1.26 | ) | | | | — | | | | $ | (1.43 | ) | | | | — | | | | $ | 21.75 | | | | | 4.4 | % | | | $ | 1 | | | | | 0.17 | %(g) | | | | 1.73 | %(g) | | | | 1.73 | %(c)(g) | | | | 22 | % |
| † | Total return represents aggregate total return of a hypothetical $1,000 investment at the beginning of the period and sold at the end of the year including reinvestment of distributions and does not reflect the applicable sales charges. Total return for a period of less than one year is not annualized. |
| (a) | Per share amounts have been calculated using the average shares outstanding method. |
| (b) | Amount represents less than $0.005 per share. |
| (c) | The Fund received credits from a designated broker who agreed to pay certain Fund operating expenses. For the years ended December 31, 2017, 2016, and 2015, there was no impact to the expense ratios. |
| (d) | During the year ended December 31, 2016, the Fund received reimbursements of custody expenses paid in prior years. Had such reimbursement (allocated by relative net asset values of the Fund’s share classes) been included in that period, the expense ratios would have been 1.22% (Class AAA), 1.54% (Class A), 1.99% (Class C), and 0.95% (Class I), respectively. |
| (e) | Under an expense reimbursement agreement with the Adviser, the Adviser reimbursed certain Class I expenses to the Fund of $56,231 and $899 for the years ended December 31, 2017 and 2016, respectively. |
| (f) | Class T Shares were initially offered on July 5, 2017. |
See accompanying notes to financial statements.
12
The Gabelli Global Content & Connectivity Fund
Notes to Financial Statements
1. Organization. Effective September 5, 2017, The GAMCO Global Telecommunications Fund changed its name to The Gabelli Global Content & Connectivity Fund with a corresponding change in the name of each of its Classes of Shares. The Fund, a series of GAMCO Global Series Funds, Inc. (the “Corporation”), was incorporated on July 16, 1993 in Maryland. The Fund is a non-diversified open-end management investment company registered under the Investment Company Act of 1940, as amended (the “1940 Act”), and one of four separately managed portfolios (collectively, the “Portfolios”) of the Corporation. The Fund’s primary objective is capital appreciation. The Fund commenced investment operations on November 1, 1993. On July 5, 2017, the Fund began to offer for sale Class T Shares.
The Fund may invest a high percentage of its assets in specific sectors of the market in order to achieve a potentially greater investment return. As a result, the Fund may be more susceptible to economic, political, and regulatory developments in a particular sector of the market, positive or negative, and may experience increased volatility to the Fund’s NAV and a magnified effect in its total return.
2. Significant Accounting Policies. As an investment company, the Fund follows the investment company accounting and reporting guidance, which is part of U.S. generally accepted accounting principles (“GAAP”) that may require the use of management estimates and assumptions in the preparation of its financial statements. Actual results could differ from those estimates. The following is a summary of significant accounting policies followed by the Fund in the preparation of its financial statements.
Security Valuation. Portfolio securities listed or traded on a nationally recognized securities exchange or traded in the U.S. over-the-counter market for which market quotations are readily available are valued at the last quoted sale price or a market’s official closing price as of the close of business on the day the securities are being valued. If there were no sales that day, the security is valued at the average of the closing bid and asked prices or, if there were no asked prices quoted on that day, then the security is valued at the closing bid price on that day. If no bid or asked prices are quoted on such day, the security is valued at the most recently available price or, if the Board of Directors (the “Board”) so determines, by such other method as the Board shall determine in good faith to reflect its fair market value. Portfolio securities traded on more than one national securities exchange or market are valued according to the broadest and most representative market, as determined by Gabelli Funds, LLC (the “Adviser”).
Portfolio securities primarily traded on a foreign market are generally valued at the preceding closing values of such securities on the relevant market, but may be fair valued pursuant to procedures established by the Board if market conditions change significantly after the close of the foreign market, but prior to the close of business on the day the securities are being valued. Debt obligations for which market quotations are readily available are valued at the average of the latest bid and asked prices. If there were no asked prices quoted on such day, the security is valued using the closing bid price. Such debt obligations are valued through prices provided by a Pricing Service approved by the Board. Certain securities are valued principally using dealer quotations.
Securities and assets for which market quotations are not readily available are fair valued as determined by the Board. Fair valuation methodologies and procedures may include, but are not limited to: analysis and review of available financial and non-financial information about the company; comparisons with the valuation and changes in valuation of similar securities, including a comparison of foreign securities with the equivalent U.S. dollar value American Depositary Receipt securities at the close of the U.S. exchange; and evaluation of any other information that could be indicative of the value of the security.
13
The Gabelli Global Content & Connectivity Fund
Notes to Financial Statements (Continued)
The inputs and valuation techniques used to measure fair value of the Fund’s investments are summarized into three levels as described in the hierarchy below:
| | ● | | Level 1 — quoted prices in active markets for identical securities; |
| | ● | | Level 2 — other significant observable inputs (including quoted prices for similar securities, interest rates, prepayment speeds, credit risk, etc.); and |
| | ● | | Level 3 — significant unobservable inputs (including the Board’s determinations as to the fair value of investments). |
A financial instrument’s level within the fair value hierarchy is based on the lowest level of any input both individually and in the aggregate that is significant to the fair value measurement. The inputs or methodology used for valuing securities are not necessarily an indication of the risk associated with investing in those securities. The summary of the Fund’s investments in securities by inputs used to value the Fund’s investments as of December 31, 2017 is as follows:
| | | | | | | | | | | | | | | | | | | | |
| | | Valuation Inputs | | |
| | | Level 1
Quoted Prices | | Level 2 Other Significant
Observable Inputs | | Level 3 Significant
Unobservable Inputs | | Total Market Value
at 12/31/17 |
INVESTMENTS IN SECURITIES: | | | | | | | | | | | | | | | | | | | | |
ASSETS (Market Value): | | | | | | | | | | | | | | | | | | | | |
Common Stocks | | | | | | | | | | | | | | | | | | | | |
Media | | | | $22,324,768 | | | | | $ 119,696 | | | | | — | | | | | $22,444,464 | |
Telecommunications Services | | | | 50,733,387 | | | | | 372,681 | | | | $ | 0 | | | | | 51,106,068 | |
Other (a) | | | | 14,224,529 | | | | | 88,202 | | | | | 600 | | | | | 14,313,331 | |
Other Industries (a) | | | | 5,596,521 | | | | | — | | | | | — | | | | | 5,596,521 | |
Total Common Stocks | | | | 92,879,205 | | | | | 580,579 | | | | | 600 | | | | | 93,460,384 | |
Closed-End Funds (a) | | | | 2,221,230 | | | | | — | | | | | — | | | | | 2,221,230 | |
Warrants (a) | | | | — | | | | | 672,300 | | | | | — | | | | | 672,300 | |
Corporate Bonds (a) | | | | — | | | | | 1,532 | | | | | — | | | | | 1,532 | |
U.S. Government Obligations | | | | — | | | | | 797,858 | | | | | — | | | | | 797,858 | |
TOTAL INVESTMENTS IN
SECURITIES – ASSETS | | | | $95,100,435 | | | | | $2,052,269 | | | | | $600 | | | | | $97,153,304 | |
| (a) | Please refer to the Schedule of Investments for the industry classifications of these portfolio holdings. |
The Fund did not have material transfers among Level 1, Level 2, and Level 3 during the year ended December 31, 2017. The Fund’s policy is to recognize transfers among Levels as of the beginning of the reporting period.
Additional Information to Evaluate Qualitative Information.
General. The Fund uses recognized industry pricing services – approved by the Board and unaffiliated with the Adviser – to value most of its securities, and uses broker quotes provided by market makers of securities not valued by these and other recognized pricing sources. Several different pricing feeds are received to value domestic equity securities, international equity securities, preferred equity securities, and fixed income securities. The data within these feeds are ultimately sourced from major stock exchanges and trading systems where these securities trade. The prices supplied by external sources are checked by obtaining quotations or actual transaction prices from market participants. If a price obtained from the pricing source is deemed unreliable, prices will be sought from another pricing service or from a broker/dealer that trades that security or similar securities.
14
The Gabelli Global Content & Connectivity Fund
Notes to Financial Statements (Continued)
Fair Valuation. Fair valued securities may be common or preferred equities, warrants, options, rights, or fixed income obligations. Where appropriate, Level 3 securities are those for which market quotations are not available, such as securities not traded for several days, or for which current bids are not available, or which are restricted as to transfer. When fair valuing a security, factors to consider include recent prices of comparable securities that are publicly traded, reliable prices of securities not publicly traded, the use of valuation models, current analyst reports, valuing the income or cash flow of the issuer, or cost if the preceding factors do not apply. A significant change in the unobservable inputs could result in a lower or higher value in Level 3 securities. The circumstances of Level 3 securities are frequently monitored to determine if fair valuation measures continue to apply.
The Adviser reports quarterly to the Board the results of the application of fair valuation policies and procedures. These may include backtesting the prices realized in subsequent trades of these fair valued securities to fair values previously recognized.
Foreign Currency Translations. The books and records of the Fund are maintained in U.S. dollars. Foreign currencies, investments, and other assets and liabilities are translated into U.S. dollars at current exchange rates. Purchases and sales of investment securities, income, and expenses are translated at the exchange rate prevailing on the respective dates of such transactions. Unrealized gains and losses that result from changes in foreign exchange rates and/or changes in market prices of securities have been included in unrealized appreciation/depreciation on investments and foreign currency translations. Net realized foreign currency gains and losses resulting from changes in exchange rates include foreign currency gains and losses between trade date and settlement date on investment securities transactions, foreign currency transactions, and the difference between the amounts of interest and dividends recorded on the books of the Fund and the amounts actually received. The portion of foreign currency gains and losses related to fluctuation in exchange rates between the initial purchase trade date and subsequent sale trade date is included in realized gain/(loss) on investments.
Foreign Securities. The Fund may directly purchase securities of foreign issuers. Investing in securities of foreign issuers involves special risks not typically associated with investing in securities of U.S. issuers. The risks include possible revaluation of currencies, the inability to repatriate funds, less complete financial information about companies, and possible future adverse political and economic developments. Moreover, securities of many foreign issuers and their markets may be less liquid and their prices more volatile than securities of comparable U.S. issuers.
Foreign Taxes. The Fund may be subject to foreign taxes on income, gains on investments, or currency repatriation, a portion of which may be recoverable. The Fund will accrue such taxes and recoveries as applicable, based upon its current interpretation of tax rules and regulations that exist in the markets in which it invests.
Restricted Securities. The Fund may invest up to 15% of its net assets in securities for which the markets are restricted. Restricted securities include securities whose disposition is subject to substantial legal or contractual restrictions. The sale of restricted securities often requires more time and results in higher brokerage charges or dealer discounts and other selling expenses than does the sale of securities eligible for trading on national securities exchanges or in the over-the-counter markets. Restricted securities may sell at a price lower than similar securities that are not subject to restrictions on resale. Securities freely saleable among qualified institutional
15
The Gabelli Global Content & Connectivity Fund
Notes to Financial Statements (Continued)
investors under special rules adopted by the SEC may be treated as liquid if they satisfy liquidity standards established by the Board. The continued liquidity of such securities is not as well assured as that of publicly traded securities, and accordingly the Board will monitor their liquidity. For the restricted securities the Fund held as of December 31, 2017, refer to the Schedule of Investments.
Securities Transactions and Investment Income. Securities transactions are accounted for on the trade date with realized gain or loss on investments determined by using the identified cost method. Interest income (including amortization of premium and accretion of discount) is recorded on an accrual basis. Premiums and discounts on debt securities are amortized using the effective yield to maturity method. Dividend income is recorded on the ex-dividend date, except for certain dividends from foreign securities that are recorded as soon after the ex-dividend date as the Fund becomes aware of such dividends.
Determination of Net Asset Value and Calculation of Expenses. Certain administrative expenses are common to, and allocated among, various affiliated funds. Such allocations are made on the basis of each fund’s average net assets or other criteria directly affecting the expenses as determined by the Adviser pursuant to procedures established by the Board.
In calculating the NAV per share of each class, investment income, realized and unrealized gains and losses, redemption fees, and expenses other than class specific expenses are allocated daily to each class of shares based upon the proportion of net assets of each class at the beginning of each day. Distribution expenses are borne solely by the class incurring the expense.
Distributions to Shareholders. Distributions to shareholders are recorded on the ex-dividend date. Distributions to shareholders are based on income and capital gains as determined in accordance with federal income tax regulations, which may differ from income and capital gains as determined under GAAP. These differences are primarily due to differing treatments of income and gains on various investment securities and foreign currency transactions, timing differences, and differing characterizations of distributions made by the Fund. Distributions from net investment income for federal income tax purposes include net realized gains on foreign currency transactions. These book/tax differences are either temporary or permanent in nature. To the extent these differences are permanent, adjustments are made to the appropriate capital accounts in the period when the differences arise. Permanent differences were primarily due to the tax treatment of currency gains and losses, recharacterization of distributions and sales of passive foreign investment companies. These reclassifications have no impact on the NAV of the Fund. For the year ended December 31, 2017, reclassifications were made to decrease accumulated distributions in excess of net investment income by $140,866 and increase accumulated distributions in excess of net realized gain on investments and foreign currency transactions by $117,887, with an offsetting adjustment to paid-in capital.
16
The Gabelli Global Content & Connectivity Fund
Notes to Financial Statements (Continued)
The tax character of distributions paid during the years ended December 31, 2017 and 2016 was as follows:
| | | | | | | | | | |
| | | Year Ended
December 31, 2017 | | | Year Ended
December 31, 2016 | | | |
Distributions paid from: | | | | | | | | | | |
Ordinary income | | $ | 690,650 | | | $ | 1,299,323 | | | |
Net long term capital gains | | | 5,298,429 | | | | 4,934,688 | | | |
Return of Capital | | | — | | | | 84,720 | | | |
| | | | | | | | | | |
Total distributions paid | | $ | 5,989,079 | | | $ | 6,318,731 | | | |
| | | | | | | | | | |
Provision for Income Taxes. The Fund intends to continue to qualify as a regulated investment company under Subchapter M of the Internal Revenue Code of 1986, as amended (the “Code”). It is the policy of the Fund to comply with the requirements of the Code applicable to regulated investment companies and to distribute substantially all of its net investment company taxable income and net capital gains. Therefore, no provision for federal income taxes is required.
As of December 31, 2017, the components of accumulated earnings/losses on a tax basis were as follows:
| | | | |
Undistributed long term capital gains | | $ | 186,602 | |
Net unrealized appreciation on investments and foreign currency translations | | | 30,037,483 | |
| | | | |
Total | | $ | 30,224,085 | |
| | | | |
The Fund is permitted to carry capital losses forward for an unlimited period. Capital losses that are carried forward will retain their character as either short term or long term capital losses.
At December 31, 2017, the temporary differences between book basis and tax basis unrealized appreciation were primarily due to deferral of losses from wash sales for tax purposes and mark-to-market adjustments on investments previously considered to be a passive foreign investment company, and no longer considered a passive foreign investment company.
The following summarizes the tax cost of investments and the related net unrealized appreciation at December 31, 2017.
| | | | | | | | | | | | |
| | | Cost | | | Gross
Unrealized
Appreciation | | Gross
Unrealized
Depreciation | | | Net Unrealized
Appreciation |
Investments | | | $67,116,561 | | | $45,122,247 | | $ | (15,085,504 | ) | | $30,036,743 |
The Fund is required to evaluate tax positions taken or expected to be taken in the course of preparing the Fund’s tax returns to determine whether the tax positions are “more-likely-than-not” of being sustained by the applicable tax authority. Income tax and related interest and penalties would be recognized by the Fund as tax expense in the Statement of Operations if the tax positions were deemed not to meet the more-likely-than-not threshold. For the year ended December 31, 2017, the Fund did not incur any income tax, interest, or penalties. As of December 31, 2017, the Adviser has reviewed all open tax years and concluded that there was no impact to the Fund’s net assets or results of operations. The Fund’s federal and state tax returns for the prior three fiscal years remain open, subject to examination. On an ongoing basis, the Adviser will monitor the Fund’s tax positions to determine if adjustments to this conclusion are necessary.
3. Investment Advisory Agreement and Other Transactions. The Fund has entered into an investment advisory agreement (the “Advisory Agreement”) with the Adviser which provides that the Fund will pay the
17
The Gabelli Global Content & Connectivity Fund
Notes to Financial Statements (Continued)
Adviser a fee, computed daily and paid monthly, at the annual rate of 1.00% of the value of its average daily net assets. In accordance with the Advisory Agreement, the Adviser provides a continuous investment program for the Fund’s portfolio, oversees the administration of all aspects of the Fund’s business and affairs, and pays the compensation of all Officers and Directors of the Fund who are affiliated persons of the Adviser.
Effective December 1, 2016, the Adviser has agreed to amend its contractual agreement with respect to Class I shares of the Fund to waive its investment advisory fees and/or to reimburse expenses of the Fund to the extent necessary to maintain the total annual operating expenses after fee waiver and expense reimbursement (excluding brokerage costs, acquired fund fees and expenses, interest, taxes, and extraordinary expenses) at no more than an annual rate of 1.00% of the value of its average daily net assets. For the year ended December 31, 2017, the Adviser reimbursed certain Class I expenses in the amount of $56,231. In addition, the Fund has agreed, during the two year period following any waiver or reimbursement by the Adviser, to repay such amount to the extent, that after giving effect to the repayment, such adjusted annualized total operating expenses of the Fund would not exceed 1.00% of the value of the Fund’s average daily net assets for Class I Shares. This arrangement is in effect through April 30, 2019. At December 31, 2017, the cumulative amount which the Class I Shares may repay the Adviser, subject to the terms above, is $57,130:
| | | | |
For the year ended December 31, 2016, expiring December 31, 2018 | | $ | 899 | |
For the year ended December 31, 2017, expiring December 31, 2019 | | | 56,231 | |
| | | | |
| | $ | 57,130 | |
| | | | |
The Corporation pays each Director who is not considered to be an affiliated person an annual retainer of $6,000 plus $1,000 for each Board meeting attended and they are reimbursed for any out of pocket expenses incurred in attending meetings. All Board committee members receive $1,000 per meeting attended. The Chairman of the Audit Committee receives an annual fee $3,000, and the Lead Director receives an annual fee of $2,000. A Director may receive a single meeting fee, allocated among the participating funds, for attending certain meetings held on behalf of multiple funds. Directors who are directors or employees of the Adviser or an affiliated company receive no compensation or expense reimbursement from the Corporation.
4. Distribution Plan. The Fund’s Board has adopted a distribution plan (the “Plan”) for each class of shares, except for Class I Shares, pursuant to Rule 12b-1 under the 1940 Act. Under the Class AAA, Class A, Class C, and Class T Share Plans, payments are authorized to G.distributors, LLC (the “Distributor”), an affiliate of the Adviser, at annual rates of 0.25%, 0.25%, 1.00%, and 0.25%, respectively, of the average daily net assets of those classes, the annual limitations under each Plan. Such payments are accrued daily and paid monthly.
5. Portfolio Securities. Purchases and sales of securities during the year ended December 31, 2017, other than short term securities and U.S. Government obligations, aggregated $21,391,730 and $32,126,240, respectively.
6. Transactions with Affiliates and Other Arrangements. During the year ended December 31, 2017, the Fund paid brokerage commissions on security trades of $21,805 to G.research, LLC, an affiliate of the Adviser. Additionally, the Distributor retained a total of $1,354 from investors representing commissions (sales charges and underwriting fees) on sales and redemptions of Fund shares.
The Fund received credits from a designated broker who agreed to pay certain Fund operating expenses. The amount of such expenses paid through this directed brokerage arrangement during this period was $1,982.
18
The Gabelli Global Content & Connectivity Fund
Notes to Financial Statements (Continued)
The cost of calculating the Fund’s NAV per share is a Fund expense pursuant to the Advisory Agreement. During the year ended December 31, 2017, the Fund paid or accrued $45,000 to the Adviser in connection with the cost of computing the Fund’s NAV.
7. Line of Credit. The Fund participates in an unsecured line of credit which expires on March 8, 2018 and may be renewed annually, of up to $75,000,000 under which it may borrow up to 10% of its net assets from the custodian for temporary borrowing purposes. Borrowings under this arrangement bear interest at a floating rate equal to the higher of the overnight Federal Funds rate plus 125 basis points or the 30-day LIBOR plus 125 basis points in effect on that day. This amount, if any, would be included in “Interest expense” in the Statement of Operations. At December 31, 2017, there were no borrowings outstanding under the line of credit.
The average daily amount of borrowings outstanding under the line of credit during the year ended December 31, 2017 was $40,890 with a weighted average interest rate of 2.23%. The maximum amount borrowed at any time during the year ended December 31, 2017 was $363,000.
8. Capital Stock. The Fund offers five classes of shares–Class AAA Shares, Class A Shares, Class C Shares, Class I Shares, and Class T Shares. Class AAA and Class I Shares are offered without a sales charge. Class A Shares and Class T Shares are subject to a maximum front-end sales charge of 5.75% and 2.5%, respectively, and Class C Shares are subject to a 1.00% contingent deferred sales charge for one year after purchase.
The Fund imposes a redemption fee of 2.00% on all classes of shares that are redeemed or exchanged on or before the seventh day after the date of a purchase. The redemption fee is deducted from the proceeds otherwise payable to the redeeming shareholders and is retained by the Fund as an increase in paid-in capital. The redemption fees retained by the Fund during the years ended December 31, 2017 and 2016, if any, can be found in the Statement of Changes in Net Assets under Redemption Fees.
19
The Gabelli Global Content & Connectivity Fund
Notes to Financial Statements (Continued)
Transactions in shares of capital stock were as follows:
| | | | | | | | | | | | | | | | |
| | | Year Ended
December 31, 2017 | | | Year Ended
December 31, 2016 | |
| | | Shares | | | Amount | | | Shares | | | Amount | |
Class AAA | | | | | | | | | | | | | | | | |
Shares sold | | | 29,753 | | | $ | 654,237 | | | | 35,018 | | | $ | 749,451 | |
Shares issued upon reinvestment of distributions | | | 218,174 | | | | 4,751,822 | | | | 273,021 | | | | 5,577,825 | |
Shares redeemed | | | (791,326 | ) | | | (17,319,668 | ) | | | (755,902 | ) | | | (16,230,361 | ) |
| | | | | | | | | | | | | | | | |
Net decrease | | | (543,399 | ) | | $ | (11,913,609 | ) | | | (447,863 | ) | | $ | (9,903,085 | ) |
| | | | | | | | | | | | | | | | |
Class A | | | | | | | | | | | | | | | | |
Shares sold | | | 10,559 | | | $ | 235,876 | | | | 748,844 | | | $ | 16,390,157 | |
Shares issued upon reinvestment of distributions | | | 1,357 | | | | 29,767 | | | | 1,296 | | | | 26,665 | |
Shares redeemed | | | (17,780 | ) | | | (391,007 | ) | | | (757,757 | ) | | | (17,036,159 | ) |
| | | | | | | | | | | | | | | | |
Net decrease | | | (5,864 | ) | | $ | (125,364 | ) | | | (7,617 | ) | | $ | (619,337 | ) |
| | | | | | | | | | | | | | | | |
Class C | | | | | | | | | | | | | | | | |
Shares sold | | | 19 | | | $ | 394 | | | | 1,808 | | | $ | 37,916 | |
Shares issued upon reinvestment of distributions | | | 705 | | | | 14,868 | | | | 882 | | | | 17,501 | |
Shares redeemed | | | (4,605 | ) | | | (95,569 | ) | | | (7,435 | ) | | | (156,953 | ) |
| | | | | | | | | | | | | | | | |
Net decrease | | | (3,881 | ) | | $ | (80,307 | ) | | | (4,745 | ) | | $ | (101,536 | ) |
| | | | | | | | | | | | | | | | |
Class I | | | | | | | | | | | | | | | | |
Shares sold | | | 361,860 | | | $ | 7,882,460 | | | | 222,024 | | | $ | 4,802,848 | |
Shares issued upon reinvestment of distributions | | | 41,693 | | | | 906,821 | | | | 16,218 | | | | 330,850 | |
Shares redeemed | | | (54,399 | ) | | | (1,208,608 | ) | | | (12,962 | ) | | | (279,028 | ) |
| | | | | | | | | | | | | | | | |
Net increase | | | 349,154 | | | $ | 7,580,673 | | | | 225,280 | | | $ | 4,854,670 | |
| | | | | | | | | | | | | | | | |
Class T | | | | | | | | | | | | | | | | |
Shares sold | | | 45 | | | $ | 1,000 | | | | — | | | | — | |
Shares issued upon reinvestment of distributions | | | 3 | | | | 64 | | | | — | | | | — | |
| | | | | | | | | | | | | | | | |
Net increase | | | 48 | | | $ | 1,064 | | | | — | | | | — | |
| | | | | | | | | | | | | | | | |
9. Indemnifications. The Fund enters into contracts that contain a variety of indemnifications. The Fund’s maximum exposure under these arrangements is unknown. However, the Fund has not had prior claims or losses pursuant to these contracts. Management has reviewed the Fund’s existing contracts and expects the risk of loss to be remote.
10. Subsequent Events. Management has evaluated the impact on the Fund of all other subsequent events occurring through the date the financial statements were issued and has determined that there were no other subsequent events requiring recognition or disclosure in the financial statements.
20
The Gabelli Global Content & Connectivity Fund
Report of Independent Registered Public Accounting Firm
To the Shareholders and the Board of Directors of
The Gabelli Global Content & Connectivity Fund
Opinion on the Financial Statements
We have audited the accompanying statement of assets and liabilities of The Gabelli Global Content & Connectivity Fund (the “Fund”) (one of the funds constituting GAMCO Global Series Funds, Inc. (the “Corporation”)), including the schedule of investments, as of December 31, 2017, and the related statement of operations for the year then ended, the statements of changes in net assets for each of the two years in the period then ended, the financial highlights for each of the five years in the period then ended and the related notes (collectively referred to as the “financial statements”). In our opinion, the financial statements present fairly, in all material respects, the financial position of the Fund (one of the funds constituting GAMCO Global Series Funds, Inc.) at December 31, 2017, the results of its operations for the year then ended, the changes in its net assets for each of the two years in the period then ended and its financial highlights for each of the five years in the period then ended, in conformity with U.S. generally accepted accounting principles.
Basis for Opinion
These financial statements are the responsibility of the Corporation’s management. Our responsibility is to express an opinion on the Fund’s financial statements based on our audits. We are a public accounting firm registered with the Public Company Accounting Oversight Board (United States) (“PCAOB”) and are required to be independent with respect to the Corporation in accordance with the U.S. federal securities laws and the applicable rules and regulations of the Securities and Exchange Commission and the PCAOB.
We conducted our audits in accordance with the standards of the PCAOB. Those standards require that we plan and perform the audit to obtain reasonable assurance about whether the financial statements and financial highlights are free of material misstatement, whether due to error or fraud. The Corporation is not required to have, nor were we engaged to perform, an audit of the Corporation’s internal control over financial reporting. As part of our audits, we are required to obtain an understanding of internal control over financial reporting, but not for the purpose of expressing an opinion on the effectiveness of the Corporation’s internal control over financial reporting. Accordingly, we express no such opinion.
Our audits included performing procedures to assess the risks of material misstatement of the financial statements, whether due to error or fraud, and performing procedures that respond to those risks. Such procedures included examining, on a test basis, evidence regarding the amounts and disclosures in the financial statements. Our procedures included confirmation of securities owned as of December 31, 2017, by correspondence with the custodian. Our audits also included evaluating the accounting principles used and significant estimates made by management, as well as evaluating the overall presentation of the financial statements. We believe that our audits provide a reasonable basis for our opinion.

We have served as the auditor of one or more Gabelli/GAMCO Funds investment companies since 1992.
Philadelphia, Pennsylvania
February 28, 2018
21
The Gabelli Global Content & Connectivity Fund
Board Consideration and Re-Approval of Investment Advisory Agreement (Unaudited)
During the six months ended December 31, 2017, the Board of Directors of the Corporation approved the continuation of the investment advisory agreement with the Adviser for the Fund on the basis of the recommendation by the directors (the “Independent Board Members”) who are not “interested persons” of the Fund. The following paragraphs summarize the material information and factors considered by the Independent Board Members as well as their conclusions relative to such factors.
Nature, Extent, and Quality of Services. The Independent Board Members considered information regarding the Fund’s portfolio managers, the depth of the analyst pool available to the Adviser and the Fund’s portfolio managers, the scope of supervisory, administrative, shareholder, and other services supervised or provided by the Adviser, and the absence of significant service problems reported to the Board. The Independent Board Members noted the experience, length of service, and reputation of the Fund’s portfolio managers.
Investment Performance. The Independent Board Members reviewed the short, medium, and long term performance of the Fund (as of September 30, 2017) against a peer group of six other comparable funds prepared by the Adviser (the “Adviser Peer Group”), and against a peer group prepared by Broadridge (the “Broadridge Performance Peer Group”) consisting of all retail and institutional telecommunication funds, regardless of asset size or primary channel of distribution, as represented by the Lipper Telecom Fund Index. The Independent Board Members noted that the Fund’s performance was in the second quartile for the one year period, and in the fourth (lowest) quartile for the three, five, and ten year periods, as measured against the Adviser Peer Group. Against the Broadridge Performance Peer Group, the Independent Board Members noted that the Fund’s performance was in the second quintile for the one year period, and the fourth quintile for the three, five, and ten year periods.
Profitability. The Independent Board Members reviewed summary data regarding the profitability of the Fund to the Adviser both with a pro rata administrative charge and with a standalone administrative charge. The Independent Board Members also noted that a substantial portion of the Fund’s portfolio transactions were executed by an affiliated broker of the Adviser and that another affiliated broker received distribution fees and minor amounts of sales commissions.
Economies of Scale. The Independent Board Members discussed the major elements of the Adviser’s cost structure, the relationship of those elements to potential economies of scale and reviewed data provided by the Adviser.
Sharing of Economies of Scale. The Independent Board Members noted that the investment management fee schedule for the Fund does not take into account any potential economies of scale that may develop.
Service and Cost Comparisons. The Independent Board Members compared the expense ratios of the investment management fee, other expenses, and total expenses of the Fund with similar expense ratios of the Adviser Peer Group and a peer group of four other telecommunications funds selected by Broadridge, and noted that the Adviser’s management fee includes substantially all administrative services of the Fund as well as investment advisory services of the Adviser. The Independent Board Members noted that although the Fund’s total expense ratio was the highest of both peer groups, it did not significantly depart from the median total expense ratio for each of the two peer groups, and that the Fund’s size was generally average within both peer groups. The Independent Board Members also noted that the advisory fee structure was the same as that in effect for most of the Gabelli funds. The Independent Board Members were presented with, but did not consider to be material to their decision, various information comparing the advisory fee with the fee for other types of accounts managed by the Adviser.
22
The Gabelli Global Content & Connectivity Fund
Board Consideration and Re-Approval of Investment Advisory Agreement (Unaudited) (Continued)
Conclusions. The Independent Board Members concluded that the Fund enjoyed highly experienced portfolio management services, good ancillary services, and a performance record that was acceptable. The Independent Board Members also concluded that the Fund’s expense ratios and the profitability to the Adviser of managing the Fund were reasonable, and that economies of scale were not a significant factor in their thinking at this time. The Independent Board Members did not view the potential profitability of ancillary services as material to their decision. On the basis of the foregoing and without assigning particular weight to any single conclusion, the Independent Board Members determined to recommend continuation of the investment management agreement to the full Board.
Based on a consideration of all these factors in their totality, the Board Members, including all of the Independent Board Members, determined that each Fund’s advisory fee was fair and reasonable with respect to the quality of services provided and in light of the other factors described above that the Board deemed relevant. Accordingly, the Board Members determined to approve the continuation of each Fund’s Advisory Agreement. The Board Members based their decision on evaluations of all these factors as a whole and did not consider any one factor as all-important or controlling.
23
The Gabelli Global Content & Connectivity Fund
Additional Fund Information (Unaudited)
The business and affairs of the Fund are managed under the direction of the Corporation’s Board of Directors. Information pertaining to the Directors and officers of the Fund is set forth below. The Corporation’s Statement of Additional Information includes additional information about the Fund’s Directors and is available without charge, upon request, by calling 800-GABELLI (800-422-3554) or by writing to The Gabelli Global Content & Connectivity Fund at One Corporate Center, Rye, NY 10580-1422.
| | | | | | | | |
Name, Position(s) Address1 and Age | | Term of Office and Length of Time Served2 | | Number of Funds in Fund Complex Overseen by Director | | Principal Occupation(s) During Past Five Years | | Other Directorships Held by Director3 |
| | | | |
INTERESTED DIRECTORS4: | | | | | | | | |
Mario J. Gabelli, CFA Director and Chief Investment Officer Age: 75 | | Since 1993 | | 32 | | Chairman, Chief Executive Officer, and Chief Investment Officer– Value Portfolios of GAMCO Investors, Inc. and Chief Investment Officer– Value Portfolios of Gabelli Funds, LLC and GAMCO Asset Management Inc.; Director/ Trustee or Chief Investment Officer of other registered investment companies within the Gabelli/GAMCO Fund Complex; Chief Executive Officer of GGCP, Inc.; Executive Chairman of Associated Capital Group, Inc. | | Director of Morgan Group Holdings, Inc. (holding company); Chairman of the Board and Chief Executive Officer of LICT Corp. (multimedia and communication services company); Director of CIBL, Inc. (broadcasting and wireless communications); Director of ICTC Group Inc. (communications) |
John D. Gabelli Director Age: 73 | | Since 1993 | | 10 | | Senior Vice President of G.research, LLC | | — |
INDEPENDENT DIRECTORS5: | | | | | | | | |
E. Val Cerutti Director Age: 78 | | Since 2001 | | 7 | | Chief Executive Officer of Cerutti Consultants, Inc. | | Director of The LGL Group, Inc. (diversified manufacturing) (1990-2009) |
Anthony J. Colavita Director Age: 82 | | Since 1993 | | 28 | | President of the law firm of Anthony J. Colavita, P.C. | | — |
Arthur V. Ferrara Director Age: 87 | | Since 2001 | | 8 | | Former Chairman of the Board and Chief Executive Officer of The Guardian Life Insurance Company of America (1993-1995) | | — |
Werner J. Roeder Director Age: 77 | | Since 1993 | | 23 | | Retired physician; Former Vice President of Medical Affairs (Medical Director) of New York Presbyterian/Lawrence Hospital (1999-2014) | | — |
Anthonie C. van Ekris Director Age: 83 | | Since 1993 | | 22 | | Chairman and Chief Executive Officer of BALMAC International, Inc. (global import/ export company) | | — |
Salvatore J. Zizza Director Age: 72 | | Since 2004 | | 30 | | President of Zizza & Associates Corp. (private holding company); Chairman of Harbor Diversified, Inc. (pharmaceuticals); Chairman of BAM (semiconductor and aerospace manufacturing); Chairman of Bergen Cove Realty Inc.; Chairman of Metropolitan Paper Recycling Inc. (recycling) (2005-2014) | | Director and Vice Chairman of Trans-Lux Corporation (business services); Director and Chairman of Harbor Diversified Inc. (pharmaceuticals) |
24
The Gabelli Global Content & Connectivity Fund
Additional Fund Information (Continued) (Unaudited)
| | | | | | |
Name, Position(s) Address1 and Age | | Term of Office and Length of Time Served2 | | | | Principal Occupation(s) During Past Five Years |
| | | |
OFFICERS: | | | | | | |
| | | |
Bruce N. Alpert President Age: 66 | | Since 2003 | | | | Executive Vice President and Chief Operating Officer of Gabelli Funds, LLC since 1988; Officer of registered investment companies within the Gabelli/GAMCO Fund Complex; Senior Vice President of GAMCO Investors, Inc. since 2008 |
| | | |
John C. Ball Treasurer Age: 41 | | Since 2017 | | | | Treasurer of all the registered investment companies within the Gabelli/GAMCO Fund Complex since 2017; Vice President and Assistant Treasurer of AMG Funds, 2014-2017; Vice President of State Street Corporation, 2007-2014 |
| | | |
Agnes Mullady Vice President Age: 59 | | Since 2006 | | | | Officer of all of the registered investment companies within the Gabelli/GAMCO Fund Complex since 2006; President and Chief Operating Officer of the Fund Division of Gabelli Funds, LLC since 2015; Chief Executive Officer of G.distributors, LLC since 2010; Senior Vice President of GAMCO Investors, Inc. since 2009; Vice President of Gabelli Funds, LLC since 2007; Executive Vice President of Associated Capital Group, Inc. since 2016 |
| | | |
Andrea R. Mango Secretary Age: 45 | | Since 2013 | | | | Vice President of GAMCO Investors, Inc. since 2016; Counsel of Gabelli Funds, LLC since 2013; Secretary of all registered investment companies within the Gabelli/GAMCO Fund Complex since 2013; Vice President of all closed-end funds within the Gabelli/GAMCO Fund Complex since 2014; Corporate Vice President within the Corporate Compliance Department of New York Life Insurance Company, 2011-2013 |
| | | |
Richard J. Walz Chief Compliance Officer Age: 58 | | Since 2013 | | | | Chief Compliance Officer of all of the registered investment companies within the Gabelli/ GAMCO Fund Complex since 2013; Chief Compliance Officer of AEGON USA Investment Management, 2011-2013 |
| 1 | Address: One Corporate Center, Rye, NY 10580-1422, unless otherwise noted. |
| 2 | Each Director will hold office for an indefinite term until the earliest of (i) the next meeting of shareholders, if any, called for the purpose of considering the election or re-election of such Director and until the election and qualification of his or her successor, if any, elected at such meeting, or (ii) the date a Director resigns or retires, or a Director is removed by the Board of Directors or shareholders, in accordance with the Corporation’s By-Laws and Articles of Incorporation. Each officer will hold office for an indefinite term until the date he or she resigns or retires or until his or her successor is elected and qualified. |
| 3 | This column includes only directorships of companies required to report to the SEC under the Securities Exchange Act of 1934, as amended, i.e., public companies, or other investment companies registered under the 1940 Act. |
| 4 | “Interested person” of the Corporation as defined in the 1940 Act. Messrs. Mario J. Gabelli and John D. Gabelli, who are brothers, are each considered an “interested person” because of their affiliation with Gabelli Funds, LLC which acts as the Corporation’s investment adviser. |
| 5 | Directors who are not interested persons are considered “Independent” Directors. |
| | We have separated the portfolio managers’ commentary from the financial statements and investment portfolio due to corporate governance regulations stipulated by the Sarbanes-Oxley Act of 2002. We have done this to ensure that the content of the portfolio managers’ commentary is unrestricted. Both the commentary and the financial statements, including the portfolio of investments, will be available on our website at www.gabelli.com. | |
25
THE GABELLI GLOBAL CONTENT & CONNECTIVITY FUND
One Corporate Center
Rye, NY 10580-1422
Portfolio Management Team Biographies
Mario J. Gabelli, CFA, is Chairman, Chief Executive Officer, and Chief Investment Officer - Value Portfolios of GAMCO Investors, Inc. that he founded in 1977, and Chief Investment Officer - Value Portfolios of Gabelli Funds, LLC and GAMCO Asset Management Inc. He is also Executive Chairman of Associated Capital Group, Inc. Mr. Gabelli is a summa cum laude graduate of Fordham University and holds an MBA degree from Columbia Business School and Honorary Doctorates from Fordham University and Roger Williams University.
Evan D. Miller, CFA, joined G.research, LLC in 2002 as a research analyst following the telecommunications industry on a global basis. Currently, he continues to specialize in the industry and also serves as a portfolio manager of Gabelli Funds, LLC and of the Fund. Prior to joining Gabelli, his career spanned nearly a quarter century in the telecommunications industry with corporate strategy and business development positions. Mr. Miller holds an MBA in Finance from the University of Chicago and a BA in Economics from Northwestern University.
Sergey Dluzhevskiy, CFA, CPA, joined G.research, LLC in 2005 as a research analyst covering the North American telecommunications industry. Currently, he continues to specialize in the industry and also serves as a portfolio manager of Gabelli Funds, LLC and of the Fund. Prior to joining Gabelli, Mr. Dluzhevskiy was a senior accountant at Deloitte. He received his undergraduate degree from Case Western Reserve University and an MBA at the Wharton School of the University of Pennsylvania.
Brett Harris joined G. Research as a research analyst in 2008 covering Media and Entertainment. Currently, he oversees the digital research team responsible for covering the Telecommunication, Media, Technology, and Gaming & Lodging industries, and also serves as a portfolio manager of Gabelli Funds, LLC and the Fund. Previously, he worked as a financial analyst at JetBlue and as an investment banker at JPMorgan Chase. Brett received his BA from Columbia University in Economics in 2003 and his MBA from Columbia Business School in 2008 in Finance and Economics.
2017 TAX NOTICE TO SHAREHOLDERS (Unaudited)
For the year ended December 31, 2017, the Fund paid to shareholders ordinary income distributions (comprised of net investment income and short term capital gains) totaling $0.141, $0.142, $0.004, $0.293, and $0.172, per share for Class AAA, Class A, Class C, Class I, and Class T Shares, respectively, and long term capital gains totaling $5,298,429, or the maximum allowable. The distribution of long term capital gains has been designated as a capital gain dividend by the Fund’s Board of Directors. For the year ended December 31, 2017, 80.56% of the ordinary income distribution qualifies for the dividends received deduction available to corporations. The Fund designates 100% of the ordinary income distribution as qualified dividend income pursuant to the Jobs and Growth Tax Relief Reconciliation Act of 2003. The Fund designates 0.15% of the ordinary income distribution as qualified interest income pursuant to the Tax Relief, Unemployment Reauthorization, and Job Creation Act of 2010. Also for the year 2017, the Fund did not have foreign tax credits.
U.S. Government Income:
The percentage of the ordinary income distribution paid by the Fund during the year ended December 31, 2017 which was derived from U.S. Treasury securities was 0.12%. Such income is exempt from state and local tax in all states. However, many states, including New York and California, allow a tax exemption for a portion of the income earned only if a mutual fund has invested at least 50% of its assets at the end of each quarter of the Fund’s fiscal year in U.S. Government securities. The Fund did not meet this strict requirement in 2017. The percentage of U.S. Government securities held as of December 31, 2017 was 0.82%. Due to the diversity in state and local tax law, it is recommended that you consult your personal tax adviser as to the applicability of the information provided to your specific situation.
GAMCO Global Series Funds, Inc.
THE GABELLI GLOBAL CONTENT & CONNECTIVITY FUND
One Corporate Center
Rye, New York 10580-1422
| t | 800-GABELLI (800-422-3554) |
Net Asset Value per share available daily
by calling 800-GABELLI after 7:00 P.M.
| | |
BOARD OF DIRECTORS | | OFFICERS |
Mario J. Gabelli, CFA Chairman and Chief Executive Officer, GAMCO Investors, Inc. Executive Chairman, Associated Capital Group, Inc. | | Bruce N. Alpert President John C. Ball Treasurer Agnes Mullady Vice President Andrea R. Mango Secretary Richard J. Walz Chief Compliance Officer |
E. Val Cerutti Chief Executive Officer, Cerutti Consultants, Inc. | |
Anthony J. Colavita President, Anthony J. Colavita, P.C. | | DISTRIBUTOR G.distributors, LLC |
Arthur V. Ferrara Former Chairman and Chief Executive Officer, Guardian Life Insurance Company of America | | CUSTODIAN State Street Bank and Trust Company |
John D. Gabelli Senior Vice President, G.research, LLC | | TRANSFER AGENT AND DIVIDEND DISBURSING AGENT DST Asset Manager Solutions, Inc. |
Werner J. Roeder Former Medical Director, Lawrence Hospital Anthonie C. van Ekris Chairman, BALMAC International, Inc. Salvatore J. Zizza Chairman, Zizza & Associates Corp. | | LEGAL COUNSEL Skadden, Arps, Slate, Meagher & Flom LLP |
| | |
This report is submitted for the general information of the shareholders of The Gabelli Global Content & Connectivity Fund. It is not authorized for distribution to prospective investors unless preceded or accompanied by an effective prospectus. |
|
| GAB401Q417AR |

Item 2. Code of Ethics.
| | (a) | The registrant, as of the end of the period covered by this report, has adopted a code of ethics that applies to the registrant’s principal executive officer, principal financial officer, principal accounting officer or controller, or persons performing similar functions, regardless of whether these individuals are employed by the registrant or a third party. |
| | (c) | There have been no amendments, during the period covered by this report, to a provision of the code of ethics that applies to the registrant’s principal executive officer, principal financial officer, principal accounting officer or controller, or persons performing similar functions, regardless of whether these individuals are employed by the registrant or a third party, and that relates to any element of the code of ethics description. |
| | (d) | The registrant has not granted any waivers, including an implicit waiver, from a provision of the code of ethics that applies to the registrant’s principal executive officer, principal financial officer, principal accounting officer or controller, or persons performing similar functions, regardless of whether these individuals are employed by the registrant or a third party, that relates to one or more of the items set forth in paragraph (b) of this item’s instructions. |
Item 3. Audit Committee Financial Expert.
As of the end of the period covered by the report, the registrant’s Board of Directors has determined that Salvatore J. Zizza is qualified to serve as an audit committee financial expert serving on its audit committee and that he is “independent,” as defined by Item 3 of Form N-CSR.
Item 4. Principal Accountant Fees and Services.
Audit Fees
| | (a) | The aggregate fees billed for each of the last two fiscal years for professional services rendered by the principal accountant for the audit of the registrant’s annual financial statements or services that are normally provided by the accountant in connection with statutory and regulatory filings or engagements for those fiscal years are $109,600 for 2016 and $109,600 for 2017. |
Audit-Related Fees
| | (b) | The aggregate fees billed in each of the last two fiscal years for assurance and related services by the principal accountant that are reasonably related to the performance of the audit of the registrant’s financial statements and are not reported under paragraph (a) of this Item are $0 for 2016 and $0 for 2017. |
Tax Fees
| | |
(c) | | The aggregate fees billed in each of the last two fiscal years for professional services rendered by the principal accountant for tax compliance, tax advice, and tax planning are $14,800 for 2016 and $14,800 for 2017. Tax fees represent tax compliance services provided in connection with the review of the Registrant’s tax returns. |
All Other Fees
| | |
(d) | | The aggregate fees billed in each of the last two fiscal years for products and services provided by the principal accountant, other than the services reported in paragraphs (a) through (c) of this Item are $2,660 for 2016 and $2,766 for 2017. The fees relate to Passive Foreign Investment Company identification database subscription fees billed on an annual basis. |
| |
(e)(1) | | Disclose the audit committee’s pre-approval policies and procedures described in paragraph (c)(7) of Rule 2-01 of Regulation S-X. |
| |
| | Pre-Approval Policies and Procedures. The Audit Committee (“Committee”) of the registrant is responsible for pre-approving (i) all audit and permissible non-audit services to be provided by the independent registered public accounting firm to the registrant and (ii) all permissible non-audit services to be provided by the independent registered public accounting firm to the Adviser, Gabelli Funds, LLC, and any affiliate of Gabelli Funds, LLC (“Gabelli”) that provides services to the registrant (a “Covered Services Provider”) if the independent registered public accounting firm’s engagement related directly to the operations and financial reporting of the registrant. The Committee may delegate its responsibility to pre-approve any such audit and permissible non-audit services to the Chairperson of the Committee, and the Chairperson must report to the Committee, at its next regularly scheduled meeting after the Chairperson’s pre-approval of such services, his or her decision(s). The Committee may also establish detailed pre-approval policies and procedures for pre-approval of such services in accordance with applicable laws, including the delegation of some or all of the Committee’s pre-approval responsibilities to the other persons (other than Gabelli or the registrant’s officers). Pre-approval by the Committee of any permissible non-audit services is not required so long as: (i) the permissible non-audit services were not recognized by the registrant at the time of the engagement to be non-audit services; and (ii) such services are promptly brought to the attention of the Committee and approved by the Committee or Chairperson prior to the completion of the audit. |
| |
(e)(2) | | The percentage of services described in each of paragraphs (b) through (d) of this Item that were approved by the audit committee pursuant to paragraph (c)(7)(i)(C) of Rule 2-01 of Regulation S-X are as follows: |
(b) N/A
(c) 100%
(d) 100%
| | |
| |
(f) | | The percentage of hours expended on the principal accountant’s engagement to audit the registrant’s financial statements for the most recent fiscal year that were attributed to work performed by persons other than the principal accountant’s full-time, permanent employees was 0%. |
| | (g) | The aggregate non-audit fees billed by the registrant’s accountant for services rendered to the registrant, and rendered to the registrant’s investment adviser (not including any sub-adviser whose role is primarily portfolio management and is subcontracted with or overseen by another investment adviser), and any entity controlling, controlled by, or under common control with the adviser that provides ongoing services to the registrant for each of the last two fiscal years of the registrant was $46,421 for 2016 and $48,086 for 2017. |
| | (h) | The registrant’s audit committee of the board of directors has considered whether the provision of non-audit services that were rendered to the registrant’s investment adviser (not including any sub-adviser whose role is primarily portfolio management and is subcontracted with or overseen by another investment adviser), and any entity controlling, controlled by, or under common control with the investment adviser that provides ongoing services to the registrant that were not pre-approved pursuant to paragraph (c)(7)(ii) of Rule 2-01 of Regulation S-X is compatible with maintaining the principal accountant’s independence. |
Item 5. Audit Committee of Listed Registrants.
Not applicable.
Item 6. Investments.
(a) | Schedule of Investments in securities of unaffiliated issuers as of the close of the reporting period is included as part of the report to shareholders filed under Item 1 of this form. |
Item 7. | Disclosure of Proxy Voting Policies and Procedures for Closed-End Management Investment Companies. |
Not applicable.
Item 8. Portfolio Managers of Closed-End Management Investment Companies.
Not applicable.
Item 9. | Purchases of Equity Securities by Closed-End Management Investment Company and Affiliated Purchasers. |
Not applicable.
Item 10. Submission of Matters to a Vote of Security Holders.
There have been no material changes to the procedures by which the shareholders may recommend nominees to the registrant’s Board of Directors, where those changes were implemented after the registrant last provided disclosure in response to the requirements of Item 407(c)(2)(iv) of Regulation S-K (17 CFR 229.407) (as required by Item 22(b)(15) of Schedule 14A (17 CFR 240.14a-101)), or this Item.
Item 11. Controls and Procedures.
| | (a) | The registrant’s principal executive and principal financial officers, or persons performing similar functions, have concluded that the registrant’s disclosure controls and procedures (as defined in Rule 30a-3(c) under the Investment Company Act of 1940, as amended (the “1940 Act”) (17 CFR 270.30a-3(c))) are effective, as of a date within 90 days of the filing date of the report that includes the disclosure required by this paragraph, based on their evaluation of these controls and procedures required by Rule 30a-3(b) under the 1940 Act (17 CFR 270.30a-3(b)) and Rules 13a-15(b) or 15d-15(b) under the Securities Exchange Act of 1934, as amended (17 CFR 240.13a-15(b) or 240.15d-15(b)). |
| | (b) | There were no changes in the registrant’s internal control over financial reporting (as defined in Rule 30a-3(d) under the 1940 Act (17 CFR 270.30a-3(d))) that occurred during the registrant’s last fiscal quarter that has materially affected, or is reasonably likely to materially affect, the registrant’s internal control over financial reporting. |
Item 12. | Disclosure of Securities Lending Activities for Closed-End Management Investment Companies. |
Not applicable.
Item 13. Exhibits.
| | |
| |
(a)(1) | | Code of ethics, or any amendment thereto, that is the subject of disclosure required by Item 2 is attached hereto. |
| |
(a)(2) | | Certifications pursuant to Rule 30a-2(a) under the 1940 Act and Section 302 of the Sarbanes-Oxley Act of 2002 are attached hereto. |
| |
(a)(3) | | Not applicable. |
| |
(a)(4) | | Not applicable. |
| |
(b) | | Certifications pursuant to Rule 30a-2(b) under the 1940 Act and Section 906 of the Sarbanes- Oxley Act of 2002 are attached hereto. |
SIGNATURES
Pursuant to the requirements of the Securities Exchange Act of 1934 and the Investment Company Act of 1940, the registrant has duly caused this report to be signed on its behalf by the undersigned, thereunto duly authorized.
| | | | |
(Registrant) | | GAMCO Global Series Funds, Inc. | | |
| | | | |
| | |
By (Signature and Title)* | | /s/ Bruce N. Alpert | | |
| | Bruce N. Alpert, Principal Executive Officer | | |
| | | | |
|
Pursuant to the requirements of the Securities Exchange Act of 1934 and the Investment Company Act of 1940, this report has been signed below by the following persons on behalf of the registrant and in the capacities and on the dates indicated. |
| | |
By (Signature and Title)* | | /s/ Bruce N. Alpert | | |
| | Bruce N. Alpert, Principal Executive Officer | | |
| | | | |
| | |
By (Signature and Title)* | | /s/ John C. Ball | | |
| | John C. Ball, Principal Financial Officer and Treasurer | | |
* Print the name and title of each signing officer under his or her signature.