UNITED STATES
SECURITIES AND EXCHANGE COMMISSION
Washington, D.C. 20549
FORMN-CSR
CERTIFIED SHAREHOLDER REPORT OF REGISTERED MANAGEMENT
INVESTMENT COMPANIES
Investment Company Act file number 811-07896
GAMCO Global Series Funds, Inc.
(Exact name of registrant as specified in charter)
One Corporate Center
Rye, New York 10580-1422
(Address of principal executive offices) (Zip code)
Bruce N. Alpert
Gabelli Funds, LLC
One Corporate Center
Rye, New York 10580-1422
(Name and address of agent for service)
Registrant’s telephone number, including area code: 1-800-422-3554
Date of fiscal year end: December 31
Date of reporting period: December 31, 2019
FormN-CSR is to be used by management investment companies to file reports with the Commission not later than 10 days after the transmission to stockholders of any report that is required to be transmitted to stockholders under Rule30e-1 under the Investment Company Act of 1940 (17 CFR270.30e-1). The Commission may use the information provided on FormN-CSR in its regulatory, disclosure review, inspection, and policymaking roles.
A registrant is required to disclose the information specified by FormN-CSR, and the Commission will make this information public. A registrant is not required to respond to the collection of information contained in FormN-CSR unless the Form displays a currently valid Office of Management and Budget (“OMB”) control number. Please direct comments concerning the accuracy of the information collection burden estimate and any suggestions for reducing the burden to Secretary, Securities and Exchange Commission, 450 Fifth Street, NW, Washington, DC 20549-0609. The OMB has reviewed this collection of information under the clearance requirements of 44 U.S.C. § 3507.
Item 1. Reports to Stockholders.
The Report to Shareholders is attached herewith.
The Gabelli Global Content & Connectivity Fund
Annual Report — December 31, 2019
(Y)our Portfolio Management Team
| | | | | | |
 | |  | |  | |  |
Mario J. Gabelli, CFA Chief Investment Officer | | Evan D. Miller, CFA Portfolio Manager BA, Northwestern UniversityMBA, Booth School of Business,University of Chicago | | Sergey Dluzhevskiy, CFA, CPA Portfolio Manager BS, Case Western Reserve University MBA, The Wharton School, University of Pennsylvania | | Brett Harriss Portfolio Manager BA, Columbia University MBA, Columbia BusinessSchool, ColumbiaUniversity |
To Our Shareholders,
For the year ended December 31, 2019, the net asset value (NAV) per Class AAA Share of The Gabelli Global Content & Connectivity Fund increased 15.6% compared with an increase of 25.1% for the Morgan Stanley Capital International (MSCI) All Country (AC) World Communication Services Index. Other classes of shares are available. See page 3 for performance information for all classes.
Enclosed are the financial statements, including the schedule of investments, as of December 31, 2019.
Performance Discussion (Unaudited)
The Fund’s objective is to provide investors with appreciation of capital. Current income is a secondary objective of the Fund.
The Fund’s investment strategy is to invest its net assets in common stocks of companies in the telecommunications, media, and information technology industries which Gabelli Funds, LLC, the Adviser believes are likely to have rapid growth in revenues and earnings and potential for above average capital appreciation or are undervalued. In accordance with its concentration policy, the Fund will invest at least 25% of the value of its total assets in the telecommunications related industry, and not invest more than 25% of the value of its total assets in any other particular industry.
|
Beginning on January 1, 2021, as permitted by regulations adopted by the Securities and Exchange Commission, paper copies of the Fund’s annual and semiannual shareholder reports will no longer be sent by mail, unless you specifically request paper copies of the reports. Instead, the reports will be made available on the Fund’s website (www.gabelli.com), and you will be notified by mail each time a report is posted and provided with a website link to access the report. If you already elected to receive shareholder reports electronically, you will not be affected by this change and you need not take any action. To elect to receive all future reports on paper free of charge, please contact your financial intermediary, or, if you invest directly with the Fund, you may call800-422-3554 or send an email request to info@gabelli.com. |
Global equities rebounded from a challenging fourth quarter, with the MSCI AC World Index up 12.3% in the first quarter of 2019. The stock market rally was largely driven by indications from central banks in the U.S. and Europe that monetary tightening was unlikely in the near-term as well as signs of progress in the U.S. - China trade negotiations. Information Technology was the best performing sector, up 18.9%, followed by real estate (+16.2%), helped by expectations that interest rates may remain at levels lower than previously anticipated, and energy (+14.3%), driven by higher oil prices. The communications sector (up 11.2% in the quarter) held its own, with North America (+13.9%) leading all geographic regions.
Global equities rose in the second quarter, with MSCI AC World Index up 3.8%, on continued dovishness from major central banks as well as renewed hopes for the U.S. – China trade deal after Presidents Donald Trump and Xi Jinping agreed to restart negotiations (with no near-term escalation in tariffs) at the G20 meeting in Osaka. Financials (led by JP Morgan Chase and Citigroup) was the best performing sector in the quarter, up 6.1%, followed by Information Technology (+5.3%), and Consumer Discretionary (+4.6%). Communication Services sector was in the “middle of the pack,” up 3.4% in the second quarter.
MSCI AC World Index was essentially flat for the third quarter, reflecting a mixed quarter for global equities (with developed markets registering modest gains and emerging markets declining), amidst continued concerns over the U.S. - China trade dispute and global growth, while central banks in the U.S. and Europe remained largely accommodative. Utilities was the best performing sector in the quarter, up 5.6%, followed by Consumer Staples (+3.7%), Real Estate (+3.0%), and Information Technology (+2.7%). Communication Services sector was in the “middle of the pack,” up 0.4% in the third quarter.
MSCI AC World Index recorded a robust fourth quarter, with strong gains across all major geographies. Although much of the focus has been on the U.S. market reaching record highs, the 9.0% gain in the MSCI AC World Index was achieved with reasonably consistent contributions from North America (+8.9%), Europe (+8.9%), Latin America (+10.5%), Japan (+7.5%), and Asia,ex-Japan (+10.4%). The first phase of the trade deal between the U.S. and China was certainly a contributor to the global equities rally in the quarter, as was the perceived lower risk of global recession heading into 2020. Information Technology was the best performing sector in the quarter, up 14.6%, followed by Health Care (+13.8%), Materials (+9.4%), and Financials (9.0%). Communication Services, up 8.3%, closed out the Top 5.
Selected holdings that contributed positively to performance in 2019 were:
Facebook Inc. (4.2% of net assets as of December 31, 2019) is an online social networking and social media service with over 2.4 billion monthly active users. Revenues were up 29% year over year to $17.6 billion, while operating margin was at 41%. Daily active users were up 9% (to 2.45 billion); Comcast Corp. (4.6%) is a television and broadband provider in the U.S., UK, Italy and Germany. The introduction of the industry leading X1 platform has helped Comcast gain video subscribers in the US while a reinvestment in content and more focused leadership have improved NBC’s viewership and profitability; and Alphabet Inc. (5.1%) is an umbrella company whose subsidiaries include the core Google business (the Google search engine and related ad revenue, Android, YouTube) as well as multiple independent companies, such as Google Ventures, Waymo, and Verily. Total revenue was up 20%. At Google (core business), website revenue was up 19% (to $29 billion), led by an 18% improvement in paid clicks, with the cost per click falling by 2% due to the mix shift towards mobile search.
Some of our weaker performing stocks during the year:
Telephone and Data Systems (2.0%) provides wireless, cable and wireline broadband, TV, voice, and hosted and managed services in the United States. Down largely due to investor disappointment that USM is
2
not planning to sell its wireless towers in the near term and weaker than expected postpaid wireless net additions were a contributing factor as well; U.S. Cellular Corp. (1.6%) is a mobile network operator which owns and operates the fifth largest wireless telecommunications network in the U.S. Share weakness was largely driven by wide 2019 EBITDA guidance range; and Uniti Group Inc. (no longer held) an internally managed real estate investment trust, and is a leading provider of wireless infrastructure solutions for the communications industry. The company was impacted by its largest tenant, Windstream, filing for bankruptcy in early 2019 as well as by the ongoing dispute about the nature of Windstream’s lease and risk that related master lease payments might be reduced.
Thank you for your investment in The Gabelli Global Content and Connectivity Fund.
We appreciate your confidence and trust.
Comparative Results
Average Annual Returns through December 31, 2019 (a) (Unaudited)
| | | | | | | | | | | | | | | | | | | | |
| | | 1 Year | | | 5 Year | | | 10 Year | | | 15 Year | | | Since
Inception
(11/1/93) | |
Class AAA (GABTX) | | | 15.62 | % | | | 2.95 | % | | | 5.03 | % | | | 4.36 | % | | | 6.88 | % |
MSCI AC World Telecommunication Services Index (b) | | | 25.09 | | | | 4.97 | | | | 6.72 | | | | 5.97 | | | | N/A | |
MSCI AC World Index | | | 26.60 | | | | 8.41 | | | | 8.79 | | | | 6.86 | | | | 7.20 | (c) |
Class A (GTCAX) | | | 15.64 | | | | 2.92 | | | | 5.01 | | | | 4.35 | | | | 6.87 | |
With sales charge (d) | | | 8.99 | | | | 1.71 | | | | 4.39 | | | | 3.94 | | | | 6.63 | |
Class C (GTCCX) | | | 14.81 | | | | 2.19 | | | | 4.25 | | | | 3.58 | | | | 6.28 | |
With contingent deferred sales charge (e) | | | 13.81 | | | | 2.19 | | | | 4.25 | | | | 3.58 | | | | 6.28 | |
Class I (GTTIX) | | | 16.42 | | | | 3.50 | | | | 5.44 | | | | 4.67 | | | | 7.06 | |
In the current prospectuses dated April 30, 2019, as amended by the supplement dated December 3, 2019, the gross expense ratios for Class AAA, A, C, and I Shares are 1.73%, 1.73%, 2.48%, and 1.48%, respectively, and the net expense ratio for all share classes after contractual reimbursements by Gabelli Funds, LLC, (the Adviser) is 0.91%. See page 13 for the expense ratios for the year ended December 31, 2019. The contractual reimbursements are in effect through April 30, 2021. Class AAA and Class I Shares do not have a sales charge. The maximum sales charge for Class A Shares, and Class C Shares is 5.75%, and 1.00%, respectively.
| | (a) | Returns represent past performance and do not guarantee future results. Total returns and average annual returns reflect changes in share price, reinvestment of distributions, and are net of expenses. Investment returns and the principal value of an investment will fluctuate. When shares are redeemed, they may be worth more or less than their original cost. Current performance may be lower or higher than the performance data presented. Visit www.gabelli.com for performance information as of the most recent month end. Returns for Class I Shares would have been lower had the Adviser not reimbursed certain expenses. The Fund imposes a 2% redemption fee on shares sold or exchanged within seven days of purchase. Investors should carefully consider the investment objectives, risks, charges, and expenses of the Fund before investing. The prospectuses contain information about these and other matters and should be read carefully before investing. To obtain a prospectus, please visit our website at www.gabelli.com.Investing in foreign securities involves risks not ordinarily associated with investments in domestic issues, including currency fluctuation, economic, and political risks. The Class AAA Share NAVs are used to calculate performance for the periods prior to the issuance of Class A Shares, Class C Shares, and Class I Shares on March 12, 2000, June 2, 2000, and January 11, 2008, respectively. The actual performance for the Class A Shares and Class C Shares would have been lower due to the additional fees and expenses associated with these classes of shares. The actual performance of the Class I Shares would have been higher due to lower expenses related to this class of shares. The MSCI AC World Telecommunication Services Index is an unmanaged index that measures the performance of the global telecommunication securities from around the world. The MSCI AC World Index is an unmanaged market capitalization weighted index that is designed to measure the equity market performance of developed and emerging markets. The MSCI AC World Index consists of 45 country indices comprising 24 developed and 21 emerging market country indices. Dividends are considered reinvested. You cannot invest directly in an index. | |
| | (b) | MSCI AC World Telecommunication Services Index name changed to MSCI AC World Communication Services Index. | |
| | (c) | The MSCI AC World Index since inception performance is as of October 31, 1993. | |
| | (d) | Performance results include the effect of the maximum 5.75% sales charge at the beginning of the period. | |
| | (e) | Assuming payment of the 1% maximum contingent deferred sales charge imposed on redemptions made within one year of purchase. | |
3
COMPARISON OF CHANGE IN VALUE OF A $10,000 INVESTMENT IN
THE GABELLI GLOBAL CONTENT & CONECTIVITY FUND (CLASS AAA SHARES)
AND MSCI AC WORLD INDEX (Unaudited)
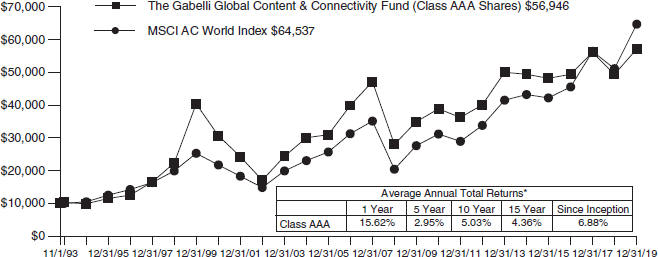
| * | Past performance is not predictive of future results. The performance tables and graph do not reflect the deduction of taxes that a shareholder would pay on Fund distributions or the redemption of Fund shares. |
4
The Gabelli Global Content & Connectivity Fund
| | | | |
| Disclosure of Fund Expenses (Unaudited) | | |
| For the Six Month Period from July 1, 2019 through December 31, 2019 | | Expense Table |
We believe it is important for you to understand the impact of fees and expenses regarding your investment. All mutual funds have operating expenses. As a shareholder of a fund, you incur ongoing costs, which include costs for portfolio management, administrative services, and shareholder reports (like this one), among others. Operating expenses, which are deducted from a fund’s gross income, directly reduce the investment return of a fund. When a fund’s expenses are expressed as a percentage of its average net assets, this figure is known as the expense ratio. The following examples are intended to help you understand the ongoing costs (in dollars) of investing in your Fund and to compare these costs with those of other mutual funds. The examples are based on an investment of $1,000 made at the beginning of the period shown and held for the entire period.
The Expense Table below illustrates your Fund’s costs in two ways:
Actual Fund Return:This section provides information about actual account values and actual expenses. You may use this section to help you to estimate the actual expenses that you paid over the period after any fee waivers and expense reimbursements. The “Ending Account Value” shown is derived from the Fund’sactualreturn during the past six months, and the “Expenses Paid During Period” shows the dollar amount that would have been paid by an investor who started with $1,000 in the Fund. You may use this information, together with the amount you invested, to estimate the expenses that you paid over the period.
To do so, simply divide your account value by $1,000 (for example, an $8,600 account value divided by $1,000 = 8.6), then multiply the result by the number given for your Fund under the heading “Expenses Paid During Period” to estimate the expenses you paid during this period.
Hypothetical 5% Return:This section provides information about hypothetical account values and hypothetical expenses based on the Fund’s actual expense
ratio. It assumes a hypothetical annualized return of 5% before expenses during the period shown. In this case – because the hypothetical return used isnotthe Fund’s actual return – the results do not apply to your investment and you cannot use the hypothetical account value and expense to estimate the actual ending account balance or expenses you paid for the period. This example is useful in making comparisons of the ongoing costs of investing in the Fund and other funds. To do so, compare this 5% hypothetical example with the 5% hypothetical examples that appear in shareholder reports of other funds.
Please note that the expenses shown in the table are meant to highlight your ongoing costs only and do not reflect any transactional costs such as sales charges (loads), redemption fees, or exchange fees, if any, which are described in the Prospectus. If these costs were applied to your account, your costs would be higher. Therefore, the 5% hypothetical return is useful in comparing ongoing costs only, and will not help you determine the relative total costs of owning different funds. The “Annualized Expense Ratio” represents the actual expenses for the last six months and may be different from the expense ratio in the Financial Highlights which is for the year ended December 31, 2019.
| | | | | | | | | | | | |
| | | Beginning
Account Value
07/01/19 | | Ending
Account Value
12/31/19 | | Annualized
Expense
Ratio | | | Expenses
Paid During
Period* | |
| The Gabelli Global Content & Connectivity Fund | |
Actual Fund Return | | | | | | | | |
Class AAA | | $1,000.00 | | $1,041.60 | | | 1.63% | | | | $ 8.39 | |
Class A | | $1,000.00 | | $1,041.10 | | | 1.62% | | | | $ 8.33 | |
Class C | | $1,000.00 | | $1,038.00 | | | 2.31% | | | | $ 11.87 | |
Class I | | $1,000.00 | | $1,044.80 | | | 0.98% | | | | $ 5.05 | |
Hypothetical 5% Return | | | | | | | | |
Class AAA | | $1,000.00 | | $1,016.99 | | | 1.63% | | | | $ 8.29 | |
Class A | | $1,000.00 | | $1,017.04 | | | 1.62% | | | | $ 8.24 | |
Class C | | $1,000.00 | | $1,013.56 | | | 2.31% | | | | $ 11.72 | |
Class I | | $1,000.00 | | $1,020.27 | | | 0.98% | | | | $ 4.99 | |
| * | Expenses are equal to the Fund’s annualized expense ratio for the last six months multiplied by the average account value over the period, multiplied by the number of days in the most recent fiscal half year (184 days), then divided by 365. |
5
Summary of Portfolio Holdings (Unaudited)
The following table presents portfolio holdings as a percent of net assets as of December 31, 2019:
The Gabelli Global Content & Connectivity Fund
| | | | |
Communication Services | | | 81.0 | % |
Information Technology | | | 6.0 | % |
Consumer Discretionary | | | 3.9 | % |
Financials | | | 3.9 | % |
Real Estate | | | 2.3 | % |
U.S. Government Obligations | | | 1.2 | % |
Industrials | | | 0.8 | % |
| | | | |
Health Care | | | 0.8 | % |
Consumer Staples | | | 0.2 | % |
Utilities | | | 0.0 | %* |
Other Assets and Liabilities (Net) | | | (0.1 | )% |
| | | | |
| | | 100.0 | % |
| | | | |
| * | Amount represents less than 0.05%. |
The Fund files a complete schedule of portfolio holdings with the Securities and Exchange Commission (the SEC) for the first and third quarters of each fiscal year on FormN-PORT. Shareholders may obtain this information at www.gabelli.com or by calling the Fund at800-GABELLI(800-422-3554). The Fund’s FormN-PORT is available on the SEC’s website at www.sec.gov and may also be reviewed and copied at the SEC’s Public Reference Room in Washington, DC. Information on the operation of the Public Reference Room may be obtained by calling800-SEC-0330.
Proxy Voting
The Fund files FormN-PX with its complete proxy voting record for the twelve months ended June 30, no later than August 31 of each year. A description of the Fund’s proxy voting policies, procedures, and how the Fund voted proxies relating to portfolio securities is available without charge, upon request, by (i) calling800-GABELLI(800-422-3554); (ii) writing to The Gabelli Funds at One Corporate Center, Rye, NY 10580-1422; or (iii) visiting the SEC’s website at www.sec.gov.
6
The Gabelli Global Content & Connectivity Fund
Schedule of Investments — December 31, 2019
| | | | | | | | | | | | |
Shares | | | | | Cost | | | Market
Value | |
| | | | COMMON STOCKS — 98.1% | |
| | | | COMMUNICATION SERVICES — 80.3% | |
| | | | Telecommunication Services — 41.8% | |
| | | | Wireless Telecommunication Services — 18.7% | |
| | | | Wireless Telecommunication Services — 18.7% | |
| | 62,500 | | | America Movil SAB de CV, Cl. L, ADR | | $ | 210,700 | | | $ | 1,000,000 | |
| | 4,500 | | | Anterix Inc.† | | | 166,779 | | | | 194,445 | |
| | 10,000 | | | Axiata Group Berhad | | | 7,116 | | | | 10,121 | |
| | 9,500 | | | China Mobile Ltd., ADR | | | 113,184 | | | | 401,565 | |
| | 72,808 | | | Econet Wireless Zimbabwe Ltd.† | | | 21,788 | | | | 6,373 | |
| | 17,500 | | | Gogo Inc.† | | | 93,514 | | | | 112,000 | |
| | 666 | | | Hutchison Telecommunications Hong Kong Holdings Ltd. | | | 63 | | | | 134 | |
| | 49,000 | | | KDDI Corp. | | | 386,824 | | | | 1,467,001 | |
| | 23,292 | | | Millicom International Cellular SA, SDR | | | 1,232,638 | | | | 1,115,567 | |
| | 16,200 | | | NTT DOCOMO Inc. | | | 251,251 | | | | 452,953 | |
| | 18,000 | | | PLDT Inc., ADR | | | 242,214 | | | | 359,820 | |
| | 240,000 | | | PT Indosat Tbk† | | | 38,553 | | | | 50,308 | |
| | 11,500 | | | Rogers Communications Inc., Cl. B | | | 37,946 | | | | 571,205 | |
| | 3,500 | | | Shenandoah Telecommunications Co. | | | 7,917 | | | | 145,635 | |
| | 45,000 | | | Sistema PJSC FC, GDR | | | 228,379 | | | | 219,330 | |
| | 14,000 | | | SK Telecom Co. Ltd., ADR | | | 213,315 | | | | 323,540 | |
| | 20,000 | | | SoftBank Group Corp. | | | 721,385 | | | | 875,431 | |
| | 40,000 | | | Sprint Corp.† | | | 202,752 | | | | 208,400 | |
| | 60,000 | | | TIM Participacoes SA | | | 123,340 | | | | 233,724 | |
| | 55,500 | | | T-Mobile US Inc.† | | | 1,546,591 | | | | 4,352,310 | |
| | 56,000 | | | Turkcell Iletisim Hizmetleri A/S, ADR | | | 277,945 | | | | 324,800 | |
| | 33,800 | | | United States Cellular Corp.† | | | 1,126,509 | | | | 1,224,574 | |
| | 140,000 | | | VEON Ltd., ADR | | | 223,340 | | | | 354,200 | |
| | 31,000 | | | Vodafone Group plc, ADR | | | 654,169 | | | | 599,230 | |
| | | | | | | | | | | | |
| | | | | | | 8,128,212 | | | | 14,602,666 | |
| | | | | | | | | | | | |
| | | | Diversified Telecommunication Services — 23.1% | |
| | | | Integrated Telecommunication Services — 19.9% | |
| | 9,500 | | | AT&T Inc. | | | 193,967 | | | | 371,260 | |
| | 1,900 | | | ATN International Inc. | | | 5,893 | | | | 105,241 | |
| | 37,415,054 | | | Cable & Wireless Jamaica Ltd.†(a) | | | 499,070 | | | | 409,347 | |
| | 16,400 | | | China Unicom Hong Kong Ltd., ADR | | | 104,722 | | | | 153,504 | |
| | 44,000 | | | Cincinnati Bell Inc.† | | | 289,030 | | | | 460,680 | |
| | 101,000 | | | Deutsche Telekom AG, ADR | | | 1,836,835 | | | | 1,645,290 | |
| | 3,107 | | | Hellenic Telecommunications Organization SA | | | 43,544 | | | | 49,698 | |
| | 2,000 | | | Hellenic Telecommunications Organization SA, ADR | | | 16,157 | | | | 16,140 | |
| | 15,000 | | | Koninklijke KPN NV | | | 39,437 | | | | 44,268 | |
| | | | | | | | | | | | |
Shares | | | | | Cost | | | Market
Value | |
| | 26,000 | | | Maroc Telecom | | $ | 426,215 | | | $ | 417,050 | |
| | 18,000 | | | Nippon Telegraph & Telephone Corp. | | | 165,752 | | | | 456,730 | |
| | 2,000 | | | Nippon Telegraph & Telephone Corp., ADR | | | 38,489 | | | | 101,000 | |
| | 20,500 | | | Nuvera Communications Inc. | | | 227,926 | | | | 389,500 | |
| | 453 | | | Oi SA, Cl. C, ADR† | | | 1,724 | | | | 422 | |
| | 2,000 | | | Orange SA, ADR | | | 28,867 | | | | 29,180 | |
| | 200,000 | | | Pakistan Telecommunication Co. Ltd. | | | 29,365 | | | | 12,088 | |
| | 90,000 | | | PCCW Ltd. | | | 74,681 | | | | 53,245 | |
| | 6,400 | | | Proximus SA | | | 185,008 | | | | 183,206 | |
| | 9,700 | | | PT Telekomunikasi Indonesia Persero Tbk, ADR | | | 21,613 | | | | 276,450 | |
| | 3,000 | | | Rostelecom PJSC, ADR | | | 20,044 | | | | 22,515 | |
| | 180,000 | | | Singapore Telecommunications Ltd. | | | 136,646 | | | | 451,020 | |
| | 9,800 | | | Swisscom AG, ADR | | | 235,828 | | | | 517,979 | |
| | 18,000 | | | Telecom Argentina SA, ADR | | | 66,803 | | | | 204,300 | |
| | 11,500 | | | Telecom Italia SpA, ADR† | | | 86,914 | | | | 71,070 | |
| | 5,021 | | | Telefonica Brasil SA, ADR | | | 27,844 | | | | 71,901 | |
| | 3,935 | | | Telefonica SA | | | 58,513 | | | | 27,485 | |
| | 77,000 | | | Telefonica SA, ADR | | | 246,054 | | | | 536,690 | |
| | 70,000 | | | Telekom Austria AG | | | 498,397 | | | | 571,621 | |
| | 123,000 | | | Telekom Malaysia Berhad | | | 114,886 | | | | 114,866 | |
| | 36,300 | | | Telenor ASA | | | 515,432 | | | | 651,013 | |
| | 60,000 | | | Telephone & Data Systems Inc. | | | 1,141,189 | | | | 1,525,800 | |
| | 128,000 | | | Telesites SAB de CV† | | | 97,176 | | | | 94,777 | |
| | 259,000 | | | Telia Co. AB | | | 556,485 | | | | 1,113,000 | |
| | 26,000 | | | TELUS Corp. | | | 284,822 | | | | 1,006,980 | |
| | 405,000 | | | True Corp. Public Co. Ltd. | | | 61,287 | | | | 62,196 | |
| | 53,300 | | | Verizon Communications Inc. | | | 1,673,375 | | | | 3,272,620 | |
| | | | | | | | | | | | |
| | | | | | | 10,049,990 | | | | 15,490,132 | |
| | | | | | | | | | | | |
| | | | Alternative Carriers — 3.2% | |
| | 106,000 | | | CenturyLink Inc. | | | 1,695,738 | | | | 1,400,260 | |
| | 300 | | | Iliad SA | | | 29,953 | | | | 38,884 | |
| | 22,500 | | | Intelsat SA† | | | 360,317 | | | | 158,175 | |
| | 28,000 | | | TIME dotCom Berhad | | | 56,823 | | | | 63,112 | |
| | 25,000 | | | Zayo Group Holdings Inc.† | | | 716,486 | | | | 866,250 | |
| | | | | | | | | | | | |
| | | | | | | 2,859,317 | | | | 2,526,681 | |
| | | | | | | | | | | | |
| | | | Media & Entertainment — 38.5% | |
| | | | Media — 25.9% | |
| | | | Cable & Satellite — 13.9% | | | | | |
| | 6,200 | | | Cogeco Inc. | | | 120,942 | | | | 496,983 | |
| | 79,800 | | | Comcast Corp., Cl. A | | | 2,430,616 | | | | 3,588,606 | |
| | 28,461 | | | DISH Network Corp., Cl. A† | | | 553,488 | | | | 1,009,512 | |
| | 280,000 | | | Dish TV India Ltd., GDR† | | | 271,241 | | | | 28,000 | |
| | 3,500 | | | GCI Liberty Inc., Cl. A† | | | 19,375 | | | | 247,975 | |
| | 184,000 | | | Grupo Televisa SAB, ADR | | | 2,266,000 | | | | 2,158,320 | |
| | 1,025 | | | Liberty Broadband Corp., Cl. A† | | | 1,876 | | | | 127,674 | |
See accompanying notes to financial statements.
7
The Gabelli Global Content & Connectivity Fund
Schedule of Investments (Continued) — December 31, 2019
| | | | | | | | | | | | |
Shares | | | | | Cost | | | Market
Value | |
| | | | COMMON STOCKS (Continued) | |
| | | | COMMUNICATION SERVICES (Continued) | |
| | | | Media & Entertainment (Continued) | |
| | | | Media (Continued) | | | | | | | | |
| | | | Cable & Satellite (Continued) | |
| | 1,000 | | | Liberty Broadband Corp.,
Cl. C† | | $ | 3,616 | | | $ | 125,750 | |
| | 14,840 | | | Liberty Global plc, Cl. A† | | | 181,787 | | | | 337,462 | |
| | 58,600 | | | Liberty Global plc, Cl. C† | | | 706,948 | | | | 1,277,187 | |
| | 1,000 | | | Liberty Latin America Ltd.,
Cl. A† | | | 13,803 | | | | 19,300 | |
| | 3,444 | | | Liberty Latin America Ltd.,
Cl. C† | | | 36,730 | | | | 67,020 | |
| | 15,500 | | | Liberty Media Corp. - Liberty | | | | | | | | |
| | | | SiriusXM, Cl. A† | | | 537,457 | | | | 749,270 | |
| | 12,000 | | | Liberty Media Corp. - Liberty | | | | | | | | |
| | | | SiriusXM, Cl. C† | | | 474,012 | | | | 577,680 | |
| | 2,000 | | | MultiChoice Group† | | | 13,807 | | | | 16,636 | |
| | | | | | | | | | | | |
| | | | | | | 7,631,698 | | | | 10,827,375 | |
| | | | | | | �� | | | | | |
| | | | Broadcasting — 12.0% | | | | | |
| | 1,400 | | | AMC Networks Inc., Cl. A† | | | 28,458 | | | | 55,300 | |
| | 300,000 | | | Corus Entertainment Inc., Cl. B | | | 1,099,064 | | | | 1,229,063 | |
| | 18,000 | | | Discovery Inc., Cl. A† | | | 337,965 | | | | 589,320 | |
| | 85,000 | | | Discovery Inc., Cl. C† | | | 1,672,913 | | | | 2,591,650 | |
| | 55,666 | | | Fox Corp., Cl. B. | | | 2,078,388 | | | | 2,026,242 | |
| | 11,000 | | | MSG Networks Inc., Cl. A† | | | 67,634 | | | | 191,400 | |
| | 3,000 | | | Nordic Entertainment Group AB, Cl. B | | | 63,636 | | | | 96,985 | |
| | 6,000 | | | Sinclair Broadcast Group Inc., Cl. A | | | 175,753 | | | | 200,040 | |
| | 9,000 | | | Tokyo Broadcasting System Holdings Inc. | | | 114,490 | | | | 154,563 | |
| | 54,070 | | | ViacomCBS Inc., Cl. B | | | 2,494,517 | | | | 2,269,318 | |
| | | | | | | | | | | | |
| | | | | | | 8,132,818 | | | | 9,403,881 | |
| | | | | | | | | | | | |
| | | | Interactive Media & Services — 9.4% | |
| | | | Interactive Media & Services — 9.4% | |
| | 3,000 | | | Alphabet Inc., Cl. C† | | | 3,121,332 | | | | 4,011,060 | |
| | 16,000 | | | Facebook Inc., Cl. A† | | | 2,638,926 | | | | 3,284,000 | |
| | | | | | | | | | | | |
| | | | | | | 5,760,258 | | | | 7,295,060 | |
| | | | | | | | | | | | |
| | | | Entertainment — 3.2% | | | | | |
| | | | Movies & Entertainment — 2.7% | | | | | |
| | 1,600 | | | Liberty Media Corp.- Liberty Braves, Cl. A† | | | 39,285 | | | | 47,440 | |
| | 10,500 | | | Liberty Media Corp.- Liberty Braves, Cl. C† | | | 206,736 | | | | 310,170 | |
| | 950 | | | Liberty Media Corp.- Liberty Formula One, Cl. A† | | | 1,143 | | | | 41,591 | |
| | 2,000 | | | Liberty Media Corp.- Liberty Formula One, Cl. C† | | | 4,491 | | | | 91,930 | |
| | 100 | | | Netflix Inc.† | | | 28,468 | | | | 32,357 | |
| | 4,000 | | | The Madison Square Garden Co., Cl. A† | | | 514,978 | | | | 1,176,760 | |
| | 2,674 | | | The Walt Disney Co. | | | 138,858 | | | | 386,741 | |
| | | | | | | | | | | | |
| | | | | | | 933,959 | | | | 2,086,989 | |
| | | | | | | | | | | | |
| | | | | | | | | | | | |
Shares | | | | | Cost | | | Market
Value | |
| | | | Interactive Home Entertainment — 0.5% | |
| | 3,000 | | | Modern Times Group MTG AB, Cl. B† | | $ | 45,669 | | | $ | 35,761 | |
| | 3,000 | | | Take-Two Interactive Software Inc.† | | | 293,129 | | | | 367,290 | |
| | | | | | | | | | | | |
| | | | | | 338,798 | | | 403,051 | |
| | | | | | | | | | | | |
| | | | TOTAL COMMUNICATION SERVICES | | | 43,835,050 | | | | 62,635,835 | |
| | | | | | | | | | | | |
| | | | INFORMATION TECHNOLOGY — 6.0% | |
| | | | Technology Hardware & Equipment — 1.7% | |
| | | | Technology Hardware, Storage & Peripherals — 1.3% | |
| | | | Technology hardware, Storage & Peripherals — 1.3% | |
| | 3,500 | | | Apple Inc. | | | 559,163 | | | | 1,027,775 | |
| | | | | | | | | | | | |
| | | | Electronic Equipment, Instruments & Components — 0.1% | |
| | | | Electronic Equipment & Instruments — 0.1% | |
| | 1,000 | | | Sony Corp., ADR | | | 52,638 | | | | 68,000 | |
| | | | | | | | | | | | |
| | | | Communications Equipment — 0.3% | |
| | | | Communications Equipment — 0.3% | |
| | 5,000 | | | EchoStar Corp., Cl. A† | | | 109,544 | | | | 216,550 | |
| | | | | | | | | | | | |
| | | | Software & Services — 3.6% | |
| | | | Software — 1.0% | | | | | | | | |
| | | | Systems Software — 0.4% | |
| | 2,000 | | | Microsoft Corp. | | | 152,364 | | | | 315,400 | |
| | | | | | | | | | | | |
| | | | Application Software — 0.6% | |
| | 35,000 | | | MiX Telematics Ltd., ADR | | | 593,390 | | | | 453,950 | |
| | | | | | | | | | | | |
| | | | IT Services — 2.6% | | | | | | | | |
| | | | IT Consulting & Other Services — 1.3% | |
| | 56,062 | | | Cassava SmarTech Zimbabwe Ltd.† | | | 85,775 | | | | 4,678 | |
| | 12,000 | | | InterXion Holding NV† | | | 145,827 | | | | 1,005,720 | |
| | | | | | | | | | | | |
| | | | | | | 231,602 | | | | 1,010,398 | |
| | | | | | | | | | | | |
| | | | Data Processing & Outsourced Services — 1.3% | |
| | 2,000 | | | Mastercard Inc., Cl. A | | | 292,729 | | | | 597,180 | |
| | 2,000 | | | Visa Inc., Cl. A | | | 218,924 | | | | 375,800 | |
| | | | | | | | | | | | |
| | | | | | | 511,653 | | | | 972,980 | |
| | | | | | | | | | | | |
| | | | Semiconductors & Semiconductor Equipment — 0.7% | |
| | | | Semiconductors & Semiconductor Equipment — 0.7% | |
| | | | Semiconductors — 0.7% | |
| | 15,000 | | | SMART Global Holdings Inc.† | | | 401,880 | | | | 569,100 | |
| | | | | | | | | | | | |
| | | | TOTAL INFORMATION TECHNOLOGY | | | 2,612,234 | | | | 4,634,153 | |
| | | | | | | | | | | | |
| | | | FINANCIALS — 3.9% | | | | | | | | |
| | | | Diversified Financials — 3.9% | |
| | | | Diversified Financial Services — 3.1% | |
| | | | Multi-Sector Holdings — 3.1% | |
| | 97,500 | | | First Pacific Co. Ltd. | | | 48,559 | | | | 33,158 | |
See accompanying notes to financial statements.
8
The Gabelli Global Content & Connectivity Fund
Schedule of Investments (Continued) — December 31, 2019
| | | | | | | | | | | | |
Shares | | | | | Cost | | | Market
Value | |
| | | | COMMON STOCKS (Continued) | | | | | | | | |
| | | | FINANCIALS (Continued) | | | | | | | | |
| | | | Diversified Financials (Continued) | | | | | |
| | | | Diversified Financial Services (Continued) | | | | | |
| | | | Multi-Sector Holdings (Continued) | | | | | |
| | 4,100 | | | First Pacific Co. Ltd., ADR | | $ | 3,337 | | | $ | 6,806 | |
| | 1,000 | | | Kinnevik AB, Cl. A | | | 33,558 | | | | 25,463 | |
| | 96,000 | | | Kinnevik AB, Cl. B | | | 2,341,640 | | | | 2,347,126 | |
| | 12,000 | | | Waterloo Investment Holdings Ltd.†(a) | | | 1,432 | | | | 2,520 | |
| | | | | | | | | | | | |
| | | | | | | 2,428,526 | | | | 2,415,073 | |
| | | | | | | | | | | | |
| | | | Consumer Finance — 0.8% | | | | | |
| | | | Consumer Finance — 0.8% | | | | | |
| | 5,000 | | | American Express Co. | | | 471,162 | | | | 622,450 | |
| | | | | | | | | | | | |
| | | | TOTAL FINANCIALS | | | 2,899,688 | | | | 3,037,523 | |
| | | | | | | | | | | | |
| | | | CONSUMER DISCRETIONARY —3.8% | | | | | |
| | | | Retailing — 2.6% | | | | | | | | |
| | | | Internet & Direct Marketing Retail — 2.6% | | | | | |
| | | | Internet & Direct Marketing Retail — 2.6% | | | | | |
| | 72 | | | Expedia Group Inc. | | | 6,881 | | | | 7,786 | |
| | 8,600 | | | Naspers Ltd., Cl. N | | | 1,883,150 | | | | 1,406,597 | |
| | 8,600 | | | Prosus NV† | | | 721,572 | | | | 641,792 | |
| | 2,000 | | | Qurate Retail Inc., Cl. A† | | | 15,202 | | | | 16,860 | |
| | | | | | | | | | | | |
| | | | | | | 2,626,805 | | | | 2,073,035 | |
| | | | | | | | | | | | |
| | | | Automobiles & Components — 1.2% | | | | | |
| | | | Automobiles — 1.2% | | | | | | | | |
| | | | Automobile Manufacturers — 1.2% | | | | | |
| | 25,000 | | | General Motors Co. | | | 862,082 | | | | 915,000 | |
| | | | | | | | | | | | |
| | | | TOTAL CONSUMER DISCRETIONARY | | | 3,488,887 | | | | 2,988,035 | |
| | | | | | | | | | | | |
| | | | REAL ESTATE — 2.3% | | | | | | | | |
| | | | Real Estate — 2.3% | | | | | | | | |
| | | | Real Estate Management & Development — 0.3% | |
| | | | Real Estate Development — 0.3% | | | | | |
| | 27,360 | | | CK Asset Holdings Ltd. | | | 150,629 | | | | 197,503 | |
| | | | | | | | | | | | |
| | | | Equity Real Estate Investment Trusts — 2.0% | |
| | | | Specialized REITs — 2.0% | | | | | | | | |
| | 2,000 | | | CyrusOne Inc., REIT | | | 24,800 | | | | 130,860 | |
| | 2,500 | | | Equinix Inc., REIT | | | 227,567 | | | | 1,459,250 | |
| | | | | | | | | | | | |
| | | | | | | 252,367 | | | | 1,590,110 | |
| | | | | | | | | | | | |
| | | | TOTAL REAL ESTATE | | | 402,996 | | | | 1,787,613 | |
| | | | | | | | | | | | |
| | | | INDUSTRIALS — 0.8% | | | | | | | | |
| | | | Commercial & Professional Services — 0.1% | |
| | | | Commercial Services & Supplies — 0.1% | |
| | | | Security & Alarm Services — 0.1% | | | | | |
| | 30,000 | | | G4S plc | | | 0 | | | | 86,629 | |
| | 900 | | | Marlowe plc† | | | 521 | | | | 6,050 | |
| | | | | | | | | | | | |
| | | | | | | 521 | | | | 92,679 | |
| | | | | | | | | | | | |
| | | | | | | | | | | | |
Shares | | | | | Cost | | | Market
Value | |
| | | | Capital Goods — 0.7% | | | | | |
| | | | Industrial Conglomerates — 0.3% | | | | | |
| | | | Industrial Conglomerates — 0.3% | | | | | |
| | 27,360 | | | CK Hutchison Holdings Ltd. | | $ | 245,763 | | | $ | 260,879 | |
| | | | | | | | | | | | |
| | | | Electrical Equipment — 0.1% | | | | | |
| | | | Electrical Components & Equipment — 0.1% | |
| | 1,800 | | | Furukawa Electric Co. Ltd. | | | 53,735 | | | | 46,717 | |
| | | | | | | | | | | | |
| | | | Construction & Engineering — 0.3% | | | | | |
| | | | Construction & Engineering — 0.3% | | | | | |
| | 6,000 | | | Bouygues SA | | | 167,997 | | | | 254,941 | |
| | | | | | | | | | | | |
| | | | TOTAL INDUSTRIALS | | | 468,016 | | | | 655,216 | |
| | | | | | | | | | | | |
| | | | HEALTH CARE — 0.8% | | | | | | | | |
| | | | Health Care Equipment & Services — 0.8% | | | | | |
| | | | Health Care Equipment & Supplies — 0.8% | | | | | |
| | | | Health Care Equipment — 0.8% | | | | | |
| | 13,000 | | | GN Store Nord A/S | | | 76,744 | | | | 611,377 | |
| | | | | | | | | | | | |
| | | | CONSUMER STAPLES — 0.2% | | | | | |
| | | | Food, Beverage & Tobacco — 0.2% | | | | | |
| | | | Food Products — 0.2% | | | | | | | | |
| | | | Agricultural Products — 0.2% | | | | | |
| | 68,000 | | | C.P. Pokphand Co. Ltd., ADR | | | 52,895 | | | | 136,680 | |
| | | | | | | | | | | | |
| | | | Beverages — 0.0% | | | | | | | | |
| | | | Distillers & Vintners — 0.0% | | | | | |
| | 1,768 | | | Gusbourne plc† | | | 1,486 | | | | 1,991 | |
| | | | | | | | | | | | |
| | | | Food & Staples Retailing — 0.0% | | | | | |
| | | | Food & Staples Retailing — 0.0% | | | | | |
| | | | Food Retail — 0.0% | | | | | | | | |
| | 504 | | | Meikles Ltd. | | | 203 | | | | 75 | |
| | | | | | | | | | | | |
| | | | TOTAL CONSUMER STAPLES | | | 54,584 | | | | 138,746 | |
| | | | | | | | | | | | |
| | | | UTILITIES — 0.0% | | | | | | | | |
| | | | Utilities — 0.0% | | | | | | | | |
| | | | Multi-Utilities — 0.0% | | | | | | | | |
| | | | Multi-Utilities — 0.0% | | | | | | | | |
| | 200 | | | National Grid plc, ADR | | | 10,528 | | | | 12,534 | |
| | | | | | | | | | | | |
| | | | TOTAL COMMON STOCKS | | | 53,848,727 | | | | 76,501,032 | |
| | | | | | | | | | | | |
| | | | CLOSED-END FUNDS — 0.1% | | | | | |
| | | | CONSUMER DISCRETIONARY — 0.1% | | | | | |
| | | | Retailing — 0.1% | | | | | | | | |
| | | | Internet & Direct Marketing Retail — 0.1% | | | | | |
| | | | Internet & Direct Marketing Retail — 0.1% | | | | | |
| | 5,800 | | | Altaba Inc., Escrow† | | | 0 | | | | 120,350 | |
| | | | | | | | | | | | |
See accompanying notes to financial statements.
9
The Gabelli Global Content & Connectivity Fund
Schedule of Investments (Continued) — December 31, 2019
| | | | | | | | | | | | |
Shares | | | | | Cost | | | Market Value | |
| | | | WARRANTS — 0.7% | |
| | | | COMMUNICATION SERVICES — 0.7% | |
| | | | Telecommunication Services — 0.7% | |
| | | | Wireless Telecommunication Services — 0.7% | |
| | | | Wireless Telecommunication Services — 0.7% | |
| | 81,000 | | | Bharti Airtel Ltd., expire
11/30/20†(b) | | $ | 443,540 | | | $ | 517,590 | |
| | | | | | | | | | | | |
| | | |
Principal
Amount | | | | | | | | | |
| | | | CORPORATE BONDS — 0.0% | |
| | | | COMMUNICATION SERVICES — 0.0% | |
| | | | Telecommunication Services — 0.0% | |
| | | | Wireless Telecommunication Services — 0.0% | |
| | | | Wireless Telecommunication Services — 0.0% | |
| | $ 32,808 | | | Econet Wireless Zimbabwe Ltd.,
5.000%, 03/17/23(a) | | | 1,768 | | | | 1,532 | |
| | | | | | | | | | | | |
| |
| | | | U.S. GOVERNMENT OBLIGATIONS — 1.2% | |
| | 939,000 | | | U.S. Treasury Bills,
1.531% to 1.557%††,
02/13/20 to 02/27/20 | | | 937,045 | | | | 937,129 | |
| | | | | | | | | | | | |
| | | |
| | | | TOTAL INVESTMENTS —100.1% | | $ | 55,231,080 | | | | 78,077,633 | |
| | | | | | | | | | | | |
| | | | Other Assets and Liabilities (Net) — (0.1)% | | | | (100,290 | ) |
| | | | | | | | | | | | |
| | | | NET ASSETS — 100.0% | | | | | | $ | 77,977,343 | |
| | | | | | | | | | | | |
| (a) | Security is valued using significant unobservable inputs and is classified as Level 3 in the fair value hierarchy. |
| (b) | Security exempt from registration under Rule 144A of the Securities Act of 1933, as amended. This security may be resold in transactions exempt from registration, normally to qualified institutional buyers. |
| † | Non-income producing security. |
| †† | Represents annualized yields at dates of purchase. |
| ADR | American Depositary Receipt |
| GDR | Global Depositary Receipt |
| REIT | Real Estate Investment Trust |
| SDR | Swedish Depositary Receipt |
| | | | | | | | |
Geographic Diversification | | %of
Market
Value | | | Market
Value | |
North America | | | 63.3 | % | | $ | 49,431,624 | |
Europe | | | 19.9 | | | | 15,547,950 | |
Latin America | | | 5.4 | | | | 4,175,311 | |
Japan | | | 4.6 | | | | 3,622,395 | |
Asia/Pacific | | | 3.8 | | | | 2,994,995 | |
Africa/Middle East | | | 3.0 | | | | 2,305,358 | |
| | | | | | | | |
| | | 100.0 | % | | $ | 78,077,633 | |
| | | | | | | | |
See accompanying notes to financial statements.
10
The Gabelli Global Content & Connectivity Fund
| | | | |
Statement of Assets and Liabilities December 31, 2019 | |
Assets: | | | | |
Investments, at value (cost $55,231,080) | | | $78,077,633 | |
Foreign currency, at value (cost $1,911) | | | 1,264 | |
Receivable for Fund shares sold | | | 7,575 | |
Receivable from Adviser | | | 30,943 | |
Dividends receivable | | | 90,797 | |
Prepaid expenses | | | 28,843 | |
| | | | |
Total Assets | | | 78,237,055 | |
| | | | |
Liabilities: | | | | |
Payable to custodian | | | 20,919 | |
Payable for Fund shares redeemed | | | 19,817 | |
Payable for investment advisory fees | | | 65,784 | |
Payable for distribution fees | | | 13,857 | |
Payable for accounting fees | | | 11,250 | |
Payable for legal and audit fees | | | 54,427 | |
Payable for shareholder communications expenses | | | 42,568 | |
Payable for shareholder services fees | | | 19,896 | |
Other accrued expenses | | | 11,194 | |
| | | | |
Total Liabilities | | | 259,712 | |
| | | | |
Net Assets
(applicable to 3,972,680 shares outstanding) | | | $77,977,343 | |
| | | | |
Net Assets Consist of: | | | | |
Paid-in capital | | | $56,067,590 | |
Total distributable earnings | | | 21,909,753 | |
| | | | |
Net Assets | | | $77,977,343 | |
| | | | |
| | | | |
Shares of Capital Stock, each at $0.001 par value: | | | | |
Class AAA: | | | | |
Net Asset Value, offering, and redemption price per share ($65,024,198 ÷ 3,311,189 shares outstanding; 150,000,000 shares authorized) | | | $19.64 | |
| | | | |
Class A: | | | | |
Net Asset Value and redemption price per share ($373,605 ÷ 18,860 shares outstanding; 50,000,000 shares authorized) | | | $19.81 | |
| | | | |
Maximum offering price per share (NAV ÷ 0.9425, based on maximum sales charge of 5.75% of the offering price) | | | $21.02 | |
| | | | |
Class C: | | | | |
Net Asset Value and offering price per share ($84,556 ÷ 4,420 shares outstanding; 50,000,000 shares authorized) | | | $19.13 | (a) |
| | | | |
Class I: | | | | |
Net Asset Value, offering, and redemption price per share ($12,494,984 ÷ 638,211 shares outstanding; 50,000,000 shares authorized) | | | $19.58 | |
| | | | |
| | | | |
Statement of Operations For the Year Ended December 31, 2019 | |
Investment Income: | | | | |
Dividends (net of foreign withholding taxes of $115,353) | | $ | 1,340,940 | |
Income fromnon-cash dividends | | | 1,268,866 | |
Interest | | | 23,302 | |
| | | | |
Total Investment Income | | | 2,633,108 | |
| | | | |
Expenses: | | | | |
Investment advisory fees | | | 791,487 | |
Distribution fees - Class AAA | | | 164,815 | |
Distribution fees - Class A | | | 796 | |
Distribution fees - Class C | | | 1,800 | |
Shareholder services fees | | | 84,635 | |
Shareholder communications expenses | | | 80,773 | |
Legal and audit fees | | | 56,973 | |
Registration expenses | | | 48,037 | |
Accounting fees | | | 45,000 | |
Custodian fees | | | 32,377 | |
Directors’ fees | | | 18,724 | |
Interest expense | | | 1,335 | |
Miscellaneous expenses | | | 17,357 | |
| | | | |
Total Expenses | | | 1,344,109 | |
| | | | |
Less: | | | | |
Expenses paid indirectly by broker
(See Note 6) | | | (689 | ) |
Expense reimbursements (See Note 3) | | | (91,150 | ) |
| | | | |
Total Credits and Reimbursements | | | (91,839 | ) |
| | | | |
Net Expenses | | | 1,252,270 | |
| | | | |
Net Investment Income | | | 1,380,838 | |
| | | | |
Net Realized and Unrealized Gain/(Loss) on Investments and Foreign Currency: | | | | |
Net realized gain on investments | | | 3,393,353 | |
Net realized loss on foreign currency transactions | | | (6,130 | ) |
| | | | |
Net realized gain on investments and foreign currency transactions | | | 3,387,223 | |
| | | | |
Net change in unrealized appreciation/depreciation: | | | | |
on investments | | | 6,765,388 | |
on foreign currency translations | | | (263 | ) |
| | | | |
Net change in unrealized appreciation/depreciation on investments and foreign currency translations | | | 6,765,125 | |
| | | | |
Net Realized and Unrealized Gain/(Loss) on Investments and Foreign Currency | | | 10,152,348 | |
| | | | |
Net Increase in Net Assets Resulting from Operations | | $ | 11,533,186 | |
| | | | |
| (a) | Redemption price varies based on the length of time held. |
See accompanying notes to financial statements.
11
The Gabelli Global Content & Connectivity Fund
Statement of Changes in Net Assets
| | | | | | | | | | |
| | | Year Ended
December 31, 2019 | | Year Ended
December 31, 2018 |
Operations: | | | | | | | | | | |
Net investment income | | | $ | 1,380,838 | | | | $ | 800,143 | |
Net realized gain on investments and foreign currency transactions | | | | 3,387,223 | | | | | 3,939,456 | |
Net change in unrealized appreciation/depreciation on investments and foreign currency translations | | | | 6,765,125 | | | | | (15,398,677 | ) |
| | | | | | | | | | |
Net Increase/(Decrease) in Net Assets Resulting from Operations | | | | 11,533,186 | | | | | (10,659,078 | ) |
| | | | | | | | | | |
Distributions to Shareholders: | | | | | | | | | | |
Accumulated earnings | | | | | | | | | | |
Class AAA | | | | (3,972,615 | ) | | | | (3,588,419 | ) |
Class A | | | | (22,666 | ) | | | | (12,799 | ) |
Class C | | | | (3,829 | ) | | | | (14,569 | ) |
Class I | | | | (855,412 | ) | | | | (802,477 | ) |
| | | | | | | | | | |
| | | | (4,854,522 | ) | | | | (4,418,264 | ) |
| | | | | | | | | | |
Return of capital | | | | | | | | | | |
Class AAA | | | | — | | | | | (33,667 | ) |
Class A | | | | — | | | | | (120 | ) |
Class C | | | | — | | | | | (137 | ) |
Class I | | | | — | | | | | (7,529 | ) |
| | | | | | | | | | |
| | | | — | | | | | (41,453 | ) |
| | | | | | | | | | |
Total Distributions to Shareholders | | | | (4,854,522 | ) | | | | (4,459,717 | ) |
| | | | | | | | | | |
| | |
Capital Share Transactions: | | | | | | | | | | |
Class AAA | | | | (3,728,999 | ) | | | | (6,132,278 | ) |
Class A | | | | 127,427 | | | | | (294,869 | ) |
Class C | | | | (221,139 | ) | | | | 63,433 | |
Class I | | | | (979,121 | ) | | | | 533,982 | |
Class T* | | | | — | | | | | (1,038 | ) |
| | | | | | | | | | |
Net Decrease in Net Assets from Capital Share Transactions | | | | (4,801,832 | ) | | | | (5,830,770 | ) |
| | | | | | | | | | |
| | |
Redemption Fees | | | | 25 | | | | | 113 | |
| | | | | | | | | | |
Net Increase/(Decrease) in Net Assets | | | | 1,876,857 | | | | | (20,949,452 | ) |
Net Assets: | | | | | | | | | | |
Beginning of year | | | | 76,100,486 | | | | | 97,049,938 | |
| | | | | | | | | | |
End of year | | | $ | 77,977,343 | | | | $ | 76,100,486 | |
| | | | | | | | | | |
| * | Class T Shares were liquidated on September 21, 2018. |
See accompanying notes to financial statements.
12
The Gabelli Global Content & Connectivity Fund
Financial Highlights
Selected data for a share of capital stock outstanding throughout each year:
| | | | | | | | | | | | | | | | | | | | | | | | | | | | | | | | | | | | | | | | | | | | | | | | | | | | | | | | | | |
| | | | | Income (Loss)
from Investment Operations | | | Distributions | | | | | | | | | | | Ratios to Average Net Assets/
Supplemental Data | |
Year Ended
December 31 | | Net Asset
Value,
Beginning
of Year | | Net
Investment
Income
(Loss)(a) | | Net
Realized
and
Unrealized
Gain (Loss)
on Investments | | | Total from
Investment
Operations | | | Net
Investment
Income | | | Net
Realized
Gain | | | Return of
Capital | | | Total
Distributions | | | Redemption
Fees(a)(b) | | | Net Asset
Value,
End of
Year | | | Total
Return† | | Net Assets
End of Year
(in 000’s) | | | Net Investment
Income
(Loss) | | | Operating
Expenses
Before
Reimbursement | | | Operating Expenses Net of Reimbursement(c) | | | Portfolio
Turnover
Rate | |
Class AAA | | | | | | | | | | | | | | | | | | | | | | | | | | | | | | | | | | | | | | | | | | | | | | | | | | | | | | | | | | |
2019 | | $18.08 | | $0.32(d) | | | $ 2.51 | | | | $ 2.83 | | | | $(0.37) | | | | $(0.90) | | | | — | | | | $(1.27) | | | | $0.00 | | | | $19.64 | | | 15.6% | | $ | 65,024 | | | | 1.63 | %(d) | | | 1.74% | | | | 1.69%(e) | | | | 14% | |
2018 | | 21.77 | | 0.16 | | | (2.76 | ) | | | (2.60 | ) | | | (0.15) | | | | (0.93) | | | | $(0.01) | | | | (1.09) | | | | 0.00 | | | | 18.08 | | | (11.9) | | | 63,196 | | | | 0.78 | | | | 1.72 | | | | 1.72 | | | | 19 | |
2017 | | 20.43 | | 0.11 | | | 2.63 | | | | 2.74 | | | | (0.14) | | | | (1.26) | | | | — | | | | (1.40) | | | | — | | | | 21.77 | | | 13.4 | | | 81,832 | | | | 0.48 | | | | 1.73 | | | | 1.73 | | | | 22 | |
2016 | | 21.30 | | 0.27 | | | 0.29 | | | | 0.56 | | | | (0.28) | | | | (1.13) | | | | (0.02) | | | | (1.43) | | | | 0.00 | | | | 20.43 | | | 2.7 | | | 87,893 | | | | 1.23 | | | | 1.65 | | | | 1.65(f) | | | | 9 | |
2015 | | 23.63 | | 0.26 | | | (0.82 | ) | | | (0.56 | ) | | | (0.27) | | | | (1.49) | | | | (0.01) | | | | (1.77) | | | | 0.00 | | | | 21.30 | | | (2.5) | | | 101,187 | | | | 1.08 | | | | 1.63 | | | | 1.63 | | | | 5 | |
Class A | | | | | | | | | | | | | | | | | | | | | | | | | | | | | | | | | | | | | | | | | | | | | | | | | | | | | | | | | | |
2019 | | $18.23 | | $0.36(d) | | | $ 2.50 | | | | $ 2.86 | | | | $(0.38) | | | | $(0.90) | | | | — | | | | $(1.28) | | | | $0.00 | | | | $19.81 | | | 15.6% | | $ | 374 | | | | 1.80 | %(d) | | | 1.74% | | | | 1.68%(e) | | | | 14% | |
2018 | | 21.94 | | 0.16 | | | (2.79 | ) | | | (2.63 | ) | | | (0.14) | | | | (0.93) | | | | $(0.01) | | | | (1.08) | | | | 0.00 | | | | 18.23 | | | (11.9) | | | 231 | | | | 0.76 | | | | 1.72 | | | | 1.72 | | | | 19 | |
2017 | | 20.58 | | 0.10 | | | 2.66 | | | | 2.76 | | | | (0.14) | | | | (1.26) | | | | — | | | | (1.40) | | | | — | | | | 21.94 | | | 13.4 | | | 576 | | | | 0.43 | | | | 1.73 | | | | 1.73 | | | | 22 | |
2016 | | 21.29 | | 0.15 | | | 0.38 | | | | 0.53 | | | | (0.09) | | | | (1.13) | | | | (0.02) | | | | (1.24) | | | | 0.00 | | | | 20.58 | | | 2.5 | | | 661 | | | | 0.68 | | | | 1.65 | | | | 1.65(f) | | | | 9 | |
2015 | | 23.61 | | 0.26 | | | (0.81 | ) | | | (0.55 | ) | | | (0.27) | | | | (1.49) | | | | (0.01) | | | | (1.77) | | | | 0.00 | | | | 21.29 | | | (2.5) | | | 846 | | | | 1.08 | | | | 1.63 | | | | 1.63 | | | | 5 | |
Class C | | | | | | | | | | | | | | | | | | | | | | | | | | | | | | | | | | | | | | | | | | | | | | | | | | | | | | | | | | |
2019 | | $17.45 | | $0.04(d) | | | $ 2.55 | | | | $ 2.59 | | | | $(0.01) | | | | $(0.90) | | | | — | | | | $(0.91) | | | | $0.00 | | | | $19.13 | | | 14.8% | | $ | 84 | | | | 0.19 | %(d) | | | 2.49% | | | | 2.45%(e) | | | | 14% | |
2018 | | 21.08 | | 0.02 | | | (2.68 | ) | | | (2.66 | ) | | | (0.03) | | | | (0.93) | | | | $(0.01) | | | | (0.97) | | | | 0.00 | | | | 17.45 | | | (12.6) | | | 279 | | | | 0.08 | | | | 2.47 | | | | 2.47 | | | | 19 | |
2017 | | 19.85 | | (0.06) | | | 2.55 | | | | 2.49 | | | | — | | | | (1.26) | | | | — | | | | (1.26) | | | | — | | | | 21.08 | | | 12.5 | | | 267 | | | | (0.28 | ) | | | 2.48 | | | | 2.48 | | | | 22 | |
2016 | | 20.71 | | 0.09 | | | 0.30 | | | | 0.39 | | | | (0.10) | | | | (1.13) | | | | (0.02) | | | | (1.25) | | | | 0.00 | | | | 19.85 | | | 1.9 | | | 328 | | | | 0.42 | | | | 2.40 | | | | 2.40(f) | | | | 9 | |
2015 | | 22.98 | | 0.08 | | | (0.79 | ) | | | (0.71 | ) | | | (0.06) | | | | (1.49) | | | | (0.01) | | | | (1.56) | | | | 0.00 | | | | 20.71 | | | (3.2) | | | 441 | | | | 0.36 | | | | 2.38 | | | | 2.38 | | | | 5 | |
Class I | | | | | | | | | | | | | | | | | | | | | | | | | | | | | | | | | | | | | | | | | | | | | | | | | | | | | | | | | | |
2019 | | $18.03 | | $0.46(d) | | | $ 2.51 | | | | $ 2.97 | | | | $(0.52) | | | | $(0.90) | | | | — | | | | $(1.42) | | | | $0.00 | | | | $19.58 | | | 16.4% | | $ | 12,495 | | | | 2.33 | %(d) | | | 1.49% | | | | 0.99%(e) | | | | 14% | |
2018 | | 21.75 | | 0.32 | | | (2.79 | ) | | | (2.47 | ) | | | (0.31) | | | | (0.93) | | | | $(0.01) | | | | (1.25) | | | | 0.00 | | | | 18.03 | | | (11.3) | | | 12,394 | | | | 1.52 | | | | 1.47 | | | | 1.00(e) | | | | 19 | |
2017 | | 20.40 | | 0.28 | | | 2.62 | | | | 2.90 | | | | (0.29) | | | | (1.26) | | | | — | | | | (1.55) | | | | — | | | | 21.75 | | | 14.2 | | | 14,374 | | | | 1.26 | | | | 1.48 | | | | 1.00(e) | | | | 22 | |
2016 | | 21.27 | | 0.30 | | | 0.33 | | | | 0.63 | | | | (0.35) | | | | (1.13) | | | | (0.02) | | | | (1.50) | | | | 0.00 | | | | 20.40 | | | 3.0 | | | 6,361 | | | | 1.41 | | | | 1.40 | | | | 1.35(e)(f) | | | | 9 | |
2015 | | 23.60 | | 0.30 | | | (0.79 | ) | | | (0.49 | ) | | | (0.34) | | | | (1.49) | | | | (0.01) | | | | (1.84) | | | | 0.00 | | | | 21.27 | | | (2.2) | | | 1,842 | | | | 1.26 | | | | 1.38 | | | | 1.38 | | | | 5 | |
| † | Total return represents aggregate total return of a hypothetical $1,000 investment at the beginning of the year and sold at the end of the year including reinvestment of distributions and does not reflect the applicable sales charges. |
| (a) | Per share amounts have been calculated using the average shares outstanding method. |
| (b) | Amount represents less than $0.005 per share. |
| (c) | The Fund received credits from a designated broker who agreed to pay certain Fund operating expenses. For the years ended December 31, 2019, 2018, 2017, 2016, and 2015, there was no impact to the expense ratios. |
| (d) | Includes income resulting from special dividends. Without these dividends, the per share income amounts would have been 0.01 (Class AAA), 0.04 (Class A), (0.27) (Class C), and 0.15 (Class I), and the net investment income ratio would have been 0.03% (Class AAA), 0.19% (Class A), (1.41%) (Class C), and 0.73% (Class I), respectively. |
| (e) | Under an expense reimbursement agreement with the Adviser, the Adviser reimbursed expenses of $91,150 for the year ended December 31, 2019 and certain Class I expenses to the Fund of $70,600, $56,231, and $899 for the years ended December 31, 2018, 2017, and 2016, respectively. |
| (f) | During the year ended December 31, 2016, the Fund received reimbursements of custody expenses paid in prior years. Had such reimbursement (allocated by relative net asset values of the Fund’s share classes) been included in that period, the expense ratios would have been 1.22% (Class AAA), 1.54% (Class A), 1.99% (Class C), and 0.95% (Class I). |
See accompanying notes to financial statements.
13
The Gabelli Global Content & Connectivity Fund
Notes to Financial Statements
1. Organization.The Gabelli Global Content & Connectivity Fund, a series of GAMCO Global Series Funds, Inc. (the Corporation), was incorporated on July 16, 1993 in Maryland. The Fund is anon-diversifiedopen-end management investment company registered under the Investment Company Act of 1940, as amended (the 1940 Act), and is one of five separately managed portfolios (collectively, the Portfolios) of the Corporation. The Fund’s primary objective is capital appreciation. The Fund commenced investment operations on November 1, 1993.
The Fund may invest a high percentage of its assets in specific sectors of the market in order to achieve a potentially greater investment return. As a result, the Fund may be more susceptible to economic, political, and regulatory developments in a particular sector of the market, positive or negative, and may experience increased volatility to the Fund’s NAV and a magnified effect in its total return.
2. Significant Accounting Policies.As an investment company, the Fund follows the investment company accounting and reporting guidance, which is part of U.S. generally accepted accounting principles (GAAP) that may require the use of management estimates and assumptions in the preparation of its financial statements. Actual results could differ from those estimates. The following is a summary of significant accounting policies followed by the Fund in the preparation of its financial statements.
New Accounting Pronouncements.To improve the effectiveness of fair value disclosure requirements, the Financial Accounting Standards Board recently issued Accounting Standard Update (ASU)2018-13, Fair Value Measurement Disclosure Framework – Changes to the Disclosure Requirements for Fair Value Measurement (ASU2018-13), which adds, removes, and modifies certain aspects relating to fair value disclosure. ASU2018-13 is effective for interim and annual reporting periods beginning after December 15, 2019; early adoption of the additions relating to ASU2018-13 is not required, even if early adoption is elected for the removals and modifications under ASU2018-13. Management has early adopted the removals and modifications set forth in ASU2018-13 in these financial statements and has not early adopted the additions set forth in ASU2018-13.
Security Valuation.Portfolio securities listed or traded on a nationally recognized securities exchange or traded in the U.S.over-the-counter market for which market quotations are readily available are valued at the last quoted sale price or a market’s official closing price as of the close of business on the day the securities are being valued. If there were no sales that day, the security is valued at the average of the closing bid and asked prices or, if there were no asked prices quoted on that day, then the security is valued at the closing bid price on that day. If no bid or asked prices are quoted on such day, the security is valued at the most recently available price or, if the Board of Directors (the Board) so determines, by such other method as the Board shall determine in good faith to reflect its fair market value. Portfolio securities traded on more than one national securities exchange or market are valued according to the broadest and most representative market, as determined by Gabelli Funds, LLC (the Adviser).
Portfolio securities primarily traded on a foreign market are generally valued at the preceding closing values of such securities on the relevant market, but may be fair valued pursuant to procedures established by the Board if market conditions change significantly after the close of the foreign market, but prior to the close of business on the day the securities are being valued. Debt obligations for which market quotations are readily available are valued at the average of the latest bid and asked prices. If there were no asked prices quoted
14
The Gabelli Global Content & Connectivity Fund
Notes to Financial Statements (Continued)
on such day, the security is valued using the closing bid price. Such debt obligations are valued through prices provided by a pricing service approved by the Board. Certain securities are valued principally using dealer quotations.
Securities and assets for which market quotations are not readily available are fair valued as determined by the Board. Fair valuation methodologies and procedures may include, but are not limited to: analysis and review of available financial andnon-financial information about the company; comparisons with the valuation and changes in valuation of similar securities, including a comparison of foreign securities with the equivalent U.S. dollar value American Depositary Receipt securities at the close of the U.S. exchange; and evaluation of any other information that could be indicative of the value of the security.
The inputs and valuation techniques used to measure fair value of the Fund’s investments are summarized into three levels as described in the hierarchy below:
| | ● | | Level 1 — quoted prices in active markets for identical securities; |
| | ● | | Level 2 — other significant observable inputs (including quoted prices for similar securities, interest rates, prepayment speeds, credit risk, etc.); and |
| | ● | | Level 3 — significant unobservable inputs (including the Board’s determinations as to the fair value of investments). |
A financial instrument’s level within the fair value hierarchy is based on the lowest level of any input both individually and in the aggregate that is significant to the fair value measurement. The inputs or methodology used for valuing securities are not necessarily an indication of the risk associated with investing in those securities. The summary of the Fund’s investments in securities by inputs used to value the Fund’s investments as of December 31, 2019 is as follows:
| | | | | | | | | | | | | | | | |
| | | Valuation Inputs | | | | |
| | | Level 1
Quoted Prices | | | Level 2 Other Significant
Observable Inputs | | | Level 3 Significant
Unobservable Inputs | | | Total Market Value
at 12/31/19 | |
INVESTMENTS IN SECURITIES: | | | | | | | | | | | | | | | | |
ASSETS (Market Value): | | | | | | | | | | | | | | | | |
Common Stocks | | | | | | | | | | | | | | | | |
Communication Services | | | $62,141,777 | | | | $ 84,711 | | | | $409,347 | | | | $62,635,835 | |
Consumer Staples | | | 138,671 | | | | 75 | | | | — | | | | 138,746 | |
Financials | | | 3,035,003 | | | | — | | | | 2,520 | | | | 3,037,523 | |
Other (a) | | | 10,688,928 | | | | — | | | | — | | | | 10,688,928 | |
Total Common Stocks | | | 76,004,379 | | | | 84,786 | | | | 411,867 | | | | 76,501,032 | |
Closed-End Funds (a) | | | — | | | | 120,350 | | | | — | | | | 120,350 | |
Warrants (a) | | | — | | | | 517,590 | | | | — | | | | 517,590 | |
Corporate Bonds (a) | | | — | | | | — | | | | 1,532 | | | | 1,532 | |
U.S. Government Obligations | | | — | | | | 937,129 | | | | — | | | | 937,129 | |
TOTAL INVESTMENTS IN
SECURITIES – ASSETS | | | $76,004,379 | | | | $1,659,855 | | | | $413,399 | | | | $78,077,633 | |
| (a) | Please refer to the Schedule of Investments for the industry classifications of these portfolio holdings. |
The Fund did not have any transfers into or out of Level 3 during the year ended December 31, 2019.
15
The Gabelli Global Content & Connectivity Fund
Notes to Financial Statements (Continued)
Additional Information to Evaluate Qualitative Information.
General.The Fund uses recognized industry pricing services – approved by the Board and unaffiliated with the Adviser – to value most of its securities, and uses broker quotes provided by market makers of securities not valued by these and other recognized pricing sources. Several different pricing feeds are received to value domestic equity securities, international equity securities, preferred equity securities, and fixed income securities. The data within these feeds are ultimately sourced from major stock exchanges and trading systems where these securities trade. The prices supplied by external sources are checked by obtaining quotations or actual transaction prices from market participants. If a price obtained from the pricing source is deemed unreliable, prices will be sought from another pricing service or from a broker/dealer that trades that security or similar securities.
Fair Valuation.Fair valued securities may be common or preferred equities, warrants, options, rights, or fixed income obligations. Where appropriate, Level 3 securities are those for which market quotations are not available, such as securities not traded for several days, or for which current bids are not available, or which are restricted as to transfer. When fair valuing a security, factors to consider include recent prices of comparable securities that are publicly traded, reliable prices of securities not publicly traded, the use of valuation models, current analyst reports, valuing the income or cash flow of the issuer, or cost if the preceding factors do not apply. A significant change in the unobservable inputs could result in a lower or higher value in Level 3 securities. The circumstances of Level 3 securities are frequently monitored to determine if fair valuation measures continue to apply.
The Adviser reports quarterly to the Board the results of the application of fair valuation policies and procedures. These may include backtesting the prices realized in subsequent trades of these fair valued securities to fair values previously recognized.
Foreign Currency Translations.The books and records of the Fund are maintained in U.S. dollars. Foreign currencies, investments, and other assets and liabilities are translated into U.S. dollars at current exchange rates. Purchases and sales of investment securities, income, and expenses are translated at the exchange rate prevailing on the respective dates of such transactions. Unrealized gains and losses that result from changes in foreign exchange rates and/or changes in market prices of securities have been included in unrealized appreciation/depreciation on investments and foreign currency translations. Net realized foreign currency gains and losses resulting from changes in exchange rates include foreign currency gains and losses between trade date and settlement date on investment securities transactions, foreign currency transactions, and the difference between the amounts of interest and dividends recorded on the books of the Fund and the amounts actually received. The portion of foreign currency gains and losses related to fluctuation in exchange rates between the initial purchase trade date and subsequent sale trade date is included in realized gain/(loss) on investments.
Foreign Securities.The Fund may directly purchase securities of foreign issuers. Investing in securities of foreign issuers involves special risks not typically associated with investing in securities of U.S. issuers. The risks include possible revaluation of currencies, the inability to repatriate funds, less complete financial information about companies, and possible future adverse political and economic developments. Moreover, securities of many foreign issuers and their markets may be less liquid and their prices more volatile than securities of comparable U.S. issuers.
16
The Gabelli Global Content & Connectivity Fund
Notes to Financial Statements (Continued)
Foreign Taxes.The Fund may be subject to foreign taxes on income, gains on investments, or currency repatriation, a portion of which may be recoverable. The Fund will accrue such taxes and recoveries as applicable, based upon its current interpretation of tax rules and regulations that exist in the markets in which it invests.
Restricted Securities.The Fund may invest up to 15% of its net assets in securities for which the markets are restricted. Restricted securities include securities whose disposition is subject to substantial legal or contractual restrictions. The sale of restricted securities often requires more time and results in higher brokerage charges or dealer discounts and other selling expenses than does the sale of securities eligible for trading on national securities exchanges or in theover-the-counter markets. Restricted securities may sell at a price lower than similar securities that are not subject to restrictions on resale. Securities freely saleable among qualified institutional investors under special rules adopted by the SEC may be treated as liquid if they satisfy liquidity standards established by the Board. The continued liquidity of such securities is not as well assured as that of publicly traded securities, and accordingly the Board will monitor their liquidity.
Investments in other Investment Companies.The Fund may invest, from time to time, in shares of other investment companies (or entities that would be considered investment companies but are excluded from the definition pursuant to certain exceptions under the 1940 Act) (the Acquired Funds) in accordance with the 1940 Act and related rules. Shareholders in the Fund would bear the pro rata portion on of the periodic expenses of the Acquired Funds in addition to the Fund’s expenses. For the year ended December 31, 2019, the Fund’s pro rata portion of the periodic expenses charged by the Acquired Funds was approximately two basis points.
Securities Transactions and Investment Income.Securities transactions are accounted for on the trade date with realized gain or loss on investments determined by using the identified cost method. Interest income (including amortization of premium and accretion of discount) is recorded on an accrual basis. Premiums and discounts on debt securities are amortized using the effective yield to maturity method. Dividend income is recorded on theex-dividend date, except for certain dividends from foreign securities that are recorded as soon after theex-dividend date as the Fund becomes aware of such dividends.
Determination of Net Asset Value and Calculation of Expenses.Certain administrative expenses are common to, and allocated among, various affiliated funds. Such allocations are made on the basis of each fund’s average net assets or other criteria directly affecting the expenses as determined by the Adviser pursuant to procedures established by the Board.
In calculating the NAV per share of each class, investment income, realized and unrealized gains and losses, redemption fees, and expenses other than class specific expenses are allocated daily to each class of shares based upon the proportion of net assets of each class at the beginning of each day. Distribution expenses are borne solely by the class incurring the expense.
Distributions to Shareholders.Distributions to shareholders are recorded on theex-dividend date. Distributions to shareholders are based on income and capital gains as determined in accordance with federal income tax regulations, which may differ from income and capital gains as determined under GAAP. These differences are primarily due to differing treatments of income and gains on various investment securities and foreign currency transactions, timing differences, and differing characterizations of distributions made by the Fund. Distributions from net investment income for federal income tax purposes include net realized gains on foreign currency transactions. These book/tax differences are either temporary or permanent in nature. To the extent
17
The Gabelli Global Content & Connectivity Fund
Notes to Financial Statements (Continued)
these differences are permanent, adjustments are made to the appropriate capital accounts in the period when the differences arise. Permanent differences were primarily due to the tax treatment of currency gains and losses, sales relating to investments considered no longer to be passive foreign investments, capital gain adjustment on sale of real estate investment trusts and redesignation of dividends paid. These reclassifications have no impact on the NAV of the Fund. For the year ended December 31, 2019, reclassifications were made to decreasepaid-in capital by $84,346, with an offsetting adjustment to total distributable earnings.
The tax character of distributions paid during the year ended December 31, 2019 and 2018 were as follows:
| | | | | | | | | | | | | | | | | | | | | | | | |
| | | Year Ended December 31, 2019 | | | Year Ended December 31, 2018 | |
Distributions paid from: | | | | | | | | | | | | | | | | | | | | | | | | |
Ordinary income (inclusive of short term capital gains) | | | | | | | $1,903,819 | | | | | | | | | | | | $1,045,421 | | | | | |
Net long term capital gains | | | | | | | 2,950,703 | | | | | | | | | | | | 3,372,843 | | | | | |
Return of Capital | | | | | | | — | | | | | | | | | | | | 41,453 | | | | | |
| | | | | | | | | | | | | | | | | | | | | | | | |
Total distributions paid | | | | | | | $4,854,522 | | | | | | | | | | | | $4,459,717 | | | | | |
| | | | | | | | | | | | | | | | | | | | | | | | |
Provision for Income Taxes.The Fund intends to continue to qualify as a regulated investment company under Subchapter M of the Internal Revenue Code of 1986, as amended (the Code). It is the policy of the Fund to comply with the requirements of the Code applicable to regulated investment companies and to distribute substantially all of its net investment company taxable income and net capital gains. Therefore, no provision for federal income taxes is required.
At December 31, 2019, the components of accumulated earnings/losses on a tax basis were as follows:
| | | | |
Undistributed ordinary income | | $ | 19,774 | |
Net unrealized appreciation on investments and foreign currency translations | | | 21,889,979 | |
| | | | |
Total | | $ | 21,909,753 | |
| | | | |
The Fund is permitted to carry capital losses forward for an unlimited period. Capital losses that are carried forward will retain their character as either short term or long term capital losses.
At December 31, 2019, the temporary differences between book basis and tax basis unrealized appreciation were primarily due to deferral of losses from wash sales for tax purposes andmark-to-market adjustments on investments previously considered to be a passive foreign investment company, and no longer considered a passive foreign investment company.
The following summarizes the tax cost of investments and the related net unrealized appreciation at December 31, 2019.
| | | | | | | | |
| | | Cost | | Gross
Unrealized
Appreciation | | Gross
Unrealized
Depreciation | | Net Unrealized
Appreciation |
| Investments | | $56,187,116 | | $26,400,369 | | $(4,509,852) | | $21,890,517 |
The Fund is required to evaluate tax positions taken or expected to be taken in the course of preparing the Fund’s tax returns to determine whether the tax positions are“more-likely-than-not” of being sustained by the applicable tax authority. Income tax and related interest and penalties would be recognized by the Fund as tax expense in the Statement of Operations if the tax positions were deemed not to meet themore-likely-than-not threshold. During the year ended December 31, 2019, the Fund did not incur any income tax, interest, or
18
The Gabelli Global Content & Connectivity Fund
Notes to Financial Statements (Continued)
penalties. As of December 31, 2019, the Adviser has reviewed all open tax years and concluded that there was no impact to the Fund’s net assets or results of operations. The Fund’s federal and state tax returns for the prior three fiscal years remain open, subject to examination. On an ongoing basis, the Adviser will monitor the Fund’s tax positions to determine if adjustments to this conclusion are necessary.
3. Investment Advisory Agreement and Other Transactions.The Fund has entered into an investment advisory agreement (the Advisory Agreement) with the Adviser which provides that the Fund will pay the Adviser a fee, computed daily and paid monthly, at the annual rate of 1.00% of the value of its average daily net assets. In accordance with the Advisory Agreement, the Adviser provides a continuous investment program for the Fund’s portfolio, oversees the administration of all aspects of the Fund’s business and affairs, and pays the compensation of all Officers and Directors of the Fund who are affiliated persons of the Adviser.
Through November 30, 2019, the Adviser had agreed to waive and/or to reimburse expenses of the Fund to the extent necessary to maintain the annualized total operating expenses of Class I (excluding brokerage costs, acquired fund fees and expenses, interest, taxes, and extraordinary expenses) at no more than an annual rate of 1.00% of the value of that class’s average daily net assets. Effective December 1, 2019, the Adviser amended its contractual agreement with respect to each share class of the Fund to waive its investment advisory fees and/or to reimburse expenses to the extent necessary to maintain the annualized total operating expenses of the Fund (excluding brokerage costs, acquired fund fees and expenses, interest, taxes, and extraordinary expenses) until at least April 30, 2021, at no more than 0.90% of the value of the Fund’s average daily net assets for each share class of the Fund. During the year ended December 31, 2019, the Adviser reimbursed expenses in the amount of $91,150. In addition, the Fund has agreed, during the two year period following any waiver or reimbursement by the Adviser, to repay such amount to the extent, that after giving effect to the repayment, such adjusted annualized total operating expenses of the Fund would not exceed 0.90% of the value of the Fund’s average daily net assets for each share class of the Fund. The agreement is renewable annually. At December 31, 2019, the cumulative amount which the Fund may repay the Adviser, subject to the terms above, is $161,750:
| | | | | | | | | | | | | | |
For the year ended December 31, 2018, expiring December 31, 2020 | | $ | 70,600 | |
For the year ended December 31, 2019, expiring December 31, 2021 | | | 91,150 | |
| | | | |
| | $ | 161,750 | |
| | | | |
The Corporation pays each Director who is not considered to be an affiliated person an annual retainer of $6,000 plus $1,000 for each Board meeting attended and they are reimbursed for any out of pocket expenses incurred in attending meetings. All Board committee members receive $1,000 per meeting attended. The Chairman of the Audit Committee receives an annual fee of $3,000, and the Lead Director receives an annual fee of $2,000. A Director may receive a single meeting fee, allocated among the participating funds, for attending certain meetings held on behalf of multiple funds. Directors who are directors or employees of the Adviser or an affiliated company receive no compensation or expense reimbursement from the Corporation.
4. Distribution Plan.The Fund’s Board has adopted a distribution plan (the Plan) for each class of shares, except for Class I Shares, pursuant to Rule12b-1 under the 1940 Act. Under the Class AAA, Class A, and Class C Share Plans, payments are authorized to G.distributors, LLC (the Distributor), an affiliate of the Adviser, at annual rates of 0.25%, 0.25%, and 1.00%, respectively, of the average daily net assets of those classes, the annual limitations under each Plan. Such payments are accrued daily and paid monthly.
19
The Gabelli Global Content & Connectivity Fund
Notes to Financial Statements (Continued)
5. Portfolio Securities.Purchases and sales of securities during the year ended December 31, 2019, other than short term securities and U.S. Government obligations, aggregated $10,855,164 and $19,507,654, respectively.
6. Transactions with Affiliates and Other Arrangements.During the year ended December 31, 2019, the Fund paid brokerage commissions on security trades of $13,236 to G.research, LLC, an affiliate of the Adviser. Additionally, the Distributor retained a total of $479 from investors representing commissions (sales charges and underwriters fees) on sales and redemptions of Fund shares.
The Fund received credits from a designated broker who agreed to pay certain Fund operating expenses. The amount of such expenses paid through this directed brokerage arrangement during this period was $689.
The cost of calculating the Fund’s NAV per share is a Fund expense pursuant to the Advisory Agreement. Under thesub-administration agreement with Bank of New York Mellon, the fees paid include the cost of calculating the Fund’s NAV. The Fund reimburses the Adviser for this service. During the year ended December 31, 2019, the Fund accrued $45,000 in accounting fees in the Statement of Operations.
7. Line of Credit.The Fund participates in an unsecured line of credit which expires on March 4, 2020 and may be renewed annually, of up to $75,000,000 under which it may borrow up to 10% of its net assets from the custodian for temporary borrowing purposes. Borrowings under this arrangement bear interest at a floating rate equal to the higher of the overnight Federal Funds rate plus 125 basis points or the 30 day ICE LIBOR plus 125 basis points in effect on that day. This amount, if any, would be included in “Interest expense” in the Statement of Operations. At December 31, 2019, there were no borrowings outstanding under the line of credit.
The average daily amount of borrowings outstanding under the line of credit during the year ended December 31, 2019 was $4,786 with a weighted average interest rate of 3.81%. The maximum amount borrowed at anytime during the year ended December 31, 2019 was $387,000.
8. Capital Stock.The Fund offers four classes of shares–Class AAA Shares, Class A Shares, Class C Shares, and Class I Shares. Class AAA and Class I Shares are offered without a sales charge. Class A Shares are subject to a maximumfront-end sales charge of 5.75% and Class C Shares are subject to a 1.00% contingent deferred sales charge for one year after purchase.
The Fund imposes a redemption fee of 2.00% on all classes of shares that are redeemed or exchanged on or before the seventh day after the date of a purchase. The redemption fee is deducted from the proceeds otherwise payable to the redeeming shareholders and is retained by the Fund as an increase inpaid-in capital. The redemption fees retained by the Fund during the year ended December 31, 2019 and 2018, if any, can be found in the Statement of Changes in Net Assets under Redemption Fees.
20
The Gabelli Global Content & Connectivity Fund
Notes to Financial Statements (Continued)
Transactions in shares of capital stock were as follows:
| | | | | | | | | | | | | | | | |
| | | Year Ended
December 31, 2019 | | | Year Ended
December 31, 2018 | |
| | | Shares | | | Amount | | | Shares | | | Amount | |
Class AAA | | | | | | | | | | | | | | | | |
Shares sold | | | 18,269 | | | $ | 359,384 | | | | 37,061 | | | $ | 785,310 | |
Shares issued upon reinvestment of distributions | | | 192,809 | | | | 3,794,424 | | | | 194,100 | | | | 3,470,481 | |
Shares redeemed | | | (395,781 | ) | | | (7,882,807 | ) | | | (493,849 | ) | | | (10,388,069 | ) |
| | | | | | | | | | | | | | | | |
Net decrease | | | (184,703 | ) | | $ | (3,728,999 | ) | | | (262,688 | ) | | $ | (6,132,278 | ) |
| | | | | | | | | | | | | | | | |
Class A | | | | | | | | | | | | | | | | |
Shares sold | | | 11,470 | | | $ | 233,058 | | | | 2,091 | | | $ | 43,839 | |
Shares issued upon reinvestment of distributions | | | 879 | | | | 17,451 | | | | 485 | | | | 8,745 | |
Shares redeemed | | | (6,170 | ) | | | (123,082 | ) | | | (16,146 | ) | | | (347,453 | ) |
| | | | | | | | | | | | | | | | |
Net increase/(decrease) | | | 6,179 | | | $ | 127,427 | | | | (13,570 | ) | | $ | (294,869 | ) |
| | | | | | | | | | | | | | | | |
Class C | | | | | | | | | | | | | | | | |
Shares sold | | | 957 | | | $ | 18,383 | | | | 7,249 | | | $ | 145,473 | |
Shares issued upon reinvestment of distributions | | | 186 | | | | 3,567 | | | | 836 | | | | 14,433 | |
Shares redeemed | | | (12,687 | ) | | | (243,089 | ) | | | (4,769 | ) | | | (96,473 | ) |
| | | | | | | | | | | | | | | | |
Net increase/(decrease) | | | (11,544 | ) | | $ | (221,139 | ) | | | 3,316 | | | $ | 63,433 | |
| | | | | | | | | | | | | | | | |
Class I | | | | | | | | | | | | | | | | |
Shares sold | | | 18,555 | | | $ | 366,674 | | | | 94,989 | | | $ | 2,058,019 | |
Shares issued upon reinvestment of distributions | | | 40,293 | | | | 790,553 | | | | 42,285 | | | | 753,940 | |
Shares redeemed | | | (108,204 | ) | | | (2,136,348 | ) | | | (110,731 | ) | | | (2,277,977 | ) |
| | | | | | | | | | | | | | | | |
Net increase/(decrease) | | | (49,356 | ) | | $ | (979,121 | ) | | | 26,543 | | | $ | 533,982 | |
| | | | | | | | | | | | | | | | |
Class T * | | | | | | | | | | | | | | | | |
Shares redeemed | | | — | | | | — | | | | (48 | ) | | $ | (1,038 | ) |
| | | | | | | | | | | | | | | | |
Net decrease | | | — | | | | — | | | | (48 | ) | | $ | (1,038 | ) |
| | | | | | | | | | | | | | | | |
| * | Class T Shares were liquidated on September 21, 2018. |
9. Indemnifications.The Fund enters into contracts that contain a variety of indemnifications. The Fund’s maximum exposure under these arrangements is unknown. However, the Fund has not had prior claims or losses pursuant to these contracts. Management has reviewed the Fund’s existing contracts and expects the risk of loss to be remote.
10. Subsequent Events.Effective January 1, 2020, Mario J. Gabelli, CFA, and Brett Harriss no longer serve as portfolio managers of the Fund. Management has evaluated the impact on the Fund of all other subsequent events occurring through the date the financial statements were issued and has determined that there were no other subsequent events requiring recognition or disclosure in the financial statements.
21
The Gabelli Global Content & Connectivity Fund
Report of Independent Registered Public Accounting Firm
To the Shareholders of The Gabelli Global Content & Connectivity Fund
and the Board of Directors of GAMCO Global Series Funds, Inc.
Opinion on the Financial Statements
We have audited the accompanying statement of assets and liabilities of The Gabelli Global Content & Connectivity Fund (the “Fund”) (one of the funds constituting GAMCO Global Series Funds, Inc. (the “Corporation”)), including the schedule of investments, as of December 31, 2019, and the related statement of operations for the year then ended, the statements of changes in net assets for each of the two years in the period then ended, the financial highlights for each of the five years in the period then ended and the related notes (collectively referred to as the “financial statements”). In our opinion, the financial statements present fairly, in all material respects, the financial position of the Fund (one of the funds constituting GAMCO Global Series Funds, Inc.) at December 31, 2019, the results of its operations for the year then ended, the changes in its net assets for each of the two years in the period then ended and its financial highlights for each of the five years in the period then ended, in conformity with U.S. generally accepted accounting principles.
Basis for Opinion
These financial statements are the responsibility of the Corporation’s management. Our responsibility is to express an opinion on the Fund’s financial statements based on our audits. We are a public accounting firm registered with the Public Company Accounting Oversight Board (United States) (“PCAOB”) and are required to be independent with respect to the Corporation in accordance with the U.S. federal securities laws and the applicable rules and regulations of the Securities and Exchange Commission and the PCAOB.
We conducted our audits in accordance with the standards of the PCAOB. Those standards require that we plan and perform the audit to obtain reasonable assurance about whether the financial statements are free of material misstatement, whether due to error or fraud. The Corporation is not required to have, nor were we engaged to perform, an audit of the Corporation’s internal control over financial reporting. As part of our audits we are required to obtain an understanding of internal control over financial reporting but not for the purpose of expressing an opinion on the effectiveness of the Corporation’s internal control over financial reporting. Accordingly, we express no such opinion.
Our audits included performing procedures to assess the risks of material misstatement of the financial statements, whether due to error or fraud, and performing procedures that respond to those risks. Such procedures included examining, on a test basis, evidence regarding the amounts and disclosures in the financial statements. Our procedures included confirmation of securities owned as of December 31, 2019, by correspondence with the custodian. Our audits also included evaluating the accounting principles used and significant estimates made by management, as well as evaluating the overall presentation of the financial statements. We believe that our audits provide a reasonable basis for our opinion.

We have served as the auditor of one or more Gabelli/GAMCO Funds investment companies since 1992.
Philadelphia, Pennsylvania
February 27, 2020
22
The Gabelli Global Content & Connectivity Fund
Board Consideration andRe-Approval of Investment Advisory Agreement (Unaudited)
During the six months ended December 31, 2019, the Board of Directors of the Corporation approved the continuation of the investment advisory agreement with the Adviser for the Fund on the basis of the recommendation by the directors (the Independent Board Members) who are not interested persons of the Fund. The following paragraphs summarize the material information and factors considered by the Independent Board Members as well as their conclusions relative to such factors.
Nature, Extent, and Quality of Services.The Independent Board Members considered information regarding the Fund’s portfolio managers, the depth of the analyst pool available to the Adviser and the Fund’s portfolio managers, the scope of supervisory, administrative, shareholder, and other services supervised or provided by the Adviser, and the absence of significant service problems reported to the Board. The Independent Board Members noted the experience, length of service, and reputation of the Fund’s portfolio managers.
Investment Performance.The Independent Board Members reviewed the short, medium, and long term performance of the Fund (as of September 30, 2019) against a peer group of six other comparable funds prepared by the Adviser (the Adviser Peer Group), and against a peer group prepared by Broadridge (the Broadridge Performance Peer Group) consisting of all retail and institutional telecommunication funds, regardless of asset size or primary channel of distribution, as represented by the Lipper Telecom Fund Index. The Independent Board Members noted that the Fund’s performance was in the fourth (lowest) quartile for the one, three, five, and ten year periods, as measured against the Adviser Peer Group. Against the Broadridge Performance Peer Group, the Independent Board Members noted that the Fund’s performance was in the fourth quintile for the one, three, and ten year periods and in the fifth quintile for the five year period. The Independent Board Members also noted that had recently changed its name and investment mandate.
Profitability.The Independent Board Members reviewed summary data regarding the profitability of the Fund to the Adviser both with a pro rata administrative charge and with a standalone administrative charge and noted the impact of the expense limitation agreement. The Independent Board Members also noted that a substantial portion of the Fund’s portfolio transactions were executed by an affiliated broker of the Adviser and that another affiliated broker received distribution fees and minor amounts of sales commissions.
Economies of Scale.The Independent Board Members discussed the major elements of the Adviser’s cost structure, the relationship of those elements to potential economies of scale and reviewed data provided by the Adviser.
Sharing of Economies of Scale.The Independent Board Members noted that the investment management fee schedule for the Fund does not take into account any potential economies of scale that may develop.
Service and Cost Comparisons.The Independent Board Members compared the expense ratios of the investment management fee, other expenses, and total expenses of the Fund with similar expense ratios of the Adviser Peer Group and a peer group of four other telecommunications funds selected by Broadridge (the Broadridge Expense Peer Group), and noted that the Adviser’s management fee includes substantially all administrative services of the Fund as well as investment advisory services of the Adviser. The Independent Board Members noted the effect of the expense limitation agreement in place for the Fund. The Independent Board Members noted that although the Fund’s total expense ratio was the highest in the Adviser Peer Group and the second highest in the Broadridge Expense Peer Group, it did not significantly depart from the median total expense ratio for each of the two peer groups, and that the Fund’s size was generally average within both peer groups. The Independent Board Members also noted that the advisory fee structure was the same as that in effect for
23
The Gabelli Global Content & Connectivity Fund
Board Consideration andRe-Approval of Investment Advisory Agreement (Unaudited) (Continued)
most of the Gabelli funds. The Independent Board Members were presented with, but did not consider to be material to their decision, various information comparing the advisory fee with the fee for other types of accounts managed by the Adviser.
Conclusions.The Independent Board Members concluded that the Fund enjoyed highly experienced portfolio management services, good ancillary services, but did not have a favorable performance record. The Independent Board Members also concluded that the Fund’s expense ratios and the profitability to the Adviser of managing the Fund were reasonable, and that economies of scale were not a significant factor in their thinking at this time. The Independent Board Members did not view the potential profitability of ancillary services as material to their decision. On the basis of the foregoing and without assigning particular weight to any single conclusion, the Independent Board Members determined to recommend continuation of the investment advisory agreement to the full Board.
Based on a consideration of all these factors in their totality, the Board Members, including all of the Independent Board Members, determined that the Fund’s advisory fee was fair and reasonable with respect to the quality of services provided and in light of the other factors described above that the Board deemed relevant. Accordingly, the Board Members determined to approve the continuation of the Fund’s Advisory Agreement. The Board Members based their decision on evaluations of all these factors as a whole and did not consider any one factor asall-important or controlling.
24
The Gabelli Global Content & Connectivity Fund
Additional Fund Information (Unaudited)
The business and affairs of the Fund are managed under the direction of the Corporation’s Board of Directors. Information pertaining to the Directors and officers of the Fund is set forth below. The Corporation’s Statement of Additional Information includes additional information about the Fund’s Directors and is available without charge, upon request, by calling800-GABELLI(800-422-3554) or by writing to The Gabelli Global Content & Connectivity Fund at One Corporate Center, Rye, NY 10580-1422.
| | | | | | | | |
Name, Position(s)
Address1
and Age | | Term of Office
and Length of
Time Served2 | | Number of Funds
in Fund Complex
Overseen by Director | | Principal Occupation(s)
During Past Five Years | | Other Directorships Held by Director3 |
| | | | |
INTERESTED DIRECTORS4: | | | | | | | | |
| | | | |
Mario J. Gabelli, CFA Director and Chief Investment Officer Age: 77 | | Since 1993 | | 33 | | Chairman, Chief Executive Officer, and Chief Investment Officer– Value Portfolios of GAMCO Investors, Inc. and Chief Investment Officer– Value Portfolios of Gabelli Funds, LLC and GAMCO Asset Management Inc.; Director/ Trustee or Chief Investment Officer of other registered investment companies within the Gabelli/GAMCO Fund Complex; Chief Executive Officer of GGCP, Inc.; Executive Chairman of Associated Capital Group, Inc. | | Director of Morgan Group Holdings, Inc. (holding company) (2001-2019); Chairman of the Board and Chief Executive Officer of LICT Corp. (multimedia and communication services company); Director of CIBL, Inc. (broadcasting and wireless communications); Director of ICTC Group Inc. (communications) (2013-2018) |
| | | | |
John D. Gabelli Director Age: 75 | | Since 1993 | | 12 | | Senior Vice President of G.research, LLC | | — |
| | | | |
INDEPENDENT DIRECTORS5: | | | | | | | | |
| | | | |
E. Val Cerutti Director Age: 80 | | Since 2001 | | 7 | | Chief Executive Officer of Cerutti Consultants, Inc. | | Director of The LGL Group, Inc. (diversified manufacturing) (1990-2009) |
| | | | |
Anthony J. Colavita6 Director Age: 84 | | Since 1993 | | 20 | | President of the law firm of Anthony J. Colavita, P.C. | | — |
| | | | |
Werner J. Roeder Director Age: 79 | | Since 1993 | | 21 | | Retired physician; Former Vice President of Medical Affairs (Medical Director) of New York Presbyterian/Lawrence Hospital (1999-2014) | | — |
| | | | |
Anthonie C. van Ekris6 Director Age: 85 | | Since 1993 | | 23 | | Chairman and Chief Executive Officer of BALMAC International, Inc. (global import/ export company) | | — |
| | | | |
Salvatore J. Zizza7 Director Age: 74 | | Since 2004 | | 31 | | President of Zizza & Associates Corp. (private holding company); President of Bergen Cove Realty Inc.; Chairman of Harbor Diversified, Inc. (pharmaceuticals) (2009-2018); Chairman of BAM (semiconductor and aerospace manufacturing)(2000-2018); Chairman of Metropolitan Paper Recycling Inc. (recycling) (2005-2014) | | Director and Chairman of Trans- Lux Corporation (business services); Director and Chairman of Harbor Diversified Inc. (pharmaceuticals) (2009-2018) |
25
The Gabelli Global Content & Connectivity Fund
Additional Fund Information (Continued) (Unaudited)
| | | | |
Name, Position(s)
Address1
and Age | | Term of Office and Length of Time Served2 | | Principal Occupation(s)
During Past Five Years |
OFFICERS: | | | | |
| | |
Bruce N. Alpert President Age: 68 | | Since 1993 | | Executive Vice President and Chief Operating Officer of Gabelli Funds, LLC since 1988; Officer of registered investment companies within the Gabelli/GAMCO Fund Complex; Senior Vice President of GAMCO Investors, Inc. since 2008 |
| | |
John C. Ball Treasurer Age: 43 | | Since 2017 | | Treasurer of funds within the Gabelli/GAMCO Fund Complex since 2017; Vice President and Assistant Treasurer of AMG Funds, 2014-2017; Vice President of State Street Corporation, 2007-2014 |
| | |
Agnes Mullady Vice President Age: 61 | | Since 2006 | | Officer of registered investment companies within the Gabelli/GAMCO Fund Complex since 2006; President and Chief Operating Officer of the Fund Division of Gabelli Funds, LLC since 2015; Chief Executive Officer of G.distributors, LLC since 2010; Senior Vice President of GAMCO Investors, Inc. since 2009; Vice President of Gabelli Funds, LLC since 2007; Executive Vice President of Associated Capital Group, Inc. since 2016 |
| | |
Andrea R. Mango Secretary Age: 47 | | Since 2013 | | Vice President of GAMCO Investors, Inc. since 2016; Counsel of Gabelli Funds, LLC since 2013; Secretary of registered investment companies within the Gabelli/GAMCO Fund Complex since 2013; Vice President ofclosed-end funds within the Gabelli/GAMCO Fund Complex since 2014 |
| | |
Richard J. Walz Chief Compliance Officer Age: 60 | | Since 2013 | | Chief Compliance Officer of registered investment companies within the Gabelli/GAMCO Fund Complex since 2013 |
| 1 | Address: One Corporate Center, Rye, NY 10580-1422, unless otherwise noted. |
| 2 | Each Director will hold office for an indefinite term until the earliest of (i) the next meeting of shareholders, if any, called for the purpose of considering the election orre-election of such Director and until the election and qualification of his or her successor, if any, elected at such meeting, or (ii) the date a Director resigns or retires, or a Director is removed by the Board of Directors or shareholders, in accordance with the Corporation’sBy-Laws and Articles of Incorporation. For officers, includes time served in prior officer positions with the Fund. Each officer will hold office for an indefinite term until the date he or she resigns or retires or until his or her successor is elected and qualified. |
| 3 | This column includes only directorships of companies required to report to the SEC under the Securities Exchange Act of 1934, as amended, i.e., public companies, or other investment companies registered under the 1940 Act. |
| 4 | “Interested person” of the Corporation as defined in the 1940 Act. Messrs. Mario J. Gabelli and John D. Gabelli, who are brothers, are each considered an “interested person” because of their affiliation with Gabelli Funds, LLC which acts as the Corporation’s investment adviser. |
| 5 | Directors who are not interested persons are considered “Independent” Directors. |
| 6 | Mr. Colavita’s son, Anthony S. Colavita, serves as a director of other funds in the Gabelli/GAMCO Fund Complex. Mr. van Ekris is an independent director of Gabelli International Ltd., Gabelli Fund LDC, GAMA Capital Opportunities Master Ltd., and GAMCO International SICAV, which may be deemed to be controlled by Mario J. Gabelli and/or affiliates and, in that event, would be deemed to be under common control with the Fund’s Adviser. |
| 7 | Mr. Zizza is an independent director of Gabelli International Ltd., which may be deemed to be controlled by Mario J. Gabelli and/or affiliates and in that event would be deemed to be under common control with the Fund’s Adviser. On September 9, 2015, Mr. Zizza entered into a settlement with the SEC to resolve an inquiry relating to an alleged violation regarding the making of false statements or omissions to the accountants of a company concerning a related party transaction. The company in question is not an affiliate of, nor has any connection to, the Fund. Under the terms of the settlement, Mr. Zizza, without admitting or denying the SEC’s findings and allegation, paid $150,000 and agreed to cease and desist committing or causing any future violations of Rule13b2-2 of the Securities Exchange Act of 1934, as amended. The Board has discussed this matter and has determined that it does not disqualify Mr. Zizza from serving as an Independent Director. |
26
Gabelli/GAMCO Funds and Your Personal Privacy
Who are we?
The Gabelli/GAMCO Funds are investment companies registered with the Securities and Exchange Commission under the Investment Company Act of 1940. We are managed by Gabelli Funds, LLC, which is affiliated with GAMCO Investors, Inc., a publicly held company with subsidiaries and affiliates that provide investment advisory services for a variety of clients.
What kind ofnon-public information do we collect about you if you become a fund shareholder?
If you apply to open an account directly with us, you will be giving us somenon-public information about yourself. Thenon-public information we collect about you is:
| | ● | | Information you give us on your application form. This could include your name, address, telephone number, social security number, bank account number, and other information. | |
| | ● | | Information about your transactions with us, any transactions with our affiliates, and transactions with the entities we hire to provide services to you. This would include information about the shares that you buy or redeem. If we hire someone else to provide services — like a transfer agent — we will also have information about the transactions that you conduct through them. | |
What information do we disclose and to whom do we disclose it?
We do not disclose anynon-public personal information about our customers or former customers to anyone other than our affiliates, our service providers who need to know such information, and as otherwise permitted by law. If you want to find out what the law permits, you can read the privacy rules adopted by the Securities and Exchange Commission. They are in volume 17 of the Code of Federal Regulations, Part 248. The Commission often posts information about its regulations on its website, www.sec.gov.
What do we do to protect your personal information?
We restrict access tonon-public personal information about you to the people who need to know that information in order to provide services to you or the fund and to ensure that we are complying with the laws governing the securities business. We maintain physical, electronic, and procedural safeguards to keep your personal information confidential.
This page was intentionally left blank.
This page was intentionally left blank.
THE GABELLI GLOBAL CONTENT & CONNECTIVITY FUND
One Corporate Center
Rye, NY 10580-1422
Portfolio Management Team Biographies
Mario J. Gabelli, CFA,is Chairman, Chief Executive Officer, and Chief Investment Officer - Value Portfolios of GAMCO Investors, Inc. that he founded in 1977, and Chief Investment Officer - Value Portfolios of Gabelli Funds, LLC and GAMCO Asset Management Inc. He is also Executive Chairman of Associated Capital Group, Inc. Mr. Gabelli is a summa cum laude graduate of Fordham University and holds an MBA degree from Columbia Business School and Honorary Doctorates from Fordham University and Roger Williams University.
Evan D. Miller, CFA,joined G.research, LLC in 2002 as a research analyst following the telecommunications industry on a global basis. Currently, he continues to specialize in the industry and also serves as a portfolio manager of Gabelli Funds, LLC and the Fund. Prior to joining Gabelli, his career spanned nearly a quarter century in the telecommunications industry with corporate strategy and business development positions. Mr. Miller holds an MBA in Finance from the University of Chicago and a BA in Economics from Northwestern University.
Sergey Dluzhevskiy, CFA, CPA,joined G.research, LLC in 2005 as a research analyst covering the North American telecommunications industry. Currently, he continues to specialize in the industry and also serves as a portfolio manager of Gabelli Funds, LLC and the Fund. Prior to joining Gabelli, Mr. Dluzhevskiy was a senior accountant at Deloitte. He received his undergraduate degree from Case Western Reserve University and an MBA at the Wharton School of the University of Pennsylvania.
Brett Harrissjoined G. Research as a research analyst in 2008 covering Media and Entertainment. Currently, he oversees the digital research team responsible for covering the Telecommunication, Media, Technology, and Gaming & Lodging industries, and also serves as a portfolio manager of Gabelli Funds, LLC and the Fund. Previously, he worked as a financial analyst at JetBlue and as an investment banker at JPMorgan Chase. Mr. Harris received his BA from Columbia University in Economics and his MBA from Columbia Business School in Finance and Economics.
We have separated the portfolio managers’ commentary from the financial statements and investment portfolio due to corporate governance regulations stipulated by the Sarbanes-Oxley Act of 2002. We have done this to ensure that the content of the portfolio managers’ commentary is unrestricted. Both the commentary and the financial statements, including the portfolio of investments, will be available on our website at www.gabelli.com.
2019 TAX NOTICE TO SHAREHOLDERS(Unaudited)
For the year ended December 31, 2019, the Fund paid to shareholders ordinary income distributions (comprised of net investment income and short term capital gains) totaling $0.4826, $0.4904, $0.1217, and $0.6297, per share for Class AAA, Class A, Class C, and Class I Shares, respectively, and long term capital gains totaling $2,950,703, or the maximum allowable. The distribution of long term capital gains has been designated as a capital gain dividend by the Fund’s Board of Directors. For the year ended December 31, 2019, 27.75% of the ordinary income distribution qualifies for the dividends received deduction available to corporations. The Fund designates 75.25% of the ordinary income distribution as qualified dividend income pursuant to the Jobs and Growth Tax Relief Reconciliation Act of 2003. The Fund designates 0.93% of the ordinary income distribution as qualified interest income pursuant to the Tax Relief, Unemployment Reauthorization, and Job Creation Act of 2010. Also for the year of 2019, the Fund did not have foreign tax credits.
U.S. Government Income:
The percentage of the ordinary income distribution paid by the Fund during the year ended December 31, 2019 which was derived from U.S. Treasury securities was 0.60%. Such income is exempt from state and local tax in all states. However, many states, including New York and California, allow a tax exemption for a portion of the income earned only if a mutual fund has invested at least 50% of its assets at the end of each quarter of the Fund’s fiscal year in U.S. Government securities. The Fund did not meet this strict requirement in 2019. The percentage of U.S. Government securities held as of December 31, 2019 was 1.20%. Due to the diversity in state and local tax law, it is recommended that you consult your personal tax adviser as to the applicability of the information provided to your specific situation.
GAMCO Global Series Funds, Inc.
THE GABELLI GLOBAL CONTENT & CONNECTIVITY FUND
One Corporate Center
Rye, New York 10580-1422
| t | 800-GABELLI(800-422-3554) |
Net Asset Value per share available daily
by calling800-GABELLI after 7:00 P.M.
| | |
BOARD OF DIRECTORS Mario J. Gabelli, CFA Chairman and Chief Executive Officer, GAMCO Investors, Inc. Executive Chairman, Associated Capital Group, Inc. E. Val Cerutti Chief Executive Officer, Cerutti Consultants, Inc. Anthony J. Colavita President, Anthony J. Colavita, P.C. John D. Gabelli Senior Vice President, G.research, LLC Werner J. Roeder Former Medical Director, Lawrence Hospital Anthonie C. van Ekris Chairman, BALMAC International, Inc. Salvatore J. Zizza Chairman, Zizza & Associates Corp. | | OFFICERS Bruce N. Alpert President John C. Ball Treasurer Agnes Mullady Vice President Andrea R. Mango Secretary Richard J. Walz Chief Compliance Officer DISTRIBUTOR G.distributors, LLC CUSTODIAN State Street Bank and Trust Company TRANSFER AGENT AND DIVIDEND DISBURSING AGENT DST Asset Manager Solutions, Inc. LEGAL COUNSEL Skadden, Arps, Slate, Meagher & Flom LLP |
This report is submitted for the general information of the shareholders of The Gabelli Global Content & Connectivity Fund. It is not authorized for distribution to prospective investors unless preceded or accompanied by an effective prospectus.
GAB401Q419AR

The Gabelli Global Growth Fund
Annual Report — December 31, 2019
(Y)our Portfolio Management Team
| | | | | | | | |
| |  | |  | |  | | |
| | | | |
| | Caesar M. P. Bryan Portfolio Manager | | Howard F. Ward, CFA Portfolio Manager | | Christopher D. Ward, CFA Associate Portfolio Manager | | |
To Our Shareholders,
For the year ended December 31, 2019, the net asset value (NAV) per Class I Share of The Gabelli Global Growth Fund (formerly The GAMCO Global Growth Fund) increased 31.0% compared with an increase of 26.6% for the Morgan Stanley Capital International (MSCI) All Country (AC) World Index. Other classes of shares are available. See page 4 for performance information for all classes.
Enclosed are the financial statements, including the schedule of investments, as of December 31, 2019.
Performance Discussion (Unaudited)
The Fund’s investment objective is to provide investors with appreciation of capital. Current income is a secondary objective of the Fund.
The Fund’s investment strategy is to invest at least 65% of its total assets in common stocks of companies, which the portfolio managers believe are likely to have rapid growth in revenues and earnings and potential for above average capital appreciation or are undervalued. The Global Growth Fund invests primarily in common stocks of foreign and domestic small-capitalization,mid-capitalization, and large-capitalization issuers. As a “global” fund, the Fund invests in securities of issuers, or related investments thereof, located in at least three countries, and at least 40% of the Fund’s total net assets is invested in securities ofnon-U.S. issuers.
|
Beginning on January 1, 2021, as permitted by regulations adopted by the Securities and Exchange Commission, paper copies of the Fund’s annual and semiannual shareholder reports will no longer be sent by mail, unless you specifically request paper copies of the reports. Instead, the reports will be made available on the Fund’s website (www.gabelli.com), and you will be notified by mail each time a report is posted and provided with a website link to access the report. If you already elected to receive shareholder reports electronically, you will not be affected by this change and you need not take any action. To elect to receive all future reports on paper free of charge, please contact your financial intermediary, or, if you invest directly with the Fund, you may call800-422-3554 or send an email request to info@gabelli.com. |
The S&P 500 returned 13.7% through the first quarter, the best first quarter since 1998. Just weeks after suggesting the Fed balance sheet runoff was on “autopilot”, and hiking rates for the ninth time this cycle, the Fed went out of its way to soothe markets. Fed chairman Jerome Powell clarified his intentions, to be patient and flexible with the balance sheet. Fed dot projections became considerably more dovish, with rate hike projections for 2019 decreasing from two to zero in just three months. This Fed pivot resulted in a brief cyclical surge, led by industrials and energy, as the10-year yield rose from 2.55% to 2.78%. February and March proved cyclical leadership to be quite temporary, as market leadership swiftly returned to more defensive areas such as technology, utilities, consumer staples, and REITs, consistent with a falling10-year yield from 2.78% to 2.40%. Domestic and Global PMIs continued to decline, consistent with S&P 500 earnings estimates which were steadily revised lower, from $172 in December to $166 at the end of the first quarter.
Global Purchasing Manager Indices (PMIs) continued to deteriorate in the second quarter reflecting a slowing economy. With leading economic indicators declining and China trade tensions escalating, CEO confidence (as measured by Chief Executive Magazine) declined. However, the market interpreted “bad news” as “good news” as the likelihood of a Fed rate cut increased. As a result, the “Fed relief rally” continued through the second quarter with the market returning 4.3%, fueled by multiple expansion.
For those anticipating more rate cuts, the Fed delivered in the third quarter with not one, but two, 25 basis point cuts. Fed Chairman Powell highlighted low unemployment and strong consumer spending, but acknowledged weakening capex, softer exports, muted inflation and geopolitical risks were sufficient cause for action. Indeed, the third quarter was rife with geopolitical turmoil. On August 1, the market reacted swiftly and violently to the escalating trade tensions between the U.S. and China. President Trump announced an expansion of tariffs to cover nearly 100% of Chinese exports. China responded, in an attempt to offset the tariff impact, by allowing the yuan to depreciate below the critical7-to-1 U.S. dollar threshold. Markets panicked, fearing a currency war, which would have triggered a devastating ripple effect through the global economy. The S&P 500 lost over 6% as the debacle unfolded. The remainder of the third quarter was no less dramatic. Half of Saudi Arabia’s oil production was taken offline bylow-altitude missiles and drones, likely initiated by Iran, testing the United States’ commitment to defend theoil-rich monarchies of the Persian Gulf. Hong Kong demonstrations intensified, leading up to China’s 70th anniversary celebrations in October. Brexit negotiations remained contentious and unresolved as the October 31 deadline approached. And on the domestic front, House Majority Speaker Nancy Pelosi announced the start of a formal impeachment inquiry into President Trump. Despite a decelerating economy and rising geopolitical risks, which drove the10-year yield from 2.05% to 1.67% in the quarter, the S&P 500 finished the quarter just 1.5% below itsall-time high.
The S&P 500 finished the year strong with a 9.1% return in the fourth quarter. September PMIs (released in October) showed improvement, which some interpreted as a PMI trough, fueling a rally in cyclical stocks. Indeed, early cyclical industries, such as housing, had benefitted from the decline in rates over the previous fourteen months. Consumer health metrics remained strong, supported by record low unemployment, record high net worth, and record low debt service. Consumer confidence remained stable at an elevated level. Average hourly earnings grew 3%, a healthy level and well below the recession-inducing threshold of 4%. Oil prices remained consumer friendly. As a result, inflation remained tame, below the Fed’s symmetric 2% target. In contrast, business investment, exports and manufacturing remained weak. Unlike consumer confidence, CEO confidence continued to decline reflecting uncertainty surrounding geopolitics and the election.
2
SUMMARY
Multiple expansion did the heavy lifting in 2019, with earnings contributing less than 2% of the S&P 500’s 31% total return. In fact, 85% of the S&P 500 experienced multiple expansion. Multiple expansion is typically associated with receding market risks. Indeed, investor sentiment improved throughout the year driven by a number of catalysts, including the Fed pivot in January, improving economic data in September, the expected passing of the USMCA trade deal, and an eleventh hour Phase 1 trade agreement with China in December. In addition, investor sentiment, a contrarian indicator rose from bearish in December of 2018 to bullish twelve months later. In the fourth quarter, as a result of improving investor sentiment, corporate credit spreads and high yield credit default swap spreads sat at historic lows, suggesting very little risk was priced into the market. Given elevated P/E multiples and an already low amount of risk priced into the market, it became difficult to envision risks receding any further to fuel continued multiple expansion. For these reasons, we maintained a relatively defensive posture throughout 2019 by limiting beta exposure and selling positions whose valuations became unjustifiable. We believed this to be prudent given leading economic indicators (PMIs) in contraction territory (under 50) and valuations for certain growth stocks returning to peak levels.
Selected holdings that contributed positively to performance in 2019 were: Microsoft Corp. (6.0% of net assets as of December 31, 2019), the world’s largest software company which develops software products for computing devices ranging from PCs to servers to its Xbox game console. The transition from Office to cloud-based Office 365 is resulting in growth in users, average revenue per user, and recurring revenue; IHS Markit Ltd. (3.1%) is a world leader in critical information, analytics and solutions for major industries that drive economies worldwide. Following the merger with Markit in 2016, the combined company also provides financial services clients solutions around securities pricing, reference data, indices, valuation and trading services, trade processing, enterprise software and managed services.; and AON plc. (3.1%) is a leading global professional services firm that provides advice and solutions to clients focused on risk, retirement and health. The company’s revenue mix is transitioning to higher margin, less capital intensive businesses which we believe will result in strong free cash flow generation.
Some of our weaker performing holdings during the year were: Jardine Matheson Holdings Ltd. (1.4%), whose businesses range from automobile and hotels to supermarkets all around Asia. The conglomerate’s volatility was an embodiment of intensifying global trade tensions, prolonged protest in Hong Kong and slowing auto sales; New Relic Inc. (no longer held as of December 31, 2019), an American software analytics company that had a negative return on equity and negative net margin; and Verizon Communications Inc. (no longer held), an American multinational telecommunications conglomerate, has a high level of debt and large one off items that impacted financial results.
Thank you for your investment in The Gabelli Global Growth Fund.
We appreciate your confidence and trust.
3
Comparative Results
| | | | | | | | | | | | | | | | | | | | | | | | | |
Average Annual Returns through December 31, 2019 (a) (Unaudited) | | Since
Inception
(2/7/94) |
| | | 1 Year | | 5 Year | | 10 Year | | 15 Year |
Class I (GGGIX) | | | | 31.03 | % | | | | 10.99 | % | | | | 11.43 | % | | | | 8.85 | % | | | | 9.53 | % |
Class AAA (GICPX) | | | | 30.73 | | | | | 10.39 | | | | | 10.96 | | | | | 8.50 | | | | | 9.33 | |
MSCI AC World Index | | | | 26.60 | | | | | 8.41 | | | | | 8.79 | | | | | 6.86 | | | | | 7.06 | (b) |
Lipper GlobalLarge-Cap Growth Fund Classification | | | | 30.32 | | | | | 10.19 | | | | | 10.18 | | | | | 8.05 | | | | | 7.75 | |
Class A (GGGAX) | | | | 30.74 | | | | | 10.39 | | | | | 10.97 | | | | | 8.50 | | | | | 9.34 | |
With sales charge (c) | | | | 23.22 | | | | | 9.09 | | | | | 10.31 | | | | | 8.07 | | | | | 9.09 | |
Class C (GGGCX) | | | | 29.82 | | | | | 9.58 | | | | | 10.15 | | | | | 7.69 | | | | | 8.71 | |
With contingent deferred sales charge (d) | | | | 28.82 | | | | | 9.58 | | | | | 10.15 | | | | | 7.69 | | | | | 8.71 | |
In the current prospectuses dated April 30, 2019, as amended by the supplement dated December 3, 2019, the gross expense ratios for Class AAA, A, C, and I Shares are 1.68%, 1.68%, 2.43%, and 1.43%, respectively, and the net expense ratio for all share classes after contractual reimbursements by Gabelli Funds, LLC, (the “Adviser”) is 0.90%. See page 11 for the expense ratios for the year ended December 31, 2019. The contractual reimbursements are in effect through April 30, 2021. Class AAA and Class I Shares do not have a sales charge. The maximum sales charge for Class A Shares and Class C Shares is 5.75% and 1.00%, respectively.
| | (a) | Returns represent past performance and do not guarantee future results. Total returns and average annual returns reflect changes in share price, reinvestment of distributions, and are netof expenses. Investment returns and the principal value of an investment will fluctuate. When shares are redeemed, they may be worth more or less than their original cost. Currentperformance may be lower or higher than the performance data presented. Visit www.gabelli.com for performance information as of the most recent month end. Returns would have beenlower had the Adviser not reimbursed certain expenses. The Fund imposes a 2% redemption fee on shares sold or exchanged within seven days after the date of purchase. Investors shouldcarefully consider the investment objectives, risks, charges, and expenses of the Fund before investing. The prospectuses contain information about these and other matters and should beread carefully before investing. To obtain a prospectus, please visit our website at www.gabelli.com. Investing in foreign securities involves risks not ordinarily associated with investments in domestic issues, including currency fluctuation, economic, and political risks. The Class AAA Share NAVs are used to calculate performance for the periods prior to the issuance of Class A Shares, Class C Shares, and Class I Shares on March 2, 2000, March 12, 2000, and January 11, 2008, respectively. The actual performance of the Class A and Class C Shares would have been lower due to the additional fees and expenses associated with these classes of shares. The actual performance of Class I Shares would have been higher due to lower expenses related to this class of shares. The MSCI AC World Index is an unmanaged market capitalization weighted index that is designed to measure the equity market performance of developed and emerging markets. The MSCI AC World Index consists of 45 country indices comprising 24 developed and 21 emerging market country indices. The Lipper GlobalLarge-Cap Growth Fund Classification reflects the performance of mutual funds classified in this particular category. Dividends are considered reinvested. You cannot invest directly in an index. | |
| | (b) | The MSCI AC World Index since inception performance is as of January 31, 1994. | |
| | (c) | Performance results include the effect of the maximum 5.75% sales charge at the beginning of the period. | |
| | (d) | Assuming payment of the 1% maximum contingent deferred sales charge imposed on redemptions made within one year of purchase. | |
COMPARISON OF CHANGE IN VALUE OF A $10,000 INVESTMENT IN
THE GABELLI GLOBAL GROWTH FUND (CLASS AAA SHARES), MSCI AC WORLD INDEX, AND
LIPPER GLOBALLARGE-CAP GROWTH FUND CLASSIFICATION (Unaudited)
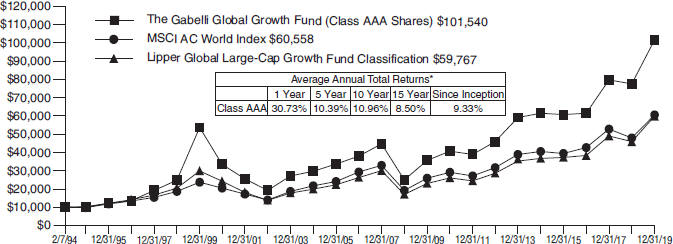
| | * | Past performance is not predictive of future results. The performance tables and graph do not reflect the deduction of taxes that a shareholder would pay on Fund distributions or the redemption of Fund shares. | |
4
The Gabelli Global Growth Fund
Disclosure of Fund Expenses (Unaudited)
For the Six Month Period from July 1, 2019 through December 31, 2019 Expense Table
We believe it is important for you to understand the impact of fees and expenses regarding your investment. All mutual funds have operating expenses. As a shareholder of a fund, you incur ongoing costs, which include costs for portfolio management, administrative services, and shareholder reports (like this one), among others. Operating expenses, which are deducted from a fund’s gross income, directly reduce the investment return of a fund. When a fund’s expenses are expressed as a percentage of its average net assets, this figure is known as the expense ratio. The following examples are intended to help you understand the ongoing costs (in dollars) of investing in your Fund and to compare these costs with those of other mutual funds. The examples are based on an investment of $1,000 made at the beginning of the period shown and held for the entire period.
The Expense Table below illustrates your Fund’s costs in two ways:
Actual Fund Return:This section provides information about actual account values and actual expenses. You may use this section to help you to estimate the actual expenses that you paid over the period after any fee waivers and expense reimbursements. The “Ending Account Value” shown is derived from the Fund’sactualreturn during the past six months, and the “Expenses Paid During Period” shows the dollar amount that would have been paid by an investor who started with $1,000 in the Fund. You may use this information, together with the amount you invested, to estimate the expenses that you paid over the period.
To do so, simply divide your account value by $1,000 (for example, an $8,600 account value divided by $1,000 = 8.6), then multiply the result by the number given for your Fund under the heading “Expenses Paid During Period” to estimate the expenses you paid during this period.
Hypothetical 5% Return:This section provides information about hypothetical account values and
hypothetical expenses based on the Fund’s actual expense ratio. It assumes a hypothetical annualized return of 5% before expenses during the period shown. In this case – because the hypothetical return used isnotthe Fund’s actual return – the results do not apply to your investment and you cannot use the hypothetical account value and expense to estimate the actual ending account balance or expenses you paid for the period. This example is useful in making comparisons of the ongoing costs of investing in the Fund and other funds. To do so, compare this 5% hypothetical example with the 5% hypothetical examples that appear in shareholder reports of other funds.
Please note that the expenses shown in the table are meant to highlight your ongoing costs only and do not reflect any transactional costs such as sales charges (loads), redemption fees, or exchange fees, if any, which are described in the Prospectus. If these costs were applied to your account, your costs would be higher. Therefore, the 5% hypothetical return is useful in comparing ongoing costs only, and will not help you determine the relative total costs of owning different funds. The “Annualized Expense Ratio” represents the actual expenses for the last six months and may be different from the expense ratio in the Financial Highlights which is for the year ended December 31, 2019.
| | | | | | | | | | | | | | | | | | | | |
| | | Beginning
Account Value
07/01/19 | | Ending
Account Value
12/31/19 | | Annualized
Expense
Ratio | | Expenses
Paid During
Period* |
| The Gabelli Global Growth Fund |
Actual Fund Return | |
Class AAA | | | | $1,000.00 | | | | | $1,071.40 | | | | | 1.19 | % | | | | $6.21 | |
Class A | | | | $1,000.00 | | | | | $1,071.70 | | | | | 1.19 | % | | | | $6.21 | |
Class C | | | | $1,000.00 | | | | | $1,068.30 | | | | | 1.77 | % | | | | $9.23 | |
Class I | | | | $1,000.00 | | | | | $1,072.60 | | | | | 0.98 | % | | | | $5.12 | |
Hypothetical 5% Return | |
Class AAA | | | | $1,000.00 | | | | | $1,019.21 | | | | | 1.19 | % | | | | $6.06 | |
Class A | | | | $1,000.00 | | | | | $1,019.21 | | | | | 1.19 | % | | | | $6.06 | |
Class C | | | | $1,000.00 | | | | | $1,016.28 | | | | | 1.77 | % | | | | $9.00 | |
Class I | | | | $1,000.00 | | | | | $1,020.27 | | | | | 0.98 | % | | | | $4.99 | |
| * | Expenses are equal to the Fund’s annualized expense ratio for the last six months multiplied by the average account value over the period, multiplied by the number of days in the most recent fiscal half year (184 days), then divided by 365. |
5
Summary of Portfolio Holdings (Unaudited)
The following table presents portfolio holdings as a percent of net assets as of December 31, 2019:
| | | | |
The Gabelli Global Growth Fund | | | | |
Information Technology | | | 25.5 | % |
Consumer Discretionary | | | 19.3 | % |
Health Care | | | 13.7 | % |
Consumer Staples | | | 11.1 | % |
Communication Services | | | 7.4 | % |
Financials | | | 7.1 | % |
Industrials | | | 5.8 | % |
| | | | |
Real Estate | | | 5.1 | % |
Utilities | | | 4.7 | % |
U.S. Government Obligations | | | 0.4 | % |
Other Assets and Liabilities (Net) | | | (0.1 | )% |
| | | | |
| | | 100.0 | % |
| | | | |
The Fund files a complete schedule of portfolio holdings with the Securities and Exchange Commission (the SEC) for the first and third quarters of each fiscal year on FormN-PORT. Shareholders may obtain this information at www.gabelli.com or by calling the Fund at800-GABELLI(800-422-3554). The Fund’s FormN-PORT is available on the SEC’s website at www.sec.gov and may also be reviewed and copied at the SEC’s Public Reference Room in Washington, DC. Information on the operation of the Public Reference Room may be obtained by calling800-SEC-0330.
Proxy Voting
The Fund files FormN-PX with its complete proxy voting record for the twelve months ended June 30, no later than August 31 of each year. A description of the Fund’s proxy voting policies, procedures, and how the Fund voted proxies relating to portfolio securities is available without charge, upon request, by (i) calling800-GABELLI(800-422-3554); (ii) writing to The Gabelli Funds at One Corporate Center, Rye, NY 10580-1422; or (iii) visiting the SEC’s website at www.sec.gov.
6
The Gabelli Global Growth Fund
Schedule of Investments — December 31, 2019
| | | | | | | | | | | | |
| Shares | | | | | Cost | | | Market
Value | |
| | | | COMMON STOCKS — 99.7% | | | | | |
| | | | INFORMATION TECHNOLOGY — 25.5% | | | | | |
| | 5,400 | | | Adobe Inc.† | | $ | 799,715 | | | $ | 1,780,974 | |
| | 2,680 | | | Adyen NV† | | | 1,775,779 | | | | 2,197,510 | |
| | 9,910 | | | Apple Inc. | | | 969,141 | | | | 2,910,071 | |
| | 6,000 | | | Applied Materials Inc. | | | 333,397 | | | | 366,240 | |
| | 7,000 | | | Atlassian Corp. plc, Cl. A† | | | 724,536 | | | | 842,380 | |
| | 10,900 | | | Fidelity National Information
Services Inc. | | | 1,449,971 | | | | 1,516,081 | |
| | 12,900 | | | Fiserv Inc.† | | | 816,334 | | | | 1,491,627 | |
| | 8,200 | | | Keyence Corp. | | | 343,743 | | | | 2,904,772 | |
| | 6,700 | | | Mastercard Inc., Cl. A | | | 93,730 | | | | 2,000,553 | |
| | 43,000 | | | Microsoft Corp. | | | 1,888,936 | | | | 6,781,100 | |
| | 4,300 | | | NVIDIA Corp. | | | 846,929 | | | | 1,011,790 | |
| | 9,800 | | | PayPal Holdings Inc.† | | | 647,003 | | | | 1,060,066 | |
| | 2,600 | | | ServiceNow Inc.† | | | 431,203 | | | | 734,032 | |
| | 17,000 | | | Visa Inc., Cl. A | | | 301,339 | | | | 3,194,300 | |
| | | | | | | | | | | | |
| | | | TOTAL INFORMATION
TECHNOLOGY | | | 11,421,756 | | | | 28,791,496 | |
| | | | | | | | | | | | |
| | | | CONSUMER DISCRETIONARY — 19.3% | | | | | |
| | 6,700 | | | adidas AG | | | 1,745,435 | | | | 2,177,970 | |
| | 16,455 | | | Alibaba Group Holding Ltd., ADR† | | | 3,096,223 | | | | 3,490,105 | |
| | 1,910 | | | Amazon.com Inc.† | | | 1,776,115 | | | | 3,529,374 | |
| | 2,000 | | | Christian Dior SE | | | 290,698 | | | | 1,024,790 | |
| | 2,020 | | | Kering SA | | | 1,094,445 | | | | 1,325,972 | |
| | 12,800 | | | Lululemon Athletica Inc.† | | | 1,704,237 | | | | 2,965,376 | |
| | 4,400 | | | LVMH Moet Hennessy Louis Vuitton SE | | | 738,860 | | | | 2,044,285 | |
| | 10,300 | | | McDonald’s Corp. | | | 1,965,389 | | | | 2,035,383 | |
| | 41,000 | | | Puma SE | | | 2,488,061 | | | | 3,143,410 | |
| | | | | | | | | | | | |
| | | | TOTAL CONSUMER
DISCRETIONARY | | | 14,899,463 | | | | 21,736,665 | |
| | | | | | | | | | | | |
| | | | HEALTH CARE — 13.7% | | | | | | | | |
| | 46,900 | | | Bristol-Myers Squibb Co. | | | 2,560,790 | | | | 3,010,511 | |
| | 7,900 | | | Danaher Corp. | | | 694,381 | | | | 1,212,492 | |
| | 8,400 | | | Edwards Lifesciences Corp.† | | | 1,142,342 | | | | 1,959,636 | |
| | 9,600 | | | Merck & Co. Inc. | | | 821,149 | | | | 873,120 | |
| | 8,150 | | | Thermo Fisher Scientific Inc. | | | 1,629,374 | | | | 2,647,691 | |
| | 10,200 | | | UnitedHealth Group Inc. | | | 2,494,606 | | | | 2,998,596 | |
| | 20,600 | | | Zoetis Inc. | | | 1,148,479 | | | | 2,726,410 | |
| | | | | | | | | | | | |
| | | | TOTAL HEALTH CARE | | | 10,491,121 | | | | 15,428,456 | |
| | | | | | | | | | | | |
| | | | CONSUMER STAPLES — 11.1% | | | | | |
| | 4,300 | | | Costco Wholesale Corp. | | | 674,475 | | | | 1,263,856 | |
| | 244,000 | | | Davide Campari-Milano SpA | | | 1,587,841 | | | | 2,227,886 | |
| | 11,200 | | | L’Oreal SA | | | 2,058,684 | | | | 3,316,657 | |
| | 34,900 | | | Nestlé SA | | | 2,853,879 | | | | 3,778,489 | |
| | 7,756 | | | Pernod Ricard SA | | | 917,464 | | | | 1,386,771 | |
| | 2,600 | | | The Estee Lauder Companies Inc.,
Cl. A | | | 450,236 | | | | 537,004 | |
| | | | | | | | | | | | |
| | | | TOTAL CONSUMER STAPLES | | | 8,542,579 | | | | 12,510,663 | |
| | | | | | | | | | | | |
| | | | | | | | | | | | |
| Shares | | | | | Cost | | | Market
Value | |
| | | | COMMUNICATION SERVICES — 7.4% | | | | | |
| | 810 | | | Alphabet Inc., Cl. A† | | $ | 238,018 | | | $ | 1,084,906 | |
| | 1,116 | | | Alphabet Inc., Cl. C† | | | 955,699 | | | | 1,492,114 | |
| | 13,800 | | | Facebook Inc., Cl. A† | | | 2,568,615 | | | | 2,832,450 | |
| | 3,700 | | | IAC/InterActiveCorp.† | | | 561,808 | | | | 921,707 | |
| | 1,700 | | | Netflix Inc.† | | | 455,175 | | | | 550,069 | |
| | 13,200 | | | Tencent Holdings Ltd | | | 552,615 | | | | 636,259 | |
| | 5,900 | | | The Walt Disney Co. | | | 779,629 | | | | 853,317 | |
| | | | | | | | | | | | |
| | | | TOTAL COMMUNICATION SERVICES | | | 6,111,559 | | | | 8,370,822 | |
| | | | | | | | | | | | |
| | | | FINANCIALS — 7.1% | | | | | | | | |
| | 103,000 | | | AIA Group Ltd. | | | 1,060,563 | | | | 1,081,247 | |
| | 16,900 | | | Aon plc | | | 2,879,540 | | | | 3,520,101 | |
| | 31,200 | | | HDFC Bank Ltd., ADR | | | 1,565,157 | | | | 1,977,144 | |
| | 27,000 | | | Investor AB, Cl. B | | | 1,270,691 | | | | 1,473,616 | |
| | | | | | | | | | | | |
| | | | TOTAL FINANCIALS | | | 6,775,951 | | | | 8,052,108 | |
| | | | | | | | | | | | |
| | | | INDUSTRIALS — 5.8% | | | | | | | | |
| | 45,800 | | | IHS Markit Ltd.† | | | 2,482,225 | | | | 3,451,030 | |
| | 27,500 | | | Jardine Matheson Holdings Ltd. | | | 1,334,238 | | | | 1,529,000 | |
| | 10,200 | | | United Technologies Corp. | | | 1,515,567 | | | | 1,527,552 | |
| | | | | | | | | | | | |
| | | | TOTAL INDUSTRIALS | | | 5,332,030 | | | | 6,507,582 | |
| | | | | | | | | | | | |
| | | | REAL ESTATE — 5.1% | | | | | | | | |
| | 12,700 | | | American Tower Corp., REIT | | | 2,027,077 | | | | 2,918,714 | |
| | 20,000 | | | Crown Castle International Corp.,
REIT | | | 2,343,963 | | | | 2,843,000 | |
| | | | | | | | | | | | |
| | | | TOTAL REAL ESTATE | | | 4,371,040 | | | | 5,761,714 | |
| | | | | | | | | | | | |
| | | | UTILITIES — 4.7% | | | | | | | | |
| | 18,000 | | | American Water Works Co. Inc | | | 1,737,343 | | | | 2,211,300 | |
| | 12,600 | | | NextEra Energy Inc. | | | 2,285,069 | | | | 3,051,216 | |
| | | | | | | | | | | | |
| | | | TOTAL UTILITIES | | | 4,022,412 | | | | 5,262,516 | |
| | | | | | | | | | | | |
| | | | TOTAL COMMON STOCKS | | | 71,967,911 | | | | 112,422,022 | |
| | | | | | | | | | | | |
| | | |
Principal
Amount | | | | | | | | | |
| | | | U.S. GOVERNMENT OBLIGATIONS — 0.4% | |
| | $ 423,000 | | | U.S. Treasury Bills, 1.487% to 1.557%††, 02/20/20 to 03/26/20 | | | 421,628 | | | | 421,633 | |
| | | | | | | | | | | | |
| | | | TOTAL
INVESTMENTS —100.1% | | $ | 72,389,539 | | | | 112,843,655 | |
| | | | | | | | | | | | |
| | | | Other Assets and Liabilities (Net) — (0.1)% | | | | | | | (60,452 | ) |
| | | | | | | | | | | | |
| | | | NET ASSETS — 100.0%. | | | | | | $ | 112,783,203 | |
| | | | | | | | | | | | |
| † | Non-income producing security. |
| †† | Represents annualized yields at dates of purchase. |
See accompanying notes to financial statements.
7
The Gabelli Global Growth Fund
Schedule of Investments (Continued) — December 31, 2019
| ADR | American Depositary Receipt |
| REIT | Real Estate Investment Trust |
| | | | | | | | |
| Geographic Diversification | | % of
Market
Value | | | Market
Value | |
| | |
United States | | | 58.8 | % | | $ | 66,348,886 | |
| | |
Europe | | | 27.5 | | | | 31,068,486 | |
| | |
Asia/Pacific | | | 8.5 | | | | 9,556,135 | |
| | |
Canada | | | 2.6 | | | | 2,965,376 | |
| | |
Japan | | | 2.6 | | | | 2,904,772 | |
| | | | | | | | |
| | | 100.0 | % | | $ | 112,843,655 | |
| | | | | | | | |
See accompanying notes to financial statements.
8
The Gabelli Global Growth Fund
Statement of Assets and Liabilities
December 31, 2019
| | | | |
Assets: | | | | |
Investments, at value (cost $72,389,539) | | $ | 112,843,655 | |
Cash | | | 1,771 | |
Receivable for Fund shares sold | | | 82,466 | |
Receivable from Adviser | | | 56,534 | |
Dividends receivable | | | 96,092 | |
Prepaid expenses | | | 35,256 | |
| | | | |
Total Assets | | | 113,115,774 | |
| | | | |
| |
Liabilities: | | | | |
Payable for Fund shares redeemed | | | 91,379 | |
Payable for investment advisory fees | | | 94,449 | |
Payable for distribution fees | | | 21,675 | |
Payable for accounting fees | | | 11,250 | |
Payable for legal and audit fees | | | 44,234 | |
Payable for shareholder communications expenses | | | 32,228 | |
Payable for shareholder services fees | | | 18,712 | |
Other accrued expenses | | | 18,644 | |
| | | | |
Total Liabilities | | | 332,571 | |
| | | | |
| |
Net Assets(applicable to 3,176,099 shares outstanding) | | $ | 112,783,203 | |
| | | | |
| |
Net Assets Consist of: | | | | |
Paid-in capital | | $ | 72,427,753 | |
Total distributable earnings | | | 40,355,450 | |
| | | | |
Net Assets | | $ | 112,783,203 | |
| | | | |
| | | | |
Shares of Capital Stock, each at $0.001 par value: | |
Class AAA: | | | | |
Net Asset Value, offering, and redemption price per share ($88,286,783 ÷ 2,482,411 shares outstanding; 75,000,000 shares authorized) | | $ | 35.56 | |
| | | | |
Class A: | | | | |
Net Asset Value and redemption price per share ($5,332,055 ÷ 149,981 shares outstanding; 50,000,000 shares authorized) | | $ | 35.55 | |
| | | | |
Maximum offering price per share (NAV ÷ 0.9425, based on maximum sales charge of 5.75% of the offering price) | | $ | 37.72 | |
| | | | |
Class C: | | | | |
Net Asset Value and offering price per share ($2,598,655 ÷ 89,262 shares outstanding; 25,000,000 shares authorized) | | $ | 29.11 | (a) |
| | | | |
Class I: | | | | |
Net Asset Value, offering, and redemption price per share ($16,565,710 ÷ 454,445 shares outstanding; 25,000,000 shares authorized) | | $ | 36.45 | |
| | | | |
| (a) | Redemption price varies based on the length of time held. |
Statement of Operations
For the Year Ended December 31, 2019
| | | | |
Investment Income: | | | | |
Dividends (net of foreign withholding taxes of $75,768) | | $ | 999,261 | |
Interest | | | 34,631 | |
| | | | |
Total Investment Income | | | 1,033,892 | |
| | | | |
Expenses: | | | | |
Investment advisory fees | | | 1,023,156 | |
Distribution fees - Class AAA | | | 206,734 | |
Distribution fees - Class A | | | 12,460 | |
Distribution fees - Class C | | | 17,637 | |
Shareholder services fees | | | 84,061 | |
Shareholder communications expenses | | | 67,049 | |
Registration expenses | | | 52,056 | |
Legal and audit fees | | | 51,002 | |
Accounting fees | | | 45,000 | |
Directors’ fees | | | 25,545 | |
Custodian fees | | | 22,421 | |
Interest expense | | | 2,478 | |
Miscellaneous expenses | | | 34,388 | |
| | | | |
Total Expenses | | | 1,643,987 | |
| | | | |
Less: | | | | |
Expense reimbursements (See Note 3) | | | (412,641 | ) |
| | | | |
Net Expenses | | | 1,231,346 | |
| | | | |
Net Investment Loss | | | (197,454 | ) |
| | | | |
Net Realized and Unrealized Gain/(Loss) on Investments and Foreign Currency: | | | | |
Net realized gain on investments | | | 10,429,021 | |
Net realized loss on foreign currency transactions | | | (2,137 | ) |
| | | | |
Net realized gain/(loss) on investments and foreign currency transactions | | | 10,426,884 | |
| | | | |
Net change in unrealized appreciation/depreciation: | | | | |
on investments | | | 16,290,779 | |
on foreign currency translations | | | 1,519 | |
| | | | |
Net change in unrealized appreciation/depreciation on investments and foreign currency translations | | | 16,292,298 | |
| | | | |
Net Realized and Unrealized Gain/(Loss) on Investments and Foreign Currency | | | 26,719,182 | |
| | | | |
Net Increase in Net Assets Resulting from Operations | | $ | 26,521,728 | |
| | | | |
See accompanying notes to financial statements.
9
The Gabelli Global Growth Fund
Statement of Changes in Net Assets
| | | | | | | | |
| | | Year Ended | | | Year Ended | |
| | | December 31, 2019 | | | December 31, 2018 | |
Operations: | | | | | | | | |
Net investment loss | | $ | (197,454 | ) | | $ | (110,960 | ) |
Net realized gain on investments and foreign currency transactions | | | 10,426,884 | | | | 6,712,433 | |
Net change in unrealized appreciation/depreciation on investments and foreign currency translations | | | 16,292,298 | | | | (9,343,747 | ) |
| | | | | | | | |
Net Increase/(Decrease) in Net Assets Resulting from Operations | | | 26,521,728 | | | | (2,742,274 | ) |
| | | | | | | | |
Distributions to Shareholders: | | | | | | | | |
Accumulated earnings | | | | | | | | |
Class AAA | | | (8,172,493 | ) | | | (5,615,445 | ) |
Class A | | | (495,166 | ) | | | (300,099 | ) |
Class C | | | (263,622 | ) | | | (145,703 | ) |
Class I | | | (1,497,399 | ) | | | (621,946 | ) |
| | | | | | | | |
Total Distributions to Shareholders | | | (10,428,680 | ) | | | (6,683,193 | ) |
| | | | | | | | |
| | |
Capital Share Transactions: | | | | | | | | |
Class AAA | | | 2,959,549 | | | | 1,610,344 | |
Class A | | | 725,983 | | | | 642,296 | |
Class C | | | 831,343 | | | | 301,162 | |
Class I | | | 6,601,878 | | | | 3,815,923 | |
| | | | | | | | |
Net Increase in Net Assets from Capital Share Transactions | | | 11,118,753 | | | | 6,369,725 | |
| | | | | | | | |
| | |
Redemption Fees | | | 409 | | | | 6 | |
| | | | | | | | |
Net Increase/(Decrease) in Net Assets | | | 27,212,210 | | | | (3,055,736 | ) |
Net Assets: | | | | | | | | |
Beginning of year | | | 85,570,993 | | | | 88,626,729 | |
| | | | | | | | |
End of year | | $ | 112,783,203 | | | $ | 85,570,993 | |
| | | | | | | | |
See accompanying notes to financial statements.
10
The Gabelli Global Growth Fund
Financial Highlights
Selected data for a share of capital stock outstanding throughout each year:
| | | | | | | | | | | | | | | | | | | | | | | | | | | | | | | | | | | | | | | | | | | | | | | | | | | | | | | | | | | | | | | | | | | | | | | | | | | | | | | | |
| | | | | Income (Loss)
from Investment Operations | | Distributions | | | | | | | | Ratios to Average Net Assets/
Supplemental Data |
Year Ended December 31 | | Net Asset Value, Beginning of Year | | Net Investment Income (Loss)(a) | | Net Realized and Unrealized Gain (Loss) on Investments | | Total from Investment Operations | | Net Investment Income | | Net Realized Gain | | Return of Capital | | Total Distributions | | Redemption Fees (a)(b) | | Net Asset Value, End of Period | | Total Return† | | Net Assets End of Year (in 000’s) | | Net Investment Income (Loss) | | Operating Expenses Before Reimbursement | | Operating Expenses Net of Reimbursement | | Portfolio Turnover Rate |
Class AAA | | | | | | | | | | | | | | | | | | | | | | | | | | | | | | | | | | | | | | | | | | | | | | | | | | | | | | | | | | | | | | | | | | | | | | | | | | | | | | | | |
2019 | | | $ | 29.94 | | | | $ | (0.07 | ) | | | $ | 9.29 | | | | $ | 9.22 | | | | | — | | | | $ | (3.60 | ) | | | | — | | | | $ | (3.60 | ) | | | $ | 0.00 | | | | $ | 35.56 | | | | | 30.7 | % | | | $ | 88,287 | | | | | (0.21 | )% | | | | 1.63 | % | | | | 1.22 | %(c) | | | | 78 | % |
2018 | | | | 33.42 | | | | | (0.05 | ) | | | | (0.91 | ) | | | | (0.96 | ) | | | | — | | | | | (2.52 | ) | | | | — | | | | | (2.52 | ) | | | | 0.00 | | | | | 29.94 | | | | | (2.8 | ) | | | | 71,877 | | | | | (0.14 | ) | | | | 1.68 | | | | | 1.42 | (c)(d) | | | | 58 | |
2017 | | | | 26.72 | | | | | (0.13 | ) | | | | 7.89 | | | | | 7.76 | | | | | — | | | | | (1.05 | ) | | | $ | (0.01 | ) | | | | (1.06 | ) | | | | 0.00 | | | | | 33.42 | | | | | 29.0 | | | | | 77,829 | | | | | (0.42 | ) | | | | 1.67 | | | | | 1.67 | (d) | | | | 43 | |
2016 | | | | 28.27 | | | | | 0.12 | | | | | 0.22 | | | | | 0.34 | | | | $ | (0.13 | ) | | | | (1.76 | ) | | | | — | | | | | (1.89 | ) | | | | — | | | | | 26.72 | | | | | 1.2 | | | | | 64,574 | | | | | 0.44 | | | | | 1.72 | | | | | 1.72 | (d)(e) | | | | 63 | |
2015 | | | | 30.23 | | | | | (0.03 | ) | | | | (0.31 | ) | | | | (0.34 | ) | | | | (0.02 | ) | | | | (1.60 | ) | | | | — | | | | | (1.62 | ) | | | | 0.00 | | | | | 28.27 | | | | | (1.2 | ) | | | | 72,882 | | | | | (0.10 | ) | | | | 1.68 | | | | | 1.68 | (d) | | | | 53 | |
Class A | | | | | | | | | | | | | | | | | | | | | | | | | | | | | | | | | | | | | | | | | | | | | | | | | | | | | | | | | | | | | | | | | | | | | | | | | | | | | | | | |
2019 | | | $ | 29.93 | | | | $ | (0.08 | ) | | | $ | 9.30 | | | | $ | 9.22 | | | | | — | | | | $ | (3.60 | ) | | | | — | | | | $ | (3.60 | ) | | | $ | 0.00 | | | | $ | 35.55 | | | | | 30.7 | % | | | $ | 5,332 | | | | | (0.21 | )% | | | | 1.63 | % | | | | 1.22 | %(c) | | | | 78 | % |
2018 | | | | 33.41 | | | | | (0.05 | ) | | | | (0.91 | ) | | | | (0.96 | ) | | | | — | | | | | (2.52 | ) | | | | — | | | | | (2.52 | ) | | | | 0.00 | | | | | 29.93 | | | | | (2.8 | ) | | | | 3,861 | | | | | (0.14 | ) | | | | 1.68 | | | | | 1.41 | (c)(d) | | | | 58 | |
2017 | | | | 26.72 | | | | | (0.13 | ) | | | | 7.88 | | | | | 7.75 | | | | | — | | | | | (1.05 | ) | | | $ | (0.01 | ) | | | | (1.06 | ) | | | | 0.00 | | | | | 33.41 | | | | | 29.0 | | | | | 3,652 | | | | | (0.43 | ) | | | | 1.67 | | | | | 1.67 | (d) | | | | 43 | |
2016 | | | | 28.26 | | | | | 0.12 | | | | | 0.23 | | | | | 0.35 | | | | $ | (0.14 | ) | | | | (1.75 | ) | | | | — | | | | | (1.89 | ) | | | | — | | | | | 26.72 | | | | | 1.3 | | | | | 3,143 | | | | | 0.44 | | | | | 1.72 | | | | | 1.72 | (d)(e) | | | | 63 | |
2015 | | | | 30.22 | | | | | (0.03 | ) | | | | (0.32 | ) | | | | (0.35 | ) | | | | (0.01 | ) | | | | (1.60 | ) | | | | — | | | | | (1.61 | ) | | | | 0.00 | | | | | 28.26 | | | | | (1.2 | ) | | | | 3,580 | | | | | (0.08 | ) | | | | 1.68 | | | | | 1.68 | (d) | | | | 53 | |
Class C | | | | | | | | | | | | | | | | | | | | | | | | | | | | | | | | | | | | | | | | | | | | | | | | | | | | | | | | | | | | | | | | | | | | | | | | | | | | | | | | |
2019 | | | $ | 25.18 | | | | $ | (0.25 | ) | | | $ | 7.78 | | | | $ | 7.53 | | | | | — | | | | $ | (3.60 | ) | | | | — | | | | $ | (3.60 | ) | | | $ | 0.00 | | | | $ | 29.11 | | | | | 29.8 | % | | | $ | 2,598 | | | | | (0.84 | )% | | | | 2.38 | % | | | | 1.87 | %(c) | | | | 78 | % |
2018 | | | | 28.73 | | | | | (0.28 | ) | | | | (0.75 | ) | | | | (1.03 | ) | | | | — | | | | | (2.52 | ) | | | | — | | | | | (2.52 | ) | | | | 0.00 | | | | | 25.18 | | | | | (3.5 | ) | | | | 1,561 | | | | | (0.93 | ) | | | | 2.43 | | | | | 2.15 | (c)(d) | | | | 58 | |
2017 | | | | 23.26 | | | | | (0.32 | ) | | | | 6.85 | | | | | 6.53 | | | | | — | | | | | (1.05 | ) | | | $ | (0.01 | ) | | | | (1.06 | ) | | | | 0.00 | | | | | 28.73 | | | | | 28.0 | | | | | 1,479 | | | | | (1.19 | ) | | | | 2.42 | | | | | 2.42 | (d) | | | | 43 | |
2016 | | | | 24.91 | | | | | (0.07 | ) | | | | 0.18 | | | | | 0.11 | | | | | — | | | | | (1.76 | ) | | | | — | | | | | (1.76 | ) | | | | — | | | | | 23.26 | | | | | 0.4 | | | | | 1,232 | | | | | (0.30 | ) | | | | 2.47 | | | | | 2.47 | (d)(e) | | | | 63 | |
2015 | | | | 27.01 | | | | | (0.23 | ) | | | | (0.27 | ) | | | | (0.50 | ) | | | | — | | | | | (1.60 | ) | | | | — | | | | | (1.60 | ) | | | | 0.00 | | | | | 24.91 | | | | | (1.9 | ) | | | | 1,891 | | | | | (0.86 | ) | | | | 2.43 | | | | | 2.43 | (d) | | | | 53 | |
Class I | | | | | | | | | | | | | | | | | | | | | | | | | | | | | | | | | | | | | | | | | | | | | | | | | | | | | | | | | | | | | | | | | | | | | | | | | | | | | | | | |
2019 | | | $ | 30.55 | | | | $ | 0.01 | | | | $ | 9.49 | | | | $ | 9.50 | | | | | — | | | | $ | (3.60 | ) | | | | — | | | | $ | (3.60 | ) | | | $ | 0.00 | | | | $ | 36.45 | | | | | 31.0 | % | | | $ | 16,566 | | | | | 0.03 | % | | | | 1.38 | % | | | | 0.99 | %(c) | | | | 78 | % |
2018 | | | | 33.90 | | | | | 0.09 | | | | | (0.92 | ) | | | | (0.83 | ) | | | | — | | | | | (2.52 | ) | | | | — | | | | | (2.52 | ) | | | | 0.00 | | | | | 30.55 | | | | | (2.4 | ) | | | | 8,272 | | | | | 0.26 | | | | | 1.43 | | | | | 1.00 | (c)(d) | | | | 58 | |
2017 | | | | 26.92 | | | | | 0.07 | | | | | 7.97 | | | | | 8.04 | | | | | — | | | | | (1.05 | ) | | | $ | (0.01 | ) | | | | (1.06 | ) | | | | 0.00 | | | | | 33.90 | | | | | 29.8 | | | | | 5,667 | | | | | 0.24 | | | | | 1.42 | | | | | 1.00 | (c)(d) | | | | 43 | |
2016 | | | | 28.47 | | | | | 0.33 | | | | | 0.23 | | | | | 0.56 | | | | $ | (0.35 | ) | | | | (1.76 | ) | | | | — | | | | | (2.11 | ) | | | | — | | | | | 26.92 | | | | | 2.0 | | | | | 2,975 | | | | | 1.18 | | | | | 1.47 | | | | | 1.00 | (c)(d)(e) | | | | 63 | |
2015 | | | | 30.42 | | | | | 0.17 | | | | | (0.30 | ) | | | | (0.13 | ) | | | | (0.22 | ) | | | | (1.60 | ) | | | | — | | | | | (1.82 | ) | | | | 0.00 | | | | | 28.47 | | | | | (0.5 | ) | | | | 3,102 | | | | | 0.54 | | | | | 1.43 | | | | | 1.00 | (c)(d) | | | | 53 | |
| † | Total return represents aggregate total return of a hypothetical $1,000 investment at the beginning of the year and sold at the end of the year including reinvestment of distributions and does not reflect the applicable sales charges. |
| (a) | Per share amounts have been calculated using the average shares outstanding method. |
| (b) | Amount represents less than $0.005 per share. |
| (c) | Under an expense reimbursement agreement with the Adviser, the Adviser reimbursed expenses of $412,641 and $261,050 for the years ended December 31, 2019 and 2018 and certain Class I expenses to the Fund of $19,466, $14,648, and $12,486 for the years ended December 31, 2017, 2016, and 2015, respectively. |
| (d) | The Fund received credits from a designated broker who agreed to pay certain Fund operating expenses. For the years ended December 31, 2018, 2017, 2016, and 2015, there was no impact to the expense ratios. |
| (e) | During the year ended December 31, 2016, the Fund received reimbursements of custody expenses paid in prior years. Had such reimbursement (allocated by relative net asset values of the Fund’s share classes) been included in that period, the expense ratios would have been 1.20% (Class AAA), 1.21% (Class A), 1.96% (Class C), and 0.47% (Class I). |
See accompanying notes to financial statements.
11
The Gabelli Global Growth Fund
Notes to Financial Statements
1. Organization.Effective December 27, 2019, The GAMCO Global Growth Fund changed its name to The Gabelli Global Growth Fund. The Fund, a series of GAMCO Global Series Funds, Inc. (the Corporation), was incorporated on July 16, 1993 in Maryland. The Fund is anon-diversifiedopen-end management investment company registered under the Investment Company Act of 1940, as amended (the 1940 Act), and is one of five separately managed portfolios (collectively, the Portfolios) of the Corporation. The Fund’s primary objective is capital appreciation. The Fund commenced investment operations on February 7, 1994.
2. Significant Accounting Policies.As an investment company, the Fund follows the investment company accounting and reporting guidance, which is part of U.S. generally accepted accounting principles (GAAP) that may require the use of management estimates and assumptions in the preparation of its financial statements. Actual results could differ from those estimates. The following is a summary of significant accounting policies followed by the Fund in the preparation of its financial statements.
New Accounting Pronouncements.To improve the effectiveness of fair value disclosure requirements, the Financial Accounting Standards Board recently issued Accounting Standard Update (ASU)2018-13, Fair Value Measurement Disclosure Framework – Changes to the Disclosure Requirements for Fair Value Measurement (ASU2018-13), which adds, removes, and modifies certain aspects relating to fair value disclosure. ASU2018-13 is effective for interim and annual reporting periods beginning after December 15, 2019; early adoption of the additions relating to ASU2018-13 is not required, even if early adoption is elected for the removals and modifications under ASU2018-13. Management has early adopted the removals and modifications set forth in ASU2018-13 in these financial statements and has not early adopted the additions set forth in ASU2018-13.
Security Valuation.Portfolio securities listed or traded on a nationally recognized securities exchange or traded in the U.S.over-the-counter market for which market quotations are readily available are valued at the last quoted sale price or a market’s official closing price as of the close of business on the day the securities are being valued. If there were no sales that day, the security is valued at the average of the closing bid and asked prices or, if there were no asked prices quoted on that day, then the security is valued at the closing bid price on that day. If no bid or asked prices are quoted on such day, the security is valued at the most recently available price or, if the Board of Directors (the Board) so determines, by such other method as the Board shall determine in good faith to reflect its fair market value. Portfolio securities traded on more than one national securities exchange or market are valued according to the broadest and most representative market, as determined by Gabelli Funds, LLC (the Adviser).
Portfolio securities primarily traded on a foreign market are generally valued at the preceding closing values of such securities on the relevant market, but may be fair valued pursuant to procedures established by the Board if market conditions change significantly after the close of the foreign market, but prior to the close of business on the day the securities are being valued. Debt obligations for which market quotations are readily available are valued at the average of the latest bid and asked prices. If there were no asked prices quoted on such day, the security is valued using the closing bid price. Such debt obligations are valued through prices provided by a pricing service approved by the Board. Certain securities are valued principally using dealer quotations.
Securities and assets for which market quotations are not readily available are fair valued as determined by the Board. Fair valuation methodologies and procedures may include, but are not limited to: analysis and review of available financial andnon-financial information about the company; comparisons with the valuation and
12
The Gabelli Global Growth Fund
Notes to Financial Statements (Continued)
changes in valuation of similar securities, including a comparison of foreign securities with the equivalent U.S. dollar value American Depositary Receipt securities at the close of the U.S. exchange; and evaluation of any other information that could be indicative of the value of the security.
The Fund employs a fair value model to adjust prices to reflect events affecting the values of certain portfolio securities which occur between the close of trading on the principal market for such securities (foreign exchanges andover-the-counter markets) at the time when net asset values of the Fund are determined. If the Fund’s valuation committee believes that a particular event would materially affect net asset value, further adjustment is considered.
The inputs and valuation techniques used to measure fair value of the Fund’s investments are summarized into three levels as described in the hierarchy below:
| | ● | | Level 1 — quoted prices in active markets for identical securities; |
| | ● | | Level 2 — other significant observable inputs (including quoted prices for similar securities, interest rates, prepayment speeds, credit risk, etc.); and |
| | ● | | Level 3 — significant unobservable inputs (including the Board’s determinations as to the fair value of investments). |
A financial instrument’s level within the fair value hierarchy is based on the lowest level of any input both individually and in the aggregate that is significant to the fair value measurement. The inputs or methodology used for valuing securities are not necessarily an indication of the risk associated with investing in those securities. The closing price is adjusted from the local close, therefore, such securities are classified as Level 2 in the fair value hierarchy presented below. The summary of the Fund’s investments in securities by inputs used to value the Fund’s investments as of December 31, 2019 is as follows:
| | | | | | | | | | | | |
| | | Valuation Inputs | | | | |
| | | Level 1
Quoted Prices | | | Level 2 Other Significant
Observable Inputs | | | Total Market Value
at 12/31/19 | |
INVESTMENTS IN SECURITIES: | | | | | | | | | | | | |
ASSETS (Market Value): | | | | | | | | | | | | |
Common Stocks (a) | | | $112,422,022 | | | | �� | | | | $112,422,022 | |
U.S. Government Obligations | | | — | | | | $421,633 | | | | 421,633 | |
TOTAL INVESTMENTS IN SECURITIES – ASSETS | | | $112,422,022 | | | | $421,633 | | | | $112,843,655 | |
| (a) | Please refer to the Schedule of Investments for the industry classifications of these portfolio holdings. |
The Fund held no level 3 investments at December 31, 2019 and 2018.
Additional Information to Evaluate Qualitative Information.
General.The Fund uses recognized industry pricing services – approved by the Board and unaffiliated with the Adviser – to value most of its securities, and uses broker quotes provided by market makers of securities not valued by these and other recognized pricing sources. Several different pricing feeds are received to value domestic equity securities, international equity securities, preferred equity securities, and fixed income securities. The data within these feeds are ultimately sourced from major stock exchanges and trading systems where these securities trade. The prices supplied by external sources are checked by obtaining quotations or actual
13
The Gabelli Global Growth Fund
Notes to Financial Statements (Continued)
transaction prices from market participants. If a price obtained from the pricing source is deemed unreliable, prices will be sought from another pricing service or from a broker/dealer that trades that security or similar securities.
Fair Valuation.Fair valued securities may be common or preferred equities, warrants, options, rights, or fixed income obligations. Where appropriate, Level 3 securities are those for which market quotations are not available, such as securities not traded for several days, or for which current bids are not available, or which are restricted as to transfer. When fair valuing a security, factors to consider include recent prices of comparable securities that are publicly traded, reliable prices of securities not publicly traded, the use of valuation models, current analyst reports, valuing the income or cash flow of the issuer, or cost if the preceding factors do not apply. The circumstances of Level 3 securities are frequently monitored to determine if fair valuation measures continue to apply.
The Adviser reports quarterly to the Board the results of the application of fair valuation policies and procedures. These may include backtesting the prices realized in subsequent trades of these fair valued securities to fair values previously recognized.
Foreign Currency Translations.The books and records of the Fund are maintained in U.S. dollars. Foreign currencies, investments, and other assets and liabilities are translated into U.S. dollars at current exchange rates. Purchases and sales of investment securities, income, and expenses are translated at the exchange rate prevailing on the respective dates of such transactions. Unrealized gains and losses that result from changes in foreign exchange rates and/or changes in market prices of securities have been included in unrealized appreciation/depreciation on investments and foreign currency translations. Net realized foreign currency gains and losses resulting from changes in exchange rates include foreign currency gains and losses between trade date and settlement date on investment securities transactions, foreign currency transactions, and the difference between the amounts of interest and dividends recorded on the books of the Fund and the amounts actually received. The portion of foreign currency gains and losses related to fluctuation in exchange rates between the initial purchase trade date and subsequent sale trade date is included in realized gain/(loss) on investments.
Foreign Securities.The Fund may directly purchase securities of foreign issuers. Investing in securities of foreign issuers involves special risks not typically associated with investing in securities of U.S. issuers. The risks include possible revaluation of currencies, the inability to repatriate funds, less complete financial information about companies, and possible future adverse political and economic developments. Moreover, securities of many foreign issuers and their markets may be less liquid and their prices more volatile than securities of comparable U.S. issuers.
Foreign Taxes.The Fund may be subject to foreign taxes on income, gains on investments, or currency repatriation, a portion of which may be recoverable. The Fund will accrue such taxes and recoveries as applicable, based upon its current interpretation of tax rules and regulations that exist in the markets in which it invests.
Securities Transactions and Investment Income.Securities transactions are accounted for on the trade date with realized gain or loss on investments determined by using the identified cost method. Interest income (including amortization of premium and accretion of discount) is recorded on an accrual basis. Premiums and discounts on debt securities are amortized using the effective yield to maturity method. Dividend income is recorded on
14
The Gabelli Global Growth Fund
Notes to Financial Statements (Continued)
theex-dividend date, except for certain dividends from foreign securities that are recorded as soon after theex-dividend date as the Fund becomes aware of such dividends.
Determination of Net Asset Value and Calculation of Expenses.Certain administrative expenses are common to, and allocated among, various affiliated funds. Such allocations are made on the basis of each fund’s average net assets or other criteria directly affecting the expenses as determined by the Adviser pursuant to procedures established by the Board.
In calculating NAV per share of each class, investment income, realized and unrealized gains and losses, redemption fees, and expenses other than class specific expenses are allocated daily to each class of shares based upon the proportion of net assets of each class at the beginning of each day. Distribution expenses are borne solely by the class incurring the expense.
Distributions to Shareholders.Distributions to shareholders are recorded on theex-dividend date. Distributions to shareholders are based on income and capital gains as determined in accordance with federal income tax regulations, which may differ from income and capital gains as determined under GAAP. These differences are primarily due to differing treatments of income and gains on various investment securities and foreign currency transactions held by the Fund, timing differences, and differing characterizations of distributions made by the Fund. Distributions from net investment income for federal income tax purposes include net realized gains on foreign currency transactions. These book/tax differences are either temporary or permanent in nature. To the extent these differences are permanent, adjustments are made to the appropriate capital accounts in the period when the differences arise. Permanent differences were primarily due to the tax treatment of realized foreign currency gains and capital gain adjustment on sale of real estate investment trusts. These reclassifications have no impact on the NAV of the Fund. These reclassifications have no impact on the NAV of the Fund. For the year ended December 31, 2019, reclassifications were made to decreasepaid-in capital by $3,611, with an offsetting adjustment to total distributable earnings.
The tax character of distributions paid during the years ended December 31, 2019 and 2018 was as follows:
| | | | | | | | | | |
| | | Year Ended
December 31, 2019 | | Year Ended
December 31, 2018 |
Distributions paid from: | | | | | | | | | | |
Net long term capital gains | | | | $10,428,680 | | | | | $6,683,193 | |
| | | | | | | | | | |
Total distributions paid | | | | $10,428,680 | | | | | $6,683,193 | |
| | | | | | | | | | |
Provision for Income Taxes.The Fund intends to continue to qualify as a regulated investment company under Subchapter M of the Internal Revenue Code of 1986, as amended (the Code). It is the policy of the Fund to comply with the requirements of the Code applicable to regulated investment companies and to distribute substantially all of its net investment company taxable income and net capital gains. Therefore, no provision for federal income taxes is required.
At December 31, 2019, the components of accumulated earnings/losses on a tax basis were as follows:
| | | | |
Undistributed ordinary income | | $ | 6,982 | |
Undistributed long term capital gains | | | 57,101 | |
Net unrealized appreciation on investments and foreign currency translations | | | 40,291,367 | |
| | | | |
Total | | $ | 40,355,450 | |
| | | | |
15
The Gabelli Global Growth Fund
Notes to Financial Statements (Continued)
The Fund is permitted to carry capital losses forward for an unlimited period. Capital losses that are carried forward will retain their character as either short term or long term capital losses.
At December 31, 2019, the temporary differences between book basis and tax basis net unrealized appreciation on investments were due to losses from wash sales for tax purposes,mark-to-market adjustments on investments no longer considered a passive foreign investment company and basis adjustments for litigation gains.
The following summarizes the tax cost of investments and the related net unrealized appreciation at December 31, 2019:
| | | | | | | | |
| | | Cost | | Gross
Unrealized
Appreciation | | Gross
Unrealized
Depreciation | | Net Unrealized
Appreciation |
Investments | | $72,552,878 | | $40,436,951 | | $(146,174) | | $40,290,777 |
The Fund is required to evaluate tax positions taken or expected to be taken in the course of preparing the Fund’s tax returns to determine whether the tax positions are“more-likely-than-not” of being sustained by the applicable tax authority. Income tax and related interest and penalties would be recognized by the Fund as tax expense in the Statement of Operations if the tax positions were deemed not to meet themore-likely-than-not threshold. During the year ended December 31, 2019, the Fund did not incur any income tax, interest, or penalties. As of December 31, 2019, the Adviser has reviewed all open tax years and concluded that there was no impact to the Fund’s net assets or results of operations. The Fund’s federal and state tax returns for the prior three fiscal years remain open, subject to examination. On an ongoing basis, the Adviser will monitor the Fund’s tax positions to determine if adjustments to this conclusion are necessary.
3. Investment Advisory Agreement and Other Transactions.The Fund has entered into an investment advisory agreement (the Advisory Agreement) with the Adviser which provides that the Fund will pay the Adviser a fee, computed daily and paid monthly, at the annual rate of 1.00% of the value of its average daily net assets. In accordance with the Advisory Agreement, the Adviser provides a continuous investment program for the Fund’s portfolio, oversees the administration of all aspects of the Fund’s business and affairs, and pays the compensation of all Officers and Directors of the Fund who are affiliated persons of the Adviser.
Through November 30, 2019, the Adviser had agreed to waive and/or to reimburse expenses of the Fund to the extent necessary to maintain the annualized total operating expenses of the Fund (excluding brokerage costs, acquired fund fees and expenses, interest, taxes, and extraordinary expenses) at no more than 1.25%, 1.25%, 2.00%, and 1.00% of the value of the Fund’s average daily net assets for Class AAA, Class A, Class C, and Class I Shares, respectively. Effective December 1, 2019, the Adviser amended its contractual agreement with respect to each share class of the Fund to waive its investment advisory fees and/or to reimburse expenses to the extent necessary to maintain the annualized total operating expenses of the Fund (excluding brokerage costs, acquired fund fees and expenses, interest, taxes, and extraordinary expenses) until at least April 30, 2021, at no more than 0.90% of the value of the Fund’s average daily net assets for each share class of the Fund. During the year ended December 31, 2019, the Adviser reimbursed the Fund in the amount of $412,641. In addition, the Fund has agreed, during the two year period following any waiver or reimbursement by the Adviser, to repay such amount to the extent, that after giving effect to the repayment, such adjusted annualized total operating expenses of the Fund would not exceed 0.90% of the value of the Fund’s average daily net assets for each share class of the Fund. The agreement is renewable annually. At December 31, 2019, the cumulative amount which the Fund may repay the Adviser, subject to the terms above, is $673,691:
16
The Gabelli Global Growth Fund
Notes to Financial Statements (Continued)
| | | | |
For the year ended December 31, 2018, expiring December 31, 2020 | | | $261,050 | |
For the year ended December 31, 2019, expiring December 31, 2021 | | | 412,641 | |
| | | | |
| | | $673,691 | |
| | | | |
The Corporation pays each Director who is not considered to be an affiliated person an annual retainer of $6,000 plus $1,000 for each Board meeting attended and they are reimbursed for any out of pocket expenses incurred in attending meetings. All Board committee members receive $1,000 per meeting attended. The Chairman of the Audit Committee receives an annual fee of $3,000, and the Lead Director receives an annual fee of $2,000. A Director may receive a single meeting fee, allocated among the participating funds, for attending certain meetings held on behalf of multiple funds. Directors who are directors or employees of the Adviser or an affiliated company receive no compensation or expense reimbursement from the Corporation.
4. Distribution Plan.The Fund’s Board has adopted a distribution plan (the Plan) for each class of shares, except for Class I Shares, pursuant to Rule12b-1 under the 1940 Act. Under the Class AAA, Class A, and Class C Share Plans, payments are authorized to G.distributors, LLC (the Distributor), an affiliate of the Adviser, at annual rates of 0.25%, 0.25%, and 1.00%, respectively, of the average daily net assets of those classes, the annual limitations under each Plan. Such payments are accrued daily and paid monthly.
5. Portfolio Securities.Purchases and sales of securities during the year ended December 31, 2019, other than short term securities and U.S. Government obligations, aggregated $78,660,738 and $78,384,438 respectively.
6. Transactions with Affiliates and Other Arrangements.During the year ended December 31, 2019, the Distributor retained a total of $7,326 from investors representing commissions (sales charges and underwriting fees) on sales and redemptions of Fund shares.
The cost of calculating the Fund’s NAV per share is a Fund expense pursuant to the Advisory Agreement. Under thesub-administration agreement with Bank of New York Mellon, the fees paid include the cost of calculating the Fund’s NAV. The Fund reimburses the Adviser for this service. During the year ended December 31, 2019, the Fund accrued $45,000 in accounting fees in the Statement of Operations.
7. Line of Credit.The Fund participates in an unsecured line of credit which expires on March 4, 2020 and may be renewed annually, of up to $75,000,000 under which it may borrow up to 10% of its net assets from the custodian for temporary borrowing purposes. Borrowings under this arrangement bear interest at a floating rate equal to the higher of the overnight Federal Funds rate plus 125 basis points or the 30 day ICE LIBOR plus 125 basis points in effect on that day. This amount, if any, would be included in “Interest expense” in the Statement of Operations. At December 31, 2019, there were no borrowings outstanding under the line of credit.
The average daily amount of borrowings outstanding under the line of credit during the year ended December 31, 2019 was $5,562, with a weighted average interest rate of 3.59%. The maximum amount borrowed at any time during the year ended December 31, 2019 was $447,000.
8. Capital Stock.The Fund offers four classes of shares – Class AAA Shares, Class A Shares, Class C Shares, and Class I Shares. Class AAA and Class I Shares are offered without a sales charge. Class A Shares are subject to a maximumfront-end sales charge of 5.75%, and Class C Shares are subject to a 1.00% contingent deferred sales charge for one year after purchase.
17
The Gabelli Global Growth Fund
Notes to Financial Statements (Continued)
The Fund imposes a redemption fee of 2.00% on all classes of shares that are redeemed or exchanged on or before the seventh day after the date of a purchase. The redemption fee is deducted from the proceeds otherwise payable to the redeeming shareholders and is retained by the Fund as an increase inpaid-in capital. The redemption fees retained by the Fund during the years ended December 31, 2019 and 2018, if any, can be found in the Statement of Changes in Net Assets under Redemption Fees.
Transactions in shares of capital stock were as follows:
| | | | | | | | | | | | | | | | |
| | | Year Ended
December 31, 2019 | | | Year Ended
December 31, 2018 | |
| | | Shares | | | Amount | | | Shares | | | Amount | |
Class AAA | | | | | | | | | | | | | | | | |
Shares sold | | | 137,319 | | | $ | 4,874,691 | | | | 136,173 | | | $ | 4,880,317 | |
Shares issued upon reinvestment of distributions | | | 218,229 | | | | 7,797,329 | | | | 181,172 | | | | 5,369,927 | |
Shares redeemed | | | (273,816 | ) | | | (9,712,471 | ) | | | (245,663 | ) | | | (8,639,900 | ) |
| | | | | | | | | | | | | | | | |
Net increase | | | 81,732 | | | $ | 2,959,549 | | | | 71,682 | | | $ | 1,610,344 | |
| | | | | | | | | | | | | | | | |
Class A | | | | | | | | | | | | | | | | |
Shares sold | | | 46,943 | | | $ | 1,656,674 | | | | 34,268 | | | $ | 1,224,568 | |
Shares issued upon reinvestment of distributions | | | 13,558 | | | | 484,299 | | | | 9,919 | | | | 293,888 | |
Shares redeemed | | | (39,502 | ) | | | (1,414,990 | ) | | | (24,503 | ) | | | (876,160 | ) |
| | | | | | | | | | | | | | | | |
Net increase | | | 20,999 | | | $ | 725,983 | | | | 19,684 | | | $ | 642,296 | |
| | | | | | | | | | | | | | | | |
Class C | | | | | | | | | | | | | | | | |
Shares sold | | | 58,617 | | | $ | 1,748,319 | | | | 27,281 | | | $ | 823,174 | |
Shares issued upon reinvestment of distributions | | | 8,440 | | | | 246,854 | | | | 5,166 | | | | 128,791 | |
Shares redeemed | | | (39,783 | ) | | | (1,163,830 | ) | | | (21,924 | ) | | | (650,803 | ) |
| | | | | | | | | | | | | | | | |
Net increase | | | 27,274 | | | $ | 831,343 | | | | 10,523 | | | $ | 301,162 | |
| | | | | | | | | | | | | | | | |
Class I | | | | | | | | | | | | | | | | |
Shares sold | | | 182,452 | | | $ | 6,544,921 | | | | 187,265 | | | $ | 6,867,629 | |
Shares issued upon reinvestment of distributions | | | 40,122 | | | | 1,469,262 | | | | 19,945 | | | | 603,136 | |
Shares redeemed | | | (38,894 | ) | | | (1,412,305 | ) | | | (103,621 | ) | | | (3,654,842 | ) |
| | | | | | | | | | | | | | | | |
Net increase | | | 183,680 | | | $ | 6,601,878 | | | | 103,589 | | | $ | 3,815,923 | |
| | | | | | | | | | | | | | | | |
9. Indemnifications.The Fund enters into contracts that contain a variety of indemnifications. The Fund’s maximum exposure under these arrangements is unknown. However, the Fund has not had prior claims or losses pursuant to these contracts. Management has reviewed the Fund’s existing contracts and expects the risk of loss to be remote.
10. Subsequent Events.Management has evaluated the impact on the Fund of all subsequent events occurring through the date the financial statements were issued and has determined that there were no subsequent events requiring recognition or disclosure in the financial statements.
18
The Gabelli Global Growth Fund
Report of Independent Registered Public Accounting Firm
To the Shareholders of The Gabelli Global Growth Fund
and the Board of Directors of GAMCO Global Series Funds, Inc.
Opinion on the Financial Statements
We have audited the accompanying statement of assets and liabilities of The Gabelli Global Growth Fund (the “Fund”) (one of the funds constituting GAMCO Global Series Funds, Inc. (the “Corporation”)), including the schedule of investments, as of December 31, 2019, and the related statement of operations for the year then ended, the statements of changes in net assets for each of the two years in the period then ended, the financial highlights for each of the five years in the period then ended and the related notes (collectively referred to as the “financial statements”). In our opinion, the financial statements present fairly, in all material respects, the financial position of the Fund (one of the funds constituting GAMCO Global Series Funds, Inc.) at December 31, 2019, the results of its operations for the year then ended, the changes in its net assets for each of the two years in the period then ended and its financial highlights for each of the five years in the period then ended, in conformity with U.S. generally accepted accounting principles.
Basis for Opinion
These financial statements are the responsibility of the Corporation’s management. Our responsibility is to express an opinion on the Fund’s financial statements based on our audits. We are a public accounting firm registered with the Public Company Accounting Oversight Board (United States) (“PCAOB”) and are required to be independent with respect to the Corporation in accordance with the U.S. federal securities laws and the applicable rules and regulations of the Securities and Exchange Commission and the PCAOB.
We conducted our audits in accordance with the standards of the PCAOB. Those standards require that we plan and perform the audit to obtain reasonable assurance about whether the financial statements are free of material misstatement, whether due to error or fraud. The Corporation is not required to have, nor were we engaged to perform, an audit of the Corporation’s internal control over financial reporting. As part of our audits we are required to obtain an understanding of internal control over financial reporting but not for the purpose of expressing an opinion on the effectiveness of the Corporation’s internal control over financial reporting. Accordingly, we express no such opinion.
Our audits included performing procedures to assess the risks of material misstatement of the financial statements, whether due to error or fraud, and performing procedures that respond to those risks. Such procedures included examining, on a test basis, evidence regarding the amounts and disclosures in the financial statements. Our procedures included confirmation of securities owned as of December 31, 2019, by correspondence with the custodian. Our audits also included evaluating the accounting principles used and significant estimates made by management, as well as evaluating the overall presentation of the financial statements. We believe that our audits provide a reasonable basis for our opinion.

We have served as the auditor of one or more Gabelli/GAMCO Funds investment companies since 1992.
Philadelphia, Pennsylvania
February 27, 2020
19
The Gabelli Global Growth Fund
Board Consideration andRe-Approval of Investment Advisory Agreement (Unaudited)
During the six months ended December 31, 2019, the Board of Directors of the Corporation approved the continuation of the investment advisory agreement with the Adviser for the Fund on the basis of the recommendation by the directors (the Independent Board Members) who are not interested persons of the Fund. The following paragraphs summarize the material information and factors considered by the Independent Board Members as well as their conclusions relative to such factors.
Nature, Extent, and Quality of Services.The Independent Board Members considered information regarding the Fund’s portfolio managers, the depth of the analyst pool available to the Adviser and the portfolio managers, the scope of supervisory, administrative, shareholder, and other services supervised or provided by the Adviser and the absence of significant service problems reported to the Board. The Independent Board Members noted the experience, length of service, and reputation of the Fund’s portfolio managers.
Investment Performance.The Independent Board Members reviewed the short, medium, and long term performance of the Fund (as of September 30, 2019) against a peer group of seven other comparable funds prepared by the Adviser (the Adviser Peer Group), and against a peer group prepared by Broadridge (the Broadridge Performance Peer Group) consisting of all global large cap growth funds, regardless of asset size or primary channel of distribution, as represented by the Lipper GlobalLarge-Cap Growth Index. The Independent Board Members noted that the Fund’s performance was in the second quartile for the one year period and in the first (highest) quartile for the three, five, and ten year periods, as measured against the Adviser Peer Group. Against the Broadridge Performance Peer Group, the Independent Board Members noted that the Fund’s performance was in the third quintile for the one year period, the first quintile for the three year period, the second quintile for the five year period, and the first quintile for the ten year period.
Profitability.The Independent Board Members reviewed summary data regarding the profitability of the Fund to the Adviser both with a pro rata administrative overhead charge and with a stand alone administrative charge and noted the effect of the expense limitation agreement. The Independent Board Members also noted that a portion of the Fund’s portfolio transactions were executed by an affiliated broker of the Adviser and that another affiliated broker of the Adviser received distribution fees and minor amounts of sales commissions.
Economies of Scale.The Independent Board Members discussed the major elements of the Adviser’s cost structure, the relationship of those elements to potential economies of scale and reviewed data provided by the Adviser.
Sharing of Economies of Scale.The Independent Board Members noted that the investment management fee schedule for the Fund does not take into account any potential economies of scale that may develop.
Service and Cost Comparisons.The Independent Board Members compared the expense ratios of the investment management fee, other expenses, and total expenses of the Fund with similar expense ratios of the Adviser Peer Group and a peer group of seven other global large cap growth funds selected by Broadridge, and noted that the Adviser’s management fee includes substantially all administrative services of the Fund as well as investment advisory services. The Independent Board Members noted the effect of the expense limitation agreement in place for the Fund. The Independent Board Members noted that the Fund’s total expense ratio was the highest in most of the categories for the Lipper peer group and in all for the Advisor peer group, but that the Fund’s size was below average within each peer group. The Independent Board Members also noted that the advisory fee structure was the same as that in effect for most of the Gabelli funds. The Independent Board
20
The Gabelli Global Growth Fund
Board Consideration andRe-Approval of Investment Advisory Agreement (Unaudited) (Continued)
Members were presented with, but did not consider to be material to their decision, various information comparing the advisory fee with the fee for other types of accounts managed by the Adviser.
Conclusions.The Independent Board Members concluded that the Fund enjoyed highly experienced portfolio management services and good ancillary services and an acceptable performance record. The Independent Board Members also concluded that the Fund’s expense ratios and the profitability to the Adviser of managing the Fund were reasonable, and that economies of scale were not a significant factor in their thinking at this time. The Independent Board Members did not view the potential profitability of ancillary services as material to their decision. On the basis of the foregoing and without assigning particular weight to any single conclusion, the Independent Board Members determined to recommend continuation of the investment advisory agreement to the full Board.
Based on a consideration of all these factors in their totality, the Board Members, including all of the Independent Board Members, determined that the Fund’s advisory fee was fair and reasonable with respect to the quality of services provided and in light of the other factors described above that the Board deemed relevant. Accordingly, the Board Members determined to approve the continuation of the Fund’s Advisory Agreement. The Board Members based their decision on evaluations of all these factors as a whole and did not consider any one factor asall-important or controlling.
21
The Gabelli Global Growth Fund
Additional Fund Information (Unaudited)
The business and affairs of the Fund are managed under the direction of the Corporation’s Board of Directors. Information pertaining to the Directors and officers of the Fund is set forth below. The Corporation’s Statement of Additional Information includes additional information about the Fund’s Directors and is available without charge, upon request, by calling800-GABELLI(800-422-3554) or by writing to The Gabelli Global Growth Fund at One Corporate Center, Rye, NY 10580-1422.
| | | | | | | | |
Name, Position(s)
Address1
and Age | | Term of Office
and Length of
Time Served2 | | Number of Funds
in Fund Complex
Overseen by Director | | Principal Occupation(s)
During Past Five Years | | Other Directorships
Held by Director3 |
| | | | |
INTERESTED DIRECTORS4: | | | | | | | | |
| | | | |
Mario J. Gabelli, CFA Director and Chief Investment Officer Age: 77 | | Since 1993 | | 33 | | Chairman, Chief Executive Officer, and Chief Investment Officer– Value Portfolios of GAMCO Investors, Inc. and Chief Investment Officer–Value Portfolios of Gabelli Funds, LLC and GAMCO Asset Management Inc.; Director/ Trustee or Chief Investment Officer of other registered investment companies within the Gabelli/GAMCO Fund Complex; Chief Executive Officer of GGCP, Inc.; Executive Chairman of Associated Capital Group, Inc. | | Director of Morgan Group Holdings, Inc. (holding company) (2001-2019); Chairman of the Board and Chief Executive Officer of LICT Corp. (multimedia and communication services company); Director of CIBL, Inc. (broadcasting and wireless communications); Director of ICTC Group Inc. (communications) (2013-2018) |
| | | | |
John D. Gabelli Director Age: 75 | | Since 1993 | | 12 | | Senior Vice President of G.research, LLC | | — |
| | | | |
| INDEPENDENT DIRECTORS5: | | | | | | | | |
| | | | |
E. Val Cerutti Director Age: 80 | | Since 2001 | | 7 | | Chief Executive Officer of Cerutti Consultants, Inc. | | Director of The LGL Group, Inc. (diversified manufacturing) (1990-2009) |
| | | | |
Anthony J. Colavita6 Director Age: 84 | | Since 1993 | | 20 | | President of the law firm of Anthony J. Colavita, P.C. | | — |
| | | | |
Werner J. Roeder Director Age: 79 | | Since 1993 | | 21 | | Retired physician; Former Vice President of Medical Affairs (Medical Director) of New York Presbyterian/Lawrence Hospital (1999-2014) | | — |
| | | | |
Anthonie C. van Ekris6 Director Age: 85 | | Since 1993 | | 23 | | Chairman and Chief Executive Officer of BALMAC International, Inc. (global import/ export company) | | — |
| | | | |
Salvatore J. Zizza7 Director Age: 74 | | Since 2004 | | 31 | | President of Zizza & Associates Corp. (private holding company); President of Bergen Cove Realty Inc.; Chairman of Harbor Diversified, Inc. (pharmaceuticals) (2009-2018); Chairman of BAM (semiconductor and aerospace manufacturing)(2000-2018); Chairman of Metropolitan Paper Recycling Inc. (recycling) (2005-2014) | | Director and Chairman of Trans-Lux Corporation (business services); Director and Chairman of Harbor Diversified Inc. (pharmaceuticals) (2009-2018) |
22
The Gabelli Global Growth Fund
Additional Fund Information (Continued) (Unaudited)
| | | | | | |
Name, Position(s)
Address1
and Age | | Term of Office and Length of Time Served2 | | | | Principal Occupation(s)
During Past Five Years |
| | | |
OFFICERS: | | | | | | |
| | | |
Bruce N. Alpert President Age: 68 | | Since 1993 | | | | Executive Vice President and Chief Operating Officer of Gabelli Funds, LLC since 1988; Officer of registered investment companies within the Gabelli/GAMCO Fund Complex; Senior Vice President of GAMCO Investors, Inc. since 2008 |
| | | |
John C. Ball Treasurer Age: 43 | | Since 2017 | | | | Treasurer of funds within the Gabelli/GAMCO Fund Complex since 2017; Vice President and Assistant Treasurer of AMG Funds, 2014-2017; Vice President of State Street Corporation, 2007-2014 |
| | | |
Agnes Mullady Vice President Age: 61 | | Since 2006 | | | | Officer of registered investment companies within the Gabelli/GAMCO Fund Complex since 2006; President and Chief Operating Officer of the Fund Division of Gabelli Funds, LLC since 2015; Chief Executive Officer of G.distributors, LLC since 2010; Senior Vice President of GAMCO Investors, Inc. since 2009; Vice President of Gabelli Funds, LLC since 2007; Executive Vice President of Associated Capital Group, Inc. since 2016 |
| | | |
Andrea R. Mango Secretary Age: 47 | | Since 2013 | | | | Vice President of GAMCO Investors, Inc. since 2016; Counsel of Gabelli Funds, LLC since 2013; Secretary of registered investment companies within the Gabelli/GAMCO Fund Complex since 2013; Vice President ofclosed-end funds within the Gabelli/GAMCO Fund Complex since 2014 |
| | | |
Richard J. Walz Chief Compliance Officer Age: 60 | | Since 2013 | | | | Chief Compliance Officer of registered investment companies within the Gabelli/GAMCO Fund Complex since 2013 |
| 1 | Address: One Corporate Center, Rye, NY 10580-1422, unless otherwise noted. |
| 2 | Each Director will hold office for an indefinite term until the earliest of (i) the next meeting of shareholders, if any, called for the purpose of considering the election orre-election of such Director and until the election and qualification of his or her successor, if any, elected at such meeting, or (ii) the date a Director resigns or retires, or a Director is removed by the Board of Directors or shareholders, in accordance with the Fund’sBy-Laws and Articles of Incorporation. For officers, includes time served in prior officer positions with the Fund. Each officer will hold office for an indefinite term until the date he or she resigns or retires or until his or her successor is elected and qualified. |
| 3 | This column includes only directorships of companies required to report to the SEC under the Securities Exchange Act of 1934, as amended, i.e., public companies, or other investment companies registered under the 1940 Act. |
| 4 | “Interested person” of the Corporation as defined in the 1940 Act. Messrs. Mario J. Gabelli and John D. Gabelli, who are brothers, are each considered an “interested person” because of their affiliation with Gabelli Funds, LLC which acts as the Corporation’s investment adviser. |
| 5 | Directors who are not interested persons are considered “Independent” Directors. |
| 6 | Mr. Colavita’s son, Anthony S. Colavita, serves as a director of other funds in the Gabelli/GAMCO Fund Complex. Mr. van Ekris is an independent director of Gabelli International Ltd., Gabelli Fund LDC, GAMA Capital Opportunities Master Ltd., and GAMCO International SICAV, which may be deemed to be controlled by Mario J. Gabelli and/or affiliates and, in that event, would be deemed to be under common control with the Fund’s Adviser. |
| 7 | Mr. Zizza is an independent director of Gabelli International Ltd., which may be deemed to be controlled by Mario J. Gabelli and/or affiliates and in that event would be deemed to be under common control with the Fund’s Adviser. On September 9, 2015, Mr. Zizza entered into a settlement with the SEC to resolve an inquiry relating to an alleged violation regarding the making of false statements or omissions to the accountants of a company concerning a related party transaction. The company in question is not an affiliate of, nor has any connection to, the Fund. Under the terms of the settlement, Mr. Zizza, without admitting or denying the SEC’s findings and allegation, paid $150,000 and agreed to cease and desist committing or causing any future violations of Rule13b2-2 of the Securities Exchange Act of 1934, as amended. The Board has discussed this matter and has determined that it does not disqualify Mr. Zizza from serving as an Independent Director. |
23
|
Gabelli/GAMCO Funds and Your Personal Privacy Who are we? The Gabelli/GAMCO Funds are investment companies registered with the Securities and Exchange Commission under the Investment Company Act of 1940. We are managed by Gabelli Funds, LLC, which is affiliated with GAMCO Investors, Inc., a publicly held company with subsidiaries and affiliates that provide investment advisory services for a variety of clients. What kind ofnon-public information do we collect about you if you become a fund shareholder? If you apply to open an account directly with us, you will be giving us somenon-public information about yourself. Thenon-public information we collect about you is: ● Information you give us on your application form. This could include your name, address, telephone number, social security number, bank account number, and other information. ● Information about your transactions with us, any transactions with our affiliates, and transactions with the entities we hire to provide services to you.This would include information about the shares that you buy or redeem. If we hire someone else to provide services — like a transfer agent — we will also have information about the transactions that you conduct through them. What information do we disclose and to whom do we disclose it? We do not disclose anynon-public personal information about our customers or former customers to anyone other than our affiliates, our service providers who need to know such information, and as otherwise permitted by law. If you want to find out what the law permits, you can read the privacy rules adopted by the Securities and Exchange Commission. They are in volume 17 of the Code of Federal Regulations, Part 248. The Commission often posts information about its regulations on its website, www.sec.gov. What do we do to protect your personal information? We restrict access tonon-public personal information about you to the people who need to know that information in order to provide services to you or the fund and to ensure that we are complying with the laws governing the securities business. We maintain physical, electronic, and procedural safeguards to keep your personal information confidential. |
This page was intentionally left blank.
This page was intentionally left blank.
THE GABELLI GLOBAL GROWTH FUND
One Corporate Center
Rye, NY 10580-1422
Portfolio Management Team Biographies
Caesar M. P. Bryanjoined GAMCO Asset Management in 1994. He is a member of the global investment team of Gabelli Funds, LLC and portfolio manager of several funds within the Gabelli/GAMCO Fund Complex. Prior to joining Gabelli, Mr. Bryan was a portfolio manager at Lexington Management. He began his investment career at Samuel Montagu Company, the London based merchant bank. Mr. Bryan graduated from the University of Southampton in England with a Bachelor of Law and is a member of the English Bar.
Howard F. Ward, CFA,joined Gabelli Funds in 1995 and currently serves as GAMCO’s Chief Investment Officer of Growth Equities as well as a Gabelli Funds, LLC portfolio manager for several funds within the Gabelli/GAMCO Fund Complex. Prior to joining Gabelli, Mr. Ward served as Managing Director and Lead Portfolio Manager for several Scudder mutual funds. He also was an Investment Officer in the Institutional Investment Department with Brown Brothers, Harriman & Co. Mr. Ward received his BA in Economics from Northwestern University.
Christopher D. Ward, CFA,joined the GAMCO Growth Team in 2015 as Vice President and Research Analyst. Prior to joining Gabelli Funds, Mr. Ward spent five years at Morgan Stanley Private Wealth Management where he served as Director of Business Strategy for The Apollo Group. Before joining Morgan Stanley, he was with the GFI Group, Inc., a wholesale institutional brokerage firm. Mr. Ward is a Chartered Financial Analyst and a member of the New York Society of Security Analysts. He graduated from Boston College with a BA in Economics.
|
2019 TAX NOTICE TO SHAREHOLDERS(Unaudited) For the year ended December 31, 2019, the Fund paid to shareholders long term capital gains totaling $10,428,680, or the maximum allowable. The distribution of long term capital gains has been designated as a capital gain dividend by the Fund’s Board of Directors. All designations are based on financial information available as of the date of this annual report and, accordingly, are subject to change. For each item, it is the intention of the Fund to designate the maximum amount permitted under the Internal Revenue Code and the regulations thereunder. |
|
We have separated the portfolio managers’ commentary from the financial statements and investment portfolio due to corporate governance regulations stipulated by the Sarbanes-Oxley Act of 2002. We have done this to ensure that the content of the portfolio managers’ commentary is unrestricted. Both the commentary and the financial statements, including the portfolio of investments, will be available on our website at www.gabelli.com. |
GAMCO Global Series Funds, Inc.
THE GABELLI GLOBAL GROWTH FUND
One Corporate Center
Rye, New York 10580-1422
| | |
| t | | 800-GABELLI(800-422-3554) |
| f | | 914-921-5118 |
| e | | info@gabelli.com |
| | GABELLI.com |
Net Asset Value per share available daily
by calling800-GABELLI after 7:00 P.M.
| | |
| BOARD OF DIRECTORS | | OFFICERS |
Mario J. Gabelli, CFA Chairman and Chief Executive Officer, GAMCO Investors, Inc. Executive Chairman, Associated Capital Group, Inc. E. Val Cerutti Chief Executive Officer, Cerutti Consultants, Inc. Anthony J. Colavita President, Anthony J. Colavita, P.C. John D. Gabelli Senior Vice President, G.research, LLC Werner J. Roeder Former Medical Director, Lawrence Hospital Anthonie C. van Ekris Chairman, BALMAC International, Inc. Salvatore J. Zizza Chairman, Zizza & Associates Corp. | | Bruce N. Alpert President John C. Ball Treasurer Agnes Mullady Vice President Andrea R. Mango Secretary Richard J. Walz Chief Compliance Officer DISTRIBUTOR G.distributors, LLC CUSTODIAN State Street Bank and Trust Company TRANSFER AGENT AND DIVIDEND DISBURSING AGENT DST Asset Manager Solutions, Inc. LEGAL COUNSEL Skadden, Arps, Slate, Meagher & Flom LLP |
|
This report is submitted for the general information of the shareholders of The Gabelli Global Growth Fund. It is not authorized for distribution to prospective investors unless preceded or accompanied by an effective prospectus. |

| | | | |
The Gabelli International Small Cap Fund Annual Report — December 31, 2019 | |
| 
Caesar M. P. Bryan Portfolio Manager |
|
To Our Shareholders,
For the year ended December 31, 2019, the net asset value (NAV) per Class AAA Share of The Gabelli International Small Cap Fund increased 25.9% compared with an increase of 25.0% for the Morgan Stanley Capital International (MSCI) Europe, Australasia and Far East (EAFE) Small Cap Index. Other classes of shares are available. See page 3 for performance information for all classes.
Enclosed are the financial statements, including the schedule of investments, as of December 31, 2019.
Performance Discussion (Unaudited)
The Fund’s objective is to provide investors with appreciation of capital. Current income is a secondary objective of the Fund.
The Fund’s investment strategy is to invest primarily in a portfolio of common stocks ofnon-U.S. companies. Under normal market conditions, the Fund will invest at least 80% of its net assets in the stocks of “small cap companies.” Gabelli Funds, LLC, the Adviser, currently characterizes small capitalization companies as those with total common stock market values of $3 billion or less at the time of investment.
The Fund may invest innon-U.S. markets throughout the world, including emerging markets. Ordinarily, the Fund will invest in the securities of at least five countries outside the U.S.
In selecting investments, the Adviser seeks issuers with a dominant market share or niche franchise in growing and/or consolidating industries. The Adviser considers for purchase the stocks of small capitalization companies with experienced management, strong balance sheets, and rising free cash flow and earnings. The Adviser’s goal is to invest long term in the stocks of companies trading at reasonable market valuations relative to perceived economic worth.
Beginning on January 1, 2021, as permitted by regulations adopted by the Securities and Exchange Commission, paper copies of the Fund’s annual and semiannual shareholder reports will no longer be sent by mail, unless you specifically request paper copies of the reports. Instead, the reports will be made available on the Fund’s website (www.gabelli.com), and you will be notified by mail each time a report is posted and provided with a website link to access the report. If you already elected to receive shareholder reports electronically, you will not be affected by this change and you need not take any action. To elect to receive all future reports on paper free of charge, please contact your financial intermediary, or, if you invest directly with the Fund, you may call800-422-3554 or send an email request to info@gabelli.com.
The markets made it look easy in 2019. Stocks, bonds, oil and gold, all returned double-digits. Stocks advanced across market cap, geographies and sectors. The MSCI All Country World Index advanced +27%. The U.S. market outperformed developed international markets, which outperformed emerging markets. Large cap outperformed small cap. Growth outperformed value. Technology was a standout in 2019. The S&P 500 Information Technology sector gained +48%, a full 17 percentage points better than the next best sector, being Communication Services, which, surprise, surprise, is mostly technology stocks.
Selected holdings that contributed positively to performance in 2019 were: NagaCorp Ltd. (3.1% of net assets as of December 31, 2019), a leisure and tourism company with casino operations in Phnom Penh, the capital city of Cambodia. The company saw a 37.9% year on year increase in mass market table buy ins during the period, reporting a take of $1.22 billion. Electronic gaming machines also proved popular, seeing an increase of 27.9% to $2.05 billion. A 35.3% increase in rolling chip turnover from VIP gamblers, for a total of $33.87 billion, also served to give the property a huge boost; Zojirushi Corp. (2.4%), a Japanese multinational manufacturer and marketer of vacuum flasks, beverage dispensers and consumer appliances. The company’s profit per share rose compared with the previous year; and Hotel Chocolat Group plc (2.3%), which engages in the manufacturing and retailing of chocolate in the United Kingdom and overseas. Increased sales in second half of the year and the opening of nine new U.K. stores saw an increase in group revenues.
Some of our weaker performing holdings during the year were: Laurent Perrier (1.5%), which manufactures, distributes, and sells champagne globally. Shipments in the champagne market fell in terms of volume and operating cash flow decreased year on year; Rothschild & Co. (1.5%) is a multinational investment bank and financial services company. The company’s revenues, net income and earnings declined year on year largely because of increases in operating costs; and Sekisui Plastics Co. (1.2%), engages in the manufacturing and sale of foamed plastics and other materials. Operating income rose, but recurring income and net income fell due to the impact of foreign exchange and other factors.
Thank you for your investment in The Gabelli International Small Cap Fund.
We appreciate your confidence and trust.
2
Comparative Results
| | | | | | | | | | | | | | | | | | | | | | | | | | | | | | |
| Average Annual Returns through December 31, 2019 (a) (Unaudited) | | | | |
| | | | | | | | | | | Since |
| | | | | | | | | | | Inception |
| | | 1 Year | | 5 Year | | 10 Year | | 15 Year | | (5/11/98) |
Class AAA (GABOX) | | | | 25.94 | % | | | | 5.28 | % | | | | 6.48 | % | | | | 5.67 | % | | | | 6.42 | % |
MSCI EAFE Small Cap Index | | | | 24.96 | | | | | 8.85 | | | | | 8.74 | | | | | 6.97 | | | | | 8.14 | (b) |
MSCI All Country (AC) World Index | | | | 26.60 | | | | | 8.41 | | | | | 8.79 | | | | | 6.86 | | | | | 5.58 | (c) |
Lipper GlobalLarge-Cap Growth Fund Classification | | | | 30.32 | | | | | 10.19 | | | | | 10.18 | | | | | 8.05 | | | | | 6.78 | |
Lipper GlobalMulti-Cap Growth Fund Classification | | | | 29.26 | | | | | 9.26 | | | | | 9.37 | | | | | 6.74 | | | | | 5.18 | |
Class A (GOCAX) | | | | 24.86 | | | | | 4.80 | | | | | 6.24 | | | | | 5.51 | | | | | 6.31 | |
With sales charge (d) | | | | 17.68 | | | | | 3.57 | | | | | 5.62 | | | | | 5.10 | | | | | 6.02 | |
Class C (GGLCX) | | | | 24.01 | | | | | 4.13 | | | | | 5.50 | | | | | 4.75 | | | | | 5.83 | |
With contingent deferred sales charge (e) | | | | 23.01 | | | | | 4.13 | | | | | 5.50 | | | | | 4.75 | | | | | 5.83 | |
Class I (GLOIX) | | | | 26.04 | | | | | 5.72 | | | | | 6.87 | | | | | 5.96 | | | | | 6.63 | | | | | | |
In the current prospectuses dated April 30, 2019, as amended by the supplement dated December 3, 2019, the gross expense ratios for Class AAA, A, C, and I Shares are 3.11%, 3.11%, 3.86%, and 2.86%, respectively, and the net expense ratio for all share classes after contractual reimbursements by Gabelli Funds, LLC, (the Adviser) is 0.90%. See page 10 for the expense ratios for the year ended December 31, 2019. The contractual reimbursements are in effect through April 30, 2021. Class AAA and Class I Shares do not have a sales charge. The maximum sales charge for Class A Shares and Class C Shares is 5.75% and 1.00%, respectively.
| | (a) | Returns represent past performance and do not guarantee future results. Total returns and average annual returns reflect changes in share price, reinvestment of distributions, and are net of expenses. Investment returns and the principal value of an investment will fluctuate. When shares are redeemed, they may be worth more or less than their original cost. Current performance may be lower or higher than the performance data presented. Visit www.gabelli.com for performance information as of the most recent month end. Returns would have been lower had the Adviser not reimbursed certain expenses of the Fund. The Fund imposes a 2% redemption fee on shares sold or exchanged within seven days of purchase. Investors should carefully consider the investment objectives, risks, charges, and expenses of the Fund before investing. The prospectuses contain information about these and other matters and should be read carefully before investing. To obtain a prospectus, please visit our website at www.gabelli.com.Investing in foreign securities involves risks not ordinarily associated with investments in domestic issues, including currencyfluctuation, economic, and political risks. The Class AAA Share NAVs are used to calculate performance for the periods prior to the issuance of Class A Shares, Class C Shares, and Class I Shares on March 12, 2000, November 23, 2001, and January 11, 2008, respectively. The actual performance of the Class A Shares and Class C Shares would have been lower due to the additional fees and expenses associated with these classes of shares. The actual performance of the Class I Shares would have been higher due to lower expenses related to this class of shares. The MSCI EAFE Small Cap Index has 2,304 constituents and captures small cap representation across Developed Markets countries around the world, excluding the U.S. and Canada. The MSCI AC World Index is an unmanaged market capitalization weighted index that is designed to measure the equity market performance of developed and emerging markets. The MSCI AC World Index consists of 45 country indices comprising 24 developed and 21 emerging market country indices. The Lipper GlobalLarge-Cap Growth Fund Classification and the Lipper GlobalMulti-Cap Growth Fund Classification reflect the average performance of mutual funds classified in those particular categories. Dividends are considered reinvested. You cannot invest directly in an index. | |
| | (b) | MSCI EAFE Small Cap Index inception date is December 31, 1998. |
| | (c) | The MSCI AC World Index since inception performance is as of April 30, 1994. |
| | (d) | Performance results include the effect of the maximum 5.75% sales charge at the beginning of the period. |
| | (e) | Assuming payment of the 1% maximum contingent deferred sales charge imposed on redemptions made within one year of purchase. |
COMPARISON OF CHANGE IN VALUE OF A $10,000 INVESTMENT IN
THE GABELLI INTERNATIONAL SMALL CAP FUND (CLASS AAA SHARES), LIPPER GLOBAL
MULTI-CAP GROWTH FUND CLASSIFICATION, MSCI AC WORLD INDEX, AND MSCI EAFE SMALL CAP INDEX (Unaudited)
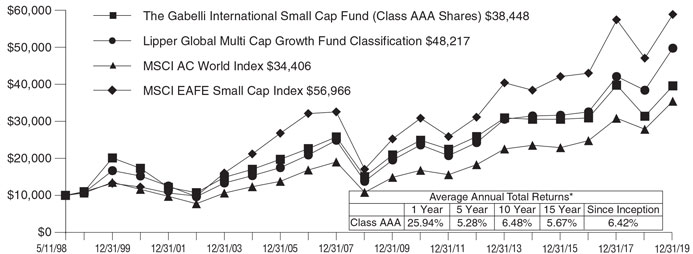
| * | Past performance is not predictive of future results. The performance tables and graph do not reflect the deduction of taxes that a shareholder would pay on Fund distributions or the redemption of Fund shares. |
3
| | |
| The Gabelli International Small Cap Fund | | |
Disclosure of Fund Expenses (Unaudited) | | |
For the Six Month Period from July 1, 2019 through December 31, 2019 | | Expense Table |
We believe it is important for you to understand the impact of fees and expenses regarding your investment. All mutual funds have operating expenses. As a shareholder of a fund, you incur ongoing costs, which include costs for portfolio management, administrative services, and shareholder reports (like this one), among others. Operating expenses, which are deducted from a fund’s gross income, directly reduce the investment return of a fund. When a fund’s expenses are expressed as a percentage of its average net assets, this figure is known as the expense ratio. The following examples are intended to help you understand the ongoing costs (in dollars) of investing in your Fund and to compare these costs with those of other mutual funds. The examples are based on an investment of $1,000 made at the beginning of the period shown and held for the entire period.
The Expense Table below illustrates your Fund’s costs in two ways:
Actual Fund Return:This section provides informationabout actual account values and actual expenses. You may use this section to help you to estimate the actual expenses that you paid over the period after any fee waivers and expense reimbursements. The “Ending Account Value” shown is derived from the Fund’sactualreturn during the past six months, and the“Expenses Paid During Period” shows the dollar amount that would have been paid by an investor who started with $1,000 in the Fund. You may use this information, together with the amount you invested, to estimate the expenses that you paid over the period.
To do so, simply divide your account value by $1,000 (for example, an $8,600 account value divided by $1,000 = 8.6), then multiply the result by the number given for your Fund under the heading “Expenses Paid During Period” to estimate the expenses you paid during this period.
Hypothetical 5% Return:This section providesinformation about hypothetical account values and
hypothetical expenses based on the Fund’s actual expense ratio. It assumes a hypothetical annualized return of 5% before expenses during the period shown. In this case – because the hypothetical return used isnot the Fund’s actual return – the results do not apply to your investment and you cannot use the hypothetical account value and expense to estimate the actual ending account balance or expenses you paid for the period. This example is useful in making comparisons of the ongoing costs of investing in the Fund and other funds. To do so, compare this 5% hypothetical example with the 5% hypothetical examples that appear in shareholder reports of other funds.
Please note that the expenses shown in the table are meant to highlight your ongoing costs only and do not reflect any transactional costs such as sales charges (loads), redemption fees, or exchange fees, if any, which are described in the Prospectus. If these costs were applied to your account, your costs would be higher. Therefore, the 5% hypothetical return is useful in comparing ongoing costs only, and will not help you determine the relative total costs of owning different funds. The “Annualized Expense Ratio” represents the actual expenses for the last six months and may be different from the expense ratio in the Financial Highlights which is for the year ended December 31, 2019.
| | | | | | | | | | | | | | |
| | | Beginning
Account Value
07/01/19 | | Ending
Account Value
12/31/19 | | | Annualized
Expense
Ratio | | | Expenses
Paid During
Period* | |
The Gabelli International Small Cap Fund | | | | | |
Actual Fund Return | | | | | | | | | | | | |
Class AAA | | $1,000.00 | | | $1,130.90 | | | | 0.98% | | | | $ 5.26 | |
Class A | | $1,000.00 | | | $1,126.20 | | | | 1.80% | | | | $ 9.65 | |
Class C | | $1,000.00 | | | $1,122.50 | | | | 2.42% | | | | $12.95 | |
Class I | | $1,000.00 | | | $1,131.30 | | | | 0.98% | | | | $ 5.26 | |
Hypothetical 5% Return | | | | | | | | | | | | |
Class AAA | | $1,000.00 | | | $1,020.27 | | | | 0.98% | | | | $ 4.99 | |
Class A | | $1,000.00 | | | $1,016.13 | | | | 1.80% | | | | $ 9.15 | |
Class C | | $1,000.00 | | | $1,013.01 | | | | 2.42% | | | | $12.28 | |
Class I | | $1,000.00 | | | $1,020.27 | | | | 0.98% | | | | $ 4.99 | |
| * | Expenses are equal to the Fund’s annualized expense ratio for the last six months multiplied by the average account value over the period, multiplied by the number of days in the most recent fiscal half year (184 days), then divided by 365. |
4
Summary of Portfolio Holdings (Unaudited)
The following table presents portfolio holdings as a percent of net assets as of December 31, 2019:
The Gabelli International Small Cap Fund
| | | | |
Consumer Discretionary | | | 19.2 | % |
Consumer Staples | | | 17.4 | % |
Materials | | | 12.6 | % |
Industrials | | | 12.4 | % |
Health Care | | | 10.6 | % |
Financials | | | 8.9 | % |
|
Communication Services | | | 6.9 | % |
|
| | | | |
Information Technology | | | 6.0 | % |
Real Estate | | | 4.0 | % |
U.S. Government Obligations | | | 3.1 | % |
Utilities | | | 0.2 | % |
Other Assets and Liabilities (Net) | | | (1.3 | )% |
| | | | |
| | | 100.0 | % |
| | | | |
The Fund files a complete schedule of portfolio holdings with the Securities and Exchange Commission (the SEC) for the first and third quarters of each fiscal year on FormN-PORT. Shareholders may obtain this information at www.gabelli.com or by calling the Fund at800-GABELLI(800-422-3554). The Fund’s FormN-PORT is available on the SEC’s website at www.sec.gov and may also be reviewed and copied at the SEC’s Public Reference Room in Washington, DC. Information on the operation of the Public Reference Room may be obtained by calling800-SEC-0330.
Proxy Voting
The Fund files FormN-PX with its complete proxy voting record for the twelve months ended June 30, no later than August 31 of each year. A description of the Fund’s proxy voting policies, procedures, and how the Fund voted proxies relating to portfolio securities is available without charge, upon request, by (i) calling800-GABELLI(800-422-3554); (ii) writing to The Gabelli Funds at One Corporate Center, Rye, NY 10580-1422; or (iii) visiting the SEC’s website at www.sec.gov.
5
The Gabelli International Small Cap Fund
Schedule of Investments — December 31, 2019
| | | | | | | | | | | | |
| | | | | | | | | Market | |
Shares | | | | | Cost | | | Value | |
| | | | COMMON STOCKS — 97.1% | | | | | | | | |
| | | | CONSUMER DISCRETIONARY — 19.2% | |
| | 5,555 | | | AcadeMedia AB | | $ | 39,150 | | | $ | 32,679 | |
| | 5,918 | | | Aston Martin Lagonda Global Holdings plc† | | | 76,447 | | | | 40,747 | |
| | 5,500 | | | Beneteau SA | | | 102,689 | | | | 66,814 | |
| | 7,000 | | | Crest Nicholson Holdings plc | | | 53,128 | | | | 40,038 | |
| | 10,000 | | | Gamesys Group plc† | | | 114,600 | | | | 93,650 | |
| | 11,820 | | | GVC Holdings plc | | | 107,595 | | | | 138,438 | |
| | 1,150 | | | Hunter Douglas NV | | | 94,649 | | | | 74,818 | |
| | 2,200 | | | JINS Holdings Inc. | | | 125,148 | | | | 149,427 | |
| | 25,000 | | | Mandarin Oriental International Ltd. | | | 61,939 | | | | 45,500 | |
| | 140,000 | | | NagaCorp. Ltd. | | | 91,176 | | | | 244,344 | |
| | 9,000 | | | Scandic Hotels Group AB | | | 117,117 | | | | 100,317 | |
| | 2,000 | | | Tod’s SpA | | | 132,379 | | | | 92,473 | |
| | 10,000 | | | Treatt plc | | | 57,375 | | | | 60,932 | |
| | 50,000 | | | William Hill plc | | | 142,702 | | | | 124,811 | |
| | 10,000 | | | Zojirushi Corp. | | | 93,734 | | | | 189,407 | |
| | | | | | | | | | | | |
| | | | TOTAL CONSUMER DISCRETIONARY | | | 1,409,828 | | | | 1,494,395 | |
| | | | | | | | | | | | |
| | |
| | | | CONSUMER STAPLES — 17.4% | | | | | |
| | 800 | | | Danone SA | | | 47,829 | | | | 66,315 | |
| | 5,000 | | | Glanbia plc | | | 59,316 | | | | 57,544 | |
| | 30,000 | | | Hotel Chocolat Group plc | | | 131,832 | | | | 176,835 | |
| | 2,420 | | | Interparfums SA | | | 82,577 | | | | 100,438 | |
| | 2,700 | | | Kameda Seika Co. Ltd. | | | 112,789 | | | | 123,874 | |
| | 3,000 | | | Kobe Bussan Co. Ltd. | | | 94,197 | | | | 103,539 | |
| | 1,200 | | | Laurent-Perrier | | | 113,180 | | | | 117,644 | |
| | 3,000 | | | Milbon Co. Ltd. | | | 103,616 | | | | 171,184 | |
| | 60 | | | Philip Morris CR AS | | | 50,515 | | | | 40,441 | |
| | 80,000 | | | Premier Foods plc† | | | 43,658 | | | | 40,109 | |
| | 22,000 | | | PZ Cussons plc | | | 87,780 | | | | 60,760 | |
| | 4,000 | | | Sakata Seed Corp. | | | 118,342 | | | | 134,922 | |
| | 35,000 | | | Stock Spirits Group plc | | | 126,796 | | | | 95,736 | |
| | 1,300 | | | Viscofan SA | | | 75,483 | | | | 68,682 | |
| | | | | | | | | | | | |
| | | | TOTAL CONSUMER STAPLES | | | 1,247,910 | | | | 1,358,023 | |
| | | | | | | | | | | | |
| | |
| | | | MATERIALS — 12.6% | | | | | |
| | 6,000 | | | Alamos Gold Inc., Cl. A | | | 44,345 | | | | 36,120 | |
| | 13,850 | | | Alamos Gold Inc., Toronto, Cl. A | | | 102,362 | | | | 83,513 | |
| | 18,000 | | | B2Gold Corp. | | | 51,262 | | | | 72,219 | |
| | 6,250 | | | Castile Resources Pty Ltd.†(a) | | | 0 | | | | 0 | |
| | 20,000 | | | Centamin plc | | | 41,668 | | | | 33,645 | |
| | 3,000 | | | Detour Gold Corp.† | | | 42,313 | | | | 58,080 | |
| | 3,000 | | | Endeavour Mining Corp.† | | | 60,421 | | | | 56,671 | |
| | 12,000 | | | Hochschild Mining plc | | | 46,101 | | | | 29,088 | |
| | 3,000 | | | Labrador Iron Ore Royalty Corp. | | | 51,466 | | | | 56,879 | |
| | 4,000 | | | MAG Silver Corp.† | | | 51,468 | | | | 47,253 | |
| | 15,000 | | | OceanaGold Corp. | | | 50,106 | | | | 29,456 | |
| | 7,000 | | | Pretium Resources Inc.† | | | 78,698 | | | | 77,910 | |
| | 12,000 | | | Sekisui Plastics Co. Ltd. | | | 136,928 | | | | 91,666 | |
| | 20,000 | | | SEMAFO Inc.† | | | 55,436 | | | | 41,585 | |
| | 2,000 | | | Sumitomo Bakelite Co. Ltd. | | | 87,393 | | | | 75,744 | |
| | | | | | | | | | | | |
| | | | | | | | | Market | |
Shares | | | | | Cost | | | Value | |
| | 5,000 | | | T. Hasegawa Co. Ltd. | | $ | 97,468 | | | $ | 98,063 | |
| | 10,000 | | | Teranga Gold Corp.† | | | 38,044 | | | | 54,060 | |
| | 25,000 | | | Westgold Resources Ltd.† | | | 38,443 | | | | 40,175 | |
| | | | | | | | | | | | |
| | | | TOTAL MATERIALS | | | 1,073,922 | | | | 982,127 | |
| | | | | | | | | | | | |
| | |
| | | | INDUSTRIALS — 12.4% | | | | | |
| | 10,000 | | | Aida Engineering Ltd. | | | 116,191 | | | | 90,470 | |
| | 40,000 | | | Chemring Group plc | | | 100,043 | | | | 127,427 | |
| | 2,000 | | | Clarkson plc | | | 78,000 | | | | 80,139 | |
| | 4,000 | | | Loomis AB, Cl. B | | | 148,615 | | | | 165,614 | |
| | 20,000 | | | Rotork plc | | | 68,941 | | | | 88,749 | |
| | 2,000 | | | Shima Seiki Manufacturing Ltd. | | | 101,334 | | | | 46,993 | |
| | 12,000 | | | Signature Aviation plc | | | 42,061 | | | | 50,420 | |
| | 10,000 | | | Sodick Co. Ltd. | | | 123,377 | | | | 89,642 | |
| | 13,000 | | | Teraoka Seisakusho Co. Ltd. | | | 100,314 | | | | 60,062 | |
| | 6,000 | | | Workspace Group plc, REIT | | | 72,186 | | | | 94,418 | |
| | 8,000 | | | Yushin Precision Equipment Co. Ltd. | | | 109,039 | | | | 74,879 | |
| | | | | | | | | | | | |
| | | | TOTAL INDUSTRIALS | | | 1,060,101 | | | | 968,813 | |
| | | | | | | | | | | | |
| | |
| | | | HEALTH CARE — 9.5% | | | | | |
| | 3,428 | | | AddLife AB, Cl. B | | | 66,615 | | | | 105,771 | |
| | 600 | | | Bachem Holding AG, Cl. B | | | 84,777 | | | | 95,970 | |
| | 6,000 | | | CVS Group plc | | | 76,399 | | | | 91,001 | |
| | 900 | | | Gerresheimer AG | | | 78,165 | | | | 69,658 | |
| | 10,000 | | | IRRAS AB† | | | 39,590 | | | | 24,983 | |
| | 15,000 | | | Nanosonics Ltd.† | | | 32,031 | | | | 66,842 | |
| | 230 | | | Siegfried Holding AG | | | 76,087 | | | | 111,459 | |
| | 10,000 | | | Tristel plc | | | 42,363 | | | | 50,997 | |
| | 1,300 | | | Vetoquinol SA | | | 81,468 | | | | 93,909 | |
| | 250 | | | Ypsomed Holding AG | | | 47,385 | | | | 33,840 | |
| | | | | | | | | | | | |
| | | | TOTAL HEALTH CARE | | | 624,880 | | | | 744,430 | |
| | | | | | | | | | | | |
| | |
| | | | FINANCIALS — 8.9% | | | | | |
| | 30,000 | | | Brewin Dolphin Holdings plc | | | 141,892 | | | | 147,985 | |
| | 4,000 | | | Kinnevik AB, Cl. B | | | 92,113 | | | | 97,797 | |
| | 14,000 | | | Polar Capital Holdings plc | | | 85,288 | | | | 101,995 | |
| | 4,000 | | | Rothschild & Co. | | | 142,628 | | | | 114,863 | |
| | 13,000 | | | Tamburi Investment Partners SpA | | | 90,851 | | | | 99,450 | |
| | 120,000 | | | Value Partners Group Ltd. | | | 109,270 | | | | 73,919 | |
| | 31,538 | | | XPS Pensions Group plc | | | 76,002 | | | | 57,232 | |
| | | | | | | | | | | | |
| | | | TOTAL FINANCIALS | | | 738,044 | | | | 693,241 | |
| | | | | | | | | | | | |
| | |
| | | | COMMUNICATION SERVICES — 6.9% | | | | | |
| | 1,100 | | | Akatsuki Inc. | | | 66,733 | | | | 59,224 | |
| | 30,000 | | | HT&E Ltd. | | | 55,068 | | | | 35,684 | |
| | 9,000 | | | Manchester United plc, Cl. A | | | 159,353 | | | | 179,370 | |
| | 548 | | | Millicom International Cellular SA, SDR | | | 24,918 | | | | 26,246 | |
| | 4,190 | | | Modern Times Group MTG AB, Cl. B† | | | 66,034 | | | | 49,946 | |
| | 4,190 | | | Nordic Entertainment Group AB, Cl. B | | | 92,012 | | | | 135,456 | |
| | 1,000 | | | Xilam Animation SA† | | | 45,110 | | | | 49,804 | |
| | | | | | | | | | | | |
| | | | TOTAL COMMUNICATION SERVICES | | | 509,228 | | | | 535,730 | |
| | | | | | | | | | | | |
See accompanying notes to financial statements.
6
The Gabelli International Small Cap Fund
Schedule of Investments (Continued) — December 31, 2019
| | | | | | | | | | |
Shares | | | | Cost | | | Market Value | |
| | COMMON STOCKS (Continued) | | | | | |
| | INFORMATION TECHNOLOGY — 6.0% | |
24,285 | | Equiniti Group plc | | $ | 90,810 | | | $ | 66,395 | |
10,000 | | F-Secure OYJ† | | | 49,487 | | | | 34,156 | |
12,000 | | Infomart Corp. | | | 69,674 | | | | 108,785 | |
20,000 | | NCC Group plc | | | 57,230 | | | | 59,740 | |
35,000 | | Oxford Metrics plc | | | 34,515 | | | | 49,143 | |
3,000 | | PSI Software AG | | | 67,275 | | | | 69,994 | |
6,000 | | Topcon Corp. | | | 108,068 | | | | 78,579 | |
| | | | | | | | | | |
| | TOTAL INFORMATION TECHNOLOGY | | | 477,059 | | | | 466,792 | |
| | | | | | | | | | |
| | |
| | REAL ESTATE — 4.0% | | | | | |
25,000 | | Impact Healthcare Reit plc, REIT | | | 34,145 | | | | 35,764 | |
4,000 | | PATRIZIA AG | | | 88,694 | | | | 89,108 | |
7,000 | | Tosei Corp. | | | 70,534 | | | | 96,121 | |
500 | | Warehouses De Pauw CVA, REIT | | | 56,435 | | | | 90,970 | |
| | | | | | | | | | |
| | TOTAL REAL ESTATE | | | 249,808 | | | | 311,963 | |
| | | | | | | | | | |
| | | |
| | UTILITIES — 0.2% | | | | | | | | |
75,000 | | China Everbright Water Ltd. | | | 27,144 | | | | 17,845 | |
| | | | | | | | | | |
| | | |
| | TOTAL COMMON STOCKS | | | 7,417,924 | | | | 7,573,359 | |
| | | | | | | | | | |
| | |
| | PREFERRED STOCKS — 1.1% | | | | | |
| | Health Care — 1.1% | | | | | | | | |
1,400 | | Draegerwerk AG & Co. KGaA, 0.190% | | | 123,037 | | | | 87,471 | |
| | | | | | | | | | |
| | | |
| | RIGHTS — 0.0% | | | | | | | | |
| | Materials — 0.0% | | | | | | | | |
6,250 | | Castile Resources Pty Ltd., expire 01/10/20†(a) | | | 0 | | | | 0 | |
| | | | | | | | | | |
| | | | | | | | | | |
Principal Amount | | | | Cost | | | Market Value | |
| | U.S. GOVERNMENT OBLIGATIONS — 3.1% | | | | | |
$ 240,000 | | U.S. Treasury Bills,
1.529% to 1.543%††, 03/12/20 | | $ | 239,275 | | | $ | 239,301 | |
| | | | | | | | | | |
| | | |
| | TOTAL INVESTMENTS — 101.3% | | $ | 7,780,236 | | | | 7,900,131 | |
| | | | | | | | | | |
| | |
| | Other Assets and Liabilities (Net) — (1.3)% | | | | (104,827 | ) |
| | | | | | | | | | |
| | | |
| | NET ASSETS — 100.0% | | | | | | $ | 7,795,304 | |
| | | | | | | | | | |
| (a) | Security is valued using significant unobservable inputs and is classified as Level 3 in the fair value hierarchy. |
| † | Non-income producing security. |
| †† | Represents annualized yields at dates of purchase. |
| REIT | Real Estate Investment Trust |
| SDR | Swedish Depositary Receipt |
| | | | | | | | | | |
Geographic Diversification | | % of
Market
Value | | Market
Value |
Europe | | | | 58.9 | % | | | $ | 4,651,108 | |
Japan | | | | 23.3 | | | | | 1,842,580 | |
Canada | | | | 6.7 | | | | | 527,619 | |
Latin America | | | | 4.2 | | | | | 330,103 | |
Asia/Pacific | | | | 3.9 | | | | | 309,420 | |
United States | | | | 3.0 | | | | | 239,301 | |
| | | | | | | | | | |
| | | | 100.0 | % | | | $ | 7,900,131 | |
| | | | | | | | | | |
See accompanying notes to financial statements.
7
The Gabelli International Small Cap Fund
Statement of Assets and Liabilities
December 31, 2019
| | | | |
Assets: | | | | |
Investments, at value (cost $7,780,236) | | $ | 7,900,131 | |
Foreign currency, at value (cost $5) | | | 5 | |
Receivable for Fund shares sold | | | 2,204 | |
Receivable from Adviser | | | 22,851 | |
Dividends receivable | | | 22,731 | |
Prepaid expenses | | | 14,654 | |
| | | | |
Total Assets | | | 7,962,576 | |
| | | | |
Liabilities: | | | | |
Payable to custodian | | | 87,347 | |
Payable for investment advisory fees | | | 12,899 | |
Payable for distribution fees | | | 1,393 | |
Payable for shareholder communications expenses | | | 12,113 | |
Payable for shareholder services fees | | | 4,627 | |
Payable for legal and audit fees | | | 29,999 | |
Other accrued expenses | | | 18,894 | |
| | | | |
Total Liabilities | | | 167,272 | |
| | | | |
Net Assets (applicable to 594,355 shares outstanding) | | $ | 7,795,304 | |
| | | | |
Net Assets Consist of: | | | | |
Paid-in capital | | $ | 7,685,886 | |
Total distributable earnings | | | 109,418 | |
| | | | |
Net Assets | | $ | 7,795,304 | |
| | | | |
| |
Shares of Capital Stock, each at $0.001 par value: | | | | |
Class AAA: | | | | |
Net Asset Value, offering, and redemption price per share ($6,365,710 ÷ 487,240 shares outstanding; 75,000,000 shares authorized) | | | $13.06 | |
Class A: | | | | |
Net Asset Value and redemption price per share ($91,199 ÷ 6,997 shares outstanding; 50,000,000 shares authorized) | | | $13.03 | |
Maximum offering price per share (NAV ÷ 0.9425, based on maximum sales charge of 5.75% of the offering price) | | | $13.82 | |
Class C: | | | | |
Net Asset Value and offering price per share ($26,664 ÷ 2,271 shares outstanding; 25,000,000 shares authorized) | | | $11.74 | (a) |
Class I: | | | | |
Net Asset Value, offering, and redemption price per share ($1,311,731 ÷ 97,847 shares outstanding; 25,000,000 shares authorized). | | | $13.41 | |
| (a) | Redemption price varies based on the length of time held. |
Statement of Operations
For the Year Ended December 31, 2019
| | | | |
Investment Income: | | | | |
Dividends (net of foreign withholding taxes of $15,274) | | $ | 165,923 | |
Income fromnon-cash dividends | | | 24,063 | |
Interest | | | 5,393 | |
| | | | |
Total Investment Income | | | 195,379 | |
| | | | |
Expenses: | | | | |
Investment advisory fees | | | 78,209 | |
Distribution fees - Class AAA | | | 15,790 | |
Distribution fees - Class A | | | 211 | |
Distribution fees - Class C | | | 280 | |
Legal and audit fees | | | 35,451 | |
Registration expenses | | | 30,377 | |
Shareholder communications expenses | | | 28,758 | |
Shareholder services fees | | | 20,194 | |
Custodian fees | | | 6,080 | |
Directors’ fees | | | 2,008 | |
Interest expense | | | 297 | |
Miscellaneous expenses | | | 45,739 | |
| | | | |
Total Expenses | | | 263,394 | |
| | | | |
Less: | | | | |
Expenses reimbursements (See Note 3) | | | (184,323 | ) |
| | | | |
Net Expenses | | | 79,071 | |
| | | | |
Net Investment Income | | | 116,308 | |
| | | | |
Net Realized and Unrealized Gain/(Loss) on Investments and Foreign Currency: | | | | |
Net realized gain on investments | | | 380,404 | |
Net realized loss on foreign currency transactions | | | (505 | ) |
| | | | |
Net realized gain on investments and foreign currency transactions | | | 379,899 | |
| | | | |
Net change in unrealized appreciation/depreciation: on investments | | | 1,293,762 | |
on foreign currency translations | | | 176 | |
| | | | |
Net change in unrealized appreciation/depreciation on investments and foreign currency translations | | | 1,293,938 | |
| | | | |
Net Realized and Unrealized Gain/(Loss) on Investments and Foreign Currency | | | 1,673,837 | |
| | | | |
Net Increase in Net Assets Resulting from Operations | | $ | 1,790,145 | |
| | | | |
See accompanying notes to financial statements.
8
The Gabelli International Small Cap Fund
Statement of Changes in Net Assets
| | | | | | | | | | |
| | |
| | | Year Ended
December 31, 2019 | | Year Ended
December 31, 2018 |
Operations: | | | | | | | | | | |
Net investment income | | | $ | 116,308 | | | | $ | 103,452 | |
Net realized gain on investments and foreign currency transactions | | | | 379,899 | | | | | 1,754,851 | |
Net change in unrealized appreciation/depreciation on investments and foreign currency translations | | | | 1,293,938 | | | | | (3,980,491 | ) |
| | | | | | | | | | |
Net Increase/(Decrease) in Net Assets Resulting from Operations | | | | 1,790,145 | | | | | (2,122,188 | ) |
| | | | | | | | | | |
Distributions to Shareholders: | | | | | | | | | | |
Accumulated earnings | | | | | | | | | | |
Class AAA | | | | (413,625 | ) | | | | (1,452,994 | ) |
Class A | | | | (5,111 | ) | | | | (19,971 | ) |
Class C | | | | (1,466 | ) | | | | (7,638 | ) |
Class I | | | | (84,650 | ) | | | | (364,355 | ) |
| | | | | | | | | | |
| | | | (504,852 | ) | | | | (1,844,958 | ) |
| | | | | | | | | | |
Return of Capital | | | | | | | | | | |
Class AAA | | | | — | | | | | (2,742 | ) |
Class I | | | | — | | | | | (666 | ) |
| | | | | | | | | | |
| | | | — | | | | | (3,408 | ) |
| | | | | | | | | | |
Total Distributions to Shareholders | | | | (504,852 | ) | | | | (1,848,366 | ) |
| | | | | | | | | | |
| | |
Capital Share Transactions: | | | | | | | | | | |
Class AAA | | | | (627,085 | ) | | | | 484,686 | |
Class A | | | | (3,385 | ) | | | | (31,025 | ) |
Class C | | | | (8,781 | ) | | | | 3,490 | |
Class I | | | | (474,101 | ) | | | | 307,596 | |
| | | | | | | | | | |
Net Increase/(Decrease) in Net Assets from Capital Share Transactions | | | | (1,113,352 | ) | | | | 764,747 | |
| | | | | | | | | | |
| | |
Redemption Fees | | | | 109 | | | | | 803 | |
| | | | | | | | | | |
Net Increase/(Decrease) in Net Assets | | | | 172,050 | | | | | (3,205,004 | ) |
Net Assets: | | | | | | | | | | |
Beginning of year | | | | 7,623,254 | | | | | 10,828,258 | |
| | | | | | | | | | |
End of year | | | $ | 7,795,304 | | | | $ | 7,623,254 | |
| | | | | | | | | | |
| See | accompanying notes to financial statements. |
9
The Gabelli International Small Cap Fund
Financial Highlights
Selected data for a share of capital stock outstanding throughout each year:
| | | | | | | | | | | | | | | | | | | | | | | | | | | | | | | | | | | | | | | | | | | | | | | | | | | | | | | | | | | | | | | | | | | | | | | | | | | | | | | | |
| | | | | Income (Loss)
from Investment Operations | | Distributions | | | | | | | | Ratios to Average Net Assets/
Supplemental Data |
Year Ended
December 31 | | Net Asset
Value,
Beginning
of Year | | Net
Investment
Income
(Loss)(a) | | Net
Realized
and
Unrealized
Gain (Loss)
on
Investments | | Total from
Investment
Operations | | Net
Investment
Income | | Net Realized
Gain | | Return of
Capital | | Total
Distributions | | Redemption
Fees(a)(b) | | Net
Asset
Value,
End of
Year | | Total
Return† | | Net Assets
End of
Year
(in 000’s) | | Net
Investment
Income
(Loss) | | Operating
Expenses
Before
Reimburse-
ment | | Operating
Expenses
Net of
Reimburse-
ment(c)(d) | | Portfolio
Turnover
Rate |
Class AAA | | | | | | | | | | | | | | | | | | | | | | | | | | | | | | | | | | | | | | | | | | | | | | | | | | | | | | | | | | | | | | | | | | | | | | | | | | | | | | | | |
2019 | | | $ | 11.09 | | | | $ | 0.19 | (e) | | | $ | 2.68 | | | | $ | 2.87 | | | | $ | (0.22 | ) | | | $ | (0.68 | ) | | | | — | | | | $ | (0.90 | ) | | | $ | 0.00 | | | | $ | 13.06 | | | | | 25.9 | % | | | $ | 6,366 | | | | | 1.50 | %(e) | | | | 3.41 | % | | | | 1.00 | % | | | | 9 | % |
2018 | | | | 18.55 | | | | | 0.19 | | | | | (4.13 | ) | | | | (3.94 | ) | | | | (0.19 | ) | | | | (3.32 | ) | | | $ | (0.01 | ) | | | | (3.52 | ) | | | | 0.00 | | | | | 11.09 | | | | | (20.9 | ) | | | | 5,954 | | | | | 1.07 | | | | | 3.11 | | | | | 1.00 | (f) | | | | 26 | |
2017 | | | | 22.41 | | | | | 0.04 | | | | | 6.19 | | | | | 6.23 | | | | | (0.13 | ) | | | | (9.96 | ) | | | | — | | | | | (10.09 | ) | | | | — | | | | | 18.55 | | | | | 28.1 | | | | | 8,599 | | | | | 0.16 | | | | | 3.01 | | | | | 1.67 | | | | | 71 | |
2016 | | | | 23.45 | | | | | 0.27 | | | | | (0.02 | ) | | | | 0.25 | | | | | (0.28 | ) | | | | (1.01 | ) | | | | — | | | | | (1.29 | ) | | | | 0.00 | | | | | 22.41 | | | | | 1.1 | | | | | 7,764 | | | | | 1.14 | | | | | 2.80 | | | | | 1.38 | (g)(h) | | | | 4 | |
2015 | | | | 23.71 | | | | | 0.01 | | | | | 0.05 | | | | | 0.06 | | | | | (0.11 | ) | | | | (0.21 | ) | | | | — | | | | | (0.32 | ) | | | | 0.00 | | | | | 23.45 | | | | | 0.2 | | | | | 8,596 | | | | | 0.03 | | | | | 2.67 | | | | | 2.02 | (f)(g) | | | | 7 | |
Class A | | | | | | | | | | | | | | | | | | | | | | | | | | | | | | | | | | | | | | | | | | | | | | | | | | | | | | | | | | | | | | | | | | | | | | | | | | | | | | | | |
2019 | | | $ | 11.05 | | | | $ | 0.07 | (e) | | | $ | 2.67 | | | | $ | 2.74 | | | | $ | (0.08 | ) | | | $ | (0.68 | ) | | | | — | | | | $ | (0.76 | ) | | | $ | 0.00 | | | | $ | 13.03 | | | | | 24.9 | % | | | $ | 91 | | | | | 0.60 | %(e) | | | | 3.41 | % | | | | 1.91 | % | | | | 9 | % |
2018 | | | | 18.44 | | | | | 0.01 | | | | | (4.08 | ) | | | | (4.07 | ) | | | | — | | | | | (3.32 | ) | | | | — | | | | | (3.32 | ) | | | | 0.00 | | | | | 11.05 | | | | | (21.7 | ) | | | | 81 | | | | | 0.04 | | | | | 3.11 | | | | | 2.01 | (f) | | | | 26 | |
2017 | | | | 22.33 | | | | | (0.05 | ) | | | | 6.18 | | | | | 6.13 | | | | | (0.06 | ) | | | | (9.96 | ) | | | | — | | | | | (10.02 | ) | | | | — | | | | | 18.44 | | | | | 27.7 | | | | | 155 | | | | | (0.19 | ) | | | | 3.01 | | | | | 2.00 | | | | | 71 | |
2016 | | | | 23.35 | | | | | 0.27 | | | | | (0.01 | ) | | | | 0.26 | | | | | (0.27 | ) | | | | (1.01 | ) | | | | — | | | | | (1.28 | ) | | | | 0.00 | | | | | 22.33 | | | | | 1.1 | | | | | 166 | | | | | 1.14 | | | | | 2.80 | | | | | 1.39 | (g)(h) | | | | 4 | |
2015 | | | | 23.61 | | | | | 0.02 | | | | | 0.03 | | | | | 0.05 | | | | | (0.10 | ) | | | | (0.21 | ) | | | | — | | | | | (0.31 | ) | | | | 0.00 | | | | | 23.35 | | | | | 0.1 | | | | | 183 | | | | | 0.08 | | | | | 2.67 | | | | | 2.02 | (f)(g) | | | | 7 | |
Class C | | | | | | | | | | | | | | | | | | | | | | | | | | | | | | | | | | | | | | | | | | | | | | | | | | | | | | | | | | | | | | | | | | | | | | | | | | | | | | | | |
2019 | | | $ | 10.02 | | | | $ | (0.01 | )(e) | | | $ | 2.41 | | | | $ | 2.40 | | | | | — | | | | $ | (0.68 | ) | | | | — | | | | $ | (0.68 | ) | | | $ | 0.00 | | | | $ | 11.74 | | | | | 24.0 | % | | | $ | 26 | | | | | (0.12 | )%(e) | | | | 4.16 | % | | | | 2.61 | % | | | | 9 | % |
2018 | | | | 17.26 | | | | | (0.11 | ) | | | | (3.81 | ) | | | | (3.92 | ) | | | | — | | | | | (3.32 | ) | | | | — | | | | | (3.32 | ) | | | | 0.00 | | | | | 10.02 | | | | | (22.3 | ) | | | | 31 | | | | | (0.67 | ) | | | | 3.86 | | | | | 2.76 | (f) | | | | 26 | |
2017 | | | | 21.52 | | | | | (0.23 | ) | | | | 5.93 | | | | | 5.70 | | | | | — | | | | | (9.96 | ) | | | | — | | | | | (9.96 | ) | | | | — | | | | | 17.26 | | | | | 26.8 | | | | | 43 | | | | | (0.92 | ) | | | | 3.76 | | | | | 2.75 | | | | | 71 | |
2016 | | | | 22.60 | | | | | 0.20 | | | | | (0.01 | ) | | | | 0.19 | | | | $ | (0.26 | ) | | | | (1.01 | ) | | | | — | | | | | (1.27 | ) | | | | 0.00 | | | | | 21.52 | | | | | 0.9 | | | | | 39 | | | | | 0.87 | | | | | 3.55 | | | | | 1.66 | (g)(h) | | | | 4 | |
2015 | | | | 22.94 | | | | | (0.17 | ) | | | | 0.04 | | | | | (0.13 | ) | | | | — | | | | | (0.21 | ) | | | | — | | | | | (0.21 | ) | | | | 0.00 | | | | | 22.60 | | | | | 0.6 | | | | | 51 | | | | | (0.75 | ) | | | | 3.42 | | | | | 2.77 | (f)(g) | | | | 7 | |
Class I | | | | | | | | | | | | | | | | | | | | | | | | | | | | | | | | | | | | | | | | | | | | | | | | | | | | | | | | | | | | | | | | | | | | | | | | | | | | | | | | |
2019 | | | $ | 11.39 | | | | $ | 0.19 | (e) | | | $ | 2.77 | | | | $ | 2.96 | | | | $ | (0.26 | ) | | | $ | (0.68 | ) | | | | — | | | | $ | (0.94 | ) | | | $ | 0.00 | | | | $ | 13.41 | | | | | 26.0 | % | | | $ | 1,312 | | | | | 1.52 | %(e) | | | | 3.16 | % | | | | 1.00 | % | | | | 9 | % |
2018 | | | | 18.93 | | | | | 0.19 | | | | | (4.22 | ) | | | | (4.03 | ) | | | | (0.18 | ) | | | | (3.32 | ) | | | $ | (0.01 | ) | | | | (3.51 | ) | | | | 0.00 | | | | | 11.39 | | | | | (20.9 | ) | | | | 1,557 | | | | | 1.07 | | | | | 2.86 | | | | | 1.00 | (f) | | | | 26 | |
2017 | | | | 22.68 | | | | | 0.21 | | | | | 6.31 | | | | | 6.52 | | | | | (0.31 | ) | | | | (9.96 | ) | | | | — | | | | | (10.27 | ) | | | | — | | | | | 18.93 | | | | | 29.0 | | | | | 2,031 | | | | | 0.82 | | | | | 2.76 | | | | | 1.00 | | | | | 71 | |
2016 | | | | 23.71 | | | | | 0.36 | | | | | (0.01 | ) | | | | 0.35 | | | | | (0.37 | ) | | | | (1.01 | ) | | | | — | | | | | (1.38 | ) | | | | 0.00 | | | | | 22.68 | | | | | 1.5 | | | | | 1,246 | | | | | 1.50 | | | | | 2.55 | | | | | 1.01 | (g)(h) | | | | 4 | |
2015 | | | | 23.87 | | | | | 0.21 | | | | | 0.08 | | | | | 0.29 | | | | | (0.24 | ) | | | | (0.21 | ) | | | | — | | | | | (0.45 | ) | | | | 0.00 | | | | | 23.71 | | | | | 1.2 | | | | | 1,251 | | | | | 0.88 | | | | | 2.42 | | | | | 1.02 | (f)(g) | | | | 7 | |
| † | Total return represents aggregate total return of a hypothetical $1,000 investment at the beginning of the year and sold at the end of the year including reinvestment of distributions and does not reflect the applicable sales charges. |
| (a) | Per share amounts have been calculated using the average shares outstanding method. |
| (b) | Amount represents less than $0.005 per share. |
| (c) | Under an expense reimbursement agreement with the Adviser, the Adviser reimbursed expenses of $184,323, $201,091, $144,403, $137,877, and $75,568 for the years ended December 31, 2019, 2018, 2017, 2016, and 2015, respectively. |
| (d) | The Fund incurred interest expense. For the year ended December 31, 2018, if interest expense had not been incurred, the ratio of operating expenses to average net assets would have been 2.00% (Class A), 2.75% (Class C) and with no impact to Class AAA and Class I. For the years ended December 31, 2019, 2017, 2016, and 2015, the effect of interest expense was minimal. |
| (e) | Includes income resulting from special dividends. Without these dividends, the per share income amounts would have been 0.15 (Class AAA), 0.04 (Class A), (0.05) (Class C), and 0.15 (Class I), and the net investment income ratio would have been 1.19% (Class AAA), 0.29% (Class A), (0.43%) (Class C), and 1.21% (Class I), respectively. |
| (f) | The Fund received credits from a designated broker who agreed to pay certain Fund operating expenses. For the year ended December 31, 2015, had such payments not been made, the expense ratios would have been 2.03% (Class AAA and Class A), 2.78% (Class C), and 1.03% (Class I). For the year ended December 31, 2018, the effect of expense was minimal. |
| (g) | The Fund incurred tax expense for the years ended December 31, 2016 and 2015. If tax expense had not been incurred, the ratios of operating expenses to average net assets would have been 1.37% and 2.00% (Class AAA), 1.38% and 2.00% (Class A), 1.65% and 2.75% (Class C), and 1.00% and 1.00% (Class I), respectively. |
| (h) | During the year ended December 31, 2016, the Fund received reimbursements of custody expenses paid in prior years. Had such reimbursement (allocated by relative net asset values of the Fund’s share classes) been included in this period, the expense ratios would have been 1.17% (Class AAA),1.18% (Class A), 1.45% (Class C), and 0.80% (Class I). |
See accompanying notes to financial statements.
10
The Gabelli International Small Cap Fund
Notes to Financial Statements
1. Organization.The Gabelli International Small Cap Fund, a series of GAMCO Global Series Funds, Inc. (theCorporation), was incorporated on July 16, 1993 in Maryland. The Fund is anon-diversifiedopen-end management investment company registered under the Investment Company Act of 1940, as amended (the 1940 Act), and is one of five separately managed portfolios (collectively, the Portfolios) of the Corporation. The Fund’s primary objective is capital appreciation. The Fund commenced investment operations on May 11, 1998.
2. Significant Accounting Policies.As an investment company, the Fund follows the investment companyaccounting and reporting guidance, which is part of U.S. generally accepted accounting principles (GAAP) that may require the use of management estimates and assumptions in the preparation of its financial statements. Actual results could differ from those estimates. The following is a summary of significant accounting policies followed by the Fund in the preparation of its financial statements.
New Accounting Pronouncements.To improve the effectiveness of fair value disclosure requirements, theFinancial Accounting Standards Board recently issued Accounting Standard Update (ASU)2018-13, Fair Value Measurement Disclosure Framework – Changes to the Disclosure Requirements for Fair Value Measurement (ASU2018-13), which adds, removes, and modifies certain aspects relating to fair value disclosure. ASU2018-13 is effective for interim and annual reporting periods beginning after December 15, 2019; early adoption of the additions relating to ASU2018-13 is not required, even if early adoption is elected for the removals and modifications under ASU2018-13. Management has early adopted the removals and modifications set forth in ASU2018-13 in these financial statements and has not early adopted the additions set forth in ASU2018-13.
Security Valuation.Portfolio securities listed or traded on a nationally recognized securities exchange or tradedin the U.S.over-the-counter market for which market quotations are readily available are valued at the last quoted sale price or a market’s official closing price as of the close of business on the day the securities are being valued. If there were no sales that day, the security is valued at the average of the closing bid and asked prices or, if there were no asked prices quoted on that day, then the security is valued at the closing bid price on that day. If no bid or asked prices are quoted on such day, the security is valued at the most recently available price or, if the Board of Directors (the Board) so determines, by such other method as the Board shall determine in good faith to reflect its fair market value. Portfolio securities traded on more than one national securities exchange or market are valued according to the broadest and most representative market, as determined by Gabelli Funds, LLC (the Adviser).
Portfolio securities primarily traded on a foreign market are generally valued at the preceding closing values of such securities on the relevant market, but may be fair valued pursuant to procedures established by the Board if market conditions change significantly after the close of the foreign market, but prior to the close of business on the day the securities are being valued. Debt obligations for which market quotations are readily available are valued at the average of the latest bid and asked prices. If there were no asked prices quoted on such day, the security is valued using the closing bid price. Such debt obligations are valued through prices provided by a pricing service approved by the Board. Certain securities are valued principally using dealer quotations.
Securities and assets for which market quotations are not readily available are fair valued as determined by the Board. Fair valuation methodologies and procedures may include, but are not limited to: analysis and review of available financial andnon-financial information about the company; comparisons with the valuation and changes in valuation of similar securities, including a comparison of foreign securities with the equivalent U.S.
11
The Gabelli International Small Cap Fund
Notes to Financial Statements (Continued)
dollar value American Depositary Receipt securities at the close of the U.S. exchange; and evaluation of any other information that could be indicative of the value of the security.
The Fund employs a fair value model to adjust prices to reflect events affecting the values of certain portfolio securities which occur between the close of trading on the principal market for such securities (foreign exchanges andover-the-counter markets) at the time when net asset values of the Fund are determined. If the Fund’s valuation committee believes that a particular event would materially affect net asset value, further adjustment is considered.
The inputs and valuation techniques used to measure fair value of the Fund’s investments are summarized into three levels as described in the hierarchy below:
● Level 1 — quoted prices in active markets for identical securities;
● Level 2 — other significant observable inputs (including quoted prices for similar securities, interest rates, prepayment speeds, credit risk, etc.); and
● Level 3 — significant unobservable inputs (including the Board’s determinations as to the fair value of investments).
A financial instrument’s level within the fair value hierarchy is based on the lowest level of any input both individually and in the aggregate that is significant to the fair value measurement. The inputs or methodology used for valuing securities are not necessarily an indication of the risk associated with investing in those securities. If fair value is adjusted from the local close, such securities are classified as Level 2 in the fair value hierarchy presented below. The summary of the Fund’s investments in securities by inputs used to value the Fund’s investments as of December 31, 2019 is as follows:
| | | | | | | | | | | | | | | | | | | | |
| | | Valuation Inputs | | Total
Market Value
at 12/31/19 |
| | | Level 1
Quoted Prices | | Level 2 Other Significant
Observable Inputs | | Level 3 Significant
Unobservable Inputs |
INVESTMENTS IN SECURITIES: | | | | | | | | | | | | | | | | | | | | |
ASSETS (Market Value): | | | | | | | | | | | | | | | | | | | | |
Common Stocks | | | | | | | | | | | | | | | | | | | | |
Materials | | | | $ 982,127 | | | | | — | | | | | $ 0 | | | | | $ 982,127 | |
Other Industries(a) | | | | 6,591,232 | | | | | — | | | | | — | | | | | 6,591,232 | |
Total Common Stocks | | | | 7,573,359 | | | | | — | | | | | 0 | | | | | 7,573,359 | |
Preferred Stocks (a) | | | | 87,471 | | | | | — | | | | | — | | | | | 87,471 | |
Rights (a) | | | | — | | | | | — | | | | | 0 | | | | | 0 | |
U.S. Government Obligations | | | | — | | | | | $239,301 | | | | | — | | | | | 239,301 | |
TOTAL INVESTMENTS IN SECURITIES – ASSETS | | | | $7,660,830 | | | | | $239,301 | | | | | $ 0 | | | | | $7,900,131 | |
| (a) | Please refer to the Schedule of Investments for the industry classifications of these portfolio holdings. |
The Fund did not have any transfers into or out of Level 3 during the year ended December 31, 2019.
Additional Information to Evaluate Qualitative Information.
General.The Fund uses recognized industry pricing services – approved by the Board and unaffiliated withthe Adviser – to value most of its securities, and uses broker quotes provided by market makers of securities not valued by these and other recognized pricing sources. Several different pricing feeds are received to value domestic equity securities, international equity securities, preferred equity securities, and fixed income securities. The data within these feeds are ultimately sourced from major stock exchanges and trading systems where
12
The Gabelli International Small Cap Fund
Notes to Financial Statements (Continued)
these securities trade. The prices supplied by external sources are checked by obtaining quotations or actual transaction prices from market participants. If a price obtained from the pricing source is deemed unreliable, prices will be sought from another pricing service or from a broker/dealer that trades that security or similar securities.
Fair Valuation.Fair valued securities may be common or preferred equities, warrants, options, rights, or fixedincome obligations. Where appropriate, Level 3 securities are those for which market quotations are not available, such as securities not traded for several days, or for which current bids are not available, or which are restricted as to transfer. When fair valuing a security, factors to consider include recent prices of comparable securities that are publicly traded, reliable prices of securities not publicly traded, the use of valuation models, current analyst reports, valuing the income or cash flow of the issuer, or cost if the preceding factors do not apply. A significant change in the unobservable inputs could result in a lower or higher value in Level 3 securities. The circumstances of Level 3 securities are frequently monitored to determine if fair valuation measures continue to apply.
The Adviser reports quarterly to the Board the results of the application of fair valuation policies and procedures. These may include backtesting the prices realized in subsequent trades of these fair valued securities to fair values previously recognized.
Foreign Currency Translations.The books and records of the Fund are maintained in U.S. dollars. Foreigncurrencies, investments, and other assets and liabilities are translated into U.S. dollars at current exchange rates. Purchases and sales of investment securities, income, and expenses are translated at the exchange rate prevailing on the respective dates of such transactions. Unrealized gains and losses that result from changes in foreign exchange rates and/or changes in market prices of securities have been included in unrealized appreciation/depreciation on investments and foreign currency translations. Net realized foreign currency gains and losses resulting from changes in exchange rates include foreign currency gains and losses between trade date and settlement date on investment securities transactions, foreign currency transactions, and the difference between the amounts of interest and dividends recorded on the books of the Fund and the amounts actually received. The portion of foreign currency gains and losses related to fluctuation in exchange rates between the initial purchase trade date and subsequent sale trade date is included in realized gain/(loss) on investments.
Foreign Securities.The Fund may directly purchase securities of foreign issuers. Investing in securities offoreign issuers involves special risks not typically associated with investing in securities of U.S. issuers. The risks include possible revaluation of currencies, the inability to repatriate funds, less complete financial information about companies, and possible future adverse political and economic developments. Moreover, securities of many foreign issuers and their markets may be less liquid and their prices more volatile than securities of comparable U.S. issuers.
Foreign Taxes.The Fund may be subject to foreign taxes on income, gains on investments, or currency repatriation,a portion of which may be recoverable. The Fund will accrue such taxes and recoveries as applicable, based upon its current interpretation of tax rules and regulations that exist in the markets in which it invests.
Investments in other Investment Companies.The Fund may invest, from time to time, in shares of otherinvestment companies (or entities that would be considered investment companies but are excluded from the definition pursuant to certain exceptions under the 1940 Act) (the Acquired Funds) in accordance with the 1940
13
The Gabelli International Small Cap Fund
Notes to Financial Statements (Continued)
Act and related rules. Shareholders in the Fund would bear the pro rata portion on of the periodic expenses of the Acquired Funds in addition to the Fund’s expenses. For the year ended December 31, 2019, the Fund’s pro rata portion of the periodic expenses charged by the Acquired Funds was less than one basis point.
Securities Transactions and Investment Income.Securities transactions are accounted for on the trade datewith realized gain or loss on investments determined by using the identified cost method. Interest income (including amortization of premium and accretion of discount) is recorded on an accrual basis. Premiums and discounts on debt securities are amortized using the effective yield to maturity method. Dividend income is recorded on theex-dividend date, except for certain dividends from foreign securities that are recorded as soon after theex-dividend date as the Fund becomes aware of such dividends.
Determination of Net Asset Value and Calculation of Expenses.Certain administrative expenses are commonto, and allocated among, various affiliated funds. Such allocations are made on the basis of each fund’s average net assets or other criteria directly affecting the expenses as determined by the Adviser pursuant to procedures established by the Board.
In calculating the NAV per share of each class, investment income, realized and unrealized gains and losses, redemption fees, and expenses other than class specific expenses are allocated daily to each class of shares based upon the proportion of net assets of each class at the beginning of each day. Distribution expenses are borne solely by the class incurring the expense.
Distributions to Shareholders.Distributions to shareholders are recorded on theex-dividend date. Distributionsto shareholders are based on income and capital gains as determined in accordance with federal income tax regulations, which may differ from income and capital gains as determined under GAAP. These differences are primarily due to differing treatments of income and gains on various investment securities and foreign currency transactions held by the Fund, timing differences, and differing characterizations of distributions made by the Fund. Distributions from net investment income for federal income tax purposes include net realized gains on foreign currency transactions. These book/tax differences are either temporary or permanent in nature. To the extent these differences are permanent, adjustments are made to the appropriate capital accounts in the period when the differences arise. Permanent differences were primarily due to reclasses of realized foreign currency and redesignation of dividends parid. These reclassifications have no impact on the NAV of the Fund. For the year ended December 31, 2019, reclassifications were made to decreasepaid-in capital by $1, with an offsetting adjustment to total distributable earnings.
The tax character of distributions paid during the years ended December 31, 2019 and 2018 was as follows:
| | | | | | | | | | |
| | | Year Ended
December 31, 2019 | | Year Ended
December 31, 2018 |
Distributions paid from: | | | | | | | | | | |
Ordinary income (inclusive of short term capital gains) | | | $ | 128,707 | | | | $ | 271,040 | |
Net long term capital gains | | | | 376,145 | | | | | 1,573,918 | |
Return of capital | | | | — | | | | | 3,408 | |
| | | | | | | | | | |
Total distributions paid | | | $ | 504,852 | | | | $ | 1,848,366 | |
| | | | | | | | | | |
Provision for Income Taxes.The Fund intends to continue to qualify as a regulated investment companyunder Subchapter M of the Internal Revenue Code of 1986, as amended (the Code). It is the policy of the
14
The Gabelli International Small Cap Fund
Notes to Financial Statements (Continued)
Fund to comply with the requirements of the Code applicable to regulated investment companies and to distribute substantially all of its net investment company taxable income and net capital gains. Therefore, no provision for federal income taxes is required.
As of December 31, 2019, the components of accumulated earnings/losses on a tax basis were as follows:
| | | | | |
Undistributed ordinary income | | | $ | 4,861 | |
Net unrealized appreciation on investments and foreign currency translations | | | | 104,557 | |
| | | | | |
Total | | | $ | 109,418 | |
| | | | | |
At December 31, 2019, the temporary differences between book basis and tax basis unrealized appreciation were primarily due tomark-to-market adjustments on investments in passive foreign investment companies.
The following summarizes the tax cost of investments and the related net unrealized depreciation at December 31, 2019:
| | | | | | | | | | | | | | | | | | | | |
| | | Cost | | Gross
Unrealized
Appreciation | | Gross
Unrealized
Depreciation | | Net Unrealized
Depreciation |
Investments | | | $ | 7,795,884 | | | | $ | 1,140,906 | | | | $ | (1,036,659 | ) | | | $ | 104,247 | |
The Fund is required to evaluate tax positions taken or expected to be taken in the course of preparing the Fund’s tax returns to determine whether the tax positions are“more-likely-than-not” of being sustained by the applicable tax authority. Income tax and related interest and penalties would be recognized by the Fund as tax expense in the Statement of Operations if the tax positions were deemed not to meet themore-likely-than-not threshold. During the year ended December 31, 2019, the Fund did not incur any income tax, interest, or penalties. As of December 31, 2019, the Adviser has reviewed all open tax years and concluded that there was no impact to the Fund’s net assets or results of operations. The Fund’s federal and state tax returns for the prior three fiscal years remain open, subject to examination. On an ongoing basis, the Adviser will monitor the Fund’s tax positions to determine if adjustments to this conclusion are necessary.
3. Investment Advisory Agreement and Other Transactions.The Fund has entered into an investmentadvisory agreement (the Advisory Agreement) with the Adviser which provides that the Fund will pay the Adviser a fee, computed daily and paid monthly, at the annual rate of 1.00% of the value of its average daily net assets. In accordance with the Advisory Agreement, the Adviser provides a continuous investment program for the Fund’s portfolio, oversees the administration of all aspects of the Fund’s business and affairs, and pays the compensation of all Officers and Directors of the Fund who are affiliated persons of the Adviser.
Through November 30, 2019, the Adviser had agreed to waive and/or to reimburse expenses of the Fund to the extent necessary to maintain the annualized total operating expenses of the Fund (excluding brokerage costs, acquired fund fees and expenses, interest, taxes, and extraordinary expenses) at no more than 1.00%, 2.00%, 2.75%, and 1.00% of the value of the Fund’s average daily net assets for Class AAA, Class A, Class C, and Class I, respectively. Effective December 1, 2019, the Adviser amended its contractual agreement with respect to each share class of the Fund to waive its investment advisory fees and/or to reimburse expenses to the extent necessary to maintain the annualized total operating expenses of the Fund (excluding brokerage costs, acquired fund fees and expenses, interest, taxes, and extraordinary expenses) until at least April 30, 2021, at no more than 0.90% of the value of the Fund’s average daily net assets for each of share class. During the year ended December 31, 2019, the Adviser reimbursed the Fund in the amount of $184,323. In addition, the
15
The Gabelli International Small Cap Fund
Notes to Financial Statements (Continued)
Fund has agreed, during the two year period following any waiver or reimbursement by the Adviser, to repay such amount to the extent, that after giving effect to the repayment, such adjusted annualized total operating expenses of the Fund would not exceed 0.90% of the value of the Fund’s average daily net assets for each share class of the Fund. The arrangement is renewable annually. At December 31, 2019, the cumulative amount which the Fund may repay the Adviser, subject to the terms above, is $385,414:
| | | | | |
For the year ended December 31, 2018, expiring December 31, 2020 | | | $ | 201,091 | |
For the year ended December 31, 2019, expiring December 31, 2021 | | | | 184,323 | |
| | | | | |
| | | $ | 385,414 | |
| | | | | |
The Corporation pays each Director who is not considered to be an affiliated person an annual retainer of $6,000 plus $1,000 for each Board meeting attended, and they are reimbursed for any out of pocket expenses incurred in attending meetings. All Board committee members receive $1,000 per meeting attended. The Chairman of the Audit Committee receives an annual fee of $3,000 and the Lead Director receives an annual fee of $2,000. A Director may receive a single meeting fee, allocated among the participating funds, for attending certain meetings held on behalf of multiple funds. Directors who are directors or employees of the Adviser or an affiliated company receive no compensation or expense reimbursement from the Corporation.
4. Distribution Plan.The Fund’s Board has adopted a distribution plan (the Plan) for each class of shares,except for Class I Shares, pursuant to Rule12b-1 under the 1940 Act. Under the Class AAA, Class A, and Class C Share Plans, payments are authorized to G.distributors, LLC (the Distributor), an affiliate of the Adviser, at annual rates of 0.25%, 0.25%, and 1.00%, respectively, of the average daily net assets of those classes, the annual limitations under each Plan. Such payments are accrued daily and paid monthly.
5. Portfolio Securities.Purchases and sales of securities during the year ended December 31, 2019, otherthan short term securities and U.S. Government obligations, aggregated $714,817 and $2,197,453, respectively.
6. Transactions with Affiliates and Other Arrangements. During the year ended December 31, 2019, theFund paid brokerage commissions on security trades of $45 to G.research, LLC, an affiliate of the Adviser. Additionally, the Distributor retained a total of $39 from investors representing commissions (sales charges and underwriting fees) on sales and redemptions of Fund shares.
The cost of calculating the Fund’s NAV per share is a Fund expense pursuant to the Advisory Agreement. Under thesub-administration agreement with Bank of New York Mellon, the fees paid include the cost of calculating the Fund’s NAV. The Fund reimburses the Adviser for this service.
7. Line of Credit.The Fund participates in an unsecured line of credit which expires on March 4, 2020 andmay be renewed annually, of up to $75,000,000 under which it may borrow up to 10% of its net assets from the custodian for temporary borrowing purposes. Borrowings under this arrangement bear interest at a floating rate equal to the higher of the overnight Federal Funds rate plus 125 basis points or the 30 day ICE LIBOR plus 125 basis points in effect on that day. This amount, if any, would be included in “Interest expense” in the Statement of Operations. At December 31, 2019, there were no borrowings outstanding under the line of credit.
The average daily amount of borrowings outstanding under the line of credit during the year ended December 31, 2019 was $1,532 with a weighted average interest rate of 3.73%. The maximum amount borrowed at any time during the year ended December 31, 2019 was $236,000.
16
The Gabelli International Small Cap Fund
Notes to Financial Statements (Continued)
8. Capital Stock.The Fund offers four classes of shares – Class AAA Shares, Class A Shares, Class C Shares,and Class I Shares. Class AAA and Class I Shares are offered without a sales charge. Class A Shares are subject to a maximumfront-end sales charge of 5.75%, and Class C Shares are subject to a 1.00% contingent deferred sales charge for one year after purchase.
The Fund imposes a redemption fee of 2.00% on all classes of shares that are redeemed or exchanged on or before the seventh day after the date of a purchase. The redemption fee is deducted from the proceeds otherwise payable to the redeeming shareholders and is retained by the Fund as an increase inpaid-in capital. The redemption fees retained by the Fund during the years ended December 31, 2019 and 2018, if any, can be found in the Statement of Changes in Net Assets under Redemption Fees.
Transactions in shares of capital stock were as follows:
| | | | | | | | | | | | | | | | | | | | | | | | | | | | | | | | | | | |
| | | Year Ended
December 31, 2019 | | | | Year Ended
December 31, 2018 |
| | Shares | | | | Amount | | | | Shares | | | | Amount |
Class AAA | | | | | | | | | | | | | | | | | | | | | | | | | | | | | | | | | | | |
Shares sold | | | | 15,135 | | | | | | | | | $ | 188,463 | | | | | | | | | | 15,566 | | | | | | | | | $ | 276,589 | |
Shares issued upon reinvestment of distributions | | | | 30,728 | | | | | | | | | | 399,469 | | | | | | | | | | 130,407 | | | | | | | | | | 1,416,098 | |
Shares redeemed | | | | (95,721 | ) | | | | | | | | | (1,215,017 | ) | | | | | | | | | (72,320 | ) | | | | | | | | | (1,208,001 | ) |
| | | | | | | | | | | | | | | | | | | | | | | | | | | | | | | | | | | |
Net increase/(decrease) | | | | (49,858 | ) | | | | | | | | $ | (627,085 | ) | | | | | | | | | 73,653 | | | | | | | | | $ | 484,686 | |
| | | | | | | | | | | | | | | | | | | | | | | | | | | | | | | | | | | |
Class A | | | | | | | | | | | | | | | | | | | | | | | | | | | | | | | | | | | |
Shares sold | | | | 1,468 | | | | | | | | | $ | 17,835 | | | | | | | | | | 416 | | | | | | | | | $ | 6,885 | |
Shares issued upon reinvestment of distributions | | | | 299 | | | | | | | | | | 3,875 | | | | | | | | | | 1,352 | | | | | | | | | | 14,624 | |
Shares redeemed | | | | (2,114 | ) | | | | | | | | | (25,095 | ) | | | | | | | | | (2,810 | ) | | | | | | | | | (52,534 | ) |
| | | | | | | | | | | | | | | | | | | | | | | | | | | | | | | | | | | |
Net decrease | | | | (347 | ) | | | | | | | | $ | (3,385 | ) | | | | | | | | | (1,042 | ) | | | | | | | | $ | (31,025 | ) |
| | | | | | | | | | | | | | | | | | | | | | | | | | | | | | | | | | | |
Class C | | | | | | | | | | | | | | | | | | | | | | | | | | | | | | | | | | | |
Shares sold | | | | 333 | | | | | | | | | $ | 3,675 | | | | | | | | | | 1,172 | | | | | | | | | $ | 20,418 | |
Shares issued upon reinvestment of distributions | | | | 125 | | | | | | | | | | 1,466 | | | | | | | | | | 775 | | | | | | | | | | 7,606 | |
Shares redeemed | | | | (1,263 | ) | | | | | | | | | (13,922 | ) | | | | | | | | | (1,398 | ) | | | | | | | | | (24,534 | ) |
| | | | | | | | | | | | | | | | | | | | | | | | | | | | | | | | | | | |
Net increase/(decrease) | | | | (805 | ) | | | | | | | | $ | (8,781 | ) | | | | | | | | | 549 | | | | | | | | | $ | 3,490 | |
| | | | | | | | | | | | | | | | | | | | | | | | | | | | | | | | | | | |
Class I | | | | | | | | | | | | | | | | | | | | | | | | | | | | | | | | | | | |
Shares sold | | | | 17,785 | | | | | | | | | $ | 227,429 | | | | | | | | | | 8,610 | | | | | | | | | $ | 158,571 | |
Shares issued upon reinvestment of distributions | | | | 6,346 | | | | | | | | | | 84,650 | | | | | | | | | | 32,737 | | | | | | | | | | 365,021 | |
Shares redeemed | | | | (63,035 | ) | | | | | | | | | (786,180 | ) | | | | | | | | | (11,872 | ) | | | | | | | | | (215,996 | ) |
| | | | | | | | | | | | | | | | | | | | | | | | | | | | | | | | | | | |
Net increase/(decrease) | | | | (38,904 | ) | | | | | | | | $ | (474,101 | ) | | | | | | | | | 29,475 | | | | | | | | | $ | 307,596 | |
| | | | | | | | | | | | | | | | | | | | | | | | | | | | | | | | | | | |
9.Indemnifications.The Fund enters into contracts that contain a variety of indemnifications. The Fund’smaximum exposure under these arrangements is unknown. However, the Fund has not had prior claims or losses pursuant to these contracts. Management has reviewed the Fund’s existing contracts and expects the risk of loss to be remote.
10.Subsequent Events.Management has evaluated the impact on the Fund of all subsequent events occurringthrough the date the financial statements were issued and has determined that there were no subsequent events requiring recognition or disclosure in the financial statements.
17
The Gabelli International Small Cap Fund
Report of Independent Registered Public Accounting Firm
To the Shareholders of The Gabelli International Small Cap Fund
and the Board of Directors of GAMCO Global Series Funds, Inc.
Opinion on the Financial Statements
We have audited the accompanying statement of assets and liabilities of The Gabelli International Small Cap Fund (the “Fund”) (one of the funds constituting GAMCO Global Series Funds, Inc. (the “Corporation”)), including the schedule of investments, as of December 31, 2019, and the related statement of operations for the year then ended, the statements of changes in net assets for each of the two years in the period then ended, the financial highlights for each of the five years in the period then ended and the related notes (collectively referred to as the “financial statements”). In our opinion, the financial statements present fairly, in all material respects, the financial position of the Fund (one of the funds constituting GAMCO Global Series Funds, Inc.) at December 31, 2019, the results of its operations for the year then ended, the changes in its net assets for each of the two years in the period then ended and its financial highlights for each of the five years in the period then ended, in conformity with U.S. generally accepted accounting principles.
Basis for Opinion
These financial statements are the responsibility of the Corporation’s management. Our responsibility is to express an opinion on the Fund’s financial statements based on our audits. We are a public accounting firm registered with the Public Company Accounting Oversight Board (United States) (“PCAOB”) and are required to be independent with respect to the Corporation in accordance with the U.S. federal securities laws and the applicable rules and regulations of the Securities and Exchange Commission and the PCAOB.
We conducted our audits in accordance with the standards of the PCAOB. Those standards require that we plan and perform the audit to obtain reasonable assurance about whether the financial statements are free of material misstatement, whether due to error or fraud. The Corporation is not required to have, nor were we engaged to perform, an audit of the Corporation’s internal control over financial reporting. As part of our audits we are required to obtain an understanding of internal control over financial reporting but not for the purpose of expressing an opinion on the effectiveness of the Corporation’s internal control over financial reporting. Accordingly, we express no such opinion.
Our audits included performing procedures to assess the risks of material misstatement of the financial statements, whether due to error or fraud, and performing procedures that respond to those risks. Such procedures included examining, on a test basis, evidence regarding the amounts and disclosures in the financial statements. Our procedures included confirmation of securities owned as of December 31, 2019, by correspondence with the custodian. Our audits also included evaluating the accounting principles used and significant estimates made by management, as well as evaluating the overall presentation of the financial statements. We believe that our audits provide a reasonable basis for our opinion.

We have served as the auditor of one or more Gabelli/GAMCO Funds investment companies since 1992.
Philadelphia, Pennsylvania
February 27, 2020
18
The Gabelli International Small Cap Fund
Board Consideration andRe-Approval of Investment Advisory Agreement (Unaudited)
During the six months ended December 31, 2019, the Board of Directors of the Corporation approved the continuation of the investment advisory agreement with the Adviser for the Fund on the basis of the recommendation by the directors (the Independent Board Members) who are not interested persons of the Fund. The following paragraphs summarize the material information and factors considered by the Independent Board Members as well as their conclusions relative to such factors.
Nature, Extent, and Quality of Services.The Independent Board Members considered information regardingthe Fund’s portfolio managers, the depth of the analyst pool available to the Adviser and the portfolio manager, the scope of supervisory, administrative, shareholder, and other services supervised or provided by the Adviser, and the absence of significant service problems reported to the Board. The Independent Board Members noted the experience, length of service, and reputation of the Fund’s portfolio manager.
Investment Performance.The Independent Board Members reviewed the short, medium, and long term performanceof the Fund (as of September 30, 2019) against a peer group of seven other comparable funds prepared by the Adviser (the Adviser Peer Group), and against a peer group prepared by Broadridge (the Broadridge Performance Peer Group) consisting of all internationalmulti-cap growth funds, regardless of asset size or primary channel of distribution, as represented by the Lipper International SmallMulti-Cap Growth Index. The Independent Board Members noted that the Fund’s performance was in the fourth quartile for the one, three, and five year periods, as measured against the Adviser Peer Group. Against the Broadridge Performance Peer Group, the Independent Board Members noted that the Fund’s performance was in the fifth quintile for the one and three year periods and the fourth quintile for the five year period.
Profitability.The Independent Board Members reviewed summary data regarding the profitability of the Fundto the Adviser both with a pro rata administrative overhead charge and with a stand alone administrative charge and noted the effect of the expense limitation agreement. The Independent Board Members also noted that a portion of the Fund’s portfolio transactions were executed by an affiliated broker of the Adviser and that another affiliated broker of the Adviser received distribution fees and minor amounts of sales commissions.
Economies of Scale.The Independent Board Members discussed the major elements of the Adviser’s coststructure, the relationship of those elements to potential economies of scale and reviewed data provided by the Adviser.
Sharing of Economies of Scale.The Independent Board Members noted that the investment managementfee schedule for the Fund does not take into account any potential economies of scale that may develop or any losses or diminished profitability to the Adviser in prior years.
Service and Cost Comparisons.The Independent Board Members compared the expense ratios of the investmentmanagement fee, other expenses, and total expenses of the Fund with similar expense ratios of the Adviser Peer Group and a peer group of eight other internationalmulti-cap growth funds selected by Broadridge (the Broadridge Expense Peer Group), and noted that the Adviser’s management fee includes substantially all administrative services of the Fund as well as investment advisory services. The Independent Board Members noted the effect of the expense limitation agreement in place for the Fund. The Independent Board Members noted that the Fund’s total expense ratio after waivers was second highest compared to the Adviser Peer Group, and the second lowest compared to all of the funds included in the Broadridge Expense Peer Group. The Independent Board Members discussed how the Fund’s size was significantly lower than average within both peer groups
19
The Gabelli International Small Cap Fund
Board Consideration andRe-Approval of Investment Advisory Agreement (Unaudited) (Continued)
and that the Adviser had been waiving substantial portions of its fees in order to make the Fund a more attractive investment, and noted the Adviser’s recent determination to waive fees even further. The Independent Board Members also noted that the advisory fee structure was the same as that in effect for most of the Gabelli funds. The Independent Board Members were presented with, but did not consider to be material to their decision, various information comparing the advisory fee to the fee for other types of accounts managed by the Adviser.
Conclusions.The Independent Board Members concluded that the Fund enjoyed highly experienced portfoliomanagement services, good ancillary services, but did not have a favorable performance record. The Independent Board Members also concluded that the Fund’s expense ratios were reasonable, particularly in light of the Adviser’s commitment to making the Fund more attractive through further expense waivers, and that economies of scale were not a factor in their thinking at this time. The Independent Board Members did not view the potential profitability of ancillary services as material to their decision. On the basis of the foregoing and without assigning particular weight to any single conclusion, the Independent Board Members determined to recommend continuation of the investment advisory agreement to the full Board.
Based on a consideration of all these factors in their totality, the Board Members, including all of the Independent Board Members, determined that the Fund’s advisory fee was fair and reasonable with respect to the quality of services provided and in light of the other factors described above that the Board deemed relevant. Accordingly, the Board Members determined to approve the continuation of the Fund’s Advisory Agreement. The Board Members based their decision on evaluations of all these factors as a whole and did not consider any one factor asall-important or controlling.
20
The Gabelli International Small Cap Fund
Additional Fund Information (Unaudited)
The business and affairs of the Fund are managed under the direction of the Corporation’s Board of Directors. Information pertaining to the Directors and officers of the Fund is set forth below. The Corporation’s Statement of Additional Information includes additional information about the Fund’s Directors and is available without charge, upon request, by calling800-GABELLI(800-422-3554) or by writing to The Gabelli International Small Cap Fund at One Corporate Center, Rye, NY 10580-1422.
| | | | | | | | |
Name, Position(s)
Address1
and Age | | Term of Office
and Length of
Time Served2 | | Number of Funds
in Fund Complex
Overseen by Director | | Principal Occupation(s)
During Past Five Years | | Other Directorships
Held by Director3 |
| | | | |
INTERESTED DIRECTORS4: | | | | | | | | |
| | | | |
Mario J. Gabelli, CFA Director and Chief Investment Officer Age: 77 | | Since 1993 | | 33 | | Chairman, Chief Executive Officer, and Chief Investment Officer– Value Portfolios of GAMCO Investors, Inc. and Chief Investment Officer– Value Portfolios of Gabelli Funds, LLC and GAMCO Asset Management Inc.; Director/ Trustee or Chief Investment Officer of other registered investment companies within the Gabelli/GAMCO Fund Complex; Chief Executive Officer of GGCP, Inc.; Executive Chairman of Associated Capital Group, Inc. | | Director of Morgan Group Holdings, Inc. (holding company) (2001-2019); Chairman of the Board and Chief Executive Officer of LICT Corp. (multimedia and communication services company); Director of CIBL, Inc. (broadcasting and wireless communications); Director of ICTC Group Inc. (communications) (2013-2018) |
| | | | |
John D. Gabelli Director Age: 75 | | Since 1993 | | 12 | | Senior Vice President of G.research, LLC | | — |
| | | | |
INDEPENDENT DIRECTORS5: | | | | | | | | |
| | | | |
E. Val Cerutti Director Age: 80 | | Since 2001 | | 7 | | Chief Executive Officer of Cerutti Consultants, Inc. | | Director of The LGL Group, Inc. (diversified manufacturing)(1990-2009) |
| | | | |
Anthony J. Colavita6 Director Age: 84 | | Since 1993 | | 20 | | President of the law firm of Anthony J. Colavita, P.C. | | — |
| | | | |
Werner J. Roeder Director Age: 79 | | Since 1993 | | 21 | | Retired physician; Former Vice President of Medical Affairs (Medical Director) of New York Presbyterian/Lawrence Hospital (1999-2014) | | — |
| | | | |
Anthonie C. van Ekris6 Director Age: 85 | | Since 1993 | | 23 | | Chairman and Chief Executive Officer of BALMAC International, Inc. (global import/ export company) | | — |
| | | | |
Salvatore J. Zizza7 Director Age: 74 | | Since 2004 | | 31 | | President of Zizza & Associates Corp. (private holding company); President of Bergen Cove Realty Inc.; Chairman of Harbor Diversified, Inc. (pharmaceuticals) (2009-2018); Chairman of BAM (semiconductor and aerospace manufacturing)(2000-2018); Chairman of Metropolitan Paper Recycling Inc. (recycling) (2005-2014) | | Director and Chairman of Trans- Lux Corporation (business services); Director and Chairman of Harbor Diversified Inc. (pharmaceuticals) (2009-2018) |
21
The Gabelli International Small Cap Fund
Additional Fund Information (Continued) (Unaudited)
| | | | | | | |
Name, Position(s)
Address1
and Age | | Term of Office
and Length of
Time Served2 | | Principal Occupation(s)
During Past Five Years |
OFFICERS: | | | | | | | |
| | |
Bruce N. Alpert President Age: 68 | | | | Since 1993 | | | Executive Vice President and Chief Operating Officer of Gabelli Funds, LLC since 1988; Officer of registered investment companies within the Gabelli/GAMCO Fund Complex; Senior Vice President of GAMCO Investors, Inc. since 2008 |
| | |
John C. Ball Treasurer Age: 43 | | | | Since 2017 | | | Treasurer of funds within the Gabelli/GAMCO Fund Complex since 2017; Vice President and Assistant Treasurer of AMG Funds, 2014-2017; Vice President of State Street Corporation, 2007-2014 |
| | |
Agnes Mullady Vice President Age: 61 | | | | Since 2006 | | | Officer of registered investment companies within the Gabelli/GAMCO Fund Complex since 2006; President and Chief Operating Officer of the Fund Division of Gabelli Funds, LLC since 2015; Chief Executive Officer of G.distributors, LLC since 2010; Senior Vice President of GAMCO Investors, Inc. since 2009; Vice President of Gabelli Funds, LLC since 2007; Executive Vice President of Associated Capital Group, Inc. since 2016 |
| | |
Andrea R. Mango Secretary Age: 47 | | | | Since 2013 | | | Vice President of GAMCO Investors, Inc. since 2016; Counsel of Gabelli Funds, LLC since 2013; Secretary of registered investment companies within the Gabelli/GAMCO Fund Complex since 2013; Vice President ofclosed-end funds within the Gabelli/GAMCO Fund Complex since 2014 |
| | |
Richard J. Walz Chief Compliance Officer Age: 60 | | | | Since 2013 | | | Chief Compliance Officer of registered investment companies within the Gabelli/GAMCO Fund Complex since 2013 |
| 1 | Address: One Corporate Center, Rye, NY 10580-1422, unless otherwise noted. |
| 2 | Each Director will hold office for an indefinite term until the earliest of (i) the next meeting of shareholders, if any, called for the purpose of considering the election orre-election of such Director and until the election and qualification of his or her successor, if any, elected at such meeting, or (ii) the date a Director resigns or retires, or a Director is removed by the Board of Directors or shareholders, in accordance with the Fund’sBy-Laws and Articles of Incorporation. For officers, includes time served in prior officer positions with the Fund. Each officer will hold office for an indefinite term until the date he or she resigns or retires or until his or her successor is elected and qualified. |
| 3 | This column includes only directorships of companies required to report to the SEC under the Securities Exchange Act of 1934, as amended, i.e., public companies, or other investment companies registered under the 1940 Act. |
| 4 | “Interested person” of the Corporation as defined in the 1940 Act. Messrs. Mario J. Gabelli and John D. Gabelli, who are brothers, are each considered an “interested person” because of their affiliation with Gabelli Funds, LLC which acts as the Corporation’s investment adviser. |
| 5 | Directors who are not interested persons are considered “Independent” Directors. |
| 6 | Mr. Colavita’s son, Anthony S. Colavita, serves as a director of other funds in the Gabelli/GAMCO Fund Complex. Mr. van Ekris is an independent director of Gabelli International Ltd., Gabelli Fund LDC, GAMA Capital Opportunities Master Ltd., and GAMCO International SICAV, all of which may be deemed to be controlled by Mario J. Gabelli and/or affiliates and, in that event, would be deemed to be under common control with the Fund’s Adviser. |
| 7 | Mr. Zizza is an independent director of Gabelli International Ltd., which may be deemed to be controlled by Mario J. Gabelli and/or affiliates and in that event would be deemed to be under common control with the Fund’s Adviser. On September 9, 2015, Mr. Zizza entered into a settlement with the SEC to resolve an inquiry relating to an alleged violation regarding the making of false statements or omissions to the accountants of a company concerning a related party transaction. The company in question is not an affiliate of, nor has any connection to, the Fund. Under the terms of the settlement, Mr. Zizza, without admitting or denying the SEC’s findings and allegation, paid $150,000 and agreed to cease and desist committing or causing any future violations of Rule13b2-2 of the Securities Exchange Act of 1934, as amended. The Board has discussed this matter and has determined that it does not disqualify Mr. Zizza from serving as an Independent Director. |
22
THE GABELLI INTERNATIONAL SMALL CAP FUND
One Corporate Center
Rye, NY 10580-1422
Portfolio Manager Biography
Caesar M. P. Bryanjoined GAMCO Asset Management in 1994. He is a member of the global investment teamof Gabelli Funds, LLC and portfolio manager of several funds within the Gabelli/GAMCO Fund Complex. Prior to joining Gabelli, Mr. Bryan was a portfolio manager at Lexington Management. He began his investment career at Samuel Montagu Company, the London based merchant bank. Mr. Bryan graduated from the University of Southampton in England with a Bachelor of Law and is a member of the English Bar.
2019 TAX NOTICE TO SHAREHOLDERS(Unaudited)
For the year ended December 31, 2019, the Fund paid to shareholders ordinary income distributions (comprised of net investment income and short term capital gains) totaling $0.2459, $0.1063, $0.0266, and $0.2842 per share for Class AAA, Class A, Class C, and Class I Shares, respectively, and long term capital gains totaling $376,145. For the year ended December 31, 2019, 0.00% of the ordinary income distribution qualifies for the dividends received deduction available to corporations. The Fund designates 100% of the ordinary income distribution as qualified dividend income pursuant to the Jobs and Growth Tax Relief Reconciliation Act of 2003. The Fund designates 2.42% of the ordinary income distribution as qualified interest income pursuant to the Tax Relief, Unemployment Reauthorization, and Job Creation Act of 2010. Also for the year ended December 31, 2019, the Fund passed through foreign tax credits of $0.0193, $0.0193, $0.0193, and $0.0193 per share to Class AAA, Class A, Class C, and Class I Shares, respectively.
U.S. Government Income:
The percentage of the ordinary income distribution paid by the Fund during the year ended December 31, 2019 which was derived from U.S. Treasury securities was 2.13%. Such income is exempt from state and local tax in all states. However, many states, including New York and California, allow a tax exemption for a portion of the income earned only if a mutual fund has invested at least 50% of its assets at the end of each quarter of the Fund’s fiscal year in U.S. Government securities. The Fund did not meet this strict requirement in 2019. The percentage of U.S. Government securities held as of December 31, 2019 was 3.07%. Due to the diversity in state and local tax law, it is recommended that you consult your personal tax adviser as to the applicability of the information provided to your specific situation.
All designations are based on financial information available as of the date of this annual report and, accordingly, are subject to change. For each item, it is the intention of the Fund to designate the maximum amount permitted under the Internal Revenue Code and the regulations thereunder.
We have separated the portfolio manager’s commentary from the financial statements and investment portfolio due to corporate governance regulations stipulated by the Sarbanes-Oxley Act of 2002. We have done this to ensure that the content of the portfolio manager’s commentary is unrestricted. Both the commentary and the financial statements, including the portfolio of investments, will be available on our website at www.gabelli.com.
| | |
GAMCO Global Series Funds, Inc. |
THE GABELLI INTERNATIONAL SMALL CAP FUND |
One Corporate Center |
Rye, New York 10580-1422 |
|
t 800-GABELLI(800-422-3554) |
f 914-921-5118 |
e info@gabelli.com |
GABELLI.com |
|
Net Asset Value per share available daily by calling800-GABELLI after 7:00 P.M. |
BOARD OF DIRECTORS Mario J. Gabelli, CFA Chairman and Chief Executive Officer, GAMCO Investors, Inc. Executive Chairman, Associated Capital Group, Inc. E. Val Cerutti Chief Executive Officer, Cerutti Consultants, Inc. Anthony J. Colavita President, Anthony J. Colavita, P.C. John D. Gabelli Senior Vice President, G.research, LLC Werner J. Roeder Former Medical Director, Lawrence Hospital Anthonie C. van Ekris Chairman, BALMAC International, Inc. Salvatore J. Zizza Chairman, Zizza & Associates Corp. | | OFFICERS Bruce N. Alpert President John C. Ball Treasurer Agnes Mullady Vice President Andrea R. Mango Secretary Richard J. Walz Chief Compliance Officer DISTRIBUTOR G.distributors, LLC CUSTODIAN State Street Bank and Trust Company TRANSFER AGENT AND DIVIDEND DISBURSING AGENT DST Asset Manager Solutions, Inc. LEGAL COUNSEL Skadden, Arps, Slate, Meagher & Flom LLP |
This report is submitted for the general information of the shareholders of The Gabelli International Small Cap Fund. It is not authorized for distribution to prospective investors unless preceded or accompanied by an effective prospectus. |
|
|
|
|
|
|
|
|
|
|
|
|
|
|
|
GAB403Q419AR |

The Gabelli Global Rising Income and Dividend Fund
Annual Report — December 31, 2019
To Our Shareholders,
For the year ended December 31, 2019, the net asset value (NAV) per Class AAA Share of The Gabelli Global Rising Income and Dividend Fund increased 14.4% compared with an increase of 13.7% for the ICE Bank of America Merrill Lynch Global 300 Convertible Index and an increase of 27.7% for the Morgan Stanley Capital International (MSCI) World Index, respectively. Other classes of shares are available. See page 2 for performance information for all classes of shares.
Enclosed are the financial statements, including the schedule of investments, as of December 31, 2019.
Performance Discussion (Unaudited)
The Fund’s investment objective is to provide investors with a high level of total return through a combination of current income and appreciation of capital.
The Fund’s investment strategy is to invest 80% of its net assets in dividend paying securities (such as common and preferred stock) or other income producing securities (such as fixed-income securities and securities that are convertible into common stock). The Fund will primarily invest in common stocks of foreign and domestic issuers that the Fund’s portfolio manager believes are likely to pay dividends and income and have the potential for above average capital appreciation and dividend increases.
The markets made it look easy in 2019. Stocks, bonds, oil and gold, all returned double-digits. Stocks advanced across market cap, geographies and sectors. The MSCI All Country World Index advanced +27%. The U.S. market outperformed developed international markets, which outperformed emerging markets. Large cap outperformed small cap. Growth outperformed value. Technology was a standout in 2019. The S&P 500 Information Technology sector gained +48%, a full 17 percentage points better than the next best sector, being Communication Services, which, surprise, surprise, is mostly technology stocks.
Selected holdings that contributed positively to performance in 2019 were: Sony Corp (8.5% of net assets as of December 31, 2019), is a Japanese multinational conglomerate whose business includes consumer and professional electronics, entertainment and financial services; growth in the company’s music revenue and image sensor businesses increased operating profits; Nestle SA (3.2%), is a multinational packaged food company that manufactures and markets a wide range of food products. High margins and a solid balance sheet increased performance; and Landis+Gyr Group AG (2.3%), the company manufactures meters and related software for electricity and gas utilities. The company’s net revenues were up year over year.
Beginning on January 1, 2021, as permitted by regulations adopted by the Securities and Exchange Commission, paper copies of the Fund’s annual and semiannual shareholder reports will no longer be sent by mail, unless you specifically request paper copies of the reports. Instead, the reports will be made available on the Fund’s website (www.gabelli.com), and you will be notified by mail each time a report is posted and provided with a website link to access the report. If you already elected to receive shareholder reports electronically, you will not be affected by this change and you need not take any action. To elect to receive all future reports on paper free of charge, please contact your financial intermediary, or, if you invest directly with the Fund, you may call800-422-3554 or send an email request to info@gabelli.com.
Some of our weaker performing securities were: Millicom International Cellular SA (2.8%), is an international telecommunications and media company offering a wide range of digital services to more than 51 million customers in eleven markets in Africa and Latin America. The company declined due to preliminary talks by Liberty Latin America to acquire Millicom falling through in early 2019; CHR Hansen Holdings A/S (1.2%), develops and produces natural ingredients such as cultures, enzymes, probiotics, and natural colors. Lackluster growth and weaker demands across all its end market segments; and Jardine Strategic Holdings Ltd. (1.0%), is an investment holding company that engages in the business of engineering and construction, transport services, insurance broking, luxury hotels, and financial services. The Group’s profit decreased across most of the businesses due to weaker consumer sentiment.
Thank you for your investment in the Gabelli Global Rising Income and Dividend Fund.
We appreciate your confidence and trust.
Comparative Results
| | | | | | | | | | | | | | | | | | | | | | | | | |
| Average Annual Returns through December 31, 2019 (a) (Unaudited) |
| | | 1 Year | | 5 Year | | 10 Year | | 15 Year | | Since
Inception
(2/3/94) |
Class AAA (GAGCX) | | | | 14.38 | % | | | | 4.74 | % | | | | 5.20 | % | | | | 3.31 | % | | | | 4.54 | % |
ICE Bank of America Merrill Lynch Global 300 Convertible Index | | | | 13.74 | | | | | 7.54 | | | | | 8.07 | | | | | 6.76 | | | | | N/A | (b) |
MSCI World Index | | | | 27.67 | | | | | 8.74 | | | | | 9.47 | | | | | 6.92 | | | | | 7.06 | (c) |
Lipper Convertible Securities Fund Average | | | | 23.85 | | | | | 7.33 | | | | | 8.75 | | | | | 6.98 | | | | | 7.69 | |
Class A (GAGAX) | | | | 14.35 | | | | | 4.70 | | | | | 5.19 | | | | | 3.32 | | | | | 4.56 | |
With sales charge (d) | | | | 7.77 | | | | | 3.47 | | | | | 4.57 | | | | | 2.91 | | | | | 4.32 | |
Class C (GACCX) | | | | 13.61 | | | | | 3.93 | | | | | 4.05 | | | | | 2.29 | | | | | 3.87 | |
With contingent deferred sales charge (e) | | | | 12.61 | | | | | 3.93 | | | | | 4.05 | | | | | 2.29 | | | | | 3.87 | |
Class I (GAGIX) | | | | 15.11 | | | | | 5.23 | | | | | 5.56 | | | | | 3.60 | | | | | 4.71 | |
In the current prospectuses dated April 30, 2019, as amended by the supplement dated December 3, 2019, the gross expense ratios for Class AAA, A, C, and I Shares are 1.67%, 1.67%, 2.42%, and 1.42%, respectively, and the net expense ratio for all share classes after contractual reimbursements by Gabelli Funds, LLC, (the “Adviser”) is 0.90%. See page 11 for the expense ratios for the year ended December 31, 2019. The contractual reimbursements are in effect through April 30, 2021. Class AAA and Class I Shares do not have a sales charge. The maximum sales charge for Class A Shares and Class C Shares is 5.75% and 1.00%, respectively.
| | (a) | Returns represent past performance and do not guarantee future results. Total returns and average annual returns reflect changes in share price, reinvestment of distributions, and are net of expenses. Investment returns and the principal value of an investment will fluctuate. When shares are redeemed, they may be worth more or less than their original cost. Current performance may be lower or higher than the performance data presented. Visit www.gabelli.com for performance information as of the most recent month end. Returns would have been lower had the Adviser not reimbursed certain expenses of the Fund. The Fund imposes a 2% redemption fee on shares sold or exchanged within seven days after the date of purchase. Investors should carefully consider the investment objectives, risks, charges, and expenses of the Fund before investing. The prospectuses contain information about these and other matters and should be read carefully before investing. To obtain a prospectus, please visit our website at www.gabelli.com. Investing in foreign securities involves risks not ordinarily associated with investments in domestic issues, including currency fluctuation, economic, and political risks. The Class AAA Share NAVs are used to calculate performance for the periods prior to the issuance of Class A Shares, Class C Shares, and Class I Shares on May 2, 2001, November 26, 2001, and January 11, 2008, respectively. The actual performance of the Class A Shares and Class C Shares would have been lower due to the additional fees and expenses associated with these classes of shares. The actual performance of the Class I Shares would have been higher due to lower expenses related to this class of shares. The ICE Bank of America Merrill Lynch Global 300 Convertible Index is an unmanaged global convertible index composed of companies representative of the market structure of countries in North America, Europe, and the Asia/Pacific region. The MSCI World Index is a free float adjusted market capitalization weighted index that is designed to measure the equity market performance of developed markets. The Lipper Convertible Securities Fund Average reflects the average performance of mutual funds classified in this particular category. Dividends are considered reinvested. You cannot invest directly in an index. | |
| | (b) | There are no data available for the ICE Bank of America Merrill Lynch Global 300 Convertible Index prior to December 31, 1994. | |
| | (c) | MSCI World Index since inception performance is as of January 31, 1994. | |
| | (d) | Performance results include the effect of the maximum 5.75% sales charge at the beginning of the period. | |
| | (e) | Assuming payment of the 1% maximum contingent deferred sales charge imposed on redemptions made within one year of purchase. | |
2
COMPARISON OF CHANGE IN VALUE OF A $10,000 INVESTMENT IN
THE GABELLI GLOBAL RISING INCOME AND DIVIDEND FUND (CLASS AAA SHARES),
LIPPER CONVERTIBLE SECURITIES FUND AVERAGE, AND MSCI WORLD INDEX (Unaudited)
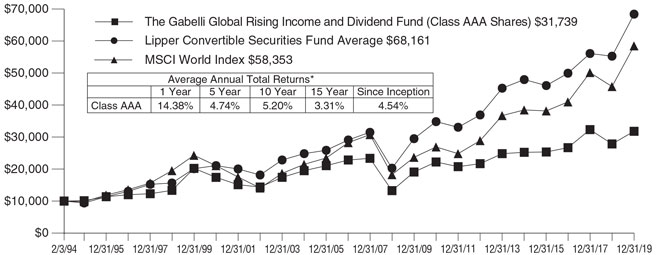
| * | Past performance is not predictive of future results. The performance tables and graph do not reflect the deduction of taxes that a shareholder would pay on Fund distributions or the redemption of Fund shares. |
3
| | |
| The Gabelli Global Rising Income and Dividend Fund | | |
Disclosure of Fund Expenses (Unaudited) | | |
For the Six Month Period from July 1, 2019 through December 31, 2019 | | Expense Table |
We believe it is important for you to understand the impact of fees and expenses regarding your investment. All mutual funds have operating expenses. As a shareholder of a fund, you incur ongoing costs, which include costs for portfolio management, administrative services, and shareholder reports (like this one), among others. Operating expenses, which are deducted from a fund’s gross income, directly reduce the investment return of a fund. When a fund’s expenses are expressed as a percentage of its average net assets, this figure is known as the expense ratio. The following examples are intended to help you understand the ongoing costs (in dollars) of investing in your Fund and to compare these costs with those of other mutual funds. The examples are based on an investment of $1,000 made at the beginning of the period shown and held for the entire period.
The Expense Table below illustrates your Fund’s costs in two ways:
Actual Fund Return:This section provides informationabout actual account values and actual expenses. You may use this section to help you to estimate the actual expenses that you paid over the period after any fee waivers and expense reimbursements. The “Ending Account Value” shown is derived from the Fund’sactualreturn during the past six months, and the“Expenses Paid During Period” shows the dollar amount that would have been paid by an investor who started with $1,000 in the Fund. You may use this information, together with the amount you invested, to estimate the expenses that you paid over the period.
To do so, simply divide your account value by $1,000 (for example, an $8,600 account value divided by $1,000 = 8.6), then multiply the result by the number given for your Fund under the heading “Expenses Paid During Period” to estimate the expenses you paid during this period.
Hypothetical 5% Return:This section providesinformation about hypothetical account values and
hypothetical expenses based on the Fund’s actual expense ratio. It assumes a hypothetical annualized return of 5% before expenses during the period shown. In this case – because the hypothetical return used isnot the Fund’s actual return – the results do not apply to your investment and you cannot use the hypothetical account value and expense to estimate the actual ending account balance or expenses you paid for the period. This example is useful in making comparisons of the ongoing costs of investing in the Fund and other funds. To do so, compare this 5% hypothetical example with the 5% hypothetical examples that appear in shareholder reports of other funds.
Please note that the expenses shown in the table are meant to highlight your ongoing costs only and do not reflect any transactional costs such as sales charges (loads), redemption fees, or exchange fees, if any, which are described in the Prospectus. If these costs were applied to your account, your costs would be higher. Therefore, the 5% hypothetical return is useful in comparing ongoing costs only, and will not help you determine the relative total costs of owning different funds. The “Annualized Expense Ratio” represents the actual expenses for the last six months and may be different from the expense ratio in the Financial Highlights which is for the year ended December 31, 2019.
| | | | | | | | | | | | | | |
| | | Beginning
Account Value
07/01/19 | | Ending
Account Value
12/31/19 | | | Annualized
Expense
Ratio | | | Expenses
Paid During
Period* | |
The Gabelli Global Rising Income and Dividend Fund | |
Actual Fund Return | | | | | | | | | | | | |
Class AAA | | $1,000.00 | | | $1,040.60 | | | | 1.58% | | | | $ 8.13 | |
Class A | | $1,000.00 | | | $1,040.50 | | | | 1.60% | | | | $ 8.23 | |
Class C | | $1,000.00 | | | $1,037.40 | | | | 2.24% | | | | $11.50 | |
Class I | | $1,000.00 | | | $1,043.50 | | | | 0.98% | | | | $ 5.05 | |
Hypothetical 5% Return | | | | | | | | | | | | |
Class AAA | | $1,000.00 | | | $1,017.24 | | | | 1.58% | | | | $ 8.03 | |
Class A | | $1,000.00 | | | $1,017.14 | | | | 1.60% | | | | $ 8.13 | |
Class C | | $1,000.00 | | | $1,013.91 | | | | 2.24% | | | | $11.37 | |
Class I | | $1,000.00 | | | $1,020.27 | | | | 0.98% | | | | $ 4.99 | |
| * | Expenses are equal to the Fund’s annualized expense ratio for the last six months multiplied by the average account value over the period, multiplied by the number of days in the most recent fiscal half year (184 days), then divided by 365. |
4
Summary of Portfolio Holdings (Unaudited)
The following table presents portfolio holdings as a percent of net assets as of December 31, 2019:
The Gabelli Global Rising Income and Dividend Fund
| | | | |
Food and Beverage | | | 19.3 | % |
Financial Services | | | 10.8 | % |
Electronics | | | 8.6 | % |
Diversified Industrial | | | 6.5 | % |
Consumer Products | | | 5.4 | % |
Telecommunications | | | 5.1 | % |
Energy and Utilities | | | 4.7 | % |
Machinery | | | 3.8 | % |
Entertainment | | | 3.6 | % |
Health Care | | | 3.2 | % |
U.S. Government Obligations | | | 2.9 | % |
Wireless Communications | | | 2.8 | % |
Energy and Energy Services | | | 2.8 | % |
Hotels and Gaming | | | 2.6 | % |
Building and Construction | | | 2.2 | % |
| | | | |
Cable and Satellite | | | 2.2 | % |
Automotive: Parts and Accessories | | | 2.1 | % |
Consumer Services | | | 1.5 | % |
Aerospace and Defense | | | 1.4 | % |
Business Services | | | 1.4 | % |
Equipment and Supplies | | | 1.2 | % |
Computer Software and Services | | | 1.1 | % |
Publishing | | | 1.1 | % |
Specialty Chemicals | | | 1.0 | % |
Retail | | | 0.9 | % |
Automotive | | | 0.4 | % |
Aviation: Parts and Services | | | 0.3 | % |
Other Assets and Liabilities (Net) | | | 1.1 | % |
| | | | |
| | | 100.0 | % |
| | | | |
The Fund files a complete schedule of portfolio holdings with the Securities and Exchange Commission (the SEC) for the first and third quarters of each fiscal year on FormN-PORT. Shareholders may obtain this information at www.gabelli.com or by calling the Fund at800-GABELLI(800-422-3554). The Fund’s FormN-PORT is available on the SEC’s website at www.sec.gov and may also be reviewed and copied at the SEC’s Public Reference Room in Washington, DC. Information on the operation of the Public Reference Room may be obtained by calling800-SEC-0330.
Proxy Voting
The Fund files FormN-PX with its complete proxy voting record for the twelve months ended June 30, no later than August 31 of each year. A description of the Fund’s proxy voting policies, procedures, and how the Fund voted proxies relating to portfolio securities is available without charge, upon request, by (i) calling800-GABELLI(800-422-3554); (ii) writing to The Gabelli Funds at One Corporate Center, Rye, NY 10580-1422; or (iii) visiting the SEC’s website at www.sec.gov.
5
The Gabelli Global Rising Income and Dividend Fund
Schedule of Investments — December 31, 2019
| | | | | | | | | | | | |
Principal
Amount | | | | | Cost | | | Market
Value | |
| | | | CONVERTIBLE CORPORATE BONDS — 0.2% | |
| | | | Energy and Utilities — 0.2% | |
| | $100,000 | | | Chart Industries Inc.,
1.000%, 11/15/24(a) | | $ | 100,000 | | | $ | 131,910 | |
| | | | | | | | | | | | |
| Shares | | | | | | | | | |
| | | | COMMON STOCKS — 95.8% | |
| | | | Aerospace and Defense — 1.4% | |
| | 5,000 | | | Aerojet Rocketdyne Holdings Inc.† | | | 49,073 | | | | 228,300 | |
| | 1,800 | | | L3Harris Technologies Inc. | | | 142,102 | | | | 356,166 | |
| | 6,000 | | | Ultra Electronics Holdings plc | | | 125,298 | | | | 168,013 | |
| | | | | | | | | | | | |
| | | | | | | 316,473 | | | | 752,479 | |
| | | | | | | | | | | | |
| | | | Automotive — 0.4% | |
| | 1,000 | | | Volkswagen AG | | | 167,644 | | | | 194,335 | |
| | | | | | | | | | | | |
| | | | Automotive: Parts and Accessories — 2.1% | |
| | 19,000 | | | Dana Inc. | | | 321,675 | | | | 345,800 | |
| | 2,000 | | | Genuine Parts Co. | | | 179,604 | | | | 212,460 | |
| | 3,000 | | | Linamar Corp. | | | 132,977 | | | | 113,504 | |
| | 46,000 | | | Uni-Select Inc. | | | 744,264 | | | | 403,481 | |
| | 4,000 | | | Veoneer Inc.† | | | 166,140 | | | | 62,480 | |
| | | | | | | | | | | | |
| | | | | | | 1,544,660 | | | | 1,137,725 | |
| | | | | | | | | | | | |
| | | | Aviation: Parts and Services — 0.3% | |
| | 200 | | | Curtiss-Wright Corp. | | | 17,951 | | | | 28,178 | |
| | 32,000 | | | Signature Aviation plc | | | 165,734 | | | | 134,453 | |
| | | | | | | | | | | | |
| | | | | | | 183,685 | | | | 162,631 | |
| | | | | | | | | | | | |
| | | | Building and Construction — 2.2% | |
| | 333 | | | Arcosa Inc. | | | 7,045 | | | | 14,835 | |
| | 15,000 | | | Armstrong Flooring Inc.† | | | 256,062 | | | | 64,050 | |
| | 500 | | | Chofu Seisakusho Co. Ltd. | | | 11,059 | | | | 11,339 | |
| | 14,000 | | | GCP Applied Technologies Inc.† | | | 359,551 | | | | 317,940 | |
| | 10,000 | | | Herc Holdings Inc.† | | | 330,599 | | | | 489,400 | |
| | 6,000 | | | Johnson Controls International plc | | | 211,053 | | | | 244,260 | |
| | 1,220 | | | Lennar Corp., Cl. B | | | 45,281 | | | | 54,534 | |
| | | | | | | | | | | | |
| | | | | | | 1,220,650 | | | | 1,196,358 | |
| | | | | | | | | | | | |
| | | | Business Services — 1.4% | |
| | 14,000 | | | JCDecaux SA | | | 427,423 | | | | 431,542 | |
| | 8,000 | | | Matthews International Corp., Cl. A | | | 350,720 | | | | 305,360 | |
| | | | | | | | | | | | |
| | | | | | | 778,143 | | | | 736,902 | |
| | | | | | | | | | | | |
| | | | Cable and Satellite — 2.2% | |
| | 514 | | | DISH Network Corp., Cl. A† | | | 19,055 | | | | 18,232 | |
| | 800 | | | EchoStar Corp., Cl. A† | | | 33,391 | | | | 34,648 | |
| | 1,000 | | | Liberty Global plc, Cl. A† | | | 32,167 | | | | 22,740 | |
| | 3,000 | | | Liberty Global plc, Cl. C† | | | 102,756 | | | | 65,385 | |
| | 1,000 | | | Liberty Latin America Ltd., Cl. A† | | | 21,774 | | | | 19,300 | |
| | 20,000 | | | Rogers Communications Inc., Cl. B | | | 707,828 | | | | 993,400 | |
| | | | | | | | | | | | |
| | | | | | | 916,971 | | | | 1,153,705 | |
| | | | | | | | | | | | |
| | | | | | | | | | | | |
| Shares | | | | | Cost | | | Market
Value | |
| | | | Computer Software and Services — 1.1% | |
| | 1,000 | | | AVEVA Group plc | | $ | 32,213 | | | $ | 61,674 | |
| | 34,000 | | | Hewlett Packard Enterprise Co. | | | 466,526 | | | | 539,240 | |
| | | | | | | | | | | | |
| | | | | | | 498,739 | | | | 600,914 | |
| | | | | | | | | | | | |
| | | | Consumer Products — 5.4% | |
| | 21,000 | | | Essity AB, Cl. A | | | 557,317 | | | | 675,984 | |
| | 9,034 | | | Hunter Douglas NV | | | 406,950 | | | | 587,742 | |
| | 2,000 | | | L’Oreal SA | | | 335,032 | | | | 592,260 | |
| | 1,500 | | | Salvatore Ferragamo SpA | | | 29,710 | | | | 31,548 | |
| | 16,000 | | | Scandinavian Tobacco Group A/S | | | 244,046 | | | | 195,141 | |
| | 4,500 | | | Svenska Cellulosa AB SCA, Cl. A | | | 29,603 | | | | 47,996 | |
| | 10,000 | | | Swedish Match AB | | | 341,330 | | | | 515,462 | |
| | 7,000 | | | Unicharm Corp. | | | 139,942 | | | | 238,369 | |
| | | | | | | | | | | | |
| | | | | | | 2,083,930 | | | | 2,884,502 | |
| | | | | | | | | | | | |
| | | | Consumer Services — 1.5% | |
| | 12,000 | | | Ashtead Group plc | | | 239,543 | | | | 383,713 | |
| | 200 | | | Boyd Group Services Inc. | | | 14,694 | | | | 31,112 | |
| | 1,500 | | | Macquarie Infrastructure Corp. | | | 64,095 | | | | 64,260 | |
| | 8,500 | | | ServiceMaster Global Holdings Inc.† | | | 300,947 | | | | 328,610 | |
| | | | | | | | | | | | |
| | | | | | | 619,279 | | | | 807,695 | |
| | | | | | | | | | | | |
| | | | Diversified Industrial — 6.5% | |
| | 1,000 | | | Aker ASA, Cl. A | | | 61,687 | | | | 61,907 | |
| | 8,000 | | | Ampco-Pittsburgh Corp.† | | | 73,770 | | | | 24,080 | |
| | 2,500 | | | Ardagh Group SA | | | 33,286 | | | | 48,950 | |
| | 8,000 | | | Bouygues SA | | | 332,884 | | | | 339,921 | |
| | 500 | | | Crane Co. | | | 37,572 | | | | 43,190 | |
| | 17,200 | | | EnPro Industries Inc. | | | 1,201,917 | | | | 1,150,336 | |
| | 7,500 | | | Jardine Matheson Holdings Ltd. | | | 400,456 | | | | 417,000 | |
| | 17,000 | | | Jardine Strategic Holdings Ltd. | | | 580,912 | | | | 521,050 | |
| | 14,500 | | | Myers Industries Inc. | | | 224,775 | | | | 241,860 | |
| | 11,500 | | | Nilfisk Holding A/S† | | | 193,613 | | | | 251,687 | |
| | 800 | | | Park-Ohio Holdings Corp. | | | 24,932 | | | | 26,920 | |
| | 1,000 | | | Sulzer AG | | | 108,207 | | | | 111,593 | |
| | 4,000 | | | Textron Inc. | | | 156,075 | | | | 178,400 | |
| | 3,000 | | | Trinity Industries Inc. | | | 57,151 | | | | 66,450 | |
| | | | | | | | | | | | |
| | | | | | | 3,487,237 | | | | 3,483,344 | |
| | | | | | | | | | | | |
| | | | Electronics — 8.6% | |
| | 36,000 | | | Sony Corp. | | | 999,862 | | | | 2,452,128 | |
| | 31,000 | | | Sony Corp., ADR | | | 663,567 | | | | 2,108,000 | |
| | 1,500 | | | Stratasys Ltd.† | | | 29,905 | | | | 30,338 | |
| | | | | | | | | | | | |
| | | | | | | 1,693,334 | | | | 4,590,466 | |
| | | | | | | | | | | | |
| | | | Energy and Energy Services — 2.8% | |
| | 6,000 | | | BP plc, ADR. | | | 202,748 | | | | 226,440 | |
| | 12,000 | | | Landis+Gyr Group AG | | | 731,326 | | | | 1,248,605 | |
| | | | | | | | | | | | |
| | | | | | | 934,074 | | | | 1,475,045 | |
| | | | | | | | | | | | |
| | | | Energy and Utilities — 4.5% | |
| | 10,000 | | | Cameco Corp. | | | 102,341 | | | | 89,000 | |
| | 500 | | | Cheniere Energy Inc.† | | | 31,425 | | | | 30,535 | |
|
| See accompanying notes to financial statements. |
|
| 6 |
The Gabelli Global Rising Income and Dividend Fund
Schedule of Investments (Continued) — December 31, 2019
| | | | | | | | | | | | |
Shares | | | | | Cost | | | Market
Value | |
| | | | COMMON STOCKS (Continued) | | | | | |
| | | | Energy and Utilities (Continued) | | | | | |
| | 7,500 | | | National Fuel Gas Co. | | $ | 391,149 | | | $ | 349,050 | |
| | 16,000 | | | National Grid plc, ADR | | | 1,105,237 | | | | 1,002,720 | |
| | 10,000 | | | Royal Dutch Shell plc, Cl. B | | | 227,355 | | | | 296,646 | |
| | 20,000 | | | Severn Trent plc | | | 542,019 | | | | 666,278 | |
| | 200,000 | | | Texas Competitive Electric Holdings Co. LLC, Escrow†(b) | | | 0 | | | | 0 | |
| | | | | | | | | | | | |
| | | | | | | 2,399,526 | | | | 2,434,229 | |
| | | | | | | | | | | | |
| | | | Entertainment — 3.6% | | | | | |
| | 9,000 | | | Discovery Inc., Cl. A† | | | 235,500 | | | | 294,660 | |
| | 22,000 | | | Grupo Televisa SAB, ADR | | | 426,256 | | | | 258,060 | |
| | 28,000 | | | International Game Technology plc | | | 492,079 | | | | 419,160 | |
| | 100,000 | | | ITV plc | | | 253,825 | | | | 200,016 | |
| | 954 | | | ViacomCBS Inc., Cl. A | | | 50,425 | | | | 42,806 | |
| | 7,155 | | | ViacomCBS Inc., Cl. B | | | 337,974 | | | | 300,295 | |
| | 15,000 | | | Vivendi SA | | | 371,240 | | | | 434,436 | |
| | | | | | | | | | | | |
| | | | | | | 2,167,299 | | | | 1,949,433 | |
| | | | | | | | | | | | |
| | | | Equipment and Supplies — 1.2% | | | | | |
| | 4,500 | | | Graco Inc. | | | 100,232 | | | | 234,000 | |
| | 12,500 | | | Mueller Industries Inc. | | | 353,268 | | | | 396,875 | |
| | | | | | | | | | | | |
| | | | | | | 453,500 | | | | 630,875 | |
| | | | | | | | | | | | |
| | | | Financial Services — 10.8% | | | | | |
| | 1,000 | | | American Express Co. | | | 80,155 | | | | 124,490 | |
| | 8,800 | | | American International Group Inc. | | | 341,298 | | | | 451,704 | |
| | 2,000 | | | Bank of America Corp. | | | 60,160 | | | | 70,440 | |
| | 3 | | | Berkshire Hathaway Inc., Cl. A† | | | 358,105 | | | | 1,018,770 | |
| | 8,000 | | | Citigroup Inc. | | | 453,300 | | | | 639,120 | |
| | 4,000 | | | Comerica Inc. | | | 172,912 | | | | 287,000 | |
| | 8,000 | | | Deutsche Bank AG | | | 59,019 | | | | 62,240 | |
| | 4,200 | | | EXOR NV | | | 156,204 | | | | 325,447 | |
| | 27,000 | | | FinecoBank Banca Fineco SpA | | | 182,261 | | | | 323,758 | |
| | 60,000 | | | GAM Holding AG† | | | 388,396 | | | | 173,838 | |
| | 2,000 | | | Julius Baer Group Ltd. | | | 98,060 | | | | 103,182 | |
| | 17,500 | | | Kinnevik AB, Cl. A | | | 551,565 | | | | 445,611 | |
| | 500 | | | Kinnevik AB, Cl. B | | | 15,085 | | | | 12,225 | |
| | 3,500 | | | Legg Mason Inc. | | | 94,123 | | | | 125,685 | |
| | 5,000 | | | Morgan Stanley | | | 122,102 | | | | 255,600 | |
| | 30,000 | | | Resona Holdings Inc. | | | 152,741 | | | | 132,253 | |
| | 1,000 | | | State Street Corp. | | | 59,450 | | | | 79,100 | |
| | 1,000 | | | T. Rowe Price Group Inc. | | | 71,771 | | | | 121,840 | |
| | 10,000 | | | The Bank of New York Mellon Corp. | | | 315,339 | | | | 503,300 | |
| | 1,500 | | | The PNC Financial Services Group Inc. | | | 102,907 | | | | 239,445 | |
| | 5,000 | | | UBS Group AG | | | 82,880 | | | | 62,900 | |
| | 4,000 | | | Wells Fargo & Co. | | | 137,920 | | | | 215,200 | |
| | | | | | | | | | | | |
| | | | | | | 4,055,753 | | | | 5,773,148 | |
| | | | | | | | | | | | |
| | | | Food and Beverage — 19.3% | | | | | |
| | 2,000 | | | Campbell Soup Co. | | | 68,687 | | | | 98,840 | |
| | 8,000 | | | Chr. Hansen Holding A/S | | | 364,041 | | | | 635,739 | |
| | | | | | | | | | | | |
Shares | | | | | Cost | | | Market
Value | |
| | 7,500 | | | Danone SA | | $ | 528,728 | | | $ | 621,705 | |
| | 130,000 | | | Davide Campari-Milano SpA | | | 483,830 | | | | 1,186,988 | |
| | 6,000 | | | Diageo plc, ADR | | | 665,409 | | | | 1,010,520 | |
| | 4,000 | | | Fomento Economico Mexicano SAB de CV, ADR | | | 320,374 | | | | 378,040 | |
| | 2,000 | | | Heineken NV | | | 133,144 | | | | 212,944 | |
| | 2,500 | | | Kellogg Co. | | | 127,291 | | | | 172,900 | |
| | 4,000 | | | Kerry Group plc, Cl. A | | | 300,765 | | | | 493,550 | |
| | 10,900 | | | Kikkoman Corp. | | | 350,663 | | | | 538,705 | |
| | 5,000 | | | Maple Leaf Foods Inc., Toronto | | | 101,615 | | | | 99,650 | |
| | 1,500 | | | McCormick & Co. Inc., Cl. V | | | 133,799 | | | | 256,605 | |
| | 1,500 | | | McCormick & Co. Inc.,Non-Voting | | | 106,428 | | | | 254,595 | |
| | 800 | | | National Beverage Corp.† | | | 32,665 | | | | 40,816 | |
| | 16,000 | | | Nestlé SA | | | 1,149,833 | | | | 1,732,259 | |
| | 3,500 | | | Pernod Ricard SA | | | 398,941 | | | | 625,799 | |
| | 14,000 | | | Remy Cointreau SA | | | 1,034,431 | | | | 1,719,574 | |
| | 6,000 | | | The Kraft Heinz Co. | | | 175,646 | | | | 192,780 | |
| | 1,000 | | | Yakult Honsha Co. Ltd. | | | 63,025 | | | | 55,497 | |
| | 400,000 | | | Yashili International Holdings Ltd. | | | 130,469 | | | | 35,933 | |
| | | | | | | | | | | | |
| | | | | | | 6,669,784 | | | | 10,363,439 | |
| | | | | | | | | | | | |
| | | | Health Care — 3.2% | | | | | |
| | 20,000 | | | Achaogen Inc.† | | | 4,200 | | | | 200 | |
| | 4,000 | | | Bristol-Myers Squibb Co. | | | 177,668 | | | | 256,760 | |
| | 16,000 | | | Clovis Oncology Inc.† | | | 168,002 | | | | 166,800 | |
| | 7,000 | | | Cutera Inc.† | | | 137,541 | | | | 250,670 | |
| | 1,000 | | | ICU Medical Inc.† | | | 57,679 | | | | 187,120 | |
| | 4,000 | | | Idorsia Ltd.† | | | 41,180 | | | | 123,745 | |
| | 1,600 | | | Johnson & Johnson | | | 182,234 | | | | 233,392 | |
| | 2,500 | | | Patterson Cos. Inc. | | | 68,005 | | | | 51,200 | |
| | 6,000 | | | Pfizer Inc. | | | 150,570 | | | | 235,080 | |
| | 5,000 | | | Roche Holding AG, ADR | | | 93,345 | | | | 203,300 | |
| | | | | | | | | | | | |
| | | | | | | 1,080,424 | | | | 1,708,267 | |
| | | | | | | | | | | | |
| | | | Hotels and Gaming — 2.6% | | | | | |
| | 250,000 | | | Mandarin Oriental International Ltd. | | | 408,479 | | | | 455,000 | |
| | 180,000 | | | The Hongkong & Shanghai Hotels Ltd. | | | 270,882 | | | | 192,883 | |
| | 225,000 | | | William Hill plc | | | 678,144 | | | | 561,651 | |
| | 1,500 | | | Wynn Resorts Ltd. | | | 159,493 | | | | 208,305 | |
| | | | | | | | | | | | |
| | | | | | | 1,516,998 | | | | 1,417,839 | |
| | | | | | | | | | | | |
| | | | Machinery — 3.8% | | | | | |
| | 104,000 | | | CNH Industrial NV, Borsa Italiana | | | 994,865 | | | | 1,142,075 | |
| | 50,000 | | | CNH Industrial NV, New York | | | 444,471 | | | | 550,000 | |
| | 1,200 | | | Mueller Water Products Inc., Cl. A | | | 13,587 | | | | 14,376 | |
| | 2,000 | | | NKT A/S† | | | 39,457 | | | | 48,275 | |
| | 28,000 | | | Twin Disc Inc.† | | | 606,230 | | | | 308,560 | |
| | | | | | | | | | | | |
| | | | | | | 2,098,610 | | | | 2,063,286 | |
| | | | | | | | | | | | |
| | | | Publishing — 1.1% | | | | | |
| | 38,000 | | | The E.W. Scripps Co., Cl. A | | | 680,679 | | | | 596,980 | |
| | | | | | | | | | | | |
|
| See accompanying notes to financial statements. |
|
| 7 |
The Gabelli Global Rising Income and Dividend Fund
Schedule of Investments (Continued) — December 31, 2019
| | | | | | | | | | | | |
Shares | | | | | Cost | | | Market
Value | |
| | | | COMMON STOCKS (Continued) | | | | | |
| | | | Retail — 0.9% | | | | | |
| | 6,753 | | | Hertz Global Holdings Inc.† | | $ | 79,442 | | | $ | 106,360 | |
| | 500 | | | Ingles Markets Inc., Cl. A | | | 15,760 | | | | 23,755 | |
| | 4,500 | | | J.C. Penney Co. Inc.† | | | 16,032 | | | | 5,040 | |
| | 4,000 | | | Macy’s Inc. | | | 82,499 | | | | 68,000 | |
| | 2,000 | | | Nathan’s Famous Inc. | | | 123,459 | | | | 141,760 | |
| | 2,400 | | | Walgreens Boots Alliance Inc. | | | 146,920 | | | | 141,504 | |
| | | | | | | | | | | | |
| | | | | | | 464,112 | | | | 486,419 | |
| | | | | | | | | | | | |
| | | | Specialty Chemicals — 1.0% | | | | | |
| | 700 | | | Ashland Global Holdings Inc. | | | 35,829 | | | | 53,571 | |
| | 3,000 | | | International Flavors & Fragrances Inc. | | | 312,534 | | | | 387,060 | |
| | 200 | | | The Chemours Co. | | | 1,719 | | | | 3,618 | |
| | 4,000 | | | Valvoline Inc. | | | 83,077 | | | | 85,640 | |
| | | | | | | | | | | | |
| | | | | | | 433,159 | | | | 529,889 | |
| | | | | | | | | | | | |
| | | | Telecommunications — 5.1% | | | | | |
| | 2,000 | | | CenturyLink Inc. | | | 24,356 | | | | 26,420 | |
| | 11,000 | | | Cincinnati Bell Inc.† | | | 97,920 | | | | 115,170 | |
| | 3,000 | | | Deutsche Telekom AG, ADR | | | 53,860 | | | | 48,870 | |
| | 4,000 | | | Frontier Communications Corp.† | | | 4,060 | | | | 3,558 | |
| | 50,000 | | | Koninklijke KPN NV | | | 139,515 | | | | 147,560 | |
| | 60,000 | | | Pharol SGPS SA, ADR† | | | 30,852 | | | | 5,521 | |
| | 2,400 | | | Proximus SA | | | 65,242 | | | | 68,702 | |
| | 130,000 | | | Sistema PJSC FC, GDR | | | 672,709 | | | | 633,620 | |
| | 90,000 | | | Sprint Corp.† | | | 574,200 | | | | 468,900 | |
| | 58,000 | | | Telefonica Deutschland Holding AG | | | 317,044 | | | | 168,112 | |
| | 60,000 | | | VEON Ltd., ADR | | | 242,602 | | | | 151,800 | |
| | 3,000 | | | Verizon Communications Inc. | | | 144,345 | | | | 184,200 | |
| | 38,000 | | | Vodafone Group plc, ADR | | | 1,096,592 | | | | 734,540 | |
| | | | | | | | | | | | |
| | | | | | | 3,463,297 | | | | 2,756,973 | |
| | | | | | | | | | | | |
| | | | Wireless Communications — 2.8% | | | | | |
| | 31,000 | | | Millicom International Cellular SA, SDR | | | 1,906,848 | | | | 1,484,741 | |
| | | | | | | | | | | | |
| | | | TOTAL COMMON STOCKS | | | 41,834,808 | | | | 51,371,619 | |
| | | | | | | | | | | | |
| | | | | | | | | | |
Principal
Amount | | | | Cost | | | Market
Value | |
| | U.S. GOVERNMENT OBLIGATIONS — 2.9% | | | | | |
$1,578,000 | | U.S. Treasury Bills,
1.487% to 1.555%††, 01/30/20 to 03/26/20 | | $ | 1,574,317 | | | $ | 1,574,413 | |
| | | | | | | | | | |
| | | |
| | TOTAL INVESTMENTS — 98.9% | | $ | 43,509,125 | | | | 53,077,942 | |
| | | | | | | | | | |
| | Other Assets and Liabilities (Net) — 1.1% | | | | 572,847 | |
| | | | | | | | | | |
| | NET ASSETS — 100.0% | | | $ | 53,650,789 | |
| | | | | | | | | | |
| (a) | Security exempt from registration under Rule 144A of the Securities Act of 1933, as amended. This security may be resold in transactions exempt from registration, normally to qualified institutional buyers. |
| (b) | Security is valued using significant unobservable inputs and is classified as Level 3 in the fair value hierarchy. |
| † | Non-income producing security. |
| †† | Represents annualized yields at dates of purchase. |
| ADR | American Depositary Receipt |
| GDR | Global Depositary Receipt |
| SDR | Swedish Depositary Receipt |
| | | | | | | | |
Geographic Diversification | | % of
Market
Value | | | Market
Value | |
| | |
Europe | | | 46.9 | % | | $ | 24,880,460 | |
United States | | | 35.2 | | | | 18,673,079 | |
Japan | | | 10.4 | | | | 5,536,291 | |
Canada | | | 3.2 | | | | 1,730,146 | |
Asia/Pacific | | | 3.1 | | | | 1,621,866 | |
Latin America | | | 1.2 | | | | 636,100 | |
| | | | | | | | |
| | | 100.0 | % | | $ | 53,077,942 | |
| | | | | | | | |
|
| See accompanying notes to financial statements. |
|
| 8 |
The Gabelli Global Rising Income and Dividend Fund
| | | | |
Statement of Assets and Liabilities | |
December 31, 2019 | |
Assets: | | | | |
Investments, at value (cost $43,509,125) | | $ | 53,077,942 | |
Foreign currency, at value (cost $472) | | | 475 | |
Cash | | | 1,912 | |
Receivable for Fund shares sold | | | 857,203 | |
Receivable from Adviser | | | 13,453 | |
Dividends and interest receivable | | | 125,716 | |
Prepaid expenses | | | 23,893 | |
| | | | |
Total Assets | | | 54,100,594 | |
| | | | |
Liabilities: | | | | |
Payable for Fund shares redeemed | | | 325,327 | |
Payable for investment advisory fees | | | 44,374 | |
Payable for accounting fees | | | 11,250 | |
Payable for distribution fees | | | 2,867 | |
Payable for legal and audit fees | | | 30,999 | |
Payable for shareholder communications expenses | | | 20,903 | |
Payable for custody expenses | | | 5,340 | |
Other accrued expenses | | | 8,745 | |
| | | | |
Total Liabilities | | | 449,805 | |
| | | | |
Net Assets(applicable to 2,056,078 shares outstanding) | | $ | 53,650,789 | |
| | | | |
Net Assets Consist of: | | | | |
Paid-in capital | | $ | 44,587,213 | |
Total distributable earnings | | | 9,063,576 | |
| | | | |
Net Assets | | $ | 53,650,789 | |
| | | | |
Shares of Capital Stock, each at $0.001 par value: | |
Class AAA: | | | | |
Net Asset Value, offering, and redemption price per share ($6,193,638 ÷ 236,581 shares outstanding; 75,000,000 shares authorized) | | | $26.18 | |
Class A: | | | | |
Net Asset Value and redemption price per share ($1,441,236 ÷ 54,937 shares outstanding; 50,000,000 shares authorized) | | | $26.23 | |
Maximum offering price per share (NAV ÷ 0.9425, based on maximum sales charge of 5.75% of the offering price) | | | $27.83 | |
Class C: | | | | |
Net Asset Value and offering price per share ($1,835,909 ÷ 83,681 shares outstanding; 25,000,000 shares authorized) | | | $21.94 | (a) |
Class I: | | | | |
Net Asset Value, offering, and redemption price per share ($44,180,006 ÷ 1,680,879 shares outstanding; 25,000,000 shares authorized) | | | $26.28 | |
| (a) | Redemption price varies based on the length of time held. |
| | | | |
Statement of Operations | | | | |
For the Year Ended December 31, 2019 | |
Investment Income: | | | | |
Dividends (net of foreign withholding taxes of $80,171) | | $ | 895,755 | |
Income fromnon-cash dividends | | | 103,325 | |
Interest | | | 10,739 | |
| | | | |
Total Investment Income | | | 1,009,819 | |
| | | | |
Expenses: | | | | |
Investment advisory fees | | | 505,729 | |
Distribution fees - Class AAA | | | 13,101 | |
Distribution fees - Class A | | | 3,787 | |
Distribution fees - Class C | | | 19,037 | |
Shareholder communications expenses | | | 44,348 | |
Registration expenses | | | 40,017 | |
Legal and audit fees | | | 36,803 | |
Accounting fees | | | 33,750 | |
Custodian fees | | | 23,509 | |
Shareholder services fees | | | 20,051 | |
Directors’ fees | | | 14,419 | |
Interest expense | | | 622 | |
Miscellaneous expenses | | | 15,582 | |
| | | | |
Total Expenses | | | 770,755 | |
| | | | |
Less: | | | | |
Expense reimbursements (See Note 3) | | | (196,584 | ) |
Expenses paid indirectly by broker (See Note 6) | | | (1,536 | ) |
| | | | |
Total Reimbursements and Credits | | | (198,120 | ) |
| | | | |
Net Expenses | | | 572,635 | |
| | | | |
Net Investment Income | | | 437,184 | |
| | | | |
Net Realized and Unrealized Gain/(Loss) on Investments and Foreign Currency: | | | | |
Net realized loss on investments | | | (49,343 | ) |
Net realized loss on foreign currency transactions | | | (5,618 | ) |
| | | | |
Net realized loss on investments and foreign currency transactions | | | (54,961 | ) |
| | | | |
Net change in unrealized appreciation/depreciation: on investments | | | 6,629,787 | |
on foreign currency translations | | | 905 | |
| | | | |
Net change in unrealized appreciation/depreciation on investments and foreign currency translations | | | 6,630,692 | |
| | | | |
Net Realized and Unrealized Gain/(Loss) on Investments and Foreign Currency | | | 6,575,731 | |
| | | | |
Net Increase in Net Assets Resulting from Operations | | $ | 7,012,915 | |
| | | | |
|
| See accompanying notes to financial statements. |
|
| 9 |
The Gabelli Global Rising Income and Dividend Fund
Statement of Changes in Net Assets
| | | | | | | | | | | | | | | | | | | | | | | | |
| | | Year Ended
December 31, 2019 | | | Year Ended
December 31, 2018 | |
Operations: | | | | | | | | | | | | | | | | | | | | | | | | |
Net investment income | | | | | | $ | 437,184 | | | | | | | | | | | $ | 710,709 | | | | | |
Net realized gain/(loss) on investments and foreign currency transactions | | | | | | | (54,961 | ) | | | | | | | | | | | 180,868 | | | | | |
Net change in unrealized appreciation/depreciation on investments and foreign currency translations | | | | | | | 6,630,692 | | | | | | | | | | | | (8,653,334 | ) | | | | |
| | | | | | | | | | | | | | | | | | | | | | | | |
Net Increase/(Decrease) in Net Assets Resulting from Operations | | | | | | | 7,012,915 | | | | | | | | | | | | (7,761,757 | ) | | | | |
| | | | | | | | | | | | | | | | | | | | | | | | |
Distributions to Shareholders: | | | | | | | | | | | | | | | | | | | | | | | | |
Accumulated earnings | | | | | | | | | | | | | | | | | | | | | | | | |
Class AAA | | | | | | | (29,111 | ) | | | | | | | | | | | (80,933 | ) | | | | |
Class A | | | | | | | (6,320 | ) | | | | | | | | | | | (24,198 | ) | | | | |
Class C | | | | | | | (2,980 | ) | | | | | | | | | | | (25,409 | ) | | | | |
Class I | | | | | | | (478,972 | ) | | | | | | | | | | | (963,201 | ) | | | | |
| | | | | | | | | | | | | | | | | | | | | | | | |
Total Distributions to Shareholders | | | | | | | (517,383 | ) | | | | | | | | | | | (1,093,741 | ) | | | | |
| | | | | | | | | | | | | | | | | | | | | | | | |
| | | | | | |
Capital Share Transactions: | | | | | | | | | | | | | | | | | | | | | | | | |
Class AAA | | | | | | | 578,125 | | | | | | | | | | | | (1,815,916 | ) | | | | |
Class A | | | | | | | (211,815 | ) | | | | | | | | | | | 542,226 | | | | | |
Class C | | | | | | | (662,838 | ) | | | | | | | | | | | 574,810 | | | | | |
Class I | | | | | | | (121,263 | ) | | | | | | | | | | | (13,404,542 | ) | | | | |
| | | | | | | | | | | | | | | | | | | | | | | | |
Net Decrease in Net Assets from Capital Share Transactions | | | | | | | (417,791 | ) | | | | | | | | | | | (14,103,422 | ) | | | | |
| | | | | | | | | | | | | | | | | | | | | | | | |
Redemption Fees | | | | | | | 2 | | | | | | | | | | | | — | | | | | |
| | | | | | | | | | | | | | | | | | | | | | | | |
Net Increase/(Decrease) in Net Assets | | | | | | | 6,077,743 | | | | | | | | | | | | (22,958,920 | ) | | | | |
Net Assets: | | | | | | | | | | | | | | | | | | | | | | | | |
Beginning of year | | | | | | | 47,573,046 | | | | | | | | | | | | 70,531,966 | | | | | |
| | | | | | | | | | | | | | | | | | | | | | | | |
End of year | | | | | | $ | 53,650,789 | | | | | | | | | | | $ | 47,573,046 | | | | | |
| | | | | | | | | | | | | | | | | | | | | | | | |
|
| See accompanying notes to financial statements. |
|
| 10 |
The Gabelli Global Rising Income and Dividend Fund
Financial Highlights
Selected data for a share of capital stock outstanding throughout each year:
| | | | | | | | | | | | | | | | | | | | | | | | | | | | | | | | | | | | | | | | | | | | | | | | | | | | | | | | | | | | | | | | |
| | | | | | Income (Loss)
from Investment Operations | | | Distributions | | | | | | | | | | | | Ratios to Average Net Assets/
Supplemental Data | |
Year Ended
December 31 | | Net Asset
Value,
Beginning
of Year | | | Net
Investment
Income
(Loss)(a) | | | Net Realized
and
Unrealized
Gain (Loss)
on
Investments | | | Total from
Investment
Operations | | | Net
Investment
Income | | | Net
Realized
Gain | | | Return of
Capital | | | Total
Distributions | | | Redemption
Fees (a)(b) | | | Net Asset
Value,
End of
Year | | | Total
Return† | | | Net Assets
End of
Year
(in 000’s) | | | Net
Investment
Income
(Loss) | | | Operating
Expenses
Before
Reimburse-
ment | | | Operating
Expenses
Net of
Reimburse-
ment(c)(d) | | | Portfolio
Turnover
Rate | |
Class AAA | | | | | | | | | | | | | | | | | | | | | | | | | | | | | | | | | | | | | | | | | | | | | | | | | | | | | | | | | | | | | | | | |
2019 | | | $23.00 | | | | $ 0.08 | (e) | | | $ 3.22 | | | | $ 3.30 | | | | $(0.08 | ) | | | $(0.04 | ) | | | — | | | | $(0.12 | ) | | | $0.00 | | | | $26.18 | | | | 14.4 | % | | | $ 6,194 | | | | 0.34 | %(e) | | | 1.70 | % | | | 1.65 | %(f) | | | 5 | % |
2018 | | | 27.20 | | | | 0.16 | | | | (3.98 | ) | | | (3.82 | ) | | | (0.20 | ) | | | (0.18 | ) | | | — | | | | (0.38 | ) | | | — | | | | 23.00 | | | | (14.0 | ) | | | 4,929 | | | | 0.60 | | | | 1.67 | | | | 1.67 | | | | 20 | |
2017 | | | 22.80 | | | | 0.03 | | | | 4.74 | | | | 4.77 | | | | (0.07 | ) | | | (0.28 | ) | | | $(0.02 | ) | | | (0.37 | ) | | | 0.00 | | | | 27.20 | | | | 20.9 | | | | 7,672 | | | | 0.12 | | | | 1.62 | | | | 1.62 | | | | 24 | |
2016 | | | 21.85 | | | | 0.27 | | | | 0.91 | | | | 1.18 | | | | (0.23 | ) | | | — | | | | — | | | | (0.23 | ) | | | — | | | | 22.80 | | | | 5.4 | | | | 4,598 | | | | 1.21 | | | | 1.61 | | | | 1.61 | (g) | | | 52 | |
2015 | | | 22.01 | | | | (0.09 | ) | | | 0.22 | | | | 0.13 | | | | — | | | | (0.29 | ) | | | — | | | | (0.29 | ) | | | — | | | | 21.85 | | | | 0.6 | | | | 7,121 | | | | (0.41 | ) | | | 1.75 | | | | 1.75 | (h) | | | 167 | |
Class A | | | | | | | | | | | | | | | | | | | | | | | | | | | | | | | | | | | | | | | | | | | | | | | | | | | | | | | | | | | | | | | | |
2019 | | | $23.04 | | | | $ 0.09 | (e) | | | $ 3.21 | | | | $ 3.30 | | | | $(0.07 | ) | | | $(0.04 | ) | | | — | | | | $(0.11 | ) | | | $0.00 | | | | $26.23 | | | | 14.4 | % | | | $ 1,441 | | | | 0.35 | %(e) | | | 1.70 | % | | | 1.66 | %(f) | | | 5 | % |
2018 | | | 27.26 | | | | 0.16 | | | | (3.99 | ) | | | (3.83 | ) | | | (0.21 | ) | | | (0.18 | ) | | | — | | | | (0.39 | ) | | | — | | | | 23.04 | | | | (14.0 | ) | | | 1,465 | | | | 0.61 | | | | 1.67 | | | | 1.67 | | | | 20 | |
2017 | | | 22.86 | | | | 0.05 | | | | 4.74 | | | | 4.79 | | | | (0.09 | ) | | | (0.28 | ) | | | $(0.02 | ) | | | (0.39 | ) | | | 0.00 | | | | 27.26 | | | | 20.9 | | | | 1,178 | | | | 0.18 | | | | 1.62 | | | | 1.62 | | | | 24 | |
2016 | | | 21.90 | | | | 0.25 | | | | 0.93 | | | | 1.18 | | | | (0.22 | ) | | | — | | | | — | | | | (0.22 | ) | | | — | | | | 22.86 | | | | 5.4 | | | | 480 | | | | 1.15 | | | | 1.61 | | | | 1.61 | (g) | | | 52 | |
2015 | | | 22.10 | | | | (0.10 | ) | | | 0.19 | | | | 0.09 | | | | — | | | | (0.29 | ) | | | — | | | | (0.29 | ) | | | — | | | | 21.90 | | | | 0.4 | | | | 694 | | | | (0.44 | ) | | | 1.75 | | | | 1.75 | (h) | | | 167 | |
Class C | | | | | | | | | | | | | | | | | | | | | | | | | | | | | | | | | | | | | | | | | | | | | | | | | | | | | | | | | | | | | | | | |
2019 | | | $19.35 | | | | $(0.09 | )(e) | | | $ 2.72 | | | | $ 2.63 | | | | — | | | | $(0.04 | ) | | | — | | | | $(0.04 | ) | | | $0.00 | | | | $21.94 | | | | 13.6 | % | | | $ 1,836 | | | | (0.43 | )%(e) | | | 2.45 | % | | | 2.37 | %(f) | | | 5 | % |
2018 | | | 22.93 | | | | (0.02 | ) | | | (3.35 | ) | | | (3.37 | ) | | | $(0.03 | ) | | | (0.18 | ) | | | — | | | | (0.21 | ) | | | — | | | | 19.35 | | | | (14.7 | ) | | | 2,245 | | | | (0.09 | ) | | | 2.42 | | | | 2.42 | | | | 20 | |
2017 | | | 19.36 | | | | (0.14 | ) | | | 4.01 | | | | 3.87 | | | | — | | | | (0.28 | ) | | | $(0.02 | ) | | | (0.30 | ) | | | 0.00 | | | | 22.93 | | | | 20.0 | | | | 2,127 | | | | (0.62 | ) | | | 2.37 | | | | 2.37 | | | | 24 | |
2016 | | | 18.61 | | | | 0.06 | | | | 0.80 | | | | 0.86 | | | | (0.11 | ) | | | — | | | | — | | | | (0.11 | ) | | | — | | | | 19.36 | | | | 4.6 | | | | 721 | | | | 0.31 | | | | 2.36 | | | | 2.36 | (g) | | | 52 | |
2015 | | | 18.97 | | | | (0.24 | ) | | | 0.17 | | | | (0.07 | ) | | | — | | | | (0.29 | ) | | | — | | | | (0.29 | ) | | | — | | | | 18.61 | | | | (0.4 | ) | | | 595 | | | | (1.26 | ) | | | 2.50 | | | | 2.20 | (h) | | | 167 | |
Class I | | | | | | | | | | | | | | | | | | | | | | | | | | | | | | | | | | | | | | | | | | | | | | | | | | | | | | | | | | | | | | | | |
2019 | | | $23.08 | | | | $ 0.25 | (e) | | | $ 3.24 | | | | $ 3.49 | | | | $(0.25 | ) | | | $(0.04 | ) | | | — | | | | $(0.29 | ) | | | $0.00 | | | | $26.28 | | | | 15.1 | % | | | $44,180 | | | | 1.01 | %(e) | | | 1.45 | % | | | 0.99 | %(f) | | | 5 | % |
2018 | | | 27.35 | | | | 0.35 | | | | (4.04 | ) | | | (3.69 | ) | | | (0.40 | ) | | | (0.18 | ) | | | — | | | | (0.58 | ) | | | — | | | | 23.08 | | | | (13.40 | ) | | | 38,934 | | | | 1.32 | | | | 1.42 | | | | 1.00 | (f) | | | 20 | |
2017 | | | 22.89 | | | | 0.19 | | | | 4.78 | | | | 4.97 | | | | (0.21 | ) | | | (0.28 | ) | | | $(0.02 | ) | | | (0.51 | ) | | | 0.00 | | | | 27.35 | | | | 21.7 | | | | 59,555 | | | | 0.74 | | | | 1.37 | | | | 1.00 | (f) | | | 24 | |
2016 | | | 21.94 | | | | 0.31 | | | | 0.95 | | | | 1.26 | | | | (0.31 | ) | | | — | | | | — | | | | (0.31 | ) | | | — | | | | 22.89 | | | | 5.8 | | | | 37,344 | | | | 1.39 | | | | 1.36 | | | | 1.27 | (f)(g) | | | 52 | |
2015 | | | 22.13 | | | | (0.04 | ) | | | 0.17 | | | | 0.13 | | | | (0.03 | ) | | | (0.29 | ) | | | — | | | | (0.32 | ) | | | — | | | | 21.94 | | | | 0.6 | | | | 36,371 | | | | (0.19 | ) | | | 1.50 | | | | 1.50 | (h) | | | 167 | |
| † | Total return represents aggregate total return of a hypothetical $1,000 investment at the beginning of the year and sold at the end of the year including reinvestment of distributions and does not reflect the applicable sales charges. |
| (a) | Per share amounts have been calculated using the average shares outstanding method. |
| (b) | Amount represents less than $0.005 per share. |
| (c) | The Fund received credits from a designated broker who agreed to pay certain Fund operating expenses. For the years ended December 31, 2019, 2018, 2017, and 2016, there was no impact to the expenses ratio. For the year ended December 31, 2015, if credits had not been received, the ratios of operating expenses to average net assets would have been 1.76% (Class AAA and Class A), 2.51% (Class C), and 1.51% (Class I). |
| (d) | The Fund incurred interest expense during the years ended December 31, 2019, 2018, 2017, 2016, and 2015, and the effect of the interest expense was minimal. |
| (e) | Includes income resulting from special dividends. Without these dividends, the per share income amounts would have been 0.03 (Class AAA), 0.04 (Class A), (0.13) (Class C), and 0.20 (Class I), and the net investment income ratio would have been 0.14% (Class AAA and Class A), (0.64%) (Class C), and 0.80% (Class I), respectively. |
| (f) | Under an expense reimbursement agreement with the Adviser, the Adviser reimbursed expenses of $196,584 for the year ended December 31, 2019 and certain Class I expenses to the Fund of $211,071, $175,468, and $36,018 for the years ended December 31, 2018, 2017, and 2016, respectively. |
| (g) | During the year ended December 31, 2016, the Fund received reimbursements of custody expenses paid in prior years. Had such reimbursement (allocated by relative net asset values of the Fund’s share classes) been included in this period, the expense ratios would have been 1.46% (Class AAA), 1.44% (Class A), 2.20% (Class C), and 1.10% (Class I). |
| (h) | Under an expense deferral agreement with the Adviser, the Adviser recovered from the Fund $62,315 for the year ended December 31, 2015, representing previously reimbursed expenses from the Adviser. Had such payment not been made, the expense ratio would have been 1.61% (Class AAA and Class A), 2.36% (Class C), and 1.36% (Class I). |
|
| See accompanying notes to financial statements. |
|
| 11 |
The Gabelli Global Rising Income and Dividend Fund
Notes to Financial Statements
1. Organization.The Gabelli Global Rising Income and Dividend Fund, a series of GAMCO Global SeriesFunds, Inc. (the Corporation), was incorporated on July 16, 1993 in Maryland. The Fund is anon-diversifiedopen-end management investment company registered under the Investment Company Act of 1940, as amended (the 1940 Act), and is one of five separately managed portfolios (collectively, the Portfolios) of the Corporation. The Fund’s primary objective is to obtain a high level of total return through a combination of income and capital appreciation. The Fund commenced investment operations on February 3, 1994.
2. Significant Accounting Policies.As an investment company, the Fund follows the investment companyaccounting and reporting guidance, which is part of U.S. generally accepted accounting principles (GAAP) that may require the use of management estimates and assumptions in the preparation of its financial statements. Actual results could differ from those estimates. The following is a summary of significant accounting policies followed by the Fund in the preparation of its financial statements.
New Accounting Pronouncements.To improve the effectiveness of fair value disclosure requirements, theFinancial Accounting Standards Board recently issued Accounting Standard Update (ASU)2018-13, Fair Value Measurement Disclosure Framework – Changes to the Disclosure Requirements for Fair Value Measurement (ASU2018-13), which adds, removes, and modifies certain aspects relating to fair value disclosure. ASU2018-13 is effective for interim and annual reporting periods beginning after December 15, 2019; early adoption of the additions relating to ASU2018-13 is not required, even if early adoption is elected for the removals and modifications under ASU2018-13. Management has early adopted the removals and modifications set forth in ASU2018-13 in these financial statements and has not early adopted the additions set forth in ASU2018-13.
Security Valuation.Portfolio securities listed or traded on a nationally recognized securities exchange or tradedin the U.S.over-the-counter market for which market quotations are readily available are valued at the last quoted sale price or a market’s official closing price as of the close of business on the day the securities are being valued. If there were no sales that day, the security is valued at the average of the closing bid and asked prices or, if there were no asked prices quoted on that day, then the security is valued at the closing bid price on that day. If no bid or asked prices are quoted on such day, the security is valued at the most recently available price or, if the Board of Directors (the Board) so determines, by such other method as the Board shall determine in good faith to reflect its fair market value. Portfolio securities traded on more than one national securities exchange or market are valued according to the broadest and most representative market, as determined by Gabelli Funds, LLC (the Adviser).
Portfolio securities primarily traded on a foreign market are generally valued at the preceding closing values of such securities on the relevant market, but may be fair valued pursuant to procedures established by the Board if market conditions change significantly after the close of the foreign market, but prior to the close of business on the day the securities are being valued. Debt obligations for which market quotations are readily available are valued at the average of the latest bid and asked prices. If there were no asked prices quoted on such day, the security is valued using the closing bid price. Such debt obligations are valued through prices provided by a pricing service approved by the Board. Certain securities are valued principally using dealer quotations.
Securities and assets for which market quotations are not readily available are fair valued as determined by the Board. Fair valuation methodologies and procedures may include, but are not limited to: analysis and review of available financial andnon-financial information about the company; comparisons with the valuation and
12
The Gabelli Global Rising Income and Dividend Fund
Notes to Financial Statements (Continued)
changes in valuation of similar securities, including a comparison of foreign securities with the equivalent U.S. dollar value American Depositary Receipt securities at the close of the U.S. exchange; and evaluation of any other information that could be indicative of the value of the security.
The Fund employs a fair value model to adjust prices to reflect events affecting the values of certain portfolio securities which occur between the close of trading on the principal market for such securities (foreign exchanges andover-the-counter markets) at the time when net asset values of the Fund are determined. If the Fund’s valuation committee believes that a particular event would materially affect net asset value, further adjustment is considered.
The inputs and valuation techniques used to measure fair value of the Fund’s investments are summarized into three levels as described in the hierarchy below:
| | ● | | Level 1 — quoted prices in active markets for identical securities; |
| | ● | | Level 2 — other significant observable inputs (including quoted prices for similar securities, interest rates, prepayment speeds, credit risk, etc.); and |
| | ● | | Level 3 — significant unobservable inputs (including the Board’s determinations as to the fair value of investments). |
A financial instrument’s level within the fair value hierarchy is based on the lowest level of any input both individually and in the aggregate that is significant to the fair value measurement. The inputs or methodology used for valuing securities are not necessarily an indication of the risk associated with investing in those securities. The summary of the Fund’s investments in securities by inputs used to value the Fund’s investments as of December 31, 2019 is as follows:
| | | | | | | | | | | | | | | | | | | | |
| | | Valuation Inputs | | |
| | | Level 1
Quoted Prices | | Level 2 Other Significant
Observable Inputs | | Level 3 Significant
Unobservable Inputs | | Total Market Value
at 12/31/19 |
INVESTMENTS IN SECURITIES: | | | | | | | | | | | | | | | | | | | | |
ASSETS (Market Value): | | | | | | | | | | | | | | | | | | | | |
Common Stocks: | | | | | | | | | | | | | | | | | | | | |
Energy and Utilities | | | $ | 2,434,229 | | | | | — | | | | $ | 0 | | | | $ | 2,434,229 | |
Other Industries (a) | | | | 48,937,390 | | | | | — | | | | | — | | | | | 48,937,390 | |
Total Common Stocks | | | | 51,371,619 | | | | | — | | | | | 0 | | | | | 51,371,619 | |
Convertible Corporate Bonds (a) | | | | — | | | | $ | 131,910 | | | | | — | | | | | 131,910 | |
U.S. Government Obligations | | | | — | | | | | 1,574,413 | | | | | — | | | | | 1,574,413 | |
TOTAL INVESTMENTS IN SECURITIES – ASSETS | | | $ | 51,371,619 | | | | $ | 1,706,323 | | | | $ | 0 | | | | $ | 53,077,942 | |
| (a) | Please refer to the Schedule of Investments for the industry classifications of these portfolio holdings. |
The Fund did not have any transfers into or out of Level 3 during the year ended December 31, 2019.
Additional Information to Evaluate Qualitative Information.
General.The Fund uses recognized industry pricing services – approved by the Board and unaffiliated withthe Adviser – to value most of its securities, and uses broker quotes provided by market makers of securities not valued by these and other recognized pricing sources. Several different pricing feeds are received to value domestic equity securities, international equity securities, preferred equity securities, and fixed income securities. The data within these feeds are ultimately sourced from major stock exchanges and trading systems where
13
The Gabelli Global Rising Income and Dividend Fund
Notes to Financial Statements (Continued)
these securities trade. The prices supplied by external sources are checked by obtaining quotations or actual transaction prices from market participants. If a price obtained from the pricing source is deemed unreliable, prices will be sought from another pricing service or from a broker/dealer that trades that security or similar securities.
Fair Valuation.Fair valued securities may be common or preferred equities, warrants, options, rights, or fixedincome obligations. Where appropriate, Level 3 securities are those for which market quotations are not available, such as securities not traded for several days, or for which current bids are not available, or which are restricted as to transfer. When fair valuing a security, factors to consider include recent prices of comparable securities that are publicly traded, reliable prices of securities not publicly traded, the use of valuation models, current analyst reports, valuing the income or cash flow of the issuer, or cost if the preceding factors do not apply. A significant change in the unobservable inputs could result in a lower or higher value in Level 3 securities. The circumstances of Level 3 securities are frequently monitored to determine if fair valuation measures continue to apply.
The Adviser reports quarterly to the Board the results of the application of fair valuation policies and procedures. These may include backtesting the prices realized in subsequent trades of these fair valued securities to fair values previously recognized.
Derivative Financial Instruments.The Fund may engage in various portfolio investment strategies by investingin derivative financial instruments for the purposes of increasing the income of the Fund, hedging against changes in the value of its portfolio securities and in the value of securities it intends to purchase, or hedging against a specific transaction with respect to either the currency in which the transaction is denominated or another currency. Investing in certain derivative financial instruments, including participation in the options, futures, or swap markets, entails certain execution, liquidity, hedging, tax, and securities, interest, credit, or currency market risks. Losses may arise if the Adviser’s prediction of movements in the direction of the securities, foreign currency, and interest rate markets is inaccurate. Losses may also arise if the counterparty does not perform its duties under a contract, or that, in the event of default, the Fund may be delayed in or prevented from obtaining payments or other contractual remedies owed to it under derivative contracts. The creditworthiness of the counterparties is closely monitored in order to minimize these risks. Participation in derivative transactions involves investment risks, transaction costs, and potential losses to which the Fund would not be subject absent the use of these strategies. The consequences of these risks, transaction costs, and losses may have a negative impact on the Fund’s ability to pay distributions.
Collateral requirements differ by type of derivative. Collateral requirements are set by the broker or exchange clearing house for exchange traded derivatives, while collateral terms are contract specific for derivatives tradedover-the-counter. Securities pledged to cover obligations of the Fund under derivative contracts, if any, are noted in the Schedule of Investments. Cash collateral, if any, pledged for the same purpose will be reported separately in the Statement of Assets and Liabilities.
The Fund’s policy with respect to offsetting is that, absent an event of default by the counterparty or a termination of the agreement, the master agreement does not result in an offset of reported amounts of financial assets and financial liabilities in the Statement of Assets and Liabilities across transactions between the Fund and the applicable counterparty. The enforceability of the right to offset may vary by jurisdiction.
14
The Gabelli Global Rising Income and Dividend Fund
Notes to Financial Statements (Continued)
The Fund’s derivative contracts held at December 31, 2019, if any, are not accounted for as hedging instruments under GAAP and are disclosed in the Schedule of Investments together with the related counterparty.
Forward Foreign Exchange Contracts.The Fund may engage in forward foreign exchange contracts for thepurpose of hedging a specific transaction with respect to either the currency in which the transaction is denominated or another currency as deemed appropriate by the Adviser. Forward foreign exchange contracts are valued at the forward rate and aremarked-to-market daily. The change in market value is included in unrealized appreciation/depreciation on investments and foreign currency translations. When the contract is closed, the Fund records a realized gain or loss equal to the difference between the value of the contract at the time it was opened and the value at the time it was closed.
The use of forward foreign exchange contracts does not eliminate fluctuations in the underlying prices of the Fund’s portfolio securities, but it does establish a rate of exchange that can be achieved in the future. Although forward foreign exchange contracts limit the risk of loss due to a decline in the value of the hedged currency, they also limit any potential gain that might result should the value of the currency increase. As of December 31, 2019, the Fund held no forward foreign exchange contracts.
Securities Sold Short.The Fund may enter into short sale transactions. Short selling involves selling securitiesthat may or may not be owned and, at times, borrowing the same securities for delivery to the purchaser, with an obligation to replace such borrowed securities at a later date. The proceeds received from short sales are recorded as liabilities and the Fund records an unrealized gain or loss to the extent of the difference between the proceeds received and the value of an open short position on the day of determination. The Fund records a realized gain or loss when the short position is closed out. By entering into a short sale, the Fund bears the market risk of an unfavorable change in the price of the security sold short. Dividends on short sales are recorded as an expense by the Fund on theex-dividend date and interest expense is recorded on the accrual basis. The broker retains collateral for the value of the open positions, which is adjusted periodically as the value of the position fluctuates. At December 31, 2019, there were no short sales outstanding.
Foreign Currency Translations.The books and records of the Fund are maintained in U.S. dollars. Foreigncurrencies, investments, and other assets and liabilities are translated into U.S. dollars at current exchange rates. Purchases and sales of investment securities, income, and expenses are translated at the exchange rate prevailing on the respective dates of such transactions. Unrealized gains and losses that result from changes in foreign exchange rates and/or changes in market prices of securities have been included in unrealized appreciation/depreciation on investments and foreign currency translations. Net realized foreign currency gains and losses resulting from changes in exchange rates include foreign currency gains and losses between trade date and settlement date on investment securities transactions, foreign currency transactions, and the difference between the amounts of interest and dividends recorded on the books of the Fund and the amounts actually received. The portion of foreign currency gains and losses related to fluctuation in exchange rates between the initial purchase trade date and subsequent sale trade date is included in realized gain/(loss) on investments.
Foreign Securities.The Fund may directly purchase securities of foreign issuers. Investing in securities offoreign issuers involves special risks not typically associated with investing in securities of U.S. issuers. The risks include possible revaluation of currencies, the inability to repatriate funds, less complete financial information about companies, and possible future adverse political and economic developments. Moreover, securities of
15
The Gabelli Global Rising Income and Dividend Fund
Notes to Financial Statements (Continued)
many foreign issuers and their markets may be less liquid and their prices more volatile than those of securities of comparable U.S. issuers.
Foreign Taxes.The Fund may be subject to foreign taxes on income, gains on investments, or currency repatriation,a portion of which may be recoverable. The Fund will accrue such taxes and recoveries as applicable, based upon its current interpretation of tax rules and regulations that exist in the markets in which it invests.
Restricted Securities.The Fund may invest up to 15% of its net assets in securities for which the marketsare restricted. Restricted securities include securities whose disposition is subject to substantial legal or contractual restrictions. The sale of restricted securities often requires more time and results in higher brokerage charges or dealer discounts and other selling expenses than does the sale of securities eligible for trading on national securities exchanges or in theover-the-counter markets. Restricted securities may sell at a price lower than similar securities that are not subject to restrictions on resale. Securities freely saleable among qualified institutional investors under special rules adopted by the SEC may be treated as liquid if they satisfy liquidity standards established by the Board. The continued liquidity of such securities is not as well assured as that of publicly traded securities, and accordingly the Board will monitor their liquidity. For the restricted securities the Fund held as of December 31, 2019, if any, refer to the Schedule of Investments.
Investments in other Investment Companies.The Fund may invest, from time to time, in shares of otherinvestment companies (or entities that would be considered investment companies but are excluded from the definition pursuant to certain exceptions under the 1940 Act) (the Acquired Funds) in accordance with the 1940 Act and related rules. Shareholders in the Fund would bear the pro rata portion on of the periodic expenses of the Acquired Funds in addition to the Fund’s expenses. For the year ended December 31, 2019, the Fund’s pro rata portion of the periodic expenses charged by the Acquired Funds was less than one basis point.
Securities Transactions and Investment Income.Securities transactions are accounted for on the trade datewith realized gain or loss on investments determined by using the identified cost method. Interest income (including amortization of premium and accretion of discount) is recorded on the accrual basis. Premiums and discounts on debt securities are amortized using the effective yield to maturity method. Dividend income is recorded on theex-dividend date, except for certain dividends from foreign securities that are recorded as soon after theex-dividend date as the Fund becomes aware of such dividends.
Determination of Net Asset Value and Calculation of Expenses.Certain administrative expenses are commonto, and allocated among, various affiliated funds. Such allocations are made on the basis of each fund’s average net assets or other criteria directly affecting the expenses as determined by the Adviser pursuant to procedures established by the Board.
In calculating the NAV per share of each class, investment income, realized and unrealized gains and losses, redemption fees, and expenses other than class specific expenses are allocated daily to each class of shares based upon the proportion of net assets of each class at the beginning of each day. Distribution expenses are borne solely by the class incurring the expense.
Distributions to Shareholders. Distributions to shareholders are recorded on theex-dividend date. Distributions to shareholders are based on income and capital gains as determined in accordance with federal income tax regulations, which may differ from income and capital gains as determined under GAAP. These differences are primarily due to differing treatments of income and gains on various investment securities and foreign
16
The Gabelli Global Rising Income and Dividend Fund
Notes to Financial Statements (Continued)
currency transactions held by the Fund, timing differences, and differing characterizations of distributions made by the Fund. Distributions from net investment income for federal income tax purposes include net realized gains on foreign currency transactions. These book/tax differences are either temporary or permanent in nature. To the extent these differences are permanent, adjustments are made to the appropriate capital accounts in the period when the differences arise. Permanent differences were primarily due to reclasses of realized foreign currency and redesignation of dividends paid. These reclassifications have no impact on the NAV of the Fund. For the year ended December 31, 2019, reclassifications were made to decreasepaid-in capital by $135, with an offsetting adjustment to total distributable earnings.
The tax character of distributions paid during the years ended December 31, 2019 and 2018 were as follows:
| | | | | | | | | | |
| | | Year Ended
December 31, 2019 | | Year Ended
December 31, 2018 |
Distributions paid from: | | | | | | | | | | |
Ordinary income (inclusive of short term capital gains) | | | $ | 502,720 | | | | $ | 718,621 | |
Net long term capital gains | | | | 14,663 | | | | | 375,120 | |
| | | | | | | | | | |
Total distributions paid | | | $ | 517,383 | | | | $ | 1,093,741 | |
| | | | | | | | | | |
Provision for Income Taxes.The Fund intends to continue to qualify as a regulated investment companyunder Subchapter M of the Internal Revenue Code of 1986, as amended (the Code). It is the policy of the Fund to comply with the requirements of the Code applicable to regulated investment companies and to distribute substantially all of its net investment company taxable income and net capital gains. Therefore, no provision for federal income taxes is required.
At December 31, 2019, the components of accumulated earnings/losses on a tax basis were as follows:
| | | | |
Net unrealized appreciation on investments and foreign currency translations | | $ | 9,063,576 | |
| | | | |
Total | | $ | 9,063,576 | |
| | | | |
The Fund is permitted to carry capital losses forward for an unlimited period. Capital losses that are carried forward will retain their character as either short term or long term capital losses.
At December 31, 2019, the temporary differences between book basis and tax basis unrealized appreciation were primarily due to deferral of losses from wash sales for tax purposes,mark-to-market adjustments on investments in passive foreign investment companies.
The following summarizes the tax cost of investments and the related net unrealized appreciation at December 31, 2019:
| | | | | | | | | | | | | | | | |
| | | Cost/
(Proceeds) | | | Gross
Unrealized
Appreciation | | | Gross
Unrealized
Depreciation | | | Net
Unrealized
Appreciation | |
Investments | | $ | 44,014,897 | | | $ | 13,681,540 | | | $ | (4,618,495 | ) | | $ | 9,063,045 | |
The Fund is required to evaluate tax positions taken or expected to be taken in the course of preparing the Fund’s tax returns to determine whether the tax positions are“more-likely-than-not” of being sustained by the applicable tax authority. Income tax and related interest and penalties would be recognized by the Fund as tax expense in the Statement of Operations if the tax positions were deemed not to meet themore-likely-than-not threshold. As of December 31, 2019, the Adviser has reviewed all open tax years and concluded that there was no impact to the Fund’s net assets or results of operations. The Fund’s federal and state tax returns for
17
The Gabelli Global Rising Income and Dividend Fund
Notes to Financial Statements (Continued)
the prior three fiscal years remain open, subject to examination. On an ongoing basis, the Adviser will monitor the Fund’s tax positions to determine if adjustments to this conclusion are necessary.
3. Investment Advisory Agreement and Other Transactions.The Fund has entered into an investmentadvisory agreement (the Advisory Agreement) with the Adviser which provides that the Fund will pay the Adviser a fee, computed daily and paid monthly, at the annual rate of 1.00% of the value of its average daily net assets. In accordance with the Advisory Agreement, the Adviser provides a continuous investment program for the Fund’s portfolio, oversees the administration of all aspects of the Fund’s business and affairs, and pays the compensation of all Officers and Directors of the Fund who are affiliated persons of the Adviser.
Through November 30, 2019, the Adviser had agreed to waive and/or to reimburse expenses of the Fund to the extent necessary to maintain the annualized total operating expenses of the Fund (excluding brokerage costs, acquired fund fees and expenses, interest, taxes, and extraordinary expenses) at no more than 2.00%, 2.00%, 2.75%, and 1.00% of the value of the Fund’s average daily net assets for Class AAA, Class A, Class C, and Class I Shares, respectively. Effective December 1, 2019, the Adviser amended its contractual agreement with respect to each share class of the Fund to waive its investment advisory fees and/or to reimburse expenses to the extent necessary to maintain the annualized total operating expenses of the Fund (excluding brokerage costs, acquired fund fees and expenses, interest, taxes, and extraordinary expenses) until at least April 30, 2021, at no more than 0.90% of the value of the Fund’s average daily net assets for each share class of the Fund. During the year ended December 31, 2019, the Adviser reimbursed expenses in the amount of $196,584. In addition, the Fund has agreed, during the two year period following any waiver or reimbursement by the Adviser, to repay such amount to the extent, after giving effect to the repayment, such adjusted annualized total operating expenses of the Fund would not exceed 0.90% of the value of the Fund’s average daily net assets for each share class of the Fund. The agreement is renewable annually. At December 31, 2019, the cumulative amount which the Fund may repay the Adviser, subject to the terms above, is $407,655:
| | | | |
For the year ended December 31, 2018, expiring December 31, 2020 | | $ | 211,071 | |
For the year ended December 31, 2019, expiring December 31, 2021 | | | 196,584 | |
| | | | |
| | $ | 407,655 | |
| | | | |
The Corporation pays each Director who is not considered to be an affiliated person an annual retainer of $6,000 plus $1,000 for each Board meeting attended, and they are reimbursed for any out of pocket expenses incurred in attending meetings. All Board committee members receive $1,000 per meeting attended. The Chairman of the Audit Committee receives an annual fee of $3,000, and the Lead Director receives an annual fee of $2,000. A Director may receive a single meeting fee, allocated among the participating funds, for attending certain meetings held on behalf of multiple funds. Directors who are directors or employees of the Adviser or an affiliated company receive no compensation or expense reimbursement from the Corporation.
4. Distribution Plan.The Fund’s Board has adopted a distribution plan (the Plan) for each class of shares,except for Class I Shares, pursuant to Rule12b-1 under the 1940 Act. Under the Class AAA, Class A, and Class C Share Plans, payments are authorized to G.distributors, LLC (the Distributor), an affiliate of the Adviser, at annual rates of 0.25%, 0.25%, and 1.00%, respectively, of the average daily net assets of those classes, the annual limitations under each Plan. Such payments are accrued daily and paid monthly.
18
The Gabelli Global Rising Income and Dividend Fund
Notes to Financial Statements (Continued)
5. Portfolio Securities.Purchases and sales of securities during the year ended December 31, 2019, otherthan short term securities and U.S. Government obligations, aggregated $2,742,136 and $4,865,910, respectively.
6. Transactions with Affiliates and Other Arrangements.During the year ended December 31, 2019, theFund paid brokerage commissions on security trades of $3,394 to G.research, LLC, an affiliate of the Adviser. Additionally, the Distributor retained a total of $2,755 from investors representing commissions (sales charges and underwriting fees) on sales and redemptions of Fund shares.
The Fund received credits from a designated broker who agreed to pay certain Fund operating expenses. The amount of such expenses paid through this directed brokerage arrangement during this period was $1,536.
The cost of calculating the Fund’s NAV per share is a Fund expense pursuant to the Advisory Agreement. Under thesub-administration agreement with Bank of New York Mellon, the fees paid include the cost of calculating the Fund’s NAV. The Fund reimburses the Adviser for this service. During the year ended December 31, 2019, the Fund accrued $33,750 in accounting fees in the Statement of Operations.
7. Line of Credit.The Fund participates in an unsecured line of credit which expires on March 4, 2020 andmay be renewed annually, of up to $75,000,000 under which it may borrow up to 10% of its net assets from the custodian for temporary borrowing purposes. Borrowings under this arrangement bear interest at a floating rate equal to the higher of the overnight Federal Funds rate plus 125 basis points or the 30 day ICE LIBOR plus 125 basis points in effect on that day. This amount, if any, would be included in “Interest expense” in the Statement of Operations. During the year ended December 31, 2019, there were no borrowings under the line of credit.
8. Capital Stock.The Fund offers four classes of shares – Class AAA Shares, Class A Shares, Class C Shares,and Class I Shares. Class AAA and Class I Shares are offered without a sales charge. Class A Shares are subject to a maximumfront-end sales charge of 5.75%, and Class C Shares are subject to a 1.00% contingent deferred sales charge for one year after purchase.
The Fund imposes a redemption fee of 2.00% on all classes of shares that are redeemed or exchanged on or before the seventh day after the date of a purchase. The redemption fee is deducted from the proceeds otherwise payable to the redeeming shareholders and is retained by the Fund as an increase inpaid-in capital. The redemption fees retained by the Fund during the years ended December 31, 2019 and 2018, if any, can be found in the Statement of Changes in Net Assets under Redemption Fees.
19
The Gabelli Global Rising Income and Dividend Fund
Notes to Financial Statements (Continued)
Transactions in shares of capital stock were as follows:
| | | | | | | | | | | | | | | | | | | | |
| | | Year Ended
December 31, 2019 | | | | | | Year Ended
December 31, 2018 | |
| | Shares | | | Amount | | | | | | Shares | | | Amount | |
Class AAA | | | | | | | | | | | | | | | | | | | | |
Shares sold | | | 55,209 | | | $ | 1,412,343 | | | | | | | | 17,059 | | | $ | 459,298 | |
Shares issued upon reinvestment of distributions | | | 1,071 | | | | 28,072 | | | | | | | | 3,432 | | | | 77,851 | |
Shares redeemed | | | (34,012 | ) | | | (862,290 | ) | | | | | | | (88,188 | ) | | | (2,353,065 | ) |
| | | | | | | | | | | | | | | | | | | | |
Net increase/(decrease) | | | 22,268 | | | $ | 578,125 | | | | | | | | (67,697 | ) | | $ | (1,815,916 | ) |
| | | | | | | | | | | | | | | | | | | | |
Class A | | | | | | | | | | | | | | | | | | | | |
Shares sold | | | 14,445 | | | $ | 363,666 | | | | | | | | 43,934 | | | $ | 1,173,482 | |
Shares issued upon reinvestment of distributions | | | 235 | | | | 6,170 | | | | | | | | 1,015 | | | | 23,051 | |
Shares redeemed | | | (23,320 | ) | | | (581,651 | ) | | | | | | | (24,574 | ) | | | (654,307 | ) |
| | | | | | | | | | | | | | | | | | | | |
Net increase/(decrease) | | | (8,640 | ) | | $ | (211,815 | ) | | | | | | | 20,375 | | | $ | 542,226 | |
| | | | | | | | | | | | | | | | | | | | |
Class C | | | | | | | | | | | | | | | | | | | | |
Shares sold | | | 19,741 | | | $ | 423,760 | | | | | | | | 58,420 | | | $ | 1,332,127 | |
Shares issued upon reinvestment of distributions | | | 133 | | | | 2,922 | | | | | | | | 1,314 | | | | 25,079 | |
Shares redeemed | | | (52,188 | ) | | | (1,089,520 | ) | | | | | | | (36,509 | ) | | | (782,396 | ) |
| | | | | | | | | | | | | | | | | | | | |
Net increase/(decrease) | | | (32,314 | ) | | $ | (662,838 | ) | | | | | | | 23,225 | | | $ | 574,810 | |
| | | | | | | | | | | | | | | | | | | | |
Class I | | | | | | | | | | | | | | | | | | | | |
Shares sold | | | 51,137 | | | $ | 1,300,988 | | | | | | | | 251,351 | | | $ | 6,807,172 | |
Shares issued upon reinvestment of distributions | | | 11,724 | | | | 308,583 | | | | | | | | 42,320 | | | | 963,201 | |
Shares redeemed | | | (69,005 | ) | | | (1,730,834 | ) | | | | | | | (784,393 | ) | | | (21,174,915 | ) |
| | | | | | | | | | | | | | | | | | | | |
Net decrease | | | (6,144 | ) | | $ | (121,263 | ) | | | | | | | (490,722 | ) | | $ | (13,404,542 | ) |
| | | | | | | | | | | | | | | | | | | | |
9. Significant Shareholder.As of December 31, 2019, approximately 77.3% of the Fund was beneficiallyowned by the Adviser and its affiliates, including managed accounts for which the affiliates of the Adviser have voting control but disclaim pecuniary interest.
10. Indemnifications.The Fund enters into contracts that contain a variety of indemnifications. The Fund’smaximum exposure under these arrangements is unknown. However, the Fund has not had prior claims or losses pursuant to these contracts. Management has reviewed the Fund’s existing contracts and expects the risk of loss to be remote.
11. Subsequent Events.Management has evaluated the impact on the Fund of all subsequent events occurringthrough the date the financial statements were issued and has determined that there were no subsequent events requiring recognition or disclosure in the financial statements.
20
The Gabelli Global Rising Income and Dividend Fund
Report of Independent Registered Public Accounting Firm
To the Shareholders of The Gabelli Global Rising Income and Dividend Fund
and the Board of Directors of GAMCO Global Series Funds, Inc.
Opinion on the Financial Statements
We have audited the accompanying statement of assets and liabilities of The Gabelli Global Rising Income and Dividend Fund (the “Fund”) (one of the funds constituting GAMCO Global Series Funds, Inc. (the “Corporation”)), including the schedule of investments, as of December 31, 2019, and the related statement of operations for the year then ended, the statements of changes in net assets for each of the two years in the period then ended, the financial highlights for each of the five years in the period then ended and the related notes (collectively referred to as the “financial statements”). In our opinion, the financial statements present fairly, in all material respects, the financial position of the Fund (one of the funds constituting GAMCO Global Series Funds, Inc.) at December 31, 2019, the results of its operations for the year then ended, the changes in its net assets for each of the two years in the period then ended and its financial highlights for each of the five years in the period then ended, in conformity with U.S. generally accepted accounting principles.
Basis for Opinion
These financial statements are the responsibility of the Corporation’s management. Our responsibility is to express an opinion on the Fund’s financial statements based on our audits. We are a public accounting firm registered with the Public Company Accounting Oversight Board (United States) (“PCAOB”) and are required to be independent with respect to the Corporation in accordance with the U.S. federal securities laws and the applicable rules and regulations of the Securities and Exchange Commission and the PCAOB.
We conducted our audits in accordance with the standards of the PCAOB. Those standards require that we plan and perform the audit to obtain reasonable assurance about whether the financial statements are free of material misstatement, whether due to error or fraud. The Corporation is not required to have, nor were we engaged to perform, an audit of the Corporation’s internal control over financial reporting. As part of our audits we are required to obtain an understanding of internal control over financial reporting but not for the purpose of expressing an opinion on the effectiveness of the Corporation’s internal control over financial reporting. Accordingly, we express no such opinion.
Our audits included performing procedures to assess the risks of material misstatement of the financial statements, whether due to error or fraud, and performing procedures that respond to those risks. Such procedures included examining, on a test basis, evidence regarding the amounts and disclosures in the financial statements. Our procedures included confirmation of securities owned as of December 31, 2019, by correspondence with the custodian. Our audits also included evaluating the accounting principles used and significant estimates made by management, as well as evaluating the overall presentation of the financial statements. We believe that our audits provide a reasonable basis for our opinion.

We have served as the auditor of one or more Gabelli/GAMCO Funds investment companies since 1992.
Philadelphia, Pennsylvania
February 27, 2020
21
The Gabelli Global Rising Income and Dividend Fund
Board Consideration andRe-Approval of Investment Advisory Agreement (Unaudited)
During the six months ended December 31, 2019, the Board of Directors of the Corporation approved the continuation of the investment advisory agreement with the Adviser for the Fund on the basis of the recommendation by the directors (the Independent Board Members) who are not interested persons of the Fund. The following paragraphs summarize the material information and factors considered by the Independent Board Members as well as their conclusions relative to such factors.
Nature, Extent, and Quality of Services.The Independent Board Members considered information regardingthe portfolio managers, the depth of the analyst pool available to the Adviser and the Fund’s portfolio managers, the scope of supervisory, administrative, shareholder and other services supervised or provided by the Adviser and the absence of significant service problems reported to the Board. The Independent Board Members noted the experience, length of service and reputation of the Fund’s portfolio managers.
Investment Performance.The Independent Board Members reviewed the short, medium, and long term performanceof the Fund (as of September 30, 2019) against a peer group of seven other comparable funds prepared by the Adviser (the Adviser Peer Group), and against a peer group prepared by Broadridge (the Broadridge Performance Peer Group) consisting of all retail and institutional global equity income funds, regardless of asset size or primary channel of distribution, as represented by the Lipper Global Equity Income Fund Index. The Independent Board Members noted that the Fund’s performance was in the fourth (lowest) quartile for the one, three and five year periods, as measured against the Adviser Peer Group. Against the Broadridge Performance Peer Group, the Independent Board Members noted that the Fund’s performance was in the fifth quintile for the one, three, and ten year periods and in the fourth quintile for the five year period. The Independent Board Members discussed the peer groups in relation to the Fund’s shift in strategy several years ago, and also noted the resulting limited utility of the five year peer performance comparison.
Profitability.The Independent Board Members reviewed summary data regarding the profitability of the Fundto the Adviser both with a pro rata administrative overhead charge and with a stand alone administrative charge and noted the effect of the expense limitation agreement. The Independent Board Members also noted that a portion of the Fund’s portfolio transactions were executed by an affiliated broker of the Adviser and that another affiliated broker of the Adviser received distribution fees and minor amounts of sales commissions.
Economies of Scale.The Independent Board Members discussed the major elements of the Adviser’s coststructure, the relationship of those elements to potential economies of scale and reviewed data provided by the Adviser.
Sharing of Economies of Scale.The Independent Board Members noted that the investment managementfee schedule for the Fund does not take into account any potential economies of scale that may develop.
Service and Cost Comparisons.The Independent Board Members compared the expense ratios of the investmentmanagement fee, other expenses and total expenses of the Fund to similar expense ratios of the Adviser Peer Group and a peer group of seven other global equity income funds selected by Broadridge (the Broadridge Expense Peer Group), and noted that the Adviser’s management fee includes substantially all administrative services of the Fund as well as investment advisory services. The Independent Board Members noted the effect of the expense limitation agreement in place for the Fund. The Board Members noted that the Fund’s total expense ratio was the highest for the Adviser Peer Group and for the Broadridge Expense Peer Group and that, the Fund’s size was significantly lower than the average of the Adviser Peer Group, and lower than the
22
The Gabelli Global Rising Income and Dividend Fund
Board Consideration and Re-Approval of Investment Advisory Agreement (Unaudited) (Continued)
average of the Broadridge Expense Peer Group. The Independent Board Members also noted that the advisory fee structure was the same as that in effect for most of the Gabelli funds. The Independent Board Members were presented with, but did not consider to be material to their decision, various information comparing the advisory fee to the fee for other types of accounts managed by the Adviser.
Conclusions.The Independent Board Members concluded that the Fund enjoyed highly experienced portfoliomanagement services, good ancillary services and did not have a favorable performance record. The Independent Board Members also concluded that the Fund’s expense ratios and profitability to the Adviser were reasonable, and that economies of scale were not a significant factor in their thinking at this time. The Board Members did not view the potential profitability of ancillary services as material to their decision. On the basis of the foregoing and without assigning particular weight to any single conclusion, the Independent Board Members determined to recommend continuation of the investment advisory agreement to the full Board.
Based on a consideration of all these factors in their totality, the Board Members, including all of the Independent Board Members, determined that the Fund’s advisory fee was fair and reasonable with respect to the quality of services provided and in light of the other factors described above that the Board deemed relevant. Accordingly, the Board Members determined to approve the continuation of the Fund’s Advisory Agreement. The Board Members based their decision on evaluations of all these factors as a whole and did not consider any one factor asall-important or controlling.
23
The Gabelli Global Rising Income and Dividend Fund
Additional Fund Information (Unaudited)
The business and affairs of the Fund are managed under the direction of the Corporation’s Board of Directors. Information pertaining to the Directors and officers of the Fund is set forth below. The Corporation’s Statement of Additional Information includes additional information about the Fund’s Directors and is available without charge, upon request, by calling800-GABELLI(800-422-3554) or by writing to The Gabelli Global Rising Income and Dividend Fund at One Corporate Center, Rye, NY 10580-1422.
| | | | | | | | |
Name, Position(s) Address1 and Age | | Term of Office
and Length of
Time Served2 | | Number of Funds
in Fund Complex
Overseen by Director | | Principal Occupation(s)
During Past Five Years | | Other Directorships Held by Director3 |
| | | | |
INTERESTED DIRECTORS4: | | | | | | | | |
| | | | |
Mario J. Gabelli, CFA Director and Chief Investment Officer Age: 77 | | Since 1993 | | 33 | | Chairman, Chief Executive Officer, and Chief Investment Officer– Value Portfolios of GAMCO Investors, Inc. and Chief Investment Officer– Value Portfolios of Gabelli Funds, LLC and GAMCO Asset Management Inc.; Director/ Trustee or Chief Investment Officer of other registered investment companies within the Gabelli/GAMCO Fund Complex; Chief Executive Officer of GGCP, Inc.; Executive Chairman of Associated Capital Group, Inc. | | Director of Morgan Group Holdings, Inc. (holding company) (2001-2019); Chairman of the Board and Chief Executive Officer of LICT Corp. (multimedia and communication services company); Director of CIBL, Inc. (broadcasting and wireless communications); Director of ICTC Group Inc. (communications)(2013-2018) |
| | | | |
John D. Gabelli Director Age: 75 | | Since 1993 | | 12 | | Senior Vice President of G.research, LLC | | — |
| | | | |
INDEPENDENT DIRECTORS5: | | | | | | | | |
| | | | |
E. Val Cerutti Director Age: 80 | | Since 2001 | | 7 | | Chief Executive Officer of Cerutti Consultants, Inc. | | Director of The LGL Group, Inc. (diversified manufacturing)(1990-2009) |
| | | | |
Anthony J. Colavita6 Director Age: 84 | | Since 1993 | | 20 | | President of the law firm of Anthony J. Colavita, P.C. | | — |
| | | | |
Werner J. Roeder Director Age: 79 | | Since 1993 | | 21 | | Retired physician; Former Vice President of Medical Affairs (Medical Director) of New York Presbyterian/Lawrence Hospital(1999-2014) | | — |
| | | | |
Anthonie C. van Ekris6 Director Age: 85 | | Since 1993 | | 23 | | Chairman and Chief Executive Officer of BALMAC International, Inc. (global import/ export company) | | — |
| | | | |
Salvatore J. Zizza7 Director Age: 74 | | Since 2004 | | 31 | | President of Zizza & Associates Corp. (private holding company); President of Bergen Cove Realty Inc.; Chairman of Harbor Diversified, Inc. (pharmaceuticals) (2009-2018); Chairman of BAM (semiconductor and aerospace manufacturing) (2000-2018); Chairman of Metropolitan Paper Recycling Inc. (recycling)(2005-2014) | | Director and Chairman of Trans- Lux Corporation (business services); Director and Chairman of Harbor Diversified Inc. (pharmaceuticals) (2009-2018) |
24
The Gabelli Global Rising Income and Dividend Fund
Additional Fund Information (Continued) (Unaudited)
| | | | | | |
Name, Position(s)
Address1
and Age | | Term of Office
and Length of
Time Served2 | | | | Principal Occupation(s)
During Past Five Years |
| | | |
| OFFICERS: | | | | | | |
| | | |
Bruce N. Alpert President Age: 68 | | Since 1993 | | | | Executive Vice President and Chief Operating Officer of Gabelli Funds, LLC since 1988; Officer of registered investment companies within the Gabelli/GAMCO Fund Complex; Senior Vice President of GAMCO Investors, Inc. since 2008 |
| | | |
John C. Ball Treasurer Age: 43 | | Since 2017 | | | | Treasurer of funds within the Gabelli/GAMCO Fund Complex since 2017; Vice President and Assistant Treasurer of AMG Funds, 2014-2017; Vice President of State Street Corporation, 2007-2014 |
| | | |
Agnes Mullady Vice President Age: 61 | | Since 2006 | | | | Officer of registered investment companies within the Gabelli/GAMCO Fund Complex since 2006; President and Chief Operating Officer of the Fund Division of Gabelli Funds, LLC since 2015; Chief Executive Officer of G.distributors, LLC since 2010; Senior Vice President of GAMCO Investors, Inc. since 2009; Vice President of Gabelli Funds, LLC since 2007; Executive Vice President of Associated Capital Group, Inc. since 2016 |
| | | |
Andrea R. Mango Secretary Age: 47 | | Since 2013 | | | | Vice President of GAMCO Investors, Inc. since 2016; Counsel of Gabelli Funds, LLC since 2013; Secretary of registered investment companies within the Gabelli/GAMCO Fund Complex since 2013; Vice President ofclosed-end funds within the Gabelli/GAMCO Fund Complex since 2014 |
| | | |
Richard J. Walz Chief Compliance Officer Age: 60 | | Since 2013 | | | | Chief Compliance Officer of registered investment companies within the Gabelli/GAMCO Fund Complex since 2013 |
| 1 | Address: One Corporate Center, Rye, NY 10580-1422, unless otherwise noted. |
| 2 | Each Director will hold office for an indefinite term until the earliest of (i) the next meeting of shareholders, if any, called for the purpose of considering the election orre-election of such Director and until the election and qualification of his or her successor, if any, elected at such meeting, or (ii) the date a Director resigns or retires, or a Director is removed by the Board of Directors or shareholders, in accordance with the Corporation’sBy-Laws and Articles of Incorporation. For officers, includes time served in prior officer positions with the Fund. Each officer will hold office for an indefinite term until the date he or she resigns or retires or until his or her successor is elected and qualified. |
| 3 | This column includes only directorships of companies required to report to the SEC under the Securities Exchange Act of 1934, as amended, i.e., public companies, or other investment companies registered under the 1940 Act. |
| 4 | “Interested person” of the Corporation as defined in the 1940 Act. Messrs. Mario J. Gabelli and John D. Gabelli, who are brothers, are each considered an “interested person” because of their affiliation with Gabelli Funds, LLC which acts as the Corporation’s investment adviser. |
| 5 | Directors who are not interested persons are considered “Independent” Directors. |
| 6 | Mr. Colavita’s son, Anthony S. Colavita, serves as a director of other funds in the Gabelli/GAMCO Fund Complex. Mr. van Ekris is an independent director of Gabelli International Ltd., Gabelli Fund LDC, GAMA Capital Opportunities Master Ltd., and GAMCO International SICAV, all of which may be deemed to be controlled by Mario J. Gabelli and/or affiliates and, in that event, would be deemed to be under common control with the Fund’s Adviser. |
| 7 | Mr. Zizza is an independent director of Gabelli International Ltd., which may be deemed to be controlled by Mario J. Gabelli and/or affiliates and in that event would be deemed to be under common control with the Fund’s Adviser. On September 9, 2015, Mr. Zizza entered into a settlement with the SEC to resolve an inquiry relating to an alleged violation regarding the making of false statements or omissions to the accountants of a company concerning a related party transaction. The company in question is not an affiliate of, nor has any connection to, the Fund. Under the terms of the settlement, Mr. Zizza, without admitting or denying the SEC’s findings and allegation, paid $150,000 and agreed to cease and desist committing or causing any future violations of Rule13b2-2 of the Securities Exchange Act of 1934, as amended. The Board has discussed this matter and has determined that it does not disqualify Mr. Zizza from serving as an Independent Director. |
25
| | | | |
| | Gabelli/GAMCO Funds and Your Personal Privacy Who are we? The Gabelli/GAMCO Funds are investment companies registered with the Securities and Exchange Commission under the Investment Company Act of 1940. We are managed by Gabelli Funds, LLC, which is affiliated with GAMCO Investors, Inc., a publicly held company with subsidiaries and affiliates that provide investment advisory services for a variety of clients. What kind ofnon-public information do we collect about you if you become a fund shareholder? If you apply to open an account directly with us, you will be giving us somenon-public information about yourself. Thenon-public information we collect about you is: ● Information you give us on your application form.This could include your name, address, telephonenumber, social security number, bank account number, and other information. ● Information about your transactions with us, any transactions with our affiliates, and transactions with the entities we hire to provide services to you.This would include information about the shares thatyou buy or redeem. If we hire someone else to provide services — like a transfer agent — we will also have information about the transactions that you conduct through them. What information do we disclose and to whom do we disclose it? We do not disclose anynon-public personal information about our customers or former customers to anyone other than our affiliates, our service providers who need to know such information, and as otherwise permitted by law. If you want to find out what the law permits, you can read the privacy rules adopted by the Securities and Exchange Commission. They are in volume 17 of the Code of Federal Regulations, Part 248. The Commission often posts information about its regulations on its website, www.sec.gov. What do we do to protect your personal information? We restrict access tonon-public personal information about you to the people who need to know that information in order to provide services to you or the fund and to ensure that we are complying with the laws governing the securities business. We maintain physical, electronic, and procedural safeguards to keep your personal information confidential. | | |
THE GABELLI GLOBAL RISING INCOME AND DIVIDEND FUND
One Corporate Center
Rye, NY 10580-1422
Portfolio Manager Biography
Mario J. Gabelli, CFA,is Chairman, Chief Executive Officer, and Chief Investment Officer - Value Portfolios ofGAMCO Investors, Inc. that he founded in 1977, and Chief Investment Officer - Value Portfolios of Gabelli Funds, LLC and GAMCO Asset Management Inc. He is also Executive Chairman of Associated Capital Group, Inc. Mr. Gabelli is a summa cum laude graduate of Fordham University and holds an MBA degree from Columbia Business School and Honorary Doctorates from Fordham University and Roger Williams University.
2019 TAX NOTICE TO SHAREHOLDERS(Unaudited)
For the year ended December 31, 2019, the Fund paid to shareholders ordinary income distributions (comprised of net investment income) totaling $0.1484, $0.1367, $0.0641, and $0.3100 per share for Class AAA, Class A, Class C, and Class I Shares, respectively, and long term capital gains totaling $14,663, or the maximum allowable. For the year ended December 31, 2019, 59.85% of the ordinary income distribution qualifies for the dividends received deduction available to corporations. The Fund designates 100% of the ordinary income distribution as qualified dividend income pursuant to the Jobs and Growth Tax Relief Reconciliation Act of 2003. The Fund designates 1.05% of the ordinary income distribution as qualified interest income pursuant to the Tax Relief, Unemployment Reauthorization, and Job Creation Act of 2010. Also for the year 2019, the Fund passed through foreign tax credits of $0.0284, $0.0284, $0.0284, and $0.0284 per share to Class AAA, Class A, Class C, and Class I Shares, respectively.
U.S. Government Income:
The percentage of the ordinary income distribution paid by the Fund during the year ended December 31, 2019 which was derived from U.S. Treasury securities was 0.70%. Such income is exempt from state and local tax in all states. However, many states, including New York and California, allow a tax exemption for a portion of the income earned only if a mutual fund has invested at least 50% of its assets at the end of each quarter of the Fund’s fiscal year in U.S. Government securities. The Fund did not meet this strict requirement in 2019. The percentage of U.S. Government securities held as of December 31, 2019 was 2.93%. Due to the diversity in state and local tax law, it is recommended that you consult your personal tax adviser as to the applicability of the information provided to your specific situation.
All designations are based on financial information available as of the date of this annual report and, accordingly, are subject to change. For each item, it is the intention of the Fund to designate the maximum amount permitted under the Internal Revenue Code and the regulations thereunder.
We have separated the portfolio manager’s commentary from the financial statements and investment portfolio due to corporate governance regulations stipulated by the Sarbanes-Oxley Act of 2002. We have done this to ensure that the content of the portfolio manager’s commentary is unrestricted. Both the commentary and the financial statements, including the portfolio of investments, will be available on our website at www.gabelli.com.
| | |
|
| GAMCO Global Series Funds, Inc. |
|
THE GABELLI GLOBAL RISING INCOME |
| AND DIVIDEND FUND |
|
| One Corporate Center |
| Rye, New York 10580-1422 |
|
| t 800-GABELLI(800-422-3554) |
| f 914-921-5118 |
| e info@gabelli.com |
| GABELLI.com |
|
Net Asset Value per share available daily by calling800-GABELLI after 7:00 P.M. |
BOARD OF DIRECTORS Mario J. Gabelli, CFA Chairman and Chief Executive Officer, GAMCO Investors, Inc. Executive Chairman, Associated Capital Group, Inc. E. Val Cerutti Chief Executive Officer, Cerutti Consultants, Inc. Anthony J. Colavita President, Anthony J. Colavita, P.C. John D. Gabelli Senior Vice President, G.research, LLC Werner J. Roeder Former Medical Director, Lawrence Hospital Anthonie C. van Ekris Chairman, BALMAC International, Inc. Salvatore J. Zizza Chairman, Zizza & Associates Corp. | | OFFICERS Bruce N. Alpert President John C. Ball Treasurer Agnes Mullady Vice President Andrea R. Mango Secretary Richard J. Walz Chief Compliance Officer DISTRIBUTOR G.distributors, LLC CUSTODIAN State Street Bank and Trust Company TRANSFER AGENT AND DIVIDEND DISBURSING AGENT DST Asset Manager Solutions, Inc. LEGAL COUNSEL Skadden, Arps, Slate, Meagher & Flom LLP |
This report is submitted for the general information of the shareholders of The Gabelli Global Rising Income and Dividend Fund. It is not authorized for distribution to prospective investors unless preceded or accompanied by an effective prospectus. |
|
|
|
|
|
|
|
|
|
|
| | | |
GAB441Q419AR | | |
The Gabelli Global Mini Mites Fund
Annual Report — December 31, 2019
To Our Shareholders,
For the year ended December 31, 2019, the net asset value (NAV) per Class AAA Share of The Gabelli Global Mini Mites Fund increased 11.5% compared with an increase of 26.1% for the S&P Developed Small Cap Index. Other classes of shares are available. See page 2 for performance information for all classes.
Enclosed are the financial statements, including the schedule of investments, as of December 31, 2019.
Performance Discussion (Unaudited)
The Fund, a series of GAMCO Global Series Funds, Inc. commenced investment operations on October 1, 2018. The Fund is anon-diversified open end management investment company whose investment objective is to provide investors with long term capital appreciation by investing primarily in micro-capitalization equity securities.
The Fund’s investment strategy is to invest in common stocks of smaller companies that have a market capitalization (defined as shares outstanding times current market price) of $250 million or less at the time of the Fund’s initial investment. These companies are calledmicro-cap companies. As a “global” fund, the Fund invests in securities of issuers located in at least three countries and at least 40% of its net assets are invested in securities of non U.S. issuers.
The markets made it look easy in 2019. Stocks, bonds, oil and gold, all returned double-digits. Stocks advanced across market caps, geographies and sectors. The MSCI All Country World Index advanced +27%. The U.S. market outperformed developed international markets, which outperformed emerging markets. Large cap outperformed small cap. Growth outperformed value. Technology was a standout in 2019. The S&P 500 Information Technology sector gained +48%, a full 17 percentage points better than the next best sector, being Communication Services, which, surprise, surprise, is mostly technology stocks.
Selected holdings that contributed positively to performance in 2019 were: Communications Systems Inc. (3.6% of net assets as of December 31, 2019) provides physical connectivity infrastructure and services for global deployments of broadband networks. Revenues increased due to strong pipelines from federal and commercial clients; Avid Technology Inc. (3.3%) specializes in audio and video systems, video editing software, audio editing software, management and distribution services. Strong sales growth in subscription software and sequentially higher maintenance revenue increased performance; and Astec Industries, Inc. (1.9%) which manufactures specialized equipment for asphalt road building, aggregate processing, oil, gas and water well drilling and concrete production. The company is actively aligning the business to meet the current demand in addition; the international strategy will help in accelerating revenue growth.
Beginning on January 1, 2021, as permitted by regulations adopted by the Securities and Exchange Commission, paper copies of the Fund’s annual and semiannual shareholder reports will no longer be sent by mail, unless you specifically request paper copies of the reports. Instead, the reports will be made available on the Fund’s website (www.gabelli.com), and you will be notified by mail each time a report is posted and provided with a website link to access the report. If you already elected to receive shareholder reports electronically, you will not be affected by this change and you need not take any action. To elect to receive all future reports on paper free of charge, please contact your financial intermediary, or, if you invest directly with the Fund, you may call800-422-3554 or send an email request to info@gabelli.com.
Some of our weaker performing holdings during the year were: IntriCon Corp. (3.1%) is a designer, developer, manufacturer and distributor of miniature and micro miniature body worn devices. Added operating expenses and lower revenues negatively impacted profitability; Farmer Brothers Co. (3.0%) the company specializes in the manufacture and distribution of coffee, tea, and other food service items. Net sales and revenues both missed their respective consensus estimates; and Twin Disc Inc. (1.5%) designs, manufactures and distributes power transmission equipment for a wide range of applications. Continued operational challenges associated with manufacturing and supply chain issues, compounded by weak oil and gas environment, significantly impacted profitability.
Thank you for your investment in The Gabelli Global Mini Mites Fund.
We appreciate your confidence and trust.
Comparative Results
| | | | |
| Average Annual Returns through December 31, 2019 (a) (Unaudited) |
| | | | | | | | |
| | | 1 Year | | | Since
Inception
(10/1/18) | |
Class AAA (GAMNX) | | | 11.49% | | | | (3.05)% | |
S&P Developed SmallCap Index | | | 26.14 | | | | 2.98 | |
Class A (GMNAX) | | | 11.47 | | | | (3.07) | |
With sales charge (b) | | | 5.06 | | | | (7.56) | |
Class C (GMNCX) | | | 10.83 | | | | (3.65) | |
With contingent deferred sales charge (c) | | | 9.83 | | | | (3.65) | |
Class I (GGMMX ) | | | 11.84 | | | | (2.85) | |
In the current prospectuses dated April 30, 2019, as amended by the supplement dated December 3, 2019, the gross expense ratios for Class AAA, A, C, and I Shares are 44.14%, 44.14%, 44.89%, and 43.89%, respectively, and the net expense ratios for all share classes after contractual reimbursements by Gabelli Funds, LLC, (the Adviser) is 0.90%. See page 10 for the expense ratios for the year ended December 31, 2019. The contractual reimbursements are in effect through April 30, 2021. Class AAA and Class I Shares do not have a sales charge. The maximum sales charge for Class A Shares and Class C Shares is 5.75% and 1.00%, respectively.
| | (a) | Returns represent past performance and do not guarantee future results. Total returns and average annual returns reflect changes in share price, reinvestment of distributions, and are net of expenses. Investment returns and the principal value of an investment will fluctuate. When shares are redeemed, they may be worth more or less than their original cost. Current performance may be lower or higher than the performance data presented. Visit www.gabelli.com for performance information as of the most recent month end. Returns would have been lower had the Adviser not reimbursed certain expenses of the Fund. The Fund imposes a 2% redemption fee on shares sold or exchanged within seven days of purchase. Investors should carefully consider the investment objectives, risks, charges, and expenses of the Fund before investing. The prospectuses contain information about these and other matters and should be read carefully before investing. To obtain a prospectus, please visit our website at www.gabelli.com.Investing in foreign securities involves risks not ordinarily associated with investments in domestic issues, including currencyfluctuation, economic, and political risks. The S&P Developed SmallCap Index is a float adjusted market capitalization weighted index designed to measure the equity market performance of small capitalization companies located in developed markets. The index is composed of companies within the bottom 15% of the cumulative market capitalization in developed markets. The index covers all publicly listed equities with float adjusted market values of U.S. $100 million or more and annual dollar value traded of at least U.S. $50 million in all included countries. You cannot invest directly in an index. | |
| | (b) | Performance results include the effect of the maximum 5.75% sales charge at the beginning of the period. |
| | (c) | Assuming payment of the 1% maximum contingent deferred sales charge imposed on redemptions made within the period of purchase. |
2
COMPARISON OF CHANGE IN VALUE OF A $10,000 INVESTMENT IN
THE GABELLI GLOBAL MINI MITES FUND (CLASS AAA SHARES)
AND S&P DEVELOPED SMALLCAP INDEX (Unaudited)
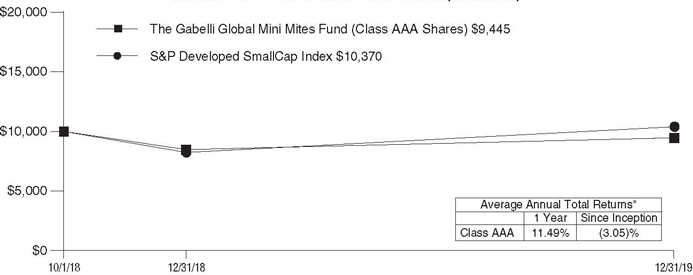
| * | Past performance is not predictive of future results. The performance tables and graph do not reflect the deduction of taxes that a shareholder would pay on Fund distributions or the redemption of Fund shares. |
3
The Gabelli Global Mini Mites Fund
Disclosure of Fund Expenses (Unaudited)
For the Six Month Period from July 1, 2019 through December 31, 2019 | Expense Table |
We believe it is important for you to understand the impact of fees and expenses regarding your investment. All mutual funds have operating expenses. As a shareholder of a fund, you incur ongoing costs, which include costs for portfolio management, administrative services, and shareholder reports (like this one), among others. Operating expenses, which are deducted from a fund’s gross income, directly reduce the investment return of a fund. When a fund’s expenses are expressed as a percentage of its average net assets, this figure is known as the expense ratio. The following examples are intended to help you understand the ongoing costs (in dollars) of investing in your Fund and to compare these costs with those of other mutual funds. The examples are based on an investment of $1,000 made at the beginning of the period shown and held for the entire period.
The Expense Table below illustrates your Fund’s costs in two ways:
Actual Fund Return:This section provides informationabout actual account values and actual expenses. You may use this section to help you to estimate the actual expenses that you paid over the period after any fee waivers and expense reimbursements. The “Ending Account Value” shown is derived from the Fund’sactualreturn during the past period, and the “ExpensesPaid During Period” shows the dollar amount that would have been paid by an investor who started with $1,000 in the Fund. You may use this information, together with the amount you invested, to estimate the expenses that you paid over the period.
To do so, simply divide your account value by $1,000 (for example, an $8,600 account value divided by $1,000 = 8.6), then multiply the result by the number given for your Fund under the heading “Expenses Paid During Period” to estimate the expenses you paid during this period.
Hypothetical 5% Return:This section providesinformation about hypothetical account values and hypothetical expenses based on the Fund’s actual expense
ratio. It assumes a hypothetical annualized return of 5% before expenses during the period shown. In this case – because the hypothetical return used isnot the Fund’s actual return – the results do not apply to your investment and you cannot use the hypothetical account value and expense to estimate the actual ending account balance or expenses you paid for the period. This example is useful in making comparisons of the ongoing costs of investing in the Fund and other funds. To do so, compare this 5% hypothetical example with the 5% hypothetical examples that appear in shareholder reports of other funds.
Please note that the expenses shown in the table are meant to highlight your ongoing costs only and do not reflect any transactional costs such as sales charges (loads), redemption fees, or exchange fees, if any, which are described in the Prospectus. If these costs were applied to your account, your costs would be higher. Therefore, the 5% hypothetical return is useful in comparing ongoing costs only, and will not help you determine the relative total costs of owning different funds. The “Annualized Expense Ratio” represents the actual expenses for the last six months and may be different from the expense ratio in the Financial Highlights which is for the year ended December 31, 2019.
| | | | | | | | |
| | | Beginning
Account Value
07/01/19 | | Ending
Account Value
12/31/19 | | Annualized
Expense
Ratio | | Expenses
Paid During
Period* |
The Gabelli Global Mini Mites | | | | | | |
Actual Fund Return | | | | | | |
Class AAA | | $1,000.00 | | $1,035.60 | | 1.21% | | $6.21 |
Class A | | $1,000.00 | | $1,036.50 | | 1.21% | | $6.21 |
Class C | | $1,000.00 | | $1,032.80 | | 1.83% | | $9.38 |
Class I | | $1,000.00 | | $1,037.60 | | 1.00% | | $5.14 |
Hypothetical 5% Return | | | | | | |
Class AAA | | $1,000.00 | | $1,019.11 | | 1.21% | | $6.16 |
Class A | | $1,000.00 | | $1,019.11 | | 1.21% | | $6.16 |
Class C | | $1,000.00 | | $1,015.98 | | 1.83% | | $9.30 |
Class I | | $1,000.00 | | $1,020.16 | | 1.00% | | $5.09 |
| * | Expenses are equal to the Fund’s annualized expense ratio for the last six months multiplied by the average account value over the period, multiplied by the number of days in the most recent fiscal half year (184 days), then divided by 365. |
4
Summary of Portfolio Holdings (Unaudited)
The following table presents portfolio holdings as a percent of net assets as of December 31, 2019:
The Gabelli Global Mini Mites Fund
| | | | |
Long Positions | | | | |
Telecommunications | | | 10.8 | % |
Hotels and Gaming | | | 9.0 | % |
Health Care | | | 8.7 | % |
Computer Software and Services | | | 8.6 | % |
Automotive: Parts and Accessories | | | 8.0 | % |
Business Services | | | 5.6 | % |
Machinery | | | 5.6 | % |
Diversified Industrial | | | 5.3 | % |
Paper and Forest Products | | | 4.8 | % |
Aerospace and Defense | | | 4.7 | % |
Food and Beverage | | | 3.9 | % |
Entertainment | | | 3.8 | % |
| | | | |
Specialty Chemicals | | | 2.8 | % |
Energy and Utilities | | | 2.7 | % |
Real Estate | | | 2.5 | % |
Equipment and Supplies | | | 2.1 | % |
Consumer Products | | | 1.8 | % |
Broadcasting | | | 1.7 | % |
Building and Construction | | | 1.7 | % |
Financials | | | 0.8 | % |
Financial Services | | | 0.7 | % |
Retail | | | 0.2 | % |
Other Assets and Liabilities (Net) | | | 4.2 | % |
| | | | |
| | | 100.0 | % |
| | | | |
The Fund files a complete schedule of portfolio holdings with the Securities and Exchange Commission (the SEC) for the first and third quarters of each fiscal year on FormN-PORT. Shareholders may obtain this information at www.gabelli.com or by calling the Fund at800-GABELLI(800-422-3554). The Fund’s FormN-PORT is available on the SEC’s website at www.sec.gov and may also be reviewed and copied at the SEC’s Public Reference Room in Washington, DC. Information on the operation of the Public Reference Room may be obtained by calling800-SEC-0330.
Proxy Voting
The Fund files FormN-PX with its complete proxy voting record for the twelve months ended June 30, no later than August 31 of each year. A description of the Fund’s proxy voting policies, procedures, and how the Fund voted proxies relating to portfolio securities is available without charge, upon request, by (i) calling800-GABELLI(800-422-3554); (ii) writing to The Gabelli Funds at One Corporate Center, Rye, NY 10580-1422; or (iii) visiting the SEC’s website at www.sec.gov.pgss
5
The Gabelli Global Mini Mites Fund
Schedule of Investments — December 31, 2019
| | | | | | | | | | | | |
Shares | | | | | Cost | | | Market
Value | |
| | | |
| | | | COMMON STOCKS — 95.8% | | | | | | | | |
| | | | Aerospace and Defense — 4.7% | | | | | | | | |
| | 2,500 | | | Avio SpA | | $ | 33,379 | | | $ | 38,867 | |
| | 17,500 | | | Cobham plc | | | 36,490 | | | | 38,074 | |
| | 800 | | | CPI Aerostructures Inc.† | | | 6,251 | | | | 5,384 | |
| | | | | | | 76,120 | | | | 82,325 | |
| | |
| | | | Automotive: Parts and Accessories — 8.0% | | | | | |
| | 63,000 | | | Opus Group AB | | | 51,180 | | | | 56,500 | |
| | 400 | | | Smart Eye AB† | | | 4,227 | | | | 5,039 | |
| | 1,200 | | | Strattec Security Corp. | | | 36,941 | | | | 26,652 | |
| | 5,700 | | | Uni-Select Inc. | | | 59,938 | | | | 49,997 | |
| | | | | | | 152,286 | | | | 138,188 | |
| | | |
| | | | Broadcasting — 1.7% | | | | | | | | |
| | 3,000 | | | Beasley Broadcast Group Inc., Cl. A | | | 12,406 | | | | 9,270 | |
| | 5,000 | | | Corus Entertainment Inc., Cl. B | | | 24,179 | | | | 20,484 | |
| | | | | | | 36,585 | | | | 29,754 | |
| | |
| | | | Building and Construction — 1.7% | | | | | |
| | 4,000 | | | Armstrong Flooring Inc.† | | | 16,717 | | | | 17,080 | |
| | 1,000 | | | Gencor Industries Inc.† | | | 12,340 | | | | 11,670 | |
| | | | | | | 29,057 | | | | 28,750 | |
| | | |
| | | | Business Services — 5.6% | | | | | | | | |
| | 400 | | | Data Respons ASA | | | 2,143 | | | | 2,182 | |
| | 7,000 | | | Diebold Nixdorf Inc.† | | | 48,929 | | | | 73,920 | |
| | 7,000 | | | Internap Corp.† | | | 23,068 | | | | 7,700 | |
| | 2,200 | | | MoneyGram International Inc.† | | | 5,551 | | | | 4,620 | |
| | 7,000 | | | Trans-Lux Corp.† | | | 4,174 | | | | 2,275 | |
| | 3,000 | | | VersaPay Corp.† | | | 6,111 | | | | 6,192 | |
| | | | | | | 89,976 | | | | 96,889 | |
| | |
| | | | Computer Software and Services — 8.6% | | | | | |
| | 5,000 | | | Alithya Group Inc., Cl. A† | | | 17,069 | | | | 14,100 | |
| | 1,200 | | | Asetek A/S† | | | 4,635 | | | | 4,237 | |
| | 6,700 | | | Avid Technology Inc.† | | | 33,196 | | | | 57,486 | |
| | 5,000 | | | GTY Technology Holdings Inc.† | | | 32,349 | | | | 29,450 | |
| | 70,000 | | | Pacific Online Ltd. | | | 14,777 | | | | 15,631 | |
| | 8,500 | | | RumbleON Inc., Cl. B† | | | 36,947 | | | | 7,018 | |
| | 3,000 | | | Sophos Group plc | | | 22,211 | | | | 22,174 | |
| | | | | | | 161,184 | | | | 150,096 | |
| | | |
| | | | Consumer Products — 1.8% | | | | | | | | |
| | 1,200 | | | Lifetime Brands Inc. | | | 11,945 | | | | 8,340 | |
| | 500 | | | Nobility Homes Inc. | | | 11,100 | | | | 12,000 | |
| | 71,000 | | | Playmates Holdings Ltd. | | | 10,621 | | | | 10,934 | |
| | | | | | | 33,666 | | | | 31,274 | |
| | | |
| | | | Diversified Industrial — 5.3% | | | | | | | | |
| | 7,000 | | | Ampco-Pittsburgh Corp.† | | | 24,660 | | | | 21,070 | |
| | 2,000 | | | Core Molding Technologies Inc.† | | | 10,245 | | | | 6,500 | |
| | 31,000 | | | Fluence Corp. Ltd.† | | | 7,941 | | | | 9,354 | |
| | 268 | | | Graham Corp. | | | 5,291 | | | | 5,864 | |
| | 300 | | | Lawson Products Inc.† | | | 9,486 | | | | 15,630 | |
| | | | | | | | | | | | |
Shares | | | | | Cost | | | Market
Value | |
| | | |
| | 2,000 | | | Myers Industries Inc. | | $ | 33,244 | | | $ | 33,360 | |
| | | | | | | 90,867 | | | | 91,778 | |
| | | |
| | | | Energy and Utilities — 2.7% | | | | | | | | |
| | 2,000 | | | KLX Energy Services Holdings Inc.† | | | 10,991 | | | | 12,880 | |
| | 3,600 | | | Mitcham Industries Inc.† | | | 13,914 | | | | 10,332 | |
| | 5,000 | | | PNE AG | | | 22,128 | | | | 22,546 | |
| | 62 | | | Weatherford International plc† | | | 6,593 | | | | 1,733 | |
| | | | | | | 53,626 | | | | 47,491 | |
| | | |
| | | | Entertainment — 3.8% | | | | | | | | |
| | 1,500 | | | Cineplex Inc. | | | 38,782 | | | | 39,101 | |
| | 2,018 | | | Reading International Inc., Cl. A† | | | 28,194 | | | | 22,581 | |
| | 100 | | | Xilam Animation SA† | | | 4,332 | | | | 4,980 | |
| | | | | | | 71,308 | | | | 66,662 | |
| | | |
| | | | Equipment and Supplies — 2.1% | | | | | | | | |
| | 1,200 | | | The Eastern Co. | | | 30,931 | | | | 36,636 | |
| | | |
| | | | Financial Services — 0.7% | | | | | | | | |
| | 1,000 | | | Steel Partners Holdings LP† | | | 14,504 | | | | 12,102 | |
| | | |
| | | | Financials — 0.8% | | | | | | | | |
| | 600 | | | BKF Capital Group Inc.† | | | 6,962 | | | | 7,050 | |
| | 4,000 | | | Harwood Wealth Management Group plc | | | 7,492 | | | | 7,683 | |
| | | | | | | 14,454 | | | | 14,733 | |
| | | |
| | | | Food and Beverage — 3.9% | | | | | | | | |
| | 3,500 | | | Farmer Brothers Co.† | | | 63,035 | | | | 52,710 | |
| | 200 | | | Nathan’s Famous Inc. | | | 13,034 | | | | 14,176 | |
| | | | | | | 76,069 | | | | 66,886 | |
| | | |
| | | | Health Care — 8.7% | | | | | | | | |
| | 60,000 | | | Achaogen Inc.† | | | 12,750 | | | | 600 | |
| | 300 | | | Consort Medical plc | | | 4,085 | | | | 4,073 | |
| | 400 | | | Cutera Inc.† | | | 5,603 | | | | 14,324 | |
| | 3,000 | | | IntriCon Corp.† | | | 66,367 | | | | 54,000 | |
| | 1,900 | | | IRRAS AB† | | | 4,898 | | | | 4,747 | |
| | 5,000 | | | National Veterinary Care Ltd. | | | 12,389 | | | | 12,702 | |
| | 4,000 | | | Oncimmune Holdings plc† | | | 4,931 | | | | 2,040 | |
| | 7,000 | | | Option Care Health Inc.† | | | 17,134 | | | | 26,110 | |
| | 3,200 | | | Owens & Minor Inc. | | | 14,704 | | | | 16,544 | |
| | 2,200 | | | Paratek Pharmaceuticals Inc.† | | | 17,418 | | | | 8,866 | |
| | 1,300 | | | Tristel plc | | | 4,856 | | | | 6,630 | |
| | | | | | | 165,135 | | | | 150,636 | |
| | | |
| | | | Hotels and Gaming — 9.0% | | | | | | | | |
| | 2,200 | | | Canterbury Park Holding Corp. | | | 30,370 | | | | 27,280 | |
| | 4,000 | | | Cherry AB, Cl. B†(a) | | | 38,859 | | | | 37,154 | |
| | 19,751 | | | Dover Motorsports Inc. | | | 42,852 | | | | 36,737 | |
| | 5,500 | | | Full House Resorts Inc.† | | | 13,392 | | | | 18,425 | |
| | 2,000 | | | Gamenet Group SpA | | | 28,767 | | | | 29,164 | |
| | 1,000 | | | Inspired Entertainment Inc.† | | | 5,140 | | | | 6,750 | |
| | | | | | | 159,380 | | | | 155,510 | |
See accompanying notes to financial statements.
6
The Gabelli Global Mini Mites Fund
Schedule of Investments (Continued) — December 31, 2019
| | | | | | | | | | | | |
Shares | | | | | Cost | | | Market
Value | |
| | |
| | | | COMMON STOCKS (Continued) | | | | | |
| | | | Machinery — 5.6% | | | | | |
| | 800 | | | Astec Industries Inc. | | $ | 25,919 | | | $ | 33,600 | |
| | 1,300 | | | L.B. Foster Co., Cl. A† | | | 26,228 | | | | 25,194 | |
| | 2,000 | | | The L.S. Starrett Co., Cl. A† | | | 11,568 | | | | 11,440 | |
| | 2,400 | | | Twin Disc Inc.† | | | 31,851 | | | | 26,448 | |
| | | | | | | 95,566 | | | | 96,682 | |
| | |
| | | | Paper and Forest Products — 4.8% | | | | | |
| | 9,000 | | | Canfor Corp.† | | | 95,947 | | | | 84,140 | |
| | |
| | | | Real Estate — 2.5% | | | | | |
| | 7,400 | | | Atrium European Real Estate Ltd. | | | 30,534 | | | | 28,637 | |
| | 5,000 | | | Trinity Place Holdings Inc.† | | | 18,000 | | | | 15,050 | |
| | | | | | | 48,534 | | | | 43,687 | |
| | | |
| | | | Retail — 0.2% | | | | | | | | |
| | 1,800 | | | Tuesday Morning Corp.† | | | 3,526 | | | | 3,330 | |
| | | |
| | | | Specialty Chemicals — 2.8% | | | | | | | | |
| | 8,000 | | | Treatt plc | | | 43,363 | | | | 48,746 | |
| | | |
| | | | Telecommunications — 10.8% | | | | | | | | |
| | 700 | | | Bittium Oyj | | | 4,945 | | | | 5,104 | |
| | 10,200 | | | Communications Systems Inc. | | | 42,853 | | | | 62,934 | |
| | 5,000 | | | Consolidated Communications
Holdings Inc. | | | 18,143 | | | | 19,400 | |
| | 5,300 | | | EXFO Inc.† | | | 18,435 | | | | 24,592 | |
| | 5,000 | | | HC2 Holdings Inc.† | | | 18,419 | | | | 10,850 | |
| | 22,877 | | | NII Holdings Inc.† | | | 42,645 | | | | 49,643 | |
| | 800 | | | Nuvera Communications Inc. | | | 14,463 | | | | 15,200 | |
| | | | | | | 159,903 | | | | 187,723 | |
| | | | TOTAL COMMON STOCKS | | | 1,701,987 | | | | 1,664,018 | |
| | | | | | | | | | | | |
Shares | | | | | Cost | | | Market
Value | |
| |
| | | | WARRANTS — 0.0% | |
| | | | Energy and Utilities — 0.0% | |
| | 693 | | | Weatherford International plc, expire 11/26/23†(a) | | $ | 0 | | | $ | 0 | |
| | | |
| | | | TOTAL INVESTMENTS — 95.8% | | $ | 1,701,987 | | | | 1,664,018 | |
| | | | | | | | | | | | |
| | |
| | | | Other Assets and Liabilities (Net) — 4.2% | | | | 73,555 | |
| | |
| | | | NET ASSETS — 100.0% | | | $ | 1,737,573 | |
| | | | | | | | | | | | |
| (a) | Security is valued using significant unobservable inputs and is classified as Level 3 in the fair value hierarchy. |
| † | Non-income producing security. |
| | | | | | | | |
Geographic Diversification | | % of
Market
Value | | | Market
Value | |
United States | | | 61.1 | % | | $ | 1,015,835 | |
Europe | | | 22.2 | | | | 370,311 | |
Canada | | | 14.3 | | | | 238,606 | |
Asia/Pacific | | | 2.4 | | | | 39,266 | |
| | | | | | | | |
| | | 100.0 | % | | $ | 1,664,018 | |
| | | | | | | | |
See accompanying notes to financial statements.
7
The Gabelli Global Mini Mites Fund
| | | | |
Statement of Assets and Liabilities | | | | |
December 31, 2019 | | | | |
| | | | |
Assets: | | | | |
Investments, at value (cost $1,701,987) | | $ | 1,664,018 | |
Foreign currency, at value (cost $1,115) | | | 1,121 | |
Cash | | | 72,543 | |
Receivable for investments sold | | | 3,398 | |
Receivable for Fund shares sold | | | 623 | |
Receivable from Adviser | | | 16,433 | |
Dividends and interest receivable | | | 1,330 | |
Prepaid expenses | | | 27,032 | |
| | | | |
Total Assets | | | 1,786,498 | |
| | | | |
Liabilities: | | | | |
Payable for investment advisory fees | | | 2,812 | |
Payable for distribution fees | | | 34 | |
Payable for legal and audit fees | | | 27,800 | |
Payable for shareholder communications expenses | | | 11,314 | |
Payable for shareholder services fees | | | 2,912 | |
Other accrued expenses | | | 4,053 | |
| | | | |
Total Liabilities | | | 48,925 | |
| | | | |
Net Assets
(applicable to 187,650 shares outstanding) | | $ | 1,737,573 | |
| | | | |
Net Assets Consist of: | | | | |
Paid-in capital | | $ | 1,782,101 | |
Total accumulated loss | | | (44,528 | ) |
| | | | |
Net Assets | | $ | 1,737,573 | |
| | | | |
Shares of Capital Stock, each at $0.001 par value: | | | | |
Class AAA: | | | | |
Net Asset Value, offering, and redemption price per share ($113,862 ÷ 12,296 shares outstanding; 75,000,000 shares authorized) | | $ | 9.26 | |
| | | | |
Class A: | | | | |
Net Asset Value and redemption price per share
($9,614 ÷ 1,038.6 shares outstanding; 50,000,000 shares authorized) | | $ | 9.26 | |
| | | | |
Maximum offering price per share (NAV ÷ 0.9425, based on maximum sales charge of 5.75% of the offering price) | | $ | 9.82 | |
| | | | |
Class C: | | | | |
Net Asset Value and offering price per share
($9,543 ÷ 1,034 shares outstanding; 25,000,000 shares authorized) | | $ | 9.23 | (a) |
| | | | |
Class I: | | | | |
Net Asset Value, offering, and redemption price per share ($1,604,554 ÷ 173,281 shares outstanding; 25,000,000 shares authorized) | | $ | 9.26 | |
| | | | |
| (a) | Redemption price varies based on the length of time held. |
| | | | |
Statement of Operations | | | | |
For the Year Ended December 31, 2019 | | | | |
| | | | |
Investment Income: | | | | |
Dividends (net of foreign withholding taxes of
$332) | | $ | 23,576 | |
Interest | | | 703 | |
| | | | |
Total Investment Income | | | 24,279 | |
| | | | |
Expenses: | | | | |
Investment advisory fees | | | 13,238 | |
Distribution fees - Class AAA | | | 244 | |
Distribution fees - Class A | | | 23 | |
Distribution fees - Class C | | | 93 | |
Legal and audit fees | | | 37,864 | |
Registration expenses | | | 36,948 | |
Shareholder communications expenses | | | 23,470 | |
Shareholder services fees | | | 10,987 | |
Custodian fees | | | 6,476 | |
Directors’ fees | | | 304 | |
Interest expense | | | 160 | |
Miscellaneous expenses | | | 10,358 | |
| | | | |
Total Expenses | | | 140,165 | |
| | | | |
Less: | | | | |
Expense reimbursements (See Note 3) | | | (126,588 | ) |
| | | | |
Net Expenses | | | 13,577 | |
| | | | |
Net Investment Income | | | 10,702 | |
| | | | |
Net Realized and Unrealized Gain/(Loss) on
Investments and Foreign Currency: | | | | |
Net realized gain on investments | | | 49,568 | |
Net realized loss on foreign currency transactions | | | (883 | ) |
| | | | |
Net realized gain on investments and foreign currency transactions | | | 48,685 | |
| | | | |
Net change in unrealized appreciation/depreciation:
on investments | | | 31,762 | |
on foreign currency translations | | | 10 | |
| | | | |
Net change in unrealized appreciation/depreciation on investments and foreign currency translations | | | 31,772 | |
| | | | |
Net Realized and Unrealized Gain/(Loss) on Investments and Foreign Currency | | | 80,457 | |
| | | | |
Net Increase in Net Assets Resulting from
Operations | | $ | 91,159 | |
| | | | |
See accompanying notes to financial statements.
8
The Gabelli Global Mini Mites Fund
Statement of Changes in Net Assets
| | | | | | | | | | | | | | | |
| | | Year Ended | | | | Period Ended |
| | | December 31, 2019 | | | | December 31, 2018(a) |
Operations: | | | | | | | | | | | | | | | |
Net investment income | | | $ | 10,702 | | | | | | | | | $ | 708 | |
Net realized gain on investments and foreign currency transactions | | | | 48,685 | | | | | | | | | | 17 | |
Net change in unrealized appreciation/depreciation on investments and foreign currency translations | | | | 31,772 | | | | | | | | | | (69,731 | ) |
| | | | | | | | | | | | | | | |
Net Increase/(Decrease) in Net Assets Resulting from Operations | | | | 91,159 | | | | | | | | | | (69,006 | ) |
| | | | | | | | | | | | | | | |
Distributions to Shareholders: | | | | | | | | | | | | | | | |
Accumulated earnings | | | | | | | | | | | | | | | |
Class AAA | | | | (4,122 | ) | | | | | | | | | (73 | ) |
Class A | | | | (351 | ) | | | | | | | | | (9 | ) |
Class C | | | | (305 | ) | | | | | | | | | (3 | ) |
Class I | | | | (61,048 | ) | | | | | | | | | (824 | ) |
| | | | | | | | | | | | | | | |
Total Distributions to Shareholders | | | | (65,826 | ) | | | | | | | | | (909 | ) |
| | | | | | | | | | | | | | | |
| | | |
Capital Share Transactions: | | | | | | | | | | | | | | | |
Class AAA | | | | 38,276 | | | | | | | | | | 80,514 | |
Class A | | | | 351 | | | | | | | | | | 10,003 | |
Class C | | | | 305 | | | | | | | | | | 10,009 | |
Class I | | | | 1,092,568 | | | | | | | | | | 550,129 | |
| | | | | | | | | | | | | | | |
Net Increase in Net Assets from Capital Share Transactions | | | | 1,131,500 | | | | | | | | | | 650,655 | |
| | | | | | | | | | | | | | | |
| | | |
Net Increase in Net Assets | | | | 1,156,833 | | | | | | | | | | 580,740 | |
Net Assets: | | | | | | | | | | | | | | | |
Beginning of period | | | | 580,740 | | | | | | | | | | — | |
| | | | | | | | | | | | | | | |
End of period | | | $ | 1,737,573 | | | | | | | | | $ | 580,740 | |
| | | | | | | | | | | | | | | |
| (a) | The Fund commenced investment operations on October 1, 2018. |
See accompanying notes to financial statements.
9
The Gabelli Global Mini Mites Fund
Financial Highlights
Selected data for a share of capital stock outstanding throughout the period:
| | | | | | | | | | | | | | | | | | | | | | | | | | | | | | | | | | | | | | | | | | | | | | | | | | | | | | | | | | | | | | | | | | | | | | | | | | | | | | | | | | | | | | | | | | | | | | | | | | | | | | | | | | | | |
| | | | | | | | | Income (Loss) from Investment
Operations | | | | | | Distributions | | | | | | | | | | | | | | | | | | Ratios to Average Net Assets/
Supplemental Data | |
Period Ended
December 31 | | Net Asset
Value,
Beginning
of Period | | | | | | Net
Investment
Income
(Loss)(a) | | | | | | Net
Realized
and
Unrealized
Gain (Loss)
on
Investments | | | | | | Total from
Investment
Operations | | | | | | Net
Investment
Income | | | | | | Net
Realized
Gain | | | | | | Total
Distributions | | | | | | Net Asset
Value,
End of
Period | | | | | | Total
Return† | | | | | | Net Assets
End of Period
(in 000’s) | | | | | | Net
Investment
Income
(Loss) | | | | | | Operating
Expenses
Before
Reimbursement | | | | | | Operating
Expenses
Net of
Reimbursement(c) | | | | | | Portfolio
Turnover
Rate | |
Class AAA | | | | | | | | | | | | | | | | | | | | | | | | | | | | | | | | | | | | | | | | | | | | | | | | | | | | | | | | | | | | | | | | | | | | | | | | | | | | | | | | | | | | | | | | | | | | | | | | | | | | | | | | | | | | |
2019 | | $ | 8.62 | | | | | | | $ | 0.05 | | | | | | | | $ 0.94 | | | | | | | $ | 0.99 | | | | | | | $ | (0.04 | ) | | | | | | $ | (0.31 | ) | | | | | | | $(0.35 | ) | | | | | | $ | 9.26 | | | | | | | | 11.5 | % | | | | | | | $ 114 | | | | | | | | 0.53 | % | | | | | | | 10.81 | % | | | | | | | 1.23 | %(d) | | | | | | | 131 | % |
2018(e) | | | 10.00 | | | | | | | | 0.01 | | | | | | | | (1.38 | ) | | | | | | | (1.37 | ) | | | | | | | (0.01 | ) | | | | | | | (0.00 | )(b) | | | | | | | (0.01 | ) | | | | | | | 8.62 | | | | | | | | (13.7 | ) | | | | | | | 70 | | | | | | | | 0.45 | (f) | | | | | | | 44.14 | (f) | | | | | | | 1.25 | (f) | | | | | | | 6 | |
Class A | | | | | | | | | | | | | | | | | | | | | | | | | | | | | | | | | | | | | | | | | | | | | | | | | | | | | | | | | | | | | | | | | | | | | | | | | | | | | | | | | | | | | | | | | | | | | | | | | | | | | | | | | | | | |
2019 | | $ | 8.62 | | | | | | | $ | 0.04 | | | | | | | | $ 0.95 | | | | | | | $ | 0.99 | | | | | | | $ | (0.04 | ) | | | | | | $ | (0.31 | ) | | | | | | | $(0.35 | ) | | | | | | $ | 9.26 | | | | | | | | 11.5 | % | | | | | | | $ 10 | | | | | | | | 0.43 | % | | | | | | | 10.81 | % | | | | | | | 1.23 | %(d) | | | | | | | 131 | % |
2018(e) | | | 10.00 | | | | | | | | 0.01 | | | | | | | | (1.38 | ) | | | | | | | (1.37 | ) | | | | | | | (0.01 | ) | | | | | | | (0.00 | )(b) | | | | | | | (0.01 | ) | | | | | | | 8.62 | | | | | | | | (13.7 | ) | | | | | | | 9 | | | | | | | | 0.41 | (f) | | | | | | | 44.14 | (f) | | | | | | | 1.25 | (f) | | | | | | | 6 | |
Class C | | | | | | | | | | | | | | | | | | | | | | | | | | | | | | | | | | | | | | | | | | | | | | | | | | | | | | | | | | | | | | | | | | | | | | | | | | | | | | | | | | | | | | | | | | | | | | | | | | | | | | | | | | | | |
2019 | | $ | 8.61 | | | | | | | $ | (0.02 | ) | | | | | | | $ 0.95 | | | | | | | $ | 0.93 | | | | | | | $ | (0.00 | )(b) | | | | | | $ | (0.31 | ) | | | | | | | $(0.31 | ) | | | | | | $ | 9.23 | | | | | | | | 10.8 | % | | | | | | | $ 9 | | | | | | | | (0.25 | )% | | | | | | | 11.56 | % | | | | | | | 1.92 | %(d) | | | | | | | 131 | % |
2018(e) | | | 10.00 | | | | | | | | (0.01 | ) | | | | | | | (1.38 | ) | | | | | | | (1.39 | ) | | | | | | | — | | | | | | | | (0.00 | )(b) | | | | | | | (0.00 | ) | | | | | | | 8.61 | | | | | | | | (13.9 | ) | | | | | | | 8 | | | | | | | | (0.34 | )(f) | | | | | | | 44.89 | (f) | | | | | | | 2.00 | (f) | | | | | | | 6 | |
Class I | | | | | | | | | | | | | | | | | | | | | | | | | | | | | | | | | | | | | | | | | | | | | | | | | | | | | | | | | | | | | | | | | | | | | | | | | | | | | | | | | | | | | | | | | | | | | | | | | | | | | | | | | | | | |
2019 | | $ | 8.61 | | | | | | | $ | 0.08 | | | | | | | | $ 0.94 | | | | | | | $ | 1.02 | | | | | | | $ | (0.06 | ) | | | | | | $ | (0.31 | ) | | | | | | | $(0.37 | ) | | | | | | $ | 9.26 | | | | | | | | 11.8 | % | | | | | | | $1,605 | | | | | | | | 0.84 | % | | | | | | | 10.56 | % | | | | | | | 1.00 | %(d) | | | | | | | 131 | % |
2018(e) | | | 10.00 | | | | | | | | 0.02 | | | | | | | | (1.40 | ) | | | | | | | (1.38 | ) | | | | | | | (0.01 | ) | | | | | | | (0.00 | )(b) | | | | | | | (0.01 | ) | | | | | | | 8.61 | | | | | | | | (13.8 | ) | | | | | | | 494 | | | | | | | | 0.79 | (f) | | | | | | | 43.89 | (f) | | | | | | | 1.00 | (f) | | | | | | | 6 | |
| † | Total return represents aggregate total return of a hypothetical $1,000 investment at the beginning of the period and sold at the end of the period including reinvestment of distributions and does not reflect the applicable sales charges. Total return for a period of less than one year is not annualized. |
| (a) | Per share amounts have been calculated using the average shares outstanding method. |
| (b) | Amount represents less than $0.005 per share. |
| (c) | Under an expense reimbursement agreement with the Adviser, the Adviser reimbursed expenses of $126,588 and $43,899 for the year ended December 31, 2019 and the period ended December 31, 2018, respectively. |
| (d) | The Fund incurred interest expense for the year ended December 31, 2019. If interest expense had not been incurred, the ratio of operating expenses to average net assets would have been 1.22% for (Class AAA and Class A), 1.90% for (Class C) and 0.99% for (Class I). |
| (e) | The Fund commenced investment operations on October 1, 2018. |
See accompanying notes to financial statements.
10
The Gabelli Global Mini Mites Fund
Notes to Financial Statements
1. Organization. The Gabelli Global Mini Mites Fund, a series of GAMCO Global Series Funds, Inc. (the Corporation),was incorporated on July 16, 1993 in Maryland. The Fund is anon-diversifiedopen-end management investment company registered under the Investment Company Act of 1940, as amended (the 1940 Act), and is one of five separately managed portfolios (collectively, the Portfolios) of the Corporation. The Fund’s primary objective is long term capital appreciation by investing primarily in micro-capitalization equity securities. The Fund commenced investment operations on October 1, 2018.
2. Significant Accounting Policies. As an investment company, the Fund follows the investment companyaccounting and reporting guidance, which is part of U.S. generally accepted accounting principles (GAAP) that may require the use of management estimates and assumptions in the preparation of its financial statements. Actual results could differ from those estimates. The following is a summary of significant accounting policies followed by the Fund in the preparation of its financial statements.
New Accounting Pronouncements.To improve the effectiveness of fair value disclosure requirements, theFinancial Accounting Standards Board recently issued Accounting Standard Update (ASU)2018-13, Fair Value Measurement Disclosure Framework – Changes to the Disclosure Requirements for Fair Value Measurement (ASU2018-13), which adds, removes, and modifies certain aspects relating to fair value disclosure. ASU2018-13 is effective for interim and annual reporting periods beginning after December 15, 2019; early adoption of the additions relating to ASU2018-13 is not required, even if early adoption is elected for the removals and modifications under ASU2018-13. Management has early adopted the removals and modifications set forth in ASU2018-13 in these financial statements and has not early adopted the additions set forth in ASU2018-13.
Security Valuation.Portfolio securities listed or traded on a nationally recognized securities exchange or tradedin the U.S.over-the-counter market for which market quotations are readily available are valued at the last quoted sale price or a market’s official closing price as of the close of business on the day the securities are being valued. If there were no sales that day, the security is valued at the average of the closing bid and asked prices or, if there were no asked prices quoted on that day, then the security is valued at the closing bid price on that day. If no bid or asked prices are quoted on such day, the security is valued at the most recently available price or, if the Board of Directors (the Board) so determines, by such other method as the Board shall determine in good faith to reflect its fair market value. Portfolio securities traded on more than one national securities exchange or market are valued according to the broadest and most representative market, as determined by Gabelli Funds, LLC (the Adviser).
Portfolio securities primarily traded on a foreign market are generally valued at the preceding closing values of such securities on the relevant market, but may be fair valued pursuant to procedures established by the Board if market conditions change significantly after the close of the foreign market, but prior to the close of business on the day the securities are being valued. Debt obligations for which market quotations are readily available are valued at the average of the latest bid and asked prices. If there were no asked prices quoted on such day, the security is valued using the closing bid price. Such debt obligations are valued through prices provided by a pricing service approved by the Board. Certain securities are valued principally using dealer quotations.
Securities and assets for which market quotations are not readily available are fair valued as determined by the Board. Fair valuation methodologies and procedures may include, but are not limited to: analysis and review of available financial andnon-financial information about the company; comparisons with the valuation and
11
The Gabelli Global Mini Mites Fund
Notes to Financial Statements (Continued)
changes in valuation of similar securities, including a comparison of foreign securities with the equivalent U.S. dollar value American Depositary Receipt securities at the close of the U.S. exchange; and evaluation of any other information that could be indicative of the value of the security.
The Fund employs a fair value model to adjust prices to reflect events affecting the values of certain portfolio securities which occur between the close of trading on the principal market for such securities (foreign exchanges andover-the-counter markets) at the time when net asset values of the Fund are determined. If the Fund’s valuation committee believes that a particular event would materially affect net asset value, further adjustment is considered.
The inputs and valuation techniques used to measure fair value of the Fund’s investments are summarized into three levels as described in the hierarchy below:
| | ● | | Level 1 — quoted prices in active markets for identical securities; |
| | ● | | Level 2 — other significant observable inputs (including quoted prices for similar securities, interest rates, prepayment speeds, credit risk, etc.); and |
| | ● | | Level 3 — significant unobservable inputs (including the Board’s determinations as to the fair value of investments). |
A financial instrument’s level within the fair value hierarchy is based on the lowest level of any input both individually and in the aggregate that is significant to the fair value measurement. The inputs or methodology used for valuing securities are not necessarily an indication of the risk associated with investing in those securities. The summary of the Fund’s investments in securities by inputs used to value the Fund’s investments as of December 31, 2019 is as follows:
| | | | | | | | | | | | | | | | | | | | |
| | | Valuation Inputs | | |
| | | Level 1
Quoted Prices | | Level 2 Other Significant
Observable Inputs | | Level 3 Significant
Unobservable Inputs | | Total Market Value
at 12/31/19 |
INVESTMENTS IN SECURITIES: | | | | | | | | | | | | | | | | | | | | |
ASSETS (Market Value): | | | | | | | | | | | | | | | | | | | | |
Common Stocks: | | | | | | | | | | | | | | | | | | | | |
Business Services | | | $ | 94,614 | | | | $ | 2,275 | | | | | — | | | | $ | 96,889 | |
Financials | | | | 7,683 | | | | | 7,050 | | | | | — | | | | | 14,733 | |
Hotels and Gaming | | | | 118,356 | | | | | — | | | | $ | 37,154 | | | | | 155,510 | |
Other Industries (a) | | | | 1,396,886 | | | | | — | | | | | — | | | | | 1,396,886 | |
Total Common Stocks | | | | 1,617,539 | | | | | 9,325 | | | | | 37,154 | | | | | 1,664,018 | |
Warrants (a) | | | | — | | | | | — | | | | | 0 | | | | | 0 | |
TOTAL INVESTMENTS IN SECURITIES – ASSETS | | | $ | 1,617,539 | | | | $ | 9,325 | | | | $ | 37,154 | | | | $ | 1,664,018 | |
| (a) | Please refer to the Schedule of Investments for the industry classifications of these portfolio holdings. |
During the year ended December 31, 2019, the Fund did not have any transfers into or out of Level 3.
12
The Gabelli Global Mini Mites Fund
Notes to Financial Statements (Continued)
The following table reconciles Level 3 investments:
| | | | | | | | | | | | | | | | | | | | | | | | | | | | | | | | | | | | | | | | | | | | | | | | | | |
| | | Balance as of 12/31/18 | | Accrued
discounts/
(premiums) | | Realized
gain/
(loss) | | Net Change
in unrealized
appreciation/
depreciation† | | Purchases | | Sales | | Transfers
into
Level 3†† | | Transfers
out of
Level 3†† | | Balance
as of
12/31/19 | | Net change in unrealized
appreciation/
depreciation
during the
period on
Level 3
investments
still held at
12/31/19† |
INVESTMENTS IN SECURITIES: | | | | | | | | | | | | | | | | | | | | | | | | | | | | | | | | | | | | | | | | | | | | | | | | | | |
ASSETS (Market Value): | | | | | | | | | | | | | | | | | | | | | | | | | | | | | | | | | | | | | | | | | | | | | | | | | | |
Common Stocks (a) | | | | — | | | | | — | | | | | — | | | | $ | (1,705 | ) | | | $ | 38,859 | | | | | — | | | | | — | | | | | — | | | | $ | 37,154 | | | | $ | (1,705 | ) |
Warrants (a) | | | | — | | | | | — | | | | | — | | | | | — | | | | | 0 | | | | | — | | | | | — | | | | | — | | | | | 0 | | | | | 0 | |
TOTAL INVESTMENTS IN SECURITIES | | | | — | | | | | — | | | | | — | | | | $ | (1,705 | ) | | | $ | 38,859 | | | | | — | | | | | — | | | | | — | | | | $ | 37,154(b | ) | | | $ | (1,705 | ) |
| (a) | Please refer to the Schedule of Investments for the industry classifications of these portfolio holdings. |
| (b) | The Level 3 common stock was valued at the announced price of the proposed merger transaction. The Level 3 warrants were valued at intrinsic value. The value of these securities at December 31, 2019 was $37,154. The inputs for the valuations of these securities were derived based on the judgement of the Adviser according to procedures approved by the Board of Directors. |
| † | Net change in unrealized appreciation/depreciation on investments is included in the related amounts in the Statement of Operations. |
| †† | The Fund’s policy is to recognize transfers into and out of Level 3 as of the beginning of the reporting period. |
Additional Information to Evaluate Qualitative Information.
General.The Fund uses recognized industry pricing services – approved by the Board and unaffiliated withthe Adviser – to value most of its securities, and uses broker quotes provided by market makers of securities not valued by these and other recognized pricing sources. Several different pricing feeds are received to value domestic equity securities, international equity securities, preferred equity securities, and fixed income securities. The data within these feeds are ultimately sourced from major stock exchanges and trading systems where these securities trade. The prices supplied by external sources are checked by obtaining quotations or actual transaction prices from market participants. If a price obtained from the pricing source is deemed unreliable, prices will be sought from another pricing service or from a broker/dealer that trades that security or similar securities.
Fair Valuation.Fair valued securities may be common or preferred equities, warrants, options, rights, or fixedincome obligations. Where appropriate, Level 3 securities are those for which market quotations are not available, such as securities not traded for several days, or for which current bids are not available, or which are restricted as to transfer. Among the factors to be considered to fair value a security are recent prices of comparable securities that are publicly traded, reliable prices of securities not publicly traded, the use of valuation models, current analyst reports, valuing the income or cash flow of the issuer, or cost if the preceding factors do not apply. The circumstances of Level 3 securities are frequently monitored to determine if fair valuation measures continue to apply.
The Adviser reports quarterly to the Board the results of the application of fair valuation policies and procedures. These may include backtesting the prices realized in subsequent trades of these fair valued securities to fair values previously recognized.
13
The Gabelli Global Mini Mites Fund
Notes to Financial Statements (Continued)
Foreign Currency Translations.The books and records of the Fund are maintained in U.S. dollars. Foreigncurrencies, investments, and other assets and liabilities are translated into U.S. dollars at current exchange rates. Purchases and sales of investment securities, income, and expenses are translated at the exchange rate prevailing on the respective dates of such transactions. Unrealized gains and losses that result from changes in foreign exchange rates and/or changes in market prices of securities have been included in unrealized appreciation/depreciation on investments and foreign currency translations. Net realized foreign currency gains and losses resulting from changes in exchange rates include foreign currency gains and losses between trade date and settlement date on investment securities transactions, foreign currency transactions, and the difference between the amounts of interest and dividends recorded on the books of the Fund and the amounts actually received. The portion of foreign currency gains and losses related to fluctuation in exchange rates between the initial purchase trade date and subsequent sale trade date is included in realized gain/(loss) on investments.
Foreign Securities.The Fund may directly purchase securities of foreign issuers. Investing in securities offoreign issuers involves special risks not typically associated with investing in securities of U.S. issuers. The risks include possible revaluation of currencies, the inability to repatriate funds, less complete financial information about companies, and possible future adverse political and economic developments. Moreover, securities of many foreign issuers and their markets may be less liquid and their prices more volatile than securities of comparable U.S. issuers.
Foreign Taxes.The Fund may be subject to foreign taxes on income, gains on investments, or currency repatriation,a portion of which may be recoverable. The Fund will accrue such taxes and recoveries as applicable, based upon its current interpretation of tax rules and regulations that exist in the markets in which it invests.
Restricted Securities.The Fund may invest up to 15% of its net assets in securities for which the marketsare restricted. Restricted securities include securities whose disposition is subject to substantial legal or contractual restrictions. The sale of restricted securities often requires more time and results in higher brokerage charges or dealer discounts and other selling expenses than does the sale of securities eligible for trading on national securities exchanges or in theover-the-counter markets. Restricted securities may sell at a price lower than similar securities that are not subject to restrictions on resale. Securities freely saleable among qualified institutional investors under special rules adopted by the SEC may be treated as liquid if they satisfy liquidity standards established by the Board. The continued liquidity of such securities is not as well assured as that of publicly traded securities, and accordingly the Board will monitor their liquidity. As of December 31, 2019, the Fund did not hold any restricted securities.
Securities Transactions and Investment Income.Securities transactions are accounted for on the trade datewith realized gain or loss on investments determined by using the identified cost method. Interest income (including amortization of premium and accretion of discount) is recorded on an accrual basis. Premiums and discounts on debt securities are amortized using the effective yield to maturity method. Dividend income is recorded on theex-dividend date, except for certain dividends from foreign securities that are recorded as soon after theex-dividend date as the Fund becomes aware of such dividends.
Determination of Net Asset Value and Calculation of Expenses.Certain administrative expenses are commonto, and allocated among, various affiliated funds. Such allocations are made on the basis of each fund’s average net assets or other criteria directly affecting the expenses as determined by the Adviser pursuant to procedures established by the Board.
14
The Gabelli Global Mini Mites Fund
Notes to Financial Statements (Continued)
In calculating the NAV per share of each class, investment income, realized and unrealized gains and losses, redemption fees, and expenses other than class specific expenses are allocated daily to each class of shares based upon the proportion of net assets of each class at the beginning of each day. Distribution expenses are borne solely by the class incurring the expense.
Distributions to Shareholders.Distributions to shareholders are recorded on theex-dividend date. Distributionsto shareholders are based on income and capital gains as determined in accordance with federal income tax regulations, which may differ from income and capital gains as determined under GAAP. These differences are primarily due to differing treatments of income and gains on various investment securities and foreign currency transactions held by the Fund, timing differences, and differing characterizations of distributions made by the Fund. Distributions from net investment income for federal income tax purposes include net realized gains on foreign currency transactions. These book/tax differences are either temporary or permanent in nature. To the extent these differences are permanent, adjustments are made to the appropriate capital accounts in the period when the differences arise. Permanent differences were primarily due to reclasses of net realized foreign currency gains and losses and redesignation of dividends paid. These reclassifications have no impact on the NAV of the Fund. For the year ended December 31, 2019, reclassifications were made to decreasepaid-in capital by $54, with an offsetting adjustment to total distributable earnings.
The tax character of distributions paid during the year ended December 31, 2019 and the period ended December 31, 2018 was as follows:
| | | | | | | | | | | | | | | | | | | | | | | | |
| | | Year Ended
December 31, 2019 | | | Period Ended
December 31, 2018 | |
Distributions paid from: | | | | | | | | | | | | | | | | | | | | | | | | |
Ordinary income (inclusive of short term capital gains) | | | | | | | $65,826 | | | | | | | | | | | | $909 | | | | | |
| | | | | | | | | | | | | | | | | | | | | | | | |
Total | | | | | | | $65,826 | | | | | | | | | | | | $909 | | | | | |
| | | | | | | | | | | | | | | | | | | | | | | | |
Provision for Income Taxes.The Fund intends to continue to qualify as a regulated investment companyunder Subchapter M of the Internal Revenue Code of 1986, as amended (the Code). It is the policy of the Fund to comply with the requirements of the Code applicable to regulated investment companies and to distribute substantially all of its net investment company taxable income and net capital gains. Therefore, no provision for federal income taxes is required.
At December 31, 2019, the components of accumulated earnings/losses on a tax basis were as follows:
| | | | |
Undistributed ordinary income | | $ | 353 | |
Net unrealized depreciation on investments | | | (44,881 | ) |
| | | | |
Total | | $ | (44,528 | ) |
| | | | |
The Fund is permitted to carry capital losses forward for an unlimited period. Capital losses that are carried forward will retain their character as either short term or long term capital losses.
At December 31, 2019, the temporary difference between book basis and tax basis unrealized depreciation was primarily due to deferral of losses from wash sales for tax purposes andmark-to-market adjustments on investments in passive foreign investment companies.
15
The Gabelli Global Mini Mites Fund
Notes to Financial Statements (Continued)
The following summarizes the tax cost of investments and the related net unrealized depreciation at December 31, 2019:
| | | | | | | | |
| | | Cost | | Gross
Unrealized
Appreciation | | Gross
Unrealized
Depreciation | | Net Unrealized
Depreciation |
Investments | | $1,708,909 | | $163,596 | | $(208,487) | | $(44,891) |
The Fund is required to evaluate tax positions taken or expected to be taken in the course of preparing the Fund’s tax returns to determine whether the tax positions are“more-likely-than-not” of being sustained by the applicable tax authority. Income tax and related interest and penalties would be recognized by the Fund as tax expense in the Statement of Operations if the tax positions were deemed not to meet themore-likely-than-not threshold. During the year ended December 31, 2019, the Fund did not incur any income tax, interest, or penalties. As of December 31, 2019, the Adviser has reviewed all open tax years and concluded that there was no impact to the Fund’s net assets or results of operations. The Fund’s federal and state tax returns will remain subject to examination for three years. On an ongoing basis, the Adviser will monitor the Fund’s tax positions to determine if adjustments to this conclusion are necessary.
3. Investment Advisory Agreement and Other Transactions.The Fund has entered into an investmentadvisory agreement (the Advisory Agreement) with the Adviser which provides that the Fund will pay the Adviser a fee, computed daily and paid monthly, at the annual rate of 1.00% of the value of its average daily net assets. In accordance with the Advisory Agreement, the Adviser provides a continuous investment program for the Fund’s portfolio, oversees the administration of all aspects of the Fund’s business and affairs, and pays the compensation of all Officers and Directors of the Fund who are affiliated persons of the Adviser.
Through November 30, 2019, the Adviser had agreed to waive and/or to reimburse expenses of the Fund to the extent necessary to maintain the annualized total operating expenses of the Fund (excluding brokerage costs, acquired fund fees and expenses, interest, taxes, and extraordinary expenses) at no more than an annual rate of 1.25%, 1.25%, 2.00%, and 1.00% of the value of the Fund’s average daily net assets for Class AAA, Class A, Class C, and Class I. Effective December 1, 2019, the Adviser amended its contractual agreement with respect to each share class of the Fund to waive its investment advisory fees and/or to reimburse expenses to the extent necessary to maintain the annualized total operating expenses of the Fund (excluding brokerage costs, acquired fund fees and expenses, interest, taxes, and extraordinary expenses) until at least April 30, 2021, at no more than 0.90% of the value of the Fund’s average daily net assets for each share class of the Fund. During the year ended December 31, 2019, the Adviser reimbursed the Fund in the amount of $126,588. In addition, the Fund has agreed, during the two year period following any waiver or reimbursement by the Adviser, to repay such amount to the extent, that after giving effect to the repayment, such adjusted annualized total operating expenses of the Fund would not exceed 0.90% of the value of the Fund’s average daily net assets for each share class of the Fund. The agreement is renewable annually. At December 31, 2019, the cumulative amount which the Fund may repay the Adviser, subject to the terms above, is $170,487:
| | | | |
For the period ended December 31, 2018, expiring December 31, 2020 | | $ | 43,899 | |
For the year ended December 31, 2019, expiring December 31, 2021 | | | 126,588 | |
| | | | |
| | $ | 170,487 | |
| | | | |
The Corporation pays each Director who is not considered to be an affiliated person an annual retainer of $6,000 plus $1,000 for each Board meeting attended and they are reimbursed for any out of pocket expenses incurred in attending meetings. All Board committee members receive $1,000 per meeting attended. The Chairman
16
The Gabelli Global Mini Mites Fund
Notes to Financial Statements (Continued)
of the Audit Committee receives an annual fee of $3,000, and the Lead Director receives an annual fee of $2,000. A Director may receive a single meeting fee, allocated among the participating funds, for attending certain meetings held on behalf of multiple funds. Directors who are directors or employees of the Adviser or an affiliated company receive no compensation or expense reimbursement from the Corporation.
4. Distribution Plan.The Fund’s Board has adopted a distribution plan (the Plan) for each class of shares,except for Class I Shares, pursuant to Rule12b-1 under the 1940 Act. Under the Class AAA, Class A, and Class C Share Plans, payments are authorized to G.distributors, LLC (the Distributor), an affiliate of the Adviser, at annual rates of 0.25%, 0.25%, and 1.00%, respectively, of the average daily net assets of those classes, the annual limitations under each Plan. Such payments are accrued daily and paid monthly.
5. Portfolio Securities.Purchases and sales of securities during the year ended December 31, 2019, otherthan short term securities and U.S. Government obligations, aggregated $2,900,688 and $1,718,849, respectively.
6. Transactions with Affiliates and Other Arrangements.During the year ended December 31, 2019, theFund paid brokerage commissions on security trades of $5,553 to G.research, LLC, an affiliate of the Adviser.
The cost of calculating the Fund’s NAV per share is a Fund expense pursuant to the Advisory Agreement. Under thesub-administration agreement with Bank of New York Mellon, the fees paid include the cost of calculating the Fund’s NAV. The Fund reimburses the Adviser for this service. During the year ended December 31, 2019, the Adviser did not seek reimbursements for this expense.
7. Line of Credit.The Fund participates in an unsecured line of credit which expires on March 4, 2020 andmay be renewed annually, of up to $75,000,000 under which it may borrow up to 10% of its net assets from the custodian for temporary borrowing purposes. Borrowings under this arrangement bear interest at a floating rate equal to the higher of the overnight Federal Funds rate plus 125 basis points or the 30 day ICE LIBOR plus 125 basis points in effect on that day. This amount, if any, would be included in “Interest expense” in the Statement of Operations. At December 31, 2019, there were no borrowings outstanding under the line of credit.
The average daily amount of borrowings outstanding under the lines of credit during the year ended December 31, 2019 was $12,934 with a weighted average interest rate of 3.51%. The maximum amount borrowed at anytime during the year ended December 31, 2019 was $294,000.
8. Capital Stock.The Fund offers four classes of shares–Class AAA Shares, Class A Shares, Class C Shares,and Class I Shares. Class AAA and Class I Shares are offered without a sales charge. Class A Shares are subject to a maximumfront-end sales charge of 5.75% and Class C Shares are subject to a 1.00% contingent deferred sales charge for the period after purchase.
The Fund imposes a redemption fee of 2.00% on all classes of shares that are redeemed or exchanged on or before the seventh day after the date of a purchase. The redemption fee is deducted from the proceeds otherwise payable to the redeeming shareholders and is retained by the Fund as an increase inpaid-in capital. The redemption fees retained by the Fund during the year ended December 31, 2019 and the period ended December 31, 2018, if any, can be found in the Statement of Changes in Net Assets under Redemption Fees.
17
The Gabelli Global Mini Mites Fund
Notes to Financial Statements (Continued)
Transactions in shares of capital stock were as follows:
| | | | | | | | | | | | | | | | |
| | | Year Ended
December 31, 2019 | | | Period Ended
December 31, 2018(a) | |
| | | Shares | | | Amount | | | Shares | | | Amount | |
Class AAA | | | | | | | | | | | | | | | | |
Shares sold | | | 7,140 | | | $ | 65,719 | | | | 18,101 | | | $ | 180,041 | |
Shares issued upon reinvestment of distributions | | | 448 | | | | 4,122 | | | | 9 | | | | 73 | |
Shares redeemed | | | (3,402 | ) | | | (31,565 | ) | | | (10,000 | ) | | | (99,600 | ) |
| | | | | | | | | | | | | | | | |
Net increase | | | 4,186 | | | $ | 38,276 | | | | 8,110 | | | $ | 80,514 | |
| | | | | | | | | | | | | | | | |
| | | | |
Class A | | | | | | | | | | | | | | | | |
Shares sold | | | — | | | | — | | | | 1,000 | | | $ | 10,000 | |
Shares issued upon reinvestment of distributions | | | 39 | | | $ | 351 | | | | 0* | | | | 3 | |
| | | | | | | | | | | | | | | | |
Net increase | | | 39 | | | $ | 351 | | | | 1,000 | | | $ | 10,003 | |
| | | | | | | | | | | | | | | | |
| | | | |
Class C | | | | | | | | | | | | | | | | |
Shares sold | | | — | | | | — | | | | 1,000 | | | $ | 10,000 | |
Shares issued upon reinvestment of distributions | | | 33 | | | $ | 305 | | | | 1 | | | | 9 | |
| | | | | | | | | | | | | | | | |
Net increase | | | 33 | | | $ | 305 | | | | 1,001 | | | $ | 10,009 | |
| | | | | | | | | | | | | | | | |
| | | | |
Class I | | | | | | | | | | | | | | | | |
Shares sold | | | 133,571 | | | $ | 1,256,583 | | | | 57,223 | | | $ | 549,305 | |
Shares issued upon reinvestment of distributions | | | 6,643 | | | | 61,048 | | | | 96 | | | | 824 | |
Shares redeemed | | | (24,252 | ) | | | (225,063 | ) | | | — | | | | — | |
| | | | | | | | | | | | | | | | |
Net increase | | | 115,962 | | | $ | 1,092,568 | | | | 57,319 | | | $ | 550,129 | |
| | | | | | | | | | | | | | | | |
| * | Represents fewer than 0.50 shares. |
| (a) | The Fund commenced investment operations on October 1, 2018. |
9. Significant Shareholder.As of December 31, 2019, approximately 68.1% of the Fund was beneficiallyowned by the Adviser and its affiliates, including managed accounts for which the affiliates of the Adviser have voting control but disclaim pecuniary interest.
10. Indemnifications.The Fund enters into contracts that contain a variety of indemnifications. The Fund’smaximum exposure under these arrangements is unknown. However, the Fund has not had prior claims or losses pursuant to these contracts. Management has reviewed the Fund’s existing contracts and expects the risk of loss to be remote.
11. Subsequent Events.Management has evaluated the impact on the Fund of all subsequent events occurringthrough the date the financial statements were issued and has determined that there were no other subsequent events requiring recognition or disclosure in the financial statements.
18
The Gabelli Global Mini Mites Fund
Report of Independent Registered Public Accounting Firm
To the Shareholders of The Gabelli Global Mini Mites Fund
and the Board of Directors of GAMCO Global Series Funds, Inc.
Opinion on the Financial Statements
We have audited the accompanying statement of assets and liabilities of The Gabelli Global Mini Mites Fund (the “Fund”) (one of the funds constituting GAMCO Global Series Funds, Inc. (the “Corporation”)), including the schedule of investments, as of December 31, 2019, and the related statement of operations for the year then ended, the statements of changes in net assets and the financial highlights for the year ended December 31, 2019 and the period from October 1, 2018 (commencement of operations) through December 31, 2018 and the related notes (collectively referred to as the “financial statements”). In our opinion, the financial statements present fairly, in all material respects, the financial position of the Fund (one of the funds constituting GAMCO Global Series Funds, Inc.) at December 31, 2019, the results of its operations for the year then ended, the changes in its net assets and its financial highlights for the year ended December 31, 2019 and the period from October 1, 2018 (commencement of operations) through December 31, 2018, in conformity with U.S. generally accepted accounting principles.
Basis for Opinion
These financial statements are the responsibility of the Corporation’s management. Our responsibility is to express an opinion on the Fund’s financial statements based on our audits. We are a public accounting firm registered with the Public Company Accounting Oversight Board (United States) (“PCAOB”) and are required to be independent with respect to the Corporation in accordance with the U.S. federal securities laws and the applicable rules and regulations of the Securities and Exchange Commission and the PCAOB.
We conducted our audits in accordance with the standards of the PCAOB. Those standards require that we plan and perform the audit to obtain reasonable assurance about whether the financial statements are free of material misstatement, whether due to error or fraud. The Corporation is not required to have, nor were we engaged to perform, an audit of the Corporation’s internal control over financial reporting. As part of our audits we are required to obtain an understanding of internal control over financial reporting but not for the purpose of expressing an opinion on the effectiveness of the Corporation’s internal control over financial reporting. Accordingly, we express no such opinion.
Our audits included performing procedures to assess the risks of material misstatement of the financial statements, whether due to error or fraud, and performing procedures that respond to those risks. Such procedures included examining, on a test basis, evidence regarding the amounts and disclosures in the financial statements. Our procedures included confirmation of securities owned as of December 31, 2019, by correspondence with the custodian. Our audits also included evaluating the accounting principles used and significant estimates made by management, as well as evaluating the overall presentation of the financial statements. We believe that our audits provide a reasonable basis for our opinion.

We have served as the auditor of one or more Gabelli/GAMCO Funds investment companies since 1992.
Philadelphia, Pennsylvania
February 27, 2020
19
The Gabelli Global Mini Mites Fund
Board Consideration and Re-Approval of Investment Advisory Agreement (Unaudited)
During the six months ended December 31, 2019, the Board of Directors of the Corporation approved the continuation of the investment advisory agreement with the Adviser for the Fund on the basis of the recommendation by the directors (the Independent Board Members) who are not interested persons of the Fund. The following paragraphs summarize the material information and factors considered by the Independent Board Members as well as their conclusions relative to such factors.
Nature, Extent, and Quality of Services.The Independent Board Members considered information regardingthe portfolio managers, the depth of the analyst pool available to the Adviser and the Fund’s portfolio managers, the scope of supervisory, administrative, shareholder and other services supervised or provided by the Adviser and the absence of significant service problems reported to the Board. The Independent Board Members noted the experience, length of service and reputation of the Fund’s portfolio managers.
Investment Performance.The Independent Board Members reviewed the short term performance of the Fund(as of September 30, 2019) against a peer group of eight other comparable funds prepared by the Adviser (the Adviser Peer Group), and against a peer group prepared by Broadridge (the Broadridge Performance Peer Group) consisting of all retail and institutional global small/mid cap fund, regardless of asset size or primary channel of distribution, as represented by the Lipper Global Small/Mid Cap Index. The Independent Board Members noted that the Fund’s performance was in the fourth (lowest) quartile for the one year period, as measured against the Adviser Peer Group. Against the Broadridge Performance Peer Group, the Independent Board Members noted that the Fund’s performance was in the fourth quintile for the one year period.
Profitability.The Independent Board Members reviewed summary data regarding the profitability of the Fundto the Adviser both with a pro rata administrative overhead charge and with a stand alone administrative charge and noted the effect of the expense limitation agreement. The Independent Board Members also noted that a portion of the Fund’s portfolio transactions were executed by an affiliated broker of the Adviser and that another affiliated broker of the Adviser received distribution fees and minor amounts of sales commissions.
Economies of Scale.The Independent Board Members discussed the major elements of the Adviser’s coststructure, the relationship of those elements to potential economies of scale and reviewed data provided by the Adviser.
Sharing of Economies of Scale.The Independent Board Members noted that the investment managementfee schedule for the Fund does not take into account any potential economies of scale that may develop.
Service and Cost Comparisons.The Independent Board Members compared the expense ratios of the investmentmanagement fee, other expenses and total expenses of the Fund to similar expense ratios of the Adviser Peer Group and a peer group of eight other global small/mid cap funds selected by Broadridge (the Broadridge Expense Peer Group), and noted that the Adviser’s management fee includes substantially all administrative services of the Fund as well as investment advisory services. The Independent Board Members noted the effect of the expense limitation agreement in place for the Fund. The Independent Board Members noted that the Fund’s total expense ratio was the third lowest for the Adviser Peer Group and the lowest for the Broadridge Expense Peer Group. The Independent Board Members also noted that the advisory fee structure was the same as that in effect for most of the Gabelli funds. The Independent Board Members were presented with, but did not consider to be material to their decision, various information comparing the advisory fee to the fee for other types of accounts managed by the Adviser.
20
The Gabelli Global Mini Mites Fund
Board Consideration andRe-Approval of Investment Advisory Agreement (Unaudited) (Continued)
Conclusions.The Independent Board Members concluded that the Fund enjoyed highly experienced portfoliomanagement services, good ancillary services and did not have a favorable performance record. The Independent Board Members also concluded that the Fund’s expense ratios and profitability to the Adviser were reasonable, and that economies of scale were not a significant factor in their thinking at this time. The Board Members did not view the potential profitability of ancillary services as material to their decision. On the basis of the foregoing and without assigning particular weight to any single conclusion, the Independent Board Members determined to recommend continuation of the investment advisory agreement to the full Board.
Based on a consideration of all these factors in their totality, the Board Members, including all of the Independent Board Members, determined that the Fund’s advisory fee was fair and reasonable with respect to the quality of services provided and in light of the other factors described above that the Board deemed relevant. Accordingly, the Board Members determined to approve the continuation of each Fund’s Advisory Agreement. The Board Members based their decision on evaluations of all these factors as a whole and did not consider any one factor asall-important or controlling.
21
The Gabelli Global Mini Mites Fund
Additional Fund Information (Unaudited)
The business and affairs of the Fund are managed under the direction of the Corporation’s Board of Directors. Information pertaining to the Directors and officers of the Fund is set forth below. The Corporation’s Statement of Additional Information includes additional information about the Fund’s Directors and is available without charge, upon request, by calling800-GABELLI(800-422-3554) or by writing to The Gabelli Global Mini Mites Fund at One Corporate Center, Rye, NY 10580-1422.
| | | | | | | | | | | | |
Name, Position(s) Address1 and Age | | Term of Office and Length of Time Served2 | | | Number of Funds in Fund Complex
Overseen by Director | | | Principal Occupation(s) During Past Five Years | | Other Directorships Held by Director3 |
| | | | |
INTERESTED DIRECTORS4: | | | | | | | | | | | | |
| | | | |
Mario J. Gabelli, CFA Director and Chief Investment Officer Age: 77 | | | Since 1993 | | | | 33 | | | Chairman, Chief Executive Officer, and Chief Investment Officer– Value Portfolios of GAMCO Investors, Inc. and Chief Investment Officer– Value Portfolios of Gabelli Funds, LLC and GAMCO Asset Management Inc.; Director/ Trustee or Chief Investment Officer of other registered investment companies within the Gabelli/GAMCO Fund Complex; Chief Executive Officer of GGCP, Inc.; Executive Chairman of Associated Capital Group, Inc. | | Director of Morgan Group Holdings, Inc. (holding company) (2001-2019); Chairman of the Board and Chief Executive Officer of LICT Corp. (multimedia and communication services company); Director of CIBL, Inc. (broadcasting and wireless communications); Director of ICTC Group Inc. (communications) (2013-2018) |
| | | | |
John D. Gabelli Director Age: 75 | | | Since 1993 | | | | 12 | | | Senior Vice President of G.research, LLC | | — |
| | | |
INDEPENDENT DIRECTORS5: | | | | | | | | | |
| | | | |
E. Val Cerutti Director Age: 80 | | | Since 2001 | | | | 7 | | | Chief Executive Officer of Cerutti Consultants, Inc. | | Director of The LGL Group, Inc. (diversified manufacturing) (1990-2009) |
| | | | |
Anthony J. Colavita6 Director Age: 84 | | | Since 1993 | | | | 20 | | | President of the law firm of Anthony J. Colavita, P.C. | | — |
| | | | |
Werner J. Roeder Director Age: 79 | | | Since 1993 | | | | 21 | | | Retired physician; Former Vice President of Medical Affairs (Medical Director) of New York Presbyterian/Lawrence Hospital (1999-2014) | | — |
| | | | |
Anthonie C. van Ekris6 Director Age: 85 | | | Since 1993 | | | | 23 | | | Chairman and Chief Executive Officer of BALMAC International, Inc. (global import/ export company) | | — |
| | | | |
Salvatore J. Zizza7 Director Age: 74 | | | Since 2004 | | | | 31 | | | President of Zizza & Associates Corp. (private holding company); President of Bergen Cove Realty Inc.; Chairman of Harbor Diversified, Inc. (pharmaceuticals) (2009-2018); Chairman of BAM (semiconductor and aerospace manufacturing) (2000-2018); Chairman of Metropolitan Paper Recycling Inc. (recycling) (2005-2014) | | Director and Chairman of Trans- Lux Corporation (business services); Director and Chairman of Harbor Diversified Inc. (pharmaceuticals) (2009-2018) |
22
The Gabelli Global Mini Mites Fund
Additional Fund Information (Continued) (Unaudited)
| | | | | | | | |
Name, Position(s)
Address1 and Age | | Term of Office
and Length of
Time Served2 | | | | | Principal Occupation(s) During Past Five Years |
| | | |
OFFICERS: | | | | | | | | |
| | | |
Bruce N. Alpert President Age: 68 | | | Since 1993 | | | | | Executive Vice President and Chief Operating Officer of Gabelli Funds, LLC since 1988; Officer of registered investment companies within the Gabelli/GAMCO Fund Complex; Senior Vice President of GAMCO Investors, Inc. since 2008 |
| | | |
John C. Ball Treasurer Age: 43 | | | Since 2017 | | | | | Treasurer of funds within the Gabelli/GAMCO Fund Complex since 2017; Vice President and Assistant Treasurer of AMG Funds, 2014-2017; Vice President of State Street Corporation, 2007-2014 |
| | | |
Agnes Mullady Vice President Age: 61 | | | Since 2006 | | | | | Officer of registered investment companies within the Gabelli/GAMCO Fund Complex since 2006; President and Chief Operating Officer of the Fund Division of Gabelli Funds, LLC since 2015; Chief Executive Officer of G.distributors, LLC since 2010; Senior Vice President of GAMCO Investors, Inc. since 2009; Vice President of Gabelli Funds, LLC since 2007; Executive Vice President of Associated Capital Group, Inc. since 2016 |
| | | |
Andrea R. Mango Secretary Age: 47 | | | Since 2013 | | | | | Vice President of GAMCO Investors, Inc. since 2016; Counsel of Gabelli Funds, LLC since 2013; Secretary of registered investment companies within the Gabelli/GAMCO Fund Complex since 2013; Vice President ofclosed-end funds within the Gabelli/GAMCO Fund Complex since 2014 |
| | | |
Richard J. Walz Chief Compliance Officer Age: 60 | | | Since 2013 | | | | | Chief Compliance Officer of registered investment companies within the Gabelli/GAMCO Fund Complex since 2013 |
| 1 | Address: One Corporate Center, Rye, NY 10580-1422, unless otherwise noted. |
| 2 | Each Director will hold office for an indefinite term until the earliest of (i) the next meeting of shareholders, if any, called for the purpose of considering the election orre-election of such Director and until the election and qualification of his or her successor, if any, elected at such meeting, or (ii) the date a Director resigns or retires, or a Director is removed by the Board of Directors or shareholders, in accordance with the Corporation’sBy-Laws and Articles of Incorporation. For Officers, includes time served in other officer positions with the corporation. Each officer will hold office for an indefinite term until the date he or she resigns or retires or until his or her successor is elected and qualified. |
| 3 | This column includes only directorships of companies required to report to the SEC under the Securities Exchange Act of 1934, as amended, i.e., public companies, or other investment companies registered under the 1940 Act. |
| 4 | “Interested person” of the Corporation as defined in the 1940 Act. Messrs. Mario J. Gabelli and John D. Gabelli, who are brothers, are each considered an “interested person” because of their affiliation with Gabelli Funds, LLC which acts as the Corporation’s investment adviser. |
| 5 | Directors who are not interested persons are considered “Independent” Directors. |
| 6 | Mr. Colavita’s son, Anthony S. Colavita, serves as a director of other funds in the Gabelli/GAMCO Fund Complex. Mr. van Ekris is an independent director of Gabelli International Ltd., Gabelli Fund LDC, GAMA Capital Opportunities Master Ltd., and GAMCO International SICAV, all of which may be deemed to be controlled by Mario J. Gabelli and/or affiliates and, in that event, would be deemed to be under common control with the Fund’s Adviser. |
| 7 | Mr. Zizza is an independent director of Gabelli International Ltd., which may be deemed to be controlled by Mario J. Gabelli and/or affiliates and in that event would be deemed to be under common control with the Fund’s Adviser. On September 9, 2015, Mr. Zizza entered into a settlement with the SEC to resolve an inquiry relating to an alleged violation regarding the making of false statements or omissions to the accountants of a company concerning a related party transaction. The company in question is not an affiliate of, nor has any connection to, the Fund. Under the terms of the settlement, Mr. Zizza, without admitting or denying the SEC’s findings and allegation, paid $150,000 and agreed to cease and desist committing or causing any future violations of Rule13b2-2 of the Securities Exchange Act of 1934, as amended. The Board has discussed this matter and has determined that it does not disqualify Mr. Zizza from serving as an Independent Director. |
23
| | |
Gabelli/GAMCO Funds and Your Personal Privacy | | |
Who are we?
The Gabelli/GAMCO Funds are investment companies registered with the Securities and Exchange Commission under the Investment Company Act of 1940. We are managed by Gabelli Funds, LLC, which is affiliated with GAMCO Investors, Inc., a publicly held company with subsidiaries and affiliates that provide investment advisory services for a variety of clients.
What kind ofnon-public information do we collect about you if you become a fund shareholder?
If you apply to open an account directly with us, you will be giving us somenon-public information about yourself. Thenon-public information we collect about you is:
| | ● | Information you give us on your application form.This could include your name, address, telephonenumber, social security number, bank account number, and other information. | |
| | ● | Information about your transactions with us, any transactions with our affiliates, and transactions with the entities we hire to provide services to you.This would include information about the shares thatyou buy or redeem. If we hire someone else to provide services — like a transfer agent — we will also have information about the transactions that you conduct through them. | |
What information do we disclose and to whom do we disclose it?
We do not disclose anynon-public personal information about our customers or former customers to anyone other than our affiliates, our service providers who need to know such information, and as otherwise permitted by law. If you want to find out what the law permits, you can read the privacy rules adopted by the Securities and Exchange Commission. They are in volume 17 of the Code of Federal Regulations, Part 248. The Commission often posts information about its regulations on its website, www.sec.gov.
What do we do to protect your personal information?
We restrict access tonon-public personal information about you to the people who need to know that information in order to provide services to you or the fund and to ensure that we are complying with the laws governing the securities business. We maintain physical, electronic, and procedural safeguards to keep your personal information confidential.
This page was intentionally left blank.
THE GABELLI GLOBAL MINI MITES FUND
One Corporate Center
Rye, NY 10580-1422
Portfolio Management Team Biographies
Mario J. Gabelli, CFA,is Chairman, Chief Executive Officer, and Chief Investment Officer - Value Portfolios ofGAMCO Investors, Inc. that he founded in 1977, and Chief Investment Officer - Value Portfolios of Gabelli Funds, LLC and GAMCO Asset Management Inc. He is also Executive Chairman of Associated Capital Group, Inc. Mr. Gabelli is a summa cum laude graduate of Fordham University and holds an MBA degree from Columbia Business School and Honorary Doctorates from Fordham University and Roger Williams University.
Sarah Donnellyjoined Gabelli in 1999 as a junior research analyst working with the consumer staples and mediaanalysts. Currently she is a portfolio manager of Gabelli Funds, LLC, a Senior Vice President, and the Food, Household, and Personal Care products research analyst for Gabelli & Company. In 2013, she was named the Health & Wellness research platform leader. Ms. Donnelly received a BS in Business Administration with a concentration in Finance and minor in History from Fordham University.
Ashish Sinhajoined GAMCO UK in 2012 as a research analyst. Prior to joining the Firm, Mr. Sinha was a researchanalyst at Morgan Stanley in London for seven years and has covered European Technology,Mid-Caps and Business Services. He also worked in planning and strategy at Birla Sun Life Insurance in India. Currently Mr. Sinha is a portfolio manager of Gabelli Funds, LLC and an Assistant Vice President of GAMCO Asset Management UK. Mr. Sinha has a BSBA degree from the Institute of Management Studies and an MB from IIFT.
Hendi Susantojoined Gabelli in 2007 as the lead technology research analyst. He spent his early career in supplychain management consulting and operations in the technology industry. He currently is a portfolio manager of Gabelli Funds, LLC and a Vice President of Associated Capital Group Inc. Mr. Susanto received a BS degree summa cum laude from the University of Minnesota, an MS from M.I.T., and an MBA from the Wharton School of Business.
Chong-Min Kangjoined the Gabelli in 2007 as a research analyst. He currently is a portfolio manager of GabelliFunds, LLC and a Senior Vice President of GAMCO Investors Inc. Mr. Kang received a BA degree from Boston College and an MBA from the Columbia Business School.
2019 TAX NOTICE TO SHAREHOLDERS(Unaudited)
For the year ended December 31, 2019, the Fund paid to shareholders ordinary income distributions (comprised of net investment income and short term capital gains) totaling $0.3479, $0.3454, $0.3101, and $0.3665 per share for Class AAA, Class A, Class C and Class I Shares, respectively. For the year ended December 31, 2019, 10.97% of the ordinary income distribution qualifies for the dividends received deduction available to corporations. The Fund designates 31.57% of the ordinary income distribution as qualified dividend income pursuant to the Jobs and Growth Tax Relief Reconciliation Act of 2003. The Fund designates 7.35% of the ordinary income distribution as qualified interest income pursuant to the Tax Relief, Unemployment Reauthorization, and Job Creation Act of 2010.
U.S. Government Income
The percentage of the ordinary income distribution paid by the Fund during 2019 which was derived from U.S. Treasury securities was 0.50%. Such income is exempt from state and local tax in all states. However, many states, including New York and California, allow a tax exemption for a portion of the income earned only if a mutual fund has invested at least 50% of its assets at the end of each quarter of the Fund’s fiscal year in U.S. Government securities. The Fund did not meet this strict requirement in 2019. The percentage of U.S. Government securities held as of December 31, 2019 was 0.00%. Due to the diversity in state and local tax law, it is recommended that you consult your personal tax adviser as to the applicability of the information provided to your specific situation.
All designations are based on financial information available as of the date of this annual report and, accordingly, are subject to change. For each item, it is the intention of the Fund to designate the maximum amount permitted under the Internal Revenue Code and the regulations thereunder.
We have separated the portfolio managers’ commentary from the financial statements and investment portfolio due to corporate governance regulations stipulated by the Sarbanes-Oxley Act of 2002. We have done this to ensure that the content of the portfolio managers’ commentary is unrestricted. Both the commentary and the financial statements, including the portfolio of investments, will be available on our website at www.gabelli.com.
GAMCO Global Series Funds, Inc.
THE GABELLI GLOBAL MINI MITES FUND
One Corporate Center
Rye, New York 10580-1422
t800-GABELLI(800-422-3554)
f914-921-5118
e info@gabelli.com
GABELLI.COM
Net Asset Value per share available daily
by calling800-GABELLI after 7:00 P.M.
| | |
| BOARD OF DIRECTORS | | OFFICERS |
| |
Mario J. Gabelli, CFA Chairman and Chief Executive Officer, GAMCO Investors, Inc. Executive Chairman, Associated Capital Group, Inc. E. Val Cerutti Chief Executive Officer, Cerutti Consultants, Inc. Anthony J. Colavita President, Anthony J. Colavita, P.C. John D. Gabelli Senior Vice President, G.research, LLC Werner J. Roeder Former Medical Director, Lawrence Hospital Anthonie C. van Ekris Chairman, BALMAC International, Inc. Salvatore J. Zizza Chairman, Zizza & Associates Corp. | | Bruce N. Alpert President John C. Ball Treasurer Agnes Mullady Vice President Andrea R. Mango Secretary Richard J. Walz Chief Compliance Officer DISTRIBUTOR G.distributors, LLC CUSTODIAN State Street Bank and Trust Company TRANSFER AGENT AND DIVIDEND DISBURSING AGENT DST Asset Manager Solutions, Inc. LEGAL COUNSEL Skadden, Arps, Slate, Meagher & Flom LLP |
This report is submitted for the general information of the shareholders of The Gabelli Global Mini Mites Fund. It is not authorized for distribution to prospective investors unless preceded or accompanied by an effective prospectus.
GAB3634Q419AR
Item 2. Code of Ethics.
| | (a) | The registrant, as of the end of the period covered by this report, has adopted a code of ethics that applies to the registrant’s principal executive officer, principal financial officer, principal accounting officer or controller, or persons performing similar functions, regardless of whether these individuals are employed by the registrant or a third party. |
| | (c) | There have been no amendments, during the period covered by this report, to a provision of the code of ethics that applies to the registrant’s principal executive officer, principal financial officer, principal accounting officer or controller, or persons performing similar functions, regardless of whether these individuals are employed by the registrant or a third party, and that relates to any element of the code of ethics description. |
| | (d) | The registrant has not granted any waivers, including an implicit waiver, from a provision of the code of ethics that applies to the registrant’s principal executive officer, principal financial officer, principal accounting officer or controller, or persons performing similar functions, regardless of whether these individuals are employed by the registrant or a third party, that relates to one or more of the items set forth in paragraph (b) of this item’s instructions. |
Item 3. Audit Committee Financial Expert.
As of the end of the period covered by the report, the registrant’s Board of Directors has determined that Salvatore J. Zizza is qualified to serve as an audit committee financial expert serving on its audit committee and that he is “independent,” as defined by Item 3 of FormN-CSR.
Item 4. Principal Accountant Fees and Services.
Audit Fees
| | (a) | The aggregate fees billed for each of the last two fiscal years for professional services rendered by the principal accountant for the audit of the registrant’s annual financial statements or services that are normally provided by the accountant in connection with statutory and regulatory filings or engagements for those fiscal years are $130,900 for 2018 and $130,900 for 2019. |
Audit-Related Fees
| | (b) | The aggregate fees billed in each of the last two fiscal years for assurance and related services by the principal accountant that are reasonably related to the performance of the audit of the registrant’s financial statements and are not reported under paragraph (a) of this Item are $3,500 for 2018 and $0 for 2019. |
Tax Fees
| | (c) | The aggregate fees billed in each of the last two fiscal years for professional services rendered by the principal accountant for tax compliance, tax advice, and tax planning are $19,000 for 2018 |
| | and $19,000 for 2019. Tax fees represent tax compliance services provided in connection with the review of the Registrant’s tax returns. |
All Other Fees
| | (d) | The aggregate fees billed in each of the last two fiscal years for products and services provided by the principal accountant, other than the services reported in paragraphs (a) through (c) of this Item are $4,803 for 2018 and $6,238 for 2019. The fees relate to Passive Foreign Investment Company identification database subscription fees billed on an annual basis. |
| | (e)(1) | Disclose the audit committee’spre-approval policies and procedures described in paragraph (c)(7) of Rule2-01 of RegulationS-X. |
Pre-Approval Policies and Procedures. The Audit Committee (“Committee”) of the registrant is responsible forpre-approving (i) all audit and permissiblenon-audit services to be provided by the independent registered public accounting firm to the registrant and (ii) all permissiblenon-audit services to be provided by the independent registered public accounting firm to the Adviser, Gabelli Funds, LLC, and any affiliate of Gabelli Funds, LLC (“Gabelli”) that provides services to the registrant (a “Covered Services Provider”) if the independent registered public accounting firm’s engagement related directly to the operations and financial reporting of the registrant. The Committee may delegate its responsibility topre-approve any such audit and permissiblenon-audit services to the Chairperson of the Committee, and the Chairperson must report to the Committee, at its next regularly scheduled meeting after the Chairperson’spre-approval of such services, his or her decision(s). The Committee may also establish detailedpre-approval policies and procedures forpre-approval of such services in accordance with applicable laws, including the delegation of some or all of the Committee’spre-approval responsibilities to the other persons (other than Gabelli or the registrant’s officers).Pre-approval by the Committee of any permissiblenon-audit services is not required so long as: (i) the permissiblenon-audit services were not recognized by the registrant at the time of the engagement to benon-audit services; and (ii) such services are promptly brought to the attention of the Committee and approved by the Committee or Chairperson prior to the completion of the audit.
| | (e)(2) | The percentage of services described in each of paragraphs (b) through (d) of this Item that were approved by the audit committee pursuant to paragraph (c)(7)(i)(C) of Rule2-01 of RegulationS-X are as follows: |
(b) N/A
(c) 0%
(d) 0%
| | (f) | The percentage of hours expended on the principal accountant’s engagement to audit the registrant’s financial statements for the most recent fiscal year that were attributed to work performed by persons other than the principal accountant’s full-time, permanent employees was less than fifty percent. |
| | (g) | The aggregatenon-audit fees billed by the registrant’s accountant for services rendered to the registrant, and rendered to the registrant’s investment adviser (not including anysub-adviser whose role is primarily portfolio management and is subcontracted with or overseen by another |
| | investment adviser), and any entity controlling, controlled by, or under common control with the adviser that provides ongoing services to the registrant for each of the last two fiscal years of the registrant was $62,121 for 2018 and $68,798 for 2019. |
| | (h) | The registrant’s audit committee of the board of directors has considered whether the provision ofnon-audit services that were rendered to the registrant’s investment adviser (not including anysub-adviser whose role is primarily portfolio management and is subcontracted with or overseen by another investment adviser), and any entity controlling, controlled by, or under common control with the investment adviser that provides ongoing services to the registrant that were notpre-approved pursuant to paragraph (c)(7)(ii) of Rule2-01 of RegulationS-X is compatible with maintaining the principal accountant’s independence. |
Item 5. Audit Committee of Listed Registrants.
Not applicable.
Item 6. Investments.
| (a) | Schedule of Investments in securities of unaffiliated issuers as of the close of the reporting period is included as part of the report to shareholders filed under Item 1 of this form. |
| (b) | Not applicable due to no such divestments during the semi-annual period covered since the previous FormN-CSR filing. |
| Item 7. | Disclosure of Proxy Voting Policies and Procedures forClosed-End Management Investment Companies. |
Not applicable.
Item 8. Portfolio Managers ofClosed-End Management Investment Companies.
Not applicable.
| Item 9. | Purchases of Equity Securities byClosed-End Management Investment Company and Affiliated Purchasers. |
Not applicable.
Item 10. Submission of Matters to a Vote of Security Holders.
There have been no material changes to the procedures by which the shareholders may recommend nominees to the registrant’s Board of Directors, where those changes were implemented after the registrant last provided disclosure in response to the requirements of Item 407(c)(2)(iv) of RegulationS-K (17 CFR 229.407) (as required by Item 22(b)(15) of Schedule 14A (17 CFR240.14a-101)), or this Item.
Item 11. Controls and Procedures.
| | (a) | The registrant’s principal executive and principal financial officers, or persons performing similar functions, have concluded that the registrant’s disclosure controls and procedures (as defined in Rule30a-3(c) under the Investment Company Act of 1940, as amended (the “1940 |
| | Act”) (17 CFR270.30a-3(c))) are effective, as of a date within 90 days of the filing date of the report that includes the disclosure required by this paragraph, based on their evaluation of these controls and procedures required by Rule30a-3(b) under the 1940 Act (17 CFR270.30a-3(b)) and Rules13a-15(b) or15d-15(b) under the Securities Exchange Act of 1934, as amended (17 CFR240.13a-15(b) or240.15d-15(b)). |
| | (b) | There were no changes in the registrant’s internal control over financial reporting (as defined in Rule30a-3(d) under the 1940 Act (17 CFR270.30a-3(d))) that occurred during the period covered by this report that has materially affected, or is reasonably likely to materially affect, the registrant’s internal control over financial reporting. |
| Item 12. | Disclosure of Securities Lending Activities forClosed-End Management Investment Companies. |
Not applicable.
Item 13. Exhibits.
| | (a)(1) | Code of ethics, or any amendment thereto, that is the subject of disclosure required by Item 2 is attached hereto. |
| | (a)(2) | Certifications pursuant to Rule30a-2(a) under the 1940 Act and Section 302 of the Sarbanes-Oxley Act of 2002 are attached hereto. |
| | (b) | Certifications pursuant to Rule30a-2(b) under the 1940 Act and Section 906 of the Sarbanes- Oxley Act of 2002 are attached hereto. |
SIGNATURES
Pursuant to the requirements of the Securities Exchange Act of 1934 and the Investment Company Act of 1940, the registrant has duly caused this report to be signed on its behalf by the undersigned, thereunto duly authorized.
| | |
(Registrant) | | GAMCO Global Series Funds, Inc. |
| | |
By (Signature and Title)* | | /s/ Bruce N. Alpert |
| | Bruce N. Alpert, Principal Executive Officer |
Pursuant to the requirements of the Securities Exchange Act of 1934 and the Investment Company Act of 1940, this report has been signed below by the following persons on behalf of the registrant and in the capacities and on the dates indicated.
| | |
By (Signature and Title)* | | /s/ Bruce N. Alpert |
| | Bruce N. Alpert, Principal Executive Officer |
| | |
By (Signature and Title)* | | /s/ John C. Ball |
| | John C. Ball, Principal Financial Officer and Treasurer |
* Print the name and title of each signing officer under his or her signature.