UNITED STATES
SECURITIES AND EXCHANGE COMMISSION
Washington, D.C. 20549
FORM N-CSR
CERTIFIED SHAREHOLDER REPORT OF REGISTERED MANAGEMENT INVESTMENT COMPANIES
Investment Company Act file number 811-07896
GAMCO Global Series Funds, Inc.
(Exact name of registrant as specified in charter)
One Corporate Center
Rye, New York 10580-1422
(Address of principal executive offices) (Zip code)
Bruce N. Alpert
Gabelli Funds, LLC
One Corporate Center
Rye, New York 10580-1422
(Name and address of agent for service)
Registrant’s telephone number, including area code: 1-800-422-3554
Date of fiscal year end: December 31
Date of reporting period: December 31, 2021
Form N-CSR is to be used by management investment companies to file reports with the Commission not later than 10 days after the transmission to stockholders of any report that is required to be transmitted to stockholders under Rule 30e-1 under the Investment Company Act of 1940 (17 CFR 270.30e-1). The Commission may use the information provided on Form N-CSR in its regulatory, disclosure review, inspection, and policymaking roles.
A registrant is required to disclose the information specified by Form N-CSR, and the Commission will make this information public. A registrant is not required to respond to the collection of information contained in Form N-CSR unless the Form displays a currently valid Office of Management and Budget (“OMB”) control number. Please direct comments concerning the accuracy of the information collection burden estimate and any suggestions for reducing the burden to Secretary, Securities and Exchange Commission, 450 Fifth Street, NW, Washington, DC 20549-0609. The OMB has reviewed this collection of information under the clearance requirements of 44 U.S.C. § 3507.
Item 1. Reports to Stockholders.
| (a) | The Report to Shareholders is attached herewith. |
The Gabelli Global Content & Connectivity Fund
Annual Report — December 31, 2021
(Y)our Portfolio Management Team
| |  |  | |
| | Evan D. Miller, CFA | Sergey Dluzhevskiy, CFA, CPA | |
| | Portfolio Manager
BA, Northwestern University
MBA, Booth School of Business,
University of Chicago | Portfolio Manager
BS, Case Western
Reserve University
MBA, The Wharton School,
University of Pennsylvania | |
To Our Shareholders,
For the year ended December 31, 2021, the net asset value (NAV) total return per Class AAA Share of The Gabelli Global Content & Connectivity Fund was 5.2% compared with a total return of 10.8% for the Morgan Stanley Capital International (MSCI) All Country (AC) World Communication Services Index. Other classes of shares are available. See page 4 for performance information for all classes.
Enclosed are the financial statements, including the schedule of investments, as of December 31, 2021.
Investment Objective and Strategy (Unaudited)
The Fund primarily seeks to provide investors with appreciation of capital. Current income is a secondary objective of the Fund.
The Fund’s investment strategy is to invest its total assets in common stocks of companies in the telecommunications, media, and information technology industries which Gabelli Funds, LLC, the Adviser, believes are likely to have rapid growth in revenues and earnings and potential for above average capital appreciation or are undervalued. In accordance with its concentration policy, the Fund will invest at least 25% of the value of its total assets in the telecommunications related industry, and not invest more than 25% of the value of its total assets in any other particular industry.
| As permitted by regulations adopted by the Securities and Exchange Commission, paper copies of the Fund’s annual and semiannual shareholder reports will no longer be sent by mail, unless you specifically request paper copies of the reports. Instead, the reports will be made available on the Fund’s website (www.gabelli.com), and you will be notified by mail each time a report is posted and provided with a website link to access the report. If you already elected to receive shareholder reports electronically, you will not be affected by this change and you need not take any action. To elect to receive all future reports on paper free of charge, please contact your financial intermediary, or, if you invest directly with the Fund, you may call 800-422-3554 or send an email request to info@gabelli.com. |
Performance Discussion (Unaudited)
Global equities continued to advance in first quarter 2021, driven by the COVID-19 vaccine rollout and significant ($1.9 trillion) fiscal stimulus plan passed in the U.S. Rising bond yields and increasing optimism about the outlook for global growth have led to cyclical sectors (energy, financials, industrials) leading the market in the quarter. The Communication services sector (+6.6%) ended up in the middle of the pack, moderately outperforming the broad index, as MSCI AC World Index gained 5.1%. Sector performance was largely driven by the Media & Entertainment Industry Group (up 7.4%), helped by meaningful gains in Alphabet and Facebook shares.
Global equities continued to advance in second quarter, driven by the accelerated COVID-19 vaccine rollout and further relaxation of pandemic related mobility restrictions in most developed markets as well as the prospect of additional fiscal stimulus (through increased infrastructure spending) in the U.S. The impact from these “tailwind” factors was somewhat tempered by investor concerns over the rise of inflation in certain countries, increased regulatory scrutiny over e-commerce companies in China, and the spread of the Delta COVID-19 variant. The market was led by the Information Technology, Energy, and Healthcare sectors, with Communication Services finishing in the middle of the pack, but moderately outperforming the broad index (with MSCI AC World Index up 7.5%), helped by meaningful gains in Alphabet and Facebook.
While global equities remained largely resilient throughout most of third quarter, downward pressure on the markets in the final few weeks of September, driven by concerns about rising inflation, supply chain disruptions, more hawkish commentary from central banks, and increased regulatory scrutiny of a number of industries in China, put the MSCI AC World Index into negative territory for the quarter (-1.0%). While Energy and Financials were the top performers in third quarter, Communication Services sector (-2.5%) was one of the laggards in the quarter.
Global equities gained in the fourth quarter (with MSCI AC World Index up 6.7%), as strong earnings growth outweighed the risk factors, including a more hawkish stance by the Federal Reserve and the emergence of the new Omicron virus variant (which initially heightened equity market volatility). While Information Technology and Utilities were the top performers in fourth quarter, Communication Services sector (-1.5%) was the laggard in the quarter, as investors rotated out of some of the high multiple internet focused names that lack meaningful profits or cash flows (Snap, Twitter, Sea, Roku, etc.).
Selected holdings that contributed positively to performance in 2021 were:
Microsoft, Corp. (3.2% of net assets as of December 31, 2021) develops, licenses, and supports software, services, devices, and solutions worldwide; Wideopenwest, Inc. (2.7%), provides high-speed data, cable television, and digital telephony to residential and business customers across 14 markets, primarily in the Midwest and Southeast United States; and Alphabet, Inc. (9.9%) is a holding company whose subsidiaries include the core Google business (Search, Android, YouTube, Cloud) as well as multiple independent companies, e.g., GV, Waymo, Verily.
Some of our weaker performing stocks during the year:
SoftBank Group Corp. (5.7%) provides telecommunication services in Japan and internationally; T-Mobile US, Inc. (6.6%) is the second largest wireless operator in the U.S., serving over 105 million branded customers; and Alibaba Group Holdings, ADR (no longer held), through its subsidiaries, provides technology infrastructure and marketing reach to merchants, brands, retailers, and other businesses to engage with their users and customers in the People’s Republic of China and internationally.
Thank you for your investment in The Gabelli Global Content and Connectivity Fund.
We appreciate your confidence and trust.
Comparative Results
Average Annual Returns through December 31, 2021 (a) (Unaudited)
Total returns and average annual returns reflect changes in share price, reinvestment of distributions, and are net of expenses.
| | | 1 Year | | 5 Year | | 10 Year | | 15 Year | | Since
Inception
(11/1/93) |
| Class AAA (GABTX) | | 5.17 | % | | 7.18 | % | | 6.80 | % | | 3.81 | % | | 7.14 | % |
| MSCI AC World Communication Services Index (b) | | 10.82 | | | 10.93 | | | 8.94 | | | 6.59 | | | N/A | |
| MSCI AC World Index (b) | | 19.04 | | | 14.97 | | | 12.44 | | | 7.62 | | | 8.28 | |
| Class A (GTCAX) | | 5.16 | | | 7.17 | | | 6.78 | | | 3.80 | | | 7.14 | |
| With sales charge (c) | | (0.88 | ) | | 5.91 | | | 6.15 | | | 3.39 | | | 6.91 | |
| Class C (GTCCX) | | 5.17 | | | 6.71 | | | 6.16 | | | 3.13 | | | 6.59 | |
| With contingent deferred sales charge (d) | | 4.17 | | | 6.71 | | | 6.16 | | | 3.13 | | | 6.59 | |
| Class I (GTTIX) | | 5.18 | | | 7.63 | | | 7.16 | | | 4.12 | | | 7.31 | |
| (a) | Returns would have been lower had the Adviser not reimbursed certain expenses. The Fund imposes a 2% redemption fee on shares sold or exchanged within seven days of purchase. The Class AAA Share NAVs are used to calculate performance for the periods prior to the issuance of Class A Shares, Class C Shares, and Class I Shares, on March 12, 2000, June 2, 2000, and January 11, 2008, respectively. The actual performance for the Class A Shares, and Class C Shares would have been lower due to the additional fees and expenses associated with these classes of shares. The actual performance of the Class I Shares would have been higher due to lower expenses related to this class of shares. |
| (b) | The MSCI AC World Communication Services Index is an unmanaged index that measures the performance of Communication Services from around the world. The MSCI AC World Index is an unmanaged market capitalization weighted index that is designed to measure the equity market performance of developed and emerging markets. The MSCI AC World Index consists of 50 country indices comprising 23 developed and 27 emerging market country indices. Dividends are considered reinvested. You cannot invest directly in an index. MSCI AC World Index since inception performance is as of October 31, 1993. |
| (c) | Performance results include the effect of the maximum 5.75% sales charge at the beginning of the period. |
| (d) | Assuming payment of the 1% maximum contingent deferred sales charge imposed on redemptions made within one year of purchase. No existing C Class shares are currently subject to the CDSC as of the date of this report. |
In the current prospectuses dated April 30, 2021, the gross expense ratios for Class AAA, A, C, and I Shares are 1.77%, 1.77%, 2.52%, and 1.52%, respectively, and the net expense ratios for all share classes after contractual reimbursements by Gabelli Funds, LLC, (the Adviser) is 0.90%. See page 12 for the expense ratios for the year ended December 31, 2021. The contractual reimbursement is in effect through April 30, 2022. Class AAA and Class I Shares do not have a sales charge. The maximum sales charge for Class A Shares, and Class C Shares is 5.75%, and 1.00%, respectively.
Investing in foreign securities involves risks not ordinarily associated with investments in domestic issues, including currency fluctuation, economic, and political risks. Investors should carefully consider the investment objectives, risks, charges, and expenses of the Fund before investing. The prospectus contains information about these and other matters and should be read carefully before investing. To obtain a prospectus, please visit our website at www.gabelli.com.
Returns represent past performance and do not guarantee future results. Investment returns and the principal value of an investment will fluctuate. When shares are redeemed, they may be worth more or less than their original cost. Current performance may be lower or higher than the performance data presented. Visit www.gabelli.com for performance information as of the most recent month end.
COMPARISON OF CHANGE IN VALUE OF A $10,000 INVESTMENT IN
THE GABELLI GLOBAL CONTENT & CONECTIVITY FUND (CLASS AAA SHARES), MSCI AC WORLD
COMMUNICATION SERVICES INDEX AND MSCI AC WORLD INDEX (Unaudited)
| Average Annual Total Returns* |
| | 1 Year | 5 Year | 10 Year |
| Class AAA | 5.17% | 7.18% | 6.80% |
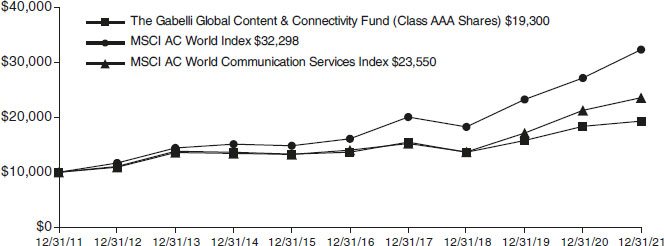
* Past performance is not predictive of future results. The performance tables and graph do not reflect the deduction of taxes that a shareholder would pay on Fund distributions or the redemption of Fund shares.
The Gabelli Global Content & Connectivity Fund
Disclosure of Fund Expenses (Unaudited) For the Six Month Period from July 1, 2021 through December 31, 2021 | Expense Table |
We believe it is important for you to understand the impact of fees and expenses regarding your investment. All mutual funds have operating expenses. As a shareholder of a fund, you incur ongoing costs, which include costs for portfolio management, administrative services, and shareholder reports (like this one), among others. Operating expenses, which are deducted from a fund’s gross income, directly reduce the investment return of a fund. When a fund’s expenses are expressed as a percentage of its average net assets, this figure is known as the expense ratio. The following examples are intended to help you understand the ongoing costs (in dollars) of investing in your Fund and to compare these costs with those of other mutual funds. The examples are based on an investment of $1,000 made at the beginning of the period shown and held for the entire period.
The Expense Table below illustrates your Fund’s costs in two ways:
Actual Fund Return: This section provides information about actual account values and actual expenses. You may use this section to help you to estimate the actual expenses that you paid over the period after any fee waivers and expense reimbursements. The “Ending Account Value” shown is derived from the Fund’s actual return during the past six months, and the “Expenses Paid During Period” shows the dollar amount that would have been paid by an investor who started with $1,000 in the Fund. You may use this information, together with the amount you invested, to estimate the expenses that you paid over the period.
To do so, simply divide your account value by $1,000 (for example, an $8,600 account value divided by $1,000 = 8.6), then multiply the result by the number given for your Fund under the heading “Expenses Paid During Period” to estimate the expenses you paid during this period.
Hypothetical 5% Return: This section provides information about hypothetical account values and hypothetical expenses based on the Fund’s actual expense ratio. It assumes a hypothetical annualized return of 5% before expenses during the period shown. In this case – because the hypothetical return used is not the Fund’s actual return – the results do not apply to your investment and you cannot use the hypothetical account value and expense to estimate the actual ending account balance or expenses you
paid for the period. This example is useful in making comparisons of the ongoing costs of investing in the Fund and other funds. To do so, compare this 5% hypothetical example with the 5% hypothetical examples that appear in shareholder reports of other funds.
Please note that the expenses shown in the table are meant to highlight your ongoing costs only and do not reflect any transactional costs such as sales charges (loads), redemption fees, or exchange fees, if any, which are described in the Prospectus. If these costs were applied to your account, your costs would be higher. Therefore, the 5% hypothetical return is useful in comparing ongoing costs only, and will not help you determine the relative total costs of owning different funds. The “Annualized Expense Ratio” represents the actual expenses for the last six months and may be different from the expense ratio in the Financial Highlights which is for the year ended December 31, 2021.
| | | Beginning
Account Value
07/01/21 | | Ending
Account Value
12/31/21 | | Annualized
Expense
Ratio | | Expenses
Paid During
Period * |
| The Gabelli Global Content & Connectivity Fund |
| Actual Fund Return |
| Class AAA | | $1,000.00 | | | $942.10 | | | 0.90 | % | | $ 4.41 | |
| Class A | | $1,000.00 | | | $942.20 | | | 0.90 | % | | $ 4.41 | |
| Class C | | $1,000.00 | | | $942.10 | | | 0.90 | % | | $ 4.41 | |
| Class I | | $1,000.00 | | | $942.30 | | | 0.90 | % | | $ 4.41 | |
| Hypothetical 5% Return | | | | | | | | | | | | |
| Class AAA | | $1,000.00 | | | $1,020.67 | | | 0.90 | % | | $ 4.58 | |
| Class A | | $1,000.00 | | | $1,020.67 | | | 0.90 | % | | $ 4.58 | |
| Class C | | $1,000.00 | | | $1,020.67 | | | 0.90 | % | | $ 4.58 | |
| Class I | | $1,000.00 | | | $1,020.67 | | | 0.90 | % | | $ 4.58 | |
| * | Expenses are equal to the Fund’s annualized expense ratio for the last six months multiplied by the average account value over the period, multiplied by the number of days in the most recent fiscal half year (184 days), then divided by 365. |
Summary of Portfolio Holdings (Unaudited)
The following table presents portfolio holdings as a percent of net assets as of December 31, 2021:
The Gabelli Global Content & Connectivity Fund
| Communication Services | 73.1% | | Real Estate | 4.4 | % |
| Information Technology | 11.4% | | Other Assets and Liabilities (Net) | (0.3) | % |
| Consumer Discretionary | 5.8% | | | 100.0 | % |
| Financials | 5.6% | | | |
The Fund files a complete schedule of portfolio holdings with the Securities and Exchange Commission (the SEC) for the first and third quarters of each fiscal year on Form N-PORT. Shareholders may obtain this information at www.gabelli.com or by calling the Fund at 800-GABELLI (800-422-3554). The Fund’s Form N-PORT is available on the SEC’s website at www.sec.gov and may also be reviewed and copied at the SEC’s Public Reference Room in Washington, DC. Information on the operation of the Public Reference Room may be obtained by calling 800-SEC-0330.
Proxy Voting
The Fund files Form N-PX with its complete proxy voting record for the twelve months ended June 30, no later than August 31 of each year. A description of the Fund’s proxy voting policies, procedures, and how the Fund voted proxies relating to portfolio securities is available without charge, upon request, by (i) calling 800-GABELLI (800-422-3554); (ii) writing to The Gabelli Funds at One Corporate Center, Rye, NY 10580-1422; or (iii) visiting the SEC’s website at www.sec.gov.
The Gabelli Global Content & Connectivity Fund
Schedule of Investments — December 31, 2021
| Shares | | | | | Cost | | | Market
Value | |
| | | | | COMMON STOCKS — 99.1% | | | | | | | | |
| | | | | COMMUNICATION SERVICES — 73.1% | | | | | | | | |
| | | | | Telecommunication Services — 36.6% | | | | | | | | |
| | | | | Wireless Telecommunication Services — 24.6% | | | | |
| | | | | Wireless Telecommunication Services — 24.6% | | | | |
| | 50,000 | | | America Movil SAB de CV, Cl. L, ADR | | $ | 167,719 | | | $ | 1,055,500 | |
| | 30,000 | | | Anterix Inc.† | | | 1,224,120 | | | | 1,762,800 | |
| | 25,000 | | | KDDI Corp. | | | 160,514 | | | | 730,679 | |
| | 55,000 | | | Millicom International Cellular SA, SDR† | | | 1,817,858 | | | | 1,566,090 | |
| | 100,000 | | | MTN Group Ltd.† | | | 424,151 | | | | 1,071,289 | |
| | 25,000 | | | Rogers Communications Inc., Cl. B | | | 637,063 | | | | 1,190,750 | |
| | 155,000 | | | Sistema PJSC FC, GDR | | | 727,348 | | | | 961,000 | |
| | 95,000 | | | SoftBank Group Corp. | | | 4,223,582 | | | | 4,487,786 | |
| | 45,000 | | | T-Mobile US Inc.† | | | 931,296 | | | | 5,219,100 | |
| | 14,000 | | | United States Cellular Corp.† | | | 396,170 | | | | 441,280 | |
| | 62,000 | | | Vodafone Group plc, ADR | | | 961,428 | | | | 925,660 | |
| | | | | | | | 11,671,249 | | | | 19,411,934 | |
| | | | | | | | | | | | | |
| | | | | Diversified Telecommunication Services — 12.0% | | | | |
| | | | | Integrated Telecommunication Services — 11.1% | | | | |
| | 33,000 | | | AT&T Inc. | | | 805,168 | | | | 811,800 | |
| | 37,415,054 | | | Cable & Wireless Jamaica Ltd.†(a) | | | 499,070 | | | | 281,771 | |
| | 100,000 | | | Deutsche Telekom AG | | | 1,822,762 | | | | 1,855,755 | |
| | 13,000 | | | Frontier Communications Parent Inc.† | | | 406,731 | | | | 383,370 | |
| | 35,000 | | | Telenor ASA | | | 494,536 | | | | 550,840 | |
| | 87,000 | | | Telephone and Data Systems Inc. | | | 1,602,488 | | | | 1,753,050 | |
| | 50,000 | | | TELUS Corp. | | | 306,092 | | | | 1,178,500 | |
| | 37,000 | | | Verizon Communications Inc. | | | 1,117,809 | | | | 1,922,520 | |
| | | | | | | | 7,054,656 | | | | 8,737,606 | |
| | | | | | | | | | | | | |
| | | | | Alternative Carriers — 0.9% | | | | | | | | |
| | 60,000 | | | Lumen Technologies Inc. | | | 602,658 | | | | 753,000 | |
| | | | | | | | | | | | | |
| | | | | Media & Entertainment — 36.5% | | | | | | | | |
| | | | | Interactive Media & Services — 17.6% | | | | | | | | |
| | | | | Interactive Media & Services — 17.6% | | | | | | | | |
| | 2,700 | | | Alphabet Inc., Cl. C† | | | 2,750,490 | | | | 7,812,693 | |
| | 18,000 | | | Meta Platforms Inc., Cl. A† | | | 2,932,573 | | | | 6,054,300 | |
| | | | | | | | 5,683,063 | | | | 13,866,993 | |
| | | | | | | | | | | | | |
| | | | | Media — 10.7% | | | | | | | | |
| | | | | Cable & Satellite — 10.7% | | | | | | | | |
| | 80,000 | | | Comcast Corp., Cl. A | | | 2,409,231 | | | | 4,026,400 | |
| | 12,000 | | | DISH Network Corp., Cl. A† | | | 223,644 | | | | 389,280 | |
| | 67,000 | | | Liberty Global plc, Cl. C† | | | 970,248 | | | | 1,882,030 | |
| Shares | | | | | Cost | | | Market
Value | |
| | 100,000 | | | WideOpenWest Inc.† | | $ | 551,848 | | | $ | 2,152,000 | |
| | | | | | | | 4,154,971 | | | | 8,449,710 | |
| | | | | | | | | | | | | |
| | | | | Entertainment — 8.2% | | | | | | | | |
| | | | | Movies & Entertainment — 6.7% | | | | | | | | |
| | 220,000 | | | Bollore SA | | | 1,301,496 | | | | 1,232,313 | |
| | 100,000 | | | Borussia Dortmund GmbH & Co. KGaA† | | | 569,360 | | | | 494,109 | |
| | 15,000 | | | Liberty Media Corp.- Liberty Braves, Cl. C† | | | 269,506 | | | | 421,500 | |
| | 3,000 | | | Madison Square Garden Sports Corp.† | | | 149,460 | | | | 521,190 | |
| | 75,000 | | | Manchester United plc, Cl. A | | | 1,144,297 | | | | 1,068,000 | |
| | 120,000 | | | OL Groupe SA† | | | 317,059 | | | | 273,240 | |
| | 8,500 | | | The Walt Disney Co.† | | | 797,830 | | | | 1,316,565 | |
| | | | | | | | 4,549,008 | | | | 5,326,917 | |
| | | | | | | | | | | | | |
| | | | | Interactive Home Entertainment — 1.5% | | | | | | | | |
| | 3,500 | | | Take-Two Interactive Software Inc.† | | | 351,334 | | | | 622,020 | |
| | 11,000 | | | Ubisoft Entertainment SA† | | | 629,137 | | | | 539,387 | |
| | | | | | | | 980,471 | | | | 1,161,407 | |
| | | | | | | | | | | | | |
| | | | | TOTAL COMMUNICATION SERVICES | | | 34,696,076 | | | | 57,707,567 | |
| | | | | INFORMATION TECHNOLOGY — 10.3% | | | | | | | | |
| | | | | Software & Services — 6.4% | | | | | | | | |
| | | | | Software — 3.2% | | | | | | | | |
| | | | | Systems Software — 3.2% | | | | | | | | |
| | 7,500 | | | Microsoft Corp. | | | 987,236 | | | | 2,522,400 | |
| | | | | | | | | | | | | |
| | | | | IT Services — 3.2% | | | | | | | | |
| | | | | Data Processing & Outsourced Services — 2.7% | | | | |
| | 3,200 | | | Mastercard Inc., Cl. A | | | 601,519 | | | | 1,149,824 | |
| | 3,500 | | | PayPal Holdings Inc.† | | | 427,641 | | | | 660,030 | |
| | 1,500 | | | Visa Inc., Cl. A | | | 163,671 | | | | 325,065 | |
| | | | | | | | 1,192,831 | | | | 2,134,919 | |
| | | | | | | | | | | | | |
| | | | | Internet Services and Infrastructure — 0.5% | | | | | | | | |
| | 16,000 | | | GMO internet Inc. | | | 438,270 | | | | 377,640 | |
| | | | | | | | | | | | | |
| | | | | Technology Hardware & Equipment — 3.9% | | | | | | | | |
| | | | | Technology Hardware, Storage & Peripherals — 2.5% | | | | |
| | | | | Technology Hardware, Storage & Peripherals — 2.5% | | | | |
| | 11,000 | | | Apple Inc. | | | 438,810 | | | | 1,953,270 | |
| | | | | | | | | | | | | |
| | | | | Electronic Equipment, Instruments & Components — 1.4% | |
| | | | | Electronic Equipment & Instruments — 1.4% | | | | | | | | |
| | 9,000 | | | Sony Group Corp., ADR | | | 595,858 | | | | 1,137,600 | |
| | | | | | | | | | | | | |
| | | | | TOTAL INFORMATION TECHNOLOGY | | | 3,653,005 | | | | 8,125,829 | |
See accompanying notes to financial statements.
The Gabelli Global Content & Connectivity Fund
Schedule of Investments (Continued) — December 31, 2021
| Shares | | | | | Cost | | | Market
Value | |
| | | | | COMMON STOCKS (Continued) | | | | | | | | |
| | | | | CONSUMER DISCRETIONARY — 5.8% | | | | | | | | |
| | | | | Retailing — 5.8% | | | | | | | | |
| | | | | Internet & Direct Marketing Retail — 5.8% | | | | |
| | | | | Internet & Direct Marketing Retail — 5.8% | | | | |
| | 50,000 | | | Prosus NV | | $ | 4,237,722 | | | $ | 4,185,695 | |
| | 5,000 | | | Zalando SE† | | | 392,645 | | | | 404,965 | |
| | | | | | | | 4,630,367 | | | | 4,590,660 | |
| | | | | | | | | | | | | |
| | | | | TOTAL CONSUMER DISCRETIONARY | | | 4,630,367 | | | | 4,590,660 | |
| | | | | | | | | | | | | |
| | | | | FINANCIALS — 5.5% | | | | | | | | |
| | | | | Diversified Financials — 5.5% | | | | | | | | |
| | | | | Diversified Financial Services — 5.5% | | | | | | | | |
| | | | | Multi-Sector Holdings — 5.5% | | | | | | | | |
| | 70,000 | | | Kinnevik AB, Cl. B† | | | 1,346,239 | | | | 2,500,221 | |
| | 4,460 | | | Old Mutual Ltd. | | | 12,500 | | | | 3,366 | |
| | 155,000 | | | VNV Global AB† | | | 1,183,936 | | | | 1,795,943 | |
| | 12,000 | | | Waterloo Investment Holdings Ltd.†(a) | | | 1,432 | | | | 3,600 | |
| | | | | | | | 2,544,107 | | | | 4,303,130 | |
| | | | | | | | | | | | | |
| | | | | Banks — 0.0% | | | | | | | | |
| | | | | Banks — 0.0% | | | | | | | | |
| | | | | Diversified Banks — 0.0% | | | | | | | | |
| | 58 | | | Nedbank Group Ltd. | | | 622 | | | | 637 | |
| | | | | | | | | | | | | |
| | | | | TOTAL FINANCIALS | | | 2,544,729 | | | | 4,303,767 | |
| | | | | | | | | | | | | |
| | | | | REAL ESTATE — 4.4% | | | | | | | | |
| | | | | Real Estate — 4.4% | | | | | | | | |
| | | | | Equity Real Estate Investment Trusts — 4.4% | | | | | | | | |
| | | | | Specialized REITs — 4.4% | | | | | | | | |
| | 4,000 | | | Crown Castle International | | | | | | | | |
| | | | | Corp., REIT | | | 544,828 | | | | 834,960 | |
| | 6,500 | | | Digital Realty Trust Inc., | | | | | | | | |
| | | | | REIT | | | 851,368 | | | | 1,149,655 | |
| | 1,800 | | | Equinix Inc., REIT | | | 143,374 | | | | 1,522,512 | |
| | | | | | | | 1,539,570 | | | | 3,507,127 | |
| | | | | | | | | | | | | |
| | | | | TOTAL REAL ESTATE | | | 1,539,570 | | | | 3,507,127 | |
| | | | | | | | | | | | | |
| | | | | TOTAL COMMON STOCKS | | | 47,063,747 | | | | 78,234,950 | |
| | | | | | | | | | | | | |
| | | | | CLOSED-END FUNDS — 0.0% | | | | | | | | |
| | | | | CONSUMER DISCRETIONARY — 0.0% | | | | | | | | |
| | | | | Retailing — 0.0% | | | | | | | | |
| | | | | Internet & Direct Marketing Retail — 0.0% | | | | | | | | |
| | | | | Internet & Direct Marketing Retail — 0.0% | | | | | | | | |
| | 5,800 | | | Altaba Inc., Escrow† | | | 0 | | | | 34,510 | |
| Shares | | | | | Cost | | | Market
Value | |
| | | | | PREFERRED STOCKS — 1.1% | | | | | | | | |
| | | | | INFORMATION TECHNOLOGY — 1.1% | | | | | | | | |
| | | | | Technology - Hardware and Equipment — 1.1% | | | | | | | | |
| | | | | Technology Hardware, Storage & Peripherals — 1.1% | | | | |
| | | | | Technology Hardware, Storage & Peripherals — 1.1% | | | | |
| | 15,000 | | | Samsung Electronics Co. Ltd., 10.630% | | $ | 602,552 | | | $ | 898,423 | |
| | | | | | | | | | | | | |
| | | | | WARRANTS — 0.1% | | | | | | | | |
| | | | | FINANCIALS — 0.1% | | | | | | | | |
| | | | | Diversified Financials — 0.1% | | | | | | | | |
| | | | | Diversified Financial Services — 0.1% | | | | | | | | |
| | | | | Multi-Sector Holdings — 0.1% | | | | | | | | |
| | 31,463 | | | VNV Global AB, expire 08/10/23† | | | 0 | | | | 45,264 | |
| | | | | | | | | | | | | |
| | | | | TOTAL INVESTMENTS — 100.3% | | $ | 47,666,299 | | | | 79,213,147 | |
| | | | | Other Assets and Liabilities (Net) — (0.3)% | | | | | | | (234,505 | ) |
| | | | | | | | | | | | | |
| | | | | NET ASSETS — 100.0% | | | | | | $ | 78,978,642 | |
| (a) | Security is valued using significant unobservable inputs and is classified as Level 3 in the fair value hierarchy. |
| † | Non-income producing security. |
| ADR | American Depositary Receipt |
| GDR | Global Depositary Receipt |
| REIT | Real Estate Investment Trust |
| SDR | Swedish Depositary Receipt |
| Geographic Diversification | | % of
Market
Value | | | Market
Value | |
| North America | | �� | 61.7 | % | | $ | 48,884,344 | |
| Europe | | | 25.6 | | | | 20,280,512 | |
| Japan | | | 8.5 | | | | 6,733,705 | |
| Latin America | | | 1.7 | | | | 1,340,871 | |
| South Africa | | | 1.4 | | | | 1,075,292 | |
| Asia/Pacific | | | 1.1 | | | | 898,423 | |
| | | | 100.0 | % | | $ | 79,213,147 | |
See accompanying notes to financial statements.
The Gabelli Global Content & Connectivity Fund
Statement of Assets and Liabilities
December 31, 2021
| Assets: | | | |
| Investments, at value (cost $47,666,299) | | $ | 79,213,147 | |
| Cash | | | 473 | |
| Foreign currency, at value (cost $2,363) | | | 2,044 | |
| Receivable for investments sold | | | 634 | |
| Receivable for Fund shares sold | | | 40 | |
| Receivable from Adviser | | | 40,880 | |
| Dividends receivable | | | 84,365 | |
| Prepaid expenses | | | 22,004 | |
| Total Assets | | | 79,363,587 | |
| Liabilities: | | | | |
| Line of credit payable | | | 182,000 | |
| Payable for Fund shares redeemed | | | 2,324 | |
| Payable for investment advisory fees | | | 66,507 | |
| Payable for distribution fees | | | 13,789 | |
| Payable for accounting fees | | | 3,750 | |
| Payable for legal and audit fees | | | 43,900 | |
| Payable for shareholder communications | | | 30,865 | |
| Payable for shareholder services fees | | | 27,646 | |
| Other accrued expenses | | | 14,164 | |
| Total Liabilities | | | 384,945 | |
Net Assets
(applicable to 3,614,845 shares outstanding) | | $ | 78,978,642 | |
| Net Assets Consist of: | | | | |
| Paid-in capital | | $ | 48,941,632 | |
| Total distributable earnings | | | 30,037,010 | |
| Net Assets | | $ | 78,978,642 | |
| Shares of Capital Stock, each at $0.001 par value: | | | | |
| Class AAA: | | | | |
| Net Asset Value, offering, and redemption price per share ($65,025,177 ÷ 2,974,610 shares outstanding; 150,000,000 shares authorized) | | $ | 21.86 | |
| Class A: | | | | |
| Net Asset Value and redemption price per share ($428,050 ÷ 19,394 shares outstanding; 50,000,000 shares authorized) | | $ | 22.07 | |
| Maximum offering price per share (NAV ÷ 0.9425, based on maximum sales charge of 5.75% of the offering price) | | $ | 23.42 | |
| Class C: | | | | |
| Net Asset Value and redemption price per share ($2,247 ÷ 105.79 shares outstanding; 50,000,000 shares authorized) | | $ | 21.24 | |
| Class I: | | | | |
| Net Asset Value, offering, and redemption price per share ($13,523,168 ÷ 620,735 shares outstanding; 50,000,000 shares authorized) | | $ | 21.79 | |
Statement of Operations
For the Year Ended December 31, 2021
| Investment Income: | | | |
| Dividends (net of foreign withholding taxes of $50,779) | | $ | 937,188 | |
| Non-cash dividends | | | 1,792,074 | |
| Interest | | | 182 | |
| Total Investment Income | | | 2,729,444 | |
| Expenses: | | | | |
| Investment advisory fees | | | 844,654 | |
| Distribution fees - Class AAA | | | 173,425 | |
| Distribution fees - Class A | | | 1,119 | |
| Distribution fees - Class C | | | 118 | |
| Shareholder services fees | | | 87,885 | |
| Legal and audit fees | | | 58,943 | |
| Registration expenses | | | 51,192 | |
| Accounting fees | | | 45,000 | |
| Custodian fees | | | 36,468 | |
| Shareholder communications expenses | | | 22,236 | |
| Directors’ fees | | | 13,789 | |
| Tax expense | | | 3,540 | |
| Interest expense | | | 1,096 | |
| Miscellaneous expenses | | | 16,870 | |
| Total Expenses | | | 1,356,335 | |
| Less: | | | | |
| Expense reimbursements (See Note 3) | | | (589,925 | ) |
| Expenses paid indirectly by broker (See Note 6) | | | (1,585 | ) |
| Total Reimbursements and Credits | | | (591,510 | ) |
| Net Expenses | | | 764,825 | |
| Net Investment Income | | | 1,964,619 | |
| Net Realized and Unrealized Gain/(Loss) on Investments, Forward Foreign Exchange Contracts, and Foreign Currency: | | | | |
| Net realized gain on investments | | | 3,398,980 | |
| Net realized gain on forward foreign exchange contracts | | | 25,433 | |
| Net realized loss on foreign currency transactions | | | (42,598 | ) |
| Net realized gain on investments, forward foreign exchange contracts, and foreign currency transactions | | | 3,381,815 | |
| Net change in unrealized appreciation/depreciation: | | | | |
| on investments | | | (1,007,425 | ) |
| on foreign currency translations | | | (699 | ) |
| Net change in unrealized appreciation/depreciation on investments and foreign currency translations | | | (1,008,124 | ) |
| Net Realized and Unrealized Gain/(Loss) on Investments, Forward Foreign Exchange Contracts, and Foreign Currency | | | 2,373,691 | |
| Net Increase in Net Assets Resulting from Operations | | $ | 4,338,310 | |
See accompanying notes to financial statements.
The Gabelli Global Content & Connectivity Fund
Statement of Changes in Net Assets
| | | Year Ended
December 31, 2021 | | | Year Ended
December 31, 2020 | |
| Operations: | | | | | | | | |
| Net investment income | | $ | 1,964,619 | | | $ | 413,299 | |
| Net realized gain on investments, forward foreign exchange contracts, and foreign currency transactions | | | 3,381,815 | | | | 1,123,880 | |
| Net change in unrealized appreciation/depreciation on investments and foreign currency translations | | | (1,008,124 | ) | | | 9,708,634 | |
| Net Increase in Net Assets Resulting from Operations | | | 4,338,310 | | | | 11,245,813 | |
| | | | | | | | | |
| Distributions to Shareholders: | | | | | | | | |
| Accumulated earnings | | | | | | | | |
| Class AAA | | | (4,120,665 | ) | | | (2,020,392 | ) |
| Class A | | | (26,818 | ) | | | (12,531 | ) |
| Class C | | | (145 | ) | | | (1,503 | ) |
| Class I | | | (859,148 | ) | | | (419,204 | ) |
| Total Distributions to Shareholders | | | (5,006,776 | ) | | | (2,453,630 | ) |
| | | | | | | | | |
| Capital Share Transactions: | | | | | | | | |
| Class AAA | | | (1,665,646 | ) | | | (4,994,337 | ) |
| Class A | | | 11,185 | | | | (4,783 | ) |
| Class C | | | (47,770 | ) | | | (36,787 | ) |
| Class I | | | (291,252 | ) | | | (93,032 | ) |
| Net Decrease in Net Assets from Capital Share Transactions | | | (1,993,483 | ) | | | (5,128,939 | ) |
| | | | | | | | | |
| Redemption Fees | | | — | | | | 4 | |
| | | | | | | | | |
| Net Increase/(Decrease) in Net Assets | | | (2,661,949 | ) | | | 3,663,248 | |
| Net Assets: | | | | | | | | |
| Beginning of year | | | 81,640,591 | | | | 77,977,343 | |
| End of year | | $ | 78,978,642 | | | $ | 81,640,591 | |
See accompanying notes to financial statements.
The Gabelli Global Content & Connectivity Fund
Financial Highlights
Selected data for a share of capital stock outstanding throughout each year:
| | | | | | | | | | | | | | | | | | | | | | | | | | | | | | | | | | | | | | | | | | | | | | | | | | |
| | | | | | | Income (Loss) from Investment
Operations | | | Distributions | | | | | | | | | | | | Ratios to Average Net Assets/Supplemental Data | |
Year Ended
December 31 | | | Net Asset Value,
Beginning of Year | | | Net Investment
Income (Loss)(a) | | | Net Realized
and Unrealized
Gain (Loss) on
Investments | | | Total from
Investment
Operations | | | Net Investment
Income | | | Net Realized
Gain on
Investments | | | Return of Capital | | | Total
Distributions | | | Redemption
Fees(a)(b) | | | Net Asset Value,
End of Year | | | Total Return† | | | Net Assets, End of
Year (in 000’s) | | | Net Investment
Income (Loss) | | Operating
Expenses Before
Reimbursement | | | Operating
Expenses Net of
Reimbursement(c) | | Portfolio
Turnover
Rate | |
| Class AAA | | | | | | | | | | | | | | | | | | | | | | | | | | | | | | | | | | | | | | | | | | | | | | | | | | | | | | | | | | |
| 2021 | | | $ | 22.18 | | | $ | 0.56 | (d) | | $ | 0.59 | | | $ | 1.15 | | | $ | (0.62 | ) | | $ | (0.85 | ) | | $ | — | | | $ | (1.47 | ) | | $ | — | | | $ | 21.86 | | | | 5.17 | % | | $ | 65,025 | | | 2.33 | %(d) | | | 1.65 | % | | 0.90 | %(e)(f) | | | 26 | % |
| 2020 | | | | 19.64 | | | | 0.11 | (d) | | | 3.11 | | | | 3.22 | | | | (0.46 | ) | | | (0.22 | ) | | | — | | | | (0.68 | ) | | | 0.00 | | | | 22.18 | | | | 16.42 | | | | 67,239 | | | 0.57 | (d) | | | 1.77 | | | 0.90 | (e) | | | 41 | |
| 2019 | | | | 18.08 | | | | 0.32 | | | | 2.51 | | | | 2.83 | | | | (0.37 | ) | | | (0.90 | ) | | | — | | | | (1.27 | ) | | | 0.00 | | | | 19.64 | | | | 15.62 | | | | 65,024 | | | 1.63 | | | | 1.74 | | | 1.69 | (e) | | | 14 | |
| 2018 | | | | 21.77 | | | | 0.16 | | | | (2.76 | ) | | | (2.60 | ) | | | (0.15 | ) | | | (0.93 | ) | | | (0.01 | ) | | | (1.09 | ) | | | 0.00 | | | | 18.08 | | | | (11.89 | ) | | | 63,196 | | | 0.78 | | | | 1.72 | | | 1.72 | | | | 19 | |
| 2017 | | | | 20.43 | | | | 0.11 | | | | 2.63 | | | | 2.74 | | | | (0.14 | ) | | | (1.26 | ) | | | — | | | | (1.40 | ) | | | — | | | | 21.77 | | | | 13.38 | | | | 81,832 | | | 0.48 | | | | 1.73 | | | 1.73 | | | | 22 | |
| Class A | | | | | | | | | | | | | | | | | | | | | | | | | | | | | | | | | | | | | | | | | | | | | | | | | | | | | | | | | | |
| 2021 | | | $ | 22.38 | | | $ | 0.56 | (d) | | $ | 0.60 | | | $ | 1.16 | | | $ | (0.62 | ) | | $ | (0.85 | ) | | $ | — | | | $ | (1.47 | ) | | $ | — | | | $ | 22.07 | | | | 5.16 | % | | $ | 428 | | | 2.30 | %(d) | | | 1.65 | % | | 0.90 | %(e)(f) | | | 26 | % |
| 2020 | | | | 19.81 | | | | 0.11 | (d) | | | 3.14 | | | | 3.25 | | | | (0.46 | ) | | | (0.22 | ) | | | — | | | | (0.68 | ) | | | 0.00 | | | | 22.38 | | | | 16.43 | | | | 422 | | | 0.59 | (d) | | | 1.77 | | | 0.90 | (e) | | | 41 | |
| 2019 | | | | 18.23 | | | | 0.36 | | | | 2.50 | | | | 2.86 | | | | (0.38 | ) | | | (0.90 | ) | | | — | | | | (1.28 | ) | | | 0.00 | | | | 19.81 | | | | 15.64 | | | | 374 | | | 1.80 | | | | 1.74 | | | 1.68 | (e) | | | 14 | |
| 2018 | | | | 21.94 | | | | 0.16 | | | | (2.79 | ) | | | (2.63 | ) | | | (0.14 | ) | | | (0.93 | ) | | | (0.01 | ) | | | (1.08 | ) | | | 0.00 | | | | 18.23 | | | | (11.94 | ) | | | 231 | | | 0.76 | | | | 1.72 | | | 1.72 | | | | 19 | |
| 2017 | | | | 20.58 | | | | 0.10 | | | | 2.66 | | | | 2.76 | | | | (0.14 | ) | | | (1.26 | ) | | | — | | | | (1.40 | ) | | | — | | | | 21.94 | | | | 13.39 | | | | 576 | | | 0.43 | | | | 1.73 | | | 1.73 | | | | 22 | |
| Class C | | | | | | | | | | | | | | | | | | | | | | | | | | | | | | | | | | | | | | | | | | | | | | | | | | | | | | | | | | |
| 2021 | | | $ | 21.59 | | | $ | 0.64 | (d) | | $ | 0.48 | | | $ | 1.12 | | | $ | (0.62 | ) | | $ | (0.85 | ) | | $ | — | | | $ | (1.47 | ) | | $ | — | | | $ | 21.24 | | | | 5.17 | % | | $ | 3 | | | 2.76 | %(d) | | | 2.40 | % | | 0.91 | %(e)(f) | | | 26 | % |
| 2020 | | | | 19.13 | | | | 0.10 | (d) | | | 3.04 | | | | 3.14 | | | | (0.46 | ) | | | (0.22 | ) | | | — | | | | (0.68 | ) | | | — | | | | 21.59 | | | | 16.44 | | | | 49 | | | 0.54 | (d) | | | 2.52 | | | 0.90 | (e) | | | 41 | |
| 2019 | | | | 17.45 | | | | 0.04 | | | | 2.55 | | | | 3.00 | | | | (0.01 | ) | | | (0.90 | ) | | | — | | | | (0.91 | ) | | | 0.00 | | | | 19.13 | | | | 14.81 | | | | 84 | | | 0.19 | | | | 2.49 | | | 2.45 | (e) | | | 14 | |
| 2018 | | | | 21.08 | | | | 0.02 | | | | (2.68 | ) | | | (2.66 | ) | | | (0.03 | ) | | | (0.93 | ) | | | (0.01 | ) | | | (0.97 | ) | | | 0.00 | | | | 17.45 | | | | (12.56 | ) | | | 279 | | | 0.08 | | | | 2.47 | | | 2.47 | | | | 19 | |
| 2017 | | | | 19.85 | | | | (0.06 | ) | | | 2.55 | | | | 2.49 | | | | — | | | | (1.26 | ) | | | — | | | | (1.26 | ) | | | — | | | | 21.08 | | | | 12.53 | | | | 267 | | | (0.28 | ) | | | 2.48 | | | 2.48 | | | | 22 | |
| Class I | | | | | | | | | | | | | | | | | | | | | | | | | | | | | | | | | | | | | | | | | | | | | | | | | | | | | | | | | | |
| 2021 | | | $ | 22.11 | | | $ | 0.55 | (d) | | $ | 0.60 | | | $ | 1.15 | | | $ | (0.62 | ) | | $ | (0.85 | ) | | $ | — | | | $ | (1.47 | ) | | $ | — | | | $ | 21.79 | | | | 5.18 | % | | $ | 13,523 | | | 2.32 | %(d) | | | 1.40 | % | | 0.90 | %(e)(f) | | | 26 | % |
| 2020 | | | | 19.58 | | | | 0.11 | (d) | | | 3.10 | | | | 3.21 | | | | (0.46 | ) | | | (0.22 | ) | | | — | | | | (0.68 | ) | | | 0.00 | | | | 22.11 | | | | 16.42 | | | | 13,931 | | | 0.58 | (d) | | | 1.52 | | | 0.90 | (e) | | | 41 | |
| 2019 | | | | 18.03 | | | | 0.46 | | | | 2.51 | | | | 2.97 | | | | (0.52 | ) | | | (0.90 | ) | | | — | | | | (1.42 | ) | | | 0.00 | | | | 19.58 | | | | 16.42 | | | | 12,495 | | | 2.33 | | | | 1.49 | | | 0.99 | (e) | | | 14 | |
| 2018 | | | | 21.75 | | | | 0.32 | | | | (2.79 | ) | | | (2.47 | ) | | | (0.31 | ) | | | (0.93 | ) | | | (0.01 | ) | | | (1.25 | ) | | | 0.00 | | | | 18.03 | | | | (11.27 | ) | | | 12,394 | | | 1.52 | | | | 1.47 | | | 1.00 | (e) | | | 19 | |
| 2017 | | | | 20.40 | | | | 0.28 | | | | 2.62 | | | | 2.90 | | | | (0.29 | ) | | | (1.26 | ) | | | — | | | | (1.55 | ) | | | — | | | | 21.75 | | | | 14.20 | | | | 14,374 | | | 1.26 | | | | 1.48 | | | 1.00 | (e) | | | 22 | |
| † | Total return represents aggregate total return of a hypothetical investment at the beginning of the year and sold at the end of the year including reinvestment of distributions and does not reflect the applicable sales charges. |
| (a) | Per share amounts have been calculated using the average shares outstanding method. |
| (b) | Amount represents less than $0.005 per share. |
| (c) | The Fund received credits from a designated broker who agreed to pay certain Fund operating expenses. For all years presented, there was no impact on the expense ratios. |
| (d) | Includes income resulting from special dividends. Without these dividends, the per share income amounts would have been $0.05 and $0.09 (Class AAA), $0.04 and $0.09 (Class A), $0.15 and $0.08 (Class C), and $0.05 and $0.09 (Class I), and the net investment income ratios would have been 0.20% and 0.45% (Class AAA), 0.18% and 0.47% (Class A), 0.63% and 0.41% (Class C), and 0.20% and 0.46% (Class I) for the years ended December 31, 2021 and 2020, respectively. |
| (e) | Under an expense reimbursement agreement with the Adviser, the Adviser reimbursed expenses of $589,925, $591,218 and $91,150 for the years ended December 31, 2021, 2020, and 2019, and certain Class I expenses to the Fund of $70,600 and $56,231 for the years ended December 31, 2018 and 2017, respectively. |
| (f) | The Fund incurred tax expense for the year ended December 31, 2021. If tax expense had not been incurred, the ratios of operating expenses to average net assets would have been 0.90% for each Class. |
See accompanying notes to financial statements.
The Gabelli Global Content & Connectivity Fund
Notes to Financial Statements
1. Organization. The Gabelli Global Content & Connectivity Fund, a series of GAMCO Global Series Funds, Inc. (the Corporation), was incorporated on July 16, 1993 in Maryland. The Fund is a non-diversified open-end management investment company registered under the Investment Company Act of 1940, as amended (the 1940 Act) and is one of five separately managed portfolios (collectively, the Portfolios) of the Corporation. The Fund primary seeks to provide investors with appreciation of capital. The Fund commenced investment operations on November 1, 1993.
The Fund may invest a high percentage of its assets in specific sectors of the market in order to achieve a potentially greater investment return. As a result, the Fund may be more susceptible to economic, political, and regulatory developments in a particular sector of the market, positive or negative, and may experience increased volatility to the Fund’s NAV and a magnified effect in its total return.
2. Significant Accounting Policies. As an investment company, the Fund follows the investment company accounting and reporting guidance, which is part of U.S. generally accepted accounting principles (GAAP) that may require the use of management estimates and assumptions in the preparation of its financial statements. Actual results could differ from those estimates. The following is a summary of significant accounting policies followed by the Fund in the preparation of its financial statements.
The global outbreak of the novel coronavirus disease, known as COVID-19, has caused adverse effects on many companies, sectors, nations, regions, and the markets in general, and may continue for an unpredictable duration. The effects of this pandemic may materially impact the value and performance of the Fund, its ability to buy and sell fund investments at appropriate valuations, and its ability to achieve its investment objectives.
Security Valuation. Portfolio securities listed or traded on a nationally recognized securities exchange or traded in the U.S. over-the-counter market for which market quotations are readily available are valued at the last quoted sale price or a market’s official closing price as of the close of business on the day the securities are being valued. If there were no sales that day, the security is valued at the average of the closing bid and asked prices or, if there were no asked prices quoted on that day, then the security is valued at the closing bid price on that day. If no bid or asked prices are quoted on such day, the security is valued at the most recently available price or, if the Board of Directors (the Board) so determines, by such other method as the Board shall determine in good faith to reflect its fair market value. Portfolio securities traded on more than one national securities exchange or market are valued according to the broadest and most representative market, as determined by Gabelli Funds, LLC (the Adviser).
Portfolio securities primarily traded on a foreign market are generally valued at the preceding closing values of such securities on the relevant market, but may be fair valued pursuant to procedures established by the Board if market conditions change significantly after the close of the foreign market, but prior to the close of business on the day the securities are being valued. Debt obligations for which market quotations are readily available are valued at the average of the latest bid and asked prices. If there were no asked prices quoted on such day, the security is valued using the closing bid price. Such debt obligations are valued through prices provided by a pricing service approved by the Board. Certain securities are valued principally using dealer quotations.
Securities and assets for which market quotations are not readily available are fair valued as determined by the Board. Fair valuation methodologies and procedures may include, but are not limited to: analysis and review of available financial and non-financial information about the company; comparisons with the valuation and changes in valuation of similar securities, including a comparison of foreign securities with the equivalent U.S.
The Gabelli Global Content & Connectivity Fund
Notes to Financial Statements (Continued)
dollar value American Depositary Receipt securities at the close of the U.S. exchange; and evaluation of any other information that could be indicative of the value of the security.
The inputs and valuation techniques used to measure fair value of the Fund’s investments are summarized into three levels as described in the hierarchy below:
| ● | Level 1 — quoted prices in active markets for identical securities; |
| ● | Level 2 — other significant observable inputs (including quoted prices for similar securities, interest rates, prepayment speeds, credit risk, etc.); and |
| ● | Level 3 — significant unobservable inputs (including the Board’s determinations as to the fair value of investments). |
A financial instrument’s level within the fair value hierarchy is based on the lowest level of any input both individually and in the aggregate that is significant to the fair value measurement. The inputs or methodology used for valuing securities are not necessarily an indication of the risk associated with investing in those securities.
The Gabelli Global Content & Connectivity Fund
Notes to Financial Statements (Continued)
The summary of the Fund’s investments in securities by inputs used to value the Fund’s investments as of December 31, 2021 is as follows:
| | | Valuation Inputs | | | |
| | | Level 1 Quoted Prices | | | Level 2 Other Significant Observable Inputs | | | Level 3 Significant Unobservable Inputs (a) | | | Total Market Value at 12/31/21 | |
| INVESTMENTS IN SECURITIES: | | | | | | | | | | | | | | | | |
| ASSETS (Market Value): | | | | | | | | | | | | | | | | |
| Common Stocks: | | | | | | | | | | | | | | | | |
| Communication Services | | $ | 57,425,796 | | | | — | | | $ | 281,771 | | | $ | 57,707,567 | |
| Financials | | | 4,296,801 | | | $ | 3,366 | | | | 3,600 | | | | 4,303,767 | |
| Other Industries (b) | | | 16,223,616 | | | | — | | | | — | | | | 16,223,616 | |
| Total Common Stocks | | | 77,946,213 | | | | 3,366 | | | | 285,371 | | | | 78,234,950 | |
| Closed-End Funds (b) | | | — | | | | 34,510 | | | | — | | | | 34,510 | |
| Preferred Stocks (b) | | | 898,423 | | | | — | | | | — | | | | 898,423 | |
| Warrants (b) | | | 45,264 | | | | — | | | | — | | | | 45,264 | |
| TOTAL INVESTMENTS IN SECURITIES – ASSETS | | $ | 78,889,900 | | | $ | 37,876 | | | $ | 285,371 | | | $ | 79,213,147 | |
| (a) | The inputs for these securities are not readily available and are derived based on the judgment of the Adviser according to procedures approved by the Board of Directors. |
| (b) | Please refer to the Schedule of Investments for the industry classifications of these portfolio holdings. |
The Fund did not have any transfers into or out of Level 3 during the year ended December 31, 2021.
Additional Information to Evaluate Qualitative Information.
General. The Fund uses recognized industry pricing services – approved by the Board and unaffiliated with the Adviser – to value most of its securities, and uses broker quotes provided by market makers of securities not valued by these and other recognized pricing sources. Several different pricing feeds are received to value domestic equity securities, international equity securities, preferred equity securities, and fixed income securities. The data within these feeds are ultimately sourced from major stock exchanges and trading systems where these securities trade. The prices supplied by external sources are checked by obtaining quotations or actual transaction prices from market participants. If a price obtained from the pricing source is deemed unreliable, prices will be sought from another pricing service or from a broker/dealer that trades that security or similar securities.
Fair Valuation. Fair valued securities may be common or preferred equities, warrants, options, rights, or fixed income obligations. Where appropriate, Level 3 securities are those for which market quotations are not available, such as securities not traded for several days, or for which current bids are not available, or which are restricted as to transfer. When fair valuing a security, factors to consider include recent prices of comparable securities that are publicly traded, reliable prices of securities not publicly traded, the use of valuation models, current analyst reports, valuing the income or cash flow of the issuer, or cost if the preceding factors do not apply. A significant change in the unobservable inputs could result in a lower or higher value in Level 3 securities. The circumstances of Level 3 securities are frequently monitored to determine if fair valuation measures continue to apply.
The Gabelli Global Content & Connectivity Fund
Notes to Financial Statements (Continued)
The Adviser reports quarterly to the Board the results of the application of fair valuation policies and procedures. These may include backtesting the prices realized in subsequent trades of these fair valued securities to fair values previously recognized.
Foreign Currency Translations. The books and records of the Fund are maintained in U.S. dollars. Foreign currencies, investments, and other assets and liabilities are translated into U.S. dollars at current exchange rates. Purchases and sales of investment securities, income, and expenses are translated at the exchange rate prevailing on the respective dates of such transactions. Unrealized gains and losses that result from changes in foreign exchange rates and/or changes in market prices of securities have been included in unrealized appreciation/depreciation on investments and foreign currency translations. Net realized foreign currency gains and losses resulting from changes in exchange rates include foreign currency gains and losses between trade date and settlement date on investment securities transactions, foreign currency transactions, and the difference between the amounts of interest and dividends recorded on the books of the Fund and the amounts actually received. The portion of foreign currency gains and losses related to fluctuation in exchange rates between the initial purchase trade date and subsequent sale trade date is included in realized gain/(loss) on investments.
Foreign Securities. The Fund may directly purchase securities of foreign issuers. Investing in securities of foreign issuers involves special risks not typically associated with investing in securities of U.S. issuers. The risks include possible revaluation of currencies, the inability to repatriate funds, less complete financial information about companies, and possible future adverse political and economic developments. Moreover, securities of many foreign issuers and their markets may be less liquid and their prices more volatile than securities of comparable U.S. issuers.
Foreign Taxes. The Fund may be subject to foreign taxes on income, gains on investments, or currency repatriation, a portion of which may be recoverable. The Fund will accrue such taxes and recoveries as applicable, based upon its current interpretation of tax rules and regulations that exist in the markets in which it invests.
Restricted Securities. The Fund may invest up to 15% of its net assets in securities for which the markets are restricted. Restricted securities include securities whose disposition is subject to substantial legal or contractual restrictions. The sale of restricted securities often requires more time and results in higher brokerage charges or dealer discounts and other selling expenses than the sale of securities eligible for trading on national securities exchanges or in the over-the-counter markets. Restricted securities may sell at a price lower than similar securities that are not subject to restrictions on resale. Securities freely saleable among qualified institutional investors under special rules adopted by the SEC may be treated as liquid if they satisfy liquidity standards established by the Board. The continued liquidity of such securities is not as well assured as that of publicly traded securities, and accordingly the Board will monitor their liquidity. At December 31, 2021, the Fund did not hold any restricted securities.
Investments in other Investment Companies. The Fund may invest, from time to time, in shares of other investment companies (or entities that would be considered investment companies but are excluded from the definition pursuant to certain exceptions under the 1940 Act) (the Acquired Funds) in accordance with the 1940 Act and related rules. Shareholders in the Fund would bear the pro rata portion of the periodic expenses of the Acquired Funds in addition to the Fund’s expenses. For the year ended December 31, 2021, the Fund’s pro rata portion of the periodic expenses charged by the Acquired Funds was less than one basis point.
The Gabelli Global Content & Connectivity Fund
Notes to Financial Statements (Continued)
Securities Transactions and Investment Income. Securities transactions are accounted for on the trade date with realized gain/(loss) on investments determined by using the identified cost method. Interest income (including amortization of premium and accretion of discount) is recorded on an accrual basis. Premiums and discounts on debt securities are amortized using the effective yield to maturity method or amortized to earliest call date, if applicable. Dividend income is recorded on the ex-dividend date, except for certain dividends from foreign securities that are recorded as soon after the ex-dividend date as the Fund becomes aware of such dividends.
Determination of Net Asset Value and Calculation of Expenses. Certain administrative expenses are common to, and allocated among, various affiliated funds. Such allocations are made on the basis of each fund’s average net assets or other criteria directly affecting the expenses as determined by the Adviser pursuant to procedures established by the Board.
In calculating the NAV per share of each class, investment income, realized and unrealized gains and losses, redemption fees, and expenses other than class specific expenses are allocated daily to each class of shares based upon the proportion of net assets of each class at the beginning of each day. Distribution expenses are borne solely by the class incurring the expense.
Distributions to Shareholders. Distributions to shareholders are recorded on the ex-dividend date. Distributions to shareholders are based on income and capital gains as determined in accordance with federal income tax regulations, which may differ from income and capital gains as determined under GAAP. These differences are primarily due to differing treatments of income and gains on various investment securities and foreign currency transactions, timing differences, and differing characterizations of distributions made by the Fund. Distributions from net investment income for federal income tax purposes include net realized gains on foreign currency transactions. These book/tax differences are either temporary or permanent in nature. To the extent these differences are permanent, adjustments are made to the appropriate capital accounts in the period when the differences arise. Permanent differences were primarily due to disallowed losses. These reclassifications have no impact on the NAV of the Fund. For the year ended December 31, 2021, reclassifications were made to decrease paid-in capital by $3,540, with an offsetting adjustment to total distributable earnings.
The tax character of distributions paid during the years ended December 31, 2021 and 2020 was as follows:
| | | Year Ended
December 31, 2021 | | | Year Ended
December 31, 2020 | |
| Distributions paid from: | | | | | | | | |
| Ordinary income (inclusive of short term capital gains) | | $ | 2,108,206 | | | $ | 1,966,445 | |
| Net long term capital gains | | | 2,898,570 | | | | 487,185 | |
| Total distributions paid | | $ | 5,006,776 | | | $ | 2,453,630 | |
Provision for Income Taxes. The Fund intends to continue to qualify as a regulated investment company under Subchapter M of the Internal Revenue Code of 1986, as amended (the Code). It is the policy of the Fund to comply with the requirements of the Code applicable to regulated investment companies and to distribute substantially all of its net investment company taxable income and net capital gains. Therefore, no provision for federal income taxes is required.
The Gabelli Global Content & Connectivity Fund
Notes to Financial Statements (Continued)
At December 31, 2021, the components of accumulated earnings/losses on a tax basis were as follows:
| Undistributed ordinary income | | $ | 9,518 | |
| Undistributed long term capital gains | | | 3,642 | |
| Net unrealized appreciation on investments and foreign currency translations | | | 30,023,850 | |
| Total | | $ | 30,037,010 | |
At December 31, 2021, the temporary differences between book basis and tax basis unrealized appreciation were primarily due to deferral of losses from wash sales for tax purposes and mark-to-market adjustments on investments considered to be a passive foreign investment company.
The following summarizes the tax cost of investments and the related net unrealized appreciation at December 31, 2021:
| | | | | Gross | | Gross | | |
| | | | | Unrealized | | Unrealized | | Net Unrealized |
| | | Cost | | Appreciation | | Depreciation | | Appreciation |
| Investments | | $49,188,974 | | $32,212,860 | | $(2,188,687) | | $30,024,173 |
The Fund is required to evaluate tax positions taken or expected to be taken in the course of preparing the Fund’s tax returns to determine whether the tax positions are “more-likely-than-not” of being sustained by the applicable tax authority. Income tax and related interest and penalties would be recognized by the Fund as tax expense in the Statement of Operations if the tax positions were deemed not to meet the more-likely-than-not threshold. During the year ended December 31, 2021, the Fund incurred an excise tax expense of $3,540. As of December 31, 2021, the Adviser has reviewed all open tax years and concluded that there was no impact to the Fund’s net assets or results of operations. The Fund’s federal and state tax returns for the prior three fiscal years remain open, subject to examination. On an ongoing basis, the Adviser will monitor the Fund’s tax positions to determine if adjustments to this conclusion are necessary.
3. Investment Advisory Agreement and Other Transactions. The Fund has entered into an investment advisory agreement (the Advisory Agreement) with the Adviser which provides that the Fund will pay the Adviser a fee, computed daily and paid monthly, at the annual rate of 1.00% of the value of its average daily net assets. In accordance with the Advisory Agreement, the Adviser provides a continuous investment program for the Fund’s portfolio, oversees the administration of all aspects of the Fund’s business and affairs, and pays the compensation of all Officers and Directors of the Fund who are affiliated persons of the Adviser.
Effective December 1, 2019, the Adviser amended its contractual agreement with respect to each share class of the Fund to waive its investment advisory fees and/or to reimburse expenses to the extent necessary to maintain the annualized total operating expenses of the Fund (excluding brokerage costs, acquired fund fees and expenses, interest, taxes, and extraordinary expenses) until at least April 30, 2022, at no more than 0.90% of the value of the Fund’s average daily net assets for each share class of the Fund. During the year ended December 31, 2021, the Adviser reimbursed expenses in the amount of $589,925. In addition, the Fund has agreed, during the two year period following any waiver or reimbursement by the Adviser, to repay such amount to the extent, that after giving effect to the repayment, such adjusted annualized total operating expenses of the Fund would not exceed 0.90% of the value of the Fund’s average daily net assets for each share class of
The Gabelli Global Content & Connectivity Fund
Notes to Financial Statements (Continued)
the Fund. The agreement is renewable annually. At December 31, 2021, the cumulative amount which the Fund may repay the Adviser, subject to the terms above, is $1,181,143:
| For the year ended December 31, 2020, expiring December 31, 2022 | | $ | 591,218 | |
| For the year ended December 31, 2021, expiring December 31, 2023 | | | 589,925 | |
| | | $ | 1,181,143 | |
4. Distribution Plan. The Fund’s Board has adopted a distribution plan (the Plan) for each class of shares, except for Class I Shares, pursuant to Rule 12b-1 under the 1940 Act. Under the Class AAA, Class A, and Class C Share Plans, payments are authorized to G.distributors, LLC (the Distributor), an affiliate of the Adviser, at annual rates of 0.25%, 0.25%, and 1.00%, respectively, of the average daily net assets of those classes, the annual limitations under each Plan. Such payments are accrued daily and paid monthly.
5. Portfolio Securities. Purchases and sales of securities during the year ended December 31, 2021, other than short term securities and U.S. Government obligations, aggregated $22,022,268 and $26,363,485, respectively.
6. Transactions with Affiliates and Other Arrangements. During the year ended December 31, 2021, the Fund paid brokerage commissions on security trades of $564 to G.research, LLC, an affiliate of the Adviser.
The Fund received credits from a designated broker who agreed to pay certain Fund operating expenses. The amount of such expenses paid through this directed brokerage arrangement during this period was $1,585.
The cost of calculating the Fund’s NAV per share is a Fund expense pursuant to the Advisory Agreement. Under the sub-administration agreement with Bank of New York Mellon, the fees paid include the cost of calculating the Fund’s NAV. The Fund reimburses the Adviser for this service. During the year ended December 31, 2021, the Fund accrued $45,000 in accounting fees in the Statement of Operations.
The Corporation pays retainer and per meeting fees to Directors not affiliated with the Adviser, plus specified amounts to the Lead Director and Audit Committee Chairman. Directors are also reimbursed for out of pocket expenses incurred in attending meetings. Directors who are directors or employees of the Adviser or an affiliated company receive no compensation or expense reimbursement from the Corporation.
7. Line of Credit. The Fund participates in an unsecured line of credit, which expires on March 2, 2022 and may be renewed annually, of up to $75,000,000 under which it may borrow up to 10% of its net assets from the custodian for temporary borrowing purposes. Borrowings under this arrangement bear interest at a floating rate equal to the higher of the Overnight Federal Funds Rate plus 135 basis points or the Overnight Bank Funding Rate plus 135 basis points in effect on that day. This amount, if any, would be included in “Interest expense” in the Statement of Operations. At December 31, 2021, there was $182,000 outstanding under the line of credit.
The average daily amount of borrowings outstanding under the line of credit during the year ended December 31, 2021 was $159,174 with a weighted average interest rate of 1.35%. The maximum amount borrowed at any time during the year ended December 31, 2021 was $947,000.
8. Capital Stock. The Fund currently offers three classes of shares – Class AAA Shares, Class A Shares, and Class I Shares. Effective January 27, 2020, (the Effective Date) the Fund’s Class AAA, Class A and Class C Shares “closed to purchases from new investors”. “Closed to purchases from new investors” means (i) with respect to the Class AAA and Class A shares, no new investors may purchase shares of such classes, but existing shareholders may continue to purchase additional shares of such classes after the Effective Date, and
The Gabelli Global Content & Connectivity Fund
Notes to Financial Statements (Continued)
(ii) with respect to Class C Shares, neither new investors nor existing shareholders may purchase any additional shares of such class after the Effective Date. These changes had no effect on existing shareholders’ ability to redeem shares of the Fund as described in the Fund’s Prospectus. Additionally, on the Effective Date Class I shares of the Fund became available to investors with a minimum initial investment amount of $1,000 when purchasing shares directly through the Distributor, or investors purchasing Class I shares through brokers or financial intermediaries that have entered into selling agreements with the Distributor specifically with respect to Class I shares.
The Fund imposes a redemption fee of 2.00% on all classes of shares that are redeemed or exchanged on or before the seventh day after the date of a purchase. The redemption fee is deducted from the proceeds otherwise payable to the redeeming shareholders and is retained by the Fund as an increase in paid-in capital. The redemption fees retained by the Fund during the years ended December 31, 2021 and 2020, if any, can be found in the Statement of Changes in Net Assets under Redemption Fees.
Transactions in shares of capital stock were as follows:
| | | Year Ended
December 31, 2021 | | | Year Ended
December 31, 2020 | |
| | | Shares | | | Amount | | | Shares | | | Amount | |
| Class AAA | | | | | | | | | | | | | | | | |
| Shares sold | | | 11,642 | | | $ | 276,213 | | | | 9,747 | | | $ | 184,252 | |
| Shares issued upon reinvestment of distributions | | | 178,982 | | | | 3,919,699 | | | | 87,160 | | | | 1,928,858 | |
| Shares redeemed | | | (247,693 | ) | | | (5,861,558 | ) | | | (376,417 | ) | | | (7,107,447 | ) |
| Net decrease | | | (57,069 | ) | | $ | (1,665,646 | ) | | | (279,510 | ) | | $ | (4,994,337 | ) |
| Class A | | | | | | | | | | | | | | | | |
| Shares sold | | | 811 | | | $ | 19,672 | | | | 2,153 | | | $ | 38,059 | |
| Shares issued upon reinvestment of distributions | | | 910 | | | | 20,117 | | | | 425 | | | | 9,480 | |
| Shares redeemed | | | (1,181 | ) | | | (28,604 | ) | | | (2,584 | ) | | | (52,322 | ) |
| Net increase/(decrease) | | | 540 | | | $ | 11,185 | | | | (6 | ) | | $ | (4,783 | ) |
| Class C | | | | | | | | | | | | | | | | |
| Shares issued upon reinvestment of distributions | | | 7 | | | $ | 149 | | | | 70 | | | $ | 1,500 | |
| Shares redeemed | | | (2,171 | ) | | | (47,919 | ) | | | (2,220 | ) | | | (38,287 | ) |
| Net decrease | | | (2,164 | ) | | $ | (47,770 | ) | | | (2,150 | ) | | $ | (36,787 | ) |
| Class I | | | | | | | | | | | | | | | | |
| Shares sold | | | 21,699 | | | $ | 518,139 | | | | 19,112 | | | $ | 362,606 | |
| Shares issued upon reinvestment of distributions | | | 35,611 | | | | 777,037 | | | | 16,760 | | | | 369,729 | |
| Shares redeemed | | | (66,670 | ) | | | (1,586,428 | ) | | | (43,988 | ) | | | (825,367 | ) |
| Net decrease | | | (9,360 | ) | | $ | (291,252 | ) | | | (8,116 | ) | | $ | (93,032 | ) |
9. Indemnifications. The Fund enters into contracts that contain a variety of indemnifications. The Fund’s maximum exposure under these arrangements is unknown. However, the Fund has not had prior claims or losses pursuant to these contracts. Management has reviewed the Fund’s existing contracts and expects the risk of loss to be remote.
The Gabelli Global Content & Connectivity Fund
Notes to Financial Statements (Continued)
10. Subsequent Events. Management has evaluated the impact on the Fund of all subsequent events occurring through the date the financial statements were issued and has determined that there were no subsequent events requiring recognition or disclosure in the financial statements.
The Gabelli Global Content & Connectivity Fund
Report of Independent Registered Public Accounting Firm
To the Shareholders of The Gabelli Global Content & Connectivity Fund
and the Board of Directors of GAMCO Global Series Funds, Inc.
Opinion on the Financial Statements
We have audited the accompanying statement of assets and liabilities of The Gabelli Global Content & Connectivity Fund (the “Fund”) (one of the funds constituting GAMCO Global Series Funds, Inc. (the “Corporation”)), including the schedule of investments, as of December 31, 2021, and the related statement of operations for the year then ended, the statements of changes in net assets for each of the two years in the period then ended, the financial highlights for each of the five years in the period then ended and the related notes (collectively referred to as the “financial statements”). In our opinion, the financial statements present fairly, in all material respects, the financial position of the Fund (one of the funds constituting GAMCO Global Series Funds, Inc.) at December 31, 2021, the results of its operations for the year then ended, the changes in its net assets for each of the two years in the period then ended and its financial highlights for each of the five years in the period then ended, in conformity with U.S. generally accepted accounting principles.
Basis for Opinion
These financial statements are the responsibility of the Corporation’s management. Our responsibility is to express an opinion on the Fund’s financial statements based on our audits. We are a public accounting firm registered with the Public Company Accounting Oversight Board (United States) (“PCAOB”) and are required to be independent with respect to the Corporation in accordance with the U.S. federal securities laws and the applicable rules and regulations of the Securities and Exchange Commission and the PCAOB.
We conducted our audits in accordance with the standards of the PCAOB. Those standards require that we plan and perform the audit to obtain reasonable assurance about whether the financial statements are free of material misstatement, whether due to error or fraud. The Corporation is not required to have, nor were we engaged to perform, an audit of the Corporation’s internal control over financial reporting. As part of our audits we are required to obtain an understanding of internal control over financial reporting but not for the purpose of expressing an opinion on the effectiveness of the Corporation’s internal control over financial reporting. Accordingly, we express no such opinion.
Our audits included performing procedures to assess the risks of material misstatement of the financial statements, whether due to error or fraud, and performing procedures that respond to those risks. Such procedures included examining, on a test basis, evidence regarding the amounts and disclosures in the financial statements. Our procedures included confirmation of securities owned as of December 31, 2021, by correspondence with the custodian. Our audits also included evaluating the accounting principles used and significant estimates made by management, as well as evaluating the overall presentation of the financial statements. We believe that our audits provide a reasonable basis for our opinion.

We have served as the auditor of one or more Gabelli/GAMCO Funds investment companies since 1992.
Philadelphia, Pennsylvania
February 28, 2022
The Gabelli Global Content & Connectivity Fund
Liquidity Risk Management Program (Unaudited)
In accordance with Rule 22e-4 under the 1940 Act, the Fund has established a liquidity risk management program (the LRM Program) to govern its approach to managing liquidity risk. The LRM Program is administered by the Liquidity Committee (the Committee), which is comprised of members of Gabelli Funds, LLC management. The Board has designated the Committee to administer the LRM Program.
The LRM Program’s principal objectives include supporting the Fund’s compliance with limits on investments in illiquid assets and mitigating the risk that the Fund will be unable to meet its redemption obligations in a timely manner. The LRM Program also includes elements that support the management and assessment of liquidity risk, including an annual assessment of factors that influence the Fund’s liquidity and the monthly classification and re-classification of certain investments that reflect the Committee’s assessment of their relative liquidity under current market conditions.
At a meeting of the Board held on May 12, 2021, the Board received a written report from the Committee regarding the design and operational effectiveness of the LRM Program. The Committee determined, and reported to the Board, that the LRM Program is reasonably designed to assess and manage the Fund’s liquidity risk and has operated adequately and effectively since its implementation. The Committee reported that there were no liquidity events that impacted the Fund or its ability to timely meet redemptions without dilution to existing shareholders. The Committee noted that the Fund is primarily invested in highly liquid securities and, accordingly, continues to be exempt from the requirement to determine a “highly liquid investment minimum” as defined in the Rule 22e-4. Because of that continued qualification for the exemption, the Fund has not adopted a “highly liquid investment minimum” amount. The Committee further noted that while changes to the LRM Program were made during the Review Period and reported to the Board, no material changes were made to the LRM Program as a result of the Committee’s annual review.
There can be no assurance that the LRM Program will achieve its objectives in the future. Please refer to the Fund’s Prospectus for more information regarding its exposure to liquidity risk and other principal risks to which an investment in the Fund may be subject.
The Gabelli Global Content & Connectivity Fund
Board Consideration and Re-Approval of Investment Advisory Agreement (Unaudited)
At its meeting on November 11, 2021, the Board of Directors of the Corporation approved the continuation of the investment advisory agreement with the Adviser for the Fund on the basis of the recommendation by the directors (the Independent Board Members) who are not interested persons of the Fund. The following paragraphs summarize the material information and factors considered by the Independent Board Members as well as their conclusions relative to such factors.
Nature, Extent, and Quality of Services. The Independent Board Members considered information regarding the Fund’s portfolio managers, the depth of the analyst pool available to the Adviser and the Fund’s portfolio managers, the scope of supervisory, administrative, shareholder, and other services supervised or provided by the Adviser, and the absence of significant service problems reported to the Board. The Independent Board Members noted the experience, length of service, and reputation of the Fund’s portfolio managers.
Investment Performance. The Independent Board Members reviewed the short, medium, and long term performance of the Fund (as of September 30, 2021) against a peer group of six other comparable funds prepared by the Adviser (the “Adviser Peer Group”), and against a peer group prepared by Broadridge (the “Broadridge Performance Peer Group”) consisting of all retail and institutional telecommunication funds, regardless of asset size or primary channel of distribution, as represented by the Lipper Telecom Fund Index. The Independent Board Members noted that the Fund’s performance was in the second quartile for the one year period and in the fourth quartile for three, five, and ten year periods, as measured against the Adviser Peer Group. Against the Broadridge Performance Peer Group, the Independent Board Members noted that the Fund’s performance was in the third quintile for the one year period and in the fourth quintile for the three, five, and ten year periods. The Independent Board Members discussed the modest improvement in the Fund’s performance relative to the prior year.
Profitability. The Independent Board Members reviewed summary data regarding the profitability of the Fund to the Adviser both with a pro rata administrative charge and with a standalone administrative charge and noted the impact of the expense limitation agreement. The Independent Board Members also noted that a substantial portion of the Fund’s portfolio transactions were executed by an affiliated broker of the Adviser and that another affiliated broker received distribution fees and minor amounts of sales commissions.
Economies of Scale. The Independent Board Members discussed the major elements of the Adviser’s cost structure and the relationship of those elements to potential economies of scale and reviewed data provided by the Adviser.
Sharing of Economies of Scale. The Independent Board Members noted that the investment management fee schedule for the Fund does not take into account any potential economies of scale that may develop.
Service and Cost Comparisons. The Independent Board Members compared the expense ratios of the investment management fee, other expenses, and total expenses of the Fund with similar expense ratios of the Adviser Peer Group and a peer group of four other telecommunications funds selected by Broadridge (the “Broadridge Expense Peer Group”), and noted that the Adviser’s management fee includes substantially all administrative services of the Fund as well as investment advisory services of the Adviser. The Independent Board Members noted the effect of the expense limitation agreement in place for the Fund. The Independent Board Members noted that the Fund’s total expense ratio was the fourth highest in the Adviser Peer Group and the second lowest in the Broadridge Expense Peer Group, and that the Fund’s size was generally smaller than
The Gabelli Global Content & Connectivity Fund
Board Consideration and Re-Approval of Investment Advisory Agreement (Unaudited) (Continued)
average within both peer groups. The Independent Board Members also noted that the advisory fee structure was the same as that in effect for most of the Gabelli funds. The Independent Board Members were presented with, but did not consider to be material to their decision, various information comparing the advisory fee with the fee for other types of accounts managed by the Adviser.
Conclusions. The Independent Board Members concluded that the Fund enjoyed highly experienced portfolio management services and good ancillary services. The Independent Board Members noted the modest improvement in the Fund’s performance over the past year and the steps the Adviser had taken to improve performance. The Independent Board Members also concluded that the Fund’s expense ratios and the profitability to the Adviser of managing the Fund were acceptable, and that economies of scale were not a significant factor in their thinking at this time. In this regard, the Independent Board Members noted the contractual Expense Deferral Agreement between the Adviser and the Corporation, on behalf of each Fund, pursuant to which the net expense ratio for each share class of each Fund was reduced to 0.90%. The Independent Board Members did not view the potential profitability of ancillary services as material to their decision. On the basis of the foregoing and without assigning particular weight to any single conclusion, the Independent Board Members determined to recommend continuation of the investment management agreement to the full Board.
Based on a consideration of all these factors in their totality, the Board Members, including all of the Independent Board Members, determined that the Fund’s advisory fee was appropriate in light of the quality of services provided and in light of the other factors described above that the Board deemed relevant. Accordingly, the Board Members determined to approve the continuation of the Fund’s Advisory Agreement. The Board Members based their decision on evaluations of all these factors as a whole and did not consider any one factor as all important or controlling.
The Gabelli Global Content & Connectivity Fund
Additional Fund Information (Unaudited)
The business and affairs of the Fund are managed under the direction of the Corporation’s Board of Directors. Information pertaining to the Directors and Officers of the Fund is set forth below. The Corporation’s Statement of Additional Information includes additional information about the Fund’s Directors and is available without charge, upon request, by calling 800-GABELLI (800-422-3554) or by writing to The Gabelli Global Content & Connectivity Fund at One Corporate Center, Rye, NY 10580-1422.
Name, Position(s)
Address1
and Age | | Term of Office
and
Length of
Time Served2 | | Number of
Funds
in Fund
Complex
Overseen
by Director | | Principal Occupation(s)
During Past Five Years | | Other Directorships
Held by Director3 |
| INTERESTED DIRECTORS4: | | | | |
| | | | | |
Mario J. Gabelli, CFA
Director and Chief
Investment Officer
Age: 79 | | Since 1993 | | 31 | | Chairman, Chief Executive Officer, and Chief Investment Officer– Value Portfolios of GAMCO Investors, Inc. and Chief Investment Officer– Value Portfolios of Gabelli Funds, LLC and GAMCO Asset Management Inc.; Director/ Trustee or Chief Investment Officer of other registered investment companies within the Fund Complex; Chief Executive Officer of GGCP, Inc.; Executive Chairman of Associated Capital Group, Inc. | | Director of Morgan Group Holdings, Inc. (holding company); Chairman of the Board and Chief Executive Officer of LICT Corp. (multimedia and communication services company); Director of CIBL, Inc. (broadcasting and wireless communications); Director of ICTC Group Inc. (communications) (2013-2018) |
John D. Gabelli
Director
Age: 77 | | Since 1993 | | 12 | | Former Senior Vice President of G.research, LLC | | — |
| INDEPENDENT DIRECTORS5: |
E. Val Cerutti
Director
Age: 82 | | Since 2001 | �� | 7 | | Chief Executive Officer of Cerutti Consultants, Inc. | | Director of The LGL Group, Inc. (diversified manufacturing) (1990-2009) |
Anthony J. Colavita6
Director
Age: 86 | | Since 1993 | | 18 | | President of the law firm of Anthony J. Colavita, P.C. | | — |
Werner J. Roeder
Director
Age: 81 | | Since 1993 | | 20 | | Retired physician; Former Vice President of Medical Affairs (Medical Director) of New York Presbyterian/Lawrence Hospital (1999-2014) | | — |
Anthonie C. van Ekris6
Director
Age: 87 | | Since 1993 | | 23 | | Chairman and Chief Executive Officer of BALMAC International, Inc. (global import/ export company) | | — |
The Gabelli Global Content & Connectivity Fund
Additional Fund Information (Continued) (Unaudited)
Name, Position(s)
Address1
and Age | | Term of Office
and
Length of
Time Served2 | | Number of
Funds
in Fund
Complex
Overseen
by Director | | Principal Occupation(s)
During Past Five Years | | Other Directorships
Held by Director3 |
Salvatore J. Zizza7
Director
Age: 76 | | Since 2004 | | 32 | | President of Zizza & Associates Corp. (private holding company); Chairman of Bergen Cove Realty Inc. (residential real estate) | | Director and Chairman of Trans-Lux Corporation (business services); Director and Chairman of Harbor Diversified Inc. (pharmaceuticals) (2009-2018); Retired Chairman of BAM (semiconductor and aerospace manufacturing) |
The Gabelli Global Content & Connectivity Fund
Additional Fund Information (Continued) (Unaudited)
Name, Position(s)
Address1
and Age | | Term of Office
and Length of
Time Served2 | | Principal Occupation(s)
During Past Five Years |
| OFFICERS: |
Bruce N. Alpert
President
Age: 70 | | Since 1993 | | Executive Vice President and Chief Operating Officer of Gabelli Funds, LLC since 1988; Officer of registered investment companies within the Fund Complex; Senior Vice President of GAMCO Investors, Inc. since 2008; Vice President – Mutual Funds, G.research, LLC |
| | | | | |
John C. Ball
Treasurer
Age: 45 | | Since 2017 | | Treasurer of registered investment companies within the Fund Complex since 2017; Vice President and Assistant Treasurer of AMG Funds (2014-2017); Chief Executive Officer, G.distributors, LLC since December 2020 |
| | | | | |
Peter Goldstein
Secretary and Vice
President
Age: 68 | | Since 2020 | | General Counsel, Gabelli Funds, LLC since July 2020; General Counsel and Chief Compliance Officer, Buckingham Capital Management, Inc. (2012-2020); Chief Legal Officer and Chief Compliance Officer, The Buckingham Research Group, Inc. (2012-2020) |
| | | | | |
Richard J. Walz
Chief Compliance
Officer
Age: 62 | | Since 2013 | | Chief Compliance Officer of registered investment companies within the Fund Complex since 2013; Chief Compliance Officer for Gabelli Funds, LLC since 2015 |
| | | | | |
Daniel Plourde
Vice President
Age: 41 | | Since 2021 | | Vice President of registered investment companies within the Fund Complex since 2021; Assistant Treasurer of the North American SPDR ETFs and State Street Global Advisors Mutual Funds (2017-2021); Fund Administration at State Street Bank (2009-2017) |
| 1 | Address: One Corporate Center, Rye, NY 10580-1422, unless otherwise noted. |
| 2 | Each Director will hold office for an indefinite term until the earliest of (i) the next meeting of shareholders, if any, called for the purpose of considering the election or re-election of such Director and until the election and qualification of his or her successor, if any, elected at such meeting, or (ii) the date a Director resigns or retires, or a Director is removed by the Board of Directors or shareholders, in accordance with the Corporation’s By-Laws and Articles of Incorporation. For officers, includes time served in prior officer positions with the Fund. Each officer will hold office for an indefinite term until the date he or she resigns or retires or until his or her successor is elected and qualified. |
| 3 | This column includes only directorships of companies required to report to the SEC under the Securities Exchange Act of 1934, as amended, i.e., public companies, or other investment companies registered under the 1940 Act. |
| 4 | “Interested person” of the Corporation as defined in the 1940 Act. Messrs. Mario J. Gabelli and John D. Gabelli, who are brothers, are each considered an “interested person” because of their affiliation with Gabelli Funds, LLC which acts as the Corporation’s investment adviser. |
| 5 | Directors who are not interested persons are considered “Independent” Directors. |
| 6 | Mr. Colavita’s son, Anthony S. Colavita, serves as a director of other funds in the Gabelli Fund Complex. Mr. van Ekris is an independent director of Gabelli International Ltd., Gabelli Fund LDC, GAMA Capital Opportunities Master Ltd., and GAMCO International SICAV, which may be deemed to be controlled by Mario J. Gabelli and/or affiliates and, in that event, would be deemed to be under common control with the Fund’s Adviser. |
| 7 | Mr. Zizza is an independent director of Gabelli International Ltd., which may be deemed to be controlled by Mario J. Gabelli and/or affiliates and in that event would be deemed to be under common control with the Fund’s Adviser. On September 9, 2015, Mr. Zizza entered into a settlement with the SEC to resolve an inquiry relating to an alleged violation regarding the making of false statements or omissions to the accountants of a company concerning a related party transaction. The company in question is not an affiliate of, nor has any connection to, the Fund. Under the terms of the settlement, Mr. Zizza, without admitting or denying the SEC’s findings and allegation, paid $150,000 and agreed to cease and desist committing or causing any future violations of Rule 13b2-2 of the Securities Exchange Act of 1934, as amended. The Board has discussed this matter and has determined that it does not disqualify Mr. Zizza from serving as an Independent Director. |
Gabelli Funds and Your Personal Privacy
Who are we?
The Gabelli Funds are investment companies registered with the Securities and Exchange Commission under the Investment Company Act of 1940. We are managed by Gabelli Funds, LLC, which is affiliated with GAMCO Investors, Inc., a publicly held company with subsidiaries and affiliates that provide investment advisory services for a variety of clients.
What kind of non-public information do we collect about you if you become a fund shareholder?
If you apply to open an account directly with us, you will be giving us some non-public information about yourself. The non-public information we collect about you is:
| ● | Information you give us on your application form. This could include your name, address, telephone number, social security number, bank account number, and other information. |
| ● | Information about your transactions with us, any transactions with our affiliates, and transactions with the entities we hire to provide services to you. This would include information about the shares that you buy or redeem. If we hire someone else to provide services — like a transfer agent — we will also have information about the transactions that you conduct through them. |
What information do we disclose and to whom do we disclose it?
We do not disclose any non-public personal information about our customers or former customers to anyone other than our affiliates, our service providers who need to know such information, and as otherwise permitted by law. If you want to find out what the law permits, you can read the privacy rules adopted by the Securities and Exchange Commission. They are in volume 17 of the Code of Federal Regulations, Part 248. The Commission often posts information about its regulations on its website, www. sec.gov.
What do we do to protect your personal information?
We restrict access to non-public personal information about you to the people who need to know that information in order to provide services to you or the fund and to ensure that we are complying with the laws governing the securities business. We maintain physical, electronic, and procedural safeguards to keep your personal information.
The Gabelli Global Content & Connectivity Fund
2021 TAX NOTICE TO SHAREHOLDERS (Unaudited)
For the year ended December 31, 2021, the Fund paid ordinary income distributions of $0.6183 to each Class of shares and long term capital gains totaling $2,898,570, or the maximum allowable. The distribution of long term capital gains has been designated as a capital gain dividend by the Fund’s Board of Directors. For the year ended December 31, 2021, 23.00% of the ordinary income distribution qualifies for the dividends received deduction available to corporations. The Fund designates 94.02% of the ordinary income distribution as qualified dividend income pursuant to the Jobs and Growth Tax Relief Reconciliation Act of 2003. The Fund designates 0.02% of the ordinary income distribution as qualified interest income pursuant to the Tax Relief, Unemployment Reauthorization, and Job Creation Act of 2010. Also for the year of 2021, the Fund did not have foreign tax credits.
U.S. Government Income:
The percentage of the ordinary income distribution paid by the Fund during the year ended December 31, 2021 which was derived from U.S. Treasury securities was 0.01%. Such income is exempt from state and local tax in all states. However, many states, including New York and California, allow a tax exemption for a portion of the income earned only if a mutual fund has invested at least 50% of its assets at the end of each quarter of the Fund’s fiscal year in U.S. Government securities. The Fund did not meet this strict requirement in 2021. The percentage of U.S. Government securities held as of December 31, 2021 was 0.00%. Due to the diversity in state and local tax law, it is recommended that you consult your personal tax adviser as to the applicability of the information provided to your specific situation.
All designations are based on financial information available as of the date of this annual report and, accordingly, are subject to change. For each item, it is the intention of the Fund to designate the maximum amount permitted under the Internal Revenue Code and the regulations thereunder.
THE GABELLI GLOBAL CONTENT & CONNECTIVITY FUND
One Corporate Center
Rye, NY 10580-1422
Portfolio Management Team Biographies
Evan D. Miller, CFA, joined G.research, LLC in 2002 as a research analyst following the telecommunications industry on a global basis. Currently, he continues to specialize in the industry and also serves as a portfolio manager of Gabelli Funds, LLC and the Fund. Prior to joining Gabelli, his career spanned nearly a quarter century in the telecommunications industry with corporate strategy and business development positions. Mr. Miller holds an MBA in Finance from the University of Chicago and a BA in Economics from Northwestern University.
Sergey Dluzhevskiy, CFA, CPA, joined G.research, LLC in 2005 as a research analyst covering the North American telecommunications industry. Currently, he continues to specialize in the industry and also serves as a portfolio manager of Gabelli Funds, LLC and the Fund. Prior to joining Gabelli, Mr. Dluzhevskiy was a senior accountant at Deloitte. He received his undergraduate degree from Case Western Reserve University and an MBA at the Wharton School of the University of Pennsylvania.
| We have separated the portfolio managers’ commentary from the financial statements and investment portfolio due to corporate governance regulations stipulated by the Sarbanes-Oxley Act of 2002. We have done this to ensure that the contents of the portfolio managers’ commentary are unrestricted. Both the commentary and the financial statements, including the portfolios of investments, will be available on our website at www.gabelli.com. |
GAMCO Global Series Funds, Inc.
THE GABELLI GLOBAL CONTENT & CONNECTIVITY FUND
One Corporate Center
Rye, New York 10580-1422
t 800-GABELLI (800-422-3554)
f 914-921-5118
e info@gabelli.com
GABELLI.COM
Net Asset Values per share available daily by calling 800-GABELLI after 7:00 P.M.
DIRECTORS Mario J. Gabelli, CFA Chairman and Chief Executive Officer, GAMCO Investors, Inc. Executive Chairman, Associated Capital Group Inc. E. Val Cerutti Chief Executive Officer, Cerutti Consultants, Inc. Anthony J. Colavita President, Anthony J. Colavita, P.C. John D. Gabelli Former Senior Vice President, G.research, LLC Werner J. Roader Former Medical Director, Lawrence Hospital Anthonie C. van Ekris Chairman, BALMAC International, Inc. Salvatore J. Zizza Chairman, Zizza & Associates Corp. | OFFICERS Bruce N. Alpert President John C. Ball Treasurer Peter Goldstein Secretary and Vice President Richard J. Walz Chief Compliance Officer Daniel Plourde Vice President DISTRIBUTOR G.distributors, LLC CUSTODIAN State Street Bank and Trust Company TRANSFER AGENT, AND DIVIDEND DISBURSING AGENT DST Asset Manager Solutions, Inc. LEGAL COUNSEL Skadden, Arps, Slate, Meagher & Flom LLP |
| This report is submitted for the general information of the shareholders of The Gabelli Global Content & Connectivity Fund. It is not authorized for distribution to prospective investors unless preceded or accompanied by an effective prospectus. |
GAB401Q421AR

The Gabelli Global Growth Fund
Annual Report — December 31, 2021
(Y) our Portfolio Management Team
| |  |  |  | |
| | Caesar M. P. Bryan | Howard F. Ward, CFA | Christopher D. Ward, CFA | |
| | Portfolio Manager | Portfolio Manager | Associate Portfolio | |
| | | | Manager | |
To Our Shareholders,
For the year ended December 31, 2021, the net asset value (NAV) total return per Class I Share of The Gabelli Global Growth Fund was 21.1% compared with a total return of 19.0% for the Morgan Stanley Capital International (MSCI) All Country (AC) World Index. Other classes of shares are available. See page 4 for performance information for all classes.
Enclosed are the financial statements, including the schedule of investments, as of December 31, 2021.
Investment Objective and Strategy (Unaudited)
The Fund primarily seeks to provide investors with appreciation of capital. Current income is a secondary objective of the Fund.
The Fund’s investment strategy is to invest at least 65% of its total assets in common stocks of companies, which the portfolio managers believe are likely to have rapid growth in revenues and earnings and potential for above average capital appreciation or are undervalued. The Global Growth Fund invests primarily in common stocks of foreign and domestic small-capitalization, mid-capitalization, and large-capitalization issuers. As a “global” fund, the Fund invests in securities of issuers, or related investments thereof, located in at least three countries, and at least 40% of the Fund’s total net assets is invested in securities of non-U.S. issuers.
| As permitted by regulations adopted by the Securities and Exchange Commission, paper copies of the Fund’s annual and semiannual shareholder reports will no longer be sent by mail, unless you specifically request paper copies of the reports. Instead, the reports will be made available on the Fund’s website (www.gabelli.com), and you will be notified by mail each time a report is posted and provided with a website link to access the report. If you already elected to receive shareholder reports electronically, you will not be affected by this change and you need not take any action. To elect to receive all future reports on paper free of charge, please contact your financial intermediary, or, if you invest directly with the Fund, you may call 800-422-3554 or send an email request to info@gabelli.com. |
Performance Discussion (Unaudited)
During the first quarter 2021, we added ZoomInfo Technologies Inc. We had long been wary about the potential risk of churn at Zoom as the economy reopened. However, as the stock sold off 40% from its November peak, the risk reward became far more attractive, especially as the rapid growth of Zoom Phone has the potential to offset churn from video customers. We also added the leading TV streaming platform in the U.S., Roku, which e-commence, OptumInsight, valued based at home, is well positioned to capture linear TV advertising dollars as those budgets move to connected TV ecosystems. We also added Coupang Inc., a recent IPO and leader in the South Korean ecommerce market.
In the second quarter we added Sea Ltd., a leading super app in Southeast Asia whose platform encompasses gaming, e-commerce and financial services. Garena is Sea’s mobile and PC gaming platform with 600 million active users. Garena licenses most of its games but will continue to scale its publishing capabilities after its first in house mobile game, Free Fire, became a global phenomenon. Sea has support from Tencent, which owns 23% of Sea. Shopee is Sea’s ecommerce arm, which operates in Southeast Asia and Latin America, regions where ecommerce penetration rates average 6% in contrast to mid-teens penetration in more mature markets around the world. Financial services comprise an insignificant amount of revenue, but Shopee Pay, Sea’s digital wallet, represents long term value potential.
In the third quarter, we added Medtronic, one of the world’s largest medical technology companies based in Ireland. Medtronic’s portfolio spans cardiovascular, medical surgical, neuroscience, and diabetes. The company has a rich new product pipeline, including its Hugo robotic-assisted surgery system. We also added SolarEdge, a global leader in solar photovoltaic (PV) inverters based in Israel. PV inverters convert direct current from solar arrays into alternating current, which enables the transmission and use of electricity in household appliances.
We added Marvell Technology in the fourth quarter, the leader in high performance data infrastructure semiconductors. The data infrastructure market is defined by long product lifecycles and deep customer relationships. In 2021, Marvell closed on its $10 billion acquisition of Inphi, a leader in optical interconnects. Marvell is benefiting from tailwinds such as 5G and Cloud, and is leveraging its broad IP portfolio to partner with customers in developing custom silicon. We also added UnitedHealth Group. UnitedHealth operates UnitedHealthcare, its health benefit platform, and Optum, an information and technology enabled health services business which includes OptumHealth, OptumInsight and OptumRx. OptumHealth is at the forefront of value-based care, with an integrated delivery model that combines in person, at home and virtual settings. OptumRx, a leading pharmacy benefits manager, is launching a marketplace that will offer discounted prescriptions and virtual provider visits.
Selected holdings that contributed positively to performance in 2021 were: Alphabet Inc. (4.2% of net assets as of December 31, 2021), is a holding company whose subsidiaries include the core Google business (Search, Android, YouTube, Cloud) as well as multiple independent companies, i.e., GV, Waymo, Verily; Microsoft Corp. (5.8%) develops, licenses, and supports software, services, devices, and solutions worldwide; and Lasertec Corp. (2.9%) develops, manufactures, sells, and services semiconductor related equipment, laser microscopes, and flat panel display related equipment worldwide.
Some of our weaker performing holdings during the year were: ZoomInfo Techonologies Inc. (1.4%), provides a video first communications platform in the Americas, the Asia/Pacific, Europe, the Middle East, and Africa; Paypal Holdings Inc. (1.2%) operates as a technology platform and digital payments company that enables digital and mobile payments on behalf of consumers and merchants worldwide; and Coupang Inc. (no longer held) owns and operates in e-commerce business through its mobile applications and Internet websites primarily in South Korea.
Thank you for your investment in The Gabelli Global Growth Fund.
We appreciate your confidence and trust.
Comparative Results
Average Annual Returns through December 31, 2021 (a) (Unaudited)
Total returns and average annual returns reflect changes in share price, reinvestment of distributions, and are net of expenses.
| | | 1 Year | | 5 Year | | 10 Year | | 15 Year | | Since
Inception
(2/7/94) |
| Class I (GGGIX) | | | 21.10 | % | | | 22.18 | % | | | 15.96 | % | | | 10.66 | % | | | 10.76 | % |
| Class AAA (GICPX) | | | 21.10 | | | | 21.87 | | | | 15.55 | | | | 10.31 | | | | 10.58 | |
| MSCI AC World Index (b) | | | 19.04 | | | | 14.97 | | | | 12.44 | | | | 7.62 | | | | 8.11 | |
| Lipper Global Large-Cap Growth Fund Classification (b) | | | 15.15 | | | | 18.57 | | | | 13.99 | | | | 8.64 | | | | N/A | |
| Class A (GGGAX) | | | 21.09 | | | | 21.86 | | | | 15.54 | | | | 10.31 | | | | 10.58 | |
| With sales charge (c) | | | 14.13 | | | | 20.42 | | | | 14.86 | | | | 9.88 | | | | 10.35 | |
| Class C (GGGCX) | | | 21.08 | | | | 21.34 | | | | 14.86 | | | | 9.60 | | | | 9.99 | |
| With contingent deferred sales charge (d) | | | 20.08 | | | | 21.34 | | | | 14.86 | | | | 9.60 | | | | 9.99 | |
| (a) | Returns would have been lower had the Adviser not reimbursed certain expenses. The Class AAA Share NAVs are used to calculate performance for the periods prior to the issuance of Class A Shares, Class C Shares, and Class I Shares on March 2, 2000, March 12, 2000, and January 11, 2008, respectively. The actual performance of the Class A and Class C Shares would have been lower due to the additional fees and expenses associated with these classes of shares. The actual performance of Class I Shares would have been higher due to lower expenses related to this class of shares. The Fund imposes a 2% redemption fee on shares sold or exchanged within seven days of purchase. |
| (b) | The MSCI AC World Index is an unmanaged market capitalization weighted index that is designed to measure the equity market performance of developed and emerging markets. The MSCI AC World Index consists of 45 country indices comprising 24 developed and 21 emerging market country indices. The Lipper Global Large-Cap Growth Fund Classification reflects the performance of mutual funds classified in this particular category. Dividends are considered reinvested. You cannot invest directly in an index. MSCI AC World Index since inception performance is as of January 31, 1994. |
| (c) | Performance results include the effect of the maximum 5.75% sales charge at the beginning of the period. |
| (d) | Assuming payment of the 1% maximum contingent deferred sales charge imposed on redemptions made within one year of purchase. No existing C Class shares are currently subject to the CDSC as of the date of this report. |
In the current prospectuses dated April 30, 2021, the gross expense ratios for Class AAA, A, C, and I Shares are 1.57%, 1.57%, 2.32%, and 1.32%, respectively, and the net expense ratios for all share classes after contractual reimbursements by Gabelli Funds, LLC, (the Adviser) is 0.90%. See page 12 for the expense ratios for the year ended December 31, 2021. The contractual reimbursements are in effect through April 30, 2022. Class AAA and Class I Shares do not have a sales charge. The maximum sales charge for Class A Shares and Class C Shares is 5.75% and 1.00%, respectively.
Investing in foreign securities involves risks not ordinarily associated with investments in domestic issues, including currency fluctuation, economic, and political risks. Investors should carefully consider the investment objectives, risks, charges, and expenses of the Fund before investing. The prospectus contains information about these and other matters and should be read carefully before investing. To obtain a prospectus, please visit our website at www.gabelli.com.
Returns represent past performance and do not guarantee future results. Investment returns and the principal value of an investment will fluctuate. When shares are redeemed, they may be worth more or less than their original cost. Current performance may be lower or higher than the performance data presented. Visit www.gabelli.com for performance information as of the most recent month end.
COMPARISON OF CHANGE IN VALUE OF A $10,000 INVESTMENT IN
THE GABELLI GLOBAL GROWTH FUND (CLASS AAA SHARES), MSCI AC WORLD INDEX, AND
LIPPER GLOBAL LARGE-CAP GROWTH FUND CLASSIFICATION (Unaudited)
| Average Annual Total Returns* |
| | 1 Year | 5 Year | 10 Year |
| Class AAA | 21.10% | 21.87% | 15.55% |
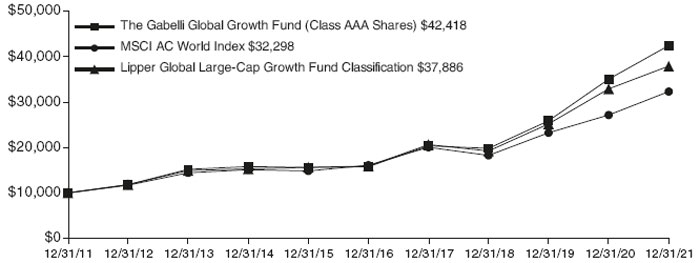
* Past performance is not predictive of future results. The performance tables and graph do not reflect the deduction of taxes that a shareholder would pay on Fund distributions or the redemption of Fund shares.
| The Gabelli Global Growth Fund | |
| Disclosure of Fund Expenses (Unaudited) | |
| For the Six Month Period from July 1, 2021 through December 31, 2021 | Expense Table |
We believe it is important for you to understand the impact of fees and expenses regarding your investment. All mutual funds have operating expenses. As a shareholder of a fund, you incur ongoing costs, which include costs for portfolio management, administrative services, and shareholder reports (like this one), among others. Operating expenses, which are deducted from a fund’s gross income, directly reduce the investment return of a fund. When a fund’s expenses are expressed as a percentage of its average net assets, this figure is known as the expense ratio. The following examples are intended to help you understand the ongoing costs (in dollars) of investing in your Fund and to compare these costs with those of other mutual funds. The examples are based on an investment of $1,000 made at the beginning of the period shown and held for the entire period.
The Expense Table below illustrates your Fund’s costs in two ways:
Actual Fund Return: This section provides information about actual account values and actual expenses. You may use this section to help you to estimate the actual expenses that you paid over the period after any fee waivers and expense reimbursements. The “Ending Account Value” shown is derived from the Fund’s actual return during the past six months, and the “Expenses Paid During Period” shows the dollar amount that would have been paid by an investor who started with $1,000 in the Fund. You may use this information, together with the amount you invested, to estimate the expenses that you paid over the period.
To do so, simply divide your account value by $1,000 (for example, an $8,600 account value divided by $1,000 = 8.6), then multiply the result by the number given for your Fund under the heading “Expenses Paid During Period” to estimate the expenses you paid during this period.
Hypothetical 5% Return: This section provides information about hypothetical account values and hypothetical expenses based on the Fund’s actual expense ratio. It assumes a hypothetical annualized return of 5% before expenses during the period shown. In this case – because the hypothetical return used is not the Fund’s actual return – the results do not apply to your investment and you cannot use the hypothetical account value and expense to estimate the actual ending account balance or expenses you
paid for the period. This example is useful in making comparisons of the ongoing costs of investing in the Fund and other funds. To do so, compare this 5% hypothetical example with the 5% hypothetical examples that appear in shareholder reports of other funds.
Please note that the expenses shown in the table are meant to highlight your ongoing costs only and do not reflect any transactional costs such as sales charges (loads), redemption fees, or exchange fees, if any, which are described in the Prospectus. If these costs were applied to your account, your costs would be higher. Therefore, the 5% hypothetical return is useful in comparing ongoing costs only, and will not help you determine the relative total costs of owning different funds. The “Annualized Expense Ratio” represents the actual expenses for the last six months and may be different from the expense ratio in the Financial Highlights which is for the year ended December 31, 2021.
| | | Beginning
Account Value
07/01/21 | | Ending
Account Value
12/31/21 | | Annualized
Expense
Ratio | | Expenses
Paid During
Period * |
| The Gabelli Global Growth Fund | | | | |
| Actual Fund Return | | | | | | |
| Class AAA | | $1,000.00 | | $1,106.30 | | 0.90% | | $ 4.78 |
| Class A | | $1,000.00 | | $1,106.20 | | 0.90% | | $ 4.78 |
| Class C | | $1,000.00 | | $1,106.30 | | 0.90% | | $ 4.78 |
| Class I | | $1,000.00 | | $1,106.40 | | 0.90% | | $ 4.78 |
| Hypothetical 5% Return | | | | | | | | |
| Class AAA | | $1,000.00 | | $1,020.67 | | 0.90% | | $ 4.58 |
| Class A | | $1,000.00 | | $1,020.67 | | 0.90% | | $ 4.58 |
| Class C | | $1,000.00 | | $1,020.67 | | 0.90% | | $ 4.58 |
| Class I | | $1,000.00 | | $1,020.67 | | 0.90% | | $ 4.58 |
| * | Expenses are equal to the Fund’s annualized expense ratio for the last six months multiplied by the average account value over the period, multiplied by the number of days in the most recent fiscal half year (184 days), then divided by 365. |
Summary of Portfolio Holdings (Unaudited)
The following table presents portfolio holdings as a percent of net assets as of December 31, 2021:
The Gabelli Global Growth Fund
| Information Technology | | | 46.4 | % |
| Consumer Discretionary | | | 18.1 | % |
| Health Care | | | 13.2 | % |
| Communication Services | | | 10.4 | % |
| Industrials | | | 6.1 | % |
| Consumer Staples | | | 2.2 | % |
| Financials | | | 1.6 | % |
| Materials | | | 1.3 | % |
| U.S. Government Obligations | | | 0.5 | % |
| Other Assets and Liabilities (Net) | | | 0.2 | % |
| | | | 100.0 | % |
The Fund files a complete schedule of portfolio holdings with the Securities and Exchange Commission (the SEC) for the first and third quarters of each fiscal year on Form N-PORT. Shareholders may obtain this information at www.gabelli.com or by calling the Fund at 800-GABELLI (800-422-3554). The Fund’s Form N-PORT is available on the SEC’s website at www.sec.gov and may also be reviewed and copied at the SEC’s Public Reference Room in Washington, DC. Information on the operation of the Public Reference Room may be obtained by calling 800-SEC-0330.
Proxy Voting
The Fund files Form N-PX with its complete proxy voting record for the twelve months ended June 30, no later than August 31 of each year. A description of the Fund’s proxy voting policies, procedures, and how the Fund voted proxies relating to portfolio securities is available without charge, upon request, by (i) calling 800-GABELLI (800-422-3554); (ii) writing to The Gabelli Funds at One Corporate Center, Rye, NY 10580-1422; or (iii) visiting the SEC’s website at www.sec.gov.
The Gabelli Global Growth Fund
Schedule of Investments — December 31, 2021
| | | | | | | | Market | |
| Shares | | | | Cost | | | Value | |
| | | COMMON STOCKS — 99.3% | | | | | | |
| | | | INFORMATION TECHNOLOGY — 46.4% | | | | | | | | |
| | 5,400 | | Adobe Inc.† | | $ | 799,715 | | | $ | 3,062,124 | |
| | 2,680 | | Adyen NV† | | | 1,775,779 | | | | 7,052,802 | |
| | 57,040 | | Apple Inc. | | | 3,285,365 | | | | 10,128,593 | |
| | 12,470 | | ASML Holding NV | | | 4,014,439 | | | | 9,927,866 | |
| | 9,700 | | Atlassian Corp. plc, Cl. A† | | | 1,363,701 | | | | 3,698,513 | |
| | 18,100 | | Cloudflare Inc., Cl. A† | | | 830,238 | | | | 2,380,150 | |
| | 10,800 | | CrowdStrike Holdings Inc., Cl. A† | | | 1,619,230 | | | | 2,211,300 | |
| | 48,800 | | Infineon Technologies AG | | | 2,099,925 | | | | 2,264,577 | |
| | 14,040 | | Keyence Corp. | | | 3,486,195 | | | | 8,822,144 | |
| | 5,080 | | Lam Research Corp. | | | 1,478,012 | | | | 3,653,282 | |
| | 22,500 | | Lasertec Corp. | | | 2,755,575 | | | | 6,902,764 | |
| | 35,000 | | Marvell Technology Inc. | | | 2,416,212 | | | | 3,062,150 | |
| | 6,700 | | Mastercard Inc., Cl. A | | | 93,730 | | | | 2,407,444 | |
| | 41,300 | | Microsoft Corp. | | | 1,765,756 | | | | 13,890,016 | |
| | 45,200 | | NVIDIA Corp. | | | 3,246,349 | | | | 13,293,772 | |
| | 14,700 | | PayPal Holdings Inc.† | | | 1,475,469 | | | | 2,772,126 | |
| | 6,300 | | ServiceNow Inc.† | | | 1,761,621 | | | | 4,089,393 | |
| | 9,800 | | Snowflake Inc., Cl. A† | | | 2,604,742 | | | | 3,319,750 | |
| | 10,500 | | Taiwan Semiconductor Manufacturing Co. Ltd., ADR | | | 537,627 | | | | 1,263,255 | |
| | 17,000 | | Visa Inc., Cl. A | | | 301,339 | | | | 3,684,070 | |
| | 51,000 | | ZoomInfo Technologies Inc.† | | | 2,755,435 | | | | 3,274,200 | |
| | | | | | | 40,466,454 | | | | 111,160,291 | |
| | | | CONSUMER DISCRETIONARY — 18.1% | | | | | | | | |
| | 4,215 | | Amazon.com Inc.† | | | 8,580,742 | | | | 14,054,243 | |
| | 36,200 | | Aptiv plc† | | | 5,222,629 | | | | 5,971,190 | |
| | 2,000 | | Christian Dior SE | | | 290,698 | | | | 1,662,210 | |
| | 6,080 | | Kering SA | | | 4,201,366 | | | | 4,893,218 | |
| | 7,800 | | Lululemon Athletica Inc.† | | | 1,180,922 | | | | 3,053,310 | |
| | 8,600 | | LVMH Moet Hennessy Louis Vuitton SE | | | 4,118,262 | | | | 7,118,130 | |
| | 55,300 | | Puma SE | | | 4,311,190 | | | | 6,768,098 | |
| | | | | | | 27,905,809 | | | | 43,520,399 | |
| | | | HEALTH CARE — 13.2% | | | | | | | | |
| | 13,500 | | Danaher Corp. | | | 2,351,457 | | | | 4,441,635 | |
| | 36,800 | | Edwards Lifesciences Corp.† | | | 2,826,970 | | | | 4,767,440 | |
| | 11,050 | | Intuitive Surgical Inc.† | | | 3,164,956 | | | | 3,970,265 | |
| | 34,000 | | Medtronic plc | | | 3,452,684 | | | | 3,517,300 | |
| | 6,950 | | Thermo Fisher Scientific Inc. | | | 1,565,108 | | | | 4,637,318 | |
| | 15,000 | | UnitedHealth Group Inc. | | | 7,136,866 | | | | 7,532,100 | |
| | 11,300 | | Zoetis Inc. | | | 637,233 | | | | 2,757,539 | |
| | | | | | | 21,135,274 | | | | 31,623,597 | |
| | | | | | | | Market | |
| Shares | | | | Cost | | | Value | |
| | | | COMMUNICATION SERVICES — 10.4% | | | | | | | | |
| | 810 | | Alphabet Inc., Cl. A† | | $ | 238,018 | | | $ | 2,346,602 | |
| | 2,696 | | Alphabet Inc., Cl. C† | | | 4,011,471 | | | | 7,801,119 | |
| | 22,700 | | Meta Platforms Inc., Cl. A† | | | 4,959,749 | | | | 7,635,145 | |
| | 10,000 | | Netflix Inc.† | | | 4,176,136 | | | | 6,024,400 | |
| | 8,000 | | The Walt Disney Co.† | | | 1,082,048 | | | | 1,239,120 | |
| | | | | | | 14,467,422 | | | | 25,046,386 | |
| | | | INDUSTRIALS — 6.1% | | | | | | | | |
| | 95,500 | | ABB Ltd., ADR | | | 3,276,025 | | | | 3,645,235 | |
| | 15,500 | | FANUC Corp. | | | 3,273,771 | | | | 3,285,143 | |
| | 27,100 | | IHS Markit Ltd. | | | 1,435,999 | | | | 3,602,132 | |
| | 15,400 | | Nidec Corp. | | | 1,908,666 | | | | 1,810,032 | |
| | 8,100 | | SolarEdge Technologies Inc.† | | | 2,443,633 | | | | 2,272,617 | |
| | | | | | | 12,338,094 | | | | 14,615,159 | |
| | | | CONSUMER STAPLES — 2.2% | | | | | | | | |
| | 11,200 | | L’Oreal SA | | | 2,058,684 | | | | 5,316,613 | |
| | | | | | | | | | | | |
| | | | FINANCIALS — 1.6% | | | | | | | | |
| | 151,000 | | Investor AB, Cl. B | | | 1,977,975 | | | | 3,805,831 | |
| | | | | | | | | | | | |
| | | | MATERIALS — 1.3% | | | | | | | | |
| | 8,660 | | The Sherwin-Williams Co. | | | 1,664,281 | | | | 3,049,706 | |
| | | | | | | | | | | | |
| | | | TOTAL COMMON STOCKS | | | 122,013,993 | | | | 238,137,982 | |
| Principal | | | | | | | | |
| Amount | | | | | | | | |
| | | | U.S. GOVERNMENT OBLIGATIONS — 0.5% |
| $ | 1,225,000 | | U.S. Treasury Bills, 0.005% to 0.037%††, 01/20/22 to 03/17/22 | | | 1,224,931 | | | | 1,224,908 | |
| | | | TOTAL INVESTMENTS — 99.8% | | $ | 123,238,924 | | | | 239,362,890 | |
| | | | Other Assets and Liabilities (Net) — 0.2% | | | 462,285 | |
| | | | NET ASSETS — 100.0% | | $ | 239,825,175 | |
| † | Non-income producing security. |
| †† | Represents annualized yields at dates of purchase. |
| | | |
| ADR | American Depositary Receipt |
See accompanying notes to financial statements.
The Gabelli Global Growth Fund
Schedule of Investments (Continued) — December 31, 2021
| | | % of | | | | |
| | | Market | | | Market | |
| Geographic Diversification | | Value | | | Value | |
| United States | | | 59.6 | % | | $ | 142,709,910 | |
| Europe | | | 28.3 | | | | 67,817,819 | |
| Japan | | | 8.7 | | | | 20,820,083 | |
| Asia/Pacific | | | 2.1 | | | | 4,961,768 | |
| Canada | | | 1.3 | | | | 3,053,310 | |
| | | | 100.0 | % | | $ | 239,362,890 | |
See accompanying notes to financial statements.
The Gabelli Global Growth Fund
Statement of Assets and Liabilities
December 31, 2021
| Assets: | | | |
| Investments, at value (cost $123,238,924) | | $ | 239,362,890 | |
| Cash | | | 569 | |
| Receivable for Fund shares sold | | | 877,942 | |
| Receivable from Adviser | | | 114,314 | |
| Dividends receivable | | | 99,212 | |
| Prepaid expenses | | | 27,001 | |
| Total Assets | | | 240,481,928 | |
| Liabilities: | | | | |
| Payable for investments purchased | | | 209,369 | |
| Payable for Fund shares redeemed | | | 78,017 | |
| Payable for investment advisory fees | | | 199,974 | |
| Payable for distribution fees | | | 29,746 | |
| Payable for accounting fees | | | 3,750 | |
| Payable for legal and audit fees | | | 42,400 | |
| Payable for shareholder communications | | | 36,816 | |
| Payable for shareholder services fees | | | 36,088 | |
| Other accrued expenses | | | 20,593 | |
| Total Liabilities | | | 656,753 | |
| Net Assets | | | | |
| (applicable to 4,347,169 shares outstanding) | | $ | 239,825,175 | |
| Net Assets Consist of: | | | | |
| Paid-in capital | | $ | 125,497,242 | |
| Total distributable earnings | | | 114,327,933 | |
| Net Assets | | $ | 239,825,175 | |
| Shares of Capital Stock, each at $0.001 par value: | | | | |
| Class AAA: | | | | |
| Net Asset Value, offering, and redemption price per share ($126,055,105 ÷ 2,305,518 shares outstanding; 75,000,000 shares authorized) | | $ | 54.68 | |
| Class A: | | | | |
| Net Asset Value and redemption price per share ($5,251,818 ÷ 96,118 shares outstanding; 50,000,000 shares authorized) | | $ | 54.64 | |
| Maximum offering price per share (NAV ÷ 0.9425, based on maximum sales charge of 5.75% of the offering price) | | $ | 57.97 | |
| Class C: | | | | |
| Net Asset Value and redemption price per share ($2,410,925 ÷ 54,680 shares outstanding; 25,000,000 shares authorized) | | $ | 44.09 | |
| Class I: | | | | |
| Net Asset Value, offering, and redemption price per share ($106,107,327 ÷ 1,890,853 shares outstanding; 25,000,000 shares authorized) | | $ | 56.12 | |
Statement of Operations
For the Year Ended December 31, 2021
| Investment Income: | | | |
| Dividends (net of foreign withholding taxes of $87,537) | | $ | 899,724 | |
| Interest | | | 267 | |
| Total Investment Income | | | 899,991 | |
| Expenses: | | | | |
| Investment advisory fees | | | 2,151,221 | |
| Distribution fees - Class AAA | | | 295,925 | |
| Distribution fees - Class A | | | 12,494 | |
| Distribution fees - Class C | | | 23,439 | |
| Shareholder services fees | | | 145,334 | |
| Registration expenses | | | 74,414 | |
| Shareholder communications expenses | | | 59,130 | |
| Legal and audit fees | | | 57,438 | |
| Accounting fees | | | 45,000 | |
| Custodian fees | | | 38,538 | |
| Directors’ fees | | | 34,555 | |
| Tax expense | | | 24,552 | |
| Interest expense | | | 1,216 | |
| Miscellaneous expenses | | | 47,117 | |
| Total Expenses | | | 3,010,373 | |
| Less: | | | | |
| Expense reimbursements (See Note 3) | | | (1,048,506 | ) |
| Net Expenses | | | 1,961,867 | |
| Net Investment Loss | | | (1,061,876 | ) |
| Net Realized and Unrealized Gain/(Loss) on Investments and Foreign Currency: | | | | |
| Net realized gain on investments | | | 9,109,692 | |
| Net realized gain on foreign currency transactions | | | 2,255 | |
| Net realized gain on investments and foreign currency transactions | | | 9,111,947 | |
| Net change in unrealized appreciation/depreciation: | | | | |
| on investments | | | 33,557,871 | |
| on foreign currency translations | | | (3,211 | ) |
| Net change in unrealized appreciation/depreciation on investments and foreign currency translations | | | 33,554,660 | |
| Net Realized and Unrealized Gain on Investments and Foreign Currency | | | 42,666,607 | |
| Net Increase in Net Assets Resulting from Operations | | $ | 41,604,731 | |
See accompanying notes to financial statements.
The Gabelli Global Growth Fund
Statement of Changes in Net Assets
| | | Year Ended | | Year Ended |
| | | December 31, 2021 | | December 31, 2020 |
| | | | | | | | | |
| Operations: | | | | | | | | | | |
| Net investment loss | | | $ | (1,061,876 | ) | | | $ | (209,482 | ) |
| Net realized gain on investments and foreign currency transactions | | | | 9,111,947 | | | | | 4,422,137 | |
| Net change in unrealized appreciation/depreciation on investments and foreign currency translations | | | | 33,554,660 | | | | | 42,117,856 | |
| Net Increase in Net Assets Resulting from Operations | | | | 41,604,731 | | | | | 46,330,511 | |
| | | | | | | | | | | |
| Distributions to Shareholders: | | | | | | | | | | |
| Accumulated earnings | | | | | | | | | | |
| Class AAA | | | | (5,108,633 | ) | | | | (2,676,732 | ) |
| Class A | | | | (214,057 | ) | | | | (111,792 | ) |
| Class C | | | | (120,340 | ) | | | | (67,412 | ) |
| Class I | | | | (4,150,844 | ) | | | | (1,600,736 | ) |
| Total Distributions to Shareholders | | | | (9,593,874 | ) | | | | (4,456,672 | ) |
| | | | | | | | | | | |
| Capital Share Transactions: | | | | | | | | | | |
| Class AAA | | | | (6,526,433 | ) | | | | (687,182 | ) |
| Class A | | | | (289,185 | ) | | | | (1,870,229 | ) |
| Class C | | | | (293,511 | ) | | | | (802,712 | ) |
| Class I | | | | 21,645,828 | | | | | 41,980,393 | |
| Net Increase in Net Assets from Capital Share Transactions | | | | 14,536,699 | | | | | 38,620,270 | |
| | | | | | | | | | | |
| Redemption Fees | | | | 33 | | | | | 274 | |
| | | | | | | | | | | |
| Net Increase in Net Assets | | | | 46,547,589 | | | | | 80,494,383 | |
| Net Assets: | | | | | | | | | | |
| Beginning of year | | | | 193,277,586 | | | | | 112,783,203 | |
| End of year | | | $ | 239,825,175 | | | | $ | 193,277,586 | |
See accompanying notes to financial statements.
The Gabelli Global Growth Fund
Financial Highlights
Selected data for a share of capital stock outstanding throughout each year:
| | | | | | Income (Loss) from Investment
Operations | | | Distributions | | | | | | | | | | | | Ratios to Average Net Assets/Supplemental Data |
Year Ended
December 31 | | Net Asset Value,
Beginning of Year | | | Net Investment
Income (Loss)(a) | | | Net Realized
and Unrealized
Gain (Loss) on
Investments | | | Total from
Investment
Operations | | | Net Investment
Income | | | Net Realized
Gain on
Investments | | | Return of Capital | | | Total
Distributions | | | Redemption
Fees(a)(b) | | | Net Asset Value,
End of Year | | | Total Return† | | | Net Assets, End of Year (in 000’s) | | | Net Investment
Income (Loss) | | | Operating
Expenses Before
Reimbursement | | | Operating
Expenses Net of
Reimbursement | | Portfolio
Turnover
Rate | |
| Class AAA | | | | | | | | | | | | | | | | | | | | | | | | | | | | | | | | | | | | | | | | | | | | | | | | | | | | | | | | | | | |
| 2021 | | $ | 47.04 | | | $ | (0.25 | ) | | $ | 10.19 | | | $ | 9.94 | | | $ | (0.02 | ) | | $ | (2.28 | ) | | $ | — | | | $ | (2.30 | ) | | $ | 0.00 | | | $ | 54.68 | | | 21.10 | % | | $ | 126,055 | | | (0.49 | )% | | 1.50 | % | | 0.91 | %(c)(d) | | 49 | % |
| 2020 | | | 35.56 | | | | (0.05 | ) | | | 12.64 | | | | 12.59 | | | | (0.09 | ) | | | (1.02 | ) | | | — | | | | (1.11 | ) | | | 0.00 | | | | 47.04 | | | 35.43 | | | | 115,210 | | | (0.14 | ) | | 1.57 | | | 0.90 | (c) | | 50 | |
| 2019 | | | 29.94 | | | | (0.07 | ) | | | 9.29 | | | | 9.22 | | | | — | | | | (3.60 | ) | | | — | | | | (3.60 | ) | | | 0.00 | | | | 35.56 | | | 30.73 | | | | 88,287 | | | (0.21 | ) | | 1.63 | | | 1.22 | (c) | | 78 | |
| 2018 | | | 33.42 | | | | (0.05 | ) | | | (0.91 | ) | | | (0.96 | ) | | | — | | | | (2.52 | ) | | | — | | | | (2.52 | ) | | | 0.00 | | | | 29.94 | | | (2.80 | ) | | | 71,877 | | | (0.14 | ) | | 1.68 | | | 1.42 | (c)(e) | | 58 | |
| 2017 | | | 26.72 | | | | (0.13 | ) | | | 7.89 | | | | 7.76 | | | | — | | | | (1.05 | ) | | | (0.01 | ) | | | (1.06 | ) | | | 0.00 | | | | 33.42 | | | 29.02 | | | | 77,829 | | | (0.42 | ) | | 1.67 | | | 1.67 | (e) | | 43 | |
| Class A | | | | | | | | | | | | | | | | | | | | | | | | | | | | | | | | | | | | | | | | | | | | | | | | | | | | | | | | | | | |
| 2021 | | $ | 47.01 | | | $ | (0.25 | ) | | $ | 10.18 | | | $ | 9.93 | | | $ | (0.02 | ) | | $ | (2.28 | ) | | $ | — | | | $ | (2.30 | ) | | $ | 0.00 | | | $ | 54.64 | | | 21.09 | % | | $ | 5,252 | | | (0.49 | )% | | 1.50 | % | | 0.91 | %(c)(d) | | 49 | % |
| 2020 | | | 35.55 | | | | (0.05 | ) | | | 12.62 | | | | 12.57 | | | | (0.09 | ) | | | (1.02 | ) | | | — | | | | (1.11 | ) | | | 0.00 | | | | 47.01 | | | 35.38 | | | | 4,804 | | | (0.12 | ) | | 1.57 | | | 0.90 | (c) | | 50 | |
| 2019 | | | 29.93 | | | | (0.08 | ) | | | 9.30 | | | | 9.22 | | | | — | | | | (3.60 | ) | | | — | | | | (3.60 | ) | | | 0.00 | | | | 35.55 | | | 30.74 | | | | 5,332 | | | (0.21 | ) | | 1.63 | | | 1.22 | (c) | | 78 | |
| 2018 | | | 33.41 | | | | (0.05 | ) | | | (0.91 | ) | | | (0.96 | ) | | | — | | | | (2.52 | ) | | | — | | | | (2.52 | ) | | | 0.00 | | | | 29.93 | | | (2.80 | ) | | | 3,861 | | | (0.14 | ) | | 1.68 | | | 1.41 | (c)(e) | | 58 | |
| 2017 | | | 26.72 | | | | (0.13 | ) | | | 7.88 | | | | 7.75 | | | | — | | | | (1.05 | ) | | | (0.01 | ) | | | (1.06 | ) | | | 0.00 | | | | 33.41 | | | 28.98 | | | | 3,652 | | | (0.43 | ) | | 1.67 | | | 1.67 | (e) | | 43 | |
| Class C | | | | | | | | | | | | | | | | | | | | | | | | | | | | | | | | | | | | | | | | | | | | | | | | | | | | | | | | | | | |
| 2021 | | $ | 38.30 | | | $ | (0.21 | ) | | $ | 8.30 | | | $ | 8.09 | | | $ | (0.02 | ) | | $ | (2.28 | ) | | $ | — | | | $ | (2.30 | ) | | $ | 0.00 | | | $ | 44.09 | | | 21.08 | % | | $ | 2,411 | | | (0.49 | )% | | 2.25 | % | | 0.91 | %(c)(d) | | 49 | % |
| 2020 | | | 29.11 | | | | (0.04 | ) | | | 10.34 | | | | 10.30 | | | | (0.09 | ) | | | (1.02 | ) | | | — | | | | (1.11 | ) | | | 0.00 | | | | 38.30 | | | 35.41 | | | | 2,376 | | | (0.12 | ) | | 2.32 | | | 0.90 | (c) | | 50 | |
| 2019 | | | 25.18 | | | | (0.25 | ) | | | 7.78 | | | | 7.53 | | | | — | | | | (3.60 | ) | | | — | | | | (3.60 | ) | | | 0.00 | | | | 29.11 | | | 29.82 | | | | 2,598 | | | (0.84 | ) | | 2.38 | | | 1.87 | (c) | | 78 | |
| 2018 | | | 28.73 | | | | (0.28 | ) | | | (0.75 | ) | | | (1.03 | ) | | | — | | | | (2.52 | ) | | | — | | | | (2.52 | ) | | | 0.00 | | | | 25.18 | | | (3.50 | ) | | | 1,561 | | | (0.93 | ) | | 2.43 | | | 2.15 | (c)(e) | | 58 | |
| 2017 | | | 23.26 | | | | (0.32 | ) | | | 6.85 | | | | 6.53 | | | | — | | | | (1.05 | ) | | | (0.01 | ) | | | (1.06 | ) | | | 0.00 | | | | 28.73 | | | 28.04 | | | | 1,479 | | | (1.19 | ) | | 2.42 | | | 2.42 | (e) | | 43 | |
| Class I | | | | | | | | | | | | | | | | | | | | | | | | | | | | | | | | | | | | | | | | | | | | | | | | | | | | | | | | | | | |
| 2021 | | $ | 48.23 | | | $ | (0.26 | ) | | $ | 10.45 | | | $ | 10.19 | | | $ | (0.02 | ) | | $ | (2.28 | ) | | $ | — | | | $ | (2.30 | ) | | $ | 0.00 | | | $ | 56.12 | | | 21.10 | % | | $ | 106,107 | | | (0.50 | )% | | 1.25 | % | | 0.91 | %(c)(d) | | 49 | % |
| 2020 | | | 36.45 | | | | (0.08 | ) | | | 12.97 | | | | 12.89 | | | | (0.09 | ) | | | (1.02 | ) | | | — | | | | (1.11 | ) | | | 0.00 | | | | 48.23 | | | 35.39 | | | | 70,888 | | | (0.18 | ) | | 1.32 | | | 0.90 | (c) | | 50 | |
| 2019 | | | 30.55 | | | | 0.01 | | | | 9.49 | | | | 9.50 | | | | — | | | | (3.60 | ) | | | — | | | | (3.60 | ) | | | 0.00 | | | | 36.45 | | | 31.03 | | | | 16,566 | | | 0.03 | | | 1.38 | | | 0.99 | (c) | | 78 | |
| 2018 | | | 33.90 | | | | 0.09 | | | | (0.92 | ) | | | (0.83 | ) | | | — | | | | (2.52 | ) | | | — | | | | (2.52 | ) | | | 0.00 | | | | 30.55 | | | (2.37 | ) | | | 8,272 | | | 0.26 | | | 1.43 | | | 1.00 | (c)(e) | | 58 | |
| 2017 | | | 26.92 | | | | 0.07 | | | | 7.97 | | | | 8.04 | | | | — | | | | (1.05 | ) | | | (0.01 | ) | | | (1.06 | ) | | | 0.00 | | | | 33.90 | | | 29.84 | | | | 5,667 | | | 0.24 | | | 1.42 | | | 1.00 | (c)(e) | | 43 | |
| † | Total return represents aggregate total return of a hypothetical investment at the beginning of the year and sold at the end of the year including reinvestment of distributions and does not reflect the applicable sales charges. |
| (a) | Per share amounts have been calculated using the average shares outstanding method. |
| (b) | Amount represents less than $0.005 per share. |
| (c) | Under an expense reimbursement agreement with the Adviser, the Adviser reimbursed expenses of $1,048,506, $876,253, $412,641, and $261,050 for the years ended December 31, 2021, 2020, 2019, and 2018 and certain Class I expenses to the Fund of $19,466 for the year ended December 31, 2017. |
| (d) | The Fund incurred tax expense for the year ended December 31, 2021. If tax expense had not been incurred, the ratios of operating expenses to average net assets would have been 0.90% for each Class. |
| (e) | The Fund received credits from a designated broker who agreed to pay certain Fund operating expenses. For the years ended December 31, 2018 and 2017, there was no impact to the expense ratios. |
See accompanying notes to financial statements.
The Gabelli Global Growth Fund
Notes to Financial Statements
1. Organization. The Gabelli Global Growth Fund, a series of GAMCO Global Series Funds, Inc. (the Corporation), was incorporated on July 16, 1993 in Maryland. The Fund is a non-diversified open-end management investment company registered under the Investment Company Act of 1940, as amended (the 1940 Act), and is one of five separately managed portfolios (collectively, the Portfolios) of the Corporation. The Fund’s primary objective is capital appreciation. The Fund commenced investment operations on February 7, 1994.
2. Significant Accounting Policies. As an investment company, the Fund follows the investment company accounting and reporting guidance, which is part of U.S. generally accepted accounting principles (GAAP) that may require the use of management estimates and assumptions in the preparation of its financial statements. Actual results could differ from those estimates. The following is a summary of significant accounting policies followed by the Fund in the preparation of its financial statements.
The global outbreak of the novel coronavirus disease, known as COVID-19, has caused adverse effects on many companies, sectors, nations, regions, and the markets in general, and may continue for an unpredictable duration. The effects of this pandemic may materially impact the value and performance of the Fund, its ability to buy and sell fund investments at appropriate valuations, and its ability to achieve its investment objectives.
Security Valuation. Portfolio securities listed or traded on a nationally recognized securities exchange or traded in the U.S. over-the-counter market for which market quotations are readily available are valued at the last quoted sale price or a market’s official closing price as of the close of business on the day the securities are being valued. If there were no sales that day, the security is valued at the average of the closing bid and asked prices or, if there were no asked prices quoted on that day, then the security is valued at the closing bid price on that day. If no bid or asked prices are quoted on such day, the security is valued at the most recently available price or, if the Board of Directors (the Board) so determines, by such other method as the Board shall determine in good faith to reflect its fair market value. Portfolio securities traded on more than one national securities exchange or market are valued according to the broadest and most representative market, as determined by Gabelli Funds, LLC (the Adviser).
Portfolio securities primarily traded on a foreign market are generally valued at the preceding closing values of such securities on the relevant market, but may be fair valued pursuant to procedures established by the Board if market conditions change significantly after the close of the foreign market, but prior to the close of business on the day the securities are being valued. Debt obligations for which market quotations are readily available are valued at the average of the latest bid and asked prices. If there were no asked prices quoted on such day, the security is valued using the closing bid price. Such debt obligations are valued through prices provided by a pricing service approved by the Board. Certain securities are valued principally using dealer quotations.
Securities and assets for which market quotations are not readily available are fair valued as determined by the Board. Fair valuation methodologies and procedures may include, but are not limited to: analysis and review of available financial and non-financial information about the company; comparisons with the valuation and changes in valuation of similar securities, including a comparison of foreign securities with the equivalent U.S. dollar value American Depositary Receipt securities at the close of the U.S. exchange; and evaluation of any other information that could be indicative of the value of the security.
The Fund employs a fair value model to adjust prices to reflect events affecting the values of certain portfolio securities which occur between the close of trading on the principal market for such securities (foreign exchanges
The Gabelli Global Growth Fund
Notes to Financial Statements (Continued)
and over-the-counter markets) at the time when net asset values of the Fund are determined. If the Fund’s valuation committee believes that a particular event would materially affect net asset value, further adjustment is considered. Such securities are classified as Level 2 in the fair value hierarchy presented below.
The inputs and valuation techniques used to measure fair value of the Fund’s investments are summarized into three levels as described in the hierarchy below:
| ● | Level 1 — quoted prices in active markets for identical securities; |
| ● | Level 2 — other significant observable inputs (including quoted prices for similar securities, interest rates, prepayment speeds, credit risk, etc.); and |
| ● | Level 3 — significant unobservable inputs (including the Board’s determinations as to the fair value of investments). |
A financial instrument’s level within the fair value hierarchy is based on the lowest level of any input both individually and in the aggregate that is significant to the fair value measurement. The inputs or methodology used for valuing securities are not necessarily an indication of the risk associated with investing in those securities. The summary of the Fund’s investments in securities by inputs used to value the Fund’s investments as of December 31, 2021 is as follows:
| | | Valuation Inputs | | | | |
| | | | | | Level 2 Other | | | | |
| | | Level 1 | | | Significant | | | Total Market Value | |
| | | Quoted Prices | | | Observable Inputs | | | at 12/31/21 | |
| INVESTMENTS IN SECURITIES: | | | | | | | | | | | | |
| ASSETS (Market Value): | | | | | | | | | | | | |
| Common Stocks (a) | | $ | 238,137,982 | | | | — | | | $ | 238,137,982 | |
| U.S. Government Obligations | | | — | | | $ | 1,224,908 | | | | 1,224,908 | |
| TOTAL INVESTMENTS IN SECURITIES – ASSETS | | $ | 238,137,982 | | | $ | 1,224,908 | | | $ | 239,362,890 | |
| (a) | Please refer to the Schedule of Investments for the industry classifications of these portfolio holdings. |
The Fund held no level 3 investments at December 31, 2021 and 2020.
Additional Information to Evaluate Qualitative Information.
General. The Fund uses recognized industry pricing services — approved by the Board and unaffiliated with the Adviser — to value most of its securities, and uses broker quotes provided by market makers of securities not valued by these and other recognized pricing sources. Several different pricing feeds are received to value domestic equity securities, international equity securities, preferred equity securities, and fixed income securities. The data within these feeds are ultimately sourced from major stock exchanges and trading systems where these securities trade. The prices supplied by external sources are checked by obtaining quotations or actual transaction prices from market participants. If a price obtained from the pricing source is deemed unreliable, prices will be sought from another pricing service or from a broker/dealer that trades that security or similar securities.
Fair Valuation. Fair valued securities may be common or preferred equities, warrants, options, rights, or fixed income obligations. Where appropriate, Level 3 securities are those for which market quotations are not available, such as securities not traded for several days, or for which current bids are not available, or which are restricted as to transfer. When fair valuing a security, factors to consider include recent prices of comparable
The Gabelli Global Growth Fund
Notes to Financial Statements (Continued)
securities that are publicly traded, reliable prices of securities not publicly traded, the use of valuation models, current analyst reports, valuing the income or cash flow of the issuer, or cost if the preceding factors do not apply. A significant change in the unobservable inputs could result in a lower or higher value in Level 3 securities. The circumstances of Level 3 securities are frequently monitored to determine if fair valuation measures continue to apply.
The Adviser reports quarterly to the Board the results of the application of fair valuation policies and procedures. These may include backtesting the prices realized in subsequent trades of these fair valued securities to fair values previously recognized.
Foreign Currency Translations. The books and records of the Fund are maintained in U.S. dollars. Foreign currencies, investments, and other assets and liabilities are translated into U.S. dollars at current exchange rates. Purchases and sales of investment securities, income, and expenses are translated at the exchange rate prevailing on the respective dates of such transactions. Unrealized gains and losses that result from changes in foreign exchange rates and/or changes in market prices of securities have been included in unrealized appreciation/depreciation on investments and foreign currency translations. Net realized foreign currency gains and losses resulting from changes in exchange rates include foreign currency gains and losses between trade date and settlement date on investment securities transactions, foreign currency transactions, and the difference between the amounts of interest and dividends recorded on the books of the Fund and the amounts actually received. The portion of foreign currency gains and losses related to fluctuation in exchange rates between the initial purchase trade date and subsequent sale trade date is included in realized gain/(loss) on investments.
Foreign Securities. The Fund may directly purchase securities of foreign issuers. Investing in securities of foreign issuers involves special risks not typically associated with investing in securities of U.S. issuers. The risks include possible revaluation of currencies, the inability to repatriate funds, less complete financial information about companies, and possible future adverse political and economic developments. Moreover, securities of many foreign issuers and their markets may be less liquid and their prices more volatile than securities of comparable U.S. issuers.
Foreign Taxes. The Fund may be subject to foreign taxes on income, gains on investments, or currency repatriation, a portion of which may be recoverable. The Fund will accrue such taxes and recoveries as applicable, based upon its current interpretation of tax rules and regulations that exist in the markets in which it invests.
Securities Transactions and Investment Income. Securities transactions are accounted for on the trade date with realized gain/(loss) on investments determined by using the identified cost method. Interest income (including amortization of premium and accretion of discount) is recorded on an accrual basis. Premiums and discounts on debt securities are amortized using the effective yield to maturity method or amortized to earliest call date, if applicable. Dividend income is recorded on the ex-dividend date, except for certain dividends from foreign securities that are recorded as soon after the ex-dividend date as the Fund becomes aware of such dividends.
Determination of Net Asset Value and Calculation of Expenses. Certain administrative expenses are common to, and allocated among, various affiliated funds. Such allocations are made on the basis of each fund’s average net assets or other criteria directly affecting the expenses as determined by the Adviser pursuant to procedures established by the Board.
The Gabelli Global Growth Fund
Notes to Financial Statements (Continued)
In calculating the NAV per share of each class, investment income, realized and unrealized gains and losses, redemption fees, and expenses other than class specific expenses are allocated daily to each class of shares based upon the proportion of net assets of each class at the beginning of each day. Distribution expenses are borne solely by the class incurring the expense.
Distributions to Shareholders. Distributions to shareholders are recorded on the ex-dividend date. Distributions to shareholders are based on income and capital gains as determined in accordance with federal income tax regulations, which may differ from income and capital gains as determined under GAAP. These differences are primarily due to differing treatments of income and gains on various investment securities and foreign currency transactions held by the Fund, timing differences, and differing characterizations of distributions made by the Fund. Distributions from net investment income for federal income tax purposes include net realized gains on foreign currency transactions. These book/tax differences are either temporary or permanent in nature. To the extent these differences are permanent, adjustments are made to the appropriate capital accounts in the period when the differences arise. Permanent differences were primarily due to disallowed expenses and write-off of net operating losses. These reclassifications have no impact on the NAV of the Fund. For the year ended December 31, 2021, reclassifications were made to decrease paid-in capital by $70,323, with an offsetting adjustment to total distributable earnings.
The tax character of distributions paid during the years ended December 31, 2021 and 2020 was as follows:
| | | | Year Ended | | | | Year Ended | |
| | | | December 31, 2021 | | | | December 31, 2020 | |
| Distributions paid from: | | | | | | | | |
| Ordinary income | | $ | 83,575 | | | $ | 368,195 | |
| Net long term capital gains | | | 9,510,299 | | | | 4,088,477 | |
| Total distributions paid | | $ | 9,593,874 | | | $ | 4,456,672 | |
Provision for Income Taxes. The Fund intends to continue to qualify as a regulated investment company under Subchapter M of the Internal Revenue Code of 1986, as amended (the Code). It is the policy of the Fund to comply with the requirements of the Code applicable to regulated investment companies and to distribute substantially all of its net investment company taxable income and net capital gains. Therefore, no provision for federal income taxes is required.
At December 31, 2021, the components of accumulated earnings/losses on a tax basis were as follows:
| Undistributed long term capital gains | | $ | 188,754 | |
| Net unrealized appreciation on investments and foreign currency translations | | | 114,139,179 | |
| Total | | $ | 114,327,933 | |
At December 31, 2021, the temporary differences between book basis and tax basis net unrealized appreciation/ depreciation on investments were due to losses from wash sales for tax purposes, mark-to-market adjustments on investments considered a passive foreign investment company, and investments no longer considered a passive foreign investment company.
The Gabelli Global Growth Fund
Notes to Financial Statements (Continued)
The following summarizes the tax cost of investments and the related net unrealized appreciation at December 31, 2021:
| | | | Gross | | Gross | | |
| | | | Unrealized | | Unrealized | | Net Unrealized |
| | Cost | | Appreciation | | Depreciation | | Appreciation |
| Investments | $125,226,967 | | $115,591,310 | | $(1,455,387) | | $114,135,923 |
The Fund is required to evaluate tax positions taken or expected to be taken in the course of preparing the Fund’s tax returns to determine whether the tax positions are “more-likely-than-not” of being sustained by the applicable tax authority. Income tax and related interest and penalties would be recognized by the Fund as tax expense in the Statement of Operations if the tax positions were deemed not to meet the more-likely-than-not threshold. During the year ended December 31, 2021, the Fund incurred an excise tax expense of $24,552. As of December 31, 2021, the Adviser has reviewed all open tax years and concluded that there was no impact to the Fund’s net assets or results of operations. The Fund’s federal and state tax returns for the prior three fiscal years remain open, subject to examination. On an ongoing basis, the Adviser will monitor the Fund’s tax positions to determine if adjustments to this conclusion are necessary.
3. Investment Advisory Agreement and Other Transactions. The Fund has entered into an investment advisory agreement (the Advisory Agreement) with the Adviser which provides that the Fund will pay the Adviser a fee, computed daily and paid monthly, at the annual rate of 1.00% of the value of its average daily net assets. In accordance with the Advisory Agreement, the Adviser provides a continuous investment program for the Fund’s portfolio, oversees the administration of all aspects of the Fund’s business and affairs, and pays the compensation of all Officers and Directors of the Fund who are affiliated persons of the Adviser.
Effective December 1, 2019, the Adviser amended its contractual agreement with respect to each share class of the Fund to waive its investment advisory fees and/or to reimburse expenses to the extent necessary to maintain the annualized total operating expenses of the Fund (excluding brokerage costs, acquired fund fees and expenses, interest, taxes, and extraordinary expenses) until at least April 30, 2022, at no more than 0.90% of the value of the Fund’s average daily net assets for each share class of the Fund. During the year ended December 31, 2021, the Adviser reimbursed the Fund in the amount of $1,048,506. In addition, the Fund has agreed, during the two year period following any waiver or reimbursement by the Adviser, to repay such amount to the extent, that after giving effect to the repayment, such adjusted annualized total operating expenses of the Fund would not exceed 0.90% of the value of the Fund’s average daily net assets for each share class of the Fund. The agreement is renewable annually. At December 31, 2021, the cumulative amount which the Fund may repay the Adviser, subject to the terms above, is $1,924,759:
| For the year ended December 31, 2020, expiring December 31, 2022 | | | $ | 876,253 | |
| For the year ended December 31, 2021, expiring December 31, 2023 | | | | 1,048,506 | |
| | | | $ | 1,924,759 | |
4. Distribution Plan. The Fund’s Board has adopted a distribution plan (the Plan) for each class of shares, except for Class I Shares, pursuant to Rule 12b-1 under the 1940 Act. Under the Class AAA, Class A, and Class C Share Plans, payments are authorized to G.distributors, LLC (the Distributor), an affiliate of the Adviser, at
The Gabelli Global Growth Fund
Notes to Financial Statements (Continued)
annual rates of 0.25%, 0.25%, and 1.00%, respectively, of the average daily net assets of those classes, the annual limitations under each Plan. Such payments are accrued daily and paid monthly.
5. Portfolio Securities. Purchases and sales of securities during the year ended December 31, 2021, other than short term securities and U.S. Government obligations, aggregated $108,749,899 and $104,426,638, respectively.
6. Transactions with Affiliates and Other Arrangements. During the year ended December 31, 2021, the Distributor retained a total of $660 from investors representing commissions (sales charges and underwriting fees) on sales and redemptions of Fund shares.
The cost of calculating the Fund’s NAV per share is a Fund expense pursuant to the Advisory Agreement. Under the sub-administration agreement with Bank of New York Mellon, the fees paid include the cost of calculating the Fund’s NAV. The Fund reimburses the Adviser for this service. During the year ended December 31, 2021, the Fund accrued $45,000 in accounting fees in the Statement of Operations.
The Corporation pays retainer and per meeting fees to Directors not affiliated with the Adviser, plus specified amounts to the Lead Director and Audit Committee Chairman. Directors are also reimbursed for out of pocket expenses incurred in attending meetings. Directors who are directors or employees of the Adviser or an affiliated company receive no compensation or expense reimbursement from the Corporation.
7. Line of Credit. The Fund participates in an unsecured line of credit, which expires on March 2, 2022 and may be renewed annually, of up to $75,000,000 under which it may borrow up to 10% of its net assets from the custodian for temporary borrowing purposes. Borrowings under this arrangement bear interest at a floating rate equal to the higher of the Overnight Federal Funds Rate plus 135 basis points or the Overnight Bank Funding Rate plus 135 basis points in effect on that day. This amount, if any, would be included in “Interest expense” in the Statement of Operations. At December 31, 2021, there were no borrowings outstanding under the line of credit.
The average daily amount of borrowings outstanding under the line of credit for the twenty eight days of borrowings during the year ended December 31, 2021 was $789,464 with a weighted average interest rate of 1.36%. The maximum amount borrowed at any time during the year ended December 31, 2021 was $2,751,000.
8. Capital Stock. The Fund currently offers three classes of shares – Class AAA Shares, Class A Shares, and Class I Shares. Effective January 27, 2020, (the Effective Date) the Fund’s Class AAA, Class A and Class C Shares “closed to purchases from new investors”. “Closed to purchases from new investors” means (i) with respect to the Class AAA and Class A shares, no new investors may purchase shares of such classes, but existing shareholders may continue to purchase additional shares of such classes after the Effective Date, and (ii) with respect to Class C Shares, neither new investors nor existing shareholders may purchase any additional shares of such class after the Effective Date. These changes had no effect on existing shareholders’ ability to redeem shares of the Fund as described in the Fund’s Prospectus. Additionally, on the Effective Date Class I shares of the Fund became available to investors with a minimum initial investment amount of $1,000 when purchasing shares directly through the Distributor, or investors purchasing Class I shares through brokers or financial intermediaries that have entered into selling agreements with the Distributor specifically with respect to Class I shares.
The Gabelli Global Growth Fund
Notes to Financial Statements (Continued)
The Fund imposes a redemption fee of 2.00% on all classes of shares that are redeemed or exchanged on or before the seventh day after the date of a purchase. The redemption fee is deducted from the proceeds otherwise payable to the redeeming shareholders and is retained by the Fund as an increase in paid-in capital. The redemption fees retained by the Fund during the years ended December 31, 2021 and 2020, if any, can be found in the Statement of Changes in Net Assets under Redemption Fees.
Transactions in shares of capital stock were as follows:
| | | Year Ended | | | Year Ended | |
| | | December 31, 2021 | | | December 31, 2020 | |
| | | Shares | | | Amount | | | Shares | | | Amount | |
| Class AAA | | | | | | | | | | | | | | |
| Shares sold | | 28,040 | | | $ | 1,478,100 | | | 177,763 | | | $ | 6,767,352 | |
| Shares issued upon reinvestment of distributions | | 89,559 | | | | 4,927,528 | | | 54,963 | | | | 2,578,876 | |
| Shares redeemed | | (261,404 | ) | | | (12,932,061 | ) | | (265,814 | ) | | | (10,033,410 | ) |
| Net decrease | | (143,805 | ) | | $ | (6,526,433 | ) | | (33,088 | ) | | $ | (687,182 | ) |
| Class A | | | | | | | | | | | | | | |
| Shares sold | | 4,244 | | | $ | 225,295 | | | 6,971 | | | $ | 291,564 | |
| Shares issued upon reinvestment of distributions | | 3,711 | | | | 204,046 | | | 2,281 | | | | 106,948 | |
| Shares redeemed | | (14,017 | ) | | | (718,526 | ) | | (57,053 | ) | | | (2,268,741 | ) |
| Net decrease | | (6,062 | ) | | $ | (289,185 | ) | | (47,801 | ) | | $ | (1,870,229 | ) |
| Class C | | | | | | | | | | | | | | |
| Shares sold | | — | | | | — | | | 4,377 | | | $ | 133,352 | |
| Shares issued upon reinvestment of distributions | | 2,712 | | | $ | 120,340 | | | 1,765 | | | | 67,412 | |
| Shares redeemed | | (10,083 | ) | | | (413,851 | ) | | (33,353 | ) | | | (1,003,476 | ) |
| Net decrease | | (7,371 | ) | | $ | (293,511 | ) | | (27,211 | ) | | $ | (802,712 | ) |
| Class I | | | | | | | | | | | | | | |
| Shares sold | | 788,919 | | | $ | 40,872,080 | | | 1,091,679 | | | $ | 45,100,661 | |
| Shares issued upon reinvestment of distributions | | 73,260 | | | | 4,137,005 | | | 32,673 | | | | 1,571,925 | |
| Shares redeemed | | (441,098 | ) | | | (23,363,257 | ) | | (109,025 | ) | | | (4,692,193 | ) |
| Net increase | | 421,081 | | | $ | 21,645,828 | | | 1,015,327 | | | $ | 41,980,393 | |
9. Indemnifications. The Fund enters into contracts that contain a variety of indemnifications. The Fund’s maximum exposure under these arrangements is unknown. However, the Fund has not had prior claims or losses pursuant to these contracts. Management has reviewed the Fund’s existing contracts and expects the risk of loss to be remote.
10. Subsequent Events. Management has evaluated the impact on the Fund of all subsequent events occurring through the date the financial statements were issued and has determined that there were no subsequent events requiring recognition or disclosure in the financial statements.
The Gabelli Global Growth Fund
Report of Independent Registered Public Accounting Firm
To the Shareholders of The Gabelli Global Growth Fund
and the Board of Directors of GAMCO Global Series Funds, Inc.
Opinion on the Financial Statements
We have audited the accompanying statement of assets and liabilities of The Gabelli Global Growth Fund (the “Fund”) (one of the funds constituting GAMCO Global Series Funds, Inc. (the “Corporation”)), including the schedule of investments, as of December 31, 2021, and the related statement of operations for the year then ended, the statements of changes in net assets for each of the two years in the period then ended, the financial highlights for each of the five years in the period then ended and the related notes (collectively referred to as the “financial statements”). In our opinion, the financial statements present fairly, in all material respects, the financial position of the Fund (one of the funds constituting GAMCO Global Series Funds, Inc.) at December 31, 2021, the results of its operations for the year then ended, the changes in its net assets for each of the two years in the period then ended and its financial highlights for each of the five years in the period then ended, in conformity with U.S. generally accepted accounting principles.
Basis for Opinion
These financial statements are the responsibility of the Corporation’s management. Our responsibility is to express an opinion on the Fund’s financial statements based on our audits. We are a public accounting firm registered with the Public Company Accounting Oversight Board (United States) (“PCAOB”) and are required to be independent with respect to the Corporation in accordance with the U.S. federal securities laws and the applicable rules and regulations of the Securities and Exchange Commission and the PCAOB.
We conducted our audits in accordance with the standards of the PCAOB. Those standards require that we plan and perform the audit to obtain reasonable assurance about whether the financial statements are free of material misstatement, whether due to error or fraud. The Corporation is not required to have, nor were we engaged to perform, an audit of the Corporation’s internal control over financial reporting. As part of our audits we are required to obtain an understanding of internal control over financial reporting but not for the purpose of expressing an opinion on the effectiveness of the Corporation’s internal control over financial reporting. Accordingly, we express no such opinion.
Our audits included performing procedures to assess the risks of material misstatement of the financial statements, whether due to error or fraud, and performing procedures that respond to those risks. Such procedures included examining, on a test basis, evidence regarding the amounts and disclosures in the financial statements. Our procedures included confirmation of securities owned as of December 31, 2021, by correspondence with the custodian and brokers or by other appropriate auditing procedures where replies from brokers were not received. Our audits also included evaluating the accounting principles used and significant estimates made by management, as well as evaluating the overall presentation of the financial statements. We believe that our audits provide a reasonable basis for our opinion.

We have served as the auditor of one or more Gabelli/GAMCO Funds investment companies since 1992.
Philadelphia, Pennsylvania
February 28, 2022
The Gabelli Global Growth Fund
Liquidity Risk Management Program (Unaudited)
In accordance with Rule 22e-4 under the 1940 Act, the Fund has established a liquidity risk management program (the LRM Program) to govern its approach to managing liquidity risk. The LRM Program is administered by the Liquidity Committee (the Committee), which is comprised of members of Gabelli Funds, LLC management. The Board has designated the Committee to administer the LRM Program.
The LRM Program’s principal objectives include supporting the Fund’s compliance with limits on investments in illiquid assets and mitigating the risk that the Fund will be unable to meet its redemption obligations in a timely manner. The LRM Program also includes elements that support the management and assessment of liquidity risk, including an annual assessment of factors that influence the Fund’s liquidity and the monthly classification and re-classification of certain investments that reflect the Committee’s assessment of their relative liquidity under current market conditions.
At a meeting of the Board held on May 12, 2021, the Board received a written report from the Committee regarding the design and operational effectiveness of the LRM Program. The Committee determined, and reported to the Board, that the LRM Program is reasonably designed to assess and manage the Fund’s liquidity risk and has operated adequately and effectively since its implementation. The Committee reported that there were no liquidity events that impacted the Fund or its ability to timely meet redemptions without dilution to existing shareholders. The Committee noted that the Fund is primarily invested in highly liquid securities and, accordingly, continues to be exempt from the requirement to determine a “highly liquid investment minimum” as defined in the Rule 22e-4. Because of that continued qualification for the exemption, the Fund has not adopted a “highly liquid investment minimum” amount. The Committee further noted that while changes to the LRM Program were made during the Review Period and reported to the Board, no material changes were made to the LRM Program as a result of the Committee’s annual review.
There can be no assurance that the LRM Program will achieve its objectives in the future. Please refer to the Fund’s Prospectus for more information regarding its exposure to liquidity risk and other principal risks to which an investment in the Fund may be subject.
The Gabelli Global Growth Fund
Board Consideration and Re-Approval of Investment Advisory Agreement (Unaudited)
At its meeting on November 11, 2021, the Board of Directors of the Corporation approved the continuation of the investment advisory agreement with the Adviser for the Fund on the basis of the recommendation by the directors (the Independent Board Members) who are not interested persons of the Fund. The following paragraphs summarize the material information and factors considered by the Independent Board Members as well as their conclusions relative to such factors.
Nature, Extent, and Quality of Services. The Independent Board Members considered information regarding the Fund’s portfolio managers, the depth of the analyst pool available to the Adviser and the portfolio managers, the scope of supervisory, administrative, shareholder, and other services supervised or provided by the Adviser and the absence of significant service problems reported to the Board. The Independent Board Members noted the experience, length of service, and reputation of the Fund’s portfolio managers.
Investment Performance. The Independent Board Members reviewed the short, medium, and long term performance of the Fund (as of September 30, 2021) against a peer group of six other comparable funds prepared by the Adviser (the “Adviser Peer Group”), and against a peer group prepared by Broadridge (the “Broadridge Performance Peer Group”) consisting of all global large cap growth funds, regardless of asset size or primary channel of distribution, as represented by the Lipper Global Large-Cap Growth Index. The Independent Board Members noted that the Fund’s performance was in the second quartile for the one and three year periods, and the first (highest) quartile for the five and ten year periods, as measured against the Adviser Peer Group. Against the Broadridge Performance Peer Group, the Independent Board Members noted that the Fund’s performance was in the fourth quintile for the one year period, the second quintile for the three year period, and the first quintile for the five and ten year periods.
Profitability. The Independent Board Members reviewed summary data regarding the profitability of the Fund to the Adviser both with a pro rata administrative overhead charge and with a standalone administrative charge and noted the effect of the expense limitation agreement. The Independent Board Members also noted that a portion of the Fund’s portfolio transactions were executed by an affiliated broker of the Adviser and that another affiliated broker of the Adviser received distribution fees and minor amounts of sales commissions.
Economies of Scale. The Independent Board Members discussed the major elements of the Adviser’s cost structure and the relationship of those elements to potential economies of scale and reviewed data provided by the Adviser.
Sharing of Economies of Scale. The Independent Board Members noted that the investment management fee schedule for the Fund does not take into account any potential economies of scale that may develop.
Service and Cost Comparisons. The Independent Board Members compared the expense ratios of the investment management fee, other expenses, and total expenses of the Fund with similar expense ratios of the Adviser Peer Group and a peer group of nine other global large cap growth funds selected by Broadridge, and noted that the Adviser’s management fee includes substantially all administrative services of the Fund as well as investment advisory services. The Independent Board Members noted the effect of the expense limitation agreement in place for the Fund. The Independent Board Members noted that the Fund’s total expense ratio was the third lowest for the Broadridge peer group and the lowest for the Adviser Peer Group, but that the Fund’s size was below average within each peer group. The Independent Board Members also noted that the advisory fee structure was the same as that in effect for most of the Gabelli funds. The Independent Board Members were
The Gabelli Global Growth Fund
Board Consideration and Re-Approval of Investment Advisory Agreement (Unaudited) (Continued)
presented with, but did not consider to be material to their decision, various information comparing the advisory fee with the fee for other types of accounts managed by the Adviser.
Conclusions. The Independent Board Members concluded that the Fund enjoyed highly experienced portfolio management services and good ancillary services and an acceptable performance record. The Independent Board Members also concluded that the Fund’s expense ratios and the profitability to the Adviser of managing the Fund were reasonable, and that economies of scale were not a significant factor in their thinking at this time. In this regard, the Independent Board Members noted the contractual Expense Deferral Agreement between the Adviser and the Corporation, on behalf of each Fund, pursuant to which the net expense ratio for each share class of each Fund was reduced to 0.90%. The Independent Board Members did not view the potential profitability of ancillary services as material to their decision. On the basis of the foregoing and without assigning particular weight to any single conclusion, the Independent Board Members determined to recommend continuation of the investment management agreement to the full Board.
Based on a consideration of all these factors in their totality, the Board Members, including all of the Independent Board Members, determined that the Fund’s advisory fee was appropriate in light of the quality of services provided and in light of the other factors described above that the Board deemed relevant. Accordingly, the Board Members determined to approve the continuation of the Fund’s Advisory Agreement. The Board Members based their decision on evaluations of all these factors as a whole and did not consider any one factor as all important or controlling.
The Gabelli Global Growth Fund
Additional Fund Information (Unaudited)
The business and affairs of the Fund are managed under the direction of the Corporation’s Board of Directors. Information pertaining to the Directors and Officers of the Fund is set forth below. The Corporation’s Statement of Additional Information includes additional information about the Fund’s Directors and is available without charge, upon request, by calling 800-GABELLI (800-422-3554) or by writing to The Gabelli Global Growth Fund at One Corporate Center, Rye, NY 10580-1422.
Name, Position(s)
Address1
and Age | | Term of Office
and
Length of
Time Served2 | | Number of
Funds
in Fund
Complex
Overseen
by Director | | Principal Occupation(s)
During Past Five Years | | Other Directorships
Held by Director3 |
| INTERESTED DIRECTORS4: | | | | | | |
| | | | | | | | | |
Mario J. Gabelli, CFA Director and Chief Investment Officer Age: 79 | | Since 1993 | | 31 | | Chairman, Chief Executive Officer, and Chief Investment Officer– Value Portfolios of GAMCO Investors, Inc. and Chief Investment Officer – Value Portfolios of Gabelli Funds, LLC and GAMCO Asset Management, Inc.; Director/Trustee or Chief Investment Officer of other registered investment companies within the Fund Complex; Chief Executive Officer of GGCP, Inc.; Executive Chairman of Associated Capital Group, Inc. | | Director of Morgan Group Holdings, Inc. (holding company); Chairman of the Board and Chief Executive Officer of LICT Corp. (multimedia and communication services company); Director of CIBL, Inc. (broadcasting and wireless communications); Director of ICTC Group Inc. (communications) (2013-2018) |
| | | | | | | | | |
John D. Gabelli Director Age: 77 | | Since 1993 | | 12 | | Former Senior Vice President of G. research, LLC | | — |
| | | | | | | | | |
| INDEPENDENT DIRECTORS5: | | | | | | |
E. Val Cerutti Director Age: 82 | | Since 2001 | | 7 | | Chief Executive Officer of Cerutti Consultants, Inc. | | Director of The LGL Group, Inc. (diversified manufacturing) (1990-2009) |
| | | | | | | | | |
Anthony J. Colavita6 Director Age: 86 | | Since 1993 | | 18 | | President of the law firm of Anthony J. Colavita, P.C. | | — |
| | | | | | | | | |
Werner J. Roeder Director Age: 81 | | Since 1993 | | 20 | | Retired physician; Former Vice President of Medical Affairs (Medical Director) of New York Presbyterian/Lawrence Hospital (1999-2014) | | — |
| | | | | | | | | |
Anthonie C. van Ekris6 Director Age: 87 | | Since 1993 | | 23 | | Chairman and Chief Executive Officer of BALMAC International, Inc. (global import/export company) | | — |
| | | | | | | | | |
The Gabelli Global Growth Fund
Additional Fund Information (Continued) (Unaudited)
Name, Position(s)
Address1
and Age | | Term of Office
and
Length of
Time Served2 | | Number of
Funds
in Fund
Complex
Overseen
by Director | | Principal Occupation(s)
During Past Five Years | | Other Directorships
Held by Director3 |
Salvatore J. Zizza7
Director
Age: 76 | | Since 2004 | | 32 | | President of Zizza & Associates Corp. (private holding company); Chairman of Bergen Cove Realty Inc. (residential real estate) | | Director and Chairman of Trans-Lux Corporation (business services); Director and Chairman of Harbor Diversified Inc. (pharmaceuticals) (2009-2018); Retired Chairman of BAM (semiconductor and aerospace manufacturing) |
The Gabelli Global Growth Fund
Additional Fund Information (Continued) (Unaudited)
Name, Position(s)
Address1
and Age | | Term of Office
and Length of
Time Served2 | | Principal Occupation(s)
During Past Five Years |
| OFFICERS: | | | | |
Bruce N. Alpert President Age: 70 | | Since 1993 | | Executive Vice President and Chief Operating Officer of Gabelli Funds, LLC since 1988; Officer of registered investment companies within the Fund Complex; Senior Vice President of GAMCO Investors, Inc. since 2008; Vice President — Mutual Funds, G.research, LLC |
| | | | | |
John C. Ball Treasurer Age: 45 | | Since 2017 | | Treasurer of registered investment companies within the Fund Complex since 2017; Vice President and Assistant Treasurer of AMG Funds (2014-2017); Chief Executive Officer, G.distributors, LLC since December 2020 |
| | | | | |
Peter Goldstein Secretary and Vice President Age: 68 | | Since 2020 | | General Counsel, Gabelli Funds, LLC since July 2020; General Counsel and Chief Compliance Officer, Buckingham Capital Management, Inc. (2012-2020); Chief Legal Officer and Chief Compliance Officer, The Buckingham Research Group, Inc. (2012-2020) |
| | | | | |
Richard J. Walz Chief Compliance Officer Age: 62 | | Since 2013 | | Chief Compliance Officer of registered investment companies within the Fund Complex since 2013; Chief Compliance Officer for Gabelli Funds, LLC since 2015 |
| | | | | |
Daniel Plourde Vice President Age: 41 | | Since 2021 | | Vice President of registered investment companies within the Fund Complex since 2021; Assistant Treasurer of the North American SPDR ETFs and State Street Global Advisors Mutual Funds (2017-2021); Fund Administration at State Street Bank (2009-2017) |
| 1 | Address: One Corporate Center, Rye, NY 10580-1422, unless otherwise noted. |
| 2 | Each Director will hold office for an indefinite term until the earliest of (i) the next meeting of shareholders, if any, called for the purpose of considering the election or re-election of such Director and until the election and qualification of his or her successor, if any, elected at such meeting, or (ii) the date a Director resigns or retires, or a Director is removed by the Board of Directors or shareholders, in accordance with the Fund’s By-Laws and Articles of Incorporation. For officers, includes time served in prior officer positions with the Fund. Each officer will hold office for an indefinite term until the date he or she resigns or retires or until his or her successor is elected and qualified. |
| 3 | This column includes only directorships of companies required to report to the SEC under the Securities Exchange Act of 1934, as amended, i.e., public companies, or other investment companies registered under the 1940 Act. |
| 4 | “Interested person” of the Corporation as defined in the 1940 Act. Messrs. Mario J. Gabelli and John D. Gabelli, who are brothers, are each considered an “interested person” because of their affiliation with Gabelli Funds, LLC which acts as the Corporation’s investment adviser. |
| 5 | Directors who are not interested persons are considered “Independent” Directors. |
| 6 | Mr. Colavita’s son, Anthony S. Colavita, serves as a director of other funds in the Gabelli Fund Complex. Mr. van Ekris is an independent director of Gabelli International Ltd., Gabelli Fund LDC, GAMA Capital Opportunities Master Ltd., and GAMCO International SICAV, which may be deemed to be controlled by Mario J. Gabelli and/or affiliates and, in that event, would be deemed to be under common control with the Fund’s Adviser. |
| 7 | Mr. Zizza is an independent director of Gabelli International Ltd., which may be deemed to be controlled by Mario J. Gabelli and/or affiliates and in that event would be deemed to be under common control with the Fund’s Adviser. On September 9, 2015, Mr. Zizza entered into a settlement with the SEC to resolve an inquiry relating to an alleged violation regarding the making of false statements or omissions to the accountants of a company concerning a related party transaction. The company in question is not an affiliate of, nor has any connection to, the Fund. Under the terms of the settlement, Mr. Zizza, without admitting or denying the SEC’s findings and allegation, paid $150,000 and agreed to cease and desist committing or causing any future violations of Rule 13b2-2 of the Securities Exchange Act of 1934, as amended. The Board has discussed this matter and has determined that it does not disqualify Mr. Zizza from serving as an Independent Director. |
Gabelli Funds and Your Personal Privacy
Who are we?
The Gabelli Funds are investment companies registered with the Securities and Exchange Commission under the Investment Company Act of 1940. We are managed by Gabelli Funds, LLC, which is affiliated with GAMCO Investors, Inc., a publicly held company with subsidiaries and affiliates that provide investment advisory services for a variety of clients.
What kind of non-public information do we collect about you if you become a fund shareholder?
If you apply to open an account directly with us, you will be giving us some non-public information about yourself. The non-public information we collect about you is:
| ● | Information you give us on your application form. This could include your name, address, telephone number, social security number, bank account number, and other information. |
| ● | Information about your transactions with us, any transactions with our affiliates, and transactions with the entities we hire to provide services to you. This would include information about the shares that you buy or redeem. If we hire someone else to provide services — like a transfer agent — we will also have information about the transactions that you conduct through them. |
What information do we disclose and to whom do we disclose it?
We do not disclose any non-public personal information about our customers or former customers to anyone other than our affiliates, our service providers who need to know such information, and as otherwise permitted by law. If you want to find out what the law permits, you can read the privacy rules adopted by the Securities and Exchange Commission. They are in volume 17 of the Code of Federal Regulations, Part 248. The Commission often posts information about its regulations on its website, www. sec.gov.
What do we do to protect your personal information?
We restrict access to non-public personal information about you to the people who need to know that information in order to provide services to you or the fund and to ensure that we are complying with the laws governing the securities business. We maintain physical, electronic, and procedural safeguards to keep your personal information.
The Gabelli Global Growth Fund
2021 TAX NOTICE TO SHAREHOLDERS (Unaudited)
During the year ended December 31, 2021, the Fund paid ordinary income distributions of $0.0201 to each Class of shares and long term capital gains totaling $9,510,299. The distribution of long term capital gains has been designated as a capital gain dividend by the Fund’s Board of Directors. For the year ended December 31, 2021, 100% of the ordinary income distribution qualifies for the dividends received deduction available to corporations. The Fund designates 100% of the ordinary income distribution as qualified dividend income pursuant to the Jobs and Growth Tax Relief Reconciliation Act of 2003. The Fund designates 0.18% of the ordinary income distribution as qualified interest income pursuant to the Tax Relief, Unemployment Reauthorization, and Job Creation Act of 2010. Also for the year of 2021, the Fund did not have foreign tax credits.
All designations are based on financial information available as of the date of this annual report and, accordingly, are subject to change. For each item, it is the intention of the Fund to designate the maximum amount permitted under the Internal Revenue Code and the regulations thereunder.
THE GABELLI GLOBAL GROWTH FUND
One Corporate Center
Rye, NY 10580-1422
Portfolio Management Team Biographies
Caesar M. P. Bryan joined GAMCO Asset Management in 1994. He is a member of the global investment team of Gabelli Funds, LLC and portfolio manager of several funds within the Fund Complex. Prior to joining Gabelli, Mr. Bryan was a portfolio manager at Lexington Management. He began his investment career at Samuel Montagu Company, the London based merchant bank. Mr. Bryan graduated from the University of Southampton in England with a Bachelor of Law and is a member of the English Bar.
Howard F. Ward, CFA, joined Gabelli Funds in 1995 and currently serves as GAMCO’s Chief Investment Officer of Growth Equities as well as a Gabelli Funds, LLC portfolio manager for several funds within the Fund Complex. Prior to joining Gabelli, Mr. Ward served as Managing Director and Lead Portfolio Manager for several Scudder mutual funds. He also was an Investment Officer in the Institutional Investment Department with Brown Brothers, Harriman & Co. Mr. Ward received his BA in Economics from Northwestern University.
Christopher D. Ward, CFA, joined the GAMCO Growth Team in 2015 as Vice President and Research Analyst. Prior to joining Gabelli Funds, Mr. Ward spent five years at Morgan Stanley Private Wealth Management where he served as Director of Business Strategy for The Apollo Group. Before joining Morgan Stanley, he was with the GFI Group, Inc., a wholesale institutional brokerage firm. He graduated from Boston College with a BA in Economics.
| We have separated the portfolio managers’ commentary from the financial statements and investment portfolio due to corporate governance regulations stipulated by the Sarbanes-Oxley Act of 2002. We have done this to ensure that the contents of the portfolio managers’ commentary are unrestricted. Both the commentary and the financial statements, including the portfolios of investments, will be available on our website at www.gabelli.com. |
This page was intentionally left blank.
This page was intentionally left blank.
The Gabelli Global Rising Income and Dividend Fund
Annual Report — December 31, 2021
To Our Shareholders,
For the year ended December 31, 2021, the net asset value (NAV) total return per Class AAA Share of The Gabelli Global Rising Income and Dividend Fund was 21.3% compared with a total return of 22.4% for the Morgan Stanley Capital International (MSCI) World Index. Other classes of shares are available. See page 3 for performance information for all classes.
Enclosed are the financial statements, including the schedule of investments, as of December 31, 2021.
Investment Objective and Strategy (Unaudited)
The Fund’s investment objective is to seek to provide investors with a high level of total return through a combination of current income and appreciation of capital.
The Fund’s investment strategy is to invest 80% of its net assets in dividend paying securities (such as common and preferred stock) or other income producing securities (such as fixed income securities and securities that are convertible into common stock). The Fund will primarily invest in common stocks of foreign and domestic issuers that the Fund’s portfolio manager believes are likely to pay dividends and income and have the potential for above average capital appreciation and dividend increases.
Performance Discussion (Unaudited)
During the first quarter of 2021, there were a number of strong performers in (y)our portfolio. One of the strong performers was Ashtead Group plc, an equipment rental company, which owns Sunbelt in the USA. Another top performer was Herc Holdings, another equipment rental supplier. Both companies have fleets that includes areal, earth moving, material handling, trucks and trailers, air compressors, and lighting. Both Ashtead and Herc have benefited from an economy that is gradually reopening, and also from the prospects of a large infrastructure spending bill from the Biden administration. There were, of course, stocks in (y)our portfolio that did not perform well in the quarter. One of them was Viatris, a specialty pharmaceutical company that needed to take a global restructuring charge in the quarter.
| As permitted by regulations adopted by the Securities and Exchange Commission, paper copies of the Fund’s annual and semiannual shareholder reports will no longer be sent by mail, unless you specifically request paper copies of the reports. Instead, the reports will be made available on the Fund’s website (www.gabelli.com), and you will be notified by mail each time a report is posted and provided with a website link to access the report. If you already elected to receive shareholder reports electronically, you will not be affected by this change and you need not take any action. To elect to receive all future reports on paper free of charge, please contact your financial intermediary, or, if you invest directly with the Fund, you may call 800-422-3554 or send an email request to info@gabelli.com. |
During the second quarter, performance for (y)our portfolio was up high single digits and there were many stocks that performed well, such as Hunter Douglas, which is a home furnishing company, primarily in the window covering business. As people all across the globe sheltered at home during the COVID-19 crisis, many consumers invested in their homes and placed orders for high quality home furnishings, such as Hunter Douglas. One of the various stocks that underperformed during the quarter was Sony, the large Japanese conglomerate that is in electronics and entertainment, among other businesses. Volkswagen, the German automotive company was a lagging stock, partly due to concerns its truck subsidiary was buying the American truck company Navistar.
Although the Fund was down slightly in the third quarter, there were a number of stocks that performed well. One such stock was Herc, the equipment rental company. As the US economy reopens, rates for rental equipment at construction sites have risen significantly and Herc has been a major beneficiary of this trend. Another stock that performed well was Sony, the Japanese conglomerate with operations in electronics and entertainment, among other businesses. Yet another Japanese based company was a strong performer in the quarter, Kikkoman Corporation, which is a major food products company, especially of soy sauce. Other positive contributors were Ulta Electrics plc, and Vivendi, a French media company.
The Fund was up nicely in the fourth quarter, and there were a number of stocks that performed well in (y)our portfolio. One such stock was Hunter Douglas, the company engages in home furnishings. They make window coverings, such as blinds, and architectural products. With more people on a global basis working from home, we expect years of good business for Hunter Douglas as homeowners invest in upgrading their homes, especially for a home office. Remy Cointreau, the French spirits company, was another strong performer in the quarter. One of the various stocks that underperformed during the quarter was Swedish Match, the smokeless tobacco company. Cellular phone companies were under pressure in the quarter, such as Millicom International Cellular, and T-Mobile.
Selected holdings that contributed positively to performance in 2021 were: Hunter Douglas NV (2.8% of net assets as of December 31, 2021) is a home furnishing company, primarily in the window covering business; Herc Holdings Inc. (2.1%) through its subsidiaries, operates as an equipment rental supplier primarily in the United States and internationally; and Uni-Select Inc. (0.9%), distributes automotive refinish, and industrial coatings and related products in North America.
Some of our weaker performing securities were: Tencent Music Entertainment ADR (0.2%) is a Chinese online music entertainment platform with music applications; Millicom International Cellular SA (0.4%) provides cable and mobile services in Latin America and Africa. The company offers mobile services, including mobile data and voice, short message service, and mobile financial services; and Chr. Hansen Holding A/S (0.9%) is a bioscience company, that develops natural ingredient solutions for the food, nutritional, pharmaceutical, and agricultural industries in Europe, the Middle East, Africa, North America, Latin America, and Asia/Pacific.
Thank you for your investment in the Gabelli Global Rising Income and Dividend Fund.
We appreciate your confidence and trust.
Comparative Results
Average Annual Returns through December 31, 2021 (a) (Unaudited)
Total returns and average annual returns reflect changes in share price, reinvestment of distributions, and are net of expenses.
| | | 1 Year | | 5 Year | | 10 Year | | 15 Year | | Since
Inception
(2/3/94) |
| Class AAA (GAGCX) | | 21.32 | % | | 10.01 | % | | 7.59 | % | | 4.32 | % | | 5.35 | % |
| MSCI World Index (b) | | 22.35 | | | 15.64 | | | 13.32 | | | 8.03 | | | 8.39 | |
| Class A (GAGAX) | | 21.31 | | | 10.01 | | | 7.55 | | | 4.32 | | | 5.37 | |
| With sales charge (c) | | 14.33 | | | 8.71 | | | 6.91 | | | 3.91 | | | 5.14 | |
| Class C (GACCX) | | 21.32 | | | 9.52 | | | 6.58 | | | 3.39 | | | 4.72 | |
| With contingent deferred sales charge (d) | | 20.32 | | | 9.52 | | | 6.58 | | | 3.39 | | | 4.72 | |
| Class I (GAGIX) | | 21.34 | | | 10.44 | | | 7.91 | | | 4.61 | | | 5.51 | |
| (a) | Returns would have been lower had the Adviser not reimbursed certain expenses of the Fund. The Class AAA Share NAVs are used to calculate performance for the periods prior to the issuance of Class A Shares, Class C Shares, and Class I Shares on May 2, 2001, November 26, 2001, and January 11, 2008, respectively. The actual performance of the Class A Shares and Class C Shares would have been lower due to the additional fees and expenses associated with these classes of shares. The actual performance of the Class I Shares would have been higher due to lower expenses related to this class of shares. The Fund imposes a 2% redemption fee on shares sold or exchanged within seven days of purchase. |
| (b) | The MSCI World Index is a free float-adjusted market capitalization weighted index that is designed to measure the equity market performance of developed market. Dividends are considered reinvested. You cannot invest directly in an index. MSCI World Index since inception performance is as of January 31, 1994. |
| (c) | Performance results include the effect of the maximum 5.75% sales charge at the beginning of the period. |
| (d) | Assuming payment of the 1% maximum contingent deferred sales charge imposed on redemptions made within one year of purchase. No existing C Class shares are currently subject to the CDSC as of the date of this report. |
In the current prospectuses dated April 30, 2021, the gross expense ratios for Class AAA, A, C, and I Shares are 1.72%, 1.72%, 2.47%, and 1.47%, respectively, and the net expense ratios for all share classes after contractual reimbursements by Gabelli Funds, LLC, (the Adviser) is 0.90%. See page 12 for the expense ratios for the year ended December 31, 2021. The contractual reimbursements are in effect through April 30, 2022. Class AAA and Class I Shares do not have a sales charge. The maximum sales charge for Class A Shares and Class C Shares is 5.75% and 1.00%, respectively.
Investing in foreign securities involves risks not ordinarily associated with investments in domestic issues, including currency fluctuation, economic, and political risks. Investors should carefully consider the investment objectives, risks, charges, and expenses of the Fund before investing. The prospectus contains information about these and other matters and should be read carefully before investing. To obtain a prospectus, please visit our website at www.gabelli.com.
Returns represent past performance and do not guarantee future results. Investment returns and the principal value of an investment will fluctuate. When shares are redeemed, they may be worth more or less than their original cost. Current performance may be lower or higher than the performance data presented. Visit www.gabelli.com for performance information as of the most recent month end.
COMPARISON OF CHANGE IN VALUE OF A $10,000 INVESTMENT IN
THE GABELLI GLOBAL RISING INCOME AND DIVIDEND FUND (CLASS AAA SHARES)
AND MSCI WORLD INDEX (Unaudited)
| Average Annual Total Returns* |
| | 1 Year | 5 Year | 10 Year |
| Class AAA | 21.32% | 10.01% | 7.59% |
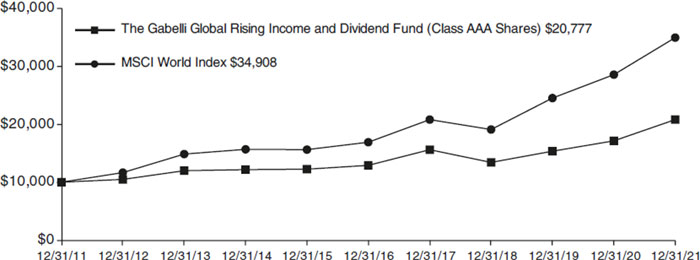
* Past performance is not predictive of future results. The performance tables and graph do not reflect the deduction of taxes that a shareholder would pay on Fund distributions or the redemption of Fund shares.
The Gabelli Global Rising Income and Dividend Fund
Disclosure of Fund Expenses (Unaudited)
| For the Six Month Period from July 1, 2021 through December 31, 2021 | Expense Table |
We believe it is important for you to understand the impact of fees and expenses regarding your investment. All mutual funds have operating expenses. As a shareholder of a fund, you incur ongoing costs, which include costs for portfolio management, administrative services, and shareholder reports (like this one), among others. Operating expenses, which are deducted from a fund’s gross income, directly reduce the investment return of a fund. When a fund’s expenses are expressed as a percentage of its average net assets, this figure is known as the expense ratio. The following examples are intended to help you understand the ongoing costs (in dollars) of investing in your Fund and to compare these costs with those of other mutual funds. The examples are based on an investment of $1,000 made at the beginning of the period shown and held for the entire period.
The Expense Table below illustrates your Fund’s costs in two ways:
Actual Fund Return: This section provides information about actual account values and actual expenses. You may use this section to help you to estimate the actual expenses that you paid over the period after any fee waivers and expense reimbursements. The “Ending Account Value” shown is derived from the Fund’s actual return during the past six months, and the “Expenses Paid During Period” shows the dollar amount that would have been paid by an investor who started with $1,000 in the Fund. You may use this information, together with the amount you invested, to estimate the expenses that you paid over the period.
To do so, simply divide your account value by $1,000 (for example, an $8,600 account value divided by $1,000 = 8.6), then multiply the result by the number given for your Fund under the heading “Expenses Paid During Period” to estimate the expenses you paid during this period.
Hypothetical 5% Return: This section provides information about hypothetical account values and hypothetical expenses based on the Fund’s actual expense ratio. It assumes a hypothetical annualized return of 5% before expenses during the period shown. In this case – because the hypothetical return used is not the Fund’s actual return – the results do not apply to your investment and you cannot use the hypothetical account value and expense to estimate the actual ending account balance or expenses you
paid for the period. This example is useful in making comparisons of the ongoing costs of investing in the Fund and other funds. To do so, compare this 5% hypothetical example with the 5% hypothetical examples that appear in shareholder reports of other funds.
Please note that the expenses shown in the table are meant to highlight your ongoing costs only and do not reflect any transactional costs such as sales charges (loads), redemption fees, or exchange fees, if any, which are described in the Prospectus. If these costs were applied to your account, your costs would be higher. Therefore, the 5% hypothetical return is useful in comparing ongoing costs only, and will not help you determine the relative total costs of owning different funds. The “Annualized Expense Ratio” represents the actual expenses for the last six months and may be different from the expense ratio in the Financial Highlights which is for the year ended December 31, 2021.
| | Beginning
Account Value
07/01/21 | | Ending
Account Value
12/31/21 | | Annualized
Expense
Ratio | | Expenses
Paid During
Period * |
| The Gabelli Global Rising Income and Dividend Fund | | |
| Actual Fund Return | | | | | | | | |
| Class AAA | | $1,000.00 | | $1,055.40 | | 0.90% | | $ | 4.66 | |
| Class A | | $1,000.00 | | $1,055.30 | | 0.90% | | $ | 4.66 | |
| Class C | | $1,000.00 | | $1,055.10 | | 0.90% | | $ | 4.66 | |
| Class I | | $1,000.00 | | $1,055.50 | | 0.90% | | $ | 4.66 | |
| Hypothetical 5% Return | | | | | | | | |
| Class AAA | | $1,000.00 | | $1,020.67 | | 0.90% | | $ | 4.58 | |
| Class A | | $1,000.00 | | $1,020.67 | | 0.90% | | $ | 4.58 | |
| Class C | | $1,000.00 | | $1,020.67 | | 0.90% | | $ | 4.58 | |
| Class I | | $1,000.00 | | $1,020.67 | | 0.90% | | $ | 4.58 | |
| * | Expenses are equal to the Fund’s annualized expense ratio for the last six months multiplied by the average account value over the period, multiplied by the number of days in the most recent fiscal half year (184 days), then divided by 365. |
Summary of Portfolio Holdings (Unaudited)
The following table present portfolio holdings as a percent of net assets as of December 31, 2021:
The Gabelli Global Rising Income and Dividend Fund
| Food and Beverage | | | 17.4 | % | | Building and Construction | | | 1.8 | % |
| Financial Services | | | 9.4 | % | | Equipment and Supplies | | | 1.5 | % |
| U.S. Government Obligations | | | 9.4 | % | | Energy and Energy Services | | | 1.3 | % |
| Electronics | | | 9.3 | % | | Business Services | | | 1.2 | % |
| Consumer Products | | | 8.0 | % | | Aerospace and Defense | | | 1.2 | % |
| Diversified Industrial | | | 6.3 | % | | Hotels and Gaming | | | 1.1 | % |
| Machinery | | | 4.3 | % | | Specialty Chemicals | | | 1.0 | % |
| Energy and Utilities | | | 3.8 | % | | Automotive | | | 0.9 | % |
| Telecommunications | | | 3.5 | % | | Retail | | | 0.8 | % |
| Consumer Services | | | 3.5 | % | | Broadcasting | | | 0.8 | % |
| Health Care | | | 3.3 | % | | Computer Software and Services | | | 0.8 | % |
| Wireless Telecommunications | | | 2.2 | % | | Publishing | | | 0.7 | % |
| Entertainment | | | 2.2 | % | | Other Assets and Liabilities (Net) | | | 0.1 | % |
| Automotive: Parts and Accessories | | | 2.1 | % | | | | | 100.0 | % |
| Cable and Satellite | | | 2.1 | % | | | | | | |
The Fund files a complete schedule of portfolio holdings with the Securities and Exchange Commission (the SEC) for the first and third quarters of each fiscal year on Form N-PORT. Shareholders may obtain this information at www.gabelli.com or by calling the Fund at 800-GABELLI (800-422-3554). The Fund’s Form N-PORT is available on the SEC’s website at www.sec.gov and may also be reviewed and copied at the SEC’s Public Reference Room in Washington, DC. Information on the operation of the Public Reference Room may be obtained by calling 800-SEC-0330.
Proxy Voting
The Fund files Form N-PX with its complete proxy voting record for the twelve months ended June 30, no later than August 31 of each year. A description of the Fund’s proxy voting policies, procedures, and how each Fund voted proxies relating to portfolio securities is available without charge, upon request, by (i) calling 800-GABELLI (800-422-3554); (ii) writing to The Gabelli Funds at One Corporate Center, Rye, NY 10580-1422; or (iii) visiting the SEC’s website at www.sec.gov.
The Gabelli Global Rising Income and Dividend Fund
Schedule of Investments — December 31, 2021
| Shares | | | | | Cost | | | Market
Value | |
| | | | | COMMON STOCKS — 90.5% |
| | | | | Aerospace and Defense — 1.2% |
| | 5,000 | | | Aerojet Rocketdyne Holdings Inc. | | $ | 49,073 | | | $ | 233,800 | |
| | 1,600 | | | L3Harris Technologies Inc. | | | 126,334 | | | | 341,184 | |
| | 6,000 | | | Ultra Electronics Holdings plc | | | 125,299 | | | | 258,257 | |
| | | | | | | | 300,706 | | | | 833,241 | |
| | | | | Automotive — 0.9% |
| | 12,000 | | | Traton SE | | | 353,518 | | | | 302,477 | |
| | 1,000 | | | Volkswagen AG | | | 167,644 | | | | 294,188 | |
| | | | | | | | 521,162 | | | | 596,665 | |
| | | | | Automotive: Parts and Accessories — 2.1% |
| | 18,000 | | | Dana Inc. | | | 283,027 | | | | 410,760 | |
| | 2,000 | | | Genuine Parts Co. | | | 179,604 | | | | 280,400 | |
| | 1,000 | | | Linamar Corp. | | | 54,495 | | | | 59,236 | |
| | 32,000 | | | Uni-Select Inc.† | | | 387,341 | | | | 651,156 | |
| | 1,000 | | | Veoneer Inc.† | | | 23,270 | | | | 35,480 | |
| | | | | | | | 927,737 | | | | 1,437,032 | |
| | | | | Broadcasting — 0.8% |
| | 17,000 | | | Sinclair Broadcast Group Inc., Cl. A | | | 539,427 | | | | 449,310 | |
| | 4,000 | | | ViacomCBS Inc., Cl. A | | | 188,225 | | | | 133,480 | |
| | | | | | | | 727,652 | | | | 582,790 | |
| | | | | Building and Construction — 1.8% |
| | 333 | | | Arcosa Inc. | | | 7,045 | | | | 17,549 | |
| | 500 | | | Chofu Seisakusho Co. Ltd. | | | 11,059 | | | | 8,867 | |
| | 16,000 | | | GCP Applied Technologies Inc.† | | | 397,521 | | | | 506,560 | |
| | 6,000 | | | Johnson Controls International plc | | | 211,053 | | | | 487,860 | |
| | 1,800 | | | Lennar Corp., Cl. B | | | 76,618 | | | | 172,116 | |
| | 200 | | | Sika AG | | | 56,628 | | | | 83,451 | |
| | | | | | | | 759,924 | | | | 1,276,403 | |
| | | | | | | | | | | | | |
| | | | | Business Services — 1.2% |
| | 17,000 | | | JCDecaux SA† | | | 468,282 | | | | 425,799 | |
| | 11,500 | | | Matthews International Corp., Cl. A | | | 349,866 | | | | 421,705 | |
| | | | | | | | 818,148 | | | | 847,504 | |
| | | | | | | | | | | | | |
| | | | | Cable and Satellite — 2.1% |
| | 514 | | | DISH Network Corp., Cl. A† | | | 19,055 | | | | 16,674 | |
| | 800 | | | EchoStar Corp., Cl. A† | | | 33,391 | | | | 21,080 | |
| | 6,000 | | | Liberty Global plc, Cl. A† | | | 150,004 | | | | 166,440 | |
| | 6,000 | | | Liberty Global plc, Cl. C† | | | 171,143 | | | | 168,540 | |
| | 12,000 | | | Liberty Latin America Ltd., Cl. A† | | | 145,964 | | | | 139,920 | |
| | 595 | | | Liberty Latin America Ltd., Cl. C† | | | 4,248 | | | | 6,783 | |
| Shares | | | | | | | | Cost | | | Market
Value | |
| | 19,000 | | | Rogers Communications Inc., Cl. B | | | | | | $ | 667,343 | | | $ | 904,970 | |
| | | | | | | | | | | | 1,191,148 | | | | 1,424,407 | |
| | | | | Computer Software and Services — 0.8% | | | | |
| | 1,777 | | | AVEVA Group plc | | | | | | | 55,461 | | | | 81,875 | |
| | 28,000 | | | Hewlett Packard Enterprise Co. | | | | | | | 379,309 | | | | 441,560 | |
| | | | | | | | | | | | 434,770 | | | | 523,435 | |
| | | | | Consumer Products — 8.0% | | | | |
| | 3,500 | | | Energizer Holdings Inc. | | | | | | | 151,822 | | | | 140,350 | |
| | 21,000 | | | Essity AB, Cl. A | | | | | | | 557,316 | | | | 687,900 | |
| | 10,000 | | | Hunter Douglas NV† | | | | | | | 588,305 | | | | 1,960,497 | |
| | 2,000 | | | L’Oreal SA | | | | | | | 335,032 | | | | 949,395 | |
| | 2,000 | | | Salvatore Ferragamo SpA† | | | . | | | | 36,074 | | | | 51,301 | |
| | 12,000 | | | Scandinavian Tobacco Group A/S | | | | | | | 179,667 | | | | 252,233 | |
| | 300 | | | Spectrum Brands Holdings Inc. | | | | | | | 28,204 | | | | 30,516 | |
| | 4,500 | | | Svenska Cellulosa AB SCA, Cl. A | | | | | | | 29,603 | | | | 80,377 | |
| | 100,000 | | | Swedish Match AB | | | | | | | 363,244 | | | | 797,016 | |
| | 6,200 | | | Terminix Global Holdings Inc.† | | | | | | | 219,526 | | | | 280,426 | |
| | 7,000 | | | Unicharm Corp. | | | | | | | 139,941 | | | | 304,208 | |
| | | | | | | | | | | | 2,628,734 | | | | 5,534,219 | |
| | | | | | | | | | | | | | | | | |
| | | | | Consumer Services — 3.5% | | | | |
| | 11,500 | | | Ashtead Group plc | | | | | | | 231,411 | | | | 924,921 | |
| | 200 | | | Boyd Group Services Inc. | | | | | | | 14,695 | | | | 31,562 | |
| | 9,500 | | | Herc Holdings Inc. | | | | | | | 302,908 | | | | 1,487,225 | |
| | | | | | | | | | | | 549,014 | | | | 2,443,708 | |
| | | | | Diversified Industrial — 6.3% | | | | |
| | 600 | | | Aker ASA, Cl. A | | | | | | | 34,010 | | | | 56,208 | |
| | 11,571 | | | Ampco-Pittsburgh Corp.† | | | | | | | 50,157 | | | | 57,855 | |
| | 9,000 | | | Ardagh Group SA | | | | | | | 158,182 | | | | 203,175 | |
| | 10,000 | | | Bouygues SA | | | | | | | 416,538 | | | | 358,514 | |
| | 1,200 | | | Crane Co. | | | | | | | 92,553 | | | | 122,076 | |
| | 15,200 | | | EnPro Industries Inc. | | | | | | | 1,038,099 | | | | 1,673,064 | |
| | 1,000 | | | Hyster-Yale Materials Handling Inc. | | | | | | | 59,577 | | | | 41,100 | |
| | 10,000 | | | Jardine Matheson Holdings Ltd. | | | | | | | 570,859 | | | | 550,100 | |
| | 3,500 | | | Macquarie Infrastructure Holdings LLC | | | | | | | 96,886 | | | | 12,775 | |
| | 14,500 | | | Myers Industries Inc. | | | | | | | 224,775 | | | | 290,145 | |
| | 11,000 | | | Nilfisk Holding A/S† | | | | | | | 184,824 | | | | 362,061 | |
| | 1,000 | | | Park-Ohio Holdings Corp. | | | | | | | 24,486 | | | | 21,170 | |
| | 1,400 | | | Sulzer AG | | | | | | | 124,292 | | | | 138,049 | |
| | 5,000 | | | Textron Inc. | | | | | | | 183,805 | | | | 386,000 | |
See accompanying notes to financial statements.
The Gabelli Global Rising Income and Dividend Fund
Schedule of Investments (Continued) — December 31, 2021
| Shares | | | | | Cost | | | Market
Value | |
| | | | COMMON STOCKS (Continued) |
| | | | | Diversified Industrial (Continued) |
| | 3,000 | | | Trinity Industries Inc. | | $ | 57,151 | | | $ | 90,600 | |
| | | | | | | | 3,316,194 | | | | 4,362,892 | |
| | | | | Electronics — 9.3% |
| | 26,000 | | | Sony Group Corp. | | | 721,630 | | | | 3,271,755 | |
| | 25,000 | | | Sony Group Corp., ADR | | | 516,885 | | | | 3,160,000 | |
| | | | | | | | 1,238,515 | | | | 6,431,755 | |
| | | | | Energy and Energy Services — 1.3% |
| | 4,000 | | | BP plc, ADR | | | 112,909 | | | | 106,520 | |
| | 12,000 | | | Landis+Gyr Group AG | | | 731,326 | | | | 813,213 | |
| | | | | | | | 844,235 | | | | 919,733 | |
| | | | | Energy and Utilities — 3.8% |
| | 7,500 | | | Cameco Corp. | | | 78,158 | | | | 163,575 | |
| | 600 | | | Cheniere Energy Inc. | | | 23,332 | | | | 60,852 | |
| | 7,000 | | | National Fuel Gas Co. | | | 358,846 | | | | 447,580 | |
| | 14,000 | | | National Grid plc, ADR | | | 945,864 | | | | 1,012,480 | |
| | 11,000 | | | Royal Dutch Shell plc, Cl. B | | | 237,463 | | | | 241,560 | |
| | 18,000 | | | Severn Trent plc | | | 485,729 | | | | 718,004 | |
| | | | | | | | 2,129,392 | | | | 2,644,051 | |
| | | | | Entertainment — 2.2% |
| | 9,000 | | | Discovery Inc., Cl. A† | | | 224,820 | | | | 211,860 | |
| | 36,000 | | | Grupo Televisa SAB, ADR | | | 337,221 | | | | 337,320 | |
| | 13,000 | | | International Game Technology plc | | | 153,742 | | | | 375,830 | |
| | 112,500 | | | ITV plc† | | | 235,598 | | | | 168,339 | |
| | 20,000 | | | Tencent Music Entertainment Group, ADR† | | | 317,003 | | | | 137,000 | |
| | 3,000 | | | Universal Music Group NV | | | 83,428 | | | | 84,636 | |
| | 15,000 | | | Vivendi SE | | | 188,961 | | | | 203,052 | |
| | | | | | | | 1,540,773 | | | | 1,518,037 | |
| | | | | Equipment and Supplies — 1.5% |
| | 4,500 | | | Graco Inc. | | | 100,232 | | | | 362,790 | |
| | 12,000 | | | Mueller Industries Inc. | | | 340,226 | | | | 712,320 | |
| | | | | | | | 440,458 | | | | 1,075,110 | |
| | | | | Financial Services — 9.4% |
| | 1,000 | | | American Express Co. | | | 80,155 | | | | 163,600 | |
| | 2,700 | | | American International Group Inc. | | | 93,346 | | | | 153,522 | |
| | 3,000 | | | Bank of America Corp. | | | 85,175 | | | | 133,470 | |
| | 3 | | | Berkshire Hathaway Inc., Cl. A† | | | 358,105 | | | | 1,351,986 | |
| | 6,000 | | | Citigroup Inc. | | | 341,241 | | | | 362,340 | |
| | 3,200 | | | Comerica Inc. | | | 134,263 | | | | 278,400 | |
| | 8,000 | | | Deutsche Bank AG† | | | 59,019 | | | | 100,000 | |
| | 5,000 | | | EXOR NV | | | 221,668 | | | | 449,480 | |
| | 27,000 | | | FinecoBank Banca Fineco SpA | | | 182,261 | | | | 474,464 | |
| Shares | | | | | Cost | | | Market
Value | |
| | 68,500 | | | GAM Holding AG† | | $ | 291,051 | | | $ | 102,239 | |
| | 1,600 | | | Julius Baer Group Ltd. | | | 75,332 | | | | 107,427 | |
| | 15,800 | | | Kinnevik AB, Cl. A† | | | 495,663 | | | | 602,541 | |
| | 4,600 | | | Morgan Stanley | | | 112,334 | | | | 451,536 | |
| | 35,000 | | | Resona Holdings Inc. | | | 160,555 | | | | 136,130 | |
| | 2,500 | | | State Street Corp. | | | 144,305 | | | | 232,500 | |
| | 1,000 | | | T. Rowe Price Group Inc. | | | 71,771 | | | | 196,640 | |
| | 10,000 | | | The Bank of New York Mellon Corp. | | | 315,339 | | | | 580,800 | |
| | 1,500 | | | The PNC Financial Services Group Inc. | | | 102,907 | | | | 300,780 | |
| | 7,000 | | | UBS Group AG | | | 70,979 | | | | 125,090 | |
| | 5,000 | | | Wells Fargo & Co. | | | 165,445 | | | | 239,900 | |
| | | | | | | | 3,560,914 | | | | 6,542,845 | |
| | | | | Food and Beverage — 17.4% |
| | 5,000 | | | Campbell Soup Co. | | | 196,358 | | | | 217,300 | |
| | 7,500 | | | Chr. Hansen Holding A/S | | | 343,823 | | | | 591,774 | |
| | 5,500 | | | Danone SA | | | 371,006 | | | | 341,829 | |
| | 45,000 | | | Davide Campari-Milano NV | | | 147,821 | | | | 658,594 | |
| | 6,000 | | | Diageo plc, ADR | | | 665,410 | | | | 1,320,840 | |
| | 4,500 | | | Fomento Economico Mexicano SAB de CV, ADR | | | 361,990 | | | | 349,695 | |
| | 2,000 | | | Heineken NV | | | 133,144 | | | | 225,104 | |
| | 2,500 | | | Kellogg Co. | | | 127,291 | | | | 161,050 | |
| | 4,000 | | | Kerry Group plc, Cl. A | | | 300,765 | | | | 511,756 | |
| | 10,600 | | | Kikkoman Corp. | | | 345,381 | | | | 891,089 | |
| | 9,000 | | | Maple Leaf Foods Inc. | | | 190,986 | | | | 208,182 | |
| | 3,000 | | | McCormick & Co. Inc. | | | 133,799 | | | | 286,170 | |
| | 3,000 | | | McCormick & Co. Inc., Non-Voting | | | 106,428 | | | | 289,830 | |
| | 14,000 | | | Nestlé SA | | | 1,013,818 | | | | 1,958,033 | |
| | 3,500 | | | Pernod Ricard SA | | | 398,941 | | | | 842,775 | |
| | 12,100 | | | Remy Cointreau SA | | | 892,126 | | | | 2,948,032 | |
| | 6,000 | | | The Kraft Heinz Co. | | | 175,646 | | | | 215,400 | |
| | 1,500 | | | Yakult Honsha Co. Ltd. | | | 88,237 | | | | 78,241 | |
| | 300,000 | | | Yashili International Holdings Ltd.† | | | 85,349 | | | | 20,006 | |
| | | | | | | | 6,078,319 | | | | 12,115,700 | |
| | | | | Health Care — 3.3% |
| | 20,000 | | | Achaogen Inc.†(a) | | | 4,200 | | | | 0 | |
| | 4,000 | | | Bristol-Myers Squibb Co. | | | 177,668 | | | | 249,400 | |
| | 10,000 | | | Clovis Oncology Inc.† | | | 46,015 | | | | 27,100 | |
| | 7,000 | | | Cutera Inc.† | | | 130,348 | | | | 289,240 | |
| | 1,000 | | | GlaxoSmithKline plc, ADR | | | 40,380 | | | | 44,100 | |
| | 700 | | | ICU Medical Inc.† | | | 39,966 | | | | 166,138 | |
| | 4,666 | | | Idorsia Ltd.† | | | 57,775 | | | | 95,450 | |
| | 1,600 | | | Johnson & Johnson | | | 182,234 | | | | 273,712 | |
| | 1,400 | | | Medmix AG† | | | 67,535 | | | | 69,386 | |
| | 2,500 | | | Patterson Cos. Inc. | | | 60,687 | | | | 73,375 | |
| | 6,000 | | | Pfizer Inc. | | | 143,046 | | | | 354,300 | |
See accompanying notes to financial statements.
The Gabelli Global Rising Income and Dividend Fund
Schedule of Investments (Continued) — December 31, 2021
| Shares | | | | | Cost | | | Market
Value | |
| | | | | COMMON STOCKS (Continued) |
| | | | | Health Care (Continued) |
| | 5,000 | | | Roche Holding AG, ADR | | $ | 93,345 | | | $ | 258,450 | |
| | 30,000 | | | Viatris Inc. | | | 495,587 | | | | 405,900 | |
| | | | | | | | 1,538,786 | | | | 2,306,551 | |
| | | | | Hotels and Gaming — 1.1% |
| | 225,000 | | | Mandarin Oriental International Ltd.† | | | 365,250 | | | | 504,000 | |
| | 200,000 | | | The Hongkong & Shanghai Hotels Ltd.† | | | 290,849 | | | | 175,696 | |
| | 800 | | | Wynn Resorts Ltd.† | | | 83,623 | | | | 68,032 | |
| | | | | | | | 739,722 | | | | 747,728 | |
| | | | | Machinery — 4.3% |
| | 90,000 | | | CNH Industrial NV, Borsa Italiana | | | 857,927 | | | | 1,749,078 | |
| | 50,000 | | | CNH Industrial NV, New York | | | 444,472 | | | | 971,500 | |
| | 2,666 | | | NKT A/S† | | | 52,701 | | | | 128,809 | |
| | 14,524 | | | Twin Disc Inc.† | | | 210,228 | | | | 159,183 | |
| | | | | | | | 1,565,328 | | | | 3,008,570 | |
| | | | | | | | | | | | | |
| | | | | Publishing — 0.7% |
| | 25,000 | | | The E.W. Scripps Co., Cl. A | | | 376,462 | | | | 483,750 | |
| | | | | | | | | | | | | |
| | | | | Retail — 0.8% |
| | 2,600 | | | Nathan’s Famous Inc. | | | 158,596 | | | | 151,814 | |
| | 4,000 | | | Walgreens Boots Alliance Inc. | | | 211,496 | | | | 208,640 | |
| | 2,800 | | | Zalando SE† | | | 284,633 | | | | 226,780 | |
| | | | | | | | 654,725 | | | | 587,234 | |
| | | | | Specialty Chemicals — 1.0% |
| | 700 | | | Ashland Global Holdings Inc. | | | 35,829 | | | | 75,362 | |
| | 3,000 | | | International Flavors & Fragrances Inc. | | | 312,534 | | | | 451,950 | |
| | 200 | | | The Chemours Co. | | | 1,719 | | | | 6,712 | |
| | 4,000 | | | Valvoline Inc. | | | 83,077 | | | | 149,160 | |
| | | | | | | | 433,159 | | | | 683,184 | |
| | | | | Telecommunications — 3.5% |
| | 11,000 | | | Deutsche Telekom AG | | | 200,258 | | | | 204,133 | |
| | 17,000 | | | Deutsche Telekom AG, ADR | | | 306,413 | | | | 314,670 | |
| | 75,000 | | | Koninklijke KPN NV | | | 221,420 | | | | 233,108 | |
| | 1,600 | | | Lumen Technologies Inc. | | | 19,485 | | | | 20,080 | |
| | 4,000 | | | Orange Belgium SA | | | 91,879 | | | | 90,625 | |
| | 60,000 | | | Pharol SGPS SA† | | | 30,852 | | | | 5,130 | |
| | 1,000 | | | Prosus NV | | | 103,441 | | | | 83,714 | |
| | 3,000 | | | Proximus SA | | | 69,309 | | | | 58,542 | |
| | 125,000 | | | Sistema PJSC FC, GDR | | | 633,927 | | | | 775,000 | |
| | 104,000 | | | Telefonica Deutschland Holding AG | | | 379,800 | | | | 289,024 | |
| | 1,500 | | | Vantage Towers AG | | | 47,947 | | | | 54,989 | |
| Shares | | | | | Cost | | | Market
Value | |
| | 104,000 | | | VEON Ltd., ADR† | | $ | 273,545 | | | $ | 177,840 | |
| | 3,000 | | | Verizon Communications Inc. | | | 144,345 | | | | 155,880 | |
| | | | | | | | 2,522,621 | | | | 2,462,735 | |
| | | | | | | | | | | | | |
| | | | | Wireless Telecommunications — 2.2% |
| | 10,000 | | | Millicom International Cellular SA, SDR† | | | 448,294 | | | | 284,744 | |
| | 7,500 | | | T-Mobile US Inc.† | | | 622,425 | | | | 869,850 | |
| | 26,000 | | | Vodafone Group plc, ADR | | | 572,569 | | | | 388,180 | |
| | | | | | | | 1,643,288 | | | | 1,542,774 | |
| | | | | TOTAL COMMON STOCKS | | | 37,481,886 | | | | 62,932,053 | |
| | | | | | | | | | | | | |
| | | | | WARRANTS — 0.0% |
| | | | | Diversified Industrial — 0.0% |
| | 8,000 | | | Ampco-Pittsburgh Corp., expire 08/01/25† | | | 5,466 | | | | 4,718 | |
| | | | | | | | | | | | | |
Principal
Amount | | | | | | | | | | | |
| | | | | U.S. GOVERNMENT OBLIGATIONS — 9.4% |
| $ | 6,505,000 | | | U.S. Treasury Bills, | | | | | | | | |
| | | | | 0.030% to 0.105%††, | | | | | | | | |
| | | | | 01/27/22 to 06/09/22 | | | 6,504,415 | | | | 6,504,461 | |
| | | | | | | | | | | | | |
| | | | | TOTAL INVESTMENTS — 99.9% | $ | 43,991,767 | | | | 69,441,232 | |
| | | | | Other Assets and Liabilities (Net) — 0.1% | | | 53,046 | |
| | | | | NET ASSETS — 100.0% | | $ | 69,494,278 | |
| (a) | Security is valued using significant unobservable inputs and is classified as Level 3 in the fair value hierarchy. |
| † | Non-income producing security. |
| †† | Represents annualized yields at dates of purchase. |
| ADR | American Depositary Receipt |
| GDR | Global Depositary Receipt |
| SDR | Swedish Depositary Receipt |
See accompanying notes to financial statements.
The Gabelli Global Rising Income and Dividend Fund
Schedule of Investments (Continued) — December 31, 2021
| Geographic Diversification | | % of
Market
Value | | | Market
Value | |
| Europe | | 43.0 | % | | $ | 29,849,187 | |
| United States | | 39.8 | | | | 27,649,257 | |
| Japan | | 11.3 | | | | 7,850,290 | |
| Canada | | 2.9 | | | | 2,018,680 | |
| Asia/Pacific | | 2.0 | | | | 1,386,803 | |
| Latin America | | 1.0 | | | | 687,015 | |
| | | 100.0 | % | | $ | 69,441,232 | |
See accompanying notes to financial statements.
The Gabelli Global Rising Income and Dividend Fund
Statement of Assets and Liabilities
December 31, 2021
| Assets: | | | |
| Investments, at value (cost $43,991,767) | | $ | 69,441,232 | |
| Foreign currency, at value (cost $1,055) | | | 1,067 | |
| Receivable for Fund shares sold | | | 5,505 | |
| Receivable from Adviser | | | 23,483 | |
| Dividends receivable | | | 139,742 | |
| Prepaid expenses | | | 19,048 | |
| Total Assets | | | 69,630,077 | |
| Liabilities: | | | | |
| Payable to bank | | | 2,195 | |
| Payable for investment advisory fees | | | 57,221 | |
| Payable for accounting fees | | | 3,750 | |
| Payable for distribution fees | | | 1,796 | |
| Payable for legal and audit fees | | | 29,400 | |
| Payable for shareholder communications | | | 22,593 | |
| Payable for shareholder services fees | | | 6,849 | |
| Other accrued expenses | | | 11,995 | |
| Total Liabilities | | | 135,799 | |
| Net Assets | | | | |
| (applicable to 2,000,435 shares outstanding) | | $ | 69,494,278 | |
| Net Assets Consist of: | | | | |
| Paid-in capital | | $ | 44,739,615 | |
| Total distributable earnings | | | 24,754,663 | |
| Net Assets | | $ | 69,494,278 | |
| Shares of Capital Stock, each at $0.001 par value: | | | | |
| Class AAA: | | | | |
| Net Asset Value, offering, and redemption price per share ($4,913,792 ÷ 141,702 shares outstanding; 75,000,000 shares authorized) | | $ | 34.68 | |
| Class A: | | | | |
| Net Asset Value and redemption price per share ($1,169,645 ÷ 33,659 shares outstanding; 50,000,000 shares authorized) | | $ | 34.75 | |
| Maximum offering price per share (NAV ÷ 0.9425, based on maximum sales charge of 5.75% of the offering price) | | $ | 36.87 | |
| Class C: | | | | |
| Net Asset Value and redemption price per share ($653,945 ÷ 22,603 shares outstanding; 25,000,000 shares authorized) | | $ | 28.93 | |
| Class I: | | | | |
| Net Asset Value, offering, and redemption price per share ($62,756,896 ÷ 1,802,471 shares outstanding; 25,000,000 shares authorized) | | $ | 34.82 | |
Statement of Operations
For the Year Ended December 31, 2021
| Investment Income: | | | |
| Dividends (net of foreign withholding taxes of $118,185) | | $ | 904,339 | |
| Non-cash dividends | | | 382,025 | |
| Interest | | | 732 | |
| Total Investment Income | | | 1,287,096 | |
| Expenses: | | | | |
| Investment advisory fees | | | 612,351 | |
| Distribution fees - Class AAA | | | 12,543 | |
| Distribution fees - Class A | | | 2,441 | |
| Distribution fees - Class C | | | 8,636 | |
| Accounting fees | | | 45,000 | |
| Legal and audit fees | | | 44,436 | |
| Registration expenses | | | 43,170 | |
| Custodian fees | | | 27,340 | |
| Shareholder services fees | | | 21,220 | |
| Shareholder communications expenses | | | 19,387 | |
| Directors’ fees | | | 9,781 | |
| Interest expense | | | 346 | |
| Miscellaneous expenses | | | 17,240 | |
| Total Expenses | | | 863,891 | |
| Less: | | | | |
| Expense reimbursements (See Note 3) | | | (311,048 | ) |
| Expenses paid indirectly by broker (See Note 6) | | | (1,382 | ) |
| Total Reimbursements and Credits | | | (312,430 | ) |
| Net Expenses | | | 551,461 | |
| Net Investment Income | | | 735,635 | |
| Net Realized and Unrealized Gain/(Loss) on | | | | |
| Investments and Foreign Currency: | | | | |
| Net realized gain on investments | | | 1,619,745 | |
| Net realized gain on foreign currency transactions | | | 3,174 | |
| Net realized gain on investments and foreign currency transactions | | | 1,622,919 | |
| Net change in unrealized appreciation/depreciation: | | | | |
| on investments | | | 9,478,794 | |
| on foreign currency translations | | | (2,614 | ) |
| Net change in unrealized appreciation/depreciation on investments and foreign currency translations | | | 9,476,180 | |
| Net Realized and Unrealized Gain/(Loss) on Investments and Foreign Currency | | | 11,099,099 | |
| Net Increase in Net Assets Resulting from Operations | | $ | 11,834,734 | |
See accompanying notes to financial statements.
The Gabelli Global Rising Income and Dividend Fund
Statement of Changes in Net Assets
| | | Year Ended
December 31, 2021 | | Year Ended
December 31, 2020 |
| | | | | | | |
| Operations: | | | | | | | | | | |
| Net investment income | | | $ | 735,635 | | | | $ | 371,980 | |
| Net realized gain/(loss) on investments and foreign currency transactions | | | | 1,622,919 | | | | | (1,471,755 | ) |
| Net change in unrealized appreciation/depreciation on investments and foreign currency translations | | | | 9,476,180 | | | | | 6,406,003 | |
| Net Increase in Net Assets Resulting from Operations | | | | 11,834,734 | | | | | 5,306,228 | |
| | | | | | | | | | | |
| Distributions to Shareholders: | | | | | | | | | | |
| Accumulated earnings | | | | | | | | | | |
| Class AAA | | | | (76,054 | ) | | | | (34,786 | ) |
| Class A | | | | (18,118 | ) | | | | (5,661 | ) |
| Class C | | | | (12,152 | ) | | | | (7,808 | ) |
| Class I | | | | (971,534 | ) | | | | (324,679 | ) |
| Total Distributions to Shareholders | | | | (1,077,858 | ) | | | | (372,934 | ) |
| | | | | | | | | | | |
| Capital Share Transactions: | | | | | | | | | | |
| Class AAA | | | | (1,147,427 | ) | | | | (1,361,295 | ) |
| Class A | | | | 159,151 | | | | | (624,036 | ) |
| Class C | | | | (469,865 | ) | | | | (845,808 | ) |
| Class I | | | | 4,996,888 | | | | | (554,404 | ) |
| Net Increase/(Decrease) in Net Assets from Capital Share Transactions | | | | 3,538,747 | | | | | (3,385,543 | ) |
| | | | | | | | | | | |
| Redemption Fees | | | | 8 | | | | | 107 | |
| | | | | | | | | | | |
| Net Increase in Net Assets | | | | 14,295,631 | | | | | 1,547,858 | |
| Net Assets: | | | | | | | | | | |
| Beginning of year | | | | 55,198,647 | | | | | 53,650,789 | |
| End of year | | | $ | 69,494,278 | | | | $ | 55,198,647 | |
See accompanying notes to financial statements.
The Gabelli Global Rising Income and Dividend Fund
Financial Highlights
Selected data for a share of beneficial interest outstanding throughout each year:
| | | | | | Income (Loss) from Investment Operations | | | Distributions | | | | | | | | | | | | Ratios to Average Net Assets/Supplemental Data | |
Year
Ended December 31 | | Net Asset Value, Beginning of Year | | | Net Investment Income (Loss)
(a) | | | Net
Realized
and Unrealized Gain (Loss) on Investments | | | Total
from Investment Operations | | | Net Investment Income | | | Net
Realized Gain
on Investments | | | Return of Capital | | | Total Distributions | | | Redemption Fees
(a)(b) | | | Net Asset Value, End of Year | | | Total Return† | | | Net Assets, End of Year
(in 000’s) | | | Net Investment Income (Loss) | | Operating Expenses Before Reimbursement | | | Operating
Expenses
Net of Reimbursement
(c)(d) | | Portfolio Turnover Rate | |
| Class AAA | | | | | | | | | | | | | | | | | | | | | | | | | | | | | | | | | | | | | | | | | | | | | | | | | | | | |
| 2021 | | $ | 29.04 | | | $ | 0.39 | (e) | | $ | 5.79 | | | $ | 6.18 | | | $ | (0.17 | ) | | $ | (0.37 | ) | | $ | — | | | $ | (0.54 | ) | | $ | 0.00 | | | $ | 34.68 | | | 21.32 | % | | $ | 4,914 | | | 1.21 | %(e) | | 1.62 | % | | 0.90 | %(f) | | | 10 | % |
| 2020 | | | 26.18 | | | | 0.19 | | | | 2.87 | | | | 3.06 | | | | (0.20 | ) | | | — | | | | — | | | | (0.20 | ) | | | 0.00 | | | | 29.04 | | | 11.68 | | | | 5,157 | | | 0.79 | | | 1.72 | | | 0.90 | (f) | | | 8 | |
| 2019 | | | 23.00 | | | | 0.08 | (e) | | | 3.22 | | | | 3.30 | | | | (0.08 | ) | | | (0.04 | ) | | | — | | | | (0.12 | ) | | | 0.00 | | | | 26.18 | | | 14.38 | | | | 6,194 | | | 0.34 | (e) | | 1.70 | | | 1.65 | (f) | | | 5 | |
| 2018 | | | 27.20 | | | | 0.16 | | | | (3.98 | ) | | | (3.82 | ) | | | (0.20 | ) | | | (0.18 | ) | | | — | | | | (0.38 | ) | | | — | | | | 23.00 | | | (14.02 | ) | | | 4,929 | | | 0.60 | | | 1.67 | | | 1.67 | | | | 20 | |
| 2017 | | | 22.80 | | | | 0.03 | | | | 4.74 | | | | 4.77 | | | | (0.07 | ) | | | (0.28 | ) | | | (0.02 | ) | | | (0.37 | ) | | | 0.00 | | | | 27.20 | | | 20.91 | | | | 7,672 | | | 0.12 | | | 1.62 | | | 1.62 | | | | 24 | |
| Class A | | | | | | | | | | | | | | | | | | | | | | | | | | | | | | | | | | | | | | | | | | | | | | | | | | | | |
| 2021 | | $ | 29.10 | | | $ | 0.39 | (e) | | $ | 5.80 | | | $ | 6.19 | | | $ | (0.17 | ) | | $ | (0.37 | ) | | $ | — | | | $ | (0.54 | ) | | $ | 0.00 | | | $ | 34.75 | | | 21.31 | % | | $ | 1,169 | | | 1.19 | %(e) | | 1.62 | % | | 0.90 | %(f) | | | 10 | % |
| 2020 | | | 26.23 | | | | 0.18 | | | | 2.89 | | | | 3.07 | | | | (0.20 | ) | | | — | | | | — | | | | (0.20 | ) | | | 0.00 | | | | 29.10 | | | 11.69 | | | | 840 | | | 0.76 | | | 1.72 | | | 0.90 | (f) | | | 8 | |
| 2019 | | | 23.04 | | | | 0.09 | (e) | | | 3.21 | | | | 3.30 | | | | (0.07 | ) | | | (0.04 | ) | | | — | | | | (0.11 | ) | | | 0.00 | | | | 26.23 | | | 14.35 | | | | 1,441 | | | 0.35 | (e) | | 1.70 | | | 1.66 | (f) | | | 5 | |
| 2018 | | | 27.26 | | | | 0.16 | | | | (3.99 | ) | | | (3.83 | ) | | | (0.21 | ) | | | (0.18 | ) | | | — | | | | (0.39 | ) | | | — | | | | 23.04 | | | (14.01 | ) | | | 1,465 | | | 0.61 | | | 1.67 | | | 1.67 | | | | 20 | |
| 2017 | | | 22.86 | | | | 0.05 | | | | 4.74 | | | | 4.79 | | | | (0.09 | ) | | | (0.28 | ) | | | (0.02 | ) | | | (0.39 | ) | | | 0.00 | | | | 27.26 | | | 20.93 | | | | 1,178 | | | 0.18 | | | 1.62 | | | 1.62 | | | | 24 | |
| Class C | | | | | | | | | | | | | | | | | | | | | | | | | | | | | | | | | | | | | | | | | | | | | | | | | | | | |
| 2021 | | $ | 24.30 | | | $ | 0.34 | (e) | | $ | 4.83 | | | $ | 5.17 | | | $ | (0.17 | ) | | $ | (0.37 | ) | | $ | — | | | $ | (0.54 | ) | | $ | 0.00 | | | $ | 28.93 | | | 21.32 | % | | $ | 654 | | | 1.23 | %(e) | | 2.38 | % | | 0.90 | %(f) | | | 10 | % |
| 2020 | | | 21.94 | | | | 0.15 | | | | 2.41 | | | | 2.56 | | | | (0.20 | ) | | | — | | | | — | | | | (0.20 | ) | | | 0.00 | | | | 24.30 | | | 11.65 | | | | 968 | | | 0.74 | | | 2.47 | | | 0.90 | (f) | | | 8 | |
| 2019 | | | 19.35 | | | | (0.09 | )(e) | | | 2.72 | | | | 2.63 | | | | — | | | | (0.04 | ) | | | — | | | | (0.04 | ) | | | 0.00 | | | | 21.94 | | | 13.61 | | | | 1,836 | | | (0.43 | )(e) | | 2.45 | | | 2.37 | (f) | | | 5 | |
| 2018 | | | 22.93 | | | | (0.02 | ) | | | (3.35 | ) | | | (3.37 | ) | | | (0.03 | ) | | | (0.18 | ) | | | — | | | | (0.21 | ) | | | — | | | | 19.35 | | | (14.65 | ) | | | 2,245 | | | (0.09 | ) | | 2.42 | | | 2.42 | | | | 20 | |
| 2017 | | | 19.36 | | | | (0.14 | ) | | | 4.01 | | | | 3.87 | | | | — | | | | (0.28 | ) | | | (0.02 | ) | | | (0.30 | ) | | | 0.00 | | | | 22.93 | | | 19.98 | | | | 2,127 | | | (0.62 | ) | | 2.37 | | | 2.37 | | | | 24 | |
| Class I | | | | | | | | | | | | | | | | | | | | | | | | | | | | | | | | | | | | | | | | | | | | | | | | | | | | |
| 2021 | | $ | 29.15 | | | $ | 0.39 | (e) | | $ | 5.82 | | | $ | 6.21 | | | $ | (0.17 | ) | | $ | (0.37 | ) | | $ | — | | | $ | (0.54 | ) | | $ | 0.00 | | | $ | 34.82 | | | 21.34 | % | | $ | 62,757 | | | 1.20 | %(e) | | 1.37 | % | | 0.90 | %(f) | | | 10 | % |
| 2020 | | | 26.28 | | | | 0.19 | | | | 2.88 | | | | 3.07 | | | | (0.20 | ) | | | — | | | | — | | | | (0.20 | ) | | | 0.00 | | | | 29.15 | | | 11.67 | | | | 48,234 | | | 0.79 | | | 1.47 | | | 0.90 | (f) | | | 8 | |
| 2019 | | | 23.08 | | | | 0.25 | (e) | | | 3.24 | | | | 3.49 | | | | (0.25 | ) | | | (0.04 | ) | | | — | | | | (0.29 | ) | | | 0.00 | | | | 26.28 | | | 15.11 | | | | 44,180 | | | 1.01 | (e) | | 1.45 | | | 0.99 | (f) | | | 5 | |
| 2018 | | | 27.35 | | | | 0.35 | | | | (4.04 | ) | | | (3.69 | ) | | | (0.40 | ) | | | (0.18 | ) | | | — | | | | (0.58 | ) | | | — | | | | 23.08 | | | (13.44 | ) | | | 38,934 | | | 1.32 | | | 1.42 | | | 1.00 | (f) | | | 20 | |
| 2017 | | | 22.89 | | | | 0.19 | | | | 4.78 | | | | 4.97 | | | | (0.21 | ) | | | (0.28 | ) | | | (0.02 | ) | | | (0.51 | ) | | | 0.00 | | | | 27.35 | | | 21.68 | | | | 59,555 | | | 0.74 | | | 1.37 | | | 1.00 | (f) | | | 24 | |
| † | Total return represents aggregate total return of a hypothetical investment at the beginning of the year and sold at the end of the year including reinvestment of distributions and does not reflect the applicable sales charges. |
| (a) | Per share amounts have been calculated using the average shares outstanding method. |
| (b) | Amount represents less than $0.005 per share. |
| (c) | The Fund received credits from a designated broker who agreed to pay certain Fund operating expenses. For all years presented, there was no impact on the expense ratios. |
| (d) | The Fund incurred interest expense, the effect of which was minimal. |
| (e) | Includes income resulting from special dividends. Without these dividends, the per share income/(loss) amounts would have been $0.19 and $0.03 (Class AAA), $0.19 and $0.04 (Class A), $0.17 and $(0.13) (Class C), and $0.19 and $0.20 (Class I), and the net investment income/(loss) ratios would have been 0.59% and 0.14% (Class AAA), 0.57% and 0.14% (Class A), 0.61% and (0.64%) (Class C), 0.58% and 0.80% (Class I), for the years ended December 31, 2021 and 2019, respectively. |
| (f) | Under an expense reimbursement agreement with the Adviser, the Adviser reimbursed expenses of $311,048, $295,855, and $196,584 for the years ended December 31, 2021, 2020, and 2019 and certain Class I expenses to the Fund of $211,071 and $175,468 for the years ended December 31, 2018 and 2017, respectively. |
See accompanying notes to financial statements.
The Gabelli Global Rising Income and Dividend Fund
Notes to Financial Statements
1. Organization. The Gabelli Global Rising Income and Dividend Fund, a series of GAMCO Global Series Funds, Inc. (the Corporation), was incorporated on July 16, 1993 in Maryland. The Fund is a non-diversified open-end management investment company registered under the Investment Company Act of 1940, as amended (the 1940 Act), and is one of five separately managed portfolios (collectively, the Portfolios) of the Corporation. The Fund’s primary objective is to seek to provide investors a high level of total return through a combination of income and capital appreciation. The Fund commenced investment operations on February 3, 1994.
2. Significant Accounting Policies. As an investment company, the Fund follows the investment company accounting and reporting guidance, which is part of U.S. generally accepted accounting principles (GAAP) that may require the use of management estimates and assumptions in the preparation of its financial statements. Actual results could differ from those estimates. The following is a summary of significant accounting policies followed by the Fund in the preparation of its financial statements.
The global outbreak of the novel coronavirus disease, known as COVID-19, has caused adverse effects on many companies, sectors, nations, regions, and the markets in general, and may continue for an unpredictable duration. The effects of this pandemic may materially impact the value and performance of the Fund, its ability to buy and sell fund investments at appropriate valuations, and its ability to achieve its investment objectives.
Security Valuation. Portfolio securities listed or traded on a nationally recognized securities exchange or traded in the U.S. over-the-counter market for which market quotations are readily available are valued at the last quoted sale price or a market’s official closing price as of the close of business on the day the securities are being valued. If there were no sales that day, the security is valued at the average of the closing bid and asked prices or, if there were no asked prices quoted on that day, then the security is valued at the closing bid price on that day. If no bid or asked prices are quoted on such day, the security is valued at the most recently available price or, if the Board of Directors (the Board) so determines, by such other method as the Board shall determine in good faith to reflect its fair market value. Portfolio securities traded on more than one national securities exchange or market are valued according to the broadest and most representative market, as determined by Gabelli Funds, LLC (the Adviser).
Portfolio securities primarily traded on a foreign market are generally valued at the preceding closing values of such securities on the relevant market, but may be fair valued pursuant to procedures established by the Board if market conditions change significantly after the close of the foreign market, but prior to the close of business on the day the securities are being valued. Debt obligations for which market quotations are readily available are valued at the average of the latest bid and asked prices. If there were no asked prices quoted on such day, the security is valued using the closing bid price. Such debt obligations are valued through prices provided by a pricing service approved by the Board. Certain securities are valued principally using dealer quotations.
Securities and assets for which market quotations are not readily available are fair valued as determined by the Board. Fair valuation methodologies and procedures may include, but are not limited to: analysis and review of available financial and non-financial information about the company; comparisons with the valuation and changes in valuation of similar securities, including a comparison of foreign securities with the equivalent U.S. dollar value American Depositary Receipt securities at the close of the U.S. exchange; and evaluation of any other information that could be indicative of the value of the security.
The Fund employs a fair value model to adjust prices to reflect events affecting the values of certain portfolio securities which occur between the close of trading on the principal market for such securities (foreign exchanges
The Gabelli Global Rising Income and Dividend Fund
Notes to Financial Statements (Continued)
and over-the-counter markets) at the time when net asset values of the Fund are determined. If the Fund’s valuation committee believes that a particular event would materially affect net asset value, further adjustment is considered. Such securities are classified as Level 2 in the fair value hierarchy presented below.
The inputs and valuation techniques used to measure fair value of the Fund’s investments are summarized into three levels as described in the hierarchy below:
| ● | Level 1 — quoted prices in active markets for identical securities; |
| ● | Level 2 — other significant observable inputs (including quoted prices for similar securities, interest rates, prepayment speeds, credit risk, etc.); and |
| ● | Level 3 — significant unobservable inputs (including the Board’s determinations as to the fair value of investments). |
A financial instrument’s level within the fair value hierarchy is based on the lowest level of any input both individually and in the aggregate that is significant to the fair value measurement. The inputs or methodology used for valuing securities are not necessarily an indication of the risk associated with investing in those securities. The summary of the Fund’s investments in securities by inputs used to value the Fund’s investments as of December 31, 2021 is as follows:
| | | Valuation Inputs | | |
| | | Level 1 Quoted Prices | | Level 2 Other Significant Observable Inputs | | Level 3 Significant Unobservable Inputs (a) | | Total Market Value at 12/31/21 |
| INVESTMENTS IN SECURITIES: | | | | | | | | |
| ASSETS (Market Value): | | | | | | | | |
| Common Stocks: | | | | | | | | | | | | | | | | |
| Diversified Industrial | | $ | 4,159,717 | | | $ | 203,175 | | | | — | | | $ | 4,362,892 | |
| Health Care | | | 2,306,551 | | | | — | | | $ | 0 | | | | 2,306,551 | |
| Other Industries (b) | | | 56,262,610 | | | | — | | | | — | | | | 56,262,610 | |
| Total Common Stocks | | | 62,728,878 | | | | 203,175 | | | | — | | | | 62,932,053 | |
| Warrants (b) | | | 4,718 | | | | — | | | | — | | | | 4,718 | |
| U.S. Government Obligations | | | — | | | | 6,504,461 | | | | — | | | | 6,504,461 | |
| TOTAL INVESTMENTS IN SECURITIES – ASSETS | | $ | 62,733,596 | | | $ | 6,707,636 | | | $ | 0 | | | $ | 69,441,232 | |
| (a) | The inputs for this security are not readily available and are derived based on the judgment of the Adviser according to procedures approved by the Board of Directors. |
| (b) | Please refer to the Schedule of Investments for the industry classifications of these portfolio holdings. |
The Fund did not have any material transfers into or out of Level 3 during the year ended December 31, 2021.
Additional Information to Evaluate Qualitative Information.
General. The Fund uses recognized industry pricing services – approved by the Board and unaffiliated with the Adviser – to value most of its securities, and uses broker quotes provided by market makers of securities not valued by these and other recognized pricing sources. Several different pricing feeds are received to value domestic equity securities, international equity securities, preferred equity securities, and fixed income securities. The data within these feeds are ultimately sourced from major stock exchanges and trading systems where these securities trade. The prices supplied by external sources are checked by obtaining quotations
The Gabelli Global Rising Income and Dividend Fund
Notes to Financial Statements (Continued)
or actual transaction prices from market participants. If a price obtained from the pricing source is deemed unreliable, prices will be sought from another pricing service or from a broker/dealer that trades that security or similar securities.
Fair Valuation. Fair valued securities may be common or preferred equities, warrants, options, rights, or fixed income obligations. Where appropriate, Level 3 securities are those for which market quotations are not available, such as securities not traded for several days, or for which current bids are not available, or which are restricted as to transfer. When fair valuing a security, factors to consider include recent prices of comparable securities that are publicly traded, reliable prices of securities not publicly traded, the use of valuation models, current analyst reports, valuing the income or cash flow of the issuer, or cost if the preceding factors do not apply. A significant change in the unobservable inputs could result in a lower or higher value in Level 3 securities. The circumstances of Level 3 securities are frequently monitored to determine if fair valuation measures continue to apply.
The Adviser reports quarterly to the Board the results of the application of fair valuation policies and procedures. These may include backtesting the prices realized in subsequent trades of these fair valued securities to fair values previously recognized.
Derivative Financial Instruments. The Fund may engage in various portfolio investment strategies by investing in derivative financial instruments for the purposes of increasing the income of the Fund, hedging against changes in the value of its portfolio securities and in the value of securities it intends to purchase, or hedging against a specific transaction with respect to either the currency in which the transaction is denominated or another currency. Investing in certain derivative financial instruments, including participation in the options, futures, or swap markets, entails certain execution, liquidity, hedging, tax, and securities, interest, credit, or currency market risks. Losses may arise if the Adviser’s prediction of movements in the direction of the securities, foreign currency, and interest rate markets is inaccurate. Losses may also arise if the counterparty does not perform its duties under a contract, or, in the event of default, the Fund may be delayed in or prevented from obtaining payments or other contractual remedies owed to it under derivative contracts. The creditworthiness of the counterparties is closely monitored in order to minimize these risks. Participation in derivative transactions involves investment risks, transaction costs, and potential losses to which the Fund would not be subject absent the use of these strategies. The consequences of these risks, transaction costs, and losses may have a negative impact on the Fund’s ability to pay distributions.
Collateral requirements differ by type of derivative. Collateral requirements are set by the broker or exchange clearing house for exchange traded derivatives, while collateral terms are contract specific for derivatives traded over-the-counter. Securities pledged to cover obligations of the Fund under derivative contracts are noted in the Schedule of Investments. Cash collateral, if any, pledged for the same purpose will be reported separately in the Statement of Assets and Liabilities.
The Fund’s policy with respect to offsetting is that, absent an event of default by the counterparty or a termination of the agreement, the master agreement does not result in an offset of reported amounts of financial assets and financial liabilities in the Statement of Assets and Liabilities across transactions between the Fund and the applicable counterparty. The enforceability of the right to offset may vary by jurisdiction.
The Fund’s derivative contracts held at December 31, 2021, if any, are not accounted for as hedging instruments under GAAP and are disclosed in the Schedule of Investments together with the related counterparty.
The Gabelli Global Rising Income and Dividend Fund
Notes to Financial Statements (Continued)
Forward Foreign Exchange Contracts. The Fund may engage in forward foreign exchange contracts for the purpose of hedging a specific transaction with respect to either the currency in which the transaction is denominated or another currency as deemed appropriate by the Adviser. Forward foreign exchange contracts are valued at the forward rate and are marked-to-market daily. The change in market value is included in unrealized appreciation/depreciation on investments and foreign currency translations. When the contract is closed, the Fund records a realized gain or loss equal to the difference between the value of the contract at the time it was opened and the value at the time it was closed.
The use of forward foreign exchange contracts does not eliminate fluctuations in the underlying prices of the Fund’s portfolio securities, but it does establish a rate of exchange that can be achieved in the future. Although forward foreign exchange contracts limit the risk of loss due to a decline in the value of the hedged currency, they also limit any potential gain that might result should the value of the currency increase. As of December 31, 2021, the Fund held no forward foreign exchange contracts.
Securities Sold Short. The Fund may enter into short sale transactions. Short selling involves selling securities that may or may not be owned and, at times, borrowing the same securities for delivery to the purchaser, with an obligation to replace such borrowed securities at a later date. The proceeds received from short sales are recorded as liabilities and the Fund records an unrealized gain or loss to the extent of the difference between the proceeds received and the value of an open short position on the day of determination. The Fund records a realized gain or loss when the short position is closed out. By entering into a short sale, the Fund bears the market risk of an unfavorable change in the price of the security sold short. Dividends on short sales are recorded as an expense by the Fund on the ex-dividend date and interest expense is recorded on the accrual basis. The broker retains collateral for the value of the open positions, which is adjusted periodically as the value of the position fluctuates. At December 31, 2021, there were no short sales outstanding.
Foreign Currency Translations. The books and records of the Fund are maintained in U.S. dollars. Foreign currencies, investments, and other assets and liabilities are translated into U.S. dollars at current exchange rates. Purchases and sales of investment securities, income, and expenses are translated at the exchange rate prevailing on the respective dates of such transactions. Unrealized gains and losses that result from changes in foreign exchange rates and/or changes in market prices of securities have been included in unrealized appreciation/depreciation on investments and foreign currency translations. Net realized foreign currency gains and losses resulting from changes in exchange rates include foreign currency gains and losses between trade date and settlement date on investment securities transactions, foreign currency transactions, and the difference between the amounts of interest and dividends recorded on the books of the Fund and the amounts actually received. The portion of foreign currency gains and losses related to fluctuation in exchange rates between the initial purchase trade date and subsequent sale trade date is included in realized gain/(loss) on investments.
Foreign Securities. The Fund may directly purchase securities of foreign issuers. Investing in securities of foreign issuers involves special risks not typically associated with investing in securities of U.S. issuers. The risks include possible revaluation of currencies, the inability to repatriate funds, less complete financial information about companies, and possible future adverse political and economic developments. Moreover, securities of many foreign issuers and their markets may be less liquid and their prices more volatile than securities of comparable U.S. issuers.
The Gabelli Global Rising Income and Dividend Fund
Notes to Financial Statements (Continued)
Foreign Taxes. The Fund may be subject to foreign taxes on income, gains on investments, or currency repatriation, a portion of which may be recoverable. The Fund will accrue such taxes and recoveries as applicable, based upon its current interpretation of tax rules and regulations that exist in the markets in which it invests.
Restricted Securities. The Fund may invest up to 15% of its net assets in securities for which the markets are restricted. Restricted securities include securities whose disposition is subject to substantial legal or contractual restrictions. The sale of restricted securities often requires more time and results in higher brokerage charges or dealer discounts and other selling expenses than does the sale of securities eligible for trading on national securities exchanges or in the over-the-counter markets. Restricted securities may sell at a price lower than similar securities that are not subject to restrictions on resale. Securities freely saleable among qualified institutional investors under special rules adopted by the SEC may be treated as liquid if they satisfy liquidity standards established by the Board. The continued liquidity of such securities is not as well assured as that of publicly traded securities, and accordingly the Board will monitor their liquidity. For the restricted securities the Fund held as of December 31, 2021, if any, refer to the Schedule of Investments.
Securities Transactions and Investment Income. Securities transactions are accounted for on the trade date with realized gain/(loss) on investments determined by using the identified cost method. Interest income (including amortization of premium and accretion of discount) is recorded on an accrual basis. Premiums and discounts on debt securities are amortized using the effective yield to maturity method or amortized to earliest call date, if applicable. Dividend income is recorded on the ex-dividend date, except for certain dividends from foreign securities that are recorded as soon after the ex-dividend date as the Fund becomes aware of such dividends.
Determination of Net Asset Value and Calculation of Expenses. Certain administrative expenses are common to, and allocated among, various affiliated funds. Such allocations are made on the basis of each fund’s average net assets or other criteria directly affecting the expenses as determined by the Adviser pursuant to procedures established by the Board.
In calculating the NAV per share of each class, investment income, realized and unrealized gains and losses, redemption fees, and expenses other than class specific expenses are allocated daily to each class of shares based upon the proportion of net assets of each class at the beginning of each day. Distribution expenses are borne solely by the class incurring the expense.
Distributions to Shareholders. Distributions to shareholders are recorded on the ex-dividend date. Distributions to shareholders are based on income and capital gains as determined in accordance with federal income tax regulations, which may differ from income and capital gains as determined under GAAP. These differences are primarily due to differing treatments of income and gains on various investment securities and foreign currency transactions held by the Fund, timing differences, and differing characterizations of distributions made by the Fund. Distributions from net investment income for federal income tax purposes include net realized gains on foreign currency transactions. These book/tax differences are either temporary or permanent in nature. To the extent these differences are permanent, adjustments are made to the appropriate capital accounts in the period when the differences arise. These reclassifications have no impact on the NAV of the Fund.
The Gabelli Global Rising Income and Dividend Fund
Notes to Financial Statements (Continued)
The tax character of distributions paid during the years ended December 31, 2021 and 2020 as follows:
| | | Year Ended
December 31, 2021 | | | Year Ended
December 31, 2020 | |
| Distributions paid from: | | | | | | | | |
| Ordinary income (inclusive of short term capital gains) | | $ | 869,291 | | | $ | 372,934 | |
| Net long term capital gains | | | 208,567 | | | | — | |
| Total distributions paid | | $ | 1,077,858 | | | $ | 372,934 | |
| | | | | | | | | |
Provision for Income Taxes. The Fund intends to continue to qualify as a regulated investment company under Subchapter M of the Internal Revenue Code of 1986, as amended (the Code). It is the policy of the Fund to comply with the requirements of the Code applicable to regulated investment companies and to distribute substantially all of its net investment company taxable income and net capital gains. Therefore, no provision for federal income taxes is required.
At December 31, 2021, the components of accumulated earnings/losses on a tax basis were as follows:
| Undistributed ordinary income | | $ | 4,589 | |
| Net unrealized appreciation on investments and foreign currency translations | | | 24,750,074 | |
| Total | | $ | 24,754,663 | |
The Fund utilized $1,296,991 of capital loss carryforwards during the year ended December 31, 2021.
At December 31, 2021, the temporary differences between book basis and tax basis net unrealized appreciation/ depreciation on investments were primarily due to deferral of losses from wash sales for tax purposes and mark-to-market adjustments on investments in passive foreign investment companies.
The following summarizes the tax cost of investments and the related net unrealized appreciation at December 31, 2021:
| | | Cost | | Gross
Unrealized
Appreciation | | Gross
Unrealized
Depreciation | | Net Unrealized
Appreciation |
| Investments | | $44,693,224 | | $27,583,923 | | $(2,835,915) | | $24,748,008 |
The Fund is required to evaluate tax positions taken or expected to be taken in the course of preparing the Fund’s tax returns to determine whether the tax positions are “more-likely-than-not” of being sustained by the applicable tax authority. Income tax and related interest and penalties would be recognized by the Fund as tax expense in the Statement of Operations if the tax positions were deemed not to meet the more-likely-than-not threshold. During the year ended December 31, 2021, the Fund did not incur any income tax, interest, or penalties. As of December 31, 2021, the Adviser has reviewed all open tax years and concluded that there was no impact to the Fund’s net assets or results of operations. The Fund’s federal and state tax returns for the prior three fiscal years remain open, subject to examination. On an ongoing basis, the Adviser will monitor the Fund’s tax positions to determine if adjustments to this conclusion are necessary.
3. Investment Advisory Agreement and Other Transactions. The Fund has entered into an investment advisory agreement (the Advisory Agreement) with the Adviser which provides that the Fund will pay the Adviser a fee, computed daily and paid monthly, at the annual rate of 1.00% of the value of its average daily net assets. In accordance with the Advisory Agreement, the Adviser provides a continuous investment program for
The Gabelli Global Rising Income and Dividend Fund
Notes to Financial Statements (Continued)
the Fund’s portfolio, oversees the administration of all aspects of the Fund’s business and affairs, and pays the compensation of all Officers and Directors of the Fund who are affiliated persons of the Adviser.
Effective December 1, 2019, the Adviser amended its contractual agreement with respect to each share class of the Fund to waive its investment advisory fees and/or to reimburse expenses to the extent necessary to maintain the annualized total operating expenses of the Fund (excluding brokerage costs, acquired fund fees and expenses, interest, taxes, and extraordinary expenses) until at least April 30, 2022, at no more than 0.90% of the value of the Fund’s average daily net assets for each share class of the Fund. During the year ended December 31, 2021, the Adviser reimbursed expenses in the amount of $311,048. In addition, the Fund has agreed, during the two year period following any waiver or reimbursement by the Adviser, to repay such amount to the extent, after giving effect to the repayment, such adjusted annualized total operating expenses of the Fund would not exceed 0.90% of the value of the Fund’s average daily net assets for each share class of the Fund. The agreement is renewable annually. At December 31, 2021, the cumulative amount which the Fund may repay the Adviser, subject to the terms above, is $606,903:
| For the year ended December 31, 2020, expiring December 31, 2022 | | | $ | 295,855 | |
| For the year ended December 31, 2021, expiring December 31, 2023 | | | | 311,048 | |
| | | | $ | 606,903 | |
4. Distribution Plan. The Fund’s Board has adopted a distribution plan (the Plan) for each class of shares, except for Class I Shares, pursuant to Rule 12b-1 under the 1940 Act. Under the Class AAA, Class A, and Class C Share Plans, payments are authorized to G.distributors, LLC (the Distributor), an affiliate of the Adviser, at annual rates of 0.25%, 0.25%, and 1.00%, respectively, of the average daily net assets of those classes, the annual limitations under each Plan. Such payments are accrued daily and paid monthly.
5. Portfolio Securities. Purchases and sales of securities during the year ended December 31, 2021, other than short term securities and U.S. Government obligations, aggregated $6,109,641 and $8,372,548, respectively.
6. Transactions with Affiliates and Other Arrangements. During the year ended December 31, 2021, the Fund paid brokerage commissions on security trades of $1,146 to G.research, LLC, an affiliate of the Adviser. Additionally, the Distributor retained a total of $74 from investors representing commissions (sales charges and underwriting fees) on sales and redemptions of Fund shares.
The Fund received credits from a designated broker who agreed to pay certain Fund operating expenses. The amount of such expenses paid through this directed brokerage arrangement during this period was $1,382.
The cost of calculating the Fund’s NAV per share is a Fund expense pursuant to the Advisory Agreement. Under the sub-administration agreement with Bank of New York Mellon, the fees paid include the cost of calculating the Fund’s NAV. The Fund reimburses the Adviser for this service. During the year ended December 31, 2021, the Fund accrued $45,000 in accounting fees in the Statement of Operations.
The Corporation pays retainer and per meeting fees to Directors not affiliated with the Adviser, plus specified amounts to the Lead Director and Audit Committee Chairman. Directors are also reimbursed for out of pocket expenses incurred in attending meetings. Directors who are directors or employees of the Adviser or an affiliated company receive no compensation or expense reimbursement from the Corporation.
7. Line of Credit. The Fund participates in an unsecured line of credit, which expires on March 2, 2022 and may be renewed annually, of up to $75,000,000 under which it may borrow up to 10% of its net assets from the
The Gabelli Global Rising Income and Dividend Fund
Notes to Financial Statements (Continued)
custodian for temporary borrowing purposes. Borrowings under this arrangement bear interest at a floating rate equal to the higher of the Overnight Federal Funds Rate plus 135 basis points or the Overnight Bank Funding Rate plus 135 basis points in effect on that day. This amount, if any, would be included in “Interest expense” in the Statement of Operations. During the year ended December 31, 2021, there were no borrowings under the line of credit.
8. Capital Stock. The Fund currently offers three classes of shares – Class AAA Shares, Class A Shares, and Class I Shares. Effective January 27, 2020 (the Effective Date), the Fund’s Class AAA, Class A and Class C Shares “closed to purchases from new investors”. “Closed to purchases from new investors” means (i) with respect to the Class AAA and Class A shares, no new investors may purchase shares of such classes, but existing shareholders may continue to purchase additional shares of such classes after the Effective Date, and (ii) with respect to Class C Shares, neither new investors nor existing shareholders may purchase any additional shares of such class after the Effective Date. These changes had no effect on existing shareholders’ ability to redeem shares of the Fund as described in the Fund’s Prospectus. Additionally, on the Effective Date Class I shares of the Fund became available to investors with a minimum initial investment amount of $1,000 when purchasing shares directly through the Distributor, or investors purchasing Class I shares through brokers or financial intermediaries that have entered into selling agreements with the Distributor specifically with respect to Class I shares.
The Fund imposes a redemption fee of 2.00% on all classes of shares that are redeemed or exchanged on or before the seventh day after the date of a purchase. The redemption fee is deducted from the proceeds otherwise payable to the redeeming shareholders and is retained by the Fund as an increase in paid-in capital. The redemption fees retained by the Fund during the years ended December 31, 2021 and 2020, if any, can be found in the Statement of Changes in Net Assets under Redemption Fees.
The Gabelli Global Rising Income and Dividend Fund
Notes to Financial Statements (Continued)
Transactions in shares of capital stock were as follows:
| | | Year Ended
December 31, 2021 | | | Year Ended
December 31, 2020 | |
| | | Shares | | | Amount | | | Shares | | | Amount | |
| Class AAA | | | | | | | | | | | | | | |
| Shares sold | | 626 | | | $ | 20,584 | | | 7,755 | | | $ | 203,820 | |
| Shares issued upon reinvestment of distributions | | 2,106 | | | | 72,245 | | | 1,134 | | | | 32,991 | |
| Shares redeemed | | (38,610 | ) | | | (1,240,256 | ) | | (67,890 | ) | | | (1,598,106 | ) |
| Net decrease | | (35,878 | ) | | $ | (1,147,427 | ) | | (59,001 | ) | | $ | (1,361,295 | ) |
| Class A | | | | | | | | | | | | | | |
| Shares sold | | 8,319 | | | $ | 272,444 | | | 1,570 | | | $ | 36,448 | |
| Shares issued upon reinvestment of distributions | | 469 | | | | 16,148 | | | 185 | | | | 5,383 | |
| Shares redeemed | | (3,997 | ) | | | (129,441 | ) | | (27,824 | ) | | | (665,867 | ) |
| Net increase/(decrease) | | 4,791 | | | $ | 159,151 | | | (26,069 | ) | | $ | (624,036 | ) |
| Class C | | | | | | | | | | | | | | |
| Shares sold | | — | | | | — | | | 1,836 | | | $ | 40,437 | |
| Shares issued upon reinvestment of distributions | | 424 | | | $ | 12,152 | | | 321 | | | | 7,808 | |
| Shares redeemed | | (17,658 | ) | | | (482,017 | ) | | (46,001 | ) | | | (894,053 | ) |
| Net decrease | | (17,234 | ) | | $ | (469,865 | ) | | (43,844 | ) | | $ | (845,808 | ) |
| Class I | | | | | | | | | | | | | | |
| Shares sold | | 187,993 | | | $ | 6,268,108 | | | 27,263 | | | $ | 666,547 | |
| Shares issued upon reinvestment of distributions | | 18,840 | | | | 649,051 | | | 7,134 | | | | 208,392 | |
| Shares redeemed | | (58,761 | ) | | | (1,920,271 | ) | | (60,877 | ) | | | (1,429,343 | ) |
| Net increase/(decrease) | | 148,072 | | | $ | 4,996,888 | | | (26,480 | ) | | $ | (554,404 | ) |
9. Significant Shareholder. As of December 31, 2021, approximately 78.4% of the Fund was beneficially owned by the Adviser and its affiliates, including managed accounts for which the affiliates of the Adviser have voting control but disclaim pecuniary interest.
10. Indemnifications. The Fund enters into contracts that contain a variety of indemnifications. The Fund’s maximum exposure under these arrangements is unknown. However, the Fund has not had prior claims or losses pursuant to these contracts. Management has reviewed the Fund’s existing contracts and expects the risk of loss to be remote.
11. Subsequent Events. Management has evaluated the impact on the Fund of all subsequent events occurring through the date the financial statements were issued and has determined that there were no subsequent events requiring recognition or disclosure in the financial statements.
The Gabelli Global Rising Income and Dividend Fund
Report of Independent Registered Public Accounting Firm
To the Shareholders of The Gabelli Global Rising Income and Dividend Fund
and the Board of Directors of GAMCO Global Series Funds, Inc.
Opinion on the Financial Statements
We have audited the accompanying statement of assets and liabilities of The Gabelli Global Rising Income and Dividend Fund (the “Fund”) (one of the funds constituting GAMCO Global Series Funds, Inc. (the “Corporation”)), including the schedule of investments, as of December 31, 2021, and the related statement of operations for the year then ended, the statements of changes in net assets for each of the two years in the period then ended, the financial highlights for each of the five years in the period then ended and the related notes (collectively referred to as the “financial statements”). In our opinion, the financial statements present fairly, in all material respects, the financial position of the Fund (one of the funds constituting GAMCO Global Series Funds, Inc.) at December 31, 2021, the results of its operations for the year then ended, the changes in its net assets for each of the two years in the period then ended and its financial highlights for each of the five years in the period then ended, in conformity with U.S. generally accepted accounting principles.
Basis for Opinion
These financial statements are the responsibility of the Corporation’s management. Our responsibility is to express an opinion on the Fund’s financial statements based on our audits. We are a public accounting firm registered with the Public Company Accounting Oversight Board (United States) (“PCAOB”) and are required to be independent with respect to the Corporation in accordance with the U.S. federal securities laws and the applicable rules and regulations of the Securities and Exchange Commission and the PCAOB.
We conducted our audits in accordance with the standards of the PCAOB. Those standards require that we plan and perform the audit to obtain reasonable assurance about whether the financial statements are free of material misstatement, whether due to error or fraud. The Corporation is not required to have, nor were we engaged to perform, an audit of the Corporation’s internal control over financial reporting. As part of our audits we are required to obtain an understanding of internal control over financial reporting but not for the purpose of expressing an opinion on the effectiveness of the Corporation’s internal control over financial reporting. Accordingly, we express no such opinion.
Our audits included performing procedures to assess the risks of material misstatement of the financial statements, whether due to error or fraud, and performing procedures that respond to those risks. Such procedures included examining, on a test basis, evidence regarding the amounts and disclosures in the financial statements. Our procedures included confirmation of securities owned as of December 31, 2021, by correspondence with the custodian. Our audits also included evaluating the accounting principles used and significant estimates made by management, as well as evaluating the overall presentation of the financial statements. We believe that our audits provide a reasonable basis for our opinion.

We have served as the auditor of one or more Gabelli/GAMCO Funds investment companies since 1992.
Philadelphia, Pennsylvania
February 28, 2022
The Gabelli Global Rising Income and Dividend Fund
Liquidity Risk Management Program (Unaudited)
In accordance with Rule 22e-4 under the 1940 Act, the Fund has established a liquidity risk management program (the LRM Program) to govern its approach to managing liquidity risk. The LRM Program is administered by the Liquidity Committee (the Committee), which is comprised of members of Gabelli Funds, LLC management. The Board has designated the Committee to administer the LRM Program.
The LRM Program’s principal objectives include supporting the Fund’s compliance with limits on investments in illiquid assets and mitigating the risk that the Fund will be unable to meet its redemption obligations in a timely manner. The LRM Program also includes elements that support the management and assessment of liquidity risk, including an annual assessment of factors that influence the Fund’s liquidity and the monthly classification and re-classification of certain investments that reflect the Committee’s assessment of their relative liquidity under current market conditions.
At a meeting of the Board held on May 12, 2021, the Board received a written report from the Committee regarding the design and operational effectiveness of the LRM Program. The Committee determined, and reported to the Board, that the LRM Program is reasonably designed to assess and manage the Fund’s liquidity risk and has operated adequately and effectively since its implementation. The Committee reported that there were no liquidity events that impacted the Fund or its ability to timely meet redemptions without dilution to existing shareholders. The Committee noted that the Fund is primarily invested in highly liquid securities and, accordingly, continues to be exempt from the requirement to determine a “highly liquid investment minimum” as defined in the Rule 22e-4. Because of that continued qualification for the exemption, the Fund has not adopted a “highly liquid investment minimum” amount. The Committee further noted that while changes to the LRM Program were made during the Review Period and reported to the Board, no material changes were made to the LRM Program as a result of the Committee’s annual review.
There can be no assurance that the LRM Program will achieve its objectives in the future. Please refer to the Fund’s Prospectus for more information regarding its exposure to liquidity risk and other principal risks to which an investment in the Fund may be subject.
The Gabelli Global Rising Income and Dividend Fund
Board Consideration and Re-Approval of Investment Advisory Agreement (Unaudited)
At its meeting on November 11, 2021, the Board of Directors of the Corporation approved the continuation of the investment advisory agreement with the Adviser for the Fund on the basis of the recommendation by the directors (the Independent Board Members) who are not interested persons of the Fund. The following paragraphs summarize the material information and factors considered by the Independent Board Members as well as their conclusions relative to such factors.
Nature, Extent, and Quality of Services. The Independent Board Members considered information regarding the portfolio managers, the depth of the analyst pool available to the Adviser and the Fund’s portfolio managers, the scope of supervisory, administrative, shareholder and other services supervised or provided by the Adviser and the absence of significant service problems reported to the Board. The Independent Board Members noted the experience, length of service, and reputation of the Fund’s portfolio managers.
Investment Performance. The Independent Board Members reviewed the short, medium, and long term performance of the Fund (as of September 30, 2021) against a peer group of seven other comparable funds prepared by the Adviser (the “Adviser Peer Group”), and against a peer group prepared by Broadridge (the “Broadridge Performance Peer Group”) consisting of all retail and institutional global equity income funds, regardless of asset size or primary channel of distribution, as represented by the Lipper Global Equity Income Fund Index. The Independent Board Members noted that the Fund’s performance was in the first (highest) quartile for the one year period and in the fourth quartile for the three, five, and ten year periods, as measured against the Adviser Peer Group. Against the Broadridge Performance Peer Group, the Independent Board Members noted that the Fund’s performance was in the first quintile for the one year period, in the second quintile for the three and five year periods, and in the fourth quintile for the ten year period. The Independent Board Members discussed the peer groups in relation to the Fund’s shift in strategy several years ago.
Profitability. The Independent Board Members reviewed summary data regarding the profitability of the Fund to the Adviser both with a pro rata administrative overhead charge and with a standalone administrative charge and noted the effect of the expense limitation agreement. The Independent Board Members also noted that a portion of the Fund’s portfolio transactions were executed by an affiliated broker of the Adviser and that another affiliated broker of the Adviser received distribution fees and minor amounts of sales commissions.
Economies of Scale. The Independent Board Members discussed the major elements of the Adviser’s cost structure and the relationship of those elements to potential economies of scale and reviewed data provided by the Adviser.
Sharing of Economies of Scale. The Independent Board Members noted that the investment management fee schedule for the Fund does not take into account any potential economies of scale that may develop.
Service and Cost Comparisons. The Independent Board Members compared the expense ratios of the investment management fee, other expenses, and total expenses of the Fund with similar expense ratios of the Adviser Peer Group and a peer group of eight other global equity income funds selected by Broadridge (the “Broadridge Expense Peer Group”), and noted that the Adviser’s management fee includes substantially all administrative services of the Fund as well as investment advisory services. The Independent Board Members noted the effect of the expense limitation agreement in place for the Fund. The Independent Board Members noted that the Fund’s total expense ratio was the third lowest for the Adviser Peer Group and the second lowest for the Broadridge Expense Peer Group and that the Fund’s size was significantly lower than the average of the
The Gabelli Global Rising Income and Dividend Fund
Board Consideration and Re-Approval of Investment Advisory Agreement (Unaudited) (Continued)
Adviser Peer Group, and lower than the average of the Broadridge Expense Peer Group. The Independent Board Members also noted that the advisory fee structure was the same as that in effect for most of the Gabelli funds. The Independent Board Members were presented with, but did not consider to be material to their decision, various information comparing the advisory fee with the fee for other types of accounts managed by the Adviser.
Conclusions. The Independent Board Members concluded that the Fund enjoyed highly experienced portfolio management services and good ancillary services. The Independent Board Members noted the reasons for the Fund’s historical underperformance and the recent improvement in performance. The Independent Board Members also concluded that the Fund’s expense ratios and profitability to the Adviser were reasonable, and that economies of scale were not a significant factor in their thinking at this time. In this regard, the Independent Board Members noted the contractual Expense Deferral Agreement between the Adviser and the Corporation, on behalf of each Fund, pursuant to which the net expense ratio for each share class of each Fund was reduced to 0.90%. The Independent Board Members did not view the potential profitability of ancillary services as material to their decision. On the basis of the foregoing and without assigning particular weight to any single conclusion, the Independent Board Members determined to recommend continuation of the investment management agreement to the full Board.
Based on a consideration of all these factors in their totality, the Board Members, including all of the Independent Board Members, determined that the Fund’s advisory fee was appropriate in light of the quality of services provided and in light of the other factors described above that the Board deemed relevant. Accordingly, the Board Members determined to approve the continuation of the Fund’s Advisory Agreement. The Board Members based their decision on evaluations of all these factors as a whole and did not consider any one factor as all important or controlling.
The Gabelli Global Rising Income and Dividend Fund
Additional Fund Information (Unaudited)
The business and affairs of the Fund are managed under the direction of the Fund’s Board of Directors. Information pertaining to the Directors and Officers of the Fund is set forth below. The Corporation’s Statement of Additional Information includes additional information about the Fund’s Directors and is available without charge, upon request, by calling 800-GABELLI (800-422-3554) or by writing to The Gabelli Global Rising Income and Dividend Fund at One Corporate Center, Rye, NY 10580-1422.
Name, Position(s)
Address1
and Age | | Term of Office
and
Length of
Time Served2 | | Number of
Funds
in Fund
Complex
Overseen
by Director | | Principal Occupation(s)
During Past Five Years | | Other Directorships
Held by Director3 |
| INTERESTED DIRECTORS4: |
| | | | | | | | | |
Mario J. Gabelli, CFA
Director and Chief
Investment Officer
Age: 79 | | Since 1993 | | 31 | | Chairman, Chief Executive Officer, and Chief Investment Officer– Value Portfolios of GAMCO Investors, Inc. and Chief Investment Officer – Value Portfolios of Gabelli Funds, LLC and GAMCO Asset Management, Inc.; Director/Trustee or Chief Investment Officer of other registered investment companies within the Fund Complex; Chief Executive Officer of GGCP, Inc.; Executive Chairman of Associated Capital Group, Inc. | | Director of Morgan Group Holdings, Inc. (holding company); Chairman of the Board and Chief Executive Officer of LICT Corp. (multimedia and communication services company); Director of CIBL, Inc. (broadcasting and wireless communications); Director of ICTC Group Inc. (communications) (2013-2018) |
| | | | | | | | | |
John D. Gabelli
Director
Age: 77 | | Since 1993 | | 12 | | Former Senior Vice President of G.research, LLC | | — |
| | | | | | | | | |
| INDEPENDENT DIRECTORS5: |
E. Val Cerutti
Director
Age: 82 | | Since 2001 | | 7 | | Chief Executive Officer of Cerutti Consultants, Inc. | | Director of The LGL Group, Inc. (diversified manufacturing) (1990-2009) |
| | | | | | | | | |
Anthony J. Colavita6
Director
Age: 86 | | Since 1993 | | 18 | | President of the law firm of Anthony J. Colavita, P.C | | — |
| | | | | | | | | |
Werner J. Roeder
Director
Age: 81 | | Since 1993 | | 20 | | Retired physician; Former Vice President of Medical Affairs (Medical Director) of New York Presbyterian/Lawrence Hospital (1999-2014) | | — |
| | | | | | | | | |
Anthonie C. van Ekris6
Director
Age: 87 | | Since 1993 | | 23 | | Chairman and Chief Executive Officer of BALMAC International, Inc. (global import/ export company) | | — |
The Gabelli Global Rising Income and Dividend Fund
Additional Fund Information (Continued) (Unaudited)
Name, Position(s)
Address1
and Age | | Term of Office
and
Length of
Time Served2 | | Number of
Funds
in Fund
Complex
Overseen
by Director | | Principal Occupation(s)
During Past Five Years | | Other Directorships
Held by Director3 |
Salvatore J. Zizza7
Director
Age: 76 | | Since 2004 | | 32 | | President of Zizza & Associates Corp. (private holding company); Chairman of Bergen Cove Realty Inc. (residential real estate) | | Director and Chairman of Trans-Lux Corporation (business services); Director and Chairman of Harbor Diversified Inc. (pharmaceuticals) (2009-2018); Retired Chairman of BAM (semiconductor and aerospace manufacturing) |
The Gabelli Global Rising Income and Dividend Fund
Additional Fund Information (Continued) (Unaudited)
Name, Position(s)
Address1
and Age | | Term of Office
and Length of
Time Served2 | | Principal Occupation(s)
During Past Five Years |
| OFFICERS: |
Bruce N. Alpert
President
Age: 70 | | Since 1993 | | Executive Vice President and Chief Operating Officer of Gabelli Funds, LLC since 1988; Officer of registered investment companies within the Fund Complex; Senior Vice President of GAMCO Investors, Inc. since 2008; Vice President – Mutual Funds, G.research, LLC |
| | | | | |
John C. Ball
Treasurer
Age: 45 | | Since 2017 | | Treasurer of registered investment companies within the Fund Complex since 2017; Vice President and Assistant Treasurer of AMG Funds, 2014-2017; Chief Executive Officer, G.distributors, LLC since December 2020 |
| | | | | |
Peter Goldstein
Secretary and Vice
President
Age: 68 | | Since 2020 | | General Counsel, Gabelli Funds, LLC since July 2020; General Counsel and Chief Compliance Officer, Buckingham Capital Management, Inc. (2012-2020); Chief Legal Officer and Chief Compliance Officer, The Buckingham Research Group, Inc. (2012-2020) |
| | | | | |
Richard J. Walz
Chief Compliance
Officer
Age: 62 | | Since 2013 | | Chief Compliance Officer of registered investment companies within the Fund Complex since 2013; Chief Compliance Officer for Gabelli Funds, LLC since 2015 |
| | | | | |
Daniel Plourde
Vice President
Age: 41 | | Since 2021 | | Vice President of registered investment companies within the Fund Complex since 2021; Assistant Treasurer of the North American SPDR ETFs and State Street Global Advisors Mutual Funds (2017-2021); Fund Administration at State Street Bank (2009-2017) |
| 1 | Address: One Corporate Center, Rye, NY 10580-1422, unless otherwise noted. |
| 2 | Each Director will hold office for an indefinite term until the earliest of (i) the next meeting of shareholders, if any, called for the purpose of considering the election or re-election of such Director and until the election and qualification of his or her successor, if any, elected at such meeting, or (ii) the date a Director resigns or retires, or a Director is removed by the Board of Directors or shareholders, in accordance with the Corporation’s By-Laws and Articles of Incorporation. For officers, includes time served in prior officer positions with the Fund. Each officer will hold office for an indefinite term until the date he or she resigns or retires or until his or her successor is elected and qualified. |
| 3 | This column includes only directorships of companies required to report to the SEC under the Securities Exchange Act of 1934, as amended, i.e., public companies, or other investment companies registered under the 1940 Act. |
| 4 | “Interested person” of the Corporation as defined in the 1940 Act. Messrs. Mario J. Gabelli and John D. Gabelli, who are brothers, are each considered an “interested person” because of their affiliation with Gabelli Funds, LLC which acts as the Corporation’s investment adviser. |
| 5 | Directors who are not interested persons are considered “Independent” Directors. |
| 6 | Mr. Colavita’s son, Anthony S. Colavita, serves as a director of other funds in the Gabelli Fund Complex. Mr. van Ekris is an independent director of Gabelli International Ltd., Gabelli Fund LDC, GAMA Capital Opportunities Master Ltd., and GAMCO International SICAV, which may be deemed to be controlled by Mario J. Gabelli and/or affiliates and, in that event, would be deemed to be under common control with the Fund’s Adviser. |
| 7 | Mr. Zizza is an independent director of Gabelli International Ltd., which may be deemed to be controlled by Mario J. Gabelli and/or affiliates and in that event would be deemed to be under common control with the Fund’s Adviser. On September 9, 2015, Mr. Zizza entered into a settlement with the SEC to resolve an inquiry relating to an alleged violation regarding the making of false statements or omissions to the accountants of a company concerning a related party transaction. The company in question is not an affiliate of, nor has any connection to, the Fund. Under the terms of the settlement, Mr. Zizza, without admitting or denying the SEC’s findings and allegation, paid $150,000 and agreed to cease and desist committing or causing any future violations of Rule 13b2-2 of the Securities Exchange Act of 1934, as amended. The Board has discussed this matter and has determined that it does not disqualify Mr. Zizza from serving as an Independent Director. |
The Gabelli Global Rising Income and Dividend Fund
2021 TAX NOTICE TO SHAREHOLDERS (Unaudited)
During the year ended December 31, 2021, the Fund paid ordinary income distributions of $0.4390 per share (comprised of net investment income and short term capital gains) to shareholders in each Class of shares and long term capital gains of $208,567, or the maximum allowable. The distribution of long term capital gains has been designated as a capital gain dividend by the Fund’s Board of Directors. For the year ended December 31, 2021, 37.68% of the ordinary income distribution qualifies for the dividends received deduction available to corporations. The Fund designates 100% of the ordinary income distribution as qualified dividend income pursuant to the Jobs and Growth Tax Relief Reconciliation Act of 2003. The Fund designates 100% of the ordinary income distribution as qualified short term gain pursuant to the American Jobs Creation Act of 2004. The Fund designates 0.05% of the ordinary income distribution as qualified interest income pursuant to the Tax Relief, Unemployment Reauthorization, and Job Creation Act of 2010. Also during 2021, the Fund passed through foreign tax credits of $0.04668 per share to each Class of shares.
U.S. Government Income:
The percentage of the ordinary income distribution paid by the Fund during the year ended December 31, 2021 which was derived from U.S. Treasury securities was 0.03%. Such income is exempt from state and local tax in all states. However, many states, including New York and California, allow a tax exemption for a portion of the income earned only if a mutual fund has invested at least 50% of its assets at the end of each quarter of the Fund’s fiscal year in U.S. Government securities. The Fund did not meet this strict requirement in 2022. The percentage of U.S. Government securities held as of December 31, 2021 was 9.36%. Due to the diversity in state and local tax law, it is recommended that you consult your personal tax adviser as to the applicability of the information provided to your specific situation.
All designations are based on financial information available as of the date of this annual report and, accordingly, are subject to change. For each item, it is the intention of the Fund to designate the maximum amount permitted under the Internal Revenue Code and the regulations thereunder.
THE GABELLI GLOBAL RISING INCOME AND DIVIDEND FUND
One Corporate Center
Rye, NY 10580-1422
Portfolio Manager Biography
Mario J. Gabelli, CFA, is Chairman, Chief Executive Officer, and Chief Investment Officer - Value Portfolios of GAMCO Investors, Inc. that he founded in 1977, and Chief Investment Officer - Value Portfolios of Gabelli Funds, LLC and GAMCO Asset Management Inc. He is also Executive Chairman of Associated Capital Group, Inc. Mr. Gabelli is a summa cum laude graduate of Fordham University and holds an MBA degree from Columbia Business School and Honorary Doctorates from Fordham University and Roger Williams University.
| We have separated the portfolio manager’s commentary from the financial statements and investment portfolio due to corporate governance regulations stipulated by the Sarbanes-Oxley Act of 2002. We have done this to ensure that the contents of the portfolio manager’s commentary are unrestricted. Both the commentary and the financial statements, including the portfolios of investments, will be available on our website at www.gabelli.com. |
GAMCO Global Series Funds, Inc.
THE GABELLI GLOBAL RISING INCOME
AND DIVIDEND FUND
One Corporate Center
Rye, New York 10580-1422
| t | 800-GABELLI (800-422-3554) |
GABELLI.COM
Net Asset Values per share available daily by calling 800-GABELLI after 7:00 P.M.
DIRECTORS Mario J. Gabelli, CFA Chairman and Chief Executive Officer, GAMCO Investors, Inc. Executive Chairman, Associated Capital Group Inc. E. Val Cerutti Chief Executive Officer, Cerutti Consultants, Inc. Anthony J. Colavita Attorney, Anthony J. Colavita, P.C. John D. Gabelli Former Senior Vice President, G.research, LLC Werner J. Roeder Former Medical Director, Lawrence Hospital Anthonie C. van Ekris Chairman, BALMAC International, Inc. Salvatore J. Zizza Chairman, Zizza & Associates Corp. | | OFFICERS Bruce N. Alpert President John C. Ball Treasurer Peter Goldstein Secretary and Vice President Richard J. Walz Chief Compliance Officer Daniel Plourde Vice President DISTRIBUTOR G.distributors, LLC CUSTODIAN State Street Bank and Trust Company TRANSFER AGENT, AND DIVIDEND DISBURSING AGENT DST Asset Manager Solutions, Inc. LEGAL COUNSEL Skadden, Arps, Slate, Meagher & Flom LLP |
This report is submitted for the general information of the shareholders of The Gabelli Global Rising Income and Dividend Fund. It is not authorized for distribution to prospective investors unless preceded or accompanied by an effective prospectus.
GAB441Q421AR
The Gabelli International Small Cap Fund
Annual Report — December 31, 2021
(Y)our Portfolio Management Team
| | | | | |
| |  |  |  | |
| | Caesar M. P. Bryan | Gustavo Pifano | Ashish Sinha | |
| | Portfolio Manager | Portfolio Manager | Portfolio Manager | |
To Our Shareholders,
For the year ended December 31, 2021, the net asset value (NAV) total return per Class AAA Share of The Gabelli International Small Cap Fund was 4.2% compared with a total return of 10.1% for the Morgan Stanley Capital International (MSCI) Europe, Australasia and Far East (EAFE) Small Cap Index. Other classes of shares are available. See page 4 for performance information for all classes.
Enclosed are the financial statements, including the schedule of investments, as of December 31, 2021.
Investment Objective and Strategy (Unaudited)
The Fund’s objective is to provide investors with appreciation of capital. Current income is a secondary objective of the Fund.
The Fund’s investment strategy is to invest primarily in a portfolio of common stocks of non-U.S. companies. Under normal market conditions, the Fund will invest at least 80% of its net assets in the stocks of “small cap companies.” Gabelli Funds, LLC, the Adviser, currently characterizes small capitalization companies as those with total common stock market values of $3 billion or less at the time of investment.
The Fund may invest in non-U.S. markets throughout the world, including emerging markets. Ordinarily, the Fund will invest in the securities of at least five countries outside the U.S.
| As permitted by regulations adopted by the Securities and Exchange Commission, paper copies of the Fund’s annual and semiannual shareholder reports will no longer be sent by mail, unless you specifically request paper copies of the reports. Instead, the reports will be made available on the Fund’s website (www.gabelli.com), and you will be notified by mail each time a report is posted and provided with a website link to access the report. If you already elected to receive shareholder reports electronically, you will not be affected by this change and you need not take any action. To elect to receive all future reports on paper free of charge, please contact your financial intermediary, or, if you invest directly with the Fund, you may call 800-422-3554 or send an email request to info@gabelli.com. |
In selecting investments, the Adviser seeks issuers with a dominant market share or niche franchise in growing and/or consolidating industries. The Adviser considers for purchase the stocks of small capitalization companies with experienced management, strong balance sheets, and rising free cash flow and earnings. The Adviser’s goal is to invest long term in the stocks of companies trading at reasonable market valuations relative to perceived economic worth.
Performance Discussion (Unaudited)
The top three contributors to performance for the first quarter 2021 were all UK listed gaming companies. These businesses have benefitted from surging online gaming revenues, deregulation in the U.S., and other markets and takeover activity. The top contributor was Gamesys which appreciated by 71.2%. It is a pure online gaming company with some well known brands such as Jackpotjoy. In March, the company agreed to be acquired by Bally’s, the U.S. gaming company. Some of our Japanese and gold holdings disappointed during the quarter. In Japan, MedPeer fell by 25.1% and was the biggest detractor to performance. The company gave up about half of its very strong performance in the fourth quarter of last year. Maruwa, was also a significant detractor and declined by 17.7%. Both these companies suffered as market sentiment shifted in favor of value stocks and away from growth companies during the quarter.
The top contributor to performance during the second quarter was Addlife, a Swedish based life sciences company. Its share price appreciated by 71.9% which contributed 1.4% to total return and ended the quarter as the largest Fund holding. All of the top ten contributors to performance were European based with the exception of Canadian based Labrador Iron Ore Royalty Company which appreciated by 33.6%. Labrador has an ownership stake in and a significant royalty over production from a large, long life iron ore mine that is majority owned and operated by Rio Tinto, one of the world’s largest mining companies.
The top contributor to performance during the third quarter of 2021 was Bachem, a Swiss based company that manufactures peptides and amino acids for the pharmaceutical industry and for research laboratories. Its stock price appreciated by 29.3% and contributed 0.75% to the Fund’s total return. The Fund’s top price gainer was Stock Spirits which was subject of a takeover bid in August 2021 from CVC Advisors which is a private equity firm. The leading contributor to performance during the fourth quarter was AddLife, the Fund's largest holding.
The company continued its strong recent performance and appreciated by 14.7% which contributed 67 basis points to performance. The second top performer was Interparfums which appreciated by 32.3% and contributed 58 basis points to performance. Other leading contributors were Treatt, PSI Software and Hotel Chocolat. The shares of all these companies appreciated in excess of 20.0%. Three of our gaming and gaming related holdings disappointed during the quarter. These included Entain, PSI Software, 888 Holdings and Genius Sports, the biggest detractor to performance during the quarter.
Selected holdings that contributed positively to performance in 2021 were: Bachem Holding AG (3.7% of net assets as of December 31, 2021) is a leading manufacturer and supplier of peptides and oligonucleotides based APIs to pharma including generics and research organizations; Addlife AB (4.8%) operates within the Nordic life sciences sector. The company primarily focuses on selected niches in the market areas of diagnostics, medical technology, and biomedical research and laboratory analysis; and PSI Software AG (3.0%) develops software for utilities, infrastructure players and industry. Their energy management software is used by customers in power and gas grids for grid management, energy trading, public transportation and road management and airport baggage and cargo logistics.
Some of our weaker performing holdings during the year were: Medpeer Inc. (0.7%) provides social network services to medical professionals in Japan; boohoo Group plc (0.5%), through its subsidiaries, operates as an online fashion retailer in the United Kingdom, rest of Europe, the United States, and internationally; and Genius
Sports Ltd. (0.6%) is a London based sports data and streaming business. The company sells real time sports data to sports books and sport platform providers.
Thank you for your investment in The Gabelli International Small Cap Fund.
We appreciate your confidence and trust.
Comparative Results
Average Annual Returns through December 31, 2021 (a) (Unaudited)
Total returns and average annual returns reflect changes in share price, reinvestment of distributions, and are net of expenses.
| | | 1 Year | | 5 Year | | 10 Year | | 15 Year | | Since Inception (5/11/98) |
| Class AAA (GABOX) | | 4.16 | % | | 9.64 | % | | 8.06 | % | | 5.24 | % | | 6.83 | % |
| MSCI EAFE Small Cap Index | | 10.10 | | | 11.04 | | | 10.80 | | | 5.58 | | | 8.41 | (b) |
| MSCI AC World Ex-US Index | | 8.27 | | | 10.15 | | | 7.83 | | | 4.30 | | | 5.87 | |
| Lipper Global Large-Cap Growth Fund Classification | | 15.15 | | | 18.57 | | | 13.99 | | | 8.64 | | | N/A | |
| Class A (GOCAX) | | 4.24 | | | 9.17 | | | 7.82 | | | 5.09 | | | 6.74 | |
| With sales charge (c) | | (1.76 | ) | | 7.89 | | | 7.18 | | | 4.67 | | | 6.47 | |
| Class C (GGLCX) | | 4.20 | | | 8.69 | | | 7.23 | | | 4.42 | | | 6.29 | |
| With contingent deferred sales charge (d) | | 3.20 | | | 8.69 | | | 7.23 | | | 4.42 | | | 6.29 | |
| Class I (GLOIX) | | 4.18 | | | 9.80 | | | 8.39 | | | 5.53 | | | 7.02 | |
| (a) | Returns would have been lower had the Adviser not reimbursed certain expenses of the Fund. The Class AAA Share NAVs are used to calculate performance for the periods prior to the issuance of Class A Shares, Class C Shares, and Class I Shares on March 12, 2000, November 23, 2001, and January 11, 2008, respectively. The actual performance of the Class A Shares and Class C Shares would have been lower due to the additional fees and expenses associated with these classes of shares. The actual performance of the Class I Shares would have been higher due to lower expenses related to this class of shares. The Fund imposes a 2% redemption fee on shares sold or exchanged within seven days of purchase. |
| (b) | The MSCI EAFE Small Cap Index captures small cap representation across Developed Markets countries around the world, excluding U.S. and Canada. The MSCI World Ex-U.S. Index captures large and mid cap representation across Developed Markets countries excluding the United States. The Lipper Global Large-Cap Growth Fund Classification reflects the average performance of mutual funds classified in that particular category. Dividends are considered reinvested. You cannot invest directly in an index. MSCI EAFE Small Cap Index performance as of inception of Index December 31, 1998. |
| (c) | Performance results include the effect of the maximum 5.75% sales charge at the beginning of the period. |
| (d) | Assuming payment of the 1% maximum contingent deferred sales charge imposed on redemptions made within one year of purchase. No existing C Class shares are currently subject to the CDSC as of the date of this report. |
In the current prospectuses dated April 30, 2021, the gross expense ratios for Class AAA, A, C, and I Shares are 3.65%, 3.65%, 4.40%, and 3.40%, respectively, and the net expense ratios for all share classes after contractual reimbursements by Gabelli Funds, LLC, (the Adviser) is 0.91%. See page 12 for the expense ratios for the year ended December 31, 2021. The contractual reimbursements are in effect through April 30, 2022. Class AAA and Class I Shares do not have a sales charge. The maximum sales charge for Class A Shares and Class C Shares is 5.75% and 1.00%, respectively.
Investing in foreign securities involves risks not ordinarily associated with investments in domestic issues, including currency fluctuation, economic, and political risks. Investors should carefully consider the investment objectives, risks, charges, and expenses of the Fund before investing. The prospectus contains information about these and other matters and should be read carefully before investing. To obtain a prospectus, please visit our website at www.gabelli.com.
Returns represent past performance and do not guarantee future results. Investment returns and the principal value of an investment will fluctuate. When shares are redeemed, they may be worth more or less than their original cost. Current performance may be lower or higher than the performance data presented. Visit www.gabelli.com for performance information as of the most recent month end.
COMPARISON OF CHANGE IN VALUE OF A $10,000 INVESTMENT IN
THE GABELLI INTERNATIONAL SMALL CAP FUND (CLASS AAA SHARES) AND MSCI EAFE SMALL CAP INDEX (Unaudited)
| Average Annual Total Returns* |
| | 1 Year | 5 Year | 10 Year |
| Class AAA | 4.16% | 9.64% | 8.06% |
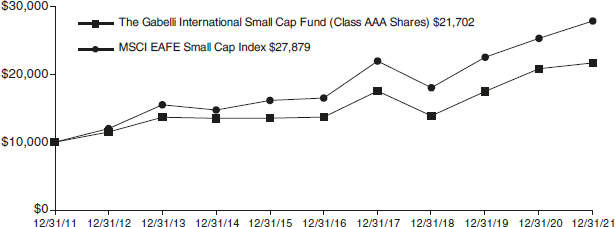
* Past performance is not predictive of future results. The performance tables and graph do not reflect the deduction of taxes that a shareholder would pay on Fund distributions or the redemption of Fund shares.
| The Gabelli International Small Cap Fund | |
| Disclosure of Fund Expenses (Unaudited) | |
| For the Six Month Period from July 1, 2021 through December 31, 2021 | Expense Table |
We believe it is important for you to understand the impact of fees and expenses regarding your investment. All mutual funds have operating expenses. As a shareholder of a fund, you incur ongoing costs, which include costs for portfolio management, administrative services, and shareholder reports (like this one), among others. Operating expenses, which are deducted from a fund’s gross income, directly reduce the investment return of a fund. When a fund’s expenses are expressed as a percentage of its average net assets, this figure is known as the expense ratio. The following examples are intended to help you understand the ongoing costs (in dollars) of investing in your Fund and to compare these costs with those of other mutual funds. The examples are based on an investment of $1,000 made at the beginning of the period shown and held for the entire period.
The Expense Table below illustrates your Fund’s costs in two ways:
Actual Fund Return: This section provides information about actual account values and actual expenses. You may use this section to help you to estimate the actual expenses that you paid over the period after any fee waivers and expense reimbursements. The “Ending Account Value” shown is derived from the Fund’s actual return during the past six months, and the “Expenses Paid During Period” shows the dollar amount that would have been paid by an investor who started with $1,000 in the Fund. You may use this information, together with the amount you invested, to estimate the expenses that you paid over the period.
To do so, simply divide your account value by $1,000 (for example, an $8,600 account value divided by $1,000 = 8.6), then multiply the result by the number given for your Fund under the heading “Expenses Paid During Period” to estimate the expenses you paid during this period.
Hypothetical 5% Return: This section provides information about hypothetical account values and hypothetical expenses based on the Fund’s actual expense ratio. It assumes a hypothetical annualized return of 5% before expenses during the period shown. In this case – because the hypothetical return used is not the Fund’s actual return – the results do not apply to your investment and you cannot use the hypothetical account value and expense to estimate the actual ending account balance or expenses you
paid for the period. This example is useful in making comparisons of the ongoing costs of investing in the Fund and other funds. To do so, compare this 5% hypothetical example with the 5% hypothetical examples that appear in shareholder reports of other funds.
Please note that the expenses shown in the table are meant to highlight your ongoing costs only and do not reflect any transactional costs such as sales charges (loads), redemption fees, or exchange fees, if any, which are described in the Prospectus. If these costs were applied to your account, your costs would be higher. Therefore, the 5% hypothetical return is useful in comparing ongoing costs only, and will not help you determine the relative total costs of owning different funds. The “Annualized Expense Ratio” represents the actual expenses for the last six months and may be different from the expense ratio in the Financial Highlights which is for the year ended December 31, 2021.
| | | Beginning Account Value 07/01/21 | | | Ending Account Value 12/31/21 | | | Annualized Expense Ratio | | Expenses Paid During Period * | |
| The Gabelli International Small Cap Fund | | | | |
| Actual Fund Return | | | | | | | | | | |
| Class AAA | | $1,000.00 | | | $982.40 | | | 0.91 | % | | $ | 4.55 | |
| Class A | | $1,000.00 | | | $983.00 | | | 0.91 | % | | $ | 4.55 | |
| Class C | | $1,000.00 | | | $983.10 | | | 0.91 | % | | $ | 4.55 | |
| Class I | | $1,000.00 | | | $982.90 | | | 0.91 | % | | $ | 4.55 | |
| Hypothetical 5% Return | | | | | | | | | | |
| Class AAA | | $1,000.00 | | | $1,020.62 | | | 0.91 | % | | $ | 4.63 | |
| Class A | | $1,000.00 | | | $1,020.62 | | | 0.91 | % | | $ | 4.63 | |
| Class C | | $1,000.00 | | | $1,020.67 | | | 0.91 | % | | $ | 4.63 | |
| Class I | | $1,000.00 | | | $1,020.67 | | | 0.91 | % | | $ | 4.63 | |
| * | Expenses are equal to the Fund’s annualized expense ratio for the last six months multiplied by the average account value over the period, multiplied by the number of days in the most recent fiscal half year (184 days), then divided by 365. |
Summary of Portfolio Holdings (Unaudited)
The following tables present portfolio holdings as a percent of net assets as of December 31, 2021:
The Gabelli International Small Cap Fund
| Health Care | | | 21.0 | % |
| Consumer Staples | | | 18.4 | % |
| Consumer Discretionary | | | 15.3 | % |
| Information Technology | | | 12.9 | % |
| Materials | | | 10.1 | % |
| Financials | | | 8.5 | % |
| Industrials | | | 8.2 | % |
| Communication Services | | | 3.6 | % |
| U.S. Government Obligations | | | 2.1 | % |
| Other Assets and Liabilities (Net) | | | (0.1 | )% |
| | | | 100.0 | % |
The Fund files a complete schedule of portfolio holdings with the Securities and Exchange Commission (the SEC) for the first and third quarters of each fiscal year on Form N-PORT. Shareholders may obtain this information at www.gabelli.com or by calling the Fund at 800-GABELLI (800-422-3554). The Fund’s Form N-PORT is available on the SEC’s website at www.sec.gov and may also be reviewed and copied at the SEC’s Public Reference Room in Washington, DC. Information on the operation of the Public Reference Room may be obtained by calling 800-SEC-0330.
Proxy Voting
The Fund files Form N-PX with its complete proxy voting record for the twelve months ended June 30, no later than August 31 of each year. A description of the Fund’s proxy voting policies, procedures, and how each Fund voted proxies relating to portfolio securities is available without charge, upon request, by (i) calling 800-GABELLI (800-422-3554); (ii) writing to The Gabelli Funds at One Corporate Center, Rye, NY 10580-1422; or (iii) visiting the SEC’s website at www.sec.gov.
The Gabelli International Small Cap Fund
Schedule of Investments — December 31, 2021
| Shares | | | | | Cost | | | Market
Value | |
| | | | | COMMON STOCKS — 96.9% | | | | | | | | |
| | | | | HEALTH CARE — 19.9% | | | | | | | | |
| | 12,212 | | | AddLife AB, Cl. B | | $ | 59,108 | | | $ | 515,444 | |
| | 500 | | | Bachem Holding AG, Cl. B | | | 70,685 | | | | 392,888 | |
| | 1,800 | | | Gerresheimer AG | | | 177,000 | | | | 173,576 | |
| | 4,000 | | | Idorsia Ltd.† | | | 113,582 | | | | 81,826 | |
| | 2,300 | | | MedPeer Inc.† | | | 110,257 | | | | 71,681 | |
| | 230 | | | Siegfried Holding AG | | | 76,087 | | | | 224,523 | |
| | 5,000 | | | Takara Bio Inc. | | | 144,019 | | | | 114,927 | |
| | 230 | | | Tecan Group AG | | | 122,568 | | | | 140,216 | |
| | 15,000 | | | Tristel plc | | | 71,265 | | | | 92,380 | |
| | 1,300 | | | Vetoquinol SA | | | 81,468 | | | | 195,367 | |
| | 600 | | | Ypsomed Holding AG | | | 100,294 | | | | 122,739 | |
| | | | | | | | 1,126,333 | | | | 2,125,567 | |
| | | | | CONSUMER STAPLES — 18.4% | | | | | | | | |
| | 15,000 | | | Austevoll Seafood ASA | | | 129,584 | | | | 181,229 | |
| | 4,500 | | | Fevertree Drinks plc | | | 126,414 | | | | 164,761 | |
| | 11,000 | | | Glanbia plc | | | 118,284 | | | | 154,039 | |
| | 30,000 | | | Hotel Chocolat Group plc† | | | 131,832 | | | | 205,063 | |
| | 3,478 | | | Interparfums SA | | | 126,644 | | | | 291,038 | |
| | 4,000 | | | Kobe Bussan Co. Ltd. | | | 62,798 | | | | 154,916 | |
| | 1,750 | | | Laurent-Perrier | | | 158,577 | | | | 206,211 | |
| | 2,500 | | | Milbon Co. Ltd. | | | 101,252 | | | | 123,881 | |
| | 6,000 | | | Nomad Foods Ltd.† | | | 156,967 | | | | 152,340 | |
| | 32,000 | | | PZ Cussons plc | | | 121,541 | | | | 89,009 | |
| | 4,000 | | | Sakata Seed Corp. | | | 118,342 | | | | 114,231 | |
| | 2,000 | | | Viscofan SA | | | 121,711 | | | | 129,561 | |
| | | | | | | | 1,473,946 | | | | 1,966,279 | |
| | | | | CONSUMER DISCRETIONARY — 15.3% | | | | | | | | |
| | 27,000 | | | 888 Holdings plc | | | 58,356 | | | | 110,003 | |
| | 10,000 | | | Beneteau SA† | | | 168,177 | | | | 162,122 | |
| | 35,000 | | | boohoo Group plc† | | | 151,228 | | | | 58,365 | |
| | 11,820 | | | Entain plc† | | | 107,595 | | | | 269,262 | |
| | 2,200 | | | JINS Holdings Inc. | | | 125,148 | | | | 134,069 | |
| | 40,000 | | | LeoVegas AB | | | 214,835 | | | | 155,109 | |
| | 75,000 | | | Mandarin Oriental International Ltd.† | | | 149,583 | | | | 168,000 | |
| | 6,000 | | | Raccoon Holdings Inc | | | 131,510 | | | | 73,703 | |
| | 2,000 | | | Tod's SpA† | | | 132,379 | | | | 112,211 | |
| | 15,000 | | | Treatt plc | | | 96,439 | | | | 260,897 | |
| | 10,000 | | | Zojirushi Corp. | | | 93,734 | | | | 125,359 | |
| | | | | | | | 1,428,984 | | | | 1,629,100 | |
| | | | | INFORMATION TECHNOLOGY — 12.9% | | | | | | | | |
| | 15,000 | | | Alphawave IP Group plc† | | | 79,662 | | | | 40,566 | |
| | 20,000 | | | F-Secure OYJ | | | 93,894 | | | | 113,053 | |
| | 9,000 | | | Genius Sports Ltd.† | | | 157,908 | | | | 68,400 | |
| | 7,500 | | | GMO internet Inc. | | | 198,867 | | | | 177,019 | |
| | 16,000 | | | Infomart Corp. | | | 146,292 | | | | 130,192 | |
| | 20,000 | | | NCC Group plc | | | 57,230 | | | | 63,211 | |
| Shares | | | | | Cost | | | Market
Value | |
| | 30,000 | | | Network International Holdings plc† | | $ | 116,006 | | | $ | 118,652 | |
| | 3,000 | | | Nynomic AG† | | | 78,031 | | | | 143,451 | |
| | 4,000 | | | Optex Group Co. Ltd. | | | 70,934 | | | | 57,133 | |
| | 100,000 | | | Oxford Metrics plc | | | 116,940 | | | | 154,982 | |
| | 6,000 | | | PSI Software AG | | | 157,350 | | | | 316,275 | |
| | | | | | | | 1,273,114 | | | | 1,382,934 | |
| | | | | MATERIALS — 10.1% | | | | | | | | |
| | 6,000 | | | Alamos Gold Inc., Cl. A | | | 44,345 | | | | 46,140 | |
| | 13,850 | | | Alamos Gold Inc., Toronto, Cl. A | | | 102,363 | | | | 106,534 | |
| | 10,000 | | | Eldorado Gold Corp.† | | | 108,334 | | | | 93,500 | |
| | 10,544 | | | Endeavour Mining plc | | | 153,901 | | | | 231,144 | |
| | 5,000 | | | Labrador Iron Ore Royalty Corp. | | | 90,519 | | | | 148,346 | |
| | 4,000 | | | MAG Silver Corp.† | | | 51,468 | | | | 62,706 | |
| | 9,000 | | | Osisko Gold Royalties Ltd. | | | 108,792 | | | | 110,139 | |
| | 75,000 | | | Perseus Mining Ltd. | | | 76,499 | | | | 88,397 | |
| | 7,000 | | | Pretium Resources Inc.† | | | 78,698 | | | | 98,630 | |
| | 65,000 | | | Westgold Resources Ltd. | | | 110,777 | | | | 96,473 | |
| | | | | | | | 925,696 | | | | 1,082,009 | |
| | | | | FINANCIALS — 8.5% | | | | | | | | |
| | 45,000 | | | Brewin Dolphin Holdings plc | | | 188,042 | | | | 225,366 | |
| | 2,500 | | | Kinnevik AB, Cl. B† | | | 57,571 | | | | 89,294 | |
| | 17,000 | | | Polar Capital Holdings plc | | | 129,675 | | | | 182,472 | |
| | 4,000 | | | Rothschild & Co. | | | 142,627 | | | | 183,754 | |
| | 20,000 | | | Tamburi Investment Partners SpA | | | 139,176 | | | | 226,106 | |
| | | | | | | | 657,091 | | | | 906,992 | |
| | | | | INDUSTRIALS — 8.2% | | | | | | | | |
| | 15,000 | | | Aida Engineering Ltd. | | | 152,919 | | | | 139,398 | |
| | 50,000 | | | Chemring Group plc | | | 137,397 | | | | 200,325 | |
| | 2,000 | | | Clarkson plc | | | 77,999 | | | | 105,036 | |
| | 4,000 | | | Loomis AB | | | 148,615 | | | | 106,549 | |
| | 8,000 | | | Maruwa Unyu Kikan Co. Ltd. | | | 122,710 | | | | 101,261 | |
| | 20,000 | | | QleanAir AB | | | 115,538 | | | | 145,637 | |
| | 23,000 | | | Teraoka Seisakusho Co. Ltd. | | | 139,576 | | | | 75,980 | |
| | | | | | | | 894,754 | | | | 874,186 | |
| | | | | COMMUNICATION SERVICES — 3.6% | | | | | | | | |
| | 9,000 | | | Manchester United plc, Cl. A | | | 159,353 | | | | 128,160 | |
| | 3,190 | | | Nordic Entertainment Group AB, Cl. B† | | | 71,000 | | | | 165,639 | |
| | 2,000 | | | Xilam Animation SA† | | | 100,467 | | | | 94,723 | |
| | | | | | | | 330,820 | | | | 388,522 | |
| | | | | TOTAL COMMON STOCKS | | | 8,110,738 | | | | 10,355,589 | |
See accompanying notes to financial statements.
The Gabelli International Small Cap Fund
Schedule of Investments (Continued) — December 31, 2021
| Shares | | | | | Cost | | | Market
Value | |
| | | | | PREFERRED STOCKS — 1.1% | | | | | | | | |
| | | | | HEALTH CARE — 1.1% | | | | | | | | |
| | 1,800 | | | Draegerwerk AG & Co. | | | | | | | | |
| | | | | KGaA, 0.190% | | $ | 156,594 | | | $ | 113,224 | |
Principal
Amount | | | | | | | | | |
| | | | | U.S. GOVERNMENT OBLIGATIONS — 2.1% | | | | | | | | |
| $ | 230,000 | | | U.S. Treasury Bills, | | | | | | | | |
| | | | | 0.035% to 0.060%††, | | | | | | | | |
| | | | | 02/08/22 to 04/21/22 | | | 229,977 | | | | 229,976 | |
| | | | | | | | | | | | | |
| | | | | TOTAL INVESTMENTS — 100.1% | | $ | 8,497,309 | | | | 10,698,789 | |
| | | | | Other Assets and Liabilities (Net) — (0.1)% | | | | | | | (11,452 | ) |
| | | | | NET ASSETS — 100.0% | | | | | | $ | 10,687,337 | |
| | | | | | | | | | | | | |
| † | Non-income producing security. |
| †† | Represents annualized yields at dates of purchase. |
| Geographic Diversification | | % of Market Value | | | Market Value | |
| Europe | | | 73.4 | % | | $ | 7,856,198 | |
| Japan | | | 14.9 | | | | 1,593,749 | |
| Canada | | | 6.3 | | | | 665,995 | |
| Asia/Pacific | | | 3.3 | | | | 352,871 | |
| United States | | | 2.1 | | | | 229,976 | |
| | | | 100.0 | % | | $ | 10,698,789 | |
See accompanying notes to financial statements.
The Gabelli International Small Cap Fund
Statement of Assets and Liabilities
December 31, 2021
| Assets: | | | |
| Investments, at value (cost $8,497,309) | | $ | 10,698,789 | |
| Cash | | | 10,550 | |
| Foreign currency, at value (cost $48) | | | 47 | |
| Receivable for Fund shares sold | | | 393 | |
| Receivable from Adviser | | | 24,942 | |
| Dividends receivable | | | 23,007 | |
| Prepaid expenses | | | 14,060 | |
| Total Assets | | | 10,771,788 | |
| Liabilities: | | | | |
| Payable for investment advisory fees | | | 8,806 | |
| Payable for distribution fees | | | 1,307 | |
| Payable for legal and audit fees | | | 28,400 | |
| Payable for shareholder communications | | | 18,683 | |
| Payable for shareholder services fees | | | 7,148 | |
| Other accrued expenses | | | 20,107 | |
| Total Liabilities | | | 84,451 | |
| Net Assets | | | | |
| (applicable to 671,237 shares outstanding) | | $ | 10,687,337 | |
| Net Assets Consist of: | | | | |
| Paid-in capital | | $ | 8,658,053 | |
| Total distributable earnings | | | 2,029,284 | |
| Net Assets | | $ | 10,687,337 | |
| | | | | |
| Shares of Capital Stock, each at $0.001 par value: | | | | |
| Class AAA: | | | | |
| Net Asset Value, offering, and redemption price per share ($6,191,413 ÷ 393,000 shares outstanding; 75,000,000 shares authorized) | | $ | 15.75 | |
| Class A: | | | | |
| Net Asset Value and redemption price per share ($104,014 ÷ 6,618 shares outstanding; 50,000,000 shares authorized) | | $ | 15.72 | |
| Maximum offering price per share (NAV ÷ 0.9425, based on maximum sales charge of 5.75% of the offering price) | | $ | 16.68 | |
| Class C: | | | | |
| Net Asset Value and redemption price per share ($15,689 ÷ 1,111 shares outstanding; 25,000,000 shares authorized) | | $ | 14.12 | |
| Class I: | | | | |
| Net Asset Value, offering, and redemption price per share ($4,376,221 ÷ 270,508 shares outstanding; 25,000,000 shares authorized) | | $ | 16.18 | |
Statement of Operations
For the Year Ended December 31, 2021
| Investment Income: | | | |
| Dividends (net of foreign withholding taxes of $25,476) | | $ | 152,675 | |
| Non-cash dividends | | | 49,761 | |
| Interest | | | 112 | |
| Total Investment Income | | | 202,548 | |
| Expenses: | | | | |
| Investment advisory fees | | | 116,138 | |
| Distribution fees - Class AAA | | | 16,394 | |
| Distribution fees - Class A | | | 274 | |
| Distribution fees - Class C | | | 178 | |
| Legal and audit fees | | | 43,437 | |
| Registration expenses | | | 43,222 | |
| Administration out-of-pocket fees | | | 36,078 | |
| Shareholder services fees | | | 21,952 | |
| Shareholder communications expenses | | | 19,184 | |
| Custodian fees | | | 9,710 | |
| Tax expense | | | 2,077 | |
| Directors' fees | | | 1,891 | |
| Interest expense | | | 280 | |
| Miscellaneous expenses | | | 12,373 | |
| Total Expenses | | | 323,188 | |
| Less: | | | | |
| Expense reimbursements (See Note 3) | | | (216,306 | ) |
| Net Expenses | | | 106,882 | |
| Net Investment Income | | | 95,666 | |
| Net Realized and Unrealized Gain/(Loss) on | | | | |
| Investments and Foreign Currency: | | | | |
| Net realized gain on investments | | | 475,747 | |
| Net realized loss on foreign currency transactions | | | (1,376 | ) |
| Net realized gain on investments and foreign currency transactions | | | 474,371 | |
| Net change in unrealized appreciation/depreciation: | | | | |
| on investments | | | 21,970 | |
| on foreign currency translations | | | (396 | ) |
| Net change in unrealized appreciation/depreciation on investments and foreign currency translations | | | 21,574 | |
| Net Realized and Unrealized Gain/(Loss) on Investments and Foreign Currency | | | 495,945 | |
| Net Increase in Net Assets Resulting from Operations | | $ | 591,611 | |
See accompanying notes to financial statements.
The Gabelli International Small Cap Fund
Statement of Changes in Net Assets
| | | Year Ended December 31, 2021 | | | Year Ended December 31, 2020 | |
| | | | | | | |
| Operations: | | | | | | | | |
| Net investment income | | $ | 95,666 | | | $ | 37,359 | |
| Net realized gain/(loss) on investments and foreign currency transactions | | | 474,371 | | | | (468,142 | ) |
| Net change in unrealized appreciation/depreciation on investments and foreign currency translations | | | 21,574 | | | | 2,059,977 | |
| Net Increase in Net Assets Resulting from Operations | | | 591,611 | | | | 1,629,194 | |
| | | | | | | | | |
| Distributions to Shareholders: | | | | | | | | |
| Accumulated earnings | | | | | | | | |
| Class AAA | | | (127,193 | ) | | | (52,265 | ) |
| Class A | | | (2,153 | ) | | | (803 | ) |
| Class C | | | (359 | ) | | | (247 | ) |
| Class I | | | (87,950 | ) | | | (33,373 | ) |
| Total Distributions to Shareholders | | | (217,655 | ) | | | (86,688 | ) |
| | | | | | | | | |
| Capital Share Transactions: | | | | | | | | |
| Class AAA | | | (585,445 | ) | | | (735,124 | ) |
| Class A | | | 60 | | | | (3,141 | ) |
| Class C | | | (12,762 | ) | | | (2,268 | ) |
| Class I | | | (176,787 | ) | | | 2,491,024 | |
| Net Increase/(Decrease) in Net Assets from Capital Share Transactions | | | (774,934 | ) | | | 1,750,491 | |
| Redemption Fees | | | 9 | | | | 5 | |
| Net Increase/(Decrease) in Net Assets | | | (400,969 | ) | | | 3,293,002 | |
| Net Assets: | | | | | | | | |
| Beginning of year | | | 11,088,306 | | | | 7,795,304 | |
| End of year | | $ | 10,687,337 | | | $ | 11,088,306 | |
See accompanying notes to financial statements.
The Gabelli International Small Cap Fund
Financial Highlights
Selected data for a share of capital stock outstanding throughout each year:
| | | | | | | Income (Loss) from Investment Operations | | | Distributions | | | | | | | | | | | | Ratios to Average Net Assets/Supplemental Data | |
Year Ended
December 31 | | | Net Asset Value, Beginning of Year | | | Net Investment Income (Loss)(a) | | | Net Realized and Unrealized Gain (Loss) on Investments | | | Total from Investment Operations | | | Net Investment Income | | | Net Realized Gain on Investments | | | Return of Capital | | | Total Distributions | | | Redemption Fees(a)(b) | | | Net Asset Value, End of Year | | | Total Return† | | | Net Assets, End of Year (in 000’s) | | | Net Investment Income (Loss) | | Operating Expenses Before Reimbursement | | | Operating Expenses Net of Reimbursement(c)(d) | | Portfolio Turnover Rate | |
| Class AAA | | | | | | | | | | | | | | | | | | | | | | | | | | | | | | | | | | | | | | | | | | | | | | | | | | | | | |
| 2021 | | | $ | 15.44 | | | $ | 0.13 | (e) | | $ | 0.51 | | | $ | 0.64 | | | $ | (0.33 | ) | | $ | (0.00 | )(b) | | $ | — | | | $ | (0.33 | ) | | $ | 0.00 | | | $ | 15.75 | | | | 4.16 | % | | $ | 6,191 | | | 0.79 | %(e) | | | 2.89 | % | | 0.92 | %(f) | | | 15 | % |
| 2020 | | | | 13.06 | | | | 0.06 | | | | 2.44 | | | | 2.50 | | | | (0.12 | ) | | | — | | | | — | | | | (0.12 | ) | | | 0.00 | | | | 15.44 | | | | 19.16 | | | | 6,617 | | | 0.51 | | | | 3.65 | | | 0.91 | | | | 22 | |
| 2019 | | | | 11.09 | | | | 0.19 | (e) | | | 2.68 | | | | 2.87 | | | | (0.22 | ) | | | (0.68 | ) | | | — | | | | (0.90 | ) | | | 0.00 | | | | 13.06 | | | | 25.94 | | | | 6,366 | | | 1.50 | (e) | | | 3.41 | | | 1.00 | | | | 9 | |
| 2018 | | | | 18.55 | | | | 0.19 | | | | (4.13 | ) | | | (3.94 | ) | | | (0.19 | ) | | | (3.32 | ) | | | (0.01 | ) | | | (3.52 | ) | | | 0.00 | | | | 11.09 | | | | (20.87 | ) | | | 5,954 | | | 1.07 | | | | 3.11 | | | 1.00 | (g) | | | 26 | |
| 2017 | | | | 22.41 | | | | 0.04 | | | | 6.19 | | | | 6.23 | | | | (0.13 | ) | | | (9.96 | ) | | | — | | | | (10.09 | ) | | | — | | | | 18.55 | | | | 28.09 | | | | 8,599 | | | 0.16 | | | | 3.01 | | | 1.67 | | | | 71 | |
| Class A | | | | | | | | | | | | | | | | | | | | | | | | | | | | | | | | | | | | | | | | | | | | | | | | | | | | | |
| 2021 | | | $ | 15.40 | | | $ | 0.13 | (e) | | $ | 0.52 | | | $ | 0.65 | | | $ | (0.33 | ) | | $ | (0.00 | )(b) | | $ | — | | | $ | (0.33 | ) | | $ | 0.00 | | | $ | 15.72 | | | | 4.24 | % | | $ | 104 | | | 0.82 | %(e) | | | 2.89 | % | | 0.92 | %(f) | | | 15 | % |
| 2020 | | | | 13.03 | | | | 0.06 | | | | 2.43 | | | | 2.49 | | | | (0.12 | ) | | | — | | | | — | | | | (0.12 | ) | | | 0.00 | | | | 15.40 | | | | 19.13 | | | | 101 | | | 0.50 | | | | 3.65 | | | 0.91 | | | | 22 | |
| 2019 | | | | 11.05 | | | | 0.07 | (e) | | | 2.67 | | | | 2.74 | | | | (0.08 | ) | | | (0.68 | ) | | | — | | | | (0.76 | ) | | | 0.00 | | | | 13.03 | | | | 24.86 | | | | 91 | | | 0.60 | (e) | | | 3.41 | | | 1.91 | | | | 9 | |
| 2018 | | | | 18.44 | | | | 0.01 | | | | (4.08 | ) | | | (4.07 | ) | | | — | | | | (3.32 | ) | | | — | | | | (3.32 | ) | | | 0.00 | | | | 11.05 | | | | (21.70 | ) | | | 81 | | | 0.04 | | | | 3.11 | | | 2.01 | (g) | | | 26 | |
| 2017 | | | | 22.33 | | | | (0.05 | ) | | | 6.18 | | | | 6.13 | | | | (0.06 | ) | | | (9.96 | ) | | | — | | | | (10.02 | ) | | | — | | | | 18.44 | | | | 27.74 | | | | 155 | | | (0.19 | ) | | | 3.01 | | | 2.00 | | | | 71 | |
| Class C | | | | | | | | | | | | | | | | | | | | | | | | | | | | | | | | | | | | | | | | | | | |
| 2021 | | | $ | 13.87 | | | $ | 0.11 | (e) | | $ | 0.47 | | | $ | 0.58 | | | $ | (0.33 | ) | | $ | (0.00 | )(b) | | $ | — | | | $ | (0.33 | ) | | $ | 0.00 | | | $ | 14.12 | | | | 4.20 | % | | $ | 16 | | | 0.77 | %(e) | | | 3.64 | % | | 0.92 | %(f) | | | 15 | % |
| 2020 | | | | 11.74 | | | | 0.05 | | | | 2.20 | | | | 2.25 | | | | (0.12 | ) | | | — | | | | — | | | | (0.12 | ) | | | 0.00 | | | | 13.87 | | | | 19.19 | | | | 28 | | | 0.48 | | | | 4.40 | | | 0.91 | | | | 22 | |
| 2019 | | | | 10.02 | | | | (0.01 | )(e) | | | 2.41 | | | | 2.40 | | | | — | | | | (0.68 | ) | | | — | | | | (0.68 | ) | | | 0.00 | | | | 11.74 | | | | 24.01 | | | | 26 | | | (0.12 | )(e) | | | 4.16 | | | 2.61 | | | | 9 | |
| 2018 | | | | 17.26 | | | | (0.11 | ) | | | (3.81 | ) | | | (3.92 | ) | | | — | | | | (3.32 | ) | | | — | | | | (3.32 | ) | | | 0.00 | | | | 10.02 | | | | (22.33 | ) | | | 31 | | | (0.67 | ) | | | 3.86 | | | 2.76 | (g) | | | 26 | |
| 2017 | | | | 21.52 | | | | (0.23 | ) | | | 5.93 | | | | 5.70 | | | | — | | | | (9.96 | ) | | | — | | | | (9.96 | ) | | | — | | | | 17.26 | | | | 26.79 | | | | 43 | | | (0.92 | ) | | | 3.76 | | | 2.75 | | | | 71 | |
| Class I | | | | | | | | | | | | | | | | | | | | | | | | | | | | | | | | | | | | | | | | | | | | | | | | | | | | | |
| 2021 | | | $ | 15.85 | | | $ | 0.14 | (e) | | $ | 0.52 | | | $ | 0.66 | | | $ | (0.33 | ) | | $ | (0.00 | )(b) | | $ | — | | | $ | (0.33 | ) | | $ | 0.00 | | | $ | 16.18 | | | | 4.18 | % | | $ | 4,376 | | | 0.87 | %(e) | | | 2.64 | % | | 0.92 | %(f) | | | 15 | % |
| 2020 | | | | 13.41 | | | | 0.05 | | | | 2.51 | | | | 2.56 | | | | (0.12 | ) | | | — | | | | — | | | | (0.12 | ) | | | 0.00 | | | | 15.85 | | | | 19.11 | | | | 4,342 | | | 0.39 | | | | 3.40 | | | 0.91 | | | | 22 | |
| 2019 | | | | 11.39 | | | | 0.19 | (e) | | | 2.77 | | | | 2.96 | | | | (0.26 | ) | | | (0.68 | ) | | | — | | | | (0.94 | ) | | | 0.00 | | | | 13.41 | | | | 26.04 | | | | 1,312 | | | 1.52 | (e) | | | 3.16 | | | 1.00 | | | | 9 | |
| 2018 | | | | 18.93 | | | | 0.19 | | | | (4.22 | ) | | | (4.03 | ) | | | (0.18 | ) | | | (3.32 | ) | | | (0.01 | ) | | | (3.51 | ) | | | 0.00 | | | | 11.39 | | | | (20.90 | ) | | | 1,557 | | | 1.07 | | | | 2.86 | | | 1.00 | (g) | | | 26 | |
| 2017 | | | | 22.68 | | | | 0.21 | | | | 6.31 | | | | 6.52 | | | | (0.31 | ) | | | (9.96 | ) | | | — | | | | (10.27 | ) | | | — | | | | 18.93 | | | | 29.02 | | | | 2,031 | | | 0.82 | | | | 2.76 | | | 1.00 | | | | 71 | |
| † | Total return represents aggregate total return of a hypothetical investment at the beginning of the year and sold at the end of the year including reinvestment of distributions and does not reflect the applicable sales charges. |
| (a) | Per share amounts have been calculated using the average shares outstanding method. |
| (b) | Amount represents less than $0.005 per share. |
| (c) | Under an expense reimbursement agreement with the Adviser, the Adviser reimbursed expenses of $216,306, $210,061, $184,323, $201,091, and $144,403 for the years ended December 31, 2021, 2020, 2019, 2018, and 2017, respectively. |
| (d) | The Fund incurred interest expense. If interest expense had not been incurred, the ratio of operating expenses to average net assets would have been 0.90% for each Class for the year ended December 31, 2020, and 2.00% (Class A), 2.75% (Class C) and with no impact to Class AAA and Class I for the year ended December 31, 2018. For the years ended December 31, 2021, 2019, and 2017, the effect of interest expense was minimal. |
| (e) | Includes income resulting from special dividends. Without these dividends, the per share income/(loss) amounts would have been $0.06 and $0.15 (Class AAA), $0.06 and $0.04 (Class A), $0.05 and $(0.05) (Class C), and $0.07 and $0.15 (Class I), and the net investment income/(loss) ratios would have been 0.36% and 1.19% (Class AAA), 0.39% and 0.29% (Class A), 0.34% and (0.43%) (Class C), and 0.44% and 1.21% (Class I) for the years ended December 31, 2021 and 2019, respectively. |
| (f) | The Fund incurred tax expense for the year ended December 31, 2021. If tax expense had not been incurred, the ratios of operating expenses to average net assets would have been 0.90% for each Class. |
| (g) | The Fund received credits from a designated broker who agreed to pay certain Fund operating expenses. For the year ended December 31, 2018, the effect of expense reimbursements was minimal. |
See accompanying notes to financial statements.
The Gabelli International Small Cap Fund
Notes to Financial Statements
1. Organization. The Gabelli International Small Cap Fund, a series of GAMCO Global Series Funds, Inc. (the Corporation), was incorporated on July 16, 1993 in Maryland. The Fund is a non-diversified open-end management investment company registered under the Investment Company Act of 1940, as amended (the 1940 Act), and is one of five separately managed portfolios (collectively, the Portfolios) of the Corporation. The Fund’s primary objective is capital appreciation. The Fund commenced investment operations on May 11, 1998.
2. Significant Accounting Policies. As an investment company, the Fund follows the investment company accounting and reporting guidance, which is part of U.S. generally accepted accounting principles (GAAP) that may require the use of management estimates and assumptions in the preparation of its financial statements. Actual results could differ from those estimates. The following is a summary of significant accounting policies followed by the Fund in the preparation of its financial statements.
The global outbreak of the novel coronavirus disease, known as COVID-19, has caused adverse effects on many companies, sectors, nations, regions, and the markets in general, and may continue for an unpredictable duration. The effects of this pandemic may materially impact the value and performance of the Fund, its ability to buy and sell fund investments at appropriate valuations, and its ability to achieve its investment objectives.
Security Valuation. Portfolio securities listed or traded on a nationally recognized securities exchange or traded in the U.S. over-the-counter market for which market quotations are readily available are valued at the last quoted sale price or a market’s official closing price as of the close of business on the day the securities are being valued. If there were no sales that day, the security is valued at the average of the closing bid and asked prices or, if there were no asked prices quoted on that day, then the security is valued at the closing bid price on that day. If no bid or asked prices are quoted on such day, the security is valued at the most recently available price or, if the Board of Directors (the Board) so determines, by such other method as the Board shall determine in good faith to reflect its fair market value. Portfolio securities traded on more than one national securities exchange or market are valued according to the broadest and most representative market, as determined by Gabelli Funds, LLC (the Adviser).
Portfolio securities primarily traded on a foreign market are generally valued at the preceding closing values of such securities on the relevant market, but may be fair valued pursuant to procedures established by the Board if market conditions change significantly after the close of the foreign market, but prior to the close of business on the day the securities are being valued. Debt obligations for which market quotations are readily available are valued at the average of the latest bid and asked prices. If there were no asked prices quoted on such day, the security is valued using the closing bid price. Such debt obligations are valued through prices provided by a pricing service approved by the Board. Certain securities are valued principally using dealer quotations.
Securities and assets for which market quotations are not readily available are fair valued as determined by the Board. Fair valuation methodologies and procedures may include, but are not limited to: analysis and review of available financial and non-financial information about the company; comparisons with the valuation and changes in valuation of similar securities, including a comparison of foreign securities with the equivalent U.S. dollar value American Depositary Receipt securities at the close of the U.S. exchange; and evaluation of any other information that could be indicative of the value of the security.
The Fund employs a fair value model to adjust prices to reflect events affecting the values of certain portfolio securities which occur between the close of trading on the principal market for such securities (foreign exchanges and over-the-counter markets) at the time when net asset values of the Fund are determined. If the Fund’s
The Gabelli International Small Cap Fund
Notes to Financial Statements (Continued)
valuation committee believes that a particular event would materially affect net asset value, further adjustment is considered. Such securities are classified as Level 2 in the fair value hierarchy presented below.
The inputs and valuation techniques used to measure fair value of the Fund’s investments are summarized into three levels as described in the hierarchy below:
| ● | Level 1 — quoted prices in active markets for identical securities; |
| ● | Level 2 — other significant observable inputs (including quoted prices for similar securities, interest rates, prepayment speeds, credit risk, etc.); and |
| ● | Level 3 — significant unobservable inputs (including the Board’s determinations as to the fair value of investments). |
A financial instrument’s level within the fair value hierarchy is based on the lowest level of any input both individually and in the aggregate that is significant to the fair value measurement. The inputs or methodology used for valuing securities are not necessarily an indication of the risk associated with investing in those securities. The summary of the Fund’s investments in securities by inputs used to value the Fund’s investments as of December 31, 2021 is as follows:
| | | | Valuation Inputs | | | | | |
| | | | Level 1 Quoted Prices | | | | Level 2 Other Significant Observable Inputs | | | | Total Market Value at 12/31/21 | |
| INVESTMENTS IN SECURITIES: | | | | | | | | | | | | |
| ASSETS (Market Value): | | | | | | | | | | | | |
| Common Stocks (a) | | $ | 10,355,589 | | | | — | | | $ | 10,355,589 | |
| Preferred Stocks (a) | | | 113,224 | | | | — | | | | 113,224 | |
| U.S. Government Obligations | | | — | | | $ | 229,976 | | | | 229,976 | |
| TOTAL INVESTMENTS IN SECURITIES – ASSETS | | $ | 10,468,813 | | | $ | 229,976 | | | $ | 10,698,789 | |
| (a) | Please refer to the Schedule of Investments for the industry classifications of these portfolio holdings. |
The Fund held no Level 3 investments at December 31, 2021 and 2020.
Additional Information to Evaluate Qualitative Information.
General. The Fund uses recognized industry pricing services – approved by the Board and unaffiliated with the Adviser – to value most of its securities, and uses broker quotes provided by market makers of securities not valued by these and other recognized pricing sources. Several different pricing feeds are received to value domestic equity securities, international equity securities, preferred equity securities, and fixed income securities. The data within these feeds are ultimately sourced from major stock exchanges and trading systems where these securities trade. The prices supplied by external sources are checked by obtaining quotations or actual transaction prices from market participants. If a price obtained from the pricing source is deemed unreliable, prices will be sought from another pricing service or from a broker/dealer that trades that security or similar securities.
Fair Valuation. Fair valued securities may be common or preferred equities, warrants, options, rights, or fixed income obligations. Where appropriate, Level 3 securities are those for which market quotations are not available, such as securities not traded for several days, or for which current bids are not available, or which are
The Gabelli International Small Cap Fund
Notes to Financial Statements (Continued)
restricted as to transfer. When fair valuing a security, factors to consider include recent prices of comparable securities that are publicly traded, reliable prices of securities not publicly traded, the use of valuation models, current analyst reports, valuing the income or cash flow of the issuer, or cost if the preceding factors do not apply. A significant change in the unobservable inputs could result in a lower or higher value in Level 3 securities. The circumstances of Level 3 securities are frequently monitored to determine if fair valuation measures continue to apply.
The Adviser reports quarterly to the Board the results of the application of fair valuation policies and procedures. These may include backtesting the prices realized in subsequent trades of these fair valued securities to fair values previously recognized.
Foreign Currency Translations. The books and records of the Fund are maintained in U.S. dollars. Foreign currencies, investments, and other assets and liabilities are translated into U.S. dollars at current exchange rates. Purchases and sales of investment securities, income, and expenses are translated at the exchange rate prevailing on the respective dates of such transactions. Unrealized gains and losses that result from changes in foreign exchange rates and/or changes in market prices of securities have been included in unrealized appreciation/depreciation on investments and foreign currency translations. Net realized foreign currency gains and losses resulting from changes in exchange rates include foreign currency gains and losses between trade date and settlement date on investment securities transactions, foreign currency transactions, and the difference between the amounts of interest and dividends recorded on the books of the Fund and the amounts actually received. The portion of foreign currency gains and losses related to fluctuation in exchange rates between the initial purchase trade date and subsequent sale trade date is included in realized gain/(loss) on investments.
Foreign Securities. The Fund may directly purchase securities of foreign issuers. Investing in securities of foreign issuers involves special risks not typically associated with investing in securities of U.S. issuers. The risks include possible revaluation of currencies, the inability to repatriate funds, less complete financial information about companies, and possible future adverse political and economic developments. Moreover, securities of many foreign issuers and their markets may be less liquid and their prices more volatile than securities of comparable U.S. issuers.
Foreign Taxes. The Fund may be subject to foreign taxes on income, gains on investments, or currency repatriation, a portion of which may be recoverable. The Fund will accrue such taxes and recoveries as applicable, based upon its current interpretation of tax rules and regulations that exist in the markets in which it invests.
Securities Transactions and Investment Income. Securities transactions are accounted for on the trade date with realized gain/(loss) on investments determined by using the identified cost method. Interest income (including amortization of premium and accretion of discount) is recorded on an accrual basis. Premiums and discounts on debt securities are amortized using the effective yield to maturity method or amortized to earliest call date, if applicable. Dividend income is recorded on the ex-dividend date, except for certain dividends from foreign securities that are recorded as soon after the ex-dividend date as the Fund becomes aware of such dividends.
Determination of Net Asset Value and Calculation of Expenses. Certain administrative expenses are common to, and allocated among, various affiliated funds. Such allocations are made on the basis of each fund’s average net assets or other criteria directly affecting the expenses as determined by the Adviser pursuant to procedures established by the Board.
The Gabelli International Small Cap Fund
Notes to Financial Statements (Continued)
In calculating the NAV per share of each class, investment income, realized and unrealized gains and losses, redemption fees, and expenses other than class specific expenses are allocated daily to each class of shares based upon the proportion of net assets of each class at the beginning of each day. Distribution expenses are borne solely by the class incurring the expense.
Distributions to Shareholders. Distributions to shareholders are recorded on the ex-dividend date. Distributions to shareholders are based on income and capital gains as determined in accordance with federal income tax regulations, which may differ from income and capital gains as determined under GAAP. These differences are primarily due to differing treatments of income and gains on various investment securities and foreign currency transactions held by the Fund, timing differences, and differing characterizations of distributions made by the Fund. Distributions from net investment income for federal income tax purposes include net realized gains on foreign currency transactions. These book/tax differences are either temporary or permanent in nature. To the extent these differences are permanent, adjustments are made to the appropriate capital accounts in the period when the differences arise. Permanent differences were primarily due to disallowed losses and distributions in excess of income. These reclassifications have no impact on the NAV of the Fund. For the year ended December 31, 2021, reclassifications were made to decrease paid-in capital by $3,404, with an offsetting adjustment to total distributable earnings.
The tax character of distributions paid during the years ended December 31, 2021 and 2020 was as follows:
| | | Year Ended December 31, 2021 | | | Year Ended December 31, 2020 | |
| Distributions paid from: | | | | | | | | |
| Ordinary income | | $ | 215,281 | | | $ | 86,688 | |
| Net long term capital gains | | | 2,374 | | | | — | |
| Total distributions paid | | $ | 217,655 | | | $ | 86,688 | |
Provision for Income Taxes. The Fund intends to continue to qualify as a regulated investment company under Subchapter M of the Internal Revenue Code of 1986, as amended (the Code). It is the policy of the Fund to comply with the requirements of the Code applicable to regulated investment companies and to distribute substantially all of its net investment company taxable income and net capital gains. Therefore, no provision for federal income taxes is required.
At December 31, 2021, the components of accumulated earnings/losses on a tax basis were as follows:
| Net unrealized appreciation on investments and foreign currency translations | | $ | 2,029,284 | |
The Fund utilized $468,992 of the capital loss carryforward for the year ended December 31, 2021.
At December 31, 2021, the temporary differences between book basis and tax basis unrealized appreciation were primarily due to mark-to-market adjustments on investments in passive foreign investment companies and investments no longer considered passive foreign investment companies.
The Gabelli International Small Cap Fund
Notes to Financial Statements (Continued)
The following summarizes the tax cost of investments and the related net unrealized appreciation at December 31, 2021:
| | | | Cost | | | Gross
Unrealized
Appreciation | | | Gross
Unrealized
Depreciation | | | Net Unrealized
Appreciation | |
| Investments | | | $ | 8,669,781 | | | $ | 2,915,323 | | | $ | (886,315 | ) | | $ | 2,029,008 | |
The Fund is required to evaluate tax positions taken or expected to be taken in the course of preparing the Fund’s tax returns to determine whether the tax positions are “more-likely-than-not” of being sustained by the applicable tax authority. Income tax and related interest and penalties would be recognized by the Fund as tax expense in the Statement of Operations if the tax positions were deemed not to meet the more-likely-than-not threshold. During the year ended December 31, 2021, the Fund incurred an excise tax expense of $2,077. As of December 31, 2021, the Adviser has reviewed all open tax years and concluded that there was no impact to the Fund’s net assets or results of operations. The Fund’s federal and state tax returns for the prior three fiscal years remain open, subject to examination. On an ongoing basis, the Adviser will monitor the Fund’s tax positions to determine if adjustments to this conclusion are necessary.
3. Investment Advisory Agreement and Other Transactions. The Fund has entered into an investment advisory agreement (the Advisory Agreement) with the Adviser which provides that the Fund will pay the Adviser a fee, computed daily and paid monthly, at the annual rate of 1.00% of the value of its average daily net assets. In accordance with the Advisory Agreement, the Adviser provides a continuous investment program for the Fund’s portfolio, oversees the administration of all aspects of the Fund’s business and affairs, and pays the compensation of all Officers and Directors of the Fund who are affiliated persons of the Adviser.
Through November 30, 2019, the Adviser had agreed to waive and/or to reimburse expenses of the Fund to the extent necessary to maintain the annualized total operating expenses of the Fund (excluding brokerage costs, acquired fund fees and expenses, interest, taxes, and extraordinary expenses) at no more than 1.00%, 2.00%, 2.75%, and 1.00% of the value of the Fund’s average daily net assets for Class AAA, Class A, Class C, and Class I, respectively. Effective December 1, 2019, the Adviser amended its contractual agreement with respect to each share class of the Fund to waive its investment advisory fees and/or to reimburse expenses to the extent necessary to maintain the annualized total operating expenses of the Fund (excluding brokerage costs, acquired fund fees and expenses, interest, taxes, and extraordinary expenses) until at least April 30, 2022, at no more than 0.90% of the value of the Fund’s average daily net assets for each share class. During the year ended December 31, 2021, the Adviser reimbursed the Fund in the amount of $216,306. In addition, the Fund has agreed, during the two year period following any waiver or reimbursement by the Adviser, to repay such amount to the extent, that after giving effect to the repayment, such adjusted annualized total operating expenses of the Fund would not exceed 0.91% of the value of the Fund’s average daily net assets for each share class of the Fund. The arrangement is renewable annually. At December 31, 2021, the cumulative amount which the Fund may repay the Adviser, subject to the terms above, is $426,367:
| For the year ended December 31, 2020, expiring December 31, 2022 | | | $ | 210,061 | |
| For the year ended December 31, 2021, expiring December 31, 2023 | | | | 216,306 | |
| | | | $ | 426,367 | |
The Gabelli International Small Cap Fund
Notes to Financial Statements (Continued)
4. Distribution Plan. The Fund’s Board has adopted a distribution plan (the Plan) for each class of shares, except for Class I Shares, pursuant to Rule 12b-1 under the 1940 Act. Under the Class AAA, Class A, and Class C Share Plans, payments are authorized to G.distributors, LLC (the Distributor), an affiliate of the Adviser, at annual rates of 0.25%, 0.25%, and 1.00%, respectively, of the average daily net assets of those classes, the annual limitations under each Plan. Such payments are accrued daily and paid monthly.
5. Portfolio Securities. Purchases and sales of securities during the year ended December 31, 2021, other than short term securities and U.S. Government obligations, aggregated $1,699,539 and $2,709,253, respectively.
6. Transactions with Affiliates and Other Arrangements. The cost of calculating the Fund’s NAV per share is a Fund expense pursuant to the Advisory Agreement. Under the sub-administration agreement with Bank of New York Mellon, the fees paid include the cost of calculating the Fund’s NAV. The Fund reimburses the Adviser for this service. The Adviser did not seek a reimbursement during the year ended December 31, 2021.
The Corporation pays retainer and per meeting fees to Directors not affiliated with the Adviser, plus specified amounts to the Lead Director and Audit Committee Chairman. Directors are also reimbursed for out of pocket expenses incurred in attending meetings. Directors who are directors or employees of the Adviser or an affiliated company receive no compensation or expense reimbursement from the Corporation.
7. Line of Credit. The Fund participates in an unsecured line of credit, which expires on March 2, 2022 and may be renewed annually, of up to $75,000,000 under which it may borrow up to 10% of its net assets from the custodian for temporary borrowing purposes. Borrowings under this arrangement bear interest at a floating rate equal to the higher of the Overnight Federal Funds Rate plus 135 basis points or the Overnight Bank Funding Rate plus 135 basis points in effect on that day. This amount, if any, would be included in “Interest expense” in the Statement of Operations. At December 31, 2021, there were no borrowings under the line of credit.
The average daily amount of borrowings outstanding under the line of credit for the four days of borrowings during the year ended December 31, 2021 was $1,198,250 with a weighted average interest rate of 1.36%. The maximum amount borrowed at any time during the year ended December 31, 2021 was $1,328,000.
8. Capital Stock. The Fund currently offers three classes of shares – Class AAA Shares, Class A Shares, and Class I Shares. Effective January 27, 2020, (the Effective Date) the Fund’s Class AAA, Class A, and Class C Shares “closed to purchases from new investors”. “Closed to purchases from new investors” means (i) with respect to the Class AAA, and Class A shares, no new investors may purchase shares of such classes, but existing shareholders may continue to purchase additional shares of such classes after the Effective Date, and (ii) with respect to Class C Shares, neither new investors nor existing shareholders may purchase any additional shares of such class after the Effective Date. These changes had no effect on existing shareholders’ ability to redeem shares of the Fund as described in the Fund’s Prospectus. Additionally, on the Effective Date Class I shares of the Fund became available to investors with a minimum initial investment amount of $1,000 when purchasing shares directly through the Distributor, or investors purchasing Class I shares through brokers or financial intermediaries that have entered into selling agreements with the Distributor specifically with respect to Class I shares.
The Fund imposes a redemption fee of 2.00% on all classes of shares that are redeemed or exchanged on or before the seventh day after the date of a purchase. The redemption fee is deducted from the proceeds otherwise payable to the redeeming shareholders and is retained by the Fund as an increase in paid-in capital.
The Gabelli International Small Cap Fund
Notes to Financial Statements (Continued)
The redemption fees retained by the Fund during the years ended December 31, 2021 and 2020, if any, can be found in the Statement of Changes in Net Assets under Redemption Fees.
Transactions in shares of capital stock were as follows:
| | | Year Ended
December 31, 2021 | | | Year Ended
December 31, 2020 | |
| | | Shares | | | Amount | | | Shares | | | Amount | |
| Class AAA | | | | | | | | | | | | | | | | |
| Shares sold | | | 6,223 | | | $ | 100,104 | | | | 15,624 | | | $ | 195,087 | |
| Shares issued upon reinvestment of distributions | | | 7,944 | | | | 124,396 | | | | 3,259 | | | | 50,245 | |
| Shares redeemed | | | (49,701 | ) | | | (809,945 | ) | | | (77,589 | ) | | | (980,456 | ) |
| Net decrease | | | (35,534 | ) | | $ | (585,445 | ) | | | (58,706 | ) | | $ | (735,124 | ) |
| Class A | | | | | | | | | | | | | | | | |
| Shares sold | | | 895 | | | $ | 13,953 | | | | 275 | | | $ | 3,530 | |
| Shares issued upon reinvestment of distributions | | | 94 | | | | 1,480 | | | | 37 | | | | 570 | |
| Shares redeemed | | | (956 | ) | | | (15,373 | ) | | | (724 | ) | | | (7,241 | ) |
| Net increase/(decrease) | | | 33 | | | $ | 60 | | | | (412 | ) | | $ | (3,141 | ) |
| Class C | | | | | | | | | | | | | | | | |
| Shares issued upon reinvestment of distributions | | | 25 | | | $ | 358 | | | | 18 | | | $ | 247 | |
| Shares redeemed | | | (946 | ) | | | (13,120 | ) | | | (257 | ) | | | (2,515 | ) |
| Net decrease | | | (921 | ) | | $ | (12,762 | ) | | | (239 | ) | | $ | (2,268 | ) |
| Class I | | | | | | | | | | | | | | | | |
| Shares sold | | | 135,215 | | | $ | 2,192,535 | | | | 282,729 | | | $ | 3,955,674 | |
| Shares issued upon reinvestment of distributions | | | 5,184 | | | | 83,354 | | | | 2,109 | | | | 33,373 | |
| Shares redeemed | | | (143,909 | ) | | | (2,452,676 | ) | | | (108,667 | ) | | | (1,498,023 | ) |
| Net increase/(decrease) | | | (3,510 | ) | | $ | (176,787 | ) | | | 176,171 | | | $ | 2,491,024 | |
9. Indemnifications. The Fund enters into contracts that contain a variety of indemnifications. The Fund’s maximum exposure under these arrangements is unknown. However, the Fund has not had prior claims or losses pursuant to these contracts. Management has reviewed the Fund’s existing contracts and expects the risk of loss to be remote.
10. Subsequent Events. Management has evaluated the impact on the Fund of all subsequent events occurring through the date the financial statements were issued and has determined that there were no subsequent events requiring recognition or disclosure in the financial statements.
The Gabelli International Small Cap Fund
Report of Independent Registered Public Accounting Firm
To the Shareholders of The Gabelli International Small Cap Fund
and the Board of Directors of GAMCO Global Series Funds, Inc.
Opinion on the Financial Statements
We have audited the accompanying statement of assets and liabilities of The Gabelli International Small Cap Fund (the "Fund") (one of the funds constituting GAMCO Global Series Funds, Inc. (the "Corporation")), including the schedule of investments, as of December 31, 2021, and the related statement of operations for the year then ended, the statements of changes in net assets for each of the two years in the period then ended, the financial highlights for each of the five years in the period then ended and the related notes (collectively referred to as the "financial statements"). In our opinion, the financial statements present fairly, in all material respects, the financial position of the Fund (one of the funds constituting GAMCO Global Series Funds, Inc.) at December 31, 2021, the results of its operations for the year then ended, the changes in its net assets for each of the two years in the period then ended and its financial highlights for each of the five years in the period then ended, in conformity with U.S. generally accepted accounting principles.
Basis for Opinion
These financial statements are the responsibility of the Corporation’s management. Our responsibility is to express an opinion on the Fund’s financial statements based on our audits. We are a public accounting firm registered with the Public Company Accounting Oversight Board (United States) (“PCAOB”) and are required to be independent with respect to the Corporation in accordance with the U.S. federal securities laws and the applicable rules and regulations of the Securities and Exchange Commission and the PCAOB.
We conducted our audits in accordance with the standards of the PCAOB. Those standards require that we plan and perform the audit to obtain reasonable assurance about whether the financial statements are free of material misstatement, whether due to error or fraud. The Corporation is not required to have, nor were we engaged to perform, an audit of the Corporation's internal control over financial reporting. As part of our audits we are required to obtain an understanding of internal control over financial reporting but not for the purpose of expressing an opinion on the effectiveness of the Corporation's internal control over financial reporting. Accordingly, we express no such opinion.
Our audits included performing procedures to assess the risks of material misstatement of the financial statements, whether due to error or fraud, and performing procedures that respond to those risks. Such procedures included examining, on a test basis, evidence regarding the amounts and disclosures in the financial statements. Our procedures included confirmation of securities owned as of December 31, 2021, by correspondence with the custodian. Our audits also included evaluating the accounting principles used and significant estimates made by management, as well as evaluating the overall presentation of the financial statements. We believe that our audits provide a reasonable basis for our opinion.

We have served as the auditor of one or more Gabelli/GAMCO Funds investment companies since 1992.
Philadelphia, Pennsylvania
February 28, 2022
The Gabelli International Small Cap Fund
Liquidity Risk Management Program (Unaudited)
In accordance with Rule 22e-4 under the 1940 Act, the Fund has established a liquidity risk management program (the LRM Program) to govern its approach to managing liquidity risk. The LRM Program is administered by the Liquidity Committee (the Committee), which is comprised of members of Gabelli Funds, LLC management. The Board has designated the Committee to administer the LRM Program.
The LRM Program’s principal objectives include supporting the Fund’s compliance with limits on investments in illiquid assets and mitigating the risk that the Fund will be unable to meet its redemption obligations in a timely manner. The LRM Program also includes elements that support the management and assessment of liquidity risk, including an annual assessment of factors that influence the Fund’s liquidity and the monthly classification and re-classification of certain investments that reflect the Committee’s assessment of their relative liquidity under current market conditions.
At a meeting of the Board held on May 12, 2021, the Board received a written report from the Committee regarding the design and operational effectiveness of the LRM Program. The Committee determined, and reported to the Board, that the LRM Program is reasonably designed to assess and manage the Fund’s liquidity risk and has operated adequately and effectively since its implementation. The Committee reported that there were no liquidity events that impacted the Fund or its ability to timely meet redemptions without dilution to existing shareholders. The Committee noted that the Fund is primarily invested in highly liquid securities and, accordingly, continues to be exempt from the requirement to determine a “highly liquid investment minimum” as defined in the Rule 22e-4. Because of that continued qualification for the exemption, the Fund has not adopted a “highly liquid investment minimum” amount. The Committee further noted that while changes to the LRM Program were made during the Review Period and reported to the Board, no material changes were made to the LRM Program as a result of the Committee’s annual review.
There can be no assurance that the LRM Program will achieve its objectives in the future. Please refer to the Fund’s Prospectus for more information regarding its exposure to liquidity risk and other principal risks to which an investment in the Fund may be subject.
The Gabelli International Small Cap Fund
Board Consideration and Re-Approval of Investment Advisory Agreement (Unaudited)
At its meeting on November 11, 2021, the Board of Directors of the Corporation approved the continuation of the investment advisory agreement with the Adviser for the Fund on the basis of the recommendation by the directors (the Independent Board Members) who are not interested persons of the Fund. The following paragraphs summarize the material information and factors considered by the Independent Board Members as well as their conclusions relative to such factors.
Nature, Extent, and Quality of Services. The Independent Board Members considered information regarding the Fund’s portfolio managers, the depth of the analyst pool available to the Adviser and the portfolio manager, the scope of supervisory, administrative, shareholder, and other services supervised or provided by the Adviser, and the absence of significant service problems reported to the Board. The Independent Board Members noted the experience, length of service, and reputation of the Fund’s portfolio manager.
Investment Performance. The Independent Board Members reviewed the short, medium, and long term performance of the Fund (as of September 30, 2021) against a peer group of seven other comparable funds prepared by the Adviser (the “Adviser Peer Group”), and against a peer group prepared by Broadridge (the “Broadridge Performance Peer Group”) consisting of all international small/mid-cap growth funds, regardless of asset size or primary channel of distribution, as represented by the Lipper International Small Mid-Cap Growth Index. The Independent Board Members noted that the Fund’s performance was in the fourth quartile for the one year period and the third quartile for the three, five, and ten year periods, as measured against the Adviser Peer Group. Against the Broadridge Performance Peer Group, the Independent Board Members noted that the Fund’s performance was in the fifth quintile for the one year period, the third quintile for the three year period, and the fourth quintile for the five and ten years periods. The Independent Board Members noted that at its current size, the Fund was not competitive among its peer group and encouraged the Adviser to continue to explore ways to increase the size of the Fund.
Profitability. The Independent Board Members reviewed summary data regarding the profitability of the Fund to the Adviser both with a pro rata administrative overhead charge and with a standalone administrative charge and noted the effect of the expense limitation agreement. The Independent Board Members also noted that a portion of the Fund’s portfolio transactions were executed by an affiliated broker of the Adviser and that another affiliated broker of the Adviser received distribution fees and minor amounts of sales commissions.
Economies of Scale. The Independent Board Members discussed the major elements of the Adviser's cost structure and the relationship of those elements to potential economies of scale and reviewed data provided by the Adviser.
Sharing of Economies of Scale. The Independent Board Members noted that the investment management fee schedule for the Fund does not take into account any potential economies of scale that may develop or any losses or diminished profitability to the Adviser in prior years.
Service and Cost Comparisons. The Independent Board Members compared the expense ratios of the investment management fee, other expenses, and total expenses of the Fund with similar expense ratios of the Adviser Peer Group and a peer group of eight other international small/mid-cap growth funds selected by Broadridge (the “Broadridge Expense Peer Group”), and noted that the Adviser's management fee includes substantially all administrative services of the Fund as well as investment advisory services. The Independent Board Members noted the effect of the expense limitation agreement in place for the Fund. The Independent
The Gabelli International Small Cap Fund
Board Consideration and Re-Approval of Investment Advisory Agreement (Unaudited) (Continued)
Board Members noted that the Fund's total expense ratio after waivers was the lowest compared with the Adviser Peer Group, and the lowest compared with all of the funds included in the Broadridge Expense Peer Group. The Independent Board Members discussed how the Fund's size was significantly lower than average within both peer groups and that the Adviser had been waiving substantial portions of its fees in order to make the Fund a more attractive investment. The Independent Board Members also noted that the advisory fee structure was the same as that in effect for most of the Gabelli funds. The Independent Board Members were presented with, but did not consider to be material to their decision, various information comparing the advisory fee with the fee for other types of accounts managed by the Adviser.
Conclusions. The Independent Board Members concluded that the Fund enjoyed highly experienced portfolio management services and good ancillary services. The Independent Board Members noted the reasons for the Fund’s underperformance and the steps the Adviser was taking to improve performance and indicated that they would continue to evaluate the Fund. The Independent Board Members noted the contractual Expense Deferral Agreement between the Adviser and the Corporation, on behalf of each Fund, pursuant to which the net expense ratio for each share class of each Fund was reduced to 0.90% and, following further discussion, determined to recommend that the Adviser consider reducing the Fund’s expense cap to 0% in light of the Fund’s small size. The Independent Board Members did not view the potential profitability of ancillary services as material to their decision. On the basis of the foregoing and without assigning particular weight to any single conclusion, the Independent Board Members determined to recommend continuation of the investment management agreement to the full Board.
Based on a consideration of all these factors in their totality, the Board Members, including all of the Independent Board Members, determined that the Fund’s advisory fee was appropriate in light of the quality of services provided and in light of the other factors described above that the Board deemed relevant. Accordingly, the Board Members determined to approve the continuation of the Fund’s Advisory Agreement. The Board Members based their decision on evaluations of all these factors as a whole and did not consider any one factor as all important or controlling.
The Gabelli International Small Cap Fund
Additional Fund Information (Unaudited)
The business and affairs of the Fund are managed under the direction of the Fund’s Board of Trustees. Information pertaining to the Directors and officers of the Fund is set forth below. The Corporation’s Statement of Additional Information includes additional information about the Fund’s Directors and is available without charge, upon request, by calling 800-GABELLI (800-422-3554) or by writing to The Gabelli International Small Cap Fund at One Corporate Center, Rye, NY 10580-1422.
Name, Position(s)
Address1
and Age | | Term of Office
and
Length of
Time Served2 | | Number of
Funds
in Fund
Complex
Overseen
by Director | | Principal Occupation(s)
During Past Five Years | | Other Directorships
Held by Director3 |
| INTERESTED DIRECTORS4: | | | | | | |
| | | | | | | |
Mario J. Gabelli, CFA Director and Chief Investment Officer Age: 79 | | Since 1993 | | 31 | | Chairman, Chief Executive Officer, and Chief Investment Officer– Value Portfolios of GAMCO Investors, Inc. and Chief Investment Officer– Value Portfolios of Gabelli Funds, LLC and GAMCO Asset Management Inc.; Director/ Trustee or Chief Investment Officer of other registered investment companies within the Fund Complex; Chief Executive Officer of GGCP, Inc.; Executive Chairman of Associated Capital Group, Inc. | | Director of Morgan Group Holdings, Inc. (holding company); Chairman of the Board and Chief Executive Officer of LICT Corp. (multimedia and communication services company); Director of CIBL, Inc. (broadcasting and wireless communications); Director of ICTC Group Inc. (communications) (2013-2018) |
| | | | | | | | | |
John D. Gabelli Director Age: 77 | | Since 1993 | | 12 | | Former Senior Vice President of G.research, LLC | | — |
| | | | | | | | | |
| INDEPENDENT DIRECTORS5: | | | | |
E. Val Cerutti Director Age: 82 | | Since 2001 | | 7 | | Chief Executive Officer of Cerutti Consultants, Inc. | | Director of The LGL Group, Inc. (diversified manufacturing) (1990-2009) |
| | | | | | | | | |
Anthony J. Colavita6 Director Age: 86 | | Since 1993 | | 18 | | President of the law firm of Anthony J. Colavita, P.C. | | — |
| | | | | | | | | |
Werner J. Roeder Director Age: 81 | | Since 1993 | | 20 | | Retired physician; Former Vice President of Medical Affairs (Medical Director) of New York Presbyterian/Lawrence Hospital (1999-2014) | | — |
| | | | | | | | | |
Anthonie C. van Ekris6 Director Age: 87 | | Since 1993 | | 23 | | Chairman and Chief Executive Officer of BALMAC International, Inc. (global import/ export company) | | — |
The Gabelli International Small Cap Fund
Additional Fund Information (Continued) (Unaudited)
Name, Position(s)
Address1
and Age | | Term of Office
and
Length of
Time Served2 | | Number of
Funds
in Fund
Complex
Overseen
by Director | | Principal Occupation(s)
During Past Five Years | | Other Directorships
Held by Director3 |
Salvatore J. Zizza7 Director Age: 76 | | Since 2004 | | 32 | | President of Zizza & Associates Corp. (private holding company); Chairman of Bergen Cove Realty Inc. (residential real estate) | | Director and Chairman of Trans-Lux Corporation (business services); Director and Chairman of Harbor Diversified Inc. (pharmaceuticals) (2009-2018); Retired Chairman of BAM (semiconductor and aerospace manufacturing) |
The Gabelli International Small Cap Fund
Additional Fund Information (Continued) (Unaudited)
Name, Position(s)
Address1
and Age | | Term of Office
and Length of
Time Served2 | | Principal Occupation(s)
During Past Five Years |
| OFFICERS: | | | | |
Bruce N. Alpert President Age: 70 | | Since 1993 | | Executive Vice President and Chief Operating Officer of Gabelli Funds, LLC since 1988; Officer of registered investment companies within the Fund Complex; Senior Vice President of GAMCO Investors, Inc. since 2008; Vice President – Mutual Funds, G.research, LLC |
| | | | | |
John C. Ball Treasurer Age: 45 | | Since 2017 | | Treasurer of registered investment companies within the Fund Complex since 2017; Vice President and Assistant Treasurer of AMG Funds, 2014-2017; Chief Executive Officer, G.distributors, LLC since December 2020 |
| | | | | |
Peter Goldstein Secretary and Vice President Age: 68 | | Since 2020 | | General Counsel, Gabelli Funds, LLC since July 2020; General Counsel and Chief Compliance Officer, Buckingham Capital Management, Inc. (2012-2020); Chief Legal Officer and Chief Compliance Officer, The Buckingham Research Group, Inc. (2012-2020) |
| | | | | |
Richard J. Walz Chief Compliance Officer Age: 62 | | Since 2013 | | Chief Compliance Officer of registered investment companies within the Fund Complex since 2013; Chief Compliance Officer for Gabelli Funds, LLC since 2015 |
| | | | | |
Daniel Plourde Vice President Age: 41 | | Since 2021 | | Vice President of registered investment companies within the Fund Complex since 2021; Assistant Treasurer of the North American SPDR ETFs and State Street Global Advisors Mutual Funds (2017-2021); Fund Administration at State Street Bank (2009-2017) |
| 1 | Address: One Corporate Center, Rye, NY 10580-1422, unless otherwise noted. |
| 2 | Each Director will hold office for an indefinite term until the earliest of (i) the next meeting of shareholders, if any, called for the purpose of considering the election or re-election of such Director and until the election and qualification of his or her successor, if any, elected at such meeting, or (ii) the date a Director resigns or retires, or a Director is removed by the Board of Directors or shareholders, in accordance with the Corporation’s By-Laws and Articles of Incorporation. For officers, includes time served in prior officer positions with the Fund. Each officer will hold office for an indefinite term until the date he or she resigns or retires or until his or her successor is elected and qualified. |
| 3 | This column includes only directorships of companies required to report to the SEC under the Securities Exchange Act of 1934, as amended, i.e., public companies, or other investment companies registered under the 1940 Act. |
| 4 | “Interested person” of the Corporation as defined in the 1940 Act. Messrs. Mario J. Gabelli and John D. Gabelli, who are brothers, are each considered an “interested person” because of their affiliation with Gabelli Funds, LLC which acts as the Corporation’s investment adviser. |
| 5 | Directors who are not interested persons are considered “Independent” Directors. |
| 6 | Mr. Colavita’s son, Anthony S. Colavita, serves as a director of other funds in the Gabelli Fund Complex. Mr. van Ekris is an independent director of Gabelli International Ltd., Gabelli Fund LDC, GAMA Capital Opportunities Master Ltd., and GAMCO International SICAV, which may be deemed to be controlled by Mario J. Gabelli and/or affiliates and, in that event, would be deemed to be under common control with the Fund’s Adviser. |
| 7 | Mr. Zizza is an independent director of Gabelli International Ltd., which may be deemed to be controlled by Mario J. Gabelli and/or affiliates and in that event would be deemed to be under common control with the Fund’s Adviser. On September 9, 2015, Mr. Zizza entered into a settlement with the SEC to resolve an inquiry relating to an alleged violation regarding the making of false statements or omissions to the accountants of a company concerning a related party transaction. The company in question is not an affiliate of, nor has any connection to, the Fund. Under the terms of the settlement, Mr. Zizza, without admitting or denying the SEC’s findings and allegation, paid $150,000 and agreed to cease and desist committing or causing any future violations of Rule 13b2-2 of the Securities Exchange Act of 1934, as amended. The Board has discussed this matter and has determined that it does not disqualify Mr. Zizza from serving as an Independent Director. |
Gabelli Funds and Your Personal Privacy
Who are we?
The Gabelli Funds are investment companies registered with the Securities and Exchange Commission under the Investment Company Act of 1940. We are managed by Gabelli Funds, LLC, which is affiliated with GAMCO Investors, Inc., a publicly held company with subsidiaries and affiliates that provide investment advisory services for a variety of clients.
What kind of non-public information do we collect about you if you become a fund shareholder?
If you apply to open an account directly with us, you will be giving us some non-public information about yourself. The non-public information we collect about you is:
| ● | Information you give us on your application form. This could include your name, address, telephone number, social security number, bank account number, and other information. |
| ● | Information about your transactions with us, any transactions with our affiliates, and transactions with the entities we hire to provide services to you. This would include information about the shares that you buy or redeem. If we hire someone else to provide services — like a transfer agent — we will also have information about the transactions that you conduct through them. |
What information do we disclose and to whom do we disclose it?
We do not disclose any non-public personal information about our customers or former customers to anyone other than our affiliates, our service providers who need to know such information, and as otherwise permitted by law. If you want to find out what the law permits, you can read the privacy rules adopted by the Securities and Exchange Commission. They are in volume 17 of the Code of Federal Regulations, Part 248. The Commission often posts information about its regulations on its website, www. sec.gov.
What do we do to protect your personal information?
We restrict access to non-public personal information about you to the people who need to know that information in order to provide services to you or the fund and to ensure that we are complying with the laws governing the securities business. We maintain physical, electronic, and procedural safeguards to keep your personal information confidential.
The Gabelli International Small Cap Fund
2021 TAX NOTICE TO SHAREHOLDERS (Unaudited) During the year ended December 31, 2021, the Fund paid $0.32650 per share to shareholders in each Class of shares. For the year ended December 31, 2021, 0.00% of the ordinary income distribution qualifies for the dividends received deduction available to corporations. The Fund designates 86.23% of the ordinary income distribution as qualified dividend income pursuant to the Jobs and Growth Tax Relief Reconciliation Act of 2003. The Fund designates 0.08% of the ordinary income distribution as qualified interest income pursuant to the Tax Relief, Unemployment Reauthorization, and Job Creation Act of 2010. Also during 2021, the Fund passed through foreign tax credits of $0.03312 per share to each Class of shares. U.S. Government Income: The percentage of the ordinary income distribution paid by the Fund during the year ended December 31, 2021 which was derived from U.S. Treasury securities was 0.04%. Such income is exempt from state and local tax in all states. However, many states, including New York and California, allow a tax exemption for a portion of the income earned only if a mutual fund has invested at least 50% of its assets at the end of each quarter of the Fund’s fiscal year in U.S. Government securities. The Fund did not meet this strict requirement in 2021. The percentage of U.S. Government securities held as of December 31, 2021 was 2.15%. Due to the diversity in state and local tax law, it is recommended that you consult your personal tax adviser as to the applicability of the information provided to your specific situation. All designations are based on financial information available as of the date of this annual report and, accordingly, are subject to change. For each item, it is the intention of the Fund to designate the maximum amount permitted under the Internal Revenue Code and the regulations thereunder. |
This page was intentionally left blank.
This page was intentionally left blank.
THE GABELLI INTERNATIONAL SMALL CAP FUND
One Corporate Center
Rye, NY 10580-1422
Portfolio Management Team Biographies
Caesar M. P. Bryan joined GAMCO Asset Management in 1994. He is a member of the global investment team of Gabelli Funds, LLC and portfolio manager of several funds within the Fund Complex. Prior to joining Gabelli, Mr. Bryan was a portfolio manager at Lexington Management. He began his investment career at Samuel Montagu Company, the London based merchant bank. Mr. Bryan graduated from the University of Southampton in England with a Bachelor of Law and is a member of the English Bar.
Gustavo Pifano joined the Firm in 2008 and is based in London. He serves as an assistant vice president of research and covers the industrial and consumer sectors with a focus on small-cap stocks. Gustavo is a member of the risk management group and responsible for the Firm’s UK compliance oversight and anti-money laundering reporting functions. Gustavo holds a BBA in Finance from University of Miami and an MBA from University of Oxford Said Business School.
Ashish Sinha joined GAMCO UK in 2012 as a research analyst. Prior to joining the Firm, Mr. Sinha was a research analyst at Morgan Stanley in London for seven years and has covered European Technology, Mid-Caps, and Business Services. He also worked in planning and strategy at Birla Sun Life Insurance in India. Currently Mr. Sinha is a portfolio manager of Gabelli Funds, LLC and an Assistant Vice President of GAMCO Asset Management UK. Mr. Sinha has a BSBA degree from the Institute of Management Studies and an MB from IIFT.
| We have separated the portfolio managers’ commentary from the financial statements and investment portfolio due to corporate governance regulations stipulated by the Sarbanes-Oxley Act of 2002. We have done this to ensure that the contents of the portfolio managers’ commentary are unrestricted. Both the commentary and the financial statements, including the portfolios of investments, will be available on our website at www.gabelli.com. |
GAMCO Global Series Funds, Inc.
THE GABELLI INTERNATIONAL SMALL CAP FUND
One Corporate Center
Rye, New York 10580-1422
t 800-GABELLI (800-422-3554)
f 914-921-5118
e info@gabelli.com
GABELLI.COM
Net Asset Values per share available daily by calling 800-GABELLI after 7:00 P.M.
TRUSTEES Mario J. Gabelli, CFA Chairman and Chief Executive Officer, GAMCO Investors, Inc. Executive Chairman, Associated Capital Group Inc. E. Val Cerutti Chief Executive Officer, Cerutti Consultants, Inc. Anthony J. Colavita President, Anthony J. Colavita, P.C. John D. Gabelli Former Senior Vice President, G.research, LLC Werner J. Roeder Former Medical Director, Lawrence Hospital Anthonie C. van Ekris Chairman, BALMAC International, Inc. Salvatore J. Zizza Chairman, Zizza & Associates Corp. | OFFICERS Bruce N. Alpert President John C. Ball Treasurer Peter Goldstein Secretary and Vice President Richard J. Walz Chief Compliance Officer Daniel Plourde Vice President DISTRIBUTOR G.distributors, LLC CUSTODIAN State Street Bank and Trust Company TRANSFER AGENT, AND DIVIDEND DISBURSING AGENT DST Asset Manager Solutions, Inc. LEGAL COUNSEL Skadden, Arps, Slate, Meagher & Flom LLP |
This report is submitted for the general information of the shareholders of The Gabelli International Small Cap Fund. It is not authorized for distribution to prospective investors unless preceded or accompanied by an effective prospectus.
GAB403Q421AR

The Gabelli Global Mini Mites Fund
Annual Report — December 31, 2021
To Our Shareholders,
For the year ended December 31, 2021, the net asset value (NAV) total return per Class AAA Share of The Gabelli Global Mini Mites Fund was 19.3% compared with a total return of 15.2% for the S&P Developed SmallCap Index. Other classes of shares are available. See page 3 for performance information for all classes.
Enclosed are the financial statements, including the schedule of investments, as of December 31, 2021.
Investment Objective and Strategy (Unaudited)
The Gabelli Global Mini Mites Fund, a series of GAMCO Global Series Funds, Inc. commenced investment operations on October 1, 2018. The Fund is a non-diversified open end management investment company whose investment objective is to seek to provide investors with long term capital appreciation.
The Fund’s investment strategy is to invest in common stocks of smaller companies that have a market capitalization (defined as shares outstanding times current market price) of $250 million or less at the time of the Fund’s initial investment. These companies are called micro-cap companies. As a “global” fund, the Fund invests in securities of issuers located in at least three countries and at least 40% of its net assets are invested in securities of non U.S. issuers.
Performance Discussion (Unaudited)
Following more than a decade of growth stock leadership, the first quarter of 2021 saw the trend of rotation to value stocks continue. Following a steep, rather short, recession, the U.S. economy rebounded in tandem with massive government fiscal stimulus along with unprecedented Federal Reserve monetary accommodation.
| As permitted by regulations adopted by the Securities and Exchange Commission, paper copies of the Fund’s annual and semiannual shareholder reports will no longer be sent by mail, unless you specifically request paper copies of the reports. Instead, the reports will be made available on the Fund’s website (www.gabelli.com), and you will be notified by mail each time a report is posted and provided with a website link to access the report. If you already elected to receive shareholder reports electronically, you will not be affected by this change and you need not take any action. To elect to receive all future reports on paper free of charge, please contact your financial intermediary, or, if you invest directly with the Fund, you may call 800-422-3554 or send an email request to info@gabelli.com. |
During the second quarter, the equity bull market remained intact as U.S. and global economies rebounded from pandemic driven shutdowns with a surge of consumer spending on retail, travel, leisure, and hospitality. Widespread vaccination in the U.S. to protect against the spread of COVID-19 has allowed bars, restaurants, and entertainment venues to reopen. Air travel reached pre-pandemic levels, hotel occupancies rose rapidly, and major cities like New York, were once again vibrant and bustling with commuter traffic. Underpinning the broad based reopening of America was trillions of dollars of government fiscal stimulus funneled to businesses along with funding to unemployed workers hit hardest by the pandemic. Against this backdrop was the U.S. Federal Reserve with its unprecedented quantitative easing, fostering negative real interest rates, adjusted for inflation.
In the third quarter, the U.S. economy continued its robust growth trajectory. The economy rebounded from its pandemic lows, and corporate earnings stood above their pre-pandemic highs. Supply chain constraints became a discussion topic in virtually every corporate earnings call, with higher input cots being reflected in both producer and consumer prices. Many companies passed these additional costs onto consumers through higher prices, further stoking consumer inflation. In September the U.S. Federal Reserve signaled that it was on track to start scaling back asset purchases before year end.
The year closed with growth stocks generally outperforming value stocks, and with large cap stocks generally outperforming small cap stocks.
Selected holdings that contributed positively to performance in 2021 were: Steel Partners Holdings LP (4.1% of net assets as of December 31, 2021), a diversified global holding company that owns and operates businesses, and has significant interests in various companies, including diversified industrial products, energy, banking, defense, direct marketing, supply chain management and logistics and youth sports. The L.S. Starrett Co. (1.8%) is a global manufacturer of precision tools, electronic gages, laser measuring equipment, and construction products. Uni-Select Inc. (1.6%) is a leading distributor of automotive refinish and industrial coatings and related products in North America. Commercial Vehicle Group is a provider of components and assemblies to vehicle OEMs and aftermarket.
Some of our weaker performing holdings during the year were: Strattec Security Corp. (2.7%), which designs, develops, manufactures, and markets automotive access control products under the VAST Automotive Group brand primarily in North America; GAN Ltd. (0.7%), operating as a business-to-business supplier of internet gambling software as a service solution to online casino gaming and online sports betting applications in the United States and internationally; and Communications Systems Inc., which through its subsidiaries, provides connectivity infrastructure products and services for deployments of broadband networks worldwide.
Thank you for your investment in the Gabelli Global Mini Mites Fund.
We appreciate your confidence and trust.
Comparative Results
Average Annual Returns through December 31, 2021 (a) (Unaudited)
Total returns and average annual returns reflect changes in share price, reinvestment of distributions, and are net of expenses.
| | | 1 Year | | 3 Year | | Since
Inception
(10/1/18) |
| Class AAA (GAMNX) | | 19.25 | % | | 15.49 | % | | 9.16 | % |
| S&P Developed SmallCap Index (b) | | 15.18 | | | 12.40 | | | 10.62 | |
| Class A (GMNAX) | | 19.38 | | | 15.49 | | | 9.15 | |
| With sales charge (c) | | 12.52 | | | 13.23 | | | 7.18 | |
| Class C (GMNCX) | | 19.34 | | | 15.28 | | | 8.90 | |
| With contingent deferred sales charge (d) | | 18.34 | | | 15.28 | | | 8.90 | |
| Class I (GGMMX) | | 19.25 | | | 15.61 | | | 9.24 | |
| (a) | Returns would have been lower had the Adviser not reimbursed certain expenses of the Fund. The Fund imposes a 2% redemption fee on shares sold or exchanged within seven days of purchase. |
| (b) | The S&P Developed Small Cap Index is a float-adjusted market-capitalization-weighted index designed to measure the equity market performance of small-capitalization companies located in developed markets. The index is composed of companies within the bottom 15% of the cumulative market capitalization in developed markets. The index covers all publicly listed equities with float-adjusted market values of U.S. $100 million or more and annual dollar value traded of at least U.S. $50 million in all included countries. Dividends are considered reinvested. You cannot invest directly in an index. |
| (c) | Performance results include the effect of the maximum 5.75% sales charge at the beginning of the period. |
| (d) | Assuming payment of the 1% maximum contingent deferred sales charge imposed on redemptions made within one year of purchase. No existing C Class shares are currently subject to the CDSC as of the date of this report. |
In the current prospectuses dated April 30, 2021, the gross expense ratios for Class AAA, A, C, and I Shares are 9.40%, 9.40%, 10.15%, and 9.15%, respectively, and the net expense ratio for all share classes after contractual reimbursements by Gabelli Funds, LLC, (the Adviser) is 0.90%. See page 12 for the expense ratios for the year ended December 31, 2021. The contractual reimbursements are in effect through April 30, 2022. Class AAA and Class I Shares do not have a sales charge. The maximum sales charge for Class A Shares and Class C Shares is 5.75% and 1.00%, respectively.
Investing in foreign securities involves risks not ordinarily associated with investments in domestic issues, including currency fluctuation, economic, and political risks. Investors should carefully consider the investment objectives, risks, charges, and expenses of the Fund before investing. The prospectus contains information about these and other matters and should be read carefully before investing. To obtain a prospectus, please visit our website at www.gabelli.com.
Returns represent past performance and do not guarantee future results. Investment returns and the principal value of an investment will fluctuate. When shares are redeemed, they may be worth more or less than their original cost. Current performance may be lower or higher than the performance data presented. Visit www.gabelli.com for performance information as of the most recent month end.
COMPARISON OF CHANGE IN VALUE OF A $10,000 INVESTMENT IN
THE GABELLI GLOBAL MINI MITES FUND (CLASS AAA SHARES)
AND S&P DEVELOPED SMALLCAP INDEX (Unaudited)
| Average Annual Total Returns* |
| | 1 Year | 3 Year | Since Inception |
| Class AAA | 19.25% | 15.49% | 9.16% |
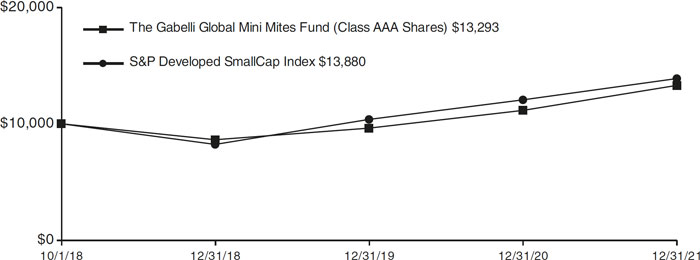
* Past performance is not predictive of future results. The performance tables and graph do not reflect the deduction of taxes that a shareholder would pay on Fund distributions or the redemption of Fund shares.
The Gabelli Global Mini Mites Fund
Disclosure of Fund Expenses (Unaudited)
| For the Six Month Period from July 1, 2021 through December 31, 2021 | Expense Table |
We believe it is important for you to understand the impact of fees and expenses regarding your investment. All mutual funds have operating expenses. As a shareholder of a fund, you incur ongoing costs, which include costs for portfolio management, administrative services, and shareholder reports (like this one), among others. Operating expenses, which are deducted from a fund’s gross income, directly reduce the investment return of a fund. When a fund’s expenses are expressed as a percentage of its average net assets, this figure is known as the expense ratio. The following examples are intended to help you understand the ongoing costs (in dollars) of investing in your Fund and to compare these costs with those of other mutual funds. The examples are based on an investment of $1,000 made at the beginning of the period shown and held for the entire period.
The Expense Table below illustrates your Fund’s costs in two ways:
Actual Fund Return: This section provides information about actual account values and actual expenses. You may use this section to help you to estimate the actual expenses that you paid over the period after any fee waivers and expense reimbursements. The “Ending Account Value” shown is derived from the Fund’s actual return during the past six months, and the “Expenses Paid During Period” shows the dollar amount that would have been paid by an investor who started with $1,000 in the Fund. You may use this information, together with the amount you invested, to estimate the expenses that you paid over the period.
To do so, simply divide your account value by $1,000 (for example, an $8,600 account value divided by $1,000 = 8.6), then multiply the result by the number given for your Fund under the heading “Expenses Paid During Period” to estimate the expenses you paid during this period.
Hypothetical 5% Return: This section provides information about hypothetical account values and hypothetical expenses based on the Fund’s actual expense ratio. It assumes a hypothetical annualized return of 5% before expenses during the period shown. In this case – because the hypothetical return used is not the Fund’s actual return – the results do not apply to your investment and you cannot use the hypothetical account value and expense to estimate the actual ending account balance or expenses you
paid for the period. This example is useful in making comparisons of the ongoing costs of investing in the Fund and other funds. To do so, compare this 5% hypothetical example with the 5% hypothetical examples that appear in shareholder reports of other funds.
Please note that the expenses shown in the table are meant to highlight your ongoing costs only and do not reflect any transactional costs such as sales charges (loads), redemption fees, or exchange fees, if any, which are described in the Prospectus. If these costs were applied to your account, your costs would be higher. Therefore, the 5% hypothetical return is useful in comparing ongoing costs only, and will not help you determine the relative total costs of owning different funds. The “Annualized Expense Ratio” represents the actual expenses for the last six months and may be different from the expense ratio in the Financial Highlights which is for the year ended December 31, 2021.
| | | Beginning
Account Value
07/01/21 | | Ending
Account Value
12/31/21 | | Annualized
Expense
Ratio | | Expenses Paid During Period * |
| The Gabelli Global Mini Mites | | | | |
| Actual Fund Return | | | | | | |
| Class AAA | | $ | 1,000.00 | | | | $913.40 | | | 0.90 | % | | $ | 4.34 | |
| Class A | | $ | 1,000.00 | | | | $914.20 | | | 0.90 | % | | $ | 4.34 | |
| Class C | | $ | 1,000.00 | | | | $914.00 | | | 0.90 | % | | $ | 4.34 | |
| Class I | | $ | 1,000.00 | | | | $913.40 | | | 0.90 | % | | $ | 4.34 | |
| Hypothetical 5% Return | | | | | | | | | | | | | | | |
| Class AAA | | $ | 1,000.00 | | | $ | 1,020.67 | | | 0.90 | % | | $ | 4.58 | |
| Class A | | $ | 1,000.00 | | | $ | 1,020.67 | | | 0.90 | % | | $ | 4.58 | |
| Class C | | $ | 1,000.00 | | | $ | 1,020.67 | | | 0.90 | % | | $ | 4.58 | |
| Class I | | $ | 1,000.00 | | | $ | 1,020.67 | | | 0.90 | % | | $ | 4.58 | |
| * | Expenses are equal to the Fund’s annualized expense ratio for the last six months multiplied by the average account value over the period, multiplied by the number of days in the most recent fiscal half year (184 days), then divided by 365. |
Summary of Portfolio Holdings (Unaudited)
The following table presents portfolio holdings as a percent of net assets as of December 31, 2021:
The Gabelli Global Mini Mites Fund
| Diversified Industrial | | | 18.8 | % | | Computer Software and Services | | | 2.9 | % |
| Machinery | | | 7.8 | % | | Hotels and Gaming | | | 2.8 | % |
| Automotive: Parts and Accessories | | | 7.5 | % | | Retail | | | 2.6 | % |
| Consumer Products | | | 7.4 | % | | Specialty Chemicals | | | 2.0 | % |
| Health Care | | | 6.2 | % | | Building and Construction | | | 1.7 | % |
| Real Estate | | | 5.5 | % | | Equipment and Supplies | | | 1.3 | % |
| Food and Beverage | | | 5.2 | % | | Agriculture | | | 1.3 | % |
| Financial Services | | | 4.3 | % | | Aerospace and Defense | | | 1.0 | % |
| Business Services | | | 3.9 | % | | Metals and Mining | | | 0.5 | % |
| Electronics | | | 3.9 | % | | Consumer Services | | | 0.1 | % |
| U.S. Government Obligations | | | 3.5 | % | | Wireless Telecommunications Services | | | 0.1 | % |
| Broadcasting | | | 3.4 | % | | Telecommunications | | | 0.1 | % |
| Entertainment | | | 3.3 | % | | Other Assets and Liabilities (Net) | | | (0.3 | )% |
| Energy and Utilities | | | 3.2 | % | | | | | 100.0 | % |
| | | | | | | | | | | |
The Fund files a complete schedule of portfolio holdings with the Securities and Exchange Commission (the SEC) for the first and third quarters of each fiscal year on Form N-PORT. Shareholders may obtain this information at www.gabelli.com or by calling the Fund at 800-GABELLI (800-422-3554). The Fund’s Form N-PORT is available on the SEC’s website at www.sec.gov and may also be reviewed and copied at the SEC’s Public Reference Room in Washington, DC. Information on the operation of the Public Reference Room may be obtained by calling 800-SEC-0330.
Proxy Voting
The Fund files Form N-PX with its complete proxy voting record for the twelve months ended June 30, no later than August 31 of each year. A description of the Fund’s proxy voting policies, procedures, and how each Fund voted proxies relating to portfolio securities is available without charge, upon request, by (i) calling 800-GABELLI (800-422-3554); (ii) writing to The Gabelli Funds at One Corporate Center, Rye, NY 10580-1422; or (iii) visiting the SEC’s website at www.sec.gov.
The Gabelli Global Mini Mites Fund
Schedule of Investments — December 31, 2021
| Shares | | | | | Cost | | | Market Value | |
| | | | COMMON STOCKS — 95.8% | | | | | | |
| | | | | Aerospace and Defense — 1.0% | | | | | | | | |
| | 5,000 | | | Avio SpA | | $ | 67,427 | | | $ | 66,602 | |
| | 1,000 | | | CPI Aerostructures Inc.† | | | 2,388 | | | | 2,730 | |
| | | | | | | | 69,815 | | | | 69,332 | |
| | | | | | | | | | | | | |
| | | | | Agriculture — 1.3% | | | | | | | | |
| | 2,000 | | | Limoneira Co. | | | 34,517 | | | | 30,000 | |
| | 21,000 | | | S&W Seed Co.† | | | 75,207 | | | | 57,330 | |
| | | | | | | | 109,724 | | | | 87,330 | |
| | | | | Automotive: Parts and Accessories — 6.9% | | | | | | | | |
| | 4,000 | | | Garrett Motion Inc.† | | | 16,780 | | | | 32,120 | |
| | 12,200 | | | Modine Manufacturing Co.† | | | 73,911 | | | | 123,098 | |
| | 300 | | | Motorcar Parts of America Inc.† | | | 4,686 | | | | 5,121 | |
| | 1,000 | | | Smart Eye AB† | | | 10,418 | | | | 21,757 | |
| | 5,000 | | | Strattec Security Corp.† | | | 192,508 | | | | 185,100 | |
| | 5,500 | | | Uni-Select Inc.† | | | 29,662 | | | | 111,917 | |
| | | | | | | | 327,965 | | | | 479,113 | |
| | | | | Broadcasting — 3.4% | | | | | | | | |
| | 8,000 | | | Beasley Broadcast Group Inc., Cl. A† | | | 17,765 | | | | 15,120 | |
| | 12,000 | | | Corus Entertainment Inc., Cl. B | | | 51,112 | | | | 45,156 | |
| | 13,000 | | | Townsquare Media Inc., Cl. A† | | | 169,299 | | | | 173,290 | |
| | | | | | | | 238,176 | | | | 233,566 | |
| | | | | Building and Construction — 1.7% | | | | | | | | |
| | 14,000 | | | Armstrong Flooring Inc.† | | | 48,648 | | | | 27,720 | |
| | 4,000 | | | Gencor Industries Inc.† | | | 48,857 | | | | 46,120 | |
| | 1,925 | | | Neinor Homes SA | | | 24,184 | | | | 23,100 | |
| | 200 | | | The Monarch Cement Co. | | | 11,234 | | | | 21,000 | |
| | | | | | | | 132,923 | | | | 117,940 | |
| | | | | Business Services — 3.9% | | | | | | | | |
| | 1,500 | | | AssetCo plc† | | | 17,249 | | | | 31,470 | |
| | 20,000 | | | B Intressenter AB† | | | 453 | | | | 443 | |
| | 10,000 | | | Diebold Nixdorf Inc.† | | | 100,658 | | | | 90,500 | |
| | 4,000 | | | eWork Group AB | | | 33,432 | | | | 58,786 | |
| | 6,500 | | | Marin Software Inc.† | | | 38,033 | | | | 24,115 | |
| | 1,500 | | | MIND Technology Inc.† | | | 4,884 | | | | 2,490 | |
| | 3,000 | | | MoneyGram International Inc.† | | | 20,237 | | | | 23,670 | |
| | 4,000 | | | Team Inc.† | | | 18,787 | | | | 4,360 | |
| | 50,102 | | | Trans-Lux Corp.† | | | 12,475 | | | | 26,078 | |
| | 200 | | | TravelCenters of America Inc.† | | | 6,014 | | | | 10,324 | |
| | | | | | | | 252,222 | | | | 272,236 | |
| | | | | Computer Software and Services — 2.9% | | | | | | | | |
| | 8,000 | | | Alithya Group Inc., Cl. A† | | | 24,396 | | | | 20,400 | |
| | 1,200 | | | Asetek A/S† | | | 4,635 | | | | 5,587 | |
| Shares | | | | | Cost | | | Market Value | |
| | 5,500 | | | Daktronics Inc.† | | $ | 35,386 | | | $ | 27,775 | |
| | 9,000 | | | GTY Technology Holdings Inc.† | | | 46,417 | | | | 60,300 | |
| | 200 | | | Otonomo Technologies Ltd.† | | | 966 | | | | 818 | |
| | 70,000 | | | Pacific Online Ltd. | | | 14,776 | | | | 12,299 | |
| | 800 | | | Rubicon Technology Inc.† | | | 6,259 | | | | 7,176 | |
| | 3,000 | | | Steel Connect Inc.† | | | 1,683 | | | | 4,170 | |
| | 20,000 | | | ZetaDisplay AB†(a) | | | 62,960 | | | | 59,759 | |
| | | | | | | | 197,478 | | | | 198,284 | |
| | | | | Consumer Products — 7.4% | | | | | | | | |
| | 18,000 | | | Aspen Group Inc.† | | | 86,931 | | | | 42,480 | |
| | 2,500 | | | CompX International Inc. | | | 35,602 | | | | 56,175 | |
| | 20,000 | | | Goodbaby International Holdings Ltd.† | | | 3,243 | | | | 2,565 | |
| | 3,724 | | | HG Holdings Inc.† | | | 33,739 | | | | 43,757 | |
| | 7,500 | | | Landec Corp.† | | | 80,675 | | | | 83,250 | |
| | 2,000 | | | Lifetime Brands Inc. | | | 19,709 | | | | 31,940 | |
| | 4,500 | | | Marine Products Corp. | | | 68,848 | | | | 56,250 | |
| | 3,000 | | | Nobility Homes Inc. | | | 87,608 | | | | 105,000 | |
| | 2,500 | | | Oil-Dri Corp. of America | | | 90,213 | | | | 81,825 | |
| | 71,000 | | | Playmates Holdings Ltd. | | | 10,621 | | | | 7,011 | |
| | | | | | | | 517,189 | | | | 510,253 | |
| | | | | Consumer Services — 0.1% | | | | | | | | |
| | 4,000 | | | Liberty TripAdvisor Holdings Inc., Cl. A† | | | 11,075 | | | | 8,680 | |
| | | | | | | | | | | | | |
| | | | | Diversified Industrial — 18.4% | | | | | | | | |
| | 50,000 | | | Ampco-Pittsburgh Corp.† | | | 255,108 | | | | 250,000 | |
| | 26,500 | | | Commercial Vehicle Group Inc.† | | | 230,060 | | | | 213,590 | |
| | 2,500 | | | Core Molding Technologies Inc.† | | | 19,782 | | | | 21,275 | |
| | 31,000 | | | Fluence Corp. Ltd.† | | | 7,941 | | | | 3,383 | |
| | 4,000 | | | Graham Corp. | | | 52,566 | | | | 49,760 | |
| | 28,000 | | | INNOVATE Corp.† | | | 77,943 | | | | 103,600 | |
| | 13,504 | | | Intevac Inc.† | | | 86,997 | | | | 63,604 | |
| | 6,000 | | | Myers Industries Inc | | | 116,472 | | | | 120,060 | |
| | 7,100 | | | Park-Ohio Holdings Corp. | | | 188,014 | | | | 150,307 | |
| | 12,045 | | | Synalloy Corp.† | | | 119,934 | | | | 197,899 | |
| | 8,000 | | | Tredegar Corp. | | | 121,776 | | | | 94,560 | |
| | | | | | | | 1,276,593 | | | | 1,268,038 | |
| | | | | Electronics — 3.9% | | | | | | | | |
| | 20,000 | | | Bel Fuse Inc., Cl. B | | | 273,542 | | | | 258,600 | |
| | 1,000 | | | Richardson Electronics Ltd. | | | 11,753 | | | | 13,520 | |
| | | | | | | | 285,295 | | | | 272,120 | |
| | | | | Energy and Utilities — 3.2% | | | | | | | | |
| | 9,300 | | | Capstone Green Energy Corp.† | | | 43,190 | | | | 30,876 | |
| | 800 | | | Consolidated Water Co. Ltd. | | | 8,168 | | | | 8,512 | |
See accompanying notes to financial statements.
The Gabelli Global Mini Mites Fund
Schedule of Investments (Continued) — December 31, 2021
| Shares | | | | | Cost | | | Market Value | |
| | | | | COMMON STOCKS (Continued) | | | | | | | | |
| | | | | Energy and Utilities (Continued) | | | | | | | | |
| | 4,000 | | | Dril-Quip Inc.† | | $ | 81,454 | | | $ | 78,720 | |
| | 13,000 | | | Trecora Resources† | | | 102,542 | | | | 105,040 | |
| | | | | | | | 235,354 | | | | 223,148 | |
| | | | | Entertainment — 3.3% | | | | | | | | |
| | 600 | | | Du-Art Film Laboratories Inc.† | | | 47,912 | | | | 39,000 | |
| | 4,200 | | | Engine Gaming and Media Inc.† | | | 29,443 | | | | 12,783 | |
| | 5,500 | | | GAN Ltd.† | | | 87,540 | | | | 50,545 | |
| | 3,000 | | | Inspired Entertainment Inc.† | | | 31,339 | | | | 38,880 | |
| | 7,000 | | | Reading International Inc., Cl. A† | | | 44,204 | | | | 28,280 | |
| | 100,000 | | | Sportech plc† | | | 37,134 | | | | 51,435 | |
| | 100 | | | Xilam Animation SA† | | | 4,332 | | | | 4,736 | |
| | | | | | | | 281,904 | | | | 225,659 | |
| | | | | Equipment and Supplies — 1.3% | | | | | | | | |
| | 3,500 | | | The Eastern Co. | | | 81,272 | | | | 88,060 | |
| | | | | | | | | | | | | |
| | | | | Financial Services — 4.3% | | | | | | | | |
| | 10,000 | | | GAM Holding AG† | | | 23,077 | | | | 14,925 | |
| | 6,700 | | | Steel Partners Holdings LP† | | | 37,367 | | | | 281,400 | |
| | | | | | | | 60,444 | | | | 296,325 | |
| | | | | Food and Beverage — 5.2% | | | | | | | | |
| | 1,000 | | | Corby Spirit and Wine Ltd., Cl. A | | | 14,197 | | | | 13,258 | |
| | 34,000 | | | Farmer Brothers Co.† | | | 226,822 | | | | 253,300 | |
| | 1,600 | | | Nathan’s Famous Inc. | | | 95,315 | | | | 93,424 | |
| | | | | | | | 336,334 | | | | 359,982 | |
| | | | | Health Care — 6.2% | | | | | | | | |
| | 2,000 | | | Accuray Inc.† | | | 8,180 | | | | 9,540 | |
| | 40,000 | | | Achaogen Inc.†(a) | | | 488 | | | | 0 | |
| | 10,000 | | | BioDelivery Sciences International Inc.† | | | 33,199 | | | | 31,000 | |
| | 500 | | | Cutera Inc.† | | | 5,735 | | | | 20,660 | |
| | 200 | | | Daxor Corp.† | | | 2,214 | | | | 2,257 | |
| | 1,500 | | | Electromed Inc.† | | | 14,633 | | | | 19,500 | |
| | 5,500 | | | IntriCon Corp.† | | | 72,055 | | | | 88,935 | |
| | 4,370 | | | IRRAS AB† | | | 6,339 | | | | 1,886 | |
| | 8,500 | | | Neuronetics Inc.† | | | 75,203 | | | | 37,910 | |
| | 4,000 | | | Oncimmune Holdings plc† | | | 4,931 | | | | 9,475 | |
| | 1,750 | | | Option Care Health Inc.† | | | 17,134 | | | | 49,770 | |
| | 33,000 | | | Paratek Pharmaceuticals Inc.† | | | 166,498 | | | | 148,170 | |
| | 1,300 | | | Tristel plc | | | 4,856 | | | | 8,006 | |
| | | | | | | | 411,465 | | | | 427,109 | |
| | | | | Hotels and Gaming — 2.8% | | | | | | | | |
| | 4,000 | | | Canterbury Park Holding Corp.† | | | 52,654 | | | | 69,040 | |
| Shares | | | | | Cost | | | Market Value | |
| | 4,000 | | | Full House Resorts Inc.† | | $ | 18,812 | | | $ | 48,440 | |
| | 500 | | | Genius Sports Ltd.† | | | 7,402 | | | | 3,800 | |
| | 14,000 | | | LeoVegas AB | | | 67,694 | | | | 54,288 | |
| | 1,000 | | | The Marcus Corp.† | | | 21,413 | | | | 17,860 | |
| | | | | | | | 167,975 | | | | 193,428 | |
| | | | | Machinery — 7.8% | | | | | | | | |
| | 100 | | | Astec Industries Inc. | | | 2,925 | | | | 6,927 | |
| | 6,000 | | | CFT SpA†(a) | | | 33,163 | | | | 31,423 | |
| | 21,000 | | | L.B. Foster Co., Cl. A† | | | 341,166 | | | | 288,750 | |
| | 13,000 | | | The L.S. Starrett Co., Cl. A† | | | 44,264 | | | | 121,550 | |
| | 8,243 | | | Twin Disc Inc.† | | | 73,637 | | | | 90,343 | |
| | | | | | | | 495,155 | | | | 538,993 | |
| | | | | Metals and Mining — 0.5% | | | | | | | | |
| | 27,000 | | | Sierra Metals Inc. | | | 90,044 | | | | 36,720 | |
| | | | | | | | | | | | | |
| | | | | Real Estate — 5.5% | | | | | | | | |
| | 6,500 | | | Atrium European Real Estate Ltd. | | | 26,820 | | | | 26,604 | |
| | 65,000 | | | Corem Property Group AB, Cl. B | | | 149,987 | | | | 234,861 | |
| | 1,000 | | | Indus Realty Trust Inc., REIT | | | 49,120 | | | | 81,060 | |
| | 21,502 | | | Trinity Place Holdings Inc.† | | | 44,753 | | | | 39,564 | |
| | | | | | | | 270,680 | | | | 382,089 | |
| | | | | Retail — 2.6% | | | | | | | | |
| | 300 | | | RumbleON Inc., Cl. B† | | | 8,946 | | | | 12,456 | |
| | 7,000 | | | Village Super Market Inc., Cl. A | | | 159,683 | | | | 163,730 | |
| | | | | | | | 168,629 | | | | 176,186 | |
| | | | | Specialty Chemicals — 2.0% | | | | | | | | |
| | 8,000 | | | Treatt plc | | | 43,363 | | | | 139,145 | |
| | | | | | | | | | | | | |
| | | | | Telecommunications — 0.1% | | | | | | | | |
| | 700 | | | Bittium Oyj | | | 4,945 | | | | 4,224 | |
| | 200 | | | Communications Systems Inc. | | | 1,335 | | | | 480 | |
| | | | | | | | 6,280 | | | | 4,704 | |
| | | | | Wireless Telecommunications Services — 0.1% | | | | | | | | |
| | 22,877 | | | NII Holdings Inc., Escrow† | | | 442 | | | | 6,863 | |
| | | | | | | | | | | | | |
| | | | | TOTAL COMMON STOCKS | | | 6,067,796 | | | | 6,615,303 | |
| | | | | | | | | | | | | |
| | | | | CONVERTIBLE PREFERRED STOCKS — 0.6% | | | | | | | | |
| | | | | Automotive: Parts and Accessories — 0.6% | | | | | | | | |
| | 5,200 | | | Garrett Motion Inc., Ser. A, 11.000% | | | 27,300 | | | | 43,576 | |
See accompanying notes to financial statements.
The Gabelli Global Mini Mites Fund
Schedule of Investments (Continued) — December 31, 2021
| Shares | | | | | Cost | | | Market Value | |
| | | | WARRANTS — 0.4% | | | | | | |
| | | | | Business Services — 0.0% | | | | | | | | |
| | 4 | | | Internap Corp., expire 05/08/24†(a) | | $ | 0 | | | $ | 2,608 | |
| | | | | | | | | | | | | |
| | | | | Diversified Industrial — 0.4% | | | | | | | | |
| | 44,000 | | | Ampco-Pittsburgh Corp., expire 08/01/25† | | | 30,056 | | | | 25,951 | |
| | | | | | | | | | | | | |
| | | | | Energy and Utilities — 0.0% | | | | | | | | |
| | 693 | | | Weatherford International plc, expire 12/13/23† | | | 0 | | | | 347 | |
| | | | | | | | | | | | | |
| | | | | TOTAL WARRANTS | | | 30,056 | | | | 28,906 | |
Principal Amount | | | | | | | | | | | |
| | | | | U.S. GOVERNMENT OBLIGATIONS — 3.5% | | | | | | | | |
| $ | 240,000 | | | U.S. Treasury Bills, 0.050%††, 03/10/22 | | | 239,978 | | | | 239,983 | |
| | | | | | | | | | | | | |
| | | | | TOTAL INVESTMENTS — 100.3% | | $ | 6,365,130 | | | | 6,927,768 | |
| | | | | | | | | | | | | |
| | | | | Other Assets and Liabilities (Net) — (0.3)% | | | | | | | (17,519 | ) |
| | | | | | | | | | | | | |
| | | | | NET ASSETS — 100.0% | | | | | | $ | 6,910,249 | |
| (a) | Security is valued using significant unobservable inputs and is classified as Level 3 in the fair value hierarchy. |
| † | Non-income producing security. |
| †† | Represents annualized yield at date of purchase. |
| REIT | Real Estate Investment Trust |
| Geographic Diversification | | % of Market Value | | | Market Value | |
| United States | | | 82.0 | % | | $ | 5,677,777 | |
| Europe | | | 14.1 | | | | 979,370 | |
| Canada | | | 3.5 | | | | 240,234 | |
| Asia/Pacific | | | 0.3 | | | | 21,875 | |
| Latin America | | | 0.1 | | | | 8,512 | |
| | | | 100.0 | % | | $ | 6,927,768 | |
See accompanying notes to financial statements.
The Gabelli Global Mini Mites Fund
Statement of Assets and Liabilities
December 31, 2021
| Statement of Assets and Liabilities | | | |
| December 31, 2021 | | | |
| Assets: | | | |
| Investments, at value (cost $6,365,130) | | $ | 6,927,768 | |
| Cash | | | 20,139 | |
| Receivable for Fund shares sold | | | 100 | |
| Receivable from Adviser | | | 13,536 | |
| Dividends receivable | | | 2,648 | |
| Prepaid expenses | | | 22,017 | |
| Total Assets | | | 6,986,208 | |
| Liabilities: | | | | |
| Payable for investments purchased | | | 16,837 | |
| Payable for investment advisory fees | | | 5,676 | |
| Payable for distribution fees | | | 31 | |
| Payable for legal and audit fees | | | 25,800 | |
| Payable for shareholder communications | | | 15,683 | |
| Payable for shareholder services fees | | | 4,229 | |
| Other accrued expenses | | | 7,703 | |
| Total Liabilities | | | 75,959 | |
| Net Assets | | | | |
| (applicable to 625,841 shares outstanding) | | $ | 6,910,249 | |
| Net Assets Consist of: | | | | |
| Paid-in capital | | $ | 6,393,715 | |
| Total distributable earnings | | | 516,534 | |
| Net Assets | | $ | 6,910,249 | |
| | | | | |
| Shares of Capital Stock, each at $0.001 par value: | | | | |
| Class AAA: | | | | |
| Net Asset Value, offering, and redemption price per share ($82,534 ÷ 7,475 shares outstanding; 75,000,000 shares authorized) | | $ | 11.04 | |
| Class A: | | | | |
| Net Asset Value and redemption price per share ($13,288 ÷ 1,204 shares outstanding; 50,000,000 shares authorized) | | $ | 11.04 | |
| Maximum offering price per share (NAV ÷ 0.9425, based on maximum sales charge of 5.75% of the offering price) | | $ | 11.71 | |
| Class C: | | | | |
| Net Asset Value and redemption price per share ($13,188 ÷ 1,199 shares outstanding; 25,000,000 shares authorized) | | $ | 11.00 | |
| Class I: | | | | |
| Net Asset Value, offering, and redemption price per share ($6,801,239 ÷ 615,963 shares outstanding; 25,000,000 shares authorized) | | $ | 11.04 | |
Statement of Operations
For the Year Ended December 31, 2021
| Investment Income: | | | |
| Dividends (net of foreign withholding taxes of $2,389) | | $ | 45,782 | |
| Interest | | | 162 | |
| Total Investment Income | | | 45,944 | |
| Expenses: | | | | |
| Investment advisory fees | | | 63,351 | |
| Distribution fees - Class AAA | | | 237 | |
| Distribution fees - Class A | | | 33 | |
| Distribution fees - Class C | | | 133 | |
| Registration expenses | | | 53,252 | |
| Legal and audit fees | | | 41,501 | |
| Shareholder services fees | | | 12,728 | |
| Shareholder communications expenses | | | 10,697 | |
| Custodian fees | | | 8,426 | |
| Directors’ fees | | | 985 | |
| Tax expense | | | 288 | |
| Miscellaneous expenses | | | 13,974 | |
| Total Expenses | | | 205,605 | |
| Less: | | | | |
| Expense reimbursements (See Note 3) | | | (147,312 | ) |
| Expenses paid indirectly by broker (See Note 6) | | | (989 | ) |
| Total Reimbursements and Credits | | | (148,301 | ) |
| Net Expenses | | | 57,304 | |
| Net Investment Loss | | | (11,360 | ) |
| Net Realized and Unrealized Gain/(Loss) on | | | | |
| Investments and Foreign Currency: | | | | |
| Net realized gain on investments | | | 1,054,435 | |
| Net realized loss on foreign currency transactions | | | (31 | ) |
| Net realized gain on investments and foreign currency transactions | | | 1,054,404 | |
| Net change in unrealized appreciation/depreciation: | | | | |
| on investments | | | (216,225 | ) |
| on foreign currency translations | | | (510 | ) |
| Net change in unrealized appreciation/depreciation on investments and foreign currency translations | | | (216,735 | ) |
| Net Realized and Unrealized Gain/(Loss) on Investments and Foreign Currency | | | 837,669 | |
| Net Increase in Net Assets Resulting from Operations | | $ | 826,309 | |
See accompanying notes to financial statements.
The Gabelli Global Mini Mites Fund
Statement of Changes in Net Assets
| | | Year Ended December 31, 2021 | | | Year Ended December 31, 2020 | |
| | | | | | | |
| Operations: | | | | | | | | |
| Net investment income/(loss) | | $ | (11,360 | ) | | $ | 21,457 | |
| Net realized gain/(loss) on investments and foreign currency transactions | | | 1,054,404 | | | | (186,721 | ) |
| Net change in unrealized appreciation/depreciation on investments and foreign currency translations | | | (216,735 | ) | | | 817,337 | |
| Net Increase in Net Assets Resulting from Operations | | | 826,309 | | | | 652,073 | |
| | | | | | | | | |
| Distributions to Shareholders: | | | | | | | | |
| Accumulated earnings | | | | | | | | |
| Class AAA | | | (10,819 | ) | | | (649 | ) |
| Class A | | | (1,727 | ) | | | (60 | ) |
| Class C | | | (1,720 | ) | | | (60 | ) |
| Class I | | | (884,190 | ) | | | (21,243 | ) |
| Total Distributions to Shareholders | | | (898,456 | ) | | | (22,012 | ) |
| | | | | | | | | |
| Capital Share Transactions: | | | | | | | | |
| Class AAA | | | (50,119 | ) | | | (7,555 | ) |
| Class A | | | 1,727 | | | | 60 | |
| Class C | | | 1,720 | | | | 60 | |
| Class I | | | 2,965,363 | | | | 1,703,485 | |
| | | | | | | | | |
| Net Increase in Net Assets from Capital Share Transactions | | | 2,918,691 | | | | 1,696,050 | |
| | | | | | | | | |
| Redemption Fees | | | 21 | | | | — | |
| | | | | | | | | |
| Net Increase in Net Assets | | | 2,846,565 | | | | 2,326,111 | |
| Net Assets: | | | | | | | | |
| Beginning of year | | | 4,063,684 | | | | 1,737,573 | |
| End of year | | $ | 6,910,249 | | | $ | 4,063,684 | |
See accompanying notes to financial statements.
The Gabelli Global Mini Mites Fund
Financial Highlights
Selected data for a share of capital stock outstanding throughout each period:
| | | | | | | Income (Loss) from Investment Operations | | | Distributions | | | | | | | | | | | | Ratios to Average Net Assets/Supplemental Data | |
Period Ended
December 31 | | | Net Asset Value, Beginning of
Period | | | Net Investment Income (Loss)(a) | | | Net Realized and Unrealized Gain (Loss) on Investments | | | Total from Investment Operations | | | Net Investment Income | | | Net
Realized Gain
on Investments | | | Total Distributions | | | Redemption Fees(a)(b) | | | Net Asset Value, End of Period | | | Total Return† | | | Net Assets, End of Period
(in 000’s) | | | Net Investment Income (Loss) | | | Operating Expenses Before Reimbursement | | | Operating
Expenses
Net
of
Reimbursement(c) | | Portfolio Turnover Rate | |
| Class AAA | | | | | | | | | | | | | | | | | | | | | | | | | | | | | | | | | | | | | | | | | | | | | | | | | | | | | | | | | | | |
| 2021 | | | $ | 10.67 | | | $ | (0.02 | ) | | $ | 2.04 | | | $ | 2.02 | | | $ | (0.07 | ) | | $ | (1.58 | ) | | $ | (1.65 | ) | | $ | 0.00 | | | $ | 11.04 | | | | 19.25 | % | | $ | 83 | | | | (0.17 | )% | | | 3.49 | % | | | 0.90 | %(d)(e) | | | 79 | % |
| 2020 | | | | 9.26 | | | | 0.05 | | | | 1.42 | | | | 1.47 | | | | (0.06 | ) | | | — | | | | (0.06 | ) | | | — | | | | 10.67 | | | | 15.87 | | | | 120 | | | | 0.61 | | | | 9.40 | | | | 0.90 | (d) | | | 63 | |
| 2019 | | | | 8.62 | | | | 0.05 | | | | 0.94 | | | | 0.99 | | | | (0.04 | ) | | | (0.31 | ) | | | (0.35 | ) | | | — | | | | 9.26 | | | | 11.49 | | | | 114 | | | | 0.53 | | | | 10.81 | | | | 1.23 | (f) | | | 131 | |
| 2018(g) | | | 10.00 | | | | 0.01 | | | | (1.38 | ) | | | (1.37 | ) | | | (0.01 | ) | | | (0.00 | )(b) | | | (0.01 | ) | | | — | | | | 8.62 | | | | (13.71 | ) | | | 70 | | | | 0.45 | (h) | | | 44.14 | (h) | | | 1.25 | (h) | | | 6 | |
| Class A | | | | | | | | | | | | | | | | | | | | | | | | | | | | | | | | | | | | | | | | | | | | | | | | | | | | | | | | | | | |
| 2021 | | | $ | 10.66 | | | $ | (0.02 | ) | | $ | 2.05 | | | $ | 2.03 | | | $ | (0.07 | ) | | $ | (1.58 | ) | | $ | (1.65 | ) | | $ | 0.00 | | | $ | 11.04 | | | | 19.38 | % | | $ | 13 | | | | (0.18 | )% | | | 3.49 | % | | | 0.90 | %(d)(e) | | | 79 | % |
| 2020 | | | | 9.26 | | | | 0.05 | | | | 1.41 | | | | 1.46 | | | | (0.06 | ) | | | — | | | | (0.06 | ) | | | — | | | | 10.66 | | | | 15.76 | | | | 11 | | | | 0.66 | | | | 9.40 | | | | 0.90 | (d) | | | 63 | |
| 2019 | | | | 8.62 | | | | 0.04 | | | | 0.95 | | | | 0.99 | | | | (0.04 | ) | | | (0.31 | ) | | | (0.35 | ) | | | — | | | | 9.26 | | | | 11.47 | | | | 10 | | | | 0.43 | | | | 10.81 | | | | 1.23 | (f) | | | 131 | |
| 2018(g) | | | 10.00 | | | | 0.01 | | | | (1.38 | ) | | | (1.37 | ) | | | (0.01 | ) | | | (0.00 | )(b) | | | (0.01 | ) | | | — | | | | 8.62 | | | | (13.72 | ) | | | 9 | | | | 0.41 | (h) | | | 44.14 | (h) | | | 1.25 | (h) | | | 6 | |
| Class C | | | | | | | | | | | | | | | | | | | | | | | | | | | | | | | | | | | | | | | | | | | | | | | | | | | | | | | | | | | |
| 2021 | | | $ | 10.63 | | | $ | (0.02 | ) | | $ | 2.04 | | | $ | 2.02 | | | $ | (0.07 | ) | | $ | (1.58 | ) | | $ | (1.65 | ) | | $ | 0.00 | | | $ | 11.00 | | | | 19.34 | % | | $ | 13 | | | | (0.18 | )% | | | 4.24 | % | | | 0.90 | %(d)(e) | | | 79 | % |
| 2020 | | | | 9.23 | | | | 0.05 | | | | 1.41 | | | | 1.46 | | | | (0.06 | ) | | | — | | | | (0.06 | ) | | | — | | | | 10.63 | | | | 15.81 | | | | 11 | | | | 0.66 | | | | 10.15 | | | | 0.90 | (d) | | | 63 | |
| 2019 | | | | 8.61 | | | | (0.02 | ) | | | 0.95 | | | | 0.93 | | | | (0.00 | )(b) | | | (0.31 | ) | | | (0.31 | ) | | | — | | | | 9.23 | | | | 10.83 | | | | 9 | | | | (0.25 | ) | | | 11.56 | | | | 1.92 | (f) | | | 131 | |
| 2018(g) | | | 10.00 | | | | (0.01 | ) | | | (1.38 | ) | | | (1.39 | ) | | | — | | | | (0.00 | )(b) | | | (0.00 | )(b) | | | — | | | | 8.61 | | | | (13.88 | ) | | | 8 | | | | (0.34 | )(h) | | | 44.89 | (h) | | | 2.00 | (h) | | | 6 | |
| Class I | | | | | | | | | | | | | | | | | | | | | | | | | | | | | | | | | | | | | | | | | | | | | | | | | | | | | | | | | | | |
| 2021 | | | $ | 10.67 | | | $ | (0.02 | ) | | $ | 2.04 | | | $ | 2.02 | | | $ | (0.07 | ) | | $ | (1.58 | ) | | $ | (1.65 | ) | | $ | 0.00 | | | $ | 11.04 | | | | 19.25 | % | | $ | 6,801 | | | | (0.18 | )% | | | 3.24 | % | | | 0.90 | %(d)(e) | | | 79 | % |
| 2020 | | | | 9.26 | | | | 0.09 | | | | 1.38 | | | | 1.47 | | | | (0.06 | ) | | | — | | | | (0.06 | ) | | | — | | | | 10.67 | | | | 15.87 | | | | 3,922 | | | | 1.11 | | | | 9.15 | | | | 0.90 | (d) | | | 63 | |
| 2019 | | | | 8.61 | | | | 0.08 | | | | 0.94 | | | | 1.02 | | | | (0.06 | ) | | | (0.31 | ) | | | (0.37 | ) | | | — | | | | 9.26 | | | | 11.84 | | | | 1,605 | | | | 0.84 | | | | 10.56 | | | | 1.00 | (f) | | | 131 | |
| 2018(g) | | | 10.00 | | | | 0.02 | | | | (1.40 | ) | | | (1.38 | ) | | | (0.01 | ) | | | (0.00 | )(b) | | | (0.01 | ) | | | — | | | | 8.61 | | | | (13.76 | ) | | | 494 | | | | 0.79 | (h) | | | 43.89 | (h) | | | 1.00 | (h) | | | 6 | |
| | | | | | | | | | | | | | | | | | | | | | | | | | | | | | | | | | | | | | | | | | | | | | | | | | | | | | | | | | | | | | |
| † | Total return represents aggregate total return of a hypothetical investment at the beginning of the period and sold at the end of the period. Total return for a period of less than one year is not annualized. Total return for a period of less than one year is not annualized. |
| (a) | Per share amounts have been calculated using the average shares outstanding method. |
| (b) | Amount represents less than $0.005 per share. |
| (c) | Under an expense reimbursement agreement with the Adviser, the Adviser reimbursed expenses of $147,312, $163,109, $126,588, and $43,899 for the years ended December 31, 2021, 2020, and 2019 and the period ended December 31, 2018, respectively. |
| (d) | The Fund received credits from a designated broker who agreed to pay certain Fund operating expenses for the years ended December 31, 2021 and 2020. If credits had not been received, the ratios of operating expenses to average net assets would have been 0.92% and 0.96% for each Class, respectively. |
| (e) | The Fund incurred tax expense for the year ended December 31, 2021 and there was no impact on the expense ratios. |
| (f) | The Fund incurred interest expense for the year ended December 31, 2019. If interest expense had not been incurred, the ratio of operating expenses to average net assets would have been 1.22% (Class AAA and Class A),1.90% (Class C), and 0.99% (Class I), respectively. |
| (g) | The Fund commenced investment operations on October 1, 2018. |
See accompanying notes to financial statements.
The Gabelli Global Mini Mites Fund
Notes to Financial Statements
1. Organization. The Gabelli Global Mini Mites Fund, a series of GAMCO Global Series Funds, Inc. (the Corporation), was incorporated on July 16, 1993 in Maryland. The Fund is a non-diversified open-end management investment company registered under the Investment Company Act of 1940, as amended (the 1940 Act), and is one of five separately managed portfolios (collectively, the Portfolios) of the Corporation. The Fund’s primary objective is long term capital appreciation by investing primarily in micro-capitalization equity securities. The Fund commenced investment operations on October 1, 2018.
2. Significant Accounting Policies. As an investment company, the Fund follows the investment company accounting and reporting guidance, which is part of U.S. generally accepted accounting principles (GAAP) that may require the use of management estimates and assumptions in the preparation of its financial statements. Actual results could differ from those estimates. The following is a summary of significant accounting policies followed by the Fund in the preparation of its financial statements.
The global outbreak of the novel coronavirus disease, known as COVID-19, has caused adverse effects on many companies, sectors, nations, regions, and the markets in general, and may continue for an unpredictable duration. The effects of this pandemic may materially impact the value and performance of the Fund, its ability to buy and sell fund investments at appropriate valuations, and its ability to achieve its investment objectives.
Security Valuation. Portfolio securities listed or traded on a nationally recognized securities exchange or traded in the U.S. over-the-counter market for which market quotations are readily available are valued at the last quoted sale price or a market’s official closing price as of the close of business on the day the securities are being valued. If there were no sales that day, the security is valued at the average of the closing bid and asked prices or, if there were no asked prices quoted on that day, then the security is valued at the closing bid price on that day. If no bid or asked prices are quoted on such day, the security is valued at the most recently available price or, if the Board of Directors (the Board) so determines, by such other method as the Board shall determine in good faith to reflect its fair market value. Portfolio securities traded on more than one national securities exchange or market are valued according to the broadest and most representative market, as determined by Gabelli Funds, LLC (the Adviser).
Portfolio securities primarily traded on a foreign market are generally valued at the preceding closing values of such securities on the relevant market, but may be fair valued pursuant to procedures established by the Board if market conditions change significantly after the close of the foreign market, but prior to the close of business on the day the securities are being valued. Debt obligations for which market quotations are readily available are valued at the average of the latest bid and asked prices. If there were no asked prices quoted on such day, the security is valued using the closing bid price. Such debt obligations are valued through prices provided by a pricing service approved by the Board. Certain securities are valued principally using dealer quotations.
Securities and assets for which market quotations are not readily available are fair valued as determined by the Board. Fair valuation methodologies and procedures may include, but are not limited to: analysis and review of available financial and non-financial information about the company; comparisons with the valuation and changes in valuation of similar securities, including a comparison of foreign securities with the equivalent U.S. dollar value American Depositary Receipt securities at the close of the U.S. exchange; and evaluation of any other information that could be indicative of the value of the security.
The Fund employs a fair value model to adjust prices to reflect events affecting the values of certain portfolio securities which occur between the close of trading on the principal market for such securities (foreign exchanges
The Gabelli Global Mini Mites Fund
Notes to Financial Statements (Continued)
and over-the-counter markets) at the time when net asset values of the Fund are determined. If the Fund’s valuation committee believes that a particular event would materially affect net asset value, further adjustment is considered. Such securities are classified as Level 2 in the fair value hierarchy presented below.
The inputs and valuation techniques used to measure fair value of the Fund’s investments are summarized into three levels as described in the hierarchy below:
| ● | Level 1 — quoted prices in active markets for identical securities; |
| ● | Level 2 — other significant observable inputs (including quoted prices for similar securities, interest rates, prepayment speeds, credit risk, etc.); and |
| ● | Level 3 — significant unobservable inputs (including the Board’s determinations as to the fair value of investments). |
A financial instrument’s level within the fair value hierarchy is based on the lowest level of any input both individually and in the aggregate that is significant to the fair value measurement. The inputs or methodology used for valuing securities are not necessarily an indication of the risk associated with investing in those securities.
The summary of the Fund’s investments in securities by inputs used to value the Fund’s investments as of December 31, 2021 is as follows:
| | | Valuation Inputs | | | | |
| | | Level 1 Quoted Prices | | | Level 2 Other Significant Observable Inputs | | | Level 3 Significant Unobservable Inputs (a) | | | Total Market Value at 12/31/21 | |
| INVESTMENTS IN SECURITIES: | | | | | | | | | | | | |
| ASSETS (Market Value): | | | | | | | | | | | | |
| Common Stocks: | | | | | | | | | | | | | | | | |
| Business Services | | $ | 271,793 | | | $ | 443 | | | | — | | | $ | 272,236 | |
| Computer Software and Services | | | 138,525 | | | | — | | | $ | 59,759 | | | | 198,284 | |
| Consumer Products | | | 405,253 | | | | 105,000 | | | | — | | | | 510,253 | |
| Health Care | | | 427,109 | | | | — | | | | 0 | | | | 427,109 | |
| Machinery | | | 507,570 | | | | — | | | | 31,423 | | | | 538,993 | |
| Wireless Telecommunications Services | | | — | | | | 6,863 | | | | — | | | | 6,863 | |
| Other Industries (b) | | | 4,661,565 | | | | — | | | | — | | | | 4,661,565 | |
| Total Common Stocks | | | 6,411,815 | | | | 112,306 | | | | 91,182 | | | | 6,615,303 | |
| Convertible Preferred Stocks (b) | | | 43,576 | | | | — | | | | — | | | | 43,576 | |
| Warrants (b) | | | 26,298 | | | | — | | | | 2,608 | | | | 28,906 | |
| U.S. Government Obligations | | | — | | | | 239,983 | | | | — | | | | 239,983 | |
| TOTAL INVESTMENTS IN SECURITIES – ASSETS | | $ | 6,481,689 | | | $ | 352,289 | | | $ | 93,790 | | | $ | 6,927,768 | |
| (a) | The inputs for these securities are not readily available and are derived based on the judgment of the Adviser according to procedures approved by the Board of Directors. |
| (b) | Please refer to the Schedule of Investments for the industry classifications of these portfolio holdings. |
During the year ended December 31, 2021, the Fund did not have material transfers into or out of Level 3.
The Gabelli Global Mini Mites Fund
Notes to Financial Statements (Continued)
The following table reconciles Level 3 investments:
| | | Balance
as of
12/31/20 | | | Accrued
discounts/
(premiums) | | | Realized
gain/
(loss) | | | Net Change
in unrealized
appreciation/
depreciation† | | | Purchases | | | Sales | | | Transfers
Into
Level 3 | | | Transfers
Out of
Level 3 | | | Balance
as of
12/31/21 | | | Net change
in unrealized
appreciation/
depreciation
during the
period on
Level 3
investments
still held at
12/31/21† | |
| INVESTMENTS IN SECURITIES: |
| ASSETS (Market Value): |
| Common Stocks (a) | | $ | 42,783 | | | | — | | | $ | 3,563 | | | $ | (8,759 | ) | | $ | 62,960 | | | $ | (42,421 | ) | | $ | 33,542 | | | $ | (486 | ) | | $ | 91,182 | | | $ | (5,320 | ) |
| Warrants (a) | | | — | | | | — | | | | — | | | | — | | | | — | | | | — | | | | 2,608 | | | | — | | | | 2,608 | | | | — | |
| TOTAL INVESTMENTS IN SECURITIES | | $ | 42,783 | | | | — | | | $ | 3,563 | | | $ | (8,759 | ) | | $ | 62,960 | | | $ | (42,421 | ) | | $ | 36,150 | | | $ | (486 | ) | | $ | 93,790 | (b) | | $ | (5,320 | ) |
| (a) | Please refer to the Schedule of Investments for the industry classifications of these portfolio holdings. |
| † | Net change in unrealized appreciation/depreciation on investments is included in the related amounts in the Statement of Operations. |
| (b) | The Level 3 common stocks were valued at the prices of the proposed merger transactions and net realizable values of corporate actions. The Level 3 warrants were valued at the estimated net realizable value. The total value of these securities at December 31, 2021 was $93,790. The inputs for the valuations of these securities were based on the judgement of the Adviser according to procedures approved by the Board. |
Additional Information to Evaluate Qualitative Information.
General. The Fund uses recognized industry pricing services – approved by the Board and unaffiliated with the Adviser – to value most of its securities, and uses broker quotes provided by market makers of securities not valued by these and other recognized pricing sources. Several different pricing feeds are received to value domestic equity securities, international equity securities, preferred equity securities, and fixed income securities. The data within these feeds are ultimately sourced from major stock exchanges and trading systems where these securities trade. The prices supplied by external sources are checked by obtaining quotations or actual transaction prices from market participants. If a price obtained from the pricing source is deemed unreliable, prices will be sought from another pricing service or from a broker/dealer that trades that security or similar securities.
Fair Valuation. Fair valued securities may be common or preferred equities, warrants, options, rights, or fixed income obligations. Where appropriate, Level 3 securities are those for which market quotations are not available, such as securities not traded for several days, or for which current bids are not available, or which are restricted as to transfer. When fair valuing a security, factors to consider include recent prices of comparable securities that are publicly traded, reliable prices of securities not publicly traded, the use of valuation models, current analyst reports, valuing the income or cash flow of the issuer, or cost if the preceding factors do not apply. A significant change in the unobservable inputs could result in a lower or higher value in Level 3 securities. The circumstances of Level 3 securities are frequently monitored to determine if fair valuation measures continue to apply.
The Gabelli Global Mini Mites Fund
Notes to Financial Statements (Continued)
The Adviser reports quarterly to the Board the results of the application of fair valuation policies and procedures. These may include backtesting the prices realized in subsequent trades of these fair valued securities to fair values previously recognized.
Foreign Currency Translations. The books and records of the Fund are maintained in U.S. dollars. Foreign currencies, investments, and other assets and liabilities are translated into U.S. dollars at current exchange rates. Purchases and sales of investment securities, income, and expenses are translated at the exchange rate prevailing on the respective dates of such transactions. Unrealized gains and losses that result from changes in foreign exchange rates and/or changes in market prices of securities have been included in unrealized appreciation/depreciation on investments and foreign currency translations. Net realized foreign currency gains and losses resulting from changes in exchange rates include foreign currency gains and losses between trade date and settlement date on investment securities transactions, foreign currency transactions, and the difference between the amounts of interest and dividends recorded on the books of the Fund and the amounts actually received. The portion of foreign currency gains and losses related to fluctuation in exchange rates between the initial purchase trade date and subsequent sale trade date is included in realized gain/(loss) on investments.
Foreign Securities. The Fund may directly purchase securities of foreign issuers. Investing in securities of foreign issuers involves special risks not typically associated with investing in securities of U.S. issuers. The risks include possible revaluation of currencies, the inability to repatriate funds, less complete financial information about companies, and possible future adverse political and economic developments. Moreover, securities of many foreign issuers and their markets may be less liquid and their prices more volatile than securities of comparable U.S. issuers.
Foreign Taxes. The Fund may be subject to foreign taxes on income, gains on investments, or currency repatriation, a portion of which may be recoverable. The Fund will accrue such taxes and recoveries as applicable, based upon its current interpretation of tax rules and regulations that exist in the markets in which it invests.
Restricted Securities. The Fund may invest up to 15% of its net assets in securities for which the markets are restricted. Restricted securities include securities whose disposition is subject to substantial legal or contractual restrictions. The sale of restricted securities often requires more time and results in higher brokerage charges or dealer discounts and other selling expenses than the sale of securities eligible for trading on national securities exchanges or in the over-the-counter markets. Restricted securities may sell at a price lower than similar securities that are not subject to restrictions on resale. Securities freely saleable among qualified institutional investors under special rules adopted by the SEC may be treated as liquid if they satisfy liquidity standards established by the Board. The continued liquidity of such securities is not as well assured as that of publicly traded securities, and accordingly the Board will monitor their liquidity. At December 31, 2021, the Fund did not hold any restricted securities.
Securities Transactions and Investment Income. Securities transactions are accounted for on the trade date with realized gain/(loss) on investments determined by using the identified cost method. Interest income (including amortization of premium and accretion of discount) is recorded on an accrual basis. Premiums and discounts on debt securities are amortized using the effective yield to maturity method or amortized to earliest call date, if applicable. Dividend income is recorded on the ex-dividend date, except for certain dividends from foreign securities that are recorded as soon after the ex-dividend date as the Fund becomes aware of such dividends.
The Gabelli Global Mini Mites Fund
Notes to Financial Statements (Continued)
Determination of Net Asset Value and Calculation of Expenses. Certain administrative expenses are common to, and allocated among, various affiliated funds. Such allocations are made on the basis of each fund’s average net assets or other criteria directly affecting the expenses as determined by the Adviser pursuant to procedures established by the Board.
In calculating the NAV per share of each class, investment income, realized and unrealized gains and losses, redemption fees, and expenses other than class specific expenses are allocated daily to each class of shares based upon the proportion of net assets of each class at the beginning of each day. Distribution expenses are borne solely by the class incurring the expense.
Distributions to Shareholders. Distributions to shareholders are recorded on the ex-dividend date. Distributions to shareholders are based on income and capital gains as determined in accordance with federal income tax regulations, which may differ from income and capital gains as determined under GAAP. These differences are primarily due to differing treatments of income and gains on various investment securities and foreign currency transactions held by the Fund, timing differences, and differing characterizations of distributions made by the Fund. Distributions from net investment income for federal income tax purposes include net realized gains on foreign currency transactions. These book/tax differences are either temporary or permanent in nature. To the extent these differences are permanent, adjustments are made to the appropriate capital accounts in the period when the differences arise. Permanent differences were primarily due to disallowed losses and distributions in excess of income. These reclassifications have no impact on the NAV of the Fund. For the year ended December 31, 2021, reclassifications were made to decrease paid-in capital by $2,941, with an offsetting adjustment to total distributable earnings.
The tax character of distributions paid during the years ended December 31, 2021 and 2020 was as follows:
| | | Year Ended
December 31, 2021 | | | Year Ended
December 31, 2020 | |
| Distributions paid from: | | | | | | | | |
| Ordinary income (inclusive of short term capital gains) | | $ | 564,618 | | | $ | 22,012 | |
| Net long term capital gains | | | 333,838 | | | | — | |
| Total distributions paid | | $ | 898,456 | | | $ | 22,012 | |
| | | | | | | | | |
Provision for Income Taxes. The Fund intends to continue to qualify as a regulated investment company under Subchapter M of the Internal Revenue Code of 1986, as amended (the Code). It is the policy of the Fund to comply with the requirements of the Code applicable to regulated investment companies and to distribute substantially all of its net investment company taxable income and net capital gains. Therefore, no provision for federal income taxes is required.
At December 31, 2021, the components of accumulated earnings/losses on a tax basis were as follows:
| Net unrealized appreciation on investments and foreign currency translations | | $ | 516,534 | |
The Fund utilized $143,801 of the capital loss carryforward for the year ended December 31, 2021.
At December 31, 2021, the temporary difference between book basis and tax basis unrealized appreciation was primarily due to deferral of losses from wash sales for tax purposes and mark-to-market adjustments on investments in passive foreign investment companies.
The Gabelli Global Mini Mites Fund
Notes to Financial Statements (Continued)
The following summarizes the tax cost of investments and the related net unrealized appreciation at December 31, 2021:
| | | Cost | | Gross Unrealized Appreciation | | Gross Unrealized Depreciation | | Net Unrealized Appreciation |
| Investments | | $6,411,239 | | $1,198,051 | | $(681,522) | | $516,529 |
The Fund is required to evaluate tax positions taken or expected to be taken in the course of preparing the Fund’s tax returns to determine whether the tax positions are “more-likely-than-not” of being sustained by the applicable tax authority. Income tax and related interest and penalties would be recognized by the Fund as tax expense in the Statement of Operations if the tax positions were deemed not to meet the more-likely-than-not threshold. During the year ended December 31, 2021, the Fund incurred an excise tax expense of $288. As of December 31, 2021, the Adviser has reviewed all open tax years and concluded that there was no impact to the Fund’s net assets or results of operations. The Fund’s federal and state tax returns for the prior three fiscal years remain open, subject to examination. On an ongoing basis, the Adviser will monitor the Fund’s tax positions to determine if adjustments to this conclusion are necessary.
3. Investment Advisory Agreement and Other Transactions. The Fund has entered into an investment advisory agreement (the Advisory Agreement) with the Adviser which provides that the Fund will pay the Adviser a fee, computed daily and paid monthly, at the annual rate of 1.00% of the value of its average daily net assets. In accordance with the Advisory Agreement, the Adviser provides a continuous investment program for the Fund’s portfolio, oversees the administration of all aspects of the Fund’s business and affairs, and pays the compensation of all Officers and Directors of the Fund who are affiliated persons of the Adviser.
Effective December 1, 2019, the Adviser amended its contractual agreement with respect to each share class of the Fund to waive its investment advisory fees and/or to reimburse expenses to the extent necessary to maintain the annualized total operating expenses of the Fund (excluding brokerage costs, acquired fund fees and expenses, interest, taxes, and extraordinary expenses) until at least April 30, 2022, at no more than 0.90% of the value of the Fund’s average daily net assets for each share class of the Fund. During the year ended December 31, 2021, the Adviser reimbursed the Fund in the amount of $147,312. In addition, the Fund has agreed, during the two year period following any waiver or reimbursement by the Adviser, to repay such amount to the extent, that after giving effect to the repayment, such adjusted annualized total operating expenses (continuing the same foregoing exclusions as above) of the Fund would not exceed 0.90% of the value of the Fund’s average daily net assets for each share class of the Fund. The agreement is renewable annually. At December 31, 2021, the cumulative amount which the Fund may repay the Adviser, subject to the terms above, is $310,421:
| For the year ended December 31, 2020, expiring December 31, 2022 | | | $ | 163,109 | |
| For the year ended December 31, 2021, expiring December 31, 2023 | | | | 147,312 | |
| | | | $ | 310,421 | |
4. Distribution Plan. The Fund’s Board has adopted a distribution plan (the Plan) for each class of shares, except for Class I Shares, pursuant to Rule 12b-1 under the 1940 Act. Under the Class AAA, Class A, and Class C Share Plans, payments are authorized to G.distributors, LLC (the Distributor), an affiliate of the Adviser, at annual rates of 0.25%, 0.25%, and 1.00%, respectively, of the average daily net assets of those classes, the annual limitations under each Plan. Such payments are accrued daily and paid monthly.
The Gabelli Global Mini Mites Fund
Notes to Financial Statements (Continued)
5. Portfolio Securities. Purchases and sales of securities during the year ended December 31, 2021, other than short term securities and U.S. Government obligations, aggregated $6,693,420 and $4,687,972, respectively.
6. Transactions with Affiliates and Other Arrangements. During the year ended December 31, 2021, the Fund paid $12,031 in brokerage commissions on security trades to G.research, LLC, an affiliate of the Adviser.
During the year ended December 31, 2021, the Fund received credits from a designated broker who agreed to pay certain Fund operating expenses. The amount of such expenses paid through this directed brokerage arrangement during this period was $989.
The cost of calculating the Fund’s NAV per share is a Fund expense pursuant to the Advisory Agreement. Under the sub-administration agreement with Bank of New York Mellon, the fees paid include the cost of calculating the Fund’s NAV. The Fund reimburses the Adviser for this service. The Adviser did not seek a reimbursement during the year ended December 31, 2021.
The Corporation pays retainer and per meeting fees to Directors not affiliated with the Adviser, plus specified amounts to the Lead Director and Audit Committee Chairman. Directors are also reimbursed for out of pocket expenses incurred in attending meetings. Directors who are directors or employees of the Adviser or an affiliated company receive no compensation or expense reimbursement from the Corporation.
7. Line of Credit. The Fund participates in an unsecured line of credit, which expires on March 2, 2022 and may be renewed annually, of up to $75,000,000 under which it may borrow up to 10% of its net assets from the custodian for temporary borrowing purposes. Borrowings under this arrangement bear interest at a floating rate equal to the higher of the Overnight Federal Funds Rate plus 135 basis points or the Overnight Bank Funding Rate plus 135 basis points in effect on that day. This amount, if any, would be included in “Interest expense” in the Statement of Operations. During the year ended December 31, 2021, there were no borrowings under the line of credit.
8. Capital Stock. The Fund currently offers three classes of shares – Class AAA Shares, Class A Shares, and Class I Shares. Effective January 27, 2020 (the Effective Date), the Fund’s Class AAA, Class A and Class C Shares “closed to purchases from new investors”. “Closed to purchases from new investors” means (i) with respect to the Class AAA and Class A shares, no new investors may purchase shares of such classes, but existing shareholders may continue to purchase additional shares of such classes after the Effective Date, and (ii) with respect to Class C Shares, neither new investors nor existing shareholders may purchase any additional shares of such class after the Effective Date. These changes had no effect on existing shareholders’ ability to redeem shares of the Fund as described in the Fund’s Prospectus. Additionally, on the Effective Date Class I shares of the Fund became available to investors with a minimum initial investment amount of $1,000 when purchasing shares directly through the Distributor, or investors purchasing Class I shares through brokers or financial intermediaries that have entered into selling agreements with the Distributor specifically with respect to Class I shares.
The Fund imposes a redemption fee of 2.00% on all classes of shares that are redeemed or exchanged on or before the seventh day after the date of a purchase. The redemption fee is deducted from the proceeds otherwise payable to the redeeming shareholders and is retained by the Fund as an increase in paid-in capital. The redemption fees retained by the Fund during the years ended December 31, 2021 and, 2020, if any, can be found in the Statement of Changes in Net Assets under Redemption Fees.
The Gabelli Global Mini Mites Fund
Notes to Financial Statements (Continued)
Transactions in shares of capital stock were as follows:
| | | Year Ended
December 31, 2021 | | | Year Ended
December 31, 2020 | |
| | | Shares | | | Amount | | | Shares | | | Amount | |
| Class AAA | | | | | | | | | | | | | | |
| Shares sold | | 167 | | | $ | 2,000 | | | 424 | | | $ | 3,649 | |
| Shares issued upon reinvestment of distributions | | 998 | | | | 10,819 | | | 62 | | | | 643 | |
| Shares redeemed | | (4,919 | ) | | | (62,938 | ) | | (1,553 | ) | | | (11,847 | ) |
| Net decrease | | (3,754 | ) | | $ | (50,119 | ) | | (1,067 | ) | | $ | (7,555 | ) |
| Class A | | | | | | | | | | | | | | |
| Shares issued upon reinvestment of distributions | | 159 | | | $ | 1,727 | | | 6 | | | $ | 60 | |
| Net increase | | 159 | | | $ | 1,727 | | | 6 | | | $ | 60 | |
| Class C | | | | | | | | | | | | | | |
| Shares issued upon reinvestment of distributions | | 159 | | | $ | 1,720 | | | 6 | | | $ | 60 | |
| Net increase | | 159 | | | $ | 1,720 | | | 6 | | | $ | 60 | |
| Class I | | | | | | | | | | | | | | |
| Shares sold | | 179,732 | | | $ | 2,250,080 | | | 208,543 | | | $ | 1,788,894 | |
| Shares issued upon reinvestment of distributions | | 81,567 | | | | 884,189 | | | 2,037 | | | | 21,243 | |
| Shares redeemed | | (13,038 | ) | | | (168,906 | ) | | (16,159 | ) | | | (106,652 | ) |
| Net increase | | 248,261 | | | $ | 2,965,363 | | | 194,421 | | | $ | 1,703,485 | |
9. Significant Shareholder. As of December 31, 2021, approximately 64.3% of the Fund was beneficially owned by the Adviser and its affiliates, including managed accounts for which the affiliates of the Adviser have voting control but disclaim pecuniary interest.
10. Indemnifications. The Fund enters into contracts that contain a variety of indemnifications. The Fund’s maximum exposure under these arrangements is unknown. However, the Fund has not had prior claims or losses pursuant to these contracts. Management has reviewed the Fund’s existing contracts and expects the risk of loss to be remote.
11. Subsequent Events. Management has evaluated the impact on the Fund of all subsequent events occurring through the date the financial statements were issued and has determined that there were no subsequent events requiring recognition or disclosure in the financial statements.
The Gabelli Global Mini Mites Fund
Report of Independent Registered Public Accounting Firm
To the Shareholders of The Gabelli Global Mini Mites Fund
and the Board of Directors of GAMCO Global Series Funds, Inc.
Opinion on the Financial Statements
We have audited the accompanying statement of assets and liabilities of The Gabelli Global Mini Mites Fund (the “Fund”) (one of the funds constituting GAMCO Global Series Funds, Inc. (the “Corporation”)), including the schedule of investments, as of December 31, 2021, and the related statement of operations for the year then ended, the statements of changes in net assets for each of the two years in the period then ended, the financial highlights for each of the three years in the period then ended and the period from October 1, 2018 (commencement of operations) through December 31, 2018 and the related notes (collectively referred to as the “financial statements”). In our opinion, the financial statements present fairly, in all material respects, the financial position of the Fund (one of the funds constituting GAMCO Global Series Funds, Inc.) at December 31, 2021, the results of its operations for the year then ended, the changes in its net assets for each of the two years in the period then ended and its financial highlights for each of the three years in the period then ended and the period from October 1, 2018 (commencement of operations) through December 31, 2018, in conformity with U.S. generally accepted accounting principles.
Basis for Opinion
These financial statements are the responsibility of the Corporation’s management. Our responsibility is to express an opinion on the Fund’s financial statements based on our audits. We are a public accounting firm registered with the Public Company Accounting Oversight Board (United States) (“PCAOB”) and are required to be independent with respect to the Corporation in accordance with the U.S. federal securities laws and the applicable rules and regulations of the Securities and Exchange Commission and the PCAOB.
We conducted our audits in accordance with the standards of the PCAOB. Those standards require that we plan and perform the audit to obtain reasonable assurance about whether the financial statements are free of material misstatement, whether due to error or fraud. The Corporation is not required to have, nor were we engaged to perform, an audit of the Corporation’s internal control over financial reporting. As part of our audits we are required to obtain an understanding of internal control over financial reporting but not for the purpose of expressing an opinion on the effectiveness of the Corporation’s internal control over financial reporting. Accordingly, we express no such opinion.
Our audits included performing procedures to assess the risks of material misstatement of the financial statements, whether due to error or fraud, and performing procedures that respond to those risks. Such procedures included examining, on a test basis, evidence regarding the amounts and disclosures in the financial statements. Our procedures included confirmation of securities owned as of December 31, 2021, by correspondence with the custodians and brokers or by other appropriate auditing procedures where replies from brokers were not received. Our audits also included evaluating the accounting principles used and significant estimates made by management, as well as evaluating the overall presentation of the financial statements. We believe that our audits provide a reasonable basis for our opinion.

We have served as the auditor of one or more Gabelli/GAMCO Funds investment companies since 1992.
Philadelphia, Pennsylvania
February 28, 2022
The Gabelli Global Mini Mites Fund
Liquidity Risk Management Program (Unaudited)
In accordance with Rule 22e-4 under the 1940 Act, the Fund has established a liquidity risk management program (the LRM Program) to govern its approach to managing liquidity risk. The LRM Program is administered by the Liquidity Committee (the Committee), which is comprised of members of Gabelli Funds, LLC management. The Board has designated the Committee to administer the LRM Program.
The LRM Program’s principal objectives include supporting the Fund’s compliance with limits on investments in illiquid assets and mitigating the risk that the Fund will be unable to meet its redemption obligations in a timely manner. The LRM Program also includes elements that support the management and assessment of liquidity risk, including an annual assessment of factors that influence the Fund’s liquidity and the monthly classification and re-classification of certain investments that reflect the Committee’s assessment of their relative liquidity under current market conditions.
At a meeting of the Board held on May 12, 2021, the Board received a written report from the Committee regarding the design and operational effectiveness of the LRM Program. The Committee determined, and reported to the Board, that the LRM Program is reasonably designed to assess and manage the Fund’s liquidity risk and has operated adequately and effectively since its implementation. The Committee reported that there were no liquidity events that impacted the Fund or its ability to timely meet redemptions without dilution to existing shareholders. The Committee noted that the Fund is primarily invested in highly liquid securities and, accordingly, continues to be exempt from the requirement to determine a “highly liquid investment minimum” as defined in the Rule 22e-4. Because of that continued qualification for the exemption, the Fund has not adopted a “highly liquid investment minimum” amount. The Committee further noted that while changes to the LRM Program were made during the Review Period and reported to the Board, no material changes were made to the LRM Program as a result of the Committee’s annual review.
There can be no assurance that the LRM Program will achieve its objectives in the future. Please refer to the Fund’s Prospectus for more information regarding its exposure to liquidity risk and other principal risks to which an investment in the Fund may be subject.
The Gabelli Global Mini Mites Fund
Board Consideration and Re-Approval of Investment Advisory Agreement (Unaudited)
At its meeting on November 11, 2021, the Board of Directors of the Corporation approved the continuation of the investment advisory agreement with the Adviser for the Fund on the basis of the recommendation by the directors (the Independent Board Members) who are not interested persons of the Fund. The following paragraphs summarize the material information and factors considered by the Independent Board Members as well as their conclusions relative to such factors.
Nature, Extent, and Quality of Services. The Independent Board Members considered information regarding the portfolio managers, the depth of the analyst pool available to the Adviser and the Fund’s portfolio managers, the scope of supervisory, administrative, shareholder, and other services supervised or provided by the Adviser and the absence of significant service problems reported to the Board. The Independent Board Members noted the experience, length of service, and reputation of the Fund’s portfolio managers.
Investment Performance. The Independent Board Members reviewed the short term performance of the Fund (as of September 30, 2021) against a peer group of seven other comparable funds prepared by the Adviser (the “Adviser Peer Group”), and against a peer group prepared by Broadridge (the “Broadridge Performance Peer Group”) consisting of all retail and institutional global small/mid cap funds, regardless of asset size or primary channel of distribution, as represented by the Lipper Global Small/Mid Cap Index. The Independent Board Members noted that the Fund’s performance was in the first (highest) quartile for the one year period and the third quartile for the three year period, as measured against the Adviser Peer Group. Against the Broadridge Performance Peer Group, the Independent Board Members noted that the Fund’s performance was in the first quintile for the one year period and the fourth quintile for the three year period. The Independent Board Members noted that at its current size, the Fund was not competitive among its peer groups and encouraged the Adviser to continue to explore ways to increase the size of the Fund. The Independent Board Members also noted that it was important to provide the portfolio management team sufficient time to continue to establish a performance history.
Profitability. The Independent Board Members reviewed summary data regarding the profitability of the Fund to the Adviser both with a pro rata administrative overhead charge and with a standalone administrative charge and noted the effect of the expense limitation agreement. The Independent Board Members also noted that a portion of the Fund’s portfolio transactions were executed by an affiliated broker of the Adviser and that another affiliated broker of the Adviser received distribution fees and minor amounts of sales commissions.
Economies of Scale. The Independent Board Members discussed the major elements of the Adviser’s cost structure and the relationship of those elements to potential economies of scale and reviewed data provided by the Adviser.
Sharing of Economies of Scale. The Independent Board Members noted that the investment management fee schedule for the Fund does not take into account any potential economies of scale that may develop.
Service and Cost Comparisons. The Independent Board Members compared the expense ratios of the investment management fee, other expenses, and total expenses of the Fund with similar expense ratios of the Adviser Peer Group and a peer group of eleven other global small/mid cap funds selected by Broadridge (the “Broadridge Expense Peer Group”) and noted that the Adviser’s management fee includes substantially all administrative services of the Fund as well as investment advisory services. The Independent Board Members noted the effect of the expense limitation agreement in place for the Fund. The Independent Board Members
The Gabelli Global Mini Mites Fund
Board Consideration and Re-Approval of Investment Advisory Agreement (Unaudited) (Continued)
noted that the Fund’s total expense ratio was the lowest for the Adviser Peer Group and the Broadridge Expense Peer Group. The Independent Board Members also noted that the advisory fee structure was the same as that in effect for most of the Gabelli funds. The Independent Board Members were presented with, but did not consider to be material to their decision, various information comparing the advisory fee to the fee for other types of accounts managed by the Adviser.
Conclusions. The Independent Board Members concluded that the Fund enjoyed highly experienced portfolio management services and good ancillary services. The Independent Board Members noted the reasons for the Fund’s historical underperformance and the recent improvement in performance. The Independent Board Members noted that they would need to continue to evaluate the Fund’s performance as the Fund establishes a longer performance history. The Independent Board Members also concluded that the Fund’s expense ratios and profitability to the Adviser were acceptable, and that economies of scale were not a significant factor in their thinking at this time. In this regard, the Independent Board Members noted the contractual Expense Deferral Agreement between the Adviser and the Corporation, on behalf of each Fund, pursuant to which the net expense ratio for each share class of each Fund was reduced to 0.90% and, following further discussion, determined to recommend that the Adviser consider reducing the Fund’s expense cap to 0% in light of the Fund’s small size. The Board Members did not view the potential profitability of ancillary services as material to their decision. On the basis of the foregoing and without assigning particular weight to any single conclusion, the Independent Board Members determined to recommend continuation of the investment management agreement to the full Board.
Based on a consideration of all these factors in their totality, the Board Members, including all of the Independent Board Members, determined that the Fund’s advisory fee was appropriate in light of the quality of services provided and in light of the other factors described above that the Board deemed relevant. Accordingly, the Board Members determined to approve the continuation of the Fund’s Advisory Agreement. The Board Members based their decision on evaluations of all these factors as a whole and did not consider any one factor as all important or controlling.
The Gabelli Global Mini Mites Fund
Additional Fund Information (Unaudited)
The business and affairs of the Fund are managed under the direction of the Corporation’s Board of Directors. Information pertaining to the Directors and Officers of the Fund is set forth below. The Corporation’s Statement of Additional Information includes additional information about the Fund’s Directors and is available without charge, upon request, by calling 800-GABELLI (800-422-3554) or by writing to The Gabelli Global Mini Mites Fund at One Corporate Center, Rye, NY 10580-1422.
Name, Position(s)
Address1
and Age | | Term of Office
and
Length of
Time Served2 | | Number of
Funds
in Fund
Complex
Overseen
by Director | | Principal Occupation(s)
During Past Five Years | | Other Directorships
Held by Director3 |
| INTERESTED DIRECTORS4: | | | | | | |
| | | | | | | | | |
Mario J. Gabelli, CFA
Director and Chief
Investment Officer
Age: 79 | | Since 1993 | | 31 | | Chairman, Chief Executive Officer, and Chief Investment Officer– Value Portfolios of GAMCO Investors, Inc. and Chief Investment Officer– Value Portfolios of Gabelli Funds, LLC and GAMCO Asset Management Inc.; Director/ Trustee or Chief Investment Officer of other registered investment companies within the Fund Complex; Chief Executive Officer of GGCP, Inc.; Executive Chairman of Associated Capital Group, Inc. | | Director of Morgan Group Holdings, Inc. (holding company); Chairman of the Board and Chief Executive Officer of LICT Corp. (multimedia and communication services company); Director of CIBL, Inc. (broadcasting and wireless communications); Director of ICTC Group Inc. (communications) (2013-2018) |
| | | | | | | | | |
John D. Gabelli
Director
Age: 77 | | Since 1993 | | 12 | | Former Senior Vice President of G.research, LLC | | — |
| | | | | | | |
| INDEPENDENT DIRECTORS5: | | | | | | |
E. Val Cerutti
Director
Age: 82 | | Since 2001 | | 7 | | Chief Executive Officer of Cerutti Consultants, Inc. | | Director of The LGL Group, Inc. (diversified manufacturing) (1990-2009) |
| | | | | | | | | |
Anthony J. Colavita6
Director
Age: 86 | | Since 1993 | | 18 | | President of the law firm of Anthony J. Colavita, P.C. | | — |
| | | | | | | | | |
Werner J. Roeder
Director
Age: 81 | | Since 1993 | | 20 | | Retired physician; Former Vice President of Medical Affairs (Medical Director) of New York Presbyterian/Lawrence Hospital (1999-2014) | | — |
| | | | | | | | | |
Anthonie C. van Ekris6
Director
Age: 87 | | Since 1993 | | 23 | | Chairman and Chief Executive Officer of BALMAC International, Inc. (global import/export company) | | — |
The Gabelli Global Mini Mites Fund
Additional Fund Information (Continued) (Unaudited)
Name, Position(s)
Address1
and Age | | Term of Office
and
Length of
Time Served2 | | Number of
Funds
in Fund
Complex
Overseen
by Director | | Principal Occupation(s)
During Past Five Years | | Other Directorships
Held by Director3 |
Salvatore J. Zizza7
Director
Age: 76 | | Since 2004 | | 32 | | President of Zizza & Associates Corp. (private holding company); Chairman of Bergen Cove Realty Inc. (residential real estate) | | Director and Chairman of Trans-Lux Corporation (business services); Director and Chairman of Harbor Diversified Inc. (pharmaceuticals) (2009-2018); Retired Chairman of BAM (semiconductor and aerospace manufacturing) |
The Gabelli Global Mini Mites Fund
Additional Fund Information (Continued) (Unaudited)
Name, Position(s)
Address1
and Age | | Term of Office
and Length of
Time Served2 | | Principal Occupation(s)
During Past Five Years |
| OFFICERS: |
Bruce N. Alpert
President
Age: 70 | | Since 1993 | | Executive Vice President and Chief Operating Officer of Gabelli Funds, LLC since 1988; Officer of registered investment companies within the Fund Complex; Senior Vice President of GAMCO Investors, Inc. since 2008; Vice President – Mutual Funds, G.research, LLC |
| | | | | |
John C. Ball
Treasurer
Age: 45 | | Since 2017 | | Treasurer of registered investment companies within the Fund Complex since 2017; Vice President and Assistant Treasurer of AMG Funds (2014-2017); Chief Executive Officer, G.distributors, LLC since December 2020 |
| | | | | |
Peter Goldstein
Secretary and Vice
President
Age: 68 | | Since 2020 | | General Counsel, Gabelli Funds, LLC since July 2020; General Counsel and Chief Compliance Officer, Buckingham Capital Management, Inc. (2012-2020); Chief Legal Officer and Chief Compliance Officer, The Buckingham Research Group, Inc. (2012-2020) |
| | | | | |
Richard J. Walz
Chief Compliance
Officer
Age: 62 | | Since 2013 | | Chief Compliance Officer of registered investment companies within the Fund Complex since 2013; Chief Compliance Officer for Gabelli Funds, LLC since 2015 |
| | | | | |
Daniel Plourde
Vice President
Age: 41 | | Since 2021 | | Vice President of registered investment companies within the Fund Complex since 2021; Assistant Treasurer of the North American SPDR ETFs and State Street Global Advisors Mutual Funds (2017-2021); Fund Administration at State Street Bank (2009-2017) |
| 1 | Address: One Corporate Center, Rye, NY 10580-1422, unless otherwise noted. |
| 2 | Each Director will hold office for an indefinite term until the earliest of (i) the next meeting of shareholders, if any, called for the purpose of considering the election or re-election of such Director and until the election and qualification of his or her successor, if any, elected at such meeting, or (ii) the date a Director resigns or retires, or a Director is removed by the Board of Directors or shareholders, in accordance with the Corporation’s By-Laws and Articles of Incorporation. For Officers, includes time served in other officer positions with the corporation. Each officer will hold office for an indefinite term until the date he or she resigns or retires or until his or her successor is elected and qualified. |
| 3 | This column includes only directorships of companies required to report to the SEC under the Securities Exchange Act of 1934, as amended, i.e., public companies, or other investment companies registered under the 1940 Act. |
| 4 | “Interested person” of the Corporation as defined in the 1940 Act. Messrs. Mario J. Gabelli and John D. Gabelli, who are brothers, are each considered an “interested person” because of their affiliation with Gabelli Funds, LLC which acts as the Corporation’s investment adviser. |
| 5 | Directors who are not interested persons are considered “Independent” Directors. |
| 6 | Mr. Colavita’s son, Anthony S. Colavita, serves as a director of other funds in the Gabelli Fund Complex. Mr. van Ekris is an independent director of Gabelli International Ltd., Gabelli Fund LDC, GAMA Capital Opportunities Master Ltd., and GAMCO International SICAV, all of which may be deemed to be controlled by Mario J. Gabelli and/or affiliates and, in that event, would be deemed to be under common control with the Fund’s Adviser. |
| 7 | Mr. Zizza is an independent director of Gabelli International Ltd., which may be deemed to be controlled by Mario J. Gabelli and/or affiliates and in that event would be deemed to be under common control with the Fund’s Adviser. On September 9, 2015, Mr. Zizza entered into a settlement with the SEC to resolve an inquiry relating to an alleged violation regarding the making of false statements or omissions to the accountants of a company concerning a related party transaction. The company in question is not an affiliate of, nor has any connection to, the Fund. Under the terms of the settlement, Mr. Zizza, without admitting or denying the SEC’s findings and allegation, paid $150,000 and agreed to cease and desist committing or causing any future violations of Rule 13b2-2 of the Securities Exchange Act of 1934, as amended. The Board has discussed this matter and has determined that it does not disqualify Mr. Zizza from serving as an Independent Director. |
Gabelli Funds and Your Personal Privacy
Who are we?
The Gabelli Funds are investment companies registered with the Securities and Exchange Commission under the Investment Company Act of 1940. We are managed by Gabelli Funds, LLC, which is affiliated with GAMCO Investors, Inc., a publicly held company with subsidiaries and affiliates that provide investment advisory services for a variety of clients.
What kind of non-public information do we collect about you if you become a fund shareholder?
If you apply to open an account directly with us, you will be giving us some non-public information about yourself. The non-public information we collect about you is:
| ● | Information you give us on your application form. This could include your name, address, telephone number, social security number, bank account number, and other information. |
| ● | Information about your transactions with us, any transactions with our affiliates, and transactions with the entities we hire to provide services to you. This would include information about the shares that you buy or redeem. If we hire someone else to provide services — like a transfer agent — we will also have information about the transactions that you conduct through them. |
What information do we disclose and to whom do we disclose it?
We do not disclose any non-public personal information about our customers or former customers to anyone other than our affiliates, our service providers who need to know such information, and as otherwise permitted by law. If you want to find out what the law permits, you can read the privacy rules adopted by the Securities and Exchange Commission. They are in volume 17 of the Code of Federal Regulations, Part 248. The Commission often posts information about its regulations on its website, www. sec.gov.
What do we do to protect your personal information?
We restrict access to non-public personal information about you to the people who need to know that information in order to provide services to you or the fund and to ensure that we are complying with the laws governing the securities business. We maintain physical, electronic, and procedural safeguards to keep your personal information.
The Gabelli Global Mini Mites Fund
2021 TAX NOTICE TO SHAREHOLDERS (Unaudited)
For the year ended December 31, 2021, the Fund paid each share class $1.0393 per share of ordinary income (comprised of net investment income and short term capital gains), and long term capital gains totaling $333,838, or the maximum allowable. For the year ended December 31, 2021, 4.79% of the ordinary income distribution qualifies for the dividends received deduction available to corporations. The Fund designates 7.87% of the ordinary income distribution as qualified dividend income pursuant to the Jobs and Growth Tax Relief Reconciliation Act of 2003. The Fund designates 100% of the ordinary income distribution as qualified short term gain pursuant to the American Jobs Creation Act of 2004. The Fund designates 0.26% of the ordinary income distribution as qualified interest income pursuant to the Tax Relief, Unemployment Reauthorization, and Job Creation Act of 2010.
U.S. Government Income:
The percentage of the ordinary income distribution paid by the Fund during 2021 which was derived from U.S. Treasury securities was 0.00%. Such income is exempt from state and local tax in all states. However, many states, including New York and California, allow a tax exemption for a portion of the income earned only if a mutual fund has invested at least 50% of its assets at the end of each quarter of the Fund’s fiscal year in U.S. Government securities. The Fund did not meet this strict requirement in 2021. The percentage of U.S. Government securities held as of December 31, 2021 was 3.47%. Due to the diversity in state and local tax law, it is recommended that you consult your personal tax adviser as to the applicability of the information provided to your specific situation.
All designations are based on financial information available as of the date of this annual report and, accordingly, are subject to change. For each item, it is the intention of the Fund to designate the maximum amount permitted under the Internal Revenue Code and the regulations thereunder.
This page was intentionally left blank.
THE GABELLI GLOBAL MINI MITES FUND
One Corporate Center
Rye, NY 10580-1422
Portfolio Management Team Biographies
Mario J. Gabelli, CFA, is Chairman, Chief Executive Officer, and Chief Investment Officer - Value Portfolios of GAMCO Investors, Inc. that he founded in 1977, and Chief Investment Officer - Value Portfolios of Gabelli Funds, LLC and GAMCO Asset Management Inc. He is also Executive Chairman of Associated Capital Group, Inc. Mr. Gabelli is a summa cum laude graduate of Fordham University and holds an MBA degree from Columbia Business School and Honorary Doctorates from Fordham University and Roger Williams University.
Sarah Donnelly joined Gabelli in 1999 as a junior research analyst working with the consumer staples and media analysts. Currently she is a portfolio manager of Gabelli Funds, LLC, a Senior Vice President, and the Food, Household, and Personal Care products research analyst for Gabelli & Company. In 2013, she was named the Health & Wellness research platform leader. Ms. Donnelly received a BS in Business Administration with a concentration in Finance and minor in History from Fordham University.
Ashish Sinha joined GAMCO UK in 2012 as a research analyst. Prior to joining the Firm, Mr. Sinha was a research analyst at Morgan Stanley in London for seven years and has covered European Technology, Mid-Caps and Business Services. He also worked in planning and strategy at Birla Sun Life Insurance in India. Currently Mr. Sinha is a portfolio manager of Gabelli Funds, LLC and an Assistant Vice President of GAMCO Asset Management UK. Mr. Sinha has a BSBA degree from the Institute of Management Studies and an MB from IIFT.
Hendi Susanto joined Gabelli in 2007 as the lead technology research analyst. He spent his early career in supply chain management consulting and operations in the technology industry. He currently is a portfolio manager of Gabelli Funds, LLC and a Vice President of Associated Capital Group Inc. Mr. Susanto received a BS degree summa cum laude from the University of Minnesota, an MS from Massachusetts Institute of Technology, and an MBA from the Wharton School of Business.
Chong-Min Kang joined the Gabelli in 2007 as a research analyst. He currently is a portfolio manager of Gabelli Funds, LLC and a Senior Vice President of GAMCO Investors Inc. Mr. Kang received a BA degree from Boston College and an MBA from Columbia Business School.
| We have separated the portfolio managers’ commentary from the financial statements and investment portfolio due to corporate governance regulations stipulated by the Sarbanes-Oxley Act of 2002. We have done this to ensure that the contents of the portfolio managers’ commentary are unrestricted. Both the commentary and the financial statements, including the portfolios of investments, will be available on our website at www.gabelli.com. |
GAMCO Global Series Funds, Inc.
THE GABELLI GLOBAL MINI MITES FUND
One Corporate Center
Rye, New York 10580-1422
| t | 800-GABELLI (800-422-3554) |
GABELLI.COM
Net Asset Values per share available daily by calling 800-GABELLI after 7:00 P.M.
DIRECTORS Mario J. Gabelli, CFA Chairman and Chief Executive Officer, GAMCO Investors, Inc. Executive Chairman, Associated Capital Group Inc. E. Val Cerutti Chief Executive Officer, Cerutti Consultants, Inc. Anthony J. Colavita President, Anthony J. Colavita, P.C. John D. Gabelli Former Senior Vice President, G.research, LLC Werner J. Roeder Former Medical Director, Lawrence Hospital Anthonie C. van Ekris Chairman, BALMAC International, Inc. Salvatore J. Zizza Chairman, Zizza & Associates Corp. | | OFFICERS Bruce N. Alpert President John C. Ball Treasurer Peter Goldstein Secretary and Vice President Richard J. Walz Chief Compliance Officer Daniel Plourde Vice President DISTRIBUTOR G.distributors, LLC CUSTODIAN State Street Bank and Trust Company TRANSFER AGENT AND DIVIDEND DISBURSING AGENT DST Asset Manager Solutions, Inc. LEGAL COUNSEL Skadden, Arps, Slate, Meagher & Flom LLP |
This report is submitted for the general information of the shareholders of The Gabelli Global Mini Mites Fund. It is not authorized for distribution to prospective investors unless preceded or accompanied by an effective prospectus.
GAB3634Q421AR
Item 2. Code of Ethics.
| (a) | The registrant, as of the end of the period covered by this report, has adopted a code of ethics that applies to the registrant’s principal executive officer, principal financial officer, principal accounting officer or controller, or persons performing similar functions, regardless of whether these individuals are employed by the registrant or a third party. |
| (c) | There have been no amendments, during the period covered by this report, to a provision of the code of ethics that applies to the registrant’s principal executive officer, principal financial officer, principal accounting officer or controller, or persons performing similar functions, regardless of whether these individuals are employed by the registrant or a third party, and that relates to any element of the code of ethics description. |
| (d) | The registrant has not granted any waivers, including an implicit waiver, from a provision of the code of ethics that applies to the registrant’s principal executive officer, principal financial officer, principal accounting officer or controller, or persons performing similar functions, regardless of whether these individuals are employed by the registrant or a third party, that relates to one or more of the items set forth in paragraph (b) of this item’s instructions. |
Item 3. Audit Committee Financial Expert.
As of the end of the period covered by the report, the registrant’s Board of Directors has determined that Salvatore J. Zizza is qualified to serve as an audit committee financial expert serving on its audit committee and that he is “independent,” as defined by Item 3 of Form N-CSR.
Item 4. Principal Accountant Fees and Services.
Audit Fees
| (a) | The aggregate fees billed for each of the last two fiscal years for professional services rendered by the principal accountant for the audit of the registrant’s annual financial statements or services that are normally provided by the accountant in connection with statutory and regulatory filings or engagements for those fiscal years are $130,900 for 2020 and $130,900 for 2021. |
Audit-Related Fees
| (b) | The aggregate fees billed in each of the last two fiscal years for assurance and related services by the principal accountant that are reasonably related to the performance of the audit of the registrant’s financial statements and are not reported under paragraph (a) of this Item are $0 for 2020 and $0 for 2021. |
Tax Fees
| (c) | The aggregate fees billed in each of the last two fiscal years for professional services rendered by the principal accountant for tax compliance, tax advice, and tax planning are $19,000 for 2020 and $19,000 for 2021. Tax fees represent tax compliance services provided in connection with the review of the Registrant’s tax returns. |
All Other Fees
| (d) | The aggregate fees billed in each of the last two fiscal years for products and services provided by the principal accountant, other than the services reported in paragraphs (a) through (c) of this Item are $5,404 for 2020 and $6,816 for 2021. The fees relate to Passive Foreign Investment Company identification database subscription fees billed on an annual basis. |
| (e)(1) | Disclose the audit committee’s pre-approval policies and procedures described in paragraph (c)(7) of Rule 2-01 of Regulation S-X. |
Pre-Approval Policies and Procedures. The Audit Committee (“Committee”) of the registrant is responsible for pre-approving (i) all audit and permissible non-audit services to be provided by the independent registered public accounting firm to the registrant and (ii) all permissible non-audit services to be provided by the independent registered public accounting firm to the Adviser, Gabelli Funds, LLC, and any affiliate of Gabelli Funds, LLC (“Gabelli”) that provides services to the registrant (a “Covered Services Provider”) if the independent registered public accounting firm’s engagement related directly to the operations and financial reporting of the registrant. The Committee may delegate its responsibility to pre-approve any such audit and permissible non-audit services to the Chairperson of the Committee, and the Chairperson must report to the Committee, at its next regularly scheduled meeting after the Chairperson’s pre-approval of such services, his or her decision(s). The Committee may also establish detailed pre-approval policies and procedures for pre-approval of such services in accordance with applicable laws, including the delegation of some or all of the Committee’s pre-approval responsibilities to the other persons (other than Gabelli or the registrant’s officers). Pre-approval by the Committee of any permissible non-audit services is not required so long as: (i) the permissible non-audit services were not recognized by the registrant at the time of the engagement to be non-audit services; and (ii) such services are promptly brought to the attention of the Committee and approved by the Committee or Chairperson prior to the completion of the audit.
| (e)(2) | The percentage of services described in each of paragraphs (b) through (d) of this Item that were approved by the audit committee pursuant to paragraph (c)(7)(i)(C) of Rule 2-01 of Regulation S-X are as follows: |
(b) N/A
(c) 0%
(d) 0%
| (f) | The percentage of hours expended on the principal accountant’s engagement to audit the registrant’s financial statements for the most recent fiscal year that were attributed to work performed by persons other than the principal accountant’s full-time, permanent employees was less than fifty percent. |
| (g) | The aggregate non-audit fees billed by the registrant’s accountant for services rendered to the registrant, and rendered to the registrant’s investment adviser (not including any sub-adviser whose role is primarily portfolio management and is subcontracted with or overseen by another investment adviser), and any entity controlling, controlled by, or under common control with the adviser that provides ongoing services to the registrant for each of the last two fiscal years of the registrant was $59,750 for 2020 and $60,150 for 2021. |
| (h) | The registrant’s audit committee of the board of directors has considered whether the provision of non-audit services that were rendered to the registrant’s investment adviser (not including any sub-adviser whose role is primarily portfolio management and is subcontracted with or overseen by another investment adviser), and any entity controlling, controlled by, or under common control with the investment adviser that provides ongoing services to the registrant that were not pre-approved pursuant to paragraph (c)(7)(ii) of Rule 2-01 of Regulation S-X is compatible with maintaining the principal accountant’s independence. |
Item 5. Audit Committee of Listed Registrants.
Not applicable.
Item 6. Investments.
| (a) | Schedule of Investments in securities of unaffiliated issuers as of the close of the reporting period is included as part of the report to shareholders filed under Item 1(a) of this form. |
| (b) | Not applicable due to no such divestments during the semi-annual period covered since the previous Form N-CSR filing. |
Item 7. Disclosure of Proxy Voting Policies and Procedures for Closed-End Management Investment Companies.
Not applicable.
Item 8. Portfolio Managers of Closed-End Management Investment Companies.
Not applicable.
Item 9. Purchases of Equity Securities by Closed-End Management Investment Company and Affiliated Purchasers.
Not applicable.
Item 10. Submission of Matters to a Vote of Security Holders.
There have been no material changes to the procedures by which the shareholders may recommend nominees to the registrant’s Board of Directors, where those changes were implemented after the registrant last provided disclosure in response to the requirements of Item 407(c)(2)(iv) of Regulation S-K (17 CFR 229.407) (as required by Item 22(b)(15) of Schedule 14A (17 CFR 240.14a-101)), or this Item.
Item 11. Controls and Procedures.
| (a) | The registrant’s principal executive and principal financial officers, or persons performing similar functions, have concluded that the registrant’s disclosure controls and procedures (as defined in Rule 30a-3(c) under the Investment Company Act of 1940, as amended (the “1940 Act”) (17 CFR 270.30a-3(c))) are effective, as of a date within 90 days of the filing date of the report that includes the disclosure required by this paragraph, based on their evaluation of these controls and procedures required by Rule 30a-3(b) under the 1940 Act (17 CFR 270.30a-3(b)) and Rules 13a-15(b) or 15d-15(b) under the Securities Exchange Act of 1934, as amended (17 CFR 240.13a-15(b) or 240.15d-15(b)). |
| (b) | There were no changes in the registrant’s internal control over financial reporting (as defined in Rule 30a-3(d) under the 1940 Act (17 CFR 270.30a-3(d))) that occurred during the period covered by this report that has materially affected, or is reasonably likely to materially affect, the registrant’s internal control over financial reporting. |
Item 12. Disclosure of Securities Lending Activities for Closed-End Management Investment Companies.
Not applicable.
Item 13. Exhibits.
SIGNATURES
Pursuant to the requirements of the Securities Exchange Act of 1934 and the Investment Company Act of 1940, the registrant has duly caused this report to be signed on its behalf by the undersigned, thereunto duly authorized.
| (Registrant) | | GAMCO Global Series Funds, Inc. |
| By (Signature and Title)* | /s/ Bruce N. Alpert |
| | Bruce N. Alpert, Principal Executive Officer |
Pursuant to the requirements of the Securities Exchange Act of 1934 and the Investment Company Act of 1940, this report has been signed below by the following persons on behalf of the registrant and in the capacities and on the dates indicated.
| By (Signature and Title)* | /s/ Bruce N. Alpert |
| | Bruce N. Alpert, Principal Executive Officer |
| By (Signature and Title)* | /s/ John C. Ball |
| | John C. Ball, Principal Financial Officer and Treasurer |
* Print the name and title of each signing officer under his or her signature.