UNITED STATES
SECURITIES AND EXCHANGE COMMISSION
Washington, D.C. 20549
FORM N-CSR
CERTIFIED SHAREHOLDER REPORT OF REGISTERED
MANAGEMENT INVESTMENT COMPANIES
Investment Company Act file number 811-07896
GAMCO Global Series Funds, Inc.
(Exact name of registrant as specified in charter)
One Corporate Center
Rye, New York 10580-1422
(Address of principal executive offices) (Zip code)
John C. Ball
Gabelli Funds, LLC
One Corporate Center
Rye, New York 10580-1422
(Name and address of agent for service)
Registrant’s telephone number, including area code: 1-800-422-3554
Date of fiscal year end: December 31
Date of reporting period: December 31, 2023
Form N-CSR is to be used by management investment companies to file reports with the Commission not later than 10 days after the transmission to stockholders of any report that is required to be transmitted to stockholders under Rule 30e-1 under the Investment Company Act of 1940 (17 CFR 270.30e-1). The Commission may use the information provided on Form N-CSR in its regulatory, disclosure review, inspection, and policymaking roles.
A registrant is required to disclose the information specified by Form N-CSR, and the Commission will make this information public. A registrant is not required to respond to the collection of information contained in Form N-CSR unless the Form displays a currently valid Office of Management and Budget (“OMB”) control number. Please direct comments concerning the accuracy of the information collection burden estimate and any suggestions for reducing the burden to Secretary, Securities and Exchange Commission, 450 Fifth Street, NW, Washington, DC 20549-0609. The OMB has reviewed this collection of information under the clearance requirements of 44 U.S.C. § 3507.
| Item 1. | Reports to Stockholders. |
| (a) | The Report to Shareholders is attached herewith. |
| The Gabelli Global Content & Connectivity Fund Annual Report — December 31, 2023 |  |
| | | Sergey Dluzhevskiy, CFA, CPA Portfolio Manager BS, Case Western Reserve University MBA, The Wharton School University of Pennsylvania |
To Our Shareholders,
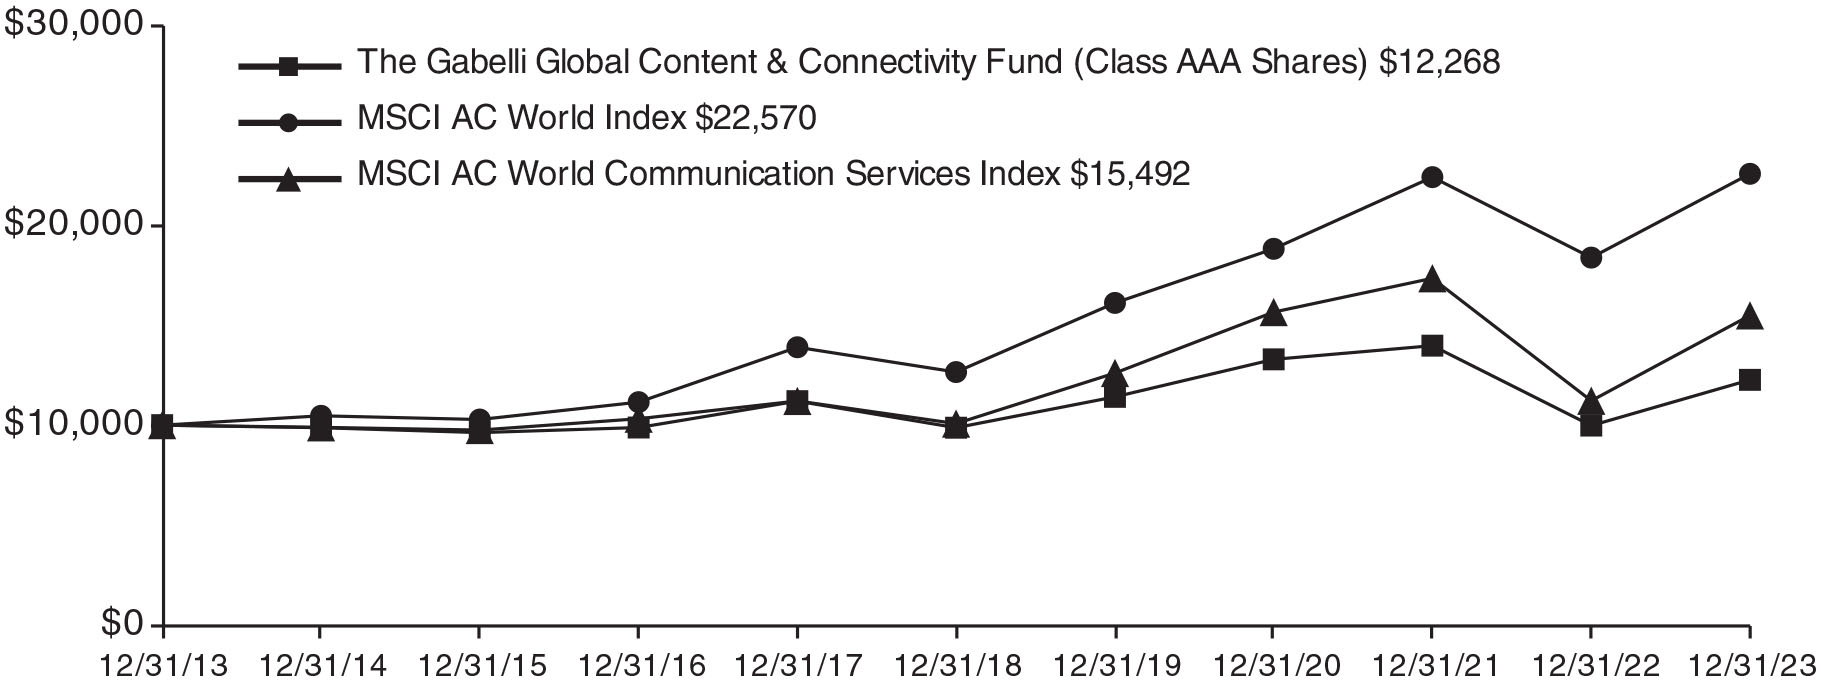
For the year ended December 31, 2023, the net asset value (NAV) total return per Class AAA Share of The Gabelli Global Content & Connectivity Fund was 22.9% compared with a total return of 38.1% for the Morgan Stanley Capital International (MSCI) All Country (AC) World Communication Services Index. Other classes of shares are available. See page 4 for performance information for all classes.
Enclosed are the financial statements, including the schedule of investments, as of December 31, 2023.
Investment Objective and Strategy (Unaudited)
The Fund’s investment objective primarily seeks to provide investors with appreciation of capital. Current income is a secondary objective of the Fund.
The Fund’s investment strategy is to invest its net assets in common stocks of companies in the telecommunications, media, and information technology industries which Gabelli Funds, LLC, the Adviser, believes are likely to have rapid growth in revenues and earnings and potential for above average capital appreciation or are undervalued. In accordance with its concentration policy, the Fund will invest at least 25% of the value of its total assets in the telecommunications related industry, and not invest more than 25% of the value of its total assets in any other particular industry.
| As permitted by regulations adopted by the Securities and Exchange Commission, paper copies of the Fund’s annual and semiannual shareholder reports will no longer be sent by mail, unless you specifically request paper copies of the reports. Instead, the reports will be made available on the Fund’s website (www.gabelli.com), and you will be notified by mail each time a report is posted and provided with a website link to access the report. If you already elected to receive shareholder reports electronically, you will not be affected by this change and you need not take any action. To elect to receive all future reports on paper free of charge, please contact your financial intermediary, or, if you invest directly with the Fund, you may call 800-422-3554 or send an email request to info@gabelli.com. |
Performance Discussion (Unaudited)
Leading the list of positive contributors to Fund performance in 1Q’23 was Meta Platforms (+76.1%), as the company lowered its expense outlook for the current fiscal year and Mark Zuckerberg labeled 2023 the “Year of Efficiency.” In addition, competition for user time from TikTok appears to be lessening and engagement across various Meta Platforms remains healthy. Alphabet (+17.2%) rose in 1Q as it continued to benefit from scale in digital advertising continues to drive further growth in mobile search, YouTube, and other ad-related areas. In late December 2022, the National Football League announced that YouTube won the rights to the next season’s NFL Sunday Ticket, which will likely help increase YouTubeTV’s customer base. Millicom (+49.5%) as (a) the company confirmed in January 2023 that a potential acquisition of the firm is being discussed with Apollo Global Management and Claure Group and (b) the firm’s largest shareholder, Xavier Niel (founder of Iliad) had increased its stake to 21% (from 7%) during 1Q. Deutsche Telekom (+22.1%) rallied on growing market recognition of the deep value discount of the “non-T-Mobile US components,” namely Germany and other European operations. The firm’s 2023 guidance reinforced positive expectations for these businesses.
Global equities rose in 2Q, with MSCI AC World Index up 6.3%, on lower inflation and a pause in interest rate hikes in the US as well as positive sentiment around development of artificial intelligence (AI) platforms and tools, driving significant gains in some of the largest technology related names. Not surprisingly, Information Technology (+14.9%) was the strongest performing sector, with Consumer Discretionary (+8.7%) and Communication Services (+7.1%) also registering solid gains. The Communication Services sector was led primarily by Media & Entertainment Industry Group (10.4%) on continued strength in shares of Meta Platforms, Alphabet, and Netflix.
Global equities declined in 3Q, with the MSCI AC World Index down 3.3%, on rising interest rates and investor concerns that the Federal Reserve and other key central banks would keep rates higher for longer than previously expected to lower inflation further. Market weakness was relatively broad based, with nine of eleven MSCI sectors registering negative returns in the quarter. Only Energy (+11%), helped by significant rise in oil prices, and Communication Services (+0.5%), led by gains in Alphabet’s and Meta Platform’s shares, were in positive territory.
Leading the list of positive contributors to Fund performance in 4Q’23 was Meta Platforms (+17.9% in 4Q), as the company reported strong 3Q’23 results (reflecting a rebound in advertising), reduced its expense guidance for FY’23, and provided lower than expected preliminary expense outlook for 2024. T-Mobile US (+15.0%) was up on solid quarterly results (with moderate beats on service revenues, EBITDA, and postpaid phone net additions) as well as raised 2023 guidance. Microsoft (+19.3%) rallied on strong fiscal 1Q performance, led by reacceleration in Microsoft Azure, the company’s premier cloud computing platform (which was up 29% year-over-year, in constant currency). Frontier Communications (+61.9%) benefited from continued solid operational execution (including strong fiber net additions), falling bond yields, and activist shareholder presence (with Jana Partners bringing investor attention to the firm’s depressed valuation and urging Frontier’s board to begin a strategic review process).
Selected holdings that contributed positively to performance in 2023 were:
Meta Platforms, Inc. (7.2% of net assets as of December 31, 2023), is the leading global online social networking and social media service provider with over 3 billion Facebook monthly active users; Alphabet Inc. (7.7%) is a holding company whose subsidiaries include the core Google business (Search, Android, YouTube, Cloud) as well as multiple independent companies, e.g. Ventures, Waymo, Verily; and Microsoft Corp. (3.8%), which develops and supports software, services, devices, and solutions worldwide.
Some of our weaker performing stocks during the year:
WideOpenWest Inc. (0.8% of net assets as of December 31, 2023), which provides high speed data, cable television, and digital telephony services to residential and business services customers in the United States; Zalando SE (1.2%), is a leading European online fashion retailer; and Kinnevik AB (1.3%), is a venture capital firm specializing in investments in early to late venture and growth capital.
Thank you for your investment in The Gabelli Global Content & Connectivity Fund.
Thank you for your continued interest and trust.
| The views expressed reflect the opinions of the Fund’s portfolio manager and Gabelli Funds, LLC, the Adviser, as of the date of this report and are subject to change without notice based on changes in market, economic, or other conditions. These views are not intended to be a forecast of future events and are no guarantee of future results. |
Comparative Results
Average Annual Returns through December 31, 2023 (a) (Unaudited)
Total returns and average annual returns reflect changes in share price, reinvestment of distributions, and are net of expenses.
| | | 1 Year | | | 5 Year | | | 10 Year | | | 15 Year | | | Since
Inception
(11/1/93) | |
| Class AAA (GABTX) | | | 22.89 | % | | | 4.43 | % | | | 2.06 | % | | | 5.35 | % | | | 6.19 | % |
| MSCI AC World Communication Services Index (b) | | | 38.13 | | | | 8.98 | | | | 4.47 | | | | 7.09 | | | | N/A | |
| MSCI AC World Index (b) | | | 22.81 | | | | 12.27 | | | | 8.48 | | | | 10.78 | | | | 7.73 | |
| Class A (GTCAX) | | | 22.92 | | | | 4.44 | | | | 2.05 | | | | 5.34 | | | | 6.19 | |
| With sales charge (c) | | | 15.85 | | | | 3.21 | | | | 1.44 | | | | 4.92 | | | | 5.98 | |
| Class C (GTCCX) | | | 54.42 | | | | 4.17 | | | | 1.55 | | | | 4.74 | | | | 5.66 | |
| Class I (GTTIX) | | | 22.90 | | | | 4.57 | | | | 2.36 | | | | 5.64 | | | | 6.35 | |
| (a) | Returns would have been lower had the Adviser not reimbursed certain expenses. The Fund imposes a 2% redemption fee on shares sold or exchanged within seven days of purchase. The Class AAA Share NAVs are used to calculate performance for the periods prior to the issuance of Class A Shares, Class C Shares, and Class I Shares on March 12, 2000, June 2, 2000, and January 11, 2008, respectively. The actual performance for the Class A Shares and Class C Shares would have been lower due to the additional fees and expenses associated with these classes of shares. The actual performance of the Class I Shares would have been higher due to lower expenses related to this class of shares. |
| (b) | The MSCI AC World Communication Services Index is an unmanaged index that measures the performance of Communication Services from around the world. The MSCI AC World Index is an unmanaged market capitalization weighted index that is designed to measure the equity market performance of developed and emerging markets. The MSCI AC World Index comprises the stocks of nearly 3,000 companies from 23 developed countries and 25 emerging markets. Dividends are considered reinvested. You cannot invest directly in an index. The MSCI AC World Communication Services Index inception date is December 30, 1994. The MSCI AC World Index since inception performance is as of October 31, 1993. |
| (c) | Performance results include the effect of the maximum 5.75% sales charge at the beginning of the period. |
In the current prospectuses dated April 28, 2023, the gross expense ratios for Class AAA, A, and I Shares are 1.81%, 1.81%, and 1.56%, respectively, and the net expense ratios for all share classes after contractual reimbursements by Gabelli Funds, LLC, (the Adviser) is 0.90%. See page 12 for the expense ratios for the year ended December 31, 2023. The contractual reimbursement is in effect through April 30, 2024. Class AAA and Class I Shares do not have a sales charge. The maximum sales charge for Class A Shares is 5.75%.
Investing in foreign securities involves risks not ordinarily associated with investments in domestic issues, including currency fluctuation, economic, and political risks. Investors should carefully consider the investment objectives, risks, charges, and expenses of the Fund before investing. The prospectus contains information about these and other matters and should be read carefully before investing. To obtain a prospectus, please visit our website at www.gabelli.com.
Returns represent past performance and do not guarantee future results. Investment returns and the principal value of an investment will fluctuate. When shares are redeemed, they may be worth more or less than their original cost. Current performance may be lower or higher than the performance data presented. Visit www.gabelli.com for performance information as of the most recent month end.
COMPARISON OF CHANGE IN VALUE OF A $10,000 INVESTMENT IN
THE GABELLI GLOBAL CONTENT & CONECTIVITY FUND (CLASS AAA SHARES), MSCI AC WORLD
COMMUNICATION SERVICES INDEX AND MSCI AC WORLD INDEX (Unaudited)
| Average Annual Total Returns* |
| | 1 Year | 5 Year | 10 Year |
| Class AAA | 22.89% | 4.43% | 2.06% |
* Past performance is not predictive of future results. The performance tables and graph do not reflect the deduction of taxes that a shareholder would pay on Fund distributions or the redemption of Fund shares.
The Gabelli Global Content & Connectivity Fund
Disclosure of Fund Expenses (Unaudited)
| For the Six Month Period from July 1, 2023 through December 31, 2023 | Expense Table |
We believe it is important for you to understand the impact of fees and expenses regarding your investment. All mutual funds have operating expenses. As a shareholder of a fund, you incur ongoing costs, which include costs for portfolio management, administrative services, and shareholder reports (like this one), among others. Operating expenses, which are deducted from a fund’s gross income, directly reduce the investment return of a fund. When a fund’s expenses are expressed as a percentage of its average net assets, this figure is known as the expense ratio. The following examples are intended to help you understand the ongoing costs (in dollars) of investing in your Fund and to compare these costs with those of other mutual funds. The examples are based on an investment of $1,000 made at the beginning of the period shown and held for the entire period.
The Expense Table below illustrates your Fund’s costs in two ways:
Actual Fund Return: This section provides information about actual account values and actual expenses. You may use this section to help you to estimate the actual expenses that you paid over the period after any fee waivers and expense reimbursements. The “Ending Account Value” shown is derived from the Fund’s actual return during the past six months, and the “Expenses Paid During Period” shows the dollar amount that would have been paid by an investor who started with $1,000 in the Fund. You may use this information, together with the amount you invested, to estimate the expenses that you paid over the period.
To do so, simply divide your account value by $1,000 (for example, an $8,600 account value divided by $1,000 = 8.6), then multiply the result by the number given for your Fund under the heading “Expenses Paid During Period” to estimate the expenses you paid during this period.
Hypothetical 5% Return: This section provides information about hypothetical account values and hypothetical expenses based on the Fund’s actual expense ratio. It assumes a hypothetical annualized return of 5% before expenses during the period shown. In this case – because the hypothetical return used is not the Fund’s actual return – the results do not apply to your investment and you cannot use the hypothetical account value and expense to estimate the actual ending account balance or expenses you
paid for the period. This example is useful in making comparisons of the ongoing costs of investing in the Fund and other funds. To do so, compare this 5% hypothetical example with the 5% hypothetical examples that appear in shareholder reports of other funds.
Please note that the expenses shown in the table are meant to highlight your ongoing costs only and do not reflect any transactional costs such as sales charges (loads), redemption fees, or exchange fees, if any, which are described in the Prospectus. If these costs were applied to your account, your costs would be higher. Therefore, the 5% hypothetical return is useful in comparing ongoing costs only, and will not help you determine the relative total costs of owning different funds. The "Annualized Expense Ratio" represents the actual expenses for the last six months and may be different from the expense ratio in the Financial Highlights which is for the year ended December 31, 2023.
| | | Beginning
Account Value
07/01/23 | | | Ending
Account Value
12/31/23 | | | Annualized
Expense
Ratio | | | Expenses
Paid During
Period * |
| The Gabelli Global Content & Connectivity Fund |
| Actual Fund Return | | | | | | | | | | | | | | | | |
| Class AAA | | $ | 1,000.00 | | | $ | 1,083.90 | | | 0.90% | | | | $ | 4.73 | |
| Class A | | $ | 1,000.00 | | | $ | 1,084.20 | | | 0.90% | | | | $ | 4.73 | |
| Class C | | $ | 1,000.00 | | | $ | 1,083.60 | | | 0.90% | | | | $ | 4.73 | |
| Class I | | $ | 1,000.00 | | | $ | 1,084.20 | | | 0.90% | | | | $ | 4.73 | |
| Hypothetical 5% Return | | | | | | | | | | | | | | | | |
| Class AAA | | $ | 1,000.00 | | | $ | 1,020.67 | | | 0.90% | | | | $ | 4.58 | |
| Class A | | $ | 1,000.00 | | | $ | 1,020.67 | | | 0.90% | | | | $ | 4.58 | |
| Class C | | $ | 1,000.00 | | | $ | 1,020.67 | | | 0.90% | | | | $ | 4.58 | |
| Class I | | $ | 1,000.00 | | | $ | 1,020.67 | | | 0.90% | | | | $ | 4.58 | |
| * | Expenses are equal to the Fund’s annualized expense ratio for the last six months multiplied by the average account value over the period, multiplied by the number of days in the most recent fiscal half year (184 days), then divided by 365. |
Summary of Portfolio Holdings (Unaudited)
The following table presents portfolio holdings as a percent of net assets as of December 31, 2023:
The Gabelli Global Content & Connectivity Fund
| Communication Services | | | 73.0 | % |
| Information Technology | | | 10.6 | % |
| Consumer Discretionary | | | 7.8 | % |
| Real Estate | | | 4.9 | % |
| Financials | | | 3.1 | % |
| U.S. Government Obligations | | | 0.7 | % |
| Other Assets and Liabilities (Net) | | | (0.1 | )% |
| | | | 100.0 | % |
The Fund files a complete schedule of portfolio holdings with the Securities and Exchange Commission (the SEC) for the first and third quarters of each fiscal year on Form N-PORT. Shareholders may obtain this information at www.gabelli.com or by calling the Fund at 800-GABELLI (800-422-3554). The Fund’s Form N-PORT is available on the SEC’s website at www.sec.gov and may also be reviewed and copied at the SEC’s Public Reference Room in Washington, DC. Information on the operation of the Public Reference Room may be obtained by calling 800-SEC-0330.
Proxy Voting
The Fund files Form N-PX with its complete proxy voting record for the twelve months ended June 30, no later than August 31 of each year. A description of the Fund’s proxy voting policies, procedures, and how the Fund voted proxies relating to portfolio securities is available without charge, upon request, by (i) calling 800-GABELLI (800-422-3554); (ii) writing to The Gabelli Funds at One Corporate Center, Rye, NY 10580-1422; or (iii) visiting the SEC’s website at www.sec.gov.
The Gabelli Global Content & Connectivity Fund
Schedule of Investments — December 31, 2023
| Shares | | | | | Cost | | | Market
Value | |
| | | | | COMMON STOCKS — 98.3% | | | | | | | | |
| | | | | COMMUNICATION SERVICES — 73.0% | | | | | | | | |
| | | | | Telecommunication Services — 47.3% | | | | | | | | |
| | | | | Wireless Telecommunication Services — 31.0% | | | | | | | | |
| | | | | Wireless Telecommunication Services — 31.0% | | | | | | | | |
| | 35,000 | | | America Movil SAB de CV, ADR | | $ | 117,403 | | | $ | 648,200 | |
| | 50,000 | | | Anterix Inc.† | | | 1,866,777 | | | | 1,666,000 | |
| | 10,000 | | | KDDI Corp. | | | 50,648 | | | | 318,156 | |
| | 85,000 | | | Millicom International Cellular SA, SDR† | | | 1,366,502 | | | | 1,519,054 | |
| | 100,000 | | | MTN Group Ltd. | | | 424,151 | | | | 631,406 | |
| | 35,000 | | | Rogers Communications Inc., Cl. B | | | 1,092,554 | | | | 1,638,350 | |
| | 80,000 | | | SoftBank Group Corp. | | | 3,325,122 | | | | 3,570,496 | |
| | 38,000 | | | T-Mobile US Inc. | | | 636,581 | | | | 6,092,540 | |
| | 36,000 | | | United States Cellular Corp.† | | | 916,134 | | | | 1,495,440 | |
| | 70,000 | | | Vodafone Group plc, ADR | | | 782,158 | | | | 609,000 | |
| | | | | | | | 10,578,030 | | | | 18,188,642 | |
| | | | | Diversified Telecommunication Services — 16.3% | | | | | | | | |
| | | | | Integrated Telecommunication Services — 15.7% | | | | | | | | |
| | 45,000 | | | AT&T Inc. | | | 805,178 | | | | 755,100 | |
| | 37,415,054 | | | Cable & Wireless Jamaica Ltd.†(a) | | | 499,070 | | | | 281,080 | |
| | 90,000 | | | Deutsche Telekom AG | | | 1,625,305 | | | | 2,160,982 | |
| | 65,000 | | | Frontier Communications Parent Inc.† | | | 1,288,246 | | | | 1,647,100 | |
| | 52,000 | | | Liberty Global Ltd., Cl. C† | | | 558,000 | | | | 969,280 | |
| | 32,000 | | | Telenor ASA | | | 446,392 | | | | 367,248 | |
| | 85,000 | | | Telephone and Data Systems Inc. | | | 1,003,369 | | | | 1,559,750 | |
| | 35,000 | | | TELUS Corp. | | | 180,401 | | | | 622,650 | |
| | 23,000 | | | Verizon Communications Inc. | | | 682,213 | | | | 867,100 | |
| | | | | | | | 7,088,174 | | | | 9,230,290 | |
| | | | | Alternative Carriers — 0.6% | | | | | | | | |
| | 35,000 | | | Telesat Corp.† | | | 463,432 | | | | 365,050 | |
| | | | | | | | | | | | | |
| | | | | Media & Entertainment — 25.7% | | | | | | | | |
| | | | | Interactive Media & Services — 14.9% | | | | | | | | |
| | | | | Interactive Media & Services — 14.9% | | | | | | | | |
| | 32,000 | | | Alphabet Inc., Cl. C† | | | 1,568,465 | | | | 4,509,760 | |
| | 12,000 | | | Meta Platforms Inc., Cl. A† | | | 1,772,962 | | | | 4,247,520 | |
| | | | | | | | 3,341,427 | | | | 8,757,280 | |
| | | | | Entertainment — 6.2% | | | | | | | | |
| | | | | Movies & Entertainment — 6.2% | | | | | | | | |
| | 13,000 | | | Atlanta Braves Holdings Inc., Cl. C† | | | 223,677 | | | | 514,540 | |
| | 200,000 | | | Bollore SE | | | 1,163,375 | | | | 1,248,568 | |
| Shares | | | | |
Cost | | | Market
Value | |
| | 60,000 | | | Manchester United plc, Cl. A† | | $ | 900,980 | | | $ | 1,222,800 | |
| | 7,500 | | | The Walt Disney Co. | | | 634,230 | | | | 677,175 | |
| | | | | | | | 2,922,262 | | | | 3,663,083 | |
| | | | | Media — 4.6% | | | | | | | | |
| | | | | Cable & Satellite — 4.6% | | | | | | | | |
| | 50,000 | | | Comcast Corp., Cl. A | | | 1,333,223 | | | | 2,192,500 | |
| | 120,000 | | | WideOpenWest Inc.† | | | 567,738 | | | | 486,000 | |
| | | | | | | | 1,900,961 | | | | 2,678,500 | |
| | | | | TOTAL COMMUNICATION SERVICES | | | 26,294,286 | | | | 42,882,845 | |
| | | | | | | | | | | | | |
| | | | | INFORMATION TECHNOLOGY — 9.5% | | | | | | | | |
| | | | | Software & Services — 6.4% | | | | | | | | |
| | | | | Software — 3.8% | | | | | | | | |
| | | | | Systems Software — 3.8% | | | | | | | | |
| | 6,000 | | | Microsoft Corp. | | | 743,640 | | | | 2,256,240 | |
| | | | | | | | | | | | | |
| | | | | IT Services — 2.6% | | | | | | | | |
| | | | | Data Processing & Outsourced Services — 2.6% | | | | | | | | |
| | 2,000 | | | Mastercard Inc., Cl. A | | | 292,730 | | | | 853,020 | |
| | 11,000 | | | PayPal Holdings Inc.† | | | 772,457 | | | | 675,510 | |
| | | | | | | | 1,065,187 | | | | 1,528,530 | |
| | | | | Technology Hardware & Equipment — 3.1% | | | | | | | | |
| | | | | Technology Hardware, Storage & Peripherals — 1.8% | | | | | | | | |
| | | | | Technology Hardware, Storage & Peripherals — 1.8% | | | | | | | | |
| | 5,500 | | | Apple Inc. | | | 217,900 | | | | 1,058,915 | |
| | | | | | | | | | | | | |
| | | | | Electronic Equipment, Instruments & Components — 1.3% | | | | | | | | |
| | | | | Electronic Equipment & Instruments — 1.3% | | | | | | | | |
| | 8,000 | | | Sony Group Corp., ADR | | | 523,380 | | | | 757,520 | |
| | | | | | | | | | | | | |
| | | | | TOTAL INFORMATION TECHNOLOGY | | | 2,550,107 | | | | 5,601,205 | |
| | | | | CONSUMER DISCRETIONARY — 7.8% | | | | | | | | |
| | | | | Retailing — 7.8% | | | | | | | | |
| | | | | Internet & Direct Marketing Retail — 7.8% | | | | | | | | |
| | | | | Internet & Direct Marketing Retail — 7.8% | | | | | | | | |
| | 4,000 | | | Amazon.com Inc.† | | | 439,023 | | | | 607,760 | |
| | 110,000 | | | Prosus NV | | | 3,460,364 | | | | 3,276,910 | |
| | 30,000 | | | Zalando SE† | | | 761,241 | | | | 710,392 | |
| | | | | | | | 4,660,628 | | | | 4,595,062 | |
| | | | | | | | | | | | | |
| | | | | TOTAL CONSUMER DISCRETIONARY | | | 4,660,628 | | | | 4,595,062 | |
| | | | | | | | | | | | | |
| | | | | REAL ESTATE — 4.9% | | | | | | | | |
| | | | | Real Estate — 4.9% | | | | | | | | |
| | | | | Equity Real Estate Investment Trusts — 4.9% | | | | | | | | |
| | | | | Specialized REITs — 4.9% | | | | | | | | |
| | 3,500 | | | American Tower Corp., REIT | | | 631,894 | | | | 755,580 | |
See accompanying notes to financial statements.
The Gabelli Global Content & Connectivity Fund
Schedule of Investments (Continued) — December 31, 2023
| Shares | | | | | Cost | | | Market
Value | |
| | | | | COMMON STOCKS (Continued) | | | | | | | | |
| | | | | REAL ESTATE (Continued) | | | | | | | | |
| | | | | Real Estate (Continued) | | | | | | | | |
| | | | | Equity Real Estate Investment Trusts (Continued) | | | | | | | | |
| | | | | Specialized REITs (Continued) | | | | | | | | |
| | 8,000 | | | Crown Castle Inc., REIT | | $ | 839,834 | | | $ | 921,520 | |
| | 1,500 | | | Equinix Inc., REIT | | | 117,666 | | | | 1,208,085 | |
| | | | | | | | 1,589,394 | | | | 2,885,185 | |
| | | | | TOTAL REAL ESTATE | | | 1,589,394 | | | | 2,885,185 | |
| | | | | | | | | | | | | |
| | | | | FINANCIALS — 3.1% | | | | | | | | |
| | | | | Diversified Financials — 3.1% | | | | | | | | |
| | | | | Diversified Financial Services — 3.1% | | | | | | | | |
| | | | | Multi-Sector Holdings — 3.1% | | | | | | | | |
| | 70,000 | | | Kinnevik AB, Cl. B† | | | 1,227,520 | | | | 750,244 | |
| | 4,460 | | | Old Mutual Ltd.(a) | | | 12,500 | | | | 50 | |
| | 500,000 | | | VNV Global AB† | | | 1,095,983 | | | | 1,041,042 | |
| | 12,000 | | | Waterloo Investment Holdings Ltd.†(a) | | | 1,432 | | | | 6,000 | |
| | | | | | | | 2,337,435 | | | | 1,797,336 | |
| | | | | Banks — 0.0% | | | | | | | | |
| | | | | Banks — 0.0% | | | | | | | | |
| | | | | Diversified Banks — 0.0% | | | | | | | | |
| | 58 | | | Nedbank Group Ltd. | | | 622 | | | | 685 | |
| | | | | | | | | | | | | |
| | | | | TOTAL FINANCIALS | | | 2,338,057 | | | | 1,798,021 | |
| | | | | | | | | | | | | |
| | | | | TOTAL COMMON STOCKS | | | 37,432,472 | | | | 57,762,318 | |
| | | | | | | | | | | | | |
| | | | | CLOSED-END FUNDS — 0.0% | | | | | | | | |
| | | | | CONSUMER DISCRETIONARY — 0.0% | | | | | | | | |
| | | | | Retailing — 0.0% | | | | | | | | |
| | | | | Internet & Direct Marketing Retail — 0.0% | | | | | | | | |
| | | | | Internet & Direct Marketing Retail — 0.0% | | | | | | | | |
| | 5,800 | | | Altaba Inc., Escrow† | | | 0 | | | | 14,181 | |
| Shares | | | | | Cost | | | Market
Value | |
| | | | | PREFERRED STOCKS — 1.1% | | | | | | | | |
| | | | | INFORMATION TECHNOLOGY — 1.1% | | | | | | | | |
| | | | | Technology - Hardware and Equipment — 1.1% | | | | | | | | |
| | | | | Technology Hardware, Storage & Peripherals — 1.1% | | | | | | | | |
| | | | | Technology Hardware, Storage & Peripherals — 1.1% | | | | | | | | |
| | 13,000 | | | Samsung Electronics Co. Ltd., 10.630% | | $ | 517,457 | | | $ | 628,853 | |
Principal
Amount | | | | | | | | | | | |
| | | | | U.S. GOVERNMENT OBLIGATIONS — 0.7% | | | | | | | | |
| $ | 395,000 | | | U.S. Treasury Bills 5.263% to 5.281%††, 03/14/24 to 03/21/24 | | | 390,732 | | | | 390,804 | |
| | | | | | | | | | | | | |
| | | | | TOTAL INVESTMENTS — 100.1% | | $ | 38,340,661 | | | | 58,796,156 | |
| | | | | | | | | | | | | |
| | | | | Other Assets and Liabilities (Net) — (0.1)% | | | | | | | (34,339 | ) |
| | | | | | | | | | | | | |
| | | | | NET ASSETS — 100.0% | | | | | | $ | 58,761,817 | |
| (a) | Security is valued using significant unobservable inputs and is classified as Level 3 in the fair value hierarchy. |
| † | Non-income producing security. |
| †† | Represents annualized yields at dates of purchase. |
ADR American Depositary Receipt
REIT Real Estate Investment Trust
SDR Swedish Depositary Receipt
| Geographic Diversification | | % of
Market
Value | | | Market
Value | |
| North America | | | 64.8 | % | | $ | 38,078,190 | |
| Europe | | | 21.9 | | | | 12,906,239 | |
| Japan | | | 7.9 | | | | 4,646,172 | |
| Latin America | | | 3.2 | | | | 1,904,560 | |
| South Africa | | | 1.1 | | | | 632,142 | |
| Asia/Pacific | | | 1.1 | | | | 628,853 | |
| | | | 100.0 | % | | $ | 58,796,156 | |
See accompanying notes to financial statements.
The Gabelli Global Content & Connectivity Fund
Statement of Assets and Liabilities
December 31, 2023
| Assets: | | | |
| Investments, at value (cost $38,340,661) | | $ | 58,796,156 | |
| Cash | | | 4,439 | |
| Foreign currency, at value (cost $1,268) | | | 661 | |
| Receivable from Adviser | | | 40,194 | |
| Dividends receivable | | | 64,320 | |
| Prepaid expenses | | | 20,096 | |
| Total Assets | | | 58,925,866 | |
| Liabilities: | | | | |
| Payable for Fund shares redeemed | | | 3,079 | |
| Payable for investment advisory fees | | | 49,251 | |
| Payable for distribution fees | | | 10,079 | |
| Payable for accounting fees | | | 3,750 | |
| Payable for shareholder communications | | | 24,534 | |
| Payable for legal and audit fees | | | 24,196 | |
| Payable for custodian fees | | | 20,810 | |
| Payable for shareholder services fees | | | 20,234 | |
| Other accrued expenses | | | 8,116 | |
| Total Liabilities | | | 164,049 | |
| Net Assets | | | | |
| (applicable to 3,147,163 shares outstanding) | | $ | 58,761,817 | |
| Net Assets Consist of: | | | | |
| Paid-in capital | | $ | 39,007,576 | |
| Total distributable earnings | | | 19,754,241 | |
| Net Assets | | $ | 58,761,817 | |
| | | | | |
| Shares of Capital Stock, each at $0.001 par value: | | | | |
| Class AAA: | | | | |
| Net Asset Value, offering, and redemption price per share ($47,833,634 ÷ 2,560,330 shares outstanding; 150,000,000 shares authorized) | | $ | 18.68 | |
| Class A: | | | | |
| Net Asset Value and redemption price per share ($223,836 ÷ 11,865 shares outstanding; 50,000,000 shares authorized) | | $ | 18.87 | |
| Maximum offering price per share (NAV ÷ 0.9425, based on maximum sales charge of 5.75% of the offering price) | | $ | 20.02 | |
| Class C: | | | | |
| Net Asset Value and redemption price per share ($185.06 ÷ 10.02 shares outstanding; 50,000,000 shares authorized) | | $ | 18.47 | |
| Class I: | | | | |
| Net Asset Value, offering, and redemption price per share ($10,704,162 ÷ 574,958 shares outstanding; 50,000,000 shares authorized) | | $ | 18.62 | |
Statement of Operations
For the Year Ended December 31, 2023
| Investment Income: | | | |
| Dividends (net of foreign withholding taxes of $34,724) | | $ | 696,716 | |
| Interest | | | 10,024 | |
| Total Investment Income | | | 706,740 | |
| Expenses: | | | | |
| Investment advisory fees | | | 557,699 | |
| Distribution fees - Class AAA | | | 114,150 | |
| Distribution fees - Class A | | | 555 | |
| Distribution fees - Class C | | | 2 | |
| Shareholder services fees | | | 77,822 | |
| Shareholder communications expenses | | | 65,463 | |
| Legal and audit fees | | | 63,772 | |
| Accounting fees | | | 45,000 | |
| Registration expenses | | | 37,591 | |
| Custodian fees | | | 31,481 | |
| Directors’ fees | | | 12,565 | |
| Interest expense | | | 3,104 | |
| Miscellaneous expenses | | | 23,141 | |
| Total Expenses | | | 1,032,345 | |
| Less: | | | | |
| Expense reimbursements (See Note 3) | | | (527,312 | ) |
| Net Expenses | | | 505,033 | |
| Net Investment Income | | | 201,707 | |
| | | | | |
| Net Realized and Unrealized Gain on Investments and Foreign Currency: | | | | |
| Net realized gain on investments | | | 158,407 | |
| Net realized gain on foreign currency transactions | | | 1,876 | |
| Net realized gain on investments and foreign currency transactions | | | 160,283 | |
| Net change in unrealized appreciation/depreciation: | | | | |
| on investments | | | 11,064,669 | |
| on foreign currency translations | | | 193 | |
| Net change in unrealized appreciation/depreciation on investments and foreign currency translations | | | 11,064,862 | |
| Net Realized and Unrealized Gain on Investments and Foreign Currency | | | 11,225,145 | |
| Net Increase in Net Assets Resulting from Operations | | $ | 11,426,852 | |
See accompanying notes to financial statements.
The Gabelli Global Content & Connectivity Fund
Statement of Changes in Net Assets
| | | Year Ended
December 31,
2023 | | | Year Ended
December 31,
2022 | |
| Operations: | | | | | | | | |
| Net investment income | | $ | 201,707 | | | $ | 109,817 | |
| Net realized gain/(loss) on investments, forward foreign exchange contracts and foreign currency transactions | | | 160,283 | | | | (91,699 | ) |
| Net change in unrealized appreciation/depreciation on investments and foreign currency translations | | | 11,064,862 | | | | (22,156,407 | ) |
| Net Increase/(Decrease) in Net Assets Resulting from Operations | | | 11,426,852 | | | | (22,138,289 | ) |
| | | | | | | | | |
| Distributions to Shareholders: | | | | | | | | |
| Accumulated earnings | | | | | | | | |
| Class AAA | | | (153,363 | ) | | | (948,178 | ) |
| Class A | | | (709 | ) | | | (5,094 | ) |
| Class C | | | (1 | ) | | | — | |
| Class I | | | (34,335 | ) | | | (205,082 | ) |
| Total Distributions to Shareholders | | | (188,408 | ) | | | (1,158,354 | ) |
| | | | | | | | | |
| Capital Share Transactions: | | | | | | | | |
| Class AAA | | | (3,659,505 | ) | | | (3,636,564 | ) |
| Class A | | | (52,076 | ) | | | (75,960 | ) |
| Class C | | | 151 | | | | (1,665 | ) |
| Class I | | | (221,679 | ) | | | (512,013 | ) |
| Net Decrease in Net Assets from Capital Share Transactions | | | (3,933,109 | ) | | | (4,226,202 | ) |
| | | | | | | | | |
| Redemption Fees | | | 631 | | | | 54 | |
| | | | | | | | | |
| Net Increase/(Decrease) in Net Assets | | | 7,305,966 | | | | (27,522,791 | ) |
| | | | | | | | | |
| Net Assets: | | | | | | | | |
| Beginning of year | | | 51,455,851 | | | | 78,978,642 | |
| End of year | | $ | 58,761,817 | | | $ | 51,455,851 | |
See accompanying notes to financial statements.
The Gabelli Global Content & Connectivity Fund
Financial Highlights
Selected data for a share of capital stock outstanding throughout each year:
| | | | | | | Income (Loss) from Investment Operations | | | Distributions | | | | | | | | | | | | Ratios to Average Net Assets/Supplemental Data | |
Year Ended
December 31 | | Net Asset Value,
Beginning of Year | | | Net Investment
Income(a) | | | Net Realized
and Unrealized
Gain (Loss) on
Investments | | | Total from
Investment
Operations | | | Net Investment
Income | | | Net Realized
Gain on
Investments | | | Total
Distributions | | | Redemption
Fees(a)(b) | | | Net Asset Value,
End of year | | | Total
Return† | | | Net Assets, End
of year
(in 000’s) | | | Net Investment
Income | | | Operating
Expenses Before
Reimbursement | | | Operating
Expenses Net of
Reimbursement(c)(d) | | | Portfolio
Turnover
Rate | |
| Class AAA | | | | | | | | | | | | | | | | | | | | |
| 2023 | | $ | 15.25 | | | $ | 0.06 | | | $ | 3.43 | | | $ | 3.49 | | | $ | (0.06 | ) | | $ | — | | | $ | (0.06 | ) | | $ | 0.00 | | | $ | 18.68 | | | | 22.89 | % | | $ | 47,834 | | | | 0.36 | % | | | 1.90 | % | | | 0.91 | % | | | 11 | % |
| 2022 | | | 21.86 | | | | 0.03 | | | | (6.29 | ) | | | (6.26 | ) | | | (0.35 | ) | | | — | | | | (0.35 | ) | | | 0.00 | | | | 15.25 | | | | (28.62 | ) | | | 42,290 | | | | 0.18 | | | | 1.81 | | | | 0.97 | (e) | | | 17 | |
| 2021 | | | 22.18 | | | | 0.56 | (f) | | | 0.59 | | | | 1.15 | | | | (0.62 | ) | | | (0.85 | ) | | | (1.47 | ) | | | — | | | | 21.86 | | | | 5.17 | | | | 65,025 | | | | 2.33 | (f) | | | 1.65 | | | | 0.90 | (e)(g) | | | 26 | |
| 2020 | | | 19.64 | | | | 0.11 | (f) | | | 3.11 | | | | 3.22 | | | | (0.46 | ) | | | (0.22 | ) | | | (0.68 | ) | | | 0.00 | | | | 22.18 | | | | 16.42 | | | | 67,239 | | | | 0.57 | (f) | | | 1.77 | | | | 0.90 | (g) | | | 41 | |
| 2019 | | | 18.08 | | | | 0.32 | | | | 2.51 | | | | 2.83 | | | | (0.37 | ) | | | (0.90 | ) | | | (1.27 | ) | | | 0.00 | | | | 19.64 | | | | 15.62 | | | | 65,024 | | | | 1.63 | | | | 1.74 | | | | 1.69 | (g) | | | 14 | |
| Class A | | | | | | | | | | | | | | | | | | | | | | | | | | | | | | |
| 2023 | | $ | 15.40 | | | $ | 0.06 | | | $ | 3.47 | | | $ | 3.53 | | | $ | (0.06 | ) | | $ | — | | | $ | (0.06 | ) | | $ | 0.00 | | | $ | 18.87 | | | | 22.92 | % | | $ | 224 | | | | 0.36 | % | | | 1.90 | % | | | 0.91 | % | | | 11 | % |
| 2022 | | | 22.07 | | | | 0.03 | | | | (6.35 | ) | | | (6.32 | ) | | | (0.35 | ) | | | — | | | | (0.35 | ) | | | 0.00 | | | | 15.40 | | | | (28.62 | ) | | | 228 | | | | 0.19 | | | | 1.81 | | | | 0.97 | (e) | | | 17 | |
| 2021 | | | 22.38 | | | | 0.56 | (f) | | | 0.60 | | | | 1.16 | | | | (0.62 | ) | | | (0.85 | ) | | | (1.47 | ) | | | — | | | | 22.07 | | | | 5.16 | | | | 428 | | | | 2.30 | (f) | | | 1.65 | | | | 0.90 | (e)(g) | | | 26 | |
| 2020 | | | 19.81 | | | | 0.11 | (f) | | | 3.14 | | | | 3.25 | | | | (0.46 | ) | | | (0.22 | ) | | | (0.68 | ) | | | 0.00 | | | | 22.38 | | | | 16.43 | | | | 422 | | | | 0.59 | (f) | | | 1.77 | | | | 0.90 | (g) | | | 41 | |
| 2019 | | | 18.23 | | | | 0.36 | | | | 2.50 | | | | 2.86 | | | | (0.38 | ) | | | (0.90 | ) | | | (1.28 | ) | | | 0.00 | | | | 19.81 | | | | 15.64 | | | | 374 | | | | 1.80 | | | | 1.74 | | | | 1.68 | (g) | | | 14 | |
| Class C | | | | | | | | | | | | | | | | | | | | | | | | | | | | | | |
| 2023 | | $ | 12.00 | | | $ | 0.06 | | | $ | 6.47 | | | $ | 6.53 | | | $ | (0.06 | ) | | $ | — | | | $ | (0.06 | ) | | $ | — | | | $ | 18.47 | | | | 54.42 | % | | $ | 0 | (h) | | | 0.38 | % | | | 2.64 | % | | | 0.91 | % | | | 11 | % |
| 2022 | | | 21.24 | | | | 0.02 | | | | (9.26 | ) | | | (9.24 | ) | | | — | | | | — | | | | — | | | | — | | | | 12.00 | | | | (43.50 | ) | | | 0 | (h) | | | 0.12 | | | | 2.56 | | | | 0.97 | (e) | | | 17 | |
| 2021 | | | 21.59 | | | | 0.64 | (f) | | | 0.48 | | | | 1.12 | | | | (0.62 | ) | | | (0.85 | ) | | | (1.47 | ) | | | — | | | | 21.24 | | | | 5.17 | | | | 3 | | | | 2.76 | (f) | | | 2.40 | | | | 0.91 | (e)(g) | | | 26 | |
| 2020 | | | 19.13 | | | | 0.10 | (f) | | | 3.04 | | | | 3.14 | | | | (0.46 | ) | | | (0.22 | ) | | | (0.68 | ) | | | — | | | | 21.59 | | | | 16.44 | | | | 49 | | | | 0.54 | (f) | | | 2.52 | | | | 0.90 | (g) | | | 41 | |
| 2019 | | | 17.45 | | | | 0.04 | | | | 2.55 | | | | 2.59 | | | | (0.01 | ) | | | (0.90 | ) | | | (0.91 | ) | | | 0.00 | | | | 19.13 | | | | 14.81 | | | | 84 | | | | 0.19 | | | | 2.49 | | | | 2.45 | (g) | | | 14 | |
| Class I | | | | | | | | | | | | | | | | | | | | | | | | | | | | | | |
| 2023 | | $ | 15.20 | | | $ | 0.06 | | | $ | 3.42 | | | $ | 3.48 | | | $ | (0.06 | ) | | $ | — | | | $ | (0.06 | ) | | $ | 0.00 | | | $ | 18.62 | | | | 22.90 | % | | $ | 10,704 | | | | 0.36 | % | | | 1.65 | % | | | 0.91 | % | | | 11 | % |
| 2022 | | | 21.79 | | | | 0.03 | | | | (6.27 | ) | | | (6.24 | ) | | | (0.35 | ) | | | — | | | | (0.35 | ) | | | 0.00 | | | | 15.20 | | | | (28.62 | ) | | | 8,938 | | | | 0.18 | | | | 1.56 | | | | 0.97 | (e) | | | 17 | |
| 2021 | | | 22.11 | | | | 0.55 | (f) | | | 0.60 | | | | 1.15 | | | | (0.62 | ) | | | (0.85 | ) | | | (1.47 | ) | | | — | | | | 21.79 | | | | 5.18 | | | | 13,523 | | | | 2.32 | (f) | | | 1.40 | | | | 0.90 | (e)(g) | | | 26 | |
| 2020 | | | 19.58 | | | | 0.11 | (f) | | | 3.10 | | | | 3.21 | | | | (0.46 | ) | | | (0.22 | ) | | | (0.68 | ) | | | 0.00 | | | | 22.11 | | | | 16.42 | | | | 13,931 | | | | 0.58 | (f) | | | 1.52 | | | | 0.90 | (g) | | | 41 | |
| 2019 | | | 18.03 | | | | 0.46 | | | | 2.51 | | | | 2.97 | | | | (0.52 | ) | | | (0.90 | ) | | | (1.42 | ) | | | 0.00 | | | | 19.58 | | | | 16.42 | | | | 12,495 | | | | 2.33 | | | | 1.49 | | | | 0.99 | (g) | | | 14 | |
| † | Total return represents aggregate total return of a hypothetical investment at the beginning of the year and sold at the end of the year including reinvestment of distributions and does not reflect the applicable sales charges. |
| (a) | Per share amounts have been calculated using the average shares outstanding method. |
| (b) | Amount represents less than $0.005 per share. |
| (c) | The Fund incurred interest expense. If interest expense had not been incurred, the ratio of operating expenses to average net assets would have been 0.90% and 0.96% for each Class for the years ended December 31, 2023 and 2022, respectively. For the years ended December 31, 2021, 2020, and 2019, the effect of interest expense was minimal. |
| (d) | Under an expense reimbursement agreement with the Adviser, the Adviser reimbursed expenses of $527,312, $490,627, $589,925, $591,218, and $91,150 for the years ended December 31, 2023, 2022, 2021, 2020, and 2019, respectively. |
| (e) | The Fund incurred tax expense for the years ended December 31, 2022 and 2021. If tax expense had not been incurred, the ratios of operating expenses to average net assets would have been 0.90% and 0.90% for each Class. |
| (f) | Includes income resulting from special dividends. Without these dividends, the per share income amounts would have been $0.05 and $0.09 (Class AAA), $0.04 and $0.09 (Class A), $0.15 and $0.08 (Class C), and $0.05 and $0.09 (Class I), and the net investment income ratios would have been 0.20% and 0.45% (Class AAA), 0.18% and 0.47% (Class A), 0.63% and 0.41% (Class C), and 0.20% and 0.46% (Class I) for the years ended December 31, 2021 and 2020, respectively. |
| (g) | The Fund received credits from a designated broker who agreed to pay certain Fund operating expenses. For the years ended December 31, 2021, 2020, and 2019, there was no impact to the expense ratios. |
| (h) | Actual number of shares outstanding is 10.02 and 0.02 for the years ended December 31, 2023 and 2022, respectively. |
See accompanying notes to financial statements.
The Gabelli Global Content & Connectivity Fund
Notes to Financial Statements
1. Organization. The Gabelli Global Content & Connectivity Fund, a series of the GAMCO Global Series Funds, Inc. (the Corporation), was incorporated on July 16, 1993 in Maryland. The Fund is a non-diversified open-end management investment company registered under the Investment Company Act of 1940, as amended (the 1940 Act), and is one of five separately managed portfolios (collectively, the Portfolios) of the Corporation. The Fund commenced investment operations on November 1, 1993.
The Fund’s investment objective primarily seeks to provide investors with appreciation of capital. The Fund may invest a high percentage of its assets in specific sectors of the market in order to achieve a potentially greater investment return. As a result, the Fund may be more susceptible to economic, political, and regulatory developments in a particular sector of the market, positive or negative, and may experience increased volatility to the Fund’s NAV and a magnified effect in its total return.
2. Significant Accounting Policies. As an investment company, the Fund follows the investment company accounting and reporting guidance, which is part of U.S. generally accepted accounting principles (GAAP) that may require the use of management estimates and assumptions in the preparation of its financial statements. Actual results could differ from those estimates. The following is a summary of significant accounting policies followed by the Fund in the preparation of its financial statements.
Security Valuation. Portfolio securities listed or traded on a nationally recognized securities exchange or traded in the U.S. over-the-counter market for which market quotations are readily available are valued at the last quoted sale price or a market’s official closing price as of the close of business on the day the securities are being valued. If there were no sales that day, the security is valued at the average of the closing bid and asked prices or, if there were no asked prices quoted on that day, then the security is valued at the closing bid price on that day. If no bid or asked prices are quoted on such day, the security is valued at the most recently available price or, if the Board of Directors (the Board) so determines, by such other method as the Board shall determine in good faith to reflect its fair market value. Portfolio securities traded on more than one national securities exchange or market are valued according to the broadest and most representative market, as determined by Gabelli Funds, LLC (the Adviser).
Portfolio securities primarily traded on a foreign market are generally valued at the preceding closing values of such securities on the relevant market, but may be fair valued pursuant to procedures established by the Board if market conditions change significantly after the close of the foreign market, but prior to the close of business on the day the securities are being valued. Debt obligations for which market quotations are readily available are valued at the average of the latest bid and asked prices. If there were no asked prices quoted on such day, the security is valued using the closing bid price. Such debt obligations are valued through prices provided by a pricing service approved by the Board. Certain securities are valued principally using dealer quotations.
Securities and assets for which market quotations are not readily available are fair valued as determined by the Board. Fair valuation methodologies and procedures may include, but are not limited to: analysis and review of available financial and non-financial information about the company; comparisons with the valuation and changes in valuation of similar securities, including a comparison of foreign securities with the equivalent U.S. dollar value American Depositary Receipt securities at the close of the U.S. exchange; and evaluation of any other information that could be indicative of the value of the security.
The Gabelli Global Content & Connectivity Fund
Notes to Financial Statements (Continued)
The inputs and valuation techniques used to measure fair value of the Fund’s investments are summarized into three levels as described in the hierarchy below:
| ● | Level 1 — quoted prices in active markets for identical securities; |
| ● | Level 2 — other significant observable inputs (including quoted prices for similar securities, interest rates, prepayment speeds, credit risk, etc.); and |
| ● | Level 3 — significant unobservable inputs (including the Board’s determinations as to the fair value of investments). |
A financial instrument’s level within the fair value hierarchy is based on the lowest level of any input both individually and in the aggregate that is significant to the fair value measurement. The inputs or methodology used for valuing securities are not necessarily an indication of the risk associated with investing in those securities. The summary of the Fund’s investments in securities by inputs used to value the Fund’s investments as of December 31, 2023 is as follows:
| | | Valuation Inputs | | | | |
| | |
Level 1
Quoted Prices | | | Level 2
Other Significant
Observable
Inputs | | | Level 3
Significant
Unobservable
Inputs (a) | | |
Total Market Value at
12/31/23 | |
| INVESTMENTS IN SECURITIES: | | | | | | | | | | | | | | | | |
| ASSETS (Market Value): | | | | | | | | | | | | | | | | |
| Common Stocks: | | | | | | | | | | | | | | | | |
| Communication Services | | $ | 42,601,765 | | | | — | | | $ | 281,080 | | | $ | 42,882,845 | |
| Financials | | | 1,791,971 | | | | — | | | | 6,050 | | | | 1,798,021 | |
| Other Industries (b) | | | 13,081,452 | | | | — | | | | — | | | | 13,081,452 | |
| Total Common Stocks | | | 57,475,188 | | | | — | | | | 287,130 | | | | 57,762,318 | |
| Closed-End Funds (b) | | | — | | | $ | 14,181 | | | | — | | | | 14,181 | |
| Preferred Stocks (b) | | | 628,853 | | | | — | | | | — | | | | 628,853 | |
| U.S. Government Obligations | | | — | | | | 390,804 | | | | — | | | | 390,804 | |
| TOTAL INVESTMENTS IN SECURITIES – ASSETS | | $ | 58,104,041 | | | $ | 404,985 | | | $ | 287,130 | | | $ | 58,796,156 | |
| (a) | The inputs for these securities are not readily available and are derived based on the judgment of the Adviser according to procedures approved by the Board. |
| (b) | Please refer to the Schedule of Investments for the industry classifications of these portfolio holdings. |
The Fund did not have transfers into or out of Level 3 during the year ended December 31, 2023. The Fund’s policy is to recognize transfers among levels as of the beginning of the reporting period.
The Gabelli Global Content & Connectivity Fund
Notes to Financial Statements (Continued)
Additional Information to Evaluate Qualitative Information.
General. The Fund uses recognized industry pricing services – approved by the Board and unaffiliated with the Adviser – to value most of its securities, and uses broker quotes provided by market makers of securities not valued by these and other recognized pricing sources. Several different pricing feeds are received to value domestic equity securities, international equity securities, preferred equity securities, and fixed income securities. The data within these feeds are ultimately sourced from major stock exchanges and trading systems where these securities trade. The prices supplied by external sources are checked by obtaining quotations or actual transaction prices from market participants. If a price obtained from the pricing source is deemed unreliable, prices will be sought from another pricing service or from a broker/dealer that trades that security or similar securities.
Fair Valuation. Fair valued securities may be common or preferred equities, warrants, options, rights, or fixed income obligations. Where appropriate, Level 3 securities are those for which market quotations are not available, such as securities not traded for several days, or for which current bids are not available, or which are restricted as to transfer. When fair valuing a security, factors to consider include recent prices of comparable securities that are publicly traded, reliable prices of securities not publicly traded, the use of valuation models, current analyst reports, valuing the income or cash flow of the issuer, or cost if the preceding factors do not apply. A significant change in the unobservable inputs could result in a lower or higher value in Level 3 securities. The circumstances of Level 3 securities are frequently monitored to determine if fair valuation measures continue to apply.
The Adviser reports quarterly to the Board the results of the application of fair valuation policies and procedures. These may include backtesting the prices realized in subsequent trades of these fair valued securities to fair values previously recognized.
Foreign Currency Translations. The books and records of the Fund are maintained in U.S. dollars. Foreign currencies, investments, and other assets and liabilities are translated into U.S. dollars at current exchange rates. Purchases and sales of investment securities, income, and expenses are translated at the exchange rate prevailing on the respective dates of such transactions. Unrealized gains and losses that result from changes in foreign exchange rates and/or changes in market prices of securities have been included in unrealized appreciation/depreciation on investments and foreign currency translations. Net realized foreign currency gains and losses resulting from changes in exchange rates include foreign currency gains and losses between trade date and settlement date on investment securities transactions, foreign currency transactions, and the difference between the amounts of interest and dividends recorded on the books of the Fund and the amounts actually received. The portion of foreign currency gains and losses related to fluctuation in exchange rates between the initial purchase trade date and subsequent sale trade date is included in realized gain/(loss) on investments.
Foreign Securities. The Fund may directly purchase securities of foreign issuers. Investing in securities of foreign issuers involves special risks not typically associated with investing in securities of U.S. issuers. The risks include possible revaluation of currencies, the inability to repatriate funds, less complete financial information about companies, and possible future adverse political and economic developments. Moreover, securities of many foreign issuers and their markets may be less liquid and their prices more volatile than securities of comparable U.S. issuers.
The Gabelli Global Content & Connectivity Fund
Notes to Financial Statements (Continued)
Foreign Taxes. The Fund may be subject to foreign taxes on income, gains on investments, or currency repatriation, a portion of which may be recoverable. The Fund will accrue such taxes and recoveries as applicable, based upon its current interpretation of tax rules and regulations that exist in the markets in which it invests.
Restricted Securities. The Fund may invest up to 15% of its net assets in securities for which the markets are restricted. Restricted securities include securities whose disposition is subject to substantial legal or contractual restrictions. The sale of restricted securities often requires more time and results in higher brokerage charges or dealer discounts and other selling expenses than the sale of securities eligible for trading on national securities exchanges or in the over-the-counter markets. Restricted securities may sell at a price lower than similar securities that are not subject to restrictions on resale. Securities freely saleable among qualified institutional investors under special rules adopted by the SEC may be treated as liquid if they satisfy liquidity standards established by the Board. The continued liquidity of such securities is not as well assured as that of publicly traded securities, and accordingly the Board will monitor their liquidity. At December 31, 2023, the Fund did not hold any restricted securities.
Investments in Other Investment Companies. The Fund may invest, from time to time, in shares of other investment companies (or entities that would be considered investment companies but are excluded from the definition pursuant to certain exceptions under the 1940 Act) (the Acquired Funds) in accordance with the 1940 Act and related rules. Shareholders in the Fund would bear the pro rata portion of the periodic expenses of the Acquired Funds in addition to the Fund’s expenses. For the year ended December 31, 2023, the Fund’s pro rata portion of the periodic expenses charged by the Acquired Funds was less than one basis point.
Securities Transactions and Investment Income. Securities transactions are accounted for on the trade date with realized gain/(loss) on investments determined by using the identified cost method. Interest income (including amortization of premium and accretion of discount) is recorded on an accrual basis. Premiums and discounts on debt securities are amortized using the effective yield to maturity method or amortized to earliest call date, if applicable. Dividend income is recorded on the ex-dividend date, except for certain dividends from foreign securities that are recorded as soon after the ex-dividend date as the Fund becomes aware of such dividends.
Determination of Net Asset Value and Calculation of Expenses. Certain administrative expenses are common to, and allocated among, various affiliated funds. Such allocations are made on the basis of each fund’s average net assets or other criteria directly affecting the expenses as determined by the Adviser pursuant to procedures established by the Board.
In calculating the NAV per share of each class, investment income, realized and unrealized gains and losses, redemption fees, and expenses other than class specific expenses are allocated daily to each class of shares based upon the proportion of net assets of each class at the beginning of each day. Distribution expenses are borne solely by the class incurring the expense.
Distributions to Shareholders. Distributions to shareholders are recorded on the ex-dividend date. Distributions to shareholders are based on income and capital gains as determined in accordance with federal income tax regulations, which may differ from income and capital gains as determined under GAAP. These differences are primarily due to differing treatments of income and gains on various investment securities and foreign currency transactions, timing differences, and differing characterizations of distributions made by the Fund. Distributions from net investment income for federal income tax purposes include net realized gains on foreign currency
The Gabelli Global Content & Connectivity Fund
Notes to Financial Statements (Continued)
transactions. These book/tax differences are either temporary or permanent in nature. To the extent these differences are permanent, adjustments are made to the appropriate capital accounts in the period when the differences arise. Permanent differences were primarily due to the disallowance of net operating losses. These reclassifications have no impact on the NAV of the Fund. For the year ended December 31, 2023, reclassifications were made to increase paid-in capital by $932, with an offsetting adjustment to total distributable earnings.
The tax character of distributions paid during the years ended December 31, 2023 and 2022 was as follows:
| | | Year Ended
December 31,
2023 | | | Year Ended
December 31,
2022 | |
| Distributions paid from: | | | | | | | | |
| Ordinary income | | $ | 188,408 | | | $ | 1,158,354 | |
| Total distributions paid | | $ | 188,408 | | | $ | 1,158,354 | |
Provision for Income Taxes. The Fund intends to continue to qualify as a regulated investment company under Subchapter M of the Internal Revenue Code of 1986, as amended (the Code). It is the policy of the Fund to comply with the requirements of the Code applicable to regulated investment companies and to distribute substantially all of its net investment company taxable income and net capital gains. Therefore, no provision for federal income taxes is required.
At December 31, 2023, the components of accumulated earnings/losses on a tax basis were as follows:
| Undistributed ordinary income | | $ | 84,749 | |
| Accumulated capital loss carryforwards | | | (354,304 | ) |
| Net unrealized appreciation on investments and foreign currency translations | | | 20,023,796 | |
| Total | | $ | 19,754,241 | |
The Fund is permitted to carry capital losses forward for an unlimited period. Capital losses that are carried forward will retain their character as either short term or long term capital losses. The Fund has a short term capital loss carryforward with no expiration of $260,802 and a long term capital loss carryforward with no expiration of $93,502.
At December 31, 2023, the temporary differences between book basis and tax basis unrealized appreciation were primarily due to mark-to-market adjustments on investments considered passive foreign investment companies.
The following summarizes the tax cost of investments and the related net unrealized appreciation at December 31, 2023:
| | | Cost | | | Gross
Unrealized
Appreciation | | | Gross
Unrealized
Depreciation | | | Net
Unrealized
Appreciation | |
| Investments | | $ | 38,771,845 | | | $ | 23,070,278 | | | $ | (3,045,967 | ) | | $ | 20,024,311 | |
The Fund is required to evaluate tax positions taken or expected to be taken in the course of preparing the Fund’s tax returns to determine whether the tax positions are “more-likely-than-not” of being sustained by the applicable tax authority. Income tax and related interest and penalties would be recognized by the Fund as tax
The Gabelli Global Content & Connectivity Fund
Notes to Financial Statements (Continued)
expense in the Statement of Operations if the tax positions were deemed not to meet the more-likely-than-not threshold. During the year ended December 31, 2023, the Fund did not incur any income tax, interest, or penalties. As of December 31, 2023, the Adviser has reviewed all open tax years and concluded that there was no impact to the Fund’s net assets or results of operations. The Fund’s federal and state tax returns for the prior three fiscal years remain open, subject to examination. On an ongoing basis, the Adviser will monitor the Fund’s tax positions to determine if adjustments to this conclusion are necessary.
3. Investment Advisory Agreement and Other Transactions. The Fund has entered into an investment advisory agreement (the Advisory Agreement) with the Adviser which provides that the Fund will pay the Adviser a fee, computed daily and paid monthly, at the annual rate of 1.00% of the value of its average daily net assets. In accordance with the Advisory Agreement, the Adviser provides a continuous investment program for the Fund’s portfolio, oversees the administration of all aspects of the Fund’s business and affairs, and pays the compensation of all Officers and Directors of the Fund who are affiliated persons of the Adviser.
The Adviser has contractually agreed to waive its investment advisory fees and/or to reimburse expenses to the extent necessary to maintain the annualized total operating expenses of the Fund (excluding brokerage costs, acquired fund fees and expenses, interest, taxes, and extraordinary expenses) until at least April 30, 2024, at no more than an annual rate of 0.90% for all classes of shares. During the year ended December 31, 2023, the Adviser reimbursed expenses in the amount of $527,312. In addition, the Fund has agreed, during the two year period following any waiver or reimbursement by the Adviser, to repay such amount to the extent, that after giving effect to the repayment, such adjusted annualized total operating expenses of the Fund would not exceed 0.90% of the value of the Fund’s average daily net assets for each share class of the Fund. The agreement is renewable annually. At December 31, 2023, the cumulative contingent amount which the Fund may repay the Adviser, subject to the terms above, is $1,017,939:
| For the year ended December 31, 2022, expiring December 31, 2024 | | $ | 490,627 | |
| For the year ended December 31, 2023, expiring December 31, 2025 | | | 527,312 | |
| | | $ | 1,017,939 | |
4. Distribution Plan. The Fund’s Board has adopted a distribution plan (the Plan) for each class of shares, except for Class I Shares, pursuant to Rule 12b-1 under the 1940 Act. Under the Class AAA, Class A, and Class C Share Plans, payments are authorized to G.distributors, LLC (the Distributor), an affiliate of the Adviser, at annual rates of 0.25%, 0.25%, and 1.00%, respectively, of the average daily net assets of those classes, the annual limitations under each Plan. Such payments are accrued daily and paid monthly.
5. Portfolio Securities. Purchases and sales of securities during the year ended December 31, 2023, other than short term securities and U.S. Government obligations, aggregated $6,386,710 and $10,650,161, respectively.
6. Transactions with Affiliates and Other Arrangements. During the year ended December 31, 2023, the Fund paid brokerage commissions on security trades of $306 to G.research, LLC, an affiliate of the Adviser.
The cost of calculating the Fund’s NAV per share is a Fund expense pursuant to the Advisory Agreement. Under the sub-administration agreement with Bank of New York Mellon, the fees paid include the cost of calculating the Fund’s NAV. The Fund reimburses the Adviser for this service. During the year ended December 31, 2023, the Fund accrued $45,000 in accounting fees in the Statement of Operations.
The Gabelli Global Content & Connectivity Fund
Notes to Financial Statements (Continued)
The Corporation pays retainer and per meeting fees to Directors not affiliated with the Adviser, plus specified amounts to the Lead Director and Audit Committee Chairman. Directors are also reimbursed for out of pocket expenses incurred in attending meetings. Directors who are directors or employees of the Adviser or an affiliated company receive no compensation or expense reimbursement from the Corporation.
7. Line of Credit. The Fund participates in an unsecured line of credit, which expires on February 28, 2024 and may be renewed annually, of up to $75,000,000 under which it may borrow up to 10% of its net assets from the custodian for temporary borrowing purposes. Borrowings under this arrangement bear interest at a floating rate equal to the higher of the Overnight Federal Funds Rate plus 135 basis points or the Overnight Bank Funding Rate plus 135 basis points in effect on that day. This amount, if any, would be included in “Interest expense” in the Statement of Operations. At December 31, 2023, there were no borrowings outstanding under the line of credit.
The average daily amount of borrowings outstanding under the line of credit for 61 days of borrowings during the year ended December 31, 2023 was $131,787 with a weighted average interest rate of 6.51%. The maximum amount borrowed at any time during the year ended December 31, 2023 was $202,000.
8. Capital Stock. The Fund currently offers three classes of shares – Class AAA Shares, Class A Shares, and Class I Shares. Class AAA and Class A investors may purchase more of these share classes. Class C shareholders cannot purchase more of this class. The minimum investment for Class I shares is $1,000. These changes had no effect on existing shareholders’ ability to redeem shares of the Fund as described in the Fund’s Prospectus.
The Fund imposes a redemption fee of 2.00% on all classes of shares that are redeemed or exchanged on or before the seventh day after the date of a purchase. The redemption fee is deducted from the proceeds otherwise payable to the redeeming shareholders and is retained by the Fund as an increase in paid-in capital. The redemption fees retained by the Fund during the years ended December 31, 2023 and 2022, if any, can be found in the Statement of Changes in Net Assets under Redemption Fees.
The Gabelli Global Content & Connectivity Fund
Notes to Financial Statements (Continued)
Transactions in shares of capital stock were as follows:
|
| Year Ended
December 31,
2023 |
|
| Year Ended
December 31,
2022 |
|
| | | Shares | | | Amount | | | Shares | | | Amount | |
| Class AAA | | | | | | | | | | | | | | | | |
| Shares sold | | | 12,289 | | | $ | 214,152 | | | | 8,946 | | | $ | 158,255 | |
| Shares issued upon reinvestment of distributions | | | 7,830 | | | | 145,873 | | | | 60,605 | | | | 908,371 | |
| Shares redeemed | | | (232,358 | ) | | | (4,019,530 | ) | | | (271,592 | ) | | | (4,703,190 | ) |
| Net decrease | | | (212,239 | ) | | $ | (3,659,505 | ) | | | (202,041 | ) | | $ | (3,636,564 | ) |
| Class A | | | | | | | | | | | | | | | | |
| Shares sold | | | 8 | | | $ | 156 | | | | 59 | | | $ | 885 | |
| Shares issued upon reinvestment of distributions | | | 29 | | | | 553 | | | | 278 | | | | 4,209 | |
| Shares redeemed | | | (3,001 | ) | | | (52,785 | ) | | | (4,902 | ) | | | (81,054 | ) |
| Net decrease | | | (2,964 | ) | | $ | (52,076 | ) | | | (4,565 | ) | | $ | (75,960 | ) |
| Class C | | | | | | | | | | | | | | | | |
| Shares issued upon reinvestment of distributions | | | 10 | | | $ | 151 | | | | 10 | | | $ | 157 | |
| Shares redeemed | | | — | | | | — | | | | (116 | ) | | | (1,822 | ) |
| Net increase/(decrease) | | | 10 | | | $ | 151 | | | | (106 | ) | | $ | (1,665 | ) |
| Class I | | | | | | | | | | | | | | | | |
| Shares sold | | | 37,489 | | | $ | 642,576 | | | | 25,548 | | | $ | 473,558 | |
| Shares issued upon reinvestment of distributions | | | 1,689 | | | | 31,356 | | | | 12,425 | | | | 185,623 | |
| Shares redeemed | | | (52,246 | ) | | | (895,611 | ) | | | (70,682 | ) | | | (1,171,194 | ) |
| Net decrease | | | (13,068 | ) | | $ | (221,679 | ) | | | (32,709 | ) | | $ | (512,013 | ) |
9. Indemnifications. The Fund enters into contracts that contain a variety of indemnifications. The Fund’s maximum exposure under these arrangements is unknown. However, the Fund has not had prior claims or losses pursuant to these contracts. Management has reviewed the Fund’s existing contracts and expects the risk of loss to be remote.
10. Subsequent Events. Management has evaluated the impact on the Fund of all subsequent events occurring through the date the financial statements were issued and has determined that there were no subsequent events requiring recognition or disclosure in the financial statements.
The Gabelli Global Content & Connectivity Fund
Report of Independent Registered Public Accounting Firm
To the Shareholders of The Gabelli Global Content & Connectivity Fund
and the Board of Directors of GAMCO Global Series Funds, Inc.
Opinion on the Financial Statements
We have audited the accompanying statement of assets and liabilities of The Gabelli Global Content & Connectivity Fund (the “Fund”) (one of the funds constituting GAMCO Global Series Funds, Inc. (the “Corporation”)), including the schedule of investments, as of December 31, 2023, and the related statement of operations for the year then ended, the statements of changes in net assets for each of the two years in the period then ended, the financial highlights for each of the five years in the period then ended and the related notes (collectively referred to as the “financial statements”). In our opinion, the financial statements present fairly, in all material respects, the financial position of the Fund (one of the funds constituting GAMCO Global Series Funds, Inc.) at December 31, 2023, the results of its operations for the year then ended, the changes in its net assets for each of the two years in the period then ended and its financial highlights for each of the five years in the period then ended, in conformity with U.S. generally accepted accounting principles.
Basis for Opinion
These financial statements are the responsibility of the Corporation’s management. Our responsibility is to express an opinion on the Fund’s financial statements based on our audits. We are a public accounting firm registered with the Public Company Accounting Oversight Board (United States) (“PCAOB”) and are required to be independent with respect to the Corporation in accordance with the U.S. federal securities laws and the applicable rules and regulations of the Securities and Exchange Commission and the PCAOB.
We conducted our audits in accordance with the standards of the PCAOB. Those standards require that we plan and perform the audit to obtain reasonable assurance about whether the financial statements are free of material misstatement, whether due to error or fraud. The Corporation is not required to have, nor were we engaged to perform, an audit of the Corporation’s internal control over financial reporting. As part of our audits, we are required to obtain an understanding of internal control over financial reporting, but not for the purpose of expressing an opinion on the effectiveness of the Corporation’s internal control over financial reporting. Accordingly, we express no such opinion.
Our audits included performing procedures to assess the risks of material misstatement of the financial statements, whether due to error or fraud, and performing procedures that respond to those risks. Such procedures included examining, on a test basis, evidence regarding the amounts and disclosures in the financial statements. Our procedures included confirmation of securities owned as of December 31, 2023 by correspondence with the custodian. Our audits also included evaluating the accounting principles used and significant estimates made by management, as well as evaluating the overall presentation of the financial statements. We believe that our audits provide a reasonable basis for our opinion.

We have served as the auditor of one or more Gabelli Funds investment companies since 1992.
New York, New York
February 28, 2024
The Gabelli Global Content & Connectivity Fund
Liquidity Risk Management Program (Unaudited)
In accordance with Rule 22e-4 under the 1940 Act,the Fund has established a liquidity risk management program (the LRM Program) to govern its approach to managing liquidity risk. The LRM Program is administered by the Liquidity Committee (the Committee), which is comprised of members of Gabelli Funds, LLC management. The Board has designated the Committee to administer the LRM Program.
The LRM Program’s principal objectives include supporting the Fund’s compliance with limits on investments in illiquid assets and mitigating the risk that the Fund will be unable to meet its redemption obligations in a timely manner. The LRM Program also includes elements that support the management and assessment of liquidity risk, including an annual assessment of factors that influence the Fund’s liquidity and the monthly classification and re-classification of certain investments that reflect the Committee’s assessment of their relative liquidity under current market conditions.
At a meeting of the Board held on August 23, 2023, the Board received a written report from the Committee regarding the design and operational effectiveness of the LRM Program. The Committee determined, and reported to the Board, that the LRM Program is reasonably designed to assess and manage the Fund’s liquidity risk and has operated adequately and effectively since its implementation. The Committee reported that there were no liquidity events that impacted the Fund or its ability to timely meet redemptions without dilution to existing shareholders. The Committee noted that the Fund is primarily invested in highly liquid securities and, accordingly, continues to be exempt from the requirement to determine a “highly liquid investment minimum” as defined in the Rule 22e-4. Because of that continued qualification for the exemption, the Fund has not adopted a “highly liquid investment minimum” amount. The Committee further noted that while changes to the LRM Program were made during the Review Period and reported to the Board, no material changes were made to the LRM Program as a result of the Committee’s annual review.
There can be no assurance that the LRM Program will achieve its objectives in the future. Please refer to the Fund’s Prospectus for more information regarding its exposure to liquidity risk and other principal risks to which an investment in the Fund may be subject.
The Gabelli Global Content & Connectivity Fund
Board Consideration and Re-Approval of Investment Advisory Agreement (Unaudited)
During the six months ended December 31, 2023, the Board of Directors of the Corporation approved the continuation of the investment advisory agreement with the Adviser for the Fund on the basis of the recommendation by the directors (the Independent Board Members) who are not interested persons of the Fund. The following paragraphs summarize the material information and factors considered by the Independent Board Members as well as their conclusions relative to such factors.
Nature, Extent, and Quality of Services. The Independent Board Members considered information regarding the Fund’s portfolio manager, the depth of the analyst pool available to the Adviser and the Fund’s portfolio manager, the scope of supervisory, administrative, shareholder, and other services supervised or provided by the Adviser and the absence of significant service problems reported to the Board. The Independent Board Members noted the experience, length of service, and reputation of the Fund’s portfolio manager.
Investment Performance. The Independent Board Members reviewed the short, medium, and long term performance of the Fund (as of September 30, 2023) against a peer group of nine other comparable funds prepared by the Adviser (the Adviser Peer Group), and against a peer group prepared by Broadridge (the Broadridge Performance Peer Group) consisting of all retail and institutional telecommunication funds, regardless of asset size or primary channel of distribution. The Independent Board Members noted that the Fund’s performance was in the third quartile for the one and three year periods and in the fourth quartile for five and ten year periods, as measured against the Adviser Peer Group. Against the Broadridge Performance Peer Group, the Independent Board Members noted that the Fund’s performance was in the third quintile for the one year and five year periods, the second quintile for the three year period, and in the fourth quintile for the ten year period. The Independent Board Members discussed the modest improvement in the Fund’s performance and also recalled the Adviser’s comprehensive discussion of performance earlier in the Meeting.
Profitability. The Independent Board Members reviewed summary data regarding the profitability of the Fund to the Adviser both with a pro rata administrative charge and with a standalone administrative charge and noted the impact of the expense limitation agreement. The Independent Board Members also noted that a substantial portion of the Fund’s portfolio transactions were executed by an affiliated broker of the Adviser and that another affiliated broker received distribution fees and minor amounts of sales commissions.
Economies of Scale. The Independent Board Members discussed the major elements of the Adviser’s cost structure and the relationship of those elements to potential economies of scale and reviewed data provided by the Adviser.
Sharing of Economies of Scale. The Independent Board Members noted that the investment management fee schedule for the Fund does not take into account any potential economies of scale that may develop.
Service and Cost Comparisons. The Independent Board Members compared the expense ratios of the investment management fee, other expenses, and total expenses of the Fund with similar expense ratios of the Adviser Peer Group and a peer group of four other telecommunications funds selected by Broadridge (the Broadridge Expense Peer Group), and noted that the Adviser’s management fee includes substantially all administrative services of the Fund as well as investment advisory services of the Adviser. The Independent Board Members noted that the Fund’s total expense ratio was slightly above the median in the Adviser Peer Group and the second lowest in the Broadridge Expense Peer Group and that the Fund’s size was generally smaller than average within both peer groups. The Independent Board Members also noted that the advisory
The Gabelli Global Content & Connectivity Fund
Board Consideration and Re-Approval of Investment Advisory Agreement (Unaudited) (Continued)
fee structure was the same as that in effect for most of the Gabelli funds and noted the effect of the expense limitation agreement in place for the Fund. The Independent Board Members were presented with, but did not consider to be material to their decision, various information comparing the advisory fee with the fee for other types of accounts managed by the Adviser.
Conclusions. The Independent Board Members concluded that the Fund enjoyed highly experienced portfolio management services and good ancillary services. The Independent Board Members noted the modest improvement in the Fund’s performance and the steps the Adviser had taken to improve performance. The Independent Board Members also concluded that the Fund’s expense ratios and the profitability to the Adviser of managing the Fund were acceptable, and that economies of scale were not a significant factor in their thinking at this time. In this regard, the Independent Board Members noted the contractual Expense Deferral Agreement between the Adviser and the Corporation, on behalf of each Fund, pursuant to which the net expense ratio for each share class of each Fund was reduced to 0.90%. The Independent Board Members did not view the potential profitability of ancillary services as material to their decision. On the basis of the foregoing and without assigning particular weight to any single conclusion, the Independent Board Members determined to recommend continuation of the investment management agreement to the full Board.
Based on a consideration of all these factors in their totality, the Board Members, including all of the Independent Board Members, determined that the Fund’s advisory fee was appropriate in light of the quality of services provided and in light of the other factors described above that the Board deemed relevant. Accordingly, the Board Members determined to approve the continuation of the Fund’s Advisory Agreement. The Board Members based their decision on evaluations of all these factors as a whole and did not consider any one factor as all important or controlling.
The Gabelli Global Content & Connectivity Fund
Additional Fund Information (Unaudited)
The business and affairs of the Fund are managed under the direction of the Corporation’s Board of Directors. Information pertaining to the Directors and Officers of the Fund is set forth below. The Corporation’s Statement of Additional Information includes additional information about the Fund’s Directors and is available without charge, upon request, by calling 800-GABELLI (800-422-3554) or by writing to The Gabelli Global Content & Connectivity Fund at One Corporate Center, Rye, NY 10580-1422.
Name, Position(s)
Address1
and Year of Birth | | Term of Office
and Length of
Time Served2 | | Number of
Funds
in Fund
Complex
Overseen by
Director | | Principal Occupation(s)
During Past Five Years | | Other Directorships
Held by Director3 |
| |
| INTERESTED DIRECTORS4: |
| | | | | | | | | |
Mario J. Gabelli, CFA
Director and Chief Investment Officer
1942 | | Since 1993
| | 31 | | Chairman, Co-Chief Executive Officer, and Chief Investment Officer– Value Portfolios of GAMCO Investors, Inc. and Chief Investment Officer – Value Portfolios of Gabelli Funds, LLC and GAMCO Asset Management, Inc.; Director/Trustee or Chief Investment Officer of other registered investment companies within the Gabelli Fund Complex; Chief Executive Officer of GGCP, Inc.; Executive Chair of Associated Capital Group, Inc. | | Director of Morgan Group Holding Co. (holding company) (2001-2019); Chairman of the Board and Chief Executive Officer of LICT Corp. (multimedia and communication services company); Director of CIBL, Inc. (broadcasting and wireless communications); Director of ICTC Group Inc. (communications) (2013-2018) |
| | | | | | | | | |
John D. Gabelli
Director
1944 | | Since 1993
| | 12 | | Former Senior Vice President of G.research, LLC (and its predecessor) (1991-2019) | | — |
| |
| INDEPENDENT DIRECTORS5: |
| | | | | | | | | |
E. Val Cerutti
Director
1939 | | Since 2001
| | 7 | | Chief Executive Officer of Cerutti Consultants, Inc. | | Director of The LGL Group, Inc. (diversified manufacturing) (1990-2009) |
| | | | | | | | | |
Anthony J. Colavita6
Director
1935 |
| Since 1993
|
| 18
|
| President of the law firm of Anthony J. Colavita, P.C.
|
| —
|
| | | | | | | | | |
Werner J. Roeder
Director
1940 | | Since 1993
| | 20 | | Retired physician; Former Vice President of Medical Affairs (Medical Director) of New York Presbyterian/Lawrence Hospital (1999-2014) | | — |
| | | | | | | | | |
Anthonie C. van Ekris6
Director
1934 | | Since 1993
| | 23 | | Chairman and Chief Executive Officer of BALMAC International, Inc. (global import/ export company) | | — |
The Gabelli Global Content & Connectivity Fund
Additional Fund Information (Unaudited) (Continued)
Name, Position(s)
Address1
and Year of Birth | | Term of Office
and Length of
Time Served2 | | Number of
Funds
in Fund
Complex
Overseen by
Director | | Principal Occupation(s)
During Past Five Years | | Other Directorships
Held by Director3 |
| | | | | | | | | |
Salvatore J. Zizza7
Director
1945 | | Since 2004
| | 35 | | President, Zizza & Associates Corp. (private holding company); Chairman of Bergen Cove Realty Inc. (residential real estate) | | Director and Chairman of Trans-Lux Corporation (business services); Director and Chairman of Harbor Diversified Inc. (pharmaceuticals) (2009-2018); Retired Chairman of BAM (semiconductor and aerospace manufacturing); Director of Bion Environmental Technologies, Inc. |
The Gabelli Global Content & Connectivity Fund
Additional Fund Information (Unaudited) (Continued)
Name, Position(s)
Address1
and Year of Birth | | Term of Office
and Length of
Time Served2 | | Principal Occupation(s)
During Past Five Years |
| |
| OFFICERS: |
| | | | | |
John C. Ball
President, Treasurer, Principal Financial &
Accounting Officer 1976 |
| Since 2017
|
| Senior Vice President (since 2018) and other positions (2017 - 2018) of GAMCO Investors, Inc.; Chief Executive Officer, G.distributors, LLC since 2020; Officer of registered investment companies within the Gabelli Fund Complex since 2017 |
| | | | | |
Peter Goldstein
Secretary & Vice
President
1953 | | Since 2020 | | General Counsel, GAMCO Investors, Inc. and Chief Legal Officer, Associated Capital Group, Inc. since 2021; General Counsel and Chief Compliance Officer, Buckingham Capital Management, Inc. (2012-2020); Chief Legal Officer and Chief Compliance Officer, The Buckingham Research Group, Inc. (2012-2020) |
| | | | | |
Richard J. Walz
Chief Compliance
Officer
1959 | | Since 2013 | | Chief Compliance Officer of registered investment companies within the Gabelli Fund Complex since 2013 |
| 1 | Address: One Corporate Center, Rye, NY 10580-1422, unless otherwise noted. |
| 2 | Each Director will hold office for an indefinite term until the earliest of (i) the next meeting of shareholders, if any, called for the purpose of considering the election or re-election of such Director and until the election and qualification of his or her successor, if any, elected at such meeting, or (ii) the date a Director resigns or retires, or a Director is removed by the Board of Directors or shareholders, in accordance with the Corporation’s By-Laws and Articles of Incorporation. For officers, includes time served in prior officer positions with the Fund. Each officer will hold office for an indefinite term until the date he or she resigns or retires or until his or her successor is elected and qualified. |
| 3 | This column includes only directorships of companies required to report to the SEC under the Securities Exchange Act of 1934, as amended, i.e., public companies, or other investment companies registered under the 1940 Act. |
| 4 | “Interested person” of the Corporation as defined in the 1940 Act. Messrs. Gabelli are each considered an “interested person” because of their affiliation with Gabelli Funds, LLC which acts as the Corporation’s investment adviser. Mario J. Gabelli and John D. Gabelli are brothers. |
| 5 | Directors who are not interested persons are considered “Independent” Directors. |
| 6 | Mr. Colavita’s son, Anthony S. Colavita, serves as a director of other funds in the Gabelli Fund Complex. Mr. van Ekris is an independent director of Gabelli International Ltd., Gabelli Fund, LDC, GAMA Capital Opportunities Master, Ltd., and GAMCO International SICAV, which may be deemed to be controlled by Mario J. Gabelli and/or affiliates and in that event would be deemed to be under common control with the Fund’s Adviser. |
| 7 | Mr. Zizza is an independent director of Gabelli International Ltd., which may be deemed to be controlled by Mario J. Gabelli and/or affiliates and in that event would be deemed to be under common control with the Fund’s Adviser. On September 9, 2015, Mr. Zizza entered into a settlement with the SEC to resolve an inquiry relating to an alleged violation regarding the making of false statements or omissions to the accountants of a company concerning a related party transaction. The company in question is not an affiliate of, nor has any connection to, the Fund. Under the terms of the settlement, Mr. Zizza, without admitting or denying the SEC’s findings and allegation, paid $150,000 and agreed to cease and desist committing or causing any future violations of Rule 13b2-2 of the Securities Exchange Act of 1934, as amended. The Board has discussed this matter and has determined that it does not disqualify Mr. Zizza from serving as an Independent Director. |
Gabelli Funds and Your Personal Privacy
Who are we?
The Gabelli Funds are investment companies registered with the Securities and Exchange Commission under the Investment Company Act of 1940. We are managed by Gabelli Funds, LLC, which is affiliated with GAMCO Investors, Inc., a publicly held company with subsidiaries and affiliates that provide investment advisory services for a variety of clients.
What kind of non-public information do we collect about you if you become a fund shareholder?
If you apply to open an account directly with us, you will be giving us some non-public information about yourself. The non-public information we collect about you is:
| ● | Information you give us on your application form. This could include your name, address, telephone number, social security number, bank account number, and other information. |
| ● | Information about your transactions with us, any transactions with our affiliates, and transactions with the entities we hire to provide services to you. This would include information about the shares that you buy or redeem. If we hire someone else to provide services — like a transfer agent — we will also have information about the transactions that you conduct through them. |
What information do we disclose and to whom do we disclose it?
We do not disclose any non-public personal information about our customers or former customers to anyone other than our affiliates, our service providers who need to know such information, and as otherwise permitted by law. If you want to find out what the law permits, you can read the privacy rules adopted by the Securities and Exchange Commission. They are in volume 17 of the Code of Federal Regulations, Part 248. The Commission often posts information about its regulations on its website, www. sec.gov.
What do we do to protect your personal information?
We restrict access to non-public personal information about you to the people who need to know that information in order to provide services to you or the fund and to ensure that we are complying with the laws governing the securities business. We maintain physical, electronic, and procedural safeguards to keep your personal information.
This page was intentionally left blank.
The Gabelli Global Content & Connectivity Fund
2023 TAX NOTICE TO SHAREHOLDERS (Unaudited)
For the year ended December 31, 2023, the Fund paid ordinary income distributions of $0.0599 per share for each Class. For the year ended December 31, 2023, 100% of the ordinary income distribution qualifies for the dividends received deduction available to corporations. The Fund designates 100% of the ordinary income distribution as qualified dividend income pursuant to the Jobs and Growth Tax Relief Reconciliation Act of 2003. The Fund designates 1.31% of the ordinary income distribution as qualified interest income pursuant to the Tax Relief, Unemployment Reauthorization, and Job Creation Act of 2010.
U.S. Government Income:
The percentage of the ordinary income distribution paid by the Fund during the year ended December 31, 2023 which was derived from U.S. Treasury securities was 1.01%. Such income is exempt from state and local tax in all states. However, many states, including New York and California, allow a tax exemption for a portion of the income earned only if a mutual fund has invested at least 50% of its assets at the end of each quarter of the Fund’s fiscal year in U.S. Government securities. The Fund did not meet this strict requirement in 2023. The percentage of U.S. Government securities held as of December 31, 2023 was 0.67%. Due to the diversity in state and local tax law, it is recommended that you consult your personal tax adviser as to the applicability of the information provided to your specific situation.
All designations are based on financial information available as of the date of this annual report and, accordingly, are subject to change. For each item, it is the intention of the Fund to designate the maximum amount permitted under the Internal Revenue Code and the regulations thereunder.
THE GABELLI GLOBAL CONTENT & CONNECTIVITY FUND
One Corporate Center
Rye, NY 10580-1422
Portfolio Manager Biography
Sergey Dluzhevskiy, CFA, CPA, joined G.research, LLC in 2005 as a research analyst covering the North American telecommunications industry. Currently, he continues to specialize in the industry and also serves as a portfolio manager of Gabelli Funds, LLC and the Fund. Prior to joining Gabelli, Mr. Dluzhevskiy was a senior accountant at Deloitte. He received his undergraduate degree from Case Western Reserve University and an MBA at the Wharton School of the University of Pennsylvania.

The Gabelli Global Growth Fund
Annual Report — December 31, 2023
(Y)our Portfolio Management Team
| |  | |  | |
| | Caesar M. P. Bryan
Portfolio Manager | | Howard F. Ward, CFA
Portfolio Manager | |
To Our Shareholders,
For the year ended December 31, 2023, the net asset value (NAV) total return per Class I Share of The Gabelli Global Growth Fund was 34.5% compared with a total return of 22.8% for the Morgan Stanley Capital International (MSCI) All Country (AC) World Index. Other classes of shares are available. See page 4 for performance information for all classes.
Enclosed are the financial statements, including the schedule of investments, as of December 31, 2023.
Investment Objective and Strategy (Unaudited)
The Fund’s investment objective primarily seeks to provide investors with appreciation of capital. Current income is a secondary objective of the Fund.
The Fund’s investment strategy is to invest at least 65% of its total assets in common stocks of companies, which the portfolio managers believe are likely to have rapid growth in revenues and earnings and potential for above average capital appreciation or are undervalued. The Global Growth Fund invests primarily in common stocks of foreign and domestic small-capitalization, mid-capitalization, and large-capitalization issuers. As a “global” fund, the Fund invests in securities of issuers, or related investments thereof, located in at least three countries, and at least 40% of the Fund’s total net assets is invested in securities of non-U.S. issuers.
| As permitted by regulations adopted by the Securities and Exchange Commission, paper copies of the Fund’s annual and semiannual shareholder reports will no longer be sent by mail, unless you specifically request paper copies of the reports. Instead, the reports will be made available on the Fund’s website (www.gabelli.com), and you will be notified by mail each time a report is posted and provided with a website link to access the report. If you already elected to receive shareholder reports electronically, you will not be affected by this change and you need not take any action. To elect to receive all future reports on paper free of charge, please contact your financial intermediary, or, if you invest directly with the Fund, you may call 800-422-3554 or send an email request to info@gabelli.com. |
Performance Discussion (Unaudited)
During the first quarter 2023, no new positions exceeded 1% of portfolio assets. We eliminated positions in Block, Inc., PayPal Holdings, American Tower, and Atlassian Corp. Block came under pressure after a reputable short-seller accused the company of inflating certain metrics related to the number of unique users and questioned the character of certain users. This was a highly unusual situation. Combined with a developing financial crisis and heightened prospects for recession, we decided the conservative thing to do was to sell both Block and PayPal, whose payments business would also suffer in a hard landing. In the case of American Tower, the company relies on floating rate debt for about a quarter of its borrowing needs. As they roll that debt, they will be squeezed; we decided to move on. Atlassian was sold due to a slowing pace of closing new deals. With the economy slowing, the sales cycle for many things, including software, was getting pushed out.
We added new positions in four domestic companies during the second quarter 2023, Cadence Design Systems (0.6% of net assets as of June 30, 2023) (software for designing chips), Edward Lifesciences (0.6%) (med-tech devices to treat cardiovascular disease), Eli Lilly (2.0%) (powerful new drugs to treat type 2 diabetes and trigger weight loss) and Palo Alto Networks (0.6%) (network security infrastructure products). Additionally, we established new positions in three foreign domiciled companies, Linde plc (1.1%) (UK producer of atmospheric gases), FANUC (1.4%) (Japanese based leader in factory automation and robotics) and Eaton Corp. (0.8%) (Irish based global provider of electrical power controls and distribution systems). We eliminated five positions: Applied Materials, Charles Schwab, Cloudflare, Kering, and SolarEdge Technologies.
The third quarter saw an additional six positions to the portfolio. Booking Holdings (0.8% of net assets as of September 30, 2023), formerly known as Priceline.com, joined the portfolio. Booking is the largest online travel agency (OTA) with a strong global presence. We bought Trane (2.0%), formerly known as Ingersoll-Rand, a leading industrial equipment provider with an emphasis on HVAC systems. We view HVAC systems as an industrial growth market given the large untapped market globally and global warming trends, which require more frequent equipment replacement. We also initiated a starter position in the Japanese company Daikin Industries (0.1%) for its strong global HVAC position.
No new positions were added to the portfolio during the fourth quarter. We eliminated 6 positions. They were Danaher, Fanuc, Lattice Semiconductor, Sherwin Williams, Tesla, and Veralto (recently spun off from Danaher). The primary catalyst for the sell decision in all cases was slowing business conditions and negative earnings estimate revisions. We felt it wise to add to positions where we had greater conviction for 2024, such as Eli Lilly, Nvidia, ServiceNow, Eaton, Palo Alto Networks, and Spotify, among others.
Selected holdings that contributed positively to performance in 2023 were: Nvidia Corp. (5.3% of net assets as of December 31, 2023) which provides graphics, and compute and networking solutions in the United States, Taiwan, China, and internationally; Meta Platforms Inc.(4.7%), which engages in the development of products that enable people to connect and share with friends and family through mobile devices, personal computers, virtual reality headsets, and wearables worldwide; and Amazon.com Inc. (5.6%), which engages in the retail sale of consumer products and subscriptions through online and physical stores in North America and internationally.
Some of our weaker performing holdings during the year were: UnitedHealth Group Inc. (2.3%), which operates as a diversified health care company in the United States. It operates through four segments: UnitedHealthcare, Optum Health, Optum Insight, and Optum Rx.; Adyen NV (no longer held as of December 31, 2023), which operates a payments platform in Europe, the Middle East, Africa, North America, the Asia/Pacific, and Latin America. The company’s platform integrates payments stack that include gateway, risk management,
processing, issuing, acquiring, and settlement services; and Fanuc Corp. (no longer held), which provides factory automation products in Japan, the Americas, Europe, China, the rest of Asia, and internationally.
Thank you for your investment in The Gabelli Global Growth Fund.
We appreciate your confidence and trust.
| The views expressed reflect the opinions of the Fund’s portfolio managers and Gabelli Funds, LLC, the Adviser, as of the date of this report and are subject to change without notice based on changes in market, economic, or other conditions. These views are not intended to be a forecast of future events and are no guarantee of future results. |
Comparative Results
Average Annual Returns through December 31, 2023 (a) (Unaudited)
Total returns and average annual returns reflect changes in share price, reinvestment of distributions, and are net of expenses.
| | | 1 Year | | | 5 Year | | | 10 Year | | | 15 Year | | | Since
Inception
(2/7/94) | |
| Class I (GGGIX) | | | 34.48 | % | | | 12.57 | % | | | 9.26 | % | | | 12.48 | % | | | 9.38 | % |
| Class AAA (GICPX) | | | 34.47 | | | | 12.51 | | | | 8.92 | | | | 12.14 | | | | 9.20 | |
| MSCI AC World Index (b) | | | 22.81 | | | | 12.27 | | | | 8.48 | | | | 10.78 | | | | 7.57 | |
| Lipper Global Large-Cap Growth Fund Classification (b) | | | 26.74 | | | | 12.55 | | | | 8.78 | | | | 11.52 | | | | 8.93 | |
| Class A (GGGAX) | | | 34.50 | | | | 12.51 | | | | 8.91 | | | | 12.15 | | | | 9.20 | |
| With sales charge (c) | | | 26.76 | | | | 11.18 | | | | 8.27 | | | | 11.70 | | | | 8.99 | |
| Class C (GGGCX) | | | 34.46 | | | | 12.35 | | | | 8.43 | | | | 11.53 | | | | 8.66 | |
| (a) | Returns would have been lower had the Adviser not reimbursed certain expenses. The Class AAA Share NAVs are used to calculate performance for the periods prior to the issuance of Class A Shares, Class C Shares, and Class I Shares on March 2, 2000, March 12, 2000, and January 11, 2008, respectively. The actual performance of the Class A and Class C Shares would have been lower due to the additional fees and expenses associated with these classes of shares. The actual performance of Class I Shares would have been higher due to lower expenses related to this class of shares. The Fund imposes a 2% redemption fee on shares sold or exchanged within seven days of purchase. |
| (b) | The MSCI AC World Index is an unmanaged market capitalization weighted index that is designed to measure the equity market performance of developed and emerging markets. The MSCI AC World Index consists of country indices comprising developed and emerging market country indices. MSCI AC World Index since inception performance is as of January 31, 1994. The Lipper Global Large-Cap Growth Fund Classification reflects the performance of mutual funds classified in this particular category. Dividends are considered reinvested. You cannot invest directly in an index. |
| (c) | Performance results include the effect of the maximum 5.75% sales charge at the beginning of the period. |
In the current prospectuses dated April 28, 2023, the gross expense ratios for Class AAA, A, and I Shares are 1.52%, 1.52%, and 1.27%, respectively, and the net expense ratios for all share classes after contractual reimbursements by Gabelli Funds, LLC, (the Adviser) is 0.90%. See page 11 for the expense ratios for the year ended December 31, 2023. The contractual reimbursements are in effect through April 30, 2024. Class AAA and Class I Shares do not have a sales charge. The maximum sales charge for Class A Shares is 5.75%.
Investing in foreign securities involves risks not ordinarily associated with investments in domestic issues, including currency fluctuation, economic, and political risks. Investors should carefully consider the investment objectives, risks, charges, and expenses of the Fund before investing. The prospectus contains information about these and other matters and should be read carefully before investing. To obtain a prospectus, please visit our website at www.gabelli.com.
Returns represent past performance and do not guarantee future results. Investment returns and the principal value of an investment will fluctuate. When shares are redeemed, they may be worth more or less than their original cost. Current performance may be lower or higher than the performance data presented. Visit www.gabelli.com for performance information as of the most recent month end.
COMPARISON OF CHANGE IN VALUE OF A $10,000 INVESTMENT IN
THE GABELLI GLOBAL GROWTH FUND (CLASS AAA SHARES), MSCI AC WORLD INDEX, AND
LIPPER GLOBAL LARGE-CAP GROWTH FUND CLASSIFICATION (Unaudited)
| Average Annual Total Returns* |
| | 1 Year | 5 Year | 10 Year |
| Class AAA | 34.47% | 12.51% | 8.92% |
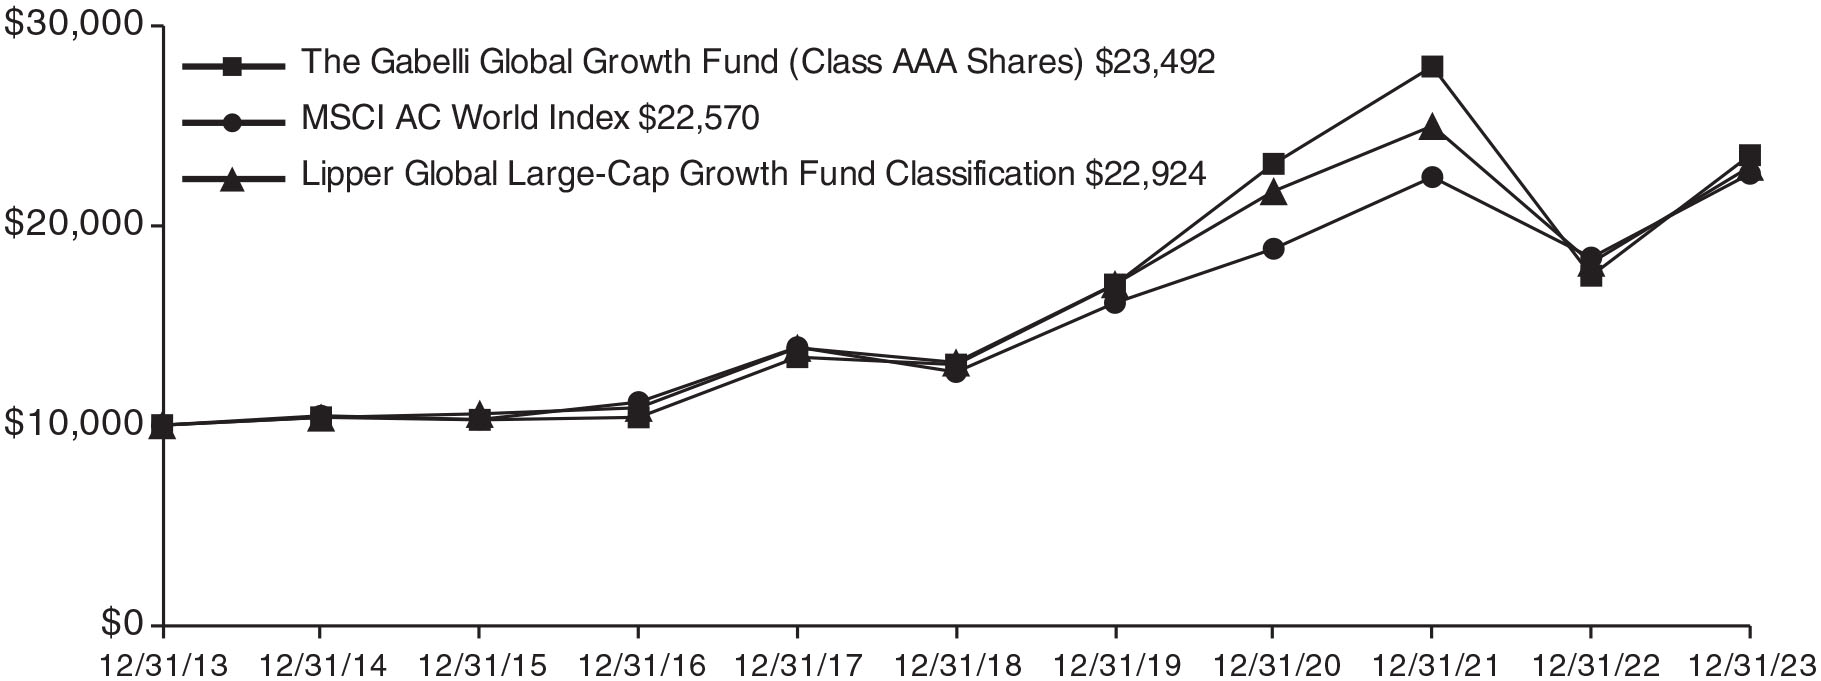
* Past performance is not predictive of future results. The performance tables and graph do not reflect the deduction of taxes that a shareholder would pay on Fund distributions or the redemption of Fund shares.
The Gabelli Global Growth Fund
Disclosure of Fund Expenses (Unaudited)
| For the Six Month Period from July 1, 2023 through December 31, 2023 | Expense Table |
We believe it is important for you to understand the impact of fees and expenses regarding your investment. All mutual funds have operating expenses. As a shareholder of a fund, you incur ongoing costs, which include costs for portfolio management, administrative services, and shareholder reports (like this one), among others. Operating expenses, which are deducted from a fund’s gross income, directly reduce the investment return of a fund. When a fund’s expenses are expressed as a percentage of its average net assets, this figure is known as the expense ratio. The following examples are intended to help you understand the ongoing costs (in dollars) of investing in your Fund and to compare these costs with those of other mutual funds. The examples are based on an investment of $1,000 made at the beginning of the period shown and held for the entire period.
The Expense Table below illustrates your Fund’s costs in two ways:
Actual Fund Return: This section provides information about actual account values and actual expenses. You may use this section to help you to estimate the actual expenses that you paid over the period after any fee waivers and expense reimbursements. The “Ending Account Value” shown is derived from the Fund’s actual return during the past six months, and the “Expenses Paid During Period” shows the dollar amount that would have been paid by an investor who started with $1,000 in the Fund. You may use this information, together with the amount you invested, to estimate the expenses that you paid over the period.
To do so, simply divide your account value by $1,000 (for example, an $8,600 account value divided by $1,000 = 8.6), then multiply the result by the number given for your Fund under the heading “Expenses Paid During Period” to estimate the expenses you paid during this period.
Hypothetical 5% Return: This section provides information about hypothetical account values and hypothetical expenses based on the Fund’s actual expense ratio. It assumes a hypothetical annualized return of 5% before expenses during the period shown. In this case – because the hypothetical return used is not the Fund’s actual return – the results do not apply to your investment and you cannot use the hypothetical account value and expense to estimate the actual ending account balance or expenses you
paid for the period. This example is useful in making comparisons of the ongoing costs of investing in the Fund and other funds. To do so, compare this 5% hypothetical example with the 5% hypothetical examples that appear in shareholder reports of other funds.
Please note that the expenses shown in the table are meant to highlight your ongoing costs only and do not reflect any transactional costs such as sales charges (loads), redemption fees, or exchange fees, if any, which are described in the Prospectus. If these costs were applied to your account, your costs would be higher. Therefore, the 5% hypothetical return is useful in comparing ongoing costs only, and will not help you determine the relative total costs of owning different funds. The “Annualized Expense Ratio” represents the actual expenses for the last six months and may be different from the expense ratio in the Financial Highlights which is for the year ended December 31, 2023.
| | | Beginning
Account
Value | | | Ending
Account
Value | | | Annualized
Expense | | | Expenses
Paid During | |
| | | 07/01/23 | | | 12/31/23 | | | Ratio | | | Period * | |
| The Gabelli Global Growth Fund | | | | | | | | | | | | |
| Actual Fund Return | | | | | | | | | | | | | | | |
| Class AAA | | $ | 1,000.00 | | | $ | 1,061.70 | | | 0.90% | | | $ | 4.68 | |
| Class A | | $ | 1,000.00 | | | $ | 1,061.70 | | | 0.90% | | | $ | 4.68 | |
| Class C | | $ | 1,000.00 | | | $ | 1,061.60 | | | 0.90% | | | $ | 4.68 | |
| Class I | | $ | 1,000.00 | | | $ | 1,061.90 | | | 0.90% | | | $ | 4.68 | |
| Hypothetical 5% Return | | | | | | | | | | | | | | | |
| Class AAA | | $ | 1,000.00 | | | $ | 1,020.67 | | | 0.90% | | | $ | 4.58 | |
| Class A | | $ | 1,000.00 | | | $ | 1,020.67 | | | 0.90% | | | $ | 4.58 | |
| Class C | | $ | 1,000.00 | | | $ | 1,020.67 | | | 0.90% | | | $ | 4.58 | |
| Class I | | $ | 1,000.00 | | | $ | 1,020.67 | | | 0.90% | | | $ | 4.58 | |
| * | Expenses are equal to the Fund’s annualized expense ratio for the last six months multiplied by the average account value over the period, multiplied by the number of days in the most recent fiscal half year (184 days), then divided by 365. |
Summary of Portfolio Holdings (Unaudited)
The following table presents portfolio holdings as a percent of net assets as of December 31, 2023:
The Gabelli Global Growth Fund
| Information Technology - Semiconductors, Hardware, and Equipment | | | 17.2 | % |
| Information Technology - Software and Services | | | 17.1 | % |
| Consumer Discretionary | | | 16.7 | % |
| Communication Services | | | 15.6 | % |
| Health Care | | | 12.1 | % |
| Financials | | | 11.8 | % |
| Consumer Staples | | | 4.5 | % |
| Industrials | | | 3.2 | % |
| Materials | | | 1.5 | % |
| U.S. Government Obligations | | | 0.4 | % |
| Other Assets and Liabilities (Net) | | | (0.1 | )% |
| | | | 100.0 | % |
The Fund files a complete schedule of portfolio holdings with the Securities and Exchange Commission (the SEC) for the first and third quarters of each fiscal year on Form N-PORT. Shareholders may obtain this information at www.gabelli.com or by calling the Fund at 800-GABELLI (800-422-3554). The Fund’s Form N-PORT is available on the SEC’s website at www.sec.gov and may also be reviewed and copied at the SEC’s Public Reference Room in Washington, DC. Information on the operation of the Public Reference Room may be obtained by calling 800-SEC-0330.
Proxy Voting
The Fund files Form N-PX with its complete proxy voting record for the twelve months ended June 30, no later than August 31 of each year. A description of the Fund’s proxy voting policies, procedures, and how the Fund voted proxies relating to portfolio securities is available without charge, upon request, by (i) calling 800-GABELLI (800-422-3554); (ii) writing to The Gabelli Funds at One Corporate Center, Rye, NY 10580-1422; or (iii) visiting the SEC’s website at www.sec.gov.
The Gabelli Global Growth Fund
Schedule of Investments — December 31, 2023
| Shares | | | | | Cost | | | Market
Value | |
| | | | | COMMON STOCKS — 99.7% | | | | | | | | |
| | | | | INFORMATION TECHNOLOGY - SEMICONDUCTORS, HARDWARE, AND EQUIPMENT — 17.2% | | | | | | | | |
| | 27,840 | | | Apple Inc. | | $ | 434,471 | | | $ | 5,360,035 | |
| | 3,550 | | | ASML Holding NV | | | 932,177 | | | | 2,687,066 | |
| | 15,330 | | | Eaton Corp. plc | | | 3,176,180 | | | | 3,691,771 | |
| | 8,200 | | | Keyence Corp. | | | 343,743 | | | | 3,612,652 | |
| | 10,200 | | | Lasertec Corp. | | | 1,310,085 | | | | 2,688,894 | |
| | 16,050 | | | NVIDIA Corp. | | | 3,041,438 | | | | 7,948,281 | |
| | | | | | | | 9,238,094 | | | | 25,988,699 | |
| | | | | INFORMATION TECHNOLOGY - SOFTWARE AND SERVICES — 17.1% | | | | | | | | |
| | 7,000 | | | Adobe Inc.† | | | 1,807,553 | | | | 4,176,200 | |
| | 4,330 | | | Cadence Design Systems Inc.† | | | 1,008,211 | | | | 1,179,362 | |
| | 13,700 | | | CrowdStrike Holdings Inc., Cl. A† | | | 1,987,037 | | | | 3,497,884 | |
| | 3,460 | | | Intuit Inc. | | | 1,420,901 | | | | 2,162,604 | |
| | 24,400 | | | Microsoft Corp. | | | 786,952 | | | | 9,175,376 | |
| | 5,380 | | | Palo Alto Networks Inc.† | | | 1,257,772 | | | | 1,586,454 | |
| | 5,600 | | | ServiceNow Inc.† | | | 1,509,615 | | | | 3,956,344 | |
| | | | | | | | 9,778,041 | | | | 25,734,224 | |
| | | | | CONSUMER DISCRETIONARY — 16.7% | | | | | | | | |
| | 56,000 | | | Amazon.com Inc.† | | | 3,606,212 | | | | 8,508,640 | |
| | 390 | | | Booking Holdings Inc.† | | | 1,246,521 | | | | 1,383,416 | |
| | 1,640 | | | Chipotle Mexican Grill Inc.† | | | 2,634,814 | | | | 3,750,614 | |
| | 2,000 | | | Christian Dior SE | | | 290,698 | | | | 1,562,089 | |
| | 3,500 | | | Lululemon Athletica Inc.† | | | 440,854 | | | | 1,789,515 | |
| | 8,135 | | | LVMH Moet Hennessy Louis Vuitton SE | | | 3,423,282 | | | | 6,588,193 | |
| | 10,000 | | | Mobileye Global Inc., Cl. A† | | | 424,008 | | | | 433,200 | |
| | 44,100 | | | On Holding AG, Cl. A† | | | 1,343,112 | | | | 1,189,377 | |
| | | | | | | | 13,409,501 | | | | 25,205,044 | |
| | | | | COMMUNICATION SERVICES — 15.6% | | | | | | | | |
| | 16,200 | | | Alphabet Inc., Cl. A† | | | 238,018 | | | | 2,262,978 | |
| | 40,020 | | | Alphabet Inc., Cl. C† | | | 2,646,496 | | | | 5,640,019 | |
| | 20,000 | | | Meta Platforms Inc., Cl. A† | | | 3,709,243 | | | | 7,079,200 | |
| | 12,800 | | | Netflix Inc.† | | | 3,789,492 | | | | 6,232,064 | |
| | 12,400 | | | Spotify Technology SA† | | | 2,066,164 | | | | 2,330,084 | |
| | | | | | | | 12,449,413 | | | | 23,544,345 | |
| | | | | HEALTH CARE — 12.1% | | | | | | | | |
| | 8,120 | | | Eli Lilly & Co. | | | 3,488,178 | | | | 4,733,310 | |
| | 5,400 | | | Intuitive Surgical Inc.† | | | 1,463,483 | | | | 1,821,744 | |
| | 34,600 | | | Novo Nordisk A/S, ADR | | | 2,027,860 | | | | 3,579,370 | |
| | 3,450 | | | Thermo Fisher Scientific Inc. | | | 473,104 | | | | 1,831,226 | |
| | 6,500 | | | UnitedHealth Group Inc. | | | 3,145,261 | | | | 3,422,055 | |
| | 14,600 | | | Zoetis Inc. | | | 1,301,031 | | | | 2,881,602 | |
| | | | | | | | 11,898,917 | | | | 18,269,307 | |
| Shares | | | | | Cost | | | Market
Value | |
| | | | | FINANCIALS — 11.8% | | | | | | | | |
| | 6,750 | | | Aon plc, Cl. A | | $ | 2,123,767 | | | $ | 1,964,385 | |
| | 9,105 | | | Chubb Ltd. | | | 1,972,132 | | | | 2,057,730 | |
| | 169,000 | | | Investor AB, Cl. B | | | 2,383,031 | | | | 3,912,483 | |
| | 7,500 | | | Mastercard Inc., Cl. A | | | 398,819 | | | | 3,198,825 | |
| | 5,190 | | | S&P Global Inc. | | | 962,221 | | | | 2,286,299 | |
| | 17,000 | | | Visa Inc., Cl. A | | | 301,339 | | | | 4,425,950 | |
| | | | | | | | 8,141,309 | | | | 17,845,672 | |
| | | | | CONSUMER STAPLES — 4.5% | | | | | | | | |
| | 13,500 | | | L’Oreal SA | | | 2,843,441 | | | | 6,716,183 | |
| | | | | | | | | | | | | |
| | | | | INDUSTRIALS — 3.2% | | | | | | | | |
| | 6,000 | | | Daikin Industries Ltd. | | | 934,235 | | | | 978,085 | |
| | 15,800 | | | Trane Technologies plc | | | 3,216,017 | | | | 3,853,620 | |
| | | | | | | | 4,150,252 | | | | 4,831,705 | |
| | | | | MATERIALS — 1.5% | | | | | | | | |
| | 5,405 | | | Linde plc | | | 2,032,248 | | | | 2,219,888 | |
| | | | | | | | | | | | | |
| | | | | TOTAL COMMON STOCKS | | | 73,941,216 | | | | 150,355,067 | |
Principal
Amount | | | | | | | | | |
| | | | | U.S. GOVERNMENT OBLIGATIONS — 0.4% | | | | | | | | |
| $ | 690,000 | | | U.S. Treasury Bills, 5.281% to 5.304%††, 03/14/24 to 03/28/24 | | | 682,228 | | | | 682,389 | |
| | | | | | | | | | | | | |
| | | | | TOTAL INVESTMENTS — 100.1% | | $ | 74,623,444 | | | | 151,037,456 | |
| | | | | | | | | | | | | |
| | | | | Other Assets and Liabilities (Net) — (0.1)% | | | | | | | (159,147 | ) |
| | | | | | | | | | | | | |
| | | | | NET ASSETS — 100.0% | | | | | | $ | 150,878,309 | |
| † | Non-income producing security. |
| †† | Represents annualized yields at dates of purchase. |
ADR American Depositary Receipt
| Geographic Diversification | | % of
Market
Value | | |
Market
Value | |
| United States | | | 70.9 | % | | $ | 107,058,915 | |
| Europe | | | 23.1 | | | | 34,909,395 | |
| Japan | | | 4.8 | | | | 7,279,631 | |
| Canada | | | 1.2 | | | | 1,789,515 | |
| | | | 100.0 | % | | $ | 151,037,456 | |
See accompanying notes to financial statements.
The Gabelli Global Growth Fund
Statement of Assets and Liabilities
December 31, 2023
| Assets: | | | | |
| Investments, at value (cost $74,623,444) | | $ | 151,037,456 | |
| Receivable for Fund shares sold | | | 164,656 | |
| Receivable from Adviser | | | 66,137 | |
| Dividends receivable | | | 70,538 | |
| Prepaid expenses | | | 24,926 | |
| Total Assets | | | 151,363,713 | |
| Liabilities: | | | | |
| Payable to bank | | | 53,131 | |
| Payable for Fund shares redeemed | | | 121,532 | |
| Payable for investment advisory fees | | | 125,997 | |
| Payable for distribution fees | | | 20,397 | |
| Payable for accounting fees | | | 3,750 | |
| Payable for shareholder communications | | | 54,363 | |
| Payable for shareholder services fees | | | 32,142 | |
| Payable for custodian fees | | | 30,292 | |
| Other accrued expenses | | | 43,800 | |
| Total Liabilities | | | 485,404 | |
| Net Assets | | | | |
| (applicable to 3,269,195 shares outstanding) | | $ | 150,878,309 | |
| Net Assets Consist of: | | | | |
| Paid-in capital | | $ | 83,043,648 | |
| Total distributable earnings | | | 67,834,661 | |
| Net Assets | | $ | 150,878,309 | |
| | | | | |
| Shares of Capital Stock, each at $0.001 par value: | | | | |
| Class AAA: | | | | |
| Net Asset Value, offering, and redemption price per share ($89,341,697 ÷ 1,952,001 shares outstanding; 75,000,000 shares authorized) | | $ | 45.77 | |
| Class A: | | | | |
| Net Asset Value and redemption price per share ($3,972,946 ÷ 86,863 shares outstanding; 50,000,000 shares authorized) | | $ | 45.74 | |
| Maximum offering price per share (NAV ÷ 0.9425, based on maximum sales charge of 5.75% of the offering price) | | $ | 48.53 | |
| Class C: | | | | |
| Net Asset Value and redemption price per share ($952,576 ÷ 25,827 shares outstanding; 25,000,000 shares authorized) | | $ | 36.88 | |
| Class I: | | | | |
| Net Asset Value, offering, and redemption price per share ($56,611,090 ÷ 1,204,504 shares outstanding; 25,000,000 shares authorized) | | $ | 47.00 | |
Statement of Operations
For the Year Ended December 31, 2023
| Investment Income: | | | | |
| Dividends (net of foreign withholding taxes of $83,407) | | $ | 940,374 | |
| Interest | | | 75,310 | |
| Total Investment Income | | | 1,015,684 | |
| Expenses: | | | | |
| Investment advisory fees | | | 1,417,477 | |
| Distribution fees - Class AAA | | | 209,797 | |
| Distribution fees - Class A | | | 8,706 | |
| Distribution fees - Class C | | | 9,023 | |
| Shareholder services fees | | | 113,800 | |
| Shareholder communications expenses | | | 104,682 | |
| Legal and audit fees | | | 63,225 | |
| Custodian fees | | | 48,355 | |
| Registration expenses | | | 45,494 | |
| Accounting fees | | | 45,000 | |
| Directors’ fees | | | 31,549 | |
| Interest expense | | | 1,139 | |
| Miscellaneous expenses | | | 61,240 | |
| Total Expenses | | | 2,159,487 | |
| Less: | | | | |
| Expense reimbursements (See Note 3) | | | (882,743 | ) |
| Net Expenses | | | 1,276,744 | |
| Net Investment Loss | | | (261,060 | ) |
| | | | | |
| Net Realized and Unrealized Gain/(Loss) on Investments and Foreign Currency: | | | | |
| Net realized gain on investments | | | 4,160,506 | |
| Net realized loss on foreign currency transactions | | | (1,238 | ) |
| Net realized gain on investments and foreign currency transactions | | | 4,159,268 | |
| Net change in unrealized appreciation/depreciation: | | | | |
| on investments | | | 37,875,434 | |
| on foreign currency translations | | | 2,064 | |
| Net change in unrealized appreciation/depreciation on investments and foreign currency translations | | | 37,877,498 | |
| Net Realized and Unrealized Gain/(Loss) on Investments and Foreign Currency | | | 42,036,766 | |
| Net Increase in Net Assets Resulting from Operations | | $ | 41,775,706 | |
See accompanying notes to financial statements.
The Gabelli Global Growth Fund
Statement of Changes in Net Assets
| | | Year Ended | | | Year Ended | |
| | | December 31,
2023 | | | December 31,
2022 | |
| Operations: | | | | | | | | |
| Net investment loss | | $ | (261,060 | ) | | $ | (594,452 | ) |
| Net realized gain/(loss) on investments and foreign currency transactions | | | 4,159,268 | | | | (11,021,705 | ) |
| Net change in unrealized appreciation/depreciation on investments and foreign currency translations | | | 37,877,498 | | | | (77,589,708 | ) |
| Net Increase/(Decrease) in Net Assets Resulting from Operations | | | 41,775,706 | | | | (89,205,865 | ) |
| | | | | | | | | |
| Distributions to Shareholders: | | | | | | | | |
| Accumulated earnings | | | | | | | | |
| Class AAA | | | (260,792 | ) | | | (128,940 | ) |
| Class A | | | (11,634 | ) | | | (5,144 | ) |
| Class C | | | (3,444 | ) | | | (1,549 | ) |
| Class I | | | (160,266 | ) | | | (70,765 | ) |
| | | | (436,136 | ) | | | (206,398 | ) |
| Return of capital | | | | | | | | |
| Class AAA | | | (6,126 | ) | | | — | |
| Class A | | | (273 | ) | | | — | |
| Class C | | | (81 | ) | | | — | |
| Class I | | | (3,765 | ) | | | — | |
| | | | (10,245 | ) | | | — | |
| Total Distributions to Shareholders | | | (446,381 | ) | | | (206,398 | ) |
| | | | | | | | | |
| Capital Share Transactions: | | | | | | | | |
| Class AAA | | | (7,956,793 | ) | | | (6,241,831 | ) |
| Class A | | | 28,713 | | | | (398,488 | ) |
| Class C | | | (186,309 | ) | | | (754,393 | ) |
| Class I | | | (13,069,374 | ) | | | (12,286,158 | ) |
| Net Decrease in Net Assets from Capital Share Transactions | | | (21,183,763 | ) | | | (19,680,870 | ) |
| | | | | | | | | |
| Redemption Fees | | | 65 | | | | 640 | |
| | | | | | | | | |
| Net Increase/(Decrease) in Net Assets | | | 20,145,627 | | | | (109,092,493 | ) |
| | | | | | | | | |
| Net Assets: | | | | | | | | |
| Beginning of year | | | 130,732,682 | | | | 239,825,175 | |
| End of year | | $ | 150,878,309 | | | $ | 130,732,682 | |
See accompanying notes to financial statements.
The Gabelli Global Growth Fund
Financial Highlights
Selected data for a share of capital stock outstanding throughout each year:
| | | | | | Income (Loss) from Investment Operations | | | Distributions | | | | | | | | | | | | Ratios to Average Net Assets/Supplemental Data | |
| Year Ended December 31 | | Net Asset Value, Beginning of Year | | | Net Investment Income (Loss)(a) | | | Net Realized and Unrealized Gain (Loss) on Investments | | | Total from Investment Operations | | | Net Investment Income | | | Net
Realized Gain on Investments | | | Return of Capital | | | Total Distributions | | | Redemption Fees(a)(b) | | | Net Asset Value, End of Year | | | Total
Return† | | | Net Assets, End of Year (in 000’s) | | | Net Investment Income (Loss) | | | Operating Expenses Before Reimbursement | | | Operating Expenses Net of Reimbursement(c) | | | Portfolio Turnover Rate | |
| Class AAA | | | | | | | | | | | | | | |
| 2023 | | $ | 34.14 | | | $ | (0.08 | ) | | $ | 11.85 | | | $ | 11.77 | | | $ | (0.14 | ) | | $ | — | | | $ | (0.00 | )(b) | | $ | (0.14 | ) | | $ | 0.00 | | | $ | 45.77 | | | | 34.47 | % | | $ | 89,342 | | | | (0.18 | )% | | | 1.61 | % | | | 0.90 | % | | | 37 | % |
| 2022 | | | 54.68 | | | | (0.14 | ) | | | (20.34 | ) | | | (20.48 | ) | | | (0.00 | )(b) | | | (0.06 | ) | | | — | | | | (0.06 | ) | | | 0.00 | | | | 34.14 | | | | (37.45 | ) | | | 73,186 | | | | (0.34 | ) | | | 1.52 | | | | 0.90 | (d)(e) | | | 36 | |
| 2021 | | | 47.04 | | | | (0.25 | ) | | | 10.19 | | | | 9.94 | | | | (0.02 | ) | | | (2.28 | ) | | | — | | | | (2.30 | ) | | | 0.00 | | | | 54.68 | | | | 21.10 | | | | 126,055 | | | | (0.49 | ) | | | 1.50 | | | | 0.91 | (d) | | | 49 | |
| 2020 | | | 35.56 | | | | (0.05 | ) | | | 12.64 | | | | 12.59 | | | | (0.09 | ) | | | (1.02 | ) | | | — | | | | (1.11 | ) | | | 0.00 | | | | 47.04 | | | | 35.43 | | | | 115,210 | | | | (0.14 | ) | | | 1.57 | | | | 0.90 | | | | 50 | |
| 2019 | | | 29.94 | | | | (0.07 | ) | | | 9.29 | | | | 9.22 | | | | — | | | | (3.60 | ) | | | — | | | | (3.60 | ) | | | 0.00 | | | | 35.56 | | | | 30.73 | | | | 88,287 | | | | (0.21 | ) | | | 1.63 | | | | 1.22 | | | | 78 | |
| Class A | | | | | | | | | | | | | | |
| 2023 | | $ | 34.11 | | | $ | (0.08 | ) | | $ | 11.85 | | | $ | 11.77 | | | $ | (0.14 | ) | | $ | — | | | $ | (0.00 | )(b) | | $ | (0.14 | ) | | $ | 0.00 | | | $ | 45.74 | | | | 34.50 | % | | $ | 3,973 | | | | (0.19 | )% | | | 1.61 | % | | | 0.90 | % | | | 37 | % |
| 2022 | | | 54.64 | | | | (0.14 | ) | | | (20.33 | ) | | | (20.47 | ) | | | (0.00 | )(b) | | | (0.06 | ) | | | — | | | | (0.06 | ) | | | 0.00 | | | | 34.11 | | | | (37.46 | ) | | | 2,957 | | | | (0.35 | ) | | | 1.52 | | | | 0.90 | (d)(e) | | | 36 | |
| 2021 | | | 47.01 | | | | (0.25 | ) | | | 10.18 | | | | 9.93 | | | | (0.02 | ) | | | (2.28 | ) | | | — | | | | (2.30 | ) | | | 0.00 | | | | 54.64 | | | | 21.09 | | | | 5,252 | | | | (0.49 | ) | | | 1.50 | | | | 0.91 | (d) | | | 49 | |
| 2020 | | | 35.55 | | | | (0.05 | ) | | | 12.62 | | | | 12.57 | | | | (0.09 | ) | | | (1.02 | ) | | | — | | | | (1.11 | ) | | | 0.00 | | | | 47.01 | | | | 35.38 | | | | 4,804 | | | | (0.12 | ) | | | 1.57 | | | | 0.90 | | | | 50 | |
| 2019 | | | 29.93 | | | | (0.08 | ) | | | 9.30 | | | | 9.22 | | | | — | | | | (3.60 | ) | | | — | | | | (3.60 | ) | | | 0.00 | | | | 35.55 | | | | 30.74 | | | | 5,332 | | | | (0.21 | ) | | | 1.63 | | | | 1.22 | | | | 78 | |
| Class C | | | | | | | | | | | | | | |
| 2023 | | $ | 27.53 | | | $ | (0.06 | ) | | $ | 9.55 | | | $ | 9.49 | | | $ | (0.14 | ) | | $ | — | | | $ | (0.00 | )(b) | | $ | (0.14 | ) | | $ | 0.00 | | | $ | 36.88 | | | | 34.46 | % | | $ | 952 | | | | (0.19 | )% | | | 2.36 | % | | | 0.90 | % | | | 37 | % |
| 2022 | | | 44.09 | | | | (0.12 | ) | | | (16.39 | ) | | | (16.51 | ) | | | (0.00 | )(b) | | | (0.05 | ) | | | — | | | | (0.05 | ) | | | 0.00 | | | | 27.53 | | | | (37.45 | ) | | | 881 | | | | (0.36 | ) | | | 2.27 | | | | 0.90 | (d)(e) | | | 36 | |
| 2021 | | | 38.30 | | | | (0.21 | ) | | | 8.30 | | | | 8.09 | | | | (0.02 | ) | | | (2.28 | ) | | | — | | | | (2.30 | ) | | | 0.00 | | | | 44.09 | | | | 21.08 | | | | 2,411 | | | | (0.49 | ) | | | 2.25 | | | | 0.91 | (d) | | | 49 | |
| 2020 | | | 29.11 | | | | (0.04 | ) | | | 10.34 | | | | 10.30 | | | | (0.09 | ) | | | (1.02 | ) | | | — | | | | (1.11 | ) | | | 0.00 | | | | 38.30 | | | | 35.41 | | | | 2,376 | | | | (0.12 | ) | | | 2.32 | | | | 0.90 | | | | 50 | |
| 2019 | | | 25.18 | | | | (0.25 | ) | | | 7.78 | | | | 7.53 | | | | — | | | | (3.60 | ) | | | — | | | | (3.60 | ) | | | 0.00 | | | | 29.11 | | | | 29.82 | | | | 2,598 | | | | (0.84 | ) | | | 2.38 | | | | 1.87 | | | | 78 | |
| Class I | | | | | | | | | | | | | | |
| 2023 | | $ | 35.05 | | | $ | (0.08 | ) | | $ | 12.17 | | | $ | 12.09 | | | $ | (0.14 | ) | | $ | — | | | $ | (0.00 | )(b) | | $ | (0.14 | ) | | $ | 0.00 | | | $ | 47.00 | | | | 34.48 | % | | $ | 56,611 | | | | (0.18 | )% | | | 1.36 | % | | | 0.90 | % | | | 37 | % |
| 2022 | | | 56.12 | | | | (0.14 | ) | | | (20.87 | ) | | | (21.01 | ) | | | (0.00 | )(b) | | | (0.06 | ) | | | — | | | | (0.06 | ) | | | 0.00 | | | | 35.05 | | | | (37.43 | ) | | | 53,709 | | | | (0.35 | ) | | | 1.27 | | | | 0.90 | (d)(e) | | | 36 | |
| 2021 | | | 48.23 | | | | (0.26 | ) | | | 10.45 | | | | 10.19 | | | | (0.02 | ) | | | (2.28 | ) | | | — | | | | (2.30 | ) | | | 0.00 | | | | 56.12 | | | | 21.10 | | | | 106,107 | | | | (0.50 | ) | | | 1.25 | | | | 0.91 | (d) | | | 49 | |
| 2020 | | | 36.45 | | | | (0.08 | ) | | | 12.97 | | | | 12.89 | | | | (0.09 | ) | | | (1.02 | ) | | | — | | | | (1.11 | ) | | | 0.00 | | | | 48.23 | | | | 35.39 | | | | 70,888 | | | | (0.18 | ) | | | 1.32 | | | | 0.90 | | | | 50 | |
| 2019 | | | 30.55 | | | | 0.01 | | | | 9.49 | | | | 9.50 | | | | — | | | | (3.60 | ) | | | — | | | | (3.60 | ) | | | 0.00 | | | | 36.45 | | | | 31.03 | | | | 16,566 | | | | 0.03 | | | | 1.38 | | | | 0.99 | | | | 78 | |
| † | Total return represents aggregate total return of a hypothetical investment at the beginning of the year and sold at the end of the year including reinvestment of distributions and does not reflect the applicable sales charges. |
| (a) | Per share amounts have been calculated using the average shares outstanding method. |
| (b) | Amount represents less than $0.005 per share. |
| (c) | Under an expense reimbursement agreement with the Adviser, the Adviser reimbursed expenses of $882,743, $880,676, $1,048,506, $876,253, and $412,641 for the years ended December 31, 2023, 2022, 2021, 2020, and 2019, respectively. |
| (d) | The Fund incurred tax expense. For the year ended December 31, 2022, the impact was minimal. For the year ended December 31, 2021, if tax expense had not been incurred, the ratios of operating expenses to average net assets would have been 0.90% for each Class. |
| (e) | The Fund received credits from a designated broker who agreed to pay certain Fund operating expenses. For the year ended December 31, 2022 there was no impact to the expense ratios. |
See accompanying notes to financial statements.
The Gabelli Global Growth Fund
Notes to Financial Statements
1. Organization. The Gabelli Global Growth Fund, a series of the GAMCO Global Series Funds, Inc. (the Corporation), was incorporated on July 16, 1993 in Maryland. The Fund is a non-diversified open-end management investment company registered under the Investment Company Act of 1940, as amended (the 1940 Act), and is one of five separately managed portfolios (collectively, the Portfolios) of the Corporation. The Fund’s primary objective is capital appreciation. The Fund commenced investment operations on February 7, 1994.
2. Significant Accounting Policies. As an investment company, the Fund follows the investment company accounting and reporting guidance, which is part of U.S. generally accepted accounting principles (GAAP) that may require the use of management estimates and assumptions in the preparation of its financial statements. Actual results could differ from those estimates. The following is a summary of significant accounting policies followed by the Fund in the preparation of its financial statements.
Security Valuation. Portfolio securities listed or traded on a nationally recognized securities exchange or traded in the U.S. over-the-counter market for which market quotations are readily available are valued at the last quoted sale price or a market’s official closing price as of the close of business on the day the securities are being valued. If there were no sales that day, the security is valued at the average of the closing bid and asked prices or, if there were no asked prices quoted on that day, then the security is valued at the closing bid price on that day. If no bid or asked prices are quoted on such day, the security is valued at the most recently available price or, if the Board of Directors (the Board) so determines, by such other method as the Board shall determine in good faith to reflect its fair market value. Portfolio securities traded on more than one national securities exchange or market are valued according to the broadest and most representative market, as determined by Gabelli Funds, LLC (the Adviser).
Portfolio securities primarily traded on a foreign market are generally valued at the preceding closing values of such securities on the relevant market, but may be fair valued pursuant to procedures established by the Board if market conditions change significantly after the close of the foreign market, but prior to the close of business on the day the securities are being valued. Debt obligations for which market quotations are readily available are valued at the average of the latest bid and asked prices. If there were no asked prices quoted on such day, the security is valued using the closing bid price. Such debt obligations are valued through prices provided by a pricing service approved by the Board. Certain securities are valued principally using dealer quotations.
Securities and assets for which market quotations are not readily available are fair valued as determined by the Board. Fair valuation methodologies and procedures may include, but are not limited to: analysis and review of available financial and non-financial information about the company; comparisons with the valuation and changes in valuation of similar securities, including a comparison of foreign securities with the equivalent U.S. dollar value American Depositary Receipt securities at the close of the U.S. exchange; and evaluation of any other information that could be indicative of the value of the security.
The Fund employs a fair value model to adjust prices to reflect events affecting the values of certain portfolio securities which occur between the close of trading on the principal market for such securities (foreign exchanges and over-the-counter markets) at the time when net asset values of the Fund are determined. If the Fund’s valuation committee believes that a particular event would materially affect net asset value, further adjustment is considered. Such securities are classified as Level 2 in the fair value hierarchy presented below.
The Gabelli Global Growth Fund
Notes to Financial Statements (Continued)
The inputs and valuation techniques used to measure fair value of the Fund’s investments are summarized into three levels as described in the hierarchy below:
| ● | Level 1 — quoted prices in active markets for identical securities; |
| ● | Level 2 — other significant observable inputs (including quoted prices for similar securities, interest rates, prepayment speeds, credit risk, etc.); and |
| ● | Level 3 — significant unobservable inputs (including the Board’s determinations as to the fair value of investments). |
A financial instrument’s level within the fair value hierarchy is based on the lowest level of any input both individually and in the aggregate that is significant to the fair value measurement. The inputs or methodology used for valuing securities are not necessarily an indication of the risk associated with investing in those securities. The summary of the Fund’s investments in securities by inputs used to value the Fund’s investments as of December 31, 2023 is as follows:
| | | Valuation Inputs | | | | |
| | | Level 1
Quoted Prices | | | Level 2 Other
Significant
Observable Inputs | | | Total Market Value
at 12/31/23 | |
| INVESTMENTS IN SECURITIES: | | | | | | | | | | | | |
| ASSETS (Market Value): | | | | | | | | | | | | |
| Common Stocks (a) | | $ | 150,355,067 | | | | — | | | $ | 150,355,067 | |
| U.S. Government Obligations | | | — | | | $ | 682,389 | | | | 682,389 | |
| TOTAL INVESTMENTS IN SECURITIES – ASSETS | | $ | 150,355,067 | | | $ | 682,389 | | | $ | 151,037,456 | |
| (a) | Please refer to the Schedule of Investments for the industry classifications of these portfolio holdings. |
The Fund held no level 3 investments at December 31, 2023 and 2022. The Fund’s policy is to recognize transfers among levels as of the beginning of the reporting period.
Additional Information to Evaluate Qualitative Information.
General. The Fund uses recognized industry pricing services – approved by the Board and unaffiliated with the Adviser – to value most of its securities, and uses broker quotes provided by market makers of securities not valued by these and other recognized pricing sources. Several different pricing feeds are received to value domestic equity securities, international equity securities, preferred equity securities, and fixed income securities. The data within these feeds are ultimately sourced from major stock exchanges and trading systems where these securities trade. The prices supplied by external sources are checked by obtaining quotations or actual transaction prices from market participants. If a price obtained from the pricing source is deemed unreliable, prices will be sought from another pricing service or from a broker/dealer that trades that security or similar securities.
Fair Valuation. Fair valued securities may be common or preferred equities, warrants, options, rights, or fixed income obligations. Where appropriate, Level 3 securities are those for which market quotations are not available, such as securities not traded for several days, or for which current bids are not available, or which are restricted as to transfer. When fair valuing a security, factors to consider include recent prices of comparable securities that are publicly traded, reliable prices of securities not publicly traded, the use of valuation models, current analyst reports, valuing the income or cash flow of the issuer, or cost if the preceding factors do not apply. A
The Gabelli Global Growth Fund
Notes to Financial Statements (Continued)
significant change in the unobservable inputs could result in a lower or higher value in Level 3 securities. The circumstances of Level 3 securities are frequently monitored to determine if fair valuation measures continue to apply.
The Adviser reports quarterly to the Board the results of the application of fair valuation policies and procedures. These may include backtesting the prices realized in subsequent trades of these fair valued securities to fair values previously recognized.
Foreign Currency Translations. The books and records of the Fund are maintained in U.S. dollars. Foreign currencies, investments, and other assets and liabilities are translated into U.S. dollars at current exchange rates. Purchases and sales of investment securities, income, and expenses are translated at the exchange rate prevailing on the respective dates of such transactions. Unrealized gains and losses that result from changes in foreign exchange rates and/or changes in market prices of securities have been included in unrealized appreciation/depreciation on investments and foreign currency translations. Net realized foreign currency gains and losses resulting from changes in exchange rates include foreign currency gains and losses between trade date and settlement date on investment securities transactions, foreign currency transactions, and the difference between the amounts of interest and dividends recorded on the books of the Fund and the amounts actually received. The portion of foreign currency gains and losses related to fluctuation in exchange rates between the initial purchase trade date and subsequent sale trade date is included in realized gain/(loss) on investments.
Foreign Securities. The Fund may directly purchase securities of foreign issuers. Investing in securities of foreign issuers involves special risks not typically associated with investing in securities of U.S. issuers. The risks include possible revaluation of currencies, the inability to repatriate funds, less complete financial information about companies, and possible future adverse political and economic developments. Moreover, securities of many foreign issuers and their markets may be less liquid and their prices more volatile than securities of comparable U.S. issuers.
Foreign Taxes. The Fund may be subject to foreign taxes on income, gains on investments, or currency repatriation, a portion of which may be recoverable. The Fund will accrue such taxes and recoveries as applicable, based upon its current interpretation of tax rules and regulations that exist in the markets in which it invests.
Securities Transactions and Investment Income. Securities transactions are accounted for on the trade date with realized gain/(loss) on investments determined by using the identified cost method. Interest income (including amortization of premium and accretion of discount) is recorded on an accrual basis. Premiums and discounts on debt securities are amortized using the effective yield to maturity method or amortized to earliest call date, if applicable. Dividend income is recorded on the ex-dividend date, except for certain dividends from foreign securities that are recorded as soon after the ex-dividend date as the Fund becomes aware of such dividends.
Determination of Net Asset Value and Calculation of Expenses. Certain administrative expenses are common to, and allocated among, various affiliated funds. Such allocations are made on the basis of each fund’s average net assets or other criteria directly affecting the expenses as determined by the Adviser pursuant to procedures established by the Board.
In calculating the NAV per share of each class, investment income, realized and unrealized gains and losses, redemption fees, and expenses other than class specific expenses are allocated daily to each class of shares
The Gabelli Global Growth Fund
Notes to Financial Statements (Continued)
based upon the proportion of net assets of each class at the beginning of each day. Distribution expenses are borne solely by the class incurring the expense.
Distributions to Shareholders. Distributions to shareholders are recorded on the ex-dividend date. Distributions to shareholders are based on income and capital gains as determined in accordance with federal income tax regulations, which may differ from income and capital gains as determined under GAAP. These differences are primarily due to differing treatments of income and gains on various investment securities and foreign currency transactions held by the Fund, timing differences, and differing characterizations of distributions made by the Fund. Distributions from net investment income for federal income tax purposes include net realized gains on foreign currency transactions. These book/tax differences are either temporary or permanent in nature. To the extent these differences are permanent, adjustments are made to the appropriate capital accounts in the period when the differences arise. Permanent differences were primarily due to the tax treatment of currency gains and losses.
The tax character of distributions paid during the years ended December 31, 2023 and 2022 was as follows:
| | | Year Ended | | | Year Ended | |
| | | December 31,
2023 | | | December 31,
2022 | |
| Distributions paid from: | | | | | | | | |
| Ordinary income | | $ | 436,136 | | | $ | 155 | |
| Net long term capital gains | | | — | | | | 206,243 | |
| Return of capital | | | 10,245 | | | | — | |
| Total distributions paid | | $ | 446,381 | | | $ | 206,398 | |
Provision for Income Taxes. The Fund intends to continue to qualify as a regulated investment company under Subchapter M of the Internal Revenue Code of 1986, as amended (the Code). It is the policy of the Fund to comply with the requirements of the Code applicable to regulated investment companies and to distribute substantially all of its net investment company taxable income and net capital gains. Therefore, no provision for federal income taxes is required.
At December 31, 2023, the components of accumulated earnings/losses on a tax basis were as follows:
| Accumulated capital loss carryforwards | | $ | (6,779,678 | ) |
| Net unrealized appreciation on investments and foreign currency translations | | | 74,614,339 | |
| Total | | $ | 67,834,661 | |
The Fund is permitted to carry capital losses forward for an unlimited period. Capital losses that are carried forward will retain their character as either short term or long term capital losses. The Fund has a short term capital loss carryforward with no expiration of $6,779,678.
The Fund utilized $4,172,771 of the capital loss carryover for the year ended December 31, 2023.
The Gabelli Global Growth Fund
Notes to Financial Statements (Continued)
At December 31, 2023, the temporary differences between book basis and tax basis net unrealized appreciation on investments were due to deferral of losses from wash sales for tax purposes and mark-to-market adjustments on investments in passive foreign investment companies.
The following summarizes the tax cost of investments and the related net unrealized appreciation at December 31, 2023:
| | | Cost | | | Gross
Unrealized
Appreciation | | | Gross
Unrealized
Depreciation | | | Net
Unrealized
Appreciation | |
| Investments | | $ | 76,424,117 | | | $ | 75,646,131 | | | $ | (1,032,792 | ) | | $ | 74,613,339 | |
The Fund is required to evaluate tax positions taken or expected to be taken in the course of preparing the Fund’s tax returns to determine whether the tax positions are “more-likely-than-not” of being sustained by the applicable tax authority. Income tax and related interest and penalties would be recognized by the Fund as tax expense in the Statement of Operations if the tax positions were deemed not to meet the more-likely-than-not threshold. During the year ended December 31, 2023, the Fund did not incur any income tax, interest, or penalties. As of December 31, 2023, the Adviser has reviewed all open tax years and concluded that there was no impact to the Fund’s net assets or results of operations. The Fund’s federal and state tax returns for the prior three fiscal years remain open, subject to examination. On an ongoing basis, the Adviser will monitor the Fund’s tax positions to determine if adjustments to this conclusion are necessary.
3. Investment Advisory Agreement and Other Transactions. The Fund has entered into an investment advisory agreement (the Advisory Agreement) with the Adviser which provides that the Fund will pay the Adviser a fee, computed daily and paid monthly, at the annual rate of 1.00% of the value of its average daily net assets. In accordance with the Advisory Agreement, the Adviser provides a continuous investment program for the Fund’s portfolio, oversees the administration of all aspects of the Fund’s business and affairs, and pays the compensation of all Officers and Directors of the Fund who are affiliated persons of the Adviser.
The Adviser has contractually agreed to waive its investment advisory fees and/or to reimburse expenses to the extent necessary to maintain the annualized total operating expenses of the Fund (excluding brokerage costs, acquired fund fees and expenses, interest, taxes, and extraordinary expenses) until at least April 30, 2024, at no more than an annual rate of 0.90% for all classes of shares. During the year ended December 31, 2023, the Adviser reimbursed the Fund in the amount of $882,743. In addition, the Fund has agreed, during the two year period following any waiver or reimbursement by the Adviser, to repay such amount to the extent, that after giving effect to the repayment, such adjusted annualized total operating expenses of the Fund would not exceed 0.90% of the value of the Fund’s average daily net assets for each share class of the Fund. The agreement is renewable annually. At December 31, 2023, the cumulative amount which the Fund may repay the Adviser, subject to the terms above, is $1,763,419:
| For the year ended December 31, 2022, expiring December 31, 2024 | | $ | 880,676 | |
| For the year ended December 31, 2023, expiring December 31, 2025 | | | 882,743 | |
| | | $ | 1,763,419 | |
4. Distribution Plan. The Fund’s Board has adopted a distribution plan (the Plan) for each class of shares, except for Class I Shares, pursuant to Rule 12b-1 under the 1940 Act. Under the Class AAA, Class A, and Class C Share Plans, payments are authorized to G.distributors, LLC (the Distributor), an affiliate of the Adviser, at
The Gabelli Global Growth Fund
Notes to Financial Statements (Continued)
annual rates of 0.25%, 0.25%, and 1.00%, respectively, of the average daily net assets of those classes, the annual limitations under each Plan. Such payments are accrued daily and paid monthly.
5. Portfolio Securities. Purchases and sales of securities during the year ended December 31, 2023, other than short term securities and U.S. Government obligations, aggregated $52,545,857 and $74,949,597, respectively.
6. Transactions with Affiliates and Other Arrangements. During the year ended December 31, 2023, the Fund paid brokerage commissions on security trades of $3 to G.research, LLC, an affiliate of the Adviser. Additionally, the Distributor retained a total of $3,550 from investors representing commissions (sales charges and underwriting fees) on sales and redemptions of Fund shares.
The cost of calculating the Fund’s NAV per share is a Fund expense pursuant to the Advisory Agreement. Under the sub-administration agreement with Bank of New York Mellon, the fees paid include the cost of calculating the Fund’s NAV. The Fund reimburses the Adviser for this service. During the year ended December 31, 2023, the Fund accrued $45,000 in accounting fees in the Statement of Operations.
The Corporation pays retainer and per meeting fees to Directors not affiliated with the Adviser, plus specified amounts to the Lead Director and Audit Committee Chairman. Directors are also reimbursed for out of pocket expenses incurred in attending meetings. Directors who are directors or employees of the Adviser or an affiliated company receive no compensation or expense reimbursement from the Corporation.
7. Line of Credit. The Fund participates in an unsecured line of credit, which expires on February 28, 2024 and may be renewed annually, of up to $75,000,000 under which it may borrow up to 10% of its net assets from the custodian for temporary borrowing purposes. Borrowings under this arrangement bear interest at a floating rate equal to the higher of the Overnight Federal Funds Rate plus 135 basis points or the Overnight Bank Funding Rate plus 135 basis points in effect on that day. This amount, if any, would be included in “Interest expense” in the Statement of Operations. At December 31, 2023, there were no borrowings outstanding under the line of credit.
The average daily amount of borrowings outstanding under the line of credit for the six days of borrowings during the year ended December 31, 2023 was $144,833 with a weighted average interest rate of 6.10%. The maximum amount borrowed at any time during the year ended December 31, 2023 was $201,000.
8. Capital Stock. The Fund currently offers three classes of shares – Class AAA Shares, Class A Shares, and Class I Shares. Class AAA and Class A investors may purchase more of these share classes. Class C shareholders cannot purchase more of this class. The minimum investment for Class I shares is $1,000. These changes had no effect on existing shareholders’ ability to redeem shares of the Fund as described in the Fund’s Prospectus.
The Fund imposes a redemption fee of 2.00% on all classes of shares that are redeemed or exchanged on or before the seventh day after the date of a purchase. The redemption fee is deducted from the proceeds otherwise payable to the redeeming shareholders and is retained by the Fund as an increase in paid-in capital. The redemption fees retained by the Fund during the fiscal years ended December 31, 2023 and 2022, if any, can be found in the Statement of Changes in Net Assets under Redemption Fees.
The Gabelli Global Growth Fund
Notes to Financial Statements (Continued)
Transactions in shares of capital stock were as follows:
| | | Year Ended
December 31,
2023 | | | Year Ended
December 31,
2022 | |
| | | Shares | | | Amount | | | Shares | | | Amount | |
| Class AAA | | | | | | | | | | | | | | | | |
| Shares sold | | | 16,251 | | | $ | 645,394 | | | | 20,241 | | | $ | 863,312 | |
| Shares issued upon reinvestment of distributions | | | 5,587 | | | | 256,436 | | | | 3,745 | | | | 125,235 | |
| Shares redeemed | | | (213,806 | ) | | | (8,858,623 | ) | | | (185,535 | ) | | | (7,230,378 | ) |
| Net decrease | | | (191,968 | ) | | $ | (7,956,793 | ) | | | (161,549 | ) | | $ | (6,241,831 | ) |
| Class A | | | | | | | | | | | | | | | | |
| Shares sold | | | 14,860 | | | $ | 617,664 | | | | 17,178 | | | $ | 685,915 | |
| Shares issued upon reinvestment of distributions | | | 246 | | | | 11,301 | | | | 146 | | | | 4,880 | |
| Shares redeemed | | | (14,942 | ) | | | (600,252 | ) | | | (26,743 | ) | | | (1,089,283 | ) |
| Net increase/(decrease) | | | 164 | | | $ | 28,713 | | | | (9,419 | ) | | $ | (398,488 | ) |
| Class C | | | | | | | | | | | | | | | | |
| Shares issued upon reinvestment of distributions | | | 95 | | | $ | 3,525 | | | | 58 | | | $ | 1,549 | |
| Shares redeemed | | | (6,265 | ) | | | (189,834 | ) | | | (22,741 | ) | | | (755,942 | ) |
| Net decrease | | | (6,170 | ) | | $ | (186,309 | ) | | | (22,683 | ) | | $ | (754,393 | ) |
| Class I | | | | | | | | | | | | | | | | |
| Shares sold | | | 176,877 | | | $ | 7,525,496 | | | | 697,628 | | | $ | 29,056,920 | |
| Shares issued upon reinvestment of distributions | | | 3,464 | | | | 163,257 | | | | 2,351 | | | | 70,411 | |
| Shares redeemed | | | (508,150 | ) | | | (20,758,127 | ) | | | (1,058,519 | ) | | | (41,413,489 | ) |
| Net decrease | | | (327,809 | ) | | $ | (13,069,374 | ) | | | (358,540 | ) | | $ | (12,286,158 | ) |
9. Indemnifications. The Fund enters into contracts that contain a variety of indemnifications. The Fund’s maximum exposure under these arrangements is unknown. However, the Fund has not had prior claims or losses pursuant to these contracts. Management has reviewed the Fund’s existing contracts and expects the risk of loss to be remote.
10. Subsequent Events. Management has evaluated the impact on the Fund of all subsequent events occurring through the date the financial statements were issued and has determined that there were no subsequent events requiring recognition or disclosure in the financial statements.
The Gabelli Global Growth Fund
Report of Independent Registered Public Accounting Firm
To the Shareholders of The Gabelli Global Growth Fund
and the Board of Directors of GAMCO Global Series Funds, Inc.
Opinion on the Financial Statements
We have audited the accompanying statement of assets and liabilities of The Gabelli Global Growth Fund (the “Fund”) (one of the funds constituting GAMCO Global Series Funds, Inc. (the “Corporation”)), including the schedule of investments, as of December 31, 2023, and the related statement of operations for the year then ended, the statements of changes in net assets for each of the two years in the period then ended, the financial highlights for each of the five years in the period then ended and the related notes (collectively referred to as the “financial statements”). In our opinion, the financial statements present fairly, in all material respects, the financial position of the Fund (one of the funds constituting GAMCO Global Series Funds, Inc.) at December 31, 2023, the results of its operations for the year then ended, the changes in its net assets for each of the two years in the period then ended and its financial highlights for each of the five years in the period then ended, in conformity with U.S. generally accepted accounting principles.
Basis for Opinion
These financial statements are the responsibility of the Corporation’s management. Our responsibility is to express an opinion on the Fund’s financial statements based on our audits. We are a public accounting firm registered with the Public Company Accounting Oversight Board (United States) (“PCAOB”) and are required to be independent with respect to the Corporation in accordance with the U.S. federal securities laws and the applicable rules and regulations of the Securities and Exchange Commission and the PCAOB.
We conducted our audits in accordance with the standards of the PCAOB. Those standards require that we plan and perform the audit to obtain reasonable assurance about whether the financial statements are free of material misstatement, whether due to error or fraud. The Corporation is not required to have, nor were we engaged to perform, an audit of the Corporation’s internal control over financial reporting. As part of our audits, we are required to obtain an understanding of internal control over financial reporting but not for the purpose of expressing an opinion on the effectiveness of the Corporation’s internal control over financial reporting. Accordingly, we express no such opinion.
Our audits included performing procedures to assess the risks of material misstatement of the financial statements, whether due to error or fraud, and performing procedures that respond to those risks. Such procedures included examining, on a test basis, evidence regarding the amounts and disclosures in the financial statements. Our procedures included confirmation of securities owned as of December 31, 2023 by correspondence with the custodian and brokers. Our audits also included evaluating the accounting principles used and significant estimates made by management, as well as evaluating the overall presentation of the financial statements. We believe that our audits provide a reasonable basis for our opinion.

We have served as the auditor of one or more Gabelli Funds investment companies since 1992.
New York, New York
February 28, 2024
The Gabelli Global Growth Fund
Liquidity Risk Management Program (Unaudited)
In accordance with Rule 22e-4 under the 1940 Act,the Fund has established a liquidity risk management program (the LRM Program) to govern its approach to managing liquidity risk. The LRM Program is administered by the Liquidity Committee (the Committee), which is comprised of members of Gabelli Funds, LLC management. The Board has designated the Committee to administer the LRM Program.
The LRM Program’s principal objectives include supporting the Fund’s compliance with limits on investments in illiquid assets and mitigating the risk that the Fund will be unable to meet its redemption obligations in a timely manner. The LRM Program also includes elements that support the management and assessment of liquidity risk, including an annual assessment of factors that influence the Fund’s liquidity and the monthly classification and re-classification of certain investments that reflect the Committee’s assessment of their relative liquidity under current market conditions.
At a meeting of the Board held on August 23, 2023, the Board received a written report from the Committee regarding the design and operational effectiveness of the LRM Program. The Committee determined, and reported to the Board, that the LRM Program is reasonably designed to assess and manage the Fund’s liquidity risk and has operated adequately and effectively since its implementation. The Committee reported that there were no liquidity events that impacted the Fund or its ability to timely meet redemptions without dilution to existing shareholders. The Committee noted that the Fund is primarily invested in highly liquid securities and, accordingly, continues to be exempt from the requirement to determine a “highly liquid investment minimum” as defined in the Rule 22e-4. Because of that continued qualification for the exemption, the Fund has not adopted a “highly liquid investment minimum” amount. The Committee further noted that while changes to the LRM Program were made during the Review Period and reported to the Board, no material changes were made to the LRM Program as a result of the Committee’s annual review.
There can be no assurance that the LRM Program will achieve its objectives in the future. Please refer to the Fund’s Prospectus for more information regarding its exposure to liquidity risk and other principal risks to which an investment in the Fund may be subject.
The Gabelli Global Growth Fund
Board Consideration and Re-Approval of Investment Advisory Agreement (Unaudited)
During the six months ended December 31, 2023, the Board of Directors of the Corporation approved the continuation of the investment advisory agreement with the Adviser for the Fund on the basis of the recommendation by the directors (the Independent Board Members) who are not interested persons of the Fund. The following paragraphs summarize the material information and factors considered by the Independent Board Members as well as their conclusions relative to such factors.
Nature, Extent, and Quality of Services. The Independent Board Members considered information regarding the Fund’s portfolio managers, the depth of the analyst pool available to the Adviser and the portfolio managers, the scope of supervisory, administrative, shareholder, and other services supervised or provided by the Adviser and the absence of significant service problems reported to the Board. The Independent Board Members noted the experience, length of service, and reputation of the Fund’s portfolio managers.
Investment Performance. The Independent Board Members reviewed the short, medium, and long term performance of the Fund (as of September 30, 2023) against a peer group of nine other comparable funds prepared by the Adviser (the Adviser Peer Group), and against a peer group prepared by Broadridge (the Broadridge Performance Peer Group) consisting of all global large cap growth funds, regardless of asset size or primary channel of distribution. The Independent Board Members noted that the Fund’s performance was in the second quartile for the one year, five year and ten year periods and in the third quartile for the three year period, as measured against the Adviser Peer Group. Against the Broadridge Performance Peer Group, the Independent Board Members noted that the Fund’s performance was in the fifth quintile for the three year period and the third quintile for the one year, five year, and ten year periods. The Independent Board Members discussed this comparative data and also recalled the Adviser’s comprehensive discussion of performance earlier in the Meeting.
Profitability. The Independent Board Members reviewed summary data regarding the profitability of the Fund to the Adviser both with a pro rata administrative overhead charge and with a standalone administrative charge and noted the effect of the expense limitation agreement. The Independent Board Members also noted that a portion of the Fund’s portfolio transactions were executed by an affiliated broker of the Adviser and that another affiliated broker of the Adviser received distribution fees and minor amounts of sales commissions.
Economies of Scale. The Independent Board Members discussed the major elements of the Adviser’s cost structure and the relationship of those elements to potential economies of scale and reviewed data provided by the Adviser.
Sharing of Economies of Scale. The Independent Board Members noted that the investment management fee schedule for the Fund does not take into account any potential economies of scale that may develop.
Service and Cost Comparisons. The Independent Board Members compared the expense ratios of the investment management fee, other expenses, and total expenses of the Fund with similar expense ratios of the Adviser Peer Group and a peer group of eight other global large cap growth funds selected by Broadridge, and noted that the Adviser’s management fee includes substantially all administrative services of the Fund as well as investment advisory services. The Independent Board Members noted that the Fund’s total expense ratio was the second lowest for the Broadridge peer group and the lowest for the Advisor peer group, but that the Fund’s size was below average within each peer group. The Independent Board Members also noted that the advisory fee structure was the same as that in effect for most of the Gabelli funds and noted the effect of the expense
The Gabelli Global Growth Fund
Board Consideration and Re-Approval of Investment Advisory Agreement (Unaudited) (Continued)
limitation agreement in place for the Fund. The Independent Board Members were presented with, but did not consider to be material to their decision, various information comparing the advisory fee with the fee for other types of accounts managed by the Adviser.
Conclusions. The Independent Board Members concluded that the Fund enjoyed highly experienced portfolio management services and good ancillary services and an acceptable performance record. The Independent Board Members also concluded that the Fund’s expense ratios and the profitability to the Adviser of managing the Fund were reasonable, and that economies of scale were not a significant factor in their thinking at this time. In this regard, the Independent Board Members noted the contractual Expense Deferral Agreement between the Adviser and the Corporation, on behalf of each Fund, pursuant to which the net expense ratio for each share class of each Fund was reduced to 0.90%. The Independent Board Members did not view the potential profitability of ancillary services as material to their decision. On the basis of the foregoing and without assigning particular weight to any single conclusion, the Independent Board Members determined to recommend continuation of the investment management agreement to the full Board.
Based on a consideration of all these factors in their totality, the Board Members, including all of the Independent Board Members, determined that the Fund’s advisory fee was appropriate in light of the quality of services provided and in light of the other factors described above that the Board deemed relevant. Accordingly, the Board Members determined to approve the continuation of the Fund’s Advisory Agreement. The Board Members based their decision on evaluations of all these factors as a whole and did not consider any one factor as all important or controlling.
The Gabelli Global Growth Fund
Additional Fund Information (Unaudited)
The business and affairs of the Fund are managed under the direction of the Corporation’s Board of Directors. Information pertaining to the Directors and Officers of the Fund is set forth below. The Corporation’s Statement of Additional Information includes additional information about the Fund’s Directors and is available without charge, upon request, by calling 800-GABELLI (800-422-3554) or by writing to The Gabelli Global Growth Fund at One Corporate Center, Rye, NY 10580-1422.
Name, Position(s)
Address1
and Year of Birth | | Term of Office
and Length of
Time Served2 | | Number of
Funds
in Fund
Complex
Overseen by
Director | | Principal Occupation(s)
During Past Five Years | | Other Directorships
Held by Director3 |
| | | | | | | | | |
| INTERESTED DIRECTORS4: | | | | | | | | |
| | | | | | | | | |
Mario J. Gabelli, CFA
Director and Chief Investment Officer
1942 | | Since 1993 | | 31 | | Chairman, Co-Chief Executive Officer, and Chief Investment Officer– Value Portfolios of GAMCO Investors, Inc. and Chief Investment Officer – Value Portfolios of Gabelli Funds, LLC and GAMCO Asset Management, Inc.; Director/Trustee or Chief Investment Officer of other registered investment companies within the Gabelli Fund Complex; Chief Executive Officer of GGCP, Inc.; Executive Chair of Associated Capital Group, Inc. | | Director of Morgan Group Holding Co. (holding company) (2001-2019); Chairman of the Board and Chief Executive Officer of LICT Corp. (multimedia and communication services company); Director of CIBL, Inc. (broadcasting and wireless communications); Director of ICTC Group Inc. (communications) (2013-2018) |
| | | | | | | | | |
John D. Gabelli
Director
1944 | | Since 1993 | | 12 | | Former Senior Vice President of G.research, LLC (and its predecessor) (1991-2019) | | — |
| | | | | | | | | |
| INDEPENDENT DIRECTORS5: | | | | | | | | |
| | | | | | | | | |
E. Val Cerutti
Director
1939 | | Since 2001 | | 7 | | Chief Executive Officer of Cerutti Consultants, Inc. | | Director of The LGL Group, Inc. (diversified manufacturing) (1990-2009) |
| | | | | | | | | |
Anthony J. Colavita6
Director
1935 | | Since 1993 | | 18 | | President of the law firm of Anthony J. Colavita, P.C. | | — |
| | | | | | | | | |
Werner J. Roeder
Director
1940 | | Since 1993 | | 20 | | Retired physician; Former Vice President of Medical Affairs (Medical Director) of New York Presbyterian/Lawrence Hospital (1999-2014) | | — |
| | | | | | | | | |
Anthonie C. van Ekris6
Director 1934 | | Since 1993 | | 23 | | Chairman and Chief Executive Officer of BALMAC International, Inc. (global import/ export company) | | — |
The Gabelli Global Growth Fund
Additional Fund Information (Unaudited) (Continued)
Name, Position(s)
Address1
and Year of Birth | | Term of Office
and Length of
Time Served2 | | Number of
Funds
in Fund
Complex
Overseen by
Director | | Principal Occupation(s)
During Past Five Years | | Other Directorships
Held by Director3 |
| | | | | | | | | |
Salvatore J. Zizza7
Director
1945 | | Since 2004 | | 35 | | President, Zizza & Associates Corp. (private holding company); Chairman of Bergen Cove Realty Inc. (residential real estate) | | Director and Chairman of Trans-Lux Corporation (business services); Director and Chairman of Harbor Diversified Inc. (pharmaceuticals) (2009-2018); Retired Chairman of BAM (semiconductor and aerospace manufacturing); Director of Bion Environmental Technologies, Inc. |
The Gabelli Global Growth Fund
Additional Fund Information (Unaudited) (Continued)
Name, Position(s)
Address1
and Year of Birth | | Term of Office
and Length of
Time Served2 | | Principal Occupation(s)
During Past Five Years |
| | | | | |
| OFFICERS: | | | | |
| | | | | |
John C. Ball
President, Treasurer,
Principal Financial &
Accounting Officer
1976 | | Since 2017 | | Senior Vice President (since 2018) and other positions (2017 - 2018) of GAMCO Investors, Inc.; Chief Executive Officer, G.distributors, LLC since 2020; Officer of registered investment companies within the Gabelli Fund Complex since 2017 |
| | | | | |
Peter Goldstein
Secretary & Vice
President
1953 | | Since 2020 | | General Counsel, GAMCO Investors, Inc. and Chief Legal Officer, Associated Capital Group, Inc. since 2021; General Counsel and Chief Compliance Officer, Buckingham Capital Management, Inc. (2012-2020); Chief Legal Officer and Chief Compliance Officer, The Buckingham Research Group, Inc. (2012-2020) |
| | | | | |
Richard J. Walz
Chief Compliance
Officer
1959 | | Since 2013 | | Chief Compliance Officer of registered investment companies within the Gabelli Fund Complex since 2013 |
| 1 | Address: One Corporate Center, Rye, NY 10580-1422, unless otherwise noted. |
| 2 | Each Director will hold office for an indefinite term until the earliest of (i) the next meeting of shareholders, if any, called for the purpose of considering the election or re-election of such Director and until the election and qualification of his or her successor, if any, elected at such meeting, or (ii) the date a Director resigns or retires, or a Director is removed by the Board of Directors or shareholders, in accordance with the Corporation’s By-Laws and Articles of Incorporation. For officers, includes time served in prior officer positions with the Fund. Each officer will hold office for an indefinite term until the date he or she resigns or retires or until his or her successor is elected and qualified. |
| 3 | This column includes only directorships of companies required to report to the SEC under the Securities Exchange Act of 1934, as amended, i.e., public companies, or other investment companies registered under the 1940 Act. |
| 4 | “Interested person” of the Corporation as defined in the 1940 Act. Messrs. Gabelli are each considered an “interested person” because of their affiliation with Gabelli Funds, LLC which acts as the Corporation’s investment adviser. Mario J. Gabelli and John D. Gabelli are brothers. |
| 5 | Directors who are not interested persons are considered “Independent” Directors. |
| 6 | Mr. Colavita’s son, Anthony S. Colavita, serves as a director of other funds in the Gabelli Fund Complex. Mr. van Ekris is an independent director of Gabelli International Ltd., Gabelli Fund, LDC, GAMA Capital Opportunities Master, Ltd., and GAMCO International SICAV, which may be deemed to be controlled by Mario J. Gabelli and/or affiliates and in that event would be deemed to be under common control with the Fund’s Adviser. |
| 7 | Mr. Zizza is an independent director of Gabelli International Ltd., which may be deemed to be controlled by Mario J. Gabelli and/or affiliates and in that event would be deemed to be under common control with the Fund’s Adviser. On September 9, 2015, Mr. Zizza entered into a settlement with the SEC to resolve an inquiry relating to an alleged violation regarding the making of false statements or omissions to the accountants of a company concerning a related party transaction. The company in question is not an affiliate of, nor has any connection to, the Fund. Under the terms of the settlement, Mr. Zizza, without admitting or denying the SEC’s findings and allegation, paid $150,000 and agreed to cease and desist committing or causing any future violations of Rule 13b2-2 of the Securities Exchange Act of 1934, as amended. The Board has discussed this matter and has determined that it does not disqualify Mr. Zizza from serving as an Independent Director. |
The Gabelli Global Growth Fund
2023 TAX NOTICE TO SHAREHOLDERS (Unaudited)
During the year ended December 31, 2023, the Fund paid ordinary income distributions of $0.1338 and return of capital distributions of $0.0031 per share to shareholders in each Class of Shares. For the year ended December 31, 2023, 76.21% of the ordinary income distribution qualifies for the dividends received deduction available to corporations. The Fund designates 100% of the ordinary income distribution as qualified dividend income pursuant to the Jobs and Growth Tax Relief Reconciliation Act of 2003. The Fund designates 4.38% of the ordinary income distribution as qualified interest income pursuant to the Tax Relief, Unemployment Reauthorization, and Job Creation Act of 2010. Also for the year of 2023, the Fund did not have foreign tax credits.
U.S. Government Income:
The percentage of the ordinary income distribution paid by the Fund during the year ended December 31, 2023 which was derived from U.S. Treasury securities was 4.19%. Such income is exempt from state and local tax in all states. However, many states, including New York and California, allow a tax exemption for a portion of the income earned only if a mutual fund has invested at least 50% of its assets at the end of each quarter of the Fund’s fiscal year in U.S. Government securities. The Fund did not meet this strict requirement in 2023. The percentage of U.S. Government securities held as of December 31, 2023 was 0.45%. Due to the diversity in state and local tax law, it is recommended that you consult your personal tax adviser as to the applicability of the information provided to your specific situation.
All designations are based on financial information available as of the date of this annual report and, accordingly, are subject to change. For each item, it is the intention of the Fund to designate the maximum amount permitted under the Internal Revenue Code and the regulations thereunder.
THE GABELLI GLOBAL GROWTH FUND
One Corporate Center
Rye, NY 10580-1422
Portfolio Management Team Biographies
Caesar M. P. Bryan joined GAMCO Asset Management in 1994. He is a member of the global investment team of Gabelli Funds, LLC and portfolio manager of several funds within the Fund Complex. Prior to joining Gabelli, Mr. Bryan was a portfolio manager at Lexington Management. He began his investment career at Samuel Montagu Company, the London based merchant bank. Mr. Bryan graduated from the University of Southampton in England with a Bachelor of Law and is a member of the English Bar.
Howard F. Ward, CFA, joined Gabelli Funds in 1995 and currently serves as GAMCO’s Chief Investment Officer of Growth Equities as well as a Gabelli Funds, LLC portfolio manager for several funds within the Fund Complex. Prior to joining Gabelli, Mr. Ward served as Managing Director and Lead Portfolio Manager for several Scudder mutual funds. He also was an Investment Officer in the Institutional Investment Department with Brown Brothers, Harriman & Co. Mr. Ward received his BA in Economics from Northwestern University.
The Gabelli Global Rising Income and Dividend Fund
Annual Report — December 31, 2023
To Our Shareholders,
For the year ended December 31, 2023, the net asset value (NAV) total return per Class AAA Share of The Gabelli Global Rising Income and Dividend Fund was 9.9% compared with a total return of 24.4% for the Morgan Stanley Capital International (MSCI) World Index. Other classes of shares are available. See page 3 for performance information for all classes.
Enclosed are the financial statements, including the schedule of investments, as of December 31, 2023.
Investment Objective and Strategy (Unaudited)
The Fund’s investment objective is to provide investors with a high level of total return through a combination of current income and appreciation of capital.
The Fund’s investment strategy is to invest 80% of its net assets in dividend paying securities (such as common and preferred stock) or other income producing securities (such as fixed income securities and securities that are convertible into common stock). The Fund will primarily invest in common stocks of foreign and domestic issuers that the Fund’s portfolio manager believes are likely to pay dividends and income and have the potential for above average capital appreciation and dividend increases.
Performance Discussion (Unaudited)
Although 2022 was a difficult year for the global stock market, the stock market did produce gains in the first quarter of 2023. (Y)our portfolio is heavily exposed to both Europe and North America, and some of the same concerns were in play in both geographies during the quarter. In Europe, the financial sector was shaken when Credit Suisse was forced by the Swiss government to merge into UBS, a much bigger and stronger Swiss financial company. Likewise, in the US, the financial sector was shaken when Silicon Valley Bank and Signature Bank both failed and were taken over by the government. Inflation continued to be a major economic concern in both Europe and North America, and central bankers continued to raise short interest rates to help rein in inflationary pressures.
| As permitted by regulations adopted by the Securities and Exchange Commission, paper copies of the Fund’s annual and semiannual shareholder reports will no longer be sent by mail, unless you specifically request paper copies of the reports. Instead, the reports will be made available on the Fund’s website (www.gabelli.com), and you will be notified by mail each time a report is posted and provided with a website link to access the report. If you already elected to receive shareholder reports electronically, you will not be affected by this change and you need not take any action. To elect to receive all future reports on paper free of charge, please contact your financial intermediary, or, if you invest directly with the Fund, you may call 800-422-3554 or send an email request to info@gabelli.com. |
The second quarter of 2023 saw global broad stock market averages generally rise across the globe. Of the major global economies, the one with the best performing stock market in the quarter was Japan, with the Nikkei 225 up about 18%. The worst performing major stock market was the United Kingdom, with the FTSE 100 down about 1%. The MSCI World Index was up 6%.
The third quarter of 2023 was down for virtually every major developed market equity index. Germany was down about 5%, France and Japan both down about 4%, while Canada and Switzerland were both down about 3%. The one major developed market with positive equity returns in the third quarter was the United Kingdom, up about 1%. Here in the US, small caps, as measured by the Russell 2000, were down about 5% in the quarter, while the S&P 500 total return was down just over 3%. Growth stocks were down a little bit less than value stocks during the quarter. Although the Fed is probably at the end of its tightening cycle, the Fed did raise rates by 25 basis points in the quarter to 5.5%. The bigger move in interest rates, however, was with the 10 year note, which moved up by 76 basis points in the quarter to about 4.6%.
All across the globe, stock markets performed well in the fourth quarter of 2023, even though geopolitical tensions remained high. The war in Ukraine continued on, Israel and Hamas were in a war, and China upped its war of words regarding Taiwan. However, inflationary pressure around the globe generally eased as supply chains gradually returned to normal, and consumers returned to normal work and life routines. In the United States, we have seen some recent improvement in the inflation rate, with it steadily decreasing throughout 2023. In the fourth quarter, The Federal Reserve kept the Federal Funds Target Rate steady at 5.5% and did not raise it, after multiple quarters of consistently raising the rate.
Selected holdings that contributed positively to performance in 2023 were: Enpro Inc. (3.1% of net assets as of December 31, 2023), which develops, manufactures, and markets proprietary, value-added products and solutions to safeguard critical environments in the United States and internationally; Sony Corp. (7.8%), which designs, develops, produces, and sells electronic equipment, instruments, and devices for the consumer, professional, and industrial markets; and Berkshire Hathaway Inc. (2.8%), through its subsidiaries, engages in the insurance, freight rail transportation, and utility businesses worldwide.
Some of our weaker performing securities were: Jardine Matheson Holdings Ltd. (0.9%), through its subsidiaries, operates in motor vehicles and related operations, property investment and development, food retailing, health and beauty, home furnishings, engineering and construction, and transportation businesses in China, Southeast Asia, the United Kingdom, and internationally; CNH Industrial NV (3.0%) is an equipment and services company, which engages in the design, production, marketing, sale, and financing of agricultural and construction equipment in North America, Europe, the Middle East, Africa, South America, and the Asia Pacific; and Remy Cointreau SA (2.7%), together with its subsidiaries, engages in the production, sale, and distribution of liqueurs and spirits.
Thank you for your investment in the Gabelli Global Rising Income and Dividend Fund.
We appreciate your confidence and trust.
| The views expressed reflect the opinions of the Fund’s portfolio manager and Gabelli Funds, LLC, the Adviser, as of the date of this report and are subject to change without notice based on changes in market, economic, or other conditions. These views are not intended to be a forecast of future events and are no guarantee of future results. |
Comparative Results
Average Annual Returns through December 31, 2023 (a) (Unaudited)
Total returns and average annual returns reflect changes in share price, reinvestment of distributions, and are net of expenses.
| | | 1 Year | | | 5 Year | | | 10 Year | | | 15 Year | | | Since
Inception
(2/3/94) | |
| Class AAA (GAGCX) | | | 9.92 | % | | | 7.52 | % | | | 4.87 | % | | | 7.64 | % | | | 4.72 | % |
| MSCI World Index (b) | | | 24.42 | | | | 13.37 | | | | 9.18 | | | | 11.31 | | | | 7.90 | |
| Class A (GAGAX) | | | 9.90 | | | | 7.52 | | | | 4.85 | | | | 7.62 | | | | 4.74 | |
| With sales charge (c) | | | 3.58 | | | | 6.25 | | | | 4.23 | | | | 7.20 | | | | 4.52 | |
| Class C (GACCX) | | | 9.89 | | | | 7.38 | | | | 4.39 | | | | 6.79 | | | | 4.14 | |
| Class I (GAGIX) | | | 9.91 | | | | 7.67 | | | | 5.15 | | | | 7.92 | | | | 4.87 | |
| (a) | Returns would have been lower had the Adviser not reimbursed certain expenses of the Fund. The Class AAA Share NAVs are used to calculate performance for the periods prior to the issuance of Class A Shares, Class C Shares, and Class I Shares on May 2, 2001, November 26, 2001, and January 11, 2008, respectively. The actual performance of the Class A Shares and Class C Shares would have been lower due to the additional fees and expenses associated with these classes of shares. The actual performance of the Class I Shares would have been higher due to lower expenses related to this class of shares. The Fund imposes a 2% redemption fee on shares sold or exchanged within seven days of purchase. |
| (b) | The MSCI World Index is a free float-adjusted market capitalization weighted index that is designed to measure the equity market performance of the developed market. Dividends are considered reinvested. You cannot invest directly in an index. MSCI World Index since inception performance is as of January 31, 1994. |
| (c) | Performance results include the effect of the maximum 5.75% sales charge at the beginning of the period. |
In the current prospectuses dated April 28, 2023, the gross expense ratios for Class AAA, A, and I Shares are 1.65%, 1.65%, and 1.40%, respectively, and the net expense ratios for all share classes after contractual reimbursements by Gabelli Funds, LLC, (the Adviser) is 0.90%. See page 12 for the expense ratios for the year ended December 31, 2023. The contractual reimbursements are in effect through April 30, 2024. Class AAA and Class I Shares do not have a sales charge. The maximum sales charge for Class A Shares is 5.75%.
Investing in foreign securities involves risks not ordinarily associated with investments in domestic issues, including currency fluctuation, economic, and political risks. Investors should carefully consider the investment objectives, risks, charges, and expenses of the Fund before investing. The prospectus contains information about these and other matters and should be read carefully before investing. To obtain a prospectus, please visit our website at www.gabelli.com.
Returns represent past performance and do not guarantee future results. Investment returns and the principal value of an investment will fluctuate. When shares are redeemed, they may be worth more or less than their original cost. Current performance may be lower or higher than the performance data presented. Visit www.gabelli.com for performance information as of the most recent month end.
COMPARISON OF CHANGE IN VALUE OF A $10,000 INVESTMENT IN
THE GABELLI GLOBAL RISING INCOME AND DIVIDEND FUND (CLASS AAA SHARES)
AND MSCI WORLD INDEX (Unaudited)
| Average Annual Total Returns* |
| | 1 Year | 5 Year | 10 Year |
| Class AAA | 9.92% | 7.52% | 4.87% |
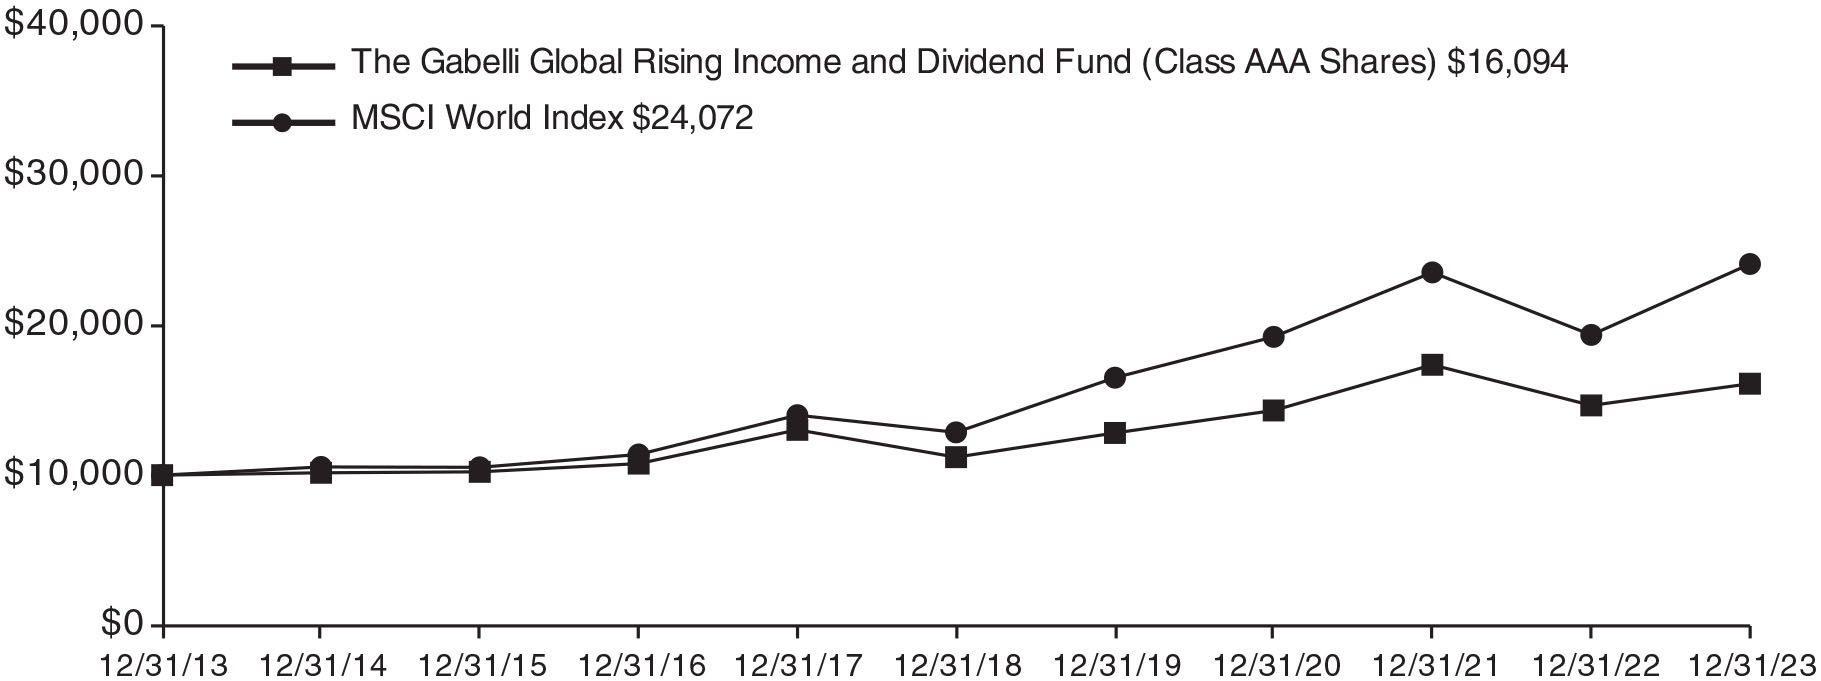
* Past performance is not predictive of future results. The performance tables and graph do not reflect the deduction of taxes that a shareholder would pay on Fund distributions or the redemption of Fund shares.
The Gabelli Global Rising Income and Dividend Fund
Disclosure of Fund Expenses (Unaudited)
| For the Six Month Period from July 1, 2023 through December 31, 2023 | Expense Table |
We believe it is important for you to understand the impact of fees and expenses regarding your investment. All mutual funds have operating expenses. As a shareholder of a fund, you incur ongoing costs, which include costs for portfolio management, administrative services, and shareholder reports (like this one), among others. Operating expenses, which are deducted from a fund’s gross income, directly reduce the investment return of a fund. When a fund’s expenses are expressed as a percentage of its average net assets, this figure is known as the expense ratio. The following examples are intended to help you understand the ongoing costs (in dollars) of investing in your Fund and to compare these costs with those of other mutual funds. The examples are based on an investment of $1,000 made at the beginning of the period shown and held for the entire period.
The Expense Table below illustrates your Fund’s costs in two ways:
Actual Fund Return: This section provides information about actual account values and actual expenses. You may use this section to help you to estimate the actual expenses that you paid over the period after any fee waivers and expense reimbursements. The “Ending Account Value” shown is derived from the Fund’s actual return during the past six months, and the “Expenses Paid During Period” shows the dollar amount that would have been paid by an investor who started with $1,000 in the Fund. You may use this information, together with the amount you invested, to estimate the expenses that you paid over the period.
To do so, simply divide your account value by $1,000 (for example, an $8,600 account value divided by $1,000 = 8.6), then multiply the result by the number given for your Fund under the heading “Expenses Paid During Period” to estimate the expenses you paid during this period.
Hypothetical 5% Return: This section provides information about hypothetical account values and hypothetical expenses based on the Fund’s actual expense ratio. It assumes a hypothetical annualized return of 5% before expenses during the period shown. In this case – because the hypothetical return used is not the Fund’s actual return – the results do not apply to your investment and you cannot use the hypothetical account value and expense to estimate the actual ending account balance or expenses you
paid for the period. This example is useful in making comparisons of the ongoing costs of investing in the Fund and other funds. To do so, compare this 5% hypothetical example with the 5% hypothetical examples that appear in shareholder reports of other funds.
Please note that the expenses shown in the table are meant to highlight your ongoing costs only and do not reflect any transactional costs such as sales charges (loads), redemption fees, or exchange fees, if any, which are described in the Prospectus. If these costs were applied to your account, your costs would be higher. Therefore, the 5% hypothetical return is useful in comparing ongoing costs only, and will not help you determine the relative total costs of owning different funds. The "Annualized Expense Ratio" represents the actual expenses for the last six months and may be different from the expense ratio in the Financial Highlights which is for the year ended December 31, 2023.
| | | Beginning
Account Value
07/01/23 | | | Ending
Account Value
12/31/23 | | | Annualized
Expense
Ratio | | | Expenses
Paid During
Period * | |
| The Gabelli Global Rising Income and Dividend Fund | | | | | | | |
| Actual Fund Return | | | | | | | | | | | | | | | |
| Class AAA | | $ | 1,000.00 | | | $ | 1,020.00 | | | 0.90% | | | $ | 4.58 | |
| Class A | | $ | 1,000.00 | | | $ | 1,019.70 | | | 0.90% | | | $ | 4.58 | |
| Class C | | $ | 1,000.00 | | | $ | 1,020.00 | | | 0.90% | | | $ | 4.58 | |
| Class I | | $ | 1,000.00 | | | $ | 1,020.00 | | | 0.90% | | | $ | 4.58 | |
| Hypothetical 5% Return | | | | | | | | | | | | | | | |
| Class AAA | | $ | 1,000.00 | | | $ | 1,020.67 | | | 0.90% | | | $ | 4.58 | |
| Class A | | $ | 1,000.00 | | | $ | 1,020.67 | | | 0.90% | | | $ | 4.58 | |
| Class C | | $ | 1,000.00 | | | $ | 1,020.67 | | | 0.90% | | | $ | 4.58 | |
| Class I | | $ | 1,000.00 | | | $ | 1,020.67 | | | 0.90% | | | $ | 4.58 | |
| * | Expenses are equal to the Fund’s annualized expense ratio for the last six months multiplied by the average account value over the period, multiplied by the number of days in the most recent fiscal half year (184 days), then divided by 365. |
Summary of Portfolio Holdings (Unaudited)
The following table present portfolio holdings as a percent of net assets as of December 31, 2023:
The Gabelli Global Rising Income and Dividend Fund
| Food and Beverage | | | 17.1 | % |
| Financial Services | | | 11.0 | % |
| Diversified Industrial | | | 8.9 | % |
| Electronics | | | 7.8 | % |
| Energy and Utilities | | | 6.7 | % |
| Consumer Products | | | 4.8 | % |
| Telecommunications | | | 4.5 | % |
| Machinery | | | 4.1 | % |
| Entertainment | | | 3.8 | % |
| Automotive | | | 3.8 | % |
| Building and Construction | | | 3.7 | % |
| Wireless Telecommunications | | | 3.4 | % |
| Equipment and Supplies | | | 2.2 | % |
| Health Care | | | 2.1 | % |
| Broadcasting | | | 2.0 | % |
| Retail | | | 1.9 | % |
| Cable and Satellite | | | 1.9 | % |
| U.S. Government Obligations | | | 1.7 | % |
| Business Services | | | 1.6 | % |
| Consumer Services | | | 1.5 | % |
| Aerospace and Defense | | | 1.3 | % |
| Automotive: Parts and Accessories | | | 1.1 | % |
| Hotels and Gaming | | | 1.0 | % |
| Computer Software and Services | | | 0.8 | % |
| Specialty Chemicals | | | 0.8 | % |
| Publishing | | | 0.4 | % |
| Other Assets and Liabilities (Net) | | | 0.1 | % |
| | | | 100.0 | % |
The Fund files a complete schedule of portfolio holdings with the Securities and Exchange Commission (the SEC) for the first and third quarters of each fiscal year on Form N-PORT. Shareholders may obtain this information at www.gabelli.com or by calling the Fund at 800-GABELLI (800-422-3554). The Fund’s Form N-PORT is available on the SEC’s website at www.sec.gov and may also be reviewed and copied at the SEC’s Public Reference Room in Washington, DC. Information on the operation of the Public Reference Room may be obtained by calling 800-SEC-0330.
Proxy Voting
The Fund files Form N-PX with its complete proxy voting record for the twelve months ended June 30, no later than August 31 of each year. A description of the Fund’s proxy voting policies, procedures, and how each Fund voted proxies relating to portfolio securities is available without charge, upon request, by (i) calling 800-GABELLI (800-422-3554); (ii) writing to The Gabelli Funds at One Corporate Center, Rye, NY 10580-1422; or (iii) visiting the SEC’s website at www.sec.gov.
The Gabelli Global Rising Income and Dividend Fund
Schedule of Investments — December 31, 2023
| Shares | | | | | Cost | | | Market
Value | |
| | | | | COMMON STOCKS — 98.2% | | | | | | | | |
| | | | | Aerospace and Defense — 1.3% | | | | | | | | |
| | 1,600 | | | L3Harris Technologies Inc. | | $ | 126,334 | | | $ | 336,992 | |
| | 100,000 | | | Rolls-Royce Holdings plc† | | | 276,321 | | | | 382,013 | |
| | | | | | | | 402,655 | | | | 719,005 | |
| | | | | Automotive — 3.8% | | | | | | | | |
| | 18,500 | | | Daimler Truck Holding AG | | | 513,134 | | | | 694,793 | |
| | 42,000 | | | Iveco Group NV† | | | 256,850 | | | | 377,696 | |
| | 42,000 | | | Traton SE | | | 790,317 | | | | 988,521 | |
| | 1,000 | | | Volkswagen AG | | | 167,644 | | | | 130,763 | |
| | | | | | | | 1,727,945 | | | | 2,191,773 | |
| | | | | Automotive: Parts and Accessories — 1.1% | | | | | | | | |
| | 20,000 | | | Dana Inc. | | | 312,587 | | | | 292,200 | |
| | 2,000 | | | Genuine Parts Co. | | | 179,604 | | | | 277,000 | |
| | 800 | | | Linamar Corp. | | | 40,996 | | | | 38,652 | |
| | | | | | | | 533,187 | | | | 607,852 | |
| | | | | Broadcasting — 2.0% | | | | | | | | |
| | 1,500 | | | Cogeco Inc. | | | 63,648 | | | | 64,718 | |
| | 33,000 | | | Paramount Global, Cl. A | | | 802,187 | | | | 648,780 | |
| | 35,000 | | | Sinclair Inc. | | | 746,203 | | | | 456,050 | |
| | | | | | | | 1,612,038 | | | | 1,169,548 | |
| | | | | Building and Construction — 3.7% | | | | | | | | |
| | 500 | | | Arcosa Inc. | | | 16,993 | | | | 41,320 | |
| | 500 | | | Chofu Seisakusho Co. Ltd. | | | 7,120 | | | | 7,213 | |
| | 9,200 | | | Herc Holdings Inc. | | | 293,019 | | | | 1,369,788 | |
| | 6,000 | | | Johnson Controls International plc | | | 211,053 | | | | 345,840 | |
| | 2,000 | | | Lennar Corp., Cl. B | | | 91,921 | | | | 268,100 | |
| | 300 | | | Sika AG | | | 82,192 | | | | 97,628 | |
| | | | | | | | 702,298 | | | | 2,129,889 | |
| | | | | Business Services — 1.6% | | | | | | | | |
| | 23,000 | | | JCDecaux SE† | | | 464,681 | | | | 462,113 | |
| | 12,000 | | | Matthews International Corp., Cl. A | | | 362,151 | | | | 439,800 | |
| | | | | | | | 826,832 | | | | 901,913 | |
| | | | | Cable and Satellite — 1.9% | | | | | | | | |
| | 6,000 | | | DISH Network Corp., Cl. A† | | | 52,011 | | | | 34,620 | |
| | 3,000 | | | EchoStar Corp., Cl. A† | | | 31,410 | | | | 49,710 | |
| | 16,000 | | | Liberty Latin America Ltd., Cl. A† | | | 147,447 | | | | 116,960 | |
| | 595 | | | Liberty Latin America Ltd., Cl. C† | | | 4,248 | | | | 4,367 | |
| | 19,000 | | | Rogers Communications Inc., Cl. B | | | 667,343 | | | | 889,390 | |
| | | | | | | | 902,459 | | | | 1,095,047 | |
| | | | | Computer Software and Services — 0.8% | | | | | | | | |
| | 28,000 | | | Hewlett Packard Enterprise Co. | | | 379,309 | | | | 475,440 | |
| Shares | | | | | Cost | | | Market
Value | |
| | | | | Consumer Products — 4.8% | | | | | | | | |
| | 7,500 | | | Energizer Holdings Inc. | | $ | 279,750 | | | $ | 237,600 | |
| | 20,000 | | | Essity AB, Cl. A | | | 527,632 | | | | 492,760 | |
| | 2,000 | | | L’Oreal SA | | | 335,032 | | | | 994,990 | |
| | 5,800 | | | Salvatore Ferragamo SpA | | | 98,070 | | | | 78,180 | |
| | 10,000 | | | Scandinavian Tobacco Group A/S | | | 148,378 | | | | 173,708 | |
| | 6,800 | | | Spectrum Brands Holdings Inc. | | | 410,912 | | | | 542,436 | |
| | 6,200 | | | Unicharm Corp. | | | 125,119 | | | | 224,167 | |
| | | | | | | | 1,924,893 | | | | 2,743,841 | |
| | | | | Consumer Services — 1.5% | | | | | | | | |
| | 11,500 | | | Ashtead Group plc | | | 231,411 | | | | 800,646 | |
| | 200 | | | Boyd Group Services Inc. | | | 14,695 | | | | 42,035 | |
| | | | | | | | 246,106 | | | | 842,681 | |
| | | | | Diversified Industrial — 8.9% | | | | | | | | |
| | 600 | | | Aker ASA, Cl. A | | | 34,010 | | | | 39,331 | |
| | 11,571 | | | Ampco-Pittsburgh Corp.† | | | 50,157 | | | | 31,589 | |
| | 9,000 | | | Ardagh Group SA† | | | 158,182 | | | | 49,320 | |
| | 34,000 | | | Bollore SE | | | 189,191 | | | | 212,257 | |
| | 12,000 | | | Bouygues SA | | | 472,709 | | | | 452,001 | |
| | 1,200 | | | Crane Co. | | | 60,161 | | | | 141,768 | |
| | 11,200 | | | Enpro Inc. | | | 733,442 | | | | 1,755,488 | |
| | 7,000 | | | Hyster-Yale Materials Handling Inc. | | | 261,232 | | | | 435,330 | |
| | 12,000 | | | Jardine Matheson Holdings Ltd. | | | 675,266 | | | | 494,520 | |
| | 15,000 | | | Myers Industries Inc. | | | 234,455 | | | | 293,250 | |
| | 11,000 | | | Nilfisk Holding A/S† | | | 185,634 | | | | 192,545 | |
| | 2,600 | | | Park-Ohio Holdings Corp. | | | 46,751 | | | | 70,096 | |
| | 3,000 | | | Sulzer AG | | | 240,387 | | | | 306,403 | |
| | 3,600 | | | Svenska Cellulosa AB SCA, Cl. A | | | 23,715 | | | | 53,468 | |
| | 6,000 | | | Textron Inc. | | | 254,526 | | | | 482,520 | |
| | 3,000 | | | Trinity Industries Inc. | | | 57,151 | | | | 79,770 | |
| | | | | | | | 3,676,969 | | | | 5,089,656 | |
| | | | | Electronics — 7.8% | | | | | | | | |
| | 23,200 | | | Sony Group Corp. | | | 643,446 | | | | 2,206,468 | |
| | 24,000 | | | Sony Group Corp., ADR | | | 496,658 | | | | 2,272,560 | |
| | | | | | | | 1,140,104 | | | | 4,479,028 | |
| | | | | Energy and Utilities — 6.7% | | | | | | | | |
| | 4,000 | | | BP plc, ADR | | | 112,910 | | | | 141,600 | |
| | 7,500 | | | Cameco Corp. | | | 86,032 | | | | 323,250 | |
| | 600 | | | Cheniere Energy Inc. | | | 23,332 | | | | 102,426 | |
| | 1,500 | | | Dril-Quip Inc.† | | | 38,789 | | | | 34,905 | |
| | 11,500 | | | Landis+Gyr Group AG | | | 691,956 | | | | 1,039,177 | |
| | 11,000 | | | National Fuel Gas Co. | | | 569,687 | | | | 551,870 | |
| | 11,000 | | | National Grid plc, ADR | | | 698,299 | | | | 747,890 | |
| | 17,000 | | | Severn Trent plc | | | 456,470 | | | | 558,845 | |
See accompanying notes to financial statements.
The Gabelli Global Rising Income and Dividend Fund
Schedule of Investments (Continued) — December 31, 2023
| Shares | | | | | Cost | | | Market
Value | |
| | | | | COMMON STOCKS (Continued) | | | | | | | | |
| | | | | Energy and Utilities (Continued) | | | | | | | | |
| | 11,000 | | | Shell plc | | $ | 237,463 | | | $ | 360,554 | |
| | | | | | | | 2,914,938 | | | | 3,860,517 | |
| | | | | Entertainment — 3.8% | | | | | | | | |
| | 30,000 | | | Corus Entertainment Inc., Cl. B | | | 91,269 | | | | 16,075 | |
| | 80,000 | | | Grupo Televisa SAB, ADR | | | 527,693 | | | | 267,200 | |
| | 13,000 | | | International Game Technology plc | | | 153,742 | | | | 356,330 | |
| | 115,000 | | | ITV plc | | | 219,606 | | | | 92,759 | |
| | 44,000 | | | Tencent Music Entertainment Group, ADR† | | | 387,172 | | | | 396,440 | |
| | 1,000 | | | Ubisoft Entertainment SA† | | | 30,523 | | | | 25,512 | |
| | 10,000 | | | Universal Music Group NV | | | 217,812 | | | | 284,929 | |
| | 50,000 | | | Vivendi SE | | | 533,311 | | | | 534,091 | |
| | 20,000 | | | Warner Bros Discovery Inc.† | | | 205,344 | | | | 227,600 | |
| | | | | | | | 2,366,472 | | | | 2,200,936 | |
| | | | | Equipment and Supplies — 2.2% | | | | | | | | |
| | 200 | | | AMETEK Inc. | | | 25,278 | | | | 32,978 | |
| | 5,000 | | | Ardagh Metal Packaging SA | | | 18,965 | | | | 19,200 | |
| | 3,000 | | | Graco Inc. | | | 71,740 | | | | 260,280 | |
| | 40,000 | | | Instalco AB | | | 188,326 | | | | 162,204 | |
| | 17,000 | | | Mueller Industries Inc. | | | 242,086 | | | | 801,550 | |
| | | | | | | | 546,395 | | | | 1,276,212 | |
| | | | | Financial Services — 11.0% | | | | | | | | |
| | 1,000 | | | American Express Co. | | | 80,155 | | | | 187,340 | |
| | 1,800 | | | American International Group Inc. | | | 63,440 | | | | 121,950 | |
| | 3,000 | | | Bank of America Corp. | | | 85,175 | | | | 101,010 | |
| | 3 | | | Berkshire Hathaway Inc., Cl. A† | | | 358,105 | | | | 1,627,875 | |
| | 10,000 | | | Citigroup Inc. | | | 485,856 | | | | 514,400 | |
| | 3,200 | | | Comerica Inc. | | | 134,262 | | | | 178,592 | |
| | 8,000 | | | Deutsche Bank AG | | | 59,019 | | | | 108,400 | |
| | 5,500 | | | EXOR NV | | | 262,676 | | | | 549,491 | |
| | 27,000 | | | FinecoBank Banca Fineco SpA | | | 182,261 | | | | 404,923 | |
| | 107,000 | | | GAM Holding AG† | | | 133,619 | | | | 49,807 | |
| | 1,600 | | | Julius Baer Group Ltd. | | | 75,332 | | | | 89,698 | |
| | 14,000 | | | Kinnevik AB, Cl. A† | | | 388,740 | | | | 148,244 | |
| | 4,400 | | | Morgan Stanley | | | 107,450 | | | | 410,300 | |
| | 40,000 | | | Resona Holdings Inc. | | | 181,079 | | | | 203,263 | |
| | 4,000 | | | State Street Corp. | | | 246,331 | | | | 309,840 | |
| | 1,000 | | | T. Rowe Price Group Inc. | | | 71,771 | | | | 107,690 | |
| | 10,000 | | | The Bank of New York Mellon Corp. | | | 315,339 | | | | 520,500 | |
| Shares | | | | | Cost | | | Market
Value | |
| | 1,500 | | | The PNC Financial Services Group Inc. | | $ | 102,907 | | | $ | 232,275 | |
| | 7,000 | | | UBS Group AG | | | 70,979 | | | | 216,300 | |
| | 4,000 | | | Wells Fargo & Co. | | | 130,845 | | | | 196,880 | |
| | | | | | | | 3,535,341 | | | | 6,278,778 | |
| | | | | Food and Beverage — 17.1% | | | | | | | | |
| | 10,000 | | | Campbell Soup Co. | | | 403,968 | | | | 432,300 | |
| | 6,500 | | | Chr. Hansen Holding A/S | | | 321,456 | | | | 545,012 | |
| | 5,000 | | | Danone SA | | | 335,187 | | | | 323,899 | |
| | 40,000 | | | Davide Campari-Milano NV | | | 131,897 | | | | 451,074 | |
| | 6,000 | | | Diageo plc, ADR | | | 665,410 | | | | 873,960 | |
| | 6,400 | | | Fomento Economico Mexicano SAB de CV, ADR | | | 514,524 | | | | 834,240 | |
| | 1,700 | | | General Mills Inc. | | | 115,627 | | | | 110,738 | |
| | 2,000 | | | Heineken NV | | | 133,144 | | | | 202,994 | |
| | 2,500 | | | Kellanova | | | 119,867 | | | | 139,775 | |
| | 4,000 | | | Kerry Group plc, Cl. A | | | 300,765 | | | | 349,290 | |
| | 10,600 | | | Kikkoman Corp. | | | 345,381 | | | | 649,081 | |
| | 10,000 | | | Maple Leaf Foods Inc. | | | 197,296 | | | | 190,483 | |
| | 3,000 | | | McCormick & Co. Inc. | | | 133,799 | | | | 204,000 | |
| | 3,000 | | | McCormick & Co. Inc., Non-Voting | | | 106,428 | | | | 205,260 | |
| | 3,600 | | | Molson Coors Beverage Co., Cl. B | | | 190,719 | | | | 220,356 | |
| | 14,000 | | | Nestlé SA | | | 1,013,818 | | | | 1,623,138 | |
| | 3,500 | | | Pernod Ricard SA | | | 398,941 | | | | 617,246 | |
| | 12,100 | | | Remy Cointreau SA | | | 892,126 | | | | 1,536,146 | |
| | 5,400 | | | The Kraft Heinz Co. | | | 153,954 | | | | 199,692 | |
| | 625 | | | WK Kellogg Co. | | | 7,424 | | | | 8,213 | |
| | 5,000 | | | Yakult Honsha Co. Ltd. | | | 136,038 | | | | 112,305 | |
| | | | | | | | 6,617,769 | | | | 9,829,202 | |
| | | | | Health Care — 2.1% | | | | | | | | |
| | 20,000 | | | Achaogen Inc.†(a) | | | 4,200 | | | | 0 | |
| | 4,000 | | | Bristol-Myers Squibb Co. | | | 177,668 | | | | 205,240 | |
| | 5,000 | | | Cutera Inc.† | | | 88,731 | | | | 17,625 | |
| | 800 | | | GSK plc, ADR | | | 33,309 | | | | 29,648 | |
| | 9,000 | | | Haleon plc, ADR | | | 71,142 | | | | 74,070 | |
| | 700 | | | ICU Medical Inc.† | | | 39,966 | | | | 69,818 | |
| | 4,666 | | | Idorsia Ltd.† | | | 57,775 | | | | 11,728 | |
| | 1,400 | | | Johnson & Johnson | | | 159,572 | | | | 219,436 | |
| | 4,000 | | | Perrigo Co. plc | | | 144,926 | | | | 128,720 | |
| | 6,000 | | | Pfizer Inc. | | | 143,046 | | | | 172,740 | |
| | 5,000 | | | Roche Holding AG, ADR | | | 93,345 | | | | 181,150 | |
| | 10,000 | | | Viatris Inc. | | | 128,514 | | | | 108,300 | |
| | | | | | | | 1,142,194 | | | | 1,218,475 | |
| | | | | Hotels and Gaming — 1.0% | | | | | | | | |
| | 190,000 | | | Mandarin Oriental International Ltd. | | | 306,553 | | | | 296,400 | |
See accompanying notes to financial statements.
The Gabelli Global Rising Income and Dividend Fund
Schedule of Investments (Continued) — December 31, 2023
| Shares | | | | | Cost | | | Market
Value | |
| | | | | COMMON STOCKS (Continued) | | | | | | | | |
| | | | | Hotels and Gaming (Continued) | | | | | | | | |
| | 200,000 | | | The Hongkong & Shanghai Hotels Ltd.† | | $ | 290,849 | | | $ | 149,581 | |
| | 1,400 | | | Wynn Resorts Ltd. | | | 123,145 | | | | 127,554 | |
| | | | | | | | 720,547 | | | | 573,535 | |
| | | | | Machinery — 4.1% | | | | | | | | |
| | 90,000 | | | CNH Industrial NV, Borsa Italiana | | | 746,753 | | | | 1,100,859 | |
| | 50,000 | | | CNH Industrial NV, New York | | | 386,314 | | | | 609,000 | |
| | 2,666 | | | NKT A/S† | | | 52,701 | | | | 183,110 | |
| | 2,000 | | | Tennant Co. | | | 156,926 | | | | 185,380 | |
| | 15,024 | | | Twin Disc Inc. | | | 215,938 | | | | 242,788 | |
| | | | | | | | 1,558,632 | | | | 2,321,137 | |
| | | | | Publishing — 0.4% | | | | | | | | |
| | 26,000 | | | The E.W. Scripps Co., Cl. A† | | | 385,292 | | | | 207,740 | |
| | | | | | | | | | | | | |
| | | | | Retail — 1.9% | | | | | | | | |
| | 4,000 | | | Nathan's Famous Inc. | | | 232,477 | | | | 312,040 | |
| | 29,000 | | | Walgreens Boots Alliance Inc. | | | 930,028 | | | | 757,190 | |
| | 1,700 | | | Zalando SE† | | | 66,063 | | | | 40,256 | |
| | | | | | | | 1,228,568 | | | | 1,109,486 | |
| | | | | Specialty Chemicals — 0.8% | | | | | | | | |
| | 700 | | | Ashland Inc. | | | 35,829 | | | | 59,017 | |
| | 1,100 | | | Darling Ingredients Inc.† | | | 47,864 | | | | 54,824 | |
| | 3,600 | | | International Flavors & Fragrances Inc. | | | 312,912 | | | | 291,492 | |
| | 1,500 | | | Livent Corp.† | | | 29,231 | | | | 26,970 | |
| | 200 | | | The Chemours Co. | | | 1,719 | | | | 6,308 | |
| | | | | | | | 427,555 | | | | 438,611 | |
| | | | | Telecommunications — 4.5% | | | | | | | | |
| | 1,300 | | | Cogeco Communications Inc. | | | 68,986 | | | | 58,228 | |
| | 11,000 | | | Deutsche Telekom AG | | | 200,258 | | | | 264,120 | |
| | 20,000 | | | Deutsche Telekom AG, ADR | | | 364,252 | | | | 482,600 | |
| | 280,000 | | | HKBN Ltd. | | | 200,879 | | | | 125,146 | |
| | 75,000 | | | Koninklijke KPN NV | | | 221,420 | | | | 258,159 | |
| | 15,000 | | | Liberty Global Ltd., Cl. A† | | | 328,753 | | | | 266,550 | |
| | 9,000 | | | Liberty Global Ltd., Cl. C† | | | 190,559 | | | | 167,760 | |
| | 4,000 | | | Orange Belgium SA† | | | 91,879 | | | | 59,613 | |
| | 60,000 | | | Pharol SGPS SA† | | | 30,852 | | | | 2,490 | |
| | 2,179 | | | Prosus NV | | | 53,188 | | | | 64,913 | |
| | 13,000 | | | Proximus SA | | | 156,355 | | | | 122,130 | |
| | 125,000 | | | Telefonica Deutschland Holding AG | | | 430,997 | | | | 324,561 | |
| | 13,000 | | | VEON Ltd., ADR† | | | 250,770 | | | | 256,100 | |
| Shares | | | | | Cost | | | Market
Value | |
| | 3,000 | | | Verizon Communications Inc. | | $ | 129,450 | | | $ | 113,100 | |
| | | | | | | | 2,718,598 | | | | 2,565,470 | |
| | | | | Wireless Telecommunications — 3.4% | | | | | | | | |
| | 22,000 | | | Millicom International Cellular SA, SDR† | | | 417,012 | | | | 393,167 | |
| | 5,500 | | | T-Mobile US Inc. | | | 456,445 | | | | 881,815 | |
| | 75,000 | | | Vodafone Group plc, ADR | | | 1,053,823 | | | | 652,500 | |
| | | | | | | | 1,927,280 | | | | 1,927,482 | |
| | | | | TOTAL COMMON STOCKS | | | 40,164,376 | | | | 56,253,254 | |
| | | | | | | | | | | | | |
| | | | | WARRANTS — 0.0% | | | | | | | | |
| | | | | Diversified Industrial — 0.0% | | | | | | | | |
| | 8,000 | | | Ampco-Pittsburgh Corp., expire 08/01/25† | | | 5,466 | | | | 960 | |
Principal
Amount | | | | | | | | | |
| | | | | U.S. GOVERNMENT OBLIGATIONS — 1.7% | | | | | | | | |
| $ | 1,000,000 | | | U.S. Treasury Bills, 5.287% to 5.396%††, 01/04/24 to 03/28/24 | | | 993,876 | | | | 994,045 | |
| | | | | | | | | | | | | |
| | | | | TOTAL INVESTMENTS — 99.9% | | $ | 41,163,718 | | | | 57,248,259 | |
| | | | | | | | | | | | | |
| | | | | Other Assets and Liabilities (Net) — 0.1% | | | | | | | 74,056 | |
| | | | | | | | | | | | | |
| | | | | NET ASSETS — 100.0% | | | | | | $ | 57,322,315 | |
| (a) | Security is valued using significant unobservable inputs and is classified as Level 3 in the fair value hierarchy. |
| † | Non-income producing security. |
| †† | Represents annualized yields at dates of purchase. |
ADR American Depositary Receipt
SDR Swedish Depositary Receipt
| Geographic Diversification | | % of
Market
Value | | | Market
Value | |
| Europe | | | 42.4 | % | | $ | 24,274,415 | |
| United States | | | 39.6 | | | | 22,678,120 | |
| Japan | | | 9.9 | | | | 5,675,057 | |
| Canada | | | 2.8 | | | | 1,622,831 | |
| Latin America | | | 2.7 | | | | 1,535,750 | |
| Asia/Pacific | | | 2.6 | | | | 1,462,086 | |
| | | | 100.0 | % | | $ | 57,248,259 | |
See accompanying notes to financial statements.
The Gabelli Global Rising Income and Dividend Fund
Statement of Assets and Liabilities
December 31, 2023
| Assets: | | | |
| Investments, at value (cost $41,163,718) | | $ | 57,248,259 | |
| Foreign currency, at value (cost $1,354) | | | 1,347 | |
| Receivable from Adviser | | | 27,809 | |
| Dividends receivable | | | 175,872 | |
| Prepaid expenses | | | 19,218 | |
| Total Assets | | | 57,472,505 | |
| Liabilities: | | | | |
| Payable to bank | | | 17,229 | |
| Payable for investment advisory fees | | | 47,283 | |
| Payable for accounting fees | | | 3,750 | |
| Payable for distribution fees | | | 1,335 | |
| Payable for shareholder communications | | | 28,952 | |
| Payable for custodian fees | | | 28,808 | |
| Payable for legal and audit fees | | | 16,317 | |
| Other accrued expenses | | | 6,516 | |
| Total Liabilities | | | 150,190 | |
| Net Assets | | | | |
| (applicable to 1,887,212 shares outstanding) | | $ | 57,322,315 | |
| Net Assets Consist of: | | | | |
| Paid-in capital | | $ | 41,996,656 | |
| Total distributable earnings | | | 15,325,659 | |
| Net Assets | | $ | 57,322,315 | |
| | | | | |
| Shares of Capital Stock, each at $0.001 par value: | | | | |
| Class AAA: | | | | |
| Net Asset Value, offering, and redemption price per share ($4,081,373 ÷ 134,702 shares outstanding; 75,000,000 shares authorized) | | $ | 30.30 | |
| Class A: | | | | |
| Net Asset Value and redemption price per share ($812,641 ÷ 26,763 shares outstanding;50,000,000 shares authorized) | | $ | 30.36 | |
| Maximum offering price per share (NAV ÷ 0.9425, based on maximum sales charge of 5.75% of the offering price) | | $ | 32.21 | |
| Class C: | | | | |
| Net Asset Value and redemption price per share ($373,295 ÷ 14,850 shares outstanding;25,000,000 shares authorized) | | $ | 25.14 | |
| Class I: | | | | |
| Net Asset Value, offering, and redemption price per share ($52,055,006 ÷ 1,710,897 shares outstanding; 25,000,000 shares authorized) | | $ | 30.43 | |
Statement of Operations
For the Year Ended December 31, 2023
| Investment Income: | | | |
| Dividends (net of foreign withholding taxes of $60,171) | | $ | 1,251,194 | |
| Interest | | | 351,091 | |
| Total Investment Income | | | 1,602,285 | |
| Expenses: | | | | |
| Investment advisory fees | | | 612,259 | |
| Distribution fees - Class AAA | | | 10,009 | |
| Distribution fees - Class A | | | 2,053 | |
| Distribution fees - Class C | | | 4,018 | |
| Shareholder communications expenses | | | 51,184 | |
| Legal and audit fees | | | 48,228 | |
| Accounting fees | | | 45,000 | |
| Custodian fees | | | 40,475 | |
| Registration expenses | | | 36,777 | |
| Shareholder services fees | | | 21,816 | |
| Directors’ fees | | | 12,727 | |
| Interest expense | | | 738 | |
| Miscellaneous expenses | | | 26,059 | |
| Total Expenses | | | 911,343 | |
| Less: | | | | |
| Expense reimbursements (See Note 3) | | | (357,890 | ) |
| Expenses paid indirectly by broker (See Note 6) | | | (1,807 | ) |
| Total Reimbursements and Credits | | | (359,697 | ) |
| Net Expenses | | | 551,646 | |
| Net Investment Income | | | 1,050,639 | |
| | | | | |
| Net Realized and Unrealized Gain/(Loss) on Investments and Foreign Currency: | | | | |
| Net realized gain on investments | | | 40,969 | |
| Net realized loss on foreign currency transactions | | | (572 | ) |
| Net realized gain on investments and foreign currency transactions | | | 40,397 | |
| Net change in unrealized appreciation/depreciation: | | | | |
| on investments | | | 3,113,583 | |
| on foreign currency translations | | | 5,128 | |
| Net change in unrealized appreciation/depreciation on investments and foreign currency translations | | | 3,118,711 | |
| Net Realized and Unrealized Gain/(Loss) on Investments and Foreign Currency | | | 3,159,108 | |
| Net Increase in Net Assets Resulting from Operations | | $ | 4,209,747 | |
See accompanying notes to financial statements.
The Gabelli Global Rising Income and Dividend Fund
Statement of Changes in Net Assets
| | | Year Ended | | | Year Ended | |
| | | December 31,
2023 | | | December 31,
2022 | |
| Operations: | | | | | | | | |
| Net investment income | | $ | 1,050,639 | | | $ | 556,987 | |
| Net realized gain on investments and foreign currency transactions | | | 40,397 | | | | 1,293,818 | |
| Net change in unrealized appreciation/depreciation on investments and foreign currency translations | | | 3,118,711 | | | | (12,481,364 | ) |
| Net Increase/(Decrease) in Net Assets Resulting from Operations | | | 4,209,747 | | | | (10,630,559 | ) |
| | | | | | | | | |
| Distributions to Shareholders: | | | | | | | | |
| Accumulated earnings | | | | | | | | |
| Class AAA | | | (82,132 | ) | | | (139,081 | ) |
| Class A | | | (16,383 | ) | | | (28,624 | ) |
| Class C | | | (8,943 | ) | | | (15,453 | ) |
| Class I | | | (1,041,965 | ) | | | (1,675,611 | ) |
| | | | (1,149,423 | ) | | | (1,858,769 | ) |
| Return of capital | | | | | | | | |
| Class AAA | | | (12,973 | ) | | | (1,251 | ) |
| Class A | | | (2,592 | ) | | | (258 | ) |
| Class C | | | (1,231 | ) | | | (132 | ) |
| Class I | | | (165,033 | ) | | | (15,084 | ) |
| | | | (181,829 | ) | | | (16,725 | ) |
| Total Distributions to Shareholders | | | (1,331,252 | ) | | | (1,875,494 | ) |
| | | | | | | | | |
| Capital Share Transactions: | | | | | | | | |
| Class AAA | | | (161,018 | ) | | | (53,774 | ) |
| Class A | | | (61,769 | ) | | | (149,606 | ) |
| Class C | | | (72,679 | ) | | | (122,423 | ) |
| Class I | | | 2,217,107 | | | | (4,140,243 | ) |
| Net Increase/(Decrease) in Net Assets from Capital Share Transactions | | | 1,921,641 | | | | (4,466,046 | ) |
| | | | | | | | | |
| Net Increase/(Decrease) in Net Assets | | | 4,800,136 | | | | (16,972,099 | ) |
| | | | | | | | | |
| Net Assets: | | | | | | | | |
| Beginning of year | | | 52,522,179 | | | | 69,494,278 | |
| End of year | | $ | 57,322,315 | | | $ | 52,522,179 | |
See accompanying notes to financial statements.
The Gabelli Global Rising Income and Dividend Fund
Financial Highlights
Selected data for a share of beneficial interest outstanding throughout each year:
| | | | | | Income (Loss) from Investment Operations | | | Distributions | | | | | | | | | | | | Ratios to Average Net Assets/Supplemental Data | |
| Year Ended December 31 | | Net Asset Value, Beginning of Year | | | Net Investment Income (Loss)(a) | | | Net Realized and Unrealized Gain (Loss) on Investments | | | Total from Investment Operations | | | Net Investment Income | | | Net
Realized Gain on Investments | | | Return of Capital | | | Total Distributions | | | Redemption Fees(a)(b) | | | Net Asset Value, End of Year | | | Total
Return† | | | Net Assets, End of Year (in 000’s) | | | Net Investment Income (Loss) | | | Operating Expenses Before Reimbursement | | | Operating
Expenses
Net of
Reimbursement(c)(d)(e) | | | Portfolio Turnover Rate | |
| Class AAA | | | | | | | | | | | | | | | | | | | | | | | | | | | | | | | | | | | | | | | | | | | | | | | | |
| 2023 | | $ | 28.22 | | | $ | 0.48 | | | $ | 2.32 | | | $ | 2.80 | | | $ | (0.57 | ) | | $ | (0.05 | ) | | $ | (0.10 | ) | | $ | (0.72 | ) | | $ | — | | | $ | 30.30 | | | | 9.92 | % | | $ | 4,081 | | | | 1.64 | % | | | 1.71 | % | | | 0.90 | % | | | 9 | % |
| 2022 | | | 34.68 | | | | 0.30 | | | | (5.73 | ) | | | (5.43 | ) | | | (0.26 | ) | | | (0.76 | ) | | | (0.01 | ) | | | (1.03 | ) | | | — | | | | 28.22 | | | | (15.63 | ) | | | 3,954 | | | | 1.01 | | | | 1.65 | | | | 0.90 | | | | 11 | |
| 2021 | | | 29.04 | | | | 0.39 | (f) | | | 5.79 | | | | 6.18 | | | | (0.17 | ) | | | (0.37 | ) | | | — | | | | (0.54 | ) | | | 0.00 | | | | 34.68 | | | | 21.32 | | | | 4,914 | | | | 1.21 | (f) | | | 1.62 | | | | 0.90 | | | | 10 | |
| 2020 | | | 26.18 | | | | 0.19 | | | | 2.87 | | | | 3.06 | | | | (0.20 | ) | | | — | | | | — | | | | (0.20 | ) | | | 0.00 | | | | 29.04 | | | | 11.68 | | | | 5,157 | | | | 0.79 | | | | 1.72 | | | | 0.90 | | | | 8 | |
| 2019 | | | 23.00 | | | | 0.08 | (f) | | | 3.22 | | | | 3.30 | | | | (0.08 | ) | | | (0.04 | ) | | | — | | | | (0.12 | ) | | | 0.00 | | | | 26.18 | | | | 14.38 | | | | 6,194 | | | | 0.34 | (f) | | | 1.70 | | | | 1.65 | | | | 5 | |
| Class A | | | | | | | | | | | | | | | | | | | | | | | | | | | | | | | | | | | | | | | | | | | | | | | | | |
| 2023 | | $ | 28.28 | | | $ | 0.49 | | | $ | 2.31 | | | $ | 2.80 | | | $ | (0.57 | ) | | $ | (0.05 | ) | | $ | (0.10 | ) | | $ | (0.72 | ) | | $ | — | | | $ | 30.36 | | | | 9.90 | % | | $ | 813 | | | | 1.65 | % | | | 1.71 | % | | | 0.90 | % | | | 9 | % |
| 2022 | | | 34.75 | | | | 0.29 | | | | (5.73 | ) | | | (5.44 | ) | | | (0.26 | ) | | | (0.76 | ) | | | (0.01 | ) | | | (1.03 | ) | | | — | | | | 28.28 | | | | (15.62) | | | | 815 | | | | 0.97 | | | | 1.65 | | | | 0.90 | | | | 11 | |
| 2021 | | | 29.10 | | | | 0.39 | (f) | | | 5.80 | | | | 6.19 | | | | (0.17 | ) | | | (0.37 | ) | | | — | | | | (0.54 | ) | | | 0.00 | | | | 34.75 | | | | 21.31 | | | | 1,169 | | | | 1.19 | (f) | | | 1.62 | | | | 0.90 | | | | 10 | |
| 2020 | | | 26.23 | | | | 0.18 | | | | 2.89 | | | | 3.07 | | | | (0.20 | ) | | | — | | | | — | | | | (0.20 | ) | | | 0.00 | | | | 29.10 | | | | 11.69 | | | | 840 | | | | 0.76 | | | | 1.72 | | | | 0.90 | | | | 8 | |
| 2019 | | | 23.04 | | | | 0.09 | (f) | | | 3.21 | | | | 3.30 | | | | (0.07 | ) | | | (0.04 | ) | | | — | | | | (0.11 | ) | | | 0.00 | | | | 26.23 | | | | 14.35 | | | | 1,441 | | | | 0.35 | (f) | | | 1.70 | | | | 1.66 | | | | 5 | |
| Class C | | | | | | | | | | | | | | | | | | | | | | | | | | | | | | | | | | | | | | | | | | | | | | | | | |
| 2023 | | $ | 23.51 | | | $ | 0.40 | | | $ | 1.93 | | | $ | 2.33 | | | $ | (0.57 | ) | | $ | (0.04 | ) | | $ | (0.09 | ) | | $ | (0.70 | ) | | $ | — | | | $ | 25.14 | | | | 9.89 | % | | $ | 373 | | | | 1.64 | % | | | 2.46 | % | | | 0.90 | % | | | 9 | % |
| 2022 | | | 28.93 | | | | 0.25 | | | | (4.77 | ) | | | (4.52 | ) | | | (0.26 | ) | | | (0.63 | ) | | | (0.01 | ) | | | (0.90 | ) | | | — | | | | 23.51 | | | | (15.59 | ) | | | 417 | | | | 1.00 | | | | 2.40 | | | | 0.90 | | | | 11 | |
| 2021 | | | 24.30 | | | | 0.34 | (f) | | | 4.83 | | | | 5.17 | | | | (0.17 | ) | | | (0.37 | ) | | | — | | | | (0.54 | ) | | | 0.00 | | | | 28.93 | | | | 21.32 | | | | 654 | | | | 1.23 | (f) | | | 2.38 | | | | 0.90 | | | | 10 | |
| 2020 | | | 21.94 | | | | 0.15 | | | | 2.41 | | | | 2.56 | | | | (0.20 | ) | | | — | | | | — | | | | (0.20 | ) | | | 0.00 | | | | 24.30 | | | | 11.65 | | | | 968 | | | | 0.74 | | | | 2.47 | | | | 0.90 | | | | 8 | |
| 2019 | | | 19.35 | | | | (0.09 | )(f) | | | 2.72 | | | | 2.63 | | | | — | | | | (0.04 | ) | | | — | | | | (0.04 | ) | | | 0.00 | | | | 21.94 | | | | 13.61 | | | | 1,836 | | | | (0.43 | )(f) | | | 2.45 | | | | 2.37 | | | | 5 | |
| Class I | | | | | | | | | | | | | | | | | | | | | | | | | | | | | | | | | | | | | | | | | | | | | | | | | |
| 2023 | | $ | 28.34 | | | $ | 0.51 | | | $ | 2.30 | | | $ | 2.81 | | | $ | (0.57 | ) | | $ | (0.05 | ) | | $ | (0.10 | ) | | $ | (0.72 | ) | | $ | — | | | $ | 30.43 | | | | 9.91 | % | | $ | 52,055 | | | | 1.72 | % | | | 1.46 | % | | | 0.90 | % | | | 9 | % |
| 2022 | | | 34.82 | | | | 0.30 | | | | (5.75 | ) | | | (5.45 | ) | | | (0.26 | ) | | | (0.76 | ) | | | (0.01 | ) | | | (1.03 | ) | | | — | | | | 28.34 | | | | (15.61 | ) | | | 47,336 | | | | 0.99 | | | | 1.40 | | | | 0.90 | | | | 11 | |
| 2021 | | | 29.15 | | | | 0.39 | (f) | | | 5.82 | | | | 6.21 | | | | (0.17 | ) | | | (0.37 | ) | | | — | | | | (0.54 | ) | | | 0.00 | | | | 34.82 | | | | 21.34 | | | | 62,757 | | | | 1.20 | (f) | | | 1.37 | | | | 0.90 | | | | 10 | |
| 2020 | | | 26.28 | | | | 0.19 | | | | 2.88 | | | | 3.07 | | | | (0.20 | ) | | | — | | | | — | | | | (0.20 | ) | | | 0.00 | | | | 29.15 | | | | 11.67 | | | | 48,234 | | | | 0.79 | | | | 1.47 | | | | 0.90 | | | | 8 | |
| 2019 | | | 23.08 | | | | 0.25 | (f) | | | 3.24 | | | | 3.49 | | | | (0.25 | ) | | | (0.04 | ) | | | — | | | | (0.29 | ) | | | 0.00 | | | | 26.28 | | | | 15.11 | | | | 44,180 | | | | 1.01 | (f) | | | 1.45 | | | | 0.99 | | | | 5 | |
| † | Total return represents aggregate total return of a hypothetical investment at the beginning of the year and sold at the end of the year including reinvestment of distributions and does not reflect the applicable sales charges. |
| (a) | Per share amounts have been calculated using the average shares outstanding method. |
| (b) | Amount represents less than $0.005 per share. |
| (c) | The Fund received credits from a designated broker who agreed to pay certain Fund operating expenses. For all years presented, there was no impact on the expense ratios. |
| (d) | The Fund incurred interest expense in all periods, the effect of which was minimal. |
| (e) | Under an expense reimbursement agreement with the Adviser, the Adviser reimbursed expenses of $357,890, $295,664, $311,048, $295,855, and $196,584 for the years ended December 31, 2023, 2022, 2021, 2020, and 2019, respectively. |
| (f) | Includes income resulting from special dividends. Without these dividends, the per share income/(loss) amounts would have been $0.19 and $0.03 (Class AAA), $0.19 and $0.04 (Class A), $0.17 and $(0.13) (Class C), and $0.19 and $0.20 (Class I), and the net investment income/(loss) ratios would have been 0.59% and 0.14% (Class AAA), 0.57% and 0.14% (Class A), 0.61% and (0.64%) (Class C), 0.58% and 0.80% (Class I), for the years ended December 31, 2021 and 2019, respectively. |
See accompanying notes to financial statements.
The Gabelli Global Rising Income and Dividend Fund
Notes to Financial Statements
1. Organization. The Gabelli Global Rising Income and Dividend Fund, a series of the GAMCO Global Series Funds, Inc. (the Corporation), was incorporated on July 16, 1993 in Maryland. Although the Fund is registered as a non-diversified fund, it has operated as a diversified fund for over three years. Therefore, the Investment Company Act of 1940, as amended (the 1940 Act) obliges the Fund to continue to operate as a diversified fund unless the Fund obtains shareholder approval to operate as a non-diversified fund. The Fund is one of five separately managed portfolios (collectively, the Portfolios) of the Corporation. The Fund’s primary objective is to seek to provide investors a high level of total return through a combination of income and capital appreciation. The Fund commenced investment operations on February 3, 1994.
2. Significant Accounting Policies. As an investment company, the Fund follows the investment company accounting and reporting guidance, which is part of U.S. generally accepted accounting principles (GAAP) that may require the use of management estimates and assumptions in the preparation of its financial statements. Actual results could differ from those estimates. The following is a summary of significant accounting policies followed by the Fund in the preparation of its financial statements.
Security Valuation. Portfolio securities listed or traded on a nationally recognized securities exchange or traded in the U.S. over-the-counter market for which market quotations are readily available are valued at the last quoted sale price or a market’s official closing price as of the close of business on the day the securities are being valued. If there were no sales that day, the security is valued at the average of the closing bid and asked prices or, if there were no asked prices quoted on that day, then the security is valued at the closing bid price on that day. If no bid or asked prices are quoted on such day, the security is valued at the most recently available price or, if the Board of Directors (the Board) so determines, by such other method as the Board shall determine in good faith to reflect its fair market value. Portfolio securities traded on more than one national securities exchange or market are valued according to the broadest and most representative market, as determined by Gabelli Funds, LLC (the Adviser).
Portfolio securities primarily traded on a foreign market are generally valued at the preceding closing values of such securities on the relevant market, but may be fair valued pursuant to procedures established by the Board if market conditions change significantly after the close of the foreign market, but prior to the close of business on the day the securities are being valued. Debt obligations for which market quotations are readily available are valued at the average of the latest bid and asked prices. If there were no asked prices quoted on such day, the security is valued using the closing bid price. Such debt obligations are valued through prices provided by a pricing service approved by the Board. Certain securities are valued principally using dealer quotations.
Securities and assets for which market quotations are not readily available are fair valued as determined by the Board. Fair valuation methodologies and procedures may include, but are not limited to: analysis and review of available financial and non-financial information about the company; comparisons with the valuation and changes in valuation of similar securities, including a comparison of foreign securities with the equivalent U.S. dollar value American Depositary Receipt securities at the close of the U.S. exchange; and evaluation of any other information that could be indicative of the value of the security.
The Fund employs a fair value model to adjust prices to reflect events affecting the values of certain portfolio securities which occur between the close of trading on the principal market for such securities (foreign exchanges and over-the-counter markets) at the time when net asset values of the Fund are determined. If the Fund’s valuation committee believes that a particular event would materially affect net asset value, further adjustment is considered. Such securities are classified as Level 2 in the fair value hierarchy presented below.
The Gabelli Global Rising Income and Dividend Fund
Notes to Financial Statements (Continued)
The inputs and valuation techniques used to measure fair value of the Fund’s investments are summarized into three levels as described in the hierarchy below:
| ● | Level 1 — quoted prices in active markets for identical securities; |
| ● | Level 2 — other significant observable inputs (including quoted prices for similar securities, interest rates, prepayment speeds, credit risk, etc.); and |
| ● | Level 3 — significant unobservable inputs (including the Board’s determinations as to the fair value of investments). |
A financial instrument’s level within the fair value hierarchy is based on the lowest level of any input both individually and in the aggregate that is significant to the fair value measurement. The inputs or methodology used for valuing securities are not necessarily an indication of the risk associated with investing in those securities. The summary of the Fund’s investments in securities by inputs used to value the Fund’s investments as of December 31, 2023 is as follows:
| | | Valuation Inputs | | | | |
| | Level 1
Quoted Prices | | | Level 2 Other
Significant
Observable Inputs | | | Level 3 Significant
Unobservable
Inputs (a) | | | Total Market Value
at 12/31/23 | |
| INVESTMENTS IN SECURITIES: | | | | | | | | | | | | | | | | |
| ASSETS (Market Value): | | | | | | | | | | | | | | | | |
| Common Stocks: | | | | | | | | | | | | | | | | |
| Diversified Industrial | | $ | 5,040,336 | | | $ | 49,320 | | | | — | | | $ | 5,089,656 | |
| Health Care | | | 1,218,475 | | | | — | | | $ | 0 | | | | 1,218,475 | |
| Other Industries (b) | | | 49,945,123 | | | | — | | | | — | | | | 49,945,123 | |
| Total Common Stocks | | | 56,203,934 | | | | 49,320 | | | | — | | | | 56,253,254 | |
| Warrants (b) | | | 960 | | | | — | | | | — | | | | 960 | |
| U.S. Government Obligations | | | — | | | | 994,045 | | | | — | | | | 994,045 | |
| TOTAL INVESTMENTS IN SECURITIES – ASSETS | | $ | 56,204,894 | | | $ | 1,043,365 | | | $ | 0 | | | $ | 57,248,259 | |
| (a) | The inputs for this security are not readily available and are derived based on the judgment of the Adviser according to procedures approved by the Board. |
| (b) | Please refer to the Schedule of Investments for the industry classifications of these portfolio holdings. |
The Fund did not have any material transfers into or out of Level 3 during the year ended December 31, 2023. The Fund’s policy is to recognize transfers among levels as of the beginning of the reporting period.
Additional Information to Evaluate Qualitative Information.
General. The Fund uses recognized industry pricing services – approved by the Board and unaffiliated with the Adviser – to value most of its securities, and uses broker quotes provided by market makers of securities not valued by these and other recognized pricing sources. Several different pricing feeds are received to value domestic equity securities, international equity securities, preferred equity securities, and fixed income securities. The data within these feeds are ultimately sourced from major stock exchanges and trading systems where these securities trade. The prices supplied by external sources are checked by obtaining quotations or actual transaction prices from market participants. If a price obtained from the pricing source is deemed
The Gabelli Global Rising Income and Dividend Fund
Notes to Financial Statements (Continued)
unreliable, prices will be sought from another pricing service or from a broker/dealer that trades that security or similar securities.
Fair Valuation. Fair valued securities may be common or preferred equities, warrants, options, rights, or fixed income obligations. Where appropriate, Level 3 securities are those for which market quotations are not available, such as securities not traded for several days, or for which current bids are not available, or which are restricted as to transfer. When fair valuing a security, factors to consider include recent prices of comparable securities that are publicly traded, reliable prices of securities not publicly traded, the use of valuation models, current analyst reports, valuing the income or cash flow of the issuer, or cost if the preceding factors do not apply. A significant change in the unobservable inputs could result in a lower or higher value in Level 3 securities. The circumstances of Level 3 securities are frequently monitored to determine if fair valuation measures continue to apply.
The Adviser reports quarterly to the Board the results of the application of fair valuation policies and procedures. These may include backtesting the prices realized in subsequent trades of these fair valued securities to fair values previously recognized.
Foreign Currency Translations. The books and records of the Fund are maintained in U.S. dollars. Foreign currencies, investments, and other assets and liabilities are translated into U.S. dollars at current exchange rates. Purchases and sales of investment securities, income, and expenses are translated at the exchange rate prevailing on the respective dates of such transactions. Unrealized gains and losses that result from changes in foreign exchange rates and/or changes in market prices of securities have been included in unrealized appreciation/depreciation on investments and foreign currency translations. Net realized foreign currency gains and losses resulting from changes in exchange rates include foreign currency gains and losses between trade date and settlement date on investment securities transactions, foreign currency transactions, and the difference between the amounts of interest and dividends recorded on the books of the Fund and the amounts actually received. The portion of foreign currency gains and losses related to fluctuation in exchange rates between the initial purchase trade date and subsequent sale trade date is included in realized gain/(loss) on investments.
Foreign Securities. The Fund may directly purchase securities of foreign issuers. Investing in securities of foreign issuers involves special risks not typically associated with investing in securities of U.S. issuers. The risks include possible revaluation of currencies, the inability to repatriate funds, less complete financial information about companies, and possible future adverse political and economic developments. Moreover, securities of many foreign issuers and their markets may be less liquid and their prices more volatile than securities of comparable U.S. issuers.
Foreign Taxes. The Fund may be subject to foreign taxes on income, gains on investments, or currency repatriation, a portion of which may be recoverable. The Fund will accrue such taxes and recoveries as applicable, based upon its current interpretation of tax rules and regulations that exist in the markets in which it invests.
Restricted Securities. The Fund may invest up to 15% of its net assets in securities for which the markets are restricted. Restricted securities include securities whose disposition is subject to substantial legal or contractual restrictions. The sale of restricted securities often requires more time and results in higher brokerage charges or dealer discounts and other selling expenses than does the sale of securities eligible for trading on national securities exchanges or in the over-the-counter markets. Restricted securities may sell at a price lower than similar securities that are not subject to restrictions on resale. Securities freely saleable among qualified
The Gabelli Global Rising Income and Dividend Fund
Notes to Financial Statements (Continued)
institutional investors under special rules adopted by the SEC may be treated as liquid if they satisfy liquidity standards established by the Board. The continued liquidity of such securities is not as well assured as that of publicly traded securities, and accordingly the Board will monitor their liquidity. For the restricted securities the Fund held as of December 31, 2023, if any, refer to the Schedule of Investments.
Securities Transactions and Investment Income. Securities transactions are accounted for on the trade date with realized gain/(loss) on investments determined by using the identified cost method. Interest income (including amortization of premium and accretion of discount) is recorded on an accrual basis. Premiums and discounts on debt securities are amortized using the effective yield to maturity method or amortized to earliest call date, if applicable. Dividend income is recorded on the ex-dividend date, except for certain dividends from foreign securities that are recorded as soon after the ex-dividend date as the Fund becomes aware of such dividends.
Determination of Net Asset Value and Calculation of Expenses. Certain administrative expenses are common to, and allocated among, various affiliated funds. Such allocations are made on the basis of each fund’s average net assets or other criteria directly affecting the expenses as determined by the Adviser pursuant to procedures established by the Board.
In calculating the NAV per share of each class, investment income, realized and unrealized gains and losses, redemption fees, and expenses other than class specific expenses are allocated daily to each class of shares based upon the proportion of net assets of each class at the beginning of each day. Distribution expenses are borne solely by the class incurring the expense.
Distributions to Shareholders. Distributions to shareholders are recorded on the ex-dividend date. Distributions to shareholders are based on income and capital gains as determined in accordance with federal income tax regulations, which may differ from income and capital gains as determined under GAAP. These differences are primarily due to the reclassification of prior year return of capital and redesignation of dividends paid. These book/tax differences are either temporary or permanent in nature. To the extent these differences are permanent, adjustments are made to the appropriate capital accounts in the period when the differences arise. These reclassifications have no impact on the NAV of the Fund.
The tax character of distributions paid during the years ended December 31, 2023 and 2022 was as follows:
| | | Year Ended | | | Year Ended | |
| | | December 31,
2023 | | | December 31,
2022 | |
| Distributions paid from: | | | | | | | | |
| Ordinary income | | $ | 1,053,332 | | | $ | 482,353 | |
| Net long term capital gains | | | 96,091 | | | | 1,376,416 | |
| Return of capital | | | 181,829 | | | | 16,725 | |
| Total distributions paid | | $ | 1,331,252 | | | $ | 1,875,494 | |
Provision for Income Taxes. The Fund intends to continue to qualify as a regulated investment company under Subchapter M of the Internal Revenue Code of 1986, as amended (the Code). It is the policy of the Fund to comply with the requirements of the Code applicable to regulated investment companies and to distribute
The Gabelli Global Rising Income and Dividend Fund
Notes to Financial Statements (Continued)
substantially all of its net investment company taxable income and net capital gains. Therefore, no provision for federal income taxes is required.
At December 31, 2023, the components of accumulated earnings/losses on a tax basis were as follows:
| Net unrealized appreciation on investments and foreign currency translations | | $ | 15,325,659 | |
At December 31, 2023, the temporary differences between book basis and tax basis net unrealized appreciation on investments were primarily due to deferral of losses from wash sales for tax purposes and prior year mark-to-market adjustments on investments no longer considered passive foreign investment companies.
The following summarizes the tax cost of investments and the related net unrealized appreciation at December 31, 2023:
| | | Cost | | | Gross
Unrealized
Appreciation | | | Gross
Unrealized
Depreciation | | | Net
Unrealized
Appreciation | |
| Investments | | $ | 41,926,937 | | | $ | 19,723,226 | | | $ | (4,401,904 | ) | | $ | 15,321,322 | |
The Fund is required to evaluate tax positions taken or expected to be taken in the course of preparing the Fund’s tax returns to determine whether the tax positions are “more-likely-than-not” of being sustained by the applicable tax authority. Income tax and related interest and penalties would be recognized by the Fund as tax expense in the Statement of Operations if the tax positions were deemed not to meet the more-likely-than-not threshold. During the year ended December 31, 2023, the Fund did not incur any income tax, interest, or penalties. As of December 31, 2023, the Adviser has reviewed all open tax years and concluded that there was no impact to the Fund’s net assets or results of operations. The Fund’s federal and state tax returns for the prior three fiscal years remain open, subject to examination. On an ongoing basis, the Adviser will monitor the Fund’s tax positions to determine if adjustments to this conclusion are necessary.
3. Investment Advisory Agreement and Other Transactions. The Fund has entered into an investment advisory agreement (the Advisory Agreement) with the Adviser which provides that the Fund will pay the Adviser a fee, computed daily and paid monthly, at the annual rate of 1.00% of the value of its average daily net assets. In accordance with the Advisory Agreement, the Adviser provides a continuous investment program for the Fund’s portfolio, oversees the administration of all aspects of the Fund’s business and affairs, and pays the compensation of all Officers and Directors of the Fund who are affiliated persons of the Adviser.
The Adviser has contractually agreed to waive its investment advisory fees and/or to reimburse expenses to the extent necessary to maintain the annualized total operating expenses of the Fund (excluding brokerage costs, acquired fund fees and expenses, interest, taxes, and extraordinary expenses) until at least April 30, 2024, at no more than an annual rate of 0.90% for all classes of shares. During the year ended December 31, 2023, the Adviser reimbursed expenses in the amount of $357,890. In addition, the Fund has agreed, during the two year period following any waiver or reimbursement by the Adviser, to repay such amount to the extent, after giving effect to the repayment, such adjusted annualized total operating expenses of the Fund would not exceed 0.90% of the value of the Fund’s average daily net assets for each share class of the Fund. The agreement
The Gabelli Global Rising Income and Dividend Fund
Notes to Financial Statements (Continued)
is renewable annually. At December 31, 2023, the cumulative amount which the Fund may repay the Adviser, subject to the terms above, is $653,554:
| For the year ended December 31, 2022, expiring December 31, 2024 | | $ | 295,664 | |
| For the year ended December 31, 2023, expiring December 31, 2025 | | | 357,890 | |
| | | $ | 653,554 | |
4. Distribution Plan. The Fund’s Board has adopted a distribution plan (the Plan) for each class of shares, except for Class I Shares, pursuant to Rule 12b-1 under the 1940 Act. Under the Class AAA, Class A, and Class C Share Plans, payments are authorized to G.distributors, LLC (the Distributor), an affiliate of the Adviser, at annual rates of 0.25%, 0.25%, and 1.00%, respectively, of the average daily net assets of those classes, the annual limitations under each Plan. Such payments are accrued daily and paid monthly.
5. Portfolio Securities. Purchases and sales of securities during the year ended December 31, 2023, other than short term securities and U.S. Government obligations, aggregated $7,336,857 and $5,016,887, respectively.
6. Transactions with Affiliates and Other Arrangements. During the year ended December 31, 2023, the Fund paid brokerage commissions on security trades of $2,063 to G.research, LLC, an affiliate of the Adviser. Additionally, the Distributor retained a total of $23 from investors representing commissions (sales charges and underwriting fees) on sales and redemptions of Fund shares.
The Fund received credits from a designated broker who agreed to pay certain Fund operating expenses. The amount of such expenses paid through this directed brokerage arrangement during this period was $1,807.
The cost of calculating the Fund’s NAV per share is a Fund expense pursuant to the Advisory Agreement. Under the sub-administration agreement with Bank of New York Mellon, the fees paid include the cost of calculating the Fund’s NAV. The Fund reimburses the Adviser for this service. During the year ended December 31, 2023, the Fund accrued $45,000 in accounting fees in the Statement of Operations.
The Corporation pays retainer and per meeting fees to Directors not affiliated with the Adviser, plus specified amounts to the Lead Director and Audit Committee Chairman. Directors are also reimbursed for out of pocket expenses incurred in attending meetings. Directors who are directors or employees of the Adviser or an affiliated company receive no compensation or expense reimbursement from the Corporation.
7. Line of Credit. The Fund participates in an unsecured line of credit, which expires on February 28, 2024 and may be renewed annually, of up to $75,000,000 under which it may borrow up to 10% of its net assets from the bank for temporary borrowing purposes. Borrowings under this arrangement bear interest at a floating rate equal to the higher of the Overnight Federal Funds Rate plus 135 basis points or the Overnight Bank Funding Rate plus 135 basis points in effect on that day. This amount, if any, would be included in “Interest expense” in the Statement of Operations. During the year ended December 31, 2023, there were no borrowings under the line of credit.
8. Capital Stock. The Fund currently offers three classes of shares – Class AAA Shares, Class A Shares, and Class I Shares. Class AAA and Class A investors may purchase more of these share classes. Class C shareholders cannot purchase more of this class. The minimum investment for Class I shares is $1,000. These changes had no effect on existing shareholders’ ability to redeem shares of the Fund as described in the Fund’s Prospectus.
The Gabelli Global Rising Income and Dividend Fund
Notes to Financial Statements (Continued)
The Fund imposes a redemption fee of 2.00% on all classes of shares that are redeemed or exchanged on or before the seventh day after the date of a purchase. The redemption fee is deducted from the proceeds otherwise payable to the redeeming shareholders and is retained by the Fund as an increase in paid-in capital. The redemption fees retained by the Fund during the years ended December 31, 2023 and 2022, if any, can be found in the Statement of Changes in Net Assets under Redemption Fees.
Transactions in shares of capital stock were as follows:
| | | Year Ended | | | Year Ended | |
| | | December 31,
2023 | | | December 31,
2022 | |
| | | Shares | | | Amount | | | Shares | | | Amount | |
| Class AAA | | | | | | | | | | | | | | | | |
| Shares sold | | | 460 | | | $ | 13,676 | | | | 735 | | | $ | 22,539 | |
| Shares issued upon reinvestment of distributions | | | 3,085 | | | | 93,767 | | | | 4,798 | | | | 134,227 | |
| Shares redeemed | | | (8,936 | ) | | | (268,461 | ) | | | (7,142 | ) | | | (210,540 | ) |
| Net decrease | | | (5,391 | ) | | $ | (161,018 | ) | | | (1,609 | ) | | $ | (53,774 | ) |
| Class A | | | | | | | | | | | | | | | | |
| Shares sold | | | 1,379 | | | $ | 41,508 | | | | 2,580 | | | $ | 76,197 | |
| Shares issued upon reinvestment of distributions | | | 591 | | | | 17,988 | | | | 1,002 | | | | 28,094 | |
| Shares redeemed | | | (4,044 | ) | | | (121,265 | ) | | | (8,404 | ) | | | (253,897 | ) |
| Net decrease | | | (2,074 | ) | | $ | (61,769 | ) | | | (4,822 | ) | | $ | (149,606 | ) |
| Class C | | | | | | | | | | | | | | | | |
| Shares issued upon reinvestment of distributions | | | 403 | | | $ | 10,158 | | | | 666 | | | $ | 15,517 | |
| Shares redeemed | | | (3,278 | ) | | | (82,837 | ) | | | (5,544 | ) | | | (137,940 | ) |
| Net decrease | | | (2,875 | ) | | $ | (72,679 | ) | | | (4,878 | ) | | $ | (122,423 | ) |
| Class I | | | | | | | | | | | | | | | | |
| Shares sold | | | 577,974 | | | $ | 17,758,434 | | | | 96,585 | | | $ | 3,181,012 | |
| Shares issued upon reinvestment of distributions | | | 39,489 | | | | 1,205,195 | | | | 38,351 | | | | 1,077,284 | |
| Shares redeemed | | | (577,080 | ) | | | (16,746,522 | ) | | | (266,893 | ) | | | (8,398,539 | ) |
| Net increase/(decrease) | | | 40,383 | | | $ | 2,217,107 | | | | (131,957 | ) | | $ | (4,140,243 | ) |
9. Significant Shareholder. As of December 31, 2023, approximately 87.0% of the Fund was beneficially owned by the Adviser and its affiliates, including managed accounts for which the affiliates of the Adviser have voting control but disclaim pecuniary interest.
10. Indemnifications. The Fund enters into contracts that contain a variety of indemnifications. The Fund’s maximum exposure under these arrangements is unknown. However, the Fund has not had prior claims or losses pursuant to these contracts. Management has reviewed the Fund’s existing contracts and expects the risk of loss to be remote.
11. Subsequent Events. Management has evaluated the impact on the Fund of all subsequent events occurring through the date the financial statements were issued and has determined that there were no subsequent events requiring recognition or disclosure in the financial statements.
The Gabelli Global Rising Income and Dividend Fund
Report of Independent Registered Public Accounting Firm
To the Shareholders of The Gabelli Global Rising Income and Dividend Fund
and the Board of Directors of GAMCO Global Series Funds, Inc.
Opinion on the Financial Statements
We have audited the accompanying statement of assets and liabilities of The Gabelli Global Rising Income and Dividend Fund (the “Fund”) (one of the funds constituting GAMCO Global Series Funds, Inc. (the “Corporation”)), including the schedule of investments, as of December 31, 2023, and the related statement of operations for the year then ended, the statements of changes in net assets for each of the two years in the period then ended, the financial highlights for each of the five years in the period then ended and the related notes (collectively referred to as the “financial statements”). In our opinion, the financial statements present fairly, in all material respects, the financial position of the Fund (one of the funds constituting GAMCO Global Series Funds, Inc.) at December 31, 2023, the results of its operations for the year then ended, the changes in its net assets for each of the two years in the period then ended and its financial highlights for each of the five years in the period then ended, in conformity with U.S. generally accepted accounting principles.
Basis for Opinion
These financial statements are the responsibility of the Corporation’s management. Our responsibility is to express an opinion on the Fund’s financial statements based on our audits. We are a public accounting firm registered with the Public Company Accounting Oversight Board (United States) (“PCAOB”) and are required to be independent with respect to the Corporation in accordance with the U.S. federal securities laws and the applicable rules and regulations of the Securities and Exchange Commission and the PCAOB.
We conducted our audits in accordance with the standards of the PCAOB. Those standards require that we plan and perform the audit to obtain reasonable assurance about whether the financial statements are free of material misstatement, whether due to error or fraud. The Corporation is not required to have, nor were we engaged to perform, an audit of the Corporation’s internal control over financial reporting. As part of our audits, we are required to obtain an understanding of internal control over financial reporting but not for the purpose of expressing an opinion on the effectiveness of the Corporation’s internal control over financial reporting. Accordingly, we express no such opinion.
Our audits included performing procedures to assess the risks of material misstatement of the financial statements, whether due to error or fraud, and performing procedures that respond to those risks. Such procedures included examining, on a test basis, evidence regarding the amounts and disclosures in the financial statements. Our procedures included confirmation of securities owned as of December 31, 2023 by correspondence with the custodian and brokers. Our audits also included evaluating the accounting principles used and significant estimates made by management, as well as evaluating the overall presentation of the financial statements. We believe that our audits provide a reasonable basis for our opinion.

We have served as the auditor of one or more Gabelli Funds investment companies since 1992.
New York, New York
February 28, 2024
The Gabelli Global Rising Income and Dividend Fund
Liquidity Risk Management Program (Unaudited)
In accordance with Rule 22e-4 under the 1940 Act,the Fund has established a liquidity risk management program (the LRM Program) to govern its approach to managing liquidity risk. The LRM Program is administered by the Liquidity Committee (the Committee), which is comprised of members of Gabelli Funds, LLC management. The Board has designated the Committee to administer the LRM Program.
The LRM Program’s principal objectives include supporting the Fund’s compliance with limits on investments in illiquid assets and mitigating the risk that the Fund will be unable to meet its redemption obligations in a timely manner. The LRM Program also includes elements that support the management and assessment of liquidity risk, including an annual assessment of factors that influence the Fund’s liquidity and the monthly classification and re-classification of certain investments that reflect the Committee’s assessment of their relative liquidity under current market conditions.
At a meeting of the Board held on August 23, 2023, the Board received a written report from the Committee regarding the design and operational effectiveness of the LRM Program. The Committee determined, and reported to the Board, that the LRM Program is reasonably designed to assess and manage the Fund’s liquidity risk and has operated adequately and effectively since its implementation. The Committee reported that there were no liquidity events that impacted the Fund or its ability to timely meet redemptions without dilution to existing shareholders. The Committee noted that the Fund is primarily invested in highly liquid securities and, accordingly, continues to be exempt from the requirement to determine a “highly liquid investment minimum” as defined in the Rule 22e-4. Because of that continued qualification for the exemption, the Fund has not adopted a “highly liquid investment minimum” amount. The Committee further noted that while changes to the LRM Program were made during the Review Period and reported to the Board, no material changes were made to the LRM Program as a result of the Committee’s annual review.
There can be no assurance that the LRM Program will achieve its objectives in the future. Please refer to the Fund’s Prospectus for more information regarding its exposure to liquidity risk and other principal risks to which an investment in the Fund may be subject.
The Gabelli Global Rising Income and Dividend Fund
Board Consideration and Re-Approval of Investment Advisory Agreement (Unaudited)
During the six months ended December 31, 2023, the Board of Directors of the Corporation approved the continuation of the investment advisory agreement with the Adviser for the Fund on the basis of the recommendation by the directors (the Independent Board Members) who are not interested persons of the Fund. The following paragraphs summarize the material information and factors considered by the Independent Board Members as well as their conclusions relative to such factors.
Nature, Extent, and Quality of Services. The Independent Board Members considered information regarding the portfolio managers, the depth of the analyst pool available to the Adviser and the Fund’s portfolio managers, the scope of supervisory, administrative, shareholder, and other services supervised or provided by the Adviser and the absence of significant service problems reported to the Board. The Independent Board Members noted the experience, length of service and reputation of the Fund’s portfolio managers.
Investment Performance. The Independent Board Members reviewed the short, medium, and long term performance of the Fund (as of September 30, 2023) against a peer group of nine other comparable funds prepared by the Adviser (the Adviser Peer Group), and against a peer group prepared by Broadridge (the Broadridge Performance Peer Group) consisting of all retail and institutional global equity income funds, regardless of asset size or primary channel of distribution. The Independent Board Members noted that the Fund’s performance was in the third quartile for the one year period and in the fourth quartile for the three, five, and ten year periods, as measured against the Adviser Peer Group. Against the Broadridge Performance Peer Group, the Independent Board Members noted that the Fund’s performance was in the fifth quintile for the five and ten year periods, and in the third quintile for the one and three year periods. The Independent Board Members recalled the Adviser’s comprehensive discussion of performance earlier in the Meeting.
Profitability. The Independent Board Members reviewed summary data regarding the profitability of the Fund to the Adviser both with a pro rata administrative overhead charge and with a standalone administrative charge and noted the effect of the expense limitation agreement. The Independent Board Members also noted that a portion of the Fund’s portfolio transactions were executed by an affiliated broker of the Adviser and that another affiliated broker of the Adviser received distribution fees and minor amounts of sales commissions.
Economies of Scale. The Independent Board Members discussed the major elements of the Adviser’s cost structure and the relationship of those elements to potential economies of scale and reviewed data provided by the Adviser.
Sharing of Economies of Scale. The Independent Board Members noted that the investment management fee schedule for the Fund does not take into account any potential economies of scale that may develop.
Service and Cost Comparisons. The Independent Board Members compared the expense ratios of the investment management fee, other expenses, and total expenses of the Fund with similar expense ratios of the Adviser Peer Group and a peer group of six other global equity income funds selected by Broadridge (the Broadridge Expense Peer Group), and noted that the Adviser’s management fee includes substantially all administrative services of the Fund as well as investment advisory services. The Board Members noted that the Fund’s total expense ratio was one of the lowest for the Adviser Peer Group and the lowest for the Broadridge Expense Peer Group and that the Fund’s size was significantly lower than the average of the Adviser Peer Group, and lower than the average of the Broadridge Expense Peer Group. The Independent Board Members also noted that the advisory fee structure was the same as that in effect for most of the Gabelli funds and noted
The Gabelli Global Rising Income and Dividend Fund
Board Consideration and Re-Approval of Investment Advisory Agreement (Unaudited) (Continued)
the effect of the expense limitation agreement in place for the Fund. The Independent Board Members were presented with, but did not consider to be material to their decision, various information comparing the advisory fee to the fee for other types of accounts managed by the Adviser.
Conclusions. The Independent Board Members concluded that the Fund enjoyed highly experienced portfolio management services and good ancillary services. The Independent Board Members noted the reasons for the Fund’s historical underperformance and certain improved performance metrics. The Independent Board Members also concluded that the Fund’s expense ratios and profitability to the Adviser were reasonable, and that economies of scale were not a significant factor in their thinking at this time. In this regard, the Independent Board Members noted the contractual Expense Deferral Agreement between the Adviser and the Corporation, on behalf of each Fund, pursuant to which the net expense ratio for each share class of each Fund was reduced to 0.90%. The Independent Board Members did not view the potential profitability of ancillary services as material to their decision. On the basis of the foregoing and without assigning particular weight to any single conclusion, the Independent Board Members determined to recommend continuation of the investment management agreement to the full Board.
Based on a consideration of all these factors in their totality, the Board Members, including all of the Independent Board Members, determined that the Fund’s advisory fee was appropriate in light of the quality of services provided and in light of the other factors described above that the Board deemed relevant. Accordingly, the Board Members determined to approve the continuation of the Fund’s Advisory Agreement. The Board Members based their decision on evaluations of all these factors as a whole and did not consider any one factor as all important or controlling.
The Gabelli Global Rising Income and Dividend Fund
Additional Fund Information (Unaudited)
The business and affairs of the Fund are managed under the direction of the Fund’s Board of Directors. Information pertaining to the Directors and Officers of the Fund is set forth below. The Corporation’s Statement of Additional Information includes additional information about the Fund’s Directors and is available without charge, upon request, by calling 800-GABELLI (800-422-3554) or by writing to The Gabelli Global Rising Income and Dividend Fund at One Corporate Center, Rye, NY 10580-1422.
Name, Position(s)
Address1
and Year of Birth | | Term of Office
and Length of
Time Served2 | | Number of
Funds
in Fund
Complex
Overseen by
Director | | Principal Occupation(s)
During Past Five Years | | Other Directorships
Held by Director3 |
| | | | | | | | | |
| INTERESTED DIRECTORS4: | | | | | | | | |
| | | | | | | | | |
Mario J. Gabelli, CFA
Director and Chief
Investment Officer
1942 | | Since 1993 | | 31 | | Chairman, Co-Chief Executive Officer, and Chief Investment Officer– Value Portfolios of GAMCO Investors, Inc. and Chief Investment Officer – Value Portfolios of Gabelli Funds, LLC and GAMCO Asset Management, Inc.; Director/Trustee or Chief Investment Officer of other registered investment companies within the Gabelli Fund Complex; Chief Executive Officer of GGCP, Inc.; Executive Chair of Associated Capital Group, Inc. | | Director of Morgan Group Holding Co. (holding company) (2001-2019); Chairman of the Board and Chief Executive Officer of LICT Corp. (multimedia and communication services company); Director of CIBL, Inc. (broadcasting and wireless communications); Director of ICTC Group Inc. (communications) (2013-2018) |
| | | | | | | | | |
John D. Gabelli
Director
1944 | | Since 1993 | | 12 | | Former Senior Vice President of G.research, LLC (and its predecessor) (1991-2019) | | — |
| | | | | | | | | |
| INDEPENDENT DIRECTORS5: | | | | | | | | |
| | | | | | | | | |
E. Val Cerutti
Director
1939 | | Since 2001
| | 7
| | Chief Executive Officer of Cerutti Consultants, Inc. | | Director of The LGL Group, Inc. (diversified manufacturing) (1990-2009) |
| | | | | | | | | |
Anthony J. Colavita6
Director
1935 | | Since 1993 | | 18 | | President of the law firm of Anthony J. Colavita, P.C. | | — |
| | | | | | | | | |
Werner J. Roeder
Director
1940 | | Since 1993 | | 20 | | Retired physician; Former Vice President of Medical Affairs (Medical Director) of New York Presbyterian/Lawrence Hospital (1999-2014) | | — |
| | | | | | | | | |
Anthonie C. van Ekris6
Director
1934 | | Since 1993 | | 23 | | Chairman and Chief Executive Officer of BALMAC International, Inc. (global import/ export company) | | — |
The Gabelli Global Rising Income and Dividend Fund
Additional Fund Information (Unaudited) (Continued)
Name, Position(s)
Address1
and Year of Birth | | Term of Office
and Length of
Time Served2 | | Number of
Funds
in Fund
Complex
Overseen by
Director | | Principal Occupation(s)
During Past Five Years | | Other Directorships
Held by Director3 |
| | | | | | | | | |
Salvatore J. Zizza7 Director 1945 | | Since 2004 | | 35 | | President, Zizza & Associates Corp. (private holding company); Chairman of Bergen Cove Realty Inc. (residential real estate) | | Director and Chairman of Trans-Lux Corporation (business services); Director and Chairman of Harbor Diversified Inc. (pharmaceuticals) (2009-2018); Retired Chairman of BAM (semiconductor and aerospace manufacturing); Director of Bion Environmental Technologies, Inc. |
The Gabelli Global Rising Income and Dividend Fund
Additional Fund Information (Unaudited) (Continued)
Name, Position(s)
Address1
and Year of Birth | | Term of Office
and Length of
Time Served2 | |
Principal Occupation(s)
During Past Five Years |
| | | | | |
| OFFICERS: | | | | |
| | | | | |
John C. Ball
President, Treasurer,
Principal Financial &
Accounting Officer 1976 | | Since 2017 | | Senior Vice President (since 2018) and other positions (2017 - 2018) of GAMCO Investors, Inc.; Chief Executive Officer, G.distributors, LLC since 2020; Officer of registered investment companies within the Gabelli Fund Complex since 2017 |
| | | | | |
Peter Goldstein
Secretary & Vice
President
1953 | | Since 2020 | | General Counsel, GAMCO Investors, Inc. and Chief Legal Officer, Associated Capital Group, Inc. since 2021; General Counsel and Chief Compliance Officer, Buckingham Capital Management, Inc. (2012-2020); Chief Legal Officer and Chief Compliance Officer, The Buckingham Research Group, Inc. (2012-2020) |
| | | | | |
Richard J. Walz
Chief Compliance
Officer
1959 | | Since 2013 | | Chief Compliance Officer of registered investment companies within the Gabelli Fund Complex since 2013 |
| 1 | Address: One Corporate Center, Rye, NY 10580-1422, unless otherwise noted. |
| 2 | Each Director will hold office for an indefinite term until the earliest of (i) the next meeting of shareholders, if any, called for the purpose of considering the election or re-election of such Director and until the election and qualification of his or her successor, if any, elected at such meeting, or (ii) the date a Director resigns or retires, or a Director is removed by the Board of Directors or shareholders, in accordance with the Corporation’s By-Laws and Articles of Incorporation. For officers, includes time served in prior officer positions with the Fund. Each officer will hold office for an indefinite term until the date he or she resigns or retires or until his or her successor is elected and qualified. |
| 3 | This column includes only directorships of companies required to report to the SEC under the Securities Exchange Act of 1934, as amended, i.e., public companies, or other investment companies registered under the 1940 Act. |
| 4 | “Interested person” of the Corporation as defined in the 1940 Act. Messrs. Gabelli are each considered an “interested person” because of their affiliation with Gabelli Funds, LLC which acts as the Corporation’s investment adviser. Mario J. Gabelli and John D. Gabelli are brothers. |
| 5 | Directors who are not interested persons are considered “Independent” Directors. |
| 6 | Mr. Colavita’s son, Anthony S. Colavita, serves as a director of other funds in the Gabelli Fund Complex. Mr. van Ekris is an independent director of Gabelli International Ltd., Gabelli Fund, LDC, GAMA Capital Opportunities Master, Ltd., and GAMCO International SICAV, which may be deemed to be controlled by Mario J. Gabelli and/or affiliates and in that event would be deemed to be under common control with the Fund’s Adviser. |
| 7 | Mr. Zizza is an independent director of Gabelli International Ltd., which may be deemed to be controlled by Mario J. Gabelli and/or affiliates and in that event would be deemed to be under common control with the Fund’s Adviser. On September 9, 2015, Mr. Zizza entered into a settlement with the SEC to resolve an inquiry relating to an alleged violation regarding the making of false statements or omissions to the accountants of a company concerning a related party transaction. The company in question is not an affiliate of, nor has any connection to, the Fund. Under the terms of the settlement, Mr. Zizza, without admitting or denying the SEC’s findings and allegation, paid $150,000 and agreed to cease and desist committing or causing any future violations of Rule 13b2-2 of the Securities Exchange Act of 1934, as amended. The Board has discussed this matter and has determined that it does not disqualify Mr. Zizza from serving as an Independent Director. |
Gabelli Funds and Your Personal Privacy
Who are we?
The Gabelli Funds are investment companies registered with the Securities and Exchange Commission under the Investment Company Act of 1940. We are managed by Gabelli Funds, LLC, which is affiliated with GAMCO Investors, Inc., a publicly held company with subsidiaries and affiliates that provide investment advisory services for a variety of clients.
What kind of non-public information do we collect about you if you become a fund shareholder?
If you apply to open an account directly with us, you will be giving us some non-public information about yourself. The non-public information we collect about you is:
| ● | Information you give us on your application form. This could include your name, address, telephone number, social security number, bank account number, and other information. |
| ● | Information about your transactions with us, any transactions with our affiliates, and transactions with the entities we hire to provide services to you. This would include information about the shares that you buy or redeem. If we hire someone else to provide services — like a transfer agent — we will also have information about the transactions that you conduct through them. |
What information do we disclose and to whom do we disclose it?
We do not disclose any non-public personal information about our customers or former customers to anyone other than our affiliates, our service providers who need to know such information, and as otherwise permitted by law. If you want to find out what the law permits, you can read the privacy rules adopted by the Securities and Exchange Commission. They are in volume 17 of the Code of Federal Regulations, Part 248. The Commission often posts information about its regulations on its website, www. sec.gov.
What do we do to protect your personal information?
We restrict access to non-public personal information about you to the people who need to know that information in order to provide services to you or the fund and to ensure that we are complying with the laws governing the securities business. We maintain physical, electronic, and procedural safeguards to keep your personal information.
This page was intentionally left blank.
This page was intentionally left blank.
The Gabelli Global Rising Income and Dividend Fund
2023 TAX NOTICE TO SHAREHOLDERS (Unaudited)
During the year ended December 31, 2023, the Fund paid to shareholders ordinary income distributions of $0.57094, $0.57094, $0.56987, and $0.57094 per share for Class AAA, Class A, Class C, and Class I Shares, respectively, return of capital distributions of $0.09838, $0.09857, $0.08453, and $0.09869 per share for Class AAA, Class A, Class C, and Class I Shares, respectively, and long term capital gains of $96,091, or the maximum allowable. The distribution of long term capital gains has been designated as a capital gain dividend by the Fund’s Board of Directors. For the year ended December 31, 2023, 39.78% of the ordinary income distribution qualifies for the dividends received deduction available to corporations. The Fund designates 100% of the ordinary income distribution as qualified dividend income pursuant to the Jobs and Growth Tax Relief Reconciliation Act of 2003. The Fund designates 21.07% of the ordinary income distribution as qualified interest income pursuant to the Tax Relief, Unemployment Reauthorization, and Job Creation Act of 2010. Also during 2023, the Fund passed through foreign tax credits of $0.03261 per share to each Class of Shares.
U.S. Government Income:
The percentage of the ordinary income distribution paid by the Fund during the year ended December 31, 2023 which was derived from U.S. Treasury securities was 19.92%. Such income is exempt from state and local tax in all states. However, many states, including New York and California, allow a tax exemption for a portion of the income earned only if a mutual fund has invested at least 50% of its assets at the end of each quarter of the Fund’s fiscal year in U.S. Government securities. The Fund did not meet this strict requirement in 2023. The percentage of U.S. Government securities held as of December 31, 2023 was 1.73%. Due to the diversity in state and local tax law, it is recommended that you consult your personal tax adviser as to the applicability of the information provided to your specific situation.
All designations are based on financial information available as of the date of this annual report and, accordingly, are subject to change. For each item, it is the intention of the Fund to designate the maximum amount permitted under the Internal Revenue Code and the regulations thereunder.
THE GABELLI GLOBAL RISING INCOME AND DIVIDEND FUND
One Corporate Center
Rye, NY 10580-1422
Portfolio Manager Biography
Mario J. Gabelli, CFA, is Chairman, Chief Executive Officer, and Chief Investment Officer - Value Portfolios of GAMCO Investors, Inc. that he founded in 1977, and Chief Investment Officer - Value Portfolios of Gabelli Funds, LLC and GAMCO Asset Management, Inc. He is also Executive Chairman of Associated Capital Group, Inc. Mr. Gabelli is a summa cum laude graduate of Fordham University and holds an MBA degree from Columbia Business School and Honorary Doctorates from Fordham University and Roger Williams University.
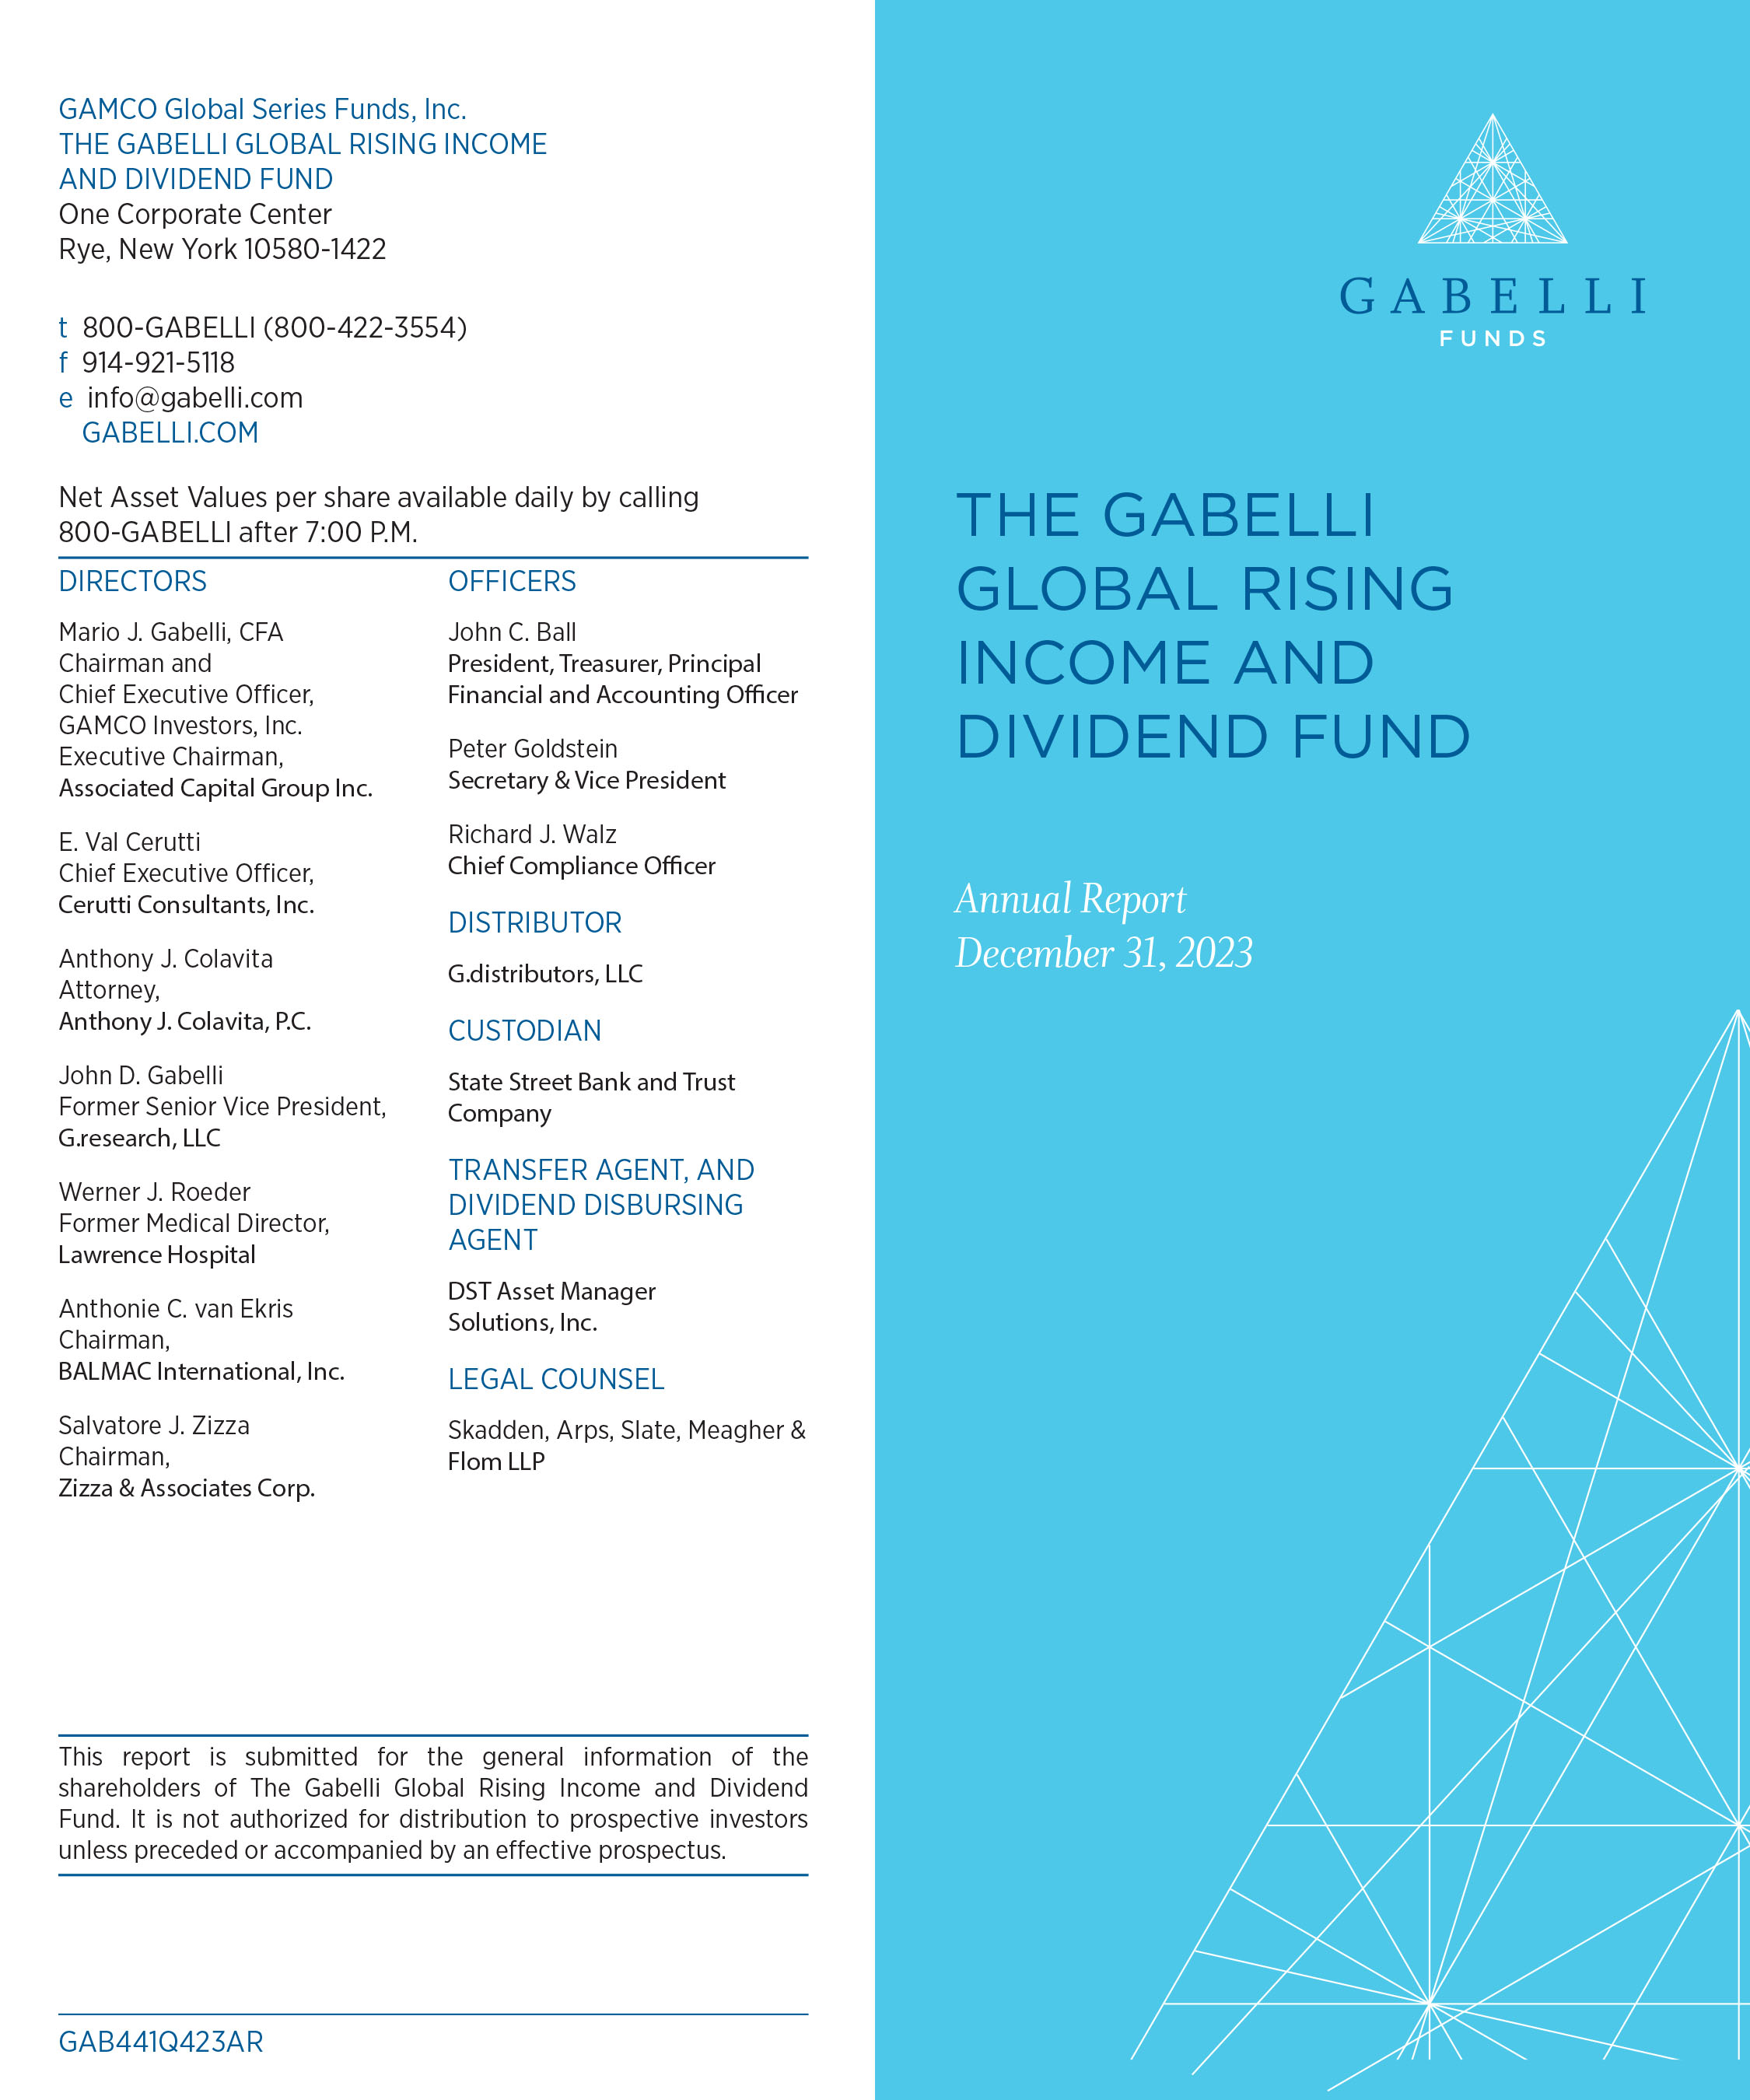
The Gabelli International Small Cap Fund
Annual Report — December 31, 2023
(Y)our Portfolio Management Team
| |  | |  | |  | |
| | Caesar M. P. Bryan
Portfolio Manager | | Gustavo Pifano
Portfolio Manager | | Ashish Sinha
Portfolio Manager | |
To Our Shareholders,
For the year ended December 31, 2023, the net asset value (NAV) total return per Class AAA Share of The Gabelli International Small Cap Fund was 6.3% compared with a total return of 13.2% for the Morgan Stanley Capital International (MSCI) Europe, Australasia and Far East (EAFE) Small Cap Index. Other classes of shares are available. See page 4 for performance information for all classes.
Enclosed are the financial statements, including the schedule of investments, as of December 31, 2023.
Investment Objective and Strategy (Unaudited)
The Fund’s objective is to provide investors with appreciation of capital. Current income is a secondary objective of the Fund.
The Fund’s investment strategy is to invest primarily in a portfolio of common stocks of non-U.S. companies. Under normal market conditions, the Fund will invest at least 80% of its net assets in the stocks of “small cap companies.” Gabelli Funds, LLC, the Adviser, currently characterizes small capitalization companies as those with total common stock market values of $3 billion or less at the time of investment.
The Fund may invest in non-U.S. markets throughout the world, including emerging markets. Ordinarily, the Fund will invest in the securities of at least five countries outside the U.S.
| As permitted by regulations adopted by the Securities and Exchange Commission, paper copies of the Fund’s annual and semiannual shareholder reports will no longer be sent by mail, unless you specifically request paper copies of the reports. Instead, the reports will be made available on the Fund’s website (www.gabelli.com), and you will be notified by mail each time a report is posted and provided with a website link to access the report. If you already elected to receive shareholder reports electronically, you will not be affected by this change and you need not take any action. To elect to receive all future reports on paper free of charge, please contact your financial intermediary, or, if you invest directly with the Fund, you may call 800-422-3554 or send an email request to info@gabelli.com. |
In selecting investments, the Adviser seeks issuers with a dominant market share or niche franchise in growing and/or consolidating industries. The Adviser considers for purchase the stocks of small capitalization companies with experienced management, strong balance sheets, and rising free cash flow and earnings. The Adviser’s goal is to invest long term in the stocks of companies trading at reasonable market valuations relative to perceived economic worth.
Performance Discussion (Unaudited)
Global equity markets posted solid gains during the first quarter of 2023. Developed international markets gained 7.3% adding to a strong fourth quarter further recovering from a poor 2022. Investors reacted positively to lower long term interest rates and the reopening of the Chinese economy. Sentiment was further buoyed by lower energy prices. For example, the price of Brent crude oil declined by $6 per barrel to end the quarter at about $80 per barrel. This is particularly important for Japan and the major European economies that are large oil importers. Lower energy prices and sluggish economic growth raised investor confidence that inflation had peaked and was headed lower. Investor belief that central banks will be less aggressive was reflected in sharply lower long term interest rates. This is illustrated by the German ten year government bond which ended March at 2.3% down by 28 basis points for the quarter.
For the second quarter, equity returns were dominated by the powerful performance of a limited number of very large capitalization U.S. based technology companies. To illustrate this point, while the MSCI EAFE index of overseas developed markets appreciated by 1.9% the NASDAQ 100 index, which includes the few strong performing large technology companies, rose by 15.2% and by 38.8% for the year to date. Within international equity markets, Europe, in aggregate, rallied by 1.3% while the Japanese market posted a solid gain of 6.3%. Smaller capitalization stocks overseas have continued to underperform larger companies. As an example, in Japan the Nikkei 225 index appreciated by 18.4% in yen terms while the Topix Small Company index only rose by 8.2%. This current underperformance of smaller companies likely reflects investor concerns about global growth.
Most global equity markets declined during the third quarter of 2023 largely in reaction to rising interest rates. Developed international markets, as measured by the EAFE Index, fell by 4.7% with Japan declining by 2.4% and Europe by 5.4%. For comparison, the S&P index and Emerging Markets lost 3.6% and 3.7% respectively. The leading global central banks led by the Federal Reserve (Fed) and with the exception of the Bank of Japan continued to focus their attention on reducing inflation by raising short term interest rates and threatening to keep raising rates until inflation is tamed. This has led to further losses in longer dated government bonds. For example, the ten year U.S. Treasury ended September yielding 4.57% up 73 basis points for the quarter. Similarly, the German ten year government bond yield rose 45 basis points and ended the quarter with a yield of 2.84%.
After a weak three months to the end of October, global equity markets responded positively to indications that the Fed had finished raising interest rates. Bonds rallied and equities raced ahead with the MSCI world index gaining over 15% from the end of October to year end. For the fourth quarter of 2023 the MSCI EAFE index appreciated by 10.1% with Europe and Japan rising by 10.7% and 8.0% respectively. Among the larger equity markets only China declined (by 4.4%) while the standouts were Sweden and the Netherlands which added about 20% for the quarter. Helping returns from international markets was the weakness in the dollar. For example, the euro rallied from 1.06 to the dollar to 1.10 by year end and the yen clawed back some of its recent losses during the quarter to end the year at 141 to the dollar having hit a multi year low over 150 earlier in the year.
Selected holdings that contributed positively to performance in 2023 were: Hotel Chocolat Group plc (2.6% of net assets as of December 31, 2023), which manufactures and retails chocolates and cocoa related products under the Hotel Chocolat brand name in the United Kingdom, rest of Europe, Saint Lucia, the United States, and Japan; Siegfried Holdings AG (3.6%), which engages in the life sciences business worldwide. The company develops and produces active pharmaceutical ingredients (APIs) and intermediates, as well as finished dosage forms; and Alamos Gold Inc. (3.7%) is a Canadian based intermediate gold producer with diversified production from three operating mines in North America.
Some of our weaker performing holdings during the year were: Entain plc (1.9%) which operates as a sports betting and gaming company. The company provides online betting, casino, poker, and bingo services; Manchester United plc (1.7%), together with its subsidiaries, owns and operates the Manchester United Football Club in the United Kingdom; and Sakata Seed Corp. (1.7%), which produces and sells vegetable and flower seeds, bulbs, plants, and agricultural and horticultural supplies in Japan and internationally.
Thank you for your investment in The Gabelli International Small Cap Fund.
We appreciate your confidence and trust.
| The views expressed reflect the opinions of the Fund’s portfolio managers and Gabelli Funds, LLC, the Adviser, as of the date of this report and are subject to change without notice based on changes in market, economic, or other conditions. These views are not intended to be a forecast of future events and are no guarantee of future results. |
Comparative Results
Average Annual Returns through December 31, 2023 (a) (Unaudited)
Total returns and average annual returns reflect changes in share price, reinvestment of distributions, and are net of expenses.
| | | 1 Year | | | 5 Year | | | 10 Year | | | 15 Year | | | Since
Inception
(5/11/98) | |
| Class AAA (GABOX) | | | 6.32 | % | | | 4.36 | % | | | 2.31 | % | | | 6.39 | % | | | 5.32 | % |
| MSCI EAFE Small Cap Index | | | 13.16 | | | | 6.58 | | | | 4.80 | | | | 9.18 | | | | 7.20 | (b) |
| MSCI AC World Ex-U.S. Index | | | 16.09 | | | | 7.55 | | | | 4.27 | | | | 7.17 | | | | 5.00 | |
| Lipper Global Large-Cap Growth Fund Classification | | | 26.74 | | | | 12.55 | | | | 8.78 | | | | 11.52 | | | | 2.11 | |
| Class A (GOCAX) | | | 6.34 | | | | 4.18 | | | | 2.08 | | | | 6.23 | | | | 5.23 | |
| With sales charge (c) | | | 0.22 | | | | 2.96 | | | | 1.47 | | | | 5.81 | | | | 4.99 | |
| Class C (GGLCX) | | | 6.39 | | | | 4.06 | | | | 1.67 | | | | 5.69 | | | | 4.83 | |
| Class I (GLOIX) | | | 6.41 | | | | 4.37 | | | | 2.57 | | | | 6.66 | | | | 5.49 | |
| (a) | Returns would have been lower had the Adviser not reimbursed certain expenses of the Fund. The Class AAA Share NAVs are used to calculate performance for the periods prior to the issuance of Class A Shares, Class C Shares, and Class I Shares on March 12, 2000, November 23, 2001, and January 11, 2008, respectively. The actual performance of the Class A Shares and Class C Shares would have been lower due to the additional fees and expenses associated with these classes of shares. The actual performance of the Class I Shares would have been higher due to lower expenses related to this class of shares. The Fund imposes a 2% redemption fee on shares sold or exchanged within seven days of purchase. |
| (b) | The MSCI EAFE Small Cap Index captures small cap representation across Developed Markets countries around the world, excluding U.S. and Canada. The MSCI World Ex-U.S. Index captures large and mid cap representation across Developed Markets countries excluding the United States. The Lipper Global Large-Cap Growth Fund Classification reflects the average performance of mutual funds classified in those particular categories. Dividends are considered reinvested. You cannot invest directly in an index. MSCI EAFE Small Cap Index performance as of inception of Index December 31, 1998. |
| (c) | Performance results include the effect of the maximum 5.75% sales charge at the beginning of the period. |
In the current prospectuses dated April 28, 2023, the gross expense ratios for Class AAA, A, and I Shares are 3.64%, 3.64%, and 3.39%, respectively, and the net expense ratios for all share classes after contractual reimbursements by Gabelli Funds, LLC, (the Adviser) is 0.92%. See page 12 for the expense ratios for the year ended December 31, 2023. The contractual reimbursements are in effect through April 30, 2024. Class AAA and Class I Shares do not have a sales charge. The maximum sales charge for Class A Shares is 5.75%.
Investing in foreign securities involves risks not ordinarily associated with investments in domestic issues, including currency fluctuation, economic, and political risks. Investors should carefully consider the investment objectives, risks, charges, and expenses of the Fund before investing. The prospectus contains information about these and other matters and should be read carefully before investing. To obtain a prospectus, please visit our website at www.gabelli.com.
Returns represent past performance and do not guarantee future results. Investment returns and the principal value of an investment will fluctuate. When shares are redeemed, they may be worth more or less than their original cost. Current performance may be lower or higher than the performance data presented. Visit www.gabelli.com for performance information as of the most recent month end.
COMPARISON OF CHANGE IN VALUE OF A $10,000 INVESTMENT IN
THE GABELLI INTERNATIONAL SMALL CAP FUND (CLASS AAA SHARES) AND MSCI EAFE SMALL
CAP INDEX (Unaudited)
| Average Annual Total Returns* |
| | 1 Year | 5 Year | 10 Year |
| Class AAA | 6.32% | 4.36% | 2.31% |
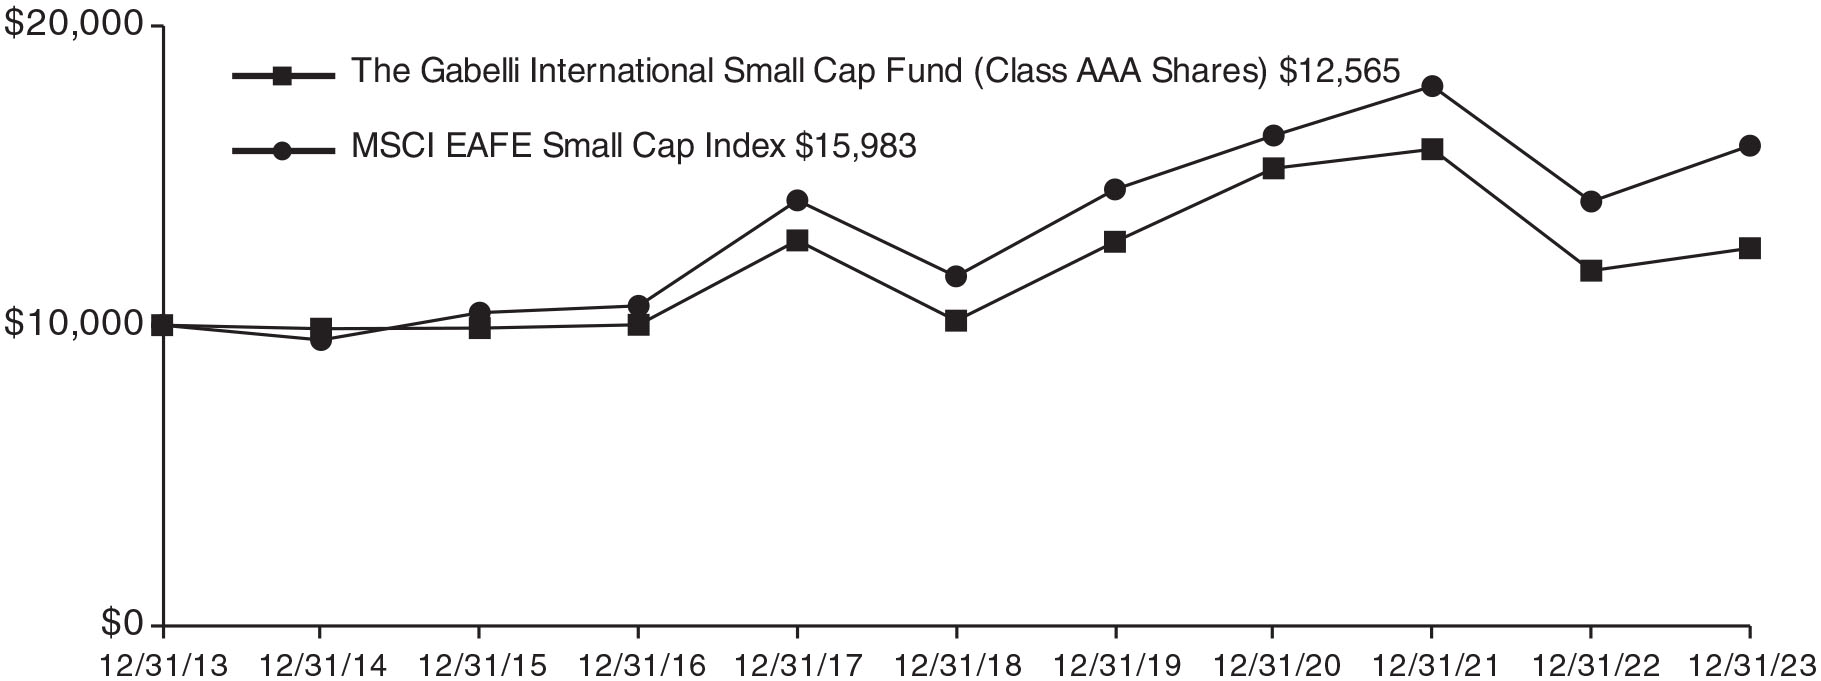
* Past performance is not predictive of future results. The performance tables and graph do not reflect the deduction of taxes that a shareholder would pay on Fund distributions or the redemption of Fund shares.
The Gabelli International Small Cap Fund
Disclosure of Fund Expenses (Unaudited)
| For the Six Month Period from July 1, 2023 through December 31, 2023 | Expense Table |
We believe it is important for you to understand the impact of fees and expenses regarding your investment. All mutual funds have operating expenses. As a shareholder of a fund, you incur ongoing costs, which include costs for portfolio management, administrative services, and shareholder reports (like this one), among others. Operating expenses, which are deducted from a fund’s gross income, directly reduce the investment return of a fund. When a fund’s expenses are expressed as a percentage of its average net assets, this figure is known as the expense ratio. The following examples are intended to help you understand the ongoing costs (in dollars) of investing in your Fund and to compare these costs with those of other mutual funds. The examples are based on an investment of $1,000 made at the beginning of the period shown and held for the entire period.
The Expense Table below illustrates your Fund’s costs in two ways:
Actual Fund Return: This section provides information about actual account values and actual expenses. You may use this section to help you to estimate the actual expenses that you paid over the period after any fee waivers and expense reimbursements. The “Ending Account Value” shown is derived from the Fund’s actual return during the past six months, and the “Expenses Paid During Period” shows the dollar amount that would have been paid by an investor who started with $1,000 in the Fund. You may use this information, together with the amount you invested, to estimate the expenses that you paid over the period.
To do so, simply divide your account value by $1,000 (for example, an $8,600 account value divided by $1,000 = 8.6), then multiply the result by the number given for your Fund under the heading “Expenses Paid During Period” to estimate the expenses you paid during this period.
Hypothetical 5% Return: This section provides information about hypothetical account values and hypothetical expenses based on the Fund’s actual expense ratio. It assumes a hypothetical annualized return of 5% before expenses during the period shown. In this case – because the hypothetical return used is not the Fund’s actual return – the results do not apply to your investment and you cannot use the hypothetical account value and expense to estimate the actual ending account balance or expenses you
paid for the period. This example is useful in making comparisons of the ongoing costs of investing in the Fund and other funds. To do so, compare this 5% hypothetical example with the 5% hypothetical examples that appear in shareholder reports of other funds.
Please note that the expenses shown in the table are meant to highlight your ongoing costs only and do not reflect any transactional costs such as sales charges (loads), redemption fees, or exchange fees, if any, which are described in the Prospectus. If these costs were applied to your account, your costs would be higher. Therefore, the 5% hypothetical return is useful in comparing ongoing costs only, and will not help you determine the relative total costs of owning different funds. The “Annualized Expense Ratio” represents the actual expenses for the last six months and may be different from the expense ratio in the Financial Highlights which is for the year ended December 31, 2023.
| | | Beginning
Account Value
07/01/23 | | | Ending
Account Value
12/31/23 | | | Annualized
Expense
Ratio | | | Expenses
Paid During
Period * | |
| The Gabelli International Small Cap Fund |
| Actual Fund Return | | | | | | | | | | | | | | | |
| Class AAA | | $ | 1,000.00 | | | $ | 997.50 | | | 0.92% | | | $ | 4.63 | |
| Class A | | $ | 1,000.00 | | | $ | 997.50 | | | 0.92% | | | $ | 4.63 | |
| Class C | | $ | 1,000.00 | | | $ | 998.10 | | | 0.92% | | | $ | 4.63 | |
| Class I | | $ | 1,000.00 | | | $ | 998.30 | | | 0.92% | | | $ | 4.63 | |
| Hypothetical 5% Return | | | | | | | | | | | | | | | |
| Class AAA | | $ | 1,000.00 | | | $ | 1,020.57 | | | 0.92% | | | $ | 4.69 | |
| Class A | | $ | 1,000.00 | | | $ | 1,020.57 | | | 0.92% | | | $ | 4.69 | |
| Class C | | $ | 1,000.00 | | | $ | 1,020.57 | | | 0.92% | | | $ | 4.69 | |
| Class I | | $ | 1,000.00 | | | $ | 1,020.57 | | | 0.92% | | | $ | 4.69 | |
| * | Expenses are equal to the Fund’s annualized expense ratio for the last six months multiplied by the average account value over the period, multiplied by the number of days in the most recent fiscal half year (184 days), then divided by 365. |
Summary of Portfolio Holdings (Unaudited)
The following tables present portfolio holdings as a percent of net assets as of December 31, 2023:
The Gabelli International Small Cap Fund
| Consumer Staples | | | 19.4 | % |
| Health Care | | | 18.5 | % |
| Materials | | | 18.0 | % |
| Industrials | | | 13.2 | % |
| Consumer Discretionary | | | 12.5 | % |
| Information Technology | | | 10.9 | % |
| Financials | | | 4.8 | % |
| U.S. Government Obligations | | | 2.7 | % |
| Communication Services | | | 1.7 | % |
| Other Assets and Liabilities (Net) | | | (1.7 | )% |
| | | | 100.0 | % |
The Fund files a complete schedule of portfolio holdings with the Securities and Exchange Commission (the SEC) for the first and third quarters of each fiscal year on Form N-PORT. Shareholders may obtain this information at www.gabelli.com or by calling the Fund at 800-GABELLI (800-422-3554). The Fund’s Form N-PORT is available on the SEC’s website at www.sec.gov and may also be reviewed and copied at the SEC’s Public Reference Room in Washington, DC. Information on the operation of the Public Reference Room may be obtained by calling 800-SEC-0330.
Proxy Voting
The Fund files Form N-PX with its complete proxy voting record for the twelve months ended June 30, no later than August 31 of each year. A description of the Fund’s proxy voting policies, procedures, and how each Fund voted proxies relating to portfolio securities is available without charge, upon request, by (i) calling 800-GABELLI (800-422-3554); (ii) writing to The Gabelli Funds at One Corporate Center, Rye, NY 10580-1422; or (iii) visiting the SEC’s website at www.sec.gov.
The Gabelli International Small Cap Fund
Schedule of Investments — December 31, 2023
| | | | | | | | | Market | |
| Shares | | | | | Cost | | | Value | |
| | | | | COMMON STOCKS — 97.4% | | | | | | | | |
| | | | | CONSUMER STAPLES — 19.4% | | | | | | | | |
| | 15,000 | | | Austevoll Seafood ASA | | $ | 129,584 | | | $ | 109,475 | |
| | 5,500 | | | Fevertree Drinks plc | | | 138,747 | | | | 73,541 | |
| | 9,000 | | | Glanbia plc | | | 94,557 | | | | 148,139 | |
| | 35,000 | | | Hotel Chocolat Group plc† | | | 114,665 | | | | 165,067 | |
| | 3,300 | | | Interparfums SA | | | 106,001 | | | | 183,609 | |
| | 1,600 | | | Laurent-Perrier | | | 144,622 | | | | 213,725 | |
| | 2,500 | | | Milbon Co. Ltd. | | | 101,252 | | | | 65,497 | |
| | 32,000 | | | PZ Cussons plc | | | 121,541 | | | | 62,488 | |
| | 4,000 | | | Sakata Seed Corp. | | | 118,342 | | | | 111,064 | |
| | 2,000 | | | Viscofan SA | | | 121,711 | | | | 118,343 | |
| | | | | | | | 1,191,022 | | | | 1,250,948 | |
| | | | | MATERIALS — 18.0% | | | | | | | | |
| | 4,000 | | | Alamos Gold Inc., Cl. A | | | 27,681 | | | | 53,880 | |
| | 13,850 | | | Alamos Gold Inc., Toronto, Cl. A | | | 102,362 | | | | 186,262 | |
| | 8,000 | | | Eldorado Gold Corp.† | | | 86,947 | | | | 103,760 | |
| | 9,544 | | | Endeavour Mining plc | | | 133,761 | | | | 214,426 | |
| | 5,000 | | | Labrador Iron Ore Royalty Corp. | | | 90,519 | | | | 120,373 | |
| | 4,000 | | | MAG Silver Corp.† | | | 51,468 | | | | 41,629 | |
| | 9,000 | | | Osisko Gold Royalties Ltd. | | | 108,792 | | | | 128,441 | |
| | 75,000 | | | Perseus Mining Ltd. | | | 76,499 | | | | 94,551 | |
| | 15,000 | | | Treatt plc | | | 96,439 | | | | 96,172 | |
| | 80,000 | | | Westgold Resources Ltd.† | | | 132,212 | | | | 118,845 | |
| | | | | | | | 906,680 | | | | 1,158,339 | |
| | | | | HEALTH CARE — 16.9% | | | | | | | | |
| | 12,212 | | | AddLife AB, Cl. B | | | 59,108 | | | | 132,459 | |
| | 1,300 | | | Bachem Holding AG | | | 36,865 | | | | 100,470 | |
| | 1,800 | | | Gerresheimer AG | | | 177,000 | | | | 187,484 | |
| | 7,000 | | | Mani Inc. | | | 88,794 | | | | 105,943 | |
| | 230 | | | Siegfried Holding AG | | | 76,087 | | | | 235,045 | |
| | 230 | | | Tecan Group AG | | | 122,569 | | | | 93,909 | |
| | 15,000 | | | Tristel plc | | | 71,265 | | | | 87,951 | |
| | 1,300 | | | Vetoquinol SA | | | 81,468 | | | | 146,958 | |
| | | | | | | | 713,156 | | | | 1,090,219 | |
| | | | | INDUSTRIALS — 13.2% | | | | | | | | |
| | 15,000 | | | Aida Engineering Ltd. | | | 152,919 | | | | 87,766 | |
| | 8,000 | | | AZ-COM MARUWA Holdings Inc. | | | 122,710 | | | | 86,752 | |
| | 50,000 | | | Chemring Group plc | | | 137,397 | | | | 223,382 | |
| | 2,000 | | | Clarkson plc | | | 78,000 | | | | 80,685 | |
| | 4,000 | | | Daiei Kankyo Co. Ltd. | | | 62,437 | | | | 70,723 | |
| | 4,000 | | | Iveco Group NV† | | | 42,339 | | | | 35,971 | |
| | 8,000 | | | JGC Holdings Corp. | | | 101,054 | | | | 92,341 | |
| | 4,000 | | | Loomis AB | | | 148,615 | | | | 106,127 | |
| | 20,000 | | | QleanAir AB† | | | 115,538 | | | | 64,941 | |
| | | | | | | | 961,009 | | | | 848,688 | |
| | | | | | | | | Market | |
| Shares | | | | | Cost | | | Value | |
| | | | | CONSUMER DISCRETIONARY — 12.5% | | | | | | | | |
| | 10,000 | | | Beneteau SACA | | $ | 168,177 | | | $ | 137,773 | |
| | 9,820 | | | Entain plc | | | 81,636 | | | | 124,445 | |
| | 24,000 | | | Genius Sports Ltd.† | | | 239,319 | | | | 148,320 | |
| | 2,200 | | | JINS Holdings Inc. | | | 125,148 | | | | 73,333 | |
| | 75,000 | | | Mandarin Oriental International Ltd. | | | 149,583 | | | | 117,000 | |
| | 6,000 | | | Raccoon Holdings Inc. | | | 131,510 | | | | 27,617 | |
| | 2,300 | | | Tokyotokeiba Co. Ltd. | | | 67,831 | | | | 72,344 | |
| | 10,000 | | | Zojirushi Corp. | | | 93,734 | | | | 105,745 | |
| | | | | | | | 1,056,938 | | | | 806,577 | |
| | | | | INFORMATION TECHNOLOGY — 10.9% | | | | | | | | |
| | 4,000 | | | A&D HOLON Holdings Co. Ltd. | | | 53,479 | | | | 51,120 | |
| | 7,500 | | | GMO internet group Inc. | | | 198,867 | | | | 136,330 | |
| | 20,000 | | | NCC Group plc | | | 57,230 | | | | 32,835 | |
| | 3,000 | | | Nynomic AG† | | | 78,031 | | | | 105,317 | |
| | 6,000 | | | Optex Group Co. Ltd. | | | 98,632 | | | | 76,000 | |
| | 100,000 | | | Oxford Metrics plc | | | 116,940 | | | | 136,387 | |
| | 6,000 | | | PSI Software SE | | | 157,350 | | | | 167,580 | |
| | | | | | | | 760,529 | | | | 705,569 | |
| | | | | FINANCIALS — 4.8% | | | | | | | | |
| | 17,000 | | | Polar Capital Holdings plc | | | 129,675 | | | | 100,978 | |
| | 20,000 | | | Tamburi Investment Partners SpA | | | 139,176 | | | | 205,334 | |
| | | | | | | | 268,851 | | | | 306,312 | |
| | | | | COMMUNICATION SERVICES — 1.7% | | | | | | | | |
| | 5,500 | | | Manchester United plc,Cl. A† | | | 100,264 | | | | 112,090 | |
| | | | | | | | | | | | | |
| | | | | TOTAL COMMON STOCKS | | | 5,958,449 | | | | 6,278,742 | |
| | | | | | | | | | | | | |
| | | | | PREFERRED STOCKS — 1.6% | | | | | | | | |
| | | | | HEALTH CARE — 1.6% | | | | | | | | |
| | 1,800 | | | Draegerwerk AG & Co. KGaA, 0.190% | | | 156,593 | | | | 102,932 | |
| Principal | | | | | | | | | |
| Amount | | | | | | | | | |
| | | | | U.S. GOVERNMENT OBLIGATIONS — 2.7% | | | | | | | | |
| $ | 175,000 | | | U.S. Treasury Bill, 5.293%††, 03/28/24 | | | 172,791 | | | | 172,830 | |
| | | | | | | | | | | | | |
| | | | | TOTAL INVESTMENTS — 101.7% | | $ | 6,287,833 | | | | 6,554,504 | |
| | | | | | | | | | | | | |
| | | | | Other Assets and Liabilities (Net) — (1.7)% | | | | | | | (106,827 | ) |
| | | | | | | | | | | | | |
| | | | | NET ASSETS — 100.0% | | | | | | $ | 6,447,677 | |
See accompanying notes to financial statements.
The Gabelli International Small Cap Fund
Schedule of Investments (Continued) — December 31, 2023
| † | Non-income producing security. |
| †† | Represents annualized yield at date of purchase. |
| | | % of | | | | |
| | | Market | | | Market | |
| Geographic Diversification | | Value | | | Value | |
| Europe | | | 64.9 | % | | $ | 4,254,359 | |
| Japan | | | 17.7 | | | | 1,162,575 | |
| Canada | | | 9.8 | | | | 634,344 | |
| Asia/Pacific | | | 5.0 | | | | 330,396 | |
| United States | | | 2.6 | | | | 172,830 | |
| | | 100.0 | % | | $ | 6,554,504 | |
See accompanying notes to financial statements.
The Gabelli International Small Cap Fund
Statement of Assets and Liabilities
December 31, 2023
| Assets: | | | | |
| Investments, at value (cost $6,287,833) | | $ | 6,554,504 | |
| Cash | | | 690 | |
| Receivable for Fund shares sold | | | 115 | |
| Receivable from Adviser | | | 16,338 | |
| Dividends receivable | | | 19,764 | |
| Prepaid expenses | | | 14,876 | |
| Total Assets | | | 6,606,287 | |
| Liabilities: | | | | |
| Payable for Fund shares redeemed | | | 41,191 | |
| Payable for investment advisory fees | | | 5,366 | |
| Payable for distribution fees | | | 848 | |
| Payable for legal and audit fees | | | 15,875 | |
| Other accrued expenses | | | 95,330 | |
| Total Liabilities | | | 158,610 | |
| Net Assets | | | | |
| (applicable to 522,801 shares outstanding) | | $ | 6,447,677 | |
| Net Assets Consist of: | | | | |
| Paid-in capital | | $ | 6,849,479 | |
| Total accumulated loss | | | (401,802 | ) |
| Net Assets | | $ | 6,447,677 | |
| | | | | |
| Shares of Capital Stock, each at $0.001 par value: | | | | |
| Class AAA: | | | | |
| Net Asset Value, offering, and redemption price per share ($4,009,961 ÷ 328,332 shares outstanding; 75,000,000 shares authorized) | | $ | 12.21 | |
| Class A: | | | | |
| Net Asset Value and redemption price per share ($52,020 ÷ 4,270 shares outstanding; 50,000,000 shares authorized) | | $ | 12.18 | |
| Maximum offering price per share (NAV ÷ 0.9425, based on maximum sales charge of 5.75% of the offering price) | | $ | 12.92 | |
| Class C: | | | | |
| Net Asset Value and redemption price per share ($7,618 ÷ 697.86 shares outstanding; 25,000,000 shares authorized) | | $ | 10.92 | |
| Class I: | | | | |
| Net Asset Value, offering, and redemption price per share ($2,378,078 ÷ 189,501 shares outstanding; 25,000,000 shares authorized) | | $ | 12.55 | |
Statement of Operations
For the Year Ended December 31, 2023
| Investment Income: | | | | |
| Dividends (net of foreign withholding taxes of $11,370) | | $ | 113,362 | |
| Interest | | | 12,251 | |
| Total Investment Income | | | 125,613 | |
| Expenses: | | | | |
| Investment advisory fees | | | 65,261 | |
| Distribution fees - Class AAA | | | 10,294 | |
| Distribution fees - Class A | | | 126 | |
| Distribution fees - Class C | | | 74 | |
| Legal and audit fees | | | 47,132 | |
| Administration out-of-pocket fees | | | 41,011 | |
| Registration expenses | | | 35,230 | |
| Shareholder services fees | | | 22,188 | |
| Shareholder communications expenses | | | 11,189 | |
| Interest expense | | | 1,805 | |
| Directors’ fees | | | 1,502 | |
| Miscellaneous expenses | | | 20,724 | |
| Total Expenses | | | 256,536 | |
| Less: | | | | |
| Expense reimbursements (See Note 3) | | | (194,774 | ) |
| Expenses paid indirectly by broker (See Note 6) | | | (1,222 | ) |
| Total Reimbursements and Credits | | | (195,996 | ) |
| Net Expenses | | | 60,540 | |
| Net Investment Income | | | 65,073 | |
| | | | | |
| Net Realized and Unrealized Gain/(Loss) on Investments and Foreign Currency: | | | | |
| Net realized loss on investments | | | (357,346 | ) |
| Net realized loss on foreign currency transactions | | | (734 | ) |
| Net realized loss on investments and foreign currency transactions | | | (358,080 | ) |
| Net change in unrealized appreciation/depreciation: | | | | |
| on investments | | | 716,775 | |
| on foreign currency translations | | | 234 | |
| Net change in unrealized appreciation/depreciation on investments and foreign currency translations | | | 717,009 | |
| Net Realized and Unrealized Gain/(Loss) on Investments and Foreign Currency | | | 358,929 | |
| Net Increase in Net Assets Resulting from Operations | | $ | 424,002 | |
See accompanying notes to financial statements.
The Gabelli International Small Cap Fund
Statement of Changes in Net Assets
| | | Year Ended | | | Year Ended | |
| | | December 31,
2023 | | | December 31,
2022 | |
| Operations: | | | | | | | | |
| Net investment income | | $ | 65,073 | | | $ | 117,675 | |
| Net realized loss on investments, forward foreign exchange contracts, and foreign currency transactions | | | (358,080 | ) | | | (184,400 | ) |
| Net change in unrealized appreciation/depreciation on investments and foreign currency translations | | | 717,009 | | | | (2,651,897 | ) |
| Net Increase/(Decrease) in Net Assets Resulting from Operations | | | 424,002 | | | | (2,718,622 | ) |
| | | | | | | | | |
| Distributions to Shareholders: | | | | | | | | |
| Accumulated earnings | | | | | | | | |
| Class AAA | | | (68,053 | ) | | | (18,913 | ) |
| Class A | | | (881 | ) | | | (219 | ) |
| Class C | | | (144 | ) | | | (36 | ) |
| Class I | | | (39,770 | ) | | | (11,275 | ) |
| Total Distributions to Shareholders | | | (108,848 | ) | | | (30,443 | ) |
| | | | | | | | | |
| Capital Share Transactions: | | | | | | | | |
| Class AAA | | | (397,634 | ) | | | (383,911 | ) |
| Class A | | | 766 | | | | (31,433 | ) |
| Class C | | | 129 | | | | (5,306 | ) |
| Class I | | | (334,878 | ) | | | (653,586 | ) |
| Net Decrease in Net Assets from Capital Share Transactions | | | (731,617 | ) | | | (1,074,236 | ) |
| | | | | | | | | |
| Redemption Fees | | | 99 | | | | 5 | |
| | | | | | | | | |
| Net Decrease in Net Assets | | | (416,364 | ) | | | (3,823,296 | ) |
| | | | | | | | | |
| Net Assets: | | | | | | | | |
| Beginning of year | | | 6,864,041 | | | | 10,687,337 | |
| End of year | | $ | 6,447,677 | | | $ | 6,864,041 | |
See accompanying notes to financial statements.
The Gabelli International Small Cap Fund
Financial Highlights
Selected data for a share of capital stock outstanding throughout each year:
| | | | | | Income (Loss) from Investment Operations | | | Distributions | | | | | | | | | | | | Ratios to Average Net Assets/Supplemental Data | |
| Year Ended December 31 | | Net Asset Value, Beginning of Year | | | Net Investment Income (Loss)(a) | | | Net Realized and Unrealized Gain (Loss) on Investments | | | Total from Investment Operations | | | Net Investment Income | | | Net Realized Gain on Investments | | | Total Distributions | | | Redemption Fees(a)(b) | | | Net Asset Value, End of Year | | | Total Return† | | | Net Assets, End of Year (in 000’s) | | | Net Investment Income (Loss) | | | Operating Expenses Before Reimbursement | | | Operating
Expenses Net of Reimbursement(c)(d) | | | Portfolio Turnover Rate | |
| Class AAA | | | | | | | | | | | | | | |
| 2023 | | $ | 11.68 | | | $ | 0.12 | | | $ | 0.62 | | | $ | 0.74 | | | $ | (0.21 | ) | | $ | — | | | $ | (0.21 | ) | | $ | 0.00 | | | $ | 12.21 | | | | 6.32 | % | | $ | 4,010 | | | | 1.00 | % | | | 4.02 | % | | | 0.93 | %(e) | | | 6 | % |
| 2022 | | | 15.75 | | | | 0.18 | (f) | | | (4.20 | ) | | | (4.02 | ) | | | (0.05 | ) | | | — | | | | (0.05 | ) | | | 0.00 | | | | 11.68 | | | | (25.50 | ) | | | 4,216 | | | | 1.48 | (f) | | | 3.64 | | | | 0.92 | (e)(g) | | | 5 | |
| 2021 | | | 15.44 | | | | 0.13 | (f) | | | 0.51 | | | | 0.64 | | | | (0.33 | ) | | | (0.00 | )(b) | | | (0.33 | ) | | | 0.00 | | | | 15.75 | | | | 4.16 | | | | 6,191 | | | | 0.79 | (f) | | | 2.89 | | | | 0.92 | (g) | | | 15 | |
| 2020 | | | 13.06 | | | | 0.06 | | | | 2.44 | | | | 2.50 | | | | (0.12 | ) | | | — | | | | (0.12 | ) | | | 0.00 | | | | 15.44 | | | | 19.16 | | | | 6,617 | | | | 0.51 | | | | 3.65 | | | | 0.91 | | | | 22 | |
| 2019 | | | 11.09 | | | | 0.19 | (f) | | | 2.68 | | | | 2.87 | | | | (0.22 | ) | | | (0.68 | ) | | | (0.90 | ) | | | 0.00 | | | | 13.06 | | | | 25.94 | | | | 6,366 | | | | 1.50 | (f) | | | 3.41 | | | | 1.00 | | | | 9 | |
| Class A | | | | | | | | | | | | | | | | | | | | | | | | | | | | | | |
| 2023 | | $ | 11.65 | | | $ | 0.12 | | | $ | 0.62 | | | $ | 0.74 | | �� | $ | (0.21 | ) | | $ | — | | | $ | (0.21 | ) | | $ | 0.00 | | | $ | 12.18 | | | | 6.34 | % | | $ | 52 | | | | 1.01 | % | | | 4.02 | % | | | 0.93 | %(e) | | | 6 | % |
| 2022 | | | 15.72 | | | | 0.17 | (f) | | | (4.19 | ) | | | (4.02 | ) | | | (0.05 | ) | | | — | | | | (0.05 | ) | | | 0.00 | | | | 11.65 | | | | (25.55 | ) | | | 49 | | | | 1.40 | (f) | | | 3.64 | | | | 0.92 | (e)(g) | | | 5 | |
| 2021 | | | 15.40 | | | | 0.13 | (f) | | | 0.52 | | | | 0.65 | | | | (0.33 | ) | | | (0.00 | )(b) | | | (0.33 | ) | | | 0.00 | | | | 15.72 | | | | 4.24 | | | | 104 | | | | 0.82 | (f) | | | 2.89 | | | | 0.92 | (g) | | | 15 | |
| 2020 | | | 13.03 | | | | 0.06 | | | | 2.43 | | | | 2.49 | | | | (0.12 | ) | | | — | | | | (0.12 | ) | | | 0.00 | | | | 15.40 | | | | 19.13 | | | | 101 | | | | 0.50 | | | | 3.65 | | | | 0.91 | | | | 22 | |
| 2019 | | | 11.05 | | | | 0.07 | (f) | | | 2.67 | | | | 2.74 | | | | (0.08 | ) | | | (0.68 | ) | | | (0.76 | ) | | | 0.00 | | | | 13.03 | | | | 24.86 | | | | 91 | | | | 0.60 | (f) | | | 3.41 | | | | 1.91 | | | | 9 | |
| Class C | | | | | | | | | | | | | | | | | | | | | | | | | | | | | | |
| 2023 | | $ | 10.46 | | | $ | 0.11 | | | $ | 0.56 | | | $ | 0.67 | | | $ | (0.21 | ) | | $ | — | | | $ | (0.21 | ) | | $ | 0.00 | | | $ | 10.92 | | | | 6.39 | % | | $ | 8 | | | | 1.01 | % | | | 4.77 | % | | | 0.93 | %(e) | | | 6 | % |
| 2022 | | | 14.12 | | | | 0.15 | (f) | | | (3.76 | ) | | | (3.61 | ) | | | (0.05 | ) | | | — | | | | (0.05 | ) | | | — | | | | 10.46 | | | | (25.55 | ) | | | 7 | | | | 1.36 | (f) | | | 4.39 | | | | 0.92 | (e)(g) | | | 5 | |
| 2021 | | | 13.87 | | | | 0.11 | (f) | | | 0.47 | | | | 0.58 | | | | (0.33 | ) | | | (0.00 | )(b) | | | (0.33 | ) | | | 0.00 | | | | 14.12 | | | | 4.20 | | | | 16 | | | | 0.77 | (f) | | | 3.64 | | | | 0.92 | (g) | | | 15 | |
| 2020 | | | 11.74 | | | | 0.05 | | | | 2.20 | | | | 2.25 | | | | (0.12 | ) | | | — | | | | (0.12 | ) | | | 0.00 | | | | 13.87 | | | | 19.19 | | | | 28 | | | | 0.48 | | | | 4.40 | | | | 0.91 | | | | 22 | |
| 2019 | | | 10.02 | | | | (0.01 | )(f) | | | 2.41 | | | | 2.40 | | | | — | | | | (0.68 | ) | | | (0.68 | ) | | | 0.00 | | | | 11.74 | | | | 24.01 | | | | 26 | | | | (0.12 | )(f) | | | 4.16 | | | | 2.61 | | | | 9 | |
| Class I | | | | | | | | | | | | | | | | | | | | | | | | | | | | | | |
| 2023 | | $ | 11.99 | | | $ | 0.12 | | | $ | 0.65 | | | $ | 0.77 | | | $ | (0.21 | ) | | $ | — | | | $ | (0.21 | ) | | $ | 0.00 | | | $ | 12.55 | | | | 6.41 | % | | $ | 2,378 | | | | 0.99 | % | | | 3.77 | % | | | 0.93 | %(e) | | | 6 | % |
| 2022 | | | 16.18 | | | | 0.19 | (f) | | | (4.33 | ) | | | (4.14 | ) | | | (0.05 | ) | | | — | | | | (0.05 | ) | | | 0.00 | | | | 11.99 | | | | (25.57 | ) | | | 2,592 | | | | 1.52 | (f) | | | 3.39 | | | | 0.92 | (e)(g) | | | 5 | |
| 2021 | | | 15.85 | | | | 0.14 | (f) | | | 0.52 | | | | 0.66 | | | | (0.33 | ) | | | (0.00 | )(b) | | | (0.33 | ) | | | 0.00 | | | | 16.18 | | | | 4.18 | | | | 4,376 | | | | 0.87 | (f) | | | 2.64 | | | | 0.92 | (g) | | | 15 | |
| 2020 | | | 13.41 | | | | 0.05 | | | | 2.51 | | | | 2.56 | | | | (0.12 | ) | | | — | | | | (0.12 | ) | | | 0.00 | | | | 15.85 | | | | 19.11 | | | | 4,342 | | | | 0.39 | | | | 3.40 | | | | 0.91 | | | | 22 | |
| 2019 | | | 11.39 | | | | 0.19 | (f) | | | 2.77 | | | | 2.96 | | | | (0.26 | ) | | | (0.68 | ) | | | (0.94 | ) | | | 0.00 | | | | 13.41 | | | | 26.04 | | | | 1,312 | | | | 1.52 | (f) | | | 3.16 | | | | 1.00 | | | | 9 | |
| † | Total return represents aggregate total return of a hypothetical investment at the beginning of the year and sold at the end of the year including reinvestment of distributions and does not reflect the applicable sales charges. |
| (a) | Per share amounts have been calculated using the average shares outstanding method. |
| (b) | Amount represents less than $0.005 per share. |
| (c) | Under an expense reimbursement agreement with the Adviser, the Adviser reimbursed expenses of $251,208, $205,704, $216,306, $210,061, and $184,323 for the years ended December 31, 2023, 2022, 2021, 2020, and 2019, respectively. |
| (d) | The Fund incurred interest expense. If interest expense had not been incurred, the ratio of operating expenses to average net assets would have been 0.90%, 0.91%, and 0.90% for each Class for the years ended December 31, 2023, 2022, and 2020. For the years ended December 31, 2021, and 2019, the effect of interest expense was minimal. |
| (e) | The Fund received credits from a designated broker who agreed to pay certain Fund operating expenses. If such credits had not been received, the ratios of operating expenses to average net assets would have been 0.95% for each Class for the year ended December 31, 2023. For the year ended December 31, 2022, there was no impact to the expense ratios. |
| (f) | Includes income resulting from special dividends. Without these dividends, the per share income/(loss) amounts would have been $0.09, $0.06, and $0.15 (Class AAA), $0.08, $0.06, and $0.04 (Class A), $0.07, $0.05, and $(0.05) (Class C), and $0.10, $0.07, and $0.15 (Class I), and the net investment income/(loss) ratios would have been 0.77%, 0.36%, and 1.19% (Class AAA), 0.69%, 0.39%, and 0.29% (Class A), 0.65%, 0.34%, and (0.43%) (Class C), and 0.81%, 0.44%, and 1.21% (Class I) for the years ended December 31, 2022, 2021, and 2019, respectively. |
| (g) | The Fund incurred tax expense for the years ended December 31, 2022 and 2021. If tax expense had not been incurred, the ratios of operating expenses to average net assets would have been 0.90% for each Class. |
See accompanying notes to financial statements.
The Gabelli International Small Cap Fund
Notes to Financial Statements
1. Organization. The Gabelli International Small Cap Fund (the Fund), a series of the GAMCO Global Series Funds, Inc. (the Corporation), was incorporated on July 16, 1993 in Maryland. Although the Fund is registered as a non-diversified fund, it has operated as a diversified fund for over three years. Therefore, the Investment Company Act of 1940, as amended (the 1940 Act) obliges the Fund to continue to operate as a diversified fund unless the Fund obtains shareholder approval to operate as a non-diversified fund. The Fund is one of five separately managed portfolios (collectively, the Portfolios) of the Corporation. The Fund’s primary objective is capital appreciation. The Fund commenced investment operations on May 11, 1998.
2. Significant Accounting Policies. As an investment company, the Fund follows the investment company accounting and reporting guidance, which is part of U.S. generally accepted accounting principles (GAAP) that may require the use of management estimates and assumptions in the preparation of its financial statements. Actual results could differ from those estimates. The following is a summary of significant accounting policies followed by the Fund in the preparation of its financial statements.
Security Valuation. Portfolio securities listed or traded on a nationally recognized securities exchange or traded in the U.S. over-the-counter market for which market quotations are readily available are valued at the last quoted sale price or a market’s official closing price as of the close of business on the day the securities are being valued. If there were no sales that day, the security is valued at the average of the closing bid and asked prices or, if there were no asked prices quoted on that day, then the security is valued at the closing bid price on that day. If no bid or asked prices are quoted on such day, the security is valued at the most recently available price or, if the Board of Directors (the Board) so determines, by such other method as the Board shall determine in good faith to reflect its fair market value. Portfolio securities traded on more than one national securities exchange or market are valued according to the broadest and most representative market, as determined by Gabelli Funds, LLC (the Adviser).
Portfolio securities primarily traded on a foreign market are generally valued at the preceding closing values of such securities on the relevant market, but may be fair valued pursuant to procedures established by the Board if market conditions change significantly after the close of the foreign market, but prior to the close of business on the day the securities are being valued. Debt obligations for which market quotations are readily available are valued at the average of the latest bid and asked prices. If there were no asked prices quoted on such day, the security is valued using the closing bid price. Such debt obligations are valued through prices provided by a pricing service approved by the Board. Certain securities are valued principally using dealer quotations.
Securities and assets for which market quotations are not readily available are fair valued as determined by the Board. Fair valuation methodologies and procedures may include, but are not limited to: analysis and review of available financial and non-financial information about the company; comparisons with the valuation and changes in valuation of similar securities, including a comparison of foreign securities with the equivalent U.S. dollar value American Depositary Receipt securities at the close of the U.S. exchange; and evaluation of any other information that could be indicative of the value of the security.
The Fund employs a fair value model to adjust prices to reflect events affecting the values of certain portfolio securities which occur between the close of trading on the principal market for such securities (foreign exchanges and over-the-counter markets) at the time when net asset values of the Fund are determined. If the Fund’s valuation committee believes that a particular event would materially affect net asset value, further adjustment is considered. Such securities are classified as Level 2 in the fair value hierarchy presented below.
The Gabelli International Small Cap Fund
Notes to Financial Statements (Continued)
The inputs and valuation techniques used to measure fair value of the Fund’s investments are summarized into three levels as described in the hierarchy below:
| ● | Level 1 — quoted prices in active markets for identical securities; |
| ● | Level 2 — other significant observable inputs (including quoted prices for similar securities, interest rates, prepayment speeds, credit risk, etc.); and |
| ● | Level 3 — significant unobservable inputs (including the Board’s determinations as to the fair value of investments). |
A financial instrument’s level within the fair value hierarchy is based on the lowest level of any input both individually and in the aggregate that is significant to the fair value measurement. The inputs or methodology used for valuing securities are not necessarily an indication of the risk associated with investing in those securities. The summary of the Fund’s investments in securities by inputs used to value the Fund’s investments as of December 31, 2023 is as follows:
| | | Valuation Inputs | | | | |
| | Level 1
Quoted Prices | | | Level 2
Other Significant
Observable Inputs | | | Total Market Value
at 12/31/23 | |
| INVESTMENTS IN SECURITIES: | | | | | | | | | | | | |
| ASSETS (Market Value): | | | | | | | | | | | | |
| Common Stocks (a) | | $ | 6,278,742 | | | | — | | | $ | 6,278,742 | |
| Preferred Stocks (a) | | | 102,932 | | | | — | | | | 102,932 | |
| U.S. Government Obligations | | | — | | | $ | 172,830 | | | | 172,830 | |
| TOTAL INVESTMENTS IN SECURITIES – ASSETS | | $ | 6,381,674 | | | $ | 172,830 | | | $ | 6,554,504 | |
| (a) | Please refer to the Schedule of Investments for the industry classifications of these portfolio holdings. |
The Fund held no Level 3 investments at December 31, 2023 and 2022. The Fund’s policy is to recognize transfers among levels as of the beginning of the reporting period.
Additional Information to Evaluate Qualitative Information.
General. The Fund uses recognized industry pricing services – approved by the Board and unaffiliated with the Adviser – to value most of its securities, and uses broker quotes provided by market makers of securities not valued by these and other recognized pricing sources. Several different pricing feeds are received to value domestic equity securities, international equity securities, preferred equity securities, and fixed income securities. The data within these feeds are ultimately sourced from major stock exchanges and trading systems where these securities trade. The prices supplied by external sources are checked by obtaining quotations or actual transaction prices from market participants. If a price obtained from the pricing source is deemed unreliable, prices will be sought from another pricing service or from a broker/dealer that trades that security or similar securities.
Fair Valuation. Fair valued securities may be common or preferred equities, warrants, options, rights, or fixed income obligations. Where appropriate, Level 3 securities are those for which market quotations are not available, such as securities not traded for several days, or for which current bids are not available, or which are restricted
The Gabelli International Small Cap Fund
Notes to Financial Statements (Continued)
as to transfer. When fair valuing a security, factors to consider include recent prices of comparable securities that are publicly traded, reliable prices of securities not publicly traded, the use of valuation models, current analyst reports, valuing the income or cash flow of the issuer, or cost if the preceding factors do not apply. A significant change in the unobservable inputs could result in a lower or higher value in Level 3 securities. The circumstances of Level 3 securities are frequently monitored to determine if fair valuation measures continue to apply.
The Adviser reports quarterly to the Board the results of the application of fair valuation policies and procedures. These may include backtesting the prices realized in subsequent trades of these fair valued securities to fair values previously recognized.
Foreign Currency Translations. The books and records of the Fund are maintained in U.S. dollars. Foreign currencies, investments, and other assets and liabilities are translated into U.S. dollars at current exchange rates. Purchases and sales of investment securities, income, and expenses are translated at the exchange rate prevailing on the respective dates of such transactions. Unrealized gains and losses that result from changes in foreign exchange rates and/or changes in market prices of securities have been included in unrealized appreciation/depreciation on investments and foreign currency translations. Net realized foreign currency gains and losses resulting from changes in exchange rates include foreign currency gains and losses between trade date and settlement date on investment securities transactions, foreign currency transactions, and the difference between the amounts of interest and dividends recorded on the books of the Fund and the amounts actually received. The portion of foreign currency gains and losses related to fluctuation in exchange rates between the initial purchase trade date and subsequent sale trade date is included in realized gain/(loss) on investments.
Foreign Securities. The Fund may directly purchase securities of foreign issuers. Investing in securities of foreign issuers involves special risks not typically associated with investing in securities of U.S. issuers. The risks include possible revaluation of currencies, the inability to repatriate funds, less complete financial information about companies, and possible future adverse political and economic developments. Moreover, securities of many foreign issuers and their markets may be less liquid and their prices more volatile than securities of comparable U.S. issuers.
Foreign Taxes. The Fund may be subject to foreign taxes on income, gains on investments, or currency repatriation, a portion of which may be recoverable. The Fund will accrue such taxes and recoveries as applicable, based upon its current interpretation of tax rules and regulations that exist in the markets in which it invests.
Securities Transactions and Investment Income. Securities transactions are accounted for on the trade date with realized gain/(loss) on investments determined by using the identified cost method. Interest income (including amortization of premium and accretion of discount) is recorded on an accrual basis. Premiums and discounts on debt securities are amortized using the effective yield to maturity method or amortized to earliest call date, if applicable. Dividend income is recorded on the ex-dividend date, except for certain dividends from foreign securities that are recorded as soon after the ex-dividend date as the Fund becomes aware of such dividends.
Determination of Net Asset Value and Calculation of Expenses. Certain administrative expenses are common to, and allocated among, various affiliated funds. Such allocations are made on the basis of each fund’s average net assets or other criteria directly affecting the expenses as determined by the Adviser pursuant to procedures established by the Board.
The Gabelli International Small Cap Fund
Notes to Financial Statements (Continued)
In calculating the NAV per share of each class, investment income, realized and unrealized gains and losses, redemption fees, and expenses other than class specific expenses are allocated daily to each class of shares based upon the proportion of net assets of each class at the beginning of each day. Distribution expenses are borne solely by the class incurring the expense.
Distributions to Shareholders. Distributions to shareholders are recorded on the ex-dividend date. Distributions to shareholders are based on income and capital gains as determined in accordance with federal income tax regulations, which may differ from income and capital gains as determined under GAAP. These differences are primarily due to differing treatments of income and gains on various investment securities and foreign currency transactions held by the Fund, timing differences, and differing characterizations of distributions made by the Fund. Distributions from net investment income for federal income tax purposes include net realized gains on foreign currency transactions. These book/tax differences are either temporary or permanent in nature. To the extent these differences are permanent, adjustments are made to the appropriate capital accounts in the period when the differences arise. Permanent differences were primarily due to the tax treatment of taxable distributions in excess of income. These reclassifications have no impact on the NAV of the Fund. For the year ended December 31, 2023, reclassifications were made to decrease paid-in capital by $981, with an offsetting adjustment to total accumulated loss.
The tax character of distributions paid during the years ended December 31, 2023 and 2022 was as follows:
| | | Year Ended | | | Year Ended | |
| | | December 31,
2023 | | | December 31,
2022 | |
| Distributions paid from: | | | | | | | | |
| Ordinary income | | $ | 108,848 | | | $ | 30,443 | |
| Total distributions paid | | $ | 108,848 | | | $ | 30,443 | |
Provision for Income Taxes. The Fund intends to continue to qualify as a regulated investment company under Subchapter M of the Internal Revenue Code of 1986, as amended (the Code). It is the policy of the Fund to comply with the requirements of the Code applicable to regulated investment companies and to distribute substantially all of its net investment company taxable income and net capital gains. Therefore, no provision for federal income taxes is required.
At December 31, 2023, the components of accumulated earnings/losses on a tax basis were as follows:
| Accumulated capital loss carryforwards | | $ | (544,952 | ) |
| Net unrealized appreciation on investments and foreign currency translations | | | 143,150 | |
| Total | | $ | (401,802 | ) |
The Fund is permitted to carry capital losses forward for an unlimited period. Capital losses that are carried forward will retain their character as either short term or long term capital losses. The Fund has a short term capital loss carryforward with no expiration of $33,331 and a long term capital loss carryforward with no expiration of $511,621.
At December 31, 2023, the temporary differences between book basis and tax basis unrealized appreciation were primarily due to mark-to-market adjustments on investments in passive foreign investment companies,
The Gabelli International Small Cap Fund
Notes to Financial Statements (Continued)
capital loss carryforward not yet utilized, and adjustments on the sale of securities no longer deemed passive foreign investment companies.
The following summarizes the tax cost of investments and the related net unrealized appreciation at December 31, 2023:
| | | Cost | | | Gross
Unrealized
Appreciation | | | Gross
Unrealized
Depreciation | | | Net
Unrealized
Appreciation | |
| Investments | | $ | 6,411,551 | | | $ | 1,287,445 | | | $ | (1,144,492 | ) | | $ | 142,953 | |
The Fund is required to evaluate tax positions taken or expected to be taken in the course of preparing the Fund’s tax returns to determine whether the tax positions are “more-likely-than-not” of being sustained by the applicable tax authority. Income tax and related interest and penalties would be recognized by the Fund as tax expense in the Statement of Operations if the tax positions were deemed not to meet the more-likely-than-not threshold. During the year ended December 31, 2023, the Fund did not incur any income tax, interest, or penalties. As of December 31, 2023, the Adviser has reviewed all open tax years and concluded that there was no impact to the Fund’s net assets or results of operations. The Fund’s federal and state tax returns for the prior three fiscal years remain open, subject to examination. On an ongoing basis, the Adviser will monitor the Fund’s tax positions to determine if adjustments to this conclusion are necessary.
3. Investment Advisory Agreement and Other Transactions. The Fund has entered into an investment advisory agreement (the Advisory Agreement) with the Adviser which provides that the Fund will pay the Adviser a fee, computed daily and paid monthly, at the annual rate of 1.00% of the value of its average daily net assets. In accordance with the Advisory Agreement, the Adviser provides a continuous investment program for the Fund’s portfolio, oversees the administration of all aspects of the Fund’s business and affairs, and pays the compensation of all Officers and Directors of the Fund who are affiliated persons of the Adviser.
The Adviser has contractually agreed to waive its investment advisory fees and/or to reimburse expenses to the extent necessary to maintain the annualized total operating expenses of the Fund (excluding brokerage costs, acquired fund fees and expenses, interest, taxes, and extraordinary expenses) until at least April 30, 2024, at no more than an annual rate of 0.90% for all classes of shares. During the year ended December 31, 2023, the Adviser reimbursed the Fund in the amount of $251,208. In addition, the Fund has agreed, during the two year period following any waiver or reimbursement by the Adviser, to repay such amount to the extent, that after giving effect to the repayment, such adjusted annualized total operating expenses of the Fund would not exceed 0.90% of the value of the Fund’s average daily net assets for each share class of the Fund. The arrangement is renewable annually. At December 31, 2023, the cumulative amount which the Fund may repay the Adviser, subject to the terms above, is $456,912:
| For the year ended December 31, 2022, expiring December 31, 2024 | | $ | 205,704 | |
| For the year ended December 31, 2023, expiring December 31, 2025 | | | 251,208 | |
| | | $ | 456,912 | |
4. Distribution Plan. The Fund’s Board has adopted a distribution plan (the Plan) for each class of shares, except for Class I Shares, pursuant to Rule 12b-1 under the 1940 Act. Under the Class AAA, Class A, and Class C Share Plans, payments are authorized to G.distributors, LLC (the Distributor), an affiliate of the Adviser, at annual rates of 0.25%, 0.25%, and 1.00%, respectively, of the average daily net assets of those classes, the annual limitations under each Plan. Such payments are accrued daily and paid monthly.
The Gabelli International Small Cap Fund
Notes to Financial Statements (Continued)
5. Portfolio Securities. Purchases and sales of securities during the year ended December 31, 2023, other than short term securities and U.S. Government obligations, aggregated $366,285 and $957,528, respectively.
6. Transactions with Affiliates and Other Arrangements. The cost of calculating the Fund’s NAV per share is a Fund expense pursuant to the Advisory Agreement. Under the sub-administration agreement with Bank of New York Mellon, the fees paid include the cost of calculating the Fund’s NAV. The Fund reimburses the Adviser for this service. The Adviser did not seek a reimbursement during the year ended December 31, 2023.
The Fund received credits from a designated broker who agreed to pay certain Fund operating expenses. The amount of such expenses paid through this directed brokerage arrangement during this period was $1,222.
The Corporation pays retainer and per meeting fees to Directors not affiliated with the Adviser, plus specified amounts to the Lead Director and Audit Committee Chairman. Directors are also reimbursed for out of pocket expenses incurred in attending meetings. Directors who are directors or employees of the Adviser or an affiliated company receive no compensation or expense reimbursement from the Corporation.
7. Line of Credit. The Fund participates in an unsecured line of credit, which expires on February 28, 2024 and may be renewed annually, of up to $75,000,000 under which it may borrow up to 10% of its net assets from the bank for temporary borrowing purposes. Borrowings under this arrangement bear interest at a floating rate equal to the higher of the Overnight Federal Funds Rate plus 135 basis points or the Overnight Bank Funding Rate plus 135 basis points in effect on that day. This amount, if any, would be included in “Interest expense” in the Statement of Operations. At December 31, 2023, there were no borrowings outstanding under the line of credit.
The average daily amount of borrowings outstanding under the line of credit for the six days of borrowings during the year ended December 31, 2023 was $174,333 with a weighted average interest rate of 5.82%. The maximum amount borrowed at any time during the year ended December 31, 2023 was $191,000.
8. Capital Stock. The Fund currently offers three classes of shares – Class AAA Shares, Class A Shares, and Class I Shares. Class AAA and Class A investors may purchase more of these share classes. Class C shareholders cannot purchase more of this class. The minimum investment for Class I shares is $1,000. These changes had no effect on existing shareholders’ ability to redeem shares of the Fund as described in the Fund’s Prospectus.
The Fund imposes a redemption fee of 2.00% on all classes of shares that are redeemed or exchanged on or before the seventh day after the date of a purchase. The redemption fee is deducted from the proceeds otherwise payable to the redeeming shareholders and is retained by the Fund as an increase in paid-in capital. The redemption fees retained by the Fund during the years ended December 31, 2023 and 2022, if any, can be found in the Statement of Changes in Net Assets under Redemption Fees.
The Gabelli International Small Cap Fund
Notes to Financial Statements (Continued)
Transactions in shares of capital stock were as follows:
| | | Year Ended | | | Year Ended | |
| | | December 31,
2023 | | | December 31,
2022 | |
| | | Shares | | | Amount | | | Shares | | | Amount | |
| Class AAA | | | | | | | | | | | | | | | | |
| Shares sold | | | 2,701 | | | $ | 32,793 | | | | 4,401 | | | $ | 53,258 | |
| Shares issued upon reinvestment of distributions | | | 5,468 | | | | 67,259 | | | | 1,643 | | | | 18,986 | |
| Shares redeemed | | | (40,962 | ) | | | (497,686 | ) | | | (37,919 | ) | | | (456,155 | ) |
| Net decrease | | | (32,793 | ) | | $ | (397,634 | ) | | | (31,875 | ) | | $ | (383,911 | ) |
| Class A | | | | | | | | | | | | | | | | |
| Shares sold | | | — | | | | — | | | | 384 | | | $ | 5,327 | |
| Shares issued upon reinvestment of distributions | | | 72 | | | $ | 879 | | | | 19 | | | | 219 | |
| Shares redeemed | | | (10 | ) | | | (113 | ) | | | (2,813 | ) | | | (36,979 | ) |
| Net increase/(decrease) | | | 62 | | | $ | 766 | | | | (2,410 | ) | | $ | (31,433 | ) |
| Class C | | | | | | | | | | | | | | | | |
| Shares issued upon reinvestment of distributions | | | 13 | | | $ | 144 | | | | 3 | | | $ | 36 | |
| Shares redeemed | | | (1 | ) | | | (15 | ) | | | (428 | ) | | | (5,342 | ) |
| Net increase/(decrease) | | | 12 | | | $ | 129 | | | | (425 | ) | | $ | (5,306 | ) |
| Class I | | | | | | | | | | | | | | | | |
| Shares sold | | | 42,708 | | | $ | 531,641 | | | | 46,305 | | | $ | 624,129 | |
| Shares issued upon reinvestment of distributions | | | 3,011 | | | | 38,059 | | | | 741 | | | | 8,778 | |
| Shares redeemed | | | (72,369 | ) | | | (904,578 | ) | | | (101,403 | ) | | | (1,286,493 | ) |
| Net decrease | | | (26,650 | ) | | $ | (334,878 | ) | | | (54,357 | ) | | $ | (653,586 | ) |
9. Indemnifications. The Fund enters into contracts that contain a variety of indemnifications. The Fund’s maximum exposure under these arrangements is unknown. However, the Fund has not had prior claims or losses pursuant to these contracts. Management has reviewed the Fund’s existing contracts and expects the risk of loss to be remote.
10. Subsequent Events. Management has evaluated the impact on the Fund of all subsequent events occurring through the date the financial statements were issued and has determined that there were no subsequent events requiring recognition or disclosure in the financial statements.
The Gabelli International Small Cap Fund
Report of Independent Registered Public Accounting Firm
To the Shareholders of The Gabelli International Small Cap Fund
and the Board of Directors of GAMCO Global Series Funds, Inc.
Opinion on the Financial Statements
We have audited the accompanying statement of assets and liabilities of The Gabelli International Small Cap Fund (the “Fund”) (one of the funds constituting GAMCO Global Series Funds, Inc. (the “Corporation”)), including the schedule of investments, as of December 31, 2023, and the related statement of operations for the year then ended, the statements of changes in net assets for each of the two years in the period then ended, the financial highlights for each of the five years in the period then ended and the related notes (collectively referred to as the “financial statements”). In our opinion, the financial statements present fairly, in all material respects, the financial position of the Fund (one of the funds constituting GAMCO Global Series Funds, Inc.) at December 31, 2023, the results of its operations for the year then ended, the changes in its net assets for each of the two years in the period then ended and its financial highlights for each of the five years in the period then ended, in conformity with U.S. generally accepted accounting principles.
Basis for Opinion
These financial statements are the responsibility of the Corporation’s management. Our responsibility is to express an opinion on the Fund’s financial statements based on our audits. We are a public accounting firm registered with the Public Company Accounting Oversight Board (United States) (“PCAOB”) and are required to be independent with respect to the Corporation in accordance with the U.S. federal securities laws and the applicable rules and regulations of the Securities and Exchange Commission and the PCAOB.
We conducted our audits in accordance with the standards of the PCAOB. Those standards require that we plan and perform the audit to obtain reasonable assurance about whether the financial statements are free of material misstatement, whether due to error or fraud. The Corporation is not required to have, nor were we engaged to perform, an audit of the Corporation’s internal control over financial reporting. As part of our audits, we are required to obtain an understanding of internal control over financial reporting but not for the purpose of expressing an opinion on the effectiveness of the Corporation’s internal control over financial reporting. Accordingly, we express no such opinion.
Our audits included performing procedures to assess the risks of material misstatement of the financial statements, whether due to error or fraud, and performing procedures that respond to those risks. Such procedures included examining, on a test basis, evidence regarding the amounts and disclosures in the financial statements. Our procedures included confirmation of securities owned as of December 31, 2023 by correspondence with the custodian. Our audits also included evaluating the accounting principles used and significant estimates made by management, as well as evaluating the overall presentation of the financial statements. We believe that our audits provide a reasonable basis for our opinion.

We have served as the auditor of one or more Gabelli Funds investment companies since 1992.
New York, New York
February 28, 2024
The Gabelli International Small Cap Fund
Liquidity Risk Management Program (Unaudited)
In accordance with Rule 22e-4 under the 1940 Act,the Fund has established a liquidity risk management program (the LRM Program) to govern its approach to managing liquidity risk. The LRM Program is administered by the Liquidity Committee (the Committee), which is comprised of members of Gabelli Funds, LLC management. The Board has designated the Committee to administer the LRM Program.
The LRM Program’s principal objectives include supporting the Fund’s compliance with limits on investments in illiquid assets and mitigating the risk that the Fund will be unable to meet its redemption obligations in a timely manner. The LRM Program also includes elements that support the management and assessment of liquidity risk, including an annual assessment of factors that influence the Fund’s liquidity and the monthly classification and re-classification of certain investments that reflect the Committee’s assessment of their relative liquidity under current market conditions.
At a meeting of the Board held on August 23, 2023, the Board received a written report from the Committee regarding the design and operational effectiveness of the LRM Program. The Committee determined, and reported to the Board, that the LRM Program is reasonably designed to assess and manage the Fund’s liquidity risk and has operated adequately and effectively since its implementation. The Committee reported that there were no liquidity events that impacted the Fund or its ability to timely meet redemptions without dilution to existing shareholders. The Committee noted that the Fund is primarily invested in highly liquid securities and, accordingly, continues to be exempt from the requirement to determine a “highly liquid investment minimum” as defined in the Rule 22e-4. Because of that continued qualification for the exemption, the Fund has not adopted a “highly liquid investment minimum” amount. The Committee further noted that while changes to the LRM Program were made during the Review Period and reported to the Board, no material changes were made to the LRM Program as a result of the Committee’s annual review.
There can be no assurance that the LRM Program will achieve its objectives in the future. Please refer to the Fund’s Prospectus for more information regarding its exposure to liquidity risk and other principal risks to which an investment in the Fund may be subject.
The Gabelli International Small Cap Fund
Board Consideration and Re-Approval of Investment Advisory Agreement (Unaudited)
During the six months ended December 31, 2023, the Board of Directors of the Corporation approved the continuation of the investment advisory agreement with the Adviser for the Fund on the basis of the recommendation by the directors (the Independent Board Members) who are not interested persons of the Fund. The following paragraphs summarize the material information and factors considered by the Independent Board Members as well as their conclusions relative to such factors.
Nature, Extent, and Quality of Services. The Independent Board Members considered information regarding the Fund’s portfolio managers, the depth of the analyst pool available to the Adviser and the portfolio managers, the scope of supervisory, administrative, shareholder, and other services supervised or provided by the Adviser, and the absence of significant service problems reported to the Board. The Independent Board Members noted the experience, length of service, and reputation of the Fund’s portfolio managers.
Investment Performance. The Independent Board Members reviewed the short, medium, and long term performance of the Fund (as of September 30, 2023) against a peer group of seven other comparable funds prepared by the Adviser (the Adviser Peer Group), and against a peer group prepared by Broadridge (the Broadridge Performance Peer Group) consisting of all international small/mid cap growth funds, regardless of asset size or primary channel of distribution. The Independent Board Members noted that the Fund’s performance was in the second quartile for the one year period, in the third quartile for the three year period, and in the fourth quartile for the five and ten year periods, as measured against the Adviser Peer Group. Against the Broadridge Performance Peer Group, the Independent Board Members noted that the Fund’s performance was in the fourth quintile for the one year period, and the fifth quintile for the three, five and ten years periods. The Independent Board Members noted that at its current size, the Fund was not competitive among its peer group and encouraged the Adviser to continue to explore ways to increase the size of the Fund. The Independent Board Members also recalled the Adviser’s comprehensive discussion of performance earlier in the Meeting.
Profitability. The Independent Board Members reviewed summary data regarding the profitability of the Fund to the Adviser both with a pro rata administrative overhead charge and with a standalone administrative charge and noted the effect of the expense limitation agreement. The Independent Board Members also noted that a portion of the Fund’s portfolio transactions were executed by an affiliated broker of the Adviser and that another affiliated broker of the Adviser received distribution fees and minor amounts of sales commissions.
Economies of Scale. The Independent Board Members discussed the major elements of the Adviser’s cost structure and the relationship of those elements to potential economies of scale and reviewed data provided by the Adviser.
Sharing of Economies of Scale. The Independent Board Members noted that the investment management fee schedule for the Fund does not take into account any potential economies of scale that may develop or any losses or diminished profitability to the Adviser in prior years.
Service and Cost Comparisons. The Independent Board Members compared the expense ratios of the investment management fee, other expenses, and total expenses of the Fund with similar expense ratios of the Adviser Peer Group and a peer group of ten other international small/mid cap growth funds selected by Broadridge (the Broadridge Expense Peer Group), and noted that the Adviser’s management fee includes substantially all administrative services of the Fund as well as investment advisory services. The Independent Board Members noted that the Fund’s total expense ratio after waivers was the lowest compared with the
The Gabelli International Small Cap Fund
Board Consideration and Re-Approval of Investment Advisory Agreement (Unaudited) (Continued)
Adviser Peer Group, and the lowest compared with all of the funds included in the Broadridge Expense Peer Group. The Independent Board Members discussed how the Fund’s size was lower than average within both peer groups and that the Adviser had been waiving substantial portions of its fees in order to make the Fund a more attractive investment. The Independent Board Members also noted that the advisory fee structure was the same as that in effect for most of the Gabelli funds and noted the effect of the expense limitation agreement in place for the Fund. The Independent Board Members were presented with, but did not consider to be material to their decision, various information comparing the advisory fee to the fee for other types of accounts managed by the Adviser.
Conclusions. The Independent Board Members concluded that the Fund enjoyed highly experienced portfolio management services, an acceptable performance record, and good ancillary services. The Independent Board Members noted the contractual Expense Deferral Agreement between the Adviser and the Corporation, on behalf of each Fund, pursuant to which the net expense ratio for each share class of each Fund was reduced to 0.90%. The Independent Board Members did not view the potential profitability of ancillary services as material to their decision. On the basis of the foregoing and without assigning particular weight to any single conclusion, the Independent Board Members determined to recommend continuation of the investment management agreement to the full Board.
Based on a consideration of all these factors in their totality, the Board Members, including all of the Independent Board Members, determined that the Fund’s advisory fee was appropriate in light of the quality of services provided and in light of the other factors described above that the Board deemed relevant. Accordingly, the Board Members determined to approve the continuation of the Fund’s Advisory Agreement. The Board Members based their decision on evaluations of all these factors as a whole and did not consider any one factor as all important or controlling.
The Gabelli International Small Cap Fund
Additional Fund Information (Unaudited)
The business and affairs of the Fund are managed under the direction of the Fund’s Board of Directors. Information pertaining to the Directors and Officers of the Fund is set forth below. The Corporation’s Statement of Additional Information includes additional information about the Fund’s Directors and is available without charge, upon request, by calling 800-GABELLI (800-422-3554) or by writing to The Gabelli International Small Cap Fund at One Corporate Center, Rye, NY 10580-1422.
Name, Position(s)
Address1
and Year of Birth | | Term of Office
and Length of
Time Served2 | | Number of
Funds
in Fund
Complex
Overseen
by Director | | Principal Occupation(s)
During Past Five Years | | Other Directorships
Held by Director3 |
| | | | | | | |
| INTERESTED DIRECTORS4: | | | | | | |
| | | | | | | | | |
Mario J. Gabelli, CFA
Director and Chief Investment Officer
1942 | | Since 1993 | | 31 | | Chairman, Co-Chief Executive Officer, and Chief Investment Officer – Value Portfolios of GAMCO Investors, Inc. and Chief Investment Officer – Value Portfolios of Gabelli Funds, LLC and GAMCO Asset Management, Inc.; Director/Trustee or Chief Investment Officer of other registered investment companies within the Gabelli Fund Complex; Chief Executive Officer of GGCP, Inc.; Executive Chair of Associated Capital Group, Inc. | | Director of Morgan Group Holding Co. (holding company) (2001-2019); Chairman of the Board and Chief Executive Officer of LICT Corp. (multimedia and communication services company); Director of CIBL, Inc. (broadcasting and wireless communications); Director of ICTC Group Inc. (communications) (2013-2018) |
| | | | | | | | | |
John D. Gabelli
Director
1944 | | Since 1993 | | 12 | | Former Senior Vice President of G.research, LLC (and its predecessor) (1991-2019) | | — |
| | | | | | | |
| INDEPENDENT DIRECTORS5: | | | | | | |
| | | | | | | | | |
E. Val Cerutti
Director
1939 | | Since 2001 | | 7 | | Chief Executive Officer of Cerutti Consultants, Inc. | | Director of The LGL Group, Inc. (diversified manufacturing) (1990-2009) |
| | | | | | | | | |
Anthony J. Colavita6
Director
1935 | | Since 1993 | | 18 | | President of the law firm of Anthony J. Colavita, P.C. | | — |
| | | | | | | | | |
Werner J. Roeder
Director
1940 | | Since 1993 | | 20 | | Retired physician; Former Vice President of Medical Affairs (Medical Director) of New York Presbyterian/Lawrence Hospital (1999-2014) | | — |
| | | | | | | | | |
Anthonie C. van Ekris6
Director
1934 | | Since 1993 | | 23 | | Chairman and Chief Executive Officer of BALMAC International, Inc. (global import/ export company) | | — |
The Gabelli International Small Cap Fund
Additional Fund Information (Unaudited) (Continued)
Name, Position(s)
Address1
and Year of Birth | | Term of Office
and Length of
Time Served2 | | Number of
Funds
in Fund
Complex
Overseen
by Director | | Principal Occupation(s)
During Past Five Years | | Other Directorships
Held by Director3 |
| | | | | | | | | |
Salvatore J. Zizza7
Director
1945 | | Since 2004 | | 35 | | President, Zizza & Associates Corp. (private holding company); Chairman of Bergen Cove Realty Inc. (residential real estate) | | Director and Chairman of Trans-Lux Corporation (business services); Director and Chairman of Harbor Diversified Inc. (pharmaceuticals) (2009-2018); Retired Chairman of BAM (semiconductor and aerospace manufacturing); Director of Bion Environmental Technologies, Inc. |
The Gabelli International Small Cap Fund
Additional Fund Information (Unaudited) (Continued)
Name, Position(s)
Address1
and Year of Birth | | Term of Office
and Length of
Time Served2 | | Principal Occupation(s)
During Past Five Years |
| | | | | |
| OFFICERS: | | | | |
| | | | | |
John C. Ball
President, Treasurer, Principal Financial & Accounting Officer
1976 | | Since 2017 | | Senior Vice President (since 2018) and other positions (2017 - 2018) of GAMCO Investors, Inc.; Chief Executive Officer, G.distributors, LLC since 2020; Officer of registered investment companies within the Gabelli Fund Complex since 2017 |
| | | | | |
Peter Goldstein
Secretary & Vice President
1953 | | Since 2020 | | General Counsel, GAMCO Investors, Inc. and Chief Legal Officer, Associated Capital Group, Inc. since 2021; General Counsel and Chief Compliance Officer, Buckingham Capital Management, Inc. (2012-2020); Chief Legal Officer and Chief Compliance Officer, The Buckingham Research Group, Inc. (2012-2020) |
| | | | | |
Richard J. Walz
Chief Compliance Officer
1959 | | Since 2013 | | Chief Compliance Officer of registered investment companies within the Gabelli Fund Complex since 2013 |
| 1 | Address: One Corporate Center, Rye, NY 10580-1422, unless otherwise noted. |
| 2 | Each Director will hold office for an indefinite term until the earliest of (i) the next meeting of shareholders, if any, called for the purpose of considering the election or re-election of such Director and until the election and qualification of his or her successor, if any, elected at such meeting, or (ii) the date a Director resigns or retires, or a Director is removed by the Board of Directors or shareholders, in accordance with the Corporation’s By-Laws and Articles of Incorporation. For officers, includes time served in prior officer positions with the Fund. Each officer will hold office for an indefinite term until the date he or she resigns or retires or until his or her successor is elected and qualified.. |
| 3 | This column includes only directorships of companies required to report to the SEC under the Securities Exchange Act of 1934, as amended, i.e., public companies, or other investment companies registered under the 1940 Act. |
| 4 | “Interested person” of the Corporation as defined in the 1940 Act. Messrs. Gabelli are each considered an “interested person” because of their affiliation with Gabelli Funds, LLC which acts as the Corporation’s investment adviser. Mario J. Gabelli and John D. Gabelli are brothers. |
| 5 | Directors who are not interested persons are considered “Independent” Directors. |
| 6 | Mr. Colavita’s son, Anthony S. Colavita, serves as a director of other funds in the Gabelli Fund Complex. Mr. van Ekris is an independent director of Gabelli International Ltd., Gabelli Fund, LDC, GAMA Capital Opportunities Master, Ltd., and GAMCO International SICAV, which may be deemed to be controlled by Mario J. Gabelli and/or affiliates and in that event would be deemed to be under common control with the Fund’s Adviser. |
| 7 | Mr. Zizza is an independent director of Gabelli International Ltd., which may be deemed to be controlled by Mario J. Gabelli and/or affiliates and in that event would be deemed to be under common control with the Fund’s Adviser. On September 9, 2015, Mr. Zizza entered into a settlement with the SEC to resolve an inquiry relating to an alleged violation regarding the making of false statements or omissions to the accountants of a company concerning a related party transaction. The company in question is not an affiliate of, nor has any connection to, the Fund. Under the terms of the settlement, Mr. Zizza, without admitting or denying the SEC’s findings and allegation, paid $150,000 and agreed to cease and desist committing or causing any future violations of Rule 13b2-2 of the Securities Exchange Act of 1934, as amended. The Board has discussed this matter and has determined that it does not disqualify Mr. Zizza from serving as an Independent Director. |
Gabelli Funds and Your Personal Privacy
Who are we?
The Gabelli Funds are investment companies registered with the Securities and Exchange Commission under the Investment Company Act of 1940. We are managed by Gabelli Funds, LLC, which is affiliated with GAMCO Investors, Inc., a publicly held company with subsidiaries and affiliates that provide investment advisory services for a variety of clients.
What kind of non-public information do we collect about you if you become a fund shareholder?
If you apply to open an account directly with us, you will be giving us some non-public information about yourself. The non-public information we collect about you is:
| ● | Information you give us on your application form. This could include your name, address, telephone number, social security number, bank account number, and other information. |
| ● | Information about your transactions with us, any transactions with our affiliates, and transactions with the entities we hire to provide services to you. This would include information about the shares that you buy or redeem. If we hire someone else to provide services — like a transfer agent — we will also have information about the transactions that you conduct through them. |
What information do we disclose and to whom do we disclose it?
We do not disclose any non-public personal information about our customers or former customers to anyone other than our affiliates, our service providers who need to know such information, and as otherwise permitted by law. If you want to find out what the law permits, you can read the privacy rules adopted by the Securities and Exchange Commission. They are in volume 17 of the Code of Federal Regulations, Part 248. The Commission often posts information about its regulations on its website, www. sec.gov.
What do we do to protect your personal information?
We restrict access to non-public personal information about you to the people who need to know that information in order to provide services to you or the fund and to ensure that we are complying with the laws governing the securities business. We maintain physical, electronic, and procedural safeguards to keep your personal information confidential.
This page was intentionally left blank.
This page was intentionally left blank.
The Gabelli International Small Cap Fund
2023 TAX NOTICE TO SHAREHOLDERS (Unaudited)
During the year ended December 31, 2023, the Fund paid $0.2099 per share to shareholders in each Class of Shares. The Fund designates 88.33% of the ordinary income distribution as qualified dividend income pursuant to the Jobs and Growth Tax Relief Reconciliation Act of 2003. The Fund designates 6.76% of the ordinary income distribution as qualified interest income pursuant to the Tax Relief, Unemployment Reauthorization, and Job Creation Act of 2010. Also during 2023, the Fund passed through foreign tax credits of $0.0219 per share to each Class of Shares.
U.S. Government Income:
The percentage of the ordinary income distribution paid by the Fund during the year ended December 31, 2023 which was derived from U.S. Treasury securities was 4.86%. Such income is exempt from state and local tax in all states. However, many states, including New York and California, allow a tax exemption for a portion of the income earned only if a mutual fund has invested at least 50% of its assets at the end of each quarter of the Fund’s fiscal year in U.S. Government securities. The Fund did not meet this strict requirement in 2023. The percentage of U.S. Government securities held as of December 31, 2023 was 2.68%. Due to the diversity in state and local tax law, it is recommended that you consult your personal tax adviser as to the applicability of the information provided to your specific situation.
All designations are based on financial information available as of the date of this annual report and, accordingly, are subject to change. For each item, it is the intention of the Fund to designate the maximum amount permitted under the Internal Revenue Code and the regulations thereunder.
THE GABELLI INTERNATIONAL SMALL CAP FUND
One Corporate Center
Rye, NY 10580-1422
Portfolio Management Team Biographies
Caesar M. P. Bryan joined GAMCO Asset Management in 1994. He is a member of the global investment team of Gabelli Funds, LLC and portfolio manager of several funds within the Fund Complex. Prior to joining Gabelli, Mr. Bryan was a portfolio manager at Lexington Management. He began his investment career at Samuel Montagu Company, the London based merchant bank. Mr. Bryan graduated from the University of Southampton in England with a Bachelor of Law and is a member of the English Bar.
Gustavo Pifano joined the Firm in 2008 and is based in London. He serves as an assistant vice president of research and covers the industrial and consumer sectors with a focus on small-cap stocks. Gustavo is a member of the risk management group and responsible for the Firm’s UK compliance oversight and AML reporting functions. Gustavo holds a BBA in Finance from University of Miami and an MBA degree from University of Oxford Said Business School.
Ashish Sinha joined GAMCO UK in 2012 as a research analyst. Prior to joining the Firm, Mr. Sinha was a research analyst at Morgan Stanley in London for seven years and has covered European Technology, Mid-Caps and Business Services. He also worked in planning and strategy at Birla Sun Life Insurance in India. Currently Mr. Sinha is a portfolio manager of Gabelli Funds, LLC and an Assistant Vice President of GAMCO Asset Management UK. Mr. Sinha has a BSBA degree from the Institute of Management Studies and an MB from IIFT.

The Gabelli Global Mini MitesTM Fund
Annual Report — December 31, 2023
To Our Shareholders,
For the year ended December 31, 2023, the net asset value (NAV) total return per Class AAA Share of The Gabelli Global Mini Mites Fund was 39.0% compared with a total return of 15.9% for the S&P Developed SmallCap Index. Other classes of shares are available. See page 3 for performance information for all classes.
Enclosed are the financial statements, including the schedule of investments, as of December 31, 2023.
Investment Objective and Strategy (Unaudited)
The Fund is a non-diversified open end management investment company whose investment objective is to provide investors with long term capital appreciation by investing primarily in micro-capitalization equity securities.
The Fund’s investment strategy is to invest in common stocks of smaller companies that have a market capitalization (defined as shares outstanding times current market price) of $250 million or less at the time of the Fund’s initial investment. These companies are called micro-cap companies. As a "global" fund, the Fund invests in securities of issuers located in at least three countries and at least 40% of its net assets are invested in securities of non U.S. issuers.
Performance Discussion (Unaudited)
The top contributors to performance in the first quarter 2023 included Gencor Industries Inc. and Intevac Inc. Gencor Industries designs, builds, and sells equipment and materials used for the production of asphalt and highway construction machines. It is a leading producer of hot mix asphalt plants in North America. The company continues to enjoy solid results, driven by end market demand combined with pricing actions and gross margin recovery following a challenging 2022 affected by higher costs, including labor rates, steel, and other inputs. Intevac (IVAC), which develops and sells thin-film processing systems, primarily for the hard disk drive media market. While the hard disk drive market is at a cyclical market bottom, dealing with excess inventories and weak market demand, the company is pursuing sales opportunity in system upgrades among its installed base and preparing for its next generation systems for ultra large storage capacity. The top detractors to performance in the quarter were Neuronetics Inc. and Canterbury Park Holdings Corp.
As permitted by regulations adopted by the Securities and Exchange Commission, paper copies of the Fund’s annual and semiannual shareholder reports will no longer be sent by mail, unless you specifically request paper copies of the reports. Instead, the reports will be made available on the Fund’s website (www.gabelli.com), and you will be notified by mail each time a report is posted and provided with a website link to access the report. If you already elected to receive shareholder reports electronically, you will not be affected by this change and you need not take any action. To elect to receive all future reports on paper free of charge, please contact your financial intermediary, or, if you invest directly with the Fund, you may call 800-422-3554 or send an email request to info@gabelli.com. |
The top contributors to performance in the second quarter included Applied Optoelectronics Inc. and Circor International Inc. Applied Optoelectronics is an integrated provider of fiber-optic networking products for cable television, fiber-to-the-home and internet data centers. In late 2022, the company shored up its balance sheet announcing the sale of its manufacturing facilities in China for $150 million and established its position as a primary supplier to Microsoft. Circor International which designs, manufactures, and distributes highly engineered valves, pumps, and related flow control products serving industrial and aerospace and defense end markets. During the second quarter, Circor shares surged on the back of a bidding war that concluded with an agreement at the end of June to be acquired by KKR for $56 per share in cash, or a 77% premium. The top detractors to performance in the quarter were Intevac, Inc. and Farmer Bros. Co.
The top contributors to performance in the third quarter included Applied Optoelectronics Inc. (second consecutive quarter) and L.B. Foster Company. During the quarter, Applied Optoelectronics Inc. announced the termination of its agreement to sell its China manufacturing facilities - it will continue to explore strategic alternatives for those assets. L.B. Foster Company shares increased over 30% during the quarter as it reported solid financial results attributed to strong demand for its rail technologies offerings, which include automated track lubrication systems and sensor-enabled remote track monitoring solutions for passenger and freight rail networks, as well as information totems and display systems used at passenger rail stations.
In the fourth quarter Park-Ohio (PKOH), demonstrated considerable progress in operating efficiency in the company’s third quarter results. Strong end market demand, coupled with better pricing and manufacturing improvements, drove results. Further, the company recently announced the completion of the sale of its General Aluminum business for $50 million, further driving operational focus. Intevac successfully won a joint development agreement with Corning to collaborate on protective coatings for display cover glass market for mobile devices through its new TRIO system.
Selected holdings that contributed positively to performance in 2023 were: Applied Optoelectronics Inc. (6.9% of net assets as of December 31, 2023), L.B. Foster Co. (3.0%), and Circor International Inc. (no longer held).
Some of our weaker performing holdings during the year were: Tredegar Corp. (1.2% of net assets as of December 31, 2023), through its subsidiaries, manufactures and sells aluminum extrusions, polyethylene films, and plastic and polyester films in the United States and internationally; Intevac Inc. (1.5%), and American Vanguard Corp. (0.9%), through its subsidiaries, develops, manufactures, and markets specialty chemicals for agricultural, commercial, and consumer uses in the United States and internationally.
Thank you for your investment in the Gabelli Global Mini Mites Fund.
We appreciate your confidence and trust.
The views expressed reflect the opinions of the Fund’s portfolio managers and Gabelli Funds, LLC, the Adviser, as of the date of this report and are subject to change without notice based on changes in market, economic, or other conditions. These views are not intended to be a forecast of future events and are no guarantee of future results. |
Comparative Results
Average Annual Returns through December 31, 2023 (a) (Unaudited)
Total returns and average annual returns reflect changes in share price, reinvestment of distributions, and are net of expenses.
| | | 1 Year | | | 3 Year | | | 5 Year | | | Since
Inception
(10/1/18) | |
| Class AAA (GAMNX) | | | 39.05 | % | | | 11.61 | % | | | 12.42 | % | | | 8.70 | % |
| S&P Developed SmallCap Index (b) | | | 15.90 | | | | 2.93 | | | | 9.83 | | | | 5.35 | |
| Class A (GMNAX) | | | 38.93 | | | | 11.61 | | | | 12.40 | | | | 8.68 | |
| With sales charge (c) | | | 30.94 | | | | 9.43 | | | | 11.08 | | | | 7.46 | |
| Class C (GMNCX) | | | 39.06 | | | | 11.60 | | | | 12.28 | | | | 8.53 | |
| Class I (GGMMX) | | | 39.05 | | | | 11.61 | | | | 12.49 | | | | 8.76 | |
| (a) | Returns would have been lower had the Adviser not reimbursed certain expenses of the Fund. The Fund imposes a 2% redemption fee on shares sold or exchanged within seven days of purchase. |
| (b) | The S&P Developed Small Cap Index is a float-adjusted market-capitalization-weighted index designed to measure the equity market performance of small-capitalization companies located in developed markets. The index is composed of companies within the bottom 15% of the cumulative market capitalization in developed markets. The index covers all publicly listed equities with float-adjusted market values of U.S. $100 million or more and annual dollar value traded of at least U.S. $50 million in all included countries. Dividends are considered reinvested. You cannot invest directly in an index. |
| (c) | Performance results include the effect of the maximum 5.75% sales charge at the beginning of the period. |
In the current prospectuses dated April 28, 2023, the gross expense ratios for Class AAA, A, and I Shares are 3.40%, 3.40%, and 3.15%, respectively, and the net expense ratio for all share classes after contractual reimbursements by Gabelli Funds, LLC, (the Adviser) is 0.90%. See page 12 for the expense ratios for the year ended December 31, 2023. The contractual reimbursements are in effect through April 30, 2024. Class AAA and Class I Shares do not have a sales charge. The maximum sales charge for Class A Shares is 5.75%.
Investing in foreign securities involves risks not ordinarily associated with investments in domestic issues, including currency fluctuation, economic, and political risks. Investors should carefully consider the investment objectives, risks, charges, and expenses of the Fund before investing. The prospectus contain information about these and other matters and should be read carefully before investing. To obtain a prospectus, please visit our website at www.gabelli.com.
Returns represent past performance and do not guarantee future results. Investment returns and the principal value of an investment will fluctuate. When shares are redeemed, they may be worth more or less than their original cost. Current performance may be lower or higher than the performance data presented. Visit www.gabelli.com for performance information as of the most recent month end.
COMPARISON OF CHANGE IN VALUE OF A $10,000 INVESTMENT IN
THE GABELLI GLOBAL MINI MITES FUND (CLASS AAA SHARES)
AND S&P DEVELOPED SMALLCAP INDEX (Unaudited)
| Average Annual Total Returns* |
| | 1 Year | 5 Year | Since Inception |
| Class AAA | 39.05% | 12.42% | 8.70% |
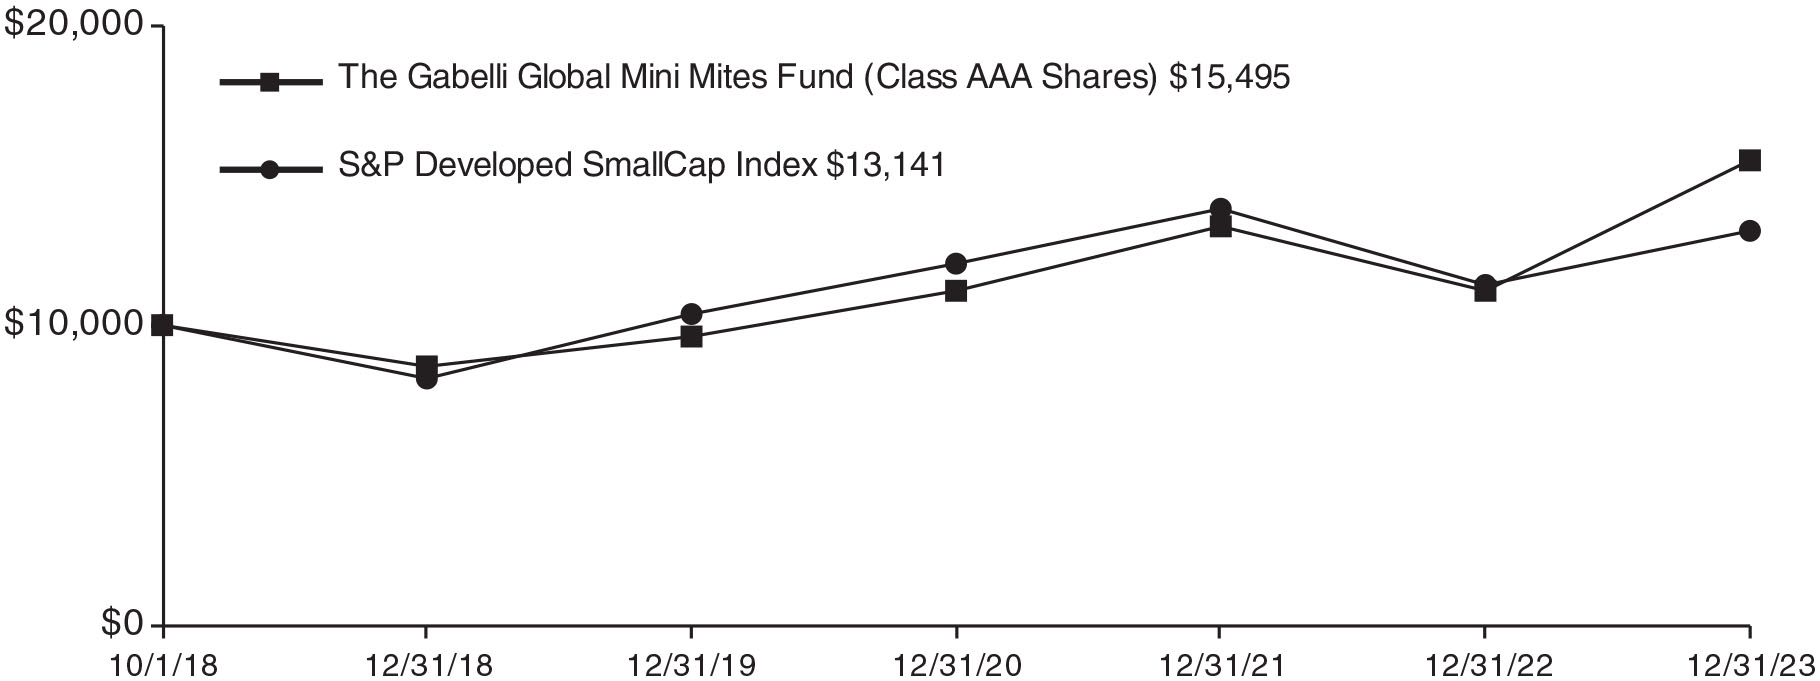
* Past performance is not predictive of future results. The performance tables and graph do not reflect the deduction of taxes that a shareholder would pay on Fund distributions or the redemption of Fund shares.
The Gabelli Global Mini Mites Fund
Disclosure of Fund Expenses (Unaudited)
| For the Six Month Period from July 1, 2023 through December 31, 2023 | Expense Table |
We believe it is important for you to understand the impact of fees and expenses regarding your investment. All mutual funds have operating expenses. As a shareholder of a fund, you incur ongoing costs, which include costs for portfolio management, administrative services, and shareholder reports (like this one), among others. Operating expenses, which are deducted from a fund’s gross income, directly reduce the investment return of a fund. When a fund’s expenses are expressed as a percentage of its average net assets, this figure is known as the expense ratio. The following examples are intended to help you understand the ongoing costs (in dollars) of investing in your Fund and to compare these costs with those of other mutual funds. The examples are based on an investment of $1,000 made at the beginning of the period shown and held for the entire period.
The Expense Table below illustrates your Fund’s costs in two ways:
Actual Fund Return: This section provides information about actual account values and actual expenses. You may use this section to help you to estimate the actual expenses that you paid over the period after any fee waivers and expense reimbursements. The “Ending Account Value” shown is derived from the Fund’s actual return during the past six months, and the “Expenses Paid During Period” shows the dollar amount that would have been paid by an investor who started with $1,000 in the Fund. You may use this information, together with the amount you invested, to estimate the expenses that you paid over the period.
To do so, simply divide your account value by $1,000 (for example, an $8,600 account value divided by $1,000 = 8.6), then multiply the result by the number given for your Fund under the heading “Expenses Paid During Period” to estimate the expenses you paid during this period.
Hypothetical 5% Return: This section provides information about hypothetical account values and hypothetical expenses based on the Fund’s actual expense ratio. It assumes a hypothetical annualized return of 5% before expenses during the period shown. In this case – because the hypothetical return used is not the Fund’s actual return – the results do not apply to your investment and you cannot use the hypothetical account value and expense to estimate the actual ending account balance or expenses you
paid for the period. This example is useful in making comparisons of the ongoing costs of investing in the Fund and other funds. To do so, compare this 5% hypothetical example with the 5% hypothetical examples that appear in shareholder reports of other funds.
Please note that the expenses shown in the table are meant to highlight your ongoing costs only and do not reflect any transactional costs such as sales charges (loads), redemption fees, or exchange fees, if any, which are described in the Prospectus. If these costs were applied to your account, your costs would be higher. Therefore, the 5% hypothetical return is useful in comparing ongoing costs only, and will not help you determine the relative total costs of owning different funds. The "Annualized Expense Ratio" represents the actual expenses for the last six months and may be different from the expense ratio in the Financial Highlights which is for the year ended December 31, 2023.
| | | Beginning
Account Value
07/01/23 | | | Ending
Account Value
12/31/23 | | | Annualized
Expense
Ratio | | | Expenses
Paid During
Period * | |
| The Gabelli Global Mini Mites Fund | | | | | | | | | | | | | | | |
| Actual Fund Return | | | | | | | | | | | | | | | |
| Class AAA | | $ | 1,000.00 | | | $ | 1,181.40 | | | 0.90% | | | $ | 4.95 | |
| Class A | | $ | 1,000.00 | | | $ | 1,181.50 | | | 0.90% | | | $ | 4.95 | |
| Class C | | $ | 1,000.00 | | | $ | 1,181.80 | | | 0.90% | | | $ | 4.95 | |
| Class I | | $ | 1,000.00 | | | $ | 1,181.40 | | | 0.90% | | | $ | 4.95 | |
| Hypothetical 5% Return | | | | | | | | | | | | | | | |
| Class AAA | | $ | 1,000.00 | | | $ | 1,020.67 | | | 0.90% | | | $ | 4.58 | |
| Class A | | $ | 1,000.00 | | | $ | 1,020.67 | | | 0.90% | | | $ | 4.58 | |
| Class C | | $ | 1,000.00 | | | $ | 1,020.67 | | | 0.90% | | | $ | 4.58 | |
| Class I | | $ | 1,000.00 | | | $ | 1,020.67 | | | 0.90% | | | $ | 4.58 | |
| * | Expenses are equal to the Fund’s annualized expense ratio for the last six months multiplied by the average account value over the period, multiplied by the number of days in the most recent fiscal half year (184 days), then divided by 365. |
Summary of Portfolio Holdings (Unaudited)
The following table presents portfolio holdings as a percent of net assets as of December 31, 2023:
The Gabelli Global Mini Mites Fund
| U.S. Government Obligations | | | 22.3 | % |
| Diversified Industrial | | | 14.5 | % |
| Equipment and Supplies | | | 8.3 | % |
| Machinery | | | 6.9 | % |
| Consumer Products | | | 4.8 | % |
| Food and Beverage | | | 3.2 | % |
| Broadcasting | | | 2.8 | % |
| Automotive: Parts and Accessories | | | 2.7 | % |
| Business Services | | | 2.7 | % |
| Entertainment | | | 2.5 | % |
| Health Care | | | 2.4 | % |
| Building and Construction | | | 2.3 | % |
| Hotels and Gaming | | | 2.2 | % |
| Energy and Utilities | | | 2.2 | % |
| Aerospace and Defense | | | 2.2 | % |
| Retail | | | 2.0 | % |
| Financial Services | | | 2.0 | % |
| Specialty Chemicals | | | 1.9 | % |
| Consumer Services | | | 1.9 | % |
| Agriculture | | | 1.4 | % |
| Computer Software and Services | | | 1.2 | % |
| Real Estate | | | 0.7 | % |
| Metals and Mining | | | 0.6 | % |
| Electronics | | | 0.1 | % |
| Wireless Telecommunications Services | | | 0.1 | % |
| Telecommunications | | | 0.0 | %* |
| Publishing | | | 0.0 | %* |
| Other Assets and Liabilities (Net) | | | 6.1 | % |
| | | | 100.0 | % |
| * | Amount represents less than 0.05%. |
The Fund files a complete schedule of portfolio holdings with the Securities and Exchange Commission (the SEC) for the first and third quarters of each fiscal year on Form N-PORT. Shareholders may obtain this information at www.gabelli.com or by calling the Fund at 800-GABELLI (800-422-3554). The Fund’s Form N-PORT is available on the SEC’s website at www.sec.gov and may also be reviewed and copied at the SEC’s Public Reference Room in Washington, DC. Information on the operation of the Public Reference Room may be obtained by calling 800-SEC-0330.
Proxy Voting
The Fund files Form N-PX with its complete proxy voting record for the twelve months ended June 30, no later than August 31 of each year. A description of the Fund’s proxy voting policies, procedures, and how each Fund voted proxies relating to portfolio securities is available without charge, upon request, by (i) calling 800-GABELLI (800-422-3554); (ii) writing to The Gabelli Funds at One Corporate Center, Rye, NY 10580-1422; or (iii) visiting the SEC’s website at www.sec.gov.
The Gabelli Global Mini Mites Fund
Schedule of Investments — December 31, 2023
| Shares | | | | | Cost | | | Market
Value | |
| | | | | COMMON STOCKS — 71.5% | | | | | | | | |
| | | | | Aerospace and Defense — 2.2% | | | | | | | | |
| | 500 | | | Astronics Corp.† | | $ | 8,165 | | | $ | 8,710 | |
| | 1,300 | | | Astronics Corp., Cl. B† | | | 21,085 | | | | 22,672 | |
| | 13,000 | | | Avio SpA† | | | 149,119 | | | | 121,412 | |
| | 1,000 | | | CPI Aerostructures Inc.† | | | 2,388 | | | | 2,730 | |
| | 4,000 | | | Innovative Solutions and Support Inc.† | | | 27,868 | | | | 34,120 | |
| | 3,500 | | | Terran Orbital Corp.† | | | 3,559 | | | | 3,990 | |
| | 3,500 | | | Triumph Group Inc.† | | | 30,156 | | | | 58,030 | |
| | | | | | | | 242,340 | | | | 251,664 | |
| | | | | Agriculture — 1.4% | | | | | | | | |
| | 6,000 | | | Limoneira Co. | | | 90,784 | | | | 123,780 | |
| | 48,000 | | | S&W Seed Co.† | | | 91,133 | | | | 33,600 | |
| | | | | | | | 181,917 | | | | 157,380 | |
| | | | | Automotive: Parts and Accessories — 2.7% | | | | | | | | |
| | 12,500 | | | Garrett Motion Inc.† | | | 68,625 | | | | 120,875 | |
| | 1,000 | | | Motorcar Parts of America Inc.† | | | 9,597 | | | | 9,340 | |
| | 700 | | | Smart Eye AB† | | | 5,647 | | | | 6,163 | |
| | 7,200 | | | Strattec Security Corp.† | | | 210,943 | | | | 180,792 | |
| | | | | | | | 294,812 | | | | 317,170 | |
| | | | | Broadcasting — 2.8% | | | | | | | | |
| | 21,209 | | | Beasley Broadcast Group Inc., Cl. A† | | | 31,198 | | | | 18,622 | |
| | 46,000 | | | Corus Entertainment Inc., Cl. B | | | 124,583 | | | | 24,648 | |
| | 4,000 | | | Cumulus Media Inc., Cl. A† | | | 22,996 | | | | 21,280 | |
| | 25,000 | | | Townsquare Media Inc., Cl. A | | | 274,580 | | | | 264,000 | |
| | | | | | | | 453,357 | | | | 328,550 | |
| | | | | Building and Construction — 2.3% | | | | | | | | |
| | 59,026 | | | Armstrong Flooring Inc.† | | | 5,515 | | | | 6 | |
| | 13,000 | | | Gencor Industries Inc.† | | | 137,461 | | | | 209,820 | |
| | 1,925 | | | Neinor Homes SA | | | 24,184 | | | | 22,441 | |
| | 200 | | | The Monarch Cement Co. | | | 11,234 | | | | 31,900 | |
| | | | | | | | 178,394 | | | | 264,167 | |
| | | | | Business Services — 2.7% | | | | | | | | |
| | 2,000 | | | AssetCo plc† | | | 2,300 | | | | 1,198 | |
| | 20,000 | | | B Intressenter AB† | | | 453 | | | | 397 | |
| | 600 | | | Boston Omaha Corp., Cl. A† | | | 11,994 | | | | 9,438 | |
| | 30,333 | | | Diebold Nixdorf Inc.† | | | 21,290 | | | | 0 | |
| | 5,400 | | | Du-Art Film Laboratories Inc.†(a) | | | 0 | | | | 23,414 | |
| | 600 | | | Du-Art Film Laboratories Inc.†(a) | | | 0 | | | | 2,602 | |
| | 4,000 | | | Ework Group AB | | | 33,432 | | | | 58,774 | |
| | 4,000 | | | Marin Software Inc.† | | | 3,770 | | | | 1,466 | |
| | 500 | | | MIND Technology Inc.† | | | 2,330 | | | | 3,265 | |
| Shares | | | | | Cost | | | Market
Value | |
| | 7,999 | | | Steel Connect Inc.† | | $ | 76,512 | | | $ | 76,150 | |
| | 10,000 | | | TransAct Technologies Inc.† | | | 68,904 | | | | 69,800 | |
| | 80,002 | | | Trans-Lux Corp.† | | | 24,495 | | | | 64,002 | |
| | | | | | | | 245,480 | | | | 310,506 | |
| | | | | Computer Software and Services — 1.2% | | | | | | | | |
| | 15,000 | | | Alithya Group Inc., Cl. A† | | | 36,707 | | | | 19,650 | |
| | 900 | | | Asetek A/S† | | | 706 | | | | 514 | |
| | 9,700 | | | Daktronics Inc.† | | | 48,656 | | | | 82,256 | |
| | 6,000 | | | NextNav Inc.† | | | 16,888 | | | | 26,700 | |
| | 60,000 | | | Pacific Online Ltd. | | | 12,358 | | | | 3,688 | |
| | 100 | | | SilverSun Technologies Inc. | | | 1,058 | | | | 1,711 | |
| | | | | | | | 116,373 | | | | 134,519 | |
| | | | | Consumer Products — 4.8% | | | | | | | | |
| | 11,000 | | | American Outdoor Brands Inc.† | | | 95,718 | | | | 92,400 | |
| | 2,000 | | | Aspen Group Inc.† | | | 244 | | | | 340 | |
| | 1,200 | | | CompX International Inc. | | | 17,148 | | | | 30,336 | |
| | 34,000 | | | Glatfelter Corp.† | | | 131,890 | | | | 65,960 | |
| | 430,000 | | | Goodbaby International Holdings Ltd.† | | | 43,507 | | | | 39,649 | |
| | 3,500 | | | HG Holdings Inc.† | | | 31,710 | | | | 20,422 | |
| | 7,300 | | | Lifecore Biomedical Inc.† | | | 75,105 | | | | 45,187 | |
| | 12,000 | | | Lifetime Brands Inc. | | | 71,355 | | | | 80,520 | |
| | 2,100 | | | Marine Products Corp. | | | 26,398 | | | | 23,940 | |
| | 4,000 | | | Nobility Homes Inc. | | | 113,208 | | | | 137,980 | |
| | 100 | | | Oil-Dri Corp. of America | | | 2,550 | | | | 6,708 | |
| | 71,000 | | | Playmates Holdings Ltd. | | | 10,621 | | | | 5,092 | |
| | | | | | | | 619,454 | | | | 548,534 | |
| | | | | Consumer Services — 1.9% | | | | | | | | |
| | 22,000 | | | Liberty TripAdvisor Holdings Inc., Cl. A† | | | 24,038 | | | | 18,700 | |
| | 285,000 | | | Tribal Group plc | | | 250,146 | | | | 201,255 | |
| | | | | | | | 274,184 | | | | 219,955 | |
| | | | | Diversified Industrial — 14.4% | | | | | | | | |
| | 12,000 | | | Advanced Emissions Solutions Inc.† | | | 21,108 | | | | 35,760 | |
| | 108,000 | | | Ampco-Pittsburgh Corp.† | | | 396,375 | | | | 294,840 | |
| | 9,500 | | | Ascent Industries Co.† | | | 93,840 | | | | 90,820 | |
| | 14,000 | | | Commercial Vehicle Group Inc.† | | | 125,711 | | | | 98,140 | |
| | 500 | | | Core Molding Technologies Inc.† | | | 5,890 | | | | 9,265 | |
| | 31,000 | | | Fluence Corp. Ltd.† | | | 7,940 | | | | 2,429 | |
| | 5,500 | | | Graham Corp.† | | | 40,862 | | | | 104,335 | |
| | 27,000 | | | INNOVATE Corp.† | | | 74,386 | | | | 33,210 | |
| | 40,000 | | | Intevac Inc.† | | | 210,247 | | | | 172,800 | |
| | 8,300 | | | Myers Industries Inc. | | | 157,995 | | | | 162,265 | |
| | 12,200 | | | Park-Ohio Holdings Corp. | | | 226,182 | | | | 328,912 | |
| | 3,000 | | | Perma-Fix Environmental Services Inc.† | | | 35,742 | | | | 23,580 | |
See accompanying notes to financial statements.
The Gabelli Global Mini Mites Fund
Schedule of Investments (Continued) — December 31, 2023
| Shares | | | | | Cost | | | Market
Value | |
| | | | | COMMON STOCKS (Continued) | | | | | | | | |
| | | | | Diversified Industrial (Continued) | | | | | | | | |
| | 2,900 | | | Servotronics Inc.† | | $ | 33,957 | | | $ | 36,250 | |
| | 26,500 | | | Tredegar Corp. | | | 226,408 | | | | 143,365 | |
| | 30,000 | | | Velan Inc. | | | 117,607 | | | | 121,354 | |
| | | | | | | | 1,774,250 | | | | 1,657,325 | |
| | | | | Electronics — 0.1% | | | | | | | | |
| | 200 | | | Bel Fuse Inc., Cl. B | | | 2,432 | | | | 13,354 | |
| | | | | | | | | | | | | |
| | | | | Energy and Utilities — 2.2% | | | | | | | | |
| | 2,900 | | | Capstone Green Energy Corp.† | | | 12,681 | | | | 609 | |
| | 400 | | | Consolidated Water Co. Ltd. | | | 4,084 | | | | 14,240 | |
| | 4,700 | | | Dril-Quip Inc.† | | | 99,440 | | | | 109,369 | |
| | 6,500 | | | RGC Resources Inc. | | | 123,929 | | | | 132,210 | |
| | | | | | | | 240,134 | | | | 256,428 | |
| | | | | Entertainment — 2.5% | | | | | | | | |
| | 30,000 | | | Entravision Communications Corp., Cl. A | | | 128,038 | | | | 125,100 | |
| | 500 | | | GameSquare Holdings Inc.† | | | 1,688 | | | | 887 | |
| | 8,400 | | | Inspired Entertainment Inc.† | | | 91,595 | | | | 82,992 | |
| | 13,000 | | | Reading International Inc., Cl. A† | | | 65,878 | | | | 24,830 | |
| | 6,000 | | | Reservoir Media Inc.† | | | 41,793 | | | | 42,780 | |
| | 10,000 | | | Sportech plc | | | 37,134 | | | | 10,707 | |
| | | | | | | | 366,126 | | | | 287,296 | |
| | | | | Equipment and Supplies — 8.3% | | | | | | | | |
| | 41,000 | | | Applied Optoelectronics Inc.† | | | 118,584 | | | | 792,120 | |
| | 4,000 | | | Ilika plc† | | | 2,231 | | | | 1,836 | |
| | 5,000 | | | The Eastern Co. | | | 108,340 | | | | 110,000 | |
| | 2,000 | | | Titan Machinery Inc.† | | | 46,334 | | | | 57,760 | |
| | | | | | | | 275,489 | | | | 961,716 | |
| | | | | Financial Services — 2.0% | | | | | | | | |
| | 1,000 | | | FNCB Bancorp Inc. | | | 6,398 | | | | 6,790 | |
| | 100,000 | | | GAM Holding AG† | | | 73,265 | | | | 46,549 | |
| | 700 | | | OceanFirst Financial Corp. | | | 10,321 | | | | 12,152 | |
| | 3,800 | | | Steel Partners Holdings LP† | | | 22,194 | | | | 152,000 | |
| | 5,500 | | | Tiny Ltd.† | | | 14,188 | | | | 9,173 | |
| | | | | | | | 126,366 | | | | 226,664 | |
| | | | | Food and Beverage — 3.2% | | | | | | | | |
| | 4,600 | | | Corby Spirit and Wine Ltd., Cl. A | | | 56,719 | | | | 45,373 | |
| | 32,000 | | | Farmer Brothers Co.† | | | 188,595 | | | | 97,920 | |
| | 500 | | | Hotel Chocolat Group plc† | | | 819 | | | | 2,358 | |
| | 7,000 | | | Lifeway Foods Inc.† | | | 71,333 | | | | 93,870 | |
| | 1,700 | | | Nathan’s Famous Inc. | | | 97,346 | | | | 132,617 | |
| | | | | | | | 414,812 | | | | 372,138 | |
Shares | | | | | Cost | | | Market
Value | |
| | | | | Health Care — 2.4% | | | | | | | | |
| | 35,000 | | | Accuray Inc.† | | $ | 114,350 | | | $ | 99,050 | |
| | 40,000 | | | Achaogen Inc.†(a) | | | 488 | | | | 0 | |
| | 5,500 | | | Axogen Inc.† | | | 43,637 | | | | 37,565 | |
| | 20,000 | | | Clovis Oncology Inc.† | | | 2,468 | | | | 0 | |
| | 2,400 | | | Cutera Inc.† | | | 21,201 | | | | 8,460 | |
| | 400 | | | Daxor Corp.† | | | 4,127 | | | | 3,836 | |
| | 4,500 | | | Electromed Inc.† | | | 45,893 | | | | 49,095 | |
| | 5,500 | | | Neuronetics Inc.† | | | 19,288 | | | | 15,950 | |
| | 2,900 | | | Oncimmune Holdings plc† | | | 3,575 | | | | 932 | |
| | 1,600 | | | Option Care Health Inc.† | | | 15,886 | | | | 53,904 | |
| | 1,300 | | | Tristel plc | | | 4,856 | | | | 7,622 | |
| | 200 | | | Zimvie Inc.† | | | 3,366 | | | | 3,550 | |
| | | | | | | | 279,135 | | | | 279,964 | |
| | | | | Hotels and Gaming — 2.2% | | | | | | | | |
| | 3,800 | | | Canterbury Park Holding Corp. | | | 49,727 | | | | 77,672 | |
| | 10,500 | | | Full House Resorts Inc.† | | | 56,474 | | | | 56,385 | |
| | 7,000 | | | Genius Sports Ltd.† | | | 38,648 | | | | 43,260 | |
| | 5,500 | | | The Marcus Corp. | | | 92,154 | | | | 80,190 | |
| | | | | | | | 237,003 | | | | 257,507 | |
| | | | | Machinery — 6.9% | | | | | | | | |
| | 6,000 | | | CFT SpA†(a) | | | 33,163 | | | | 30,469 | |
| | 15,500 | | | L.B. Foster Co., Cl. A† | | | 195,045 | | | | 340,845 | |
| | 15,000 | | | The L.S. Starrett Co., Cl. A† | | | 69,269 | | | | 181,500 | |
| | 15,043 | | | Twin Disc Inc. | | | 145,015 | | | | 243,095 | |
| | | | | | | | 442,492 | | | | 795,909 | |
| | | | | Metals and Mining — 0.6% | | | | | | | | |
| | 20,000 | | | Sierra Metals Inc.† | | | 6,129 | | | | 11,072 | |
| | 40,000 | | | Western Copper & Gold Corp.† | | | 66,662 | | | | 53,200 | |
| | | | | | | | 72,791 | | | | 64,272 | |
| | | | | Publishing — 0.0% | | | | | | | | |
| | 600 | | | DallasNews Corp. | | | 2,669 | | | | 2,562 | |
| | | | | | | | | | | | | |
| | | | | Real Estate — 0.7% | | | | | | | | |
| | 54,500 | | | Corem Property Group AB, Cl. B | | | 125,605 | | | | 57,385 | |
| | 2,500 | | | Gyrodyne LLC† | | | 21,715 | | | | 23,688 | |
| | 20,000 | | | Trinity Place Holdings Inc.† | | | 22,006 | | | | 2,220 | |
| | | | | | | | 169,326 | | | | 83,293 | |
| | | | | Retail — 2.0% | | | | | | | | |
| | 3,300 | | | Bassett Furniture Industries Inc. | | | 53,217 | | | | 54,780 | |
| | 6,700 | | | Village Super Market Inc., Cl. A | | | 152,828 | | | | 175,741 | |
| | 2,200 | | | Vroom Inc.† | | | 3,179 | | | | 1,326 | |
| | | | | | | | 209,224 | | | | 231,847 | |
See accompanying notes to financial statements.
The Gabelli Global Mini Mites Fund
Schedule of Investments (Continued) — December 31, 2023
| Shares | | | | | Cost | | | Market
Value | |
| | | | | COMMON STOCKS (Continued) | | | | | | | | |
| | | | | Specialty Chemicals — 1.9% | | | | | | | | |
| | 10,000 | | | American Vanguard Corp. | | $ | 181,759 | | | $ | 109,700 | |
| | 17,500 | | | Treatt plc | | | 101,130 | | | | 112,201 | |
| | | | | | | | 282,889 | | | | 221,901 | |
| | | | | Telecommunications — 0.0% | | | | | | | | |
| | 700 | | | Bittium Oyj | | | 4,945 | | | | 3,717 | |
| | | | | | | | | | | | | |
| | | | | Wireless Telecommunications Services — 0.1% | | | | | | | | |
| �� | 22,877 | | | NII Holdings Inc., Escrow† | | | 442 | | | | 8,007 | |
| | | | | | | | | | | | | |
| | | | | TOTAL COMMON STOCKS | | | 7,506,836 | | | | 8,256,345 | |
| | | | | | | | | | | | | |
| | | | | RIGHTS — 0.0% | | | | | | | | |
| | | | | Diversified Industrial — 0.0% | | | | | | | | |
| | 12,400 | | | Fluence Corp. Ltd., expire 12/29/23† | | | 0 | | | | 361 | |
| | | | | | | | | | | | | |
| | | | | Health Care — 0.0% | | | | | | | | |
| | 16,000 | | | Epizyme Inc., CVR† | | | 0 | | | | 320 | |
| | 30,000 | | | Paratek Pharmaceuticals Inc., CVR† | | | 0 | | | | 600 | |
| | | | | | | | 0 | | | | 920 | |
| | | | | TOTAL RIGHTS | | | 0 | | | | 1,281 | |
| | | | | | | | | | | | | |
| | | | | WARRANTS — 0.1% | | | | | | | | |
| | | | | Business Services — 0.0% | | | | | | | | |
| | 4 | | | Internap Corp., expire 05/08/24†(a) | | | 0 | | | | 2,608 | |
| | | | | | | | | | | | | |
| | | | | Diversified Industrial — 0.1% | | | | | | | | |
| | 44,000 | | | Ampco-Pittsburgh Corp., expire 08/01/25† | | | 30,056 | | | | 5,280 | |
| | | | | TOTAL WARRANTS | | | 30,056 | | | | 7,888 | |
Principal
Amount | | | | | | | | | |
| | | | | U.S. GOVERNMENT OBLIGATIONS — 22.3% | | | | | | | | |
| $ | 2,600,000 | | | U.S. Treasury Bills, 5.244% to 5.372%††, 01/16/24 to 03/21/24 | | | 2,579,888 | | | | 2,580,381 | |
| | | | | | | | | | | | | |
| | | | | TOTAL INVESTMENTS — 93.9% | | $ | 10,116,780 | | | | 10,845,895 | |
| | | | | | | | | | | | | |
| | | | | Other Assets and Liabilities (Net) — 6.1% | | | | | | | 704,780 | |
| | | | | | | | | | | | | |
| | | | | NET ASSETS — 100.0% | | | | | | $ | 11,550,675 | |
| (a) | Security is valued using significant unobservable inputs and is classified as Level 3 in the fair value hierarchy. |
| † | Non-income producing security. |
| †† | Represents annualized yields at dates of purchase. |
| | | |
| CVR | Contingent Value Right |
| Geographic Diversification | | % of
Market
Value | | | Market
Value | |
| United States | | | 89.0 | % | | $ | 9,647,804 | |
| Europe | | | 7.8 | | | | 850,065 | |
| Canada | | | 2.6 | | | | 285,357 | |
| Asia/Pacific | | | 0.5 | | | | 48,429 | |
| Latin America | | | 0.1 | | | | 14,240 | |
| | | | 100.0 | % | | $ | 10,845,895 | |
See accompanying notes to financial statements.
The Gabelli Global Mini Mites Fund
Statement of Assets and Liabilities
December 31, 2023
| Assets: | | | | |
| Investments, at value (cost $10,116,780) | | $ | 10,845,895 | |
| Cash | | | 4,485 | |
| Receivable for Fund shares sold | | | 763,600 | |
| Receivable for investments sold | | | 1,090 | |
| Receivable from Adviser | | | 11,446 | |
| Dividends receivable | | | 7,328 | |
| Prepaid expenses | | | 21,818 | |
| Total Assets | | | 11,655,662 | |
| Liabilities: | | | | |
| Payable for investments purchased | | | 45,345 | |
| Payable for investment advisory fees | | | 8,487 | |
| Payable for distribution fees | | | 34 | |
| Payable for shareholder communications | | | 19,389 | |
| Payable for legal and audit fees | | | 14,523 | |
| Payable for custodian fees | | | 7,225 | |
| Other accrued expenses | | | 9,984 | |
| Total Liabilities | | | 104,987 | |
| Net Assets | | | | |
| (applicable to 1,059,896 shares outstanding) | | $ | 11,550,675 | |
| Net Assets Consist of: | | | | |
| Paid-in capital | | $ | 10,947,875 | |
| Total distributable earnings | | | 602,800 | |
| Net Assets | | $ | 11,550,675 | |
| | | | | |
| Shares of Capital Stock, each at $0.001 par value: | | | | |
| Class AAA: | | | | |
| Net Asset Value, offering, and redemption price per share ($92,300 ÷ 8,469 shares outstanding; 75,000,000 shares authorized) | | $ | 10.90 | |
| Class A: | | | | |
| Net Asset Value and redemption price per share ($15,485 ÷ 1,422 shares outstanding; 50,000,000 shares authorized) | | $ | 10.89 | |
| Maximum offering price per share (NAV ÷ 0.9425, based on maximum sales charge of 5.75% of the offering price) | | $ | 11.55 | |
| Class C: | | | | |
| Net Asset Value and redemption price per share ($15,368 ÷ 1,416 shares outstanding; 25,000,000 shares authorized) | | $ | 10.85 | |
| Class I: | | | | |
| Net Asset Value, offering, and redemption price per share ($11,427,522 ÷ 1,048,589 shares outstanding; 25,000,000 shares authorized) | | $ | 10.90 | |
Statement of Operations
For the Year Ended December 31, 2023
| Investment Income: | | | | |
| Dividends (net of foreign withholding taxes of $1,418) | | $ | 92,006 | |
| Interest | | | 39,189 | |
| Total Investment Income | | | 131,195 | |
| Expenses: | | | | |
| Investment advisory fees | | | 79,817 | |
| Distribution fees - Class AAA | | | 193 | |
| Distribution fees - Class A | | | 32 | |
| Distribution fees - Class C | | | 128 | |
| Registration expenses | | | 44,450 | |
| Legal and audit fees | | | 44,429 | |
| Shareholder communications expenses | | | 34,781 | |
| Shareholder services fees | | | 15,221 | |
| Custodian fees | | | 12,965 | |
| Administration out-of-pocket fees | | | 9,236 | |
| Directors’ fees | | | 2,657 | |
| Miscellaneous expenses | | | 5,300 | |
| Total Expenses | | | 249,209 | |
| Less: | | | | |
| Expense reimbursements (See Note 3) | | | (176,163 | ) |
| Expenses paid indirectly by broker (See Note 6) | | | (1,210 | ) |
| Total Reimbursements and Credits | | | (177,373 | ) |
| Net Expenses | | | 71,836 | |
| Net Investment Income | | | 59,359 | |
| | | | | |
| Net Realized and Unrealized Gain/(Loss) on Investments and Foreign Currency: | | | | |
| Net realized gain on investments | | | 988,608 | |
| Net realized loss on foreign currency transactions | | | (1,343 | ) |
| Net realized gain on investments and foreign currency transactions | | | 987,265 | |
| Net change in unrealized appreciation/depreciation: | | | | |
| on investments | | | 1,667,226 | |
| on foreign currency translations | | | 3 | |
| Net change in unrealized appreciation/depreciation on investments and foreign currency translations | | | 1,667,229 | |
| Net Realized and Unrealized Gain/(Loss) on Investments and Foreign Currency | | | 2,654,494 | |
| Net Increase in Net Assets Resulting from Operations | | $ | 2,713,853 | |
See accompanying notes to financial statements.
The Gabelli Global Mini Mites Fund
Statement of Changes in Net Assets
| | | Year Ended | | | Year Ended | |
| | | December 31,
2023 | | | December 31,
2022 | |
| Operations: | | | | | | | | |
| Net investment income | | $ | 59,359 | | | $ | 34,896 | |
| Net realized gain on investments and foreign currency transactions | | | 987,265 | | | | 280,973 | |
| Net change in unrealized appreciation/depreciation on investments and foreign currency translations | | | 1,667,229 | | | | (1,500,758 | ) |
| Net Increase/(Decrease) in Net Assets Resulting from Operations | | | 2,713,853 | | | | (1,184,889 | ) |
| | | | | | | | | |
| Distributions to Shareholders: | | | | | | | | |
| Accumulated earnings | | | | | | | | |
| Class AAA | | | (9,263 | ) | | | (3,882 | ) |
| Class A | | | (1,554 | ) | | | (651 | ) |
| Class C | | | (1,543 | ) | | | (647 | ) |
| Class I | | | (1,060,429 | ) | | | (376,682 | ) |
| Total Distributions to Shareholders | | | (1,072,789 | ) | | | (381,862 | ) |
| | | | | | | | | |
| Capital Share Transactions: | | | | | | | | |
| Class AAA | | | 9,263 | | | | 678 | |
| Class A | | | 1,554 | | | | 651 | |
| Class C | | | 1,543 | | | | 647 | |
| Class I | | | 3,368,510 | | | | 1,183,267 | |
| Net Increase in Net Assets from Capital Share Transactions | | | 3,380,870 | | | | 1,185,243 | |
| | | | | | | | | |
| Net Increase/(Decrease) in Net Assets | | | 5,021,934 | | | | (381,508 | ) |
| | | | | | | | | |
| Net Assets: | | | | | | | | |
| Beginning of year | | | 6,528,741 | | | | 6,910,249 | |
| End of year | | $ | 11,550,675 | | | $ | 6,528,741 | |
See accompanying notes to financial statements.
The Gabelli Global Mini Mites Fund
Financial Highlights
Selected data for a share of capital stock outstanding throughout each year:
| | | | | | | Income (Loss) from Investment Operations | | | Distributions | | | | | | | | | | | | | | | Ratios to Average Net Assets/Supplemental Data | |
| Year Ended December 31 | | Net Asset Value, Beginning of Year | | | Net Investment Income (Loss)(a) | | | Net Realized and Unrealized Gain (Loss) on Investments | | | Total from Investment Operations | | | Net Investment Income | | | Net Realized Gain on Investments | | | Total Distributions | | | Redemption Fees(a)(b) | | | Net Asset Value, End of Year | | | Total Return† | | | Net Assets, End of Year (in 000’s) | | | Net Investment Income (Loss) | | | Operating Expenses Before Reimbursement | | | Operating Expenses Net of Reimbursement(c) | | | Portfolio Turnover Rate | |
| Class AAA | | | | | | | | | | |
| 2023 | | $ | 8.70 | | | $ | 0.07 | | | $ | 3.35 | | | $ | 3.42 | | | $ | (0.07 | ) | | $ | (1.15 | ) | | $ | (1.22 | ) | | $ | — | | | $ | 10.90 | | | | 39.05 | % | | $ | 92 | | | | 0.74 | % | | | 3.37 | % | | | 0.90 | %(d) | | | 42 | % |
| 2022 | | | 11.04 | | | | 0.05 | | | | (1.85 | ) | | | (1.80 | ) | | | (0.05 | ) | | | (0.49 | ) | | | (0.54 | ) | | | — | | | | 8.70 | | | | (16.17 | ) | | | 67 | | | | 0.52 | | | | 3.40 | | | | 0.90 | (d)(e) | | | 30 | |
| 2021 | | | 10.67 | | | | (0.02 | ) | | | 2.04 | | | | 2.02 | | | | (0.07 | ) | | | (1.58 | ) | | | (1.65 | ) | | | 0.00 | | | | 11.04 | | | | 19.25 | | | | 83 | | | | (0.17 | ) | | | 3.49 | | | | 0.90 | (d)(f) | | | 79 | |
| 2020 | | | 9.26 | | | | 0.05 | | | | 1.42 | | | | 1.47 | | | | (0.06 | ) | | | — | | | | (0.06 | ) | | | — | | | | 10.67 | | | | 15.87 | | | | 120 | | | | 0.61 | | | | 9.40 | | | | 0.90 | (d) | | | 63 | |
| 2019 | | | 8.62 | | | | 0.05 | | | | 0.94 | | | | 0.99 | | | | (0.04 | ) | | | (0.31 | ) | | | (0.35 | ) | | | — | | | | 9.26 | | | | 11.49 | | | | 114 | | | | 0.53 | | | | 10.81 | | | | 1.23 | (e) | | | 131 | |
| Class A | | | | | | | | | | |
| 2023 | | $ | 8.70 | | | $ | 0.07 | | | $ | 3.34 | | | $ | 3.41 | | | $ | (0.07 | ) | | $ | (1.15 | ) | | $ | (1.22 | ) | | $ | — | | | $ | 10.89 | | | | 38.93 | % | | $ | 16 | | | | 0.74 | % | | | 3.37 | % | | | 0.90 | %(d) | | | 42 | % |
| 2022 | | | 11.04 | | | | 0.05 | | | | (1.85 | ) | | | (1.80 | ) | | | (0.05 | ) | | | (0.49 | ) | | | (0.54 | ) | | | — | | | | 8.70 | | | | (16.17 | ) | | | 11 | | | | 0.52 | | | | 3.40 | | | | 0.90 | (d)(e) | | | 30 | |
| 2021 | | | 10.66 | | | | (0.02 | ) | | | 2.05 | | | | 2.03 | | | | (0.07 | ) | | | (1.58 | ) | | | (1.65 | ) | | | 0.00 | | | | 11.04 | | | | 19.38 | | | | 13 | | | | (0.18 | ) | | | 3.49 | | | | 0.90 | (d)(f) | | | 79 | |
| 2020 | | | 9.26 | | | | 0.05 | | | | 1.41 | | | | 1.46 | | | | (0.06 | ) | | | — | | | | (0.06 | ) | | | — | | | | 10.66 | | | | 15.76 | | | | 11 | | | | 0.66 | | | | 9.40 | | | | 0.90 | (d) | | | 63 | |
| 2019 | | | 8.62 | | | | 0.04 | | | | 0.95 | | | | 0.99 | | | | (0.04 | ) | | | (0.31 | ) | | | (0.35 | ) | | | — | | | | 9.26 | | | | 11.47 | | | | 10 | | | | 0.43 | | | | 10.81 | | | | 1.23 | (e) | | | 131 | |
| Class C | | | | | | | | | | |
| 2023 | | $ | 8.66 | | | $ | 0.07 | | | $ | 3.33 | | | $ | 3.40 | | | $ | (0.07 | ) | | $ | (1.14 | ) | | $ | (1.21 | ) | | $ | — | | | $ | 10.85 | | | | 39.06 | % | | $ | 15 | | | | 0.74 | % | | | 4.12 | % | | | 0.90 | %(d) | | | 42 | % |
| 2022 | | | 11.00 | | | | 0.05 | | | | (1.85 | ) | | | (1.80 | ) | | | (0.05 | ) | | | (0.49 | ) | | | (0.54 | ) | | | — | | | | 8.66 | | | | (16.25 | ) | | | 11 | | | | 0.52 | | | | 4.15 | | | | 0.90 | (d)(e) | | | 30 | |
| 2021 | | | 10.63 | | | | (0.02 | ) | | | 2.04 | | | | 2.02 | | | | (0.07 | ) | | | (1.58 | ) | | | (1.65 | ) | | | 0.00 | | | | 11.00 | | | | 19.34 | | | | 13 | | | | (0.18 | ) | | | 4.24 | | | | 0.90 | (d)(f) | | | 79 | |
| 2020 | | | 9.23 | | | | 0.05 | | | | 1.41 | | | | 1.46 | | | | (0.06 | ) | | | — | | | | (0.06 | ) | | | — | | | | 10.63 | | | | 15.81 | | | | 11 | | | | 0.66 | | | | 10.15 | | | | 0.90 | (d) | | | 63 | |
| 2019 | | | 8.61 | | | | (0.02 | ) | | | 0.95 | | | | 0.93 | | | | (0.00 | )(b) | | | (0.31 | ) | | | (0.31 | ) | | | — | | | | 9.23 | | | | 10.83 | | | | 9 | | | | (0.25 | ) | | | 11.56 | | | | 1.92 | (e) | | | 131 | |
| Class I | | | | | | | | | | |
| 2023 | | $ | 8.70 | | | $ | 0.08 | | | $ | 3.34 | | | $ | 3.42 | | | $ | (0.07 | ) | | $ | (1.15 | ) | | $ | (1.22 | ) | | $ | — | | | $ | 10.90 | | | | 39.05 | % | | $ | 11,428 | | | | 0.74 | % | | | 3.12 | % | | | 0.90 | %(d) | | | 42 | % |
| 2022 | | | 11.04 | | | | 0.05 | | | | (1.85 | ) | | | (1.80 | ) | | | (0.05 | ) | | | (0.49 | ) | | | (0.54 | ) | | | — | | | | 8.70 | | | | (16.17 | ) | | | 6,440 | | | | 0.52 | | | | 3.15 | | | | 0.90 | (d)(e) | | | 30 | |
| 2021 | | | 10.67 | | | | (0.02 | ) | | | 2.04 | | | | 2.02 | | | | (0.07 | ) | | | (1.58 | ) | | | (1.65 | ) | | | 0.00 | | | | 11.04 | | | | 19.25 | | | | 6,801 | | | | (0.18 | ) | | | 3.24 | | | | 0.90 | (d)(f) | | | 79 | |
| 2020 | | | 9.26 | | | | 0.09 | | | | 1.38 | | | | 1.47 | | | | (0.06 | ) | | | — | | | | (0.06 | ) | | | — | | | | 10.67 | | | | 15.87 | | | | 3,922 | | | | 1.11 | | | | 9.15 | | | | 0.90 | (d) | | | 63 | |
| 2019 | | | 8.61 | | | | 0.08 | | | | 0.94 | | | | 1.02 | | | | (0.06 | ) | | | (0.31 | ) | | | (0.37 | ) | | | — | | | | 9.26 | | | | 11.84 | | | | 1,605 | | | | 0.84 | | | | 10.56 | | | | 1.00 | (e) | | | 131 | |
| † | Total return represents aggregate total return of a hypothetical investment at the beginning of the year and sold at the end of the year including reinvestment of distributions and does not reflect the applicable sales charges. |
| (a) | Per share amounts have been calculated using the average shares outstanding method. |
| (b) | Amount represents less than $0.005 per share. |
| (c) | Under an expense reimbursement agreement with the Adviser, the Adviser reimbursed expenses of $176,163, $148,978, $147,312, $163,109, and $126,588 for the years ended December 31, 2023, 2022, 2021, 2020, and 2019, respectively. |
| (d) | The Fund received credits from a designated broker who agreed to pay certain Fund operating expenses for the years ended December 31, 2023, 2022, 2021, and 2020. If such credits had not been received, the ratios of operating expenses to average net assets would have been 0.92%, 0.92%, 0.92%, and 0.96% for each Class, respectively. |
| (e) | The Fund incurred interest expense. For the year ended December 31, 2022, the impact was minimal. For the year ended December 31, 2019, if interest expense had not been incurred, the ratio of operating expenses to average net assets would have been 1.22% (Class AAA and Class A),1.90% (Class C), and 0.99% (Class I), respectively. |
| (f) | The Fund incurred tax expense for the year ended December 31, 2021 and there was no impact on the expense ratios. |
See accompanying notes to financial statements.
The Gabelli Global Mini Mites Fund
Notes to Financial Statements
1. Organization. The Gabelli Global Mini Mites Fund, a series of the GAMCO Global Series Funds, Inc. (the Corporation), was incorporated on July 16, 1993 in Maryland. The Fund is a non-diversified open-end management investment company registered under the Investment Company Act of 1940, as amended (the 1940 Act), and is one of five separately managed portfolios (collectively, the Portfolios) of the Corporation. The Fund’s primary objective is long term capital appreciation by investing primarily in micro-capitalization equity securities. The Fund commenced investment operations on October 1, 2018.
2. Significant Accounting Policies. As an investment company, the Fund follows the investment company accounting and reporting guidance, which is part of U.S. generally accepted accounting principles (GAAP) that may require the use of management estimates and assumptions in the preparation of its financial statements. Actual results could differ from those estimates. The following is a summary of significant accounting policies followed by the Fund in the preparation of its financial statements.
Security Valuation. Portfolio securities listed or traded on a nationally recognized securities exchange or traded in the U.S. over-the-counter market for which market quotations are readily available are valued at the last quoted sale price or a market’s official closing price as of the close of business on the day the securities are being valued. If there were no sales that day, the security is valued at the average of the closing bid and asked prices or, if there were no asked prices quoted on that day, then the security is valued at the closing bid price on that day. If no bid or asked prices are quoted on such day, the security is valued at the most recently available price or, if the Board of Directors (the Board) so determines, by such other method as the Board shall determine in good faith to reflect its fair market value. Portfolio securities traded on more than one national securities exchange or market are valued according to the broadest and most representative market, as determined by Gabelli Funds, LLC (the Adviser).
Portfolio securities primarily traded on a foreign market are generally valued at the preceding closing values of such securities on the relevant market, but may be fair valued pursuant to procedures established by the Board if market conditions change significantly after the close of the foreign market, but prior to the close of business on the day the securities are being valued. Debt obligations for which market quotations are readily available are valued at the average of the latest bid and asked prices. If there were no asked prices quoted on such day, the security is valued using the closing bid price. Such debt obligations are valued through prices provided by a pricing service approved by the Board. Certain securities are valued principally using dealer quotations.
Securities and assets for which market quotations are not readily available are fair valued as determined by the Board. Fair valuation methodologies and procedures may include, but are not limited to: analysis and review of available financial and non-financial information about the company; comparisons with the valuation and changes in valuation of similar securities, including a comparison of foreign securities with the equivalent U.S. dollar value American Depositary Receipt securities at the close of the U.S. exchange; and evaluation of any other information that could be indicative of the value of the security.
The Fund employs a fair value model to adjust prices to reflect events affecting the values of certain portfolio securities which occur between the close of trading on the principal market for such securities (foreign exchanges and over-the-counter markets) at the time when net asset values of the Fund are determined. If the Fund’s valuation committee believes that a particular event would materially affect net asset value, further adjustment is considered. Such securities are classified as Level 2 in the fair value hierarchy presented below.
The Gabelli Global Mini Mites Fund
Notes to Financial Statements (Continued)
The inputs and valuation techniques used to measure fair value of the Fund’s investments are summarized into three levels as described in the hierarchy below:
| ● | Level 1 — quoted prices in active markets for identical securities; |
| ● | Level 2 — other significant observable inputs (including quoted prices for similar securities, interest rates, prepayment speeds, credit risk, etc.); and |
| ● | Level 3 — significant unobservable inputs (including the Board’s determinations as to the fair value of investments). |
A financial instrument’s level within the fair value hierarchy is based on the lowest level of any input both individually and in the aggregate that is significant to the fair value measurement. The inputs or methodology used for valuing securities are not necessarily an indication of the risk associated with investing in those securities.
The summary of the Fund’s investments in securities by inputs used to value the Fund’s investments as of December 31, 2023 is as follows:
| | | Valuation Inputs | | | | |
| | | Level 1
Quoted Prices | | | Level 2 Other
Significant
Observable Inputs | | | Level 3 Significant
Unobservable
Inputs (a) | | |
Total Market Value
at 12/31/23 | |
| INVESTMENTS IN SECURITIES: | | | | | | | | | | | | | | | | |
| ASSETS (Market Value): | | | | | | | | | | | | | | | | |
| Common Stocks: | | | | | | | | | | | | | | | | |
| Business Services | | $ | 284,093 | | | $ | 397 | | | $ | 26,016 | | | $ | 310,506 | |
| Energy and Utilities | | | 255,819 | | | | 609 | | | | — | | | | 256,428 | |
| Entertainment | | | 276,589 | | | | 10,707 | | | | — | | | | 287,296 | |
| Health Care | | | 279,964 | | | | 0 | | | | 0 | | | | 279,964 | |
| Machinery | | | 765,440 | | | | — | | | | 30,469 | | | | 795,909 | |
| Wireless Telecommunications Services | | | — | | | | 8,007 | | | | — | | | | 8,007 | |
| Other Industries (b) | | | 6,318,235 | | | | — | | | | — | | | | 6,318,235 | |
| Total Common Stocks | | | 8,180,140 | | | | 19,720 | | | | 56,485 | | | | 8,256,345 | |
| Rights (b) | | | — | | | | 1,281 | | | | — | | | | 1,281 | |
| Warrants (b) | | | 5,280 | | | | — | | | | 2,608 | | | | 7,888 | |
| U.S. Government Obligations | | | — | | | | 2,580,381 | | | | — | | | | 2,580,381 | |
| TOTAL INVESTMENTS IN SECURITIES – ASSETS | | $ | 8,185,420 | | | $ | 2,601,382 | | | $ | 59,093 | | | $ | 10,845,895 | |
| (a) | The inputs for these securities are not readily available and are derived based on the judgment of the Adviser according to procedures approved by the Board. |
| (b) | Please refer to the Schedule of Investments for the industry classifications of these portfolio holdings. |
During the year ended December 31, 2023, the Fund did not have transfers into or out of Level 3. The Fund’s policy is to recognize transfers among levels as of the beginning of the reporting period.
The Gabelli Global Mini Mites Fund
Notes to Financial Statements (Continued)
The following table reconciles Level 3 investments:
| | | Balance
as of
12/31/22 | | | Accrued
discounts/
(premiums) | | | Realized
gain/ (loss) | | | Net Change
in unrealized
appreciation/
depreciation† | | | Return of
capital | | | Purchases | | | Sales | | | Transfers
Into
Level 3 | | | Transfers
Out of
Level 3 | | | Balance
as of
12/31/23 | | | Net change
in unrealized
appreciation/
depreciation
during the
period on
Level 3
investments
still held at
12/31/23† | |
| INVESTMENTS IN SECURITIES: | | | | | | | | | | | | | | | | | | | | | | | | | | | | | | | | | | | | | | | | | | | | |
| ASSETS (Market Value): | | | | | | | | | | | | | | | | | | | | | | | | | | | | | | | | | | | | | | | | | | | | |
| Common Stocks (a) | | $ | 68,544 | | | | — | | | $ | 180 | | | $ | 26,941 | | | $ | (39,180 | ) | | | — | | | | — | | | | — | | | | — | | | $ | 56,485 | | | $ | 26,941 | |
| Warrants (a) | | | 2,608 | | | | — | | | | — | | | | — | | | | — | | | | — | | | | — | | | | — | | | | — | | | | 2,608 | | | | — | |
| TOTAL INVESTMENTS IN SECURITIES | | $ | 71,152 | | | | — | | | $ | 180 | | | $ | 26,941 | | | $ | (39,180 | ) | | | — | | | | — | | | | — | | | | — | | | $ | 59,093 | | | $ | 26,941 | |
| (a) | Please refer to the Schedule of Investments for the industry classifications of these portfolio holdings. |
| † | Net change in unrealized appreciation/depreciation on investments is included in the related amounts in the Statement of Operations. |
Additional Information to Evaluate Qualitative Information.
General. The Fund uses recognized industry pricing services – approved by the Board and unaffiliated with the Adviser – to value most of its securities, and uses broker quotes provided by market makers of securities not valued by these and other recognized pricing sources. Several different pricing feeds are received to value domestic equity securities, international equity securities, preferred equity securities, and fixed income securities. The data within these feeds are ultimately sourced from major stock exchanges and trading systems where these securities trade. The prices supplied by external sources are checked by obtaining quotations or actual transaction prices from market participants. If a price obtained from the pricing source is deemed unreliable, prices will be sought from another pricing service or from a broker/dealer that trades that security or similar securities.
Fair Valuation. Fair valued securities may be common or preferred equities, warrants, options, rights, or fixed income obligations. Where appropriate, Level 3 securities are those for which market quotations are not available, such as securities not traded for several days, or for which current bids are not available, or which are restricted as to transfer. When fair valuing a security, factors to consider include recent prices of comparable securities that are publicly traded, reliable prices of securities not publicly traded, the use of valuation models, current analyst reports, valuing the income or cash flow of the issuer, or cost if the preceding factors do not apply. A significant change in the unobservable inputs could result in a lower or higher value in Level 3 securities. The circumstances of Level 3 securities are frequently monitored to determine if fair valuation measures continue to apply.
The Adviser reports quarterly to the Board the results of the application of fair valuation policies and procedures. These may include backtesting the prices realized in subsequent trades of these fair valued securities to fair values previously recognized.
The Gabelli Global Mini Mites Fund
Notes to Financial Statements (Continued)
Foreign Currency Translations. The books and records of the Fund are maintained in U.S. dollars. Foreign currencies, investments, and other assets and liabilities are translated into U.S. dollars at current exchange rates. Purchases and sales of investment securities, income, and expenses are translated at the exchange rate prevailing on the respective dates of such transactions. Unrealized gains and losses that result from changes in foreign exchange rates and/or changes in market prices of securities have been included in unrealized appreciation/depreciation on investments and foreign currency translations. Net realized foreign currency gains and losses resulting from changes in exchange rates include foreign currency gains and losses between trade date and settlement date on investment securities transactions, foreign currency transactions, and the difference between the amounts of interest and dividends recorded on the books of the Fund and the amounts actually received. The portion of foreign currency gains and losses related to fluctuation in exchange rates between the initial purchase trade date and subsequent sale trade date is included in realized gain/(loss) on investments.
Foreign Securities. The Fund may directly purchase securities of foreign issuers. Investing in securities of foreign issuers involves special risks not typically associated with investing in securities of U.S. issuers. The risks include possible revaluation of currencies, the inability to repatriate funds, less complete financial information about companies, and possible future adverse political and economic developments. Moreover, securities of many foreign issuers and their markets may be less liquid and their prices more volatile than securities of comparable U.S. issuers.
Foreign Taxes. The Fund may be subject to foreign taxes on income, gains on investments, or currency repatriation, a portion of which may be recoverable. The Fund will accrue such taxes and recoveries as applicable, based upon its current interpretation of tax rules and regulations that exist in the markets in which it invests.
Restricted Securities. The Fund may invest up to 15% of its net assets in securities for which the markets are restricted. Restricted securities include securities whose disposition is subject to substantial legal or contractual restrictions. The sale of restricted securities often requires more time and results in higher brokerage charges or dealer discounts and other selling expenses than the sale of securities eligible for trading on national securities exchanges or in the over-the-counter markets. Restricted securities may sell at a price lower than similar securities that are not subject to restrictions on resale. Securities freely saleable among qualified institutional investors under special rules adopted by the SEC may be treated as liquid if they satisfy liquidity standards established by the Board. The continued liquidity of such securities is not as well assured as that of publicly traded securities, and accordingly the Board will monitor their liquidity. At December 31, 2023, the Fund did not hold any restricted securities.
Securities Transactions and Investment Income. Securities transactions are accounted for on the trade date with realized gain/(loss) on investments determined by using the identified cost method. Interest income (including amortization of premium and accretion of discount) is recorded on an accrual basis. Premiums and discounts on debt securities are amortized using the effective yield to maturity method or amortized to earliest call date, if applicable. Dividend income is recorded on the ex-dividend date, except for certain dividends from foreign securities that are recorded as soon after the ex-dividend date as the Fund becomes aware of such dividends.
Determination of Net Asset Value and Calculation of Expenses. Certain administrative expenses are common to, and allocated among, various affiliated funds. Such allocations are made on the basis of each fund’s average net assets or other criteria directly affecting the expenses as determined by the Adviser pursuant to procedures established by the Board.
The Gabelli Global Mini Mites Fund
Notes to Financial Statements (Continued)
In calculating the NAV per share of each class, investment income, realized and unrealized gains and losses, redemption fees, and expenses other than class specific expenses are allocated daily to each class of shares based upon the proportion of net assets of each class at the beginning of each day. Distribution expenses are borne solely by the class incurring the expense.
Distributions to Shareholders. Distributions to shareholders are recorded on the ex-dividend date. Distributions to shareholders are based on income and capital gains as determined in accordance with federal income tax regulations, which may differ from income and capital gains as determined under GAAP. These differences are primarily due to differing treatments of income and gains on various investment securities and foreign currency transactions held by the Fund, timing differences, and differing characterizations of distributions made by the Fund. Distributions from net investment income for federal income tax purposes include net realized gains on foreign currency transactions. These book/tax differences are either temporary or permanent in nature. To the extent these differences are permanent, adjustments are made to the appropriate capital accounts in the period when the differences arise. Permanent differences were primarily due to tax treatment of currency gains and losses. These reclassifications have no impact on the net asset value (NAV) per share of the Fund. For the year ended December 31, 2023, no reclassifications were made in the Fund.
The tax character of distributions paid during the years ended December 31, 2023 and 2022 was as follows:
| | | Year Ended
December 31,
2023 | | | Year Ended
December 31,
2022 | |
| Distributions paid from: | | | | | | | | |
| Ordinary income (inclusive of short term capital gains) | | $ | 529,059 | | | $ | 34,661 | |
| Net long term capital gains | | | 543,730 | | | | 347,201 | |
| Total distributions paid | | $ | 1,072,789 | | | $ | 381,862 | |
Provision for Income Taxes. The Fund intends to continue to qualify as a regulated investment company under Subchapter M of the Internal Revenue Code of 1986, as amended (the Code). It is the policy of the Fund to comply with the requirements of the Code applicable to regulated investment companies and to distribute substantially all of its net investment company taxable income and net capital gains. Therefore, no provision for federal income taxes is required.
At December 31, 2023, the components of accumulated earnings/losses on a tax basis were as follows:
| Undistributed ordinary income | | $ | 1,988 | |
| Undistributed long term capital gains | | | 33,545 | |
| Net unrealized appreciation on investments and foreign currency translations | | | 567,267 | |
| Total | | $ | 602,800 | |
At December 31, 2023, the temporary difference between book basis and tax basis unrealized appreciation was primarily due to deferral of losses from wash sales for tax purposes, adjustments on partnerships, and investments no longer considered passive foreign investment companies.
The Gabelli Global Mini Mites Fund
Notes to Financial Statements (Continued)
The following summarizes the tax cost of investments and the related net unrealized appreciation at December 31, 2023:
| | | Cost | | | Gross
Unrealized
Appreciation | | | Gross
Unrealized
Depreciation | | | Net
Unrealized
Appreciation | |
| Investments | | $ | 10,278,627 | | | $ | 2,011,128 | | | $ | (1,443,860 | ) | | $ | 567,268 | |
The Fund is required to evaluate tax positions taken or expected to be taken in the course of preparing the Fund’s tax returns to determine whether the tax positions are “more-likely-than-not” of being sustained by the applicable tax authority. Income tax and related interest and penalties would be recognized by the Fund as tax expense in the Statement of Operations if the tax positions were deemed not to meet the more-likely-than-not threshold. During the year ended December 31, 2023, the Fund did not incur any income tax, interest, or penalties. As of December 31, 2023, the Adviser has reviewed all open tax years and concluded that there was no impact to the Fund’s net assets or results of operations. The Fund’s federal and state tax returns for the prior three fiscal years remain open, subject to examination. On an ongoing basis, the Adviser will monitor the Fund’s tax positions to determine if adjustments to this conclusion are necessary.
3. Investment Advisory Agreement and Other Transactions. The Fund has entered into an investment advisory agreement (the Advisory Agreement) with the Adviser which provides that the Fund will pay the Adviser a fee, computed daily and paid monthly, at the annual rate of 1.00% of the value of its average daily net assets. In accordance with the Advisory Agreement, the Adviser provides a continuous investment program for the Fund’s portfolio, oversees the administration of all aspects of the Fund’s business and affairs, and pays the compensation of all Officers and Directors of the Fund who are affiliated persons of the Adviser.
The Adviser has contractually agreed to waive its investment advisory fees and/or to reimburse expenses to the extent necessary to maintain the annualized total operating expenses of the Fund (excluding brokerage costs, acquired fund fees and expenses, interest, taxes, and extraordinary expenses) until at least April 30, 2024, at no more than an annual rate of 0.90% for all classed of shares. During the year ended December 31, 2023, the Adviser reimbursed the Fund in the amount of $176,163. In addition, the Fund has agreed, during the two year period following any waiver or reimbursement by the Adviser, to repay such amount to the extent, that after giving effect to the repayment, such adjusted annualized total operating expenses (continuing the same foregoing exclusions as above) of the Fund would not exceed 0.90% of the value of the Fund’s average daily net assets for each share class of the Fund. The agreement is renewable annually. At December 31, 2023, the cumulative amount which the Fund may repay the Adviser, subject to the terms above, is $325,141:
| For the year ended December 31, 2022, expiring December 31, 2024 | | $ | 148,978 | |
| For the year ended December 31, 2023, expiring December 31, 2025 | | | 176,163 | |
| | | $ | 325,141 | |
4. Distribution Plan. The Fund’s Board has adopted a distribution plan (the Plan) for each class of shares, except for Class I Shares, pursuant to Rule 12b-1 under the 1940 Act. Under the Class AAA, Class A, and Class C Share Plans, payments are authorized to G.distributors, LLC (the Distributor), an affiliate of the Adviser, at annual rates of 0.25%, 0.25%, and 1.00%, respectively, of the average daily net assets of those classes, the annual limitations under each Plan. Such payments are accrued daily and paid monthly.
The Gabelli Global Mini Mites Fund
Notes to Financial Statements (Continued)
5. Portfolio Securities. Purchases and sales of securities during the year ended December 31, 2023, other than short term securities and U.S. Government obligations, aggregated $3,061,559 and $3,780,845, respectively.
6. Transactions with Affiliates and Other Arrangements. During the year ended December 31, 2023, the Fund paid $5,748 in brokerage commissions on security trades to G.research, LLC, an affiliate of the Adviser.
During the year ended December 31, 2023, the Fund received credits from a designated broker who agreed to pay certain Fund operating expenses. The amount of such expenses paid through this directed brokerage arrangement during this period was $1,210.
The cost of calculating the Fund’s NAV per share is a Fund expense pursuant to the Advisory Agreement. Under the sub-administration agreement with Bank of New York Mellon, the fees paid include the cost of calculating the Fund’s NAV. The Fund reimburses the Adviser for this service. The Adviser did not seek a reimbursement during the year ended December 31, 2023.
The Corporation pays retainer and per meeting fees to Directors not affiliated with the Adviser, plus specified amounts to the Lead Director and Audit Committee Chairman. Directors are also reimbursed for out of pocket expenses incurred in attending meetings. Directors who are directors or employees of the Adviser or an affiliated company receive no compensation or expense reimbursement from the Corporation.
7. Line of Credit. The Fund participates in an unsecured line of credit, which expires on February 28, 2024 and may be renewed annually, of up to $75,000,000 under which it may borrow up to 10% of its net assets from the bank for temporary borrowing purposes. Borrowings under this arrangement bear interest at a floating rate equal to the higher of the Overnight Federal Funds Rate plus 135 basis points or the Overnight Bank Funding Rate plus 135 basis points in effect on that day. This amount, if any, would be included in “Interest expense” in the Statement of Operations. During the year ended December 31, 2023, there were no borrowings under the line of credit.
8. Capital Stock. The Fund currently offers three classes of shares – Class AAA Shares, Class A Shares, and Class I Shares. Class AAA and Class A investors may purchase more of these share classes. Class C shareholders cannot purchase more of this class. The minimum investment for Class I shares is $1,000. These changes had no effect on existing shareholders’ ability to redeem shares of the Fund as described in the Fund’s Prospectus.
The Fund imposes a redemption fee of 2.00% on all classes of shares that are redeemed or exchanged on or before the seventh day after the date of a purchase. The redemption fee is deducted from the proceeds otherwise payable to the redeeming shareholders and is retained by the Fund as an increase in paid-in capital. The redemption fees retained by the Fund during the years ended December 31, 2023 and 2022, if any, can be found in the Statement of Changes in Net Assets under Redemption Fees.
The Gabelli Global Mini Mites Fund
Notes to Financial Statements (Continued)
Transactions in shares of capital stock were as follows:
| | | Year Ended | | | Year Ended | |
| | | December 31,
2023 | | | December 31,
2022 | |
| | | Shares | | | Amount | | | Shares | | | Amount | |
| Class AAA | | | | | | | | | | | | | | | | |
| Shares issued upon reinvestment of distributions | | | 838 | | | $ | 9,263 | | | | 458 | | | $ | 3,881 | |
| Shares redeemed | | | — | | | | — | | | | (302 | ) | | | (3,203 | ) |
| Net increase | | | 838 | | | $ | 9,263 | | | | 156 | | | $ | 678 | |
| Class A | | | | | | | | | | | | | | | | |
| Shares issued upon reinvestment of distributions | | | 141 | | | $ | 1,554 | | | | 77 | | | $ | 651 | |
| Net increase | | | 141 | | | $ | 1,554 | | | | 77 | | | $ | 651 | |
| Class C | | | | | | | | | | | | | | | | |
| Shares issued upon reinvestment of distributions | | | 140 | | | $ | 1,543 | | | | 77 | | | $ | 647 | |
| Net increase | | | 140 | | | $ | 1,543 | | | | 77 | | | $ | 647 | |
| Class I | | | | | | | | | | | | | | | | |
| Shares sold | | | 244,596 | | | $ | 2,652,277 | | | | 166,432 | | | $ | 1,634,597 | |
| Shares issued upon reinvestment of distributions | | | 95,556 | | | | 1,055,891 | | | | 44,420 | | | | 376,683 | |
| Shares redeemed | | | (31,989 | ) | | | (339,658 | ) | | | (86,389 | ) | | | (828,013 | ) |
| Net increase | | | 308,163 | | | $ | 3,368,510 | | | | 124,463 | | | $ | 1,183,267 | |
9. Significant Shareholder. As of December 31, 2023, approximately 63.3% of the Fund was beneficially owned by the Adviser and its affiliates, including managed accounts for which the affiliates of the Adviser have voting control but disclaim pecuniary interest.
10. Indemnifications. The Fund enters into contracts that contain a variety of indemnifications. The Fund’s maximum exposure under these arrangements is unknown. However, the Fund has not had prior claims or losses pursuant to these contracts. Management has reviewed the Fund’s existing contracts and expects the risk of loss to be remote.
11. Subsequent Events. Management has evaluated the impact on the Fund of all subsequent events occurring through the date the financial statements were issued and has determined that there were no subsequent events requiring recognition or disclosure in the financial statements.
The Gabelli Global Mini Mites Fund
Report of Independent Registered Public Accounting Firm
To the Shareholders of The Gabelli Global Mini Mites Fund
and the Board of Directors of GAMCO Global Series Funds, Inc.
Opinion on the Financial Statements
We have audited the accompanying statement of assets and liabilities of The Gabelli Global Mini Mites Fund (the “Fund”) (one of the funds constituting GAMCO Global Series Funds, Inc. (the “Corporation”)), including the schedule of investments, as of December 31, 2023, and the related statement of operations for the year then ended, the statements of changes in net assets for each of the two years in the period then ended, the financial highlights for each of the five years in the period then ended and the related notes (collectively referred to as the “financial statements”). In our opinion, the financial statements present fairly, in all material respects, the financial position of the Fund (one of the funds constituting GAMCO Global Series Funds, Inc.) at December 31, 2023, the results of its operations for the year then ended, the changes in its net assets for each of the two years in the period then ended and its financial highlights for each of the five years in the period then ended, in conformity with U.S. generally accepted accounting principles.
Basis for Opinion
These financial statements are the responsibility of the Corporation’s management. Our responsibility is to express an opinion on the Fund’s financial statements based on our audits. We are a public accounting firm registered with the Public Company Accounting Oversight Board (United States) (“PCAOB”) and are required to be independent with respect to the Corporation in accordance with the U.S. federal securities laws and the applicable rules and regulations of the Securities and Exchange Commission and the PCAOB.
We conducted our audits in accordance with the standards of the PCAOB. Those standards require that we plan and perform the audit to obtain reasonable assurance about whether the financial statements are free of material misstatement, whether due to error or fraud. The Corporation is not required to have, nor were we engaged to perform, an audit of the Corporation’s internal control over financial reporting. As part of our audits, we are required to obtain an understanding of internal control over financial reporting but not for the purpose of expressing an opinion on the effectiveness of the Corporation’s internal control over financial reporting. Accordingly, we express no such opinion.
Our audits included performing procedures to assess the risks of material misstatement of the financial statements, whether due to error or fraud, and performing procedures that respond to those risks. Such procedures included examining, on a test basis, evidence regarding the amounts and disclosures in the financial statements. Our procedures included confirmation of securities owned as of December 31, 2023 by correspondence with the custodian and brokers; when replies were not received from brokers, we performed other auditing procedures. Our audits also included evaluating the accounting principles used and significant estimates made by management, as well as evaluating the overall presentation of the financial statements. We believe that our audits provide a reasonable basis for our opinion.

We have served as the auditor of one or more Gabelli Funds investment companies since 1992.
New York, New York
February 28, 2024
The Gabelli Global Mini Mites Fund
Liquidity Risk Management Program (Unaudited)
In accordance with Rule 22e-4 under the 1940 Act,the Fund has established a liquidity risk management program (the LRM Program) to govern its approach to managing liquidity risk. The LRM Program is administered by the Liquidity Committee (the Committee), which is comprised of members of Gabelli Funds, LLC management. The Board has designated the Committee to administer the LRM Program.
The LRM Program’s principal objectives include supporting the Fund’s compliance with limits on investments in illiquid assets and mitigating the risk that the Fund will be unable to meet its redemption obligations in a timely manner. The LRM Program also includes elements that support the management and assessment of liquidity risk, including an annual assessment of factors that influence the Fund’s liquidity and the monthly classification and re-classification of certain investments that reflect the Committee’s assessment of their relative liquidity under current market conditions.
At a meeting of the Board held on August 23, 2023, the Board received a written report from the Committee regarding the design and operational effectiveness of the LRM Program. The Committee determined, and reported to the Board, that the LRM Program is reasonably designed to assess and manage the Fund’s liquidity risk and has operated adequately and effectively since its implementation. The Committee reported that there were no liquidity events that impacted the Fund or its ability to timely meet redemptions without dilution to existing shareholders. The Committee noted that the Fund is primarily invested in highly liquid securities and, accordingly, continues to be exempt from the requirement to determine a “highly liquid investment minimum” as defined in the Rule 22e-4. Because of that continued qualification for the exemption, the Fund has not adopted a “highly liquid investment minimum” amount. The Committee further noted that while changes to the LRM Program were made during the Review Period and reported to the Board, no material changes were made to the LRM Program as a result of the Committee’s annual review.
There can be no assurance that the LRM Program will achieve its objectives in the future. Please refer to the Fund’s Prospectus for more information regarding its exposure to liquidity risk and other principal risks to which an investment in the Fund may be subject.
The Gabelli Global Mini Mites Fund
Board Consideration and Re-Approval of Investment Advisory Agreement (Unaudited)
During the six months ended December 31, 2023, the Board of Directors of the Corporation approved the continuation of the investment advisory agreement with the Adviser for the Fund on the basis of the recommendation by the directors (the Independent Board Members) who are not interested persons of the Fund. The following paragraphs summarize the material information and factors considered by the Independent Board Members as well as their conclusions relative to such factors.
Nature, Extent, and Quality of Services. The Independent Board Members considered information regarding the portfolio managers, the depth of the analyst pool available to the Adviser and the Fund’s portfolio managers, the scope of supervisory, administrative, shareholder, and other services supervised or provided by the Adviser and the absence of significant service problems reported to the Board. The Independent Board Members noted the experience, length of service, and reputation of the Fund’s portfolio managers.
Investment Performance. The Independent Board Members reviewed the short term performance of the Fund (as of September 30, 2023) against a peer group of seven other comparable funds prepared by the Adviser (the Adviser Peer Group), and against a peer group prepared by Broadridge (the Broadridge Performance Peer Group) consisting of all retail and institutional global small/mid cap fund, regardless of asset size or primary channel of distribution. The Independent Board Members noted that the Fund’s performance was in the first quartile for the one year period, and in the second quartile (but second overall) for the three and five year periods, as measured against the Adviser Peer Group. Against the Broadridge Performance Peer Group, the Independent Board Members noted that the Fund’s performance was in the first quintile for the one, three, and five year periods. The Independent Board Members noted that at its current size, the Fund was not competitive among its peer groups and encouraged the Adviser to continue to explore ways to increase the size of the Fund. The Independent Board Members discussed the Adviser’s comprehensive performance discussion earlier in the Meeting.
Profitability. The Independent Board Members reviewed summary data regarding the profitability of the Fund to the Adviser both with a pro rata administrative overhead charge and with a standalone administrative charge and noted the effect of the expense limitation agreement. The Independent Board Members also noted that a portion of the Fund’s portfolio transactions were executed by an affiliated broker of the Adviser and that another affiliated broker of the Adviser received distribution fees and minor amounts of sales commissions.
Economies of Scale. The Independent Board Members discussed the major elements of the Adviser’s cost structure and the relationship of those elements to potential economies of scale and reviewed data provided by the Adviser.
Sharing of Economies of Scale. The Independent Board Members noted that the investment management fee schedule for the Fund does not take into account any potential economies of scale that may develop.
Service and Cost Comparisons. The Independent Board Members compared the expense ratios of the investment management fee, other expenses and total expenses of the Fund to similar expense ratios of the Adviser Peer Group and a peer group of ten other global small/mid cap funds selected by Broadridge (the Broadridge Expense Peer Group), and noted that the Adviser’s management fee includes substantially all administrative services of the Fund as well as investment advisory services. The Board Members noted that the Fund’s total expense ratio was the lowest for the Adviser Peer Group and the Broadridge Expense Peer Group. The Independent Board Members also noted that the advisory fee structure was the same as that in effect for
The Gabelli Global Mini Mites Fund
Board Consideration and Re-Approval of Investment Advisory Agreement (Unaudited) (Continued)
most of the Gabelli funds and noted the effect of the expense limitation agreement in place for the Fund. The Independent Board Members were presented with, but did not consider to be material to their decision, various information comparing the advisory fee to the fee for other types of accounts managed by the Adviser.
Conclusions. The Independent Board Members concluded that the Fund enjoyed highly experienced portfolio management services, and good ancillary services and an acceptable performance record. The Independent Board Members also concluded that the Fund’s expense ratios and profitability to the Adviser were acceptable, and that economies of scale were not a significant factor in their thinking at this time. In this regard, the Independent Board Members noted the contractual Expense Deferral Agreement between the Adviser and the Corporation, on behalf of each Fund, pursuant to which the net expense ratio for each share class of each Fund was reduced to 0.90%. The Independent Board Members did not view the potential profitability of ancillary services as material to their decision. On the basis of the foregoing and without assigning particular weight to any single conclusion, the Independent Board Members determined to recommend continuation of the investment management agreement to the full Board.
Based on a consideration of all these factors in their totality, the Board Members, including all of the Independent Board Members, determined that The Fund’s advisory fee was appropriate in light of the quality of services provided and in light of the other factors described above that the Board deemed relevant. Accordingly, the Board Members determined to approve the continuation of The Fund’s Advisory Agreement. The Board Members based their decision on evaluations of all these factors as a whole and did not consider any one factor as all important or controlling.
The Gabelli Global Mini Mites Fund
Additional Fund Information (Unaudited)
The business and affairs of the Fund are managed under the direction of the Corporation’s Board of Directors. Information pertaining to the Directors and Officers of the Fund is set forth below. The Corporation’s Statement of Additional Information includes additional information about the Fund’s Directors and is available without charge, upon request, by calling 800-GABELLI (800-422-3554) or by writing to The Gabelli Global Mini Mites Fund at One Corporate Center, Rye, NY 10580-1422.
Name, Position(s)
Address1
and Year of Birth | | Term of Office
and Length of
Time Served2 | | Number of
Funds
in Fund
Complex
Overseen by
Director | |
Principal Occupation(s)
During Past Five Years | |
Other Directorships
Held by Director3 |
| | | | | | | | | |
| INTERESTED DIRECTORS4: | | | | | | | | |
| | | | | | | | | |
Mario J. Gabelli, CFA Director and Chief Investment Officer 1942 | | Since 1993 | | 31 | | Chairman, Co-Chief Executive Officer, and Chief Investment Officer– Value Portfolios of GAMCO Investors, Inc. and Chief Investment Officer – Value Portfolios of Gabelli Funds, LLC and GAMCO Asset Management, Inc.; Director/Trustee or Chief Investment Officer of other registered investment companies within the Gabelli Fund Complex; Chief Executive Officer of GGCP, Inc.; Executive Chair of Associated Capital Group, Inc. | | Director of Morgan Group Holding Co. (holding company) (2001-2019); Chairman of the Board and Chief Executive Officer of LICT Corp. (multimedia and communication services company); Director of CIBL, Inc. (broadcasting and wireless communications); Director of ICTC Group Inc. (communications) (2013-2018) |
| | | | | | | | | |
John D. Gabelli Director 1944 | | Since 1993 | | 12 | | Former Senior Vice President of G.research, LLC (and its predecessor) (1991-2019) | | — |
| INDEPENDENT DIRECTORS5: | | | | | | | | |
| | | | | | | | | |
E. Val Cerutti Director 1939 | | Since 2001 | | 7 | | Chief Executive Officer of Cerutti Consultants, Inc. | | Director of The LGL Group, Inc. (diversified manufacturing) (1990-2009) |
| | | | | | | | | |
Anthony J. Colavita6 Director 1935 | | Since 1993 | | 18 | | President of the law firm of Anthony J. Colavita, P.C. | | — |
| | | | | | | | | |
Werner J. Roeder Director 1940 | | Since 1993 | | 20 | | Retired physician; Former Vice President of Medical Affairs (Medical Director) of New York Presbyterian/Lawrence Hospital (1999-2014) | | — |
| | | | | | | | | |
Anthonie C. van Ekris6 Director 1934 | | Since 1993 | | 23 | | Chairman and Chief Executive Officer of BALMAC International, Inc. (global import/export company) | | — |
The Gabelli Global Mini Mites Fund
Additional Fund Information (Unaudited) (Continued)
Name, Position(s)
Address1
and Year of Birth | |
Term of Office
and Length of
Time Served2 | | Number of
Funds
in Fund
Complex
Overseen by
Director | |
Principal Occupation(s)
During Past Five Years | |
Other Directorships
Held by Director3 |
| | | | | | | | | |
Salvatore J. Zizza7 Director 1945 | | Since 2004 | | 35 | | President, Zizza & Associates Corp. (private holding company); Chairman of Bergen Cove Realty Inc. (residential real estate) | | Director and Chairman of Trans-Lux Corporation (business services); Director and Chairman of Harbor Diversified Inc. (pharmaceuticals) (2009-2018); Retired Chairman of BAM (semiconductor and aerospace manufacturing); Director of Bion Environmental Technologies, Inc. |
The Gabelli Global Mini Mites Fund
Additional Fund Information (Unaudited) (Continued)
Name, Position(s)
Address1
and Year of Birth | | Term of Office
and Length of
Time Served2 | |
Principal Occupation(s)
During Past Five Years |
| | | | | |
| OFFICERS: | | | | |
| | | | | |
John C. Ball President, Treasurer, Principal Financial & Accounting Officer 1976 | | Since 2017 | | Senior Vice President (since 2018) and other positions (2017 - 2018) of GAMCO Investors, Inc.; Chief Executive Officer, G.distributors, LLC since 2020; Officer of registered investment companies within the Gabelli Fund Complex since 2017 |
| | | | | |
Peter Goldstein Secretary & Vice President 1953 | | Since 2020 | | General Counsel, GAMCO Investors, Inc. and Chief Legal Officer, Associated Capital Group, Inc. since 2021; General Counsel and Chief Compliance Officer, Buckingham Capital Management, Inc. (2012-2020); Chief Legal Officer and Chief Compliance Officer, The Buckingham Research Group, Inc. (2012-2020) |
| | | | | |
Richard J. Walz Chief Compliance Officer 1959 | | Since 2013 | | Chief Compliance Officer of registered investment companies within the Gabelli Fund Complex since 2013 |
| 1 | Address: One Corporate Center, Rye, NY 10580-1422, unless otherwise noted. |
| 2 | Each Director will hold office for an indefinite term until the earliest of (i) the next meeting of shareholders, if any, called for the purpose of considering the election or re-election of such Director and until the election and qualification of his or her successor, if any, elected at such meeting, or (ii) the date a Director resigns or retires, or a Director is removed by the Board of Directors or shareholders, in accordance with the Corporation’s By-Laws and Articles of Incorporation. For officers, includes time served in prior officer positions with the Fund. Each officer will hold office for an indefinite term until the date he or she resigns or retires or until his or her successor is elected and qualified. |
| 3 | This column includes only directorships of companies required to report to the SEC under the Securities Exchange Act of 1934, as amended, i.e., public companies, or other investment companies registered under the 1940 Act. |
| 4 | “Interested person” of the Corporation as defined in the 1940 Act. Messrs. Gabelli are each considered an “interested person” because of their affiliation with Gabelli Funds, LLC which acts as the Corporation’s investment adviser. Mario J. Gabelli and John D. Gabelli are brothers. |
| 5 | Directors who are not interested persons are considered “Independent” Directors. |
| 6 | Mr. Colavita’s son, Anthony S. Colavita, serves as a director of other funds in the Gabelli Fund Complex. Mr. van Ekris is an independent director of Gabelli International Ltd., Gabelli Fund, LDC, GAMA Capital Opportunities Master, Ltd., and GAMCO International SICAV, which may be deemed to be controlled by Mario J. Gabelli and/or affiliates and in that event would be deemed to be under common control with the Fund’s Adviser. |
| 7 | Mr. Zizza is an independent director of Gabelli International Ltd., which may be deemed to be controlled by Mario J. Gabelli and/or affiliates and in that event would be deemed to be under common control with the Fund’s Adviser. On September 9, 2015, Mr. Zizza entered into a settlement with the SEC to resolve an inquiry relating to an alleged violation regarding the making of false statements or omissions to the accountants of a company concerning a related party transaction. The company in question is not an affiliate of, nor has any connection to, the Fund. Under the terms of the settlement, Mr. Zizza, without admitting or denying the SEC’s findings and allegation, paid $150,000 and agreed to cease and desist committing or causing any future violations of Rule 13b2-2 of the Securities Exchange Act of 1934, as amended. The Board has discussed this matter and has determined that it does not disqualify Mr. Zizza from serving as an Independent Director. |
Gabelli Funds and Your Personal Privacy
Who are we?
The Gabelli Funds are investment companies registered with the Securities and Exchange Commission under the Investment Company Act of 1940. We are managed by Gabelli Funds, LLC, which is affiliated with GAMCO Investors, Inc., a publicly held company with subsidiaries and affiliates that provide investment advisory services for a variety of clients.
What kind of non-public information do we collect about you if you become a fund shareholder?
If you apply to open an account directly with us, you will be giving us some non-public information about yourself. The non-public information we collect about you is:
| ● | Information you give us on your application form. This could include your name, address, telephone number, social security number, bank account number, and other information. |
| ● | Information about your transactions with us, any transactions with our affiliates, and transactions with the entities we hire to provide services to you. This would include information about the shares that you buy or redeem. If we hire someone else to provide services — like a transfer agent — we will also have information about the transactions that you conduct through them. |
What information do we disclose and to whom do we disclose it?
We do not disclose any non-public personal information about our customers or former customers to anyone other than our affiliates, our service providers who need to know such information, and as otherwise permitted by law. If you want to find out what the law permits, you can read the privacy rules adopted by the Securities and Exchange Commission. They are in volume 17 of the Code of Federal Regulations, Part 248. The Commission often posts information about its regulations on its website, www. sec.gov.
What do we do to protect your personal information?
We restrict access to non-public personal information about you to the people who need to know that information in order to provide services to you or the fund and to ensure that we are complying with the laws governing the securities business. We maintain physical, electronic, and procedural safeguards to keep your personal information.
This page was intentionally left blank.
The Gabelli Global Mini Mites Fund
2023 TAX NOTICE TO SHAREHOLDERS (Unaudited)
For the year ended December 31, 2023, the Fund paid to shareholders ordinary income distributions (comprised of net investment income and short term capital gains) totaling $0.5986, $0.5985, $0.5964, and $0.5986 per share for Class AAA, Class A, Class C, and Class I, respectively, and long term capital gains totaling $543,730, or the maximum allowable. For the year ended December 31, 2023, 13.51% of the ordinary income distribution qualifies for the dividends received deduction available to corporations. The Fund designates 16.51% of the ordinary income distribution as qualified dividend income pursuant to the Jobs and Growth Tax Relief Reconciliation Act of 2003. The Fund designates 57.91% of the ordinary income distribution as qualified interest income pursuant to the Tax Relief, Unemployment Reauthorization, and Job Creation Act of 2010. The Fund designates 100% of the ordinary income distribution as qualified short term gain pursuant to the American Jobs Creation Act of 2004. Also for the year of 2023, the Fund did not have foreign tax credits.
U.S. Government Income:
The percentage of the ordinary income distribution paid by the Fund during 2023 which was derived from U.S. Treasury securities was 3.30%. Such income is exempt from state and local tax in all states. However, many states, including New York and California, allow a tax exemption for a portion of the income earned only if a mutual fund has invested at least 50% of its assets at the end of each quarter of the Fund’s fiscal year in U.S. Government securities. The Fund did not meet this strict requirement in 2023. The percentage of U.S. Government securities held as of December 31, 2023 was 22.34%. Due to the diversity in state and local tax law, it is recommended that you consult your personal tax adviser as to the applicability of the information provided to your specific situation.
All designations are based on financial information available as of the date of this annual report and, accordingly, are subject to change. For each item, it is the intention of the Fund to designate the maximum amount permitted under the Internal Revenue Code and the regulations thereunder.
THE GABELLI GLOBAL MINI MITES FUND
One Corporate Center
Rye, NY 10580-1422
Portfolio Management Team Biographies
Mario J. Gabelli, CFA, is Chairman, Chief Executive Officer, and Chief Investment Officer - Value Portfolios of GAMCO Investors, Inc. that he founded in 1977, and Chief Investment Officer - Value Portfolios of Gabelli Funds, LLC and GAMCO Asset Management, Inc. He is also Executive Chairman of Associated Capital Group, Inc. Mr. Gabelli is a summa cum laude graduate of Fordham University and holds an MBA degree from Columbia Business School and Honorary Doctorates from Fordham University and Roger Williams University.
Sarah Donnelly joined Gabelli in 1999 as a junior research analyst working with the consumer staples and media analysts. Currently she is a portfolio manager of Gabelli Funds, LLC, a Senior Vice President, and the Food, Household, and Personal Care products research analyst for Gabelli & Company. In 2013, she was named the Health & Wellness research platform leader. Ms. Donnelly received a BS in Business Administration with a concentration in Finance and minor in History from Fordham University.
Ashish Sinha joined GAMCO UK in 2012 as a research analyst. Prior to joining the Firm, Mr. Sinha was a research analyst at Morgan Stanley in London for seven years and has covered European Technology, Mid-Caps and Business Services. He also worked in planning and strategy at Birla Sun Life Insurance in India. Currently Mr. Sinha is a portfolio manager of Gabelli Funds, LLC and an Assistant Vice President of GAMCO Asset Management UK. Mr. Sinha has a BSBA degree from the Institute of Management Studies and an MB from IIFT.
Hendi Susanto joined Gabelli in 2007 as the lead technology research analyst. He spent his early career in supply chain management consulting and operations in the technology industry. He currently is a portfolio manager of Gabelli Funds, LLC and a Vice President of Associated Capital Group Inc. Mr. Susanto received a BS degree summa cum laude from the University of Minnesota, an MS from Massachusetts Institute of Technology, and an MBA degree from the Wharton School of Business.
Chong-Min Kang joined the Gabelli in 2007 as a research analyst. He currently is a portfolio manager of Gabelli Funds, LLC and a Senior Vice President of GAMCO Investors Inc. Mr. Kang received a BA degree from Boston College and an MBA from the Columbia Business School.

| (a) | The registrant, as of the end of the period covered by this report, has adopted a code of ethics that applies to the registrant’s principal executive officer, principal financial officer, principal accounting officer or controller, or persons performing similar functions, regardless of whether these individuals are employed by the registrant or a third party. |
| (c) | There have been no amendments, during the period covered by this report, to a provision of the code of ethics that applies to the registrant’s principal executive officer, principal financial officer, principal accounting officer or controller, or persons performing similar functions, regardless of whether these individuals are employed by the registrant or a third party, and that relates to any element of the code of ethics description. |
| (d) | The registrant has not granted any waivers, including an implicit waiver, from a provision of the code of ethics that applies to the registrant’s principal executive officer, principal financial officer, principal accounting officer or controller, or persons performing similar functions, regardless of whether these individuals are employed by the registrant or a third party, that relates to one or more of the items set forth in paragraph (b) of this item’s instructions. |
| Item 3. | Audit Committee Financial Expert. |
As of the end of the period covered by the report, the registrant’s Board of Directors has determined that Salvatore J. Zizza is qualified to serve as an audit committee financial expert serving on its audit committee and that he is “independent,” as defined by Item 3 of Form N-CSR.
| Item 4. | Principal Accountant Fees and Services. |
Audit Fees
| (a) | The aggregate fees billed for each of the last two fiscal years for professional services rendered by the principal accountant for the audit of the registrant’s annual financial statements or services that are normally provided by the accountant in connection with statutory and regulatory filings or engagements for those fiscal years are $136,100 for 2022 and $140,200 for 2023. |
Audit-Related Fees
| (b) | The aggregate fees billed in each of the last two fiscal years for assurance and related services by the principal accountant that are reasonably related to the performance of the audit of the registrant’s financial statements and are not reported under paragraph (a) of this Item are $0 for 2022 and $0 for 2023. |
Tax Fees
| (c) | The aggregate fees billed in each of the last two fiscal years for professional services rendered by the principal accountant for tax compliance, tax advice, and tax planning are $19,000 for 2022 and $19,760 for 2023. Tax fees represent tax compliance services provided in connection with the review of the Registrant’s tax returns. |
All Other Fees
| (d) | The aggregate fees billed in each of the last two fiscal years for products and services provided by the principal accountant, other than the services reported in paragraphs (a) through (c) of this Item are $5,049 for 2022 and $4,892 for 2023. The fees relate to Passive Foreign Investment Company identification database subscription fees billed on an annual basis. |
| (e)(1) | Disclose the audit committee’s pre-approval policies and procedures described in paragraph (c)(7) of Rule 2-01 of Regulation S-X. |
Pre-Approval Policies and Procedures. The Audit Committee ("Committee") of the registrant is responsible for pre-approving (i) all audit and permissible non-audit services to be provided by the independent registered public accounting firm to the registrant and (ii) all permissible non-audit services to be provided by the independent registered public accounting firm to the Adviser, Gabelli Funds, LLC, and any affiliate of Gabelli Funds, LLC ("Gabelli") that provides services to the registrant (a "Covered Services Provider") if the independent registered public accounting firm's engagement related directly to the operations and financial reporting of the registrant. The Committee may delegate its responsibility to pre-approve any such audit and permissible non-audit services to the Chairperson of the Committee, and the Chairperson must report to the Committee, at its next regularly scheduled meeting after the Chairperson's pre-approval of such services, his or her decision(s). The Committee may also establish detailed pre-approval policies and procedures for pre-approval of such services in accordance with applicable laws, including the delegation of some or all of the Committee's pre-approval responsibilities to the other persons (other than Gabelli or the registrant's officers). Pre-approval by the Committee of any permissible non-audit services is not required so long as: (i) the permissible non-audit services were not recognized by the registrant at the time of the engagement to be non-audit services; and (ii) such services are promptly brought to the attention of the Committee and approved by the Committee or Chairperson prior to the completion of the audit.
| (e)(2) | The percentage of services described in each of paragraphs (b) through (d) of this Item that were approved by the audit committee pursuant to paragraph (c)(7)(i)(C) of Rule 2-01 of Regulation S-X are as follows: |
| (f) | The percentage of hours expended on the principal accountant’s engagement to audit the registrant’s financial statements for the most recent fiscal year that were attributed to work performed by persons other than the principal accountant’s full-time, permanent employees was less than fifty percent. |
| (g) | The aggregate non-audit fees billed by the registrant’s accountant for services rendered to the registrant, and rendered to the registrant’s investment adviser (not including any sub-adviser whose role is primarily portfolio management and is subcontracted with or overseen by another investment adviser), and any entity controlling, controlled by, or under common control with the adviser that provides ongoing services to the registrant for each of the last two fiscal years of the registrant was $63,550 for 2022 and $57,210 for 2023. |
| (h) | The registrant’s audit committee of the board of directors has considered whether the provision of non-audit services that were rendered to the registrant’s investment adviser (not including any sub-adviser whose role is primarily portfolio management and is subcontracted with or overseen by another investment adviser), and any entity controlling, controlled by, or under common control with the investment adviser that provides ongoing services to the registrant that were not pre-approved pursuant to paragraph (c)(7)(ii) of Rule 2-01 of Regulation S-X is compatible with maintaining the principal accountant’s independence. |
| (j) | The registrant is not a foreign issuer. |
| Item 5. | Audit Committee of Listed Registrants. |
Not applicable.
| (a) | Schedule of Investments in securities of unaffiliated issuers as of the close of the reporting period is included as part of the report to shareholders filed under Item 1(a) of this form. |
| (b) | Not applicable due to no such divestments during the semi-annual period covered since the previous Form N-CSR filing. |
| Item 7. | Disclosure of Proxy Voting Policies and Procedures for Closed-End Management Investment Companies. |
Not applicable.
| Item 8. | Portfolio Managers of Closed-End Management Investment Companies. |
Not applicable.
| Item 9. | Purchases of Equity Securities by Closed-End Management Investment Company and Affiliated Purchasers. |
Not applicable.
| Item 10. | Submission of Matters to a Vote of Security Holders. |
There have been no material changes to the procedures by which the shareholders may recommend nominees to the registrant’s Board of Directors, where those changes were implemented after the registrant last provided disclosure in response to the requirements of Item 407(c)(2)(iv) of Regulation S-K (17 CFR 229.407) (as required by Item 22(b)(15) of Schedule 14A (17 CFR 240.14a-101)), or this Item.
| Item 11. | Controls and Procedures. |
| (a) | The registrant’s principal executive and principal financial officers, or persons performing similar functions, have concluded that the registrant’s disclosure controls and procedures (as defined in Rule 30a-3(c) under the Investment Company Act of 1940, as amended (the “1940 Act”) (17 CFR 270.30a-3(c))) are effective, as of a date within 90 days of the filing date of the report that includes the disclosure required by this paragraph, based on their evaluation of these controls and procedures required by Rule 30a-3(b) under the 1940 Act (17 CFR 270.30a-3(b)) and Rules 13a-15(b) or 15d-15(b) under the Securities Exchange Act of 1934, as amended (17 CFR 240.13a-15(b) or 240.15d-15(b)). |
| (b) | There were no changes in the registrant’s internal control over financial reporting (as defined in Rule 30a-3(d) under the 1940 Act (17 CFR 270.30a-3(d))) that occurred during the period covered by this report that has materially affected, or is reasonably likely to materially affect, the registrant’s internal control over financial reporting. |
| Item 12. | Disclosure of Securities Lending Activities for Closed-End Management Investment Companies. |
Not applicable.
| (a)(2)(1) | | Not applicable. |
| (a)(2)(2) | | Not applicable. |
SIGNATURES
Pursuant to the requirements of the Securities Exchange Act of 1934 and the Investment Company Act of 1940, the registrant has duly caused this report to be signed on its behalf by the undersigned, thereunto duly authorized.
| (Registrant) | GAMCO Global Series Funds, Inc. | |
| | | |
| By (Signature and Title)* | /s/ John C. Ball | |
| | John C. Ball, Principal Executive Officer | |
| | | |
| Date | March 8, 2024 | |
Pursuant to the requirements of the Securities Exchange Act of 1934 and the Investment Company Act of 1940, this report has been signed below by the following persons on behalf of the registrant and in the capacities and on the dates indicated.
| By (Signature and Title)* | /s/ John C. Ball | |
| | John C. Ball, Principal Executive Officer | |
| | | |
| Date | March 8, 2024 | |
| By (Signature and Title)* | /s/ John C. Ball | |
| | John C. Ball, Principal Financial Officer and Treasurer | |
| | | |
| Date | March 8, 2024 | |
| * | Print the name and title of each signing officer under his or her signature. |