UNITED STATES
SECURITIES AND EXCHANGE COMMISSION
Washington, D.C. 20549
Form 10-K
| x | ANNUAL REPORT PURSUANT TO SECTION 13 OR 15(d) OF THE SECURITIES EXCHANGE ACT OF 1934 |
For the fiscal year ended December 31, 2007
| ¨ | TRANSITION REPORT PURSUANT TO SECTION 13 OR 15(d) OF THE SECURITIES EXCHANGE ACT OF 1934 |
For the transition period from to .
Commission File No. 0-22158
NetManage, Inc.
(Exact name of registrant as specified in its charter)
| | |
| Delaware | | 77-0252226 |
(State or other jurisdiction of incorporation or organization) | | (IRS Employer Identification No.) |
| |
| 20883 Stevens Creek Boulevard, | | |
| Cupertino, California | | 95014 |
| (Address of principal executive offices) | | (Zip Code) |
Registrant’s telephone number, including area code:
(408) 973-7171
Securities registered pursuant to Section 12(b) of the Act:
| | |
Title of each class | | Name of each exchange on which registered |
| Common Stock, $0.01 par value, including related Preferred Shares Purchase Rights | | The NASDAQ Global Market Inc. |
Securities registered pursuant to Section 12(g) of the Act:
None
Indicate by check mark whether the registrant is a well-known seasoned issuer, as defined in Rule 405 of the Securities Act. Yes ¨ No x
Indicate by check mark whether the registrant is not required to file reports pursuant to Section 13 or Section 15(d) of the Act. Yes ¨ No x
Indicate by check mark whether the registrant (1) has filed all reports required to be filed by Section 13 or 15(d) of the Securities Exchange Act of 1934 during the preceding 12 months (or for such shorter period that the registrant was required to file such reports), and (2) has been subject to such filing requirements for the past 90 days. Yes x No ¨
Indicate by check mark if disclosure of delinquent filers pursuant to Item 405 of Regulation S-K is not contained herein, and will not be contained, to the best of registrant’s knowledge, in definitive proxy or information statements incorporated by reference in Part III of this Form 10-K or any amendment to this Form 10-K. ¨
Indicate by check mark whether the registrant is a large accelerated filer, an accelerated filer, a non-accelerated filer, or a smaller reporting company. See the definitions of “large accelerated filer,” “accelerated filer” and “smaller reporting company” in Rule 12b-2 of the Exchange Act (check one):
| | | | | | |
| Large Accelerated Filer ¨ | | Accelerated Filer ¨ | | Non-accelerated filer ¨ | | Smaller reporting company Filer x |
| | | | (Do not check if a smaller reporting company) | | |
Indicate by check mark whether the registrant is a shell company (as defined in Rule 12b-2 of the Act). Yes ¨ No x
The approximate aggregate market value of the Common Stock, $0.01 par value per share, held by non-affiliates of the registrant on June 29, 2007, the last business day of the registrant’s most recently completed second fiscal quarter, was $21,808,366, based upon the closing price of the Common Stock reported on the NASDAQ Global Market on that date (1).
The number of shares of Common Stock outstanding as of March 27, 2008 was 9,630,077.
| (1) | Excludes 4,810,151 shares of Common Stock held by directors, officers, and stockholders whose beneficial ownership exceeds five percent of the shares outstanding at June 29, 2007. Exclusion of shares held by any person should not be construed to indicate that such persons possesses the power, direct or indirect, to direct or cause the direction of the management or policies of the registrant, or that such person is controlled by or under common control with the registrant or that such person is otherwise an “affiliate” for any other purpose. |
TABLE OF CONTENTS
Forward-looking statements
Some of the statements contained in this Annual Report on Form 10-K are forward-looking statements, including but not limited to those specifically identified as such, that involve risks and uncertainties. The statements contained in this Annual Report on Form 10-K that are not purely historical are forward-looking statements within the meaning of Section 27A of the Securities Act and Section 21E of the Exchange Act, including, without limitation, statements regarding our expectations, beliefs, intentions or strategies regarding the future. These statements involve known and unknown risks, uncertainties and other factors, which may cause our actual results to differ materially from those implied by the forward-looking statements, including those described in this report in Item 1A—“Risk Factors”. In some cases, you can identify forward-looking statements by terminology such as “may,” “will,” “should,” “expects,” “plans,” “anticipates,” “believes,” “estimates,” “predicts,” “potential,” or “continue” or the negative of these terms or other comparable terminology. Although we believe that the expectations reflected in the forward-looking statements are reasonable, we cannot guarantee future results, levels of activity, performance, or achievements. All forward-looking statements included in this Annual Report on Form 10-K are based on information available to us on the date hereof, and we assume no obligation to update any such forward-looking statements.
PART I
Item 1—Business
General
NetManage, Inc. was incorporated in 1990 as a California corporation and reincorporated in Delaware in 1993 in connection with our initial public offering. References in this Annual Report on Form 10-K to “NetManage”, “the Company”, “we”, “our”, and “us” collectively refer to NetManage, Inc., a Delaware corporation, its subsidiaries and its California predecessor. NetManage operates through only one business segment. Please see Item 8, financial statements and supplementary data, of this Annual Report for more details.
NetManage®, OnWeb®, RUMBA®, OneStep®, ViewNow®, OnNet®, Chameleon®, SupportNow®, InterDrive®, Librados™, the NetManage logo, NetManage partner logo and the lizard logo are registered trademarks, registered service marks, trademarks or service marks of NetManage, Inc., its subsidiaries and its affiliates in the United States and/or other countries. UNIX is a registered trademark in the United States and other countries, licensed exclusively through X/Open Company Limited. Windows and ActiveX are registered trademarks in the United States and other countries of Microsoft Corporation (Microsoft). AIX, AS/400 and iSeries are registered trademarks in the United States and other countries of International Business Machines Corporation (IBM). Java is a trademark of Sun Microsystems, Inc. (Sun). All other trademarks are the property of their respective owners.
Overview
We develop and market software and service solutions that are designed to enable our customers to access and leverage the investment they have in their corporate business applications, processes, and data. We provide a range of personal computer, browser-based and server-based software products and tools. These products allow our customers to access and leverage applications, business processes and data on IBM and IBM compatible mainframe computers, IBM mid-range computers such as the iSeries (often referred to as host access), in packaged applications, middleware and databases such as SAP, Siebel, Oracle and PeopleSoft, amongst others, and on UNIX and Microsoft-based servers. We provide support, maintenance, and technical consultation services to our customers in association with the products we develop and market. We provide applications and management consultancy to our customers primarily in association with the server-based products we deliver that are designed to allow customers to develop and deploy new web-based applications and services.
1
Four important industry trends have strong influences on our business strategy:
| | 1. | the adoption of electronic commerce by major corporations worldwide and the acceptance of these approaches in mid-sized companies; |
| | 2. | the continuing development of the Internet, intranets, and extranets for delivery of mission-critical business applications in large and mid-sized companies; |
| | 3. | the desire on the part of corporations to make business processes and information broadly accessible internally and externally to their employees, customers, and business partners; and |
| | 4. | the mobilization of users of personal computers and the proliferation of wireless and handheld devices requiring corporate system access on a global basis. |
The growth of the Internet has also been matched by an increase in the use of mobile computing that allows users to access a company’s computer systems from remote locations within the confines of an organization’s security and access-control policies. As the Internet continues to grow, the number of different communication and inter-networking options required by major corporations to support their businesses is also increasing. The number and type of mobile computing and communication devices now includes wireless handheld devices, personal digital assistants (PDAs), Internet and Web-enabled cellular phones and smartphones. We anticipate that these trends will continue to accelerate over the next several years.
We believe that our customers require a single set of solutions that address the traditional need for host access combined with the need for the presentation of existing corporate systems with a Web application look and feel, along with the delivery of existing corporate processes and transactions as reusable programmatic components such as Web services. In assessing the change in the marketplace, we have focused our sales and marketing efforts on meeting the changing needs of our customers. Our products are designed and built to incorporate reusable components and technologies and to utilize common underlying services such as user management, system management, security, auditing and reporting. Several technologies are employed to provide these solutions; which include traditional thick client or desktop solutions; thin client or browser-based solutions; zero footprint or server-based solutions and application adapter or connector technologies. Within this marketplace, we believe the trend is away from desktop solutions and toward zero footprint solutions. We believe this movement is primarily driven by a desire to reduce the total cost of ownership associated with deploying and maintaining older technology. We also believe that a major element of our customer base will deploy a mixture of all types of solutions.
The market in which we compete is also made up of a number of products that allow organizations to reduce costs or increase revenue by allowing them, or their business partners, to interact via the Internet with corporate business applications that are the backbone of their business processes. A primary example of this kind of solution is found in self-service call center applications. Companies are building solutions that allow customers to determine order status over the Internet without involving a customer support representative. This approach simultaneously minimizes staffing costs and improves customer service. Our products assist our customers in building solutions that quickly transform corporate applications into Web-based solutions.
Industry background
The number and variety of applications that utilize internal company networks and the Internet continues to grow, driven in part by corporate initiatives to increase the responsiveness and agility of the business. Additionally, enterprises are faced with much tighter restrictions on corporate IT budgets and new application initiatives. IT organizations are more focused on leveraging their current investments in systems and applications, improving operating efficiencies, reducing costs, and extending their company’s market reach.
We develop products that are designed to assist companies in meeting these needs. Our products include:
| | 1. | traditional host access products for desktops to communicate with corporate host systems; |
| | 2. | products that allow organizations to transform corporate applications into systems that can service external users, partners and customers through the Web; and |
2
| | 3. | development platforms that allow organizations to create new applications based on information and data from one or more existing applications. |
Additionally, we provide products that allow access to and use of existing business processes and transactions for customers using application server development platforms such as IBM WebSphere, BEA WebLogic, and Microsoft .NET. These products are referred to as “connecters” or “adapters” and allow corporate applications to be presented in formats such as Web Services. These products address the access and integration markets, which over time have converged, as both customers and the industry look for more integrated solutions. We believe that these trends will continue and gain momentum as businesses experience the often rapid return on investment derived from these solutions.
Companies are seeking ways to make certain applications accessible to customers, partners, and vendors in order to enhance the flow of information and reduce expenses. This major move, utilizing the Internet as an inter-networking solution, covers the full migration of moving business processes to the Web and the sharing of those processes with partners—allowing electronic selling, trading and other transactions on the Web. We are focused on providing solutions to our customers that allow them to simplify the sharing of business processes and business services in a secure environment.
We believe that the open and interoperable characteristics of inter-networking technology, the use of intranets, the software that enables them, and the continued adoption of the Internet as an inter-company communication mechanism will continue to grow.
We believe that the adoption of Service-Oriented Architecture (SOA) will drive the requirement to incorporate existing applications as key components in corporate IT systems. The ability to easily codify existing business processes into components using industry standard technology and to quickly deliver those components to new applications and frameworks will ensure that corporations get new and increased value from their existing IT assets.
Our vision is to provide to our customers integration products and solutions that greatly improve and extend the reach and value of existing corporate systems, regardless of what end-user devices are in use or where those end-user devices are located. As we continue to deliver on our vision, we intend to support our customers in implementing business-to-employee (B2E), business-to-business (B2B), and business-to-customer (B2C) solutions and SOA. See “Risk Factors” under Item 1A below.
Products and technology
Our suite of products provides organizations with cost-effective solutions for connecting companies with their employees, partners and customers. Our products extend the functionality of these organizations’ technology investments by providing essential services that are not included in desktop and network operating systems. Our solutions are designed to streamline communication, reduce the total cost of ownership of desktop connectivity, and increase productivity throughout an organization.
Our current products include:
| | |
RUMBA | | Connectivity software designed to connect PCs to IBM mainframe and iSeries systems and UNIX host systems. RUMBA provides state-of-the-art terminal and printer emulation, file sharing, and file transfer solutions. |
| |
| ViewNow X Server and ViewNow InterDrive NFS | | Connectivity software allowing PCs to share files with UNIX host systems using Network File System, or NFS, and to access and run X Windows applications on UNIX hosts. |
3
| | |
| |
OnWeb Web-to-Host | | A browser-based product for fast deployment of host access solutions to any browser supporting ActiveX or Java. OnWeb Web-to-Host can be deployed from virtually any Web server and can lower total cost of ownership of terminal emulators by eliminating the need to configure individual desktops during initial installation and future updates. |
| |
OnWeb Server | | A broad, robust, and highly scalable server-based solution designed to allow customers to leverage their existing enterprise applications, information, and business processes for new presentation methods and integration projects. OnWeb Server is designed to enable application publishing on the Web by mapping one or more human-based transactions or processes to a Web-based presentation. OnWeb can also generate .NET Assemblies, BizTalk adapters, JavaBeans, Enterprise JavaBeans (EJB), and portlets from back-end transactions. These components can then be reused in building new applications and services. |
| |
SOA Planner | | SOA Planner, introduced November 2006, is a server product installed on a network that non-invasively listens to host system interactions in real-time to capture common usage patterns. End-user processes are tracked without impact to operations, providing critical insight to plan a practical SOA deployment. As a result, the captured data can be mined by system architects and developers to make smarter decisions about which services are essential when planning and deploying an SOA. SOA Planner is the foundation of the company’s new Incremental SOA™ strategy, a flexible four-step process designed to help organizations take a phased, lower-risk approach to creating a SOA. |
| |
OnWeb for CICS | | OnWeb for CICS, a software solution that transforms existing CICS (Customer Information Control System) data into standard XML for integration with other enterprise information systems or SOA initiatives. OnWeb for CICS, introduced August 2006, runs natively on the mainframe, providing powerful, scalable and secure support for large enterprises looking to extend their CICS applications to new business users, such as partners and customers, while eliminating the expense of multiple proxy servers and host application re-engineering. OnWeb for CICS complements NetManage’s comprehensive portfolio of integration solutions that can be used both individually or combined to enable companies to simply and cost-effectively leverage years of business logic without any change to the host system. |
| |
OnWeb for iSeries | | OnWeb for iSeries runs natively on IBM iSeries hardware and does not require the use of a separate runtime server. OnWeb for iSeries is capable of combining information from multiple 5250 applications, databases and RPG applications, and of publishing the results directly in HTML or delivering them as a Web service, JavaBean, EJB or .NET Assembly. |
| |
Librados Application and Technology Adapters | | A range of high performance and highly scalable application and technology adapters Java J2EE application servers and environments. Our Librados adapters allow data and information to be accessed and extracted from a range of packaged applications, middleware and databases such as SAP, PeopleSoft, JD Edwards, Siebel and Oracle, amongst others, for a range of databases including Oracle, Informix, IBM DB2 and Sybase and for a range of technology connections including support for Electronic Data Interchange (EDI) standards. This technology resides entirely within the bounds of the application server environment negating the need for intermediary (or proxy) servers, which may hinder performance and increase implementation complexity. |
4
A significant portion of our net revenues are derived from the sale of products that provide host access, presentation and integration solutions for the Microsoft Windows environment (clients and servers), and are marketed primarily to Windows users. In addition, our strategy of developing products based on the Windows operating environment is substantially dependent on our ability to gain pre-release access to, and to develop expertise in, current and future Windows developments by Microsoft. We have no agreement with Microsoft giving us pre-release access to future Windows products. In addition, we have products that are similar to functionality included in some Microsoft products. The Company expects Microsoft to continue development of such products.
Some of our newer OnWeb products have been developed to run on the UNIX operating system, including Linux and Solaris and are marketed primarily to the Fortune 1000 companies running UNIX platforms as their servers. In addition, our strategy of developing products based on the UNIX operating environment is substantially dependent on our ability to gain pre-release access to, and to develop expertise in, current and future UNIX developments by Sun, IBM, HP and others. No agreement exists between a developer of UNIX operating systems and us to provide pre-release access to future UNIX products.
We have made a number of acquisitions over time, including our acquisition of Librados, Inc. in the fourth quarter of 2004 that have provided technology incorporated into our current product offering. We regularly evaluate product and technology acquisition opportunities and we may make acquisitions in the future if we determine that an acquisition would further our corporate strategy.
For a discussion of risk factors that may affect our business and financial results, see “Risk Factors” in Item 1A below.
Working capital
At December 31, 2007, we had working capital of $15.8 million. We believe that our current cash balance and future operating cash flows will be sufficient to meet our working capital needs, capital expenditure requirements, and to complete currently identified projects and planned objectives for at least the next 12 months. Although we do not have any specific commitments with regard to future capital expenditures, we do anticipate normal capital expenditures for the replacement and addition of computer equipment and furniture and fixtures related to our operations. Our standard payment terms are net 30 days and the majority of our business is done under those terms. Our cash balance could be impacted by the risks and uncertainties outlined in Item 1A, “Risk Factors”, however, there are no additional trends or uncertainties that we are aware of that will materially affect our cash balance.
Backlog
Because we generally ship software products within a short period after receipt of an order, we typically do not have a material backlog of unfilled orders, and our revenues for license fees in any quarter are substantially dependent on orders booked in that quarter and particularly in the last month of that quarter.
Sales and marketing
We develop products that are designed to provide solutions for our customers across a wide-range of industries. Successful installations can be found in government agencies, as well as companies in the finance, health care, manufacturing, and insurance industries. Our products are designed to improve business processes throughout these organizations.
To bring our products to market we use a combination of telephone and direct sales personnel specifically assigned to meet the needs of major customer accounts. As part of our strategy to develop multiple distribution channels, we expect to continue our use of indirect channels, such as resellers, particularly value added resellers and systems integrators, and to a lesser extent distributors and original equipment manufacturers, both in the United States and internationally. Any material increase in our indirect sales may adversely affect our average selling prices and gross margins due to the lower unit costs that are typically charged when selling through indirect channels.
5
In the United States, we have four sales offices, and internationally, we have sales offices in Canada, France, Germany, Israel, Italy, Holland, Spain, United Kingdom and China. We also utilize local distributors and resellers internationally. We support the sales activity of these sales offices and distributors in specific countries through localization of products and sales material, local training, and participation in local trade shows.
In 2007, 2006, and 2005, respectively, we derived approximately 40%, 36%, and 33% of net revenues from sales outside of North America (United States and Canada). We believe that the potential international markets for our products are substantial, based on the extent to which Windows, UNIX, and inter-networking products are used internationally. Accordingly, we localize many of our products for use in the native language of specific countries. We intend to continue to target China and major European countries for additional sales and marketing activity. For more information on our foreign operations refer to Note 8 of our Notes to Consolidated Financial Statements.
Risks inherent in our international business activities generally include unexpected changes in regulatory requirements, tariffs, and other trade barriers, costs and risks of localizing products for foreign countries, longer accounts receivable payment cycles, weak or unenforced international intellectual property laws, difficulties in managing international operations, currency fluctuations, potentially adverse tax consequences, repatriation of earnings, and the burdens of complying with a wide variety of foreign laws.
Historically, our business and revenues have fluctuated on a seasonal basis. Our fourth quarter has typically been our strongest revenue quarter, we believe, in large part, driven by customer spending patterns and the sales organization’s focus on achieving sales incentives.
Customer support
Our North America support organization consists of a staff of professionals providing support by telephone primarily from our facilities in Ottawa, Canada, Kirkland, WA, Wakefield, MA and Cupertino, CA. Both telephone support and regular update releases of our products are made available to customers that purchase annual or multi-year maintenance and support. Our sales and customer support organizations work together to provide customer satisfaction. Our customers outside North America are supported by our support organization located in Haifa, Israel, by various international sales offices and by local distributors and resellers who are trained by us.
Research and development
We believe that our future success will depend on our ability to enhance our existing products and to develop and introduce new products providing access, presentation and integration services, which address customer needs in the areas of B2B, B2C, B2E and SOA. On December 31, 2007, we had 30 employees involved in research and development activities located primarily in Israel. Our internal research and development resources are complemented by the selective use of third party consulting resources that are covered by intellectual property and confidentiality agreements. Our research and development expenses for the years ended December 31, 2007, 2006, and 2005 were $6.2 million, $7.2 million, and $7.2 million, respectively.
Competition
The market for our products is intensely competitive and characterized by rapidly changing technology, evolving industry standards, changes in customers’ needs, consolidation of vendors, and frequent new product introductions. To maintain and improve our position in the industry, we must continue to successfully develop, introduce, and market new products and product enhancements on a timely and cost-effective basis. Three key factors will contribute to the continued growth of our marketplace: the proliferation of Microsoft Windows client and server technology, the continued need to utilize highly reliable legacy systems, and the continued implementation of Web-based corporate initiatives.
6
We compete directly with providers of Windows inter-networking applications, such as IBM and Attachmate. Additionally, we compete with companies such as Software AG with respect to web integration server products.
Many of our competitors have substantially greater footprint with existing customers as well as greater name recognition and a larger customer base than we do. Typically the first place customers cut from budgets are in the software maintenance agreements with companies like us, and we anticipate that we will face increasing market and pricing pressures from customers and competitors respectively in the future.
Proprietary rights
We rely on a combination of patent, copyright, trade secret, confidentiality procedures, trademark laws, and contractual provisions to protect our intellectual property and proprietary rights. However, the basic TCP/IP protocols on which our products are based are non-proprietary, and other companies have developed their own versions. We seek to protect our software, documentation and other written materials under trade secret and copyright laws, which afford only limited protection, and to a lesser extent, patent laws. Despite our efforts to protect our proprietary rights, unauthorized parties may attempt to copy aspects of our products or to obtain and use information that we regard as proprietary. Policing unauthorized use of our products is difficult, and while we are unable to determine the extent to which piracy of our software products exists, software piracy can be expected to be a persistent problem. In selling our products, we rely primarily on “click-wrap” licenses that are not signed by licensees, and may be unenforceable under the laws of certain jurisdictions. In addition, the laws of some foreign countries do not protect our proprietary rights to as great an extent as do the laws of the United States. In addition, the number of patents applied for and granted for software inventions is increasing. Consequently, there is a growing risk of third parties asserting patent claims against us.
We believe that, due to the rapid pace of innovation within our industry, factors such as the technological and creative skills of our personnel are more important to establishing and maintaining a technology leadership position within the industry than are the various legal means of protecting our technology.
Employees
On December 31, 2007, we had 147 regular full-time employees, of whom 82 were engaged in sales, marketing, technical support and consulting, 19 in general management, finance, and human resources, 12 in information technology and facilities, 30 in software development and engineering and 4 in production. None of our employees is subject to a collective bargaining agreement, and we have not experienced any work stoppage.
The majority of our workforce is located in the competitive employment markets of the Silicon Valley in California and Haifa, Israel.
Recent Developments
On February 22, 2007, the Company implemented a restructuring of operations designed to align its business units with its core business functions, to relocate certain of its functional operations, and to reduce operating expenses. As part of the restructuring, the Company reduced its workforce in excess of 10% and recorded a $2.0 million charge to operating expenses for the year ended December 31, 2007. For more information on our restructuring activity refer to Note 3 of our Notes to Consolidated Financial Statements.
On December 11, 2007, NetManage entered into a merger agreement with Rocket Software, Inc., a Delaware corporation, and Eastern Software, Inc., a Delaware corporation and wholly-owned subsidiary of Rocket, pursuant to which Eastern Software would have been merged with and into NetManage, continuing as the surviving entity. Pursuant to the merger agreement, at the effective time of the merger, each share of the Company’s common stock would have been converted into the right to receive $7.20 cash and each outstanding option would have been converted into the right to receive $7.20 cash less the exercise price of such option. The Board of Directors of the Company
7
unanimously approved the merger and the merger agreement at a special meeting on December 11, 2007, and directed that the merger agreement be submitted to the Company’s stockholders for adoption. On February 29, 2008, NetManage received notification from Rocket Software that it had failed to obtain the requisite financing to the proposed acquisition of NetManage within the contracted timeframe and, as a result, Rocket Software terminated the merger agreement.
Available Information
We are a reporting company and file annual, quarterly, and current reports, proxy statements, and other information with the United States Securities and Exchange Commission (SEC). We make our annual reports on Form 10-K, quarterly reports on Form 10-Q, current reports on Form 8-K, and amendments to those reports available on our website ( www.netmanage.com ), free of charge, as soon as reasonably practicable after we have electronically filed or furnished such materials to the SEC. These filings are also available on the SEC’s web site at www.sec.gov. In addition, you may read and copy any documents we file at the SEC’s public reference room at 100 F Street, NE, Washington, D.C. 20549, and at the regional offices of the SEC located at 3 World Financial Center, Suite 400, New York, NY 10281-1022, and at 175 West Jackson Blvd., Suite 900, Chicago, Illinois 60604. You may obtain information on the operation of the SEC’s public reference room in Washington, D.C. by calling the SEC at 1-800-SEC-0330. You can also read and copy our SEC filings at the office of the National Association of Securities Dealers, Inc. at 1735 K Street, Washington, D.C. 20006.
Item 1A—Risk Factors
Our business is subject to a number of risks and uncertainties. You should carefully consider the risks described below, in addition to the other information contained in this Report and in our other filings with the SEC. The risks and uncertainties described below are not the only ones facing our company. Additional risks and uncertainties not presently known to us or that we currently consider immaterial may also affect our business operations. If any of these risks actually occur, our business, financial condition or results of operations could be seriously harmed. In that event, the market price for our common stock could decline and you may lose part or all of your investment.
Our operating results and net income (loss) have fluctuated significantly in the past and may continue to do so in the future, which could cause our stock price to decline.
We have experienced, and expect to experience in future periods, significant fluctuations in operating results and net income that may be caused by many factors including, among others:
| | • | | general economic conditions; |
| | • | | changes in the demand for our products; |
| | • | | introduction or enhancements to our products and those of our competitors; |
| | • | | technological changes in computer networking; |
| | • | | competitive pricing pressures; |
| | • | | market acceptance of new products; |
| | • | | customer order deferrals in anticipation of new products and product enhancements; |
| | • | | size and timing of individual product orders; |
| | • | | mix of international and domestic revenues; |
| | • | | mix of distribution channels through which our products are sold; |
| | • | | loss of, or failure to enter into, strategic alliances to develop or promote our products; |
| | • | | quality control of our products; |
8
| | • | | changes in our operating expenses; |
| | • | | foreign currency exchange rates; |
| | • | | potential tax benefits; |
| | • | | adverse business conditions in specific industries. |
In addition, our acquisition of complementary businesses, products, or technologies has caused in the past and may continue to cause fluctuations in our operating results due to in-process research and development charges, the amortization of acquired intangible assets, and integration costs recorded in connection with acquisitions.
Since we generally ship software products within a short period after receipt of an order, we do not typically have a material backlog of unfilled orders, and our revenues for license fees in any one quarter are substantially dependent on orders booked in that quarter and particularly in the last month of that quarter. Our expenses are based in part on our expectations as to future revenues and to a large extent are fixed. Therefore, we may be unable to adjust spending in a timely manner to compensate for any unexpected revenue shortfall. Accordingly, any significant shortfall in demand for our products in relation to our expectations or any material delay of customer orders would have an almost immediate adverse impact on our operating results and on our ability to achieve profitability.
As a result, we believe that period-to-period comparisons of our results of operations are not necessarily meaningful and should not be relied upon as indications of future performance. Fluctuations in our operating results have caused, and may in the future cause us to perform below the expectations of public market analysts and investors. If our operating results fall below market expectations, the price of our common stock may fall.
We have only been profitable in two years since 1995 and may never achieve profitability in the future, which would weaken our financial condition.
With the exception of the net income reported for 2005 and 2004, we have not achieved profitability on an annual basis since 1995 and we may never obtain sufficient revenues to sustain profitability in any future period. In addition, we cannot be certain that we can increase profitability, particularly to the extent that we face price competition. As a result, we will need to generate significant revenues to attain profitability. Increasing competition may cause our prices to decline, which would harm our operating results. We anticipate that the prices for our software products may decline over the next few years. We expect to face increased competition in markets where we sell our products, which will make it more difficult to increase or maintain our prices and profit margins. If anticipated increases in sales volume do not keep pace with anticipated pricing pressures, our revenues would decline and our business could be harmed. Despite our efforts to introduce enhancements to our products, we may not be successful in maintaining our pricing.
We rely in part on third parties for sales of our products and our revenues could decline significantly with little or no notice.
We rely in part on our independent distributors and value-added resellers for certain elements of the marketing and distribution of our products. The agreements in place with these organizations are generally non-exclusive, of limited duration, are terminable with little or no notice by either party and generally do not contain minimum purchase requirements. There can be no assurance that we will be able to attract or retain distributors and resellers who will be able to market our products effectively. These distributors of our products are not within our control and generally represent competing product lines of other companies in addition to our products. There can be no assurance that these organizations will give a high priority to the marketing of our products, and they may give a higher priority to the products of our competitors.
9
Furthermore, our results of operations can also be materially adversely affected by changes in the inventory strategies of our distributors, which can occur rapidly and may not be related to end-user demand. As part of our continued strategy of selling through multiple distribution channels, we expect to continue using indirect distribution channels, particularly value-added resellers, and system integrators, in addition to distributors and original equipment manufacturers. Indirect sales may grow as a percentage of both domestic and total net revenues during 2008 and beyond, because of acquisitions or increased market penetration. Any material increase in our indirect sales as a percentage of revenues may adversely affect our average selling prices and gross margins due to lower unit costs that are typically charged when selling through indirect channels. There can be no assurance that we will be able to attract or retain resellers and distributors who will be able to market our products effectively, will be qualified to provide timely and cost-effective customer support and service, or will continue to represent our products. If we are unable to recruit or retain important resellers or distributors or if they decrease their sales of our products, we may suffer a material adverse effect on our business, financial condition, or results of operations.
We have undergone significant restructurings, which may have a material adverse effect on our operating results.
We have undertaken a number of initiatives in the past intended to control costs and to reduce operating expenses. These restructuring plans involved reductions in our worldwide workforce and the consolidation of certain functions of our sales, customer support, and research and development operations. We have also had to write-down assets as part of the restructuring effort that lowered our operating results. In February 2007, we implemented a restructuring of our worldwide operations to refocus our operations and reduce our operating expenses. While the restructuring plans have thus far been successful, we may be required to implement additional restructuring plans in the future.
Our goodwill or amortizable intangible assets may become impaired and we may be required to record a significant charge to earnings.
We test our goodwill for impairment at least annually and we review our amortizable intangible assets for impairment whenever events or changes in circumstances indicate the carrying value may not be recoverable. Factors that may be considered a change in circumstances indicating that the carrying value of our goodwill or amortizable intangible assets may not be recoverable include a decline in stock price and market capitalization, future cash flows, and slower growth rates in our industry. We may be required to record a significant charge to earnings in our financial statements during the period in which any impairment of our goodwill or amortizable intangible assets is identified resulting in an impact on our results of operations.
We may not be able to successfully make acquisitions of or investments in other companies or technologies, which could limit our future growth and access to technology.
We have limited experience in acquiring or making investments in companies, technologies, or services. We regularly evaluate product and technology acquisition opportunities and anticipate that we may make additional acquisitions in the future if we determine that an acquisition would further our corporate strategy. Acquisitions in our industry are particularly difficult to assess because of the rapidly changing technological standards. If we make any acquisitions, we will be required to assimilate the personnel, operations, and products of the acquired business and train, retain, and motivate key personnel from the acquired business. However, the key personnel of the acquired business may decide not to work for us. In addition, we may not be successful in the integration of product lines and customers of an acquired company. Moreover, if the operations of an acquired company or business do not meet our expectations, we may be required to restructure the acquired business, or write-off the value of some or all of the assets of the acquired business. No assurance can be given that any acquisition by us will or will not occur. If an acquisition does occur, no assurance can be given that it will not materially or adversely affect us, or that any such acquisition will be successful in enhancing our business.
10
We are dependent upon our key management and employees for our future success, and few of our key managers and employees are obligated to stay with us.
Our success depends in part on our ability to attract and retain key senior management and certain other personnel. Many of our key employees are employed on an at-will basis. If any of our key employees left or were unable to work and we were unable to find a suitable replacement, then our business, financial condition, and results from operations could be materially harmed.
We face significant competition and competition in our market is likely to increase which could harm our business.
The markets for our products are intensely competitive and characterized by rapidly changing technology, evolving industry standards, price erosion, changes in customers’ needs, and frequent new product introductions. We anticipate continued growth and competition in our industry, and accordingly, the markets for our products will remain intensely competitive. We expect that competition will increase yet become more focused as consolidation continues within our industry. Several key factors contribute to the continued growth of our marketplaces including the proliferation of Microsoft Windows client server technology, and the continued implementation of web-based access to corporate mainframe and mid-range computer systems. We also face competition from makers of terminal emulation software such as Attachmate.
Many of our current competitors have, and many of our future competitors may have, substantially greater financial, technical, sales, marketing, and other resources, in addition to greater name recognition and a larger customer base than us. The markets for our products are characterized by significant price competition and we anticipate that we will face increasing pricing pressures from our competitors in the future. In addition, our current and future competitors may be able to respond more quickly to new or emerging technologies and changes in customer requirements than we can. Increased competition could result in price reductions, fewer customer orders, reduced gross profit margins, and loss of market share, any of which could harm our business.
Furthermore, our competitors could seek to expand their product offerings by designing and selling products using technology that could render obsolete or adversely affect sales of our products. These developments may adversely affect sales of our products either by directly affecting customer-purchasing decisions or by causing potential customers to delay their purchases of our products. Several of our competitors have developed proprietary networking applications and certain of such vendors, including Novell, provide a TCP/IP protocol suite in their products at little or no additional cost. In particular, Microsoft has embedded a TCP/IP protocol suite in its Windows 98, Windows 2000, Windows ME, Windows NT, Windows XP, Windows Vista, and Windows .NET operating systems. We have products, which are similar to connectivity products marketed by Microsoft. Microsoft is expected to continue development of such products, which could have a material adverse effect on our business, financial condition, or results of operations.
If we fail to manage technological change, respond to consumer demands or evolving industry standards or if we fail to enhance our products’ interoperability with the products of our customers, demand for our products will decrease and our business will suffer.
From time to time, many of our customers have delayed purchase decisions due to confusion in the marketplace relating to rapidly changing technology and product introductions. To maintain or improve our position in this industry, we must successfully develop, introduce, and market new products and product enhancements on a timely and cost-effective basis. We have had trouble from time to time in developing and introducing new products and enhancing existing products, in a manner that satisfies customer requirements and changing market demands. Any failure by us to anticipate or respond adequately to changes in technology and customer preferences, or any significant delays in product development or introduction, could have a material adverse effect on our business, financial condition, and results of operations. The failure to develop products or product enhancements incorporating new functionality on a timely basis could cause customers to delay purchase of our current products or cause customers to purchase products from our competitors; either situation would adversely affect our business, financial condition, and results of
11
operations. We may not be successful in developing new products or enhancing our existing products on a timely basis, and any new products or product enhancements developed by us may not achieve market acceptance. In addition, we incorporate software and other technologies owned by third parties and as a result, we are dependent upon such third parties’ ability to enhance their current products, to develop new products that will meet changing customer needs on a timely and cost-effective basis, and to respond to emerging industry standards and other technological changes.
We depend upon technology licensed from third parties, and if we do not maintain these license arrangements, we will not be able to ship many of our products and our business will be seriously harmed.
Certain products of ours incorporate software and other technologies developed and maintained by third parties. We license these technologies from third parties under agreements with a limited duration, and we may not be able to maintain these license arrangements. If we fail to maintain our license arrangements or find suitable replacements, we would not be able to ship many of our products and our business would be materially harmed. There can be no assurance that we would be able to replace the functionality provided by the third-party technologies currently offered in conjunction with our products if those technologies become unavailable to us, obsolete or incompatible with future versions of our products or market standards. Whenever possible, we place all third party source codes within escrow to prevent such situations.
We depend upon the compatibility of our products with applications operating on Microsoft Windows to sell our products.
A significant portion of our net revenues have been derived from the sales of products that provide inter-networking applications for the Microsoft Windows environment and are marketed primarily to Windows users. As a result, sales of certain of our products would be negatively impacted by developments adverse to Microsoft Windows products. As well, if competing technologies such as Linux are successful in negatively affecting Microsoft’s success, our ability to sell our products would be further limited. In addition, our strategy of developing products based on the Windows operating environment is substantially dependent on our ability to gain pre-release access to, and to develop expertise in, current and future Windows developments by Microsoft. We have no agreement with Microsoft giving us pre-release access to future Windows products. If we are unable to gain such access our ability to develop new products compatible with future Windows release in a timely manner could be harmed. In addition, we have products that are similar to functionality included in some Microsoft products. Microsoft is expected to continue development of such products, which could have a material adverse effect on our business, financial condition, or results of operations.
We depend upon the compatibility of our products with applications operating on UNIX platforms to sell our products.
A small percentage of our net revenues have been derived from the sales of products that provide inter-networking applications for UNIX environments, including Linux and Solaris and are marketed primarily to the Fortune 1000 companies running UNIX platforms as their servers. As a result, sales of certain of our products would be negatively impacted by developments adverse to UNIX products or developments in the Open Source community based around Linux adverse to our own Linux-based products. In addition, our strategy of developing products based on the UNIX operating environment is substantially dependent on our ability to gain pre-release access to, and to develop expertise in, current and future UNIX developments by various companies including IBM, Hewlett-Packard, and Sun. No agreement between a developer of UNIX operating systems and us exists to provide pre-release access to future UNIX products. If we are unable to gain such access our ability to develop new products compatible with future UNIX product releases in a timely manner could be harmed.
The loss of any of our strategic relationships would make it more difficult to keep pace with evolving industry standards and to design products that appeal to the marketplace.
Our future success depends on our ability to maintain and enter into new strategic alliances and OEM relationships to develop necessary products or technologies, to expand our distribution channels or to jointly market or gain market awareness for our products. We currently rely on strategic relationships, such as those with Microsoft to provide us with state of the art technology, assist us in integrating our products with leading
12
industry applications, and help us make use of economies of scale in manufacturing and distribution. However, we do not have written agreements with some of our strategic partners and cannot ensure these relationships will continue for a significant period of time. Many of our agreements with these partners are informal and may be terminated by them at any time. There can be no assurance that we will be successful in maintaining current alliances or developing new alliances and relationships or that such alliances and relationships will achieve their intended purposes.
We may be subject to product returns, product liability claims, and reduced sales because of defects in our products that could reduce our revenues and otherwise adversely affect our financial results.
Software products as complex as those offered by us may contain undetected errors or failures when first introduced or as new versions are released. The likelihood of errors is higher when a new product is introduced or when new versions or enhancements are released. Errors may also arise because of defects in third-party products or components, which are incorporated into our products. There can be no assurance that, despite testing by us and by current and potential customers, errors will not be found in new products or product enhancements after commencement of commercial shipments, which could result in loss of or delay in market acceptance.
We may be required to devote significant financial resources and personnel to correct any defects. Known or unknown errors or defects that affect the operation of our products could result in the following, any of which could have a material adverse effect on our business, financial condition, and results of operations:
| | • | | delay or loss of revenues; |
| | • | | cancellation of a purchase order or contract due to defects; |
| | • | | diversion of development resources; |
| | • | | damage to our reputation; |
| | • | | failure of our products to achieve market acceptance; |
| | • | | increased service and warranty costs; and |
Although some of our licenses with customers contain provisions designed to limit our exposure to potential product liability claims, these contractual limitations on liability may not be enforceable or may only limit, rather than eliminate potential liability. In addition, our product liability insurance may not be adequate to cover our losses in the event of a product liability claim resulting from defects in our products and may not be available to us in the future.
Our business depends upon licensing our intellectual property, and if we fail to protect our proprietary rights, our business could be harmed.
Our ability to compete depends substantially upon our internally developed proprietary technology. We rely primarily on a combination of patent, copyright and trademark laws, trade secrets, confidentiality procedures, and contractual provisions to protect our proprietary rights. We seek to protect our software, documentation and other written materials under trade secret and copyright laws and contractual confidentiality agreements, which afford only limited protection, and, to a lesser extent, patent laws. Despite our efforts to protect our proprietary rights, unauthorized parties may attempt to copy aspects of our products or to obtain and use information that we regard as proprietary. Policing unauthorized use of our products and technology is difficult and, while we are unable to determine the extent to which piracy of our software products exists, software piracy can be expected to be a persistent problem. There can be no assurance that our means of protecting our proprietary rights will be adequate, or our competitors will not independently develop similar technology. In selling a portion of our products, we rely primarily on “click-wrap” licenses that are not signed by licensees and, therefore, may be unenforceable under the laws of certain jurisdictions. In addition, the laws of some foreign countries do not protect our proprietary rights to as great an extent as do the laws of the United States. If we are not successful in protecting our intellectual property, our business could be substantially harmed.
13
We rely upon our patents, trademarks, copyrights and trade secrets to protect our proprietary rights, but they may be only of limited value as we may not be able to prevent misappropriation of our technology.
There can be no assurance that our means of protecting our proprietary rights will be adequate or that our competitors will not independently develop similar technology. In addition, the number of patents applied and granted for software inventions is increasing. Despite any precautions that we have taken:
| | • | | laws and contractual restrictions may not be sufficient to prevent misappropriation of our technology or deter others from developing similar technologies; |
| | • | | other companies may claim common law trademark rights based upon state or foreign law which precede our federal registration of such marks; and |
| | • | | current federal laws that prohibit software copying provide only limited protection from software “pirates,” and effective trademark, copyright and trade secret protection may be unavailable or limited in certain foreign countries. |
Our pending patent applications may never be issued, and even if issued, may provide us with little protection.
We regard the protection of patentable inventions as important to our business. However, it is possible that:
| | • | | our pending patent applications may not result in the issuance of patents; |
| | • | | our patents may not be broad enough to protect our proprietary rights; |
| | • | | any issued patent could be successfully challenged by one or more third parties, which could result in our loss of the right to prevent others from exploiting the inventions claimed in those patents; |
| | • | | current and future competitors may independently develop similar technology, duplicate our products or design around any of our patents; and |
| | • | | effective patent protection, if any, may not be available in every country in which we do business. |
If we are not successful in asserting our patent rights, our business could be substantially harmed. At the present time, we have 11 patents issued from the U.S. Patent Office.
We have received notices of claims that may result in litigation and we may become involved in costly and time-consuming litigation over proprietary rights.
Substantial litigation regarding intellectual property rights exists in our industry. We expect that software in our industry may be increasingly subject to third party infringement claims as the number of competitors grows and the functionality of products in different areas of the industry overlaps. Third parties may currently have, or may eventually be issued, patents that would be infringed by our products or technology. We cannot be certain that any of these third parties will not make a claim of infringement against us with respect to our products and technology. We have received, and may receive in the future, communications from third parties asserting that our products infringe, or may infringe, the proprietary rights of third parties seeking indemnification against such infringement or indicating that we may be interested in obtaining a license from such third parties. Any claims or actions asserted against us could result in the expenditure of significant financial resources and the diversion of management’s time and efforts. In addition, litigation in which we are accused of infringement may cause product shipment delays, require us to develop non-infringing technology or require us to enter into royalty or license agreements even before the issue of infringement has been decided on the merits. If any litigation were not to be resolved in our favor, we could become subject to substantial damage claims and be prohibited from using the technology at issue without a royalty or license agreement. These royalty or license agreements, if required, might not be available on acceptable terms, or at all, and could result in significant costs and harm our business. If a successful claim of infringement is made against us and we cannot develop non-infringing technology or license the infringed or similar technology on a timely and cost-effective basis, our business could be significantly harmed.
14
Our business is subject to risks from international operations such as legal uncertainty, tariffs, trade barriers, and political and economic instability that could restrict our ability to compete effectively.
We derived approximately 40% of our net revenues from sales outside of North America during the year ended December 31, 2007. While we expect that international sales will continue to account for a significant portion of our net revenues, there can be no assurance that we will be able to maintain or increase international market demand for our products or that our sales offices and distributors will be able to effectively meet that demand. Risks inherent in our international business activities generally include, among others:
| | • | | unexpected changes in regulatory requirements; |
| | • | | legal uncertainty, particularly regarding intellectual property rights and protection; |
| | • | | costs and risks of localizing products for foreign countries; |
| | • | | longer accounts receivable payment cycles; |
| | • | | language barriers in business discussions; |
| | • | | cultural differences in the negotiation of contracts and conflict resolution; |
| | • | | the limitations imposed by U.S. export laws (see Government Regulation and Legal Uncertainties below); |
| | • | | changes in markets caused by a variety of political, social and economic factors; |
| | • | | tariffs and other trade barriers; |
| | • | | difficulties in managing international operations; |
| | • | | currency exchange rate fluctuations; |
| | • | | potentially adverse tax consequences; |
| | • | | repatriation of earnings; and |
| | • | | the burdens of complying with a wide variety of foreign laws. |
Many of our customers are subject to many of the risks described above. These factors may have an adverse effect on our international sales and, consequently, on our business, financial condition or results of operations.
Terrorist attacks and threats or actual war could adversely affect our operating results and the price of our common stock.
The terrorist attacks in the United States, the United States response to these attacks, and the current instability in the Middle East have had an adverse impact on our operations. Any escalation in these events or similar future events may disrupt our operations or those of our customers. These events have had and may continue to have an adverse impact on the United States and world economies in general and consumer confidence and spending in particular, which has and could continue to harm our sales. Any of these events could increase volatility in the United States and worldwide financial markets and economies, which could harm our stock price and may limit the capital resources available to our customers and us. This could have a significant impact on our operating results, revenues, and costs and may result in increased volatility in the market price of our common stock and on the future price of our common stock.
15
It may be difficult to raise needed capital in the future, which could significantly harm our business by limiting our ability to grow or make acquisitions.
We may require substantial additional capital to finance growth, acquisitions and fund ongoing operations in future years. Our capital requirements will depend on many factors including, among other things:
| | • | | the results of operations; |
| | • | | the acceptance of and demand for our products; |
| | • | | the number and timing of any acquisitions and the cost of these acquisitions; |
| | • | | the costs of developing new products; |
| | • | | the costs associated with our refocusing on core products and technologies; and |
| | • | | the extent to which we invest in new technology and research and development projects. |
Although our current business plan does not require the need for further financing activities to fund our operations for the foreseeable future, due to risks and uncertainties in the marketplace as well as a potential of pursuing further acquisitions, we may need to raise additional capital. If we issue additional stock to raise capital, current percentage ownership in the company would be diluted. If we raise capital through debt, our debt servicing costs will increase. Additional financing may not be available when needed and, if such financing is available, it may not be available on terms favorable to us.
Because of their significant stock ownership, our officers and directors can exert significant control over our future direction.
As of March 27, 2008, our officers, directors and entities affiliated with them, taken together, beneficially owned approximately 2.2 million shares, or approximately 22%, of our outstanding common stock. These stockholders, if acting together, would be able to exert significant influence on all matters requiring approval by our stockholders, including the election of directors, the approval of mergers, or other business combination transactions or a sale of all or substantially all of our assets.
Certain provisions of our stock option plan, our Key Employee Retention and Severance Plan, our stockholder rights plan, and our certificate of incorporation and bylaws make changes of control difficult even if they would be beneficial to stockholders.
Our 1992 Stock Option Plan and our 1999 Non-statutory Stock Option Plan provide that, in the event of a change of control of NetManage, all options outstanding under those plans would become fully vested and exercisable for at least 10 days prior to the consummation of such change of control transaction. These accelerations of vesting provisions would increase the cost to any potential acquirer and could have the effect of deterring or reducing the per share price paid to purchase NetManage. In April of 2002, the 1992 stock option plan was amended so that options outstanding would not become fully vested and exercisable upon a change in control. Under our Key Employee Retention and Severance Benefits Plan established in the year ended December 31, 2007, certain of our officers may be entitled to receive accelerated vesting of options and retention bonuses as well as severance payments in the event such officer is terminated during the two-year period following a change of control of NetManage.
In addition, our board of directors has the authority without any further vote or action on the part of the stockholders to issue up to 1,000,000 shares of preferred stock and to determine the price, rights, preferences, privileges, and restrictions of the preferred stock. This preferred stock, if it is ever issued, may have preference over and harm the rights of the holders of our common stock. Although the issuance of this preferred stock will provide us with flexibility in connection with possible acquisitions and other corporate purposes, the issuance of the preferred stock may make it more difficult for a third party to acquire a majority of our outstanding voting stock. We currently have no plans to issue preferred stock.
16
Our certificate of incorporation and bylaws include provisions that may have the effect of deterring an unsolicited offer to purchase our stock. In addition, we have implemented a stockholder rights plan that could deter or at least make it significantly more expensive for an unsolicited offer to purchase our stock. These provisions, coupled with the provisions of the Delaware General Corporation Law, may delay or impede a merger, tender offer, or proxy contest involving us. Furthermore, our board of directors is divided into three classes, only one of which is elected each year. Directors are only capable of being removed by the affirmative vote of two thirds or greater of all classes of voting stock. These factors may further delay or prevent a change of control.
We have been and/or are subject to unsolicited attempts to acquire NetManage and elect directors to our board, which could have a negative effect on our ability to operate our business and on our operating results.
On December 11, 2007, NetManage entered into a merger agreement with Rocket Software, Inc., a Delaware corporation, and Eastern Software, Inc., a Delaware corporation and wholly-owned subsidiary of Rocket, pursuant to which Eastern Software would have been merged with and into NetManage, continuing as the surviving entity. Pursuant to the merger agreement, at the effective time of the merger, each share of the Company’s common stock would have been converted into the right to receive $7.20 cash and each outstanding option would have been converted into the right to receive $7.20 cash less the exercise price of such option. The Board of Directors of the Company unanimously approved the merger and the merger agreement at a special meeting on December 11, 2007, and directed that the merger agreement be submitted to the Company’s stockholders for adoption. On February 29, 2008, NetManage received notification from Rocket Software that it had failed to obtain the requisite financing to the proposed acquisition of NetManage within the contracted timeframe and, as a result, Rocket Software terminated the merger agreement.
The process of responding to these unsolicited offers and potential proxy solicitations has required, and these and other similar events may continue to require, the attention of our Board of Directors and our management and the expenditure of resources, which may affect our ability to operate our business and may have a negative impact on our operating results. Furthermore, these matters and other similar events could result in a change of control or sale of NetManage.
We face risks from the uncertainties of current and future governmental regulation that could have a negative impact on our ability to operate our business.
We are not currently subject to direct regulation by any government agency, other than regulations applicable to businesses generally, and there are currently few laws or regulations directly applicable to access to or commerce on the Internet. However, due to the increasing popularity and use of the Internet, various laws and regulations may be adopted with respect to the Internet, covering issues such as user privacy, pricing and characteristics and quality of products and services. The adoption of any such laws or regulations may decrease the growth of the Internet, which could in turn decrease the demand for our products, increase our cost of doing business, or otherwise have an adverse effect on our business, financial condition, or results of operations. Moreover, the applicability to the Internet of existing laws governing issues such as property ownership, libel, and personal privacy is uncertain. Further, due to the encryption technology contained in certain of our products, such products are subject to U.S. export controls. There can be no assurance that such export controls, either in their current form or as may be subsequently enacted, will not limit our ability to distribute products outside of the United States or electronically. While we take precautions against unlawful exportation, there can be no assurance that inadvertent violations will not occur, and the global nature of the Internet makes it virtually impossible to effectively control the distribution of our products. In addition, future federal or state legislation or regulation may further limit levels of encryption or authentication technology. Any such export restriction, new legislation, regulation, or unlawful exportation could have a material adverse effect on our business, financial condition, or results of operations.
17
Our acquisitions may have a material adverse effect on our operating results and financial condition.
We acquired Librados, Inc. in the fourth quarter of 2004 and have made a number of acquisitions in the past several years. These acquisitions were motivated by various factors, including the desire to obtain new technologies, expand and enhance our product offerings, expand our customer base, attract key personnel, and strengthen our presence in the international and OEM marketplaces. Product and technology acquisitions entail numerous risks, including:
| | • | | the diversion of management’s attention away from day-to-day operations; |
| | • | | difficulties in the assimilation of acquired operations and personnel (such as sales, engineering, and customer support); |
| | • | | the integration of acquired products with existing product lines; |
| | • | | the failure to realize anticipated benefits of cost savings and synergies; |
| | • | | undisclosed liabilities; |
| | • | | adverse effects on reported operating results; |
| | • | | the amortization of acquired intangible assets; |
| | • | | the loss of key employees; and |
| | • | | the difficulty of presenting a unified corporate image. |
We identified a material weakness in connection with internal control over financial reporting that, unless remedied, could have a material adverse effect on our external financial reporting.
For the year ended December 31, 2007, management identified a material weakness in our internal control over financial reporting associated with insufficient personnel resources and technical accounting expertise within our accounting function. Specifically, while we have replaced key accounting personnel who we had lost, we do not have the complement of personnel with an appropriate level of accounting knowledge and training to ensure that the financial information is adequately analyzed and reviewed on a timely basis to detect misstatements. We intend to remedy this material weakness by augmenting the resources available to our accounting function and increasing the level of accounting expertise of current personnel by means of training. We are not able at this time to determine the costs of the remediation, but do expect to incur additional expenses related to our accounting function. Industry demand for qualified accounting personnel currently exceeds the number available, and the competition for attracting and retaining these employees is intense. Because of this intense competition, we may be unable to retain or attract qualified accounting employees. Any failure to achieve and maintain effective control over financial reporting could cause us to fail to meet our reporting obligations and could require that we restate our financial statements for prior periods, any of which could cause investors to lose confidence in our reported financial information and cause a decline, which could be material, in the trading price of our common stock.
While we believe that we currently have adequate internal control over financial reporting, we are exposed to risks from legislation requiring companies to evaluate those internal controls.
The Sarbanes-Oxley Act requires that we test our internal control over financial reporting and disclosure controls and procedures. In particular, for the year ended December 31, 2007, we have performed system and process evaluation and testing of our internal control over financial reporting to allow management to report on the effectiveness of our internal control over financial reporting, as required by Section 404 of the Sarbanes-Oxley Act. Our compliance with Section 404 will require that we incur substantial expense and expend significant management time on compliance-related issues. Moreover, if we are not able to comply with the requirements of Section 404 in the future, or if we or our independent registered public accounting firm identify deficiencies in our internal control over
18
financial reporting that are deemed to be material weaknesses, the market price of our stock may decline and we could be subject to sanctions or investigations by the Nasdaq Stock Market’s Global Select Market, the SEC or other regulatory authorities, which would require significant additional financial and management resources.
Increased costs associated with corporate governance compliance may significantly affect the results of our operations.
Changing laws, regulations, and standards relating to corporate governance, public disclosure, and compliance practices, including the Sarbanes-Oxley Act of 2002, new SEC regulations, and NASDAQ Global Market rules are creating uncertainty for companies such as ours in understanding and complying with these laws, regulations, and standards. Because of this uncertainty and other factors, devoting the necessary resources to comply with evolving corporate governance and public disclosure standards may result in increased general and administrative expenses and a diversion of management time and attention to compliance activities. We also expect these developments to increase our legal compliance and financial reporting costs. In addition, these developments may make it more difficult and more expensive for us to obtain director and officer liability insurance, and we may be required to accept reduced coverage or incur substantially higher costs to obtain such coverage. Moreover, we may not be able to comply with these new rules and regulations on a timely basis.
These developments could make it more difficult for us to retain qualified members of our board of directors or executive officers. We are presently evaluating and monitoring regulatory developments and cannot estimate the timing and magnitude of additional costs we may incur as a result. To the extent these costs are significant, our general and administrative expenses are likely to increase.
Item 1B—Unresolved Staff Comments
The Company has received no written comments regarding its periodic or current reports from the staff of the Securities and Exchange Commission that were issued 180 days or more preceding the end of its 2007 fiscal year and that remain unresolved.
Item 2—Properties
All of our office space is leased. We have approximately 31,761 square feet, of leased space in North America including our 24,550 square foot headquarters building in Cupertino, California. This location supports executive, legal, finance, human resources, marketing, sales, and administration. Other primary North American sites are located in Kirkland, Washington, which houses sales, sales support, and marketing, Wakefield, Massachusetts which houses sales and sales support and Ottawa, Ontario, Canada which houses the consulting, customer and technical support, and research and development groups primarily for the presentation and integration services products. Other regional and local sales offices are located in various cities throughout the United States.
Internationally, we lease approximately 19,400 square feet of office space in Haifa, Israel for the purpose of international sales, marketing, customer and technical support, finance, human resources, and research and development. We also lease sales offices in France, Germany, Italy, Spain, Holland, and the United Kingdom.
Item 3—Legal proceedings
We may be party to various legal proceedings and claims, either asserted or unasserted, which arise in the ordinary course of business, including proceedings and claims that may relate to acquisitions we have completed or to companies we have acquired. While the outcome of these matters cannot be predicted with certainty, we do not believe that the outcome of any of these potential claims will have a material adverse effect on our consolidated financial position, results of operations or cash flow.
Item 4—Submission of matters to a vote of security holders
Not applicable.
19
PART II
Item 5—Market for registrant’s common equity and related stockholder matters
The following graph shows the total stockholder return of an investment of $100 in stock on December 31, 2002 or index including reinvestment of dividends for; (i) the Company’s Common stock; (ii) the NASDAQ Composite (U.S.) Index; and (iii) the RDG Software Composite Index. All values assume reinvestment of the full amount of all dividends and are calculated as of December 31st of each year:
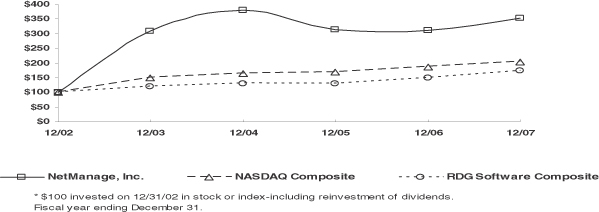
Market price of common stock
Our common stock is traded on the NASDAQ Global Market under the symbol NETM. According to the records of our stock transfer agent, as of March 27, 2008, there were 876 holders of record of our common stock. Many of the shares of our common stock are held by brokers and other institutions on behalf of stockholders and we are unable to estimate the exact total number of stockholders represented by these record holders.
The high and low closing sales prices of our common stock as reported on the NASDAQ Global Market for each quarter of 2007 and 2006 were as follows:
| | | | | | | | | | | | |
| | | First | | Second | | Third | | Fourth |
2007 | | | | | | | | | | | | |
High | | $ | 5.74 | | $ | 5.25 | | $ | 4.52 | | $ | 6.70 |
Low | | $ | 5.06 | | $ | 4.57 | | $ | 3.79 | | $ | 3.63 |
2006 | | | | | | | | | | | | |
High | | $ | 6.20 | | $ | 6.21 | | $ | 5.23 | | $ | 5.29 |
Low | | $ | 5.28 | | $ | 4.85 | | $ | 4.10 | | $ | 4.80 |
Dividends
We have not declared or paid cash dividends on our common stock and do not currently intend to pay any cash dividends in the foreseeable future. We are not subject to any agreements or debt instruments that restrict the payment of cash dividends.
Recent Sales of our Stock
We issued 263,678 unregistered shares of our common stock in connection with the acquisition of Librados, Inc. on October 22, 2004. The stock was issued to the former stockholders of Librados, Inc. and was subsequently registered pursuant to a Form S-3 filed on February 17, 2005 and declared effective on May 26, 2005.
20
Item 6—Selected financial data
The following selected consolidated financial data should be read in conjunction with our consolidated financial statements. The information set forth below is not necessarily indicative of results of future operations and should be read in conjunction with Item 7, “Management’s discussion and analysis of financial condition and results of operations” and the consolidated financial statements and notes to those financial statements included in Item 8 of this Form 10-K.
| | | | | | | | | | | | | | | | | | |
| | | For the Years Ended December 31, | |
| | | 2007 | | | 2006 | | | 2005 | | 2004 | | 2003 | |
| | | (in thousands, except per share data) | |
Statement of Operations Data: (1) | | | | | | | | | | | | | | | | | | |
Net revenues (2) | | $ | 35,970 | | | $ | 35,561 | | | $ | 43,434 | | $ | 47,666 | | $ | 50,663 | |
Income (loss) from operations (3)(4) | | | (2,096 | ) | | | (3,640 | ) | | | 2,433 | | | 1,507 | | | (4,663 | ) |
Net income (loss) | | | (1,954 | ) | | | (2,536 | ) | | | 4,711 | | | 1,424 | | | (2,685 | ) |
Net income (loss) per share, basic | | $ | (0.20 | ) | | $ | (0.27 | ) | | $ | 0.51 | | $ | 0.16 | | $ | (0.31 | ) |
Net income (loss) per share, diluted | | $ | (0.20 | ) | | $ | (0.27 | ) | | $ | 0.49 | | $ | 0.15 | | $ | (0.31 | ) |
Weighted average common shares, basic | | | 9,567 | | | | 9,439 | | | | 9,312 | | | 8,928 | | | 8,658 | |
Weighted average common shares, diluted | | | 9,567 | | | | 9,439 | | | | 9,650 | | | 9,359 | | | 8,658 | |
Balance Sheet Data: | | | | | | | | | | | | | | | | | | |
Cash and cash equivalents and short term investments | | $ | 25,364 | | | $ | 28,046 | | | $ | 21,515 | | $ | 19,789 | | $ | 20,299 | |
Long-term investments | | | — | | | | 600 | | | | 1,583 | | | — | | | — | |
Working capital | | | 15,831 | | | | 17,387 | | | | 14,046 | | | 9,860 | | | 7,847 | |
Total assets | | | 42,657 | | | | 47,353 | | | | 43,866 | | | 47,834 | | | 41,851 | |
Long-term liabilities | | | 1,204 | | | | 3,962 | | | | 1,150 | | | 2,543 | | | 584 | |
Total stockholders’ equity | | | 20,588 | | | | 21,177 | | | | 22,703 | | | 16,974 | | | 12,830 | |
| (1) | We acquired Librados in October 2004. |
| (2) | Net revenues in 2003 were previously revised to reflect a reclassification from cost of goods to net revenues related to shipping costs. |
| (3) | Income (loss) from operations include restructuring charges of $2.3 million and $1.8 million for the years ended December 31, 2007 and 2003 respectively. Income (loss) from operations for the year ended December 31, 2007 also included litigation settlement of $929,000 recovered during the year. In addition, income (loss) from operations includes asset impairment charges of approximately $43,000 for the year ended December 31, 2005. See further discussion in Item 7, “Management’s discussion and analysis of financial condition and results of operations.” |
| (4) | For the years ended 2007 and 2006, net loss and net loss per share includes the impact of SFAS 123(R), share-based compensation charges which was not included in prior years. Refer to Note 2 of our Notes to Consolidated Financial Statements. |
21
Item 7—Management’s discussion and analysis of financial condition and results of operations.
The following discussion should be read in conjunction with the Consolidated Financial Statements and related notes that appear in Item 8 of this Form 10-K.
Overview
We develop and market software solutions and service offerings that are designed to enable our customers to access, Web enable and integrate enterprise information systems. These solutions assist our customers in their efforts to leverage the investment they have in their corporate business applications, processes, and data. We provide a range of personal computer, browser-based and server-based software products and tools. These products allow our customers to access and leverage applications, business processes and data on IBM and IBM compatible mainframe computers, IBM mid-range computers such as the iSeries, in packaged applications, middleware, and databases such as SAP, Siebel, Oracle, and PeopleSoft, amongst others, and on UNIX and Microsoft-based servers. We provide support, maintenance, and technical consultation services to our customers in association with the products we develop and market. We provide applications and management consultancy to our customers primarily in association with the server-based products we deliver that are designed to allow customers to develop and deploy new web-based applications and services.
Important industry trends that have strong influence on our business strategy are as follows:
| | • | | the adoption of electronic commerce by major corporations worldwide and the acceptance of these approaches in mid-sized companies; |
| | • | | the continuing development of the Internet, intranets, and extranets for delivery of mission-critical business applications in large and mid-sized companies; |
| | • | | the desire on the part of corporations to make business processes and information broadly accessible internally and externally to their employees and business partners; and |
| | • | | the emergence of security and privacy standards and the need to keep all information secure. |
The globalization of enterprise customers, especially those in the consumer and retail space, has created opportunities for NetManage product proliferation. With the need for real time inventory and more specific customer tracking, standard legacy applications simply will not suffice. We anticipate that these trends will continue to accelerate over the next several years which equates to additional software and consulting service opportunities.
We believe that our customers require a single set of solutions that address the traditional need for host access combined with the need for the presentation of existing corporate systems with a Web application look and feel, along with the delivery of existing corporate processes and transactions as reusable programmatic components such as Web services. In assessing the change in the marketplace, we have focused on assisting our customers as they transition from traditional host access to newer software solutions that allow them to Web enable and integrate applications and data more cost effectively. Several technologies are employed to provide these solutions and include traditional thick client or desktop solutions; thin client or browser-based solutions; zero footprint or server-based solutions and application adapter or connector technologies. Within this marketplace, we believe the trend is away from desktop solutions and toward zero footprint solutions. We believe this movement is primarily driven by a desire to reduce the total cost of ownership associated with deploying and maintaining older technology. We also believe that a major element of our customer base will deploy a mixture of all types of solutions. We believe that our products, specifically our OnWeb integration products, are differentiated from competitive products in two main areas:
| | • | | Speed of deployment—applications can be Web enabled and deployed in days and weeks instead of weeks and months with more traditional application development; and, |
| | • | | Scalability of applications—applications, while initially deployed to a limited number of users may be further deployed to much larger user populations with little or no additional development effort. |
22
The market is also made up of a number of products that allow organizations to reduce costs or increase revenue by allowing them, or their business partners, to interact via the Internet with corporate business applications that are the backbone of their business processes. A primary example of this kind of solution is found in self-service call center applications. Companies are building solutions that allow customers to determine order status over the Internet without involving a customer support representative. This approach simultaneously minimizes staffing costs and improves customer service. Our products assist our customers in building solutions that quickly transform corporate applications into Web-based solutions.
Customer technology purchases are affected by many factors that are beyond our control, including longer-term infrastructure decisions, product offerings or pricing by our competitors, project timing and duration, business priorities, seasonal buying patterns and various customer financial constraints and initiatives. We believe that ongoing initiatives to reduce costs and improve profitability within our customer base has continued to put pressure on their IT budgets for both new license purchases and maintenance and consulting services. This has resulted in customers delaying decisions to license additional software solutions and reducing the number of copies of software that have been subject to maintenance agreements in the past or in certain cases to forgo maintenance agreements completely.
We have a direct sales force of 31 quota-carrying salespeople that generate the majority of our net revenues, two of which are exclusively selling through channels. Not all customers buy directly from us and many of our customers choose to place their orders through one of our channel partners because of pre-existing relationships they may have with them. We believe additional growth opportunities exist through indirect channels and further development of those channels is a priority for us. We also license our Librados adapters to independent software vendors (ISVs) for inclusion in their product or service offerings. We believe sales to ISVs will increase sales in the future but may fluctuate from quarter to quarter.
Developing and marketing innovative products is critical to our ongoing success. Time to market pressures also require us to regularly evaluate technology acquisitions that we believe will expand or enhance our existing product offering. We have acquired a number of companies since our inception and expect that we may make acquisitions in the future.
Product developments:
During our fiscal 2007 year, we introduced a number of new products and product developments, including:
| | • | | OnWeb Server: OnWeb Server is the complete solution to enable companies throughout the world to continue to use legacy host systems for mission critical applications. OnWeb turns inefficient green screen applications into graphical, Web-based applications and streamlines business processes, while creating reusable components. All this is accomplished without changing the business logic of the legacy application—lowering the risk and cost of deploying new business solutions. The OnWeb release for 2007 was the most extensive release of the product to date. Features and innovations such as iPrint, AJAX support, zero OLTP and a 300% performance increase were added. iPrint brings the industry’s first green and eco-friendly paperless printing solution while zero OLTP allows our System I customers to spend less on hardware while getting more performance out of their applications. |
| | • | | RUMBA Product Family: Our RUMBA product family gives customers the ability to access any legacy system from their Windows based desktops. During 2007, the RUMBA product family was updated to take advantage of the new Microsoft Vista operating system. The innovations to the RUMBA product family were driven by customer demands and their desire to migrate to Microsoft Vista. Additionally, our NFS client, the software that links Windows desktops with UNIX based file systems, was improved and continues to be the fastest and highest performing NFS client in the world. |
23
Entry into merger agreement with Rocket Software and subsequent termination
On December 11, 2007, NetManage entered into a merger agreement with Rocket Software, Inc., a Delaware corporation, and Eastern Software, Inc., a Delaware corporation and wholly-owned subsidiary of Rocket, pursuant to which Eastern Software would have been merged with and into NetManage, continuing as the surviving entity. Pursuant to the merger agreement, at the effective time of the merger, each share of the Company’s common stock would have been converted into the right to receive $7.20 cash and each outstanding option would have been converted into the right to receive $7.20 cash less the exercise price of such option. The Board of Directors of the Company unanimously approved the merger and the merger agreement at a special meeting on December 11, 2007, and directed that the merger agreement be submitted to the Company’s stockholders for adoption. On February 29, 2008, NetManage received notification from Rocket Software that it had failed to obtain the requisite financing to the proposed acquisition of NetManage within the contracted timeframe and, as a result, Rocket Software terminated the merger agreement.
Income taxes
During 2007, we recorded tax expense of approximately $206,000 composed primarily of foreign taxes.
Application of critical accounting policies
Our discussion and analysis of our financial condition and results of operations are based on our consolidated financial statements, which have been prepared in conformity with accounting principles generally accepted in the United States of America. Our preparation of these consolidated financial statements requires us to make judgments and estimates that affect the reported amounts of assets and liabilities, disclosure of contingent assets and liabilities at the date of the financial statements and the reported amounts of net revenues and expenses during the reporting period. We base our estimates on historical experience and on various other information available to us at the time and assumptions that we believe to be reasonable under the circumstances. Actual results may differ from such estimates under different assumptions or conditions. The following summarizes our critical accounting policies used in preparing our consolidated financial statements:
Revenue Recognition: We derive revenue primarily from two sources: (1) product revenue, which includes software license and royalty revenue, and (2) support and services revenue, which includes software maintenance and consulting services. We license our software products both on a term basis and on a perpetual basis. Our term-based arrangements are primarily for a period of 12 months. We also license our software in both source code and object code format. We apply the provisions of the American Institute of Certified Public Accountants (AICPA) Statement of Position (SOP) 97-2,Software Revenue Recognition,and related amendments and interpretations to all transactions involving the licensing of software products.
We recognize revenue from the sale of software licenses to end users and resellers when the following criteria are met: persuasive evidence of an arrangement exists, the product has been delivered, the fee is fixed or determinable, and collection of the resulting receivable is reasonably assured. Delivery occurs when the product is delivered to a common carrier or when a software key has been transmitted to our customer.
Product is sold without the right of return, except for distributor inventory rotation of old or excess product. Certain of our sales are made to domestic distributors under agreements allowing rights of return and price protection on unsold merchandise. Accordingly, we defer recognition of such sales until the distributor sells the merchandise. We recognize sales to international resellers upon shipment, provided all other revenue recognition criteria as mentioned above have been met. We give rebates to customers on a limited basis. Returns, price protection adjustments, and rebates are presented in our Consolidated Statement of Operations as a reduction of revenue.
24
At the time of the transaction, we assess whether the fee associated with a revenue transaction is fixed or determinable and whether or not collection is reasonably assured. To establish whether the fee is fixed or determinable, we assess the payment terms associated with the transaction. If a significant portion of a fee is due after its normal payment terms, we account for the fee as not being fixed or determinable. In these cases, we recognize revenue as the fees become due. To establish our ability to collect, we assess a number of factors, including past transaction history with the customer and the credit-worthiness of the customer. We do not request collateral from our customers. If we determine that collection of a fee is not reasonably assured, we recognize revenue at the time collection becomes reasonably assured, which is generally upon receipt of payment.
For sales, except those completed over the Internet, we use either a binding purchase order or equivalent customer commitment or signed license agreement as evidence of a contractual arrangement. For sales over the Internet, we use a credit card authorization as evidence of an arrangement. Sales through our distributors are evidenced by a master agreement governing the relationship together with binding purchase orders on a transaction-by-transaction basis.
For arrangements with multiple elements (for example, undelivered maintenance and support), we allocate revenue to each element of the arrangement using the residual value method based on vendor-specific objective evidence (VSOE) of the fair value of the undelivered elements. In effect, this means that we defer revenue from the arrangement fee equivalent to the fair value of the undelivered elements. Fair values for the ongoing maintenance and support obligations are generally based upon separate sales of renewals to other customers or upon renewal rates quoted in the sales contracts. Fair value of services, such as training or consulting, is based upon separate sales by us of these services to other customers. However, if an arrangement includes an acceptance provision, acceptance occurs upon the earlier of receipt of a written customer acceptance or expiration of the acceptance period.
Service revenues are derived from providing our customers with software updates or upgrades for existing software products, user documentation, and technical support under annual service agreements. These revenues are recognized ratably over the terms of such agreements. If such services are included in the initial licensing fee, the value of the services determined based on VSOE of fair value is unbundled and recognized ratably over the related service period. Service revenues derived from consulting and training are deferred and recognized when the services are performed and collection is considered probable. To date, consulting revenue has not been significant.
Allowance for doubtful accounts, sales returns, and rebates: In establishing our allowance for doubtful accounts, we analyze historical bad debts, customer concentrations, customer credit-worthiness, current economic trends, and changes in our customer payment terms. We apply significant judgment in connection with assessing whether or not our accounts receivable are collectible. Our accounts receivable balance was $10.5 million and $10.2 million, net of our allowance for doubtful accounts of $98,000 and $117,000 at December 31, 2007 and 2006, respectively. In establishing our sales return and rebate allowance, we must make estimates of potential future product returns related to current period product revenue, including analyzing historical returns, current economic trends, and changes in customer demand and acceptance of our products. Our reserves for returns were $8,000 and $6,000 at December 31, 2007 and 2006, respectively, and represented less than 0.1% of total net revenues for both 2007 and 2006. Our reserves for rebates were $0 and $1,000 at December 31, 2007 and 2006, respectively, and represented less than 0.1% of total net revenues for both 2007 and 2006.
Restructuring reserves: We accrue for restructuring costs when we make a commitment to a firm exit plan that specifically identifies all significant actions to be taken in conjunction with our response to a change in our strategic plan, product demand, expense structure, or other factors such as the date we cease using a facility. We reassess our prior restructuring accruals on a quarterly basis to reflect changes in the costs of our restructuring activities, and we record new restructuring accruals as commitments are made. Estimates are based on anticipated costs of such restructuring activities and are subject to change. Our restructuring reserves balance was $903,000 and $357,000 as of December 31, 2007 and 2006, respectively. For further discussion, see Note 3 to the Notes to Consolidated Financial Statements.
25
Accounting for income taxes: As part of the process of preparing our consolidated financial statements, we are required to estimate our income taxes in each of the jurisdictions in which we operate. This process requires us to estimate our actual current tax exposure together with assessing temporary differences resulting from differing treatment of items, such as deferred revenue, for tax and accounting purposes. These differences result in deferred tax assets and liabilities, which are included within our consolidated balance sheet. We must then assess the likelihood that our deferred tax assets will be recovered from future taxable income and to the extent, we believe that recovery is not likely, we must establish a valuation allowance. To the extent we establish a valuation allowance or increase this allowance in a period, we must include an expense within the tax provision in the Consolidated Statement of Operations.
Significant judgment is required in determining our provision for income taxes, our deferred tax assets, and liabilities, and any valuation allowance recorded against our net deferred tax assets. As of December 31, 2007, we had a net deferred tax asset of approximately $50.7 million, consisting primarily of net operating loss carryforwards. Realization of such carryforwards before they expire is dependent on our generating sufficient future taxable income. We recorded a valuation allowance for the entire balance of the net deferred tax assets at December 31, 2007 due to uncertainties related to our ability to utilize the carryforwards before they expire. The valuation allowance is based on our estimates of taxable income by jurisdiction in which we operate and the period over which our deferred tax assets will be recoverable. In the event that actual results differ from these estimates, we will adjust these estimates in future periods.
Our tax liabilities calculations involve uncertainties in the application of complex tax laws and regulations. In the first quarter of 2007, we adopted Financial Accounting Standards Board (FASB) Interpretation No. 48, “Accounting for Uncertainty in Income Taxes—an interpretation of SFAS No. 109” (FIN 48), and related guidance (see “Note 7: Income Taxes” in Part II, Item 8 of this Form 10-K). In the process of adopting FIN 48, we recognize tax liabilities for uncertain tax positions based on the two-step process prescribed in the interpretation. The first step is to evaluate each tax position for recognition by determining if it is more likely than not that the position will be sustained on audit, including resolution of any appeals or litigation processes, based on assessment of available evidence. The second step requires us to estimate and measure the tax benefit in the amount that is more than 50% likely to be realized upon ultimate settlement with the tax authorities. It is inherently difficult and subject to significant judgment to estimate these amounts, as the amounts weigh the probability of various possible outcomes. We reevaluate these uncertain tax positions on a quarterly basis. This ongoing evaluation is based on various factors including, but not limited to, changes in facts or circumstances, changes in tax law, effectively settled issues under audit, and new or expanded audit activity. Such a change in recognition or measurement would result in the recognition of a tax benefit or an additional charge to the tax provision.
Valuation of long-lived and intangible assets and goodwill: We believe that the accounting estimate related to asset impairment is a “critical accounting estimate” because: (1) it is highly susceptible to change from period to period as it requires us to make assumptions about future revenues over the life of our software products and services; and (2) the impact that recognizing an impairment has on the assets reported on our Consolidated Balance Sheet and the net income (loss) reported in our Consolidated Statement of Operations could be material.
Our assumptions about future revenues and sales volumes require significant judgment because actual sales prices and volumes have fluctuated significantly in the past and are expected to continue to do so. In estimating future revenues, we use our sales performance, planned levels of product development, planned new product launches, our internal budgets, and industry market estimates of planned market size and growth rates to assist us.
We assess the carrying value of identifiable intangibles and long-lived assets whenever events or changes in circumstances indicate that the carrying value may not be recoverable. We assess the carrying value of goodwill whenever events or changes in circumstances indicate that the carrying value may not be recoverable and at a minimum, annually. SFAS No. 142,Goodwill and Other Intangible Assetsrequires that if the fair value of a
26
company’s individual reporting unit is less than the reported value of the individual reporting unit, an asset impairment charge must be recognized in the financial statements. The amount of the impairment is calculated by subtracting the fair value of the asset from the carrying value of the asset. We measure impairment based on a projected discounted cash flow method using a discount rate determined by management to be commensurate with the risk inherent in our current business model.
Factors we consider important which could trigger an impairment review include the following:
| | • | | significant underperformance relative to expected historical or projected future operating results; |
| | • | | significant changes in the manner of our use of the acquired assets or the strategy for our overall business; |
| | • | | significant negative industry or economic trends; and |
| | • | | our market capitalization relative to net book value. |
In connection with the acquisition of Librados in October 2004, we recorded an intangible asset related to employment contracts for certain individuals. In the quarter ended September 30, 2005, former key Librados executives terminated their employment and the remaining unamortized value of the related employment agreement of $43,000 was expensed. In the quarter ended March 31, 2006, we recorded a reduction in Goodwill of $49,000. This reduction was the result of the resolution of a pre-acquisition contingency recovered in cash from an escrow account set up at the time of the Librados acquisition.
We reviewed our recorded goodwill for impairment at December 31, 2007 and 2006, and concluded that there was no impairment as of these dates.
Recent accounting pronouncements
See Note 2 in the Notes to Consolidated Financial Statements in Item 8 of this Form 10-K for a description of recent accounting pronouncements, including the expected dates of adoption and estimated effects on results of operations and financial condition, which is incorporated herein by reference.
Restructurings
During 2007 and earlier years, we undertook a number of initiatives intended to control costs and reduce operating expenses including the discontinuance of several low revenue-generating products and the implementation of worldwide restructurings of our operations as a result of acquisitions and prevailing market conditions. We believe that the objectives set forth in our prior initiatives have been met and at this time, we only foresee the need for a periodic change in estimate due to foreign exchange valuation on our non-U.S. facility obligations.
On February 22, 2007, the Company implemented a restructuring of operations designed to align its business units with its core business functions, to relocate certain of its functional operations, and to reduce operating expenses. As part of the restructuring, the Company reduced its workforce in excess of 10% and recorded a $2.0 million charge to operating expenses in the year ended December 31, 2007.
On January 30, 2003, we announced a restructuring of the Company in response to the sluggish North American and European economies. We believed it was necessary to refocus our operations and reduce our operating expenses to bring them in line with our revised anticipated revenue levels. We implemented a reduction in our workforce of more than 30% and recorded a $2.0 million restructuring charge consisting of $1.6 million relating to employee and other-related expenses for employee terminations and $0.4 million related to facilities no longer needed for company operations as required by SFAS No. 146, Accounting for Costs Associated with Exit or Disposal Activities, in the first quarter of 2003. Additional restructuring charges and credits, related to the January 2003 restructuring, of $0.9 million, $0.4 million and $(0.1) million were recorded
27
in the second, third and fourth quarters of 2003, respectively. In 2005, we recorded a reduction in restructuring expense of approximately $0.2 million for severance related to European operations. During 2004, the Company recorded approximately $0.2 million reduction in our estimate primarily related to the successful sublease of unoccupied space in the Ottawa facility In the quarter ended March 31, 2006, the Company recorded an increase in the restructuring charge of $7,000 as an adjustment to the expected facility obligations in Ottawa, Canada. During 2007 As of December 31, 2007, the Company had incurred net costs totaling $2.8 million related to the restructuring, which has required $2.8 million in cash expenditures. For the year ended December 31, 2007, the Company recorded a change in estimate of $14,000 and utilized $11,000 of the reserve. As of December 31, 2007, there are no more obligations for restructuring reserve related to the January 2003 restructuring.
In years prior to 2003, we recorded restructuring charges related to current economic pressures or because of business acquisitions. As of December 31, 2007, the remaining reserves related to these restructurings were $93,000 and $270,000 in accrued liabilities and other long-term liabilities, respectively.
Stock repurchase program
Our Board of Directors has authorized in 1998 the repurchase from time to time of up to 2,142,857 shares of our common stock through open market purchases. No purchases of our common stock were made in 2007, 2006, or 2005. Cumulatively, as of December 31, 2007, we had repurchased 2,076,848 shares of our common stock at an average price of $10.02 per share for a total cost of approximately $20.8 million from 1998 to 2007.
28
Results of Operations
Year ended December 31, 2007 compared to year ended December 31, 2006 (in thousands)
| | | | | | | | | | | | | | | |
| | | Year Ended December 31, | | | | | | | |
| | | 2007 | | | 2006 | | | Change | |
Net revenues | �� | | | | | | | | | | | | | | |
License fees | | $ | 11,580 | | | $ | 12,380 | | | $ | (800 | ) | | (6 | )% |
Services | | | 24,390 | | | | 23,181 | | | | 1,209 | | | 5 | % |
| | | | | | | | | | | | | | | |
Total net revenues | | | 35,970 | | | | 35,561 | | | | 409 | | | 1 | % |
As a percentage of net revenues: | | | | | | | | | | | | | | | |
License fees | | | 32.2 | % | | | 34.8 | % | | | | | | | |
Services | | | 67.8 | % | | | 65.2 | % | | | | | | | |
| | | | | | | | | | | | | | | |
Total net revenues | | | 100.0 | % | | | 100.0 | % | | | | | | | |
| | | | | | | | | | | | | | | |
Gross margin—license fees | | $ | 10,577 | | | $ | 11,549 | | | $ | (972 | ) | | (8 | )% |
Gross margin—services | | | 20,920 | | | | 19,750 | | | | 1,170 | | | 6 | % |
Gross margin—amortization of intangibles | | | (325 | ) | | | (280 | ) | | | (45 | ) | | 16 | % |
| | | | | | | | | | | | | | | |
Total gross margin | | $ | 31,172 | | | $ | 31,019 | | | $ | 153 | | | 1 | % |
As a percentage of net revenues: | | | | | | | | | | | | | | | |
Gross margin—license fees | | | 29.4 | % | | | 32.5 | % | | | | | | | |
Gross margin—services | | | 58.2 | % | | | 55.5 | % | | | | | | | |
Gross margin—amortization of intangibles | | | (0.9 | )% | | | (0.8 | )% | | | | | | | |
Total gross margin | | | 86.7 | % | | | 87.2 | % | | | | | | | |
Research and development | | $ | 6,244 | | | $ | 7,209 | | | $ | (965 | ) | | (13 | )% |
As a percentage of total net revenues: | | | 17.3 | % | | | 20.3 | % | | | | | | | |
Sales and marketing | | $ | 19,117 | | | $ | 20,715 | | | $ | (1,598 | ) | | (8 | )% |
As a percentage of total net revenues: | | | 53.1 | % | | | 58.3 | % | | | | | | | |
General and administrative | | $ | 6,446 | | | $ | 6,194 | | | $ | 252 | | | 4 | % |
As a percentage of total net revenues: | | | 17.9 | % | | | 17.4 | % | | | | | | | |
Litigation settlement | | $ | (929 | ) | | $ | — | | | $ | (929 | ) | | 0 | % |
As a percentage of total net revenues: | | | (2.6 | )% | | | 0.0 | % | | | | | | | |
Restructuring charges | | $ | 2,330 | | | $ | 181 | | | $ | 2,149 | | | 1,187 | % |
As a percentage of total net revenues: | | | 6.5 | % | | | 0.5 | % | | | | | | | |
Amortization of other intangible assets | | $ | 60 | | | $ | 360 | | | $ | (300 | ) | | (83 | )% |
As a percentage of total net revenues: | | | 0.2 | % | | | 1.0 | % | | | | | | | |
Interest income and other, net | | $ | 1,195 | | | $ | 1,160 | | | $ | 35 | | | 3 | % |
As a percentage of total net revenues: | | | 3.3 | % | | | 3.3 | % | | | | | | | |
Foreign currency transaction losses | | $ | (847 | ) | | $ | (139 | ) | | $ | (708 | ) | | 509 | % |
As a percentage of total net revenues: | | | (2.35 | )% | | | (0.4 | )% | | | | | | | |
Provision (benefit) for income taxes | | $ | 206 | | | $ | (83 | ) | | $ | 289 | | | (348 | )% |
As a percentage of total net revenues | | | 0.6 | %(1) | | | (0.2 | )%(2) | | | | | | | |
| | | | | | | | | | | | | | | |
Net loss | | $ | (1,954 | ) | | $ | (2,536 | ) | | $ | 582 | | | (23 | )% |
As a percentage of total net revenues: | | | (5.4 | )% | | | (7.1 | )% | | | | | | | |
| (1) | During 2007, the Company recorded tax expense of approximately $206,000 composed primarily of foreign taxes. |
| (2) | The tax benefit for the year ended December 31, 2006 was a result of favorable non-U.S. tax adjustments and non-U.S. tax refunds. The foreign adjustments related to the release of international reserves on liquidation of non-U.S. dormant entity. |
29
Net revenues
Historically, our net revenues have been derived primarily from: (1) License fees revenue, which includes software license and royalty revenue net of returns and rebates, and (2) Services revenue, which include software maintenance and consulting services.
For the year ended December 31, 2007, our total net revenues increased 1% compared to the year ended December 31, 2006. This increase in net revenues resulted from a decrease in license fees of $0.8 million, or 6%, and an increase in services revenues of $1.2 million, or 5%, compared to the same period in 2006 and primarily results from an increase in revenues from our older technologies offset in part by the decline in our new product offerings. License fees represented 32% of total revenues in 2007 compared to 35% of total revenues in 2006. Services revenues increased to 68% of total revenues in 2007 compared to 65% in 2006. We believe that the decline in license fees resulted from lengthening sales cycles due to cautious IT spending, the continued pressure on organizations to reduce costs and, in large part, the reduction in the sales force during the first half of 2007. The increase in our services revenues was because of decisions by our customers in the latter part of 2006 to renew maintenance contracts primarily on our stable and mature RUMBA products. We generally ship software products within a short period of time after receipt of an order and therefore we do not have a material backlog of unfilled orders.
We have operations worldwide, with sales offices located in the United States, Europe, China, Canada, and Israel. Revenues outside of North America as a percentage of total net revenues were approximately 40% and 36% for the years ended December 31, 2007 and 2006, respectively.
No customer accounted for more than 10% of net revenues during the years ended December 31, 2007 and 2006.
Gross margin
Gross margin decreased in absolute dollars for license fees and increased in services for the year ended December 31, 2007 as compared to the year ended December 31, 2006, primarily because of the increase in total net revenues of 1%.
Gross margin for license fees as a percentage of total net revenues declined to 29% in 2007 from 33% in 2006 primarily due to the 6% reduction in license fees and in part by a 21% increase in cost of goods associated with license fees from 2006 to 2007.
Services revenues increased to 68% of total revenues in 2007 from 65% in 2006 and the gross margin for services increased to 58% in 2007 from 56% in 2006 as a result. Services cost of goods were flat.
Research and development
Research and development, or R & D, expenses consist primarily of salaries and benefits, occupancy, travel expenses, and fees paid to outside consultants. R & D expenses decreased in 2007 as compared to 2006. R&D expenses decreased $1.0 million or 13% for 2007 as compared to 2006 primarily due to a reduction in headcount of 19 employees and lower corporate expense allocations offset by increased bonuses.
Software development costs are accounted for in accordance with SFAS No. 86, Accounting for the Costs of Computer Software to be Sold, Leased or Otherwise Marketed, under which we are required to capitalize software development costs after technological feasibility is established which we define as a working model and further define as a beta version of the software. The establishment of technological feasibility and the ongoing assessment of the recoverability of these costs requires considerable judgment by us with respect to certain external factors, including, but not limited to, anticipated future gross product revenue, estimated economic life, and changes in technology. Costs that do not qualify for capitalization are charged to R & D expense when incurred. We did not capitalize any software development costs in 2007 or 2006.
30
Sales and marketing
Sales and marketing expenses consist primarily of salaries and commissions of sales personnel, salaries of marketing personnel, advertising and promotional expenses, occupancy, and related costs. Sales and marketing expenses decreased $1.6 million, or 8%, for the year 2007 as compared to the year 2006, primarily as a result of the reduction of 30 sales and marketing personnel which caused a decrease in salaries, benefits, and related costs. Commission expense decreased in 2007 as compared to 2006 due to the February 2007, restructuring of sales force and also due to lower sales, travel, recruiting, temp labor, seminars and tradeshows. These decreases were offset by increases in costs associated with corporate expense allocations, bonuses and outside services.
General and administrative
General and administrative expenses consist primarily of salaries, benefits, accounting, travel, legal, and occupancy expenses. General and administrative expenses increased $0.3 million, or 4% for the year 2007 as compared to 2006 primarily due to increases in bonus expense, consulting and outside services offset in part by reduced headcount of 14 individuals, reductions in legal, recruiting, business fees and lower corporate expense allocations.
Litigation settlement
Litigation settlement for the year ended December 31, 2007 in the amount of $929,000 includes $918,000 that was received by the Company during the second quarter of 2007 in connection with the settlement of litigation filed by the Company in 2003 and from $11,000 that was received by the Company during the third quarter of 2007 in connection with the settlement of a complaint filed in 2005. These settlements are reflected as a seperate item in operating expenses.
Restructuring charges
Restructuring charges consist of charges recorded for the restructuring event implemented in February 2007, January 2003, and August 1998, to align our core business functions, to relocate certain operations and to reduce operating expenses. Restructuring charges also include adjustments to the estimated cost of restructuring activities made in previous periods. The restructuring charges for the year ended December 31, 2007 includes $1.0 million for facility costs and $1.3 million in personnel costs. Restructuring charges in 2006 of $181,000 relate primarily to adjustments to the 1999 restructuring reserves for facility obligations in the UK Restructuring.
Amortization of other intangible assets
Effective January 1, 2002, the Company adopted SFAS No. 142, Goodwill and Other Intangibles. Under SFAS No. 142, goodwill is no longer subject to amortization. Rather, SFAS No. 142 requires that intangible assets considered to have an indefinite useful life be reviewed for impairment upon adoption of SFAS No. 142 and at least annually thereafter.
Intangible assets with determinable useful lives are amortized on a straight-line basis over their estimated useful lives ranging from two to five years. Amortization of developed technology is amortized as an expense in cost of goods while all other intangibles are amortized as an operating expense. In connection with the acquisition of Librados in October 2004, we recorded an intangible asset related to employment contracts for certain individuals. In the quarter ended September 30, 2005, employment with these individuals was terminated and the remaining unamortized value of the related intangible asset of $43,000 was expensed. Amortization expense for developed technology was $0.3 million in both 2007 and 2006 and total intangible amortization expense recorded in 2007 was $0.4 million compared to $0.6 million recorded in 2006. The decrease in amortization expense of $0.2 million for the year 2007 as compared to 2006 is the result of intangible assets that were fully amortized in 2006, offset in part by increase of new Intangible amortization that started in 2007.
31
Interest income and other, net
The largest component of interest income and other, net is interest earned on cash, cash equivalents, and investments, primarily held in the U.S. Interest income and other, net was $1,195,000 and $1,160,000 for the years ended December 31, 2007 and 2006, respectively.
Our interest income on cash and investments increased for the year ended December 31, 2007 as compared to 2006 as a result of investing a larger proportion of our cash in interest bearing securities at higher average rates. We recorded other income of $46,000, primarily related to a local tax refund in the year ended December 31, 2007. In the year ended December 31, 2006, we recorded other income of $151,000, primarily related to the sale of certain non-operating net assets. The following table identifies the components of our interest income (expense) and other, net for the years ended December 31, 2007 and 2006, respectively (in thousands):
| | | | | | | | |
| | | Year ended
December 31, | |
| | | 2007 | | | 2006 | |
Interest income (expense) | | | | | | | | |
On cash and investments | | $ | 1,161 | | | $ | 1,015 | |
On tax refunds | | | 5 | | | | 1 | |
Interest expense | | | (17 | ) | | | (7 | ) |
Other income | | | 46 | | | | 151 | |
| | | | | | | | |
Interest income and other, net | | $ | 1,195 | | | $ | 1,160 | |
| | | | | | | | |
Foreign currency transaction gains (losses)
We recorded a transaction loss of $0.8 million and $0.1 million for the years ended December 31, 2007 and 2006 respectively. The transaction loss for the year ended December 31, 2007 is composed primarily of foreign currency losses of $0.4 million on vendor and customer foreign denominated assets and liabilities and on foreign currency losses on inter-company accounts of $0.4 million. The transaction loss for the year ended December 31, 2006 is composed primarily foreign currency losses of $0.1 million on vendor and customer foreign denominated assets and liabilities and on foreign currency losses on inter-company accounts. Except as noted, transaction gains and losses are attributable to fluctuations related primarily to the Israeli shekel (Shekel) in relation to the U.S. dollar (USD), the British Pound (Pound) and the Euro. For the years ended December 31, 2007 and 2006, the relationship of the Shekel to the USD, the Pound, and the Euro was as follows:
| | | | | | |
| | | Year ended
December 31, | |
| | | 2007 | | | 2006 | |
USD% Change | | -8.7 | % | | -8.2 | % |
Pound% Change | | -6.9 | % | | 4.0 | % |
Euro% Change | | 2.4 | % | | 1.6 | % |
32
Provision for income taxes
We recorded tax expense for the year ended December 31, 2007 of approximately $0.2 million. The tax expense relates to international and U.S. state tax obligations. We recorded a tax benefit for the year ended December 31, 2006 of approximately $0.1 million. The tax benefit primarily relates to a refund of non-U.S. taxes in the Netherlands of $0.1 million offset in part by international and U.S. federal and state tax obligations. Our effective tax rate for 2006 was approximately 3%.
| | | | | | | |
| | | Year Ended
December 31, | |
| | | 2007 | | 2006 | |
U.S. federal tax | | $ | 27 | | $ | 2 | |
U.S. state tax | | | 35 | | | 13 | |
International tax | | | 144 | | | 37 | |
International reserve adjustment on liquidation of non-U.S. entities | | | — | | | (51 | ) |
Income tax refunds: | | | | | | | |
Netherlands | | | — | | | (84 | ) |
| | | | | | | |
Total expense/(benefit) for income taxes | | $ | 206 | | $ | (83 | ) |
| | | | | | | |
As of December 31, 2007, we had a gross deferred tax asset of approximately $50.7 million. Realization of the gross deferred tax asset is dependent on our generating sufficient future taxable income. We have fully reserved the gross deferred tax asset because we have concluded that it more likely than not that the deferred tax assets will not be realized.
33
Year ended December 31, 2006 compared to year ended December 31, 2005 (in thousands)
| | | | | | | | | | | | | | | |
| | | Year Ended December 31, | | | | | | | |
| | | 2006 | | | 2005 | | | Change | |
Net revenues | | | | | | | | | | | | | | | |
License fees | | $ | 12,380 | | | $ | 17,205 | | | $ | (4,825 | ) | | (28 | )% |
Services | | | 23,181 | | | | 26,229 | | | | (3,048 | ) | | (12 | )% |
| | | | | | | | | | | | | | | |
Total net revenues | | | 35,561 | | | | 43,434 | | | | (7,873 | ) | | (18 | )% |
As a percentage of net revenues: | | | | | | | | | | | | | | | |
License fees | | | 34.8 | % | | | 39.6 | % | | | | | | | |
Services | | | 65.2 | % | | | 60.4 | % | | | | | | | |
| | | | | | | | | | | | | | | |
Total net revenues | | | 100.0 | % | | | 100.0 | % | | | | | | | |
| | | | | | | | | | | | | | | |
Gross margin—license fees | | $ | 11,549 | | | $ | 16,108 | | | $ | (4,559 | ) | | (28 | )% |
Gross margin—services | | | 19,750 | | | | 22,932 | | | | (3,182 | ) | | (14 | )% |
Gross margin—amortization of intangibles | | | (280 | ) | | | (280 | ) | | | — | | | 0 | % |
| | | | | | | | | | | | | | | |
Total gross margin | | $ | 31,019 | | | $ | 38,760 | | | $ | (7,741 | ) | | (20 | )% |
As a percentage of net revenues: | | | | | | | | | | | | | | | |
Gross margin—license fees | | | 32.5 | % | | | 37.0 | % | | | | | | | |
Gross margin—services | | | 55.5 | % | | | 52.8 | % | | | | | | | |
Gross margin—amortization of intangibles | | | (0.8 | )% | | | (0.6 | )% | | | | | | | |
Total gross margin | | | 87.2 | % | | | 89.2 | % | | | | | | | |
Research and development | | $ | 7,209 | | | $ | 7,200 | | | $ | 9 | | | 0 | % |
As a percentage of total net revenues: | | | 20.3 | % | | | 16.6 | % | | | | | | | |
Sales and marketing | | $ | 20,715 | | | $ | 20,350 | | | $ | 365 | | | 2 | % |
As a percentage of total net revenues: | | | 58.3 | % | | | 46.9 | % | | | | | | | |
General and administrative | | $ | 6,194 | | | $ | 8,343 | | | $ | (2,149 | ) | | (26 | )% |
As a percentage of total net revenues: | | | 17.4 | % | | | 19.2 | % | | | | | | | |
Restructuring charges (reversals) | | $ | 181 | | | $ | (59 | ) | | $ | 240 | | | (407 | )% |
As a percentage of total net revenues: | | | 0.5 | % | | | (0.1 | )% | | | | | | | |
Amortization of other intangible assets | | $ | 360 | | | $ | 493 | | | $ | (133 | ) | | (27 | )% |
As a percentage of total net revenues: | | | 1.0 | % | | | 1.1 | % | | | | | | | |
Interest income and other, net | | $ | 1,160 | | | $ | 731 | | | $ | 429 | | | 59 | % |
As a percentage of total net revenues: | | | 3.3 | % | | | 1.7 | % | | | | | | | |
Foreign currency transaction gains (losses) | | $ | (139 | ) | | $ | (283 | ) | | $ | 144 | | | (51 | )% |
As a percentage of total net revenues: | | | (0.4 | )% | | | (0.7 | )% | | | | | | | |
Provision (benefit) for income taxes | | $ | (83 | ) | | $ | (1,830 | ) | | $ | 1,747 | | | (95 | )% |
As a percentage of total net revenues | | | (0.2 | )%(1) | | | (4.2 | )%(2) | | | | | | | |
| | | | | | | | | | | | | | | |
Net income (loss) | | $ | (2,536 | ) | | $ | 4,711 | | | $ | (7,247 | ) | | (154 | )% |
As a percentage of total net revenues: | | | (7.1 | )% | | | 10.8 | % | | | | | | | |
| (1) | The tax benefit for the year ended December 31, 2006 was a result of favorable non-U.S. tax adjustments and non-U.S. tax refunds. The foreign adjustments related to the release of international reserves on liquidation of non-U.S. dormant entity. |
| (2) | The tax benefit for the year ended December 31, 2005 was a result of favorable non-U.S. and U.S. state tax adjustments and non-U.S. tax refunds. The foreign adjustments related to resolution of a non-U.S. tax audit and dissolution of dormant entities. |
34
Net revenues
Historically, our net revenues have been derived primarily from: (1) product revenue, which includes software license and royalty revenue net of returns and rebates, and (2) support and services revenue, which include software maintenance and consulting services.
For the year ended December 31, 2006, our total net revenues decreased 18% compared to the year ended December 31, 2005. This decline in net revenues resulted from a decrease in license fees of $4.8 million, or 28%, and a decrease in services revenues of $3.0 million, or 12% compared to the same period in 2005 and primarily results from a decrease in revenues from our older technologies offset in part by the growth in our new product offerings. License fees represented 35% of total revenues in 2006 compared to 40% of total revenues in 2005. Services revenues increased to 65% of total revenues in 2006 compared to 60% in 2005. We believe that the decline in license fees resulted from lengthening sales cycles due to cautious IT spending, the continued pressure on organizations to reduce costs, and to lower productivity from the North American sales force that, in large part, were hired during the first half of 2006. The decline in our services revenues was a product of lower license sales and from decisions by our customers in the latter part of 2005 to not renew maintenance contracts primarily on our stable and mature RUMBA products. We generally ship software products within a short period of time after receipt of an order and therefore we do not have a material backlog of unfilled orders.
From 2001 through 2006, we have experienced declines in our revenues on an annual basis. We believe this has resulted from the soft economic conditions in both North America and Europe that have affected our customers purchasing decisions and because of our transitioning our business from older, more expensive software solutions to newer technologies and solutions that utilize the Internet.
We have operations worldwide, with sales offices located in the United States, Europe, Canada, and Israel. Revenues outside of North America as a percentage of total net revenues were approximately 36% and 33% for the years ended December 31, 2006 and 2005, respectively.
No customer accounted for more than 10% of net revenues during the years ended December 31, 2006 and 2005.
Gross margin
Gross margin decreased in absolute dollars for both license fees and services for the year ended December 31, 2006 as compared to the year ended December 31, 2005, primarily because of the decline in total net revenues of 18%.
Gross margin for license fees as a percentage of total net revenues declined to 33% in 2006 from 37% in 2005 primarily due to the 28% reduction in license fees offset in part by a 24% reduction in cost of goods associated with license fees from 2005 to 2006.
Services revenues increased to 65% of total revenues in 2006 from 60% in 2005 and the gross margin for services increased to 56% in 2006 from 53% in 2005 as a result. Services cost of goods increased 4% from 2005 to 2006 primarily due to share-based compensation expense and corporate allocations. The effect on gross margin from the Librados acquisition was not material in any period presented.
Research and development
Research and development, or R & D, expenses consist primarily of salaries and benefits, occupancy, travel expenses, and fees paid to outside consultants. R & D expenses remained flat in 2006 as compared to 2005 but increased to 20% of total net revenues in 2006 compared to 17% of total net revenues in 2005 because of decreased revenues. R & D costs decreased in 2006 as compared to 2005 on a reduced headcount of four individuals but were offset by corporate allocations and by share-based compensation.
35
Software development costs are accounted for in accordance with SFAS No. 86, Accounting for the Costs of Computer Software to be Sold, Leased or Otherwise Marketed, under which we are required to capitalize software development costs after technological feasibility is established which we define as a working model and further define as a beta version of the software. The establishment of technological feasibility and the ongoing assessment of the recoverability of these costs requires considerable judgment by us with respect to certain external factors, including, but not limited to, anticipated future gross product revenue, estimated economic life, and changes in technology. Costs that do not qualify for capitalization are charged to R & D expense when incurred. We did not capitalize any software development costs in 2006 or 2005.
Sales and marketing
Sales and marketing expenses consist primarily of salaries and commissions of sales personnel, salaries of marketing personnel, advertising and promotional expenses, occupancy, and related costs. Sales and marketing expenses increased $0.4 million, or 2%, for the year 2006 as compared to the year 2005, primarily as a result of the addition of nine sales and marketing personnel resulting in increased salary, benefits, and related costs. Commission expense was lower in 2006 as compared to 2005 because of the transition in the sales force and lower sales; however, this was offset by increased costs associated with corporate allocations and by share-based compensation expense.
General and administrative
General and administrative expenses consist primarily of salaries, benefits, accounting, travel, legal, and occupancy expenses. General and administrative expenses decreased $2.1 million, or 26% for the year 2006 as compared to 2005 primarily on a reduced headcount of four individuals, reduced incentive compensation, and reductions in legal and services expenses offset in part by share-based compensation expense.
Restructuring charges (reversals)
Restructuring charges in 2006 of $181,000 relate primarily to adjustments to the 1999 restructuring reserves for facility obligations in the UK Restructuring charges in 2005 of $(59,000) relate primarily to an adjustment to facility obligations for both the 2003 and 1999 restructurings reserves.
Amortization of other intangible assets
Effective January 1, 2002, the Company adopted SFAS No. 142, Goodwill and Other Intangibles. Under SFAS No. 142, goodwill is no longer subject to amortization. Rather, SFAS No. 142 requires that intangible assets considered to have an indefinite useful life be reviewed for impairment upon adoption of SFAS No. 142 and at least annually thereafter.
Intangible assets with determinable useful lives are amortized on a straight-line basis over their estimated useful lives ranging from two to five years. Amortization of developed technology is amortized as an expense in cost of goods while all other intangibles are amortized as an operating expense. In connection with the acquisition of Librados in October 2004, we recorded an intangible asset related to employment contracts for certain individuals. In the quarter ended September 30, 2005, employment with these individuals was terminated and the remaining unamortized value of the related intangible asset of $43,000 was expensed. Amortization expense for developed technology was $0.3 million in both 2006 and 2005 and total intangible amortization expense recorded in 2006 was $0.6 million compared to $0.7 million recorded in 2005.
Interest income and other, net
The largest component of interest income (expense) and other, net is interest earned on cash, cash equivalents, and investments, primarily held in the U.S. Interest income (expense) and other, net was $1,160,000 and $731,000 for the years ended December 31, 2006 and 2005, respectively. Our interest income on cash and investments increased in the twelve month periods ended December 31, 2006 as compared to the same period in
36
2005 as a result of investing a larger proportion of our cash in interest bearing securities at higher average rates. We recorded other income of $151,000, primarily related to the sale of certain non-operating net assets in the year ended December 31, 2006. In the year ended December 31, 2005, we recorded interest earned of $210,000 on income tax refunds received in Germany and we recorded a gain on investments of $35,000 primarily related to the sale of our investment in KANA Software Inc. The following table identifies the components of our interest income (expense) and other, net for the years ended December 31, 2006 and 2005, respectively (in thousands):
| | | | | | | | |
| | | Year ended
December 31, | |
| | | 2006 | | | 2005 | |
Interest income (expense) | | | | | | | | |
On cash and investments | | $ | 1,015 | | | $ | 495 | |
On tax refunds | | | 1 | | | | 211 | |
Interest expense | | | (7 | ) | | | (10 | ) |
Gain on investments | | | — | | | | 35 | |
Other income | | | 151 | | | | — | |
| | | | | | | | |
Interest income (expense) and other, net | | $ | 1,160 | | | $ | 731 | |
| | | | | | | | |
We recorded a transaction loss of $0.1 million and $0.3 million for the years ended December 31, 2006 and 2005 respectively. The transaction loss for the year ended December 31, 2006 is composed primarily foreign currency losses of $0.1 million on vendor and customer foreign denominated assets and liabilities and on foreign currency losses on inter-company accounts. The transaction loss for the year ended December 31, 2005 is primarily composed of foreign exchange loss of $0.4 million on inter-company accounts offset by a foreign exchange gain of approximately $0.1 million on vendor and customer foreign denominated assets and liabilities. Except as noted, transaction gains and losses are attributable to fluctuations related primarily to the Israeli shekel (Shekel) in relation to the U.S. dollar (USD), the British Pound (Pound) and the Euro. For the years ended December 31, 2006 and 2005, the relationship of the Shekel to the USD, the Pound, and the Euro was as follows:
| | | | | | |
| | | Year ended
December 31, | |
| | | 2006 | | | 2005 | |
USD% Change | | -8.2 | % | | 5.7 | % |
Pound% Change | | 4.0 | % | | -5.0 | % |
Euro% Change | | 1.6 | % | | -8.0 | % |
Provision for income taxes
We recorded a tax benefit for the year ended December 31, 2006 of approximately $0.1 million. The tax benefit primarily relates to a refund of non-U.S. taxes in the Netherlands of $0.1 million offset in part by international and U.S. federal and state tax obligations. Our effective tax rate for 2006 was approximately 3%.
For the year ended December 31, 2005, we recorded a tax benefit of approximately $1.8 million, related to U.S. state income taxes and net non-U.S. tax benefits. This tax benefit primarily relates to a refund of non-U.S. taxes of $0.9 million, a favorable settlement of a non-U.S. tax audit resulting in a release of accrued tax reserves of $0.5 million and liquidation of non-U.S. entities resulting in a release of accrued tax reserves of $0.5 million. Our effective tax rate benefit for 2005 was approximately 64%. Excluding the tax benefits, the effective tax rate for 2005 would be less than 1% due to our current U.S. consolidated tax loss position.
37
| | | | | | | | |
| | | Year Ended
December 31, | |
| | | 2006 | | | 2005 | |
U.S. federal tax | | $ | 2 | | | $ | — | |
U.S. state tax | | | 13 | | | | (7 | ) |
International tax | | | 37 | | | | 110 | |
International reserve adjustment on favorable tax audit outcome | | | — | | | | (504 | ) |
International reserve adjustment on liquidation of non-U.S. entities | | | (51 | ) | | | (494 | ) |
Income tax refunds: | | | | | | | | |
Netherlands | | | (84 | ) | | | — | |
Germany | | | — | | | | (936 | ) |
| | | | | | | | |
Total benefit for income taxes | | $ | (83 | ) | | $ | (1,831 | ) |
| | | | | | | | |
As of December 31, 2006, we had a gross deferred tax asset of approximately $72.1 million. Realization of the gross deferred tax asset is dependent on our generating sufficient future taxable income. We have fully reserved the gross deferred tax asset because we have concluded that it more likely than not that the deferred tax assets will not be realized.
Disclosures about market risk
Disclosures about market risk can be found below, under Item 7A—Quantitative and qualitative disclosures about market risk.
Liquidity and capital resources
| | | | | | | | |
| | | As of
December 31,
2007 | | | As of
December 31,
2006 | |
Cash and cash equivalents | | $ | 15,141 | | | $ | 8,306 | |
Short-term investments | | $ | 10,223 | | | $ | 19,740 | |
Long-term investments | | $ | — | | | $ | 600 | |
Working capital | | $ | 15,831 | | | $ | 17,387 | |
| |
| | | For the years ended | |
| | | December 31,
2007 | | | December 31,
2006 | |
Net cash provided (used) by operating activities | | $ | (4,266 | ) | | $ | 5,357 | |
Net cash provided (used) in investing activities | | $ | 9,800 | | | $ | (5,428 | ) |
Net cash provided by financing activities | | $ | 288 | | | $ | 497 | |
��
Our primary source of cash is receipts from net revenues. The primary uses of cash are payroll (salaries, commissions, other incentives, and benefits), general operating expenses (marketing, travel, office rent), cost of revenues and the purchase of investments, property, and equipment. Other sources of cash are proceeds from the exercise of employee stock options and from participation in the employee stock purchase program.
Net cash used by operating activities decreased by approximately $9.6 million from $5.4 million of net cash provided to approximately $4.2 million net cash used in the year ended December 31, 2007 as compared to the corresponding period in 2006. This decrease is primarily a result of a change in deferred revenue of approximately $8.5 million which is a result of $4.2 million of deferred revenue recognized for the year ended December 31, 2007, from $4.3 million of deferred revenue established for the corresponding period in 2006. In addition the Company also used approximately $1.7 million, the result of $0.4 million reduction in receivables in the year ended December 31, 2007 compared to a $1.3 million increase in receivables in the year ended December 31, 2006. The Company also used approximately $0.8 million, the result of $0.4 million reduction in
38
payables in the year ended December 31, 2007 compared to a $0.4 million increase in payables in the year ended December 31, 2006. This $11.0 million decrease is offset by a decrease of $0.6 million change in net loss from $2.5 million for the year ended December 31, 2006, to $1.3 million for the year ended December 31, 2007, and from the change in prepaid expenses and other current assets of $0.8 million.
Net cash provided in investing activities increased by $15.2 million from $5.4 million of net cash used to $9.8 million net cash provided for the year ended December 31, 2007 as compared to the corresponding period in 2006. In the year ended December 31, 2007, the Company received proceeds from sales and maturities of investments of $10.1 million, net of purchases of investments as compared to the net investment in cash and interest bearing securities of $4.8 million, net of proceeds, made during the same period in 2006. In addition to the $14.9 million increase in cash provided by net investment activities, the company also had approximately $0.4 million due to less purchases of property and equipment in the year ended December 31, 2007 which was offset by approximately $0.1 million decrease in proceeds from acquisition adjustment that occurred in the year ended December 31, 2006. We expect to continue to invest in short-term and long-term investments and to purchase additional property and equipment to support our operations.
Net cash provided by financing activities is derived primarily from proceeds from the sale of common stock through employee stock option plans and the employee stock purchase plan which was suspended in November 2006. Net cash provided by financing activities decreased by $209,000 from $497,000 to $288,000 for the year ended December 31, 2007 as compared to the same period in 2006. This decrease is primarily due to reduced proceeds of $198,000 received from shares issued in connection with employee stock plans, and a decrease of $12,000 in proceeds received from an investor for a short-term profit earned within six months of acquiring 10% of the Company’s common stock, from $12,000 for the year ended December 31, 2006 to no proceeds for the year ended December 31, 2007. These decreases were offset in part by proceeds received from exercise of stock options by none employees.
At December 31, 2007, we had working capital of $15.8 million. We believe that our current cash, cash equivalents, and investments and future operating cash flows will be sufficient to meet our working capital needs, capital expenditure requirements, currently identified projects, and planned objectives for at least the next 12 months. If our credit rating was to change materially, it could affect our ability to enter into transactions with new and existing customers and subsequently have an impact on our cash position. We do not anticipate a material change in our credit rating or rating outlook.
A table of our contractual future obligations as of December 31, 2007 is as follows (in thousands):
| | | | | | | | | | | | | | | |
| | | Amount of payments due per period |
| | | Total | | Less Than
12 Months | | 12-36
Months | | 37-60
Months | | More Than
60 Months |
Capital leases | | $ | 19 | | $ | 7 | | $ | 12 | | $ | — | | $ | — |
Operating leases | | $ | 4,816 | | $ | 2,023 | | $ | 2,186 | | $ | 607 | | $ | — |
| | | | | | | | | | | | | | | |
Total | | $ | 4,835 | | $ | 2,030 | | $ | 2,198 | | $ | 607 | | $ | — |
| | | | | | | | | | | | | | | |
Since our inception, our operations have been financed primarily through cash provided by operations and sales of capital stock. Our primary financing activities to date consist of our initial and secondary public stock offerings and private preferred stock issuances, which aggregated net proceeds to us of approximately $72.5 million. Excluding 2005, and 2004 domestic and international economic events over the past several years have negatively impacted our ability to generate sufficient cash to offset our cash outflows. We have taken a number of measures to reverse this trend including restructuring our organization, reducing our operating expenses through the closing of excess facilities, subleasing excess facility space, and carefully monitoring our discretionary expenses which have helped us manage the cash flow in 2007 to minimize future expenses. Our business has been and will continue to be dependent upon the spending of our customers and their respective IT organizations.
39
As of December 31, 2007, we did not engage in any off-balance sheet arrangements as defined in Item 303(a) (4) of Regulation S-K promulgated by the Commission under the Securities Exchange Act of 1934, as amended. We do not have external debt financing. We do not issue or purchase derivative instruments or use our stock as a form of liquidity. If our credit rating was to change materially, it could affect our ability to enter into transactions with new and existing customers and subsequently have an impact on our cash position. We do not anticipate a material change in our credit rating or rating outlook.
Our Board of Directors has authorized in 1998 the repurchase from time to time of up to 2,142,857 shares of our common stock through open market purchases. No purchases of our common stock were made in 2007, 2006, or 2005. Cumulatively, as of December 31, 2007, we had repurchased 2,076,848 shares of our common stock at an average price of $10.02 per share for a total cost of approximately $20.8 million from 1998 to 2007.
Item 7A—Quantitative and qualitative disclosures about market risk
Disclosures about market risk
Interest rate risk
Our exposure to market risk for changes in interest rates relates primarily to our investment portfolio. We place our investments with high credit quality issuers and, by policy, limit our amount of credit exposure to any one issuer. As stated in our policy, we are averse to principal loss, and seek to preserve our invested funds by limiting default risk, liquidity risk, and territory risk.
We mitigate default and liquidity risks by investing only in safe and high credit quality securities, and by positioning our portfolio to respond appropriately to a significant reduction in a credit rating of any investment issuer or guarantor. The portfolio includes only marketable securities with active secondary or resale markets to ensure portfolio liquidity. We mitigate risk by investing only in the highest quality bonds as rated by Moody’s and Standard & Poor’s and only allowing up to 5% of the portfolio to be invested in one corporate bond issuer.
The table below presents the carrying value, market value, and related weighted average interest rates for our cash and interest-bearing investment portfolio as of December 31, 2007. All investments mature, by policy, in two years or less. Currently, these investments all have contractual maturity periods of less than one year.
| | | | | | | | | |
| | | Carrying
Value | | Market
Value | | Weighted Average
Interest | |
| | | (in thousands, except for interest rates/yields) | |
Cash and Investment Securities: | | | | | | | | | |
Cash—fixed rate | | $ | 15,141 | | $ | 15,141 | | 3.15 | % |
Cash equivalents | | $ | — | | $ | — | | — | |
Corporate bonds and commercial paper | | $ | 8,179 | | $ | 8,177 | | 4.11 | % |
Taxable municipal bonds | | $ | 1,526 | | $ | 1,530 | | 4.36 | % |
Government bonds | | $ | 500 | | $ | 500 | | 4.6 | % |
Time deposits and other | | $ | 16 | | $ | 16 | | * | |
| * | Interest rate/yield is less than 1% |
Foreign currency risk
We are exposed to foreign currency exchange rate risk inherent in our sales commitments, anticipated sales, anticipated purchases and assets and liabilities in currencies other than the functional currency. We transact business in approximately six foreign currencies worldwide, of which the most significant to our operations are the Euro, the Canadian dollar, the Israeli shekel, and the British pound. For most currencies, we are the net receiver of foreign currencies and therefore benefit from a weaker U.S. dollar and are adversely affected by a stronger U.S. dollar relative to those foreign currencies in which we transact significant amounts of business. The net results of the transaction gains or losses relating to the transactions that are not transacted in the functional
40
currency appear in the line entitled foreign currency transaction gains (losses) in the Consolidated Statements of Operations. At the end of each period, the translation of the Consolidated Balance Sheets from local currency to the reporting currency appears in the Consolidated Statements of Comprehensive Income (Loss) under the foreign currency translation adjustments line.
We currently do not enter into financial instruments for hedging or speculative purposes. There were no forward foreign exchange contracts used during the three year period ended December 31, 2007. We may institute a foreign currency hedging program in the future.
The following table presents the potential impact on cash flow of changes in exchange rates as noted (in thousands):
| | | | | | | | | | | | | | | | | | | | |
| | | December 31,
2007 | | | Cash flow impact on change in exchange rates | |
| | | | -15%
Change | | | -10%
Change | | | +10%
Change | | | +15%
Change | |
Accounts receivable (1) (2) | | $ | 5,540 | | | $ | (978 | ) | | $ | (616 | ) | | $ | 504 | | | $ | 723 | |
Accounts payable (2) | | | (790 | ) | | | 139 | | | | 88 | | | | (72 | ) | | | (103 | ) |
Intercompany with U.S. (3) | | | (29,055 | ) | | | 5,127 | | | | 3,228 | | | | (2,641 | ) | | | (3,790 | ) |
| (1) | Accounts receivable does not include allowances of approximately $38,000. |
| (2) | The offset entry for this change in exchange rates would be to Accumulated other comprehensive loss in the Consolidated Balance Sheet. |
| (3) | This assumes the change in exchange rates applies only to the relationship between the U.S. dollar and the local currency as of December 31, 2007 and that there is no change in rates between the various non-U.S. dollar currencies. The offset entry for this change in exchange rates would be to Foreign currency transaction gain (loss) in the Consolidated Statements of Operations. |
41
Item 8—Financial statements and supplementary data.
INDEX TO CONSOLIDATED FINANCIAL STATEMENTS
| | |
| | | Page |
Financial Statements: | | |
Report of Independent Registered Public Accounting Firm | | 43 |
Consolidated Balance Sheets at December 31, 2007 and 2006 | | 44 |
Consolidated Statements of Operations—Years ended December 31, 2007, 2006 and 2005 | | 45 |
Consolidated Statements of Comprehensive Income (Loss)—Years ended December 31, 2007, 2006 and 2005 | | 46 |
Consolidated Statements of Stockholders’ Equity—Years ended December 31, 2007, 2006 and 2005 | | 47 |
Consolidated Statements of Cash Flows—Years ended December 31, 2007, 2006 and 2005 | | 48 |
Notes to Consolidated financial Statements—Years ended December 31, 2007, 2006 and 2005 | | 49 |
42
REPORT OF INDEPENDENT REGISTERED PUBLIC ACCOUNTING FIRM
To the Board of Directors and Stockholders of
NetManage, Inc.
Cupertino, California
We have audited the accompanying consolidated balance sheets of NetManage, Inc. and subsidiaries (the “Company”) as of December 31, 2007 and 2006, and the related consolidated statements of operations, comprehensive income (loss), stockholders’ equity, and cash flows for each of the three years in the period ended December 31, 2007. Our audits also included the consolidated financial statement schedule listed in the Index at Item 15 (a) 2. These financial statements and financial statement schedules are the responsibility of the Company’s management. Our responsibility is to express an opinion on the financial statements and financial statement schedules based on our audits.
We conducted our audits in accordance with the standards of the Public Company Accounting Oversight Board (United States). Those standards require that we plan and perform the audit to obtain reasonable assurance about whether the financial statements are free of material misstatement. The Company is not required to have, nor were we engaged to perform, an audit of its internal control over financial reporting. Our audits included consideration of internal control over financial reporting as a basis for designing audit procedures that are appropriate in the circumstances, but not for the purpose of expressing an opinion on the effectiveness of the Company’s internal control over financial reporting. Accordingly, we express no such opinion. An audit also includes examining, on a test basis, evidence supporting the amounts and disclosures in the financial statements, assessing the accounting principles used and significant estimates made by management, as well as evaluating the overall financial statement presentation. We believe that our audits provide a reasonable basis for our opinion.
In our opinion, such consolidated financial statements present fairly, in all material respects, the financial position of NetManage, Inc. and subsidiaries as of December 31, 2007 and 2006, and the results of their operations and their cash flows for each of the three years in the period ended December 31, 2007, in conformity with accounting principles generally accepted in the United States of America. Also, in our opinion, such consolidated financial statement schedule, when considered in relation to the basic consolidated financial statements taken as a whole, present fairly in all material respects the information set forth therein.
As discussed in Note 2 to the financial statements, effective January 1, 2006 the Company changed its method of accounting for stock based compensation in 2006 in accordance with Statement of Financial Accounting Standards No 123 (revised 2004)Share-Based Payment, and adopted Financial Accounting Standards Board Interpretation No. 48Accounting for Uncertainty in Income Taxes—an Interpretation of FASB Statement No. 109, effective January 1, 2007.
/s/ DELOITTE & TOUCHE LLP
San Jose, California
March 31, 2008
43
NETMANAGE, INC.
CONSOLIDATED BALANCE SHEETS
(In thousands, except share amounts)
| | | | | | | | |
| | | December 31, | |
| | | 2007 | | | 2006 | |
| ASSETS | | | | | | | | |
Current assets: | | | | | | | | |
Cash and cash equivalents | | $ | 15,141 | | | $ | 8,306 | |
Short-term investments | | | 10,223 | | | | 19,740 | |
Accounts receivable, net of allowances of $106 and $124, respectively | | | 10,530 | | | | 10,186 | |
Prepaid expenses and other current assets | | | 802 | | | | 1,369 | |
| | | | | | | | |
Total current assets | | | 36,696 | | | | 39,601 | |
| | | | | | | | |
Property and equipment, at cost: | | | | | | | | |
Computer software and equipment | | | 1,921 | | | | 1,637 | |
Furniture and fixtures | | | 3,054 | | | | 2,805 | |
Leasehold improvements and other | | | 429 | | | | 813 | |
| | | | | | | | |
| | | 5,404 | | | | 5,255 | |
Less accumulated depreciation and amortization | | | (3,990 | ) | | | (3,012 | ) |
| | | | | | | | |
Net property and equipment | | | 1,414 | | | | 2,243 | |
| | | | | | | | |
Goodwill | | | 3,648 | | | | 3,648 | |
Other intangibles, net | | | 714 | | | | 1,099 | |
Long-term investments | | | — | | | | 600 | |
Other long-term assets | | | 185 | | | | 162 | |
| | | | | | | | |
Total assets | | $ | 42,657 | | | $ | 47,353 | |
| | | | | | | | |
| LIABILITIES AND STOCKHOLDERS’ EQUITY | | | | | | | | |
Current liabilities: | | | | | | | | |
Accounts payable | | $ | 1,194 | | | $ | 1,587 | |
Accrued liabilities | | | 1,821 | | | | 2,059 | |
Accrued payroll and related expenses | | | 2,856 | | | | 2,396 | |
Deferred revenue | | | 14,968 | | | | 15,927 | |
Income taxes payable | | | 26 | | | | 245 | |
| | | | | | | | |
Total current liabilities | | | 20,865 | | | | 22,214 | |
| | | | | | | | |
Long-term liabilities: | | | | | | | | |
Deferred revenue | | | 445 | | | | 3,320 | |
Long-term income taxes payable | | | 229 | | | | — | |
Other long-term liabilities | | | 530 | | | | 642 | |
| | | | | | | | |
Total long-term liabilities | | | 1,204 | | | | 3,962 | |
| | | | | | | | |
Total liabilities | | | 22,069 | | | | 26,176 | |
| | | | | | | | |
Commitments and contingencies (Note 4) | | | | | | | | |
Stockholders’ equity: | | | | | | | | |
Preferred stock, $0.01 par value—Authorized—1,000,000 shares. No shares issued and outstanding | | | — | | | | — | |
Common stock, $0.01 par value—Authorized—36,000,000 shares. Issued—11,678,082 and 11,595,555 shares, respectively. Outstanding—9,601,234 and 9,518,707 shares, respectively | | | 117 | | | | 116 | |
Treasury stock, at cost—2,076,848 shares | | | (20,804 | ) | | | (20,804 | ) |
Additional paid-in capital | | | 183,948 | | | | 182,945 | |
Accumulated deficit | | | (139,197 | ) | | | (137,243 | ) |
Accumulated other comprehensive loss | | | (3,476 | ) | | | (3,837 | ) |
| | | | | | | | |
Total stockholders’ equity | | | 20,588 | | | | 21,177 | |
| | | | | | | | |
Total liabilities and stockholders’ equity | | $ | 42,657 | | | $ | 47,353 | |
| | | | | | | | |
The accompanying notes are an integral part of these consolidated financial statements.
44
NETMANAGE, INC.
CONSOLIDATED STATEMENTS OF OPERATIONS
(In thousands, except per share amounts)
| | | | | | | | | | | | |
| | | Years Ended December 31, | |
| | | 2007 | | | 2006 | | | 2005 | |
Net revenues: | | | | | | | | | | | | |
License fees | | $ | 11,580 | | | $ | 12,380 | | | $ | 17,205 | |
Services | | | 24,390 | | | | 23,181 | | | | 26,229 | |
| | | | | | | | | | | | |
Total net revenues | | | 35,970 | | | | 35,561 | | | | 43,434 | |
| | | | | | | | | | | | |
Cost of revenues: | | | | | | | | | | | | |
License fees | | | 1,003 | | | | 831 | | | | 1,097 | |
Services | | | 3,470 | | | | 3,431 | | | | 3,297 | |
Amortization of developed technology | | | 325 | | | | 280 | | | | 280 | |
| | | | | | | | | | | | |
Total cost of revenues | | | 4,798 | | | | 4,542 | | | | 4,674 | |
| | | | | | | | | | | | |
Gross margin | | | 31,172 | | | | 31,019 | | | | 38,760 | |
| | | | | | | | | | | | |
Operating expenses: | | | | | | | | | | | | |
Research and development | | | 6,244 | | | | 7,209 | | | | 7,200 | |
Sales and marketing | | | 19,117 | | | | 20,715 | | | | 20,350 | |
General and administrative | | | 6,446 | | | | 6,194 | | | | 8,343 | |
Litigation settlement | | | (929 | ) | | | — | | | | — | |
Restructuring charges (reversals) | | | 2,330 | | | | 181 | | | | (59 | ) |
Amortization of other intangible assets | | | 60 | | | | 360 | | | | 493 | |
| | | | | | | | | | | | |
Total operating expenses | | | 33,268 | | | | 34,659 | | | | 36,327 | |
| | | | | | | | | | | | |
Income (loss) from operations | | | (2,096 | ) | | | (3,640 | ) | | | 2,433 | |
Interest income and other, net | | | 1,195 | | | | 1,160 | | | | 731 | |
Foreign currency transaction loss | | | (847 | ) | | | (139 | ) | | | (283 | ) |
| | | | | | | | | | | | |
Income (loss) before income tax provision (benefit) | | | (1,748 | ) | | | (2,619 | ) | | | 2,881 | |
Income tax provision (benefit) | | | 206 | | | | (83 | ) | | | (1,830 | ) |
| | | | | | | | | | | | |
Net income (loss) | | $ | (1,954 | ) | | $ | (2,536 | ) | | $ | 4,711 | |
| | | | | | | | | | | | |
Net income (loss) per share: | | | | | | | | | | | | |
Basic | | $ | (0.20 | ) | | $ | (0.27 | ) | | $ | 0.51 | |
Diluted | | $ | (0.20 | ) | | $ | (0.27 | ) | | $ | 0.49 | |
Weighted average common shares and equivalents: | | | | | | | | | | | | |
Basic | | | 9,567 | | | | 9,439 | | | | 9,312 | |
Diluted | | | 9,567 | | | | 9,439 | | | | 9,650 | |
The accompanying notes are an integral part of these consolidated financial statements.
45
NETMANAGE, INC.
CONSOLIDATED STATEMENTS OF COMPREHENSIVE INCOME (LOSS)
(In thousands)
| | | | | | | | | | | | |
| | | Years Ended December 31, | |
| | | 2007 | | | 2006 | | | 2005 | |
Net income (loss) | | $ | (1,954 | ) | | $ | (2,536 | ) | | $ | 4,711 | |
Other comprehensive income (loss): | | | | | | | | | | | | |
Unrealized gain (loss) on investments, net | | | 2 | | | | — | | | | (47 | ) |
Foreign currency translation adjustments | | | 359 | | | | (181 | ) | | | 276 | |
| | | | | | | | | | | | |
Comprehensive income (loss) | | $ | (1,593 | ) | | $ | (2,717 | ) | | $ | 4,940 | |
| | | | | | | | | | | | |
The accompanying notes are an integral part of these consolidated financial statements.
46
NETMANAGE, INC.
CONSOLIDATED STATEMENTS OF STOCKHOLDERS’ EQUITY
(In thousands, except share amounts)
| | | | | | | | | | | | | | | | | | | | | | | | | |
| | | Common Stock | | Treasury
Stock | | | Additional
Paid-in
Capital | | | Accumulated
Deficit | | | Accumulated
Other
Comprehensive
Loss | | | Total | |
| | | Shares | | Amount | | | | | |
Balance, December 31, 2004 | | 9,198,525 | | $ | 113 | | $ | (20,804 | ) | | $ | 180,968 | | | $ | (139,418 | ) | | $ | (3,885 | ) | | | 16,974 | |
Sale of common stock under employee stock purchase plan | | 86,067 | | | 1 | | | — | | | | 370 | | | | — | | | | — | | | | 371 | |
Exercise of common stock options | | 104,760 | | | 1 | | | — | | | | 459 | | | | — | | | | — | | | | 460 | |
Share-based compensation | | — | | | — | | | — | | | | 24 | | | | — | | | | — | | | | 24 | |
Stock issuance costs | | — | | | — | | | — | | | | (66 | ) | | | — | | | | — | | | | (66 | ) |
Unrealized loss on investments | | — | | | — | | | — | | | | — | | | | — | | | | (47 | ) | | | (47 | ) |
Foreign currency translation adjustment | | — | | | — | | | — | | | | — | | | | — | | | | 276 | | | | 276 | |
Net income | | — | | | — | | | — | | | | — | | | | 4,711 | | | | — | | | | 4,711 | |
| | | | | | | | | | | | | | | | | | | | | | | | | |
Balance, December 31, 2005 | | 9,389,352 | | $ | 115 | | $ | (20,804 | ) | | $ | 181,755 | | | $ | (134,707 | ) | | $ | (3,656 | ) | | $ | 22,703 | |
Sale of common stock under employee stock purchase plan | | 6,783 | | | — | | | — | | | | 35 | | | | — | | | | — | | | | 35 | |
Exercise of common stock options | | 122,572 | | | 1 | | | — | | | | 449 | | | | — | | | | — | | | | 450 | |
Share-based compensation | | — | | | — | | | — | | | | 694 | | | | — | | | | — | | | | 694 | |
Investor short swing profit | | — | | | — | | | — | | | | 12 | | | | — | | | | — | | | | 12 | |
Foreign currency translation adjustment | | — | | | — | | | — | | | | — | | | | — | | | | (181 | ) | | | (181 | ) |
Net loss | | — | | | — | | | — | | | | — | | | | (2,536 | ) | | | — | | | | (2,536 | ) |
| | | | | | | | | | | | | | | | | | | | | | | | | |
Balance, December 31, 2006 | | 9,518,707 | | $ | 116 | | $ | (20,804 | ) | | $ | 182,945 | | | $ | (137,243 | ) | | $ | (3,837 | ) | | $ | 21,177 | |
Exercise of common stock options | | 82,527 | | | 1 | | | — | | | | 287 | | | | — | | | | — | | | | 288 | |
Share-based compensation | | — | | | — | | | — | | | | 716 | | | | — | | | | — | | | | 716 | |
Unrealized gain on investments, net | | — | | | — | | | — | | | | — | | | | — | | | | 2 | | | | 2 | |
Foreign currency translation adjustment | | — | | | — | | | — | | | | — | | | | — | | | | 359 | | | | 359 | |
Net loss | | — | | | — | | | — | | | | — | | | | (1,954 | ) | | | — | | | | (1,954 | ) |
| | | | | | | | | | | | | | | | | | | | | | | | | |
Balance, December 31, 2007 | | 9,601,234 | | $ | 117 | | $ | (20,804 | ) | | $ | 183,948 | | | $ | (139,197 | ) | | $ | (3,476 | ) | | $ | 20,588 | |
| | | | | | | | | | | | | | | | | | | | | | | | | |
The accompanying notes are an integral part of these consolidated financial statements.
47
NETMANAGE, INC.
CONSOLIDATED STATEMENTS OF CASH FLOWS
(In thousands)
| | | | | | | | | | | | |
| | | Years Ended December 31, | |
| | | 2007 | | | 2006 | | | 2005 | |
Cash flows from operating activities: | | | | | | | | | | | | |
Net income (loss) | | $ | (1,954 | ) | | $ | (2,536 | ) | | $ | 4,711 | |
Adjustments to reconcile net income (loss) to net cash (used in) provided by operating activities: | | | | | | | | | | | | |
Depreciation and amortization | | | 1,300 | | | | 1,715 | | | | 1,889 | |
Provision for doubtful accounts and returns | | | 55 | | | | (122 | ) | | | (240 | ) |
Share-based compensation expense | | | 716 | | | | 694 | | | | 24 | |
Loss (gain) on disposal of property, plant & equipment | | | 209 | | | | 27 | | | | 1 | |
Gain on investments | | | — | | | | — | | | | (35 | ) |
Non-cash impairment charges | | | — | | | | — | | | | 43 | |
Change in operating assets and liabilities: | | | | | | | | | | | | |
Accounts receivable | | | (371 | ) | | | 1,367 | | | | 4,327 | |
Prepaid expenses and other current assets | | | 598 | | | | (149 | ) | | | 1,247 | |
Other assets | | | 8 | | | | 37 | | | | 206 | |
Accounts payable | | | (380 | ) | | | 404 | | | | (1,533 | ) |
Accrued liabilities, payroll and payroll-related expenses | | | (106 | ) | | | 12 | | | | (1,962 | ) |
Deferred revenue and other long-term liabilities | | | (4,202 | ) | | | 4,300 | | | | (4,329 | ) |
Income taxes payable | | | 8 | | | | (194 | ) | | | (987 | ) |
Long term liabilities | | | (147 | ) | | | (198 | ) | | | 38 | |
| | | | | | | | | | | | |
Net cash (used in) provided by operating activities | | | (4,266 | ) | | | 5,357 | | | | 3,400 | |
| | | | | | | | | | | | |
Cash flows from investing activities: | | | | | | | | | | | | |
Purchases of investments | | | (60,079 | ) | | | (33,979 | ) | | | (42,870 | ) |
Proceeds from sales and maturities of investments | | | 70,177 | | | | 29,166 | | | | 27,456 | |
Purchases of property and equipment | | | (298 | ) | | | (664 | ) | | | (782 | ) |
Other | | | — | | | | 49 | | | | (66 | ) |
| | | | | | | | | | | | |
Net cash (used in) provided by investing activities | | | 9,800 | | | | (5,428 | ) | | | (16,262 | ) |
| | | | | | | | | | | | |
Cash flows from financing activities: | | | | | | | | | | | | |
Proceeds from sale of common stock | | | 288 | | | | 485 | | | | 831 | |
Investor short swing profit returned to Company | | | — | | | | 12 | | | | — | |
| | | | | | | | | | | | |
Net cash provided by financing activities | | | 288 | | | | 497 | | | | 831 | |
| | | | | | | | | | | | |
Effect of exchange rate changes on cash | | | 1,013 | | | | 350 | | | | (9 | ) |
| | | | | | | | | | | | |
Net increase (decrease) in cash and cash equivalents | | | 6,835 | | | | 776 | | | | (12,040 | ) |
Cash and cash equivalents, beginning of year | | | 8,306 | | | | 7,530 | | | | 19,570 | |
| | | | | | | | | | | | |
Cash and cash equivalents, end of year | | $ | 15,141 | | | $ | 8,306 | | | $ | 7,530 | |
| | | | | | | | | | | | |
Non-cash investing and financing activities: | | | | | | | | | | | | |
Unrealized gain (loss) on investments, net | | $ | 2 | | | $ | — | | | $ | (47 | ) |
Cash paid during the year for: | | | | | | | | | | | | |
Income taxes | | $ | 146 | | | $ | 222 | | | $ | 51 | |
Interest | | $ | 16 | | | $ | 7 | | | $ | 5 | |
The accompanying notes are an integral part of these consolidated financial statements.
48
NETMANAGE, INC.
NOTES TO CONSOLIDATED FINANCIAL STATEMENTS
1. Nature of operations and organization:
NetManage, Inc. (the “Company”/”NetManage”), software and solutions are a fast way to deliver new solutions from legacy applications. NetManage develops and markets software and service solutions that are designed to allow its customers to access, Web enable, integrate and leverage the investment they have in their corporate business applications, processes, and data. These software solutions are marketed and sold to mid-sized and enterprise level organizations with data residing on IBM mainframe, mid-range such as the AS/400 or iSeries, in packaged applications such as SAP, Siebel, Oracle and PeopleSoft, and on UNIX based host systems.
NetManage provides support, maintenance, and technical consultancy services to its customers in association with the products it develops and markets. As part of this consulting service, NetManage provides application and industry specific consultation to its customers. This assures that the customers will get the right solution for their specific industry. NetManage’s products are marketed and licensed under the OnWeb, Rumba, ViewNow and Librados brand names.
2. Summary of significant accounting policies:
Principles of consolidation
The consolidated financial statements include the accounts of NetManage and its wholly owned subsidiaries. All inter-company accounts and transactions have been eliminated.
Use of estimates
The preparation of consolidated financial statements in conformity with accounting principles generally accepted in the United States of America requires management to make estimates and assumptions that affect the reported amounts of assets and liabilities, disclosures of contingent assets and liabilities at the date of the consolidated financial statements, and the reported amounts of revenues and expenses during the reporting period. Actual results could differ from those estimates.
Foreign currency translation, foreign exchange contracts, and comprehensive income
The functional currency of NetManage’s foreign subsidiaries is the local currency of each subsidiary. Gains and losses resulting from the translation of the foreign subsidiaries’ financial statements are included in accumulated other comprehensive loss and reported as a separate component of stockholders’ equity. Gains and losses resulting from foreign currency transactions are included in net income (loss).
NetManage currently does not enter into financial instruments for either trading or speculative purposes. There were no forward foreign exchange contracts used during the three year period ended December 31, 2007.
Total comprehensive income (loss) is comprised of net income (loss) and other comprehensive earnings such as foreign currency translation gains or losses and unrealized gains or losses on marketable securities.
Cash and cash equivalents
Cash equivalents consist of amounts invested in money market funds.
Investments
The Company accounts for its investments under the provisions of the Financial Accounting Standards Board’s (FASB) Statement of Financial Accounting Standards (SFAS) No. 115, Accounting for Certain Investments in Debt and Equity Securities. Under SFAS No. 115, the Company’s investments are classified as
49
NETMANAGE, INC.
NOTES TO CONSOLIDATED FINANCIAL STATEMENTS—(Continued)
either available-for-sale or held-to-maturity securities. All available-for-sale securities are reported at fair value, with unrealized gains and losses, net of tax, reported in the consolidated balance sheet as “Accumulated other comprehensive loss.” Held-to-maturity investments are valued using the amortized cost method.
During the fourth quarter of 2007 the Company changed the classification of its investments from held-to-maturity to available-for-sale, and amortized gain of approximately $2,000 was reported in other comprehensive income. As of December 31, 2007 the Company’s investments are considered available-for-sale and primarily consist of high grade debt securities. These securities are carried at fair market value based on market quotes. Unrealized gains and losses, net of tax, are reported as a separate component of stockholders’ equity and included in “Accumulated other comprehensive loss”.
The following table summarizes NetManage’s available-for-sale securities recorded as cash, cash equivalents and short-term investments as of December 31, 2007 (in thousands):
| | | | | | | | | | | | |
| | | Amortized
Cost | | | Gross Unrealized
Gains (losses) | | | Fair
Value | |
Cash and cash equivalents | | $ | 15,141 | | | $ | — | | | $ | 15,141 | |
Corporate bonds and commercial paper | | | 8,179 | | | | (2 | ) | | | 8,177 | |
Taxable municipal bonds | | | 1,526 | | | | 4 | | | | 1,530 | |
Government bonds | | | 500 | | | | — | | | | 500 | |
Time deposits | | | 16 | | | | — | | | | 16 | |
Less amounts classified as Cash and cash equivalents | | | (15,141 | ) | | | — | | | | (15,141 | ) |
| | | | | | | | | | | | |
Total short-term investments | | $ | 10,221 | | | $ | 2 | | | $ | 10,223 | |
| | | | | | | | | | | | |
All short-term investments have contractual maturity periods of less than one year.
The following table summarizes NetManage’s held-to-maturity securities recorded as cash, cash equivalents, short-term and long-term investments as of December 31, 2006 (in thousands):
| | | | | | | | | | | | | | | |
| | | Amortized
Cost | | | Unrealized
Gains | | Unrealized
Losses | | | Fair
Value | |
Cash and cash equivalents: | | | | | | | | | | | | | | | |
Cash | | $ | 7,840 | | | $ | — | | $ | — | | | $ | 7,840 | |
Cash equivalents | | | 466 | | | | — | | | — | | | | 466 | |
| | | | | | | | | | | | | | | |
Total cash and cash equivalents | | $ | 8,306 | | | $ | — | | $ | — | | | $ | 8,306 | |
| | | | | | | | | | | | | | | |
Held-to-maturity investments: | | | | | | | | | | | | | | | |
Corporate bonds | | $ | 17,555 | | | $ | 2 | | $ | (6 | ) | | $ | 17,551 | |
Taxable municipal bonds | | | 2,073 | | | | — | | | (3 | ) | | | 2,070 | |
Government bonds | | | 200 | | | | — | | | — | | | | 200 | |
Commercial paper | | | 495 | | | | — | | | — | | | | 495 | |
Time deposits | | | 17 | | | | — | | | — | | | | 17 | |
Restricted cash deposits | | | 90 | | | | — | | | — | | | | 90 | |
| | | | | | | | | | | | | | | |
Total investments | | $ | 20,430 | | | $ | 2 | | $ | (9 | ) | | $ | 20,423 | |
Less amounts classified as other non-current assets | | | (90 | ) | | | — | | | — | | | | (90 | ) |
Less amounts classified as long-term investments | | | (600 | ) | | | — | | | — | | | | (600 | ) |
| | | | | | | | | | | | | | | |
Total short-term investments | | $ | 19,740 | | | $ | 2 | | $ | (9 | ) | | $ | 19,733 | |
| | | | | | | | | | | | | | | |
50
NETMANAGE, INC.
NOTES TO CONSOLIDATED FINANCIAL STATEMENTS—(Continued)
Property and equipment
Property and equipment are recorded at cost. Improvements, renewals, and extraordinary repairs that extend the lives of the asset are capitalized; other repairs and maintenance are expensed as incurred. Depreciation and amortization is computed using the straight-line method over the following estimated useful lives:
| | |
Classification | | Life |
Computer software and equipment | | 2 to 3 years |
Furniture and fixtures | | 5 years |
Leasehold improvements | | Shorter of the lease term or the estimated useful life |
Depreciation and amortization expense for 2007, 2006, and 2005 was $0.9 million, $1.1 million, and $1.2 million, respectively.
Net property and equipment in North America and the rest of the world is as follows (in thousands):
| | | | | | |
| | | Years Ended
December 31, |
| | | 2007 | | 2006 |
North America | | $ | 1,045 | | $ | 1,794 |
Rest of world | | | 369 | | | 449 |
| | | | | | |
Total | | $ | 1,414 | | $ | 2,243 |
| | | | | | |
Goodwill and other intangible assets, net
NetManage reviews for impairment of long-lived assets and certain identifiable intangibles whenever events or changes in circumstances indicate that the carrying amount of an asset may not be recoverable. NetManage evaluates possible impairment of long-lived assets using estimates of undiscounted future cash flows. Impairment loss to be recognized is measured as the amount by which the carrying amount of the asset exceeds the fair value of the asset. Management evaluates the fair value of long-lived assets and intangibles using primarily the estimated discounted future cash flows method.
Goodwill and other assets with indefinite lives are not amortized but are reviewed for impairment under SFAS No. 142, Goodwill and Other Intangible Assets. NetManage performs an annual impairment review during the fourth quarter of each year or whenever events or changes in circumstances indicate that the carrying amount of an asset may not be recoverable. Under SFAS No. 142, goodwill impairment may exist if the net book value of a reporting unit exceeds its estimated fair value.
The following table provides a summary of the carrying amounts of other intangible assets that will continue to be amortized (in thousands):
| | | | | | | | |
| | | December 31,
2007 | | | December 31,
2006 | |
Carrying amount of: | | | | | | | | |
Developed technology | | $ | 1,535 | | | $ | 1,535 | |
Trade names | | | 300 | | | | 300 | |
| | | | | | | | |
Gross carrying amount of other intangibles | | | 1,835 | | | | 1,835 | |
Less accumulated amortization: | | | | | | | | |
Developed technology | | | (931 | ) | | | (606 | ) |
Trade names | | | (190 | ) | | | (130 | ) |
| | | | | | | | |
Net carrying amount of other intangibles | | $ | 714 | | | $ | 1,099 | |
| | | | | | | | |
51
NETMANAGE, INC.
NOTES TO CONSOLIDATED FINANCIAL STATEMENTS—(Continued)
The carrying amount and accumulated amortization as of December 31, 2007 and December 31, 2006 have been adjusted to exclude intangibles that were fully amortized as of December 31, 2007 and December 31, 2006, respectively.
The remaining net carrying amount of other intangibles is expected to be amortized as follows (in thousands):
| | | |
Year | | Amortization
Expense |
2008 | | $ | 385 |
2009 | | | 329 |
| | | |
| | $ | 714 |
| | | |
Aggregate amortization expense for the years ended December 31, 2007, 2006 and 2005 was $0.4 million, $0.6 million, and $0.7 million, respectively.
Accrued liabilities
Accrued liabilities at December 31, 2007 and 2006 consisted of the following (in thousands):
| | | | | | |
Description | | December 31,
2007 | | December 31,
2006 |
Current restructuring (see Note 3) | | $ | 593 | | $ | 60 |
Other accruals | | | 1,228 | | | 1,999 |
| | | | | | |
Total | | $ | 1,821 | | $ | 2,059 |
| | | | | | |
Other accruals include legal and accounting fees, sales & use tax and VAT obligations, customer deposits and other obligations and accrued expenses.
Long-term liabilities
Long-term liabilities at December 31, 2007 and 2006 consisted of the following (in thousands):
| | | | | | |
Description | | December 31,
2007 | | December 31,
2006 |
Long-term restructuring (see Note 3) | | $ | 310 | | $ | 297 |
Long-term other | | | 220 | | | 345 |
Long-term income taxes payable | | | 229 | | | — |
Long-term deferred revenue | | | 445 | | | 3,320 |
| | | | | | |
Total long-term liabilities | | $ | 1,204 | | $ | 3,962 |
| | | | | | |
Software development costs
Software development costs are accounted for in accordance with SFAS No. 86, Accounting for Computer Software to be Sold, Leased or Otherwise Marketed, under which capitalization of software development costs begins upon the establishment of technological feasibility of the product, which management defines as the development of a working model and further defines as the development of a beta version of the software. The establishment of technological feasibility and the ongoing assessment of the recoverability of these costs require considerable judgment by management with respect to certain external factors, including but not limited to,
52
NETMANAGE, INC.
NOTES TO CONSOLIDATED FINANCIAL STATEMENTS—(Continued)
anticipated future gross product revenue, estimated economic life, and changes in technology. Such costs are reported at the lower of cost or net realizable value. Amortization of purchased software is generally computed on a straight-line basis over one to five years or, if less, the estimated remaining economic life of the underlying products. To date, software development costs that were eligible for capitalization have not been significant. Accordingly, all other software development costs have been expensed as incurred.
Concentrations of credit risk
Financial instruments, which potentially subject NetManage to concentrations of credit risk, consist principally of cash and cash equivalents, investments and trade receivables. NetManage has a cash investment policy that limits the amount of credit exposure to any one issuer and restricts placement of these investments to issuers evaluated as less than creditworthy. Concentrations of credit risk with respect to trade receivables are limited due to the large number of customers comprising NetManage’s customer base and their dispersion across many different industries and geographies. No single customer accounts for more than 10% of accounts receivable as of December 31, 2007 and 2006. There were no customers that accounted for more than 10% of consolidated revenues in 2007, 2006 or 2005.
Net income (loss) per share
Basic net income (loss) per share data has been computed using the weighted-average number of shares of common stock outstanding during the indicated periods. Diluted net income (loss) per share data has been computed using the weighted-average number of shares of common stock and potential dilutive common shares. Potential dilutive common shares include dilutive shares that may be issued upon the exercise of outstanding common stock options computed using the treasury stock method.
As of December 31, 2007, 2006, and 2005 potentially dilutive securities, consisting of stock options, are as shown in the following table. In those periods in which a net loss was recorded, the potentially dilutive securities were not included in the computation of diluted net loss per share because to do so would have been anti-dilutive.
| | | | | | |
| | | December 31,
2007 | | December 31,
2006 | | December 31,
2005 |
Potentially dilutive shares for in the money options computed using treasury stock method (in thousands) | | 234 | | 304 | | — |
| | | | | | |
| | | | | | |
| | | December 31,
2007 | | December 31,
2006 | | December 31,
2005 |
Potentially dilutive shares for options who’s exercise price is higher Than the market price of number of options outstanding (in thousands) | | 225 | | 564 | | 422 |
| | | | | | |
53
NETMANAGE, INC.
NOTES TO CONSOLIDATED FINANCIAL STATEMENTS—(Continued)
The following table sets forth the computation of basic and diluted net income (loss) per share for the years ended December 31, 2007, 2006 and 2005 (in thousands, except per share amounts):
| | | | | | | | | | | |
| | | December 31,
2007 | | | December 31,
2006 | | | December 31,
2005 |
Net income (loss) | | $ | (1,954 | ) | | $ | (2,536 | ) | | $ | 4,711 |
| | | | | | | | | | | |
Shares used to compute basic net income (loss) per share | | | 9,567 | | | | 9,439 | | | | 9,312 |
Potentially dilutive shares used to compute net income per share on a diluted basis | | | — | | | | — | | | | 338 |
| | | | | | | | | | | |
Shares used to compute diluted net income (loss) per share | | | 9,567 | | | | 9,439 | | | | 9,650 |
| | | | | | | | | | | |
Net income (loss) per share: | | | | | | | | | | | |
Basic | | $ | (0.20 | ) | | $ | (0.27 | ) | | $ | 0.51 |
Diluted | | $ | (0.20 | ) | | $ | (0.27 | ) | | $ | 0.49 |
Revenue recognition
NetManage derives revenue primarily from two sources: (1) license fees, which includes software license and royalty revenue, and (2) support and services revenue, which includes software license maintenance and, to a lesser extent, consulting services. NetManage licenses its software products on a term basis and on a perpetual basis. Its term-based arrangements are primarily for a period of 12 months. NetManage also licenses its software in both source code and object code format. NetManage applies the provisions of the American Institute of Certified Public Accountants (AICPA) Statement of Position (SOP) 97-2,Software Revenue Recognition, and related amendments and interpretations to all transactions involving the licensing of software products.
NetManage recognizes revenue from the sale of software licenses to end users and resellers when the following criteria are met: persuasive evidence of an arrangement exists, the product has been delivered, the fee is fixed or determinable, and collection of the resulting receivable is reasonably assured. Delivery occurs when the product is delivered to a common carrier or when a software key has been transmitted to our customer.
Product is sold, without the right of return, except for distributor inventory rotation of old or excess product. Certain of its sales are made to domestic distributors under agreements allowing rights of return and price protection on unsold merchandise. Accordingly, the Company defers recognition of such sales until the distributor sells the merchandise to the end customer. NetManage recognizes sales to international resellers upon shipment, provided all other revenue recognition criteria have been met. NetManage gives rebates to customers on a limited basis. These rebates are presented in its Consolidated Statements of Operations as a reduction of revenue.
At the inception of the transaction, the Company assesses whether the fee associated with a revenue transaction is fixed or determinable and whether or not collection is reasonably assured. NetManage assesses whether the fee is fixed or determinable based on the payment terms associated with the transaction. If a significant portion of a fee is due after our normal payment terms, the Company accounts for the fee as not being fixed or determinable. In these cases, it recognizes revenue as the fees become due.
NetManage assesses whether or not collection is reasonably assured based on a number of factors, including past transaction history with the customer and the credit-worthiness of the customer. The Company does not request collateral from our customers. If it determines that collection of a fee is not reasonably assured, the Company recognizes revenue at the time collection becomes reasonably assured, which is generally upon receipt of cash.
54
NETMANAGE, INC.
NOTES TO CONSOLIDATED FINANCIAL STATEMENTS—(Continued)
For all sales, except those completed over the Internet, NetManage uses either a binding purchase order or equivalent customer commitment or signed license agreement as evidence of an arrangement. For sales over the Internet, it uses a credit card authorization as evidence of an arrangement. Sales through the Company’s distributors are evidenced by a master agreement governing the relationship together with binding purchase orders on a transaction-by-transaction basis.
For arrangements with multiple elements (for example, undelivered maintenance and support), the Company allocates revenue to each element of the arrangement using the residual value method based on vendor-specific objective evidence (VSOE) of the fair value of the undelivered elements. This means that it defers revenue from the arrangement fee equivalent to the fair value of the undelivered elements. Fair values for the ongoing maintenance and support obligations are generally based upon separate sales of renewals to other customers or upon renewal rates quoted in the sales contracts. Fair value of services, such as training or consulting, is based upon separate sales by NetManage of these services to other customers. If an arrangement includes an acceptance provision, acceptance occurs upon the earlier of receipt of a written customer acceptance or expiration of the acceptance period.
The Company derives its service revenues from providing its customers with software updates for existing software products, user documentation, and technical support under annual service agreements. These revenues are recognized ratably over the terms of such agreements. If such services are included in the initial licensing fee, the value of the services determined based on VSOE of fair value is unbundled and recognized ratably over the related service period. Service revenues derived from consulting and training are deferred and recognized when the services are performed. To date, consulting revenue has not been significant.
Deferred revenue
Deferred revenue is primarily comprised of advance billing for service, support and maintenance agreements and revenue deferred for other services yet to be completed as well as license revenue for which collectability is not insured or customer acceptance is required. Deferred revenue is not recognized as revenue until the completion of those performance and acceptance criteria.
Advertising and sales promotion costs
Advertising and sales promotion costs are expensed as incurred. Advertising costs consist primarily of magazine advertisements, agency fees and other direct production costs. Advertising and sales promotion costs totaled $0.4 million, $0.4 million, and $0.5 million for the years ended December 31, 2007, 2006 and 2005, respectively.
Income taxes
NetManage accounts for income taxes under the liability method. Under the liability method, deferred tax assets and liabilities are determined based on differences between financial reporting and tax bases of assets and liabilities and are measured using the enacted tax rates and laws that will be in effect when the differences are expected to reverse. NetManage is required to adjust its deferred tax liabilities in the period when tax rates or the provisions of the income tax laws change. Valuation allowances are established when necessary to reduce deferred tax assets to amounts that more likely than not are expected to be realized.
NetManage adopted FASB Interpretation No. 48, “Accounting for Uncertainty in Income Taxes—an interpretation of FASB Statement No. 109” (FIN 48), and related guidance in fiscal year 2007. See Note 7: Income Taxes for further discussion.
55
NETMANAGE, INC.
NOTES TO CONSOLIDATED FINANCIAL STATEMENTS—(Continued)
Share-based compensation
Prior to January 1, 2006, the Company accounted for share-based compensation by applying the intrinsic value based method of accounting prescribed by Accounting Principles Board (APB) Opinion No. 25, Accounting for Stock Issued to Employees (APB 25) and provided pro-forma disclosure amounts in accordance with SFAS No. 148, Accounting for Stock-Based Compensation-Transition and Disclosure (SFAS 148), as if the fair value method defined by SFAS 123,Accounting for Stock-Based Compensation (SFAS 123) had been applied to its share-based compensation. Accordingly, no compensation expense was recorded for stock options granted with exercise prices greater than or equal to the fair value of the underlying common stock at the option grant date. The Company’s Employee Stock Purchase Plan, (ESPP) qualified as a non-compensatory plan under APB 25, therefore, no compensation cost was recorded in relation to the discount offered to employees for purchases made under the ESPP.
Effective January 1, 2006, NetManage adopted the fair value recognition provisions of Statement of Financial Accounting Standards (SFAS) No. 123 (revised 2004),Share-Based Payments(SFAS 123(R)), using the modified prospective transition method and therefore has not restated prior periods’ results. Under this transition method, share-based compensation expense for the years ended December 31, 2007 and 2006 include compensation expense for all share-based compensation awards granted prior to, but not yet vested as of, January 1, 2006, based on the grant-date fair value estimated in accordance with the provisions of SFAS 123, as adjusted for estimated forfeitures. Share-based compensation expense for all share-based payment awards granted after January 1, 2006 are based on the grant-date fair value estimated in accordance with the provisions of SFAS 123(R). Under SFAS 123(R), the Company recognizes share-based compensation costs net of a forfeiture rate on a straight-line basis over the requisite service period of the award, which is generally the option vesting term of four years. The Company estimated the forfeiture rate for the year ended December 31, 2007 based on its historical experience and anticipated future employee turnover.
As a result of adopting SFAS 123(R) on January 1, 2006, the impact to the Consolidated Financial Statements for the year ended December 31, 2007 was $716,000 in share-based compensation expense that would not have been recorded had we continued to account for share-based compensation under APB 25. Basic net loss per share increased by $(0.07) per share for the years ended December 31, 2007 and 2006 as a result of the adoption of SFAS 123(R).
On November 10, 2005, the FASB issued FASB Staff Position No. FAS 123(R)-3, Transition Election Related to Accounting for Tax Effects on Share-Based Payment Awards (FSP 123(R)-3). We have elected to adopt the alternative transition method provided in the FSP 123(R)-3 for calculating the tax effects of share-based compensation pursuant to SFAS 123(R). The alternative transition method provides a simplified method to establish the beginning balance of the additional paid-in capital pool (APIC Pool) related to the tax effects of employee share-based compensation and to determine the subsequent impact on the APIC Pool and consolidated statements of cash flows of the tax effects of employee share-based compensation awards that are outstanding upon adoption of SFAS 123(R). See Share-based compensation expense for additional information.
Determining fair value
Valuation and amortization method: The Company estimates the fair value of stock options granted using the Black-Scholes option-pricing formula and a single option award approach. This fair value is then amortized on a straight-line basis over the requisite service periods of the awards, which is generally the vesting period.
Expected Term: The expected term represents the period that share-based awards are expected to be outstanding and is determined based on historical experience of similar awards, giving consideration to the contractual terms of the share-based awards, vesting schedules and expectations of future employee behavior as
56
NETMANAGE, INC.
NOTES TO CONSOLIDATED FINANCIAL STATEMENTS—(Continued)
influenced by changes to the terms of the Company’s share-based awards. For the year ended December 31, 2007, the Company has elected to use the simplified method of determining the expected term as permitted by SEC Staff Accounting Bulletin 107.
Expected Volatility: The computation of expected volatility for the year ended December 31, 2007 is based on historical volatility.
Risk-Free Interest Rate: The risk-free interest rate used in the Black-Scholes valuation method is based on the implied yield currently available on U.S. Treasury zero-coupon issues with an equivalent term to the Expected Term.
Expected Dividend: The expected dividend assumption is based on the Company’s current expectations about its anticipated dividend policy.
Forfeiture Rate: The forfeiture rate for the year ended December 31, 2007 is based on historical forfeiture rates adjusted for anticipated changes in employee turnover over the next year.
The fair value of the Company’s stock options granted to employees for the years ended December 31, 2007, 2006, and 2005, respectively, was estimated using the following weighted-average assumptions:
| | | | | | |
| | | 2007 | | 2006 | | 2005 |
Expected Term | | 5.41 - 5.96 years | | 5.96 years | | 3 - 4 months
beyond vest date |
Volatility | | 47.74 – 56.15% | | 52.26 – 59.48% | | 35.9% |
Risk-free interest rate | | 3.53 – 4.94% | | 4.36 – 5.21% | | 4.01% |
Dividend yield | | 0.00% | | 0.00% | | 0.00% |
Weighted average fair value (per share) | | $2.27 | | $3.17 | | $2.29 |
Share-based compensation expense
Cost of revenues and operating expenses for the years ended December 31, 2007 and 2006 includes share based compensation related to the adoption of SFAS No. 123(R), Share-Based Payment (SFAS 123(R)). Periods prior to January 1, 2006, have not been restated to conform to the provisions of SFAS 123(R).
57
NETMANAGE, INC.
NOTES TO CONSOLIDATED FINANCIAL STATEMENTS—(Continued)
The following table shows total share-based compensation expense included in the Consolidated Statement of Operations for the years ended December 31, 2007 and 2006 (in thousands):
| | | | | | | | |
| | | Year ended
December 31, 2007 | | | Year ended
December 31, 2006 | |
Cost of revenues: | | | | | | | | |
License fees | | $ | 13 | | | $ | 8 | |
Services | | | 53 | | | | 49 | |
| | | | | | | | |
Additional expense recorded as cost of revenues | | | 66 | | | | 57 | |
| | | | | | | | |
Operating expenses: | | | | | | | | |
Research and development | | | 218 | | | | 193 | |
Sales and marketing | | | 309 | | | | 327 | |
General and administrative | | | 123 | | | | 117 | |
| | | | | | | | |
Additional expense recorded as operating expenses: | | | 650 | | | | 637 | |
| | | | | | | | |
Additional expense recorded in loss from operations: | | $ | 716 | | | $ | 694 | |
| | | | | | | | |
Weighted-average common shares: | | | | | | | | |
Basic | | | 9,567 | | | | 9,439 | |
Diluted | | | 9,567 | | | | 9,439 | |
Impact of SFAS 123(R) on loss per share: | | | | | | | | |
Basic loss per share | | $ | (0.07 | ) | | $ | (0.07 | ) |
Diluted loss per share | | $ | (0.07 | ) | | $ | (0.07 | ) |
As required by SFAS 123(R), management made an estimate of expected forfeitures and is recognizing compensation costs only for those equity awards expected to vest.
At December 31, 2007, the total compensation cost related to unvested share-based awards granted to employees and directors under the Company’s stock option plans but not yet recognized was approximately $1.1 million, net of estimated forfeitures of $0.9 million. This cost will be amortized on a straight-line basis over a weighted-average period of approximately 2.5 years and will be adjusted for subsequent changes in estimated forfeitures.
Stock options and awards activity
The following is a summary of option activity for our stock option plans for the year ended December 31, 2007 (in thousands, except per share amounts):
| | | | | | | | | | | |
| | | Number of
Shares | | | Weighted
Average
Exercise Price | | Weighted
Average
Remaining
Contractual
Term in Years | | Aggregate
Intrinsic Value |
Outstanding at December 31, 2006 | | 1,595 | | | $ | 5.16 | | | | | |
Granted | | 511 | | | | 4.40 | | | | | |
Exercised | | (82 | ) | | | 3.49 | | | | | |
Forfeitures and cancellations | | (320 | ) | | | 5.68 | | | | | |
| | | | | | | | | | | |
Outstanding at December 31, 2007 | | 1,704 | | | $ | 4.92 | | 6.69 | | $ | 2,220 |
| | | | | | | | | | | |
Vested and expected to vest at December 31, 2007 | | 1,423 | | | $ | 4.93 | | 6.25 | | $ | 1,880 |
| | | | | | | | | | | |
Exercisable at December 31, 2007 | | 1,039 | | | $ | 5.04 | | 5.18 | | $ | 1,349 |
| | | | | | | | | | | |
58
NETMANAGE, INC.
NOTES TO CONSOLIDATED FINANCIAL STATEMENTS—(Continued)
The aggregate intrinsic value is calculated as the difference between the exercise price of the underlying awards and the market price of the Company’s common stock for the 1.0 million exercisable options where the market price was higher than the exercise price at December 31, 2007.
The aggregate intrinsic value of options exercised under the Company’s stock option plans, determined as of the date of the option exercise for the years ended December 31, 2007, 2006 and 2005 was $154,618, $200,552, and $212,138, respectively.
Recent accounting pronouncements
In December 2007, the Financial Accounting Standards Board (FASB) issued SFAS No. 141 (revised 2007),Business Combinations (SFAS 141R) and SFAS No. 160,Accounting and Reporting of Noncontrolling Interest in Consolidated Financial Statements, an amendment of ARB 51 (SFAS 160), which will change the accounting for and reporting of business combination transactions and noncontrolling interests in consolidated financial statements. SFAS 141R and SFAS 160 will be effective for us on January 1, 2009. We are currently evaluating the impact of adopting SFAS 141R and SFAS 160 on our consolidated financial position, cash flows, and results of operations.
In February 2007, the FASB issued SFAS No. 159,The Fair Value Option for Financial Assets and Financial Liabilities (SFAS 159) which permits entities to choose to measure many financial instruments and certain other items at fair value that are not currently required to be measured at fair value. The provisions of SFAS 159 became effective for us on January 1, 2008. The adoption of SFAS 159 is not expected to have a material impact on our consolidated financial position, cash flows, or results of operations.
In September 2006, the FASB issued SFAS No. 157,Fair Value Measurements (SFAS 157), which defines fair value, establishes a framework for measuring fair value in generally accepted accounting principles, and expands disclosures about fair value measurements. SFAS 157 does not require any new fair value measurements, but provides guidance on how to measure fair value by providing a fair value hierarchy used to classify the source of the information. SFAS 157 is effective for fiscal years beginning after November 15, 2007. However, on February 12, 2008, the FASB issued FSP FAS 157-2 which delays the effective date of SFAS 157 for all nonfinancial assets and nonfinancial liabilities, except those that are recognized or disclosed at fair value in the financial statements on a recurring basis (at least annually). This FSP partially defers the effective date of SFAS 157 to fiscal years beginning after November 15, 2008, and interim periods within those fiscal years for items within the scope of this FSP. Effective for 2008, we will adopt SFAS 157 except as it applies to those nonfinancial assets and nonfinancial liabilities as noted in FSP FAS 157-2. The partial adoption of SFAS 157 is not expected to have a material impact on our consolidated financial position, cash flows, or results of operations.
In June 2006, the FASB issued FASB Interpretation (FIN) No. 48,Accounting for Uncertainty in Income Taxes—an Interpretation of FASB Statement No. 109 (FIN 48) which clarifies the accounting for uncertainty in tax positions. This interpretation requires the Company to recognize in its financial statements the impact of a tax position if that position is more likely than not of being sustained on audit, based on the technical merits of the position. The provisions of FIN 48 are effective for fiscal years beginning after December 15, 2006, with the cumulative effect of the change in accounting principle recorded as an adjustment to opening retained earnings. The Company adopted the provisions of FIN 48 on January 1, 2007. Upon implementing FIN 48 and performing the analysis, the Company did not recognize any increase or decrease to reserves for uncertain tax positions (see Note 7 of our Notes to Consolidated Financial Statements).
59
NETMANAGE, INC.
NOTES TO CONSOLIDATED FINANCIAL STATEMENTS—(Continued)
3. Restructuring charges (reversals):
The Company accrues for restructuring costs when it makes a commitment to a firm exit plan that specifically identifies all significant actions to be taken in conjunction with its response to a change in its strategic plan, product demand, expense structure or other factors such as the date it ceases to use a facility. The Company reassesses its prior restructuring accruals on a quarterly basis to reflect changes in the costs of its restructuring activities, and the Company records new restructuring accruals as commitments are made. Estimates are based on anticipated costs of such restructuring activities and are subject to change.
On January 30, 2003, NetManage announced a restructuring of its operations in response to the sluggish North American and European economies. The Company concluded that it was necessary to refocus its operations and reduce its operating expenses to bring them in line with its revised anticipated revenue levels. The Company implemented a reduction in its workforce of more than 30% and recorded a $3.2 million restructuring charge related to expenses for employee terminations and expenses related to facilities no longer needed for Company operations during 2003 as required by SFAS No. 146, Accounting for Costs Associated with Exit or Disposal Activities. During 2004, the Company recorded a $0.2 million reduction in estimate primarily related to the successful sublease of unoccupied space in the Ottawa facility. In 2005, the Company recorded a reduction in restructuring expense of $0.2 million for severance related to European operations. In the quarter ended March 31, 2006, the Company recorded an increase in the restructuring charge of $7,000 as an adjustment to the expected facility obligations in Ottawa, Canada. As of December 31, 2007, the Company had incurred net costs totaling $2.8 million related to the restructuring, which has required $2.8 million in cash expenditures. For the year ended December 31, 2007, the Company recorded a change in estimate of $14,000 and utilized $11,000 of the reserve. As of December 31, 2007, there are no more obligations for restructuring reserve related to the January 2003 restructuring.
The distribution of the reduction in workforce was as follows (number of employees):
| | | | | | |
| | | Terminations | | Replacements | | Net Reduction |
Operations | | 10 | | 6 | | 4 |
Services | | 14 | | 1 | | 13 |
Research and development | | 19 | | — | | 19 |
Sales and marketing | | 44 | | 4 | | 40 |
General and administrative | | 24 | | 5 | | 19 |
| | | | | | |
Total | | 111 | | 16 | | 95 |
| | | | | | |
The restructuring charge of $2.8 million includes $2.4 million for employee severances and related expenses, and $0.4 million in facility expenses related to leased facilities in Germany and Canada.
60
NETMANAGE, INC.
NOTES TO CONSOLIDATED FINANCIAL STATEMENTS—(Continued)
The following table lists the components of the January 2003 restructuring charge for the years ended December 31, 2007, 2006, and 2005 (in thousands):
| | | | | | | | | | | | |
| | | Employee
Costs | | | Excess
Facilities | | | Total | |
Balance at December 31, 2004 | | $ | 205 | | | $ | 82 | | | $ | 287 | |
Change in estimates in 2005 | | | (187 | ) | | | — | | | | (187 | ) |
Reserves utilized in year ended December 31, 2005 | | | (18 | ) | | | (38 | ) | | | (56 | ) |
| | | | | | | | | | | | |
Balance at December 31, 2005 | | $ | — | | | $ | 44 | | | $ | 44 | |
Change in estimates in 2006 | | | — | | | | 7 | | | | 7 | |
Reserves utilized in year ended December 31, 2006 | | | — | | | | (26 | ) | | | (26 | ) |
| | | | | | | | | | | | |
Balance at December 31, 2006 | | $ | — | | | $ | 25 | | | $ | 25 | |
Change in estimates in 2007 | | | — | | | | (14 | ) | | | (14 | ) |
Reserves utilized in year ended December 31, 2007 | | | — | | | | (11 | ) | | | (11 | ) |
| | | | | | | | | | | | |
Balance at December 31, 2007 | | $ | — | | | $ | — | | | $ | — | |
| | | | | | | | | | | | |
In August 1998, following the acquisition of FTP Software, or FTP, the Company initiated a plan to restructure its worldwide operations as a result of business conditions and in connection with the integration of the operations of FTP. In connection with this plan, NetManage recorded a $7.0 million charge to operating expenses in 1998. In 2005, the Company recorded an increase in restructuring expense of $120,000 composed of primarily of sublease income not recovered. For the year ended December 31, 2006, the Company recorded a change in estimate of $174,000. The change in estimate is composed of adjustments to expected lease, sublease, and associated obligations related to the Birmingham, U.K. facility and related foreign exchange adjustments on the long-term lease commitments and related sublease income. For the year ended December 31, 2007, the Company recorded a change in estimate of $408,000. The change in estimate is composed of adjustments to expected lease, sublease and associated obligations related to the Birmingham, U.K. facility and related foreign exchange adjustments on the long-term lease commitments and related sublease income. The remaining reserve related to this restructuring at December 31, 2007 is $363,000 of which $93,000 is included in accrued liabilities and $270,000 is included in long-term liabilities.
The following table lists the components of the August 1998 restructuring reserve for the years ended December 31, 2007, 2006, and 2005 (in thousands):
| | | | |
| | | Excess
Facilities | |
Balance at December 31, 2004 | | $ | 369 | |
Change in estimates in 2005 | | | 120 | |
Reserves utilized in year ended December 31, 2005 | | | (170 | ) |
| | | | |
Balance at December 31, 2005 | | $ | 319 | |
Change in estimates in 2006 | | | 174 | |
Reserves utilized in year ended December 31, 2006 | | | (161 | ) |
| | | | |
Balance at December 31, 2006 | | $ | 332 | |
Change in estimates in 2007 | | | 408 | |
Reserves utilized in year ended December 31, 2007 | | | (377 | ) |
| | | | |
Balance at December 31, 2007 | | $ | 363 | |
| | | | |
61
NETMANAGE, INC.
NOTES TO CONSOLIDATED FINANCIAL STATEMENTS—(Continued)
On February 22, 2007, the Company implemented a restructuring of operations designed to align its business units with its core business functions, to relocate certain of its functional operations, and to reduce operating expenses. As part of the restructuring, the Company reduced its workforce in excess of 10% and recorded a $2.0 million charge to operating expenses for the year ended December 31, 2007. The distribution of this reduction in workforce is as follows:
| | |
| | | Terminations |
Services | | 2 |
Research and development | | 14 |
Sales and marketing | | 7 |
General and administrative | | 6 |
| | |
Total | | 29 |
| | |
The restructuring charge included approximately $1.0 million of expenses related to facilities no longer needed as of December 31, 2007 for company operations and approximately $1.3 million of employee and other-related expenses for employee terminations. The execution of the restructuring actions will require total cash expenditures of $2.3 million. These restructuring costs are expected to be funded from internal operations and existing cash balances. In the third quarter of 2007, the Company received a release of liability for leased office space in Ottawa, Canada. The release of liability resulted in the reduction of approximately $215,000 from the February 2007 restructuring reserve and approximately $126,000 and $40,000 of deferred rent from other long-term liabilities and accrued liabilities respectively.
As of December 31, 2007, the Company had incurred costs totaling approximately $2.0 million related to the restructuring, which required approximately $1.5 million in cash expenditures. The remaining reserve related to this restructuring which is included in the accrued liabilities is approximately $540,000 of which $500,000 is included in accrued liabilities and $40,000 is included in long-term liabilities.
The following table lists the components of the February 2007 restructuring for the year ended December 31, 2007 (in thousands):
| | | | | | | | | | | | |
| | | Employee
Costs | | | Excess
Facilities | | | Total | |
Balance at December 31, 2006 | | $ | — | | | $ | — | | | $ | — | |
Initial reserve established | | | 979 | | | | 994 | | | | 1,973 | |
Change in estimated restructuring charge previously recorded | | | — | | | | (219 | ) | | | (219 | ) |
Additional reserve established during the second and third quarters of 2007 | | | 346 | | | | — | | | | 346 | |
Reserve utilized in twelve months ended December 31, 2007 | | | (815 | ) | | | (745 | ) | | | (1,560 | ) |
| | | | | | | | | | | | |
Balance at December 31, 2007 | | $ | 510 | | | $ | 30 | | | $ | 540 | |
| | | | | | | | | | | | |
4. Commitments and contingencies:
Legal proceedings
Litigation settlement for the year ended December 31, 2007 in the amount of $929,000 includes $918,000 that was received by the Company during the second quarter of 2007 in connection with the settlement of litigation filed by the Company in 2003 and $11,000 that was received by the Company during the third quarter of 2007 in connection with the settlement of a complaint filed in 2005. These settlements are reflected as a separate item in operating expenses.
62
NETMANAGE, INC.
NOTES TO CONSOLIDATED FINANCIAL STATEMENTS—(Continued)
The Company may be party to various legal proceedings and claims, either asserted or unasserted, which arise in the ordinary course of business, including proceedings and claims that may relate to acquisitions that have been completed or to companies have been acquired. While the outcome of these matters cannot be predicted with certainty, the Company does not believe that the outcome of any of these potential claims will have a material adverse effect on its consolidated financial position, results of operations or cash flow.
Leases
Facilities and equipment are leased under non-cancelable leases expiring on various dates through the year 2011. The Company has one capital lease. As of December 31, 2007, future minimum rental and lease payments for all leases are as follows (in thousands):
| | | | |
Year | | Lease
Payments | |
2008 | | | 2,438 | |
2009 | | | 1,850 | |
2010 | | | 1,164 | |
Thereafter | | | 981 | |
| | | | |
Gross lease obligations | | $ | 6,433 | |
Less sublease income | | | (1,598 | ) |
| | | | |
Total minimum obligations, net of sublease income | | $ | 4,835 | |
| | | | |
Rent expense was approximately $1.0 million, $1.2 million and $1.3 million for the years ended December 31, 2007, 2006 and 2005, respectively, net of sublease payments.
Other
As an element of its standard commercial terms, NetManage includes an indemnification clause in its software licensing agreements that indemnifies the licensee against liability and damages (including legal defense costs) arising from any claims of patent, copyright, trademark, or trade secret infringement by its software. NetManage’s indemnification limitation is the cost to defend any third party claim brought against its customers, and to the maximum, a refund of the purchase price. To date the Company has not experienced any claims related to its indemnification provisions and therefore has not established an indemnification loss reserve.
5. Stockholders’ equity:
Common stock
As of December 31, 2007, NetManage reserved the following shares of authorized but unissued common stock:
| | |
Employee stock option plans | | 3,347,007 |
Directors’ stock option plan | | 198,500 |
Employee stock purchase plan | | 780,486 |
| | |
Total shares reserved | | 4,325,993 |
| | |
63
NETMANAGE, INC.
NOTES TO CONSOLIDATED FINANCIAL STATEMENTS—(Continued)
Stock repurchase plan
Previously, NetManage’s Board of Directors authorized the repurchase of up to 2,142,857 shares of the Company’s common stock from time to time for possible reissue and general corporate purposes. No purchases of the Company’s common stock were made during 2007, 2006, or 2005.
Stockholder Rights Plan
On April 26, 1999, pursuant to a Preferred Shares Rights Agreement between NetManage and BankBoston, N.A., as rights agent, the Company’s Board of Directors declared a dividend of the right to purchase one share of the Company’s Series A Participating Preferred Stock for each one thousand outstanding shares of Common Stock (“Common Shares”). Each right entitles the registered holder to purchase from the Company one one-thousandth of a share of Series A Preferred at an exercise price of $24.00, subject to adjustment. The rights will not be exercisable until the earlier of: (i) 10 days following a public announcement that a person or group of affiliated or associated persons has acquired, or obtained the right to acquire, beneficial ownership of 20% or more of the outstanding Common Shares or (ii) 10 business days following the commencement of, or announcement of a tender offer or exchange offer, the consummation of which would result in the beneficial ownership by a person or group of 20% or more of the outstanding Common Shares. Upon the occurrence of certain events, the holders of rights (other than certain “Acquiring Persons” as defined in the rights agreement) will thereafter have the right to receive, upon exercise of the right, Common Shares having a value equal to two times the exercise price then in effect. The rights expire on May��7, 2009 unless redeemed prior to that date.
6. Stock option, stock purchase plans, and employee benefit plan:
Employee stock option plans
The 1999 Non-Statutory Stock Option Plan was initially adopted by the Board of Directors on October 25, 1999, and amended and restated on April 19, 2002, (the “1999 Plan”). The Board of Directors authorized and reserved for the issuance of 571,429 shares of NetManage common stock. At the Company’s Annual Stockholder’s Meeting on June 15, 2005, a majority of the stockholders of the Company present or represented and entitled to vote approved the following: (i) an increase in the number of shares reserved for issuance under the 1999 Plan by 300,000 shares; and (ii) an extension of the term of the plan to October 25, 2015. NetManage stockholders have authorized and reserved for issuance a total of 871,429 shares under the 1999 Plan. The 1999 Plan provides for the grant of non-qualified stock options to officers and employees in its employ, or in the employ of any subsidiary company, to members of the Board of Directors, and to independent consultants who provide services to the Company, or subsidiary companies. However, not more than 50% of the shares authorized for issuance under the 1999 Plan may be issued pursuant to option grants made to officers or the members of the Board of Directors. The exercise price of the stock options, issued under the 1999 Plan shall not be less than 100% of the fair market value per share (being the closing price of the share on the NASDAQ Global Market). Options granted under the 1999 Plan become exercisable at a rate of 25% of the shares subject to the option at the end of the first year and 1/48 of the shares subject to the option at the end of each calendar month thereafter. The maximum term of a stock option under the 1999 Plan is 10 years.
On June 26, 1992, the Board of Directors approved the 1992 Employee Stock Option Plan, (the 1992 Plan). At the Company’s Annual Stockholder’s Meeting, on June 5, 2002, a majority of the stockholders of the Company present or represented and entitled to vote at the Meeting approved the following: (i) an increase in the number of shares reserved for issuance under the 1992 Plan by 214,286 shares; (ii) the addition of an annual share increase provision to the 1992 Plan beginning in the calendar year 2003 and continuing through calendar year 2007; and (iii) an extension of the term of the 1992 Plan to July 22, 2012. As of December 31, 2007,
64
NETMANAGE, INC.
NOTES TO CONSOLIDATED FINANCIAL STATEMENTS—(Continued)
NetManage stockholders had authorized a total of 3,437,417 shares for issuance under the 1992 Plan including 285,560, 281,681, and 275,956 shares authorized for issuance in 2007, 2006, and 2005, respectively. The 1992 Plan provides for the grant of incentive stock options to employees and officers and non-statutory stock options to employees, officers, directors, and consultants. Pursuant to the terms of the 1992 Plan, the exercise price of incentive stock options may not be less than 100% of the fair market value (being the closing price of the share on the NASDAQ Global Market) of the common stock on the date of grant (110% of such fair market value in the case of a grant to a holder of more than 10% of the voting power of NetManage’s outstanding capital stock (a 10% stockholder)); the exercise price of non-statutory options may not be less than 85% of such fair market value. Under the 1992 Plan stock options generally vest over a period of four years. The maximum term of a stock option under the 1992 Plan is 10 years (five years in the case of an incentive option granted to a 10% stockholder).
Non-employee directors’ stock option plan
The Directors’ Plan was initially adopted by the Board on July 22, 1993 and amended and restated on April 29, 2003. On May 28, 2003 at the Company’s Annual Stockholder’s Meeting a majority of the stockholders of the Company present or represented and entitled to vote at the meeting approved an increase in the number of shares authorized so that the maximum number of shares of common stock that may be delivered in respect of options granted under the Director’s Plan is 200,000 shares and extended the term of the plan to July 22, 2013. Under the Directors’ Plan, options may be granted only to non-employee directors of the Company. All option grants will have an exercise price per share of 100% of the fair market value (being the closing price of the share on the NASDAQ Global Market) of the common stock on the date of grant. Options granted under the Directors’ Plan become exercisable at a rate of 25% of the shares subject to the option at the end of the first year and 1/48 of the shares subject to the option at the end of each calendar month thereafter. The maximum term of a stock option under the Directors’ Plan is 10 years.
Employee stock purchase plan
In July 1993, the Company adopted the Employee Stock Purchase Plan (the “Purchase Plan”). On June 5, 2002 at its Annual Meeting of Stockholders’ a majority of the stockholders of the Company present or represented and entitled to vote at the meeting approved the following: (i) an increase in the number of shares reserved for issuance under the Purchase Plan by 214,286 shares, (ii) the addition of the annual share increase provision to the Purchase Plan beginning in the calendar year 2003 and continuing through calendar year 2007, and (iii) an extension of term of the Purchase Plan to April 30, 2012. As of December 31, 2007, NetManage’s stockholders authorized 1,345,856 shares of common stock for issuance under the Purchase Plan including 93,894 and 91,985 shares authorized for issuance in 2006 and 2005, respectively. Effective for the offering period beginning November 1, 2005, under the Purchase Plan, NetManage employees, subject to certain restrictions, may purchase shares of common stock at a price per share that is equal to 95% of the fair market value of the common stock on the last business day of the purchase period.
Effective November 1, 2006, the Company indefinitely suspended the Purchase Plan primarily due to low employee participation resulting from the implementation of the ‘Safe Harbor’ provision of SFAS 123(R). The Company is evaluating the Purchase Plan however no recommendation has been made concerning the continuation of the Purchase Plan.
65
NETMANAGE, INC.
NOTES TO CONSOLIDATED FINANCIAL STATEMENTS—(Continued)
Share-based compensation
Option activity, including the acquired options, under NetManage’s stock option plans was as follows:
| | | | | | | | | |
| | | Options
Available | | | Options
Issued &
Outstanding | | | Weighted
Average
Exercise
Price |
Balance at January 1, 2005 | | 1,115,724 | | | 1,596,438 | | | $ | 4.84 |
Authorized | | 575,956 | | | — | | | | — |
Granted | | (343,048 | ) | | 343,048 | | | | 6.38 |
Exercised | | — | | | (104,755 | ) | | | 4.40 |
Terminated | | 271,837 | | | (271,837 | ) | | | 5.72 |
| | | | | | | | | |
Balance at December 31, 2005 | | 1,620,469 | | | 1,562,894 | | | $ | 5.05 |
Authorized | | 281,683 | | | — | | | | — |
Granted | | (331,558 | ) | | 331,558 | | | | 5.49 |
Exercised | | — | | | (122,572 | ) | | | 3.68 |
Terminated | | 176,936 | | | (176,936 | ) | | | 5.82 |
| | | | | | | | | |
Balance at December 31, 2006 | | 1,747,530 | | | 1,594,944 | | | $ | 5.16 |
Authorized | | 285,560 | | | — | | | | — |
Granted | | (511,479 | ) | | 511,479 | | | | 4.40 |
Exercised | | — | | | (82,527 | ) | | | 3.49 |
Terminated | | 319,738 | | | (319,738 | ) | | | 5.68 |
| | | | | | | | | |
Balance at December 31, 2007 | | 1,841,349 | | | 1,704,158 | | | $ | 4.92 |
| | | | | | | | | |
Exercisable at December 31, 2005 | | | | | 850,215 | | | $ | 4.59 |
Exercisable at December 31, 2006 | | | | | 973,522 | | | $ | 4.89 |
Exercisable at December 31, 2007 | | | | | 1,039,112 | | | $ | 5.04 |
The following table summarizes NetManage’s outstanding options as of December 31, 2007:
| | | | | | | | | | | | |
| | | Options Outstanding | | Options Exercisable |
Range of Exercise Price | | Number
Outstanding | | Weighted
Average
Remaining
Life (Years) | | Weighted
Average
Exercise
Price | | Number
Exercisable | | Weighted
Average
Exercise
Price |
$1.05–$3.74 | | 149,607 | | 2.28 | | $ | 1.84 | | 146,277 | | $ | 1.79 |
$3.96–$3.96 | | 197,293 | | 9.83 | | $ | 3.96 | | — | | | — |
$3.97–$4.76 | | 179,861 | | 9.24 | | $ | 4.37 | | 10,714 | | $ | 4.33 |
$4.78–$4.78 | | 480,837 | | 5.64 | | $ | 4.78 | | 480,837 | | $ | 4.78 |
$4.97–$5.15 | | 173,009 | | 8.64 | | $ | 5.03 | | 25,206 | | $ | 5.06 |
$5.20–$5.40 | | 172,940 | | 6.33 | | $ | 5.28 | | 129,535 | | $ | 5.27 |
$5.45–$6.56 | | 221,855 | | 7.01 | | $ | 6.09 | | 135,089 | | $ | 6.15 |
$6.57–$22.31 | | 126,250 | | 4.69 | | $ | 8.14 | | 108,948 | | $ | 8.35 |
$27.56–$27.56 | | 77 | | 0.31 | | $ | 27.56 | | 77 | | $ | 27.56 |
$30.84–$30.84 | | 2,429 | | 1.90 | | $ | 30.84 | | 2,429 | | $ | 30.84 |
| | | | | | | | | | | | |
$1.05–$30.84 | | 1,704,158 | | 6.69 | | $ | 4.92 | | 1,039,112 | | $ | 5.04 |
| | | | | | | | | | | | |
The weighted average fair values of options granted during 2007, 2006 and 2005 were $2.27, $3.17 and $2.29 per share, respectively.
66
NETMANAGE, INC.
NOTES TO CONSOLIDATED FINANCIAL STATEMENTS—(Continued)
Employee benefit plan
NetManage has an Employee 401(k) Savings Plan, (the 401(k) Plan) established in 1992 to provide retirement and incidental benefits for its employees. As allowed under Section 401(k) of the Internal Revenue Code, the 401(k) Plan provides tax-deferred salary deductions for eligible employees. Employees may contribute from 1% to 25% of their eligible pre-tax compensation up to the amount allowable under current income tax regulations. Under the 401(k) Plan NetManage is not required to contribute and has not contributed since inception.
7. Income taxes:
The provision (benefit) for income taxes is based upon income (loss) before income taxes as follows (in thousands):
| | | | | | | | | | | |
| | | Years Ended December 31, |
| | | 2007 | | | 2006 | | | 2005 |
U.S. | | $ | (814 | ) | | $ | (2,883 | ) | | $ | 1,100 |
Non-U.S. | | | (934 | ) | | | 264 | | | | 1,781 |
| | | | | | | | | | | |
Income (loss) before income tax provision (benefit) | | $ | (1,748 | ) | | $ | (2,619 | ) | | $ | 2,881 |
| | | | | | | | | | | |
The components of the provision (benefit) for income taxes, net of valuation allowances, are as follows (in thousands):
| | | | | | | | | | | |
| | | Years Ended December 31, | |
| | | 2007 | | 2006 | | | 2005 | |
Current: | | | | | | | | | | | |
U.S.-Federal | | $ | 27 | | $ | 2 | | | $ | — | |
U.S.-State | | | 35 | | | 13 | | | | (7 | ) |
Non-U.S. | | | 144 | | | (98 | ) | | | (1,823 | ) |
| | | | | | | | | | | |
Total current | | | 206 | | | (83 | ) | | | (1,830 | ) |
| | | | | | | | | | | |
Deferred | | | — | | | — | | | | — | |
| | | | | | | | | | | |
Provision (benefit) for income taxes | | $ | 206 | | $ | (83 | ) | | $ | (1,830 | ) |
| | | | | | | | | | | |
The provision (benefit) for income taxes differs from the amounts that would result by applying the applicable statutory federal income tax rate to income before taxes, as follows (in thousands):
| | | | | | | | | | | | |
| | | Years Ended December 31, | |
| | | 2007 | | | 2006 | | | 2005 | |
Provision (benefit) at U.S. federal statutory rate | | $ | (612 | ) | | $ | (917 | ) | | $ | 1,008 | |
U.S. state income taxes, net of U.S. federal tax benefits | | | 35 | | | | 13 | | | | 11 | |
Incremental tax (benefit) on non-U.S. operations | | | 294 | | | | (97 | ) | | | (1,876 | ) |
Change in valuation allowance | | | 370 | | | | 755 | | | | (972 | ) |
Share-based compensation | | | 94 | | | | 191 | | | | — | |
Other permanent differences | | | 25 | | | | (28 | ) | | | (1 | ) |
| | | | | | | | | | | | |
Provision (benefit) for income taxes | | $ | 206 | | | $ | (83 | ) | | $ | (1,830 | ) |
| | | | | | | | | | | | |
67
NETMANAGE, INC.
NOTES TO CONSOLIDATED FINANCIAL STATEMENTS—(Continued)
The components of the net deferred income tax asset are as follows (in thousands):
| | | | | | | | | | | | |
| | | Years Ended December 31, | |
| | | 2007 | | | 2006 | | | 2005 | |
Deferred tax assets: | | | | | | | | | | | | |
Deferred revenue recognized currently for tax purposes | | $ | 1,071 | | | $ | 72 | | | $ | 73 | |
Reserves and accruals not currently deductible for tax purposes | | | 729 | | | | 570 | | | | 628 | |
Net operating loss carry forwards | | | 37,305 | | | | 60,724 | | | | 61,024 | |
Capital loss carry forwards | | | 1,037 | | | | 1,079 | | | | — | |
Tax credit carry forwards | | | 3,475 | | | | 3,393 | | | | 4,113 | |
Deferred R & D expenses | | | 3,864 | | | | 3,749 | | | | 5,427 | |
Basis difference in fixed assets | | | 177 | | | | — | | | | — | |
Amortizable intangibles | | | 1,702 | | | | 2,298 | | | | 3,278 | |
Other temporary differences | | | 1,387 | | | | 207 | | | | 175 | |
| | | | | | | | | | | | |
Total deferred tax asset | | | 50,747 | | | | 72,092 | | | | 74,718 | |
| | | | | | | | | | | | |
Deferred tax liabilities: | | | | | | | | | | | | |
Basis difference in fixed assets | | | — | | | | (13 | ) | | | (245 | ) |
| | | | | | | | | | | | |
Total deferred tax liabilities | | | — | | | | (13 | ) | | | — | |
| | | | | | | | | | | | |
Net total deferred tax asset | | | 50,747 | | | | 72,079 | | | | 74,473 | |
Less: Valuation allowance | | | (50,747 | ) | | | (72,079 | ) | | | (74,473 | ) |
| | | | | | | | | | | | |
Net deferred tax asset | | $ | — | | | $ | — | | | $ | — | |
| | | | | | | | | | | | |
The pretax income (loss) from non-U.S. subsidiaries, which is comprised of Canadian, European, Asian, and Latin American operations, was ($0.9) million, $0.3 million and $1.8 million, in 2007, 2006 and 2005, respectively. Undistributed earnings of NetManage’s foreign subsidiaries are considered to be indefinitely reinvested and, accordingly no provision for federal and state income taxes has been provided thereon. Upon distribution of those earnings in the form of a dividend or otherwise, NetManage may be subject to both U.S. income taxes (subject to an adjustment for foreign tax credits) and withholding taxes payable to the various foreign countries. It is not practical to estimate the income tax liability that might be incurred on the remittance of such earnings.
The income tax provision of $206,000 for the year ended December 31, 2007 resulted from foreign and U.S. state income taxes. The income tax benefit of $83,000 for the year ended December 31, 2006 resulted primarily from non-U.S. tax accruals released, foreign tax refunds received, and U.S. state income taxes and non-U.S. taxes not offset by losses. The income tax benefit of $1.8 million for the year ended December 31, 2005 resulted primarily from non-U.S. tax accruals released and foreign tax refunds received.
Currently, management believes it is more likely than not that the net deferred tax asset will not be realized and, accordingly has recorded a valuation allowance for the entire balance. This is due to the history of net operating losses that NetManage has incurred. The amount of the deferred tax asset considered realizable however may change if actual future taxable income differs from estimated amounts.
At December 31, 2007, NetManage had net operating loss carry forwards of approximately $150.7 million and $37.5 million for U.S. federal and U.S. state income tax purposes, respectively, expiring at various dates through 2027 and U.S. federal tax credit carry forwards of approximately $1.0 million that expire in various years through 2011. At December 31, 2007, NetManage had non-U.S. net operating loss carry forwards of approximately $48.2 million available to offset future taxable income in several non-U.S. jurisdictions.
68
NETMANAGE, INC.
NOTES TO CONSOLIDATED FINANCIAL STATEMENTS—(Continued)
Included in the above carry forwards are $62.4 million of U.S. federal net operating losses and $0.8 million in U.S. federal tax credit carry forwards that relate to NetManage’s past acquisitions accounted for under the purchase method of accounting. The benefit of such losses and tax credits, if and when realized, will be credited first to reduce to zero any goodwill related to the respective acquisition, second to reduce to zero other non-current intangible assets related to the respective acquisition, and third to reduce income tax expense subject to limitations under the Internal Revenue Code and similar U.S. state provisions. At December 31, 2007, the net carrying amount of goodwill and other non-current intangible assets against which such pre-acquisition tax attributes could be applied is $4.4 million.
During the years ended December 31, 2007, 2006 and 2005, NetManage recognized benefits of $0.2 million, $0.1 million and $0.7 million, respectively from the utilization of worldwide post-acquisition net operating loss carry forwards for which NetManage had previously established a full valuation allowance. Because of the full valuation allowance against the deferred tax assets, the benefit from the utilization of these tax attributes had not been previously recognized.
As of December 31, 2007, the Company had $1.4 million of valuation allowance related to stock option deductions, which, if realized will be accounted for as an addition to equity rather than as a reduction of the provision for taxes.
As a result of the adoption of FIN 48, the Company recognized a $23.1 million decrease in the deferred tax assets for unrecognized tax benefits primarily consisting of net operating losses related to tax positions taken in prior periods. This amount was fully offset by a valuation allowance. As such, this decrease has no impact to retained earnings in accordance with the provisions of FIN 48. At the adoption date, we had $24.1 million of unrecognized tax benefits, of which $24.0 million would affect the Company’s effective tax rate if recognized, without consideration of the related valuation allowance previously recorded. At the end of the year, we had $25.4 million of unrecognized tax benefits, of which $25.0 million would affect the Company’s effective tax rate if recognized, without consideration of the related valuation allowance previously recorded. The Company did not recognize any adjustment to reserves for uncertain tax positions as a result of the implementation of FIN 48. Additionally, the Company reclassified $178,000 from current taxes payable to long-term taxes payable as of the adoption date. Since the adoption of FIN 48, the Company’s FIN 48 reserve increased by $52,000, including an increase of $6,000 of accrued interest and penalties. The Company does not anticipate any unrecognized tax benefits in the next twelve months that would result in a material change to its financial position.
The Company includes interest and penalties recognized in accordance with FIN 48 in the financial statements as a component of income tax expense. The Company had $16,000 of accrued interest and penalties at December 31, 2007.
The aggregate changes in the balance of gross unrecognized tax benefits were as follows (in thousands):
| | | | |
Beginning balance as of January 1, 2007 (date of adoption) | | $ | 24,076 | |
Lapse of statute of limitations | | | (58 | ) |
Increases in balances related to tax positions taken during prior periods | | | 1,406 | |
Decreases in balances related to tax positions taken during prior periods | | | (238 | ) |
Increases in balances related to tax positions taken during current period | | | 241 | |
| | | | |
Balance as of December 31, 2007 | | $ | 25,427 | |
| | | | |
Although the Company files U.S. federal, U.S. state, and foreign tax returns, the Company’s major tax jurisdictions are the U.S., Canada, and Israel. The Company’s 1998-2006 tax years remain subject to examination
69
NETMANAGE, INC.
NOTES TO CONSOLIDATED FINANCIAL STATEMENTS—(Continued)
by the IRS for U.S. federal tax purposes, and the Company’s 2002-2006 tax years remain subject to examination by the appropriate governmental agencies for Canada and Israel tax purposes.
In accordance with certain provisions of the Internal Revenue Code, as amended, a change in ownership of greater than 50% of a company within a three year period results in an annual limitation on its ability to utilize its U.S. federal net operating loss carry forward from tax periods prior to the ownership change. Such a change in ownership may have occurred with respect to NetManage or NetManage’s past acquisition of certain companies. Accordingly, NetManage’s net operating losses and credits are subject to these limitations and may expire before utilization.
NetManage’s subsidiary in Haifa, Israel (NetManage, Ltd.), has received government approved enterprise status for its investment plans. Under these plans, NetManage, Ltd. was granted a ten-year tax holiday. During the first two years of the tax holiday, NetManage, Ltd. was exempt from taxation on income generated during that period. For the remaining eight years in which income is generated by NetManage, Ltd., that generated income will be taxed at a reduced income tax rate of 10%. The plans currently in effect will expire at various dates through 2015.
8. Segment information:
The Company operates in one reportable segment as defined by Statement of Financial Accounting Standards No. 131, Disclosures About Segments of an Enterprise and Related Information. The Company designs, develops, markets and sells software products involving both client-side and server-side solutions. NetManage’s chief operating decision maker is its chief executive officer.
The following is a summary of revenues by geographic region based on customer location (in thousands):
| | | | | | | | | |
| | | Years Ended December 31, |
| | | 2007 | | 2006 | | 2005 |
Net revenues: | | | | | | | | | |
North America operations | | $ | 21,746 | | $ | 22,935 | | $ | 29,224 |
European operations | | | 13,301 | | | 11,883 | | | 13,526 |
Latin America operations | | | 455 | | | 319 | | | 212 |
Asian operations | | | 468 | | | 424 | | | 472 |
Total net revenues | | $ | 35,970 | | $ | 35,561 | | $ | 43,434 |
Approximately 74% and 80% of the Company’s net fixed assets are located in North America as of December 31, 2007 and 2006, respectively. Approximately 26% and 20% of the Company’s fixed assets are located in Europe as of December 31, 2007 and 2006, respectively.
9. Related party transactions:
On July 19, 2007, the Company entered into an independent contractor services agreement with Dr. Shelley Harrison, a director of the Company, pursuant to which Dr. Harrison will receive compensation in consideration for consultancy and advisory services to the Company. The terms of the agreement require the Company to pay Dr. Harrison a fixed fee of $150,000 per year, and a one time grant to Dr. Harrison of an option to purchase 100,000 shares under the 1999 Plan, at an exercise price of $4.33 per share (which represents the quoted market price of the stock at the date of grant). The option will vest on a monthly basis over a four-year term and expires ten years from the date of issuance. The fair value of the 100,000 options from the 1999 Plan was determined using the Black-Scholes option pricing model with the following assumptions: stock price $4.33-$6.00; no dividends; risk free interest rate of 3.53%-4.64%; volatility of 47%-56%; and a contractual life of ten years.
70
NETMANAGE, INC.
NOTES TO CONSOLIDATED FINANCIAL STATEMENTS—(Continued)
The fair value of the option is subject to change over the vesting period of the option based on changes in the underlying assumptions. For the year ended December 31, 2007, the Company recorded approximately $30,000 in share based compensation expense under this agreement and recorded total aggregate cash and non-cash compensation of approximately $105,000 included in General and Administrative expense in the Consolidated Statements of Operations.
10. Subsequent event:
On January 18, 2008, NetManage and Rocket Software entered into an amendment to the merger agreement entered into on December 11, 2007. Pursuant to the amendment, NetManage and Rocket agreed to extend the date by which Rocket must terminate the merger agreement or waive conditions to February 8, 2008. In addition, the amendment extended until March 31, 2008 the date as of which either party could have terminated the merger agreement if the merger has not been completed by that date.
On February 8, 2008, NetManage, and Rocket Software entered into amendment No. 2 to extend the date by which Rocket must terminate the merger agreement or waive these conditions to February 29, 2008. On February 29, 2008, NetManage received notification from Rocket Software that it had failed to obtain the requisite financing to the proposed acquisition of NetManage within the contracted timeframe and, as a result, Rocket Software terminated the merger agreement.
Quarterly financial data (unaudited)
We have experienced, and expect to experience in future periods, significant fluctuations in operating results that may be caused by many factors, including, among others, those described above within Item 1A—Risk Factors. Our future revenues and results of operations could be subject to significant volatility and may be unpredictable due to shipment patterns typical of the software industry. A significant percentage of our net revenues is generally recognized in the third month of each quarter and tends to occur in the latter half of that month. We believe that period-to-period comparisons of our results of operations are not necessarily meaningful and should not be relied upon as indications of future performance.
The following table sets forth unaudited consolidated quarterly financial information for 2007 and 2006. This unaudited information has been prepared on the same basis as the audited consolidated financial statements and, in the opinion of management, includes all normal and reoccurring adjustments necessary for the fair presentation of the information for the periods presented.
2007 Quarter Ended (Unaudited) (in thousands, except per share amounts)
| | | | | | | | | | | | | | | |
| | | December 31 | | September 30 | | | June 30 | | | March 31 | |
Statement of Operations Data: | | | | | | | | | | | | | | | |
Net revenues | | $ | 10,832 | | $ | 8,668 | | | $ | 8,786 | | | $ | 7,684 | |
Gross margin | | | 9,534 | | | 7,427 | | | | 7,638 | | | | 6,573 | |
Income (loss) from operations | | | 1,354 | | | 301 | (1) | | | 133 | (1) | | | (3,884 | )(2) |
Net income (loss) | | $ | 993 | | $ | 456 | | | $ | 153 | | | $ | (3,556 | ) |
Net income (loss) per share, basic | | $ | 0.10 | | $ | 0.05 | | | $ | 0.02 | | | $ | (0.37 | ) |
Net income (loss) per share, diluted | | $ | 0.10 | | $ | 0.05 | | | $ | 0.02 | | | $ | (0.37 | ) |
Weighted average common shares, basic | | | 9,588 | | | 9,576 | | | | 9,563 | | | | 9,540 | |
Weighted average common shares, diluted | | | 9,738 | | | 9,723 | | | | 9,786 | | | | 9,540 | |
71
NETMANAGE, INC.
NOTES TO CONSOLIDATED FINANCIAL STATEMENTS—(Continued)
| (1) | Income from operations for the third and second quarters ending September 30, 2007 and June 30, 2007, respectively, includes Litigation settlements of $11,000 that was received by the Company during the third quarter of 2007 in connection with the settlement of a complaint filed in 2005 and $918,000 that was received by the Company during the second quarter of 2007 in connection with the settlement of litigation filed by the Company in 2003. These settlements were reflected as a separate item in operating expenses. |
| (2) | Income from operations for the first quarter ended March 31, 2007 includes Restructuring charge recorded for the restructuring event implemented in February 2007 to align our core business functions, to relocate certain operations and to reduce operating expenses. The restructuring charges for the quarter ended March 31, 2007 includes $2.0 million for the February 2007 restructuring activity and is composed of $1.0 million for facility costs and $1.0 million in personnel costs. |
2006 Quarter Ended (Unaudited) (in thousands, except per share amounts)
| | | | | | | | | | | | | | | | |
| | | December 31 | | | September 30 | | | June 30 | | | March 31 | |
Statement of Operations Data: | | | | | | | | | | | | | | | | |
Net revenues | | $ | 8,649 | | | $ | 9,394 | | | $ | 8,990 | | | $ | 8,528 | |
Gross margin | | | 7,424 | | | | 8,281 | | | | 7,784 | | | | 7,530 | |
Loss from operations | | | (1,395 | ) | | | (92 | ) | | | (1,101 | ) | | | (1,052 | ) |
Net income (loss) | | $ | (916 | ) | | $ | 33 | | | $ | (899 | ) | | $ | (754 | ) |
Net income (loss) per share, basic | | $ | (0.10 | ) | | $ | 0.00 | | | $ | (0.10 | ) | | $ | (0.08 | ) |
Net income (loss) per share, diluted | | $ | (0.10 | ) | | $ | 0.00 | | | $ | (0.10 | ) | | $ | (0.08 | ) |
Weighted average common shares, basic | | | 9,498 | | | | 9,443 | | | | 9,422 | | | | 9,393 | |
Weighted average common shares, diluted | | | 9,498 | | | | 9,728 | | | | 9,422 | | | | 9,393 | |
Item 9—Changes in and disagreements with accountants on accounting and financial disclosure
None
Item 9A—Controls and Procedures
Management’s Report on Internal Control Over Financial Reporting
Our management is responsible for establishing and maintaining adequate internal control over financial reporting, as such term is defined in Exchange Act Rules 13a-15(f) and 15d-15(f). Our internal control over financial reporting is designed to provide reasonable assurance regarding the reliability of financial reporting and the preparation of financial statements for external purposes in accordance with generally accepted accounting principles in the U.S. However, all internal control systems, no matter how well conceived and implemented, have inherent limitations. Therefore, even those systems determined to be effective can provide only reasonable assurance with respect to financial statement preparation and reporting. Under the supervision and with the participation of our management, including our principal executive officer and principal financial officer, we conducted an evaluation of the effectiveness of our internal control over financial reporting based on the framework in Internal Control—Integrated Framework issued by the Committee of Sponsoring Organizations of the Treadway Commission (COSO). Based on that evaluation, our management concluded that, as of December 31, 2007, we did not maintain effective internal control over financial reporting due to a material weakness as described below.
Accounting principles generally accepted in the United States and the reporting requirements of the SEC are complex and require an appropriate level of expertise and experience within the accounting and finance function to facilitate accurate and timely financial reporting. Although we filled up the key positions of the chief financial
72
NETMANAGE, INC.
NOTES TO CONSOLIDATED FINANCIAL STATEMENTS—(Continued)
officer and corporate controller in 2007, we still lacked the complement of personnel with an appropriate level of accounting knowledge and training to ensure that our financial information is adequately analyzed and reviewed on a timely basis to detect misstatements.
As discussed below under “Remediation Actions,” we plan to take the necessary steps to remediate this material weakness. We will continue to actively monitor the effectiveness of these processes, procedures and controls, and will make any further changes as management determines appropriate.
This annual report does not include an attestation report of the company’s registered public accounting firm regarding internal control over financial reporting. Management’s report was not subject to attestation by the company’s registered public accounting firm pursuant to temporary rules of the Securities and Exchange Commission that permit the company to provide only management’s report in this annual report.
Remediation Actions
Our management has developed a plan to remediate the material weakness by the end of the third quarter of 2008. We expect this remediation will require us to augment the resources available to our accounting function and to increase the level of accounting expertise of current personnel by means of training. We have also concluded that we must ensure that all of our accounting and finance staff are thoroughly trained in the application of our accounting policies and procedures and internal controls. We are not able at this time to determine the costs of the remediation, but do expect to incur additional expenses related to our accounting function.
Changes in Internal Controls Over Financial Reporting
In 2006 NetManage lost key personnel in the finance and accounting departments. During 2007, NetManage has replaced those key personnel lost in 2006 and added additional processes in place in the finance and accounting departments resolving the issues raised in connection with such loss of personnel.
Other than as expressly noted in this Item 9A, there were no changes in our internal control over financial reporting identified in connection with the evaluation of our controls during the quarter ended December 31, 2007 that have materially affected, or are reasonably likely to materially affect, our internal control over financial reporting.
Evaluation of Disclosure Controls and Procedures
We maintain disclosure controls and procedures that are designed to ensure that information required to be disclosed by us in reports that we file or submit under the Exchange Act is recorded, processed, summarized and reported as specified in the SEC’s rules and forms. An evaluation was performed under the supervision and with the participation of our management, including our principal executive officer and principal financial officer of the effectiveness of our disclosure controls and procedures as of December 31, 2007. Based on that evaluation and as described above in “Management’s Report on Internal Control Over Financial Reporting,” we have identified a material weakness in our internal control over financial reporting (as defined in Exchange Act Rules 13a-15(f)). Solely as a result of this material weakness, our management, including our principal executive officer and principal financial officer, have concluded that our disclosure controls and procedures (as such term is defined in Rules 13a-15(e) and 15d-15(e) under the Securities Exchange Act of 1934, as amended, or the Exchange Act) were not effective as of December 31, 2007.
Item 9B—Other Information
None
73
PART III
Item 10—Directors and executive officers of the registrant
Executive officers of the registrant
The executive officers, their ages, and their positions as of March 31, 2008 are as follows:
| | | | |
Name | | Age | | Position |
Zvi Alon | | 56 | | Chairman of the Board, President and Chief Executive Officer |
Omer Regev | | 42 | | Chief Financial Officer and Vice President, Finance |
Ido Hardonag | | 47 | | Senior Vice President, Worldwide Engineering |
Cheli Dudai-Karpel | | 54 | | Vice President, European and Israel Operations |
Zvi Alon is the founder of NetManage, Inc. and has served as our Chairman of the Board, President, and Chief Executive Officer since our formation in 1990. From 1986 to 1989, Mr. Alon was the President of Halley Systems, a manufacturer of networking equipment including bridges and routers. He also has served as Manager, Standard Product Line at Sytek, Inc., a networking company, and Manager of the Strategic Business Group for Architecture, Graphics and Data Communications at Intel Corporation, a semiconductor manufacturer. Mr. Alon received a B.S. degree in electrical engineering from the Technion-Israel Institute of Technology in Haifa, Israel. Mr. Alon is the former son-in-law of Mr. Uzia Galil, a director of the Company.
Omer Regev joined us in April 2007 as Senior Vice President of Finance, and Chief Financial Officer. Mr. Regev has over 15 years of experience in global financial management, private equity, mergers and acquisitions, financial restructurings, research and development support grants as well as investment banking services. Prior to joining NetManage, he held financial management positions across a variety of high-tech companies. Most recently, he served as CFO at Port Authority Technologies, a provider for Information Leak Prevention (ILP) solutions which was recently acquired by Websense. Mr. Regev also worked as CFO at Kagoor Network (acquired by Juniper Networks) and as CFO at XACCT Technologies (acquired by AMDOCS). Prior to this, he was Controller and Finance Director for the Enterprise System Division of LANNET/ Madge Networks NV and worked as a financial analyst in the Office of the Economic Advisor for the Israeli Ministry of Defense. Mr. Regev served three years in the Israeli Navy. He earned a BA degree in Economics and an MBA in Finance and Accounting in from Tel-Aviv University in Tel-Aviv, Israel.
Ido Hardonag re-joined us in October 2002 as Senior Vice President, Worldwide Engineering. Mr. Hardonag is responsible for worldwide engineering and research and development for the company’s current and future product lines and was previously employed by NetManage from July 1992 to January 2000 in several engineering management positions, the most recent as Vice President, Research and Development. Prior to re-joining the Company, Mr. Hardonag served as an independent consultant, from October 2001 to September 2002, providing consulting services to a number of companies. Prior to that Mr. Hardonag was with TeleKnowledge Group, a start-up company in Israel where he served as Vice President, Research and Development from January 2000 to September 2001. He was responsible for core product development, new product releases, and customer-related projects for its e-billing product. Mr. Hardonag received a B.S. in computer science from Tel-Aviv University in Tel-Aviv, Israel and a M.S. in computer science from the University of Southern California.
Cheli Dudai-Karpel re-joined us in March 2003 as Director, European and Israel Operations and was promoted to Vice President, European and Israel Operations in November 2004. Prior to re-joining the Company, Ms. Karpel worked as a consultant from November 2002 to March 2003. From December 2000 to November 2002 Ms. Karpel worked for Anota Ltd., a provider of e-business solutions for host-to-web access, initially as COO and was promoted to CEO in September 2001. Ms. Karpel worked from December 1999 to December 2000 for Internet2Anywhere, an Israeli based wireless internet provider, as Vice President, Marketing. From May 1993 to January 1999 Ms. Karpel worked for the Company and was a founding team member for NetManage Ltd.
74
Ms. Karpel holds a B.A. degree in Political Science and Literature and has completed M.S. studies in Social Sciences from Haifa University. She also holds a diploma in Systems Analysis and Management from Bar-Ilan University in Israel and a diploma in Management and Planning from the Israeli Institute of Technology.
The NetManage Board of Directors is divided into three classes (Class I, Class II and Class III), with one class of directors elected at each annual meeting of stockholders for a three-year term.
Class I Director Nominees Whose Terms Expire In 2010
| | |
John Bosch Age 73 | | John Bosch has served as a director of NetManage since December 1991. Currently, Mr. Bosch is a consultant. From November 1981 to December 1999, Mr. Bosch served as a general partner with Bay Partners, a venture capital firm. In 1976, he co-founded Cronus Precision Products, Inc., a digital timing company, and served as its President and Chief Executive Officer until 1981. In 1970, Mr. Bosch co-founded Anixter, Bosch and Russell, a consulting firm specializing in marketing and sales consulting for high technology companies and in technical venture analysis for the venture capital community. He is a graduate of the University of Southern California where he received a B.S. degree in mechanical engineering and an M.B.A. in International Trade. |
| |
Dr. Shelley Harrison Age 65 | | Dr. Shelley A. Harrison has served as a director of NetManage since July 1996. Dr. Harrison has served as Chairman of the Board of Directors of Spacehab, Inc. since 1993, a company that develops, owns and operates habitable modules and logistics supply services for the manned U.S. Space Shuttle missions, and from April 1996 to March 2003 was also the Chief Executive Officer. Dr. Harrison co-founded and served as the first Chief Executive Officer and Chairman of Symbol Technologies, Inc. from February 1973 to October 1982. Dr. Harrison is also a founder of the high-tech venture capital firms Harrison Enterprises, Inc., and PolyVentures I and II L.P., and Dr. Harrison currently serves as the Chairman of the Board of Directors of Harrison Enterprises, Inc., and member of the Board of SafeNet, Inc. Dr. Harrison received his B.S. in Electrical Engineering from New York University and received an M.S. and Ph.D. in Electrophysics from Polytechnic University. Dr. Harrison served as a consultant to the Company from May 2003 to May 2005 as described under Item 13—Certain Relationships and Related Transactions. |
Class II Directors Whose Terms Expire In 2008
| | |
Uzia Galil Age 83 | | Uzia Galil has been a director of NetManage since its inception in 1990. Mr. Galil currently serves as President and Chief Executive Officer of Uzia Initiatives and Management Ltd., a company specializing in the promotion and nurturing of new businesses associated with mobile communication, innovative consumer electronics and medical informatics which he founded in November 1999. From 1962 until October 1999, Mr. Galil served as President, Chief Executive Officer, and has also served as Chairman of the Board of Directors of Elron Electronic Industries Ltd., or Elron, an Israeli high technology holding company. From January 1981 until November 1999, Mr. Galil also served as Chairman of the Board of Directors of Elbit Ltd., an electronic communication affiliate of Elron, and as a member of the Boards of Directors of Elbit Systems Ltd., a defense electronics affiliate of Elron, and all other private companies held in the Elron portfolio. Mr. Galil currently serves as a member of the Board of Directors of Orbotech Ltd, which makes automated optical inspection and computer aided manufacturing systems for printed circuit boards, flat panel displays, integrated circuit packaging, and electronics assemblies; Partner Communications Co. Ltd., which operates the GSM network in Israel, using the Orange brand name; and is currently Chairman of the Board |
75
| | |
| | of Zoran Corporation, a provider of digital solutions-on-a-chip in the consumer electronics market. Mr. Galil holds an M.S. in Electrical Engineering from Purdue University and a B.S. from the Technion-Israel Institute of Technology in Haifa, Israel. From 1980 to 1990, Mr. Galil served as Chairman of the International Board of Governors of the Technion. Mr. Galil has also been awarded an honorary doctorate in technical sciences by the Technion in recognition of his contribution to the development of science-based industries in Israel, an honorary doctorate in philosophy by the Weizmann Institute of Science, an honorary doctorate in engineering by Polytechnic University, New York, and an honorary doctorate from the Ben-Gurion University of the Negev in Israel. In addition, Mr. Galil has been awarded the Solomon Bublick Prize Laureate from the Hebrew University of Jerusalem as well as the Outstanding Electrical and Computer Engineer Award by Purdue University. Mr. Galil is a recipient of the Israel Prize for his contribution to the development of Israel’s hi-tech industry. Mr. Galil is the former father-in-law of Zvi Alon, the Chairman of the Board of Directors, President, and Chief Executive Officer of NetManage. |
| |
Darrell Miller Age 61 | | Darrell Miller has served as a director of NetManage since 1993 and served as Executive Vice President, Corporate Strategic Marketing for NetManage from December 1994 to February 1996, at which time he retired. From 1987 to 1992, Mr. Miller was employed by Novell, Inc., a computer network company, in numerous positions including Executive Vice President responsible for strategic and marketing operations and Executive Vice President responsible for product development. From 1984 to 1987, Mr. Miller served as the Director of Marketing for Ungermann-Bass, a manufacturer of networking equipment. Mr. Miller also serves on the Board of Directors of Xpoint Technologies, Inc., a developer of fault tolerant software. Mr. Miller is a graduate of the University of Denver where he received a B.S. in business administration. |
Class III Directors Whose Terms Expire In 2009
| | |
Zvi Alon Age 56 | | Zvi Alon is the founder of NetManage, Inc. and has served as our Chairman of the Board, President and Chief Executive Officer since its formation in 1990. From 1986 to 1989, Mr. Alon was the President of Halley Systems, a manufacturer of networking equipment including bridges and routers. He also has served as Manager, Standard Product Line at Sytek, Inc., a networking company, and Manager of the Strategic Business Group for Architecture, Graphics and Data Communications at Intel Corporation, a semiconductor manufacturer. Mr. Alon received a B.S. degree in electrical engineering from the Technion-Israel Institute of Technology in Haifa, Israel. |
| |
Abraham Ostrovsky Age 65 | | Abraham Ostrovsky has served as a director of NetManage since January 1998. Mr. Ostrovsky served as the Chairman of the Board of Accelio Corporation (formerly JetForm) from June 1994 to April 2002, a provider of electronic forms and enterprise workflow products, and served as its Chief Executive Officer from 1992 to 1995. Mr. Ostrovsky also served as Chairman of the Board and Chief Executive Officer of Compressent Corporation, which develops and licenses color facsimile and communications software, from March 1996 to December 1997. Mr. Ostrovsky currently serves as non-executive Chairman of CenterBeam, Inc., an information technology outsourcing servicer. Mr. Ostrovsky served as Chairman of the Board of Directors of Digital Now, Inc., a developer of digital imaging technology and Internet-based activity for the photo processing industry, from 2000 to 2003. |
76
| | |
| |
Dr. Harry J. Saal Age 65 | | Dr. Harry J. Saal has served as a director of NetManage since October 2006. From October 1973 to October 1978, Dr. Saal worked at International Business Machines Corporation (IBM) in Haifa, Israel, and in San Jose, California, which manufactures and sells computer services, hardware, and software and also provides financing services in support of its computer business. Dr. Saal was the founder and Chief Executive Officer during October 1986 of Network General Corporation, the first company wholly dedicated to the area of network diagnostics. Dr. Saal also founded and served as Chief Executive Officer of Smart Valley, Inc., a non-profit organization chartered to create a regional electronic community based on an advanced information infrastructure from 1993 to 1995. |
| |
| | Dr. Saal is currently serving on the Board of the Northern California Chapter of the Arthritis Foundation and American Institute of Mathematics and Numenta, Inc., a company developing computer memory systems modeled after the human neocortex and which can be applied to solve problems in computer vision, artificial intelligence, robotics and machine learning. Mr. Saal currently serves as a member of the technical committee, charged with monitoring and enforcing the recently settled Microsoft Antitrust case. Previously, he served as President of Cultural Initiatives Silicon Valley; Chairman of the Board of the Community Foundation Silicon Valley; and Vice Chairman of the American Leadership Forum, Silicon Valley Chapter. Dr. Saal graduated magna cum laude from Columbia University in 1969, where he also received his Ph.D. in High Energy Physics. In 1997, Columbia University awarded Dr. Saal its highest honor, the John Jay Award. |
77
COMMITTEES OF THE NETMANAGE BOARD OF DIRECTORS
Board Committees and Meetings
During the fiscal year ended December 31, 2007, the Board of Directors (also referred to as the “Board”) held ten meetings. Standing committees of the Board in 2007 included the Audit Committee, the Option Committee, and the Compensation Committee. During the fiscal year ended December 31, 2007, each member of the Board attended 85% or more of the aggregate number of meetings of the Board and of the committees on which he served that was held during the period for which he was a director or committee.
Audit Committee
NetManage has a separately-designated standing Audit Committee established in accordance with Section 3(a)(58)(A) of the Securities Exchange Act of 1934, as amended (the “Exchange Act”). The Audit Committee assists the Board in fulfilling its responsibilities for generally overseeing NetManage’s financial reporting processes and the audit of NetManage’s financial statements. The Audit Committee meets with our independent registered public accounting firm at least quarterly to review the results of our quarterly financial reviews, our annual audit, and to discuss our financial statements. We certify that the Board adopted and approved an amended and restated charter for the Audit Committee on January 29, 2004, and that the Audit Committee has reviewed and reassessed the adequacy of the formal written charter on an annual basis. We filed a copy of our amended and restated charter for the Audit Committee with the Securities and Exchange Commission (the “SEC”) as an exhibit to our April 16, 2004 Proxy Statement. The charter gives the Audit Committee the authority and responsibility for the appointment, retention, compensation and oversight of our independent accountants, including pre-approval of all audit and non-audit services to be performed by our independent accountants. The Audit Committee charter has also been amended to give this committee broader authority to fulfill its obligations under the SEC and National Association of Securities Dealers (the “NASD”) requirements.
The Audit Committee is currently composed of three Non-Employee Directors: Messrs. Bosch, Miller, and Ostrovsky. The Audit Committee held four meetings during 2007. The Board has determined that all members of the Audit Committee are “independent” as that term is currently defined in Rule 4200(a)(15) of the listing standards of the NASD. The Board of Directors has also determined that Mr. Ostrovsky meets the SEC criteria of an “audit committee financial expert” as defined in Item 401(h) of Regulation S-K. Mr. Ostrovsky’s extensive background and experience includes serving as the Chief Executive Officer of Accelio Corporation (formerly JetForm) where Mr. Ostrovsky actively supervised the company’s Chief Financial Officer and participated extensively in accounting, auditing, and internal control and risk management matters.
Option Committee
The functions of the Option Committee are to review and recommend awards of stock options for approval by the Board of Directors under our stock option plans to employees and consultants who are not subject to Section 16 of the Exchange Act, and to recommend any changes or amendments to the Company’s stock option plans. The Option Committee currently consists of Messrs. Bosch and Miller, both of whom are independent, Non-Employee Directors. The Option Committee met twelve times during 2007.
Compensation Committee
The Compensation Committee reviews and approves specific compensation matters including the grant of options for the Chief Executive Officer, and all executive staff who report directly to the Chief Executive Officer as well as performing such other functions regarding compensation as the Board may delegate. The Board adopted and approved an amended and restated charter for the Compensation Committee on January 29, 2004. We filed a copy of our amended and restated charter for the Compensation Committee with the SEC as an exhibit to our April 16, 2004 Proxy Statement. The Compensation Committee is currently composed of three
78
independent Non-Employee Directors: Messrs. Bosch, Galil, and Ostrovsky. Mr. Alon makes his recommendations to the Compensation Committee with respect to options and any repurchases under our stock option plans and the 1993 Employee Stock Purchase Plan, as amended, subject to Section 16 of the Exchange Act, for individuals other than the Chief Executive Officer. The Compensation Committee determines the terms of option grants (including the number of shares) for all such individuals. The Compensation Committee met twice during 2007.
Nominations of Candidates for Director
The Company does not currently have a nominating committee. The full Board of Directors, in consultation with the Company’s Chief Executive Officer, recommends candidates for election to the Company’s Board of Directors and from time to time reviews the appropriate skills and characteristics required of individual Board members in the context of the current make-up of the Board, including such factors as business experience, diversity, and personal skills in technology, finance, marketing, international business, financial reporting, corporate governance, and other areas that are expected to contribute to an effective Board, and therefore, the Company believes it is unnecessary to have a nominating committee. The Board adopted and approved the Company’s Nominating Policy on April 2, 2004. We filed a copy of our Nominating Policy with the SEC as an exhibit to our April 16, 2004 Proxy Statement. The Nominating Policy provides guidelines to the Board of Directors of NetManage with the identification, evaluation and recommendation of nominees for the Company’s Board for each annual meeting and is designed to assist with the evaluation of the composition of the Company’s Board and its committees. The Board of Directors shall identify potential nominees by asking current directors and executive officers to notify the Board of Directors if they become aware of persons, meeting the criteria described above, who might serve on the Company’s Board. The Board of Directors also, from time to time, may engage firms that specialize in identifying director candidates.
The Board of Directors also considers candidates recommended by stockholders for election as directors. Such recommendations should be sent to the Board in care of the Corporate Secretary at the Company’s headquarters, and should include information as to the candidate’s name, biographical data and qualifications per the Nominating Policy. The Independent Directors believe that the minimum qualifications for serving as a director of the Company are that a nominee demonstrate, by a significant accomplishment in his or her field, an ability to make a meaningful contribution to the Company’s board’s oversight of the business and affairs of the Company and have an impeccable record and reputation for honest and ethical conduct in both his or her professional and personnel activities. In addition, the independent directors shall examine a candidate’s specific experiences and skills, time and availability in light of other commitments, potential conflicts of interest and independence from management and the Company.
Available Information and Code of Ethics
NetManage maintains on its website, www.netmanage.com, copies of the charters of each of the committees of the NetManage Board of Directors. Copies of these documents are also available in printed form upon request of NetManage’s Corporate Secretary. NetManage as adopted a code of ethics that applies to all of its directors, officers and employees, including the chief executive officer and chief financial officer. The code of ethics is an exhibit to this report.
Section 16(a) Beneficial Ownership Reporting Compliance
Section 16(a) of the Securities Exchange Act of 1934, as amended (the “Exchange Act”) requires the Company’s executive officers and directors and persons who own more than 10% of the Common stock of the Company to file reports of ownership and changes in ownership of common stock of the Company with the Securities and Exchange Commission (the “SEC”). Based solely on a review of copies of such, the Company believes that during the year ended December 31, 2007, its executive officers, directors and greater than 10% stockholders filed on a timely basis all reports due under Section 16(a) of the Exchange Act other than eight reports that were not filed timely as follows: Messrs. Zvi Alon, Omer Regev and Ido Hardonag, each filed one Form 4 late, Messrs. Shelley Harrison and Daniel Torres each filed two Forms 4 late and Trilogy, Inc. filed one Form 4 late.
79
Item 11—Executive and director compensation
Compensation Discussion and Analysis
In this compensation discussion and analysis, we explain our general compensation philosophy for the NetManage executive staff, including those named in the 2007 Summary Compensation Table,and provide an overview and analysis of the different material elements of compensation that we provide our executive officers, as well as for our Non-Employee Directors.
Material Elements of Compensation
Executive Compensation Objectives and Major Policies
Our primary goal is to align compensation with our business objectives and performance. Our aim is to attract, retain and reward executive officers and other key employees who contribute to our long-term success and to motivate those individuals to enhance long-term stockholder value. To establish this relationship between executive compensation and the creation of stockholder value, the Compensation Committee has adopted a total compensation package comprised of base salary, bonus and stock option awards. Key elements of this compensation package are:
| | • | | We pay competitively with leading software and high technology companies with which we compete for employees and other service providers; |
| | • | | We maintain annual incentive opportunities sufficient to provide motivation to achieve specific operating goals and to generate rewards that bring total compensation to competitive levels, and |
| | • | | We provide significant equity-based incentives for executives and other key employees to ensure that these individuals are motivated over the long term to respond to our business challenges and opportunities as owners and not just as employees. |
Company Performance and Chief Executive Officer Compensation
The 2007 salary and potential bonus of Mr. Alon, our Chief Executive Officer were established by the Compensation Committee in light of Mr. Alon’s responsibilities as President and Chief Executive Officer, on the basis of the salary received by him in 2005 and 2006 and our overall 2007 performance. Mr. Alon’s annual salary for 2007 was $475,000, and his target bonus was $285,000. The Committee determined that Mr. Alon’s salary and bonus are necessary to maintain Mr. Alon’s compensation at a competitive level in the industry. The Committee then reviewed Mr. Alon’s performance during fiscal year 2007, taking into account the Company’s overall financial performance, Mr. Alon’s specific business achievements over the last year and progress that had been made with respect to certain Company initiatives. The Compensation Committee determined that the Company’s goals for 2007 were achieved and therefore determined to pay cash bonuses to Mr. Alon for 2007 results.
Executive Officer Salaries
With respect to the executive officers hired in 2007, salary, potential bonus and stock option grants were determined on the basis of negotiations between us and each officer with due regard to the officer’s experience, prevailing market conditions and internal equity. Similarly, we negotiated with the former executive officers at the time of such officer’s hiring and reached a level of compensation that we believed was reasonably required to obtain the services of such officer.
NetManage reviews and administers compensation changes for all employees, including our continuing Named Executive Officers, on an annual basis. Each January, after performance results for the prior year are finalized and the business planning performance targets for the current year are complete, base salary changes and long-term incentive grants are reviewed and where applicable are approved by the appropriate authorized individuals. For the 2007 compensation administration cycle, management reviewed and summarized published reports by Radford Survey and presented management’s analysis of the Radford Survey’s to the Committee at their January 2008 meeting.
80
Specific Elements of Executive Compensation
Specifically, management examined the pattern of compensation practices among similar companies and adjusted benchmark data for the general industry and broad industry groups to reflect the pay level they expected the peer companies to pay if they were NetManage’s revenue size. The Committee and management also discussed the relative compensation and organizational roles and responsibilities of the Named Executive Officers.
We paid or provided the following elements of compensation to the Named Executive Officers with respect to 2007:
Base salaries
To remain competitive for critical talent, we linked our base salaries to approximately the 50th percentile of the relevant benchmark in the industry. For 2007, each named executive officer’s base pay was at or slightly above the 50th percentile of the applicable market.
Short-term incentives
We provided each of the Named Executive Officers with the opportunity to earn an annual cash bonus for 2007 performance. These awards are generally intended to qualify as performance based under Section 162(m) of the Internal Revenue Code. Historically, a substantial portion of the cash compensation paid to our executive officers, including the Chief Executive Officer, has been in the form of discretionary cash bonuses payable on a quarterly basis. The Compensation Committee believes that the bonus compensation of the Chief Executive Officer and our other executive officers should be expressly linked to our performance. Consistent with this philosophy, the bonus compensation is contingent primarily upon achieving a sufficient level of corporate profitability and the Company’s overall financial performance. Bonus payments are based on a target bonus pool established at the beginning of the year for each officer.
In reviewing 2007 bonuses, the Compensation Committee determined that the Company’s goals for 2007 were achieved and therefore determined to pay cash bonuses to the executive officers for 2007.
Long-Term Incentives
To date, long-term incentives have consisted solely of grants of options to purchase our common stock. Generally, the Compensation Committee makes stock option grants annually to certain of our executive officers. Each grant is designed to align the interests of the executive officer with those of the stockholders and provide each individual with a significant incentive to manage the Company from the perspective of an owner with an equity stake in the business. Each grant allows the officer to acquire shares of our common stock at a fixed price per share (being the closing price of the shares on the NASDAQ Global Market on the grant date) over a specified period of time (up to ten years). Each option generally becomes exercisable in a series of installments over a four-year period, contingent upon the officer’s continued employment with us. Accordingly, the option will provide a return to the executive officer only if he remains employed by us during the vesting period, and then only if the fair market value of the underlying shares appreciates over the option term.
The size of the option grant to each executive officer is set by the Compensation Committee at a level that is intended to create a meaningful opportunity for stock ownership based upon the individual’s current position with us, the individual’s personal performance in recent periods, and his or her potential for future responsibility and promotion over the option term. The Compensation Committee also takes into account the number of unvested options held by the executive officer in order to maintain an appropriate level of equity incentive for that individual, the relevant weight given to each of these factors varies from individual to individual. The Compensation Committee has established certain guidelines with respect to the option grants made to the executive officers, but has the flexibility to make adjustments to those guidelines at its discretion.
81
Our primary long-term incentive program presently consists of the 1992 Plan and the 1999 Plan. Options granted under the 1992 Plan generally vest over four years beginning on the first of the month following the date of hire of the optionee. These options are subject to a 25% cliff-vesting period that matures on the one-year anniversary of the grant date after which they are subject to monthly vesting to encourage key employees to continue in our employ. Through option grants, executives receive significant equity incentives to build long-term stockholder value. The exercise price of options granted under the 1992 Plan is generally 100% of the fair market value (being the closing price of the shares on the NASDAQ Global Market) of our common stock on the date of grant. The 1999 Plan provides for the grant of non-qualified stock options for employees of the Company (or a subsidiary corporation). Options granted under the 1999 Plan generally vest over four years beginning on the date of grant of the option. These options are subject to a 25% cliff-vesting period that matures on the one-year anniversary of the grant date after which they are subject to monthly vesting.
Employee Retention and Severance Benefits Agreement
Effective September 7, 2007, NetManage, Inc. (the “Company”) instituted a plan to grant certain key employees of the Company retention and severance benefits pursuant to the Key Employee Retention and Severance Benefits Agreement (the “Plan”).
The Plan was instituted to retain existing key employees by providing them with additional stock options and retention bonuses. Subject to the forfeiture provisions in each agreement executed by a key employee, the Plan will provide key employees of the Company with options under the Company’s 1999 Non-statutory Stock Option Plan and cash retention bonuses. The options will vest over two years with 50% of the shares subject to the option vesting on the one-year anniversary of the date of grant and with the balance vesting on the two-year anniversary of the date of grant. The key employees who will participate in the Plan and number of shares granted to each key employee will be determined by the Company’s Compensation Committee. Each key employee subject to the Plan will receive a cash bonus equal to twenty-five percent (25%) of the employee’s base salary on the one-year anniversary of the grant date and a cash bonus equal to fifty percent (50%) of the employee’s base salary on the two-year anniversary of the grant date. A key employee must be continually employed by the Company from the grant date to the specified payment date in order to receive any retention bonus. Payment of the retention bonus shall be done as soon as possible after becoming due but not later than two and one-half (2 1/2) months following the taxable year of Employee in which such payment becomes due and payable. The vesting of these options and the payment of the retention bonus may accelerate under certain conditions following a Change of Control (as defined in the Plan) of the Company.
The Plan also provides for cash severance benefits to be paid to a key employee in the event a key employee is terminated under specific circumstances, including: if the key employee is terminated within two years following the date of a Change of Control of the Company without Cause (as defined in the Plan) or if during this period he or she voluntarily terminates his or her employment for Good Reason (as defined in the Plan) and executes a standard release agreement. The amount of such severance benefits will be determined by the Company’s Compensation Committee. Also included are COBRA continuation coverage benefits for health, dental and vision insurance for a period equal to the amount of time the key employee receives severance payments. The Company shall also reimburse the key employee for a limited amount of outplacement service expenses actually incurred by the key employee.
Deferred compensation
NetManage sponsors a qualified 401(k) savings plan that covers most employees, including the Named Executive Officers, and other executive officers, however, NetManage does not match any deferred contributions of any of it employees, including its Named Executive Officers and other executive officers.
Non-Qualified Deferred Compensation
NetManage does not provide any non-qualified deferred compensation plans for any employees, including the Named Executive Officers.
82
Pension Benefits
NetManage does not provide Pension benefits to its employees, including its Named Executive Officers.
Certain Tax Considerations
Section 162(m) of the Internal Revenue Code of 1986, as amended, precludes a public corporation from taking a tax deduction for individual compensation in excess of $1 million for its chief executive officer or any of its four other highest-paid officers. This limitation applies to all compensation paid to the covered executive officers, which is not considered to be performance-based. The Compensation Committee considers the implications of this deduction limitation as one of many factors when setting compensation policy and making individual compensation determinations. The 1992 Plan contains provisions that permit certain grants to be made that would qualify for the performance-based exception. However, not all grants issued under the 1992 Plan qualify for this exception. The Compensation Committee does not expect that the Company would be denied a deduction under Section 162(m) for compensation paid during 2006; however, it is possible that in 2007 or some future year, a portion of the compensation deemed paid to a Company executive based on the exercise of one or more options will not be deductible under Code Section 162(m).
Summary Compensation Table
The following table sets forth all compensation awarded, earned or paid for services rendered in all capacities to us and our subsidiaries during 2007 to our Chief Executive Officer and certain other executive officers (collectively, the “Named Executive Officers”). This information includes the dollar values of base salaries, bonus awards, the number of stock options granted, and certain other compensation, whether paid or deferred.
Summary Compensation Table
| | | | | | | | | | | | | | |
| | | Year | | Salary ($) | | | Bonus ($)
(7) | | Option
Awards
($) (1) | | All Other
Compensation
($) | | | Total ($) |
Zvi Alon | | 2007 | | 475,000 | | | 100,625 | | 173,072 | | 4,649 | (2) | | 753,346 |
Chairman of the Board, President and Chief Executive Officer | | 2006 | | 475,000 | | | — | | 176,296 | | 4,636 | (2) | | 655,932 |
Omer Regev (8) Senior Vice President Finance, and Chief Financial Officer | | 2007 | | 137,949 | | | 37,500 | | 31,705 | | 298 | (2) | | 207,452 |
George Bennett | | 2007 | | 244,994 | (3) | | — | | 10,787 | | 2,358 | (4) | | 267,833 |
Vice President North America sales | | 2006 | | 311,344 | (3) | | — | | 10,744 | | 38,715 | (4) | | 360,803 |
Cheli Aflalo-Karpel (9) | | 2007 | | 195,846 | | | 60,708 | | 31,056 | | 70,547 | (5) | | 338,170 |
Vice President of Operations Europe and Israel | | 2006 | | 178,800 | | | — | | 26,388 | | 71,413 | (5) | | 276,601 |
Ido Hardonag (9) | | 2007 | | 212,768 | | | 44,100 | | 42,630 | | 70,186 | (6) | | 369,684 |
Senior Vice President of Worldwide Engineering | | 2006 | | 194,000 | | | — | | 41,257 | | 64,502 | (2) | | 299,759 |
Notes to Summary Compensation Table:
| (1) | This column reflects the stock awards expense taken in 2007 and 2006 in accordance with FAS 123R assuming no forfeitures. |
| (2) | 2007 All Other Compensation includes Group Life benefits. 2006 All Other Compensation includes Group Life benefits and other social benefits. |
| (3) | Mr. Bennett left the company in October 2007. Salary for 2007 includes base salary, payout for unused paid time off and sales commissions. Salary for 2006 includes base salary and sales commissions. |
83
| (4) | 2007 All Other Compensation includes i) $1,772 reimbursed for relocation costs ii) $586 for Group Life and other social benefits; and iii) $9,694 gain from the exercise and sale of vested stock option. 2006 amount Includes money reimbursed for relocation costs. |
| (5) | 2007 All Other Compensation includes i) $17,441 for Company sponsored travel or car allowance; ii) management insurance, including $9,792 for pension and $16,314 for severance pay; iii) $14,688 in payments toward this executive’s education fund; and iv) Israeli social security. |
2006 All Other Compensation includes i) $19,336 for Company sponsored travel or car allowance; ii) $47,665 for Group Life and other social benefits; and iii) $4,412 gain from the exercise and sale of vested stock options granted pursuant to the 1992 or 1999 Stock Option Plans.
| (6) | 2007 All Other Compensation includes i) $17,226 for Company sponsored travel or car allowance; ii) management insurance, including $10,638 for pension and $17,724 for severance pay; iii) $15,958 in payments toward this executive’s education fund; and iv) Israeli social security. 2006 All Other Compensation includes i) $14,942 for Company sponsored travel or car allowance; and ii) $49,560 for Group Life and other social benefits. |
| (7) | Includes bonuses paid for 2007 and bonus expense taken in 2007 as part of the Key Employee Retention and Severance Benefits Agreement. |
| (8) | Mr. Regev joined the company in April 2007. |
| (9) | All compensation to this executive was paid in New Israeli Shekel; the amounts specified in the table and related notes for this executive are the U.S. dollar equivalent. The conversion rate used for all such amounts paid on or before March 31, 2007 was the rate between the U.S. dollar and New Israeli Shekels at end of relevant month rate as published by the Bank of Israel, the central bank of Israel. The conversion rate used for all such amounts paid after March 31, 2007 was the rate between the U.S. dollar and New Israeli Shekels on the date of payment as quoted by OANDA.com. |
2007 Grants of Plan-Based Awards
The following table shows the number of options to purchase common stock that was granted by NetManage during 2007 to each person named in the2007 Summary Compensation Table. NetManage did not grant any stock appreciation rights to the Named Executive Officers for fiscal year 2007. As described in “Compensation Discussion and Analysis-Short-term incentives”, NetManage paid cash bonuses to executive officers for fiscal year 2007.
2007 Grants of Plan-Based Awards
| | | | | | | | | |
Name | | Grant
Date | | All Other
Option
Awards:
Number of
Securities
Underlying
Options (#) | | | Exercise
or Base
Price of
Option
Awards
($/share) | | Grant Date
Fair Value
of Stock
and Option
Awards ($) |
Zvi Alon | | 10/29/07 | | 75,000 | (2) | | 3.96 | | 3.96 |
Omer Regev | | 4/30/07 | | 60,000 | (3) | | 5.01 | | 5.01 |
| | 10/29/07 | | 30,000 | (2) | | 3.96 | | 3.96 |
George Bennett (1) | | 10/29/07 | | — | | | — | | — |
Cheli Aflalo-Karpel | | 10/29/07 | | 30,000 | (2) | | 3.96 | | 3.96 |
Ido Hardonag | | 10/29/07 | | 30,000 | (2) | | 3.96 | | 3.96 |
Notes to 2007 Grants of Plan Based Awards:
| (1) | Mr. Bennett left the Company in October 2007. |
84
| (2) | Options were granted as part of the Key Employee Retention and Severance Benefits Agreement, and were granted under the Company’s 1999 Non-statutory Stock Option Plan. The options will vest over two years with 50% of the shares subject to the option vesting on the one-year anniversary of the date of grant and with the balance vesting on the two-year anniversary of the date of grant. |
| (3) | Represents options granted pursuant to NetManage’s 1992 Stock Option Plan with an exercise price equal to the fair market value of NetManage common stock on the date of grant. The option grant vests and becomes exercisable in installments over a period of four years from the date of grant. Twenty five percent (25%) of the shares shall vest on the first anniversary of the date of grant and one forty-eighth (1/48) of the shares shall vest each month thereafter. These options will accelerate in the event of a change of control and of involuntary termination due to change in control. |
Outstanding Equity Awards at 2007 Fiscal Year-End
The market values in the table below are based on the closing market price of NetManage common stock at December 31, 2007 of $6.00 per share.
| | | | | | | | | | | |
| | | Outstanding Equity Awards at December 31, 2007 |
| | | Option Awards |
Name | | Number of
Securities
Underlying
Unexercised
Options: #
Exercisable | | | Number of
Securities
Underlying
Unexercised
Options: #
Unexercisable | | | Option
Exercise
Price ($) | | Option
Expiration
Date |
Zvi Alon | | — | | | 75,000 | (5) | | $ | 3.96 | | 10/28/2017 |
| | 17,968 | (1) | | 19,532 | (1) | | $ | 5.98 | | 1/25/2016 |
| | 16,210 | (2) | | — | | | $ | 4.78 | | 12/15/2013 |
| | 30,218 | (2) | | — | | | $ | 4.78 | | 12/15/2013 |
| | 661 | (2) | | — | | | $ | 4.78 | | 12/15/2013 |
| | 47,143 | (2) | | — | | | $ | 4.78 | | 12/15/2013 |
| | 47,143 | (2) | | — | | | $ | 4.78 | | 12/15/2013 |
| | 42,196 | (2) | | — | | | $ | 4.78 | | 12/15/2013 |
| | 47,143 | (2) | | — | | | $ | 4.78 | | 12/15/2013 |
| | 56,250 | (2) | | — | | | $ | 4.78 | | 12/15/2013 |
| | 90,872 | (3) | | 23,914 | (3) | | $ | 5.27 | | 9/30/2014 |
| | 27,343 | (3) | | 10,157 | (3) | | $ | 6.56 | | 1/25/2015 |
| | | | |
Omer Regev | | — | | | 60,000 | (6) | | $ | 5.01 | | 4/29/2017 |
| | — | | | 30,000 | (5) | | $ | 3.96 | | 10/28/2017 |
| | | | |
George Bennett (4) | | 6,875 | (3) | | — | | | $ | 5.30 | | 11/29/2015 |
| | | | |
Cheli Aflalo-Karpel | | — | | | 30,000 | (5) | | $ | 3.96 | | 10/28/2017 |
| | 4,672 | (1) | | 5,078 | (1) | | $ | 5.98 | | 1/25/2016 |
| | 917 | (1) | | — | | | $ | 1.54 | | 3/30/2013 |
| | 5,887 | (3) | | — | | | $ | 4.78 | | 12/15/2013 |
| | 1,575 | (3) | | 225 | (3) | | $ | 6.76 | | 5/27/2014 |
| | 3,951 | (3) | | 1,175 | (3) | | $ | 5.30 | | 10/28/2014 |
| | 7,260 | (3) | | 2,990 | (3) | | $ | 7.12 | | 2/10/2015 |
| | | | |
Ido Hardonag | | — | | | 30,000 | (5) | | $ | 3.96 | | 10/28/2017 |
| | 5,750 | (1) | | 6,250 | (1) | | $ | 5.98 | | 1/25/2016 |
| | 30,000 | (3) | | — | | | $ | 1.05 | | 10/30/2012 |
| | 13,941 | (3) | | — | | | $ | 4.78 | | 12/15/2013 |
| | 13,914 | (3) | | 3,662 | (3) | | $ | 5.27 | | 9/30/2014 |
| | 8,750 | (3) | | 3,250 | (3) | | $ | 6.56 | | 1/25/2015 |
85
Notes to Outstanding Equity Awards at 2007 Fiscal Year-End Table:
| (1) | Represents options granted pursuant to NetManage’s 1999 Stock Option Plan with an exercise price equal to the fair market value of NetManage common stock on the date of grant. The option grant vests and becomes exercisable in installments over a period of four years from the date of grant. Twenty five percent (25%) of the shares shall vest on the first anniversary of the date of grant and one forty-eighth (1/48) of the shares shall vest each month thereafter. |
| (2) | Represents replacement options granted on December 16, 2003 with an exercise price equal to the fair market value of NetManage’s common stock on the date of grant ($4.78), pursuant to a voluntary stock option exchange program announced on May 16, 2003. |
| (3) | Represents options granted pursuant to NetManage’s 1992 Stock Option Plan with an exercise price equal to the fair market value of NetManage common stock on the date of grant. The option grant vests and becomes exercisable in installments over a period of four years from the date of grant. Twenty five percent (25%) of the shares shall vest on the first anniversary of the date of grant and one forty-eighth (1/48) of the shares shall vest each month thereafter. |
| (4) | Mr. Bennett left the Company in October 2007. |
| (5) | Options were granted as part of the Key Employee Retention and Severance Benefits Agreement, and were granted under the Company’s 1999 Non-statutory Stock Option Plan. The options will vest over two years with 50% of the shares subject to the option vesting on the one-year anniversary of the date of grant and with the balance vesting on the two-year anniversary of the date of grant. |
| (6) | Represents options granted pursuant to NetManage’s 1992 Stock Option Plan with an exercise price equal to the fair market value of NetManage common stock on the date of grant. The option grant vests and becomes exercisable in installments over a period of four years from the date of grant. Twenty five percent (25%) of the shares shall vest on the first anniversary of the date of grant and one forty-eighth (1/48) of the shares shall vest each month thereafter. These options will accelerate in the event of a change of control and of involuntary termination due to change in control. |
2007 Option Exercises and Stock Vested
The following table provides information regarding amounts realized by each Named Executive Officer due to the vesting or exercise of equity compensation during the year.
| | | | |
| | | 2007 Option Exercises and Stock Vested |
| | | Option Awards |
Name | | Number of Shares
Acquired on
Exercise(#) (1) | | Value Realized
on Exercise
($) |
Zvi Alon | | — | | — |
Omer Regev | | — | | — |
George Bennett (2) | | 6,875 | | 9,694 |
Cheli Aflalo-Karpel | | — | | — |
Ido Hardong | | — | | — |
Notes to 2007 Option Exercises and Stock Vested Table (all values are based on the closing price per share of NetManage common stock on the vest date):
| (1) | Represents options granted pursuant to NetManage’s 1992 Stock Option Plan. |
| (2) | Mr. Bennett left the Company in October 2007. |
Employment Contracts, Termination of Employment and Change of Control Arrangements
Pursuant to an Employment Agreement with Omer Regev dated April 22, 2007, Mr. Regev’s monthly salary is $16,666 and he was granted an option to purchase 60,000 shares of the Company’s common stock. In addition, pursuant to Mr. Regev’s Employment Agreement, each stock option held by him that is outstanding at the time of
86
a change in control but not otherwise fully-vested, shall automatically accelerate so that each such option shall, immediately prior to the effective date of the change in control, become exercisable for all of the shares of common stock at the time subject to that option. However, an option shall not be accelerated if (i) such option is assumed or continued if full force and effect by the successor pursuant to the terms of the merger agreement; (ii) such option is replaced with a cash incentive program of the successor; (iii) the acceleration of such option is subject to other limitations imposed by the Plan Administrator at the time of the option grant.
Pursuant to an Employment Agreement with Ido Hardong dated October 10, 2002, Mr. Hardong’s monthly salary is $12,500 and he is entitled to sixty (60) days notice prior to termination.
Currently, in the event a change in control of the Company occurs, each outstanding option issued pursuant to: (i) the 1992 Plan; (ii) the 1999 Plan, or (iii) Directors’ Plan will automatically accelerate in full, subject to the limitations as stated below. All options granted under the 1992 Plan prior to its April 25, 2003 restatement will accelerate in full upon a change in control. In the event of a change in control, each outstanding option under the 1992 Plan as amended and restated will automatically accelerate in full, unless; (i) the option is assumed by the successor corporation or otherwise continued in effect, or (ii) the option is replaced with a cash incentive program which preserves the spread existing on the unvested option shares (the excess of the fair market value of those shares over the option exercise price payable for such shares) and provides for subsequent payout in accordance with the same vesting schedule in effect for those option shares. In addition, all unvested shares outstanding under the 1992 Plan will immediately vest, except to the extent that our repurchase rights with respect to those shares are to be assigned to the successor corporation or otherwise continued in effect. The Board or Option Committee will have complete discretion to grant one or more options which will become exercisable for all the option shares in the event the optionee’s service with us or the successor entity is terminated (actually or constructively) within a designated period following a change in control transaction in which those options are assumed or otherwise continued in effect.
The Board or Option Committee will have the discretion to structure one or more option grants under the 1992 Plan so that those options will vest immediately upon a change in control, whether or not the options are to be assumed or otherwise continued in effect.
All options granted under the 1999 Plan as amended and restated, will automatically accelerate in full and will be exercisable for a period of at least 10 days prior to the closing in the event of: (i) a merger or consolidation in which the Company is not the surviving corporation; (ii) a reverse merger in which the Company is the surviving corporation but the shares of the Company’s common stock outstanding immediately preceding the merger are converted by virtue of the merger into other property, whether in the form of securities, cash or otherwise, or (iii) any other capital reorganization in which more than fifty percent (50%) of the shares of the Company entitled to vote are exchanged. Such options shall be terminated if not exercised prior to the closing of such transaction; provided, however, that in no event shall any such accelerated vesting or termination of the options occur in connection with a transaction effected solely for the purpose of changing the situs of the Company’s incorporation (e.g. from Delaware to California).
All options granted under the 1993 Directors Plan, as amended and restated, will automatically accelerate in full in the event of: (i) a merger or consolidation in which the Company is not the surviving corporation; (ii) a reverse merger in which the Company is the surviving corporation but the shares of the Company’s common stock outstanding immediately preceding the merger are converted by virtue of the merger into other property, whether in the form of securities, cash or otherwise, or (iii) any other capital reorganization in which more than fifty percent (50%) of the shares of the Company entitled to vote are exchanged at the time during which such option may be exercised shall be accelerated and the options terminated if not exercised prior to such event. In the event of a dissolution or liquidation of the Company, any outstanding options shall terminate if not exercised prior to such event.
87
Director Compensation
Employee directors do not receive any separate compensation for their Board activities although service on the Board may be considered when establishing their compensation as employees. Non-employee Directors receive the compensation described below.
Non-employee Directors currently receive a fixed sum of $20,000 in cash compensation per year, payable in quarterly installments, for service on the Board of Directors. In addition, the Chairman of the Audit Committee is paid $4,000 per year in cash compensation, and the Chairman of the Compensation Committee is paid $2,000 in cash compensation per year. The designated Audit Committee financial expert receives an additional $4,000 in cash compensation per year. Non-employee Directors may also be reimbursed for certain expenses in connection with attendance at Board and committee meetings.
Non-employee Directors are eligible to receive options under the 1993 Non-employee Directors’ Stock Option Plan, as amended and restated, (the “Directors’ Plan”) and under our 1999 Stock Option Plan, as amended and restated. A total of 200,000 shares of common stock have been reserved for issuance under the Directors’ Plan. Under the Directors’ Plan, each person that is elected for the first time as a director and who is not otherwise employed by us or our affiliates (a “Non-employee Director”) is granted an option to purchase 16,000 shares of common stock upon the date of his or her election to the Board. At each annual meeting of stockholders, each person who is then a Non-employee Director and has been a Non-employee Director for at least three months is granted an option to purchase an additional 4,000 shares of common stock.
The following table provides information on compensation for Non-Employee Directors who served during fiscal year 2007.
| | | | | | | | |
| | | 2007 Director Compensation |
Name | | Fees
Earned or
Paid in
Cash ($) | | Option
Awards ($)
(7) | | All Other
Compensation ($) | | Total ($) |
John Bosch (1)(2)(3)(4) | | 26,000 | | 8,945 | | — | | 34,945 |
Uzia Galil (3) | | 20,000 | | 8,945 | | — | | 28,945 |
Dr. Shelley Harrison (5) | | 20,000 | | 46,653 | | 75,000 | | 141,653 |
Darrell Miller (1)(2) | | 20,000 | | 8,945 | | — | | 28,945 |
Abraham Ostrovsky (2)(3)(6) | | 24,000 | | 8,945 | | — | | 32,945 |
Dr. Harry J. Saal | | 20,000 | | 12,414 | | — | | 32,414 |
Notes to 2007 Director Compensation Table:
| (1) | Member of the Option Committee. |
| (2) | Member of the Audit Committee. |
| (3) | Member of the Compensation Committee. |
| (4) | Mr. Bosch is the Chair for the Audit Committee and the Compensation Committee |
| (5) | On July 19, 2007, the Company entered into an independent contractor services agreement with Dr. Shelley Harrison, a director of the Company, pursuant to which Dr. Harrison will receive compensation in consideration for consultancy and advisory services to the Company (For more information refer to Note 9 of our Notes to Consolidated Financial Statements). |
| (6) | Mr. Ostrovsky is the designated financial expert of the Audit Committee. |
| (7) | This column reflects the stock option awards expense taken in 2007 in accordance with FAS 123R assuming no forfeitures. |
88
COMPENSATION COMMITTEE REPORT
The Compensation Committee of the Board of Directors has reviewed and discussed the Compensation Discussion and Analysis with management. Based on such review and discussions, the Compensation Committee recommended to the Board of Directors that the Compensation Discussion and Analysis be included in the proxy statement for the 2007 annual meeting of stockholders. Mr. Ostrovsky is the designated financial expert of the Audit Committee
John Bosch
Abraham Ostrovsky
Uzia Galil
89
Item 12—Security ownership of certain beneficial owners and management and related stockholder matters
The following table sets forth information regarding the beneficial ownership of our common stock as of March 27, 2008 for: (i) each of our Directors; (ii) each of our Named Executive Officers; (iii) all of our executive officers and directors as a group, and (iv) all those persons known to us to be the beneficial owners of more than 5% of our outstanding common stock. At the close of business on March 27, 2008, there were 9,630,077 shares of our common stock outstanding. Except as otherwise indicated below, each person has sole voting power and sole investment power with respect to all shares beneficially owned by such person, subject to community property laws where applicable. Except as otherwise set forth below, the address of each named individual is our address as set forth herein.
The number and percentage of shares beneficially owned is determined in accordance with Rule 13d-3 of the Securities Exchange Act of 1934 and is not necessarily indicative of beneficial ownership for any other purpose. Shares of common stock that a person has a right to require within 60 days of March 27, 2008, or, with respect to 5% beneficial owners, as calculated in the applicable Schedule 13D or Schedule 13G, are deemed outstanding for purposes of computing the percentage ownership of that person, but are not deemed outstanding for purposes of computing the percentage ownership of any other person, except with respect to the percentage ownership of all directors and executive officers as a group, if applicable.
| | | | | |
| | | Beneficial Ownership | |
Stock Ownership of Executive Officers & Directors | | Number
of Shares | | Percent
Total (%)
(1) | |
Beneficial Owner | | | | | |
| | |
Zvi Alon (2) | | 1,841,298 | | 18.28 | % |
John Bosch (3) | | 21,976 | | * | |
Uzia Galil (4) | | 95,586 | | * | |
Shelley Harrison (5) | | 109,337 | | 1.12 | % |
Darrell Miller (6) | | 18,648 | | * | |
Abraham Ostrovsky (7) | | 27,673 | | * | |
Harry Saal (8) | | 6,333 | | * | |
Omer Regev (9) | | 15,000 | | * | |
Ido Hardonag (10) | | 78,434 | | * | |
Cheli Aflalo-Karpel (11) | | 27,066 | | * | |
George Bennett (12) | | — | | * | |
All executive officers and directors as a group (12 persons) (13) | | 2,241,351 | | 21.57 | % |
| | |
Stock Ownership of Other Beneficial Owners of More than 5% | | | | | |
Beneficial Owner | | | | | |
| | |
Trilogy, Inc. (14) | | 969,965 | | 10.07 | % |
| | |
Versata Enterprises, Inc. Mr. Joseph A. Liemandt c/o 6011 West Courtyard Drive Suite 300 Austin, TX 78730 | | | | | |
| | |
Spectrum Galaxy Fund Ltd. (15) Zeff Capital Partners, I, L.P. Zeff Holding Company, LLC Mr. Daniel Zeff c/o 50 California Street, Suite 1500 San Francisco, CA 94111 | | 643,644 | | 6.68 | % |
| | |
Riley Investment Management LLC (16) Riley Investment Partners Riley Investment Partners Master Fund, L.P. Mr. Bryant Riley c/o 11100 Santa Monica Blvd Suite 810 Los Angeles, CA 90025 | | 514,545 | | 5.34 | % |
90
| (1) | Based on 9,630,077 shares of common stock outstanding as of March 27, 2008. |
| (2) | Includes (i) 42,352 shares owned by Mr. Alon; (ii) 5,428 held by the Alon Family Foundation, with respect to which Mr. Alon has voting and investment control; (iii) 696,801 shares held by the Alon Living Trust, with respect to which Mr. Alon has voting and investment control; (iv) 653,799 shares held by the Elyad, LLC, representing approximately 6.79% of the outstanding shares of Common Stock, with respect to which Mr. Alon has voting rights, and (v) 442,918 shares issuable upon exercise of options that are exercisable within 60 days of March 27, 2008. |
| (3) | Includes 143 shares held by Mr. Bosch’s spouse. Mr. Bosch disclaims beneficial ownership of these shares. Also includes 21,833 shares issuable upon exercise of options that are exercisable within 60 days of March 27, 2008. |
| (4) | Includes 71,429 shares owned by Uzia and Ella Galil. Also includes 24,157 shares issuable upon exercise of options that are exercisable within 60 days of March 27, 2008. |
| (5) | Includes 109,337 shares issuable upon exercise of options that are exercisable within 60 days of March 27, 2008. |
| (6) | Includes 18,648 shares issuable upon exercise of options that are exercisable within 60 days of March 27, 2008. |
| (7) | Includes 20,530 shares issuable upon exercise of options that are exercisable within 60 days of March 27, 2008. |
| (8) | Includes 6,333 shares issuable upon exercise of options that are exercisable within 60 days of March 27, 2008. |
| (9) | Includes 15,000 shares issuable upon exercise of options that are exercisable within 60 days of March 27, 2008. |
| (10) | Includes 76,686 shares issuable upon exercise of options that are exercisable within 60 days of March 27, 2008. |
| (11) | Includes 27,066 shares issuable upon exercise of options that are exercisable within 60 days of March 27, 2008. |
| (12) | Mr. Bennett left the company in October 2007. |
| (13) | Includes 762,508 shares issuable upon exercise of options that are exercisable within 60 days of March 27, 2008. |
| (14) | Information presented is based on a Schedule 13D filed on March 13, 2008 by Trilogy, Inc., Versata Enterprises, Inc. and Joseph A. Liemandt. Mr. Liemandt is the President, Chief Executive Officer and Chairman of the board of directors of Trilogy, Inc. Versata Enterprises, Inc. is a wholly-owned subsidiary of Trilogy, Inc. According to the Schedule 13D, as of March 4, 2008, each of Trilogy, Inc., Versata Enterprises, Inc. and Joseph A. Liemandt reported that they beneficially owned 969,965 shares of our common stock, and that they had sole power to vote and to dispose of all of these shares. Additionally, they reported that they may be deemed to share the power to vote and to dispose 378,897 shares that were beneficially owned by Charles I. Frumberg and Emancipation Capital Master, Ltd. because Mr. Frumberg is a director of Trilogy, Inc. However, Trilogy, Inc., Versata Enterprises, Inc. and Mr. Liemandt each disclaim beneficial ownership of these 378,897 shares and also disclaim membership in a group with Emancipation Capital Master, Ltd. and Mr. Frumberg. |
| (15) | Information presented is based on Schedule 13G/A filed on February 12, 2008 by Daniel Zeff, Spectrum Galaxy Fund Ltd., Zeff Capital Partners I, L.P., and Zeff Holding Company, LLC. Mr. Zeff is the sole manager and member of Zeff Holding Company, LLC, which is the general partner of Zeff Capital Partners I, L.P. Mr. Zeff is also the investment manager of Zeff Capital Offshore Fund, a class of shares of Spectrum Galaxy Fund Ltd. According to the Schedule 13G/A, Mr. Zeff reported that he beneficially owned 643,644 shares of our common stock, and that he had sole power to vote and to dispose of these shares, comprised of 365,297 shares of our common stock that are also beneficially owned by Zeff Capital Partners I, L.P. and Zeff Holding Company, LLC and 278,347 shares of our common stock that are also beneficially owned by Spectrum Galaxy Fund Ltd. |
| (16) | Information presented is based on a Schedule 13D/A filed on December 17, 2007 by Riley Investment Management LLC, Riley Investment Partners Master Fund, L.P. and Bryan R. Riley. Mr. Riley is the sole manager of Riley Investment Management LLC, which is the general partner of Riley Investment Partners Master Fund, L.P. Riley Investment Management LLC, Riley Investment Partners Master Fund, L.P. and Mr. Riley reported they each beneficially owned 569,470 shares of our common stock, of which they had sole power to vote and to dispose of 514,545 shares. Additionally, each reported shared voting and dispositive power over 54,925 shares of common stock owned of by an investment advisory client of Riley Investment Management LLC in an account indirectly affiliated with Mr. Riley. |
91
Equity Compensation Plan Information
The following table reflects our equity compensation plan information as of December 31, 2007:
| | | | | | | | | | |
Plan Category | | Number of securities to
be issued upon exercise
of outstanding options,
warrants and rights | | | Weighted-average
exercise price of
outstanding options,
warrants and rights | | | Number of securities
remaining available for
issuance under equity
compensation plans
(excluding securities
reflected in column (a)) (1) | |
Equity compensation plans approved by security holders: | | | | | | | | | | |
1992 Plan (2) | | 1,038,346 | | | $ | 5.03 | | | 1,665,608 | (2) |
Directors’ Plan | | 126,960 | | | $ | 6.23 | | | 71,540 | |
1993 Employee Stock Purchase Plan (3) | | N/A | | | | N/A | | | 780,486 | (4) |
1999 Plan (5) | | 538,852 | | | $ | 4.38 | | | 104,201 | |
| | | | | | | | | | |
Aggregate total of all equity compensation plans approved by security holders | | 1,704,158 | (4) | | $ | 4.92 | (4) | | 2,621,835 | |
| (1) | Excludes shares of common stock issuable upon the exercise of the outstanding options, warrants and rights listed in the column (a). |
| (2) | On June 5, 2002, the stockholders approved an automatic share increase provision to the 1992 Plan pursuant to which the share reserve under the plan shall automatically increase on the first trading day of January in each calendar year. Beginning with the 2003 calendar year through the calendar year 2007, the share reserve under the plan shall increase by an amount equal to three percent (3%) of the total number of shares of the Company’s common stock outstanding on the last trading day of December in the immediately preceding calendar year, subject to a maximum annual increase of 285,714 shares. |
| (3) | On June 5, 2002, the stockholders approved an automatic share increase provision to the 1993 Employee Stock Purchase Plan pursuant to which the share reserve under the plan shall automatically increase on the first trading day of January in each calendar year. Beginning with the 2003 calendar year through the calendar year 2007, the share reserve under the plan shall increase by an amount equal to one percent (1%) of the total number of shares of the Company’s common stock outstanding on the last trading day of December in the immediately preceding calendar year, subject to a maximum annual increase of 107,143 shares. |
| (4) | Does not include shares to be issued under the Company’s 1993 Employee Stock Purchase Plan, which has as its purchase periods May 1 to October 31 and November 1 to April 30 of each year. The purchase price for shares under the purchase plan is 95% of the fair market value of the common stock on the last business day of the purchase period. Effective November 1, 2006, the Company indefinitely suspended the Purchase Plan primarily due to low employee participation resulting from the implementation of the ‘Safe Harbor’ provision of SFAS 123(R). The Company is evaluating the Purchase Plan however no recommendation has been made concerning the continuation of the Purchase Plan. |
| (5) | On June 15, 2005, the stockholders approved an increase in the number of shares of common stock available for issuance under the 1999 Plan by an additional 300,000 shares. |
Item 13—Certain relationships and related transactions
We have entered into indemnification agreements with certain officers and directors which provide, among other things, that we will indemnify such officer or director, under the circumstances and to the extent provided for therein, for expenses, damages, judgments, fines and settlements he or she may be required to pay in actions or proceedings to which he or she is or may be made a party by reason of his or her position as a director, officer or other agent of ours, and otherwise to the full extent permitted under Delaware law and our Bylaws.
On July 19, 2007, the Company entered into an independent contractor services agreement with Dr. Shelley Harrison, a director of the Company, pursuant to which Dr. Harrison will receive compensation in consideration for consultancy and advisory services to the Company. The terms of the agreement require the Company to pay
92
Dr. Harrison a fixed fee of $150,000 per year, and a one time grant to Dr. Harrison of an option to purchase 100,000 shares under the 1999 Plan, at an exercise price of $4.33 per share (which represents the quoted market price of the stock at the date of grant). The option will vest on a monthly basis over a four-year term and expires ten years from the date of issuance. The fair value of the 100,000 options from the 1999 Plan was determined using the Black-Scholes option pricing model with the following assumptions: stock price $4.33-$6.00; no dividends; risk free interest rate of 3.53%-4.64%; volatility of 47%-56%; and a contractual life of ten years.
The fair value of the option is subject to change over the vesting period of the option based on changes in the underlying assumptions. For the year ended December 31, 2007, the Company recorded approximately $30,000 in compensation expense under this agreement and recorded total aggregate cash and non-cash compensation of approximately $105,000 included in General and Administrative expense in the Condensed Consolidated Statements of Operations.
Item 14—Principal accountant fees and services
The following information describes the fees billed by Deloitte & Touche LLP to the Company for the fiscal years ended December 31, 2006 and 2007:
Fees Billed by Deloitte & Touche LLP during 2006 and 2007
The following fees were billed by Deloitte and Touche LLP, the Company’s independent registered public accounting firm, for services rendered in 2006 and 2007:
| | | | | | |
Fee Category | | 2007 | | 2006 |
Audit Fees | | $ | 559,161 | | $ | 583,100 |
Audit Related Fees | | | — | | | 4,000 |
Tax Fees | | | 201,503 | | | 15,567 |
All Other Fees | | | — | | | 8,000 |
| | | | | | |
Total Deloitte & Touche Fees | | $ | 762,503 | | $ | 610,667 |
| | | | | | |
Audit Fees: The amounts above represent amounts billed by Deloitte and Touche LLP for the audit of our annual financial statements, reviews of SEC Forms 10-Q and Form 10-K and statutory audit requirements at certain non-U.S. locations. The aggregate fees billed to the Company by Deloitte & Touche LLP, the member firms of Deloitte Touche Tohmatsu, and their respective affiliates (collectively, “Deloitte & Touche”) represent fees for professional services rendered for the audit of the Company’s annual consolidated financial statements for the fiscal years ended December 31, 2006 and 2007 and for the reviews of the financial statements included in the Company’s Quarterly Reports on Form 10-Q for 2006 and 2007 and consents and assistance with review of documents filed with the SEC.
Audit Related Fees: The amounts above represent reports in each of 2006 and 2007 that Deloitte & Touche provided in a non-U.S. location associated with employee tax benefits.
Tax Fees: The amounts above represent fees billed to us by Deloitte & Touche for 2006 and 2007 are for tax compliance, tax planning, and tax refund activity in U.S. and non-U.S. locations.
All Other Fees: The amounts above represent the aggregate fees billed by Deloitte & Touche for services rendered to the Company, other than the services described above under “Audit Fees”, “Audit Related Fees”, and “Tax Fees”, for 2007, included software fees, and support, installation and training fees.
We did not engage Deloitte & Touche to provide services to us regarding financial information systems during 2006 or 2007.
93
Audit Committee’s Pre-Approval Policies and Procedures
The Audit Committee pre-approved all of the services provided by the independent registered public accountants during the fiscal years 2006 and 2007. Following are the material elements of the Audit Committee’s pre-approval policies and procedures:
Audit Services and Fees: Annually, the Audit Committee will review and approve 100% of the audit services and estimated audit fees for the following year. The projections are updated quarterly and the Audit Committee will consider and, if appropriate, pre-approve any amounts exceeding the original estimates.
Non-Audit Services and Fees: Annually, and otherwise as necessary, the Audit Committee will review and pre-approve 100% of the non-audit services and estimated audit fees for such services. For recurring services, such as tax compliance and statutory filings the Audit Committee will review and approve the services and estimated total fees for such matters by category and location of service. The projections are updated quarterly and the Audit Committee will consider and, if appropriate, pre-approve any amounts exceeding the original estimates. For non-recurring services such as special tax projects, due diligence or other consulting, the Audit Committee will review and pre-approve the services and the estimated fees by individual project. The projections are updated quarterly and the Audit Committee will pre-approve any amounts exceeding the original estimates.
Should an engagement need pre-approval before the next Committee meeting, authority to grant such approval is delegated to the Audit Committee Chairman (or if he were unavailable, another Audit Committee member). Such approval would be reviewed with the entire Audit Committee at the next meeting.
The Audit Committee has considered whether the provision of the services described under All Other Fees above is compatible with maintaining Deloitte & Touche’s independence and has determined that such services have not adversely affected Deloitte & Touche’s independence.
94
PART IV
Item 15—Exhibits and financial statement schedules
(a)Consolidated Financial Statements, Consolidated Financial Statement Schedule and Exhibits
| | 1. | Consolidated Financial Statements. The consolidated financial statements, notes to consolidated financial statements and report of independent registered public accounting firm as listed in the accompanying “Index to Consolidated Financial Statements” are filed as part of this Annual Report. |
| | 2. | Consolidated Financial Statement Schedule. |
Schedule II Valuation and Qualifying Accounts and Reserves is filed as part of this Annual Report and is set forth on page 96.
Schedules not included have been omitted because they are either not required, not applicable, or the required information is included in the consolidated financial statements or the notes thereto.
| | 3. | Exhibits. The exhibits listed in the accompanying “Exhibit Index” are filed or incorporated by reference as part of this Annual Report. |
95
NETMANAGE, INC.
SCHEDULE II VALUATION AND QUALIFYING ACCOUNTS AND RESERVES
| | | | | | | | | | | | | | |
| | | Balance at
Beginning
of Period | | Charged to
Revenues,
Costs or
Expenses | | | Additions,
Deductions
and Write-
Offs | | | Balance at
End of
Period |
| | | (in thousands) |
Year ended December 31, 2005: | | | | | | | | | | | | | | |
Allowance for doubtful accounts and sales returns | | $ | 883 | | $ | (240 | ) | | $ | (384 | ) | | $ | 259 |
Year ended December 31, 2006: | | | | | | | | | | | | | | |
Allowance for doubtful accounts and sales returns | | $ | 259 | | $ | (123 | ) | | $ | (12 | ) | | $ | 124 |
Year ended December 31, 2007: | | | | | | | | | | | | | | |
Allowance for doubtful accounts and sales returns | | $ | 124 | | $ | 55 | | | $ | (73 | ) | | $ | 106 |
| | | | | | | | | | | | | | | | | |
| | | Balance at
Beginning
of Period | | Reserve
Provided | | Reserve
Utilized | | | Additions/
Deduction | | | Balance at
End of
Period |
| | | (in thousands) |
FTP Restructuring Reserve | | | | | | | | | | | | | | | | | |
Year ended December 31, 2005 | | $ | 369 | | $ | — | | $ | (170 | ) | | $ | 120 | | | $ | 319 |
Year ended December 31, 2006 | | $ | 319 | | $ | — | | $ | (161 | ) | | $ | 174 | | | $ | 332 |
Year ended December 31, 2007 | | $ | 332 | | $ | — | | $ | (377 | ) | | $ | 408 | | | $ | 363 |
NetManage Restructuring Reserve (August 2002) | | | | | | | | | | | | | | | | | |
Year ended December 31, 2005 | | $ | 40 | | $ | — | | $ | (49 | ) | | $ | 9 | | | $ | — |
NetManage Restructuring Reserve (January 2003) | | | | | | | | | | | | | | | | | |
Year ended December 31, 2005 | | $ | 287 | | $ | — | | $ | (56 | ) | | $ | (187 | ) | | $ | 44 |
Year ended December 31, 2006 | | $ | 44 | | $ | — | | $ | (26 | ) | | $ | 7 | | | $ | 25 |
Year ended December 31, 2007 | | $ | 25 | | $ | — | | $ | (11 | ) | | $ | (14 | ) | | $ | — |
NetManage Restructuring Reserve (February 2007) | | | | | | | | | | | | | | | | | |
Year ended December 31, 2007 | | $ | — | | $ | 1,973 | | $ | (1,560 | ) | | $ | 127 | | | $ | 540 |
96
SIGNATURES
Pursuant to the requirements of Section 13 or 15(d) of the Securities Exchange Act of 1934, the Registrant has duly caused this Annual Report on Form 10-K to be signed on its behalf by the undersigned, thereunto duly authorized on the 31st day of March 2008.
| | |
| NETMANAGE, INC. |
| |
| By: | | /s/ OMER REGEV |
| | Omer Regev, Chief Financial Officer and Vice President of Finance (On behalf of the registrant and as Principal Financial and Accounting Officer) |
Pursuant to the requirements of the Securities Exchange Act of 1934, this report has been signed below by the following persons on behalf of the Registrant and in the capacities and on the dates indicated.
| | | | |
Signature | | Title | | Date |
| | |
/s/ ZVI ALON Zvi Alon | | Chairman of the Board, President and Chief Executive Officer (Principal Executive Officer) | | March 31, 2008 |
| | |
/s/ JOHN BOSCH John Bosch | | Director | | March 31, 2008 |
| | |
/s/ UZIA GALIL Uzia Galil | | Director | | March 31, 2008 |
| | |
/s/ SHELLEY HARRISON Shelley Harrison | | Director | | March 31, 2008 |
| | |
/s/ DARRELL MILLER Darrell Miller | | Director | | March 31, 2008 |
| | |
/s/ ABRAHAM OSTROVSKY Abraham Ostrovsky | | Director | | March 31, 2008 |
| | |
/s/ HARRY SAAL Harry Saal | | Director | | March 31, 2008 |
97
EXHIBIT INDEX
| | |
Exhibit
Number | | Exhibit Title |
| |
| 2.1 | | Agreement and Plan of Reorganization among the Registrant, NetManage Acquisition Corporation, Syzygy Communications, Inc. and the Designated Shareholders, dated October 16, 1995.(1) |
| |
| 2.2 | | Agreement and Plan of Reorganization among the Registrant, NetManage Acquisition Corporation and AGE Logic, Inc., dated November 17, 1995.(1) |
| |
| 2.3 | | Stock Purchase Agreement by and among the Registrant, Network Software Associates, Inc. a California corporation, NetSoft, a California corporation, holders of securities of NSA and holders of securities of NetSoft, dated as of July 8, 1997.(2) |
| |
| 2.4 | | Agreement and Plan of Reorganization by and among the Registrant, Amanda Acquisition Corp. and FTP Software, Inc., dated as of June 15, 1998, as amended as of June 30, 1998 and July 14, 1998.(3) |
| |
| 2.5 | | Acquisition Agreement by and among Registrant, NetManage Bid Co., Preston Delaware Acquisition Corporation and Simware Inc., dated as of September 26, 1999.(4) |
| |
| 2.6 | | Agreement and Plan of Merger by and among Registrant, NetManage Acquisition Corporation and Wall Data Incorporated, dated October 20, 1999.(5) |
| |
| 2.7 | | Stock Purchase Agreement by and among the Registrant, Librados, Inc., a Delaware corporation, and holders of securities of Librados, Inc., dated as of September 22, 2004.(6) |
| |
| 2.8 | | Agreement and Plan of Merger by and among the Registrant, Rocket Software, Inc. and Eastern Software, Inc., dated as of December 11, 2007.(15) |
| |
| 2.9 | | Amendment No. 1 to Agreement and Plan of Merger by and among the Registrant, Rocket Software, Inc. and Eastern Software, Inc., dated as of January 18, 2008.(16) |
| |
| 2.10 | | Amendment No. 2 to Agreement and Plan of Merger by and among the Registrant, Rocket Software, Inc. and Eastern Software, Inc., dated as of February 8, 2008.(17) |
| |
| 2.11 | | Notice of Termination of Agreement and Plan of Merger dated February 29, 2008.(18) |
| |
| 3.1 | | Restated Certificate of Incorporation of the Registrant filed June 9, 2004.(8) |
| |
| 3.2 | | Amended and Restated Bylaws of NetManage, Inc.(19) |
| |
| 4.1 | | Form of Common Stock certificate.(7) |
| |
| 4.2 | | Preferred Shares Rights Agreement, among the Registrant and the parties named therein, dated as of July 24, 1993 as amended May 7, 1999.(7) |
| |
| 4.3 | | Form of Certificate of Designations of Rights, Preferences and Privileges of Series A Participating Preferred Stock.(7) |
| |
| 4.4 | | Form of Rights Certificate.(20) |
| |
| 4.5 | | Registration Rights Agreement by and among the Registrant, and holders of securities of Librados, Inc. dated October 22, 2004 (6) |
| |
| 10.1 | | Form of Indemnity Agreement entered into among the Registrant and our directors and officers.(13) |
| |
| 10.2* | | Registrant’s 1992 Stock Option Plan, as amended and restated, including forms of option agreements.(9) |
| |
| 10.3* | | Registrant’s 1993 Non-Employee Directors Stock Option Plan, as amended, including form of option agreements.(10) |
| |
| 10.4* | | Registrant’s 1993 Employee Stock Purchase Plan, as amended and restated, including form of offering document.(9) |
| | |
Exhibit
Number | | Exhibit Title |
| 10.5 | | Lease between the Registrant and Stevens Creek Office Center Associates, dated June 15, 2004 (6) |
| |
| 10.6 | | Agreement between NetManage, Ltd., Elron Electronic Industries, Ltd., and NetVision, Ltd., dated July 1, 1995.(7) |
| |
| 10.7* | | Registrant’s 1999 Non-Statutory Stock Option Plan, including form of option agreements.(11) |
| |
| 10.8* | | Independent Services Agreement by and between NetManage, Inc. and Dr. Shelley Harrison dated July 19, 2007.(12) |
| |
| 10.9* | | Form of Key Employee Retention and Severance Benefits Agreement.(14) |
| |
| 14.1 | | Code of Business Conduct (21) |
| |
| 21.1** | | Subsidiaries of the Registrant |
| |
| 23.1** | | Consent of Independent Registered Public Accounting Firm |
| |
| 31.1** | | Certification of the Chief Executive Officer pursuant to Rule 13a-14(a)/15d-14(a) as adopted pursuant to Section 302 of the Sarbanes-Oxley Act of 2002. |
| |
| 31.2** | | Certification of the Chief Financial Officer pursuant to Rule 13a-14(a)/15d-14(a) as adopted pursuant to Section 302 of the Sarbanes-Oxley Act of 2002. |
| |
| 32.1** | | Certification of Chief Executive Officer pursuant to 18 U.S.C. Section 1350, as adopted pursuant to Section 906 of the Sarbanes-Oxley Act of 2002. |
| |
| 32.2** | | Certification of Chief Financial Officer pursuant to 18 U.S.C. Section 1350, as adopted pursuant to Section 906 of the Sarbanes-Oxley Act of 2002. |
| (1) | | Incorporated by reference to the exhibits filed with the Registrant’s Form 10-K for the year ended December 31, 1995. |
| (2) | | Incorporated by reference to Exhibit 2.1 filed with the Registrant’s Form 8-K dated July 29, 1997 (File No. 000-22158). |
| (3) | | Incorporated by reference Exhibit 2.1 filed with the Registrant’s Registration Statement on Form S-4 filed on July 15, 1998 (File No. 333-59101). |
| (4) | | Incorporated by reference to Exhibit 2.1 filed with the Registrant’s Form 8-K dated December 23, 1999 (File No. 000-22158). |
| (5) | | Incorporated by reference to Exhibit 2.1 filed with the Registrant’s Form 8-K dated January 12, 2000 (File No. 000-22158). |
| (6) | | Incorporated by reference to the exhibits filed with the Registrant’s Form 10-Q for the quarter ended September 30, 2004 (File No. 000-22158). |
| (7) | | Incorporated by reference to the exhibits filed with the Registrant’s Registration Statement on Form S-1 (File No. 33-66460) dated July 24, 1993, as amended, which became effective September 20, 1993. |
| (8) | | Incorporated by reference to Exhibit 3.5 filed with the Registrant’s Form 10-Q for the quarter ended June 30, 2004 (File No. 000-22158). |
| (9) | | Incorporated by reference to the Exhibits filed with the Registrant’s Registration Statement on Form S-8 filed on April 9, 2003 (File No. 333-104397). |
| (10) | | Incorporated by reference to Exhibit 4.2 filed with the Registrant’s Registration Statement of Form S-8 filed on October 27, 2003 (File No. 333-110011). |
| (11) | | Incorporated by reference to Exhibit 10.18 filed with the Registrant’s Form 10-K for the year ended December 31, 1999 (File No. 000-22158). |
| (12) | | Incorporated by reference to Exhibit 10.19 filed with the Registrant’s Form 10-Q for the quarter ended June 30, 2003 (File No. 000-22158). |
| (13) | | Incorporated by reference to exhibit (e)(4) filed with the Registrant’s Schedule 14D-9 dated January 4, 2007 (File No. 005-43535). |
| (14) | | Incorporated by reference to Exhibit 10.1 filed with the Registrant’s Form 8-K dated December 7, 2007 (File No. 000-22158). |
| (15) | | Incorporated by reference to Exhibit 2.1 filed with the Registrant’s Form 8-K dated December 17, 2007 (File No. 000-22158). |
| (16) | | Incorporated by reference to Exhibit 2.1 filed with the Registrant’s Form 8-K dated January 21, 2008 (File No. 000-22158). |
| (17) | | Incorporated by reference to Exhibit 2.1 filed with the Registrant’s Form 8-K dated February 11, 2008 (File No. 000-22158). |
| (18) | | Incorporated by reference to Exhibit 99.1 filed with the Registrant’s Form 8-K dated February 29, 2008 (File No. 000-22158). |
| (19) | | Incorporated by reference to Exhibit 3.3 filed with the Registrant’s Form 10-K for the year ended December 31, 2004 (File No. 000-22158). |
| (20) | | Incorporated by reference to Exhibit 1 filed with the Registrant’s Form 8-A filed May 18, 1999 (File No. 000-22158). |
| (21) | | Incorporated by reference to Exhibit 14.1 filed with the Registrant’s Form 10-K for the year ended December 31, 2005 (File No. 000-22158). |
| * | | Compensatory plan or arrangement. |