Exhibit (c)(3)

1 CADUS CORPORATION Preliminary Financial Analysis Presentation to the Special Committee of the Board of Directors November 20, 2017

2 ALVAREZ & MARSAL VALUATION SERVICES, LLC • The following pages contain material that is being provided by Alvarez & Marsal Valuation Services, LLC (“A&M” or “Alvarez & Marsal”) in its capacity as an independent financial advisor to the Special Committee of the Board of Directors (the “Special Committee”) of Cadus Corporation (“Cadus” or the “Company”) . • The accompanying material was compiled and prepared on a confidential basis for the sole use of the Company and the Special Committee, and not with a view toward public disclosure and may not be disclosed, summarized, reproduced, disseminated or quoted from or otherwise referred to, in whole or in part, without the prior written consent of A&M . • The information utilized in preparing this presentation was obtained from the Company and public sources . Any estimates and projections contained herein have been prepared by or based on discussions with the senior management of the Company (“Management”) and involve numerous and significant subjective determinations, which may or may not prove to be correct . No representation or warranty, expressed or implied, is made as to the accuracy or completeness of such information and nothing contained herein is, or shall be relied upon as, a representation, whether as to the past or the future . A&M did not independently verify such information . • Because this material was prepared for use in the context of an oral presentation to the Special Committee, which is familiar with the business and affairs of the Company, neither the Company nor A&M, nor any of their respective legal or financial advisors or accountants take any responsibility for the accuracy or completeness of any of the material if used by persons other than the Special Committee . • These materials are not intended to represent an opinion but rather to serve as discussion materials for the Special Committee to review and as a partial summary of factors considered by A&M in its preliminary analysis . • No selected public company or selected transaction target used in our analysis is directly comparable to the Company . Disclaimer

3 TABLE OF CONTENTS I. Executive Summary II. Analytical Approach III. Financial Analysis IV. Summary of Financial Analyses Appendix A: Patent Information

4 EXECUTIVE SUMMARY • Cadus was incorporated under the laws of the State of Delaware in January 1992 and initially devoted substantially all of its resources to the development and application of novel yeast - based and other drug discovery technologies . – Cadus no longer seeks to develop, maintain, or license its drug discovery technologies . – Beginning in the fourth quarter of 2013 , Cadus began to explore opportunities to profit from purchasing land and residential homes for construction/renovation and resale in the United States . • The Company has predominantly concentrated its real estate acquisition, renovation, and construction activities in south Florida . – The Company owns 12 single - family residential zoned properties in Miami - Dade County, Florida and 1 vacant lot in East Hampton, New York . Cadus has completed renovation on 2 homes and started construction on 1 home . • As of September 30 , 2017 , Cadus had an accumulated deficit of approximately $ 40 . 6 million . – The Company’s losses have resulted principally from costs incurred in connection with its prior biomedical R&D activities, its current real estate activities, and from G&A costs associated with the Company’s operations . – As of September 30 , 2017 , Cadus had net operating loss (“NOL”) carryforwards of approximately $ 23 . 3 million and R&D credits of approximately $ 1 . 5 million . Company Business Description Source: Cadus Corporation Form 10 - K for the year ended December 31, 2016; draft Cadus Corporation Form 10 - Q for the quarter ended September 30, 2017.
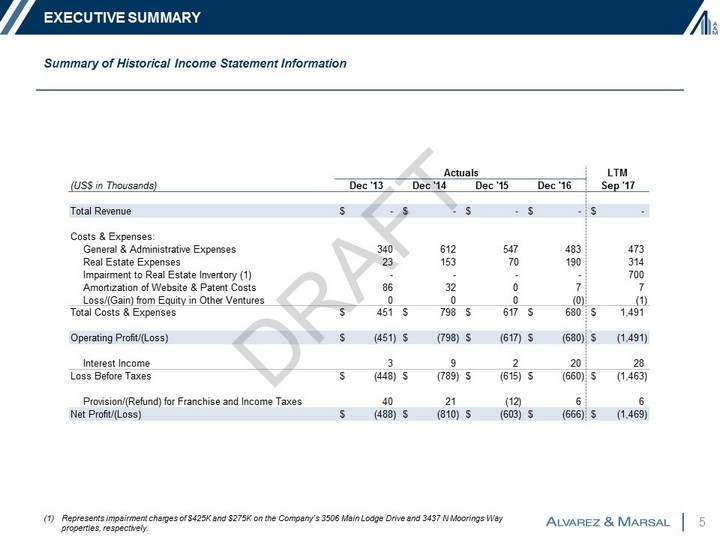
5 EXECUTIVE SUMMARY Summary of Historical Income Statement Information (1) Represents impairment charges of $425K and $275K on the Company’s 3506 Main Lodge Drive and 3437 N Moorings Way properties, respectively. Actuals LTM (US$ in Thousands) Dec '13 Dec '14 Dec '15 Dec '16 Sep '17 Total Revenue -$ -$ -$ -$ -$ Costs & Expenses: General & Administrative Expenses 340 612 547 483 473 Real Estate Expenses 23 153 70 190 314 Impairment to Real Estate Inventory (1) - - - - 700 Amortization of Website & Patent Costs 86 32 0 7 7 Loss/(Gain) from Equity in Other Ventures 0 0 0 (0) (1) Total Costs & Expenses 451$ 798$ 617$ 680$ 1,491$ Operating Profit/(Loss) (451)$ (798)$ (617)$ (680)$ (1,491)$ Interest Income 3 9 2 20 28 Loss Before Taxes (448)$ (789)$ (615)$ (660)$ (1,463)$ Provision/(Refund) for Franchise and Income Taxes 40 21 (12) 6 6 Net Profit/(Loss) (488)$ (810)$ (603)$ (666)$ (1,469)$

6 EXECUTIVE SUMMARY Summary of Historical Balance Sheet Information Actuals As of (US$ in Thousands) Dec '13 Dec '14 Dec '15 Dec '16 Sep '17 Assets: Real Estate Inventory - 30,184 32,717 35,122 36,050 Cash & Cash Equivalents 22,244 11,878 8,936 5,675 3,833 Interest Receivable 0 0 1 2 3 Prepaid & Other Assets 7 12 39 61 193 Investment in Other Venture (1) 193 193 193 193 194 Website, Net - - 20 13 8 Patents, Net (2) 32 0 - - - Total Assets 22,477$ 42,267$ 41,905$ 41,066$ 40,282$ Liabilities & Equity: Liabilities: Accrued Expenses & Other Liabilities 61 85 325 153 651 Total Liabilities 61$ 85$ 325$ 153$ 651$ Equity: Common Stock 133 264 264 264 264 Additional Paid-In Capital 59,847 80,292 80,292 80,292 80,292 Accumulated Deficit (37,263) (38,073) (38,677) (39,343) (40,626) Treasury Stock - At Cost (300) (300) (300) (300) (300) Total Equity 22,417$ 42,183$ 41,579$ 40,913$ 39,631$ Total Liabilities & Equity 22,477$ 42,267$ 41,905$ 41,066$ 40,282$ (1) Represents the Company’s 89.2% investment in Laurel Partners. (2) The Company currently holds 8 active patents associated with the Company’s legacy biotechnology business. Management has informed us that the Company does not expect to be able to utilize, license, sell, or otherwise derive value from these paten ts and that Management believes that these patents have no value.

7 EXECUTIVE SUMMARY Annotated Stock Chart for Cadus Corporation ( OTCPK : KDUS ) ( 1 ) (1) Source: Capital IQ; Bloomberg; Company filings; press releases . (2) Includes Management and members of the Board of Directors . Avg. Weekly Trading Volume (Nov. ’16 – Nov. ’17) = 75,821 shares Avg. Daily Trading Volume (Nov. ’16 – Nov. ’17) = 19,770 shares Number of Shareholders (as of Mar. ’17) = Approx. 46 (2) 500 1,000 1,500 2,000 $0.50 $1.00 $1.50 $2.00 $2.50 Oct. '13 Oct. '14 Oct. '15 Oct. '16 Oct. '17 Volume (in Thousands) Share Price Volume Price Sept. 10, 2017: Hurricane Irma hits Florida Oct. 1, 2015: Hurricane Joaquin hits Florida Oct. 7, 2016: Hurricane Matthew hits Florida Sept. 1, 2016: Hurricane Hermine hits Florida Jun. 6, 2014: Completed rights offering for $20.1 million ($1.53/share) Q4 2013: Company begins real estate operations Sept. 20, 2017: High River Limited Partnership and Barberry Corp. file an amended 13D announcing their intent to acquire the remaining 32.2% equity interest in Cadus Mar. 2014: Hunter C. Gary appointed as CEO

8 TABLE OF CONTENTS I. Executive Summary II. Analytical Approach III. Financial Analysis IV. Summary of Financial Analyses Appendix A: Patent Information

9 ANALYTICAL APPROACH • A&M utilized a Net Asset (“NA”) approach to evaluate Cadus . When employing the NA approach, adjustments are made to the book value of the Company’s assets and liabilities to approximate fair value, if necessary . Non - operating assets and liabilities are also considered . The value range of liabilities is then deducted from the value range of assets to arrive at an implied equity value reference range . • A&M also employed the Guideline Public Company (“GPC”) method of the market approach . In the GPC analysis, trading statistics of small (enterprise values of less than $ 1 billion) and mid sized (enterprise values between $ 1 billion and $ 2 . 5 billion) U . S . public companies in the homebuilding industry were reviewed and considered in order to develop an implied equity value reference range of Cadus . Adjustments were made to total equity value to account for the Company’s equity interest in Laurel Partners . • A&M separately evaluated the tax benefits associated with Cadus’ NOL carryforwards and R&D tax credits under three different illustrative scenarios : ( i ) a related - party buyer with effective control acquires Cadus and is able to immediately utilize the NOLs and R&D credits without a Section 382 limitation ; (ii) a third - party acquires Cadus and the tax attributes are subject to a Section 382 limitation ; and (iii) Cadus is not acquired and the value of the tax benefits are based on Cadus’ standalone expected taxable income . • A&M considered but ultimately did not rely upon the Guideline Precedent Transaction (“GPT”) method . – Consistent with our GPC analysis, we considered transactions that involved small and mid sized U . S . target companies in the homebuilding industry and that closed in the past 3 years . – Nearly all of the selected GPTs represented acquisitions of controlling interests in each target company, whereas the current transaction involves a minority interest in the Company . – Each of the selected GPTs likely included synergies resulting from increased scale, SG&A leverage, and asset diversity, which may not be achieved in an acquisition of Cadus . • A&M considered but ultimately did not rely upon the Discounted Cash Flow method since, per Management, the Company has not generated positive cash flow in the past 5 years and does not anticipated generating sustainable cash flow in the foreseeable future . Analytical Approach – Overview Note: For screening Guideline Public Companies and Guideline Precedent Transactions by size, A&M’s considered enterprise valu e amounts that excluded cash.

10 TABLE OF CONTENTS I. Executive Summary II. Analytical Approach III. Financial Analysis IV. Summary of Financial Analyses Appendix A: Patent Information

11 FINANCIAL ANALYSIS Net Asset Approach – Summary When employing the NA approach, adjustments are made to the book value of assets and liabilities to approximate fair value, if necessary . Non - operating assets and liabilities are also considered . Based on our analysis, we adjusted the following assets and liabilities of the Company : real estate inventory ; the investment in Laurel Partners ; Cadus’ website ; and certain non - operating assets . Real Estate Inventory : • Cadus owns the following 13 properties, which have a current book value of $ 36 . 1 million : 3506 Main Lodge Drive, Coconut Grove, FL 33133 3437 N Moorings Way, Coconut Grove, FL 33133 2535 Shelter Avenue, Miami Beach, FL 33140 700 88 th Street, Surfside, FL 33154 88 th Street, Surfside, FL 33154 (no street address) 1420 Biscaya Drive, Surfside, FL 33154 1211 Stillwater Drive, Miami Beach, FL 33141 2555 Shelter Avenue, Miami Beach, FL 33140 11400 N Bayshore Drive, North Miami, FL 33181 11404 N Bayshore Drive, North Miami, FL 33181 241 Atlantic Isle, Sunny Isles Beach, FL 33160 18970 North Bay Road, Sunny Isles Beach, FL 33160 65 East Hollow Road, East Hampton, NY 11937 • Of the Company’s 13 properties, 12 are located in Miami - Dade County, Florida and one is located in East Hampton, New York . The majority of the Company’s properties are luxury waterfront properties . • A&M considered each of the properties listed above . A&M’s analysis indicated an implied value reference range of the Company’s real estate inventory of between $ 36 . 1 million and $ 40 . 6 million . Source: Cadus Corporation Form 10 - K for the year ended December 31, 2016; draft Cadus Corporation Form 10 - Q for the quarter ended September 30, 2017. Completed Renovations Under Construction Vacant Lots
12 FINANCIAL ANALYSIS Net Asset Approach – Summary (cont’d) Investment in Laurel Partners : • A&M understands that the Company currently holds an 89 . 2 % equity investment in Laurel Partners, which is a joint venture with Carl C . Icahn that was established in 1996 to invest in biotechnology companies . Per our discussions with Management, Laurel Partners does not have any ongoing operations, and the only asset held by Laurel Partners is its $ 314 K cash balance . Accordingly, A&M concluded on a value of $ 280 K for Cadus’ investment in Laurel Partners, which is based on the Company’s share of Laurel Partners’ cash balance . Website : • A&M developed a value reference range for the website assuming that it has either no value or a value approximating its total development costs . Given that the Company recently completed its website in December 2015 at a total cost of $ 20 K, A&M applied a range of value between $ 0 to $ 20 K for the website . Non - Operating Assets and Liabilities : • Patents – A&M understands that the Company currently holds an active portfolio of patents that have not expired and are associated with Cadus’ legacy biotechnology business . Management has informed us that the Company does not, and does not expect to be able to, utilize, license, sell, or otherwise derive revenue from these patents and that Management believes these patents have no value . We have therefore assumed that the Company’s patents have no value . See Appendix A for further details . • Other Non - Operating Assets and Liabilities – Per Management’s representation, the Company does not have any other non - operating assets or liabilities . Source: First Amended and Restated Agreement of Limited Partnership of Laurel Partners Limited Partnership; Cadus Corporation Form 10 - K for the year ended December 31, 2016; draft Cadus Corporation Form 10 - Q for the quarter ended September 30, 2017; discussions with Management.

13 FINANCIAL ANALYSIS Net Asset Approach – Real Estate Inventory • Of the 12 properties in the Miami area, two are improved single family residential properties located in Coconut Grove, Florida . These properties were purchased in 2014 and have been recently renovated . One property is an under construction single family home located on Sunset Island II in Miami Beach, FL . Based on the documentation reviewed, the construction process is approximately 87 % complete as of October 25 , 2017 , and based on conversations with the local contractor, the estimated timing for the completion of the residence is December 15 , 2017 . • The rest of the properties are vacant single family residential lots . One interior lot without water frontage is located on Sunset Island II and the remaining lots have water frontage and are located in Surfside, Miami Beach, North Miami and Sunny Isles Beach . • In evaluating the real property, the following procedures were completed : – Gathered specific property information such as building sizes and land areas from Company documentation and on - line public data sources ; – Gathered information on comparable land and improved sales and listings from public on - line data providers ; and – Performed site visits for all the properties that are the subject of this report . • A&M utilized the sales comparison approach to provide a market value estimate for the improved properties . A&M researched and considered recent localized sales of improved properties that A&M deemed similar to the Companies improved properties in one or more respects and applied qualitative adjustments to arrive at an estimated value range . • Similarly, for the vacant residential lots, A&M also utilized the sales comparison approach by considering recent localized transactions involving properties that A&M deemed similar to the Company’s unimproved properties in one or more respects in each respective location . It is noted that a common practice in the market is to acquire land with improvements and subsequently demolish the improvements to arrive at a vacant parcel . A&M utilized sales of improved properties and considered them land transactions when it was evidenced that the improvements in place at the time of the acquisition were subsequently demolished and/or redeveloped within a reasonable timeframe from the acquisition . We understand the Company employed a similar approach in acquiring several of the subject properties . • This analysis indicated an aggregate implied value reference range for the subject properties of $ 36 . 1 million to $ 40 . 6 million .

14 FINANCIAL ANALYSIS Net Asset Approach – Real Estate Inventory (cont’d) (1) Some water frontage estimates are based on measurements from online aerial mapping. (2) Fully Loaded Cost is based on client documentation. As of September 30, 2017 and inclusive of September 30, 2017 impairment totaling $425k for 3506 Main Lodge and $275k for 3437 N Moorings Way. (3) A&M’s concluded value range is inclusive of a $400K downward adjustment for the remaining cost to complete the residential development. (US$ in Thousands) A dd r e s s C i ty S t a te I m p r o v e m e nt SF Land SF Water Frontage (1) Acq. Date Acq. Cost Fully Loaded Cost (2) Implied Reference Range Low High Totals $ 3 5 , 6 8 0 29,441 $ $ 3 6 , 1 0 0 $ 40 , 6 0 0 700 88th Street Surfside FL N A 15,099 75 0 5 / 0 2 / 1 4 3 , 2 0 0 3 , 3 5 2 2,000 2 , 2 0 0 0 88th Street (No Address) Surfside FL N A 15,107 75 0 5 / 0 2 / 1 4 Incl. in Lot Above Incl. in Lot Above 2,000 2 , 2 0 0 1420 Biscaya Drive Surfside FL N A 18,400 92 0 2 / 0 4 / 1 4 3 , 4 5 0 3 , 7 1 4 3,600 4 , 0 0 0 1211 Stillwater Drive Miami Beach FL N A 7,500 50 0 3 / 1 1 / 1 4 1 , 2 0 0 1 , 3 1 5 1,300 1 , 4 0 0 2535 Shelter Avenue (3) Miami Beach FL 5 , 02 2 12,000 NA 0 4 / 3 0 / 1 4 2 , 3 2 0 5 , 3 6 8 4,900 5 , 6 0 0 2555 Shelter Avenue Miami Beach FL NA 12,000 NA 0 4 / 3 0 / 1 4 2 , 4 2 0 2 , 5 6 2 2,800 3 , 1 0 0 11400 N Bayshore Drive North Miami FL N A 18,807 218 0 8 / 2 9 / 1 4 3 , 2 0 0 3 , 4 7 5 3,600 4 , 1 0 0 11404 N Bayshore Drive North Miami FL N A 14,100 94 0 8 / 2 9 / 1 4 2 , 4 0 0 2 , 5 4 2 2,500 2 , 7 0 0 241 Atlantic Isle Sunny Isles Beach FL NA 12,636 60 0 3 / 1 9 / 1 4 1 , 8 2 6 1 , 9 8 5 2,100 2 , 4 0 0 18970 North Bay Road Sunny Isles Beach FL N A 11,250 75 0 3 / 2 4 / 1 4 1 , 8 5 0 1 , 9 6 8 2,000 2 , 2 0 0 3506 Main Lodge Drive Coconut Grove FL 4 , 39 7 15,663 NA 0 2 / 0 4 / 1 4 2 , 2 0 0 3 , 0 7 7 3,200 3 , 4 0 0 3437 N Moorings Way Coconut Grove FL 4 , 07 1 12,464 NA 0 4 / 0 8 / 1 4 2 , 2 7 5 3 , 1 3 5 2,400 2 , 8 0 0 65 East Hollow Road East Hampton NY NA 40,946 NA 0 8 / 0 7 / 1 4 3 , 1 0 0 3 , 1 8 6 3,700 4 , 5 0 0

15 FINANCIAL ANALYSIS Net Asset Approach – Summary (1) Real estate inventory is adjusted for the estimated fair value of the Company’s properties. (2) See page 12. (3) See Appendix A. The NA approach indicated an implied aggregate equity value reference range of $ 39 . 8 million to $ 44 . 3 million for Cadus . Unadjusted Adjusted Sep '17 Plus: Non - Operating Assets P a t e n t s ( 3 ) - - - Implied Aggregate Equity Value Reference Range (Rounded) $ 39,631 $ 39,800 $ 44,300 (US$ in Thousands) Sep '17 Low High Assets: Real Estate Inventory (1) 3 6 , 0 5 0 3 6 , 100 40 , 6 0 0 Cash & Cash Equivalents 3 , 8 3 3 3 , 833 3 , 8 33 Interest Receivable 3 3 3 Prepaid & Other Current Assets 1 9 3 193 1 93 Investment in Laurel Partners (2) 1 9 4 280 2 80 Website 8 - 2 0 Less: Liabilities Accrued Expenses & Other Current Liabilities ( 6 5 1) ( 65 1 ) (6 5 1 )

16 FINANCIAL ANALYSIS • A&M selected 10 publicly traded companies that were deemed relevant to its analysis . Guideline companies were chosen because they were deemed to be similar to the Company in one or more respects . – In selecting guideline public companies, A&M focused on companies that are in the homebuilding industry and who own and trade residential properties . – Given the size of the Company, A&M focused on small (enterprise values less than $ 1 billion) and mid sized (enterprise values between $ 1 billion and $ 2 . 5 billion) public companies in its analysis . • A&M analyzed the financial performance of both Cadus and the publicly traded companies and selected valuation multiples based on a variety of factors including size, scale, asset diversity, operating history, profitability, growth, and business model . • A&M considered Price to Book Value (“Price / BV”) multiples in its analysis as this is the most relevant valuation metric for the industry in which Cadus operates . Guideline Public Company Analysis – Overview Note: None of the selected public companies are, of course, identical to Cadus. Accordingly, a complete analysis cannot be li mit ed to a quantitative review of the selected public companies and involves complex considerations and judgments concerning differences in financial and operating characteristics of such companies, as well as other factors that could affect their value relative to Ca dus.
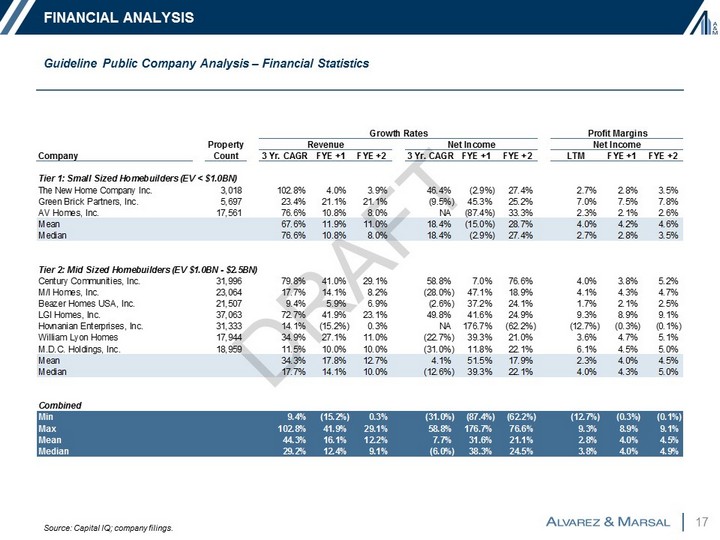
17 FINANCIAL ANALYSIS Guideline Public Company Analysis – Financial Statistics Source: Capital IQ; company filings. Property Company Count 3 Yr. CAGR FYE +1 FYE +2 3 Yr. CAGR FYE +1 FYE +2 LTM FYE +1 FYE +2 Tier 1: Small Sized Homebuilders (EV < $1.0BN) The New Home Company Inc. 3,018 102.8% 4.0% 3.9% 46.4% (2.9%) 27.4% 2.7% 2.8% 3.5% Green Brick Partners, Inc. 5,697 23.4% 21.1% 21.1% (9.5%) 45.3% 25.2% 7.0% 7.5% 7.8% AV Homes, Inc. 17,561 76.6% 10.8% 8.0% NA (87.4%) 33.3% 2.3% 2.1% 2.6% Mean 67.6% 11.9% 11.0% 18.4% (15.0%) 28.7% 4.0% 4.2% 4.6% Median 76.6% 10.8% 8.0% 18.4% (2.9%) 27.4% 2.7% 2.8% 3.5% Tier 2: Mid Sized Homebuilders (EV $1.0BN - $2.5BN) Century Communities, Inc. 31,996 79.8% 41.0% 29.1% 58.8% 7.0% 76.6% 4.0% 3.8% 5.2% M/I Homes, Inc. 23,064 17.7% 14.1% 8.2% (28.0%) 47.1% 18.9% 4.1% 4.3% 4.7% Beazer Homes USA, Inc. 21,507 9.4% 5.9% 6.9% (2.6%) 37.2% 24.1% 1.7% 2.1% 2.5% LGI Homes, Inc. 37,063 72.7% 41.9% 23.1% 49.8% 41.6% 24.9% 9.3% 8.9% 9.1% Hovnanian Enterprises, Inc. 31,333 14.1% (15.2%) 0.3% NA 176.7% (62.2%) (12.7%) (0.3%) (0.1%) William Lyon Homes 17,944 34.9% 27.1% 11.0% (22.7%) 39.3% 21.0% 3.6% 4.7% 5.1% M.D.C. Holdings, Inc. 18,959 11.5% 10.0% 10.0% (31.0%) 11.8% 22.1% 6.1% 4.5% 5.0% Mean 34.3% 17.8% 12.7% 4.1% 51.5% 17.9% 2.3% 4.0% 4.5% Median 17.7% 14.1% 10.0% (12.6%) 39.3% 22.1% 4.0% 4.3% 5.0% Combined Min 9.4% (15.2%) 0.3% (31.0%) (87.4%) (62.2%) (12.7%) (0.3%) (0.1%) Max 102.8% 41.9% 29.1% 58.8% 176.7% 76.6% 9.3% 8.9% 9.1% Mean 44.3% 16.1% 12.2% 7.7% 31.6% 21.1% 2.8% 4.0% 4.5% Median 29.2% 12.4% 9.1% (6.0%) 38.3% 24.5% 3.8% 4.0% 4.9% Revenue Profit MarginsGrowth Rates Net Income Net Income
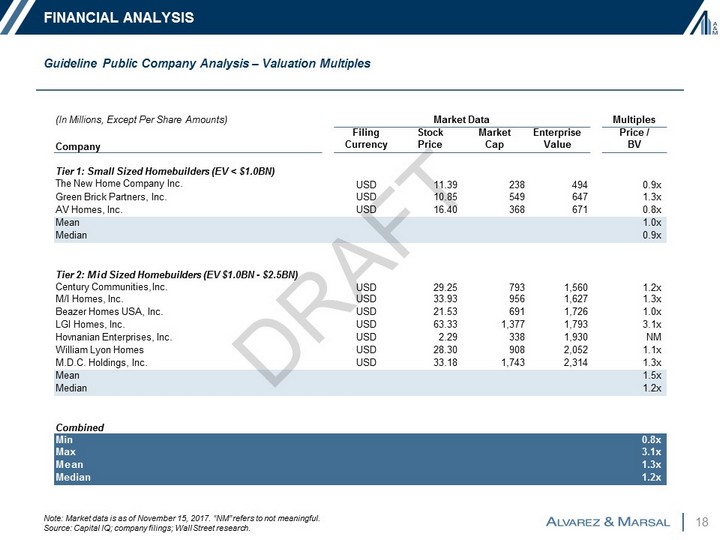
18 FINANCIAL ANALYSIS Guideline Public Company Analysis – Valuation Multiples Note: Market data is as of November 15, 2017. “NM” refers to not meaningful. Source : Capital IQ; company filings; Wall Street research. (In Millions, Except Per Share Amounts) Multiples Market Data Company Filing Currency Stock Price Market Cap Enterprise Value Price / BV Tier 1: Small Sized Homebuilders (EV < $1.0BN) The New Home Company Inc. USD 1 1 . 39 2 3 8 49 4 0 . 9 x Green Brick Partners, Inc. USD 1 0 . 8 5 5 49 647 1 . 3x AV Homes, Inc. USD 1 6 . 4 0 3 68 671 0 . 8x Mean 1 . 0 x Median 0 . 9 x Tier 2: Mid Sized Homebuilders (EV $1.0BN - $2.5BN) Century Communities, Inc. USD 2 9 . 2 5 7 93 1 , 560 1 . 2x M/I Homes, Inc. USD 3 3 . 93 9 5 6 1 , 62 7 1 . 3 x Beazer Homes USA, Inc. USD 2 1 . 5 3 6 91 1 , 726 1 . 0x LGI Homes, Inc. USD 6 3 . 33 1 , 3 7 7 1 , 79 3 3 . 1 x Hovnanian Enterprises, Inc. USD 2 . 2 9 3 38 1 , 930 N M William Lyon Homes USD 2 8 . 30 9 0 8 2 , 05 2 1 . 1 x M.D.C. Holdings, Inc. USD 3 3 . 1 8 1 , 7 43 2 , 314 1 . 3x Mean 1 . 5 x Median 1 . 2 x Combined Min 0 . 8 x Max 3 . 1 x Mean 1 . 3 x Median 1 . 2 x

19 Guideline Public Company Analysis – Conclusions FINANCIAL ANALYSIS • In selecting valuation multiples for the Company, A&M considered a variety of factors, including the following : – Cadus has very limited operating experience as a purchaser and reseller of residential properties relative to the selected guideline public companies ; – Relative to the selected guideline public companies, Cadus is much smaller in size and scale ; – Cadus is less diversified than the guideline public companies and has significant exposure to the Florida real estate market ; – Unlike the guideline public companies, the Company does not have general contractor operations and has to bear an additional cost on each property development ; – Cadus has incurred operating losses in each year since its inception with the exception of 2002 ; and – Cadus has not yet earned any revenue since it transitioned into its new line of business in Q 4 2013 . • After considering the factors above, A&M selected multiples that approximate the low end of the guideline public companies . The table below presents our selected valuation multiples and resulting implied aggregate equity value reference range for Cadus . (1) Excludes the book value of the Company's investment in Laurel Partners. (2) Represents the Company's 89.2% equity ownership interest in Laurel Partners. Laurel Partners holds approximately $314K in cas h and no liabilities. (US$ in Thousands) M e t r i c Company Statistic (1) Price / BV 0.8x - 1.0x $ 39,436 $ 3 1 , 5 4 9 - $ 3 9 , 4 3 6 Implied Aggregate Equity Value Reference Range $ 3 1 , 5 49 - $ 3 9 , 4 3 6 (+) Equity Interest in Laurel Partners (2) 2 80 2 8 0 Implied Aggregate Equity Value Reference Range (Rounded) $ 3 1 , 8 0 0 - $ 3 9 , 7 0 0 Equity Value Range Selected Multiple Range

20 Note: For illustrative purposes only. (1) Estimated Florida NOLs for the YTD period ended September 30, 2017 is based on amount of losses generated in 2016, prorated for the 9 months ended September 2017. (2) Estimated New York state/city NOLs for FY16 and the nine months ended September 30, 2017 based on amount of losses generated in 2015. For the YTD period ended September 30, 2017, the annual estimate was prorated. (3) Assumes current NOLs are not subject to a Section 382 limitation and that the acquiror has the appropriate taxable income to be able to fully utilize the NOLs and R&D credits. FINANCIAL ANALYSIS 2016 Federal NOL Carryforward Balance YTD 2017 Federal NOLs Total Federal NOL Carryforwards 2 1 , 4 13 6 0 5 $ 2 2 , 0 18 (x) Federal Tax Rate 3 5 . 0 % Total Federal NOL Tax Benefits (+) R&D Credit Tax Benefits $ 7,706 1 , 5 0 0 Total Federal NOL and R&D Credit Tax Benefits $ 9,206 2016 Florida NOL Carryforward Balance YTD 2017 Estimated Florida NOLs (1) 8 88 2 2 3 Florida State NOLs (x) Florida State Tax Rate $ 1,111 5.5% Total Florida State NOL Tax Benefits 2015 New York NOL Carryforward Balance 2016 Estimated New York NOLs (2) YTD 2017 Estimated New York NOLs (2) $ 61 49 49 37 Total New York State NOLs (x) New York State/City Tax Rate $ 1 3 5 13.0% T o t a l N e w Y o r k N O L T a x B e n e f i t s $ 1 8 Total NOL and R&D Credit Tax Benefits (3) $ 9,285 NOL and R&D Credit Analysis – Illustrative Scenario 1 : Acquisition by Controlling Shareholder – Immediate Utilization A&M considered the value of the tax benefits associated with NOLs and R&D credits assuming a related - party buyer with effective control acquires Cadus and is able to utilize them to offset its tax liabilities immediately without a 382 limitation . Under this illustrative scenario, the implied value to a potential acquiror of the tax benefits associated with the NOLs and R&D credits is approximately $ 9 . 3 million . (US$ in Thousands) FY17

21 A&M considered the value of the NOL carryforwards and R&D credits assuming a hypothetical third - party buyer were to acquire Cadus . In this illustrative scenario, the Company’s NOLs and R&D credits would be subject to the Section 382 limitation, and our analysis considers the expected timing of the tax benefits . Under this illustrative scenario, the value to a potential acquiror of the NOL and R&D credit tax benefits is approximately $ 1 . 6 million . NOL and R&D Credit Analysis – Illustrative Scenario 2 : Acquisition by a Third - Party – Section 382 Limitation Note: For illustrative purposes only. (1) Applies to all tax attributes – NOLs and R&D credits. (2) Based on the fair value of the two properties that Cadus anticipates selling in 2018 less the cost basis (original purchase p ric e plus any property improvements). (3) R&D credits cannot be used until after the NOL carryforwards have been fully utilized. R&D credits are set to expire by 2019. FINANCIAL ANALYSIS Federal NOLs and R&D Credits: (US$ in Thousands) FY17 FY18 FY19 FY20 FY21 FY22 FY23 FY24 FY25 FY26 FY27 FY28 FY29 FY30 FY31 Annual 382 Limitation: Shares Outstanding (in Thousands) 2 6 , 2 8 8 (x) Offering Price / Share $ 1.30 Total Equity Value $ 3 4 , 1 75 ( x ) A pp l i c ab l e F e dera l R a t e 1 . 9 % Annual 382 Limitation (1) $ 660 $ 8 3 $ 6 6 0 $ 66 0 $ 66 0 $ 66 0 $ 66 0 $ 6 6 0 $ 6 6 0 $ 66 0 $ 66 0 $ 66 0 $ 66 0 $ 6 6 0 $ 6 6 0 $ 6 6 0 ( + ) N e t R ea l i z a b le B u il t - I n G a in ( 2 ) - - 6 4 5 - - - - - - - - - - - - - Adjusted Annual 382 Limitation $ 660 $ 8 3 $ 1,305 $ 660 $ 66 0 $ 66 0 $ 66 0 $ 6 6 0 $ 6 6 0 $ 66 0 $ 66 0 $ 66 0 $ 66 0 $ 6 6 0 $ 6 6 0 $ 6 6 0 Scheduled Federal NOL Expiration - 8,949 5 , 810 275 - 267 5 14 4 0 5 82 344 - - 495 4 14 5 05 Scheduled Federal R&D Credit Expiration - 935 565 - - - - - - - - - - - - Federal NOL Balance 22,018 21 , 9 3 5 13 , 069 7 , 259 6 , 600 5 , 940 5 , 2 81 4 , 6 2 1 3 , 961 3 , 302 2 , 642 1 , 983 1 , 3 23 6 6 4 4 ( – ) NOLs Applied Against Current Income ( – ) Expired NOLs ( 83) - (1,305) (7,560) (660) (5,151) ( 660) - (660) - (660) - ( 6 60) - (6 6 0) - ( 66 0 ) - ( 66 0 ) - ( 660) - (660) - ( 6 60) - (6 6 0) - ( 4) - Ending NOL Balance $ 21,935 $ 13,069 $ 7,259 $ 6,600 $ 5,940 $ 5,281 $ 4,621 $ 3,961 $ 3,302 $ 2,642 $ 1,983 $ 1,323 $ 664 $ 4 $ - Federal NOLs Applied Against Income 83 1 , 3 0 5 660 660 660 660 6 60 6 6 0 660 660 660 660 6 60 6 6 0 4 (x) Federal Tax Rate 35.0% 35 . 0% 35 . 0% 35 . 0% 3 5 . 0 % 3 5 . 0 % 35 . 0 % 35 . 0% 35 . 0% 35 . 0% 3 5 . 0% 3 5 . 0 % 3 5 . 0 % 35 . 0% 35 . 0% Total Federal NOL Tax Benefits $ 29 $ 4 5 7 $ 23 1 $ 23 1 $ 23 1 $ 23 1 $ 2 3 1 $ 2 3 1 $ 23 1 $ 23 1 $ 23 1 $ 23 1 $ 2 3 1 $ 2 3 1 $ 1 (+) R&D Credit Tax Benefits (3) - - - - - - - - - - - - - - - Total Federal NOL and R&D Credit Tax Benefits $ 29 $ 4 5 7 $ 23 1 $ 23 1 $ 23 1 $ 23 1 $ 2 3 1 $ 2 3 1 $ 23 1 $ 231 $ 23 1 $ 23 1 $ 2 3 1 $ 2 3 1 $ 1

22 NOL and R&D Credit Analysis – Illustrative Scenario 2 : Acquisition by a Third - Party – Section 382 Limitation (cont’d) Note: For illustrative purposes only. (1) Discount rate is based on an estimated cost of equity of a hypothetical buyer in the homebuilding industry. FINANCIAL ANALYSIS Total Florida State NOL Tax Benefits $ 5 $ 57 $ - $ - $ - $ - $ - $ - $ - $ - $ - $ - $ - $ - - $ New York NOLs: Net Present Value of Tax Benefits $ 1,639 (US$ in Thousands) F Y 1 7 FY18 FY19 FY20 FY21 FY22 FY23 FY24 FY25 FY26 FY27 FY28 FY29 FY30 FY31 Florida State NOLs: S c h edu l e d F l or i d a S t a t e N O L E x p i ra t i o n - - - - - - - - - - - - - - - F l o r i d a St a t e N O L B a l an c e 1 , 1 1 1 1 , 0 2 8 - - - - - - - - - - - - - ( – ) N O L s A pp l i e d A ga i n s t C u rr en t I n c o m e ( 83 ) ( 1 , 0 2 8 ) - - - - - - - - - - - - - ( – ) E x p i r e d N O L s - - - - - - - - - - - - - - - Ending NOL Balance $ 1,028 $ - $ - $ - $ - $ - $ - $ - $ - $ - $ - $ - $ - $ - $ - F l o r i d a St a t e N O L s A pp l i e d A ga i n s t I n c o m e 8 3 1 , 0 2 8 - - - - - - - - - - - - - ( x ) F l or i d a S t a t e T a x R a t e 5 . 5% 5.5% 5 . 5% 5 . 5% 5 . 5% 5 . 5 % 5 . 5% 5 . 5% 5 . 5% 5 . 5 % 5 . 5 % 5 . 5 % 5 . 5 % 5 . 5 % 5 . 5 % Scheduled New York NOL Expiration - - - - - - - - - - - - - - - New York NOL Balance 1 3 5 5 2 - - - - - - - - - - - - - ( – ) NOLs Applied Against Current Income ( 83 ) ( 5 2 ) - - - - - - - - - - - - - ( – ) Expired NOLs - - - - - - - - - - - - - - - Ending NOL Balance $ 52 $ - $ - $ - $ - $ - $ - $ - $ - $ - $ - $ - $ - $ - $ - New York NOLs Applied Against Income 8 3 5 2 - - - - - - - - - - - - - (x) New York State/City Tax Rate 13 . 0% 13.0% 13 . 0% 13 . 0% 1 3 . 0 % 1 3 . 0 % 1 3 . 0 % 13 . 0% 13 . 0% 13 . 0% 1 3 . 0% 1 3 . 0 % 1 3 . 0 % 13 . 0% 13 . 0% Total New York NOL Tax Benefits $ 1 1 $ 7 $ - $ - $ - $ - $ - $ - $ - $ - $ - $ - $ - $ - $ - Total NOL and R&D Credit Tax Benefits $ 44 $ 5 2 0 $ 23 1 $ 23 1 $ 23 1 $ 23 1 $ 2 3 1 $ 2 3 1 $ 23 1 $ 23 1 $ 23 1 $ 23 1 $ 2 3 1 $ 2 3 1 $ 1 Partial Period Factor 1 . 0 0 1 . 0 0 1 . 0 0 1 . 0 0 1 . 0 0 1 . 0 0 1 . 0 0 1 . 0 0 1 . 0 0 1 . 0 0 1 . 00 1 . 00 1 . 00 1 . 0 0 1 . 0 0 Discount Period 0 . 06 0 . 6 3 1 . 63 2 . 63 3 . 63 4 . 63 5 . 63 6 . 6 3 7 . 63 8 . 63 9 . 63 10 . 6 3 1 1 . 63 1 2 . 6 3 13 . 6 3 Present Value Factor (1) 15.5% 0 . 9 9 10 0 . 91 3 7 0 . 7911 0 . 6849 0 . 5 930 0 . 5 134 0 . 4 4 45 0 . 38 4 9 0 . 3332 0 . 2885 0 . 2 498 0 . 2 163 0 . 1 8 72 0 . 1 6 21 0 . 14 0 4 PV of Tax Benefit Associated with NOLs and R&D Credits $ 44 $ 4 7 5 $ 18 3 $ 15 8 $ 13 7 $ 11 9 $ 1 0 3 $ 8 9 $ 7 7 $ 6 7 $ 5 8 $ 5 0 $ 4 3 $ 3 7 $ 0
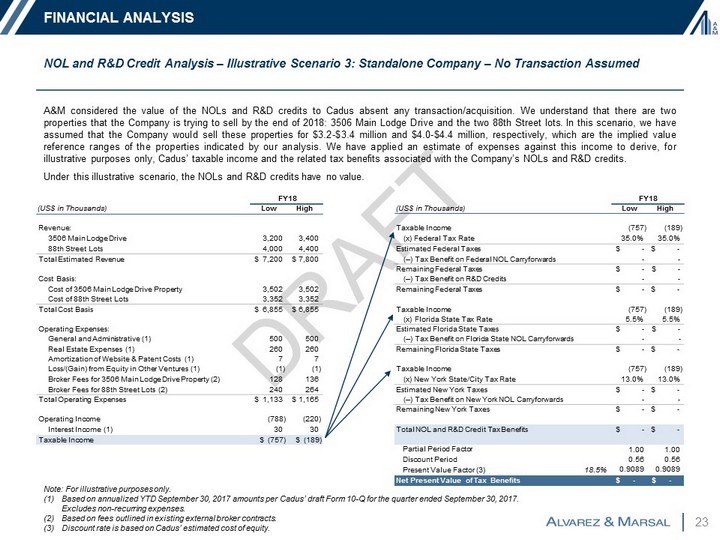
23 A&M considered the value of the NOLs and R&D credits to Cadus absent any transaction/acquisition . We understand that there are two properties that the Company is trying to sell by the end of 2018 : 3506 Main Lodge Drive and the two 88 th Street lots . In this scenario, we have assumed that the Company would sell these properties for $ 3 . 2 - $ 3 . 4 million and $ 4 . 0 - $ 4 . 4 million, respectively, which are the implied value reference ranges of the properties indicated by our analysis . We have applied an estimate of expenses against this income to derive, for illustrative purposes only, Cadus’ taxable income and the related tax benefits associated with the Company’s NOLs and R&D credits . Under this illustrative scenario, the NOLs and R&D credits have no value . NOL and R&D Credit Analysis – Illustrative Scenario 3 : Standalone Company – No Transaction Assumed Note: For illustrative purposes only. (1) Based on annualized YTD September 30, 2017 amounts per Cadus’ draft Form 10 - Q for the quarter ended September 30, 2017. Excludes non - recurring expenses. (2) Based on fees outlined in existing external broker contracts. (3) Discount rate is based on Cadus’ estimated cost of equity . FINANCIAL ANALYSIS F Y 1 8 F Y 1 8 (US$ in Thousands) Low High (US$ in Thousands) Low H i gh Partial Period Factor Discount Period Present Value Factor (3) 18 . 5 % 1 . 0 0 1 . 00 0 . 5 6 0 . 56 0 . 908 9 0 . 9089 Net Present Value of Tax Benefits $ - $ - Revenue: Taxable Income (757) (189) 3506 Main Lodge Drive 3 , 200 3 , 4 0 0 (x) Federal Tax Rate 35 . 0 % 35.0% 88th Street Lots 4 , 000 4 , 4 0 0 Estimated Federal Taxes $ - $ - Total Estimated Revenue $ 7,200 $ 7,800 ( – ) Tax Benefit on Federal NOL Carryforwards - - Cost Basis: Remaining Federal Taxes ( – ) Tax Benefit on R&D Credits $ - - $ - - Cost of 3506 Main Lodge Drive Property 3 , 502 3 , 5 0 2 Remaining Federal Taxes $ - $ - Cost of 88th Street Lots 3 , 352 3 , 3 5 2 Total Cost Basis $ 6,855 $ 6,855 Taxable Income (757) (189) (x) Florida State Tax Rate 5 . 5% 5.5% Operating Expenses: General and Administrative (1) 500 5 0 0 Estimated Florida State Taxes ( – ) Tax Benefit on Florida State NOL Carryforwards $ - - $ - - Real Estate Expenses (1) 260 2 6 0 Remaining Florida State Taxes $ - $ - Amortization of Website & Patent Costs (1) 7 7 Loss/(Gain) from Equity in Other Ventures (1) ( 1) ( 1) Taxable Income (757) (189) Broker Fees for 3506 Main Lodge Drive Property (2) 128 1 3 6 (x) New York State/City Tax Rate 13 . 0 % 13.0% Broker Fees for 88th Street Lots (2) 240 2 6 4 Estimated New York Taxes $ - $ - Total Operating Expenses $ 1,133 $ 1,165 ( – ) Tax Benefit on New York NOL Carryforwards - - Operating Income ( 78 8 ) ( 2 2 0) Remaining New York Taxes $ - $ - Interest Income (1) 30 3 0 Total NOL and R&D Credit Tax Benefits $ - $ - Taxable Income $ (757) $ (189)
24 TABLE OF CONTENTS I. Executive Summary II. Analytical Approach III. Financial Analysis IV. Summary of Financial Analyses Appendix A: Patent Information

25 SUMMARY OF FINANCIAL ANALYSES Our analyses indicated an implied total equity value reference range of $ 35 . 8 million to $ 42 . 0 million excluding the tax benefit associated with the Company’s NOLs and R&D credits . This results in an implied value reference range per share of Company common stock of $ 1 . 36 to $ 1 . 60 . In addition, the illustrative incremental value to a potential acquiror (under illustrative scenario 1 and 2 ) and to the Company (under illustrative scenario 3 ) associated with the tax benefits related to the Company’s NOLs and R&D credits is set forth below . Summary of Financial Analyses (1) Draft Cadus Corporation Form 10 - Q for the quarter ended September 30, 2017 . (US$ in Thousands, Except Per Share Amounts) Low H i gh Net Asset Approach 39 , 8 00 44 , 3 00 Guideline Public Company Method 31 , 8 0 0 39 , 7 0 0 Implied Equity Value Reference Range (Excl. NOLs and R&D Credits) $ 35 , 8 00 $ 42 , 0 0 0 Shares Outstanding (1) 26 , 2 88 26 , 2 88 Implied Per Share Value Reference Range $ 1 . 3 6 $ 1 . 6 0 (US$ in Thousands, Except Per Share Amounts) Scenario 1 Scenario 2 Scenario 3 (Low) Scenario 3 (High) PV of Tax Benefits Associated with NOLs and R&D Credits 9,285 1,639 - - Shares Outstanding (1) 26,288 26,288 26,288 2 6 , 2 8 8 Illustrative Per Share NOL and R&D Credit Value Range $ 0.35 $ 0.06 $ - $ -
26 TABLE OF CONTENTS I. Executive Summary II. Analytical Approach III. Financial Analysis IV. Summary of Financial Analyses Appendix A: Patent Information

27 APPENDIX A: PATENT INFORMATION • Based on our discussions with the founder of Cadus, the Company created over 40 drug discovery patents in the 1990 s, the majority of which have expired . As indicated in the chart at the bottom of the page, Cadus Technologies, Inc . (a subsidiary of Cadus) currently owns 7 active biotechnology - related patents and one patent that is within the expiration grace period . • Management indicated the following to us with regard to the Company’s patent portfolio and future patent operations : – The Company has no intention to utilize its current patents or to create new patents ; – Management no longer seeks to operate in the biotechnology industry, and the Company has not had any biotechnology operations since 2002 ; – The remaining patents have a short remaining life ; – The technologies that are supported by the remaining patents have been superseded to a large extent by more advanced competing technologies since the patents were granted ; and – Attempts to sell the patent portfolio in the 2000 s were unsuccessful . • After considering the factors above, we have assumed that the Company’s patent portfolio has no value . Summary Source: Management. Note: Patent information in the table above is as of September 2015. Some patents may have expired since this information was prepared. Patent No. Appl. No. Title Appl. Date Issue Date Exp. Date Status 7273747 10/267,074 Cell having amplified signal transduction pathway responses and uses therefor 10/8/02 09/25/07 02/20/21 Expired - Reinstatement available 7090991 10/404,018 System for detection of a functional interaction between a compound and a cellular signal transduction component 3/31/03 08/15/06 08/27/20 Active 7022513 10/200,013 Cell based signal generation 7/18/02 04/04/06 02/06/20 Active 7319009 10/277,607 Methods and compositions for identifying receptor effectors 10/22/02 01/15/08 11/23/19 Active (within grace period) 7081360 09/362,286 Expression of G protein-coupled receptors with altered ligand binding and/or coupling properties 7/27/99 07/25/06 09/15/19 Active 6251605 09/426,332 Yeast cells having mutations in Cav1 and uses therefor 10/25/99 06/26/01 10/27/18 Active 7611854 10/600,003 Yeast cells engineered to produce pheromone system protein surrogates, and uses therefor 6/18/03 11/03/09 06/22/18 Active 7361498 10/967,087 Yeast cells expressing modified G proteins and methods of use therefor 10/15/04 04/22/08 01/20/18 Active

28