Exhibit (c)(4)

1 CADUS CORPORATION Fairness Analysis Presentation to the Special Committee of the Board of Directors January 17, 2018 CONFIDENTIAL DRAFT – FOR DISCUSSION PURPOSES ONLY

2 ALVAREZ & MARSAL VALUATION SERVICES, LLC • The following pages contain material that is being provided by Alvarez & Marsal Valuation Services, LLC (“A&M” or “Alvarez & Marsal”) in its capacity as an independent financial advisor to the Special Committee of the Board of Directors (the “Special Committee”) of Cadus Corporation and its subsidiaries and affiliates (jointly and severally, “Cadus” or the “Company”) in connection with the Proposed Transaction, as defined herein . • The information utilized in preparing this presentation was obtained from the Company and public sources . Any estimates and projections contained herein have been prepared by or based on discussions with the senior management of the Company (“Management”) and involve numerous and significant subjective determinations, which may or may not prove to be correct . No representation or warranty, expressed or implied, is made as to the accuracy or completeness of such information and nothing contained herein is, or shall be relied upon as, a representation, whether as to the past or the future . A&M did not independently verify such information . • Because this material was prepared for use in the context of an oral presentation to the Special Committee, which is familiar with the business and affairs of the Company, neither the Company nor A&M, nor any of their respective legal or financial advisors or accountants take any responsibility for the accuracy or completeness of any of the material if used by persons other than the Special Committee . • These materials are not intended to represent an opinion but rather to serve as discussion materials for the Special Committee to review and as a partial summary of factors considered by A&M in connection with rendering its opinion . • No selected public company or selected transaction target used in our analysis is directly comparable to the Company . Disclaimer
3 TABLE OF CONTENTS I. Executive Summary II. Financial Analysis of the Proposed Transaction a) Analytical Approach b) Financial Analysis c) Summary of Financial Analyses III. Assumptions, Qualifications & Limiting Conditions Appendix A: Summary of Due Diligence Appendix B: Patent Information

4 EXECUTIVE SUMMARY Engagement Overview (1) Source: Cadus Corporation Form 10 - K for the year ended December 31, 2016; Cadus Corporation unaudited balance sheet for the year ended December 31, 2017. We understand that the Agreement and Plan of Merger (the “Agreement”), to be entered into among the Company, Starfire Holding Corporation (the “Acquiror”) and Cadus Merger Sub LLC, a wholly - owned subsidiary of the Acquiror (“Merger Sub”), provides for, among other things, the merger of Merger Sub with and into the Company (“the Proposed Transaction”), pursuant to which the Company will become a wholly - owned subsidiary of the Acquiror and each outstanding share of common stock of the Company not owned directly or indirectly by the Company or the Acquiror, other than dissenting shares, will be converted into the right to receive $ 1 . 61 per share, without interest (the “Consideration”) . For purposes of our Opinion, the term “Excluded Holders” refers to the Acquiror, Merger Sub and their respective affiliates, including, without limitation, Barberry Corp . and High River Limited Partnership . • Cadus was incorporated under the laws of the State of Delaware in January 1992 and initially devoted substantially all of its resources to the development and application of novel yeast - based and other drug discovery technologies . – Cadus no longer seeks to develop, maintain, or license its drug discovery technologies . – Beginning in the fourth quarter of 2013 , Cadus began to explore opportunities to profit from purchasing land and residential homes for construction/renovation and resale in the United States . • The Company has predominantly concentrated its real estate acquisition, renovation, and construction activities in south Florida . – The Company owns 12 single - family residential zoned properties in Miami - Dade County, Florida and 1 vacant lot in East Hampton, New York . Cadus has completed renovation on 2 homes and started construction on 1 home . • As of December 31 , 2017 , Cadus had an accumulated deficit of approximately $ 40 . 9 million . – The Company’s losses have resulted principally from costs incurred in connection with its prior biomedical R&D activities, its current real estate activities, and from G&A costs associated with the Company’s operations . – As of December 31 , 2017 , Cadus had estimated net operating loss (“NOL”) carryforwards of approximately $ 23 . 8 million and R&D credits of approximately $ 1 . 5 million . Proposed Transaction Company Business Description (1) Engagement The Special Committee of the Company has requested A&M to provide it with A&M’s opinion (the “Opinion”) as to the fairness, from a financial point of view, to the stockholders of the Company other than the Excluded Holders (as defined below) of the Consideration (as defined below) to be received by such stockholders (other than the Excluded Holders) in the Proposed Transaction (as defined below), without giving effect to any impact of the Proposed Transaction on any particular stockholder other than in its capacity as a stockholder .

5 EXECUTIVE SUMMARY Summary of Historical Income Statement Information (1) Represents impairment charges of $425K and $275K on the Company’s 3506 Main Lodge Drive and 3437 N Moorings Way properties, respectively. (US$ in Thousands) Actuals LTM Sep '17 Dec '13 Dec '14 Dec '15 Dec '16 Total Revenue $ - $ - $ - $ - $ - Costs & Expenses: General & Administrative Expenses 340 612 547 483 473 Real Estate Expenses 23 153 70 190 314 Impairment to Real Estate Inventory (1) - - - - 700 Amortization of Website & Patent Costs 86 32 0 7 7 Loss/(Gain) from Equity in Other Ventures 0 0 0 ( 0 ) ( 1 ) Total Costs & Expenses $ 451 $ 798 $ 617 $ 680 $ 1,491 Operating Profit/(Loss) $ (451) $ ( 798 ) $ ( 617 ) $ ( 680 ) $ (1,491) Interest Income 3 9 2 20 28 Loss Before Taxes $ (448) $ ( 789 ) $ ( 615 ) $ ( 660 ) $ (1,463) Provision/(Refund) for Franchise and Income Taxes 40 21 ( 12 ) 6 6 Net Profit/(Loss) $ (488) $ ( 810 ) $ ( 603 ) $ ( 666 ) $ (1,469)

6 EXECUTIVE SUMMARY Summary of Historical Balance Sheet Information (1) Represents the Company’s 89.2% investment in Laurel Partners. (2) The Company currently holds 8 patents associated with the Company’s legacy biotechnology business. Management has informed us that the Company does not expect to be able to utilize, license, sell, or otherwise derive value from these patents and th at Management believes that these patents have no value. (3) Represents an unaudited balance sheet provided by Management. Actuals (US$ in Thousands) Dec '13 Dec '14 Dec '15 Dec '16 Dec '17 (3) Assets: Real Estate Inventory - 30 , 18 4 32 , 71 7 35 , 12 2 36 , 43 9 Cash & Cash Equivalents 22 , 24 4 11 , 87 8 8 , 93 6 5 , 67 5 2 , 82 9 Interest Receivable 0 0 1 2 2 Prepaid & Other Assets 7 12 39 61 164 Investment in Other Venture (1) 193 193 193 193 195 Website, Net - - 20 13 7 Patents, Net (2) 32 0 - - - Total Assets $ 22 , 47 7 $ 42,267 $ 41 , 90 5 $ 41,066 $ 39 , 63 6 Liabilities & Equity: Liabilities: Accrued Expenses & Other Liabilities 61 85 325 153 319 Total Liabilities $ 61 $ 85 $ 325 $ 153 $ 319 Equity: Common Stock 133 264 264 264 264 Additional Paid - In Capital 59 , 84 7 80 , 29 2 80 , 29 2 80 , 29 2 80 , 29 2 Accumulated Deficit ( 37 , 263 ) ( 38 , 073 ) ( 38 , 677 ) ( 39 , 343 ) ( 40 , 939 ) Treasury Stock - At Cost ( 300 ) ( 300 ) ( 300 ) ( 300 ) ( 300 ) Total Equity $ 22 , 41 7 $ 42,183 $ 41 , 57 9 $ 40,913 $ 39 , 31 7 Total Liabilities & Equity $ 22 , 47 7 $ 42,267 $ 41 , 90 5 $ 41,066 $ 39 , 63 6

7 EXECUTIVE SUMMARY Annotated Stock Chart for Cadus Corporation (OTCQB : KDUS) ( 1 ) (1) Source: Capital IQ; Bloomberg; Company filings; press releases. (2) Includes Management and members of the Board of Directors. Avg. Weekly Trading Volume (FY2017) = 62,754 shares Avg. Daily Trading Volume (FY2017) = 17,221 shares Number of Shareholders (as of Mar. ’17) = Approx. 46 (2) 500 1,000 1,500 2,000 $0.50 $1.00 $1.50 $2.00 $2.50 Oct. '13 Oct. '14 Oct. '15 Oct. '16 Oct. '17 Volume (in Thousands) Share Price Volume Price Sept. 10, 2017: Hurricane Irma hits Florida Oct. 1, 2015: Hurricane Joaquin hits Florida Oct. 7, 2016: Hurricane Matthew hits Florida Sept. 1, 2016: Hurricane Hermine hits Florida Jun. 6, 2014: Completed rights offering for $20.1 million ($1.53/share) Q4 2013: Company begins real estate operations Sept. 20, 2017: High River Limited Partnership and Barberry Corp. file an amended 13D announcing their intent to acquire the remaining 32.2% equity interest in Cadus Mar. 2014: Hunter C. Gary appointed as CEO $0.95 Unaffected Share Price $1.56 Closing Price (1/12/18)

8 TABLE OF CONTENTS I. Executive Summary II. Financial Analysis of the Proposed Transaction a) Analytical Approach b) Financial Analysis c) Summary of Financial Analyses III. Assumptions, Qualifications & Limiting Conditions Appendix A: Summary of Due Diligence Appendix B: Patent Information
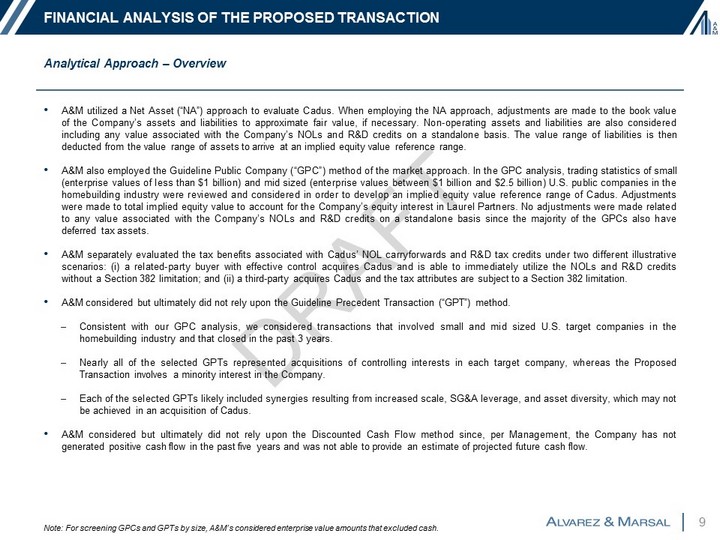
9 FINANCIAL ANALYSIS OF THE PROPOSED TRANSACTION • A&M utilized a Net Asset (“NA”) approach to evaluate Cadus . When employing the NA approach, adjustments are made to the book value of the Company’s assets and liabilities to approximate fair value, if necessary . Non - operating assets and liabilities are also considered including any value associated with the Company’s NOLs and R&D credits on a standalone basis . The value range of liabilities is then deducted from the value range of assets to arrive at an implied equity value reference range . • A&M also employed the Guideline Public Company (“GPC”) method of the market approach . In the GPC analysis, trading statistics of small (enterprise values of less than $ 1 billion) and mid sized (enterprise values between $ 1 billion and $ 2 . 5 billion) U . S . public companies in the homebuilding industry were reviewed and considered in order to develop an implied equity value reference range of Cadus . Adjustments were made to total implied equity value to account for the Company’s equity interest in Laurel Partners . No adjustments were made related to any value associated with the Company’s NOLs and R&D credits on a standalone basis since the majority of the GPCs also have deferred tax assets . • A&M separately evaluated the tax benefits associated with Cadus’ NOL carryforwards and R&D tax credits under two different illustrative scenarios : ( i ) a related - party buyer with effective control acquires Cadus and is able to immediately utilize the NOLs and R&D credits without a Section 382 limitation ; and (ii) a third - party acquires Cadus and the tax attributes are subject to a Section 382 limitation . • A&M considered but ultimately did not rely upon the Guideline Precedent Transaction (“GPT”) method . – Consistent with our GPC analysis, we considered transactions that involved small and mid sized U . S . target companies in the homebuilding industry and that closed in the past 3 years . – Nearly all of the selected GPTs represented acquisitions of controlling interests in each target company, whereas the Proposed Transaction involves a minority interest in the Company . – Each of the selected GPTs likely included synergies resulting from increased scale, SG&A leverage, and asset diversity, which may not be achieved in an acquisition of Cadus . • A&M considered but ultimately did not rely upon the Discounted Cash Flow method since, per Management, the Company has not generated positive cash flow in the past five years and was not able to provide an estimate of projected future cash flow . Analytical Approach – Overview Note: For screening GPCs and GPTs by size, A&M’s considered enterprise value amounts that excluded cash.
10 TABLE OF CONTENTS I. Executive Summary II. Financial Analysis of the Proposed Transaction a) Analytical Approach b) Financial Analysis c) Summary of Financial Analyses III. Assumptions, Qualifications & Limiting Conditions Appendix A: Summary of Due Diligence Appendix B: Patent Information

11 FINANCIAL ANALYSIS OF THE PROPOSED TRANSACTION Net Asset Approach – Summary When employing the NA approach, adjustments are made to the book value of assets and liabilities to approximate fair value, if necessary . Non - operating assets and liabilities are also considered . Based on our analysis, we adjusted the following assets and liabilities of the Company : real estate inventory ; the investment in Laurel Partners ; Cadus’ website ; and certain other non - operating assets . Real Estate Inventory : • Cadus owns the following 13 properties, which have a current book value of $ 36 . 4 million : 3506 Main Lodge Drive, Coconut Grove, FL 33133 3437 N Moorings Way, Coconut Grove, FL 33133 2535 Shelter Avenue, Miami Beach, FL 33140 700 88 th Street, Surfside, FL 33154 88 th Street, Surfside, FL 33154 (no street address) 1420 Biscaya Drive, Surfside, FL 33154 1211 Stillwater Drive, Miami Beach, FL 33141 2555 Shelter Avenue, Miami Beach, FL 33140 11400 N Bayshore Drive, North Miami, FL 33181 11404 N Bayshore Drive, North Miami, FL 33181 241 Atlantic Isle, Sunny Isles Beach, FL 33160 18970 North Bay Road, Sunny Isles Beach, FL 33160 65 East Hollow Road, East Hampton, NY 11937 • Of the Company’s 13 properties, 12 are located in Miami - Dade County, Florida and one is located in East Hampton, New York . The majority of the Company’s properties are luxury waterfront properties . • A&M considered each of the properties listed above . A&M’s analysis indicated an implied value reference range of the Company’s real estate inventory between $ 36 . 2 million and $ 40 . 9 million . Source: Cadus Corporation Form 10 - K for the year ended December 31, 2016; Cadus Corporation unaudited balance sheet for the year ended December 31, 2017. Completed Renovations Under Construction Vacant Lots

12 FINANCIAL ANALYSIS OF THE PROPOSED TRANSACTION Net Asset Approach – Summary (cont’d) Investment in Laurel Partners : • A&M understands that the Company currently holds an 89 . 2 % equity investment in Laurel Partners, which is a joint venture with Carl C . Icahn that was established in 1996 to invest in biotechnology companies . Per our discussions with Management, Laurel Partners does not have any ongoing operations, and the only asset held by Laurel Partners is its cash balance of $ 316 K . Accordingly, A&M concluded on a value of $ 282 K for Cadus’ investment in Laurel Partners, which is based on the Company’s share of Laurel Partners’ cash balance . Website : • A&M developed a value reference range for the website assuming that it has either no value or a value approximating its total development costs . Given that the Company recently completed its website in December 2015 at a total cost of $ 20 K, A&M incorporated a range of value between $ 0 to $ 20 K for the website . Other Non - Operating Assets and Liabilities : • NOL and R&D Credit Carryforwards – As of December 31 , 2017 , Cadus had estimated state and federal NOL carryforwards of approximately $ 23 . 8 million and R&D credits of approximately $ 1 . 5 million . Based on Management’s representation, A&M estimated the value of these tax credits to Cadus on a standalone basis by considering a hypothetical scenario in which seven properties that are currently listed for sale are sold in FY 2018 , the remaining properties are sold in FY 2019 , and enough taxable income is generated in FY 2020 to fully utilize the remaining available balances related to the existing NOL and R&D credits . A&M’s analysis indicated an implied value reference range of $ 1 . 1 million to $ 1 . 3 million for the Company’s NOLs and R&D credits in the aggregate . • Patents – A&M understands that the Company currently holds a portfolio of patents that have not expired and are associated with Cadus’ legacy biotechnology business . Management has informed us that the Company does not, and does not expect to be able to, utilize, license, sell, or otherwise derive revenue from these patents and that Management believes these patents have no value . We have therefore assumed that the Company’s patents have no value . See Appendix B for further details . • Per Management’s representation, the Company does not have any other non - operating assets or liabilities . Source: First Amended and Restated Agreement of Limited Partnership of Laurel Partners Limited Partnership; Laurel Partners g ene ral ledger trial balance for the year ended December 31, 2017; Cadus Corporation Form 10 - K for the year ended December 31, 2016; Cadus Corporation unaudited balance sheet for the year ended December 31, 2017; discussions with Management.

13 FINANCIAL ANALYSIS OF THE PROPOSED TRANSACTION Net Asset Approach – Real Estate Inventory • Of the 12 properties in the Miami area, two are improved single family residential properties located in Coconut Grove, Florida . These properties were purchased in 2014 and have been recently renovated . One property is an under construction single family home located on Sunset Island II in Miami Beach, FL . Based on the documentation reviewed, the construction process is approximately 98 % complete as of December 25 , 2017 , and based on communications with Management, construction is estimated to be completed in January 2018 . • The rest of the properties are vacant single family residential lots . One interior lot without water frontage is located on Sunset Island II and the remaining lots have water frontage and are located in Surfside, Miami Beach, North Miami and Sunny Isles Beach . • In evaluating the real property, the following procedures were completed : – Gathered specific property information such as building sizes and land areas from Company documentation and on - line public data sources ; – Gathered information on comparable land and improved sales and listings from public on - line data providers ; and – Performed site visits for all the properties that are the subject of this report . • A&M utilized the sales comparison approach to provide a market value estimate for the improved properties . A&M researched and considered recent localized sales of improved properties that A&M deemed similar to the Companies improved properties in one or more respects and applied qualitative adjustments to arrive at an estimated value range . • Similarly , for the vacant residential lots, A&M also utilized the sales comparison approach by considering recent localized transactions involving properties that A&M deemed similar to the Company’s unimproved properties in one or more respects in each respective location . It is noted that a common practice in the market is to acquire land with improvements and subsequently demolish the improvements to arrive at a vacant parcel . A&M utilized sales of improved properties and considered them land transactions when it was evidenced that the improvements in place at the time of the acquisition were subsequently demolished and/or redeveloped within a reasonable timeframe from the acquisition . We understand the Company employed a similar approach in acquiring several of the subject properties . • This analysis indicated an aggregate implied value reference range for the subject properties of $ 36 . 2 million to $ 40 . 9 million .

14 FINANCIAL ANALYSIS OF THE PROPOSED TRANSACTION Net Asset Approach – Real Estate Inventory (cont’d) (1) Some water frontage estimates are based on measurements from online aerial mapping. (2) Fully Loaded Cost is based on client documentation. As of September 30, 2017 and inclusive of September 30, 2017 impairment totaling $425K for 3506 Main Lodge and $275K for 3437 N Moorings Way. (3) A&M’s concluded value range is inclusive of a $290K downward adjustment for the remaining cost to complete the residential development. (US$ in Thousands) Implied Value Reference Range Water Fully Loaded Address City State Improvement SF Land SF Frontage (1) Acq. Date Acq. Cost Cost (2) Low High 700 88th Street Surfside FL NA 15 , 09 9 75 05/02/14 3 , 20 0 3 , 38 6 2 , 00 0 2 , 30 0 0 88th Street (No Address) Surfside FL NA 15 , 10 7 75 05/02/14 Incl. in Lot Above Incl. in Lot Above 2 , 00 0 2 , 30 0 1420 Biscaya Drive Surfside FL NA 18 , 40 0 92 02/04/14 3 , 45 0 3 , 75 5 3 , 60 0 4 , 00 0 1211 Stillwater Drive Miami Beach FL NA 7 , 50 0 50 03/11/14 1 , 20 0 1 , 33 8 1 , 30 0 1 , 40 0 2535 Shelter Avenue (3) Miami Beach FL 5 , 02 2 12 , 00 0 NA 04/30/14 2 , 32 0 5 , 39 8 5 , 01 0 5 , 71 0 2555 Shelter Avenue Miami Beach FL NA 12 , 00 0 NA 04/30/14 2 , 42 0 3 , 00 5 2 , 80 0 3 , 10 0 11400 N Bayshore Drive North Miami FL NA 18 , 80 7 218 08/29/14 3 , 20 0 3 , 57 2 3 , 60 0 4 , 10 0 11404 N Bayshore Drive North Miami FL NA 14 , 10 0 94 08/29/14 2 , 40 0 2 , 57 6 2 , 50 0 2 , 70 0 241 Atlantic Isle Sunny Isles Beach FL NA 12 , 63 6 60 03/19/14 1 , 82 6 2 , 00 9 2 , 10 0 2 , 40 0 18970 North Bay Road Sunny Isles Beach FL NA 11 , 25 0 75 03/24/14 1 , 85 0 1 , 99 9 2 , 00 0 2 , 20 0 3506 Main Lodge Drive Coconut Grove FL 4 , 39 7 15 , 66 3 NA 02/04/14 2 , 20 0 3 , 07 7 3 , 20 0 3 , 40 0 3437 N Moorings Way Coconut Grove FL 4 , 07 1 12 , 46 4 NA 04/08/14 2 , 27 5 3 , 13 5 2 , 40 0 2 , 80 0 65 East Hollow Road East Hampton NY NA 40 , 94 6 NA 08/07/14 3 , 10 0 3 , 18 7 3 , 70 0 4 , 50 0 Total (Rounded) $ 36 , 20 0 $ 40 , 90 0

15 A&M considered the value of the NOLs and R&D credits to Cadus on a standalone basis (assuming no transaction) . For this analysis, A&M assumed based on a representation from Management that under a hypothetical scenario, the Company would sell all seven of its listed properties in FY 2018 , and the remaining properties in FY 2019 , each at the implied value reference range indicated by our analysis . Under this hypothetical scenario, Management provided expenses to derive an estimate of taxable income for FY 2018 and FY 2019 . Thereafter, we have assumed that the Company would generate enough taxable income in FY 2020 to utilize its remaining available balances related to the existing NOLs and R&D credits . This analysis indicated an aggregate implied value reference range for the NOLs and R&D credits of $ 1 . 1 million to $ 1 . 3 million (rounded) . Net Asset Approach – NOL and R&D Credit Analysis (1) Based on annualized YTD September 30, 2017 amounts per Cadus’ Form 10 - Q for the quarter ended September 30, 2017. Excludes non - recurring expenses. (2) Based on 6% of the estimated revenue to be generated from selling the Company’s properties, per Management. FINANCIAL ANALYSIS OF THE PROPOSED TRANSACTION (US$ in Thousands) Low FY18 FY19 FY20 High FY18 FY19 FY20 3506 Main Lodge Drive 3 , 20 0 - 3 , 40 0 - 3437 N Moorings Way 2 , 40 0 - 2 , 80 0 - 2535 Shelter Ave 5 , 01 0 - 5 , 71 0 - 18970 North Bay Rd 2 , 00 0 - 2 , 20 0 - 1420 Biscaya Drive 3 , 60 0 - 4 , 00 0 - 88th Street Lots Remaining Properties 4 , 00 0 - - 15 , 99 0 4 , 60 0 - - 18 , 19 0 Total Estimated Revenue $ 20,210 $ 15,990 $ 22,710 $ 18,190 Cost of 3506 Main Lodge Drive 3 , 50 2 - 3 , 50 2 - Cost of 3437 N Moorings Way 3 , 41 0 - 3 , 41 0 - Cost of 2535 Shelter Ave 5 , 39 8 - 5 , 39 8 - Cost of 18970 North Bay Rd 1 , 99 9 - 1 , 99 9 - Cost of 1420 Biscaya Drive 3 , 75 5 - 3 , 75 5 - Cost of 88th Street Lots Cost of Remaining Properties 3 , 38 6 - - 15 , 68 8 3 , 38 6 - - 15 , 68 8 Total Cost Basis $ 21,450 $ 15,688 $ 21,450 $ 15,688 General and Administrative (1) 500 500 500 500 Real Estate Expenses (1) 260 260 260 260 Amortization of Website & Patent Costs (1) 7 7 7 7 Loss/(Gain) from Equity in Other Ventures (1) ( 1 ) ( 1 ) ( 1 ) ( 1 ) Broker Fees (2) 1 , 21 3 959 1 , 36 3 1 , 09 1 Total Operating Expenses $ 1,978 $ 1,725 $ 2,128 $ 1,857 Operating Income ( 3 , 218 ) ( 1 , 422 ) ( 868 ) 646 Interest Income (1) 30 30 30 30 Taxable Income $ (3,187) $ (1,392) $ 7,550 $ ( 837 ) $ 676 $ 7,550

16 FINANCIAL ANALYSIS OF THE PROPOSED TRANSACTION Net Asset Approach – NOL and R&D Credit Analysis (cont’d) (1) Discount rate is based on Cadus' estimated cost of equity. (US$ in Thousands) Low FY18 FY19 FY20 High FY18 FY19 FY20 Taxable Income (3,187) ( 1 , 392 ) 7 , 55 0 ( 837 ) 676 7 , 55 0 (x) Federal Tax Rate 21.0% 21 . 0 % 21 . 0 % 21 . 0 % 21 . 0 % 21 . 0 % Estimated Federal Taxes ( – ) Tax Benefit on Federal NOL Carryforwards $ - - $ - - $ 1,585 (1,585) $ - - $ 142 (142) $ 1,585 (1,585) Remaining Federal Taxes ( – ) Tax Benefit on R&D Credits $ - - $ - - $ - - $ - - $ - - $ - - Remaining Federal Taxes $ - $ - $ - $ - $ - $ - Taxable Income (3,187) (1,392) 7,550 (837) 676 7 , 55 0 (x) Florida State Tax Rate 5.5% 5.5% 5.5% 5.5% 5.5% 5 . 5 % Estimated Florida State Taxes $ - $ - $ 415 $ - $ 37 $ 415 ( – ) Tax Benefit on Florida State NOL Carryforwards - - (71) - (37) ( 34 ) Remaining Florida State Taxes $ - $ - $ 344 $ - $ - $ 381 Taxable Income (3,187) (1,392) 7,550 (837) 676 7 , 55 0 (x) New York State/City Tax Rate 13.0% 13.0% 13.0% 13.0% 13.0% 13 . 0 % Estimated New York Taxes $ - $ - $ 981 $ - $ 88 $ 981 ( – ) Tax Benefit on New York NOL Carryforwards - - (30) - (30) - Remaining New York Taxes $ - $ - $ 951 $ - $ 58 $ 981 Total NOL and R&D Credit Tax Benefits $ - $ - $ 1,687 $ - $ 209 $ 1,619 Partial Period Factor 1.00 1.00 1.00 1.00 1.00 1 . 0 0 Discount Period 0.48 1.47 2.47 0.48 1.47 2 . 4 7 Present Value Factor (1) 17.5% 0.9250 0.7893 0.6718 0.9250 0.7893 0 . 671 8 Net Present Value of Tax Benefits $ - $ - $ 1,133 $ - $ 165 $ 1,088 Net Present Value of Tax Benefits $ 1,133 $ 1,253

17 FINANCIAL ANALYSIS OF THE PROPOSED TRANSACTION Net Asset Approach – Summary (1) Real estate inventory is adjusted for the estimated fair value of the Company’s properties. (2) See page 12. (3) See pages 15 and 16. (4) See Appendix B. The NA approach indicated an implied aggregate equity value reference range of $ 40 . 3 million to $ 45 . 1 million for Cadus . Unadjusted Adjusted Dec '17 Implied Aggregate Equity Value Reference Range (Rounded) $ 39,317 $ 40,300 $ 45,100 (US$ in Thousands) Dec '17 Low High Assets: Real Estate Inventory (1) 36 , 43 9 36,200 40 , 90 0 Cash & Cash Equivalents 2 , 82 9 2,829 2 , 82 9 Interest Receivable 2 2 2 Prepaid & Other Current Assets 164 164 164 Investment in Laurel Partners (2) 195 282 282 Website 7 - 20 Less: Liabilities Accrued Expenses & Other Current Liabilities ( 319 ) ( 319 ) ( 319 ) Plus: Non - Operating Assets NOL and R&D Tax Credit Benefits (3) - 1,133 1 , 25 3 Patents (4) - - -

18 FINANCIAL ANALYSIS OF THE PROPOSED TRANSACTION • A&M selected nine publicly traded companies that were deemed relevant to its analysis . GPCs were chosen because they were deemed to be similar to the Company in one or more respects . – In selecting GPCs, A&M focused on companies that are in the homebuilding industry and who own and trade residential properties . – Given the size of the Company, A&M focused on small (enterprise values less than $ 1 billion) and mid sized (enterprise values between $ 1 billion and $ 2 . 5 billion) public companies in its analysis . • A&M analyzed the financial performance of both Cadus and the publicly traded companies and selected valuation multiples based on a variety of factors including size, scale, asset diversity, operating history, profitability, growth, and business model . • A&M considered Price to Book Value (“Price / BV”) multiples in its analysis as this is the most relevant valuation metric for the industry in which Cadus operates . Guideline Public Company Analysis – Overview Note: None of the selected GPCs are, of course, identical to Cadus. Accordingly, a complete analysis cannot be limited to a q uan titative review of the selected public companies and involves complex considerations and judgments concerning differences in financial an d operating characteristics of such companies, as well as other factors that could affect their value relative to Cadus.

19 FINANCIAL ANALYSIS OF THE PROPOSED TRANSACTION Guideline Public Company Analysis – Financial Statistics Source: Capital IQ; company filings. Property Company Count 3 Yr. CAGR FYE +1 FYE +2 3 Yr. CAGR FYE +1 FYE +2 LTM FYE +1 FYE +2 Tier 1: Small Sized Homebuilders (EV < $1.0BN) The New Home Company Inc. 3,018 102.8% 4.0% 3.9% 46.4% (2.0%) 35.1% 2.7% 2.9% 3.7% Green Brick Partners, Inc. 5,697 23.4% 21.1% 21.1% (9.5%) 45.3% 51.0% 7.0% 7.5% 9.4% AV Homes, Inc. 17,561 76.6% 10.8% 17.0% NA (87.4%) 80.8% 2.3% 2.1% 3.3% Mean 67.6% 11.9% 14.0% 18.4% (14.7%) 55.6% 4.0% 4.2% 5.5% Median 76.6% 10.8% 17.0% 18.4% (2.0%) 51.0% 2.7% 2.9% 3.7% Tier 2: Mid Sized Homebuilders (EV $1.0BN - $2.5BN) Beazer Homes USA, Inc. 21,507 9.4% 5.2% 7.1% (2.6%) 41.7% 28.4% 1.7% 2.2% 2.7% M/I Homes, Inc. 23,064 17.7% 14.1% 8.2% (28.0%) 50.9% 25.7% 4.1% 4.4% 5.1% Century Communities, Inc. 31,996 79.8% 40.7% 28.7% 58.8% 1.2% 84.0% 4.0% 3.6% 5.1% Hovnanian Enterprises, Inc. 31,319 5.9% (9.7%) 3.1% NA NA 228.0% (13.5%) 0.1% 0.4% LGI Homes, Inc. 37,063 72.7% 45.7% 22.3% 49.8% 46.7% 37.2% 9.3% 9.0% 10.1% William Lyon Homes 17,944 34.9% 27.1% 11.6% (22.7%) 39.3% 33.1% 3.6% 4.7% 5.5% Mean 36.7% 20.5% 13.5% 11.1% 36.0% 72.7% 1.5% 4.0% 4.8% Median 26.3% 20.6% 9.9% (2.6%) 41.7% 35.1% 3.8% 4.0% 5.1% Combined Min 5.9% (9.7%) 3.1% (28.0%) (87.4%) 25.7% (13.5%) 0.1% 0.4% Max 102.8% 45.7% 28.7% 58.8% 50.9% 228.0% 9.3% 9.0% 10.1% Mean 47.0% 17.7% 13.7% 13.2% 17.0% 67.0% 2.4% 4.1% 5.0% Median 34.9% 14.1% 11.6% (2.6%) 40.5% 37.2% 3.6% 3.6% 5.1% Revenue Profit MarginsGrowth Rates Net Income Net Income

20 FINANCIAL ANALYSIS OF THE PROPOSED TRANSACTION Guideline Public Company Analysis – Valuation Multiples Note: Market data is as of January 12, 2018. “NM” refers to not meaningful. Source: Capital IQ; company filings; Wall Street research. (In Millions, Except Per Share Amounts) Multiples Filing Stock Market Enterprise Price / Company Currency Price Cap Value BV Tier 1: Small Sized Homebuilders (EV < $1.0BN) The New Home Company Inc. USD 12.65 264 520 1.0x Green Brick Partners, Inc. USD 11.70 592 690 1.4x AV Homes, Inc. USD 18.75 422 724 0.9x Mean 1.1x Median 1.0x Tier 2: Mid Sized Homebuilders (EV $1.0BN - $2.5BN) Beazer Homes USA, Inc. USD 20.25 651 1,687 1.0x M/I Homes, Inc. USD 36.94 1,043 1,714 1.4x Century Communities, Inc. USD 34.90 946 1,713 1.4x Hovnanian Enterprises, Inc. USD 2.88 426 1,855 NM LGI Homes, Inc. USD 75.60 1,643 2,059 3.7x William Lyon Homes USD 32.01 1,223 2,367 1.5x Mean 1.8x Median 1.4x Combined Min 0.9x Max 3.7x Mean 1.5x Median 1.4x Market Data
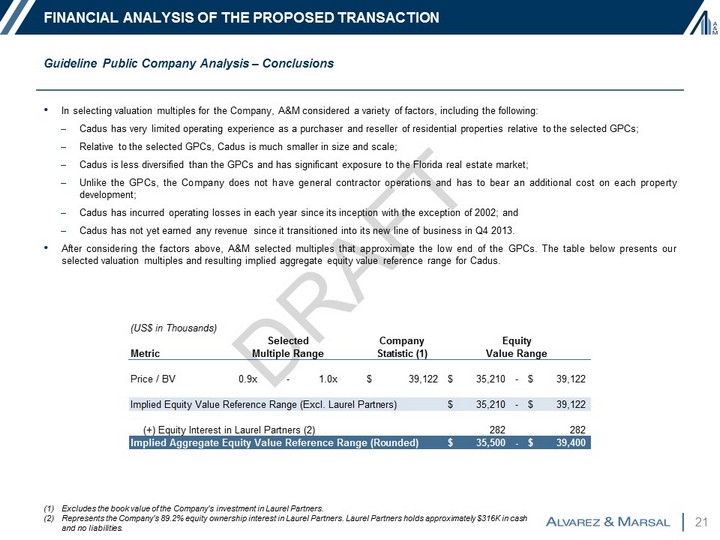
21 Guideline Public Company Analysis – Conclusions FINANCIAL ANALYSIS OF THE PROPOSED TRANSACTION • In selecting valuation multiples for the Company, A&M considered a variety of factors, including the following : – Cadus has very limited operating experience as a purchaser and reseller of residential properties relative to the selected GPCs ; – Relative to the selected GPCs, Cadus is much smaller in size and scale ; – Cadus is less diversified than the GPCs and has significant exposure to the Florida real estate market ; – Unlike the GPCs, the Company does not have general contractor operations and has to bear an additional cost on each property development ; – Cadus has incurred operating losses in each year since its inception with the exception of 2002 ; and – Cadus has not yet earned any revenue since it transitioned into its new line of business in Q 4 2013 . • After considering the factors above, A&M selected multiples that approximate the low end of the GPCs . The table below presents our selected valuation multiples and resulting implied aggregate equity value reference range for Cadus . (1) Excludes the book value of the Company's investment in Laurel Partners. (2) Represents the Company's 89.2% equity ownership interest in Laurel Partners. Laurel Partners holds approximately $316K in cas h and no liabilities. (US$ in Thousands) Metric Company Statistic (1) Price / BV 0.9x - 1.0x 39,122$ 35,210$ - 39,122$ Implied Equity Value Reference Range (Excl. Laurel Partners) 35,210$ - 39,122$ (+) Equity Interest in Laurel Partners (2) 282 282 Implied Aggregate Equity Value Reference Range (Rounded) 35,500$ - 39,400$ Equity Value Range Selected Multiple Range

22 A&M considered the value of the tax benefits associated with NOLs and R&D credits assuming a related - party buyer with effective control acquires Cadus and is able to utilize them to offset its tax liabilities immediately without a 382 limitation . Under this illustrative scenario, the implied value to a potential acquiror of the tax benefits associated with the NOLs and R&D credits is approximately $ 6 . 3 million . NOL and R&D Credit Analysis – Illustrative Scenario 1 : Acquisition by Controlling Shareholder – Immediate Utilization Note: For illustrative purposes only. (1) Assumes current NOLs are not subject to a Section 382 limitation and that the potential acquiror has the appropriate taxable income to be able to fully utilize the NOLs and R&D credits. FINANCIAL ANALYSIS OF THE PROPOSED TRANSACTION (US$ in Thousands) FY18 Total Federal NOL Carryforwards 22,309$ (x) Federal Tax Rate 21.0% Total Federal NOL Tax Benefits 4,685$ (+) R&D Credit Tax Benefits 1,500 Total Federal NOL and R&D Credit Tax Benefits 6,185$ Florida State NOLs 1,294$ (x) Florida State Tax Rate 5.5% Total Florida State NOL Tax Benefits 71$ Total New York State NOLs 232$ (x) New York State/City Tax Rate 13.0% Total New York NOL Tax Benefits 30$ Total NOL and R&D Credit Tax Benefits (1) 6,286$

23 A&M also considered the value of the NOL carryforwards and R&D credits assuming a hypothetical third - party buyer were to acquire Cadus . In this illustrative scenario, the Company’s NOLs and R&D credits would be subject to the Section 382 limitation . Consistent with the hypothetical scenario that was used to evaluate the Company’s NOLs and R&D credits on a standalone basis, we assumed that the properties that are currently listed are sold in FY 2018 and the remaining properties are sold in FY 2019 , each at the implied value reference range indicated by our analysis Under this illustrative scenario, the value to a potential acquiror of the NOL and R&D credit tax benefits is approximately $ 1 . 3 million to $ 1 . 9 million . NOL and R&D Credit Analysis – Illustrative Scenario 2 : Acquisition by a Third - Party – Section 382 Limitation Note: For illustrative purposes only. (1) Applies to all tax attributes – NOLs and R&D credits. (2) Based on the fair value of the properties (assuming Cadus sells seven properties in FY2018 and the remaining properties in FY2019) less the cost basis (original purchase price plus any property improvements). (3) R&D credits cannot be used until the NOL carryforwards have been fully utilized. R&D credits expire by FY2019. FINANCIAL ANALYSIS OF THE PROPOSED TRANSACTION (US$ in Thousands) F Y 1 8 F Y 1 9 F Y 2 0 F Y 2 1 F Y 2 2 Low Scenario F Y 2 3 F Y 2 4 F Y 2 5 F Y 2 6 F Y 2 7 F Y 2 8 F Y 2 9 Annual 382 Limitation: Shares Outstanding (in Thousands) 26,288 (x) Offering Price / Share $ 1.61 Total Equity Value (x) Long - Term Tax Exempt Rate $ 42,324 2.0% Annual 382 Limitation (1) (+) Net Realizable Built - In Gain (2) $ 83 0 $ 80 2 $ 83 0 $ 83 0 $ 83 0 $ 83 0 $ 83 0 $ 83 0 $ 83 0 $ 83 0 $ 83 0 $ 83 0 $ 830 - 61 5 63 2 - - - - - - - - - - Adjusted Annual 382 Limitation $ 830 $ 1,417 $ 1,461 $ 83 0 $ 83 0 $ 83 0 $ 83 0 $ 83 0 $ 83 0 $ 83 0 $ 83 0 $ 83 0 $ 830 Federal NOLs and R&D Credits: Total Federal NOL and R&D Credit Tax Benefits 18 $ 298 $ 307 $ 174 $ 174 $ 174 $ 174 $ 174 $ 174 $ 174 $ 174 $ 174 $ Scheduled Federal NOL Expiration 8 , 94 9 5 , 81 0 275 - 267 514 405 82 344 - - 495 Scheduled Federal R&D Credit Expiration 935 565 - - - - - - - - - - Federal NOL Balance 22,309 13 , 36 0 7 , 55 0 6,720 5 , 89 1 5 , 06 1 4 , 23 2 3 , 40 2 2,573 1 , 74 3 914 84 ( – ) NOLs Applied Against Current Income ( 1 , 417 ) ( 1 , 461 ) ( 830 ) ( 830 ) ( 830 ) ( 830 ) ( 830 ) ( 830 ) ( 830 ) ( 830 ) ( 830 ) ( 84 ) ( – ) Expired NOLs ( 7 , 531 ) ( 4 , 349 ) - - - - - - - - - - Ending NOL Balance $ 22,309 $ 13,360 $ 7,550 $ 6,720 $ 5,891 $ 5,061 $ 4,232 $ 3,402 $ 2,573 $ 1,743 $ 914 $ 84 $ - Federal NOLs Applied Against Income 1 , 41 7 1 , 46 1 830 830 830 830 830 830 830 830 830 84 (x) Federal Tax Rate 21 . 0 % 21 . 0 % 21 . 0 % 21.0% 21 . 0 % 21 . 0 % 21 . 0 % 21 . 0 % 21.0% 21 . 0 % 21 . 0 % 21 . 0 % Total Federal NOL Tax Benefits (+) R&D Credit Tax Benefits (3) $ 298 - $ 307 - $ 174 - $ 174 - $ 174 - $ 174 - $ 174 - $ 174 - $ 174 - $ 174 - $ 174 - $ 18 -
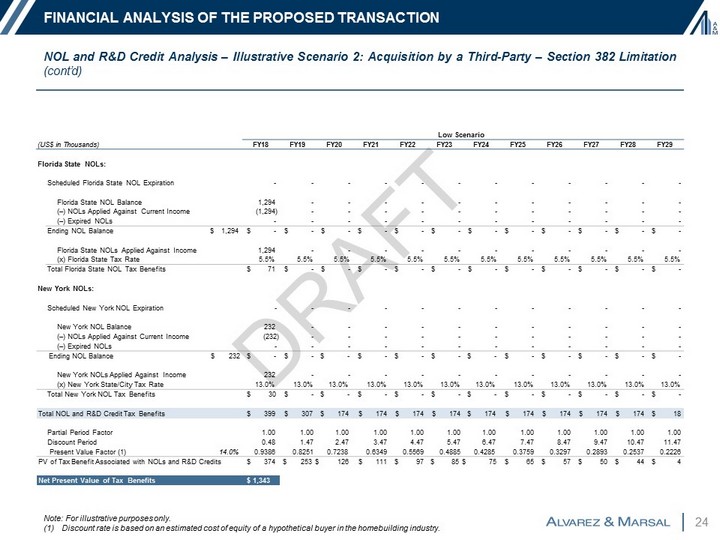
24 NOL and R&D Credit Analysis – Illustrative Scenario 2 : Acquisition by a Third - Party – Section 382 Limitation (cont’d) Note: For illustrative purposes only. (1) Discount rate is based on an estimated cost of equity of a hypothetical buyer in the homebuilding industry. FINANCIAL ANALYSIS OF THE PROPOSED TRANSACTION Low Scenario New York NOLs: (US$ in Thousands) FY18 FY19 FY20 FY21 FY22 FY23 FY24 FY25 FY26 FY27 FY28 FY29 Florida State NOLs: Scheduled Florida State NOL Expiration - - - - - - - - - - - - Florida State NOL Balance 1,294 - - - - - - - - - - - ( – ) NOLs Applied Against Current Income (1,294) - - - - - - - - - - - ( – ) Expired NOLs - - - - - - - - - - - - Ending NOL Balance $ 1,294 $ - $ - $ - $ - $ - $ - $ - $ - $ - $ - $ - $ - Florida State NOLs Applied Against Income 1,294 - - - - - - - - - - - (x) Florida State Tax Rate 5.5% 5 . 5 % 5 . 5 % 5 . 5 % 5 . 5 % 5 . 5 % 5 . 5 % 5 . 5 % 5 . 5 % 5 . 5 % 5 . 5 % 5 . 5 % Total Florida State NOL Tax Benefits $ 71 $ - $ - $ - $ - $ - $ - $ - $ - $ - $ - $ - Scheduled New York NOL Expiration - - - - - - - - - - - - New York NOL Balance 232 - - - - - - - - - - - ( – ) NOLs Applied Against Current Income ( 232 ) - - - - - - - - - - - ( – ) Expired NOLs - - - - - - - - - - - - E nd i n g N O L B a l an c e $ 232 $ - $ - $ - $ - $ - $ - $ - $ - $ - $ - $ - $ - New York NOLs Applied Against Income 232 - - - - - - - - - - - (x) New York State/City Tax Rate 13.0% 13 . 0 % 13.0% 13 . 0 % 13 . 0 % 13 . 0 % 13.0% 13 . 0 % 13 . 0 % 13 . 0 % 13 . 0 % 13 . 0 % Total New York NOL Tax Benefits $ 30 $ - $ - $ - $ - $ - $ - $ - $ - $ - $ - $ - Total NOL and R&D Credit Tax Benefits $ 399 $ 307 $ 174 $ 174 $ 174 $ 174 $ 174 $ 174 $ 174 $ 174 $ 174 $ 18 Partial Period Factor 1.00 1 . 0 0 1.00 1 . 0 0 1 . 0 0 1 . 0 0 1.00 1 . 0 0 1 . 0 0 1 . 0 0 1 . 0 0 1 . 0 0 Discount Period 0.48 1 . 4 7 2.47 3 . 4 7 4 . 4 7 5 . 4 7 6.47 7 . 4 7 8 . 4 7 9 . 4 7 10 . 4 7 11 . 4 7 P r e s en t V a l u e F a c t o r ( 1 ) 14 . 0 % 0.9386 0 . 825 1 0.7238 0 . 634 9 0 . 556 9 0 . 488 5 0.4285 0 . 375 9 0 . 329 7 0 . 289 3 0 . 253 7 0 . 222 6 PV of Tax Benefit Associated with NOLs and R&D Credits $ 374 $ 253 $ 126 $ 111 $ 97 $ 85 $ 75 $ 65 $ 57 $ 50 $ 44 $ 4 Net Present Value of Tax Benefits $ 1,343

25 NOL and R&D Credit Analysis – Illustrative Scenario 2 : Acquisition by a Third - Party – Section 382 Limitation (cont’d) Note: For illustrative purposes only. (1) Applies to all tax attributes – NOLs and R&D credits. (2) Based on the fair value of the properties (assuming Cadus sells seven properties in FY2018 and the remaining properties in FY2019) less the cost basis (original purchase price plus any property improvements). (3) R&D credits cannot be used until the NOL carryforwards have been fully utilized. R&D credits expire by FY2019. FINANCIAL ANALYSIS OF THE PROPOSED TRANSACTION (US$ in Thousands) F Y 1 8 F Y 1 9 F Y 2 0 F Y 2 1 F Y 2 2 High Scenario F Y 2 3 F Y 2 4 F Y 2 5 F Y 2 6 F Y 2 7 F Y 2 8 F Y 2 9 Annual 382 Limitation: Shares Outstanding (in Thousands) 26,288 (x) Offering Price / Share $ 1.61 Total Equity Value (x) Long - Term Tax Exempt Rate $ 42,324 2.0% Annual 382 Limitation (1) (+) Net Realizable Built - In Gain (2) $ 83 0 $ 80 2 $ 83 0 $ 83 0 $ 83 0 $ 83 0 $ 83 0 $ 83 0 $ 83 0 $ 83 0 $ 83 0 $ 83 0 $ 830 - 1 , 97 2 2 , 51 2 - - - - - - - - - - Adjusted Annual 382 Limitation $ 830 $ 2,774 $ 3,342 $ 83 0 $ 83 0 $ 83 0 $ 83 0 $ 83 0 $ 83 0 $ 83 0 $ 83 0 $ 83 0 $ 830 Federal NOLs and R&D Credits: Total Federal NOL and R&D Credit Tax Benefits 18 $ 583 $ 702 $ 174 $ 174 $ 174 $ 174 $ 174 $ 174 $ 174 $ 174 $ 174 $ Scheduled Federal NOL Expiration 8 , 94 9 5 , 81 0 275 - 267 514 405 82 344 - - 495 Scheduled Federal R&D Credit Expiration 935 565 - - - - - - - - - - Federal NOL Balance 22,309 13 , 36 0 7 , 55 0 6,720 5 , 89 1 5 , 06 1 4 , 23 2 3 , 40 2 2,573 1 , 74 3 914 84 ( – ) NOLs Applied Against Current Income ( 2 , 774 ) ( 3 , 342 ) ( 830 ) ( 830 ) ( 830 ) ( 830 ) ( 830 ) ( 830 ) ( 830 ) ( 830 ) ( 830 ) ( 84 ) ( – ) Expired NOLs ( 6 , 174 ) ( 2 , 468 ) - - - - - - - - - - Ending NOL Balance $ 22,309 $ 13,360 $ 7,550 $ 6,720 $ 5,891 $ 5,061 $ 4,232 $ 3,402 $ 2,573 $ 1,743 $ 914 $ 84 $ - Federal NOLs Applied Against Income 2 , 77 4 3 , 34 2 830 830 830 830 830 830 830 830 830 84 (x) Federal Tax Rate 21 . 0 % 21 . 0 % 21 . 0 % 21.0% 21 . 0 % 21 . 0 % 21 . 0 % 21 . 0 % 21.0% 21 . 0 % 21 . 0 % 21 . 0 % Total Federal NOL Tax Benefits (+) R&D Credit Tax Benefits (3) $ 583 - $ 702 - $ 174 - $ 174 - $ 174 - $ 174 - $ 174 - $ 174 - $ 174 - $ 174 - $ 174 - $ 18 -
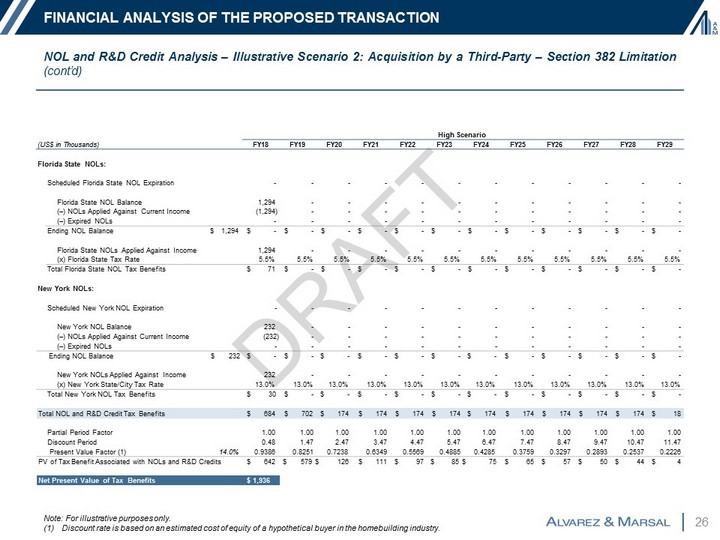
26 NOL and R&D Credit Analysis – Illustrative Scenario 2 : Acquisition by a Third - Party – Section 382 Limitation (cont’d) Note: For illustrative purposes only. (1) Discount rate is based on an estimated cost of equity of a hypothetical buyer in the homebuilding industry. FINANCIAL ANALYSIS OF THE PROPOSED TRANSACTION High Scenario New York NOLs: (US$ in Thousands) FY18 FY19 FY20 FY21 FY22 FY23 FY24 FY25 FY26 FY27 FY28 FY29 Florida State NOLs: Scheduled Florida State NOL Expiration - - - - - - - - - - - - Florida State NOL Balance 1,294 - - - - - - - - - - - ( – ) NOLs Applied Against Current Income (1,294) - - - - - - - - - - - ( – ) Expired NOLs - - - - - - - - - - - - Ending NOL Balance $ 1,294 $ - $ - $ - $ - $ - $ - $ - $ - $ - $ - $ - $ - Florida State NOLs Applied Against Income 1,294 - - - - - - - - - - - (x) Florida State Tax Rate 5.5% 5 . 5 % 5 . 5 % 5 . 5 % 5 . 5 % 5 . 5 % 5 . 5 % 5 . 5 % 5 . 5 % 5 . 5 % 5 . 5 % 5 . 5 % Total Florida State NOL Tax Benefits $ 71 $ - $ - $ - $ - $ - $ - $ - $ - $ - $ - $ - Scheduled New York NOL Expiration - - - - - - - - - - - - New York NOL Balance 232 - - - - - - - - - - - ( – ) NOLs Applied Against Current Income ( 232 ) - - - - - - - - - - - ( – ) Expired NOLs - - - - - - - - - - - - E nd i n g N O L B a l an c e $ 232 $ - $ - $ - $ - $ - $ - $ - $ - $ - $ - $ - $ - New York NOLs Applied Against Income 232 - - - - - - - - - - - (x) New York State/City Tax Rate 13.0% 13 . 0 % 13.0% 13 . 0 % 13 . 0 % 13 . 0 % 13.0% 13 . 0 % 13 . 0 % 13 . 0 % 13 . 0 % 13 . 0 % Total New York NOL Tax Benefits $ 30 $ - $ - $ - $ - $ - $ - $ - $ - $ - $ - $ - Total NOL and R&D Credit Tax Benefits $ 684 $ 702 $ 174 $ 174 $ 174 $ 174 $ 174 $ 174 $ 174 $ 174 $ 174 $ 18 Partial Period Factor 1.00 1 . 0 0 1.00 1 . 0 0 1 . 0 0 1 . 0 0 1.00 1 . 0 0 1 . 0 0 1 . 0 0 1 . 0 0 1 . 0 0 Discount Period 0.48 1 . 4 7 2.47 3 . 4 7 4 . 4 7 5 . 4 7 6.47 7 . 4 7 8 . 4 7 9 . 4 7 10 . 4 7 11 . 4 7 P r e s en t V a l u e F a c t o r ( 1 ) 14 . 0 % 0.9386 0 . 825 1 0.7238 0 . 634 9 0 . 556 9 0 . 488 5 0.4285 0 . 375 9 0 . 329 7 0 . 289 3 0 . 253 7 0 . 222 6 PV of Tax Benefit Associated with NOLs and R&D Credits $ 642 $ 579 $ 126 $ 111 $ 97 $ 85 $ 75 $ 65 $ 57 $ 50 $ 44 $ 4 Net Present Value of Tax Benefits $ 1,936

27 TABLE OF CONTENTS I. Executive Summary II. Financial Analysis of the Proposed Transaction a) Analytical Approach b) Financial Analysis c) Summary of Financial Analyses III. Assumptions, Qualifications & Limiting Conditions Appendix A: Summary of Due Diligence Appendix B: Patent Information

28 FINANCIAL ANALYSIS OF THE PROPOSED TRANSACTION Our analyses indicated an implied total equity value reference range of $ 35 . 5 million to $ 45 . 1 million inclusive of the tax benefit associated with the Company’s NOLs and R&D credits on a standalone basis under a hypothetical scenario as provided by Management . On a per share basis, our analyses indicates an implied value reference range of $ 1 . 35 to $ 1 . 72 relative to the offer price of $ 1 . 61 . The offer price of $ 1 . 61 per share represents a 7 . 6 % premium to Cadus’ book value of equity of $ 1 . 50 per share and a 69 . 5 % premium to Cadus’ unaffected share price of $ 0 . 95 per share . In addition, the illustrative incremental value to a potential acquiror (under illustrative scenario 1 and 2 ) associated with the tax benefits related to the Company’s NOLs and R&D credits is set forth below . Note : This implied value reference range is based on a hypothetical scenario provided by Management which is more favorable than that which Management believes is achievable . Summary of Financial Analyses (1) Outstanding shares = 26,288,080 per the Agreement. Total Value Value Per Share (1) (US$ in Thousands, Except Per Share Amounts) Low High Low High Net Asset Approach 40 , 30 0 45 , 10 0 1 . 5 3 1 . 7 2 Guideline Public Company Method 35 , 50 0 39 , 40 0 1 . 3 5 1 . 5 0 (US$ in Thousands, Except Share Count and Per Share Amounts) Scenario 1 Scenario 2 Low High PV of Tax Benefits Associated with NOLs and R&D Credits 6 , 28 6 1 , 34 3 1 , 93 6 Shares Outstanding (in Thousands) (1) 26 , 28 8 26 , 28 8 26 , 28 8 Illustrative Per Share NOL and R&D Credit Value Range $ 0 . 2 4 $ 0 . 0 5 $ 0 . 0 7 ( – ) Average Per Share Standalone NOL and R&D Credit Value ( 0 . 05 ) ( 0 . 05 ) ( 0 . 05 ) Incremental Per Share NOL and R&D Credit Value to a Potential Acquiror $ 0 . 1 9 $ 0 . 0 1 $ 0 . 0 3

29 TABLE OF CONTENTS I. Executive Summary II. Financial Analysis of the Proposed Transaction a) Analytical Approach b) Financial Analysis c) Summary of Financial Analyses III. Assumptions, Qualifications & Limiting Conditions Appendix A: Summary of Due Diligence Appendix B: Patent Information

30 ASSUMPTIONS, QUALIFICATIONS & LIMITING CONDITIONS Assumptions and Reliance – A&M made certain assumptions and relied on certain information with the Companies’ consent . If any of these assumptions proves to be incorrect in any material respect, our Opinion cannot and should not be relied upon . • In arriving at our opinion, we have relied upon and assumed, without independent verification, the accuracy and completeness of all financial and other information that was publicly available or furnished to us by the Company, or otherwise reviewed by us for purposes of our Opinion, and we have not assumed and we do not assume any responsibility or liability for any such information . In addition, we have assumed that ( i ) the Company NOLs have been reasonably prepared in good faith on bases reflecting the best currently available estimates and judgments of the Company’s management as to the amount of such Company NOLs, (ii) the Company Illustrative Taxable Income Scenarios are a reasonable basis on which to determine the hypothetical upper end value of the Company NOLs to the Company on a standalone basis, (iii) the Acquiror Estimated NOL Tax Savings are a reasonable basis on which to determine the upper end of the value of the Company NOLs to the Acquiror, and (iv) the Third Party Estimated NOL Tax Savings are a reasonable basis on which to evaluate a hypothetical third party acquiror’s ability to utilize the Company NOLs to achieve future tax savings . In connection with the preparation of our analyses and our Opinion, management of the Company has advised us that the Company has generated no revenue for the years ended December 31 , 2015 , 2016 and 2017 ; does not seek to utilize, license, sell or otherwise derive revenue from its patents, or develop or pursue new technology ; has no contracts for the sale of any of its real properties ; and maintains a full valuation allowance against its deferred tax assets based on Company management’s assessment of the likelihood of realization of taxable income . In addition, in connection with the preparation of our analyses and our Opinion, management of the Company has advised us, with respect to the Company’s interest in Laurel Partner Limited Partnership (“Laurel Partners”) that, to the best of Company managements’ knowledge, Laurel Partners does not have any ongoing operations . • We have not made an independent evaluation or appraisal of the assets, other than the Company’s real property assets, or liabilities (contingent or otherwise) of the Company, nor have we been furnished with any such appraisals . • Neither A&M nor any of its affiliates has been requested to, and did not, (a) initiate any discussions with, or solicit any indications of interest from, third parties with respect to the Proposed Transaction, the assets, businesses or operations of the Company, or any alternatives to the Proposed Transaction, (b) negotiate the terms of the Proposed Transaction, and therefore, A& M has assumed that such terms are the most beneficial terms, from the Company’s perspective, that could, under the circumstances, be negotiated among the parties to the Agreement and the Proposed Transaction, or (c) advise the Special Committee or any other party with respect to alternatives to the Proposed Transaction . • We have assumed that all of the conditions required to implement the Proposed Transaction will be satisfied and that the Proposed Transaction as consummated will not differ in any material respect from that described in the Agreement, without any adverse waiver or amendment of any material term or condition thereof, and that the parties to the Agreement will comply with all material terms of the Agreement ; Our Opinion would include assumptions, qualifications and limiting conditions similar to the following . This is not meant to be a complete list ; our Opinion may include other factors .

31 ASSUMPTIONS, QUALIFICATIONS & LIMITING CONDITIONS Assumptions and Reliance – A&M made certain assumptions and relied on certain information with the Companies’ consent . If any of these assumptions proves to be incorrect in any material respect, our Opinion cannot and should not be relied upon . • We have further assumed that the final form of the Agreement, when executed by the parties thereto, will conform to the draft reviewed by us in all respects material to our analyses and our Opinion ; • We accept no responsibility for the accounting or other data and commercial assumptions on which our Opinion is based . Further, our Opinion does not address any legal, regulatory, taxation or accounting matters, as to which we understand that the Special Committee has obtained such advice as it deemed necessary from qualified professionals ; • Our Opinion does not address, and should not be construed to address, the relative merits of the Proposed Transaction as compared to other business strategies or transactions that might be available with respect to the Company, the underlying business decision of the Company to effect the Proposed Transaction, or whether the Consideration to be received by the stockholders of the Company in the Proposed Transaction represents the best price obtainable . We express no view as to the federal, state or local tax consequences of the Proposed Transaction ; • Our Opinion is based on business, economic, regulatory, monetary, market and other conditions as they exist as of the date hereof or as of the date of the information provided to us ; • Our Opinion is effective as of the date hereof . We have no obligation to update the Opinion and expressly disclaim any responsibility to do so in the absence of any such request ; and • We have assumed that all governmental, regulatory or other consents and approvals necessary for the consummation of the Proposed Transaction will be obtained without any adverse effect on the Company . To the extent that any of the foregoing assumptions or any of the facts on which our Opinion is based prove to be untrue in any material respect, our Opinion cannot and should not be relied upon . Furthermore, in our analysis and in connection with the preparation of our Opinion, A&M has made numerous assumptions with respect to industry performance, general business, market and economic conditions and other matters, many of which are beyond the control of any party involved in the Proposed Transaction . Our Opinion would include assumptions, qualifications and limiting conditions similar to the following . This is not meant to be a complete list ; our Opinion may include other factors .

32 ASSUMPTIONS, QUALIFICATIONS & LIMITING CONDITIONS Qualifications – Our Opinion would be qualified by the following : • Our Opinion should not be construed as a valuation opinion, credit rating, solvency opinion, an analysis of the Company’s credit worthiness, as tax advice, or as accounting advice . Our Opinion does not constitute a view regarding the solvency of the Company or Acquiror prior to or subsequent to the Proposed Transaction . A&M has performed no procedures to determine the solvency of the Company or Acquiror . As such, our Opinion does not constitute a solvency opinion, and should not be relied upon for such purposes . In addition, A&M is not expressing any opinion as to the market price or value of any of the Company’s or Acquiror’s securities after announcement of the Proposed Transaction . A&M has not made, and assumes no responsibility to make, any representation, or render any opinion, as to any legal matter . • In rendering our Opinion, A&M is not expressing any opinion with respect to the amount or nature of any compensation to any of the Company’s officers, directors, or employees, or any class of such persons, relative to the Consideration to be received by the stockholders of the Company in the Proposed Transaction, or with respect to the fairness of any such compensation . Our Opinion would include assumptions, qualifications and limiting conditions similar to the following . This is not meant to be a complete list ; our Opinion may include other factors .

33 ASSUMPTIONS, QUALIFICATIONS & LIMITING CONDITIONS Limiting Conditions – The use of our Opinion is strictly limited as follows : • Our Opinion may not be quoted or referred to, in whole or in part, filed with, or furnished or disclosed to any other party, without our prior written consent, except as described in the remainder of this paragraph . Our Opinion may be included in its entirety in any proxy statement distributed to stockholders of the Company in connection with the Proposed Transaction or other document required by law or regulation to be filed with the Securities and Exchange Commission, and you may summarize or otherwise reference the existence of our Opinion in such documents, provided that any such summary or reference language shall also be subject to the prior written approval by A&M . • Our Opinion is provided for the benefit of the Special Committee, in their capacity as such, in connection with and for the purposes of their consideration of the Proposed Transaction . Our Opinion does not constitute a recommendation by A&M to the Special Committee, any holder of securities of the Company or any other person as to how such person should vote or act in relation to the Proposed Transaction or any form of assurance by A&M as to the condition of the Company ; instead, it only addresses the fairness, from a financial point of view, to the stockholders of the Company, other than the Excluded Holders, of the Consideration to be received by such holders in the Potential Transaction pursuant to the Agreement . The decision as to whether to proceed with the Proposed Transaction or any related transaction may depend on an assessment of factors unrelated to the financial analysis on which our Opinion is based . Our Opinion would include assumptions, qualifications and limiting conditions similar to the following . This is not meant to be a complete list ; our Opinion may include other factors .

34 TABLE OF CONTENTS I. Executive Summary II. Financial Analysis of the Proposed Transaction a) Analytical Approach b) Financial Analysis c) Summary of Financial Analyses III. Assumptions, Qualifications & Limiting Conditions Appendix A: Summary of Due Diligence Appendix B: Patent Information

35 APPENDIX A: SUMMARY OF DUE DILIGENCE • Reviewed the following agreements and documents : – A draft of the Agreement dated January 16 , 2018 ; – First Amended and Restated Agreement of Limited Partnership of Laurel Partners Limited Partnership dated December 31 , 1996 ; – Laurel Partners General Ledger Trial Balance for the period ended December 31 , 2017 ; – Cadus Corporation and Subsidiary Form 1120 NOL Carryover Detail Schedule ; – 2015 Form NYC - 2 A New York City Combined Business Corporation Tax Return ; – 2015 Form CT - 3 - A New York State General Business Corporation Combined Franchise Tax Return ; – 2016 Form 1120 Florida Corporate Income/Franchise Tax Return ; – 2016 Form 1120 U . S . Corporation Income Tax Return ; – Cadus Patents dated September 28 , 2015 ; – Cadus Property Listing dated January 16 , 2018 ; – Buyer’s and Seller’s Combined Closing Statements for the following properties : » 241 Atlantic Isle, Sunny Isles Beach, FL dated March 19 , 2014 » 700 88 th Street, Surfside, FL dated May 2 , 2014 » 1211 Stillwater Drive, Miami Beach, FL dated March 11 , 2014 » 1420 Biscaya Drive, Surfside, FL dated February 4 , 2014 » 2535 Shelter Avenue, Miami Beach, FL dated April 30 , 2014 » 2555 Shelter Avenue, Miami Beach, FL dated April 30 , 2014 » 3437 N . Mooring Way, Coconut Grove, FL dated April 8 , 2014 » 3506 Main Lodge Drive, Coconut Grove, FL dated February 4 , 2014 » 18970 N . Bay Road . , Sunny Isles Beach, FL dated March 24 , 2014 – Vacant Land N Bayshore Drive/ Folio No . 06 - 2228 - 011 - 2620 dated August 29 , 2014 ; – Residential Contract of Sale for 69 East Hollow Road, East Hampton, NY dated August 7 , 2014 ; – Strang Architecture Schematic Design Set for 11404 North Bayshore Drive, North Miami, FL dated February 5 , 2015 ; and – Application for Payment from EBL Construction for 2535 Shelter Avenue, Miami Beach, FL dated December 25 , 2017 . • Reviewed certain publicly available business and historical financial information relating to the Company including the Company’s audited financial statements on Form 10 - K filed with the Securities and Exchange Commission (“SEC”) for the years ended December 31 , 2013 through December 31 , 2016 and the Company’s unaudited interim financial statements for the quarter ended September 30 , 2017 included in the Company’s Form 10 - Q filed with the SEC ; A&M’s procedures, investigations, and financial analysis with respect to the preparation of our analysis included, but were not limited to, the items summarized below :

36 APPENDIX A: SUMMARY OF DUE DILIGENCE • Reviewed certain non - public internal financial information, including an unaudited balance sheet as of December 31 , 2017 , and other data relating to the business and financial prospects for the Company that were provided to us by the Company for the purpose of our analysis and accordingly on which basis we prepared our analysis ; • Conducted discussion with, and relied on statements made by, members of the senior management of the Company concerning the business , operations, historical financial results, future prospects of the Company, and the Proposed Transaction ; • Reviewed a letter dated [Date] from the management of the Company which made certain representations as to historical financial statements, financial condition of the underlying assets and liabilities, and other assumptions for the Company ; • Considered the historical trading price and trading volume of the Company’s common stock, and the publicly traded securities of certain other companies that we deemed relevant ; • Considered certain financial performance data of the Company and compared that data with similar data for other companies in lines of business we deemed relevant ; • Reviewed and discussed with the Special Committee the following estimates or scenarios : ( i ) estimates prepared by Company management of the Company’s net operating loss tax carryforwards (the “Company NOLs”), (ii) illustrative theoretical scenarios (the “Company Illustrative Taxable Income Scenarios”) of the Company’s taxable income and the timing of the realization thereof, which (A) were prepared by Company management solely for the preparation of A&M’s financial analyses and our Opinion and (B) Company management has indicated are more favorable to the Company than what management believes is achievable, (iii) estimates of the potential tax savings available to the Acquiror and its affiliates based on the Company NOLs (the “Acquiror Estimated NOL Tax Savings”), which were discussed with representatives of the Acquiror, and (iv) estimates of the potential tax savings available to a third party acquiror based on the Company NOLs and the assumptions underlying the Company Illustrative Taxable Income Scenarios, subject to the limitations of Section 382 of the Internal Revenue Code of 1986 , as amended (the “Third Party Estimated NOL Tax Savings”) ; and • Considered such other information, financial studies, analyses and investigations and financial, economic and market criteria as we deemed relevant and appropriate for purposes of our Opinion . A&M’s procedures, investigations, and financial analysis with respect to the preparation of our analysis included, but were not limited to, the items summarized below :

37 TABLE OF CONTENTS I. Executive Summary II. Financial Analysis of the Proposed Transaction a) Analytical Approach b) Financial Analysis c) Summary of Financial Analyses III. Assumptions, Qualifications & Limiting Conditions Appendix A: Summary of Due Diligence Appendix B: Patent Information

38 APPENDIX B: PATENT INFORMATION • Based on our discussions with the founder of Cadus, the Company created over 40 drug discovery patents in the 1990 s, the majority of which have expired . As indicated in the chart at the bottom of the page, Cadus Technologies, Inc . (a subsidiary of Cadus Corporation) currently owns seven active biotechnology - related patents and one patent that is within the expiration grace period . • Management indicated the following to us with regard to the Company’s patent portfolio and future patent operations : – The Company has no intention to utilize its current patents or to create new patents ; – Management no longer seeks to operate in the biotechnology industry, and the Company has not had any biotechnology operations since 2002 ; – The remaining patents have a short remaining life ; – The technologies that are supported by the remaining patents have been superseded to a large extent by more advanced competing technologies since the patents were granted ; and – Attempts to sell the patent portfolio in the 2000 s were unsuccessful . • After considering the factors above, we have assumed that the Company’s patent portfolio has no value . Summary Source: Management. Note: Patent information in the table above is as of September 2015. Some patents may have expired since this information was prepared. Patent No. Appl. No. Title Appl. Date Issue Date Exp. Date Status 7273747 10/267,074 Cell having amplified signal transduction pathway responses and uses therefor 10/8/02 09/25/07 02/20/21 Expired - Reinstatement available 7090991 10/404,018 System for detection of a functional interaction between a compound and a cellular signal transduction component 3/31/03 08/15/06 08/27/20 Active 7022513 10/200,013 Cell based signal generation 7/18/02 04/04/06 02/06/20 Active 7319009 10/277,607 Methods and compositions for identifying receptor effectors 10/22/02 01/15/08 11/23/19 Active (within grace period) 7081360 09/362,286 Expression of G protein-coupled receptors with altered ligand binding and/or coupling properties 7/27/99 07/25/06 09/15/19 Active 6251605 09/426,332 Yeast cells having mutations in Cav1 and uses therefor 10/25/99 06/26/01 10/27/18 Active 7611854 10/600,003 Yeast cells engineered to produce pheromone system protein surrogates, and uses therefor 6/18/03 11/03/09 06/22/18 Active 7361498 10/967,087 Yeast cells expressing modified G proteins and methods of use therefor 10/15/04 04/22/08 01/20/18 Active

39