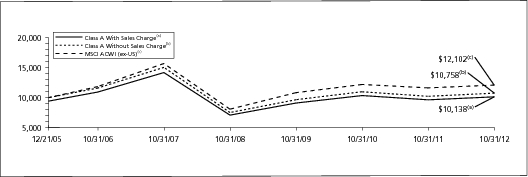
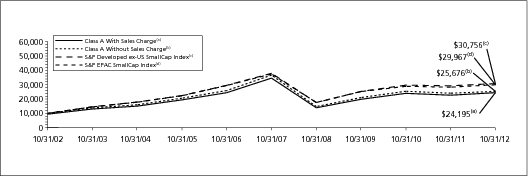
Based on a $10,000 initial investment, the graph and table above illustrate the total return of ING International Value Choice Fund against the index indicated. The index is unmanaged and has no cash in its portfolio, imposes no sales charge and incurs no operating expenses. An investor cannot invest directly in the index. The Fund’s performance is shown both with and without the imposition of sales charges.
The graph and performance table do not reflect the deduction of taxes that a shareholder will pay on Fund distributions or the redemption of Fund shares.
The performance shown may include the effect of fee waivers and/or expense reimbursements by the Investment Adviser and/or other service providers, which have the effect of increasing total return. Had all fees and expenses been considered, the total returns would have been lower.
It is important to note that the Fund has a limited operating history. Performance over a longer period of time may be more meaningful than short-term performance.
ING INTERNATIONAL VALUE FUND | PORTFOLIO MANAGERS’ REPORT
|
| | Geographic Diversification
as of October 31, 2012
(as a percentage of net assets) |
| | | Japan | | | | | 22.3 | % |
| | | United Kingdom | | | | | 20.3 | % |
| | | France | | | | | 10.2 | % |
| | | Netherlands | | | | | 7.6 | % |
| | | Germany | | | | | 6.1 | % |
| | | Switzerland | | | | | 5.3 | % |
| | | Italy | | | | | 4.7 | % |
| | | United States | | | | | 2.5 | % |
| | | Canada | | | | | 2.2 | % |
| | | Hong Kong | | | | | 2.0 | % |
| | | Countries between 0.0%–1.6%ˆ | | | | | 15.2 | % |
| | | Assets in Excess of Other Liabilities* | | | | | 1.6 | % |
| | | Net Assets | | | | | 100.0 | % |
| | | |
| | * | Includes short-term investments. |
| | ˆ | Includes 17 countries, which each represents 0.0%–1.6% of net assets. |
| | | |
| | Portfolio holdings are subject to change daily. |
ING International Value Fund (“International Value” or the “Fund”) seeks long-term capital appreciation. The Fund’s assets are managed by three sub-advisers — Brandes Investment Partners, L.P. (“Brandes”), ING Investment Management Co. LLC (“ING IM”) and del Rey Global Investors, LLC (“del Rey”) (each a “Sub-Adviser and collectively, the “Sub-Advisers”). Each manages a portion (“Sleeve”) of the Fund’s assets that is allocated to the Sub-Adviser. The following people are responsible for the day-to-day operations of the Fund: Glenn R. Carlson, CFA, Chief Executive Officer, Brent V. Woods, CFA, Managing Director — Investments, Amelia Maccoun Morris, CFA, Director — Investments, W. James Brown, CFA, Director — Investments, Brent Fredberg, Director — Investments and Jeffrey Germain, CFA, Senior Analyst, comprise the voting members of Brandes’ Large Cap Investment Committee; Martin Jansen, David Rabinowitz and Joseph Vultaggio are the Portfolio Managers for the portion of the Fund that is managed by ING IM; and Paul J. Hechmer is the Portfolio Manager for the portion of the Fund that is managed by del Rey.
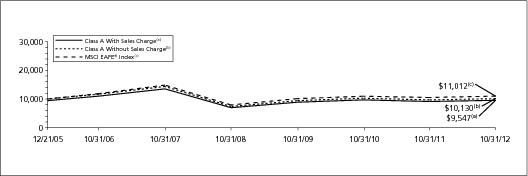
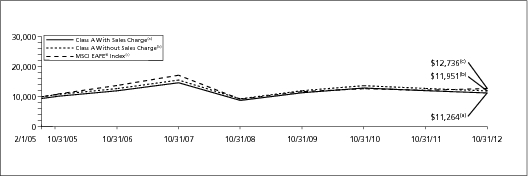
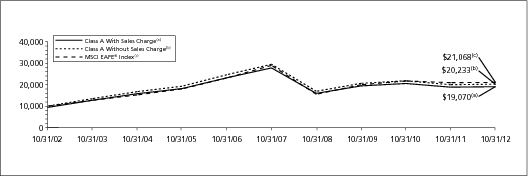
Performance: For the year ended October 31, 2012, the Fund’s Class A shares, excluding sales charges, provided a total return of 1.20% compared to the MSCI Europe, Australasia and Far East® Index (“MSCI EAFE® Index”), which returned 4.61% for the same period.
Portfolio Specifics: Brandes Sleeve — The Sleeve underperformed its benchmark by approximately 404 basis points for the fiscal year. An allocation to companies in Brazil, a country not in the benchmark, hurt relative performance as all but one of the holdings, including electric power company Electrobras, energy corporation Petrobras and telecommunications companies TIM Participacoes and Telefonica Brasil, delivered negative absolute returns. Declines in holdings in Japan — seven of the ten worst performers on a relative basis during the period were in Japan — also contributed to the underperformance. Bolstering relative returns were holdings in the United Kingdom and the Netherlands, most notably insurer Aegon.
A significant overweight to and holdings in the telecommunication services sector, as well as holdings in the information technology and financials sectors weighed heavily on relative returns. Within telecommunications, diversified telecommunications companies in Europe, including France Telecom, the Sleeve’s worst performer on a relative basis, Telecom Italia and Spain’s Telefonica all detracted from performance. In information technology, Japanese consumer electronics company FUJIFILM and semiconductor manufacturer ROHM Co. were the weakest performers. Some of the losses were mitigated by holdings in the materials and consumer discretionary sectors, including Mexican building materials producer CEMEX, the Sleeve’s best performer on an absolute basis, British media company ITV PLC and multiline retailer Marks & Spencer Group.
ING IM Sleeve — The Sleeve underperformed its benchmark by approximately 24 basis points on a net of fee basis, but outperformed prior to the deduction of fees and expenses due to strong security selection, which was primarily centered among industrials, energy and information technology. Some of these gains were offset by detractions from security selection in consumer staples and an overweight to information technology. Strong selection was most evident in Europe, particularly France and the Netherlands. By contrast, weak selection in Australia detracted from results. Among the top individual contributors to performance were Koninklijke Philips Electronics N.V., Hannover Rueckversicherung AG and Prudential PLC. Koninklijke Philips Electronics N.V., a provider of healthcare, consumer lifestyle and lighting products, rose in the wake of better than expected earnings. Hannover Rueckversicherung AG, a reinsurance company, strengthened on increased reinsurance revenue and lower claims. Prudential PLC, a composite insurance company, experienced improved profitability from its Asian operations.
Among the largest individual detractors from performance were Iluka Resources Ltd., Tokyo Electron Ltd., and NTT DoCoMo Inc. Iluka Resources Ltd., a miner of mineral sands, was hurt by a sharper than expected slowdown in Chinese housing construction. Tokyo Electron Ltd., a manufacturer of semiconductor production equipment, saw its prospects diminish due to pressure in the semiconductor space, as well the headwind from a stronger currency. NTT DoCoMo Inc., a Japanese provider of mobile communications, suffered from declining profitability in its home market.
del Rey Sleeve — The Sleeve underperformed its benchmark by approximately 896 basis points during the period. This was caused by a weak first half performance, which was offset somewhat by a stronger second half.
For the Sleeve’s fiscal year, information technology and materials weighed, as Nokia, the beleaguered Finnish handset manufacturer, and gold mining stocks hurt performance. Being underweight one of the top performing sectors, financials, also detracted. This was counteracted to some degree by strong performances in utilities, telecommunications, and energy. In particular, Nexen surged after the Chinese state-owned oil company CNOOC Ltd. announced a takeover offer for the company. Consumer discretionary stocks also contributed, with Home Retail, the British retailer, and Magna International, the Canadian auto parts manufacturer, performing particularly well.
Regionally, Japan hurt this year’s performance, as holdings in the region were hit by the lingering effects of the Japanese earthquake and ensuing tsunami, the strong yen, and the most recent territorial dispute with China. Offsetting this somewhat were strong performances from our Chinese positions, namely Huaneng Power, the Chinese utility, and China Mobile.
18
PORTFOLIO MANAGERS’ REPORT | ING INTERNATIONAL VALUE FUND
|
Current Strategy and Outlook: Brandes Sleeve — The Sleeve continues to have a meaningful overweight to companies domiciled in Japan, the Netherlands, and the telecommunications services sector, while maintaining a meaningful underweight to Germany, Australia, and the industrials sector.
While the uncertainty that engulfed investors around the globe last year seems to be gradually subsiding, the current environment still makes many investors wary of investing in equities. This has caused many companies trading at low multiples of book value, earnings and cash flows to become even cheaper. Europe is a perfect example as the gap between the price-to-book ratio of the cheapest 20% of companies and the price-to-book ratio of the average company in developed continental Europe remains wide. The same is true in Japan. Historically, wide spreads of this nature have resulted in strong subsequent returns for value stocks relative to growth stocks.
Top Ten Holdings
as of October 31, 2012*
(as a percentage of net assets) |
| Sanofi-Aventis | | | | | 2.4 | % |
| Siemens AG | | | | | 1.7 | % |
| Royal Dutch Shell PLC — Class A | | | | | 1.7 | % |
| ENI S.p.A. | | | | | 1.7 | % |
| GlaxoSmithKline PLC | | | | | 1.7 | % |
| Novartis AG | | | | | 1.5 | % |
| Total S.A. | | | | | 1.5 | % |
| Vodafone Group PLC | | | | | 1.4 | % |
| Tesco PLC | | | | | 1.4 | % |
| Roche Holding AG — Genusschein | | | | | 1.4 | % |
| | |
| * Excludes short-term investments. |
| | |
| Portfolio holdings are subject to change daily. | |
We believe that despite the extent and duration of the volatility and doubt surrounding the outlook for global stock markets, these factors help drive prices of fundamentally sound companies below what they could truly be worth — and this opportunity augurs well for long-term investors focused on attractively priced companies.
ING IM Sleeve — In our opinion, international developed stocks are attractively priced. However, the continuing sovereign debt crisis in Europe and a global growth slowdown are key risks to our short-term outlook. Central banks are easing monetary policy to offset these negative forces, but markets are likely to remain volatile in the coming months before — as we anticipate — the growth outlook improves in the first half of 2013. In our view, the Sleeve is well diversified across different geographic regions, sectors and industries; we continue to favor well-capitalized stocks with unrecognized value.
del Rey Sleeve — Notwithstanding the recent market rally, the global economy continues to face considerable challenges, most notably the ongoing crisis in the Euro region, the slump in Chinese investment, and of course, the impending U.S. fiscal cliff. In our last letter, we commented that the resulting second quarter weakness in the markets was allowing us to become incrementally more aggressive in the Sleeve as better and more opportunities were becoming available. While the temporary dip in the markets during the second quarter did grant us some buying opportunities, the rally’s quick resumption in the third quarter means that our overall Sleeve composition has not changed dramatically. We remain moderately defensively positioned, albeit less so than in earlier periods.
Portfolio holdings and characteristics are subject to change and may not be representative of current holdings and characteristics. The outlook for this Fund is based only on the outlook of its portfolio managers through the end of this period, and may differ from that presented for other ING Funds. Performance for the different classes of shares will vary based on differences in fees associated with each class.
19
ING INTERNATIONAL VALUE FUND | PORTFOLIO MANAGERS’ REPORT
|
Average Annual Total Returns for the Periods Ended October 31, 2012
|
|
|---|
| | | | 1 Year
| | 5 Year
| | 10 Year
| | Since Inception
of Class W
July 20, 2009
|
|---|
| | | | | | | | | | | | | | | | | | |
| | | | | (4.66 | )% | | | (8.35 | )% | | | 6.67 | % | | | — | |
| | | | | (4.49 | )% | | | (8.18 | )% | | | 6.55 | % | | | — | |
| | | | | (0.47 | )% | | | (7.88 | )% | | | 6.57 | % | | | — | |
| | | | | 1.57 | % | | | (6.93 | )% | | | 7.71 | % | | | — | |
| | | | | 1.49 | % | | | — | | | | — | | | | 2.17 | % |
| | | | | | | | | | | | | | | | | | |
| | | | | 1.20 | % | | | (7.26 | )% | | | 7.30 | % | | | — | |
| | | | | 0.45 | % | | | (7.92 | )% | | | 6.55 | % | | | — | |
| | | | | 0.51 | % | | | (7.88 | )% | | | 6.57 | % | | | — | |
| | | | | 1.57 | % | | | (6.93 | )% | | | 7.71 | % | | | — | |
| | | | | 1.49 | % | | | — | | | | — | | | | 2.17 | % |
| | | | | 4.61 | % | | | (5.81 | )% | | | 7.73 | % | | | 5.10 | %(4) |
Based on a $10,000 initial investment, the graph and table above illustrate the total return of ING International Value Fund against the index indicated. The Index is unmanaged and has no cash in its portfolio, imposes no sales charge and incurs no operating expenses. An investor cannot invest directly in the index. The Fund’s performance is shown both with and without the imposition of sales charges.
The graph and performance table do not reflect the deduction of taxes that a shareholder will pay on Fund distributions or the redemption of Fund shares.
The performance shown may include the effect of the fee waivers and/or expense reimbursements by the Investment Adviser and/or other service providers, which have the effect of increasing total return. Had all fees and expenses been considered, the total returns would have been lower.
The performance data represents past performance and is no assurance of future results. Investment return and principal value of an investment in the Fund will fluctuate. Shares, when sold, may be worth more or less than their original cost. The Fund’s current performance may be lower or higher than the performance data shown. Please log on to www.ingfunds.com or call (800) 992-0180 to get performance through the most recent month end.
This report contains statements that may be “forward-looking” statements. Actual results may differ materially from those projected in the “forward-looking” statements.
The views expressed in this report reflect those of the portfolio managers, only through the end of the period as stated on the cover. The portfolio managers’ views are subject to change at any time based on market and other conditions.
Fund holdings are subject to change daily.
(1) | | Reflects deduction of the maximum Class A sales charge of 5.75%. |
(2) | | Reflects deduction of the Class B deferred sales charge of 5% and 2%, respectively, for the 1 year and 5 year returns. |
(3) | | Reflects deduction of the Class C deferred sales charge of 1% for the 1 year return. |
(4) | | Since inception performance for the index is shown from August 1, 2009. |
20
PORTFOLIO MANAGERS’ REPORT
| ING RUSSIA FUND |
| | Sector Diversification
as of October 31, 2012
(as a percentage of net assets) |
| | | Energy | | | | | 42.5 | % |
| | | Financials | | | | | 17.0 | % |
| | | Materials | | | | | 15.3 | % |
| | | Telecommunications | | | | | 9.3 | % |
| | | Consumer Staples | | | | | 6.7 | % |
| | | Utilities | | | | | 5.1 | % |
| | | Information Technology | | | | | 1.4 | % |
| | | Health Care | | | | | 1.1 | % |
| | | Industrials | | | | | 1.0 | % |
| | | Consumer Discretionary | | | | | 0.5 | % |
| | | Assets in Excess of Other Liabilities* | | | | | 0.1 | % |
| | | Net Assets | | | | | 100.0 | % |
| | | |
| | * | Includes short-term investments. |
| | | |
| | Portfolio holdings are subject to change daily. |
ING Russia Fund (“Russia” or the “Fund”) seeks long-term capital appreciation through investment primarily in equity securities of Russian companies. The Fund is managed by Angus Alexander Robertson and Nathan Griffiths, Portfolio Managers, of ING Investment Management Advisors B.V. — the Sub-Adviser.
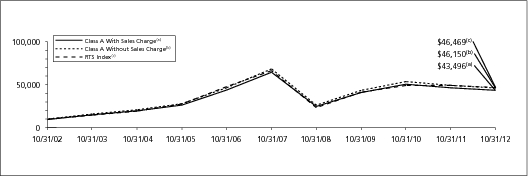
Performance: For the year ended October 31, 2012, the Fund’s Class A shares, excluding sales charges, provided a total return of (6.21)% compared to the Russia Trading System (“RTS”) Index and the MSCI Russia 10/40 Index, which returned (5.15)% and (5.92)%, respectively, for the same period.
Portfolio Specifics: The fiscal period proved disappointing for the Russian equity market. Russia was buffeted heavily by domestic political uncertainty and continued doubt around the global economy. Despite pronouncements that it was again unsuitable for investing, Russia strongly outperformed global and emerging markets between January and March 2012, as the global growth outlook grew more optimistic. Russia sold off heavily, though, as the euro crisis again dominated the investment environment. The rally from the June lows coincided with expectations of a third round of quantitative easing, by the U.S. Federal Reserve and the European Central Bank’s promise to buy sovereign bonds of euro zone members. The equity market remained vulnerable to risk appetite, however, and the recovery petered out by period-end as the domestic environment weakened.
The Fund outperformed its benchmarks before the deduction of fees and operating expenses, but lagged net of fees and expenses. Sector allocation was the main contributor to performance. Stock selection in materials and telecommunication services contributed the most. In contrast, selection in consumer staples and energy detracted the most.
The top three individual stock contributors were all underweight positions. InterRao and Rushydro suffered from utility sector uncertainty. OJSC Rostelecom came under pressure because of doubts about its ability to execute a mobile strategy. Transneft JSC was the biggest detractor as speculation of improved corporate governance saw the stock rally strongly. Having held a long-term underweight position in the stock due to heavy capital expenditure commitments, we moved to overweight as we concluded that free cash flow will become positive in 2013. Federal Grid Co. also detracted as government involvement in the utility sector saw all stocks suffer.
Top Ten Holdings
as of October 31, 2012
(as a percentage of net assets) |
| Sberbank | | | | | 10.6 | % |
| Lukoil OAO ADR | | | | | 10.3 | % |
| Gazprom OAO | | | | | 7.1 | % |
| Mobile Telesystems OJSC ADR | | | | | 5.7 | % |
| Transneft | | | | | 5.3 | % |
| Rosneft Oil Co. GDR | | | | | 5.0 | % |
| Magnit OAO | | | | | 4.9 | % |
| Uralkali GDR | | | | | 4.7 | % |
| NovaTek OAO GDR | | | | | 4.4 | % |
| Tatneft ADR | | | | | 4.1 | % |
| |
| Portfolio holdings are subject to change daily. | |
The overweight allocation to consumer staples was a major contributor as the food retail sector benefited from domestic income growth and food inflation. The underweight position in utilities also benefited, as the government reneged upon commitments to provide adequate returns on investment. In contrast, an underweight position in energy proved negative after strong performance at the start of the period due to rising oil prices.
Current Outlook and Strategy: Although we believe valuations are cheap across much of the market, in some areas we see a deteriorating earnings outlook while elsewhere we see the potential for structural improvements. Companies exposed to Western European economies and global trade cycles, and those with heavy capital programs, seem particularly unattractive to us at this moment. The focus of the Fund remains long-term investments that we believe are less exposed to the business cycle. While the global environment will continue to impact the Russian equity market, we believe there are long-term structural trends at play in Russia that provide attractive growth potential.
Though political uncertainty hurt the Russian market during the period, we hope that the realities of a budget no longer in surplus and public discontent with the status quo will accelerate political transformation. If this were to happen, the Russian equity market could undergo a significant re-rating from its current lowly valuation. In this respect it is potentially a major milestone that the government is mandating state-owned companies to pay out 25% of net income in dividends. Not only will this raise the payout ratio of the Russian market but enforce capital discipline on companies most associated with corruption. Such companies have often proved the worst value destroyers and as such have been poor investments; higher dividends alone are insufficient reason to invest. We do, however, see attractive opportunities and have added certain stocks selectively.
Current Fund positioning includes a sizable underweight in utilities. Within the energy sector we favor oil stocks over gas. Despite increases in domestic gas tariffs, we believe the domestic market is moving into surplus due to production growth from independent companies, which is likely to undercut Gazprom’s prices. In addition, weak European demand should pressure export volumes downward. On the other hand, we believe that the tax regime for oil companies is now settled, and with oil prices well supported the sector has the potential for upward re-rating. We prefer precious metals within the materials sector due to the ongoing currency debasement in the Western world. Also, we continue to like the consumer staples sector for its high growth potential and sustainable margins.
| * | | Effective May 8, 2012, Nathan Griffiths replaced Remco Vergeer as a portfolio manager to the Fund. |
Portfolio holdings and characteristics are subject to change and may not be representative of current holdings and characteristics. The outlook for this Fund is based only on the outlook of its portfolio managers through the end of this period, and may differ from that presented for other ING Funds. Performance for the different classes of shares will vary based on differences in fees associated with each class.
21
ING RUSSIA FUND
| PORTFOLIO MANAGERS’ REPORT |
Average Annual Total Returns for the Periods Ended October 31, 2012
|
|
|---|
| | | | 1 Year
| | 5 Year
| | 10 Year
| | Since Inception
of Class I
September 30, 2009
| | Since Inception
of Class W
August 5, 2011
|
|---|
| | | | | | | | | | | | | | | | | | | | | | |
| | | | | (11.59 | )% | | | (8.65 | )% | | | 15.84 | % | | | — | | | | — | |
| | | | | (6.01 | )% | | | — | | | | — | | | | 3.82 | % | | | — | |
| | | | | (5.99 | )% | | | — | | | | — | | | | — | | | | (16.31 | )% |
| | | | | | | | | | | | | | | | | | | | | | |
| | | | | (6.21 | )% | | | (7.56 | )% | | | 16.52 | % | | | — | | | | — | |
| | | | | (6.01 | )% | | | — | | | | — | | | | 3.82 | % | | | — | |
| | | | | (5.99 | )% | | | — | | | | — | | | | — | | | | (16.31 | )% |
| | | | | (5.15 | )% | | | (6.88 | )% | | | 16.59 | % | | | 6.48 | %(2) | | | (20.00 | )%(3) |
MSCI Russia 10/40 IndexSM | | | | | (5.92 | )% | | | (5.86 | )% | | | N/A | | | | 5.65 | %(2) | | | (20.99 | )%(3) |
Based on a $10,000 initial investment, the graph and table above illustrate the total return of ING Russia Fund against the indices indicated. An index is unmanaged and has no cash in its portfolio, imposes no sales charge and incurs no operating expenses. An investor cannot invest directly in an index. The Fund’s performance is shown both with and without the imposition of sales charges.
The graph and performance table do not reflect the deduction of taxes that a shareholder will pay on Fund distributions or the redemption of Fund shares.
The performance shown may include the effect of fee waivers and/or expense reimbursements by the Investment Adviser and/or other service providers, which have the effect of increasing total return. Had all fees and expenses been considered, the total returns would have been lower.
Performance data represents past performance and is no assurance of future results. Investment return and principal value of an investment in the Fund will fluctuate. Shares, when sold, may be worth more or less than their original cost. The Fund’s current performance may be lower or higher than the performance data shown. Please log on to www.ingfunds.com or call (800) 992-0180 to get performance through the most recent month end.
This report contains statements that may be “forward-looking” statements. Actual results may differ materially from those projected in the “forward-looking” statements.
The views expressed in this report reflect those of the portfolio managers, only through the end of the period as stated on the cover. The portfolio managers’ views are subject to change at any time based on market and other conditions.
Fund holdings are subject to change daily.
(1) | | Reflects deduction of the maximum Class A sales charge of 5.75%. |
(2) | | Since inception performance for the index is shown from October 1, 2009. |
(3) | | Since inception performance for the index is shown from August 1, 2011. |
| | Redemptions on shares held less than 365 days are subject to a redemption fee of 2% of the redemption proceeds. |
22
SHAREHOLDER EXPENSE EXAMPLES (UNAUDITED)
As a shareholder of a Fund, you incur two types of costs: (1) transaction costs, including sales charges (loads) on purchase payments, redemption fees, and exchange fees; and (2) ongoing costs, including management fees, distribution and/or service (12b-1) fees, and other Fund expenses. These Examples are intended to help you understand your ongoing costs (in dollars) of investing in a Fund and to compare these costs with the ongoing costs of investing in other mutual funds.
The Examples are based on an investment of $1,000 invested at the beginning of the period and held for the entire period from May 1, 2012 to October 31, 2012. Each Fund’s expenses are shown without the imposition of any sales charges or fees. Expenses would have been higher if such charges were included.
Actual Expenses
The left section of the table shown below, “Actual Fund Return,” provides information about actual account values and actual expenses. You may use the information in this section, together with the amount you invested, to estimate the expenses that you paid over the period. Simply divide your account value by $1,000 (for example, an $8,600 account value divided by $1,000 = 8.6), then multiply the result by the number in the first section under the heading entitled “Expenses Paid During the Period” to estimate the expenses you paid on your account during this period.
Hypothetical Example for Comparison Purposes
The right section of the table shown below, “Hypothetical (5% return before expenses),” provides information about hypothetical account values and hypothetical expenses based on a Fund’s actual expense ratio and an assumed rate of return of 5% per year before expenses, which is not the Fund’s actual return. The hypothetical account values and expenses may not be used to estimate the actual ending account balance or expenses you paid for the period. You may use this information to compare the ongoing costs of investing in each Fund and other funds. To do so, compare this 5% hypothetical example with the 5% hypothetical examples that appear in the shareholder reports of the other funds.
Please note that the expenses shown in the table are meant to highlight your ongoing costs only and do not reflect any transactional costs, such as sales charges (loads), redemption fees, or exchange fees. Therefore, the hypothetical lines of the table are useful in comparing ongoing costs only, and will not help you determine the relative total costs of owning different funds. In addition, if these transactional costs were included, your costs would have been higher.
| | | | Actual Fund Return
|
| Hypothetical (5% return before expenses)
|
|
|---|
| | | | Beginning
Account
Value
May 1,
2012
| | Ending
Account
Value
October 31,
2012
| | Annualized
Expense
Ratio
| | Expenses Paid
During the
Period Ended
October 31,
2012*
| | Beginning
Account
Value
May 1,
2012
| | Ending
Account
Value
October 31,
2012
| | Annualized
Expense
Ratio
| | Expenses Paid
During the
Period Ended
October 31,
2012*
|
|---|
ING Diversified International Fund** |
| | | | $ | 1,000.00 | | | $ | 1,001.10 | | | | 0.50 | % | | $ | 2.52 | | | $ | 1,000.00 | | | $ | 1,022.62 | | | | 0.50 | % | | $ | 2.54 | |
| | | | | 1,000.00 | | | | 996.60 | | | | 1.25 | | | | 6.27 | | | | 1,000.00 | | | | 1,018.85 | | | | 1.25 | | | | 6.34 | |
| | | | | 1,000.00 | | | | 996.60 | | | | 1.25 | | | | 6.27 | | | | 1,000.00 | | | | 1,018.85 | | | | 1.25 | | | | 6.34 | |
| | | | | 1,000.00 | | | | 1,002.20 | | | | 0.25 | | | | 1.26 | | | | 1,000.00 | | | | 1,023.88 | | | | 0.25 | | | | 1.27 | |
| | | | | 1,000.00 | | | | 1,000.00 | | | | 0.50 | | | | 2.51 | | | | 1,000.00 | | | | 1,022.62 | | | | 0.50 | | | | 2.54 | |
| | | | | 1,000.00 | | | | 1,000.00 | | | | 0.75 | | | | 3.77 | | | | 1,000.00 | | | | 1,021.37 | | | | 0.75 | | | | 3.81 | |
| | | | | 1,000.00 | | | | 1,002.30 | | | | 0.25 | | | | 1.26 | | | | 1,000.00 | | | | 1,023.88 | | | | 0.25 | | | | 1.27 | |
| * | | Expenses are equal to each Fund’s respective annualized expense ratios multiplied by the average account value over the period, multiplied by 184/366 to reflect the most recent fiscal half-year. |
| ** | | The annualized expense ratios do not include expenses of underlying funds. |
23
SHAREHOLDER EXPENSE EXAMPLES (UNAUDITED) (CONTINUED)
| | | | Actual Fund Return
|
| Hypothetical (5% return before expenses)
|
|
|---|
| | | | Beginning
Account
Value
May 1,
2012
| | Ending
Account
Value
October 31,
2012
| | Annualized
Expense
Ratio
| | Expenses Paid
During the
Period Ended
October 31,
2012*
| | Beginning
Account
Value
May 1,
2012
| | Ending
Account
Value
October 31,
2012
| | Annualized
Expense
Ratio
| | Expenses Paid
During the
Period Ended
October 31,
2012*
|
|---|
|
| | | | $ | 1,000.00 | | | $ | 1,026.70 | | | | 0.90 | % | | $ | 4.58 | | | $ | 1,000.00 | | | $ | 1,020.61 | | | | 0.90 | % | | $ | 4.57 | |
| | | | | 1,000.00 | | | | 1,022.20 | | | | 1.65 | | | | 8.39 | | | | 1,000.00 | | | | 1,016.84 | | | | 1.65 | | | | 8.36 | |
| | | | | 1,000.00 | | | | 1,023.00 | | | | 1.65 | | | | 8.39 | | | | 1,000.00 | | | | 1,016.84 | | | | 1.65 | | | | 8.36 | |
| | | | | 1,000.00 | | | | 1,028.30 | | | | 0.60 | | | | 3.06 | | | | 1,000.00 | | | | 1,022.12 | | | | 0.60 | | | | 3.05 | |
| | | | | 1,000.00 | | | | 1,027.20 | | | | 0.90 | | | | 4.59 | | | | 1,000.00 | | | | 1,020.61 | | | | 0.90 | | | | 4.57 | |
| | | | | 1,000.00 | | | | 1,025.50 | | | | 1.15 | | | | 5.86 | | | | 1,000.00 | | | | 1,019.36 | | | | 1.15 | | | | 5.84 | |
| | | | | 1,000.00 | | | | 1,027.60 | | | | 0.65 | | | | 3.31 | | | | 1,000.00 | | | | 1,021.87 | | | | 0.65 | | | | 3.30 | |
ING Global Value Choice Fund |
| | | | $ | 1,000.00 | | | $ | 1,005.30 | | | | 1.51 | % | | $ | 7.61 | | | $ | 1,000.00 | | | $ | 1,017.55 | | | | 1.51 | % | | $ | 7.66 | |
| | | | | 1,000.00 | �� | | | 1,001.80 | | | | 2.26 | | | | 11.37 | | | | 1,000.00 | | | | 1,013.77 | | | | 2.26 | | | | 11.44 | |
| | | | | 1,000.00 | | | | 1,001.60 | | | | 2.26 | | | | 11.37 | | | | 1,000.00 | | | | 1,013.77 | | | | 2.26 | | | | 11.44 | |
| | | | | 1,000.00 | | | | 1,005.70 | | | | 1.26 | | | | 6.35 | | | | 1,000.00 | | | | 1,018.80 | | | | 1.26 | | | | 6.39 | |
| | | | | 1,000.00 | | | | 1,006.80 | | | | 1.26 | | | | 6.36 | | | | 1,000.00 | | | | 1,018.80 | | | | 1.26 | | | | 6.39 | |
ING Index Plus International Equity Fund |
| | | | $ | 1,000.00 | | | $ | 1,020.60 | | | | 1.15 | % | | $ | 5.84 | | | $ | 1,000.00 | | | $ | 1,019.36 | | | | 1.15 | % | | $ | 5.84 | |
| | | | | 1,000.00 | | | | 1,015.30 | | | | 1.90 | | | | 9.62 | | | | 1,000.00 | | | | 1,015.58 | | | | 1.90 | | | | 9.63 | |
| | | | | 1,000.00 | | | | 1,015.50 | | | | 1.90 | | | | 9.63 | | | | 1,000.00 | | | | 1,015.58 | | | | 1.90 | | | | 9.63 | |
| | | | | 1,000.00 | | | | 1,023.20 | | | | 0.68 | | | | 3.46 | | | | 1,000.00 | | | | 1,021.72 | | | | 0.68 | | | | 3.46 | |
| | | | | 1,000.00 | | | | 1,019.50 | | | | 1.15 | | | | 5.84 | | | | 1,000.00 | | | | 1,019.36 | | | | 1.15 | | | | 5.84 | |
| | | | | 1,000.00 | | | | 1,022.00 | | | | 0.90 | | | | 4.57 | | | | 1,000.00 | | | | 1,020.61 | | | | 0.90 | | | | 4.57 | |
ING International Small Cap Fund |
| | | | $ | 1,000.00 | | | $ | 983.30 | | | | 1.74 | % | | $ | 8.67 | | | $ | 1,000.00 | | | $ | 1,016.39 | | | | 1.74 | % | | $ | 8.82 | |
| | | | | 1,000.00 | | | | 980.20 | | | | 2.39 | | | | 11.90 | | | | 1,000.00 | | | | 1,013.12 | | | | 2.39 | | | | 12.09 | |
| | | | | 1,000.00 | | | | 980.10 | | | | 2.39 | | | | 11.90 | | | | 1,000.00 | | | | 1,013.12 | | | | 2.39 | | | | 12.09 | |
| | | | | 1,000.00 | | | | 986.20 | | | | 1.26 | | | | 6.29 | | | | 1,000.00 | | | | 1,018.80 | | | | 1.26 | | | | 6.39 | |
| | | | | 1,000.00 | | | | 983.90 | | | | 1.64 | | | | 8.18 | | | | 1,000.00 | | | | 1,016.89 | | | | 1.64 | | | | 8.31 | |
| | | | | 1,000.00 | | | | 985.30 | | | | 1.39 | | | | 6.94 | | | | 1,000.00 | | | | 1,018.15 | | | | 1.39 | | | | 7.05 | |
ING International Value Choice Fund |
| | | | $ | 1,000.00 | | | $ | 1,007.70 | | | | 1.56 | % | | $ | 7.87 | | | $ | 1,000.00 | | | $ | 1,017.29 | | | | 1.56 | % | | $ | 7.91 | |
| | | | | 1,000.00 | | | | 1,004.40 | | | | 2.31 | | | | 11.64 | | | | 1,000.00 | | | | 1,013.52 | | | | 2.31 | | | | 11.69 | |
| | | | | 1,000.00 | | | | 1,003.30 | | | | 2.31 | | | | 11.63 | | | | 1,000.00 | | | | 1,013.52 | | | | 2.31 | | | | 11.69 | |
| | | | | 1,000.00 | | | | 1,008.80 | | | | 1.35 | | | | 6.82 | | | | 1,000.00 | | | | 1,018.35 | | | | 1.35 | | | | 6.85 | |
| | | | | 1,000.00 | | | | 1,009.90 | | | | 1.31 | | | | 6.62 | | | | 1,000.00 | | | | 1,018.55 | | | | 1.31 | | | | 6.65 | |
ING International Value Fund |
| | | | $ | 1,000.00 | | | $ | 1,014.60 | | | | 1.61 | % | | $ | 8.15 | | | $ | 1,000.00 | | | $ | 1,017.04 | | | | 1.61 | % | | $ | 8.16 | |
| | | | | 1,000.00 | | | | 1,010.60 | | | | 2.31 | | | | 11.67 | | | | 1,000.00 | | | | 1,013.52 | | | | 2.31 | | | | 11.69 | |
| | | | | 1,000.00 | | | | 1,011.00 | | | | 2.31 | | | | 11.68 | | | | 1,000.00 | | | | 1,013.52 | | | | 2.31 | | | | 11.69 | |
| | | | | 1,000.00 | | | | 1,016.70 | | | | 1.17 | | | | 5.93 | | | | 1,000.00 | | | | 1,019.25 | | | | 1.17 | | | | 5.94 | |
| | | | | 1,000.00 | | | | 1,015.70 | | | | 1.31 | | | | 6.64 | | | | 1,000.00 | | | | 1,018.55 | | | | 1.31 | | | | 6.65 | |
|
| | | | $ | 1,000.00 | | | $ | 934.00 | | | | 2.14 | % | | $ | 10.40 | | | $ | 1,000.00 | | | $ | 1,014.38 | | | | 2.14 | % | | $ | 10.84 | |
| | | | | 1,000.00 | | | | 934.10 | | | | 1.96 | | | | 9.53 | | | | 1,000.00 | | | | 1,015.28 | | | | 1.96 | | | | 9.93 | |
| | | | | 1,000.00 | | | | 934.90 | | | | 1.89 | | | | 9.19 | | | | 1,000.00 | | | | 1,015.63 | | | | 1.89 | | | | 9.58 | |
| * | | Expenses are equal to each Fund’s respective annualized expense ratios multiplied by the average account value over the period, multiplied by 184/366 to reflect the most recent fiscal half-year. |
24
REPORT OF INDEPENDENT REGISTERED PUBLIC ACCOUNTING FIRM
The Shareholders and Board of Trustees
ING Mutual Funds and ING Mayflower Trust
We have audited the accompanying statements of assets and liabilities, including the portfolios of investments or summary portfolios of investments, as indicated, of ING Diversified International Fund, ING Global Bond Fund, ING Global Value Choice Fund, ING Index Plus International Equity Fund, ING International Small Cap Fund, ING International Value Choice Fund, and ING Russia Fund, each a series of ING Mutual Funds, and ING International Value Fund, a series of ING Mayflower Trust, as of October 31, 2012, and the related statements of operations for the year then ended, the statements of changes in net assets for each of the years in the two-year period then ended, and the financial highlights for each of the years or periods in the five-year period then ended. These financial statements and financial highlights are the responsibility of management. Our responsibility is to express an opinion on these financial statements and financial highlights based on our audits.
We conducted our audits in accordance with the standards of the Public Company Accounting Oversight Board (United States). Those standards require that we plan and perform the audit to obtain reasonable assurance about whether the financial statements and financial highlights are free of material misstatement. An audit includes examining, on a test basis, evidence supporting the amounts and disclosures in the financial statements. Our procedures included confirmation of securities owned as of October 31, 2012, by correspondence with the custodian, transfer agent, and brokers, or by other appropriate auditing procedures when replies from brokers were not received. An audit also includes assessing the accounting principles used and significant estimates made by management, as well as evaluating the overall financial statement presentation. We believe that our audits provide a reasonable basis for our opinion.
In our opinion, the financial statements and financial highlights referred to above present fairly, in all material respects, the financial position of the aforementioned funds as of October 31, 2012, and the results of their operations, the changes in their net assets, and the financial highlights for the periods specified in the first paragraph above, in conformity with U.S. generally accepted accounting principles.
Boston, Massachusetts
December 20, 2012
25
STATEMENTS OF ASSETS AND LIABILITIES AS OF OCTOBER 31, 2012
| | | | ING
Diversified
International
Fund
| | ING
Global
Bond
Fund
| | ING
Global
Value Choice
Fund
| | ING
Index Plus
International
Equity Fund
|
|---|
| | | | | | | | | | | | | | | | | | |
Investments in securities at fair value+* | | | | $ | 4,471,700 | | | $ | 729,778,672 | | | $ | 171,237,728 | | | $ | 54,846,728 | |
Investments in affiliated underlying funds** | | | | | 92,548,723 | | | | — | | | | — | | | | — | |
Short-term investments at fair value*** | | | | | — | | | | 41,255,640 | | | | 15,326,588 | | | | 1,361,000 | |
Short-term investments at amortized cost | | | | | — | | | | 77,987,438 | | | | — | | | | — | |
Total Investments at fair value | | | | | 97,020,423 | | | | 849,021,750 | | | | 186,564,316 | | | | 56,207,728 | |
| | | | | 97,167 | | | | 2,470,316 | | | | — | | | | — | |
Cash collateral for futures | | | | | — | | | | 2,764,562 | | | | — | | | | 56,525 | |
Receivable for derivatives collateral (Note 2) | | | | | — | | | | 7,530,000 | | | | — | | | | — | |
Foreign currencies at value**** | | | | | — | | | | 285,713 | | | | — | | | | 7,841 | |
| | | | | | | �� | | | | | | | | | | | |
Investments in affiliated underlying funds sold | | | | | 55,834 | | | | — | | | | — | | | | — | |
Investments securities sold | | | | | — | | | | 48,933,876 | | | | 1,245,523 | | | | — | |
Investment securities sold on a delayed-delivery or when-issued basis | | | | | — | | | | 29,257,808 | | | | — | | | | — | |
| | | | | 6,098 | | | | 1,872,168 | | | | 38,062 | | | | 17,125 | |
| | | | | — | | | | 1,801 | | | | 345,713 | | | | 172,578 | |
| | | | | — | | | | 7,670,001 | | | | — | | | | — | |
| | | | | — | | | | — | | | | — | | | | 126,967 | |
Unrealized appreciation on forward foreign currency contracts | | | | | — | | | | 15,056,820 | | | | — | | | | — | |
Upfront payments paid on OTC swap agreements | | | | | — | | | | 205,465 | | | | — | | | | — | |
Unrealized appreciation on OTC swap agreements | | | | | — | | | | 23,142 | | | | — | | | | — | |
| | | | | 15,161 | | | | 59,034 | | | | 21,961 | | | | 11,466 | |
Reimbursement due from manager | | | | | 6,300 | | | | 29,022 | | | | — | | | | 24,416 | |
| | | | | 97,200,983 | | | | 965,181,478 | | | | 188,215,575 | | | | 56,624,646 | |
| | | | | | | | | | | | | | | | | | |
Payable for investment securities purchased | | | | | — | | | | 80,455,359 | | | | 1,092,945 | | | | — | |
Payable for investment securities purchased on a delayed-delivery or when-issued basis | | | | | — | | | | 54,393,877 | | | | — | | | | — | |
Payable for fund shares redeemed | | | | | 251,558 | | | | 1,039,872 | | | | 819,893 | | | | 68,901 | |
Payable for foreign cash collateral for futures***** | | | | | — | | | | 186,409 | | | | — | | | | — | |
Payable upon receipt of securities loaned | | | | | — | | | | — | | | | 8,310,696 | | | | — | |
Unrealized depreciation on forward foreign currency contracts | | | | | — | | | | 11,560,519 | | | | — | | | | — | |
Unrealized depreciation on OTC swap agreements | | | | | — | | | | 8,501,863 | | | | — | | | | — | |
Payable for investment management fees | | | | | — | | | | 258,685 | | | | 166,893 | | | | 26,447 | |
Payable for administrative fees | | | | | 8,308 | | | | 64,670 | | | | 15,740 | | | | 4,808 | |
Payable for shareholder service and distribution fees | | | | | 41,609 | | | | 141,514 | | | | 67,634 | | | | 10,187 | |
Payable to custodian due to bank overdraft | | | | | — | | | | — | | | | — | | | | 4,618 | |
| | | | | 540 | | | | 3,483 | | | | 1,827 | | | | 420 | |
Payable for derivatives collateral (Note 2) | | | | | — | | | | 4,198,000 | | | | — | | | | — | |
Other accrued expenses and liabilities | | | | | 166,854 | | | | 178,792 | | | | 158,291 | | | | 126,692 | |
Written options, at fair valueˆ | | | | | — | | | | 217,804 | | | | — | | | | — | |
| | | | | 468,869 | | | | 161,200,847 | | | | 10,633,919 | | | | 242,073 | |
| | | | $ | 96,732,114 | | | $ | 803,980,631 | | | $ | 177,581,656 | | | $ | 56,382,573 | |
NET ASSETS WERE COMPRISED OF: | | | | | | | | | | | | | | | | | | |
| | | | $ | 255,505,558 | | | $ | 791,647,158 | | | $ | 239,120,939 | | | $ | 125,499,396 | |
Undistributed (distributions in excess of) net investment income | | | | | 343,923 | | | | (3,407,671 | ) | | | 678,384 | | | | 2,410,014 | |
Accumulated net realized loss | | | | | (163,717,567 | ) | | | (1,102,932 | ) | | | (37,756,854 | ) | | | (80,882,464 | ) |
Net unrealized appreciation (depreciation) | | | | | 4,600,200 | | | | 16,844,076 | | | | (24,460,813 | ) | | | 9,355,627 | |
| | | | $ | 96,732,114 | | | $ | 803,980,631 | | | $ | 177,581,656 | | | $ | 56,382,573 | |
| | | | | | | | | | | | | | | | | | |
| + Including securities loaned at value | | | | $ | — | | | $ | — | | | $ | 7,969,306 | | | $ | — | |
| * Cost of investments in securities | | | | $ | 4,581,626 | | | $ | 708,632,654 | | | $ | 195,687,701 | | | $ | 45,472,335 | |
| ** Cost of investments in affiliated underlying funds | | | | $ | 87,838,597 | | | $ | — | | | $ | — | | | $ | — | |
| *** Cost of short-term investments | | | | $ | — | | | $ | 41,189,110 | | | $ | 15,326,588 | | | $ | 1,361,000 | |
| **** Cost of foreign currencies | | | | $ | — | | | $ | 291,388 | | | $ | — | | | $ | 7,823 | |
| ***** Cost of payable for foreign cash collateral for futures | | | | $ | — | | | $ | 186,409 | | | $ | — | | | $ | — | |
| ˆ Premiums received on written options | | | | $ | — | | | $ | 1,010,367 | | | $ | — | | | $ | — | |
See Accompanying Notes to Financial Statements
26
STATEMENTS OF ASSETS AND LIABILITIES AS OF OCTOBER 31, 2012 (CONTINUED)
| | | | ING
Diversified
International
Fund
| | ING
Global
Bond
Fund
| | ING
Global
Value Choice
Fund
| | ING
Index Plus
International
Equity Fund
|
|---|
| | | | | | | | | | | | | | | | | | |
| | | | $ | 46,504,207 | | | $ | 219,276,390 | | | $ | 82,688,287 | | | $ | 6,600,300 | |
| | | | | unlimited | | | | unlimited | | | | unlimited | | | | unlimited | |
| | | | $ | — | | | $ | — | | | $ | — | | | $ | — | |
| | | | | 5,195,945 | | | | 18,860,103 | | | | 3,126,883 | | | | 834,423 | |
Net asset value and redemption price per share | | | | $ | 8.95 | | | $ | 11.63 | | | $ | 26.44 | | | $ | 7.91 | |
Maximum offering price per share (5.75%)(1) | | | | $ | 9.50 | | | $ | 11.93 | (2) | | $ | 28.05 | | | $ | 8.39 | |
| |
| | | | | | | | | | | | | | | | | | |
| | | | $ | 7,795,455 | | | $ | 1,586,741 | | | $ | 3,256,483 | | | $ | 284,246 | |
| | | | | unlimited | | | | unlimited | | | | unlimited | | | | unlimited | |
| | | | $ | — | | | $ | — | | | $ | — | | | $ | — | |
| | | | | 873,888 | | | | 137,805 | | | | 114,561 | | | | 35,655 | |
Net asset value and redemption price per share† | | | | $ | 8.92 | | | $ | 11.51 | | | $ | 28.43 | | | $ | 7.97 | |
| |
| | | | | | | | | | | | | | | | | | |
| | | | $ | 27,902,869 | | | $ | 109,381,211 | | | $ | 52,627,761 | | | $ | 932,717 | |
| | | | | unlimited | | | | unlimited | | | | unlimited | | | | unlimited | |
| | | | $ | — | | | $ | — | | | $ | — | | | $ | — | |
| | | | | 3,135,080 | | | | 9,464,015 | | | | 2,133,490 | | | | 118,461 | |
Net asset value and redemption price per share† | | | | $ | 8.90 | | | $ | 11.56 | | | $ | 24.67 | | | $ | 7.87 | |
| |
| | | | | | | | | | | | | | | | | | |
| | | | $ | 9,953,490 | | | $ | 437,620,009 | | | $ | 30,701,461 | | | $ | 12,016,674 | |
| | | | | unlimited | | | | unlimited | | | | unlimited | | | | unlimited | |
| | | | $ | — | | | $ | — | | | $ | — | | | $ | — | |
| | | | | 1,115,198 | | | | 37,762,968 | | | | 1,150,187 | | | | 1,513,181 | |
Net asset value and redemption price per share | | | | $ | 8.93 | | | $ | 11.59 | | | $ | 26.69 | | | $ | 7.94 | |
| |
| | | | | | | | | | | | | | | | | | |
| | | | $ | 3,833,426 | | | $ | 4,116,980 | | | $ | n/a | | | $ | 36,545,642 | |
| | | | | unlimited | | | | unlimited | | | | n/a | | | | unlimited | |
| | | | $ | — | | | $ | — | | | $ | n/a | | | $ | — | |
| | | | | 431,993 | | | | 360,637 | | | | n/a | | | | 4,655,074 | |
Net asset value and redemption price per share | | | | $ | 8.87 | | | $ | 11.42 | | | $ | n/a | | | $ | 7.85 | |
| |
| | | | | | | | | | | | | | | | | | |
| | | | $ | 95,664 | | | $ | 275,860 | | | $ | n/a | | | $ | n/a | |
| | | | | unlimited | | | | unlimited | | | | n/a | | | | n/a | |
| | | | $ | — | | | $ | — | | | $ | n/a | | | $ | n/a | |
| | | | | 10,817 | | | | 23,761 | | | | n/a | | | | n/a | |
Net asset value and redemption price per share | | | | $ | 8.84 | | | $ | 11.61 | | | $ | n/a | | | $ | n/a | |
| |
| | | | | | | | | | | | | | | | | | |
| | | | $ | 647,003 | | | $ | 31,723,440 | | | $ | 8,307,664 | | | $ | 2,994 | |
| | | | | unlimited | | | | unlimited | | | | unlimited | | | | unlimited | |
| | | | $ | — | | | $ | — | | | $ | — | | | $ | — | |
| | | | | 72,713 | | | | 2,780,105 | | | | 311,266 | | | | 378 | |
Net asset value and redemption price per share | | | | $ | 8.90 | | | $ | 11.41 | | | $ | 26.69 | | | $ | 7.91 | |
| |
| | | | | | | | | | | | | | | | | | |
(1) Maximum offering price is computed at 100/94.25 of net asset value. On purchases of $100,000 or more, the offering price is reduced. |
(2) Maximum offering price is 2.50% and is computed at 100/97.50 of net asset value. On purchases of $100,000 or more, the offering price is reduced. |
† Redemption price per share may be reduced for any applicable contingent deferred sales charges. |
See Accompanying Notes to Financial Statements
27
STATEMENTS OF ASSETS AND LIABILITIES AS OF OCTOBER 31, 2012
| | | | ING
International
Small Cap
Fund
| | ING
International
Value Choice
Fund
| | ING
International
Value Fund
| | ING
Russia
Fund
|
|---|
| | | | | | | | | | | | | | | | | | |
Investments in securities at fair value+* | | | | $ | 237,048,043 | | | $ | 22,714,166 | | | $ | 474,776,654 | | | $ | 244,109,043 | |
Short-term investments at fair value** | | | | | 2,354,582 | | | | 203,586 | | | | 7,624,498 | | | | 14,079,810 | |
Total Investments at fair value | | | | | 239,402,625 | | | | 22,917,752 | | | | 482,401,152 | | | | 258,188,853 | |
| | | | | 3,001,730 | | | | — | | | | 356,238 | | | | 2,165,823 | |
Foreign currencies at value*** | | | | | 933,146 | | | | — | | | | — | | | | 321,427 | |
| | | | | | | | | | | | | | | | | | |
Investments securities sold | | | | | 2,344,644 | | | | 138,342 | | | | 2,234,440 | | | | 211,930 | |
| | | | | 37,792 | | | | 629 | | | | 122,267 | | | | 36,097 | |
| | | | | 634,021 | | | | 70,675 | | | | 2,397,305 | | | | 230,576 | |
| | | | | 19,139 | | | | — | | | | — | | | | — | |
| | | | | 267,149 | | | | 17,471 | | | | 2,204,197 | | | | — | |
| | | | | 26,940 | | | | 11,092 | | | | 23,135 | | | | 19,200 | |
Reimbursement due from manager | | | | | — | | | | 9,979 | | | | — | | | | — | |
| | | | | 246,667,186 | | | | 23,165,940 | | | | 489,738,734 | | | | 261,173,906 | |
| |
| | | | | | | | | | | | | | | | | | |
Payable for investment securities purchased | | | | | 1,778,317 | | | | 65,453 | | | | 2,150,223 | | | | 840,819 | |
Payable for fund shares redeemed | | | | | 564,319 | | | | 12,891 | | | | 2,895,579 | | | | 1,129,374 | |
Payable upon receipt of securities loaned | | | | | 1,722,019 | | | | — | | | | 700,066 | | | | 14,079,810 | |
Payable for investment management fees | | | | | 201,301 | | | | 17,990 | | | | 422,608 | | | | 268,981 | |
Payable for administrative fees | | | | | 20,646 | | | | 1,999 | | | | 41,530 | | | | 21,518 | |
Payable for shareholder service and distribution fees | | | | | 43,948 | | | | 6,635 | | | | 135,410 | | | | 51,848 | |
Payable to custodian due to foreign currency overdraft**** | | | | | — | | | | — | | | | 305,746 | | | | — | |
| | | | | 1,275 | | | | 135 | | | | 2,817 | | | | 1,309 | |
Other accrued expenses and liabilities | | | | | 162,131 | | | | 36,516 | | | | 501,202 | | | | 418,772 | |
| | | | | 4,493,956 | | | | 141,619 | | | | 7,155,181 | | | | 16,812,431 | |
| | | | $ | 242,173,230 | | | $ | 23,024,321 | | | $ | 482,583,553 | | | $ | 244,361,475 | |
| |
NET ASSETS WERE COMPRISED OF: | | | | | | | | | | | | | | | | | | |
| | | | $ | 508,805,937 | | | $ | 42,340,181 | | | $ | 1,470,980,819 | | | $ | 292,718,839 | |
Undistributed net investment income | | | | | 4,269,957 | | | | 365,448 | | | | 11,361,011 | | | | 973,892 | |
Accumulated net realized loss | | | | | (284,943,090 | ) | | | (18,555,421 | ) | | | (965,218,112 | ) | | | (100,262,420 | ) |
Net unrealized appreciation (depreciation) | | | | | 14,040,426 | | | | (1,125,887 | ) | | | (34,540,165 | ) | | | 50,931,164 | |
| | | | $ | 242,173,230 | | | $ | 23,024,321 | | | $ | 482,583,553 | | | $ | 244,361,475 | |
| |
| | | | | | | | | | | | | | | | | | |
| + Including securities loaned at value | | | | $ | 1,621,307 | | | $ | — | | | $ | 650,310 | | | $ | 13,619,804 | |
| * Cost of investments in securities | | | | $ | 222,991,398 | | | $ | 23,837,336 | | | $ | 509,403,588 | | | $ | 193,181,646 | |
| ** Cost of short-term investments | | | | $ | 2,354,582 | | | $ | 203,586 | | | $ | 7,624,498 | | | $ | 14,079,810 | |
| *** Cost of foreign currencies | | | | $ | 925,780 | | | $ | — | | | $ | — | | | $ | 317,659 | |
| **** Cost of foreign currency overdraft | | | | $ | — | | | $ | — | | | $ | 306,120 | | | $ | — | |
See Accompanying Notes to Financial Statements
28
STATEMENTS OF ASSETS AND LIABILITIES AS OF OCTOBER 31, 2012 (CONTINUED)
| | | | ING
International
Small Cap
Fund
| | ING
International
Value Choice
Fund
| | ING
International
Value Fund
| | ING
Russia
Fund
|
|---|
| | | | | | | | | | | | | | | | | | |
| | | | $ | 81,948,237 | | | $ | 18,558,722 | | | $ | 185,195,129 | | | $ | 235,621,954 | |
| | | | | unlimited | | | | unlimited | | | | unlimited | | | | unlimited | |
| | | | $ | — | | | $ | — | | | $ | — | | | $ | — | |
| | | | | 2,210,338 | | | | 2,017,734 | | | | 17,798,578 | | | | 7,494,572 | |
Net asset value and redemption price per share | | | | $ | 37.07 | | | $ | 9.20 | | | $ | 10.41 | | | $ | 31.44 | |
Maximum offering price per share (5.75%)(1) | | | | $ | 39.33 | | | $ | 9.76 | | | $ | 11.05 | | | $ | 33.36 | |
| |
| | | | | | | | | | | | | | | | | | |
| | | | $ | 1,887,773 | | | $ | 325,110 | | | $ | 634,539 | | | $ | n/a | |
| | | | | unlimited | | | | unlimited | | | | unlimited | | | | n/a | |
| | | | $ | — | | | $ | — | | | $ | — | | | $ | n/a | |
| | | | | 48,252 | | | | 35,741 | | | | 60,537 | | | | n/a | |
Net asset value and redemption price per share | | | | $ | 39.12 | | | $ | 9.10 | | | $ | 10.48 | | | $ | n/a | |
| |
| | | | | | | | | | | | | | | | | | |
| | | | $ | 20,350,728 | | | $ | 2,642,299 | | | $ | 101,301,106 | | | $ | n/a | |
| | | | | unlimited | | | | unlimited | | | | unlimited | | | | n/a | |
| | | | $ | — | | | $ | — | | | $ | — | | | $ | n/a | |
| | | | | 589,802 | | | | 291,336 | | | | 10,061,933 | | | | n/a | |
Net asset value and redemption price per share | | | | $ | 34.50 | | | $ | 9.07 | | | $ | 10.07 | | | $ | n/a | |
| |
| | | | | | | | | | | | | | | | | | |
| | | | $ | 100,952,305 | | | $ | 1,425,363 | | | $ | 195,303,770 | | | $ | 8,675,093 | |
| | | | | unlimited | | | | unlimited | | | | unlimited | | | | unlimited | |
| | | | $ | — | | | $ | — | | | $ | — | | | $ | — | |
| | | | | 2,718,063 | | | | 154,998 | | | | 18,806,872 | | | | 273,141 | |
Net asset value and redemption price per share | | | | $ | 37.14 | | | $ | 9.20 | | | $ | 10.38 | | | $ | 31.76 | |
| |
| | | | | | | | | | | | | | | | | | |
| | | | $ | 1,573,406 | | | $ | n/a | | | $ | n/a | | | $ | n/a | |
| | | | | unlimited | | | | n/a | | | | n/a | | | | n/a | |
| | | | $ | — | | | $ | n/a | | | $ | n/a | | | $ | n/a | |
| | | | | 42,811 | | | | n/a | | | | n/a | | | | n/a | |
Net asset value and redemption price per share | | | | $ | 36.75 | | | $ | n/a | | | $ | n/a | | | $ | n/a | |
| |
| | | | | | | | | | | | | | | | | | |
| | | | $ | 35,460,781 | | | $ | 72,827 | | | $ | 149,009 | | | $ | 64,428 | |
| | | | | unlimited | | | | unlimited | | | | unlimited | | | | unlimited | |
| | | | $ | — | | | $ | — | | | $ | — | | | $ | — | |
| | | | | 803,851 | | | | 7,911 | | | | 14,359 | | | | 2,031 | |
Net asset value and redemption price per share | | | | $ | 44.11 | | | $ | 9.21 | | | $ | 10.38 | | | $ | 31.72 | |
| |
| | | | | | | | | | | | | | | | | | |
(1) Maximum offering price is computed at 100/94.25 of net asset value. On purchases of $50,000 or more, the offering price is reduced. |
† Redemption price per share may be reduced for any applicable contingent deferred sales charges. |
See Accompanying Notes to Financial Statements
29
STATEMENTS OF OPERATIONS FOR THE YEAR ENDED OCTOBER 31, 2012
| | | | ING
Diversified
International
Fund
| | ING
Global
Bond
Fund
| | ING
Global
Value Choice
Fund
| | ING
Index Plus
International
Equity Fund
|
|---|
| | | | | | | | | | | | | | | | | | |
Dividends from affiliated underlying funds | | | | $ | 2,104,235 | | | $ | — | | | $ | — | | | $ | — | |
Dividends, net of foreign taxes withheld* | | | | | — | | | | 12,400 | | | | 8,716,065 | | | | 3,230,687 | |
Interest, net of foreign taxes withheld* | | | | | — | | | | 30,674,196 | | | | — | | | | 390 | |
Securities lending income, net | | | | | — | | | | — | | | | 94,594 | | | | — | |
| | | | | 2,104,235 | | | | 30,686,596 | | | | 8,810,659 | | | | 3,231,077 | |
| | | | | | | | | | | | | | | | | | |
Investment management fees | | | | | — | | | | 2,786,663 | | | | 3,262,789 | | | | 461,780 | |
Distribution and service fees: | | | | | | | | | | | | | | | | | | |
| | | | | 129,151 | | | | 529,096 | | | | 365,780 | | | | 17,129 | |
| | | | | 87,061 | | | | 18,156 | | | | 43,546 | | | | 3,147 | |
| | | | | 325,112 | | | | 1,000,622 | | | | 908,876 | | | | 9,659 | |
| | | | | 9,273 | | | | 10,198 | | | | — | | | | 91,407 | |
| | | | | 446 | | | | 776 | | | | — | | | | — | |
| | | | | | | | | | | | | | | | | | |
| | | | | 89,211 | | | | 165,055 | | | | 224,236 | | | | 17,129 | |
| | | | | 14,495 | | | | 1,416 | | | | 6,693 | | | | 787 | |
| | | | | 57,445 | | | | 78,209 | | | | 139,329 | | | | 2,415 | |
| | | | | 17,767 | | | | 98,843 | | | | 88,081 | | | | 10,943 | |
| | | | | 6,102 | | | | 3,183 | | | | — | | | | 91,407 | |
| | | | | 172 | | | | 135 | | | | — | | | | — | |
| | | | | 1,457 | | | | 21,052 | | | | 25,365 | | | | 7 | |
Administrative service fees | | | | | 108,029 | | | | 696,657 | | | | 365,430 | | | | 83,959 | |
Shareholder reporting expense | | | | | 61,485 | | | | 95,145 | | | | 67,950 | | | | 14,665 | |
| | | | | 102,474 | | | | 158,066 | | | | 113,983 | | | | 92,272 | |
| | | | | 20,532 | | | | 99,085 | | | | 72,390 | | | | 25,427 | |
Custody and accounting expense | | | | | 25,278 | | | | 299,625 | | | | 339,173 | | | | 107,225 | |
| | | | | 3,241 | | | | 20,900 | | | | 10,963 | | | | 2,519 | |
| | | | | 14,430 | | | | 40,598 | | | | 40,390 | | | | 7,008 | |
| | | | | 82 | | | | 3,373 | | | | 13,151 | | | | 1,166 | |
| | | | | 1,073,243 | | | | 6,126,853 | | | | 6,088,125 | | | | 1,040,051 | |
Net waived and reimbursed fees | | | | | (244,615 | ) | | | (205,867 | ) | | | (173,501 | ) | | | (248,446 | ) |
Brokerage commission recapture | | | | | — | | | | — | | | | (125,298 | ) | | | — | |
| | | | | 828,628 | | | | 5,920,986 | | | | 5,789,326 | | | | 791,605 | |
| | | | | 1,275,607 | | | | 24,765,610 | | | | 3,021,333 | | | | 2,439,472 | |
REALIZED AND UNREALIZED GAIN (LOSS): | | | | | | | | | | | | | | | | | | |
Net realized gain (loss) on: | | | | | | | | | | | | | | | | | | |
| | | | | (442,638 | ) | | | 13,191,506 | | | | (34,747,981 | ) | | | (2,282,706 | ) |
Capital gain distributions from affiliated underlying funds | | | | | 180,357 | | | | — | | | | — | | | | — | |
Capital gain distributions from unaffiliated underlying funds | | | | | — | | | | — | | | | 133 | | | | — | |
Foreign currency related transactions | | | | | — | | | | (12,264,578 | ) | | | (84,549 | ) | | | (66,052 | ) |
| | | | | — | | | | 8,405,748 | | | | — | | | | 361,998 | |
| | | | | — | | | | (20,509,389 | ) | | | — | | | | — | |
| | | | | — | | | | 3,150,527 | | | | — | | | | — | |
| | | | | (262,281 | ) | | | (8,026,186 | ) | | | (34,832,397 | ) | | | (1,986,760 | ) |
Net change in unrealized appreciation (depreciation) on: | | | | | | | | | | | | | | | | | | |
| | | | | — | | | | 15,862,350 | | | | (7,523,856 | ) | | | 3,055,318 | |
Affiliated underlying funds | | | | | 3,400,195 | | | | — | | | | — | | | | — | |
Foreign currency related transactions | | | | | — | | | | 4,073,964 | | | | 25,343 | | | | 37,642 | |
| | | | | — | | | | (743,452 | ) | | | — | | | | (218,858 | ) |
| | | | | — | | | | 1,813,888 | | | | — | | | | — | |
| | | | | — | | | | 521,404 | | | | — | | | | — | |
Net change in unrealized appreciation (depreciation) | | | | | 3,400,195 | | | | 21,528,154 | | | | (7,498,513 | ) | | | 2,874,102 | |
Net realized and unrealized gain (loss) | | | | | 3,137,914 | | | | 13,501,968 | | | | (42,330,910 | ) | | | 887,342 | |
Increase (decrease) in net assets resulting from operations | | | | $ | 4,413,521 | | | $ | 38,267,578 | | | $ | (39,309,577 | ) | | $ | 3,326,814 | |
| | | | | | | | | | | | | | | | | | |
| | | | $ | — | | | $ | 1,245 | | | $ | 771,600 | | | $ | 250,891 | |
See Accompanying Notes to Financial Statements
30
STATEMENTS OF OPERATIONS FOR THE YEAR ENDED OCTOBER 31, 2012
| | | | ING
International
Small Cap
Fund
| | ING
International
Value Choice
Fund
| | ING
International
Value Fund
| | ING
Russia
Fund
|
|---|
| | | | | | | | | | | | | | | | | | |
Dividends, net of foreign taxes withheld* | | | | $ | 7,343,189 | | | $ | 866,059 | | | $ | 20,686,699 | | | $ | 6,940,527 | |
Interest, net of foreign taxes withheld* | | | | | 52,684 | | | | — | | | | — | | | | 17,748 | |
Securities lending income, net | | | | | 39,294 | | | | — | | | | 10,172 | | | | 242,769 | |
| | | | | 7,435,167 | | | | 866,059 | | | | 20,696,871 | | | | 7,201,044 | |
| |
| | | | | | | | | | | | | | | | | | |
Investment management fees | | | | | 2,549,602 | | | | 269,966 | | | | 5,635,284 | | | | 3,499,951 | |
Distribution and service fees: | | | | | | | | | | | | | | | | | | |
| | | | | 310,242 | | | | 47,498 | | | | 696,684 | | | | 672,252 | |
| | | | | 21,162 | | | | 4,081 | | | | 9,908 | | | | — | |
| | | | | 214,872 | | | | 36,122 | | | | 1,147,231 | | | | — | |
| | | | | 3,741 | | | | — | | | | — | | | | — | |
| | | | | | | | | | | | | | | | | | |
| | | | | 144,681 | | | | 31,289 | | | | 420,419 | | | | 537,924 | |
| | | | | 3,397 | | | | 671 | | | | 1,769 | | | | — | |
| | | | | 35,179 | | | | 5,940 | | | | 208,532 | | | | — | |
| | | | | 39,800 | | | | 5,524 | | | | 88,022 | | | | 30,380 | |
| | | | | 2,520 | | | | — | | | | — | | | | — | |
| | | | | 52,644 | | | | 2,181 | | | | 453 | | | | 60 | |
Administrative service fees | | | | | 254,957 | | | | 26,996 | | | | 563,520 | | | | 279,992 | |
Shareholder reporting expense | | | | | 28,004 | | | | 3,217 | | | | 35,300 | | | | 47,623 | |
| | | | | 97,984 | | | | 73,986 | | | | 82,302 | | | | 59,715 | |
| | | | | 56,920 | | | | 14,644 | | | | 57,277 | | | | 56,901 | |
Custody and accounting expense | | | | | 181,915 | | | | 18,146 | | | | 243,998 | | | | 747,620 | |
| | | | | 7,649 | | | | 810 | | | | 16,906 | | | | 8,400 | |
| | | | | 12,283 | | | | 2,883 | | | | 48,054 | | | | 24,926 | |
| | | | | 379 | | | | 451 | | | | 6,844 | | | | 761 | |
| | | | | 4,017,931 | | | | 544,405 | | | | 9,262,503 | | | | 5,966,505 | |
Net waived and reimbursed fees | | | | | (70,231 | ) | | | (101,938 | ) | | | (311,357 | ) | | | — | |
Brokerage commission recapture | | | | | — | | | | (7,892 | ) | | | (14,780 | ) | | | — | |
| | | | | 3,947,700 | | | | 434,575 | | | | 8,936,366 | | | | 5,966,505 | |
| | | | | 3,487,467 | | | | 431,484 | | | | 11,760,505 | | | | 1,234,539 | |
| |
REALIZED AND UNREALIZED GAIN (LOSS): | | | | | | | | | | | | | | | | | | |
Net realized gain (loss) on: | | | | | | | | | | | | | | | | | | |
| | | | | (890,097 | ) | | | (2,434,613 | ) | | | (57,501,709 | ) | | | (2,260,423 | ) |
Foreign currency related transactions | | | | | 5,454 | | | | (14,188 | ) | | | (126,062 | ) | | | (253,681 | ) |
| | | | | (884,643 | ) | | | (2,448,801 | ) | | | (57,627,771 | ) | | | (2,514,104 | ) |
Net change in unrealized appreciation (depreciation) on: | | | | | | | | | | | | | | | | | | |
| | | | | 10,612,956 | | | | 108,749 | | | | 44,413,167 | | | | (19,717,659 | ) |
Foreign currency related transactions | | | | | 6,402 | | | | 124 | | | | (144,074 | ) | | | 61,435 | |
Net change in unrealized appreciation (depreciation) | | | | | 10,619,358 | | | | 108,873 | | | | 44,269,093 | | | | (19,656,224 | ) |
Net realized and unrealized gain (loss) | | | | | 9,734,715 | | | | (2,339,928 | ) | | | (13,358,678 | ) | | | (22,170,328 | ) |
Increase (decrease) in net assets resulting from operations | | | | $ | 13,222,182 | | | $ | (1,908,444 | ) | | $ | (1,598,173 | ) | | $ | (20,935,789 | ) |
| | | | | | | | | | | | | | | | | | |
| | | | $ | 507,684 | | | $ | 93,106 | | | $ | 2,010,263 | | | $ | 1,239,358 | |
See Accompanying Notes to Financial Statements
31
STATEMENTS OF CHANGES IN NET ASSETS
| | | | ING Diversified International Fund
| | ING Global Bond Fund
| |
|---|
| | | | Year Ended
October 31,
2012
| | Year Ended
October 31,
2011
| | Year Ended
October 31,
2012
| | Year Ended
October 31,
2011
|
|---|
| | | | | | | | | | | | | | | | | | |
| | | | $ | 1,275,607 | | | $ | 1,061,111 | | | $ | 24,765,610 | | | $ | 21,852,387 | |
| | | | | (262,281 | ) | | | 18,677,621 | | | | (8,026,186 | ) | | | 16,073,329 | |
Net change in unrealized appreciation (depreciation) | | | | | 3,400,195 | | | | (28,118,960 | ) | | | 21,528,154 | | | | (32,404,908 | ) |
Increase (decrease) in net assets resulting from operations | | | | | 4,413,521 | | | | (8,380,228 | ) | | | 38,267,578 | | | | 5,520,808 | |
| |
FROM DISTRIBUTIONS TO SHAREHOLDERS: | | | | | | | | | | | | | | | | | | |
| | | | | | | | | | | | | | | | | | |
| | | | | (702,513 | ) | | | (849,416 | ) | | | (2,973,693 | ) | | | (10,319,094 | ) |
| | | | | (25,317 | ) | | | (6,446 | ) | | | (10,812 | ) | | | (123,842 | ) |
| | | | | (95,652 | ) | | | (41,009 | ) | | | (453,531 | ) | | | (3,634,043 | ) |
| | | | | (173,157 | ) | | | (101,208 | ) | | | (4,757,431 | ) | | | (12,386,732 | ) |
| | | | | (47,020 | ) | | | (31,234 | ) | | | (51,069 | ) | | | (182,335 | ) |
| | | | | (1,361 | ) | | | (1,151 | ) | | | (592 | ) | | | (28 | ) |
| | | | | (14,983 | ) | | | (30,647 | ) | | | (379,070 | ) | | | (781,331 | ) |
| | | | | | | | | | | | | | | | | | |
| | | | | — | | | | — | | | | (9,453,922 | ) | | | (1,887,005 | ) |
| | | | | — | | | | — | | | | (77,080 | ) | | | (32,368 | ) |
| | | | | — | | | | — | | | | (3,749,885 | ) | | | (837,018 | ) |
| | | | | — | | | | — | | | | (11,707,244 | ) | | | (2,007,676 | ) |
| | | | | — | | | | — | | | | (159,667 | ) | | | (33,672 | ) |
| | | | | — | | | | — | | | | (3,022 | ) | | | (2 | ) |
| | | | | — | | | | — | | | | (986,134 | ) | | | (135,360 | ) |
| | | | | | | | | | | | | | | | | | |
| | | | | — | | | | (101,282 | ) | | | (2,892,533 | ) | | | — | |
| | | | | — | | | | (16,186 | ) | | | (26,356 | ) | | | — | |
| | | | | — | | | | (58,887 | ) | | | (1,459,959 | ) | | | — | |
| | | | | — | | | | (8,943 | ) | | | (5,236,765 | ) | | | — | |
| | | | | — | | | | (3,222 | ) | | | (60,046 | ) | | | — | |
| | | | | — | | | | (181 | ) | | | (2,655 | ) | | | — | |
| | | | | — | | | | (2,634 | ) | | | (400,311 | ) | | | — | |
| | | | | (1,060,003 | ) | | | (1,252,446 | ) | | | (44,841,777 | ) | | | (32,360,506 | ) |
| |
FROM CAPITAL SHARE TRANSACTIONS: | | | | | | | | | | | | | | | | | | |
Net proceeds from sale of shares | | | | | 6,351,082 | | | | 22,363,258 | | | | 509,177,465 | | | | 391,678,723 | |
Reinvestment of distributions | | | | | 865,547 | | | | 1,031,590 | | | | 37,756,214 | | | | 28,050,981 | |
| | | | | 7,216,629 | | | | 23,394,848 | | | | 546,933,679 | | | | 419,729,704 | |
| | | | | (40,900,474 | ) | | | (79,537,970 | ) | | | (371,164,423 | ) | | | (284,914,258 | ) |
Net increase (decrease) in net assets resulting from capital share transactions | | | | | (33,683,845 | ) | | | (56,143,122 | ) | | | 175,769,256 | | | | 134,815,446 | |
Net increase (decrease) in net assets | | | | | (30,330,327 | ) | | | (65,775,796 | ) | | | 169,195,057 | | | | 107,975,748 | |
| |
| | | | | | | | | | | | | | | | | | |
Beginning of year or period | | | | | 127,062,441 | | | | 192,838,237 | | | | 634,785,574 | | | | 526,809,826 | |
| | | | $ | 96,732,114 | | | $ | 127,062,441 | | | $ | 803,980,631 | | | $ | 634,785,574 | |
Undistributed (distributions in excess of) net investment income at end of year or period | | | | $ | 343,923 | | | $ | (3,478 | ) | | $ | (3,407,671 | ) | | $ | 396,522 | |
See Accompanying Notes to Financial Statements
32
STATEMENTS OF CHANGES IN NET ASSETS
| | | | ING Global Value Choice Fund
| | ING Index Plus International Equity Fund
| |
|---|
| | | | Year Ended
October 31,
2012
| | Year Ended
October 31,
2011
| | Year Ended
October 31,
2012
| | Year Ended
October 31,
2011
|
|---|
| | | | | | | | | | | | | | | | | | |
| | | | $ | 3,021,333 | | | $ | 4,470,605 | | | $ | 2,439,472 | | | $ | 2,130,084 | |
| | | | | (34,832,397 | ) | | | 72,126,776 | | | | (1,986,760 | ) | | | 7,773,885 | |
Net change in unrealized appreciation (depreciation) | | | | | (7,498,513 | ) | | | (72,744,924 | ) | | | 2,874,102 | | | | (10,985,298 | ) |
Increase (decrease) in net assets resulting from operations | | | | | (39,309,577 | ) | | | 3,852,457 | | | | 3,326,814 | | | | (1,081,329 | ) |
| |
FROM DISTRIBUTIONS TO SHAREHOLDERS: | | | | | | | | | | | | | | | | | | |
| | | | | | | | | | | | | | | | | | |
| | | | | (2,085,360 | ) | | | (3,111,531 | ) | | | (172,400 | ) | | | (119,991 | ) |
| | | | | — | | | | (43,014 | ) | | | (4,426 | ) | | | (2,716 | ) |
| | | | | (366,940 | ) | | | (1,315,055 | ) | | | (15,082 | ) | | | (5,994 | ) |
| | | | | (2,716,720 | ) | | | (2,957,286 | ) | | | (1,376,087 | ) | | | (1,354,511 | ) |
| | | | | — | | | | — | | | | (927,783 | ) | | | (609,056 | ) |
| | | | | (288,923 | ) | | | (584,591 | ) | | | (83 | ) | | | — | |
| | | | | | | | | | | | | | | | | | |
| | | | | (20,838,644 | ) | | | — | | | | — | | | | — | |
| | | | | (485,497 | ) | | | — | | | | — | | | | — | |
| | | | | (13,221,207 | ) | | | — | | | | — | | | | — | |
| | | | | (19,281,134 | ) | | | — | | | | — | | | | — | |
| | | | | (2,277,810 | ) | | | — | | | | — | | | | — | |
| | | | | (61,562,235 | ) | | | (8,011,477 | ) | | | (2,495,861 | ) | | | (2,092,268 | ) |
| |
FROM CAPITAL SHARE TRANSACTIONS: | | | | | | | | | | | | | | | | | | |
Net proceeds from sale of shares | | | | | 54,481,797 | | | | 389,319,314 | | | | 10,801,680 | | | | 51,836,203 | |
Payment from distribution/payment by affiliate | | | | | 364,932 | | | | — | | | | — | | | | — | |
Reinvestment of distributions | | | | | 36,770,617 | | | | 4,386,066 | | | | 1,596,949 | | | | 1,504,647 | |
| | | | | 91,617,346 | | | | 393,705,380 | | | | 12,398,629 | | | | 53,340,850 | |
| | | | | (453,328,903 | ) | | | (243,707,957 | ) | | | (51,575,951 | ) | | | (93,789,046 | ) |
Net increase (decrease) in net assets resulting from capital share transactions | | | | | (361,711,557 | ) | | | 149,997,423 | | | | (39,177,322 | ) | | | (40,448,196 | ) |
Net increase (decrease) in net assets | | | | | (462,583,369 | ) | | | 145,838,403 | | | | (38,346,369 | ) | | | (43,621,793 | ) |
| |
| | | | | | | | | | | | | | | | | | |
Beginning of year or period | | | | | 640,165,025 | | | | 494,326,622 | | | | 94,728,942 | | | | 138,350,735 | |
| | | | $ | 177,581,656 | | | $ | 640,165,025 | | | $ | 56,382,573 | | | $ | 94,728,942 | |
Undistributed net investment income at end of year or period | | | | $ | 678,384 | | | $ | 4,867,897 | | | $ | 2,410,014 | | | $ | 2,285,357 | |
See Accompanying Notes to Financial Statements
33
STATEMENTS OF CHANGES IN NET ASSETS
| | | | ING International Small Cap Fund
| | ING International Value Choice Fund
| |
|---|
| | | | Year Ended
October 31,
2012
| | Year Ended
October 31,
2011
| | Year Ended
October 31,
2012
| | Year Ended
October 31,
2011
|
|---|
| | | | | | | | | | | | | | | | | | |
| | | | $ | 3,487,467 | | | $ | 4,194,520 | | | $ | 431,484 | | | $ | 729,357 | |
| | | | | (884,643 | ) | | | 44,928,242 | | | | (2,448,801 | ) | | | (265,944 | ) |
Net change in unrealized appreciation (depreciation) | | | | | 10,619,358 | | | | (62,985,420 | ) | | | 108,873 | | | | (4,469,597 | ) |
Increase (decrease) in net assets resulting from operations | | | | | 13,222,182 | | | | (13,862,658 | ) | | | (1,908,444 | ) | | | (4,006,184 | ) |
| |
FROM DISTRIBUTIONS TO SHAREHOLDERS: | | | | | | | | | | | | | | | | | | |
| | | | | | | | | | | | | | | | | | |
| | | | | (1,557,769 | ) | | | (540,772 | ) | | | (562,622 | ) | | | (190,808 | ) |
| | | | | (10,775 | ) | | | (56 | ) | | | (7,167 | ) | | | — | |
| | | | | (230,441 | ) | | | (572 | ) | | | (80,404 | ) | | | (12,953 | ) |
| | | | | (3,055,854 | ) | | | (1,827,105 | ) | | | (122,252 | ) | | | (187,574 | ) |
| | | | | (25,934 | ) | | | (6,464 | ) | | | — | | | | — | |
| | | | | (458,648 | ) | | | (240,091 | ) | | | (1,980 | ) | | | (516 | ) |
| | | | | (5,339,421 | ) | | | (2,615,060 | ) | | | (774,425 | ) | | | (391,851 | ) |
| |
FROM CAPITAL SHARE TRANSACTIONS: | | | | | | | | | | | | | | | | | | |
Net proceeds from sale of shares | | | | | 29,267,070 | | | | 79,921,323 | | | | 13,499,438 | | | | 22,439,247 | |
Payment from distribution/payment by affiliate | | | | | 821,983 | | | | 136,362 | | | | — | | | | — | |
Reinvestment of distributions | | | | | 3,263,088 | | | | 1,515,427 | | | | 677,136 | | | | 351,441 | |
| | | | | 33,352,141 | | | | 81,573,112 | | | | 14,176,574 | | | | 22,790,688 | |
| | | | | (106,730,639 | ) | | | (192,605,155 | ) | | | (18,392,169 | ) | | | (35,264,069 | ) |
Net decrease in net assets resulting from capital share transactions | | | | | (73,378,498 | ) | | | (111,032,043 | ) | | | (4,215,595 | ) | | | (12,473,381 | ) |
Net decrease in net assets | | | | | (65,495,737 | ) | | | (127,509,761 | ) | | | (6,898,464 | ) | | | (16,871,416 | ) |
| |
| | | | | | | | | | | | | | | | | | |
Beginning of year or period | | | | | 307,668,967 | | | | 435,178,728 | | | | 29,922,785 | | | | 46,794,201 | |
| | | | $ | 242,173,230 | | | $ | 307,668,967 | | | $ | 23,024,321 | | | $ | 29,922,785 | |
Undistributed net investment income at end of year or period | | | | $ | 4,269,957 | | | $ | 4,023,061 | | | $ | 365,448 | | | $ | 725,238 | |
See Accompanying Notes to Financial Statements
34
STATEMENTS OF CHANGES IN NET ASSETS
| | | | ING International Value Fund
| | ING Russia Fund
| |
|---|
| | | | Year Ended
October 31,
2012
| | Year Ended
October 31,
2011
| | Year Ended
October 31,
2012
| | Year Ended
October 31,
2011
|
|---|
| | | | | | | | | | | | | | | | | | |
Net investment income (loss) | | | | $ | 11,760,505 | | | $ | 16,501,957 | | | $ | 1,234,539 | | | $ | (1,256,315 | ) |
| | | | | (57,627,771 | ) | | | (15,527,252 | ) | | | (2,514,104 | ) | | | 1,651,353 | |
Net change in unrealized appreciation (depreciation) | | | | | 44,269,093 | | | | (63,706,978 | ) | | | (19,656,224 | ) | | | (29,282,257 | ) |
Decrease in net assets resulting from operations | | | | | (1,598,173 | ) | | | (62,732,273 | ) | | | (20,935,789 | ) | | | (28,887,219 | ) |
| |
FROM DISTRIBUTIONS TO SHAREHOLDERS: | | | | | | | | | | | | | | | | | | |
| | | | | | | | | | | | | | | | | | |
| | | | | (7,601,085 | ) | | | (10,059,110 | ) | | | — | | | | — | |
| | | | | (20,538 | ) | | | (81 | ) | | | — | | | | — | |
| | | | | (2,495,707 | ) | | | (2,824,431 | ) | | | — | | | | — | |
| | | | | (7,967,223 | ) | | | (9,798,033 | ) | | | — | | | | — | |
| | | | | (9,108 | ) | | | (545,238 | ) | | | — | | | | — | |
| | | | | (18,093,661 | ) | | | (23,226,893 | ) | | | — | | | | — | |
| |
FROM CAPITAL SHARE TRANSACTIONS: | | | | | | | | | | | | | | | | | | |
Net proceeds from sale of shares | | | | | 36,063,881 | | | | 158,710,188 | | | | 24,129,463 | | | | 62,067,223 | |
Payment from distribution/payment by affiliate | | | | | 860,591 | | | | 115,624 | | | | — | | | | — | |
Reinvestment of distributions | | | | | 14,532,214 | | | | 18,121,879 | | | | — | | | | — | |
| | | | | 51,456,686 | | | | 176,947,691 | | | | 24,129,463 | | | | 62,067,223 | |
| | | | | — | | | | — | | | | 133,331 | | | | 217,940 | |
| | | | | (252,961,793 | ) | | | (623,758,163 | ) | | | (87,210,483 | ) | | | (131,466,024 | ) |
Net decrease in net assets resulting from capital share transactions | | | | | (201,505,107 | ) | | | (446,810,472 | ) | | | (62,947,689 | ) | | | (69,180,861 | ) |
Net decrease in net assets | | | | | (221,196,941 | ) | | | (532,769,638 | ) | | | (83,883,478 | ) | | | (98,068,080 | ) |
| |
| | | | | | | | | | | | | | | | | | |
Beginning of year or period | | | | | 703,780,494 | | | | 1,236,550,132 | | | | 328,244,953 | | | | 426,313,033 | |
| | | | $ | 482,583,553 | | | $ | 703,780,494 | | | $ | 244,361,475 | | | $ | 328,244,953 | |
Undistributed net investment income/Accumulated net investment loss at end of year or period | | | | $ | 11,361,011 | | | $ | 16,370,623 | | | $ | 973,892 | | | $ | (6,466 | ) |
See Accompanying Notes to Financial Statements
35
FINANCIAL HIGHLIGHTS
Selected data for a share of beneficial interest outstanding throughout each year or period.
| | | | | | Income (loss)
from investment
operations
|
| | | Less distributions
|
| | | | | | | | | Ratios to average
net assets
| | Supplemental
data
| |
|---|
| | | | | | | | | | | | | | | | | | | | | | | | | | | | | | | | | | | | | | |
|---|
| | | | Net
asset
value,
beginning
of year
or period
|
| Net
investment
income
(loss)
|
| Net
realized
and
unrealized
gain
(loss)
|
| Total
from
investment
operations
|
| From
net
investment
income
|
| From
net
realized
gains
|
| From
return
of
capital
|
| Total
distributions
|
| Payment
by
affiliate
|
| Net
asset
value,
end of
year or
period
|
| Total
Return(1)
|
| Expenses
before
reductions/
additions(2)(3)
|
| Expenses
net
of fee
waivers
and/or
recoupments
if any(2)(3)
|
| Expenses
net of
all
reductions/
additions(2)(3)
|
| Net
investment
income
(loss)(2)(3)
|
| Net
assets,
end of
year or
period
|
| Portfolio
turnover
rate
|
|---|
Year or period ended
|
|
|
| ($)
|
| ($)
|
| ($)
|
| ($)
|
| ($)
|
| ($)
|
| ($)
|
| ($)
|
| ($)
|
| ($)
|
| (%)
|
| (%)
|
| (%)
|
| (%)
|
| (%)
|
| ($000’s)
|
| (%)
|
|---|
ING Diversified International Fund | | | | | | | | | | | | | | | | | | | | | | | | | | | | | | | | | | | | | | | | | | | | | | | | | | | | | | | | | | | | | | | |
| | | | | | | | | | | | | | | | | | | | | | | | | | | | | | | | | | | | | | | | | | | | | | | | | | | | | | | | | | | | | | | | | | | | | | |
| | | | | 8.62 | | | | 0.12 | | | | 0.32 | | | | 0.44 | | | | 0.11 | | | | — | | | | — | | | | 0.11 | | | | — | | | | 8.95 | | | | 5.19 | | | | 0.73 | | | | 0.50 | | | | 0.50 | | | | 1.47 | | | | 46,504 | | | | 20 | |
| | | | | 9.33 | | | | 0.08 | | | | (0.70 | ) | | | (0.62 | ) | | | 0.08 | | | | — | | | | 0.01 | | | | 0.09 | | | | — | | | | 8.62 | | | | (6.73 | ) | | | 0.68 | | | | 0.50 | | | | 0.50 | | | | 0.97 | | | | 61,325 | | | | 112 | |
| | | | | 8.27 | | | | 0.06 | | | | 1.07 | | | | 1.13 | | | | 0.06 | | | | — | | | | 0.01 | | | | 0.07 | | | | — | | | | 9.33 | | | | 13.71 | | | | 0.63 | | | | 0.39 | | | | 0.39 | | | | 0.76 | | | | 102,460 | | | | 49 | |
| | | | | 7.30 | | | | 0.24 | • | | | 1.59 | | | | 1.83 | | | | 0.86 | | | | — | | | | — | | | | 0.86 | | | | — | | | | 8.27 | | | | 28.22 | | | | 0.76 | | | | 0.38 | | | | 0.38 | | | | 3.45 | | | | 129,966 | | | | 32 | |
| | | | | 14.98 | | | | 0.17 | • | | | (7.50 | ) | | | (7.33 | ) | | | 0.26 | | | | 0.09 | | | | — | | | | 0.35 | | | | — | | | | 7.30 | | | | (50.04 | ) | | | 0.57 | | | | 0.31 | | | | 0.31 | | | | 1.41 | | | | 167,282 | | | | 55 | |
| | | | | | | | | | | | | | | | | | | | | | | | | | | | | | | | | | | | | | | | | | | | | | | | | | | | | | | | | | | | | | | | | | | | | | |
| | | | | 8.57 | | | | 0.06 | | | | 0.31 | | | | 0.37 | | | | 0.02 | | | | — | | | | — | | | | 0.02 | | | | — | | | | 8.92 | | | | 4.37 | | | | 1.48 | | | | 1.25 | | | | 1.25 | | | | 0.70 | | | | 7,795 | | | | 20 | |
| | | | | 9.27 | | | | 0.02 | | | | (0.71 | ) | | | (0.69 | ) | | | 0.00 | * | | | — | | | | 0.01 | | | | 0.01 | | | | — | | | | 8.57 | | | | (7.42 | ) | | | 1.43 | | | | 1.25 | | | | 1.25 | | | | 0.18 | | | | 10,193 | | | | 112 | |
| | | | | 8.23 | | | | (0.00 | )* | | | 1.05 | | | | 1.05 | | | | — | | | | — | | | | 0.01 | | | | 0.01 | | | | — | | | | 9.27 | | | | 12.78 | | | | 1.38 | | | | 1.14 | | | | 1.14 | | | | (0.03 | ) | | | 16,616 | | | | 49 | |
| | | | | 7.22 | | | | 0.17 | • | | | 1.61 | | | | 1.78 | | | | 0.77 | | | | — | | | | — | | | | 0.77 | | | | — | | | | 8.23 | | | | 27.46 | | | | 1.51 | | | | 1.13 | | | | 1.13 | | | | 2.43 | | | | 19,919 | | | | 32 | |
| | | | | 14.84 | | | | 0.07 | | | | (7.43 | ) | | | (7.36 | ) | | | 0.17 | | | | 0.09 | | | | — | | | | 0.26 | | | | — | | | | 7.22 | | | | (50.43 | ) | | | 1.32 | | | | 1.06 | | | | 1.06 | | | | 0.67 | | | | 20,167 | | | | 55 | |
| | | | | | | | | | | | | | | | | | | | | | | | | | | | | | | | | | | | | | | | | | | | | | | | | | | | | | | | | | | | | | | | | | | | | | |
| | | | | 8.55 | | | | 0.06 | | | | 0.31 | | | | 0.37 | | | | 0.02 | | | | — | | | | — | | | | 0.02 | | | | — | | | | 8.90 | | | | 4.39 | | | | 1.48 | | | | 1.25 | | | | 1.25 | | | | 0.70 | | | | 27,903 | | | | 20 | |
| | | | | 9.26 | | | | 0.01 | | | | (0.70 | ) | | | (0.69 | ) | | | 0.01 | | | | — | | | | 0.01 | | | | 0.02 | | | | — | | | | 8.55 | | | | (7.51 | ) | | | 1.43 | | | | 1.25 | | | | 1.25 | | | | 0.15 | | | | 38,542 | | | | 112 | |
| | | | | 8.21 | | | | (0.00 | )* | | | 1.06 | | | | 1.06 | | | | — | | | | — | | | | 0.01 | | | | 0.01 | | | | — | | | | 9.26 | | | | 12.88 | | | | 1.38 | | | | 1.14 | | | | 1.14 | | | | (0.01 | ) | | | 59,015 | | | | 49 | |
| | | | | 7.21 | | | | 0.17 | • | | | 1.60 | | | | 1.77 | | | | 0.77 | | | | — | | | | — | | | | 0.77 | | | | — | | | | 8.21 | | | | 27.32 | | | | 1.51 | | | | 1.13 | | | | 1.13 | | | | 2.54 | | | | 71,831 | | | | 32 | |
| | | | | 14.83 | | | | 0.07 | | | | (7.42 | ) | | | (7.35 | ) | | | 0.18 | | | | 0.09 | | | | — | | | | 0.27 | | | | — | | | | 7.21 | | | | (50.43 | ) | | | 1.32 | | | | 1.06 | | | | 1.06 | | | | 0.67 | | | | 78,834 | | | | 55 | |
| | | | | | | | | | | | | | | | | | | | | | | | | | | | | | | | | | | | | | | | | | | | | | | | | | | | | | | | | | | | | | | | | | | | | | |
| | | | | 8.61 | | | | 0.13 | | | | 0.32 | | | | 0.45 | | | | 0.13 | | | | — | | | | — | | | | 0.13 | | | | — | | | | 8.93 | | | | 5.43 | | | | 0.48 | | | | 0.25 | | | | 0.25 | | | | 1.63 | | | | 9,953 | | | | 20 | |
| | | | | 9.32 | | | | 0.08 | • | | | (0.67 | ) | | | (0.59 | ) | | | 0.11 | | | | — | | | | 0.01 | | | | 0.12 | | | | — | | | | 8.61 | | | | (6.46 | ) | | | 0.28 | | | | 0.25 | | | | 0.25 | | | | 0.81 | | | | 11,957 | | | | 112 | |
| | | | | 8.26 | | | | 0.03 | • | | | 1.12 | | | | 1.15 | | | | 0.08 | | | | — | | | | 0.01 | | | | 0.09 | | | | — | | | | 9.32 | | | | 13.98 | | | | 0.35 | | | | 0.14 | | | | 0.14 | | | | 0.36 | | | | 9,188 | | | | 49 | |
| | | | | 7.30 | | | | 0.31 | • | | | 1.55 | | | | 1.86 | | | | 0.90 | | | | — | | | | — | | | | 0.90 | | | | — | | | | 8.26 | | | | 28.78 | | | | 0.48 | | | | 0.10 | | | | 0.10 | | | | 4.55 | | | | 3,209 | | | | 32 | |
| | | | | 14.99 | | | | 0.21 | | | | (7.53 | ) | | | (7.32 | ) | | | 0.28 | | | | 0.09 | | | | — | | | | 0.37 | | | | — | | | | 7.30 | | | | (49.97 | ) | | | 0.32 | | | | 0.06 | | | | 0.06 | | | | 1.69 | | | | 16 | | | | 55 | |
| | | | | | | | | | | | | | | | | | | | | | | | | | | | | | | | | | | | | | | | | | | | | | | | | | | | | | | | | | | | | | | | | | | | | | |
| | | | | 8.56 | | | | 0.11 | | | | 0.31 | | | | 0.42 | | | | 0.11 | | | | — | | | | — | | | | 0.11 | | | | — | | | | 8.87 | | | | 5.09 | | | | 0.73 | | | | 0.50 | | | | 0.50 | | | | 1.25 | | | | 3,833 | | | | 20 | |
| | | | | 9.28 | | | | 0.07 | | | | (0.69 | ) | | | (0.62 | ) | | | 0.09 | | | | — | | | | 0.01 | | | | 0.10 | | | | — | | | | 8.56 | | | | (6.75 | ) | | | 0.68 | | | | 0.50 | | | | 0.50 | | | | 0.62 | | | | 3,516 | | | | 112 | |
| | | | | 8.24 | | | | 0.05 | • | | | 1.08 | | | | 1.13 | | | | 0.08 | | | | — | | | | 0.01 | | | | 0.09 | | | | — | | | | 9.28 | | | | 13.81 | | | | 0.63 | | | | 0.34 | | | | 0.34 | | | | 0.55 | | | | 2,947 | | | | 49 | |
| | | | | 7.29 | | | | 0.10 | • | | | 1.74 | | | | 1.84 | | | | 0.89 | | | | — | | | | — | | | | 0.89 | | | | — | | | | 8.24 | | | | 28.45 | | | | 0.76 | | | | 0.38 | | | | 0.38 | | | | 1.30 | | | | 1,911 | | | | 32 | |
| | | | | 12.99 | | | | 0.02 | • | | | (5.72 | ) | | | (5.70 | ) | | | — | | | | — | | | | — | | | | — | | | | — | | | | 7.29 | | | | (43.88 | ) | | | 0.57 | | | | 0.31 | | | | 0.31 | | | | 0.48 | | | | 140 | | | | 55 | |
| | | | | | | | | | | | | | | | | | | | | | | | | | | | | | | | | | | | | | | | | | | | | | | | | | | | | | | | | | | | | | | | | | | | | | |
| | | | | 8.52 | | | | 0.13 | • | | | 0.28 | | | | 0.41 | | | | 0.09 | | | | — | | | | — | | | | 0.09 | | | | — | | | | 8.84 | | | | 4.87 | | | | 0.98 | | | | 0.75 | | | | 0.75 | | | | 1.53 | | | | 96 | | | | 20 | |
| | | | | 9.22 | | | | 0.05 | | | | (0.68 | ) | | | (0.63 | ) | | | 0.06 | | | | — | | | | 0.01 | | | | 0.07 | | | | — | | | | 8.52 | | | | (6.89 | ) | | | 0.93 | | | | 0.75 | | | | 0.75 | | | | 0.58 | | | | 137 | | | | 112 | |
| | | | | 8.18 | | | | 0.04 | • | | | 1.05 | | | | 1.09 | | | | 0.04 | | | | — | | | | 0.01 | | | | 0.05 | | | | — | | | | 9.22 | | | | 13.40 | | | | 0.88 | | | | 0.64 | | | | 0.64 | | | | 0.47 | | | | 173 | | | | 49 | |
| | | | | 7.22 | | | | 0.20 | | | | 1.60 | | | | 1.80 | | | | 0.84 | | | | — | | | | — | | | | 0.84 | | | | — | | | | 8.18 | | | | 28.13 | | | | 1.01 | | | | 0.63 | | | | 0.63 | | | | 2.94 | | | | 198 | | | | 32 | |
| | | | | 14.82 | | | | 0.15 | | | | (7.44 | ) | | | (7.29 | ) | | | 0.22 | | | | 0.09 | | | | — | | | | 0.31 | | | | — | | | | 7.22 | | | | (50.18 | ) | | | 0.82 | | | | 0.56 | | | | 0.56 | | | | 1.26 | | | | 183 | | | | 55 | |
| | | | | | | | | | | | | | | | | | | | | | | | | | | | | | | | | | | | | | | | | | | | | | | | | | | | | | | | | | | | | | | | | | | | | | |
| | | | | 8.58 | | | | 0.15 | | | | 0.30 | | | | 0.45 | | | | 0.13 | | | | — | | | | — | | | | 0.13 | | | | — | | | | 8.90 | | | | 5.48 | | | | 0.48 | | | | 0.25 | | | | 0.25 | | | | 1.86 | | | | 647 | | | | 20 | |
| | | | | 9.30 | | | | 0.12 | • | | | (0.72 | ) | | | (0.60 | ) | | | 0.11 | | | | — | | | | 0.01 | | | | 0.12 | | | | — | | | | 8.58 | | | | (6.55 | ) | | | 0.43 | | | | 0.25 | | | | 0.25 | | | | 1.29 | | | | 1,392 | | | | 112 | |
| �� | | | | 8.25 | | | | 0.09 | • | | | 1.06 | | | | 1.15 | | | | 0.09 | | | | — | | | | 0.01 | | | | 0.10 | | | | — | | | | 9.30 | | | | 14.07 | | | | 0.38 | | | | 0.09 | | | | 0.09 | | | | 1.03 | | | | 2,440 | | | | 49 | |
| | | | | 7.29 | | | | 0.21 | • | | | 1.65 | | | | 1.86 | | | | 0.90 | | | | — | | | | — | | | | 0.90 | | | | — | | | | 8.25 | | | | 28.84 | | | | 0.48 | | | | 0.10 | | | | 0.10 | | | | 2.96 | | | | 2,545 | | | | 32 | |
| | | | | 12.17 | | | | 0.06 | • | | | (4.94 | ) | | | (4.88 | ) | | | — | | | | — | | | | — | | | | — | | | | — | | | | 7.29 | | | | (40.10 | ) | | | 0.32 | | | | 0.06 | | | | 0.06 | | | | 0.80 | | | | 1,506 | | | | 55 | |
| | | | | | | | | | | | | | | | | | | | | | | | | | | | | | | | | | | | | | | | | | | | | | | | | | | | | | | | | | | | | | | | | | | | | | |
| | | | | | | | | | | | | | | | | | | | | | | | | | | | | | | | | | | | | | | | | | | | | | | | | | | | | | | | | | | | | | | | | | | | | | |
| | | | | 11.76 | | | | 0.40 | • | | | 0.22 | | | | 0.62 | | | | 0.14 | | | | 0.45 | | | | 0.16 | | | | 0.75 | | | | — | | | | 11.63 | | | | 5.69 | | | | 0.93 | | | | 0.90 | | | | 0.90 | | | | 3.46 | | | | 219,276 | | | | 609 | |
| | | | | 12.32 | | | | 0.46 | • | | | (0.32 | ) | | | 0.14 | | | | 0.59 | | | | 0.11 | | | | — | | | | 0.70 | | | | — | | | | 11.76 | | | | 1.32 | | | | 0.96 | | | | 0.90 | † | | | 0.90 | † | | | 3.88 | † | | | 266,155 | | | | 440 | |
| | | | | 12.25 | | | | 0.53 | • | | | 0.30 | | | | 0.83 | | | | 0.71 | | | | 0.05 | | | | — | | | | 0.76 | | | | — | | | | 12.32 | | | | 7.14 | | | | 1.00 | | | | 0.90 | † | | | 0.90 | † | | | 4.43 | † | | | 192,384 | | | | 440 | |
| | | | | 10.19 | | | | 0.32 | | | | 2.13 | | | | 2.45 | | | | 0.15 | | | | 0.24 | | | | — | | | | 0.39 | | | | — | | | | 12.25 | | | | 24.43 | | | | 1.06 | | | | 0.91 | † | | | 0.91 | † | | | 3.30 | † | | | 103,255 | | | | 396 | |
| | | | | 10.59 | | | | 0.27 | • | | | 0.07 | | | | 0.34 | | | | 0.62 | | | | 0.12 | | | | — | | | | 0.74 | | | | — | | | | 10.19 | | | | 3.04 | | | | 1.05 | | | | 0.93 | † | | | 0.93 | † | | | 2.53 | † | | | 79,451 | | | | 830 | |
See Accompanying Notes to Financial Statements
36
FINANCIAL HIGHLIGHTS (CONTINUED)
Selected data for a share of beneficial interest outstanding throughout each year or period.
| | | | | | Income (loss)
from investment
operations
|
| | | Less distributions
|
| | | | | | | | | Ratios to average
net assets
| | Supplemental
data
| |
|---|
| | | | | | | | | | | | | | | | | | | | | | | | | | | | | | | | | | | | | | |
|---|
| | | | Net
asset
value,
beginning
of year
or period
|
| Net
investment
income
(loss)
|
| Net
realized
and
unrealized
gain
(loss)
|
| Total
from
investment
operations
|
| From
net
investment
income
|
| From
net
realized
gains
|
| From
return
of
capital
|
| Total
distributions
|
| Payment
by
affiliate
|
| Net
asset
value,
end of
year or
period
|
| Total
Return(1)
|
| Expenses
before
reductions/
additions(2)(3)
|
| Expenses
net of
fee
waivers
and/or
recoupments
if any(2)(3)
|
| Expenses
net
of all
reductions/
additions(2)(3)
|
| Net
investment
income
(loss)(2)(3)
|
| Net
assets,
end of
year or
period
|
| Portfolio
turnover
rate
|
|---|
Year or period ended
|
|
|
| ($)
|
| ($)
|
| ($)
|
| ($)
|
| ($)
|
| ($)
|
| ($)
|
| ($)
|
| ($)
|
| ($)
|
| (%)
|
| (%)
|
| (%)
|
| (%)
|
| (%)
|
| ($000’s)
|
| (%)
|
|---|
ING Global Bond Fund (continued) | | | | | | | | | | | | | | | | | | | | | | | | | | | | | | | | | | | | | | | | | | | | | | | |
| | | | | | | | | | | | | | | | | | | | | | | | | | | | | | | | | | | | | | | | | | | | | | | | | | | | | | | | | | | | | | | | | | | | | | |
| | | | | 11.66 | | | | 0.32 | • | | | 0.20 | | | | 0.52 | | | | 0.06 | | | | 0.45 | | | | 0.16 | | | | 0.67 | | | | — | | | | 11.51 | | | | 4.78 | | | | 1.68 | | | | 1.65 | | | | 1.65 | | | | 2.77 | | | | 1,587 | | | | 609 | |
| | | | | 12.21 | | | | 0.42 | | | | (0.36 | ) | | | 0.06 | | | | 0.50 | | | | 0.11 | | | | — | | | | 0.61 | | | | — | | | | 11.66 | | | | 0.65 | | | | 1.71 | | | | 1.65 | † | | | 1.65 | † | | | 3.33 | † | | | 2,086 | | | | 440 | |
| | | | | 12.16 | | | | 0.46 | | | | 0.27 | | | | 0.73 | | | | 0.63 | | | | 0.05 | | | | — | | | | 0.68 | | | | — | | | | 12.21 | | | | 6.22 | | | | 1.75 | | | | 1.65 | † | | | 1.65 | † | | | 3.79 | † | | | 4,125 | | | | 440 | |
| | | | | 10.16 | | | | 0.29 | | | | 2.07 | | | | 2.36 | | | | 0.12 | | | | 0.24 | | | | — | | | | 0.36 | | | | — | | | | 12.16 | | | | 23.56 | | | | 1.81 | | | | 1.66 | † | | | 1.66 | † | | | 2.59 | † | | | 5,135 | | | | 396 | |
| | | | | 10.55 | | | | 0.18 | • | | | 0.08 | | | | 0.26 | | | | 0.53 | | | | 0.12 | | | | — | | | | 0.65 | | | | — | | | | 10.16 | | | | 2.26 | | | | 1.80 | | | | 1.68 | † | | | 1.68 | † | | | 1.71 | † | | | 4,085 | | | | 830 | |
| | | | | | | | | | | | | | | | | | | | | | | | | | | | | | | | | | | | | | | | | | | | | | | | | | | | | | | | | | | | | | | | | | | | | | |
| | | | | 11.70 | | | | 0.32 | • | | | 0.21 | | | | 0.53 | | | | 0.06 | | | | 0.45 | | | | 0.16 | | | | 0.67 | | | | — | | | | 11.56 | | | | 4.86 | | | | 1.68 | | | | 1.65 | | | | 1.65 | | | | 2.77 | | | | 109,381 | | | | 609 | |
| | | | | 12.25 | | | | 0.38 | | | | (0.31 | ) | | | 0.07 | | | | 0.51 | | | | 0.11 | | | | — | | | | 0.62 | | | | — | | | | 11.70 | | | | 0.65 | | | | 1.71 | | | | 1.65 | † | | | 1.65 | † | | | 3.25 | † | | | 89,510 | | | | 440 | |
| | | | | 12.20 | | | | 0.43 | • | | | 0.30 | | | | 0.73 | | | | 0.63 | | | | 0.05 | | | | — | | | | 0.68 | | | | — | | | | 12.25 | | | | 6.23 | | | | 1.75 | | | | 1.65 | † | | | 1.65 | † | | | 3.65 | † | | | 90,458 | | | | 440 | |
| | | | | 10.20 | | | | 0.28 | • | | | 2.08 | | | | 2.36 | | | | 0.12 | | | | 0.24 | | | | — | | | | 0.36 | | | | — | | | | 12.20 | | | | 23.48 | | | | 1.81 | | | | 1.66 | † | | | 1.66 | † | | | 2.54 | † | | | 45,773 | | | | 396 | |
| | | | | 10.59 | | | | 0.18 | • | | | 0.09 | | | | 0.27 | | | | 0.54 | | | | 0.12 | | | | — | | | | 0.66 | | | | — | | | | 10.20 | | | | 2.31 | | | | 1.80 | | | | 1.68 | † | | | 1.68 | † | | | 1.71 | † | | | 29,009 | | | | 830 | |
| | | | | | | | | | | | | | | | | | | | | | | | | | | | | | | | | | | | | | | | | | | | | | | | | | | | | | | | | | | | | | | | | | | | | | |
| | | | | 11.73 | | | | 0.44 | • | | | 0.21 | | | | 0.65 | | | | 0.18 | | | | 0.45 | | | | 0.16 | | | | 0.79 | | | | — | | | | 11.59 | | | | 5.94 | | | | 0.63 | | | | 0.60 | | | | 0.60 | | | | 3.82 | | | | 437,620 | | | | 609 | |
| | | | | 12.28 | | | | 0.51 | • | | | (0.32 | ) | | | 0.19 | | | | 0.63 | | | | 0.11 | | | | — | | | | 0.74 | | | | — | | | | 11.73 | | | | 1.75 | | | | 0.62 | | | | 0.56 | † | | | 0.56 | † | | | 4.34 | † | | | 251,112 | | | | 440 | |
| | | | | 12.22 | | | | 0.56 | • | | | 0.31 | | | | 0.87 | | | | 0.76 | | | | 0.05 | | | | — | | | | 0.81 | | | | — | | | | 12.28 | | | | 7.44 | | | | 0.65 | | | | 0.55 | † | | | 0.55 | † | | | 4.73 | † | | | 222,123 | | | | 440 | |
| | | | | 10.21 | | | | 0.45 | • | | | 2.04 | | | | 2.49 | | | | 0.24 | | | | 0.24 | | | | — | | | | 0.48 | | | | — | | | | 12.22 | | | | 24.94 | | | | 0.71 | | | | 0.56 | † | | | 0.56 | † | | | 3.89 | † | | | 136,178 | | | | 396 | |
| | | | | 10.58 | | | | 0.28 | • | | | 0.14 | | | | 0.42 | | | | 0.67 | | | | 0.12 | | | | — | | | | 0.79 | | | | — | | | | 10.21 | | | | 3.78 | | | | 0.74 | | | | 0.62 | † | | | 0.62 | † | | | 2.69 | † | | | 503 | | | | 830 | |
| | | | | | | | | | | | | | | | | | | | | | | | | | | | | | | | | | | | | | | | | | | | | | | | | | | | | | | | | | | | | | | | | | | | | | |
| | | | | 11.57 | | | | 0.40 | | | | 0.21 | | | | 0.61 | | | | 0.15 | | | | 0.45 | | | | 0.16 | | | | 0.76 | | | | — | | | | 11.42 | | | | 5.62 | | | | 0.93 | | | | 0.90 | | | | 0.90 | | | | 3.52 | | | | 4,117 | | | | 609 | |
| | | | | 12.12 | | | | 0.46 | • | | | (0.31 | ) | | | 0.15 | | | | 0.59 | | | | 0.11 | | | | — | | | | 0.70 | | | | — | | | | 11.57 | | | | 1.43 | | | | 0.96 | | | | 0.90 | † | | | 0.90 | † | | | 3.98 | † | | | 3,985 | | | | 440 | |
| | | | | 12.06 | | | | 0.53 | • | | | 0.29 | | | | 0.82 | | | | 0.71 | | | | 0.05 | | | | — | | | | 0.76 | | | | — | | | | 12.12 | | | | 7.17 | | | | 1.00 | | | | 0.90 | † | | | 0.90 | † | | | 4.53 | † | | | 3,578 | | | | 440 | |
| | | | | 10.15 | | | | 0.37 | • | | | 2.04 | | | | 2.41 | | | | 0.26 | | | | 0.24 | �� | | | — | | | | 0.50 | | | | — | | | | 12.06 | | | | 24.26 | | | | 1.06 | | | | 0.91 | † | | | 0.91 | † | | | 3.30 | † | | | 3,126 | | | | 396 | |
| | | | | 10.65 | | | | 0.10 | • | | | (0.49 | ) | | | (0.39 | ) | | | 0.11 | | | | — | | | | — | | | | 0.11 | | | | — | | | | 10.15 | | | | (3.70 | ) | | | 1.05 | | | | 0.93 | † | | | 0.93 | † | | | 2.47 | † | | | 222 | | | | 830 | |
| | | | | | | | | | | | | | | | | | | | | | | | | | | | | | | | | | | | | | | | | | | | | | | | | | | | | | | | | | | | | | | | | | | | | | |
| | | | | 11.75 | | | | 0.39 | • | | | 0.19 | | | | 0.58 | | | | 0.11 | | | | 0.45 | | | | 0.16 | | | | 0.72 | | | | — | | | | 11.61 | | | | 5.30 | | | | 1.18 | | | | 1.15 | | | | 1.15 | | | | 3.42 | | | | 276 | | | | 609 | |
| | | | | 12.06 | | | | 0.12 | | | | (0.31 | ) | | | (0.19 | ) | | | 0.11 | | | | 0.01 | | | | — | | | | 0.12 | | | | — | | | | 11.75 | | | | (1.59 | ) | | | 1.21 | | | | 1.15 | † | | | 1.15 | † | | | 4.22 | † | | | 3 | | | | 440 | |
| | | | | | | | | | | | | | | | | | | | | | | | | | | | | | | | | | | | | | | | | | | | | | | | | | | | | | | | | | | | | | | | | | | | | | |
| | | | | 11.56 | | | | 0.43 | • | | | 0.20 | | | | 0.63 | | | | 0.17 | | | | 0.45 | | | | 0.16 | | | | 0.78 | | | | — | | | | 11.41 | | | | 5.89 | | | | 0.68 | | | | 0.65 | | | | 0.65 | | | | 3.79 | | | | 31,723 | | | | 609 | |
| | | | | 12.12 | | | | 0.48 | | | | (0.31 | ) | | | 0.17 | | | | 0.62 | | | | 0.11 | | | | — | | | | 0.73 | | | | — | | | | 11.56 | | | | 1.60 | | | | 0.71 | | | | 0.65 | † | | | 0.65 | † | | | 4.07 | † | | | 21,934 | | | | 440 | |
| | | | | 12.06 | | | | 0.52 | • | | | 0.34 | | | | 0.86 | | | | 0.75 | | | | 0.05 | | | | — | | | | 0.80 | | | | — | | | | 12.12 | | | | 7.45 | | | | 0.75 | | | | 0.65 | † | | | 0.65 | † | | | 4.44 | † | | | 14,142 | | | | 440 | |
| | | | | 11.22 | | | | 0.14 | • | | | 1.03 | | | | 1.17 | | | | 0.33 | | | | — | | | | — | | | | 0.33 | | | | — | | | | 12.06 | | | | 10.54 | | | | 0.71 | | | | 0.56 | † | | | 0.56 | † | | | 2.85 | † | | | 1,533 | | | | 396 | |
ING Global Value Choice Fund | | | | | | | | | | | | | | | | | | | | | | | | | | | | | | | | | | | | | | | | | | | | | | | |
| | | | | | | | | | | | | | | | | | | | | | | | | | | | | | | | | | | | | | | | | | | | | | | | | | | | | | | | | | | | | | | | | | | | | | |
| | | | | 32.23 | | | | 0.29 | • | | | (2.74 | ) | | | (2.45 | ) | | | 0.31 | | | | 3.05 | | | | — | | | | 3.36 | | | | 0.02 | | | | 26.44 | | | | (7.71 | )(a) | | | 1.58 | | | | 1.51 | | | | 1.47 | | | | 1.05 | | | | 82,688 | | | | 35 | |
| | | | | 31.83 | | | | 0.21 | | | | 0.66 | | | | 0.87 | | | | 0.47 | | | | — | | | | — | | | | 0.47 | | | | — | | | | 32.23 | | | | 2.69 | | | | 1.43 | | | | 1.43 | | | | 1.42 | | | | 0.70 | | | | 233,166 | | | | 67 | |
| | | | | 26.25 | | | | 0.10 | | | | 5.61 | | | | 5.71 | | | | 0.17 | | | | — | | | | — | | | | 0.17 | | | | 0.04 | | | | 31.83 | | | | 21.97 | (b) | | | 1.50 | | | | 1.49 | | | | 1.48 | | | | 0.44 | | | | 200,835 | | | | 49 | |
| | | | | 16.84 | | | | 0.12 | • | | | 9.29 | | | | 9.41 | | | | — | | | | — | | | | — | | | | — | | | | — | | | | 26.25 | | | | 55.88 | | | | 1.58 | | | | 1.50 | † | | | 1.49 | † | | | 0.56 | † | | | 107,499 | | | | 81 | |
| | | | | 28.40 | | | | 0.11 | | | | (11.51 | ) | | | (11.40 | ) | | | 0.16 | | | | — | | | | — | | | | 0.16 | | | | — | | | | 16.84 | | | | (40.34 | ) | | | 1.62 | | | | 1.55 | † | | | 1.53 | † | | | 0.41 | † | | | 38,258 | | | | 73 | |
| | | | | | | | | | | | | | | | | | | | | | | | | | | | | | | | | | | | | | | | | | | | | | | | | | | | | | | | | | | | | | | | | | | | | | |
| | | | | 34.28 | | | | 0.12 | • | | | (2.94 | ) | | | (2.82 | ) | | | — | | | | 3.05 | | | | — | | | | 3.05 | | | | 0.02 | | | | 28.43 | | | | (8.35 | )(a) | | | 2.33 | | | | 2.26 | | | | 2.22 | | | | 0.42 | | | | 3,256 | | | | 35 | |
| | | | | 33.82 | | | | (0.04 | )• | | | 0.70 | | | | 0.66 | | | | 0.20 | | | | — | | | | — | | | | 0.20 | | | | — | | | | 34.28 | | | | 1.94 | | | | 2.18 | | | | 2.18 | | | | 2.17 | | | | (0.12 | ) | | | 5,771 | | | | 67 | |
| | | | | 28.00 | | | | (0.11 | ) | | | 5.96 | | | | 5.85 | | | | 0.07 | | | | — | | | | — | | | | 0.07 | | | | 0.04 | | | | 33.82 | | | | 21.07 | (b) | | | 2.25 | | | | 2.24 | | | | 2.23 | | | | (0.34 | ) | | | 7,557 | | | | 49 | |
| | | | | 18.10 | | | | (0.05 | ) | | | 9.95 | | | | 9.90 | | | | — | | | | — | | | | — | | | | — | | | | — | | | | 28.00 | | | | 54.70 | | | | 2.33 | | | | 2.25 | † | | | 2.24 | † | | | (0.19 | )† | | | 7,105 | | | | 81 | |
| | | | | 30.58 | | | | (0.11 | )• | | | (12.37 | ) | | | (12.48 | ) | | | — | | | | — | | | | — | | | | — | | | | — | | | | 18.10 | | | | (40.81 | ) | | | 2.37 | | | | 2.30 | † | | | 2.28 | † | | | (0.39 | )† | | | 6,722 | | | | 73 | |
See Accompanying Notes to Financial Statements
37
FINANCIAL HIGHLIGHTS (CONTINUED)
Selected data for a share of beneficial interest outstanding throughout each year or period.
| | | | | | Income (loss)
from investment
operations
|
| | | Less distributions
|
| | | | | | | | | Ratios to average
net assets
| | Supplemental
data
| |
|---|
| | | | | | | | | | | | | | | | | | | | | | | | | | | | | | | | | | | | | | |
|---|
| | | | Net
asset
value,
beginning
of year
or period
|
| Net
investment
income
(loss)
|
| Net
realized
and
unrealized
gain (loss)
|
| Total
from
investment
operations
|
| From
net
investment
income
|
| From
net
realized
gains
|
| From
return
of
capital
|
| Total
distributions
|
| Payment
by
affiliate
|
| Net
asset
value,
end of
year or
period
|
| Total
Return(1)
|
| Expenses
before
reductions/
additions(2)(3)
|
| Expenses
net of
fee
waivers
and/or
recoupments
if any(2)(3)
|
| Expenses
net of
all
reductions/
additions(2)(3)
|
| Net
investment
income
(loss)(2)(3)
|
| Net
assets,
end of
year or
period
|
| Portfolio
turnover
rate
|
|---|
Year or period ended
|
|
|
| ($)
|
| ($)
|
| ($)
|
| ($)
|
| ($)
|
| ($)
|
| ($)
|
| ($)
|
| ($)
|
| ($)
|
| (%)
|
| (%)
|
| (%)
|
| (%)
|
| (%)
|
| ($000’s)
|
| (%)
|
|---|
ING Global Value Choice Fund (continued) | | | | | | | | | | | | | | | | | | | | | | | | | | | | | | | | | | | | | | | | | | | | | | | |
| | | | | | | | | | | | | | | | | | | | | | | | | | | | | | | | | | | | | | | | | | | | | | | | | | | | | | | | | | | | | | | | | | | | | | |
| | | | | 30.27 | | | | 0.08 | • | | | (2.57 | ) | | | (2.49 | ) | | | 0.08 | | | | 3.05 | | | | — | | | | 3.13 | | | | 0.02 | | | | 24.67 | | | | (8.36 | )(a) | | | 2.33 | | | | 2.26 | | | | 2.22 | | | | 0.32 | | | | 52,628 | | | | 35 | |
| | | | | 30.03 | | | | (0.01 | )• | | | 0.60 | | | | 0.59 | | | | 0.35 | | | | — | | | | — | | | | 0.35 | | | | — | | | | 30.27 | | | | 1.93 | | | | 2.18 | | | | 2.18 | | | | 2.17 | | | | (0.05 | ) | | | 134,665 | | | | 67 | |
| | | | | 24.88 | | | | (0.09 | )• | | | 5.28 | | | | 5.19 | | | | 0.08 | | | | — | | | | — | | | | 0.08 | | | | 0.04 | | | | 30.03 | | | | 21.04 | (b) | | | 2.25 | | | | 2.24 | | | | 2.23 | | | | (0.33 | ) | | | 103,709 | | | | 49 | |
| | | | | 16.08 | | | | (0.05 | ) | | | 8.85 | | | | 8.80 | | | | — | | | | — | | | | — | | | | — | | | | — | | | | 24.88 | | | | 54.73 | | | | 2.33 | | | | 2.25 | † | | | 2.24 | † | | | (0.30 | )† | | | 48,308 | | | | 81 | |
| | | | | 27.18 | | | | (0.09 | ) | | | (10.99 | ) | | | (11.08 | ) | | | 0.02 | | | | — | | | | — | | | | 0.02 | | | | — | | | | 16.08 | | | | (40.79 | ) | | | 2.37 | | | | 2.30 | † | | | 2.28 | † | | | (0.36 | )† | | | 21,045 | | | | 73 | |
| | | | | | | | | | | | | | | | | | | | | | | | | | | | | | | | | | | | | | | | | | | | | | | | | | | | | | | | | | | | | | | | | | | | | | |
| | | | | 32.58 | | | | 0.26 | • | | | (2.69 | ) | | | (2.43 | ) | | | 0.43 | | | | 3.05 | | | | — | | | | 3.48 | | | | 0.02 | | | | 26.69 | | | | (7.54 | )(a) | | | 1.26 | | | | 1.26 | | | | 1.22 | | | | 0.90 | | | | 30,701 | | | | 35 | |
| | | | | 32.14 | | | | 0.37 | • | | | 0.62 | | | | 0.99 | | | | 0.55 | | | | — | | | | — | | | | 0.55 | | | | — | | | | 32.58 | | | | 3.04 | | | | 1.08 | | | | 1.08 | | | | 1.07 | | | | 1.09 | | | | 241,105 | | | | 67 | |
| | | | | 26.46 | | | | 0.25 | • | | | 5.63 | | | | 5.88 | | | | 0.24 | | | | — | | | | — | | | | 0.24 | | | | 0.04 | | | | 32.14 | | | | 22.49 | (b) | | | 1.12 | | | | 1.11 | | | | 1.10 | | | | 0.84 | | | | 152,120 | | | | 49 | |
| | | | | 16.92 | | | | 0.18 | • | | | 9.36 | | | | 9.54 | | | | — | | | | — | | | | — | | | | — | | | | — | | | | 26.46 | | | | 56.38 | | | | 1.18 | | | | 1.17 | † | | | 1.16 | † | | | 0.82 | † | | | 10,388 | | | | 81 | |
| | | | | 28.57 | | | | 0.22 | | | | (11.59 | ) | | | (11.37 | ) | | | 0.28 | | | | — | | | | — | | | | 0.28 | | | | — | | | | 16.92 | | | | (40.13 | ) | | | 1.22 | | | | 1.22 | † | | | 1.20 | † | | | 0.76 | † | | | 5,794 | | | | 73 | |
| | | | | | | | | | | | | | | | | | | | | | | | | | | | | | | | | | | | | | | | | | | | | | | | | | | | | | | | | | | | | | | | | | | | | | |
| | | | | 32.50 | | | | 0.37 | • | | | (2.76 | ) | | | (2.39 | ) | | | 0.39 | | | | 3.05 | | | | — | | | | 3.44 | | | | 0.02 | | | | 26.69 | | | | (7.43 | )(a) | | | 1.33 | | | | 1.26 | | | | 1.22 | | | | 1.32 | | | | 8,308 | | | | 35 | |
| | | | | 32.07 | | | | 0.29 | • | | | 0.68 | | | | 0.97 | | | | 0.54 | | | | — | | | | — | | | | 0.54 | | | | — | | | | 32.50 | | | | 2.98 | | | | 1.18 | | | | 1.18 | | | | 1.17 | | | | 0.87 | | | | 25,458 | | | | 67 | |
| | | | | 26.46 | | | | 0.21 | • | | | 5.60 | | | | 5.81 | | | | 0.24 | | | | — | | | | — | | | | 0.24 | | | | 0.04 | | | | 32.07 | | | | 22.23 | (b) | | | 1.25 | | | | 1.24 | | | | 1.23 | | | | 0.73 | | | | 30,105 | | | | 49 | |
| | | | | 24.24 | | | | (0.08 | )• | | | 2.30 | | | | 2.22 | | | | — | | | | — | | | | — | | | | — | | | | — | | | | 26.46 | | | | 9.16 | | | | 1.18 | | | | 1.17 | † | | | 1.16 | † | | | (0.79 | )† | | | 250 | | | | 81 | |
ING Index Plus International Equity Fund | | | | | | | | | | | | | | | | | | | | | | | | | | | | | | | | | | | | | | | | | | | | | | | |
| | | | | | | | | | | | | | | | | | | | | | | | | | | | | | | | | | | | | | | | | | | | | | | | | | | | | | | | | | | | | | | | | | | | | | |
| | | | | 7.77 | | | | 0.22 | | | | 0.11 | | | | 0.33 | | | | 0.19 | | | | — | | | | — | | | | 0.19 | | | | — | | | | 7.91 | | | | 4.50 | | | | 1.45 | | | | 1.15 | | | | 1.15 | | | | 2.66 | | | | 6,600 | | | | 155 | |
| | | | | 8.36 | | | | 0.18 | | | | (0.66 | ) | | | (0.48 | ) | | | 0.11 | | | | — | | | | — | | | | 0.11 | | | | — | | | | 7.77 | | | | (5.81 | ) | | | 1.48 | | | | 1.15 | † | | | 1.15 | † | | | 1.98 | † | | | 7,322 | | | | 140 | |
| | | | | 7.80 | | | | 0.13 | | | | 0.58 | | | | 0.71 | | | | 0.15 | | | | — | | | | — | | | | 0.15 | | | | 0.00 | * | | | 8.36 | | | | 9.17 | (c) | | | 1.31 | | | | 1.16 | † | | | 1.16 | † | | | 1.65 | † | | | 8,969 | | | | 171 | |
| | | | | 6.35 | | | | 0.16 | • | | | 1.49 | | | | 1.65 | | | | 0.23 | | | | — | | | | — | | | | 0.23 | | | | 0.03 | | | | 7.80 | | | | 27.40 | (d) | | | 1.53 | | | | 1.15 | | | | 1.15 | | | | 2.58 | | | | 8,828 | | | | 169 | |
| | | | | 13.95 | | | | 0.19 | • | | | (6.24 | ) | | | (6.05 | ) | | | 0.18 | | | | 1.37 | | | | — | | | | 1.55 | | | | — | | | | 6.35 | | | | (48.51 | ) | | | 1.73 | | | | 1.30 | | | | 1.30 | | | | 1.93 | | | | 9,446 | | | | 215 | |
| | | | | | | | | | | | | | | | | | | | | | | | | | | | | | | | | | | | | | | | | | | | | | | | | | | | | | | | | | | | | | | | | | | | | | |
| | | | | 7.79 | | | | 0.14 | • | | | 0.13 | | | | 0.27 | | | | 0.09 | | | | — | | | | — | | | | 0.09 | | | | — | | | | 7.97 | | | | 3.65 | | | | 2.20 | | | | 1.90 | | | | 1.90 | | | | 1.87 | | | | 284 | | | | 155 | |
| | | | | 8.36 | | | | 0.10 | • | | | (0.64 | ) | | | (0.54 | ) | | | 0.03 | | | | — | | | | — | | | | 0.03 | | | | — | | | | 7.79 | | | | (6.47 | ) | | | 2.23 | | | | 1.90 | † | | | 1.90 | † | | | 1.16 | † | | | 387 | | | | 140 | |
| | | | | 7.80 | | | | 0.06 | • | | | 0.58 | | | | 0.64 | | | | 0.08 | | | | — | | | | — | | | | 0.08 | | | | 0.00 | * | | | 8.36 | | | | 8.30 | (c) | | | 2.06 | | | | 1.91 | † | | | 1.91 | † | | | 0.86 | † | | | 772 | | | | 171 | |
| | | | | 6.29 | | | | 0.11 | • | | | 1.49 | | | | 1.60 | | | | 0.12 | | | | — | | | | — | | | | 0.12 | | | | 0.03 | | | | 7.80 | | | | 26.41 | (d) | | | 2.28 | | | | 1.90 | | | | 1.90 | | | | 1.74 | | | | 1,221 | | | | 169 | |
| | | | | 13.90 | | | | 0.12 | • | | | (6.20 | ) | | | (6.08 | ) | | | 0.16 | | | | 1.37 | | | | — | | | | 1.53 | | | | — | | | | 6.29 | | | | (48.88 | ) | | | 2.48 | | | | 2.05 | | | | 2.05 | | | | 1.22 | | | | 1,571 | | | | 215 | |
| | | | | | | | | | | | | | | | | | | | | | | | | | | | | | | | | | | | | | | | | | | | | | | | | | | | | | | | | | | | | | | | | | | | | | |
| | | | | 7.72 | | | | 0.15 | | | | 0.12 | | | | 0.27 | | | | 0.12 | | | | — | | | | — | | | | 0.12 | | | | — | | | | 7.87 | | | | 3.71 | | | | 2.20 | | | | 1.90 | | | | 1.90 | | | | 1.89 | | | | 933 | | | | 155 | |
| | | | | 8.30 | | | | 0.10 | • | | | (0.64 | ) | | | (0.54 | ) | | | 0.04 | | | | — | | | | — | | | | 0.04 | | | | — | | | | 7.72 | | | | (6.52 | ) | | | 2.23 | | | | 1.90 | † | | | 1.90 | † | | | 1.23 | † | | | 943 | | | | 140 | |
| | | | | 7.75 | | | | 0.07 | • | | | 0.57 | | | | 0.64 | | | | 0.09 | | | | — | | | | — | | | | 0.09 | | | | 0.00 | * | | | 8.30 | | | | 8.35 | (c) | | | 2.06 | | | | 1.91 | † | | | 1.91 | † | | | 0.93 | † | | | 1,202 | | | | 171 | |
| | | | | 6.28 | | | | 0.11 | • | | | 1.48 | | | | 1.59 | | | | 0.15 | | | | — | | | | — | | | | 0.15 | | | | 0.03 | | | | 7.75 | | | | 26.45 | (d) | | | 2.28 | | | | 1.90 | | | | 1.90 | | | | 1.78 | | | | 1,445 | | | | 169 | |
| | | | | 13.89 | | | | 0.12 | • | | | (6.20 | ) | | | (6.08 | ) | | | 0.16 | | | | 1.37 | | | | — | | | | 1.53 | | | | — | | | | 6.28 | | | | (48.91 | ) | | | 2.48 | | | | 2.05 | | | | 2.05 | | | | 1.16 | | | | 1,311 | | | | 215 | |
| | | | | | | | | | | | | | | | | | | | | | | | | | | | | | | | | | | | | | | | | | | | | | | | | | | | | | | | | | | | | | | | | | | | | | |
| | | | | 7.80 | | | | 0.24 | • | | | 0.12 | | | | 0.36 | | | | 0.22 | | | | — | | | | — | | | | 0.22 | | | | — | | | | 7.94 | | | | 5.04 | | | | 0.98 | | | | 0.68 | | | | 0.68 | | | | 3.24 | | | | 12,017 | | | | 155 | |
| | | | | 8.38 | | | | 0.17 | | | | (0.61 | ) | | | (0.44 | ) | | | 0.14 | | | | — | | | | — | | | | 0.14 | | | | — | | | | 7.80 | | | | (5.34 | ) | | | 1.04 | | | | 0.71 | † | | | 0.71 | † | | | 2.02 | † | | | 47,132 | | | | 140 | |
| | | | | 7.81 | | | | 0.14 | • | | | 0.59 | | | | 0.73 | | | | 0.16 | | | | — | | | | — | | | | 0.16 | | | | 0.00 | * | | | 8.38 | | | | 9.46 | (c) | | | 0.85 | | | | 0.83 | † | | | 0.83 | † | | | 1.86 | † | | | 81,470 | | | | 171 | |
| | | | | 6.42 | | | | 0.18 | • | | | 1.50 | | | | 1.68 | | | | 0.32 | | | | — | | | | — | | | | 0.32 | | | | 0.03 | | | | 7.81 | | | | 27.81 | (d) | | | 0.92 | | | | 0.90 | | | | 0.90 | | | | 2.83 | | | | 51,114 | | | | 169 | |
| | | | | 14.06 | | | | 0.29 | • | | | (6.32 | ) | | | (6.03 | ) | | | 0.24 | | | | 1.37 | | | | — | | | | 1.61 | | | | — | | | | 6.42 | | | | (48.12 | ) | | | 1.05 | | | | 0.62 | | | | 0.62 | | | | 2.80 | | | | 54,838 | | | | 215 | |
| | | | | | | | | | | | | | | | | | | | | | | | | | | | | | | | | | | | | | | | | | | | | | | | | | �� | | | | | | | | | | | | | | | | | | | | |
| | | | | 7.71 | | | | 0.21 | | | | 0.12 | | | | 0.33 | | | | 0.19 | | | | — | | | | — | | | | 0.19 | | | | — | | | | 7.85 | | | | 4.55 | | | | 1.45 | | | | 1.15 | | | | 1.15 | | | | 2.62 | | | | 36,546 | | | | 155 | |
| | | | | 8.30 | | | | 0.17 | | | | (0.65 | ) | | | (0.48 | ) | | | 0.11 | | | | — | | | | — | | | | 0.11 | | | | — | | | | 7.71 | | | | (5.85 | ) | | | 1.48 | | | | 1.15 | † | | | 1.15 | † | | | 1.98 | † | | | 38,942 | | | | 140 | |
| | | | | 7.75 | | | | 0.14 | | | | 0.56 | | | | 0.70 | | | | 0.15 | | | | — | | | | — | | | | 0.15 | | | | 0.00 | * | | | 8.30 | | | | 9.10 | (c) | | | 1.31 | | | | 1.16 | † | | | 1.16 | † | | | 1.65 | † | | | 45,938 | | | | 171 | |
| | | | | 6.31 | | | | 0.16 | • | | | 1.49 | | | | 1.65 | | | | 0.24 | | | | — | | | | — | | | | 0.24 | | | | 0.03 | | | | 7.75 | | | | 27.60 | (d) | | | 1.53 | | | | 1.15 | | | | 1.15 | | | | 2.53 | | | | 47,328 | | | | 169 | |
| | | | | 13.09 | | | | 0.19 | • | | | (5.36 | ) | | | (5.17 | ) | | | 0.24 | | | | 1.37 | | | | — | | | | 1.61 | | | | — | | | | 6.31 | | | | (45.16 | ) | | | 1.73 | | | | 1.30 | | | | 1.30 | | | | 2.03 | | | | 41,539 | | | | 215 | |
See Accompanying Notes to Financial Statements
38
FINANCIAL HIGHLIGHTS (CONTINUED)
Selected data for a share of beneficial interest outstanding throughout each year or period.
| | | | | | Income (loss)
from investment
operations
|
| | | Less distributions
|
| | | | | | | | | Ratios to average
net assets
| | Supplemental
data
| |
|---|
| | | | | | | | | | | | | | | | | | | | | | | | | | | | | | | | | | | | | | |
|---|
| | | | Net
asset
value,
beginning
of year
or period
|
| Net
investment
income
(loss)
|
| Net
realized
and
unrealized
gain
(loss)
|
| Total
from
investment
operations
|
| From
net
investment
income
|
| From
net
realized
gains
|
| From
return
of
capital
|
| Total
distributions
|
| Payment
by
affiliate
|
| Net
asset
value,
end of
year or
period
|
| Total
Return(1)
|
| Expenses
before reductions/
additions(2)(3)
|
| Expenses
net of
fee
waivers
and/or
recoupments
if any(2)(3)
|
| Expenses
net of
all
reductions/
additions(2)(3)
|
| Net
investment
income
(loss)(2)(3)
|
| Net
assets,
end of
year or
period
|
| Portfolio
turnover
rate
|
|---|
Year or period ended
|
|
|
| ($)
|
| ($)
|
| ($)
|
| ($)
|
| ($)
|
| ($)
|
| ($)
|
| ($)
|
| ($)
|
| ($)
|
| (%)
|
| (%)
|
| (%)
|
| (%)
|
| (%)
|
| ($000’s)
|
| (%)
|
|---|
ING Index Plus International Equity Fund (continued) | | | | | | | | | | | | | | | | | | | | | | | | | | | | | | | | | | | | | | | | | |
| | | | | | | | | | | | | | | | | | | | | | | | | | | | | | | | | | | | | | | | | | | | | | | | | | | | | | | | | | | | | | | | | | | | | | |
| | | | | 7.79 | | | | 0.22 | | | | 0.12 | | | | 0.34 | | | | 0.22 | | | | — | | | | — | | | | 0.22 | | | | — | | | | 7.91 | | | | 4.73 | | | | 1.20 | | | | 0.90 | | | | 0.90 | | | | 2.87 | | | | 3 | | | | 155 | |
| | | | | 7.93 | | | | 0.03 | | | | (0.17 | ) | | | (0.14 | ) | | | — | | | | — | | | | — | | | | — | | | | — | | | | 7.79 | | | | (1.77 | ) | | | 1.23 | | | | 0.90 | † | | | 0.90 | † | | | 1.73 | † | | | 3 | | | | 140 | |
ING International Small Cap Fund | | | | | | | | | | | | | | | | | | | | | | | | | | | | | | | | | | | | | | | | | | |
| | | | | | | | | | | | | | | | | | | | | | | | | | | | | | | | | | | | | | | | | | | | | | | | | | | | | | | | | | | | | | | | | | | | | | |
| | | | | 35.39 | | | | 0.42 | • | | | 1.73 | | | | 2.15 | | | | 0.57 | | | | — | | | | — | | | | 0.57 | | | | 0.10 | | | | 37.07 | | | | 6.62 | (a) | | | 1.77 | | | | 1.74 | | | | 1.74 | | | | 1.20 | | | | 81,948 | | | | 31 | |
| | | | | 37.55 | | | | 0.29 | • | | | (2.32 | ) | | | (2.03 | ) | | | 0.14 | | | | — | | | | — | | | | 0.14 | | | | 0.01 | | | | 35.39 | | | | (5.41 | )(a),(e) | | | 1.72 | | | | 1.70 | | | | 1.70 | | | | 0.74 | | | | 99,873 | | | | 37 | |
| | | | | 31.45 | | | | 0.14 | • | | | 6.28 | | | | 6.42 | | | | 0.40 | | | | — | | | | — | | | | 0.40 | | | | 0.08 | | | | 37.55 | | | | 20.85 | (a),(f) | | | 1.81 | | | | 1.79 | † | | | 1.79 | † | | | 0.42 | † | | | 144,594 | | | | 63 | |
| | | | | 22.73 | | | | 0.21 | • | | | 9.04 | | | | 9.25 | | | | 0.71 | | | | — | | | | — | | | | 0.71 | | | | 0.18 | | | | 31.45 | | | | 42.73 | (a),(g) | | | 1.95 | | | | 1.95 | † | | | 1.95 | † | | | 0.85 | † | | | 177,914 | | | | 103 | |
| | | | | 66.43 | | | | 0.65 | | | | (36.15 | ) | | | (35.50 | ) | | | 0.32 | | | | 7.88 | | | | — | | | | 8.20 | | | | — | | | | 22.73 | | | | (59.84 | )(a) | | | 1.70 | | | | 1.70 | | | | 1.70 | | | | 1.27 | | | | 160,896 | | | | 84 | |
| | | | | | | | | | | | | | | | | | | | | | | | | | | | | | | | | | | | | | | | | | | | | | | | | | | | | | | | | | | | | | | | | | | | | | |
| | | | | 37.10 | | | | 0.19 | • | | | 1.90 | | | | 2.09 | | | | 0.17 | | | | — | | | | — | | | | 0.17 | | | | 0.10 | | | | 39.12 | | | | 5.96 | (a) | | | 2.42 | | | | 2.39 | | | | 2.39 | | | | 0.51 | | | | 1,888 | | | | 31 | |
| | | | | 39.49 | | | | (0.00 | )*,• | | | (2.41 | ) | | | (2.41 | ) | | | 0.00 | * | | | — | | | | — | | | | 0.00 | * | | | 0.02 | | | | 37.10 | | | | (6.05 | )(a),(e) | | | 2.37 | | | | 2.35 | | | | 2.35 | | | | (0.01 | ) | | | 2,592 | | | | 37 | |
| | | | | 33.01 | | | | (0.09 | )• | | | 6.62 | | | | 6.53 | | | | 0.13 | | | | — | | | | — | | | | 0.13 | | | | 0.08 | | | | 39.49 | | | | 20.07 | (a),(f) | | | 2.46 | | | | 2.44 | † | | | 2.44 | † | | | (0.27 | )† | | | 5,120 | | | | 63 | |
| | | | | 23.48 | | | | 0.06 | • | | | 9.45 | | | | 9.51 | | | | 0.17 | | | | — | | | | — | | | | 0.17 | | | | 0.19 | | | | 33.01 | | | | 41.60 | (a),(g) | | | 2.60 | | | | 2.60 | † | | | 2.60 | † | | | 0.24 | † | | | 8,383 | | | | 103 | |
| | | | | 68.31 | | | | 0.21 | • | | | (37.16 | ) | | | (36.95 | ) | | | — | | | | 7.88 | | | | — | | | | 7.88 | | | | — | | | | 23.48 | | | | (60.10 | )(a) | | | 2.35 | | | | 2.35 | | | | 2.35 | | | | 0.45 | | | | 11,892 | | | | 84 | |
| | | | | | | | | | | | | | | | | | | | | | | | | | | | | | | | | | | | | | | | | | | | | | | | | | | | | | | | | | | | | | | | | | | | | | |
| | | | | 32.93 | | | | 0.18 | • | | | 1.63 | | | | 1.81 | | | | 0.33 | | | | — | | | | — | | | | 0.33 | | | | 0.09 | | | | 34.50 | | | | 5.94 | (a) | | | 2.42 | | | | 2.39 | | | | 2.39 | | | | 0.55 | | | | 20,351 | | | | 31 | |
| | | | | 35.04 | | | | 0.04 | • | | | (2.16 | ) | | | (2.12 | ) | | | 0.00 | * | | | — | | | | — | | | | 0.00 | * | | | 0.01 | | | | 32.93 | | | | (6.02 | )(a),(e) | | | 2.37 | | | | 2.35 | | | | 2.35 | | | | 0.11 | | | | 23,410 | | | | 37 | |
| | | | | 29.41 | | | | (0.07 | )• | | | 5.87 | | | | 5.80 | | | | 0.24 | | | | — | | | | — | | | | 0.24 | | | | 0.07 | | | | 35.04 | | | | 20.05 | (a),(f) | | | 2.46 | | | | 2.44 | † | | | 2.44 | † | | | (0.23 | )† | | | 31,078 | | | | 63 | |
| | | | | 21.15 | | | | 0.05 | • | | | 8.46 | | | | 8.51 | | | | 0.42 | | | | — | | | | — | | | | 0.42 | | | | 0.17 | | | | 29.41 | | | | 41.80 | (a),(g) | | | 2.60 | | | | 2.60 | † | | | 2.60 | † | | | 0.21 | † | | | 31,928 | | | | 103 | |
| | | | | 62.48 | | | | 0.34 | | | | (33.79 | ) | | | (33.45 | ) | | | — | | | | 7.88 | | | | — | | | | 7.88 | | | | — | | | | 21.15 | | | | (60.11 | )(a) | | | 2.35 | | | | 2.35 | | | | 2.35 | | | | 0.58 | | | | 29,760 | | | | 84 | |
| | | | | | | | | | | | | | | | | | | | | | | | | | | | | | | | | | | | | | | | | | | | | | | | | | | | | | | | | | | | | | | | | | | | | | |
| | | | | 35.50 | | | | 0.57 | | | | 1.74 | | | | 2.31 | | | | 0.77 | | | | — | | | | — | | | | 0.77 | | | | 0.10 | | | | 37.14 | | | | 7.15 | (a) | | | 1.29 | | | | 1.26 | | | | 1.26 | | | | 1.61 | | | | 100,952 | | | | 31 | |
| | | | | 37.66 | | | | 0.50 | • | | | (2.35 | ) | | | (1.85 | ) | | | 0.32 | | | | — | | | | — | | | | 0.32 | | | | 0.01 | | | | 35.50 | | | | (4.97 | )(a),(e) | | | 1.27 | | | | 1.25 | | | | 1.25 | | | | 1.26 | | | | 153,676 | | | | 37 | |
| | | | | 31.53 | | | | 0.33 | | | | 6.27 | | | | 6.60 | | | | 0.55 | | | | — | | | | — | | | | 0.55 | | | | 0.08 | | | | 37.66 | | | | 21.45 | (a),(f) | | | 1.28 | | | | 1.26 | † | | | 1.26 | † | | | 0.99 | † | | | 210,965 | | | | 63 | |
| | | | | 22.85 | | | | 0.32 | • | | | 9.09 | | | | 9.41 | | | | 0.91 | | | | — | | | | — | | | | 0.91 | | | | 0.18 | | | | 31.53 | | | | 43.57 | (a),(g) | | | 1.45 | | | | 1.45 | † | | | 1.45 | † | | | 1.29 | † | | | 164,985 | | | | 103 | |
| | | | | 66.72 | | | | 0.78 | | | | (36.25 | ) | | | (35.47 | ) | | | 0.52 | | | | 7.88 | | | | — | | | | 8.40 | | | | — | | | | 22.85 | | | | (59.66 | )(a) | | | 1.29 | | | | 1.29 | | | | 1.29 | | | | 1.71 | | | | 139,213 | | | | 84 | |
| | | | | | | | | | | | | | | | | | | | | | | | | | | | | | | | | | | | | | | | | | | | | | | | | | | | | | | | | | | | | | | | | | | | | | |
| | | | | 35.13 | | | | 0.50 | | | | 1.67 | | | | 2.17 | | | | 0.65 | | | | — | | | | — | | | | 0.65 | | | | 0.10 | | | | 36.75 | | | | 6.75 | (a) | | | 1.67 | | | | 1.64 | | | | 1.64 | | | | 1.37 | | | | 1,573 | | | | 31 | |
| | | | | 37.30 | | | | 0.39 | • | | | (2.37 | ) | | | (1.98 | ) | | | 0.20 | | | | — | | | | — | | | | 0.20 | | | | 0.01 | | | | 35.13 | | | | (5.32 | )(a),(e) | | | 1.62 | | | | 1.60 | | | | 1.60 | | | | 1.00 | | | | 1,425 | | | | 37 | |
| | | | | 31.28 | | | | 0.19 | | | | 6.22 | | | | 6.41 | | | | 0.47 | | | | — | | | | — | | | | 0.47 | | | | 0.08 | | | | 37.30 | | | | 20.95 | (a),(f) | | | 1.71 | | | | 1.69 | † | | | 1.69 | † | | | 0.66 | † | | | 1,164 | | | | 63 | |
| | | | | 22.75 | | | | 0.18 | • | | | 9.07 | | | | 9.25 | | | | 0.90 | | | | — | | | | — | | | | 0.90 | | | | 0.18 | | | | 31.28 | | | | 43.07 | (a),(g) | | | 1.85 | | | | 1.85 | † | | | 1.85 | † | | | 0.69 | † | | | 565 | | | | 103 | |
| | | | | 47.28 | | | | 0.18 | • | | | (24.71 | ) | | | (24.53 | ) | | | — | | | | 0.00 | * | | | — | | | | — | | | | — | | | | 22.75 | | | | (51.88 | )(a) | | | 1.60 | | | | 1.60 | | | | 1.60 | | | | 1.39 | | | | 62 | | | | 84 | |
| | | | | | | | | | | | | | | | | | | | | | | | | | | | | | | | | | | | | | | | | | | | | | | | | | | | | | | | | | | | | | | | | | | | | | |
| | | | | 42.00 | | | | 0.66 | | | | 2.05 | | | | 2.71 | | | | 0.72 | | | | — | | | | — | | | | 0.72 | | | | 0.12 | | | | 44.11 | | | | 7.02 | (a) | | | 1.42 | | | | 1.39 | | | | 1.39 | | | | 1.61 | | | | 35,461 | | | | 31 | |
| | | | | 44.49 | | | | 0.53 | • | | | (2.79 | ) | | | (2.26 | ) | | | 0.25 | | | | — | | | | — | | | | 0.25 | | | | 0.02 | | | | 42.00 | | | | (5.08 | )(a),(e) | | | 1.37 | | | | 1.35 | | | | 1.35 | | | | 1.14 | | | | 26,693 | | | | 37 | |
| | | | | 37.21 | | | | 0.32 | • | | | 7.41 | | | | 7.73 | | | | 0.54 | | | | — | | | | — | | | | 0.54 | | | | 0.09 | | | | 44.49 | | | | 21.24 | (a),(f) | | | 1.46 | | | | 1.44 | † | | | 1.44 | † | | | 0.82 | † | | | 42,257 | | | | 63 | |
| | | | | 26.83 | | | | 0.37 | | | | 10.71 | | | | 11.08 | | | | 0.92 | | | | — | | | | — | | | | 0.92 | | | | 0.22 | | | | 37.21 | | | | 43.54 | (a),(g) | | | 1.45 | | | | 1.45 | † | | | 1.45 | † | | | 1.32 | † | | | 12,096 | | | | 103 | |
| | | | | 50.70 | | | | 0.50 | • | | | (24.37 | ) | | | (23.87 | ) | | | — | | | | 0.00 | * | | | — | | | | — | | | | — | | | | 26.83 | | | | (47.08 | )(a) | | | 1.29 | | | | 1.29 | | | | 1.29 | | | | 1.80 | | | | 10,366 | | | | 84 | |
ING International Value Choice Fund | | | | | | | | | | | | | | | | | | | | | | | | | | | | | | | | | | | | | | | | | |
| | | | | | | | | | | | | | | | | | | | | | | | | | | | | | | | | | | | | | | | | | | | | | | | | | | | | | | | | | | | | | | | | | | | | | |
| | | | | 10.13 | | | | 0.16 | | | | (0.82 | ) | | | (0.66 | ) | | | 0.27 | | | | — | | | | — | | | | 0.27 | | | | — | | | | 9.20 | | | | (6.42 | ) | | | 1.94 | | | | 1.56 | | | | 1.53 | | | | 1.64 | | | | 18,559 | | | | 29 | |
| | | | | 10.96 | | | | 0.16 | | | | (0.90 | ) | | | (0.74 | ) | | | 0.09 | | | | — | | | | — | | | | 0.09 | | | | — | | | | 10.13 | | | | (6.82 | ) | | | 1.82 | | | | 1.60 | † | | | 1.60 | † | | | 1.42 | † | | | 21,037 | | | | 48 | |
| | | | | 9.68 | | | | 0.08 | • | | | 1.26 | | | | 1.34 | | | | 0.06 | | | | — | | | | — | | | | 0.06 | | | | — | | | | 10.96 | | | | 13.95 | | | | 1.78 | | | | 1.70 | † | | | 1.70 | † | | | 0.77 | † | | | 22,683 | | | | 43 | |
| | | | | 7.56 | | | | 0.06 | | | | 2.14 | | | | 2.20 | | | | 0.08 | | | | — | | | | — | | | | 0.08 | | | | — | | | | 9.68 | | | | 29.22 | | | | 1.83 | | | | 1.70 | † | | | 1.70 | † | | | 0.86 | † | | | 15,615 | | | | 44 | |
| | | | | 14.89 | | | | 0.06 | | | | (5.31 | ) | | | (5.25 | ) | | | 0.10 | | | | 1.98 | | | | — | | | | 2.08 | | | | — | | | | 7.56 | | | | (40.21 | ) | | | 1.62 | | | | 1.65 | † | | | 1.64 | † | | | 0.52 | † | | | 8,940 | | | | 73 | |
See Accompanying Notes to Financial Statements
39
FINANCIAL HIGHLIGHTS (CONTINUED)
Selected data for a share of beneficial interest outstanding throughout each year or period.
| | | | Income (loss)
from investment
operations
|
| | | Less distributions
|
| | | | | | | | | Ratios to average
net assets
| | Supplemental
data
| |
|---|
| | | | | | | | | | | | | | | | | | | | | | | | | | | | | | | | | | | | |
|---|
| | Net
asset
value,
beginning
of year
or period
|
| Net
investment
income
(loss)
|
| Net
realized
and
unrealized
gain
(loss)
|
| Total
from
investment
operations
|
| From
net
investment
income
|
| From
net
realized
gains
|
| From
return
of
capital
|
| Total
distributions
|
| Payment
by
affiliate
|
| Net
asset
value,
end of
year or
period
|
| Total
Return(1)
|
| Expenses
before
reductions/
additions(2)(3)
|
| Expenses
net
of fee
waivers
and/or
recoupments
if any(2)(3)
|
| Expenses
net of
all
reductions/
additions(2)(3)
|
| Net
investment
income
(loss)(2)(3)
|
| Net
assets,
end of
year or
period
|
| Portfolio
turnover
rate
|
|---|
Year or period ended
|
| ($)
|
| ($)
|
| ($)
|
| ($)
|
| ($)
|
| ($)
|
| ($)
|
| ($)
|
| ($)
|
| ($)
|
| (%)
|
| (%)
|
| (%)
|
| (%)
|
| (%)
|
| ($000’s)
|
| (%)
|
|---|
ING International Value Choice Fund (continued) |
| | | | | | | | | | | | | | | | | | | | | | | | | | | | | | | | | | | | | | | | | | | | | | | | | | | | | | | | | | | | | | | | | | | | |
| | | 9.95 | | | | 0.09 | • | | | (0.79 | ) | | | (0.70 | ) | | | 0.15 | | | | — | | | | — | | | | 0.15 | | | | — | | | | 9.10 | | | | (7.02 | ) | | | 2.69 | | | | 2.31 | | | | 2.28 | | | | 0.95 | | | | 325 | | | | 29 | |
| | | 10.77 | | | | 0.08 | • | | | (0.90 | ) | | | (0.82 | ) | | | — | | | | — | | | | — | | | | — | | | | — | | | | 9.95 | | | | (7.61 | ) | | | 2.57 | | | | 2.35 | † | | | 2.35 | † | | | 0.58 | † | | | 481 | | | | 48 | |
| | | 9.53 | | | | 0.01 | • | | | 1.24 | | | | 1.25 | | | | 0.01 | | | | — | | | | — | | | | 0.01 | | | | — | | | | 10.77 | | | | 13.11 | | | | 2.53 | | | | 2.45 | † | | | 2.45 | † | | | 0.09 | † | | | 1,160 | | | | 43 | |
| | | 7.44 | | | | 0.02 | • | | | 2.07 | | | | 2.09 | | | | 0.00 | * | | | — | | | | — | | | | 0.00 | * | | | — | | | | 9.53 | | | | 28.13 | | | | 2.58 | | | | 2.45 | † | | | 2.45 | † | | | 0.18 | † | | | 1,786 | | | | 44 | |
| | | 14.67 | | | | (0.03 | )• | | | (5.22 | ) | | | (5.25 | ) | | | 0.00 | * | | | 1.98 | | | | — | | | | 1.98 | | | | — | | | | 7.44 | | | | (40.63 | ) | | | 2.37 | | | | 2.40 | † | | | 2.39 | † | | | (0.27 | )† | | | 1,738 | | | | 73 | |
| | | | | | | | | | | | | | | | | | | | | | | | | | | | | | | | | | | | | | | | | | | | | | | | | | | | | | | | | | | | | | | | | | | | |
| | | 9.96 | | | | 0.09 | • | | | (0.80 | ) | | | (0.71 | ) | | | 0.18 | | | | — | | | | — | | | | 0.18 | | | | — | | | | 9.07 | | | | (7.06 | ) | | | 2.69 | | | | 2.31 | | | | 2.28 | | | | 0.96 | | | | 2,642 | | | | 29 | |
| | | 10.80 | | | | 0.09 | | | | (0.90 | ) | | | (0.81 | ) | | | 0.03 | | | | — | | | | — | | | | 0.03 | | | | — | | | | 9.96 | | | | (7.55 | ) | | | 2.57 | | | | 2.35 | † | | | 2.35 | † | | | 0.69 | † | | | 4,449 | | | | 48 | |
| | | 9.56 | | | | 0.01 | • | | | 1.24 | | | | 1.25 | | | | 0.01 | | | | — | | | | — | | | | 0.01 | | | | — | | | | 10.80 | | | | 13.07 | | | | 2.53 | | | | 2.45 | † | | | 2.45 | † | | | 0.06 | † | | | 5,195 | | | | 43 | |
| | | 7.46 | | | | 0.01 | • | | | 2.09 | | | | 2.10 | | | | 0.00 | * | | | — | | | | — | | | | 0.00 | * | | | — | | | | 9.56 | | | | 28.19 | | | | 2.58 | | | | 2.45 | † | | | 2.45 | † | | | 0.14 | † | | | 4,091 | | | | 44 | |
| | | 14.70 | | | | (0.03 | )• | | | (5.23 | ) | | | (5.26 | ) | | | — | | | | 1.98 | | | | — | | | | 1.98 | | | | — | | | | 7.46 | | | | (40.62 | ) | | | 2.37 | | | | 2.40 | † | | | 2.39 | † | | | (0.25 | )† | | | 2,267 | | | | 73 | |
| | | | | | | | | | | | | | | | | | | | | | | | | | | | | | | | | | | | | | | | | | | | | | | | | | | | | | | | | | | | | | | | | | | | |
| | | 10.14 | | | | 0.19 | | | | (0.83 | ) | | | (0.64 | ) | | | 0.30 | | | | — | | | | — | | | | 0.30 | | | | — | | | | 9.20 | | | | (6.20 | ) | | | 1.73 | | | | 1.35 | | | | 1.32 | | | | 1.85 | | | | 1,425 | | | | 29 | |
| | �� | 10.96 | | | | 0.23 | • | | | (0.93 | ) | | | (0.70 | ) | | | 0.12 | | | | — | | | | — | | | | 0.12 | | | | — | | | | 10.14 | | | | (6.50 | ) | | | 1.38 | | | | 1.28 | † | | | 1.28 | † | | | 1.82 | † | | | 3,892 | | | | 48 | |
| | | 9.67 | | | | 0.12 | • | | | 1.25 | | | | 1.37 | | | | 0.08 | | | | — | | | | — | | | | 0.08 | | | | — | | | | 10.96 | | | | 14.26 | | | | 1.35 | | | | 1.35 | † | | | 1.35 | † | | | 1.24 | † | | | 17,722 | | | | 43 | |
| | | 7.57 | | | | 0.10 | • | | | 2.12 | | | | 2.22 | | | | 0.12 | | | | — | | | | — | | | | 0.12 | | | | — | | | | 9.67 | | | | 29.58 | | | | 1.39 | | | | 1.39 | † | | | 1.39 | † | | | 1.19 | † | | | 27,654 | | | | 44 | |
| | | 14.92 | | | | 0.09 | | | | (5.30 | ) | | | (5.21 | ) | | | 0.16 | | | | 1.98 | | | | — | | | | 2.14 | | | | — | | | | 7.57 | | | | (39.96 | ) | | | 1.27 | | | | 1.30 | † | | | 1.29 | † | | | 0.80 | † | | | 36,089 | | | | 73 | |
| | | | | | | | | | | | | | | | | | | | | | | | | | | | | | | | | | | | | | | | | | | | | | | | | | | | | | | | | | | | | | | | | | | | |
| | | 10.14 | | | | 0.21 | • | | | (0.84 | ) | | | (0.63 | ) | | | 0.30 | | | | — | | | | — | | | | 0.30 | | | | — | | | | 9.21 | | | | (6.11 | ) | | | 1.69 | | | | 1.31 | | | | 1.28 | | | | 2.43 | | | | 73 | | | | 29 | |
| | | 10.97 | | | | 0.22 | | | | (0.94 | ) | | | (0.72 | ) | | | 0.11 | | | | — | | | | — | | | | 0.11 | | | | — | | | | 10.14 | | | | (6.62 | ) | | | 1.57 | | | | 1.35 | † | | | 1.35 | † | | | 2.06 | † | | | 63 | | | | 48 | |
| | | 9.68 | | | | 0.12 | • | | | 1.25 | | | | 1.37 | | | | 0.08 | | | | — | | | | — | | | | 0.08 | | | | — | | | | 10.97 | | | | 14.27 | | | | 1.53 | | | | 1.45 | † | | | 1.45 | † | | | 1.15 | † | | | 34 | | | | 43 | |
| | | 9.18 | | | | 0.01 | • | | | 0.49 | | | | 0.50 | | | | — | | | | — | | | | — | | | | — | | | | — | | | | 9.68 | | | | 5.45 | | | | 1.39 | | | | 1.39 | † | | | 1.39 | † | | | 0.30 | † | | | 3 | | | | 44 | |
ING International Value Fund | | | | | | | | | | | | | | | | | | | |
| | | | | | | | | | | | | | | | | | | | | | | | | | | | | | | | | | | | | | | | | | | | | | | | | | | | | | | | | | | | | | | | | | | | |
| | | 10.59 | | | | 0.21 | • | | | (0.12 | ) | | | 0.09 | | | | 0.28 | | | | — | | | | — | | | | 0.28 | | | | 0.01 | | | | 10.41 | | | | 1.20 | (a) | | | 1.67 | | | | 1.61 | | | | 1.61 | | | | 2.05 | | | | 185,195 | | | | 33 | |
| | | 11.78 | | | | 0.20 | • | | | (1.16 | ) | | | (0.96 | ) | | | 0.23 | | | | — | | | | — | | | | 0.23 | | | | 0.00 | * | | | 10.59 | | | | (8.33 | )(a),(h) | | | 1.65 | | | | 1.64 | | | | 1.64 | | | | 1.68 | | | | 306,024 | | | | 116 | |
| | | 11.30 | | | | 0.18 | • | | | 0.45 | | | | 0.63 | | | | 0.17 | | | | — | | | | — | | | | 0.17 | | | | 0.02 | | | | 11.78 | | | | 5.78 | (a),(i) | | | 1.62 | | | | 1.62 | † | | | 1.62 | † | | | 1.63 | † | | | 549,016 | | | | 81 | |
| | | 11.13 | | | | 0.14 | | | | 1.88 | | | | 2.02 | | | | 0.35 | | | | 1.51 | | | | — | | | | 1.86 | | | | 0.01 | | | | 11.30 | | | | 21.74 | (a),(j) | | | 1.75 | | | | 1.75 | † | | | 1.75 | † | | | 1.25 | † | | | 725,329 | | | | 92 | |
| | | 23.15 | | | | 0.39 | | | | (8.83 | ) | | | (8.44 | ) | | | 0.23 | | | | 3.35 | | | | — | | | | 3.58 | | | | — | | | | 11.13 | | | | (42.58 | )(a) | | | 1.58 | | | | 1.58 | † | | | 1.57 | † | | | 1.95 | † | | | 931,162 | | | | 23 | |
| | | | | | | | | | | | | | | | | | | | | | | | | | | | | | | | | | | | | | | | | | | | | | | | | | | | | | | | | | | | | | | | | | | | |
| | | 10.61 | | | | 0.13 | • | | | (0.11 | ) | | | 0.02 | | | | 0.16 | | | | — | | | | — | | | | 0.16 | | | | 0.01 | | | | 10.48 | | | | 0.45 | (a) | | | 2.37 | | | | 2.31 | | | | 2.31 | | | | 1.29 | | | | 635 | | | | 33 | |
| | | 11.66 | | | | 0.11 | • | | | (1.16 | ) | | | (1.05 | ) | | | 0.00 | * | | | — | | | | — | | | | 0.00 | * | | | 0.00 | * | | | 10.61 | | | | (9.00 | )(a),(h) | | | 2.35 | | | | 2.34 | | | | 2.34 | | | | 0.94 | | | | 1,430 | | | | 116 | |
| | | 11.14 | | | | 0.11 | • | | | 0.43 | | | | 0.54 | | | | 0.04 | | | | — | | | | — | | | | 0.04 | | | | 0.02 | | | | 11.66 | | | | 5.07 | (a),(i) | | | 2.32 | | | | 2.32 | † | | | 2.32 | † | | | 0.96 | † | | | 3,132 | | | | 81 | |
| | | 10.88 | | | | 0.06 | • | | | 1.87 | | | | 1.93 | | | | 0.17 | | | | 1.51 | | | | — | | | | 1.68 | | | | 0.01 | | | | 11.14 | | | | 20.91 | (a),(j) | | | 2.45 | | | | 2.45 | † | | | 2.45 | † | | | 0.65 | † | | | 37,743 | | | | 92 | |
| | | 22.64 | | | | 0.19 | • | | | (8.58 | ) | | | (8.39 | ) | | | 0.02 | | | | 3.35 | | | | — | | | | 3.37 | | | | — | | | | 10.88 | | | | (43.00 | )(a) | | | 2.28 | | | | 2.28 | † | | | 2.27 | † | | | 1.12 | † | | | 85,873 | | | | 23 | |
| | | | | | | | | | | | | | | | | | | | | | | | | | | | | | | | | | | | | | | | | | | | | | | | | | | | | | | | | | | | | | | | | | | | |
| | | 10.23 | | | | 0.14 | • | | | (0.12 | ) | | | 0.02 | | | | 0.19 | | | | — | | | | — | | | | 0.19 | | | | 0.01 | | | | 10.07 | | | | 0.51 | (a) | | | 2.37 | | | | 2.31 | | | | 2.31 | | | | 1.38 | | | | 101,301 | | | | 33 | |
| | | 11.40 | | | | 0.11 | • | | | (1.12 | ) | | | (1.01 | ) | | | 0.16 | | | | — | | | | — | | | | 0.16 | | | | 0.00 | * | | | 10.23 | | | | (8.98 | )(a),(h) | | | 2.35 | | | | 2.34 | | | | 2.34 | | | | 0.98 | | | | 137,199 | | | | 116 | |
| | | 10.95 | | | | 0.11 | • | | | 0.43 | | | | 0.54 | | | | 0.11 | | | | — | | | | — | | | | 0.11 | | | | 0.02 | | | | 11.40 | | | | 5.07 | (a),(i) | | | 2.32 | | | | 2.26 | † | | | 2.26 | † | | | 0.99 | † | | | 210,574 | | | | 81 | |
| | | 10.79 | | | | 0.05 | • | | | 1.85 | | | | 1.90 | | | | 0.24 | | | | 1.51 | | | | — | | | | 1.75 | | | | 0.01 | | | | 10.95 | | | | 20.92 | (a),(j) | | | 2.45 | | | | 2.40 | † | | | 2.40 | † | | | 0.58 | † | | | 279,060 | | | | 92 | |
| | | 22.52 | | | | 0.27 | | | | (8.57 | ) | | | (8.30 | ) | | | 0.08 | | | | 3.35 | | | | — | | | | 3.43 | | | | — | | | | 10.79 | | | | (42.94 | )(a) | | | 2.28 | | | | 2.18 | † | | | 2.17 | † | | | 1.34 | † | | | 326,812 | | | | 23 | |
| | | | | | | | | | | | | | | | | | | | | | | | | | | | | | | | | | | | | | | | | | | | | | | | | | | | | | | | | | | | | | | | | | | | |
| | | 10.58 | | | | 0.27 | | | | (0.15 | ) | | | 0.12 | | | | 0.33 | | | | — | | | | — | | | | 0.33 | | | | 0.01 | | | | 10.38 | | | | 1.57 | (a) | | | 1.23 | | | | 1.17 | | | | 1.17 | | | | 2.50 | | | | 195,304 | | | | 33 | |
| | | 11.77 | | | | 0.23 | • | | | (1.16 | ) | | | (0.93 | ) | | | 0.26 | | | | — | | | | — | | | | 0.26 | | | | 0.00 | * | | | 10.58 | | | | (8.04 | )(a),(h) | | | 1.29 | | | | 1.28 | | | | 1.28 | | | | 1.97 | | | | 258,683 | | | | 116 | |
| | | 11.30 | | | | 0.23 | • | | | 0.44 | | | | 0.67 | | | | 0.22 | | | | — | | | | — | | | | 0.22 | | | | 0.02 | | | | 11.77 | | | | 6.15 | (a),(i) | | | 1.27 | | | | 1.27 | † | | | 1.27 | † | | | 2.02 | † | | | 449,321 | | | | 81 | |
| | | 11.16 | | | | 0.16 | • | | | 1.90 | | | | 2.06 | | | | 0.42 | | | | 1.51 | | | | — | | | | 1.93 | | | | 0.01 | | | | 11.30 | | | | 22.23 | (a),(j) | | | 1.33 | | | | 1.33 | † | | | 1.33 | † | | | 1.65 | † | | | 607,517 | | | | 92 | |
| | | 23.22 | | | | 0.47 | | | | (8.87 | ) | | | (8.40 | ) | | | 0.31 | | | | 3.35 | | | | — | | | | 3.66 | | | | — | | | | 11.16 | | | | (42.37 | )(a) | | | 1.28 | | | | 1.28 | † | | | 1.27 | † | | | 2.23 | † | | | 735,622 | | | | 23 | |
See Accompanying Notes to Financial Statements
40
FINANCIAL HIGHLIGHTS (CONTINUED)
Selected data for a share of beneficial interest outstanding throughout each year or period.
| | | | Income (loss)
from investment
operations
|
| | | Less distributions
|
| | | | | | | | | Ratios to average
net assets
| | Supplemental
data
| |
|---|
| | | | | | | | | | | | | | | | | | | | | | | | | | | | | | | | | | | | |
|---|
| | Net
asset
value,
beginning
of year
or period
|
| Net
investment
income
(loss)
|
| Net
realized
and
unrealized
gain
(loss)
|
| Total
from
investment
operations
|
| From
net
investment
income
|
| From
net
realized
gains
|
| From
return
of
capital
|
| Total
distributions
|
| Payment
by
affiliate
|
| Net
asset
value,
end of
year or
period
|
| Total
Return(1)
|
| Expenses
before
reductions/
additions(2)(3)
|
| Expenses
net
of fee
waivers
and/or
recoupments
if any(2)(3)
|
| Expenses
net
of all
reductions/
additions(2)(3)
|
| Net
investment
income
(loss)(2)(3)
|
| Net
assets,
end of
year or
period
|
| Portfolio
turnover
rate
|
|---|
Year or period ended
|
| ($)
|
| ($)
|
| ($)
|
| ($)
|
| ($)
|
| ($)
|
| ($)
|
| ($)
|
| ($)
|
| ($)
|
| (%)
|
| (%)
|
| (%)
|
| (%)
|
| (%)
|
| ($000’s)
|
| (%)
|
|---|
ING International Value Fund (continued) | |
| | | | | | | | | | | | | | | | | | | | | | | | | | | | | | | | | | | | | | | | | | | | | | | | | | | | | | | | | | | | | | | | | | | | |
| | | 10.57 | | | | 0.26 | • | | | (0.15 | ) | | | 0.11 | | | | 0.31 | | | | — | | | | — | | | | 0.31 | | | | 0.01 | | | | 10.38 | | | | 1.49 | (a) | | | 1.37 | | | | 1.31 | | | | 1.31 | | | | 2.54 | | | | 149 | | | | 33 | |
| | | 11.76 | | | | 0.08 | • | | | (1.01 | ) | | | (0.93 | ) | | | 0.26 | | | | — | | | | — | | | | 0.26 | | | | 0.00 | * | | | 10.57 | | | | (8.06 | )(a),(h) | | | 1.35 | | | | 1.34 | | | | 1.34 | | | | 0.70 | | | | 445 | | | | 116 | |
| | | 11.30 | | | | 0.22 | | | | 0.44 | | | | 0.66 | | | | 0.22 | | | | — | | | | — | | | | 0.22 | | | | 0.02 | | | | 11.76 | | | | 6.04 | (a),(i) | | | 1.32 | | | | 1.32 | † | | | 1.32 | † | | | 1.99 | † | | | 24,507 | | | | 81 | |
| | | 10.42 | | | | 0.01 | • | | | 0.87 | | | | 0.88 | | | | — | | | | — | | | | — | | | | — | | | | — | | | | 11.30 | | | | 8.45 | (a),(j) | | | 1.33 | | | | 1.33 | † | | | 1.33 | † | | | 0.20 | † | | | 3 | | | | 92 | |
| | | | | | | | | | | | | | | | | | | | | | | | | | | | | | | | | | | | | | | | | | | | | |
| | | | | | | | | | | | | | | | | | | | | | | | | | | | | | | | | | | | | | | | | | | | | | | | | | | | | | | | | | | | | | | | | | | | |
| | | 33.52 | | | | 0.15 | | | | (2.23 | ) | | | (2.08 | ) | | | — | | | | — | | | | — | | | | — | | | | — | | | | 31.44 | | | | (6.21 | ) | | | 2.14 | | | | 2.14 | | | | 2.14 | | | | 0.43 | | | | 235,622 | | | | 46 | |
| | | 36.52 | | | | (0.12 | )• | | | (2.88 | ) | | | (3.00 | ) | | | — | | | | — | | | | — | | | | — | | | | — | | | | 33.52 | | | | (8.21 | ) | | | 2.03 | | | | 2.03 | | | | 2.03 | | | | (0.29 | ) | | | 317,715 | | | | 31 | |
| | | 29.53 | | | | (0.33 | )• | | | 7.32 | | | | 6.99 | | | | — | | | | — | | | | — | | | | — | | | | — | | | | 36.52 | | | | 23.67 | | | | 2.11 | | | | 2.11 | | | | 2.11 | | | | (0.98 | ) | | | 418,162 | | | | 30 | |
| | | 25.60 | | | | (0.19 | ) | | | 12.20 | | | | 12.01 | | | | — | | | | 8.08 | | | | — | | | | 8.08 | | | | — | | | | 29.53 | | | | 65.55 | | | | 2.21 | | | | 2.21 | | | | 2.21 | | | | (0.98 | ) | | | 373,249 | | | | 46 | |
| | | 78.13 | | | | (0.48 | ) | | | (40.46 | ) | | | (40.94 | ) | | | — | | | | 11.59 | | | | — | | | | 11.59 | | | | 0.00 | * | | | 25.60 | | | | (61.70 | ) | | | 2.06 | | | | 2.06 | | | | 2.06 | | | | (0.60 | ) | | | 261,127 | | | | 43 | |
| | | | | | | | | | | | | | | | | | | | | | | | | | | | | | | | | | | | | | | | | | | | | | | | | | | | | | | | | | | | | | | | | | | | |
| | | 33.79 | | | | 0.25 | • | | | (2.28 | ) | | | (2.03 | ) | | | — | | | | — | | | | — | | | | — | | | | — | | | | 31.76 | | | | (6.01 | ) | | | 1.96 | | | | 1.96 | | | | 1.96 | | | | 0.77 | | | | 8,675 | | | | 46 | |
| | | 36.64 | | | | (0.02 | ) | | | (2.83 | ) | | | (2.85 | ) | | | — | | | | — | | | | — | | | | — | | | | — | | | | 33.79 | | | | (7.78 | ) | | | 1.73 | | | | 1.73 | | | | 1.73 | | | | (0.04 | ) | | | 10,528 | | | | 31 | |
| | | 29.54 | | | | (0.10 | ) | | | 7.20 | | | | 7.10 | | | | — | | | | — | | | | — | | | | — | | | | — | | | | 36.64 | | | | 24.04 | | | | 1.71 | | | | 1.71 | | | | 1.71 | | | | (0.38 | ) | | | 8,151 | | | | 30 | |
| | | 28.27 | | | | (0.04 | )• | | | 1.31 | | | | 1.27 | | | | — | | | | — | | | | — | | | | — | | | | — | | | | 29.54 | | | | 4.49 | | | | 1.68 | | | | 1.68 | | | | 1.68 | | | | (1.68 | ) | | | 3 | | | | 46 | |
| | | | | | | | | | | | | | | | | | | | | | | | | | | | | | | | | | | | | | | | | | | | | | | | | | | | | | | | | | | | | | | | | | | | |
| | | 33.74 | | | | 0.47 | • | | | (2.49 | ) | | | (2.02 | ) | | | — | | | | — | | | | — | | | | — | | | | — | | | | 31.72 | | | | (5.99 | ) | | | 1.89 | | | | 1.89 | | | | 1.89 | | | | 1.51 | | | | 64 | | | | 46 | |
| | | 39.53 | | | | (0.03 | ) | | | (5.76 | ) | | | (5.79 | ) | | | — | | | | — | | | | — | | | | — | | | | — | | | | 33.74 | | | | (14.65 | ) | | | 1.78 | | | | 1.78 | | | | 1.78 | | | | (0.41 | ) | | | 3 | | | | 31 | |
(1)
| | Total return is calculated assuming reinvestment of all dividends, capital gain distributions and return of capital distributions, if any, at net asset value and excluding the deduction of sales charges. Total return for periods less than one year is not annualized. |
(2) | | Annualized for periods less than one year. |
(3)
| | Expense ratios reflect operating expenses of a Fund. Expenses before reductions/additions do not reflect amounts reimbursed by the Investment Adviser and/or Distributor or reductions from brokerage service arrangements or other expense offset arrangements and do not represent the amount paid by a Fund during periods when reimbursements or reductions occur. Expenses net of fee waivers reflect expenses after reimbursement by an Investment Adviser and/or Distributor but prior to reductions from brokerage service arrangements or other expense offset arrangements. Expenses net of all reductions/additions represent the net expenses paid by a Fund. Net investment income (loss) is net of all such additions or reductions. |
(4) | | Commencement of operations. |
(a)
| | Excluding a distribution payment from settlement of a regulatory matter during the year ended October 31, 2012, total return for Global Value Choice would have been (7.77)%, (8.42)%, (8.43)%, (7.61)% and (7.50)% on Classes A, B, C, I and W; International Small Cap total return would have been 6.33%, 5.68%, 5.64%, 6.85%, 6.46% and 6.72% on Classes A, B, C, I, O and W; and International Value total return would have been 1.07%, 0.32%, 0.38%, 1.44% and 1.36% on Classes A, B, C, I and W, respectively. |
(b) | | Excluding a payment from distribution settlement in the fiscal year ended October 31, 2010, Global Value Choice total return would have been 21.82%, 20.92%, 20.89%, 22.34% and 22.08% on Classes A,B,C,I and W, respectively. |
(c) | | There was no impact on total return by the payment from distribution settlement. |
(d) | | Excluding a payment by affiliate in the fiscal year ended October 31, 2009, Index Plus International Equity total return would have been 26.91%, 25.92%, 25.96%, 27.32% and 27.11% on Classes A, B, C, I and O, respectively. |
(e)
| | Excluding a payment from distribution settlement in the fiscal year ended October 31, 2011, International Small Cap total return would have been (5.45)%, (6.09)%, (6.06)%, (5.01)%, (5.36)% and (5.12)% on Classes A,B,C,I, O and W, respectively. |
(f)
| | Excluding a payment from distribution settlement in the fiscal year ended October 31, 2010, International Small Cap total return would have been 20.60%, 19.82%, 19.80%, 21.20%, 20.70% and 20.98% on Classes A,B,C,I,O and W, respectively. |
(g)
| | Excluding a payment by affiliate in the fiscal year ended October 31, 2009, International Small Cap total return would have been 41.91%, 40.78%, 40.97%, 42.75%, 42.20% and 42.70% on Classes A,B,C,I,O and W,
respectively. |
(h) | | Excluding a payment from distribution settlement in the fiscal year ended October 31, 2011, International Value total return would have been (8.34)%, (9.02)%, (9.00)%, (8.05)% and (8.07)% on Classes A,B,C,I and W, respectively. |
(i) | | Excluding a payment from distribution settlement in the fiscal year ended October 31, 2010, International Value total return would have been 5.61%, 4.90%, 4.90%, 5.98% and 5.87% on Classes A,B,C,I, and W, respectively. |
(j) | | Excluding a payment by affiliate in the fiscal year ended October 31, 2009, International Value total return would have been 21.64%, 20.80%, 20.81% and 22.12% on Classes A,B,C and I, respectively. |
(k) | | For the year ended October 31, 2008, Class A redemption fees applied to capital were less than $0.005. |
• | | Calculated using average number of shares outstanding throughout the period. |
| * | | Amount is less than $0.005 or 0.005% or more than $(0.005) or (0.005)%. |
†
| | Impact of waiving the advisory fee for the ING Institutional Prime Money Market Fund holding has less than 0.005% impact on the expense ratio and net investment income or loss ratio. |
See Accompanying Notes to Financial Statements
41
NOTES TO FINANCIAL STATEMENTS AS OF OCTOBER 31, 2012
NOTE 1 — ORGANIZATION
The ING Funds included in this report are comprised of ING Mutual Funds (“IMF”) and ING Mayflower Trust (“IMT”) (each a “Registrant” and collectively, the “Registrants”); both are organized as open-end investment management companies registered under the Investment Company Act of 1940, as amended (“1940 Act”).
IMF is a Delaware statutory trust organized on December 18, 1992 with sixteen separate active series, seven of which are included in this report, (each, a “Fund” and collectively, the “IMF Funds”): Diversified International, Global Bond, Global Value Choice, Index Plus International Equity, International Small Cap, International Value Choice and Russia. IMT is a Massachusetts business trust organized on August 18, 1993 with one series, International Value (a “Fund” and together with the IMF Funds, the “Funds”). The investment objective of each Fund is described in the Funds’ prospectuses.
Each Fund offers at least one or more of the following classes of shares: Class A, Class B, Class C, Class I, Class O, Class R and Class W. The separate classes of shares differ principally in the applicable sales charges (if any), distribution fees and shareholder servicing fees and transfer agent fees. Generally, shareholders of each class also bear certain expenses that pertain to that particular class. All shareholders bear the common expenses of the Fund and earn income and realized gains/losses from the portfolio pro rata based on the average daily net assets of each class, without distinction between share classes. Expenses that are specific to a fund or a class are charged directly to that fund or class. Other operating expenses shared by several funds are generally allocated among those funds based on average net assets. Distributions are determined separately for each class based on income and expenses allocated to each class pro rata based on the shares outstanding of each class on the date of distribution. Differences in per share dividend rates generally result from the differences in separate class expenses, including distribution and shareholder servicing fees, if applicable.
Class B shares, along with their pro rata reinvested dividend shares, automatically convert to Class A shares eight years after purchase. Class B shares are closed to new investors and additional investments from existing shareholders, except in connection with the reinvestment of any distributions and permitted exchanges.
During the period, Global Value Choice was closed to new investments except for investments by: (1) existing shareholders of record as of July 29, 2011; and (2) retirement plans that purchase shares of the Fund prior to October 31, 2011. The closure did not affect share purchases through the reinvestment of dividends and distributions. Effective May 7, 2012, the Fund was re-opened to new investments.
NOTE 2 — SIGNIFICANT ACCOUNTING POLICIES
The following significant accounting policies are consistently followed by the Funds in the preparation of their financial statements. Such policies are in conformity with U.S. generally accepted accounting principles (“GAAP”) for investment companies.
A. Security Valuation. All investments in securities are recorded at their estimated fair value, as described below. Investments in equity securities traded on a national securities exchange are valued at the last reported sale price. Securities reported by NASDAQ will be valued at the NASDAQ official closing prices. Securities traded on an exchange or NASDAQ for which there has been no sale, securities traded in the over-the-counter-market, gold and silver bullion, platinum and palladium are valued at the mean between the last reported bid and ask prices. All investments quoted in foreign currencies are valued daily in U.S. dollars on the basis of the foreign currency exchange rates prevailing at that time. Debt securities acquired with more than 60 days to maturity are valued using matrix pricing methods determined by an independent pricing service which takes into consideration such factors as yields, maturities, liquidity, ratings and traded prices in similar or identical securities. Securities for which valuations are not readily available from an independent pricing service may be valued by brokers which use prices provided by market makers or estimates of fair value obtained from yield data relating to investments or securities with similar characteristics. Investments in open-end mutual funds are valued at the net asset value. Investments in securities of sufficient credit quality, maturing 60 days or less from date of acquisition are valued at amortized cost which approximates fair value.
Securities and assets for which market quotations are not readily available (which may include certain restricted securities which are subject to limitations as to their sale) are valued at their fair values, as defined by the 1940 Act, and as determined in good faith by or under the supervision of the Funds’ Board of Trustees (“Board”) in accordance with methods that are specifically authorized by the Board. Securities traded
42
NOTES TO FINANCIAL STATEMENTS AS OF OCTOBER 31, 2012 (CONTINUED)
NOTE 2 — SIGNIFICANT ACCOUNTING POLICIES (continued)
on exchanges, including foreign exchanges, which close earlier than the time that a Fund calculates its next net asset value (“NAV”) may also be valued at their fair values, as defined by the 1940 Act, and as determined in good faith by or under the supervision of a Fund’s Board, in accordance with methods that are specifically authorized by the Board. The valuation techniques applied in any specific instance are likely to vary from case to case. With respect to a restricted security, for example, consideration is generally given to the cost of the investment, the market value of any unrestricted securities of the same class at the time of valuation, the potential expiration of restrictions on the security, the existence of any registration rights, the costs to a Fund related to registration of the security, as well as factors relevant to the issuer itself. Consideration may also be given to the price and extent of any public trading in similar securities of the issuer or comparable companies’ securities.
For all Funds, the value of a foreign security traded on an exchange outside the United States is generally based on its price on the principal foreign exchange where it trades as of the time a Fund determines its NAV, or if the foreign exchange closes prior to the time the Fund determines its NAV, the most recent closing price of the foreign security on its principal exchange. Trading in certain non-U.S. securities may not take place on all days on which the New York Stock Exchange (“NYSE”) is open. Further, trading takes place in various foreign markets on days on which the NYSE is not open. Consequently, the calculation of a Fund’s NAV may not take place contemporaneously with the determination of the prices of securities held by a Fund in foreign securities markets. Further, the value of a Fund’s assets may be significantly affected by foreign trading on days when a shareholder cannot purchase or redeem shares of the Fund. In calculating a Fund’s NAV, foreign securities in foreign currency are converted to U.S. dollar equivalents.
If an event occurs after the time at which the market for foreign securities held by a Fund closes but before the time that a Fund’s next NAV is calculated, such event may cause the closing price on the foreign exchange to not represent a readily available reliable market value quotation for such securities at the time a Fund determines its NAV. In such a case, a Fund will use the fair value of such securities as determined under the Funds’ valuation procedures. Events after the close of trading on a foreign market that could require a Fund to fair value some or all of its foreign securities include, among others, securities trading in the U.S. and other markets, corporate announcements, natural and other disasters, and political and other events. Among other elements of analysis in the determination of a security’s fair value, the Board has authorized the use of one or more independent research services to assist with such determinations. An independent research service may use statistical analyses and quantitative models to help determine fair value as of the time a Fund calculates its NAV. There can be no assurance that such models accurately reflect the behavior of the applicable markets or the effect of the behavior of such markets on the fair value of securities, or that such markets will continue to behave in a fashion that is consistent with such models. Unlike the closing price of a security on an exchange, fair value determinations employ elements of judgment. Consequently, the fair value assigned to a security may not represent the actual value that a Fund could obtain if it were to sell the security at the time of the close of the NYSE. Pursuant to procedures adopted by the Board, a Fund is not obligated to use the fair valuations suggested by any research service, and valuation recommendations provided by such research services may be overridden if other events have occurred or if other fair valuations are determined in good faith to be more accurate. Unless an event is such that it causes a Fund to determine that the closing prices for one or more securities do not represent readily available reliable market value quotations at the time a Fund determines its NAV, events that occur between the time of the close of the foreign market on which they are traded and the close of regular trading on the NYSE will not be reflected in a Fund’s NAV.
For Diversified International and other Funds with holdings in open end investment companies, the valuations of the Funds’ investments in underlying funds (“Underlying Funds”) are based on the NAVs of the Underlying Funds each business day. In general, assets of the Underlying Funds are valued based on the NAVs of the Underlying Funds each business day. In general, assets of the Underlying Funds are valued based on actual or estimated market value, with special provisions for assets not having readily available market quotations and short-term debt securities, and for situations where market quotations are deemed unreliable. Investments held in Underlying Funds maturing in 60 days or less from the date of acquisition are valued at amortized cost which generally approximates fair value. Securities prices may be obtained from automated pricing services. Shares of investment companies held by the Underlying Funds will generally be valued at the latest NAV reported by that investment company.
43
NOTES TO FINANCIAL STATEMENTS AS OF OCTOBER 31, 2012 (CONTINUED)
NOTE 2 — SIGNIFICANT ACCOUNTING POLICIES (continued)
Fair value is defined as the price that the Funds would receive to sell an asset or pay to transfer a liability in an orderly transaction between market participants at the measurement date. Each investment asset or liability of the Funds is assigned a level at measurement date based on the significance and source of the inputs to its valuation. Quoted prices in active markets for identical securities are classified as “Level 1,” inputs other than quoted prices for an asset or liability that are observable are classified as “Level 2” and unobservable inputs, including the adviser’s or sub-adviser’s judgment about the assumptions that a market participant would use in pricing an asset or liability are classified as “Level 3.” The inputs used for valuing securities are not necessarily an indication of the risks associated with investing in those securities. Short-term securities of sufficient credit quality which are valued at amortized cost, which approximates fair value, are generally considered to be Level 2 securities under applicable accounting rules. A table summarizing the Funds’ investments under these levels of classification is included following the Summary Portfolios of Investments.
The Board has adopted methods for valuing securities and other assets in circumstances where market quotes are not readily available, and has delegated the responsibility for applying the valuation methods to the “Pricing Committee” as established by the Funds’ Administrator. The Pricing Committee considers all facts it deems relevant that are reasonably available, through either public information or information available to the Investment Adviser or sub-adviser, when determining the fair value of the security. In the event that a security or asset cannot be valued pursuant to one of the valuation methods established by the Board, the fair value of the security or asset will be determined in good faith by the Pricing Committee. When a Fund uses these fair valuation methods that use significant unobservable inputs to determine its NAV, securities will be priced by a method that the Pricing Committee believes accurately reflects fair value and are categorized as Level 3 of the fair value hierarchy. The methodologies used for valuing securities are not necessarily an indication of the risks of investing in those securities valued in good faith at fair value nor can it be assured the Fund can obtain the fair value assigned to a security if they were to sell the security.
To assess the continuing appropriateness of security valuations, the Pricing Committee may compare prior day prices, prices on comparable securities, and traded prices to the prior or current day prices and the Pricing Committee challenges those prices exceeding certain tolerance levels with the third party pricing service or broker source. For those securities valued in good faith at fair value, the Pricing Committee reviews and affirms the reasonableness of the valuation on a regular basis after considering all relevant information that is reasonably available.
For fair valuations using significant unobservable inputs, U.S. GAAP requires a reconciliation of the beginning to ending balances for reported fair values that presents changes attributable to total realized and unrealized gains or losses, purchases and sales, and transfers in or out of the Level 3 category during the period. The end of period timing recognition is used for the transfers between Levels of a Fund’s assets and liabilities. A reconciliation of Level 3 investments is presented when the Fund has a significant amount of Level 3 investments.
For the year ended October 31, 2012, there have been no significant changes to the fair valuation methodologies.
B. Security Transactions and Revenue Recognition. Securities transactions are accounted for on the trade date. Realized gains and losses are reported on the basis of identified cost of securities sold. Interest income is recorded on an accrual basis. Dividend income is recorded, net of any applicable withholding tax, on the ex-dividend date, or for certain foreign securities, when the information becomes available to the Funds. Premium amortization and discount accretion are determined by the effective yield method.
C. Foreign Currency Translation. The books and records of the Funds are maintained in U.S. dollars.
Any foreign currency amounts are translated into U.S. dollars on the following basis:
| (1) | | Market value of investment securities, other assets and liabilities — at the exchange rates prevailing at the end of the day. |
| (2) | | Purchases and sales of investment securities, income and expenses — at the rates of exchange prevailing on the respective dates of such transactions. |
Although the net assets and the market values are presented at the foreign exchange rates at the end of the day, the Funds and Underlying Funds do not isolate the portion of the results of operations resulting from changes in foreign exchange rates on investments from the fluctuations arising from changes in market prices of securities held. Such fluctuations are included with the net realized and unrealized gains or losses from
44
NOTES TO FINANCIAL STATEMENTS AS OF OCTOBER 31, 2012 (CONTINUED)
NOTE 2 — SIGNIFICANT ACCOUNTING POLICIES (continued)
investments. For securities that are subject to foreign withholding tax upon disposition, liabilities are recorded on the Statements of Assets and Liabilities for the estimated tax withholding based on the securities’ current market value. Upon disposition, realized gains or losses on such securities are recorded net of foreign withholding tax.
Reported net realized foreign exchange gains or losses arise from sales of foreign currencies, currency gains or losses realized between the trade and settlement dates on securities transactions, the difference between the amounts of dividends, interest, and foreign withholding taxes recorded on a Fund’s books, and the U.S. dollar equivalent of the amounts actually received or paid. Net unrealized foreign exchange gains and losses arise from changes in the value of assets and liabilities other than investments in securities at fiscal year end, resulting from changes in the exchange rate. Foreign security and currency transactions may involve certain considerations and risks not typically associated with investing in U.S. companies and U.S. government securities. These risks include, but are not limited to, revaluation of currencies and future adverse political and economic developments which could cause securities and their markets to be less liquid, and prices more volatile than those of comparable U.S. companies and U.S. government securities. The foregoing risks are even greater with respect to securities of issuers in emerging markets.
D. Risk Exposures and the Use of Derivative Instruments. The Funds’ investment strategies permit them to enter into various types of derivatives contracts, including, but not limited to, forward foreign currency exchange contracts, futures, purchased options, written options, and swaps. In doing so, the Funds will employ strategies in differing combinations to permit them to increase or decrease the level of risk, or change the level or types of exposure to market risk factors. This may allow the Funds to pursue their objectives more quickly, and efficiently than if they were to make direct purchases or sales of securities capable of affecting a similar response to market factors.
Market Risk Factors. In pursuit of their investment objectives, the Funds may seek to use derivatives to increase or decrease their exposure to the following market risk factors:
Equity Risk. Equity risk relates to the change in value of equity securities as they relate to increases or decreases in the general market.
Foreign Exchange Rate Risk. Foreign exchange rate risk relates to the change in U.S. dollar value of a security held that is denominated in a foreign currency. The U.S. dollar value of a foreign currency denominated security will decrease as the dollar appreciates against the currency, while the U.S. dollar value will increase as the dollar depreciates against the currency.
Risks of Investing in Derivatives. The Funds’ use of derivatives can result in losses due to unanticipated changes in the market risk factors and the overall market. In instances where the Funds are using derivatives to decrease or hedge exposures to market risk factors for securities held by the Funds, there are also risks that those derivatives may not perform as expected resulting in losses for the combined or hedged positions.
The use of these strategies involves certain special risks, including a possible imperfect correlation, or even no correlation, between price movements of derivative instruments and price movements of related investments. While some strategies involving derivative instruments can reduce the risk of loss, they can also reduce the opportunity for gain or even result in losses by offsetting favorable price movements in related investments or otherwise, due to the possible inability of the Funds to purchase or sell a portfolio security at a time that otherwise would be favorable or the possible need to sell a portfolio security at a disadvantageous time because the Funds are required to maintain asset coverage or offsetting positions in connection with transactions in derivative instruments. Additional associated risks from investing in derivatives also exist and potentially could have significant effects on the valuation of the derivative and the Funds. Associated risks are not the risks that the Funds are attempting to increase or decrease exposure to, per their investment objectives, but are the additional risks from investing in derivatives. Examples of these associated risks are liquidity risk, which is the risk that the Funds will not be able to sell the derivative in the open market in a timely manner, and counterparty credit risk, which is the risk that the counterparty will not fulfill its obligation to the Funds. Associated risks can be different for each type of derivative and are discussed by each derivative type in the following notes.
Counterparty Credit Risk and Credit Related Contingent Features. Certain derivative positions are subject to counterparty credit risk, which is the risk that the counterparty will not fulfill its obligation to the Funds. The Funds derivative counterparties are financial institutions who are subject to market
45
NOTES TO FINANCIAL STATEMENTS AS OF OCTOBER 31, 2012 (CONTINUED)
NOTE 2 — SIGNIFICANT ACCOUNTING POLICIES (continued)
conditions that may weaken their financial position. The Funds intend to enter into financial transactions with counterparties that they believe to be creditworthy at the time of the transaction. To reduce this risk, the Funds generally enter into master netting arrangements, established within the Funds International Swap and Derivatives Association, Inc. (“ISDA”) Master Agreements (“Master Agreements”). These agreements are with select counterparties and they govern transactions, including certain over-the-counter (“OTC”) derivative and forward foreign currency contracts, entered into by the Funds and the counterparty. The Master Agreements maintain provisions for general obligations, representations, agreements, collateral, and events of default or termination. The occurrence of a specified event of termination may give a counterparty the right to terminate all of its contracts and affect settlement of all outstanding transactions under the applicable Master Agreement.
The Funds may also enter into collateral agreements with certain counterparties to further mitigate counterparty risk on OTC derivative and forward foreign currency contracts. Subject to established minimum levels, collateral is generally determined based on the net aggregate unrealized gain or loss on contracts with a certain counterparty. Collateral pledged to or from the Funds is held in a segregated account by a third-party agent and can be in the form of cash or debt securities issued by the U.S. government or related agencies.
At October 31, 2012, the maximum amount of loss that Global Bond would incur if its counterparties failed to perform would be $18,734,015, which represents the gross payments to be received on open purchased options, forward foreign currency contracts and swaps were they to be unwound as of October 31, 2012. To reduce the amount of potential loss to Global Bond, various counterparties have posted $4,198,000 in cash collateral and $779,000 principal value in U.S. Treasury obligations.
The Funds have credit related contingent features that if triggered would allow its derivatives counterparties to close out and demand payment or additional collateral to cover their exposure from the Funds. Credit related contingent features are established between the Funds and their derivatives counterparties to reduce the risk that the Funds will not fulfill their payment obligations to their counterparties. These triggering features include, but are not limited to, a percentage decrease in a Fund’s net assets and or a percentage decrease in a Fund’s NAV, which could cause a Fund to accelerate payment of any net liability owed to the counterparty. The contingent features are established within the Funds Master Agreements.
Global Bond had a liability position of $20,280,186 on forward foreign currency contracts, swaps and written options with credit related contingent features. If a contingent feature would have been triggered as of October 31, 2012, Global Bond could have been required to pay this amount in cash to its counterparties. As of October 31, 2012, Global Bond had posted $7,530,000 to its counterparties in cash collateral for its open derivatives transactions.
E. Forward Foreign Currency Transactions and Futures Contracts. Each Fund and Underlying Fund may enter into forward foreign currency exchange transactions to convert to and from different foreign currencies and to and from the U.S. dollar, generally in connection with the planned purchases or sales of securities. The Funds and Underlying Funds either enter into these transactions on a spot basis at the spot rate prevailing in the foreign currency exchange market or may use forward foreign currency contracts to purchase or sell foreign currencies. When the contract is fulfilled or closed, gains or losses are realized. Until then, the gain or loss is included in unrealized appreciation or depreciation. Risks may arise upon entering into forward contracts from the potential inability of counterparties to meet the terms of their forward contracts and from unanticipated movements in the value of foreign currencies relative to the U.S. dollar.
During the year ended October 31, 2012, Global Bond, Index Plus International Equity, and International Small Cap had average contract amounts on forward foreign currency contracts to buy of $832,332,761, $484,984, and $143,140 respectively. In addition to the above, Global Bond, Index Plus International Equity, and International Small Cap had average contract amounts on forward foreign currency contract to sell of $630,511,243, $533,585, and $16,495, respectively. The above Funds used forward foreign currency contracts primarily to protect their non-U.S. dollar denominated holdings from adverse currency movements. Please refer to the table following the Summary Portfolio of Investments for Global Bond for open forward foreign currency contracts at October 31, 2012. International Equity and International Small Cap had no open forward foreign currency contracts at October 31, 2012.
Each Fund and Underlying Funds may enter into futures contracts involving foreign currency, interest rates, securities and securities indices. Each Fund and Underlying Fund intends to limit its use of futures
46
NOTES TO FINANCIAL STATEMENTS AS OF OCTOBER 31, 2012 (CONTINUED)
NOTE 2 — SIGNIFICANT ACCOUNTING POLICIES (continued)
contracts and futures options to “bona fide hedging” transactions, as such term is defined in applicable regulations, interpretations and practice. A futures contract obligates the seller of the contract to deliver and the purchaser of the contract to take delivery of the type of foreign currency, financial instrument or security called for in the contract at a specified future time for a specified price. Upon entering into such a contract, a Fund or an Underlying Fund is required to deposit and maintain as collateral such initial margin as required by the exchange on which the contract is traded. Pursuant to the contract, a Fund or an Underlying Fund agrees to receive from or pay to the broker an amount equal to the daily fluctuations in the value of the contract. Such receipts or payments are known as variation margin and are recorded as unrealized gains or losses by the Fund or an Underlying Fund. When the contract is closed, the Fund or Underlying Fund records a realized gain or loss equal to the difference between the value of the contract at the time it was opened and the value at the time it was closed.
Futures contracts are exposed to the market risk factor of the underlying financial instrument. During the year ended October 31, 2012, Index Plus International Equity had purchased futures contracts on equity indices to gain additional exposure to the foreign equity markets. During the year ended October 31, 2012, Global Bond had both purchased and sold futures contracts on various bonds and notes to gain exposure to different parts of the yield curve to assist the Fund with its duration strategy. Additional associated risks of entering into futures contracts include the possibility that there may be an illiquid market where the Fund is unable to liquidate the contract or enter into an offsetting position and, if used for hedging purposes, the risk that the price of the contract will correlate imperfectly with the prices of the Fund’s securities. With futures, there is minimal counterparty credit risk to the Fund since futures are exchange traded and the exchange’s clearinghouse, as counterparty to all exchange traded futures, guarantees the futures against default.
During the year ended October 31, 2012, Index Plus International Equity had an average notional value of $1,780,074 on futures contracts purchased.
During the year ended October 31, 2012, Global Bond had an average notional value of $197,233,477 and $164,941,892 on futures contracts purchased and sold, respectively.
F. Options Contracts. The Funds may write call and put options on futures, swaps (“swaptions”), securities, commodities or foreign currencies it owns or in which it may invest. Writing put options tends to increase the Funds’ exposure to the underlying instrument. Writing call options tends to decrease the Funds’ exposure to the underlying instrument. When a Fund writes a call or put option, an amount equal to the premium received is recorded as a liability and subsequently marked to market to reflect the current value of the option written. These liabilities are reflected as written options outstanding on the Statements of Assets and Liabilities. Certain options may be written with premiums to be determined on a future date. Premiums received from writing options which expire are treated as realized gains. Premiums received from writing options which are exercised or closed are added to the proceeds or offset against amounts paid on the underlying futures, swap, security or currency transaction to determine the realized gain or loss. A Fund as a writer of an option has no control over whether the underlying instrument may be sold (call) or purchased (put) and as a result bears the market risk of an unfavorable change in the price of the instrument underlying the written option. There is the risk the Funds may not be able to enter into a closing transaction because of an illiquid market.
The Funds may also purchase put and call options. Purchasing call options tends to increase the Funds exposure to the underlying instrument. Purchasing put options tends to decrease the Funds exposure to the underlying instrument. The Funds pay a premium which is included on the Statements of Assets and Liabilities as an investment and subsequently marked to market to reflect the current value of the option. Premiums paid for purchasing options which expire are treated as realized losses. Certain options may be purchased with premiums to be determined on a future date. The premiums for these options are based upon implied volatility parameters at specified terms. The risk associated with purchasing put and call options is limited to the premium paid. Premiums paid for purchasing options which are exercised or closed are added to the amounts paid or offset against the proceeds on the underlying investment transaction to determine the realized gain or loss.
During the year ended October 31, 2012, Global Bond had purchased and written foreign currency options to gain exposure to currencies and to generate income. Please refer to the Summary Portfolio of Investments for open purchased foreign currency options and the table following the Summary Portfolio of Investments
47
NOTES TO FINANCIAL STATEMENTS AS OF OCTOBER 31, 2012 (CONTINUED)
NOTE 2 — SIGNIFICANT ACCOUNTING POLICIES (continued)
for open written foreign currency options at October 31, 2012.
During the year ended October 31, 2012, Global Bond purchased and written options on OTC U.S. Treasuries to gain exposure to different parts of the yield curve and to generate income. There were no open options on U.S. Treasuries at October 31, 2012.
During the year ended October 31, 2012, Global Bond had purchased and written interest rate swaptions to gain additional exposure to interest rates and to generate income. Please refer to the respective Summary Portfolio of Investments for open purchased interest rate swaptions and the table following for written interest rate swaptions at October 31, 2012.
During year ended October 31, 2012, Global Bond had purchased and written swaptions on credit default swap indices (“CDX”) as part of managing the Fund’s credit risk and sector exposure and as a means of generating additional income. There were no open CDX swaptions at October 31, 2012.
Please refer to Note 10 for the volume of purchased and written option activity during the year ended October 31, 2012.
G. Swap Agreements. Certain Funds may enter into swap agreements. A swap is an agreement between two parties pursuant to which each party agrees to make one or more payments to the other at specified future intervals based on the return of an asset (such as a stock, bond or currency) or non-asset reference (such as an interest rate or index). The swap agreement will specify the “notional” amount of the asset or non-asset reference to which the contract relates. Subsequent changes in fair value, if any, are calculated based upon changes in the performance of the asset or non-asset reference multiplied by the notional value of the contract. A Fund may enter into credit default, interest rate, total return and currency swaps to manage its exposure to credit, currency and interest rate risk. All outstanding swap agreements are reported following each Fund’s Summary Portfolio of Investments.
Swaps are marked to market daily using quotations primarily from third party pricing services, counterparties or brokers. The value of the swap contract is recorded on each Fund’s Statement of Assets and Liabilities. During the term of the swap, changes in the value of the swap, if any, are recorded as unrealized gains or losses on the Statement of Operations. Upfront payments paid or received by a Fund when entering into the agreements are reported on the Statement of Assets and Liabilities and as a component of the changes in unrealized gains or losses on the Statement of Operations. These upfront payments represent the amounts paid or received when initially entering into the swap agreement to compensate for differences between the stated terms of the swap agreement and the prevailing market conditions. The upfront payments are included as a component in the realized gains or losses on each Fund’s Statement of Operations upon termination or maturity of the swap. A Fund also records net periodic payments paid or received on the swap contract as a realized gain or loss on the Statement of Operations.
Entering into swap agreements involves the risk that the maximum potential loss of an investment exceeds the current value of the investment as reported on each Fund’s Statement of Assets and Liabilities. Other risks involve the possibility that the counterparty to the agreements may default on its obligation to perform, that there will be no liquid market for these investments and that unfavorable changes in the market will have a negative impact on the value of the index or securities underlying the respective swap agreement.
Credit Default Swap Contracts. A credit default swap is a bilateral agreement between counterparties in which the buyer of the protection agrees to make a stream of periodic payments to the seller of protection in exchange for the right to receive a specified return in the event of a default or other credit event for a referenced entity, obligation or index. As a seller of protection on credit default swaps, a Fund will generally receive from the buyer a fixed payment stream based on the notional amount of the swap contract. This fixed payment stream will continue until the swap contract expires or a defined credit event occurs.
A Fund is subject to credit risk in the normal course of pursuing its investment objectives. As a seller of protection in a credit default swap, a Fund may execute these contracts to manage its exposure to the market or certain sectors of the market. A Fund may also enter into credit default swaps to speculate on changes in an issuer’s credit quality, to take advantage of perceived spread advantages, or to offset an existing short equivalent (i.e. buying protection on an equivalent reference entity).
Certain Funds may sell credit default swaps which expose these Funds to the risk of loss from credit risk-related events specified in the contract. Although contract specific, credit events are generally defined as bankruptcy, failure to pay, restructuring, obligation
48
NOTES TO FINANCIAL STATEMENTS AS OF OCTOBER 31, 2012 (CONTINUED)
NOTE 2 — SIGNIFICANT ACCOUNTING POLICIES (continued)
acceleration, obligation default or repudiation/ moratorium. If a Fund is a seller of protection, and a credit event occurs, as defined under the terms of that particular swap agreement, a Fund will generally either (i) pay to the buyer an amount equal to the notional amount of the swap and take delivery of the referenced obligation, other deliverable obligations, or underlying securities comprising a referenced index or (ii) pay a net settlement amount in the form of cash or securities equal to the notional amount of the swap less the recovery value of the referenced obligation or underlying securities comprising a referenced index. If a Fund is a buyer of protection and a credit event occurs, as defined under the terms of that particular swap agreement, a Fund will either (i) receive from the seller of protection an amount equal to the notional amount of the swap and deliver the referenced obligation, other deliverable obligations or underlying securities comprising the referenced index or (ii) receive a net settlement amount in the form of cash or securities equal to the notional amount of the swap less the recovery value of the referenced obligation or underlying securities comprising the referenced index. Recovery values are assumed by market makers considering either industry standard recovery rates or entity specific factors and considerations until a credit event occurs. If a credit event has occurred, the recovery value is determined by a facilitated auction whereby a minimum number of allowable broker bids, together with a specified valuation method, are used to calculate the settlement value.
Implied credit spreads, represented in absolute terms, utilized in determining the fair value of credit default swap agreements on corporate issues or sovereign issues are disclosed in each Fund’s Summary Portfolio of Investments and serve as an indicator of the current status of the payment/performance risk and represent the likelihood or risk of default for the credit derivative. The implied credit spread of a particular referenced entity reflects the cost of buying/selling protection and may include upfront payments required to be made to enter into the agreement. For credit default swaps on asset-backed securities or credit indices, the quoted market prices and resulting fair values serve as the indicator of the current status of the payment/ performance risk. Wider credit spreads and increasing fair values, in absolute terms when compared to the notional amount of the swap, represent a deterioration of the referenced entity’s credit soundness and a greater likelihood or risk of default or other credit event occurring as defined under the terms of the agreement.
The maximum amount of future payments (undiscounted) that a Fund as seller of protection could be required to make under a credit default swap agreement would be an amount equal to the notional amount of the agreement. Notional amounts of all credit default swap agreements outstanding as of October 31, 2012, for which a Fund is seller of protection, are disclosed following each Fund’s Summary Portfolio of Investments. These potential amounts would be partially offset by any recovery values of the respective referenced obligations, upfront payments received upon entering into the agreements, or net amounts received from the settlement of buy protection credit default swap agreements entered into by a Fund for the same referenced entity or entities.
For the year ended October 31, 2012, Global Bond had an average notional amount of $9,163,443 and $11,364,443 on credit default swaps to buy protection and credit default swaps to sell protection, respectively.
For the year ended October 31, 2012, Global Bond has purchased credit protection through credit default swaps to decrease exposure to the credit risk of individual securities and to hedge against anticipated potential credit events. Please refer to the table following the Summary Portfolio of Investments for open credit default swaps to buy protection at October 31, 2012.
For the year ended October 31, 2012, Global Bond has sold credit protection to gain exposure to the credit risk of individual securities that are either unavailable or considered to be less attractive in the bond market. There were no open credit default swaps to sell protection at October 31, 2012.
Interest Rate Swap Agreements. Certain Funds may enter into interest rate swaps. An interest rate swap is an agreement between counterparties to exchange periodic payments based on interest rates. One cash flow stream will typically be a floating rate payment based upon a specified interest rate while the other is typically a fixed interest rate.
For the year ended October 31, 2012, Global Bond has entered into interest rate swaps in which it pays a floating interest rate and receives a fixed interest rate (“Long interest rate swap”) in order to increase exposure to interest rate risk. Average notional amounts on long interest rate swaps were $429,320,556.
For the year ended October 31, 2012, Global Bond has entered into interest rate swaps in which it pays a fixed interest rate and receives a floating interest
49
NOTES TO FINANCIAL STATEMENTS AS OF OCTOBER 31, 2012 (CONTINUED)
NOTE 2 — SIGNIFICANT ACCOUNTING POLICIES (continued)
rate (“Short interest rate swap”) in order to decrease exposure to interest rate risk. Average notional amounts on short interest rate swaps were $450,960,403.
Global Bond enters into interest rate swaps to adjust interest rate and yield curve exposures and to substitute for physical fixed-income securities. Please refer to the table following the Summary Portfolio of Investments for open interest rate swaps at October 31, 2012.
H. Distributions to Shareholders. The Funds record distributions to their shareholders on ex-dividend date. Each Fund pays dividends and capital gains, if any, annually. The Funds may make distributions on a more frequent basis to comply with the distribution requirements of the Internal Revenue Code. The characteristics of income and gains to be distributed are determined in accordance with income tax regulations, which may differ from U.S. generally accepted accounting principles for investment companies.
I. Federal Income Taxes. It is the policy of each Fund to comply with the requirements of subchapter M of the Internal Revenue Code that are applicable to regulated investment companies and to distribute substantially all of its net investment income and any net realized capital gains to its shareholders. Therefore, a federal income tax or excise tax provision is not required. Management has considered the sustainability of the Funds’ tax positions taken on federal income tax returns for all open tax years in making this determination. No capital gain distributions shall be made until the capital loss carryforwards have been fully utilized or expire.
The Funds may utilize equalization accounting for tax purposes, whereby a portion of redemption payments are treated as distributions of income or gain.
J. Use of Estimates. The preparation of financial statements in conformity with U.S. generally accepted accounting principles requires management to make estimates and assumptions that affect the reported amounts of assets and liabilities and disclosure of contingent assets and liabilities at the date of the financial statements and the reported amounts of increases and decreases in net assets from operations during the reporting period. Actual results could differ from those estimates.
K. Securities Lending. Each Fund has the option to temporarily loan securities representing up to 33 1/3% of its total assets (except Global Value Choice and International Small Cap which can each lend up to 30% of its total assets) to brokers, dealers or other financial institutions in exchange for a negotiated lender’s fee. The borrower is required to fully collateralize the loans with cash or U.S. government securities. Generally, in the event of counterparty default, a Fund has the right to use collateral to offset losses incurred. There would be potential loss to a Fund in the event a Fund is delayed or prevented from exercising its right to dispose of the collateral. Each Fund bears the risk of loss with respect to the investment of collateral with the following exception: BNY provides each Fund indemnification from loss with respect to the investment of collateral provided that the cash collateral is invested solely in overnight repurchase agreements. Engaging in securities lending could have a leveraging effect, which may intensify the credit, market and other risks associated with investing in a Fund.
L. Restricted Securities. Each Fund may invest in restricted securities which include those sold under Rule 144A of the Securities Act of 1933 (“1933 Act”) or securities offered pursuant to Section 4(2) of the 1933 Act, and/or are subject to legal or contractual restrictions on resale and may not be publicly sold without registration under the 1933 Act. Restricted securities are fair valued using market quotations when readily available. In the absence of market quotations, the securities are valued based upon their fair value determined in good faith under procedures approved by the Board.
M. Indemnifications. In the normal course of business, each Trust may enter into contracts that provide certain indemnifications. Each Trust’s maximum exposure under these arrangements is dependent on future claims that may be made against the Funds and, therefore, cannot be estimated; however, based on experience, management considers risk of loss from such claims remote.
NOTE 3 — INVESTMENT TRANSACTIONS
For the year ended October 31, 2012, the cost of purchases and proceeds from the sales of securities, excluding short-term securities, were as follows:
| | | | Purchases
| | Sales
|
|---|
Diversified International | | | | $ | 21,574,282 | | | $ | 56,653,478 | |
| | | | | 2,189,032,950 | | | | 2,068,030,466 | |
| | | | | 126,351,413 | | | | 533,958,928 | |
Index Plus International Equity | | | | | 127,501,136 | | | | 165,799,871 | |
| | | | | 76,502,878 | | | | 149,842,164 | |
International Value Choice | | | | | 7,717,291 | | | | 12,150,852 | |
| | | | | 181,131,618 | | | | 405,338,295 | |
| | | | | 127,316,165 | | | | 174,910,474 | |
50
NOTES TO FINANCIAL STATEMENTS AS OF OCTOBER 31, 2012 (CONTINUED)
NOTE 3 — INVESTMENT TRANSACTIONS (continued)
Purchases and sales of long-term U.S. government securities not included above were as follows:
| | | | Purchases
| | Sales
|
|---|
| | | | $ | 1,874,130,668 | | | $ | 1,853,273,530 | |
NOTE 4 — REDEMPTION FEES
A 2% redemption fee is charged on shares of Russia that are redeemed (including in connection with an exchange) within 365 days or less from their date of purchase. The redemption fee is recorded as an addition to paid-in capital. Total redemption fee proceeds for the years ended October 31, 2012 and 2011 were $133,331 and $217,940, respectively, and are set forth in the Statements of Changes in Net Assets.
NOTE 5 — INVESTMENT MANAGEMENT AND ADMINISTRATIVE FEES
Each of the Funds has entered into an investment management agreement (“Management Agreements”) with ING Investments, LLC (“ING Investments” or “Investment Adviser”). The Management Agreements compensate the Investment Adviser with a fee based on the average daily net assets of each Fund, at the following annual rates:
Fund
| | | | As a Percentage of Average
Daily Net Assets
|
|---|
Diversified International | | | | |
| | | | |
| | | | 0.90% on the first $500 million; 0.80% on the next $500 million; and 0.75% thereafter |
Index Plus International Equity | | | | |
International Small Cap(1) | | | | 1.00% on first $500 million; 0.90% on next $500 million; and 0.85% thereafter |
International Value Choice(2) | | | | |
| | | | 1.00% on the first $1.5 billion; 0.70% on the next $750 million; and 0.65% thereafter (applied to all assets of the Fund) |
| | | | |
(1) | | ING Investments has contractually agreed to waive a portion of the advisory fee for International Small Cap and International Value. These agreements will only renew if ING Investments elects to renew them. |
(2) | | Pursuant to a side agreement, ING Investments has agreed to waive 0.10% of the advisory fee for International Value Choice. The waiver agreement will only renew if ING Investments elects to renew it. |
ING Investments has contractually agreed to waive a portion of the advisory fee for International Small Cap and International Value. The waiver is calculated as 50% of the difference between the former sub-advisory fee rate minus the new sub-advisory fee.
For the year ended October 31, 2012, ING Investments waived $70,231, $110,785, and $26,996 in advisory fees for International Small Cap, International Value and International Value Choice, respectively.
Each of the Funds has entered into a sub-advisory agreement with each sub-adviser. These sub-advisers provide investment advice for the various Funds and are paid by the Investment Adviser based on the average daily net assets of the respective Funds. The sub-adviser of each of the Funds are as follows (*denotes a related party sub-adviser or sub-advisers):
Fund
| | | | Sub-Adviser
|
|---|
| | | | ING Investment Management Co. LLC* |
| | | | Tradewinds Global Investors, LLC(1) |
Index Plus International Equity | | | | ING Investment Management Co. LLC* |
| | | | Acadian Asset Management LLC and Schroder Investment Management North America Inc. |
International Value Choice | | | | Tradewinds Global Investors, LLC(1) |
| | | | Brandes Investment Partners, L.P., del Rey Global Investors, LLC and ING Investment Management Co. LLC* |
| | | | ING Investment Management Advisors B.V* |
(1) | | Please see Note 17 — Subsequent Events regarding changes to the Fund’s sub-advisory agreement. |
For Diversified International, ING Investment Management Co. LLC is a consultant (the “Consultant” or “ING IM”) to the Investment Adviser. The Consultant provides tactical allocation recommendations to the Investment Adviser. The Investment Adviser has set up an Investment Committee made up of a team of professionals to consider, review and implement the recommendations of the Consultant, and retains discretion over implementation of the Consultant’s recommendations. The Consultant provides ongoing recommendations to the Investment Committee of the Investment Adviser quarterly or as warranted by market conditions.
ING Funds Services, LLC (the “Administrator”), serves as administrator to each Fund. The Funds pay the Administrator a fee calculated at an annual rate of 0.10% of each Fund’s average daily net assets.
ING Investments Distributor, LLC (“IID” or “Distributor”) is the principal underwriter for each Fund. The Investment Adviser, ING IM, ING Investment Management Advisors B.V., the Distributor and the Administrator are indirect, wholly-owned subsidiaries of ING Groep N.V. (“ING Groep”). ING Groep is a global financial institution of Dutch origin offering banking, investments, life insurance and retirement services.
51
NOTES TO FINANCIAL STATEMENTS AS OF OCTOBER 31, 2012 (CONTINUED)
NOTE 5 — INVESTMENT MANAGEMENT AND ADMINISTRATIVE FEES (continued)
ING Groep has adopted a formal restructuring plan that was approved by the European Commission in November 2009 under which the ING life insurance businesses, including the retirement services and investment management businesses, which include the Investment Adviser and its immediate affiliates, would be separated from ING Groep. To achieve this goal, in a series of announcements beginning November 2010, ING Groep announced that it plans to pursue transactions to restructure certain businesses, including an initial public offering for its U.S. based insurance, retirement services, and investment management operations; and other transactions, which could include an initial public offering or other type of transaction, for its European based insurance and investment management operations and Asian based insurance and investment management operations. There can be no assurance that all or part of the restructuring plan will be carried out.
The restructuring plan and the uncertainty about its implementation, whether implemented through the planned public offerings or through other means, in whole or in part, may be disruptive to the businesses of ING entities, including the ING entities that service the Funds, and may cause, among other things, interruption or reduction of business and services, diversion of management’s attention from day-to-day operations, and loss of key employees or customers. A failure to complete the offerings or other means of implementation on favorable terms could have a material adverse impact on the operations of the businesses subject to the restructuring plan. The restructuring plan may result in the Investment Adviser’s loss of access to services and resources of ING Groep, which could adversely affect its businesses and profitability. In addition, the divestment of ING businesses, including the Investment Adviser, may potentially be deemed a “change of control” of each entity. A change of control would result in the termination of the Funds’ advisory and sub-advisory agreements, which would trigger the necessity for new agreements that would require approval of the Board, and may trigger the need for shareholder approval. Currently, the Investment Adviser does not anticipate that the restructuring will have a material adverse impact on the Funds or their operations and administration.
NOTE 6 — DISTRIBUTION AND SERVICE FEES
Each share class of the Funds, except Class I and Class W, has adopted a Plan pursuant to Rule 12b-1 under the 1940 Act (the “12b-1 Plans”), whereby the Distributor, an indirect, wholly-owned subsidiary of ING Groep, is reimbursed or compensated (depending on the class of shares) by the Funds for expenses incurred in the distribution of each Fund’s shares (“Distribution Fees”). Pursuant to the 12b-1 Plans, the Distributor is entitled to a payment each month for expenses incurred in the distribution and promotion of each Fund’s shares, including expenses incurred in printing prospectuses and reports used for sales purposes, expenses incurred in preparing and printing sales literature and other such distribution related expenses, including any distribution or shareholder servicing fees (“Service Fees”) paid to securities dealers who have executed a distribution agreement with the Distributor. Under the 12b-1 Plans, each class of shares of a Fund pays the Distributor a Distribution and/or Service Fee based on average daily net assets at the following annual rates:
Fund
| | | | Class A
| | Class B
| | Class C
| | Class O
| | Class R
|
|---|
Diversified International | | | | | 0.25 | % | | | 1.00 | % | | | 1.00 | % | | | 0.25 | % | | | 0.50 | % |
| | | | | 0.25 | % | | | 1.00 | % | | | 1.00 | % | | | 0.25 | % | | | 0.50 | % |
| | | | | 0.25 | % | | | 1.00 | % | | | 1.00 | % | | | N/A | | | | N/A | |
Index Plus International Equity | | | | | 0.25 | % | | | 1.00 | % | | | 1.00 | % | | | 0.25 | % | | | N/A | |
| | | | | 0.35 | % | | | 1.00 | % | | | 1.00 | % | | | 0.25 | % | | | N/A | |
International Value Choice | | | | | 0.25 | % | | | 1.00 | % | | | 1.00 | % | | | N/A | | | | N/A | |
| | | | | 0.30 | % | | | 1.00 | % | | | 1.00 | % | | | N/A | | | | N/A | |
| | | | | 0.25 | % | | | N/A | | | | N/A | | | | N/A | | | | N/A | |
The Distributor may also retain the proceeds of the initial sales charge paid by shareholders upon the purchase of Class A shares, and the contingent deferred sales charge paid by shareholders upon certain redemptions for Class A and Class C shares. For the year ended October 31, 2012, the Distributor retained the following amounts in sales charges from the following Funds:
| | | | Class A
| | Class C
|
|---|
| | | | | | | | | | |
Diversified International | | | | $ | 2,742 | | | $ | — | |
| | | | | 52,838 | | | | — | |
| | | | | 8,028 | | | | — | |
Index Plus International Equity | | | | | 443 | | | | — | |
| | | | | 2,543 | | | | — | |
International Value Choice | | | | | 1,525 | | | | — | |
| | | | | 821 | | | �� | — | |
| | | | | 40,159 | | | | — | |
52
NOTES TO FINANCIAL STATEMENTS AS OF OCTOBER 31, 2012 (CONTINUED)
NOTE 6 — DISTRIBUTION AND SERVICE FEES (continued)
| | | | Class A
| | Class C
|
|---|
Contingent Deferred Sales Charges: | | | | | | | | | | |
Diversified International | | | | $ | — | | | $ | 2,409 | |
| | | | | 10,530 | | | | 4,734 | |
| | | | | 331 | | | | 4,598 | |
Index Plus International Equity | | | | | — | | | | 37 | |
| | | | | — | | | | 222 | |
International Value Choice | | | | | — | | | | 5 | |
| | | | | — | | | | 475 | |
| | | | | 67 | | | | — | |
NOTE 7 — OTHER TRANSACTIONS WITH AFFILIATES AND RELATED PARTIES
At October 31, 2012, the following affiliated investment companies or indirect, wholly-owned subsidiaries of ING Groep owned more than 5% of the following Funds:
Affiliated Investment Company/Subsidiary
| | | | Fund
| | Percentage
|
|---|
ING Direct Investing, Inc. | | | | Index Plus International Equity | | | 62.27 | % |
ING Global Target Payment Fund | | | | Index Plus International Equity | | | 16.06 | |
ING Life Insurance and Annuity Company | | | | | | | 7.40 | |
| | | | International Value Choice | | | 10.10 | |
| | | | | | | 14.41 | |
ING Solution 2015 Portfolio | | | | | | | 5.71 | |
ING Solution 2025 Portfolio | | | | | | | 9.49 | |
Control is defined by the 1940 Act as the beneficial ownership, either directly or through one or more controlled companies, of more than 25% of the voting securities of a company. The 1940 Act defines affiliates to include companies that are under common control. Therefore, because certain Funds may have a common owner that owns over 25% of the outstanding securities of the Funds, they may be deemed to be affiliates of each other. Investment activities of these shareholders could have a material impact on the Funds.
The Investment Adviser may request that the Funds’ portfolio managers use their best efforts (subject to obtaining best execution of each transaction) to allocate a portfolio’s equity security transactions through certain designated broker-dealers. The designated broker-dealer, in turn, will reimburse a portion of the brokerage commissions to pay certain expenses of that Fund. Any amount credited to a Fund in the Statement of Operations is recognized as brokerage commission recapture.
The Funds have adopted a Deferred Compensation Plan (the “Plan”), which allows eligible non-affiliated trustees as described in the Plan to defer the receipt of all or a portion of the trustees fees payable. Amounts deferred are treated as though invested in various “notional” funds advised by ING Investments until distribution in accordance with the Plan.
NOTE 8 — OTHER ACCRUED EXPENSES AND LIABILITIES
At October 31, 2012, the following Fund had the following payables included in Other Accrued Expenses and Liabilities on the Statements of Assets and Liabilities that exceeded 5% of total liabilities:
Fund
| | | | Accrued Expenses
| | Amount
|
|---|
Index Plus International Equity | | | | | | $ | 33,948 | |
| | | | | | | 24,868 | |
NOTE 9 — EXPENSE LIMITATION AGREEMENTS
The Investment Adviser have agreed to limit expenses, excluding interest expense, taxes, brokerage commissions and extraordinary expenses (and acquired fund fees and expenses) to the levels listed below:
Maximum Operating Expense Limit (as a percentage of average net assets)
Fund
| | | | Class A
| | Class B
| | Class C
| | Class I
| | Class O
| | Class R
| | Class W
|
|---|
Diversified International(1) | | | | | 0.50 | % | | | 1.25 | % | | | 1.25 | % | | | 0.25 | % | | | 0.50 | % | | | 0.75 | % | | | 0.25 | % |
| | | | | 0.90 | % | | | 1.65 | % | | | 1.65 | % | | | 0.61 | % | | | 0.90 | % | | | 1.15 | % | | | 0.65 | % |
| | | | | 1.50 | % | | | 2.25 | % | | | 2.25 | % | | | 1.25 | % | | | N/A | | | | N/A | | | | 1.25 | % |
Index Plus International Equity | | | | | 1.15 | % | | | 1.90 | % | | | 1.90 | % | | | 0.90 | % | | | 1.15 | % | | | N/A | | | | 0.90 | % |
| | | | | 1.95 | % | | | 2.60 | % | | | 2.60 | % | | | 1.40 | % | | | 1.85 | % | | | N/A | | | | 1.60 | % |
International Value Choice | | | | | 1.70 | % | | | 2.45 | % | | | 2.45 | % | | | 1.45 | % | | | N/A | | | | N/A | | | | 1.45 | % |
| | | | | 1.80 | % | | | 2.50 | % | | | 2.50 | % | | | 1.50 | % | | | N/A | | | | N/A | | | | 1.50 | % |
| | | | | 2.75 | % | | | N/A | | | | N/A | | | | 2.50 | % | | | N/A | | | | N/A | | | | 2.50 | % |
(1)
| | The operating expense limits for Diversified International set out above apply only at the fund level and do not limit the fees payable by the underlying investment companies in which the fund invests. Including the expenses of the underlying investment companies, the expense limits for Diversified International are 1.65%, 2.40%, 2.40%, 1.40%, 1.65%, 1.90% and 1.40% for Class A, B, C, I, O, R and W shares, respectively. |
Pursuant to side agreements, ING Investments has further lowered the expense limits for the following Funds. If ING Investments elects not to renew a side agreement, the expense limits will revert to the limits listed in the table above. There is no guarantee that these side agreements will continue. Each side agreement will only renew if ING Investments elects to renew it.
53
NOTES TO FINANCIAL STATEMENTS AS OF OCTOBER 31, 2012 (CONTINUED)
NOTE 9 — EXPENSE LIMITATION AGREEMENTS (continued)
Fund
| | | | Class A
| | Class B
| | Class C
| | Class I
| | Class O
| | Class R
| | Class W
|
|---|
International SmallCap(1)(2) | | | | | 1.80 | % | | | 2.45 | % | | | 2.45 | % | | | 1.25 | % | | | 1.70 | % | | | N/A | | | | 1.45 | % |
International Value Choice | | | | | 1.60 | % | | | 2.35 | % | | | 2.35 | % | | | 1.35 | % | | | N/A | | | | N/A | | | | 1.35 | % |
International Value(1)(2) | | | | | 1.60 | % | | | 2.30 | % | | | 2.30 | % | | | 1.30 | % | | | N/A | | | | N/A | | | | 1.30 | % |
| | | | | 2.25 | % | | | N/A | | | | N/A | | | | 2.00 | % | | | N/A | | | | N/A | | | | 2.00 | % |
(1) | | Any fees waived pursuant to the side agreement shall not be eligible for recoupment. |
(2) | | Prior to January 1, 2012, the Fund did not have a side agreement. |
Unless otherwise specified above, the Investment Adviser may at a later date recoup from a Fund management and/or class specific fees waived and other expenses assumed by the Investment Adviser during the previous 36 months, but only if, after such recoupment, a Fund’s expense ratio does not exceed the percentage described above. Waived and reimbursed fees net of any recoupment by the Investment Adviser of such waived and reimbursed fees are reflected on the accompanying Statement of Operations for each Fund. Amounts payable by the Investment Adviser are reflected on the accompanying Statements of Assets and Liabilities for each Fund.
As of October 31, 2012, the amounts of waived or reimbursed fees that are subject to possible recoupment by the Investment Adviser, and the related expiration dates, are as follows:
| | | | October 31,
| |
|---|
| | | | 2013
| | 2014
| | 2015
| | Total
|
|---|
Diversified International | | | | $ | 472,043 | | | $ | 51,924 | | | $ | 244,615 | | | $ | 768,582 | |
| | | | | 365,110 | | | | 307,563 | | | | 205,867 | | | $ | 878,540 | |
Index Plus International Equity | | | | | 22,288 | | | | 358,140 | | | | 248,446 | | | $ | 628,874 | |
International Value Choice | | | | | — | | | | — | | | | 74,942 | | | $ | 74,942 | |
In addition to the above waived or reimbursed fees, the amount of class specific fees waived or reimbursed that are subject to possible recoupment by the Investment Adviser, and the related expiration dates, as of October 31, 2012, are as follows:
| | | | October 31,
| |
|---|
| | | | 2013
| | 2014
| | 2015
| | Total
|
|---|
Diversified International | | | | | | | | | | | | | | | | | | |
| | | | $ | 13,391 | | | $ | 121,634 | | | $ | — | | | $ | 135,025 | |
| | | | | 2,176 | | | | 19,366 | | | | — | | | | 21,542 | |
| | | | | 7,365 | | | | 71,599 | | | | — | | | | 78,964 | |
| | | | | 1,800 | | | | 4,761 | | | | — | | | | 6,561 | |
| | | | | 21 | | | | 226 | | | | — | | | | 247 | |
| | | | | 1,912 | | | | 3,017 | | | | — | | | | 4,929 | |
| | | | | | | | | | | | | | | | | | |
| | | | $ | — | | | $ | — | | | $ | 98,197 | | | $ | 98,197 | |
| | | | | — | | | | — | | | | 2,887 | | | | 2,887 | |
| | | | | — | | | | — | | | | 61,031 | | | | 61,031 | |
| | | | | — | | | | — | | | | 11,386 | | | | 11,386 | |
Index Plus International Equity | | | | | | | | | | | | | | | | | | |
| | | | $ | 11,667 | | | $ | — | | | $ | — | | | $ | 11,667 | |
| | | | | 1,268 | | | | — | | | | — | | | | 1,268 | |
| | | | | 1,761 | | | | — | | | | — | | | | 1,761 | |
| | | | | 60,711 | | | | — | | | | — | | | | 60,711 | |
International Value Choice | | | | | | | | | | | | | | | | | | |
| | | | $ | 15,874 | | | $ | 27,795 | | | $ | — | | | $ | 43,669 | |
| | | | | 1,164 | | | | 910 | | | | — | | | | 2,074 | |
| | | | | 3,756 | | | | 6,165 | | | | — | | | | 9,921 | |
| | | | | 53 | | | | 58 | | | | — | | | | 111 | |
The expense limitation agreements are contractual and shall renew automatically for one-year terms unless ING Investments or IMF or IMT provides written notice of the termination of the expense limitation agreement at least 90 days prior to the end of the then current term.
NOTE 10 — PURCHASED AND WRITTEN OPTIONS
Transactions in purchased foreign currency options for Global Bond for the year ended October 31, 2012 were as follows:
| | | | AUD
Notional
| | Cost
|
|---|
| | | | | — | | | $ | — | |
| | | | | 44,600,000 | | | | 423,078 | |
Options Terminated in Closing Sell Transactions | | | | | (44,600,000 | ) | | | (423,078 | ) |
| | | | | | | | | | |
| | | | | — | | | $ | — | |
Transactions in purchased foreign currency options for Global Bond for the year ended October 31, 2012 were as follows:
| | | | EUR
Notional
| | Cost
|
|---|
| | | | | 11,600,000 | | | $ | 348,378 | |
| | | | | | | | | | |
Options Terminated in Closing Sell Transactions | | | | | | | | | | |
| | | | | (11,600,000 | ) | | | (348,378 | ) |
| | | | | — | | | $ | — | |
Transactions in purchased foreign currency options for Global Bond for the year ended October 31, 2012 were as follows:
| | | | USD
Notional
| | Cost
|
|---|
| | | | | 141,800,000 | | | $ | 2,168,314 | |
| | | | | 918,100,000 | | | | 10,934,679 | |
Options Terminated in Closing Sell Transactions | | | | | (540,000,000 | ) | | | (7,730,369 | ) |
| | | | | (407,400,000 | ) | | | (3,772,165 | ) |
| | | | | 112,500,000 | | | $ | 1,600,459 | |
54
NOTES TO FINANCIAL STATEMENTS AS OF OCTOBER 31, 2012 (CONTINUED)
NOTE 10 — PURCHASED AND WRITTEN OPTIONS (continued)
Transactions in purchased option on U.S. Treasuries for Global Bond for the year ended October 31, 2012 were as follows:
| | | | USD
Notional
| | Cost
|
|---|
| | | | | — | | | $ | — | |
| | | | | 5,635,000 | | | | 82,764 | |
Options Terminated in Closing Sell Transactions | | | | | (5,635,000 | ) | | | (82,764 | ) |
| | | | | | | | | | |
| | | | | — | | | $ | — | |
Transactions in purchased interest rate swaptions for Global Bond for the year ended October 31, 2012 were as follows:
| | | | Number of
Contracts
| | Cost
|
|---|
| | | | | — | | | $ | — | |
| | | | | 151,394,000 | | | | 3,198,493 | |
Options Terminated in Closing Sell Transactions | | | | | | | | | | |
| | | | | (39,800,000 | ) | | | (398,000 | ) |
| | | | | 111,594,000 | | | $ | 2,800,493 | |
Transactions in purchased swaptions on CDS indices for Global Bond for the year ended October 31, 2012 were as follows:
| | | | Number of
Contracts
| | Cost
|
|---|
| | | | | — | | | $ | — | |
| | | | | 62,945,000 | | | | 1,601,057 | |
Options Terminated in Closing Sell Transactions | | | | | (34,970,000 | ) | | | (656,369 | ) |
| | | | | (27,975,000 | ) | | | (944,688 | ) |
| | | | | — | | | $ | — | |
Transactions in written foreign currency options for Global Bond for the year ended October 31, 2012 were as follows:
| | | | AUD
Notional
| | Premiums
Received
|
|---|
| | | | | — | | | $ | — | |
| | | | | 44,600,000 | | | | 449,223 | |
Options Terminated in Closing Purchase Transactions | | | | | (44,600,000 | ) | | | (449,223 | ) |
| | | | | | | | | | |
| | | | | — | | | $ | — | |
Transactions in written foreign currency options for Global Bond for the year ended October 31, 2012 were as follows:
| | | | EUR
Notional
| | Premiums
Received
|
|---|
| | | | | 11,600,000 | | | $ | 284,546 | |
| | | | | | | | | | |
Options Terminated in Closing Purchase Transactions | | | | | | | | | | |
| | | | | (11,600,000 | ) | | | (284,546 | ) |
| | | | | — | | | $ | — | |
Transactions in written foreign currency options for Global Bond for the year ended October 31, 2012 were as follows:
| | | | USD
Notional
| | Premiums
Received
|
|---|
| | | | | 110,600,000 | | | $ | 1,266,276 | |
| | | | | 935,800,000 | | | | 7,965,679 | |
Options Terminated in Closing Purchase Transactions | | | | | (503,000,000 | ) | | | (5,929,159 | ) |
| | | | | (448,700,000 | ) | | | (2,440,864 | ) |
| | | | | 94,700,000 | | | $ | 861,932 | |
Transactions in written option on U.S. Treasuries for Global Bond for the year ended October 31, 2012 were as follows:
| | | | USD
Notional
| | Premiums
Received
|
|---|
| | | | | — | | | $ | — | |
| | | | | 5,635,000 | | | | 1,761 | |
Options Terminated in Closing Purchase Transactions | | | | | | | | | | |
| | | | | (5,635,000 | ) | | | (1,761 | ) |
| | | | | — | | | $ | — | |
Transactions in written interest rate swaptions for Global Bond for the year ended October 31, 2012 were as follows:
| | | | Number of
Contracts
| | Premiums
Received
|
|---|
| | | | | — | | | $ | — | |
| | | | | 88,312,000 | | | | 546,435 | |
Options Terminated in Closing Purchase Transactions | | | | | | | | | | |
| | | | | (79,600,000 | ) | | | (398,000 | ) |
| | | | | 8,712,000 | | | $ | 148,435 | |
Transactions in written swaptions on CDS indices for Global Bond for the year ended October 31, 2012 were as follows:
| | | | Number of
Contracts
| | Premiums
Received
|
|---|
| | | | | — | | | $ | — | |
| | | | | 45,460,000 | | | | 645,185 | |
Options Terminated in Closing Purchase Transactions | | | | | (45,460,000 | ) | | | (645,185 | ) |
| | | | | | | | | | |
| | | | | — | | | $ | — | |
NOTE 11 — LINE OF CREDIT
All of the Funds included in this report, in addition to certain other funds managed by the Investment Adviser or an affiliate of the investment adviser, have entered into an unsecured committed revolving line of credit agreement (the “Credit Agreement”) with The Bank of New York Mellon (“BNY”) for an aggregate amount of $125,000,000. The proceeds may be used only to: (1) temporarily finance the purchase and sale of securities; or (2) finance the redemption of shares of
55
NOTES TO FINANCIAL STATEMENTS AS OF OCTOBER 31, 2012 (CONTINUED)
NOTE 11 — LINE OF CREDIT (continued)
an investor in the Funds. The funds to which the line of credit is available pay a commitment fee equal to 0.08% per annum on the daily unused portion of the committed line amount payable quarterly in arrears.
Generally, borrowings under the Credit Agreement accrue interest at the federal funds rate plus a specified margin. Repayments generally must be made within 60 days after the date of a revolving credit advance.
The following Funds utilized the line of credit during the year ended October 31, 2012:
Fund
| | | | Days
Utilized
| | Approximate
Average Daily
Balance For
Days Utilized
| | Approximate
Weighted
Average
Interest Rate
For Days
Utilized
|
|---|
Diversified International | | | | | 2 | | | $ | 1,215,000 | | | | 1.23 | % |
| | | | | 31 | | | | 3,291,290 | | | | 1.21 | |
| | | | | 20 | | | | 18,655,500 | | | | 1.29 | |
Index Plus International Equity | | | | | 13 | | | | 2,691,154 | | | | 1.22 | |
| | | | | 13 | | | | 867,692 | | | | 1.23 | |
International Value Choice | | | | | 6 | | | | 2,391,667 | | | | 1.15 | |
| | | | | 125 | | | | 1,629,240 | | | | 1.23 | |
| | | | | 20 | | | | 1,179,750 | | | | 1.18 | |
NOTE 12 — CAPITAL SHARES
Transactions in capital shares and dollars were as follows:
Year or
| | | | Shares
sold
| | Shares
issued in
merger
| | Reinvestment
of
distributions
| | Shares
redeemed
| | Shares
converted
| | Net
increase
(decrease)
in shares
outstanding
| | Shares
sold
| | Payments from
Distribution
settlement/
affiliate
(Note 16)
| | Proceeds
from shares
issued in
merger
| | Reinvestment
of
distributions
| | Redemption
fee
proceeds
| | Shares
redeemed
| | Shares
converted
| | Net
increase
(decrease)
|
|---|
period ended
| | | | #
| | #
| | #
| | #
| | #
| | #
| | ($)
| | $
| | ($)
| | ($)
| | $
| | ($)
| | $
| | ($)
|
|---|
Diversified International |
|
| | | | | 278,532 | | | | — | | | | 78,991 | | | | (2,272,947 | ) | | | — | | | | (1,915,424 | ) | | | 2,428,890 | | | | — | | | | — | | | | 635,082 | | | | — | | | | (19,511,436 | ) | | | — | | | | (16,447,464 | ) |
| | | | | 790,343 | | | | — | | | | 90,062 | | | | (4,745,194 | ) | | | — | | | | (3,864,789 | ) | | | 7,627,783 | | | | — | | | | — | | | | 863,699 | | | | — | | | | (45,428,470 | ) | | | — | | | | (36,936,988 | ) |
|
| | | | | 254 | | | | — | | | | 2,703 | | | | (318,203 | ) | | | — | | | | (315,246 | ) | | | 5,008 | | | | — | | | | — | | | | 21,787 | | | | — | | | | (2,723,845 | ) | | | — | | | | (2,697,050 | ) |
| | | | | 607 | | | | — | | | | 2,021 | | | | (605,231 | ) | | | — | | | | (602,603 | ) | | | 6,016 | | | | — | | | | — | | | | 19,384 | | | | — | | | | (5,756,366 | ) | | | — | | | | (5,730,966 | ) |
|
| | | | | 86,850 | | | | — | | | | 9,250 | | | | (1,467,463 | ) | | | — | | | | (1,371,363 | ) | | | 750,958 | | | | — | | | | — | | | | 74,369 | | | | — | | | | (12,439,046 | ) | | | — | | | | (11,613,719 | ) |
| | | | | 194,020 | | | | — | | | | 8,099 | | | | (2,071,989 | ) | | | — | | | | (1,869,870 | ) | | | 1,836,873 | | | | — | | | | — | | | | 77,503 | | | | — | | | | (19,497,794 | ) | | | — | | | | (17,583,418 | ) |
|
| | | | | 213,907 | | | | — | | | | 14,745 | | | | (501,901 | ) | | | — | | | | (273,249 | ) | | | 1,844,184 | | | | — | | | | — | | | | 117,965 | | | | — | | | | (4,289,264 | ) | | | — | | | | (2,327,115 | ) |
| | | | | 1,060,810 | | | | — | | | | 3,807 | | | | (661,463 | ) | | | — | | | | 403,154 | | | | 10,315,904 | | | | — | | | | — | | | | 36,391 | | | | — | | | | (6,155,133 | ) | | | — | | | | 4,197,162 | |
|
| | | | | 136,747 | | | | — | | | | — | | | | (115,597 | ) | | | — | | | | 21,150 | | | | 1,167,904 | | | | — | | | | — | | | | — | | | | — | | | | (984,343 | ) | | | — | | | | 183,561 | |
| | | | | 209,526 | | | | — | | | | — | | | | (116,325 | ) | | | — | | | | 93,201 | | | | 1,989,309 | | | | — | | | | — | | | | — | | | | — | | | | (1,059,969 | ) | | | — | | | | 929,340 | |
|
| | | | | — | | | | — | | | | 171 | | | | (5,471 | ) | | | — | | | | (5,300 | ) | | | 40 | | | | — | | | | — | | | | 1,361 | | | | — | | | | (45,113 | ) | | | — | | | | (43,712 | ) |
| | | | | — | | | | — | | | | 140 | | | | (2,802 | ) | | | — | | | | (2,662 | ) | | | — | | | | — | | | | — | | | | 1,332 | | | | — | | | | (27,610 | ) | | | — | | | | (26,278 | ) |
|
| | | | | 17,972 | | | | — | | | | 1,880 | | | | (109,342 | ) | | | — | | | | (89,490 | ) | | | 154,098 | | | | — | | | | — | | | | 14,983 | | | | — | | | | (907,427 | ) | | | — | | | | (738,346 | ) |
| | | | | 66,855 | | | | — | | | | 3,496 | | | | (170,541 | ) | | | — | | | | (100,190 | ) | | | 587,373 | | | | — | | | | — | | | | 33,281 | | | | — | | | | (1,612,628 | ) | | | — | | | | (991,974 | ) |
|
|
| | | | | 9,035,461 | | | | — | | | | 1,193,493 | | | | (13,995,278 | ) | | | — | | | | (3,766,324 | ) | | | 103,953,667 | | | | — | | | | — | | | | 13,612,253 | | | | — | | | | (159,105,530 | ) | | | — | | | | (41,539,610 | ) |
| | | | | 14,837,384 | | | | — | | | | 940,858 | | | | (8,773,526 | ) | | | — | | | | 7,004,716 | | | | 176,621,769 | | | | — | | | | — | | | | 11,116,131 | | | | — | | | | (103,775,875 | ) | | | — | | | | 83,962,025 | |
|
| | | | | 23,090 | | | | — | | | | 7,023 | | | | (71,270 | ) | | | — | | | | (41,157 | ) | | | 262,298 | | | | — | | | | — | | | | 79,346 | | | | — | | | | (809,356 | ) | | | — | | | | (467,712 | ) |
| | | | | 25,063 | | | | — | | | | 10,171 | | | | (194,167 | ) | | | — | | | | (158,933 | ) | | | 293,547 | | | | — | | | | — | | | | 119,021 | | | | — | | | | (2,285,314 | ) | | | — | | | | (1,872,746 | ) |
|
| | | | | 3,840,728 | | | | — | | | | 317,969 | | | | (2,344,774 | ) | | | — | | | | 1,813,923 | | | | 43,980,999 | | | | — | | | | — | | | | 3,607,338 | | | | — | | | | (26,798,110 | ) | | | — | | | | 20,790,227 | |
| | | | | 2,435,405 | | | | — | | | | 249,324 | | | | (2,416,578 | ) | | | — | | | | 268,151 | | | | 28,754,106 | | | | — | | | | — | | | | 2,929,190 | | | | — | | | | (28,391,280 | ) | | | — | | | | 3,292,016 | |
|
| | | | | 29,561,113 | | | | — | | | | 1,644,408 | | | | (14,854,236 | ) | | | — | | | | 16,351,285 | | | | 338,194,865 | | | | — | | | | — | | | | 18,739,776 | | | | — | | | | (170,391,313 | ) | | | — | | | | 186,543,328 | |
| | | | | 14,003,879 | | | | — | | | | 1,101,842 | | | | (11,781,300 | ) | | | — | | | | 3,324,421 | | | | 165,827,791 | | | | — | | | | — | | | | 12,984,986 | | | | — | | | | (138,649,671 | ) | | | — | | | | 40,163,106 | |
|
| | | | | 136,364 | | | | — | | | | 6 | | | | (120,315 | ) | | | — | | | | 16,055 | | | | 1,540,069 | | | | — | | | | — | | | | 72 | | | | — | | | | (1,360,024 | ) | | | — | | | | 180,117 | |
| | | | | 174,442 | | | | — | | | | — | | | | (125,060 | ) | | | — | | | | 49,382 | | | | 2,039,436 | | | | — | | | | — | | | | — | | | | — | | | | (1,455,707 | ) | | | — | | | | 583,729 | |
|
| | | | | 23,244 | | | | — | | | | 535 | | | | (267 | ) | | | — | | | | 23,512 | | | | 268,156 | | | | — | | | | — | | | | 6,125 | | | | — | | | | (3,004 | ) | | | — | | | | 271,277 | |
| | | | | 249 | | | | — | | | | — | | | | — | | | | — | | | | 249 | | | | 3,000 | | | | — | | | | — | | | | — | | | | — | | | | — | | | | — | | | | 3,000 | |
(1) | | Commencement of operations. |
56
NOTES TO FINANCIAL STATEMENTS AS OF OCTOBER 31, 2012 (CONTINUED)
NOTE 12 — CAPITAL SHARES (continued)
Year or
| | | | Shares
sold
| | Shares
issued in
merger
| | Reinvestment
of
distributions
| | Shares
redeemed
| | Shares
converted
| | Net
increase
(decrease)
in shares
outstanding
| | Shares
sold
| | Payments from
Distribution
settlement/
affiliate
(Note 16)
| | Proceeds
from shares
issued in
merger
| | Reinvestment
of
distributions
| | Redemption
fee
proceeds
| | Shares
redeemed
| | Shares
converted
| | Net
increase
(decrease)
|
|---|
period ended
| | | | #
| | #
| | #
| | #
| | #
| | #
| | ($)
| | $
| | ($)
| | ($)
| | $
| | ($)
| | $
| | ($)
|
|---|
|
|
| | | | | 1,857,931 | | | | — | | | | 152,609 | | | | (1,127,707 | ) | | | — | | | | 882,833 | | | | 20,977,411 | | | | — | | | | — | | | | 1,711,304 | | | | — | | | | (12,697,086 | ) | | | — | | | | 9,991,629 | |
| | | | | 1,541,709 | | | | — | | | | 77,641 | | | | (889,160 | ) | | | — | | | | 730,190 | | | | 18,139,074 | | | | — | | | | — | | | | 901,653 | | | | — | | | | (10,356,411 | ) | | | — | | | | 8,684,316 | |
|
|
| | | | | 593,626 | | | | — | | | | 716,446 | | | | (5,418,363 | ) | | | — | | | | (4,108,291 | ) | | | 16,405,098 | | | | 137,703 | | | | — | | | | 19,236,587 | | | | — | | | | (145,549,018 | ) | | | — | | | | (109,769,630 | ) |
| | | | | 4,265,625 | | | | — | | | | 79,834 | | | | (3,420,485 | ) | | | — | | | | 924,974 | | | | 144,603,799 | | | | — | | | | — | | | | 2,641,663 | | | | — | | | | (114,217,071 | ) | | | — | | | | 33,028,391 | |
|
| | | | | 1,439 | | | | — | | | | 14,886 | | | | (70,107 | ) | | | — | | | | (53,782 | ) | | | 41,253 | | | | 3,331 | | | | — | | | | 432,452 | | | | — | | | | (2,024,962 | ) | | | — | | | | (1,547,926 | ) �� |
| | | | | 13,043 | | | | — | | | | 1,069 | | | | (69,196 | ) | | | — | | | | (55,084 | ) | | | 471,719 | | | | — | | | | — | | | | 37,866 | | | | — | | | | (2,483,644 | ) | | | — | | | | (1,974,059 | ) |
|
| | | | | 247,916 | | | | — | | | | 300,547 | | | | (2,863,809 | ) | | | — | | | | (2,315,346 | ) | | | 6,344,252 | | | | 79,799 | | | | — | | | | 7,576,794 | | | | — | | | | (71,018,084 | ) | | | — | | | | (57,017,239 | ) |
| | | | | 1,679,621 | | | | — | | | | 21,518 | | | | (705,689 | ) | | | — | | | | 995,450 | | | | 53,663,379 | | | | — | | | | — | | | | 673,274 | | | | — | | | | (22,048,879 | ) | | | — | | | | 32,287,774 | |
|
| | | | | 1,072,101 | | | | — | | | | 258,211 | | | | (7,581,198 | ) | | | — | | | | (6,250,886 | ) | | | 29,635,295 | | | | 129,275 | | | | — | | | | 6,989,762 | | | | — | | | | (217,824,290 | ) | | | — | | | | (181,069,958 | ) |
| | | | | 4,607,087 | | | | — | | | | 13,983 | | | | (1,953,720 | ) | | | — | | | | 2,667,350 | | | | 157,033,879 | | | | — | | | | — | | | | 466,333 | | | | — | | | | (65,663,284 | ) | | | — | | | | 91,836,928 | |
|
| | | | | 73,824 | | | | — | | | | 93,751 | | | | (639,520 | ) | | | — | | | | (471,945 | ) | | | 2,055,899 | | | | 14,824 | | | | — | | | | 2,535,022 | | | | — | | | | (16,912,549 | ) | | | — | | | | (12,306,804 | ) |
| | | | | 981,538 | | | | — | | | | 17,025 | | | | (1,153,978 | ) | | | — | | | | (155,415 | ) | | | 33,546,538 | | | | — | | | | — | | | | 566,930 | | | | — | | | | (39,295,079 | ) | | | — | | | | (5,181,611 | ) |
Index Plus International Equity |
|
| | | | | 65,924 | | | | — | | | | 23,845 | | | | (197,783 | ) | | | — | | | | (108,014 | ) | | | 500,403 | | | | — | | | | — | | | | 166,913 | | | | — | | | | (1,455,753 | ) | | | — | | | | (788,437 | ) |
| | | | | 104,858 | | | | — | | | | 13,812 | | | | (249,258 | ) | | | — | | | | (130,588 | ) | | | 900,553 | | | | — | | | | — | | | | 115,330 | | | | — | | | | (2,118,993 | ) | | | — | | | | (1,103,110 | ) |
|
| | | | | 1,213 | | | | — | | | | 544 | | | | (15,790 | ) | | | — | | | | (14,033 | ) | | | 9,491 | | | | — | | | | — | | | | 3,863 | | | | — | | | | (122,113 | ) | | | — | | | | (108,759 | ) |
| | | | | 13 | | | | — | | | | 278 | | | | (42,996 | ) | | | — | | | | (42,705 | ) | | | 112 | | | | — | | | | — | | | | 2,340 | | | | — | | | | (377,578 | ) | | | — | | | | (375,126 | ) |
|
| | | | | 22,534 | | | | — | | | | 1,588 | | | | (27,758 | ) | | | — | | | | (3,636 | ) | | | 173,817 | | | | — | | | | — | | | | 11,133 | | | | — | | | | (210,688 | ) | | | — | | | | (25,738 | ) |
| | | | | 6,716 | | | | — | | | | 529 | | | | (29,920 | ) | | | — | | | | (22,675 | ) | | | 56,268 | | | | — | | | | — | | | | 4,422 | | | | — | | | | (250,290 | ) | | | — | | | | (189,600 | ) |
|
| | | | | 1,025,447 | | | | — | | | | 196,582 | | | | (5,749,898 | ) | | | — | | | | (4,527,869 | ) | | | 7,511,445 | | | | — | | | | — | | | | 1,374,111 | | | | — | | | | (44,129,677 | ) | | | — | | | | (35,244,121 | ) |
| | | | | 5,759,325 | | | | — | | | | 161,820 | | | | (9,597,420 | ) | | | — | | | | (3,676,275 | ) | | | 47,802,176 | | | | — | | | | — | | | | 1,352,813 | | | | — | | | | (83,821,515 | ) | | | — | | | | (34,666,526 | ) |
|
| | | | | 352,326 | | | | — | | | | 5,898 | | | | (751,406 | ) | | | — | | | | (393,182 | ) | | | 2,606,524 | | | | — | | | | — | | | | 40,929 | | | | — | | | | (5,657,720 | ) | | | — | | | | (3,010,267 | ) |
| | | | | 366,085 | | | | — | | | | 3,588 | | | | (856,544 | ) | | | — | | | | (486,871 | ) | | | 3,074,094 | | | | — | | | | — | | | | 29,742 | | | | — | | | | (7,220,670 | ) | | | — | | | | (4,116,834 | ) |
|
| | | | | — | | | | — | | | | — | | | | — | | | | — | | | | — | | | | — | | | | — | | | | — | | | | — | | | | — | | | | — | | | | — | | | | — | |
| | | | | 378 | | | | — | | | | — | | | | — | | | | — | | | | 378 | | | | 3,000 | | | | — | | | | — | | | | — | | | | — | | | | — | | | | — | | | | 3,000 | |
|
|
| | | | | 270,854 | | | | — | | | | 40,026 | | | | (922,903 | ) | | | — | | | | (612,023 | ) | | | 9,713,889 | | | | 270,209 | | | | — | | | | 1,274,839 | | | | — | | | | (32,531,269 | ) | | | — | | | | (21,272,332 | ) |
| | | | | 622,313 | | | | — | | | | 11,418 | | | | (1,662,144 | ) | | | — | | | | (1,028,413 | ) | | | 24,861,014 | | | | 43,448 | | | | — | | | | 445,420 | | | | — | | | | (65,716,954 | ) | | | — | | | | (40,367,072 | ) |
|
| | | | | 14 | | | | — | | | | 282 | | | | (21,905 | ) | | | — | | | | (21,609 | ) | | | 498 | | | | 6,794 | | | | — | | | | 9,527 | | | | — | | | | (830,403 | ) | | | — | | | | (813,584 | ) |
| | | | | 148 | | | | — | | | | 1 | | | | (59,948 | ) | | | — | | | | (59,799 | ) | | | 6,278 | | | | 1,163 | | | | — | | | | 49 | | | | — | | | | (2,536,178 | ) | | | — | | | | (2,528,688 | ) |
|
| | | | | 18,540 | | | | — | | | | 6,506 | | | | (146,218 | ) | | | — | | | | (121,172 | ) | | | 617,771 | | | | 64,016 | | | | — | | | | 193,956 | | | | — | | | | (4,823,984 | ) | | | — | | | | (3,948,241 | ) |
| | | | | 15,965 | | | | — | | | | 15 | | | | (191,906 | ) | | | — | | | | (175,926 | ) | | | 598,166 | | | | 10,010 | | | | — | | | | 477 | | | | — | | | | (7,103,227 | ) | | | — | | | | (6,494,574 | ) |
|
| | | | | 259,424 | | | | — | | | | 42,183 | | | | (1,912,885 | ) | | | — | | | | (1,611,278 | ) | | | 9,074,359 | | | | 402,185 | | | | — | | | | 1,340,152 | | | | — | | | | (64,850,016 | ) | | | — | | | | (54,033,320 | ) |
| | | | | 1,087,598 | | | | — | | | | 21,402 | | | | (2,380,895 | ) | | | — | | | | (1,271,895 | ) | | | 43,168,247 | | | | 70,572 | | | | — | | | | 834,463 | | | | — | | | | (90,223,469 | ) | | | — | | | | (46,150,187 | ) |
|
| | | | | 16,552 | | | | — | | | | — | | | | (14,297 | ) | | | — | | | | 2,255 | | | | 587,931 | | | | 3,932 | | | | — | | | | — | | | | — | | | | (498,432 | ) | | | — | | | | 93,431 | |
| | | | | 23,889 | | | | — | | | | — | | | | (14,538 | ) | | | — | | | | 9,351 | | | | 947,636 | | | | 597 | | | | — | | | | — | | | | — | | | | (569,560 | ) | | | — | | | | 378,673 | |
|
| | | | | 231,450 | | | | — | | | | 11,768 | | | | (74,946 | ) | | | — | | | | 168,272 | | | | 9,272,622 | | | | 74,847 | | | | — | | | | 444,614 | | | | — | | | | (3,196,535 | ) | | | — | | | | 6,595,548 | |
| | | | | 223,881 | | | | — | | | | 5,091 | | | | (543,204 | ) | | | — | | | | (314,232 | ) | | | 10,339,982 | | | | 10,572 | | | | — | | | | 235,018 | | | | — | | | | (26,455,767 | ) | | | — | | | | (15,870,195 | ) |
(1) | | Commencement of operations. |
57
NOTES TO FINANCIAL STATEMENTS AS OF OCTOBER 31, 2012 (CONTINUED)
NOTE 12 — CAPITAL SHARES (continued)
Year or
| | | | Shares
sold
| | Shares
issued in
merger
| | Reinvestment
of
distributions
| | Shares
redeemed
| | Shares
converted
| | Net
increase
(decrease)
in shares
outstanding
| | Shares
sold
| | Payments from
Distribution
settlement/
affiliate
(Note 16)
| | Proceeds
from shares
issued in
merger
| | Reinvestment
of
distributions
| | Redemption
fee
proceeds
| | Shares
redeemed
| | Shares
converted
| | Net
increase
(decrease)
|
|---|
period ended
| | | | #
| | #
| | #
| | #
| | #
| | #
| | ($)
| | $
| | ($)
| | ($)
| | $
| | ($)
| | $
| | ($)
|
|---|
International Value Choice |
|
| | | | | 857,977 | | | | — | | | | 61,290 | | | | (979,205 | ) | | | — | | | | (59,938 | ) | | | 7,602,647 | | | | — | | | | — | | | | 549,769 | | | | — | | | | (8,868,341 | ) | | | — | | | | (715,925 | ) |
| | | | | 700,913 | | | | — | | | | 16,673 | | | | (710,198 | ) | | | — | | | | 7,388 | | | | 7,732,588 | | | | — | | | | — | | | | 183,909 | | | | — | | | | (7,787,412 | ) | | | — | | | | 129,085 | |
|
| | | | | 143 | | | | — | | | | 641 | | | | (13,367 | ) | | | — | | | | (12,583 | ) | | | 1,279 | | | | — | | | | — | | | | 5,729 | | | | — | | | | (121,644 | ) | | | — | | | | (114,636 | ) |
| | | | | 2,967 | | | | — | | | | — | | | | (62,387 | ) | | | — | | | | (59,420 | ) | | | 32,117 | | | | — | | | | — | | | | — | | | | — | | | | (676,895 | ) | | | — | | | | (644,778 | ) |
|
| | | | | 32,738 | | | | — | | | | 6,462 | | | | (194,465 | ) | | | — | | | | (155,265 | ) | | | 297,645 | | | | — | | | | — | | | | 57,515 | | | | — | | | | (1,754,257 | ) | | | — | | | | (1,399,097 | ) |
| | | | | 102,250 | | | | — | | | | 874 | | | | (137,507 | ) | | | — | | | | (34,383 | ) | | | 1,109,821 | | | | — | | | | — | | | | 9,548 | | | | — | | | | (1,454,328 | ) | | | — | | | | (334,959 | ) |
|
| | | | | 148,611 | | | | — | | | | 6,943 | | | | (384,488 | ) | | | — | | | | (228,934 | ) | | | 1,368,545 | | | | — | | | | — | | | | 62,143 | | | | — | | | | (3,475,314 | ) | | | — | | | | (2,044,626 | ) |
| | | | | 1,211,619 | | | | — | | | | 14,302 | | | | (2,458,363 | ) | | | — | | | | (1,232,442 | ) | | | 13,488,923 | | | | — | | | | — | | | | 157,468 | | | | — | | | | (25,305,252 | ) | | | — | | | | (11,658,861 | ) |
|
| | | | | 472,053 | | | | — | | | | 221 | | | | (470,611 | ) | | | — | | | | 1,663 | | | | 4,229,322 | | | | — | | | | — | | | | 1,980 | | | | — | | | | (4,172,613 | ) | | | — | | | | 58,689 | |
| | | | | 6,762 | | | | — | | | | 47 | | | | (3,616 | ) | | | — | | | | 3,193 | | | | 75,798 | | | | — | | | | — | | | | 516 | | | | — | | | | (40,182 | ) | | | — | | | | 36,132 | |
|
|
| | | | | 1,592,206 | | | | — | | | | 624,185 | | | | (13,328,059 | ) | | | — | | | | (11,111,668 | ) | | | 15,911,710 | | | | 370,454 | | | | — | | | | 5,904,795 | | | | — | | | | (133,988,233 | ) | | | — | | | | (111,801,274 | ) |
| | | | | 2,713,615 | | | | — | | | | 687,338 | | | | (21,092,834 | ) | | | — | | | | (17,691,881 | ) | | | 31,514,665 | | | | 48,376 | | | | — | | | | 7,909,938 | | | | — | | | | (245,656,346 | ) | | | — | | | | (206,183,367 | ) |
|
| | | | | 3,308 | | | | — | | | | 1,473 | | | | (79,061 | ) | | | — | | | | (74,280 | ) | | | 33,148 | | | | 1,679 | | | | — | | | | 14,127 | | | | — | | | | (811,502 | ) | | | — | | | | (762,548 | ) |
| | | | | 953 | | | | — | | | | 5 | | | | (134,706 | ) | | | — | | | | (133,748 | ) | | | 15,458 | | | | 233 | | | | — | | | | 57 | | | | — | | | | (1,596,187 | ) | | | — | | | | (1,580,439 | ) |
|
| | | | | 88,634 | | | | — | | | | 203,326 | | | | (3,641,870 | ) | | | — | | | | (3,349,910 | ) | | | 836,062 | | | | 166,718 | | | | — | | | | 1,872,630 | | | | — | | | | (35,566,726 | ) | | | — | | | | (32,691,316 | ) |
| | | | | 125,441 | | | | — | | | | 190,553 | | | | (5,369,143 | ) | | | — | | | | (5,053,149 | ) | | | 1,422,732 | | | | 21,392 | | | | — | | | | 2,131,679 | | | | — | | | | (60,913,970 | ) | | | — | | | | (57,338,167 | ) |
|
| | | | | 1,900,630 | | | | — | | | | 716,678 | | | | (8,267,004 | ) | | | — | | | | (5,649,696 | ) | | | 19,262,272 | | | | 321,337 | | | | — | | | | 6,736,773 | | | | — | | | | (82,295,214 | ) | | | — | | | | (55,974,832 | ) |
| | | | | 10,647,783 | | | | — | | | | 658,850 | | | | (25,034,873 | ) | | | — | | | | (13,728,240 | ) | | | 125,628,816 | | | | 45,553 | | | | — | | | | 7,549,252 | | | | — | | | | (291,421,213 | ) | | | — | | | | (158,197,592 | ) |
|
| | | | | 2,195 | | | | — | | | | 413 | | | | (30,318 | ) | | | — | | | | (27,710 | ) | | | 20,689 | | | | 403 | | | | — | | | | 3,889 | | | | — | | | | (300,118 | ) | | | — | | | | (275,137 | ) |
| | | | | 11,107 | | | | — | | | | 46,331 | | | | (2,099,066 | ) | | | — | | | | (2,041,628 | ) | | | 128,517 | | | | 70 | | | | — | | | | 530,953 | | | | — | | | | (24,170,447 | ) | | | — | | | | (23,510,907 | ) |
|
|
| | | | | 486,919 | | | | — | | | | — | | | | (2,470,645 | ) | | | — | | | | (1,983,726 | ) | | | 15,853,700 | | | | — | | | | — | | | | — | | | | (122,278 | ) | | | (77,879,747 | ) | | | — | | | | (61,903,769 | ) |
| | | | | 1,257,704 | | | | — | | | | — | | | | (3,228,676 | ) | | | — | | | | (1,970,972 | ) | | | 51,432,518 | | | | — | | | | — | | | | — | | | | (180,692 | ) | | | (124,889,133 | ) | | | — | | | | (73,275,923 | ) |
|
| | | | | 252,713 | | | | — | | | | — | | | | (291,136 | ) | | | — | | | | (38,423 | ) | | | 8,205,811 | | | | — | | | | — | | | | — | | | | (10,849 | ) | | | (9,318,184 | ) | | | — | | | | (1,101,524 | ) |
| | | | | 263,755 | | | | — | | | | — | | | | (174,657 | ) | | | — | | | | 89,098 | | | | 10,631,704 | | | | — | | | | — | | | | — | | | | (37,248 | ) | | | (6,576,891 | ) | | | — | | | | 4,092,061 | |
|
| | | | | 2,374 | | | | — | | | | — | | | | (419 | ) | | | — | | | | 1,955 | | | | 69,952 | | | | — | | | | — | | | | — | | | | (204 | ) | | | (12,552 | ) | | | — | | | | 57,604 | |
| | | | | 76 | | | | — | | | | — | | | | — | | | | — | | | | 76 | | | | 3,001 | | | | — | | | | — | | | | — | | | | — | | | | — | | | | — | | | | 3,001 | |
(1) | | Commencement of operations. |
NOTE 13 — CONCENTRATION OF RISKS
All mutual funds involve risk — some more than others — and there is always the chance that you could lose money or not earn as much as you hope. A Fund’s risk profile is largely a factor of the principal securities in which it invests and investment techniques that it uses. For more information regarding the types of securities and investment techniques that may be used by the Funds and their corresponding risks, see each Fund’s most recent Prospectus and/or the Statement of Additional Information.
Diversified International is also affected by other kinds of risks, depending on the types of securities held or strategies used by an Underlying Fund.
Investment by Funds-of-Funds (Certain Funds). Certain Funds’ shares may be purchased by other investment companies. In some cases, a Fund may experience large inflows or redemptions due to allocations or rebalancings. While it is impossible to predict the overall impact of these transactions over time, there could be adverse effects on portfolio management. The Investment Adviser will monitor transactions by each
58
NOTES TO FINANCIAL STATEMENTS AS OF OCTOBER 31, 2012 (CONTINUED)
NOTE 13 — CONCENTRATION OF RISKS (continued)
Fund and will attempt to minimize any adverse effects on the Funds and the Fund-of-Funds as a result of these transactions. So long as a Fund accepts investments by other investment companies, it will not purchase securities of other investment companies, except to the extent permitted by the 1940 Act or under the terms of an exemptive order granted by the SEC.
Foreign Investments/Developing and Emerging Markets Risk (All Funds). Investments in foreign securities may entail risks not present in domestic investments. Since securities in which the Funds and Underlying Funds may invest are denominated in foreign currencies, changes in the relationship of these foreign currencies to the U.S. dollar can significantly affect the value of the investments and earnings of the Funds and Underlying Funds. Foreign investments may also subject the Funds and Underlying Funds to foreign government exchange restrictions, expropriation, taxation or other political, social or economic developments, as well as changes vis-a-vis the U.S. dollar from movements in currency, and changes in security value and interest rate, all of which could affect the market and/or credit risk of the Funds’ and Underlying Funds’ investments. Foreign investment risks typically are greater in developing and emerging markets than in developed markets.
Non-Diversified (Global Bond and Russia). Certain of the Funds are classified as non-diversified investment companies under the 1940 Act, which means that they are not limited by the 1940 Act in the proportion of assets that they may invest in the obligations of a single issuer. Declines in the value of that single company can significantly impact the value of a Fund. The investment of a large percentage of a Fund’s assets in the securities of a small number of issuers may cause a Fund’s share price to fluctuate more than that of a diversified investment company. Conversely, even though classified as non-diversified, a Fund may actually maintain a portfolio that is diversified with a large number of issuers. In such an event, a Fund would benefit less from appreciation in a single corporate issuer than if it had greater exposure to that issuer.
NOTE 14 — SECURITIES LENDING
Under an agreement with The Bank of New York Mellon (“BNY”), the Funds can lend their securities to approved brokers, dealers and other financial institutions. Loans are collateralized by cash and U.S. government securities. The collateral is equal to at least 105% of the market value of non-U.S. securities loaned and 102% of the market value of U.S. securities loaned. The market value of the loaned securities is determined at the close of business of the Funds at their last sale price or official closing price on the principal exchange or system on which they are traded and any additional collateral is delivered to the Funds on the next business day. The cash collateral received is invested in approved investments as defined in the Securities Lending Agreement with BNY (the “Agreement”). The Funds bear the risk of loss with respect to the investment of collateral with the following exception: BNY provides the Funds indemnification from loss with respect to the investment of collateral provided that the cash collateral is invested solely in overnight repurchase agreements.
The cash collateral is invested in overnight repurchase agreements that are collateralized at 102% with securities issued or fully guaranteed by the United States Treasury; United States government or any agency, instrumentality or authority of the United States government. The securities purchased with cash collateral received are reflected in the Summary Portfolio of Investments under Securities Lending Collateral.
Generally, in the event of counterparty default, the Funds have the right to use the collateral to offset losses incurred. The Agreement contains certain guarantees by BNY in the event of counterparty default and/or a borrower’s failure to return a loaned security; however, there would be a potential loss to the Funds in the event the Funds are delayed or prevented from exercising their right to dispose of the collateral. Engaging in securities lending could have a leveraging effect, which may intensify the credit, market and other risks associated with investing in a Fund. At October 31, 2012, the following Funds had securities on loan with the following market values:
Fund
| | | | Value of
Securities
Loaned
| | Cash Collateral
Received
|
|---|
| | | | $ | 7,969,306 | | | $ | 8,310,696 | |
| | | | | 1,621,307 | | | | 1,722,019 | |
| | | | | 650,310 | | | | 700,066 | |
| | | | | 13,619,804 | | | | 14,079,810 | |
59
NOTES TO FINANCIAL STATEMENTS AS OF OCTOBER 31, 2012 (CONTINUED)
NOTE 15 — FEDERAL INCOME TAXES
The amount of distributions from net investment income and net realized capital gains are determined in accordance with federal income tax regulations, which may differ from U.S. generally accepted accounting principles for investment companies. These book/tax differences may be either temporary or permanent. Permanent differences are reclassified within the capital accounts based on their federal tax-basis treatment; temporary differences are not reclassified. Key differences include the treatment of short-term capital gains, foreign currency transactions, income from passive foreign investment companies (PFICs), and wash sale deferrals. Distributions in excess of net investment income and/or net realized capital gains for tax purposes are reported as return of capital.
The following permanent tax differences have been reclassified as of October 31, 2012:
| | | | Paid-in
Capital
| | Undistributed
Net Investment Income
On Investments
| | Accumulated
Net Realized
Gains / (Losses)
|
|---|
Diversified International | | | | $ | 179 | | | $ | 131,797 | | | $ | (131,976 | ) |
| | | | | — | | | | (19,943,605 | ) | | | 19,943,605 | |
| | | | | (364,932 | ) | | | (1,752,903 | ) | | | 2,117,835 | |
Index Plus International Equity | | | | | — | | | | 181,046 | | | | (181,046 | ) |
| | | | | (821,983 | ) | | | 2,098,850 | | | | (1,276,867 | ) |
International Value Choice | | | | | — | | | | (16,849 | ) | | | 16,849 | |
| | | | | (860,591 | ) | | | 1,323,544 | | | | (462,953 | ) |
| | | | | 500 | | | | (254,181 | ) | | | 253,681 | |
(1) | | $19,080,116 relates to the tax treatment of foreign currency gains and losses. |
Dividends paid by the Funds from net investment income and distributions of net realized short-term capital gains are, for federal income tax purposes, taxable as ordinary income to shareholders.
The tax composition of dividends and distributions to shareholders was as follows:
| | | | Year Ended October 31, 2012
| | Year Ended October 31, 2011
| |
|---|
| | | | Ordinary
Income
| | Long-term
Capital Gain
| | Return
of Capital
| | Ordinary
Income
| | Return
Of Capital
|
|---|
Diversified International | | | | $ | 1,060,003 | | | $ | — | | | $ | — | | | $ | 1,061,111 | | | $ | 191,335 | |
| | | | | 27,988,289 | | | | 6,774,863 | | | | 10,078,625 | | | | 32,360,506 | | | | — | |
| | | | | 32,521,474 | | | | 29,040,761 | | | | — | | | | 8,011,477 | | | | — | |
Index Plus International Equity | | | | | 2,495,861 | | | | — | | | | — | | | | 2,092,268 | | | | — | |
| | | | | 5,339,421 | | | | — | | | | — | | | | 2,615,060 | | | | — | |
International Value Choice | | | | | 774,425 | | | | — | | | | — | | | | 391,851 | | | | — | |
| | | | | 18,093,661 | | | | — | | | | — | | | | 23,226,893 | | | | — | |
The tax-basis components of distributable earnings and the capital loss carryforwards which may be used to offset future realized capital gains for federal income tax purposes as of October 31, 2012 are detailed below. Capital loss carryforwards with no expiration, if any, must be utilized prior to those with expiration dates.
| | | | | | | | | | Capital Loss Carryforwards
| |
|---|
| | | | Undistributed
Ordinary
Income
| | Late Year
Ordinary Losses
Deferred
| | Unrealized
Appreciation/
(Depreciation)
| | Amount
| | Character
| | Expiration
|
|---|
Diversified International | | | | $ | 526,968 | | | $ | (178,380 | ) | | $ | 2,898,366 | | | $ | (28,060,058 | ) | | | Short-term | | | | 2016 | |
| | | | | | | | | | | | | | | | | (93,445,922 | ) | | | Short-term | | | | 2017 | |
| | | | | | | | | | | | | | | | | (33,117,873 | ) | | | Short-term | | | | 2018 | |
| | | | | | | | | | | | | | | | | (824,702 | ) | | | Short-term | | | | 2019 | |
| | | | | | | | | | | | | | | | | (418,596 | ) | | | Short-term | | | | None | |
| | | | | | | | | | | | | | | | | (6,148,582 | ) | | | Long-term | | | | None | |
| | | | | | | | | | | | | | | | $ | (162,015,733 | ) | | | | | | | | |
| | | | | — | | | | — | | | | 12,336,465 | | | | — | | | | N/A | | | | N/A | |
| | | | | 681,489 | | | | | | | | (27,177,137 | ) | | | (9,135,728 | ) | | | Short-term | | | | None | |
| | | | | | | | | | | | | | | | | (25,904,849 | ) | | | Long-term | | | | None | |
| | | | | | | | | | | | | | | | $ | (35,040,577 | ) | | | | | | | | |
Index Plus International Equity | | | | | 2,411,899 | | | | — | | | | 7,275,787 | | | | (27,339,841 | ) | | | Short-term | | | | 2016 | |
| | | | | | | | | | | | | | | | | (46,742,747 | ) | | | Short-term | | | | 2017 | |
| | | | | | | | | | | | | | | | | (4,579,617 | ) | | | Short-term | | | | None | |
| | | | | | | | | | | | | | | | | (140,407 | ) | | | Long-term | | | | None | |
| | | | | | | | | | | | | | | | $ | (78,802,612 | ) | | | | | | | | |
60
NOTES TO FINANCIAL STATEMENTS AS OF OCTOBER 31, 2012 (CONTINUED)
NOTE 15 — FEDERAL INCOME TAXES (continued)
| | | | | | | | | | Capital Loss Carryforwards
| |
|---|
| | | | Undistributed
Ordinary
Income
| | Late Year
Ordinary Losses
Deferred
| | Unrealized
Appreciation/
(Depreciation)
| | Amount
| | Character
| | Expiration
|
|---|
| | | | $ | 4,278,857 | | | $ | — | | | $ | 11,334,106 | | | $ | (77,906,737 | ) | | | Short-term | | | | 2016 | |
| | | | | | | | | | | | | | | | | (202,973,948 | ) | | | Short-term | | | | 2017 | |
| | | | | | | | | | | | | | | | | (1,355,837 | ) | | | Short-term | | | | None | |
| | | | | | | | | | | | | | | | $ | (282,236,522 | ) | | | | | | | | |
International Value Choice | | | | | 365,853 | | | | — | | | | (2,284,541 | ) | | | (14,545,893 | ) | | | Short-term | | | | 2017 | |
| | | | | | | | | | | | | | | | | (359,381 | ) | | | Short-term | | | | 2019 | |
| | | | | | | | | | | | | | | | | (2,490,915 | ) | | | Long-term | | | | None | |
| | | | | | | | | | | | | | | | $ | (17,396,189 | ) | | | | | | | | |
| | | | | 11,410,427 | | | | — | | | | (45,848,330 | ) | | | (810,539,013 | ) | | | Short-term | | | | 2017 | |
| | | | | | | | | | | | | | | | | (70,133,094 | ) | | | Short-term | | | | 2018 | |
| | | | | | | | | | | | | | | | | (8,757,263 | ) | | | Short-term | | | | 2019 | |
| | | | | | | | | | | | | | | | | (12,866,873 | ) | | | Short-term | | | | None | |
| | | | | | | | | | | | | | | | | (51,613,608 | ) | | | Long-term | | | | None | |
| | | | | | | | | | | | | | | | $ | (953,909,851 | ) | | | | | | | | |
| | | | | 982,885 | | | | — | | | | 41,515,751 | | | | (66,111,223 | ) | | | Short-term | | | | 2017 | |
| | | | | | | | | | | | | | | | | (21,810,157 | ) | | | Short-term | | | | 2018 | |
| | | | | | | | | | | | | | | | | (2,925,627 | ) | | | Short-term | | | | None | |
| | | | | | | | | | | | | | | | $ | (90,847,007 | ) | | | | | | | | |
The Funds’ major tax jurisdictions are U.S. federal and Arizona. The earliest tax year that remains subject to examination by these jurisdictions is 2007.
As of October 31, 2012, no provisions for income tax would be required in the Funds’ financial statements as a result of tax positions taken on federal income tax returns for open tax years. The Funds’ federal and state income and federal excise tax returns for tax years for which the applicable statutes of limitations have not expired are subject to examination by the Internal Revenue Service and state department of revenue.
NOTE 16 — INFORMATION REGARDING TRADING OF ING’S U.S. MUTUAL FUNDS
On July 20, 2005, the Securities and Exchange Commission (“Commission” or “SEC”) entered into a settlement of an administrative proceeding against CIBC World Markets Corp. and Canadian Imperial Holdings Inc. (collectively “Respondents”). As part of the settlement, the Respondents have established the Distribution Fund (“Fund”) for the benefit of shareholders who may have been affected by the market timing activity in certain mutual funds where such trading was found to have been facilitated by the Respondents, as described in the order. The Fund is comprised of disgorgement in the amount of $125 million which was paid by the Respondents. The dollar amount available for distribution to mutual funds and shareholders of affected mutual funds (“Distributable Amount”) includes the original $125 million plus interest earned by the Fund.
On December 5, 2011, the SEC issued an order approving the proposed plan of distribution. In connection with this settlement, the following funds received:
| | | | $ | 364,932 | |
International SmallCap Multi-Manager | | | | $ | 821,983 | |
| | | | $ | 860,591 | |
NOTE 17 — SUBSEQUENT EVENTS
Dividends: Subsequent to October 31, 2012, the following Funds paid dividends of:
| | | | Net
Investment
Income
| | Payable
Date
| | Record
Date
|
|---|
| | | | | | | | | | | | | | |
| | | | | | | | |
| | | | | | | | |
| | | | | | | | |
| | | | | | | | |
| | | | | | | | |
| | | | | | | | |
| | | | | | | | |
| | | | | | | | |
| | | | | | | | |
| | | | | | | | |
| | | | | | | | |
| | | | | | | | |
| | | | | | | | |
| | | | | | | | |
61
NOTES TO FINANCIAL STATEMENTS AS OF OCTOBER 31, 2012 (CONTINUED)
NOTE 17 — SUBSEQUENT EVENTS (continued)
| | | | Net
Investment
Income
| | Payable
Date
| | Record
Date
|
|---|
| | | | | | | | | | | | | | |
| | | | | | | | |
| | | | | | | | |
| | | | | | | | |
| | | | | | | | |
| | | | | | | | |
Index Plus International Equity | | | | | | | | | | | | | | |
| | | | | | | | |
| | | | | | | | |
| | | | | | | | |
| | | | | | | | |
| | | | | | | | |
| | | | | | | | |
| | | | | | | | | | | | | | |
| | | | | | | | |
| | | | | | | | |
| | | | | | | | |
| | | | | | | | |
| | | | | | | | |
| | | | | | | | |
International Value Choice | | | | | | | | | | | | | | |
| | | | | | | | |
| | | | | | | | |
| | | | | | | | |
| | | | | | | | |
| | | | | | | | |
| | | | | | | | | | | | |
| | | | | | | | |
| | | | | | | | |
| | | | | | | | |
| | | | | | | | |
| | | | | | | | |
| | | | | | | | | | | | |
| | | | | | | | |
| | | | | | | | |
| | | | | | | | |
On September 6, 2012, the Board of Global Value Choice approved a change with respect to the Fund’s sub-adviser, name and principal investment strategies. The Fund will be renamed ING International Value Equity Fund. Effective November 30, 2012, the Fund will be managed by ING IM under an interim sub-advisory agreement with subsequent changes to the Fund’s principal investment strategies, pending shareholder approval of a permanent sub-advisory agreement. The shareholder vote is expected to take place on or about March 12, 2013.
On September 6, 2012, the Board of International Value Choice approved a change with respect to the Fund’s sub-adviser and principal investment strategies. Additionally, the Board approved a proposal to reorganize the Fund with and into Global Value Choice, to be renamed ING International Value Equity Fund. Effective November 30, 2012, International Value Choice is managed by ING IM under an interim sub-advisory agreement with subsequent changes to the Fund’s principal investment strategies, pending shareholder approval of a permanent sub-advisory agreement. The shareholder vote is expected to take place on or about March 14, 2013.
On December 7, 2012, Index Plus International Equity was closed to new investments.
The Funds have evaluated events occurring after the Statements of Assets and Liabilities date (subsequent events), to determine whether any subsequent events necessitated adjustment to or disclosure in the financial statements. Other than the above, no such subsequent events were identified.
62
PORTFOLIO OF INVESTMENTS
AS OF OCTOBER 31, 2012
ING DIVERSIFIED INTERNATIONAL FUND
Shares
|
|
|
|
|
|
|
| Value
|
| Percentage
of Net
Assets
|
|---|
| |
EXCHANGE-TRADED FUNDS: 4.6% |
| | | | | | iShares MSCI EAFE Value Index | | $ | 4,471,700 | | | | 4.6 | |
| |
| | | | | | Total Exchange-Traded Funds
(Cost $4,581,626) | | | 4,471,700 | | | | 4.6 | |
| |
|
| Affiliated Investment Companies: 95.7% |
| | | | | | ING Emerging Markets Equity Fund — Class I | | | 14,559,150 | | | | 15.1 | |
| | | | | | ING International Core Fund — Class I | | | 38,882,434 | | | | 40.2 | |
| | | | | | ING International Growth Fund — Class I | | | 19,418,723 | | | | 20.1 | |
| |
MUTUAL FUNDS: (continued) |
| Affiliated Investment Companies: (continued) |
| | | | | | ING International SmallCap Fund — Class I | | $ | 4,883,616 | | | | 5.0 | |
| | | | | | ING International Value Fund — Class I | | | 14,804,800 | | | | 15.3 | |
| |
| | | | | | Total Mutual Funds
(Cost $87,838,597) | | | 92,548,723 | | | | 95.7 | |
| |
| | | | | | Total Investments in Securities
(Cost $92,420,223) | | $ | 97,020,423 | | | | 100.3 | |
| | | | | | Liabilities in Excess of Other Assets | | | (288,309 | ) | | | (0.3 | ) |
| | | | | | | | $ | 96,732,114 | | | | 100.0 | |
| | Cost for federal income tax purposes is $94,122,057. |
Net unrealized appreciation consists of: | | | | | | |
Gross Unrealized Appreciation | | | | $ | 5,009,381 | |
Gross Unrealized Depreciation | | | | | (2,111,015 | ) |
Net Unrealized Appreciation | | | | $ | 2,898,366 | |
Fair Value Measurementsˆ
The following is a summary of the fair valuations according to the inputs used as of October 31, 2012 in valuing the assets and liabilities:
| | | | Quoted Prices
in Active Markets
for Identical
Investments
(Level 1)
| | Significant
Other
Observable
Inputs
(Level 2)
| | Significant
Unobservable
Inputs
(Level 3)
| | Fair Value
at
10/31/2012
|
|---|
| | | | | | | | | | | | | | | | | | |
Investments, at fair value | | | | | | | | | | | | | | | | | | |
| | | | $ | 4,471,700 | | | $ | — | | | $ | — | | | $ | 4,471,700 | |
| | | | | 92,548,723 | | | | — | | | | — | | | | 92,548,723 | |
Total Investments, at fair value | | | | $ | 97,020,423 | | | $ | — | | | $ | — | | | $ | 97,020,423 | |
| ˆ | | See Note 2, “Significant Accounting Policies” in the Notes to Financial Statements for additional information. |
There were no transfers in or out of Levels 1, 2 or 3 of the fair value hierarchy during the year ended October 31, 2012.
See Accompanying Notes to Financial Statements
63
SUMMARY PORTFOLIO OF INVESTMENTS
AS OF OCTOBER 31, 2012
ING GLOBAL BOND FUND
Principal
Amount†
|
|
|
|
|
|
|
| Value
|
| Percentage
of Net
Assets
|
|---|
| |
CORPORATE BONDS/NOTES: 24.8% |
| |
| | | | | | | | $ | 1,125,998 | | | | 0.1 | |
|
| |
| | | | | | Caixa Economica Federal, 3.500%, 11/07/22 | | | 1,255,125 | | | | 0.2 | |
| | | | | | Itau Unibanco Holding SA/Cayman Island, 6.200%, 12/21/21 | | | 87,600 | | | | 0.0 | |
| | | | | | JBS USA LLC/JBS USA Finance, Inc., 8.250%, 02/01/20 | | | 518,750 | | | | 0.1 | |
| | | | | | Odebrecht Finance Ltd., 7.500%, 09/29/49 | | | 258,000 | | | | 0.0 | |
| | | | | | QGOG Atlantic / Alaskan Rigs Ltd., 5.250%, 07/30/18 | | | 1,174,479 | | | | 0.1 | |
| | | | | | | | | 6,080,916 | | | | 0.8 | |
| | | | | | | | | 9,374,870 | | | | 1.2 | |
|
| |
| | | | | | Sable International Finance Ltd., 8.750%, 02/01/20 | | | 761,425 | | | | 0.1 | |
| | | | | | | | | 785,625 | | | | 0.1 | |
| | | | | | | | | 1,547,050 | | | | 0.2 | |
|
| |
| | | | | | Corp Nacional del Cobre de Chile, 4.250%, 07/17/42 | | | 458,172 | | | | 0.1 | |
| | | | | | Telefonica Chile SA, 3.875%, 10/12/22 | | | 1,790,953 | | | | 0.2 | |
| | | | | | Empresa Nacional del Petroleo, 4.750%–5.250%, 08/10/20–12/06/21 | | | 2,090,511 | | | | 0.2 | |
| | | | | | | | | 4,339,636 | | | | 0.5 | |
|
| |
| | | | | | China Resources Gas Group Ltd, 4.500%, 04/05/22 | | | 659,232 | | | | 0.1 | |
| | | | | | Mega Advance Investments Ltd., 6.375%, 05/12/41 | | | 324,882 | | | | 0.0 | |
| | | | | | | | | 984,114 | | | | 0.1 | |
|
| |
| | | | | | Colombia Telecomunicaciones SA ESP, 5.375%, 09/27/22 | | | 1,537,500 | | | | 0.2 | |
| | | | | | Empresa de Energia de Bogota SA, 6.125%, 11/10/21 | | | 816,065 | | | | 0.1 | |
| | | | | | | | | 2,353,565 | | | | 0.3 | |
|
| |
| | | | | | Hutchison Whampoa International 12 Ltd., 6.000%, 11/07/49 | | | 1,567,500 | | | | 0.2 | |
| |
CORPORATE BONDS/NOTES: (continued) |
| |
| | | | | | ICICI Bank Ltd./Dubai, 4.700%, 02/21/18 | | $ | 2,406,975 | | | | 0.3 | |
| | | | | | State Bank of India/London, 4.125%, 08/01/17 | | | 819,522 | | | | 0.1 | |
| | | | | | Reliance Holdings USA, Inc., 5.400%, 02/14/22 | | | 1,113,025 | | | | 0.1 | |
| | | | | | | | | 4,339,522 | | | | 0.5 | |
|
| |
| | | | | | Pertamina Persero PT, 6.000%, 05/03/42 | | | 2,831,250 | | | | 0.3 | |
|
| |
| | | | | | Ardagh Packaging Finance PLC/Ardagh MP Holdings USA, Inc., 7.375%, 10/15/17 | | | 269,688 | | | | 0.0 | |
| | | | | | Brunswick Rail Finance Ltd., 6.500%, 11/01/17 | | | 1,528,908 | | | | 0.2 | |
| | | | | | | | | 1,798,596 | | | | 0.2 | |
|
| |
| | | | | | | | | 1,238,196 | | | | 0.2 | |
|
| |
| | | | | | Kazakhstan Temir Zholy Finance BV, 6.950%, 07/10/42 | | | 819,437 | | | | 0.1 | |
|
| |
| | | | | | BBVA Bancomer SA/Texas, 6.750%, 09/30/22 | | | 2,610,500 | | | | 0.3 | |
| | | | | | Comision Federal de Electricidad, 5.750%, 02/14/42 | | | 411,055 | | | | 0.0 | |
| | | | | | Mexichem SAB de CV, 4.875%, 09/19/22 | | | 1,245,500 | | | | 0.2 | |
| | | | | | Petroleos Mexicanos, 7.650%, 11/24/21 | | | 11,966,175 | | | | 1.5 | |
| | | | | | Petroleos Mexicanos, 4.875%–6.500%, 01/21/21–06/27/44 | | | 3,790,030 | | | | 0.5 | |
| | | | | | | | | 3,082,288 | | | | 0.4 | |
| | | | | | | | | 23,105,548 | | | | 2.9 | |
|
| |
| | | | | | Carlson Wagonlit BV, 6.875%, 06/15/19 | | | 341,250 | | | | 0.1 | |
| | | | | | | | | 1,924,103 | | | | 0.2 | |
| | | | | | | | | 2,265,353 | | | | 0.3 | |
|
| |
| | | | | | Gazprom OAO Via Gaz Capital SA, 5.999%, 01/23/21 | | | 453,600 | | | | 0.0 | |
| | | | | | Russian Agricultural Bank OJSC Via RSHB Capital SA, 5.298%, 12/27/17 | | | 806,295 | | | | 0.1 | |
See Accompanying Notes to Financial Statements
64
SUMMARY PORTFOLIO OF INVESTMENTS
AS OF OCTOBER 31, 2012 (CONTINUED)
ING GLOBAL BOND FUND
Principal
Amount†
|
|
|
|
|
|
|
| Value
|
| Percentage
of Net
Assets
|
|---|
| |
CORPORATE BONDS/NOTES: (continued) |
| |
| | | | | | Russian Agricultural Bank OJSC Via RSHB Capital SA, 5.298%, 12/27/17 | | $ | 2,580,144 | | | | 0.3 | |
| | | | | | Sberbank of Russia Via SB Capital SA, 5.125%, 10/29/22 | | | 1,371,244 | | | | 0.2 | |
| | | | | | Severstal OAO Via Steel Capital SA, 5.900%, 10/17/22 | | | 1,293,825 | | | | 0.2 | |
| | | | | | VTB Bank OJSC Via VTB Capital SA, 6.950%, 10/17/22 | | | 1,453,130 | | | | 0.2 | |
| | | | | | | | | 1,498,558 | | | | 0.2 | |
| | | | | | | | | 9,456,796 | | | | 1.2 | |
|
| |
| | | | | | Transnet SOC Ltd., 4.000%, 07/26/22 | | | 3,091,710 | | | | 0.4 | |
| | | | | | | | | 102,083 | | | | 0.0 | |
| | | | | | | | | 3,193,793 | | | | 0.4 | |
|
| |
| | | | | | Hyundai Capital America, 4.000%, 06/08/17 | | | 757,217 | | | | 0.1 | |
| | | | | | Korea Gas Corp., 6.250%, 01/20/42 | | | 675,825 | | | | 0.1 | |
| | | | | | | | | 1,433,042 | | | | 0.2 | |
|
| Trinidad And Tobago: 0.2% |
| | | | | | | | | 1,490,352 | | | | 0.2 | |
|
| |
| | | | | | Akbank TAS, 5.000%, 10/24/22 | | | 918,405 | | | | 0.1 | |
| | | | | | Turkiye Halk Bankasi AS, 4.875%, 07/19/17 | | | 410,000 | | | | 0.1 | |
| | | | | | Turkiye Is Bankasi, 6.000%, 10/24/22 | | | 1,742,500 | | | | 0.2 | |
| | | | | | | | | 3,070,905 | | | | 0.4 | |
|
| United Arab Emirates: 0.5% |
| | | | | | Abu Dhabi National Energy Co., 5.875%, 12/13/21 | | | 1,290,600 | | | | 0.2 | |
| | | | | | Dolphin Energy Ltd., 5.500%, 12/15/21 | | | 849,852 | | | | 0.1 | |
| | | | | | IPIC GMTN Ltd., 5.500%, 03/01/22 | | | 1,864,732 | | | | 0.2 | |
| | | | | | | | | 4,005,184 | | | | 0.5 | |
|
| |
| | | | | | Barclays Bank PLC, 6.050%, 12/04/17 | | | 687,543 | | | | 0.1 | |
| | | | | | Ineos Finance PLC, 8.375%, 02/15/19 | | | 263,437 | | | | 0.0 | |
| | | | | | Lloyds TSB Bank PLC, 6.500%, 09/14/20 | | | 725,035 | | | | 0.1 | |
| | | | | | | | | 670,063 | | | | 0.1 | |
| | | | | | | | | 2,346,078 | | | | 0.3 | |
| |
CORPORATE BONDS/NOTES: (continued) |
| |
| | | | | | Allegheny Energy Supply Co. LLC, 5.750%, 10/15/19 | | $ | 471,537 | | | | 0.1 | |
| | | | | | American Express Credit Corp., 2.750%–5.125%, 08/25/14–09/15/15 | | | 2,914,101 | | | | 0.4 | |
| | | | | | AT&T, Inc., 2.500%–5.350%, 08/15/15–09/01/40 | | | 4,264,501 | | | | 0.5 | |
| | | | | | Bank of America Corp., 5.420%–5.625%, 03/15/17–07/01/20 | | | 2,027,064 | | | | 0.3 | |
| | | | | | Chesapeake Oilfield Operating LLC/Chesapeake Oilfield Finance, Inc., 6.625%, 11/15/19 | | | 239,375 | | | | 0.0 | |
| | | | | | Citigroup, Inc., 5.000%–8.500%, 09/15/14–05/22/19 | | | 2,093,406 | | | | 0.3 | |
| | | | | | Comcast Corp., 5.700%–6.550%, 05/15/18–07/01/39 | | | 3,310,748 | | | | 0.4 | |
| | | | | | Devon Energy Corp., 5.600%, 07/15/41 | | | 1,534,726 | | | | 0.2 | |
| | | | | | Entergy Corp., 5.125%, 09/15/20 | | | 2,400,208 | | | | 0.3 | |
| | | | | | Fresenius Medical Care US Finance II, Inc., 5.625%, 07/31/19 | | | 634,500 | | | | 0.1 | |
| | | | | | General Electric Capital Corp., 2.250%, 11/09/15 | | | 626,682 | | | | 0.1 | |
| | | | | | General Electric Capital Corp., 4.375%, 09/16/20 | | | 2,792,073 | | | | 0.3 | |
| | | | | | General Electric Co., 2.700%, 10/09/22 | | | 1,611,696 | | | | 0.2 | |
| | | | | | Hyatt Hotels Corp., 6.875%, 08/15/19 | | | 1,168,072 | | | | 0.1 | |
| | | | | | JPMorgan Chase & Co., 4.400%, 07/22/20 | | | 2,264,553 | | | | 0.3 | |
| | | | | | JPMorgan Chase Bank NA, 5.875%, 06/13/16 | | | 284,289 | | | | 0.0 | |
| | | | | | Kellogg Co., 4.000%, 12/15/20 | | | 2,964,837 | | | | 0.4 | |
| | | | | | Kinder Morgan Finance Co. LLC, 6.000%, 01/15/18 | | | 550,817 | | | | 0.1 | |
| | | | | | MBNA Credit Card Master Note Trust, 6.100%, 05/17/13 | | | 4,676,383 | | | | 0.6 | |
| | | | | | Morgan Stanley, 4.100%-7.300%, 01/26/15–05/13/19 | | | 1,840,370 | | | | 0.2 | |
| | | | | | Oracle Corp., 5.375%, 07/15/40 | | | 3,043,032 | | | | 0.4 | |
See Accompanying Notes to Financial Statements
65
SUMMARY PORTFOLIO OF INVESTMENTS
AS OF OCTOBER 31, 2012 (CONTINUED)
ING GLOBAL BOND FUND
Principal
Amount†
|
|
|
|
|
|
|
| Value
|
| Percentage
of Net
Assets
|
|---|
| |
CORPORATE BONDS/NOTES: (continued) |
| United States: (continued) |
| | | | | | Pacific Life Insurance Co., 9.250%, 06/15/39 | | $ | 1,213,395 | | | | 0.1 | |
| | | | | | Sealed Air Corp., 8.375%, 09/15/21 | | | 1,215,500 | | | | 0.1 | |
| | | | | | Suburban Propane Partners L.P./Suburban Energy Finance Corp., 7.375%, 08/01/21 | | | 312,825 | | | | 0.0 | |
| | | | | | Time Warner, Inc., 6.500%, 11/15/36 | | | 1,854,016 | | | | 0.2 | |
| | | | | | Time Warner Cable, Inc., 5.875%–6.750%, 06/15/39–11/15/40 | | | 2,183,918 | | | | 0.3 | |
| | | | | | Valeant Pharmaceuticals International, 7.000%, 10/01/20 | | | 432,500 | | | | 0.1 | |
| | | | | | Valeant Pharmaceuticals International, 7.250%, 07/15/22 | | | 783,000 | | | | 0.1 | |
| | | | | | Wells Fargo & Co., 3.676%, 06/15/16 | | | 1,766,121 | | | | 0.2 | |
| | | | | | XM Satellite Radio, Inc., 7.625%, 11/01/18 | | | 815,850 | | | | 0.1 | |
| | | | | | | | | 58,762,688 | | | | 7.3 | |
| | | | | | | | | 111,052,783 | | | | 13.8 | |
|
| |
| | | | | | Petroleos de Venezuela SA, 8.500%, 11/02/17 | | | 3,527,190 | | | | 0.5 | |
| | | | | | Petroleos de Venezuela SA, 9.750%, 05/17/35 | | | 1,723,148 | | | | 0.2 | |
| | | | | | | | | 5,250,338 | | | | 0.7 | |
| |
| | | | | | Total Corporate Bonds/Notes
(Cost $183,238,500) | | | 198,989,906 | | | | 24.8 | |
| |
COLLATERALIZED MORTGAGE OBLIGATIONS: 7.6% |
| |
| | | | | | American General Mortgage Loan Trust, 5.750%, 09/25/48 | | | 1,723,184 | | | | 0.2 | |
| | | | | | Banc of America Alternative Loan Trust, 4.750%, 02/25/19 | | | 1,913,416 | | | | 0.2 | |
| | | | | | Banc of America Merrill Lynch Commercial Mortgage, Inc., 5.190%, 09/10/47 | | | 702,537 | | | | 0.1 | |
| | | | | | Banc of America Merrill Lynch Commercial Mortgage, Inc., 5.323%, 07/10/43 | | | 930,235 | | | | 0.1 | |
| |
COLLATERALIZED MORTGAGE OBLIGATIONS: (continued) |
| United States: (continued) |
| | | | | | Banc of America Funding Corp., 5.750%, 10/25/35–11/25/35 | | $ | 585,402 | | | | 0.1 | |
| | | | | | Bear Stearns Adjustable Rate Mortgage Trust, 2.634%, 08/25/35 | | | 1,225,608 | | | | 0.2 | |
| | | | | | Bear Stearns Commercial Mortgage Securities, 5.483%, 07/11/42 | | | 2,717,463 | | | | 0.3 | |
| | | | | | Bear Stearns Commercial Mortgage Securities, 5.539%, 04/12/38 | | | 568,648 | | | | 0.1 | |
| | | | | | Credit Suisse Mortgage Capital Certificates, 4.975%, 07/27/37 | | | 1,767,068 | | | | 0.2 | |
| | | | | | Credit Suisse Mortgage Capital Certificates, 5.589%–5.677%, 06/15/39–09/15/40 | | | 1,113,014 | | | | 0.2 | |
| | | | | | CSMC Series 2009-RR3, 5.342%, 12/15/43 | | | 764,686 | | | | 0.1 | |
| | | | | | First Union National Bank Commercial Mortgage, 6.000%, 12/12/33 | | | 559,951 | | | | 0.1 | |
| | | | | | GS Mortgage Securities Corp. II, 5.309%, 01/10/40 | | | 1,930,579 | | | | 0.2 | |
| | | | | | Heller Financial Commercial Mortgage Asset, 6.500%, 05/15/31 | | | 1,677,558 | | | | 0.2 | |
| | | | | | JP Morgan Chase Commercial Mortgage Securities Corp., 4.903%, 10/15/42 | | | 309,792 | | | | 0.0 | |
| | | | | | JPMorgan Chase Commerical Mortgage Securities Corp., 6.135%, 07/12/37 | | | 431,036 | | | | 0.0 | |
| | | | | | JPMorgan Mortgage Trust, 5.280%, 07/25/35 | | | 471,216 | | | | 0.1 | |
| | | | | | JPMorgan Chase Commerical Mortgage Securities Corp., 1.449%–5.247%, 01/12/43–08/15/46 | | | 2,408,924 | | | | 0.3 | |
| | | | | | LB-UBS Commercial Mortgage Trust, 5.032%, 10/15/36 | | | 648,114 | | | | 0.1 | |
| | | | | | LB-UBS Commercial Mortgage Trust, 5.246%, 02/15/40 | | | 380,718 | | | | 0.1 | |
| | | | | | LB-UBS Commercial Mortgage Trust, 5.750%, 01/15/36 | | | 260,083 | | | | 0.0 | |
See Accompanying Notes to Financial Statements
66
SUMMARY PORTFOLIO OF INVESTMENTS
AS OF OCTOBER 31, 2012 (CONTINUED)
ING GLOBAL BOND FUND
Principal
Amount†
|
|
|
|
|
|
|
| Value
|
| Percentage
of Net
Assets
|
|---|
| |
COLLATERALIZED MORTGAGE OBLIGATIONS: (continued) |
| United States: (continued) |
| | | | | | LB-UBS Commercial Mortgage Trust, 4.943%–5.886%, 10/15/36–06/15/38 | | $ | 4,026,772 | | | | 0.5 | |
| | | | | | Merrill Lynch Mortgage Investors, Inc., 5.250%, 08/25/36 | | | 1,416,153 | | | | 0.2 | |
| | | | | | Merrill Lynch/Countrywide Commercial Mortgage Trust, 5.331%, 03/12/51 | | | 1,152,744 | | | | 0.1 | |
| | | | | | Morgan Stanley Capital I, 5.421%, 01/13/41 | | | 1,331,227 | | | | 0.2 | |
| | | | | | Morgan Stanley Reremic Trust, 5.843%, 12/17/43 | | | 2,697,386 | | | | 0.3 | |
| | | | | | Morgan Stanley Capital I, Inc., 5.397%–5.576%, 06/15/38–04/12/49 | | | 2,974,322 | | | | 0.4 | |
| | | | | | Morgan Stanley Capital I, 5.302%–5.576%, 01/14/42–04/12/49 | | | 3,210,376 | | | | 0.4 | |
| | | | | | RBSCF Trust, 5.305%, 01/16/49 | | | 978,868 | | | | 0.1 | |
| | | | | | UBS-Barclays Commercial Mortgage Trust, 2.210%, 08/10/49 | | | 1,691,051 | | | | 0.2 | |
| | | | | | Wachovia Bank Commercial Mortgage Trust, 5.750%, 06/15/49 | | | 2,735,024 | | | | 0.4 | |
| | | | | | Wachovia Bank Commercial Mortgage Trust, 5.704%, 02/15/35 | | | 1,093,269 | | | | 0.1 | |
| | | | | | Wells Fargo Commercial Mortgage Trust, 2.167%, 10/15/45 | | | 1,547,670 | | | | 0.2 | |
| | | | | | Wells Fargo Mortgage-Backed Securities Trust, 5.338%, 08/25/35 | | | 1,646,416 | | | | 0.2 | |
| | | | | | WF-RBS Commercial Mortgage Trust, 2.073%, 11/15/44 | | | 1,881,609 | | | | 0.2 | |
| | | | | | WF-RBS Commercial Mortgage Trust, 2.259%, 08/15/45 | | | 708,759 | | | | 0.1 | |
| | | | | | Wells Fargo Mortgage Backed Securities Trust, 5.000%–5.235%, 05/25/35–11/25/36 | | | 832,178 | | | | 0.1 | |
| | | | | | | | | 8,006,773 | | | | 1.0 | |
| |
| | | | | | Total Collateralized Mortgage Obligations
(Cost $60,156,436) | | | 61,019,829 | | | | 7.6 | |
| |
FOREIGN GOVERNMENT BONDS: 37.6% |
| |
| | | | | | | | $ | 1,122,500 | | | | 0.1 | |
|
| |
| | | | | | | | | 2,186,585 | | | | 0.3 | |
|
| |
| | | | | | Aruba Government Bond, 4.625%, 09/14/23 | | | 472,350 | | | | 0.1 | |
|
| |
| | | | | | Austria Government Bond, 3.200%, 02/20/17 | | | 7,092,017 | | | | 0.9 | |
|
| |
| | | | | | | | | 651,625 | | | | 0.1 | |
|
| |
| | | | | | Bolivian Government International Bond, 4.875%, 10/29/22 | | | 302,250 | | | | 0.0 | |
|
| |
| | | | | | Brazil Notas do Tesouro Nacional Series F, 10.000%, 01/01/23 | | | 52,223,180 | | | | 6.5 | |
| | | | | | Brazilian Government International Bond, 2.625%, 01/05/23 | | | 4,519,000 | | | | 0.6 | |
| | | | | | | | | 56,742,180 | | | | 7.1 | |
|
| |
| | | | | | Canadian Government Bond, 1.500%, 03/01/17 | | | 6,055,089 | | | | 0.7 | |
| | | | | | Canadian Government Bond, 4.000%, 06/01/41 | | | 2,139,074 | | | | 0.3 | |
| | | | | | | | | 8,194,163 | | | | 1.0 | |
|
| |
| | | | | | | | | 1,421,000 | | | | 0.2 | |
|
| |
| | | | | | Colombia Government International Bond, 6.125%–7.375%, 09/18/37–01/18/41 | | | 3,577,690 | | | | 0.4 | |
|
| |
| | | | | | | | | 982,830 | | | | 0.1 | |
|
| |
| | | | | | | | | 1,953,529 | | | | 0.2 | |
|
| |
| | | | | | | | | 473,000 | | | | 0.1 | |
|
| |
| | | | | | | | | 331,650 | | | | 0.0 | |
See Accompanying Notes to Financial Statements
67
SUMMARY PORTFOLIO OF INVESTMENTS
AS OF OCTOBER 31, 2012 (CONTINUED)
ING GLOBAL BOND FUND
Principal
Amount†
|
|
|
|
|
|
|
| Value
|
| Percentage
of Net
Assets
|
|---|
| |
FOREIGN GOVERNMENT BONDS: (continued) |
| |
| | | | | | | | $ | 1,082,272 | | | | 0.1 | |
|
| |
| | | | | | France Government Bond OAT, 2.250%, 10/25/22 | | | 29,579,773 | | | | 3.7 | |
|
| |
| | | | | | Bundesobligation, 0.500%, 04/07/17 | | | 8,429,399 | | | | 1.0 | |
| | | | | | Bundesrepublik Deutschland, 1.750%, 07/04/22 | | | 8,553,732 | | | | 1.1 | |
| | | | | | Bundesrepublik Deutschland, 2.500%, 07/04/44 | | | 1,553,369 | | | | 0.2 | |
| | | | | | Bundesschatzanweisungen, 0.250%, 03/14/14 | | | 52,023 | | | | 0.0 | |
| | | | | | | | | 18,588,523 | | | | 2.3 | |
|
| |
| | | | | | | | | 809,675 | | | | 0.1 | |
|
| |
| | | | | | | | | 2,255,501 | | | | 0.3 | |
|
| |
| | | | | | | | | 890,625 | | | | 0.1 | |
|
| |
| | | | | | Italy Buoni Poliennali Del Tesoro, 5.500%, 09/01/22 | | | 22,358,473 | | | | 2.8 | |
| | | | | | Italy Buoni Poliennali Del Tesoro, 5.500%, 11/01/22 | | | 20,643,724 | | | | 2.5 | |
| | | | | | | | | 43,002,197 | | | | 5.3 | |
|
| |
| | | | | | | | | 1,397,550 | | | | 0.2 | |
|
| |
| | | | | | | | | 797,125 | | | | 0.1 | |
|
| |
| | | | | | | | | 1,767,500 | | | | 0.2 | |
|
| |
| | | | | | Lithuania Government International Bond, 5.125%, 09/14/17 | | | 1,206,907 | | | | 0.2 | |
| | | | | | Lithuania Government International Bond, 6.625%, 02/01/22 | | | 316,519 | | | | 0.0 | |
| | | | | | | | | 744,750 | | | | 0.1 | |
| | | | | | | | | 2,268,176 | | | | 0.3 | |
|
| |
| | | | | | Malaysia Government Bond, 4.392%, 04/15/26 | | | 4,951,089 | | | | 0.6 | |
| |
FOREIGN GOVERNMENT BONDS: (continued) |
| |
| | | | | | Mexican Bonos, 7.750%, 11/13/42 | | $ | 15,881,458 | | | | 2.0 | |
| |
| | | | | | Netherlands Government Bond, 4.500%, 07/15/17 | | | 13,169,298 | | | | 1.6 | |
|
| |
| | | | | | Nigeria Government Bond, 15.100%, 04/27/17 | | | 5,317,968 | | | | 0.7 | |
| | | | | | Nigeria Government Bond, 16.000%, 06/29/19 | | | 2,399,347 | | | | 0.3 | |
| | | | | | | | | 7,717,315 | | | | 1.0 | |
|
| |
| | | | | | | | | 2,073,512 | | | | 0.3 | |
|
| |
| | | | | | Peruvian Government International Bond, 5.625%, 11/18/50 | | | 2,308,800 | | | | 0.3 | |
|
| |
| | | | | | Philippine Government International Bond, 4.000%, 01/15/21 | | | 4,246,651 | | | | 0.5 | |
| | | | | | Philippine Government International Bond, 6.375%, 01/15/32 | | | 975,848 | | | | 0.1 | |
| | | | | | | | | 5,222,499 | | | | 0.6 | |
|
| |
| | | | | | | | | 2,058,150 | | | | 0.3 | |
|
| |
| | | | | | | | | 1,072,500 | | | | 0.1 | |
|
| |
| | | | | | | | | 959,445 | | | | 0.1 | |
|
| |
| | | | | | Russian Federal Bond–OFZ, 8.150%, 02/03/27 | | | 4,217,477 | | | | 0.5 | |
| | | | | | Russian Foreign Bond–Eurobond, 3.250%, 04/04/17 | | | 638,214 | | | | 0.1 | |
| | | | | | Russian Foreign Bond–Eurobond, 5.625%–7.500%, 03/31/30–04/04/42 | | | 2,869,812 | | | | 0.4 | |
| | | | | | | | | 7,725,503 | | | | 1.0 | |
|
| |
| | | | | | | | | 428,956 | | | | 0.1 | |
|
| |
| | | | | | Slovenia Government International Bond, 5.500%, 10/26/22 | | | 1,722,950 | | | | 0.2 | |
See Accompanying Notes to Financial Statements
68
SUMMARY PORTFOLIO OF INVESTMENTS
AS OF OCTOBER 31, 2012 (CONTINUED)
ING GLOBAL BOND FUND
Principal
Amount†
|
|
|
|
|
|
|
| Value
|
| Percentage
of Net
Assets
|
|---|
| |
FOREIGN GOVERNMENT BONDS: (continued) |
| |
| | | | | | South Africa Government Bond, 6.250%, 03/31/36 | | $ | 11,443,409 | | | | 1.4 | |
| | | | | | South Africa Government Bond, 8.750%, 02/28/48 | | | 13,017,109 | | | | 1.6 | |
| | | | | | | | | 24,460,518 | | | | 3.0 | |
|
| |
| | | | | | Korea Housing Finance Corp., 4.125%, 12/15/15 | | | 541,688 | | | | 0.1 | |
|
| |
| | | | | | Sri Lanka Government International Bond, 5.875%, 07/25/22 | | | 1,246,300 | | | | 0.2 | |
|
| |
| | | | | | | | | 1,884,164 | | | | 0.2 | |
|
| |
| | | | | | Turkey Government International Bond, 7.500%, 11/07/19 | | | 4,898,472 | | | | 0.6 | |
| | | | | | Turkey Government International Bond, 6.000%–6.250%, 09/26/22–01/14/41 | | | 2,216,486 | | | | 0.3 | |
| | | | | | | | | 7,114,958 | | | | 0.9 | |
|
| |
| | | | | | Ukraine Government International Bond, 9.250%, 07/24/17 | | | 4,272,723 | | | | 0.5 | |
|
| |
| | | | | | United Kingdom Gilt, 4.500%, 12/07/42 | | | 3,467,098 | | | | 0.4 | |
| | | | | | United Kingdom Gilt, 1.750%–2.250%, 03/07/14–01/22/17 | | | 334,386 | | | | 0.1 | |
| | | | | | | | | 3,801,484 | | | | 0.5 | |
|
| |
| | | | | | | | | 1,623,706 | | | | 0.2 | |
|
| |
| | | | | | Venezuela Government International Bond, 11.750%, 10/21/26 | | | 2,392,346 | | | | 0.3 | |
|
| |
| | | | | | | | | 644,875 | | | | 0.1 | |
| |
FOREIGN GOVERNMENT BONDS: (continued) |
| |
| | | | | | Zambia Government International Bond, 5.375%, 09/20/22 | | $ | 658,125 | | | | 0.1 | |
| |
| | | | | | Total Foreign Government Bonds
(Cost $298,962,489) | | | 301,874,648 | | | | 37.6 | |
| |
U.S. TREASURY OBLIGATIONS: 7.8% |
| U.S. Treasury Bonds: 2.9% |
| | | | | | | | | 23,679,798 | | | | 2.9 | |
|
| U.S. Treasury Notes: 4.9% |
| | | | | | | | | 11,124,446 | | | | 1.4 | |
| | | | | | | | | 7,356,310 | | | | 0.9 | |
| | | | | | | | | 7,460,854 | | | | 0.9 | |
| | | | | | | | | 7,668,360 | | | | 1.0 | |
| | | | | | | | | 5,802,589 | | | | 0.7 | |
| | | | | | | | | 39,412,559 | | | | 4.9 | |
| |
| | | | | | Total U.S. Treasury Obligations
(Cost $63,004,122) | | | 63,092,357 | | | | 7.8 | |
| |
U.S. GOVERNMENT AGENCY OBLIGATIONS: 12.6% |
| Federal Home Loan Mortgage Corporation: 3.7%## |
| | | | | | | | | 6,499,455 | | | | 0.8 | |
| | | | | | | | | 14,959,643 | | | | 1.9 | |
| | | | | | | | | 3,155,677 | | | | 0.4 | |
| | | | | | 2.630%–5.836%, due 11/29/19–07/15/40 | | | 5,114,743 | | | | 0.6 | |
| | | | | | | | | 29,729,518 | | | | 3.7 | |
|
| Federal National Mortgage Association: 5.9%## |
| | | | | | | | | 5,759,749 | | | | 0.7 | |
| | | | | | | | | 5,996,436 | | | | 0.8 | |
| | | | | | | | | 4,380,180 | | | | 0.6 | |
| | | | | | | | | 11,512,796 | | | | 1.4 | |
| | | | | | 3.000%–32.397%, due 05/25/18–09/25/42 | | | 19,558,224 | | | | 2.4 | |
| | | | | | | | | 47,207,385 | | | | 5.9 | |
|
| Government National Mortgage Association: 3.0% |
| | | | | | | | | 2,933,295 | | | | 0.4 | |
| | | | | | | | | 11,453,991 | | | | 1.4 | |
| | | | | | 4.000%–24.515%, due 03/20/37–10/20/60 | | | 10,029,155 | | | | 1.2 | |
| | | | | | | | | 24,416,441 | | | | 3.0 | |
| |
| | | | | | Total U.S. Government Agency Obligations
(Cost $98,870,155) | | | 101,353,344 | | | | 12.6 | |
See Accompanying Notes to Financial Statements
69
SUMMARY PORTFOLIO OF INVESTMENTS
AS OF OCTOBER 31, 2012 (CONTINUED)
ING GLOBAL BOND FUND
# of
Contracts
|
|
|
|
|
|
|
| Value
|
| Percentage
of Net
Assets
|
|---|
| |
|
| Interest Rate Swaptions: 0.3% |
| | | | | | Call Swaption, Receive a fixed rate equal to 1.500% and pay a floating based on 3-month-USD-LIBOR, Exp. 11/29/12 Counterparty: Citigroup, Inc. | | $ | 44,258 | | | | 0.0 | |
| | | | | | Call Swaption, Receive a floating rate based on 3-month-USD-LIBOR and pay a fixed rate equal to 2.828%, Exp. 10/25/13 Counterparty: Deutsche Bank AG | | | 651,545 | | | | 0.1 | |
| | | | | | Call Swaption, Receive a floating rate based on 3-month-USD-LIBOR and pay a fixed rate equal to 2.828%, Exp. 10/25/13 Counterparty: Deutsche Bank AG | | | 767,252 | | | | 0.1 | |
| | | | | | Put Swaption, Receive a fixed rate equal to 1.185% and pay a floating based on 3-month-USD-LIBOR, Exp. 01/31/13 Counterparty: Citigroup, Inc. | | | 56,394 | | | | 0.0 | |
| | | | | | Put Swaption, Receive a fixed rate equal to 2.828% and pay a floating based on 3-month-USD-LIBOR, Exp. 10/25/13 Counterparty: Deutsche Bank AG | | | 651,545 | | | | 0.1 | |
| | | | | | Put Swaption, Receive a fixed rate equal to 2.828% and pay a floating based on 3-month-USD-LIBOR, Exp. 10/25/13 Counterparty: Deutsche Bank AG | | | 526,648 | | | | 0.0 | |
| | | | | | | | | 2,697,642 | | | | 0.3 | |
|
| Options on Currencies: 0.1% |
| | | | | | EUR Put vs. USD Call Currency Option, Strike @ 1.275 Exp. 01/04/13 Counterparty: Barclays Bank PLC | | | 252,242 | | | | 0.0 | |
| | | | | | JPY Put vs. USD Call Currency Option, Strike @ 80.500 Exp. 01/04/13 Counterparty: Deutsche Bank AG | | | 309,774 | | | | 0.1 | |
| | | | | | USD Put vs. MYR Call Currency Option, Strike @ 3.000 Exp. 01/16/13 Counterparty: Deutsche Bank AG | | | 49,056 | | | | 0.0 | |
| |
PURCHASED OPTIONS: (continued) |
| Options on Currencies: (continued) |
| | | | | | ZAR Put vs. USD Call Currency Option, Strike @ 9.000 Exp. 11/30/12 Counterparty: Deutsche Bank AG | | $ | 139,874 | | | | 0.0 | |
| | | | | | | | | 750,946 | | | | 0.1 | |
| |
| | | | | | Total Purchased Options
(Cost $4,400,952) | | | 3,448,588 | | | | 0.4 | |
| |
| | | | | | Total Long-Term Investments
(Cost $708,632,654) | | | 729,778,672 | | | | 90.8 | |
| |
Principal
Amount†
|
|
|
|
|
|
|
| Value
|
| Percentage
of Net
Assets
|
|---|
| |
SHORT-TERM INVESTMENTS: 14.8% |
| |
| | | | | | Concord Minutemen Capital Co., 0.430%, 01/02/13 | | | 6,495,060 | | | | 0.8 | |
| | | | | | Crown Point Capital, 0.280%, 11/02/12 | | | 11,999,813 | | | | 1.5 | |
| | | | | | Devon Energy Corp., 0.330%, 11/09/12 | | | 7,499,381 | | | | 0.9 | |
| | | | | | General Mills Inc., 0.260%, 11/01/12 | | | 1,383,990 | | | | 0.2 | |
| | | | | | General Mills Inc., 0.270%, 11/19/12 | | | 3,664,488 | | | | 0.5 | |
| | | | | | General Mills Inc., 0.280%, 11/14/12 | | | 1,599,826 | | | | 0.2 | |
| | | | | | General Mills Inc., 0.270%, 11/20/12 | | | 350,947 | | | | 0.0 | |
| | | | | | Kinder Morgan Energy, 0.430%, 11/06/12 | | | 7,499,462 | | | | 0.9 | |
| | | | | | Kroger Co., 0.450%, 11/06/12 | | | 7,999,400 | | | | 1.0 | |
| | | | | | Potash Corp., 0.300%, 11/30/12 | | | 6,498,402 | | | | 0.9 | |
| | | | | | United HealthCare, 0.320%, 11/05/12 | | | 7,999,644 | | | | 1.0 | |
| | | | | | Verizon Global Funding Corp., 2.000%, 12/03/12 | | | 7,497,242 | | | | 0.9 | |
| | | | | | Weatherford International Ltd., 0.520%, 11/02/12 | | | 7,499,783 | | | | 0.9 | |
| | | | | | | | | 77,987,438 | | | | 9.7 | |
|
| Foreign Government Bonds: 1.6% |
| | | | | | Bank Negara Malaysia Monetary Notes, 2.900%, 04/23/13 (Cost $13,046,110) | | | 13,112,640 | | | | 1.6 | |
See Accompanying Notes to Financial Statements
70
SUMMARY PORTFOLIO OF INVESTMENTS
AS OF OCTOBER 31, 2012 (CONTINUED)
ING GLOBAL BOND FUND
Shares
|
|
|
|
|
|
|
| Value
|
| Percentage
of Net
Assets
|
|---|
| |
SHORT-TERM INVESTMENTS: (continued) |
| |
| | | | | | BlackRock Liquidity Funds, TempFund, Institutional Class
(Cost $28,143,000) | | $ | 28,143,000 | | | | 3.5 | |
| |
| | | | | | Total Short-Term Investments
(Cost $119,176,548) | | | 119,243,078 | | | | 14.8 | |
| |
| | | | | | Total Investments in Securities
(Cost $827,809,202) | | $ | 849,021,750 | | | | 105.6 | |
| | | | | | Liabilities in Excess of Other Assets | | | (45,041,119 | ) | | | (5.6 | ) |
| | | | | | | | $ | 803,980,631 | | | | 100.0 | |
“Other Securities” represents issues not identified as the top 50 holdings in terms of market value and issues or issuers not exceeding 1% of net assets individually or in aggregate respectively as of October 31, 2012.
The following footnotes apply to either the individual securities noted or one or more of the securities aggregated and listed as a single line item.
| † | | Unless otherwise indicated, principal amount is shown in USD. |
| # | | Securities with purchases pursuant to Rule 144A or section 4(2), under the Securities Act of 1933 and may not be resold subject to that rule except to qualified institutional buyers. |
| ## | | On September 7, 2008, the Federal Housing Finance Agency placed the Federal National Mortgage Association and the Federal Home Loan Mortgage Corporation into conservatorship and the U.S. Treasury guaranteed the debt issued by those organizations. |
| @ | | Non-income producing security |
| W | | Settlement is on a when-issued or delayed-delivery basis. |
| ˆ | | Interest only securities represent the right to receive the monthly interest payments on an underlying pool of mortgage loans. Principal amount shown represents the notional amount on which current interest is calculated. Payments of principal on the pool reduce the value of the interest only security. |
| ˆˆ | | Principal only securities represent the right to receive the monthly principal payments on an underlying pool of mortgage loans. No payments of interest on the pool are passed through the principal only security. |
| Z | | Indicates Zero Coupon Bond; rate shown reflects current effective yield. |
| (a) | | The grouping contains Interest only securities. |
| (b) | | The grouping contains securities in default. |
| | | Cost for federal income tax purposes is $829,383,111. |
Net unrealized appreciation consists of: | | | | | | |
Gross Unrealized Appreciation | | | | $ | 25,516,791 | |
Gross Unrealized Depreciation | | | | | (5,878,152 | ) |
Net Unrealized Appreciation | | | | $ | 19,638,639 | |
Sector Diversification
| | | | Percentage
of Net Assets
|
|---|
| | | | | 37.6 | % |
Collateralized Mortgage Obligations | | | | | 8.2 | |
U.S. Treasury Obligations | | | | | 7.1 | |
Federal National Mortgage Association | | | | | 5.9 | |
| | | | | 5.8 | |
| | | | | 5.4 | |
Federal Home Loan Mortgage Corporation | | | | | 3.7 | |
Government National Mortgage Association | | | | | 3.0 | |
| | | | | 2.2 | |
| | | | | 2.0 | |
| | | | | 1.6 | |
| | | | | 1.6 | |
Telecommunication Services | | | | | 1.4 | |
| | | | | 1.3 | |
| | | | | 1.3 | |
| | | | | 0.9 | |
| | | | | 0.7 | |
| | | | | 0.7 | |
| | | | | 0.3 | |
| | | | | 0.1 | |
| | | | | 14.8 | |
Liabilities in Excess of Other Assets | | | | | (5.6 | ) |
| | | | | 100.0 | % |
See Accompanying Notes to Financial Statements
71
SUMMARY PORTFOLIO OF INVESTMENTS
AS OF OCTOBER 31, 2012 (CONTINUED)
ING GLOBAL BOND FUND
Fair Value Measurementsˆ
The following is a summary of the fair valuations according to the inputs used as of October 31, 2012 in valuing the assets and liabilities:
| | | | Quoted Prices
in Active Markets
for Identical
Investments
(Level 1)
| | Significant
Other
Observable
Inputs
(Level 2)
| | Significant
Unobservable
Inputs
(Level 3)
| | Fair Value
at
10/31/2012
|
|---|
| | | | | | | | | | | | | | | | | | |
Investments, at fair value | | | | | | | | | | | | | | | | | | |
| | | | $ | — | | | $ | 3,448,588 | | | $ | — | | | $ | 3,448,588 | |
| | | | | — | | | | 198,989,906 | | | | — | | | | 198,989,906 | |
Collateralized Mortgage Obligations | | | | | — | | | | 61,019,829 | | | | — | | | | 61,019,829 | |
| | | | | 28,143,000 | | | | 91,100,078 | | | | — | | | | 119,243,078 | |
| | | | | — | | | | 301,874,648 | | | | — | | | | 301,874,648 | |
U.S. Treasury Obligations | | | | | — | | | | 63,092,357 | | | | — | | | | 63,092,357 | |
U.S. Government Agency Obligations | | | | | — | | | | 101,353,344 | | | | — | | | | 101,353,344 | |
Total Investments, at fair value | | | | $ | 28,143,000 | | | $ | 820,878,750 | | | $ | — | | | $ | 849,021,750 | |
Other Financial Instruments+ | | | | | | | | | | | | | | | | | | |
| | | | | — | | | | 228,607 | | | | — | | | | 228,607 | |
| | | | | 491,566 | | | | — | | | | — | | | | 491,566 | |
Forward Foreign Currency Contracts | | | | | — | | | | 15,056,820 | | | | — | | | | 15,056,820 | |
| | | | $ | 28,634,566 | | | $ | 836,164,177 | | | $ | — | | | $ | 864,798,743 | |
| | | | | | | | | | | | | | | | | | |
Other Financial Instruments+ | | | | | | | | | | | | | | | | | | |
| | | | $ | — | | | $ | (8,501,863 | ) | | $ | — | | | $ | (8,501,863 | ) |
| | | | | (632,379 | ) | | | — | | | | — | | | | (632,379 | ) |
| | | | | — | | | | (217,804 | ) | | | — | | | | (217,804 | ) |
Forward Foreign Currency Contracts | | | | | — | | | | (11,560,519 | ) | | | — | | | | (11,560,519 | ) |
| | | | $ | (632,379 | ) | | $ | (20,280,186 | ) | | $ | — | | | $ | (20,912,565 | ) |
| ˆ | | See Note 2, “Significant Accounting Policies” in the Notes to Financial Statements for additional information. |
| + | | Other Financial Instruments are derivatives not reflected in the Portfolio of Investments and may include open forward foreign currency contracts, equity forwards, futures, swaps, and written options. Forward foreign currency contracts, equity forwards and futures are valued at the unrealized gain (loss) on the instrument. Swaps and written options are valued at the fair value of the instrument. |
There were no transfers in or out of Levels 1, 2 or 3 of the fair value hierarchy during the year ended October 31, 2012.
At October 31, 2012, the following forward foreign currency contracts were outstanding for the ING Global Bond Fund:
Counterparty
| | | | Currency
| | Contract Amount
| | Buy/Sell
| | Settlement
Date
| | In Exchange For
| | Fair Value
| | Unrealized
Appreciation
(Depreciation)
|
|---|
| | | | | | | | | | | | $ | 3,332,000 | | | $ | 3,330,802 | | | $ | (1,198 | ) |
| | | | | | | | | | | | | 1,083,515 | | | | 1,080,501 | | | | (3,014 | ) |
| | | | | | | | | | | | | 3,559,000 | | | | 3,559,600 | | | | 600 | |
| | | | | | | | | | | | | 15,497,000 | | | | 15,333,406 | | | | (163,594 | ) |
| | | | | | | | | | | | | 1,287,000 | | | | 1,290,933 | | | | 3,933 | |
| | | | | | | | | | | | | 46,065 | | | | 45,028 | | | | (1,037 | ) |
| | | | | | | | | | | | | 7,403,000 | | | | 7,361,960 | | | | (41,040 | ) |
| | | | | | | | | | | | | 289,587 | | | | 290,058 | | | | 471 | |
| | | | | | | | | | | | | 15,426,000 | | | | 15,622,675 | | | | 196,675 | |
| | | | | | | | | | | | | 6,088,000 | | | | 6,126,458 | | | | 38,458 | |
| | | | | | | | | | | | | 55,257 | | | | 57,575 | | | | 2,318 | |
| | | | | | | | | | | | | 2,876,000 | | | | 2,865,416 | | | | (10,584 | ) |
| | | | | | | | | | | | | 7,222,891 | | | | 7,576,952 | | | | 354,061 | |
| | | | | | | | | | | | | 14,174,207 | | | | 14,063,879 | | | | (110,328 | ) |
| | | | | | | | | | | | | 2,699,070 | | | | 2,725,631 | | | | 26,561 | |
| | | | | | | | | | | | | 3,895,850 | | | | 3,939,857 | | | | 44,007 | |
| | | | | | | | | | | | | 3,677,000 | | | | 3,673,028 | | | | (3,972 | ) |
| | | | | | | | | | | | | 5,502,000 | | | | 5,499,429 | | | | (2,571 | ) |
| | | | | | | | | | | | | 536,000 | | | | 537,348 | | | | 1,348 | |
| | | | | | | | | | | | | 1,157,000 | | | | 1,146,425 | | | | (10,575 | ) |
| | | | | | | | | | | | | 3,127,000 | | | | 3,128,211 | | | | 1,211 | |
See Accompanying Notes to Financial Statements
72
SUMMARY PORTFOLIO OF INVESTMENTS
AS OF OCTOBER 31, 2012 (CONTINUED)
ING GLOBAL BOND FUND
Counterparty
| | | | Currency
| | Contract Amount
| | Buy/Sell
| | Settlement
Date
| | In Exchange For
| | Fair Value
| | Unrealized
Appreciation
(Depreciation)
|
|---|
| | | | | | | | | | | | $ | 4,851 | | | $ | 4,902 | | | $ | 51 | |
| | | | | | | | | | | | | 6,924,529 | | | | 6,943,469 | | | | 18,940 | |
| | | | | | | | | | | | | 2,651,000 | | | | 2,664,562 | | | | 13,562 | |
| | | | | | | | | | | | | 2,457,000 | | | | 2,443,107 | | | | (13,893 | ) |
| | | | | | | | | | | | | 5,468,000 | | | | 5,441,627 | | | | (26,373 | ) |
| | | | | | | | | | | | | 2,197,000 | | | | 2,201,145 | | | | 4,145 | |
| | | | | | | | | | | | | 5,829,000 | | | | 5,961,320 | | | | 132,320 | |
| | | | | | | | | | | | | 105,709 | | | | 106,238 | | | | 529 | |
| | | | | | | | | | | | | 458,658 | | | | 471,395 | | | | 12,737 | |
| | | | | | | | | | | | | 2,436,000 | | | | 2,434,346 | | | | (1,654 | ) |
| | | | | | | | | | | | | 4,972,000 | | | | 5,031,777 | | | | 59,777 | |
| | | | | | | | | | | | | 2,593,000 | | | | 2,579,932 | | | | (13,068 | ) |
| | | | | | | | | | | | | 4,948,000 | | | | 4,967,455 | | | | 19,455 | |
| | | | | | | | | | | | | 12,641,847 | | | | 13,177,142 | | | | 535,295 | |
| | | | | | | | | | | | | 1,205,000 | | | | 1,193,294 | | | | (11,706 | ) |
| | | | | | | | | | | | | 7,690,000 | | | | 7,752,093 | | | | 62,093 | |
| | | | | | | | | | | | | 2,530,095 | | | | 2,544,637 | | | | 14,542 | |
| | | | | | | | | | | | | 6,609,000 | | | | 6,562,398 | | | | (46,602 | ) |
| | | | | | | | | | | | | 28,996,000 | | | | 29,973,191 | | | | 977,191 | |
| | | | | | | | | | | | | 3,533,000 | | | | 3,513,203 | | | | (19,797 | ) |
| | | | | | | | | | | | | 16,686,180 | | | | 16,589,982 | | | | (96,198 | ) |
| | | | | | | | | | | | | 1,431,292 | | | | 1,490,117 | | | | 58,825 | |
| | | | | | | | | | | | | 7,769,055 | | | | 7,889,023 | | | | 119,968 | |
| | | | | | | | | | | | | 11,733,529 | | | | 12,264,330 | | | | 530,801 | |
| | | | | | | | | | | | | 2,235,000 | | | | 2,339,606 | | | | 104,606 | |
Credit Suisse First Boston | | | | | | | | | | | | | 21,692 | | | | 21,691 | | | | (1 | ) |
Credit Suisse First Boston | | | | | | | | | | | | | 6,117,000 | | | | 6,110,423 | | | | (6,577 | ) |
Credit Suisse First Boston | | | | | | | | | | | | | 937,533 | | | | 945,765 | | | | 8,232 | |
Credit Suisse First Boston | | | | | | | | | | | | | 2,088,000 | | | | 2,051,417 | | | | (36,583 | ) |
Credit Suisse First Boston | | | | | | | | | | | | | 9,092,108 | | | | 9,114,041 | | | | 21,933 | |
Credit Suisse First Boston | | | | | | | | | | | | | 2,501,000 | | | | 2,429,876 | | | | (71,124 | ) |
Credit Suisse First Boston | | | | | | | | | | | | | 13,325,000 | | | | 13,304,636 | | | | (20,364 | ) |
Credit Suisse First Boston | | | | | | | | | | | | | 11,467,000 | | | | 11,382,202 | | | | (84,798 | ) |
Credit Suisse First Boston | | | | | | | | | | | | | 5,419,949 | | | | 5,404,915 | | | | (15,034 | ) |
Credit Suisse First Boston | | | | | | | | | | | | | 5,184,000 | | | | 5,197,013 | | | | 13,013 | |
Credit Suisse First Boston | | | | | | | | | | | | | 2,537,000 | | | | 2,542,608 | | | | 5,608 | |
Credit Suisse First Boston | | | | | | | | | | | | | 11,490,989 | | | | 11,239,309 | | | | (251,680 | ) |
Credit Suisse First Boston | | | | | | | | | | | | | 7,453,000 | | | | 7,458,860 | | | | 5,860 | |
Credit Suisse First Boston | | | | | | | | | | | | | 3,673,000 | | | | 3,670,893 | | | | (2,107 | ) |
Credit Suisse First Boston | | | | | | | | | | | | | 9,035,000 | | | | 8,978,381 | | | | (56,619 | ) |
Credit Suisse First Boston | | | | | | | | | | | | | 2,314,000 | | | | 2,296,920 | | | | (17,080 | ) |
Credit Suisse First Boston | | | | | | | | | | | | | 3,155,000 | | | | 3,163,547 | | | | 8,547 | |
Credit Suisse First Boston | | | | | | | | | | | | | 1,982,294 | | | | 1,997,821 | | | | 15,527 | |
Credit Suisse First Boston | | | | | | | | | | | | | 2,844,145 | | | | 2,839,750 | | | | (4,395 | ) |
Credit Suisse First Boston | | | | | | | | | | | | | 22,270,713 | | | | 22,564,432 | | | | 293,719 | |
Credit Suisse First Boston | | | | | | | | | | | | | 14,505,938 | | | | 14,571,239 | | | | 65,301 | |
Credit Suisse First Boston | | | | | | | | | | | | | 12,296,272 | | | | 12,286,085 | | | | (10,187 | ) |
| | | | | | | | | | | | | 2,002,000 | | | | 2,000,809 | | | | (1,191 | ) |
| | | | | | | | | | | | | 1,465,218 | | | | 1,457,816 | | | | (7,402 | ) |
| | | | | | | | | | | | | 5,949,000 | | | | 5,970,781 | | | | 21,781 | |
| | | | | | | | | | | | | 6,002,000 | | | | 5,962,548 | | | | (39,452 | ) |
| | | | | | | | | | | | | 7,612,000 | | | | 7,478,709 | | | | (133,291 | ) |
| | | | | | | | | | | | | 13,790,752 | | | | 13,933,955 | | | | 143,203 | |
| | | | | | | | | | | | | 15,592,000 | | | | 15,613,190 | | | | 21,190 | |
| | | | | | | | | | | | | 7,210,412 | | | | 7,151,527 | | | | (58,885 | ) |
| | | | | | | | | | | | | 7,572,000 | | | | 7,531,930 | | | | (40,070 | ) |
| | | | | | | | | | | | | 39,023 | | | | 38,686 | | | | (337 | ) |
| | | | | | | | | | | | | 5,442,356 | | | | 5,363,687 | | | | (78,669 | ) |
| | | | | | | | | | | | | 12,799,422 | | | | 12,830,234 | | | | 30,812 | |
| | | | | | | | | | | | | 11,269,000 | | | | 11,315,876 | | | | 46,876 | |
| | | | | | | | | | | | | 2,621,185 | | | | 2,576,971 | | | | (44,214 | ) |
| | | | | | | | | | | | | 8,790,000 | | | | 8,811,378 | | | | 21,378 | |
| | | | | | | | | | | | | 2,002,000 | | | | 1,990,745 | | | | (11,255 | ) |
| | | | | | | | | | | | | 5,480,000 | | | | 5,355,989 | | | | (124,011 | ) |
See Accompanying Notes to Financial Statements
73
SUMMARY PORTFOLIO OF INVESTMENTS
AS OF OCTOBER 31, 2012 (CONTINUED)
ING GLOBAL BOND FUND
Counterparty
| | | | Currency
| | Contract Amount
| | Buy/Sell
| | Settlement
Date
| | In Exchange For
| | Fair Value
| | Unrealized
Appreciation
(Depreciation)
|
|---|
| | | | | | | | | | | | $ | 14,991,000 | | | $ | 14,652,282 | | | $ | (338,718 | ) |
| | | | | | | | | | | | | 3,375,000 | | | | 3,287,655 | | | | (87,345 | ) |
| | | | | | | | | | | | | 17,787,000 | | | | 16,777,491 | | | | (1,009,509 | ) |
| | | | | | | | | | | | | 14,071,112 | | | | 14,461,898 | | | | 390,786 | |
| | | | | | | | | | | | | 15,911,485 | | | | 16,005,672 | | | | 94,187 | |
| | | | | | | | | | | | | 8,858,000 | | | | 8,945,531 | | | | 87,531 | |
| | | | | | | | | | | | | 18,248,175 | | | | 19,029,194 | | | | 781,019 | |
| | | | | | | | | | | | | 9,098,405 | | | | 8,903,562 | | | | (194,843 | ) |
| | | | | | | �� | | | | | | 10,950,656 | | | | 10,703,156 | | | | (247,500 | ) |
| | | | | | | | | | | | | 7,577,000 | | | | 7,457,236 | | | | (119,764 | ) |
| | | | | | | | | | | | | 2,706,000 | | | | 2,709,882 | | | | 3,882 | |
| | | | | | | | | | | | | 2,074,200 | | | | 2,021,357 | | | | (52,843 | ) |
| | | | | | | | | | | | | 682,505 | | | | 700,844 | | | | 18,339 | |
| | | | | | | | | | | | | 47,271,801 | | | | 49,662,568 | | | | 2,390,767 | |
| | | | | | | | | | | | | 105,641,584 | | | | 105,025,422 | | | | (616,162 | ) |
| | | | | | | | | | | | | 3,145,934 | | | | 3,290,114 | | | | 144,180 | |
| | | | | | | | | | | | | 5,156,246 | | | | 5,312,460 | | | | 156,214 | |
| | | | | | | | | | | | | 6,532,378 | | | | 6,635,178 | | | | 102,800 | |
| | | | | | | | | | | | | 6,774,000 | | | | 6,659,188 | | | | (114,812 | ) |
| | | | | | | | | | | | | 11,605,000 | | | | 11,960,320 | | | | 355,320 | |
| | | | | | | | | | | | | 7,339,000 | | | | 7,451,798 | | | | 112,798 | |
| | | | | | | | | | | | | 7,339,000 | | | | 7,452,164 | | | | 113,164 | |
| | | | | | | �� | | | | | | 8,748,000 | | | | 8,832,008 | | | | 84,008 | |
| | | | | | | | | | | | | 2,645,000 | | | | 2,642,724 | | | | (2,276 | ) |
| | | | | | | | | | | | | 12,046,000 | | | | 12,054,534 | | | | 8,534 | |
| | | | | | | | | | | | | 11,933,000 | | | | 11,990,558 | | | | 57,558 | |
| | | | | | | | | | | | | 2,629,672 | | | | 2,638,454 | | | | 8,782 | |
| | | | | | | | | | | | | 60,487 | | | | 60,807 | | | | 320 | |
| | | | | | | | | | | | | 3,393,000 | | | | 3,401,740 | | | | 8,740 | |
| | | | | | | | | | | | | 3,012,000 | | | | 3,013,993 | | | | 1,993 | |
| | | | | | | | | | | | | 10,324,239 | | | | 10,226,663 | | | | (97,576 | ) |
| | | | | | | | | | | | | 5,210,000 | | | | 5,158,063 | | | | (51,937 | ) |
| | | | | | | | | | | | | 7,612,000 | | | | 7,487,064 | | | | (124,936 | ) |
| | | | | | | | | | | | | 18,503,286 | | | | 18,169,155 | | | | (334,131 | ) |
| | | | | | | | | | | | | 7,403,000 | | | | 7,374,730 | | | | (28,270 | ) |
| | | | | | | | | | | | | 111,964 | | | | 110,428 | | | | (1,536 | ) |
| | | | | | | | | | | | | 12,434,000 | | | | 12,386,328 | | | | (47,672 | ) |
| | | | | | | | | | | | | 7,284,000 | | | | 7,392,977 | | | | 108,977 | |
| | | | | | | | | | | | | 7,503,000 | | | | 7,635,248 | | | | 132,248 | |
| | | | | | | | | | | | | 1,274,000 | | | | 1,284,799 | | | | 10,799 | |
| | | | | | | | | | | | | 11,417,000 | | | | 11,298,288 | | | | (118,712 | ) |
| | | | | | | | | | | | | 2,602,000 | | | | 2,595,887 | | | | (6,113 | ) |
| | | | | | | | | | | | | 10,026,000 | | | | 9,885,504 | | | | (140,496 | ) |
| | | | | | | | | | | | | 3,208,000 | | | | 3,247,653 | | | | 39,653 | |
| | | | | | | | | | | | | 4,083,000 | | | | 4,037,107 | | | | (45,893 | ) |
| | | | | | | | | | | | | 7,451,000 | | | | 7,426,762 | | | | (24,238 | ) |
| | | | | | | | | | | | | 3,045,000 | | | | 2,985,224 | | | | (59,776 | ) |
| | | | | | | | | | | | | 3,669,000 | | | | 3,492,534 | | | | (176,466 | ) |
| | | | | | | | | | | | | 2,098,000 | | | | 2,116,904 | | | | 18,904 | |
| | | | | | | | | | | | | 1,693,000 | | | | 1,687,964 | | | | (5,036 | ) |
| | | | | | | | | | | | | 2,529,000 | | | | 2,520,552 | | | | (8,448 | ) |
| | | | | | | | | | | | | 5,191,000 | | | | 5,190,752 | | | | (248 | ) |
| | | | | | | | | | | | | | | | | | | | $ | 3,541,177 | |
| | | | | | | | | | | | $ | 7,598,000 | | | $ | 7,613,643 | | | $ | (15,643 | ) |
| | | | | | | | | | | | | 4,824,000 | | | | 4,740,899 | | | | 83,101 | |
| | | | | | | | | | | | | 2,591,000 | | | | 2,643,176 | | | | (52,176 | ) |
| | | | | | | | | | | | | 6,073,000 | | | | 5,888,494 | | | | 184,506 | |
| | | | | | | | | | | | | 5,821,021 | | | | 5,600,312 | | | | 220,709 | |
| | | | | | | | | | | | | 14,981,525 | | | | 15,029,501 | | | | (47,976 | ) |
| | | | | | | | | | | | | 14,956,308 | | | | 15,003,042 | | | | (46,734 | ) |
| | | | | | | | | | | | | 5,573,000 | | | | 5,723,484 | | | | (150,484 | ) |
| | | | | | | | | | | | | 3,776,000 | | | | 3,779,959 | | | | (3,959 | ) |
See Accompanying Notes to Financial Statements
74
SUMMARY PORTFOLIO OF INVESTMENTS
AS OF OCTOBER 31, 2012 (CONTINUED)
ING GLOBAL BOND FUND
Counterparty
| | | | Currency
| | Contract Amount
| | Buy/Sell
| | Settlement
Date
| | In Exchange For
| | Fair Value
| | Unrealized
Appreciation
(Depreciation)
|
|---|
| | | | | | | | | | | | $ | 5,535,000 | | | $ | 5,579,574 | | | $ | (44,574 | ) |
| | | | | | | | | | | | | 6,094,000 | | | | 6,277,696 | | | | (183,696 | ) |
| | | | | | | | | | | | | 11,147,423 | | | | 11,469,450 | | | | (322,027 | ) |
| | | | | | | | | | | | | 1,577,000 | | | | 1,583,082 | | | | (6,082 | ) |
| | | | | | | | | | | | | 1,275,000 | | | | 1,287,925 | | | | (12,925 | ) |
| | | | | | | | | | | | | 7,565,970 | | | | 7,730,149 | | | | (164,179 | ) |
| | | | | | | | | | | | | 2,753,000 | | | | 2,793,016 | | | | (40,016 | ) |
| | | | | | | | | | | | | 2,676,000 | | | | 2,706,324 | | | | (30,324 | ) |
| | | | | | | | | | | | | 7,513,000 | | | | 7,661,197 | | | | (148,197 | ) |
| | | | | | | | | | | | | 1,185,014 | | | | 1,122,313 | | | | 62,701 | |
| | | | | | | | | | | | | 2,977,960 | | | | 2,815,229 | | | | 162,731 | |
| | | | | | | | | | | | | 4,519,000 | | | | 4,548,602 | | | | (29,602 | ) |
| | | | | | | | | | | | | 1,900,000 | | | | 1,905,509 | | | | (5,509 | ) |
| | | | | | | | | | | | | 2,350,000 | | | | 2,379,170 | | | | (29,170 | ) |
| | | | | | | | | | | | | 4,267,000 | | | | 4,386,519 | | | | (119,519 | ) |
| | | | | | | | | | | | | 7,176,000 | | | | 7,136,630 | | | | 39,370 | |
| | | | | | | | | | | | | 948,000 | | | | 974,146 | | | | (26,146 | ) |
| | | | | | | | | | | | | 493,000 | | | | 496,099 | | | | (3,099 | ) |
| | | | | | | | | | | | | 14,567,000 | | | | 15,034,833 | | | | (467,833 | ) |
| | | | | | | | | | | | | 12,417 | | | | 12,575 | | | | (158 | ) |
| | | | | | | | | | | | | 50,029,990 | | | | 48,411,548 | | | | 1,618,442 | |
Credit Suisse First Boston | | | | | | | | | | | | | 2,057,000 | | | | 2,039,419 | | | | 17,581 | |
Credit Suisse First Boston | | | | | | | | | | | | | 2,534,000 | | | | 2,563,551 | | | | (29,551 | ) |
Credit Suisse First Boston | | | | | | | | | | | | | 5,670 | | | | 5,579 | | | | 91 | |
Credit Suisse First Boston | | | | | | | | | | | | | 6,906,000 | | | | 6,712,744 | | | | 193,256 | |
Credit Suisse First Boston | | | | | | | | | | | | | 3,081,127 | | | | 3,096,677 | | | | (15,550 | ) |
Credit Suisse First Boston | | | | | | | | | | | | | 3,138,000 | | | | 3,140,253 | | | | (2,253 | ) |
Credit Suisse First Boston | | | | | | | | | | | | | 5,527,000 | | | | 5,558,961 | | | | (31,961 | ) |
Credit Suisse First Boston | | | | | | | | | | | | | 1,900,000 | | | | 1,893,765 | | | | 6,235 | |
Credit Suisse First Boston | | | | | | | | | | | | | 3,122,000 | | | | 3,112,346 | | | | 9,654 | |
Credit Suisse First Boston | | | | | | | | | | | | | 8,758,000 | | | | 8,697,101 | | | | 60,899 | |
Credit Suisse First Boston | | | | | | | | | | | | | 7,644,000 | | | | 7,562,312 | | | | 81,688 | |
Credit Suisse First Boston | | | | | | | | | | | | | 2,020,659 | | | | 1,976,421 | | | | 44,238 | |
Credit Suisse First Boston | | | | | | | | | | | | | 3,059,000 | | | | 3,077,239 | | | | (18,239 | ) |
Credit Suisse First Boston | | | | | | | | | | | | | 24,761,055 | | | | 24,806,945 | | | | (45,890 | ) |
Credit Suisse First Boston | | | | | | | | | | | | | 4,071,986 | | | | 4,256,734 | | | | (184,748 | ) |
Credit Suisse First Boston | | | | | | | | | | | | | 3,497,160 | | | | 3,489,777 | | | | 7,383 | |
Credit Suisse First Boston | | | | | | | | | | | | | 1,932,939 | | | | 1,833,484 | | | | 99,455 | |
| | | | | | | | | | | | | 20,649,578 | | | | 20,628,569 | | | | 21,009 | |
| | | | | | | | | | | | | 5,874,000 | | | | 5,847,516 | | | | 26,484 | |
| | | | | | | | | | | | | 10,223 | | | | 10,121 | | | | 102 | |
| | | | | | | | | | | | | 1,390,000 | | | | 1,413,091 | | | | (23,091 | ) |
| | | | | | | | | | | | | 5,780,000 | | | | 5,674,977 | | | | 105,023 | |
| | | | | | | | | | | | | 4,558,000 | | | | 4,617,266 | | | | (59,266 | ) |
| | | | | | | | | | | | | 7,572,000 | | | | 7,550,879 | | | | 21,121 | |
| | | | | | | | | | | | | 3,685,371 | | | | 3,714,795 | | | | (29,424 | ) |
| | | | | | | | | | | | | 10,224,000 | | | | 10,191,860 | | | | 32,140 | |
| | | | | | | | | | | | | 7,266,000 | | | | 7,267,477 | | | | (1,477 | ) |
| | | | | | | | | | | | | 12,628 | | | | 12,447 | | | | 181 | |
| | | | | | | | | | | | | 5,268,000 | | | | 5,305,633 | | | | (37,633 | ) |
| | | | | | | | | | | | | 15,888,000 | | | | 15,835,379 | | | | 52,621 | |
| | | | | | | | | | | | | 2,680,000 | | | | 2,699,751 | | | | (19,751 | ) |
| | | | | | | | | | | | | 3,044,000 | | | | 3,053,979 | | | | (9,979 | ) |
| | | | | | | | | | | | | 3,362,000 | | | | 3,362,810 | | | | (810 | ) |
| | | | | | | | | | | | | 8,678,000 | | | | 8,878,777 | | | | (200,777 | ) |
| | | | | | | | | | | | | 4,773,262 | | | | 4,927,755 | | | | (154,493 | ) |
| | | | | | | | | | | | | 37,265,059 | | | | 38,548,573 | | | | (1,283,514 | ) |
| | | | | | | | | | | | | 1,557,000 | | | | 1,543,855 | | | | 13,145 | |
| | | | | | | | | | | | | 3,732,000 | | | | 3,707,128 | | | | 24,872 | |
| | | | | | | | | | | | | 5,664,995 | | | | 5,387,048 | | | | 277,947 | |
| | | | | | | | | | | | | 4,453,104 | | | | 4,495,361 | | | | (42,257 | ) |
| | | | | | | | | | | | | 2,780,000 | | | | 2,824,592 | | | | (44,592 | ) |
| | | | | | | | | | | | | 4,723,911 | | | | 4,652,324 | | | | 71,587 | |
| | | | | | | | | | | | | 15,026,000 | | | | 14,742,587 | | | | 283,413 | |
See Accompanying Notes to Financial Statements
75
SUMMARY PORTFOLIO OF INVESTMENTS
AS OF OCTOBER 31, 2012 (CONTINUED)
ING GLOBAL BOND FUND
Counterparty
| | | | Currency
| | Contract Amount
| | Buy/Sell
| | Settlement
Date
| | In Exchange For
| | Fair Value
| | Unrealized
Appreciation
(Depreciation)
|
|---|
| | | | | | | | | | | | $ | 11,467,000 | | | $ | 11,345,099 | | | $ | 121,901 | |
| | | | | | | | | | | | | 20,693,048 | | | | 20,664,182 | | | | 28,866 | |
| | | | | | | | | | | | | 14,232 | | | | 14,174 | | | | 58 | |
| | | | | | | | | | | | | 7,598,000 | | | | 7,612,560 | | | | (14,560 | ) |
| | | | | | | | | | | | | 11,398,000 | | | | 11,349,951 | | | | 48,049 | |
| | | | | | | | | | | | | 5,325,098 | | | | 5,283,534 | | | | 41,564 | |
| | | | | | | | | | | | | 194,000 | | | | 193,204 | | | | 796 | |
| | | | | | | | | | | | | 2,018,000 | | | | 1,990,504 | | | | 27,496 | |
| | | | | | | | | | | | | 11,271,112 | | | | 11,036,551 | | | | 234,561 | |
| | | | | | | | | | | | | 4,971,000 | | | | 4,872,355 | | | | 98,645 | |
| | | | | | | | | | | | | 1,390,000 | | | | 1,419,042 | | | | (29,042 | ) |
| | | | | | | | | | | | | 2,460,000 | | | | 2,494,972 | | | | (34,972 | ) |
| | | | | | | | | | | | | 3,241,026 | | | | 3,236,407 | | | | 4,619 | |
| | | | | | | | | | | | | 2,529,000 | | | | 2,571,496 | | | | (42,496 | ) |
| | | | | | | | | | | | | 36,246 | | | | 35,570 | | | | 676 | |
| | | | | | | | | | | | | 14,733,655 | | | | 14,587,149 | | | | 146,506 | |
| | | | | | | | | | | | | 11,213,756 | | | | 11,243,822 | | | | (30,066 | ) |
| | | | | | | | | | | | | 7,265,449 | | | | 7,317,568 | | | | (52,119 | ) |
| | | | | | | | | | | | | 14,095,000 | | | | 13,933,818 | | | | 161,182 | |
| | | | | | | | | | | | | 7,246,000 | | | | 7,047,085 | | | | 198,915 | |
| | | | | | | | | | | | | 3,273,000 | | | | 3,268,655 | | | | 4,345 | |
| | | | | | | | | | | | | 3,526,000 | | | | 3,437,073 | | | | 88,927 | |
| | | | | | | | | | | | | 2,359,000 | | | | 2,378,028 | | | | (19,028 | ) |
| | | | | | | | | | | | | 602,000 | | | | 589,409 | | | | 12,591 | |
| | | | | | | | | | | | | 22,097,995 | | | | 22,667,608 | | | | (569,613 | ) |
| | | | | | | | | | | | | 3,582,000 | | | | 3,671,416 | | | | (89,416 | ) |
| | | | | | | | | | | | | 5,580,000 | | | | 5,584,697 | | | | (4,697 | ) |
| | | | | | | | | | | | | 15,576,000 | | | | 15,646,376 | | | | (70,376 | ) |
| | | | | | | | | | | | | 15,019 | | | | 15,405 | | | | (386 | ) |
| | | | | | | | | | | | | 11,165 | | | | 11,296 | | | | (131 | ) |
| | | | | | | | | | | | | 11,269,000 | | | | 11,275,637 | | | | (6,637 | ) |
| | | | | | | | | | | | | 14,764,000 | | | | 14,601,314 | | | | 162,686 | |
| | | | | | | | | | | | | 2,281,000 | | | | 2,286,913 | | | | (5,913 | ) |
| | | | | | | | | | | | | 7,512,000 | | | | 7,285,361 | | | | 226,639 | |
| | | | | | | | | | | | | 5,587,000 | | | | 5,464,318 | | | | 122,682 | |
| | | | | | | | | | | | | 2,321,000 | | | | 2,350,727 | | | | (29,727 | ) |
| | | | | | | | | | | | | 2,425,000 | | | | 2,445,147 | | | | (20,147 | ) |
| | | | | | | | | | | | | 4,691,000 | | | | 4,709,951 | | | | (18,951 | ) |
| | | | | | | | | | | | | 14,564,000 | | | | 14,570,673 | | | | (6,673 | ) |
| | | | | | | | | | | | | 7,644,000 | | | | 7,561,488 | | | | 82,512 | |
| | | | | | | | | | | | | 6,819,000 | | | | 6,728,607 | | | | 90,393 | |
| | | | | | | | | | | | | 3,119,000 | | | | 3,206,913 | | | | (87,913 | ) |
| | | | | | | | | | | | | 3,539,000 | | | | 3,497,437 | | | | 41,563 | |
| | | | | | | | | | | | | 2,629,000 | | | | 2,640,387 | | | | (11,387 | ) |
| | | | | | | | | | | | | 1,413,000 | | | | 1,427,143 | | | | (14,143 | ) |
| | | | | | | | | | | | | 2,944,000 | | | | 2,962,610 | | | | (18,610 | ) |
| | | | | | | | | | | | | 13,519,000 | | | | 13,969,446 | | | | (450,446 | ) |
| | | | | | | | | | | | | | | | | | | | $ | (44,876 | ) |
See Accompanying Notes to Financial Statements
76
SUMMARY PORTFOLIO OF INVESTMENTS
AS OF OCTOBER 31, 2012 (CONTINUED)
ING GLOBAL BOND FUND
ING Global Bond Fund Open Futures Contracts on October 31, 2012:
Contract Description
| | | | Number
of Contracts
| | Expiration
Date
| | Notional
Value
| | Unrealized
Appreciation/
(Depreciation)
|
|---|
| | | | | | | | | | | | | | | | | | |
30-year German Government Bond | | | | | 53 | | | | 12/06/12 | | | $ | 9,077,432 | | | $ | 189,064 | |
| | | | | 20 | | | | 12/17/12 | | | | 2,601,584 | | | | 13,136 | |
| | | | | 108 | | | | 12/17/12 | | | | 12,328,082 | | | | 1,338 | |
| | | | | 32 | | | | 12/18/12 | | | | 4,391,730 | | | | 22,393 | |
| | | | | 118 | | | | 12/06/12 | | | | 19,245,049 | | | | 116,090 | |
| | | | | 434 | | | | 12/06/12 | | | | 62,271,620 | | | | 54,254 | |
| | | | | 185 | | | | 12/27/12 | | | | 35,568,770 | | | | (340,058 | ) |
| | | | | 6 | | | | 12/27/12 | | | | 1,010,764 | | | | (93 | ) |
U.S. Treasury 5-Year Note | | | | | 56 | | | | 12/31/12 | | | | 6,958,000 | | | | (10,202 | ) |
| | | | | | | | | | | | $ | 153,453,031 | | | $ | 45,922 | |
| | | | | | | | | | | | | | | | | | |
| | | | | (159 | ) | | | 12/06/12 | | | | (29,198,362 | ) | | | (43,876 | ) |
| | | | | (121 | ) | | | 12/27/12 | | | | (22,264,141 | ) | | | 19,426 | |
U.S. Treasury 10-Year Note | | | | | (192 | ) | | | 12/19/12 | | | | (25,542,000 | ) | | | (144,480 | ) |
U.S. Treasury 2-Year Note | | | | | (78 | ) | | | 12/31/12 | | | | (17,185,593 | ) | | | 9,555 | |
| | | | | (118 | ) | | | 12/19/12 | | | | (17,618,875 | ) | | | (93,670 | ) |
U.S. Treasury Ultra Long Bond | | | | | (98 | ) | | | 12/19/12 | | | | (16,179,188 | ) | | | 66,310 | |
| | | | | | | | | | | | $ | (127,988,159 | ) | | $ | (186,735 | ) |
ING Global Bond Fund Over-the-Counter Credit Default Swap Agreements Outstanding on October 31, 2012:
Credit Default Swaps on Corporate and Sovereign Issues — Buy Protection(1)
Counterparty
| | | | Reference
Entity/Obligation
| | Buy/Sell
Protection
| | (Pay)/
Receive
Fixed
Rate (%)
| | Termination
Date
| | Notional
Amount(2)
| | Fair
Value(3)
| | Upfront
Payments
Paid/
(Received)
| | Unrealized
Appreciation/
(Depreciation)
|
|---|
| | | | Bolivarian Republic of Venezuela | | | | | | | | | USD 1,888,000 | | | $ | 205,851 | | | $ | 205,465 | | | $ | 386 | |
| | | | | | | | | | | | | | | | $ | 205,851 | | | $ | 205,465 | | | $ | 386 | |
| (1) | | If a Fund is a buyer of protection and a credit event occurs, as defined under the terms of that particular swap agreement, a Fund will either i) receive from the seller of protection an amount equal to the notional amount of the swap and deliver the referenced obligation, other deliverable obligations or underlying securities comprising the referenced index or ii) receive a net settlement amount in the form of cash or securities equal to the notional amount of the swap less the recovery value of the referenced obligation or underlying securities comprising the referenced index. |
| (2) | | The maximum amount of future payments (undiscounted) that a Fund as seller of protection could be required to make or receive as a buyer of credit protection under a credit default swap agreement would be an amount equal to the notional amount of the agreement. |
| (3) | | The fair values for credit default swap agreements serve as an indicator of the current status of the payment/performance risk and represent the likelihood or risk of default for the credit derivative. Increasing fair values, in absolute terms, when compared to the notional amount of the agreement, represent a deterioration of the referenced obligation’s credit soundness and a greater likelihood or risk of default or other credit event occurring. |
ING Global Bond Fund Over-the-Counter Interest Rate Swap Agreements Outstanding on October 31, 2012:
| | | | Termination
Date
| | Notional
Amount
| | Fair
Value
| | Upfront
Payments
Paid/
(Received)
| | Unrealized
Appreciation/
(Depreciation)
|
|---|
Receive a floating rate based on the Brazil Cetip Interbank Deposit Rate Annualized and pay a fixed rate equal to 10.360% Counterparty: Bank of America | | | | | | | | | | $ | — | | | $ | (2,550,681 | ) |
| |
Receive a floating rate based on the Brazil Cetip Interbank Deposit Rate Annualized and pay a fixed rate equal to 10.365% Counterparty: Deutsche Bank AG | | | | | | | | | | | — | | | | (1,430,431 | ) |
See Accompanying Notes to Financial Statements
77
SUMMARY PORTFOLIO OF INVESTMENTS
AS OF OCTOBER 31, 2012 (CONTINUED)
ING GLOBAL BOND FUND
| | | | Termination
Date
| | Notional
Amount
| | Fair
Value
| | Upfront
Payments
Paid/
(Received)
| | Unrealized
Appreciation/
(Depreciation)
|
|---|
Receive a floating rate based on the Brazil Cetip Interbank Deposit Rate Annualized and pay a fixed rate equal to 10.360% Counterparty: Morgan Stanley | | | | | | | | | | $ | — | | | $ | (1,457,532 | ) |
| |
Receive a fixed rate equal to 4.750% and pay a floating rate based on the 6-month CLP-CHIBNOM Counterparty: Bank of America | | | | | | | | | | | — | | | | (155,881 | ) |
| |
Receive a fixed rate equal to 4.790% and pay a floating rate based on the 6-month CLP-CHIBNOM Counterparty: Bank of America | | | | | | | | | | | — | | | | (131,278 | ) |
| |
Receive a fixed rate equal to 4.830% and pay a floating rate based on the 6-month CLP-CHIBNOM Counterparty: Bank of America | | | | | | | | | | | — | | | | (106,680 | ) |
| |
Receive a floating rate based on the 3-month KRW-CD-KSDA-Bloomberg and pay a fixed rate equal to 3.665% Counterparty: Bank of America | | | | | | | | | | | — | | | | (589,706 | ) |
| |
Receive a floating rate based on the 3-month KRW-CD-KSDA-Bloomberg and pay a fixed rate equal to 3.660% Counterparty: Credit Suisse Group AG | | | | | | | | | | | — | | | | (584,464 | ) |
| |
Receive a fixed rate equal to 4.755% and pay a floating rate based on the 28-day MXN-TIIE-BANXICO Counterparty: UBS Warburg LLC | | | | | | | | | | | — | | | | (227,119 | ) |
| |
Receive a floating rate based on the 28-day MXN-TIIE-BANXICO and pay a fixed rate equal to 6.305% Counterparty: UBS Warburg LLC | | | | | | | | | | | — | | | | (289,187 | ) |
| |
Receive a floating rate based on 6-month PLN-WIBOR-WIBO and pay a fixed rate equal to 5.095% Counterparty: Bank of America | | | | | | | | | | | — | | | | (535,505 | ) |
| |
Receive a floating rate based on the 6-month PLN-WIBOR-WIBO and pay a fixed rate equal to 4.800% Counterparty: Deutsche Bank AG | | | | | | | | | | | — | | | | (443,399 | ) |
| |
Receive a floating rate based on the 3-month USD-LIBOR-BBA and pay a fixed rate equal to 0.792% Counterparty: JPMorgan Chase & Co. | | | | | | | | | | | — | | | | 22,756 | |
| | | | | | | | | | $ | — | | | $ | (8,479,107 | ) |
ING Global Bond Fund Written OTC Options on October 31, 2012:
Notional
Amount
| | | | Counterparty
| | Description
| | Exercise
Price
| | Expiration
Date
| | Premiums
Received
| | Fair Value
|
|---|
|
| | | | | | EUR Put vs. USD Call Currency Option | | | | | 01/04/13 | | | $ | 675,864 | | | $ | (32,304 | ) |
| | | | | | MYR Put vs. USD Call Currency Option | | | | | 01/16/13 | | | | 75,716 | | | | (48,299 | ) |
| | | | | | ZAR Put vs. USD Call Currency Option | | | | | 11/30/12 | | | | 110,352 | | | | (14,829 | ) |
| | | | | | | | Total Written OTC Options | | $ | 861,932 | | | $ | (95,432 | ) |
| | | | | | | | | | | | | | | | | | | | | | | | |
ING Global Bond Fund Written Swaptions Open on October 31, 2012:
Written Interest Rate Swaptions
Description
| | | | Counterparty
| | Floating Rate
Index/Underlying
Reference Entity
| | Pay/
Receive
Floating
| | Exercise
Rate
| | Expiration
Date
| | Notional
Amount
| | Premiums
Received
| | Fair
Value
|
|---|
| | | | | | | | | | | | | | | | $ | 148,435 | | | $ | (122,372 | ) |
| | | | | | | | | | | | Total Written Swaptions | | $ | 148,435 | | | $ | (122,372 | ) |
| | | | | | | | | | | | | | | | | | | | | | | | | | | | | | | | |
See Accompanying Notes to Financial Statements
78
SUMMARY PORTFOLIO OF INVESTMENTS
AS OF OCTOBER 31, 2012 (CONTINUED)
ING GLOBAL BOND FUND
A summary of derivative instruments by primary risk exposure is outlined in the following tables.
The fair value of derivative instruments as of October 31, 2012 was as follows:
Derivatives not accounted for as
hedging instruments
| | | | Location on Statement
of Assets and Liabilities
| | Fair Value
|
|---|
| | | | | | | | | | |
Foreign exchange contracts | | | | Investments in securities at value* | | $ | 750,946 | |
| | | | Investments in securities at value* | | | 2,697,642 | |
Foreign exchange contracts | | | | Unrealized appreciation on forward foreign currency contracts | | | 15,056,820 | |
| | | | Upfront payments paid on OTC swap agreements | | | 205,465 | |
| | | | Unrealized appreciation on OTC swap agreements | | | 386 | |
| | | | Unrealized appreciation on OTC swap agreements | | | 22,756 | |
| | | | Net Assets — Unrealized appreciation** | | | 491,566 | |
| | | | | | $ | 19,225,581 | |
| | | | | | | | | | |
Foreign exchange contracts | | | | Unrealized depreciation on forward foreign currency contracts | | $ | 11,560,519 | |
| | | | Unrealized depreciation on OTC swap agreements | | | 8,501,863 | |
| | | | Net Assets — Unrealized depreciation** | | | 632,379 | |
Foreign exchange contracts | | | | Written options, at fair value | | | 95,432 | |
| | | | Written options, at fair value | | | 122,372 | |
Total Liability Derivatives | | | | | | $ | 20,912,565 | |
| * | | Includes purchased options. |
| ** | | Includes cumulative appreciation/depreciation of futures contracts as reported in the table following the Summary Portfolio of Investments. |
The effect of derivative instruments on the Fund’s Statement of Operations for the year ended October 31, 2012 was as follows:
| | | | Amount of Realized Gain or (Loss) on Derivatives Recognized in Income
| |
|---|
Derivatives not accounted for as
hedging instruments
| | | | Investments*
| | Foreign currency
related transactions**
| | Futures
| | Swaps
| | Written options
| | Total
|
|---|
| | | | $ | (1,189,765 | ) | | $ | — | | | $ | — | | | $ | (665,786 | ) | | $ | 312,772 | | | $ | (1,542,779 | ) |
Foreign exchange contracts | | | | | (3,850,767 | ) | | | (15,411,683 | ) | | | — | | | | — | | | | 2,372,839 | | | | (16,889,611 | ) |
| | | | | (454,350 | ) | | | — | | | | 8,405,748 | | | | (19,843,603 | ) | | | 464,916 | | | | (11,427,289 | ) |
| | | | $ | (5,494,882 | ) | | $ | (15,411,683 | ) | | $ | 8,405,748 | | | $ | (20,509,389 | ) | | $ | 3,150,527 | | | $ | (29,859,679 | ) |
| |
| | | | Change in Unrealized Appreciation or (Depreciation)
on Derivatives Recognized in Income
| |
|---|
Derivatives not accounted for as
hedging instruments
| | | | Investments*
| | Foreign currency
related transactions**
| | Futures
| | Swaps
| | Written options
| | Total
|
|---|
| | | | $ | — | | | $ | — | | | $ | — | | | $ | 386 | | | $ | — | | | $ | 386 | |
Foreign exchange contracts | | | | | (115,251 | ) | | | 4,007,706 | | | | — | | | | — | | | | 495,341 | | | | 4,387,796 | |
| | | | | (102,851 | ) | | | — | | | | (743,452 | ) | | | 1,813,502 | | | | 26,063 | | | | 993,262 | |
| | | | $ | (218,102 | ) | | $ | 4,007,706 | | | $ | (743,452 | ) | | $ | 1,813,888 | | | $ | 521,404 | | | $ | 5,381,444 | |
| * | | Amounts recognized for purchased options are included in net realized gain (loss) on investments and net change in unrealized appreciation or depreciation on investments. |
| ** | | Amounts recognized for forward foreign currency contracts are included in net realized gain (loss) on foreign currency related transactions and net change in unrealized appreciation or depreciation on foreign currency related transactions. |
See Accompanying Notes to Financial Statements
79
SUMMARY PORTFOLIO OF INVESTMENTS
AS OF OCTOBER 31, 2012
ING GLOBAL VALUE CHOICE FUND
Shares
|
|
|
|
|
|
|
| Value
|
| Percentage
of Net
Assets
|
|---|
| |
|
| |
| | | | | | | | $ | 3,494,397 | | | | 2.0 | |
| | | | | | | | | | | | | | |
| |
| | | | | | Centrais Eletricas Brasileiras SA ADR | | | 3,337,392 | | | | 1.9 | |
| | | | | | | | | 3,136,888 | | | | 1.7 | |
| | | | | | | | | 6,474,280 | | | | 3.6 | |
| | | | | | | | | | | | | | |
| |
| | | | | | | | | 6,075,000 | | | | 3.4 | |
| | | | | | | | | 5,713,088 | | | | 3.2 | |
| | | | | | | | | 3,386,610 | | | | 1.9 | |
| | | | | | Turquoise Hill Resources Ltd. | | | 1,921,215 | | | | 1.1 | |
| | | | | | Uranium Participation Corp. | | | 1,816,320 | | | | 1.0 | |
| | | | | | | | | 5,037,716 | | | | 2.9 | |
| | | | | | | | | 23,949,949 | | | | 13.5 | |
| | | | | | | | | | | | | | |
| |
| | | | | | | | | 71,298 | | | | 0.0 | |
| | | | | | | | | | | | | | |
| |
| | | | | | | | | 1,843,554 | | | | 1.0 | |
| | | | | | | | | 1,719,133 | | | | 1.0 | |
| | | | | | | | | 3,562,687 | | | | 2.0 | |
| | | | | | | | | | | | | | |
| |
| | | | | | | | | 1,748,261 | | | | 1.0 | |
| | | | | | | | | 2,794,215 | | | | 1.6 | |
| | | | | | | | | 7,046,643 | | | | 4.0 | |
| | | | | | | | | 2,618,951 | | | | 1.5 | |
| | | | | | | | | 1,702,827 | | | | 0.9 | |
| | | | | | | | | 1,604,340 | | | | 0.9 | |
| | | | | | | | | 17,515,237 | | | | 9.9 | |
| | | | | | | | | | | | | | |
| |
| | | | | | | | | 830,912 | | | | 0.5 | |
| | | | | | | | | | | | | | |
| |
| | | | | | | | | 1,382,217 | | | | 0.8 | |
| | | | | | | | | | | | | | |
| |
| | | | | | | | | 877,197 | | | | 0.5 | |
| | | | | | | | | | | | | | |
| |
| | | | | | | | | 797,126 | | | | 0.4 | |
| | | | | | | | | | | | | | |
| |
| | | | | | | | | 1,560,212 | | | | 0.9 | |
| | | | | | | | | | | | | | |
| |
| | | | | | | | | 3,459,339 | | | | 1.9 | |
| | | | | | Telecom Italia S.p.A. RNC | | | 1,727,244 | | | | 1.0 | |
| | | | | | | | | 931,375 | | | | 0.5 | |
| | | | | | | | | 6,117,958 | | | | 3.4 | |
| | | | | | | | | | | | | | |
| |
| | | | | | Sumitomo Mitsui Trust Holdings, Inc. | | | 2,198,866 | | | | 1.3 | |
| | | | | | | | | 2,546,423 | | | | 1.4 | |
| |
COMMON STOCK: (continued) |
| |
| | | | | | | | $ | 2,880,919 | | | | 1.6 | |
| | | | | | | | | 1,874,664 | | | | 1.1 | |
| | | | | | Mitsui Sumitomo Insurance Group Holdings, Inc. | | | 1,877,339 | | | | 1.1 | |
| | | | | | Nippon Telegraph & Telephone Corp. | | | 3,402,173 | | | | 1.9 | |
| | | | | | | | | 5,740,312 | | | | 3.2 | |
| | | | | | | | | 20,520,696 | | | | 11.6 | |
| | | | | | | | | | | | | | |
| |
| | | | | | | | | 867,000 | | | | 0.5 | |
| | | | | | | | | | | | | | |
| |
| | | | | | | | | 1,314,238 | | | | 0.7 | |
| | | | | | | | | | | | | | |
| |
| | | | | | | | | 3,529,764 | | | | 2.0 | |
| | | | | | Federal Hydrogenerating Co. JSC ADR | | | 3,721,216 | | | | 2.1 | |
| | | | | | | | | 888,884 | | | | 0.5 | |
| | | | | | | | | 8,139,864 | | | | 4.6 | |
| | | | | | | | | | | | | | |
| |
| | | | | | AngloGold Ashanti Ltd ADR | | | 2,772,768 | | | | 1.6 | |
| | | | | | Impala Platinum Holdings Ltd. | | | 3,362,484 | | | | 1.9 | |
| | | | | | | | | 457,290 | | | | 0.2 | |
| | | | | | | | | 6,592,542 | | | | 3.7 | |
| | | | | | | | | | | | | | |
| |
| | | | | | Korea Electric Power Corp. ADR | | | 1,768,508 | | | | 1.0 | |
| | | | | | | | | 2,195,025 | | | | 1.2 | |
| | | | | | | | | 2,094,420 | | | | 1.2 | |
| | | | | | | | | 6,057,953 | | | | 3.4 | |
| | | | | | | | | | | | | | |
| |
| | | | | | | | | 1,741,164 | | | | 1.0 | |
| | | | | | | | | 678,381 | | | | 0.4 | |
| | | | | | | | | 2,419,545 | | | | 1.4 | |
| | | | | | | | | | | | | | |
| |
| | | | | | Polyus Gold International Ltd. | | | 3,847,612 | | | | 2.2 | |
| | | | | | | | | 2,751,206 | | | | 1.5 | |
| | | | | | | | | 468,290 | | | | 0.3 | |
| | | | | | | | | 7,067,108 | | | | 4.0 | |
| | | | | | | | | | | | | | |
| |
| | | | | | American International Group, Inc. | | | 3,573,339 | | | | 2.0 | |
| | | | | | Alliant Techsystems, Inc. | | | 1,919,215 | | | | 1.1 | |
| | | | | | | | | 3,128,280 | | | | 1.8 | |
| | | | | | Archer-Daniels-Midland Co. | | | 2,576,640 | | | | 1.4 | |
| | | | | | | | | 3,294,486 | | | | 1.9 | |
| | | | | | | | | 2,826,270 | | | | 1.6 | |
See Accompanying Notes to Financial Statements
80
SUMMARY PORTFOLIO OF INVESTMENTS
AS OF OCTOBER 31, 2012 (CONTINUED)
ING GLOBAL VALUE CHOICE FUND
Shares
|
|
|
|
|
|
|
| Value
|
| Percentage
of Net
Assets
|
|---|
| |
COMMON STOCK: (continued) |
| United States: (continued) |
| | | | | | | | $ | 1,695,146 | | | | 1.0 | |
| | | | | | | | | 1,738,695 | | | | 1.0 | |
| | | | | | | | | 1,687,680 | | | | 0.9 | |
| | | | | | | | | 2,701,390 | | | | 1.5 | |
| | | | | | | | | 1,897,038 | | | | 1.1 | |
| | | | | | | | | 2,648,100 | | | | 1.5 | |
| | | | | | | | | 2,782,050 | | | | 1.6 | |
| | | | | | | | | 1,785,280 | | | | 1.0 | |
| | | | | | Old Republic International Corp. | | | 2,006,628 | | | | 1.1 | |
| | | | | | | | | 1,829,542 | | | | 1.0 | |
| | | | | | | | | 3,686,760 | | | | 2.1 | |
| | | | | | | | | 1,886,082 | | | | 1.1 | |
| | | | | | | | | 2,224,950 | | | | 1.2 | |
| | | | | | | | | 4,651,501 | | | | 2.6 | |
| | | | | | | | | 50,539,072 | | | | 28.5 | |
| | | | | | | | | | | | | | |
| | | | | | | | | 170,151,488 | | | | 95.9 | |
| |
|
| |
| | | | | | | | | 1,086,240 | | | | 0.6 | |
| | | | | | | | | | | | | | |
| | | | | | | | | 1,086,240 | | | | 0.6 | |
| | | | | | Total Long-Term Investments | | | | | | | | |
| | | | | | | | | 171,237,728 | | | | 96.5 | |
| |
Principal
Amount†
|
|
|
|
|
|
|
| Value
|
| Percentage
of Net
Assets
|
|---|
| |
SHORT-TERM INVESTMENTS: 8.6% |
| Securities Lending Collateralcc(1): 4.7% |
| | | | | | Barclays Bank PLC, Repurchase Agreement dated 10/31/12, 0.25%, due 11/01/12 (Repurchase Amount $1,973,805, collateralized by various U.S. Government Agency Obligations, 2.185%–7.000%, Market Value plus accrued interest $2,013,267, due 10/01/20–12/01/47) | | | 1,973,791 | | | | 1.1 | |
| | | | | | Citigroup, Inc., Repurchase Agreement dated 10/31/12, 0.32%, due 11/01/12 (Repurchase Amount $1,973,808, collateralized by various U.S. Government and U.S. Government Agency Obligations, 0.000%– 11.000%, Market Value plus accrued interest $2,013,267, due 11/15/12–09/20/62) | | | 1,973,791 | | | | 1.1 | |
| |
SHORT-TERM INVESTMENTS: (continued) |
| Securities Lending Collateralcc(1): (continued) |
| | | | | | Deutsche Bank AG, Repurchase Agreement dated 10/31/12, 0.35%, due 11/01/12 (Repurchase Amount $1,973,810, collateralized by various U.S. Government Securities, 0.000%– 2.125%, Market Value plus accrued interest $2,013,267, due 07/15/15–02/15/41) | | $ | 1,973,791 | | | | 1.1 | |
| | | | | | Merrill Lynch & Co., Inc., Repurchase Agreement dated 10/31/12, 0.33%, due 11/01/12 (Repurchase Amount $1,973,809, collateralized by various U.S. Government Agency Obligations, 3.000%–4.500%, Market Value plus accrued interest $2,013,267, due 01/01/27–10/20/42) | | | 1,973,791 | | | | 1.1 | |
| | | | | | Royal Bank of Canada, Repurchase Agreement dated 10/31/12, 0.22%, due 11/01/12 (Repurchase Amount $415,535, collateralized by various U.S. Government Securities, 0.000%– 5.250%, Market Value plus accrued interest $423,843, due 02/15/13–11/15/28) | | | 415,532 | | | | 0.3 | |
| | | | | | | | | 8,310,696 | | | | 4.7 | |
| |
Shares
|
|
|
|
|
|
|
| Value
|
| Percentage
of Net
Assets
|
|---|
| |
| | | | | | BlackRock Liquidity Funds, TempFund, Institutional Class
(Cost $7,015,892) | | | 7,015,892 | | | | 3.9 | |
| | | | | | Total Short-Term Investments | | | | | | | | |
| | | | | | | | | 15,326,588 | | | | 8.6 | |
| | | | | | Total Investments in Securities (Cost $211,014,289) | | $ | 186,564,316 | | | | 105.1 | |
| | | | | | Liabilities in Excess of Other Assets | | | (8,982,660 | ) | | | (5.1 | ) |
| | | | | | | | $ | 177,581,656 | | | | 100.0 | |
See Accompanying Notes to Financial Statements
81
SUMMARY PORTFOLIO OF INVESTMENTS
AS OF OCTOBER 31, 2012 (CONTINUED)
ING GLOBAL VALUE CHOICE FUND
“Other Securities” represents issues not identified as the top 50 holdings in terms of market value and issues or issuers not exceeding 1% of net assets individually or in aggregate respectively as of October 31, 2012.
The following footnotes apply to either the individual securities noted or one or more of the securities aggregated and listed as a single line item.
| † | | Unless otherwise indicated, principal amount is shown in USD. |
| # | | Securities with purchases pursuant to Rule 144A or section 4(2), under the Securities Act of 1933 and may not be resold subject to that rule except to qualified institutional buyers. |
| @ | | Non-income producing security |
| ADR | | American Depositary Receipt |
| GDR | | Global Depositary Receipt |
| cc | | Securities purchased with cash collateral for securities loaned. |
| L | | Loaned security, a portion or all of the security is on loan at October 31, 2012. |
| (1) | | Collateral received from brokers for securities lending was invested into these short-term investments. |
| (a) | | This grouping contains securities on loan. |
| | | Cost for federal income tax purposes is $213,730,566. |
Net unrealized depreciation consists of: | | | | | | |
Gross Unrealized Appreciation | | | | $ | 14,020,673 | |
Gross Unrealized Depreciation | | | | | (41,186,923 | ) |
Net Unrealized Depreciation | | | | $ | (27,166,250 | ) |
Sector Diversification
| | | | Percentage
of Net Assets
|
|---|
| | | | | 18.1 | % |
| | | | | 16.7 | |
| | | | | 13.3 | |
| | | | | 11.0 | |
| | | | | 9.9 | |
Telecommunication Services | | | | | 8.2 | |
| | | | | 7.0 | |
| | | | | 4.6 | |
| | | | | 4.3 | |
| | | | | 3.4 | |
| | | | | 8.6 | |
Liabilities in Excess of Other Assets | | | | | (5.1 | ) |
| | | | | 100.0 | % |
Fair Value Measurementsˆ
The following is a summary of the fair valuations according to the inputs used as of October 31, 2012 in valuing the assets and liabilities:(1)
| | | | Quoted Prices
in Active Markets
for Identical
Investments
(Level 1)
| | Significant
Other
Observable
Inputs#
(Level 2)
| | Significant
Unobservable
Inputs
(Level 3)
| | Fair Value
at
10/31/2012
|
|---|
| | | | | | | | | | | | | | | | | | |
Investments, at fair value | | | | | | | | | | | | | | | | | | |
| | | | | | | | | | | | | | | | | | |
| | | | $ | — | | | $ | 3,494,397 | | | $ | — | | | $ | 3,494,397 | |
| | | | | 6,474,280 | | | | — | | | | — | | | | 6,474,280 | |
| | | | | 23,949,949 | | | | — | | | | — | | | | 23,949,949 | |
| | | | | — | | | | — | | | | 71,298 | | | | 71,298 | |
| | | | | 2,679,462 | | | | 883,225 | | | | — | | | | 3,562,687 | |
| | | | | 1,604,340 | | | | 15,910,897 | | | | — | | | | 17,515,237 | |
| | | | | — | | | | 830,912 | | | | — | | | | 830,912 | |
| | | | | — | | | | 1,382,217 | | | | — | | | | 1,382,217 | |
| | | | | — | | | | 877,197 | | | | — | | | | 877,197 | |
| | | | | — | | | | 797,126 | | | | — | | | | 797,126 | |
| | | | | 1,560,212 | | | | — | | | | — | | | | 1,560,212 | |
| | | | | — | | | | 6,117,958 | | | | — | | | | 6,117,958 | |
| | | | | — | | | | 20,520,696 | | | | — | | | | 20,520,696 | |
| | | | | 867,000 | | | | — | | | | — | | | | 867,000 | |
| | | | | — | | | | 1,314,238 | | | | — | | | | 1,314,238 | |
| | | | | 4,418,648 | | | | 3,721,216 | | | | — | | | | 8,139,864 | |
| | | | | 3,230,058 | | | | 3,362,484 | | | | — | | | | 6,592,542 | |
| | | | | 6,057,953 | | | | — | | | | — | | | | 6,057,953 | |
| | | | | 1,741,164 | | | | 678,381 | | | | — | | | | 2,419,545 | |
| | | | | 6,598,818 | | | | 468,290 | | | | — | | | | 7,067,108 | |
| | | | | 50,539,072 | | | | — | | | | — | | | | 50,539,072 | |
| | | | | 109,720,956 | | | | 60,359,234 | | | | 71,298 | | | | 170,151,488 | |
| | | | | — | | | | 1,086,240 | | | | — | | | | 1,086,240 | |
| | | | | 7,015,892 | | | | 8,310,696 | | | | — | | | | 15,326,588 | |
Total Investments, at fair value | | | | $ | 116,736,848 | | | $ | 69,756,170 | | | $ | 71,298 | | | $ | 186,564,316 | |
| (1) | | For the year ended October 31, 2012, as a result of the fair value pricing procedures for international equities utilized by the Fund, certain securities have transferred in and out of Level 1 and Level 2 measurements during the year. The Fund’s policy is to recognize transfers between levels at the end of the reporting period. At October 31, 2012, securities valued at $2,440,184 and $20,658,343 were transferred from Level 1 to Level 2 and Level 2 and Level 1, respectively, within the fair value hierarchy. |
See Accompanying Notes to Financial Statements
82
SUMMARY PORTFOLIO OF INVESTMENTS
AS OF OCTOBER 31, 2012 (CONTINUED)
ING GLOBAL VALUE CHOICE FUND
| ˆ | | See Note 2, “Significant Accounting Policies” in the Notes to Financial Statements for additional information. |
| # | | The earlier close of the foreign markets gives rise to the possibility that significant events, including broad market moves, may have occurred in the interim and may materially affect the value of those securities. To account for this, the Fund may frequently value many of its foreign equity securities using fair value prices based on third party vendor modeling tools to the extent available. Accordingly, a portion of the Fund’s investments are categorized as Level 2 investments. |
There were no transfers in or out of Levels 1, 2 or 3 of the fair value hierarchy during the year ended October 31, 2012.
See Accompanying Notes to Financial Statements
83
ING INDEX PLUS INTERNATIONAL
EQUITY FUND
SUMMARY PORTFOLIO OF INVESTMENTS
AS OF OCTOBER 31, 2012
Shares
|
|
|
|
|
|
|
| Value
|
| Percentage
of Net
Assets
|
|---|
| |
|
| |
| | | | | | Australia & New Zealand Banking Group Ltd. | | $ | 357,178 | | | | 0.6 | |
| | | | | | | | | 612,305 | | | | 1.1 | |
| | | | | | Commonwealth Bank of Australia | | | 556,878 | | | | 1.0 | |
| | | | | | National Australia Bank Ltd. | | | 365,409 | | | | 0.6 | |
| | | | | | | | | 449,262 | | | | 0.8 | |
| | | | | | | | | 2,634,762 | | | | 4.7 | |
| | | | | | | | | 4,975,794 | | | | 8.8 | |
| | | | | | | | | | | | | | |
| |
| | | | | | | | | 93,260 | | | | 0.2 | |
| | | | | | | | | | | | | | |
| |
| | | | | | | | | 374,080 | | | | 0.7 | |
| | | | | | | | | 467,059 | | | | 0.8 | |
| | | | | | | | | 841,139 | | | | 1.5 | |
| | | | | | | | | | | | | | |
| |
| | | | | | | | | 51,768 | | | | 0.1 | |
| | | | | | | | | | | | | | |
| |
| | | | | | | | | 423,554 | | | | 0.7 | |
| | | | | | | | | 220,004 | | | | 0.4 | |
| | | | | | | | | 643,558 | | | | 1.1 | |
| | | | | | | | | | | | | | |
| |
| | | | | | | | | 680,388 | | | | 1.2 | |
| | | | | | | | | | | | | | |
| |
| | | | | | | | | 352,770 | | | | 0.6 | |
| | | | | | | | | 437,255 | | | | 0.8 | |
| | | | | | | | | 685,753 | | | | 1.2 | |
| | | | | | | | | 566,611 | | | | 1.0 | |
| | | | | | | | | 322,205 | | | | 0.6 | |
| | | | | | | | | 2,639,999 | | | | 4.7 | |
| | | | | | | | | 5,004,593 | | | | 8.9 | |
| | | | | | | | | | | | | | |
| |
| | | | | | | | | 644,521 | | | | 1.1 | |
| | | | | | | | | 277,534 | | | | 0.5 | |
| | | | | | | | | 326,651 | | | | 0.6 | |
| | | | | | | | | 280,201 | | | | 0.5 | |
| | | | | | | | | 276,304 | | | | 0.5 | |
| | | | | | | | | 2,355,700 | | | | 4.2 | |
| | | | | | | | | 4,160,911 | | | | 7.4 | |
| | | | | | | | | | | | | | |
| |
| | | | | | | | | 1,630,562 | | | | 2.9 | |
| | | | | | | | | | | | | | |
| |
| | | | | | | | | 305,284 | | | | 0.5 | |
| | | | | | | | | | | | | | |
| |
| | | | | | | | | 522,473 | | | | 0.9 | |
| | | | | | | | | | | | | | |
| |
| | | | | | | | | 438,745 | | | | 0.8 | |
| | | | | | Central Japan Railway Co. | | | 301,189 | | | | 0.5 | |
| |
COMMON STOCK: (continued) |
| |
| | | | | | Mizuho Financial Group, Inc. | | $ | 306,183 | | | | 0.5 | |
| | | | | | | | | 389,042 | | | | 0.7 | |
| | | | | | | | | 9,417,127 | | | | 16.7 | |
| | | | | | | | | 10,852,286 | | | | 19.2 | |
| | | | | | | | | | | | | | |
| |
| | | | | | | | | 294,912 | | | | 0.5 | |
| | | | | | | | | | | | | | |
| |
| | | | | | | | | 74,762 | | | | 0.1 | |
| | | | | | | | | | | | | | |
| |
| | | | | | Royal Dutch Shell PLC — Class A | | | 435,501 | | | | 0.8 | |
| | | | | | Royal Dutch Shell PLC — Class B | | | 569,324 | | | | 1.0 | |
| | | | | | Koninklijke Philips Electronics NV | | | 385,782 | | | | 0.7 | |
| | | | | | | | | 1,306,689 | | | | 2.3 | |
| | | | | | | | | 2,697,296 | | | | 4.8 | |
| | | | | | | | | | | | | | |
| |
| | | | | | | | | 88,986 | | | | 0.2 | |
| | | | | | | | | | | | | | |
| |
| | | | | | | | | 265,336 | | | | 0.5 | |
| | | | | | | | | 396,573 | | | | 0.7 | |
| | | | | | | | | 661,909 | | | | 1.2 | |
| | | | | | | | | | | | | | |
| |
| | | | | | | | | 170,965 | | | | 0.3 | |
| | | | | | | | | | | | | | |
| |
| | | | | | | | | 997,934 | | | | 1.8 | |
| | | | | | | | | | | | | | |
| |
| | | | | | | | | 278,179 | | | | 0.5 | |
| | | | | | | | | 272,086 | | | | 0.5 | |
| | | | | | | | | 1,303,932 | | | | 2.3 | |
| | | | | | | | | 1,854,197 | | | | 3.3 | |
| | | | | | | | | | | | | | |
| |
| | | | | | | | | 309,670 | | | | 0.6 | |
| | | | | | | | | 1,482,385 | | | | 2.6 | |
| | | | | | | | | 1,792,055 | | | | 3.2 | |
| | | | | | | | | | | | | | |
| |
| | | | | | | | | 927,627 | | | | 1.6 | |
| | | | | | | | | 684,532 | | | | 1.2 | |
| | | | | | Roche Holding AG —Genusschein | | | 760,099 | | | | 1.4 | |
| | | | | | | | | 313,081 | | | | 0.6 | |
| | | | | | | | | 489,117 | | | | 0.9 | |
| | | | | | Zurich Financial Services AG | | | 352,770 | | | | 0.6 | |
| | | | | | | | | 1,041,224 | | | | 1.8 | |
| | | | | | | | | 4,568,450 | | | | 8.1 | |
See Accompanying Notes to Financial Statements
84
ING INDEX PLUS INTERNATIONAL
EQUITY FUND
SUMMARY PORTFOLIO OF INVESTMENTS
AS OF OCTOBER 31, 2012 (CONTINUED)
Shares
|
|
|
|
|
|
|
| Value
|
| Percentage
of Net
Assets
|
|---|
| |
COMMON STOCK: (continued) |
| |
| | | | | | | | $ | 421,689 | | | | 0.8 | |
| | | | | | | | | 293,848 | | | | 0.5 | |
| | | | | | | | | 612,533 | | | | 1.1 | |
| | | | | | British American Tobacco PLC | | | 632,102 | | | | 1.1 | |
| | | | | | | | | 279,431 | | | | 0.5 | |
| | | | | | | | | 267,991 | | | | 0.5 | |
| | | | | | | | | 413,869 | | | | 0.7 | |
| | | | | | | | | 846,220 | | | | 1.5 | |
| | | | | | Imperial Tobacco Group PLC | | | 457,543 | | | | 0.8 | |
| | | | | | | | | 318,384 | | | | 0.6 | |
| | | | | | | | | 336,790 | | | | 0.6 | |
| | | | | | | | | 269,617 | | | | 0.5 | |
| | | | | | | | | 406,364 | | | | 0.7 | |
| | | | | | | | | 379,056 | | | | 0.7 | |
| | | | | | | | | 545,024 | | | | 1.0 | |
| | | | | | | | | 295,190 | | | | 0.5 | |
| | | | | | | | | 4,871,657 | | | | 8.6 | |
| | | | | | | | | 11,647,308 | | | | 20.7 | |
| | | | | | | | | | | | | | |
| | | | | | | | | 54,610,790 | | | | 96.9 | |
| |
|
| |
| | | | | | | | | 229,240 | | | | 0.4 | |
| | | | | | | | | | | | | | |
| | | | | | | | | 229,240 | | | | 0.4 | |
| |
|
| |
| | | | | | | | | 6,698 | | | | 0.0 | |
| | | | | | | | | | | | | | |
| | | | | | | | | 6,698 | | | | 0.0 | |
| | | | | | Total Long-Term Investments | | | | | | | | |
| | | | | | | | | 54,846,728 | | | | 97.3 | |
| |
SHORT-TERM INVESTMENTS: 2.4% |
| |
| | | | | | BlackRock Liquidity Funds, TempFund, Institutional Class (Cost $1,361,000) | | | 1,361,000 | | | | 2.4 | |
| | | | | | Total Short-Term Investments | | | | | | | | |
| | | | | | | | | 1,361,000 | | | | 2.4 | |
| | | | | | Total Investments in Securities (Cost $46,833,335) | | $ | 56,207,728 | | | | 99.7 | |
| | | | | | Assets in Excess of Other Liabilities | | | 174,845 | | | �� | 0.3 | |
| | | | | | | | $ | 56,382,573 | | | | 100.0 | |
“Other Securities” represents issues not identified as the top 50 holdings in terms of market value and issues or issuers not exceeding 1% of net assets individually or in aggregate respectively as of October 31, 2012.
The following footnotes apply to either the individual securities noted or one or more of the securities aggregated and listed as a single line item.
| | | Cost for federal income tax purposes is $48,923,757. |
Net unrealized appreciation consists of: | | | | | | |
Gross Unrealized Appreciation | | | | $ | 9,891,723 | |
Gross Unrealized Depreciation | | | | | (2,607,752 | ) |
Net Unrealized Appreciation | | | | $ | 7,283,971 | |
Sector Diversification
| | | | Percentage
of Net Assets
|
|---|
| | | | | 23.4 | % |
| | | | | 11.8 | |
| | | | | 11.7 | |
| | | | | 10.0 | |
| | | | | 9.7 | |
| | | | | 9.6 | |
| | | | | 7.9 | |
Telecommunication Services | | | | | 5.3 | |
| | | | | 4.1 | |
| | | | | 3.8 | |
| | | | | 2.4 | |
Assets in Excess of Other Liabilities | | | | | 0.3 | |
| | | | | 100.0 | % |
See Accompanying Notes to Financial Statements
85
ING INDEX PLUS INTERNATIONAL
EQUITY FUND
SUMMARY PORTFOLIO OF INVESTMENTS
AS OF OCTOBER 31, 2012 (CONTINUED)
Fair Value Measurementsˆ
The following is a summary of the fair valuations according to the inputs used as of October 31, 2012 in valuing the assets and liabilities:
| | | | Quoted Prices
in Active Markets
for Identical
Investments
(Level 1)
| | Significant
Other
Observable
Inputs#
(Level 2)
| | Significant
Unobservable
Inputs
(Level 3)
| | Fair Value
at
10/31/2012
|
|---|
| | | | | | | | | | | | | | | | | | |
Investments, at fair value | | | | | | | | | | | | | | | | | | |
| | | | | | | | | | | | | | | | | | |
| | | | $ | — | | | $ | 4,975,794 | | | $ | — | | | $ | 4,975,794 | |
| | | | | — | | | | 93,260 | | | | — | | | | 93,260 | |
| | | | | 222,225 | | | | 618,914 | | | | — | | | | 841,139 | |
| | | | | — | | | | 51,768 | | | | — | | | | 51,768 | |
| | | | | — | | | | 643,558 | | | | — | | | | 643,558 | |
| | | | | — | | | | 680,388 | | | | — | | | | 680,388 | |
| | | | | — | | | | 5,004,593 | | | | — | | | | 5,004,593 | |
| | | | | — | | | | 4,160,911 | | | | — | | | | 4,160,911 | |
| | | | | — | | | | 1,630,562 | | | | — | | | | 1,630,562 | |
| | | | | — | | | | 305,284 | | | | — | | | | 305,284 | |
| | | | | — | | | | 522,473 | | | | — | | | | 522,473 | |
| | | | | 53,006 | | | | 10,799,280 | | | | — | | | | 10,852,286 | |
| | | | | — | | | | 294,912 | | | | — | | | | 294,912 | |
| | | | | — | | | | 74,762 | | | | — | | | | 74,762 | |
| | | | | — | | | | 2,697,296 | | | | — | | | | 2,697,296 | |
| | | | | — | | | | 88,986 | | | | — | | | | 88,986 | |
| | | | | — | | | | 661,909 | | | | — | | | | 661,909 | |
| | | | | 43,985 | | | | 126,980 | | | | — | | | | 170,965 | |
| | | | | 21,840 | | | | 976,094 | | | | — | | | | 997,934 | |
| | | | | — | | | | 1,854,197 | | | | — | | | | 1,854,197 | |
| | | | | — | | | | 1,792,055 | | | | — | | | | 1,792,055 | |
| | | | | — | | | | 4,568,450 | | | | — | | | | 4,568,450 | |
| | | | | — | | | | 11,647,308 | | | | — | | | | 11,647,308 | |
| | | | | 341,056 | | | | 54,269,734 | | | | — | | | | 54,610,790 | |
| | | | | — | | | | 229,240 | | | | — | | | | 229,240 | |
| | | | | 6,698 | | | | — | | | | — | | | | 6,698 | |
| | | | | 1,361,000 | | | | — | | | | — | | | | 1,361,000 | |
Total Investments, at fair value | | | | $ | 1,708,754 | | | $ | 54,498,974 | | | $ | — | | | $ | 56,207,728 | |
| | | | | | | | | | | | | | | | | | |
Other Financial Instruments+ | | | | | | | | | | | | | | | | | | |
| | | | $ | (10,570 | ) | | $ | — | | | $ | — | | | $ | (10,570 | ) |
| | | | $ | (10,570 | ) | | $ | — | | | $ | — | | | $ | (10,570 | ) |
| ˆ | | See Note 2, “Significant Accounting Policies” in the Notes to Financial Statements for additional information. |
| + | | Other Financial Instruments are derivatives not reflected in the Portfolio of Investments and may include open forward foreign currency contracts, equity forwards, futures, swaps, and written options. Forward foreign currency contracts, equity forwards and futures are valued at the unrealized gain (loss) on the instrument. Swaps and written options are valued at the fair value of the instrument. |
| # | | The earlier close of the foreign markets gives rise to the possibility that significant events, including broad market moves, may have occurred in the interim and may materially affect the value of those securities. To account for this, the Fund may frequently value many of its foreign equity securities using fair value prices based on third party vendor modeling tools to the extent available. Accordingly, a portion of the Fund’s investments are categorized as Level 2 investments. |
There were no transfers in or out of Levels 1, 2 or 3 of the fair value hierarchy during the year ended October 31, 2012.
See Accompanying Notes to Financial Statements
86
ING INDEX PLUS INTERNATIONAL
EQUITY FUND
SUMMARY PORTFOLIO OF INVESTMENTS
AS OF OCTOBER 31, 2012 (CONTINUED)
ING Index Plus International Equity Fund Open Futures Contracts on October 31, 2012:
Contract Description
| | | | Number
of Contracts
| | Expiration
Date
| | Notional
Value
| | Unrealized
Appreciation/
(Depreciation)
|
|---|
| | | | | | | | | | | | | | | | | | |
| | | | | 17 | | | | 12/21/12 | | | $ | 1,290,640 | | | $ | (10,570 | ) |
| | | | | | | | | | | | $ | 1,290,640 | | | $ | (10,570 | ) |
A summary of derivative instruments by primary risk exposure is outlined in the following tables.
The fair value of derivative instruments as of October 31, 2012 was as follows:
Derivatives not accounted for as
hedging instruments
| | | | Location on Statement
of Assets and Liabilities
| | Fair Value
|
|---|
| | | | | | | | |
| | | | Net Assets — Unrealized depreciation* | | $ | 10,570 | |
Total Liability Derivatives | | | | | | $ | 10,570 | |
| * | | Includes cumulative appreciation/depreciation of futures contracts as reported in the table following the Summary Portfolio of Investments. |
The effect of derivative instruments on the Fund’s Statement of Operations for the year ended October 31, 2012 was as follows:
| | | | Amount of Realized Gain or (Loss) on Derivatives Recognized in Income
| |
|---|
Derivatives not accounted for as
hedging instruments
| | | | Foreign currency
related transactions*
| | Futures
| | Total
|
|---|
| | | | $ | — | | | $ | 361,998 | | | $ | 361,998 | |
Foreign exchange contracts | | | | | 69,968 | | | | — | | | | 69,968 | |
| | | | $ | 69,968 | | | $ | 361,998 | | | $ | 431,966 | |
| | | | Change in Unrealized Appreciation or (Depreciation) on Derivatives Recognized in Income
| |
|---|
Derivatives not accounted for as
hedging instruments
| | | | Foreign currency
related transactions*
| | Futures
| | Total
|
|---|
| | | | $ | — | | | $ | (218,858 | ) | | $ | (218,858 | ) |
Foreign exchange contracts | | | | | 53,771 | | | | — | | | | 53,771 | |
| | | | $ | 53,771 | | | $ | (218,858 | ) | | $ | (165,087 | ) |
| * | | Amounts recognized for forward foreign currency contracts are included in net realized gain (loss) on foreign currency related transactions and net change in unrealized appreciation or depreciation on foreign currency related transactions. |
See Accompanying Notes to Financial Statements
87
SUMMARY PORTFOLIO OF INVESTMENTS
AS OF OCTOBER 31, 2012
ING INTERNATIONAL SMALL CAP FUND
Shares
|
|
|
|
|
|
|
| Value
|
| Percentage
of Net
Assets
|
|---|
| |
|
| |
| | | | | | | | $ | 1,059,639 | | | | 0.4 | |
| | | | | | | | | 1,283,269 | | | | 0.5 | |
| | | | | | | | | 1,208,352 | | | | 0.5 | |
| | | | | | | | | 1,141,890 | | | | 0.5 | |
| | | | | | | | | 10,356,042 | | | | 4.3 | |
| | | | | | | | | 15,049,192 | | | | 6.2 | |
|
| |
| | | | | | | | | 992,525 | | | | 0.4 | |
| | | | | | | | | 1,186,904 | | | | 0.5 | |
| | | | | | Rosenbauer International AG | | | 1,204,333 | | | | 0.5 | |
| | | | | | | | | 232,516 | | | | 0.1 | |
| | | | | | | | | 3,616,278 | | | | 1.5 | |
|
| |
| | | | | | | | | 2,937,626 | | | | 1.2 | |
|
| |
| | | | | | | | | 36,385 | | | | 0.0 | |
|
| |
| | | | | | | | | 1,105,859 | | | | 0.4 | |
|
| |
| | | | | | | | | 1,555,329 | | | | 0.7 | |
| | | | | | | | | 7,848,931 | | | | 3.2 | |
| | | | | | | | | 9,404,260 | | | | 3.9 | |
|
| |
| | | | | | | | | 3,362,139 | | | | 1.4 | |
|
| |
| | | | | | | | | 1,141,332 | | | | 0.5 | |
| | | | | | | | | 1,426,122 | | | | 0.6 | |
| | | | | | | | | 2,567,454 | | | | 1.1 | |
|
| |
| | | | | | | | | 380,298 | | | | 0.2 | |
|
| |
| | | | | | | | | 1,142,313 | | | | 0.5 | |
| | | | | | | | | 9,835,170 | | | | 4.0 | |
| | | | | | | | | 10,977,483 | | | | 4.5 | |
|
| |
| | | | | | | | | 2,009,482 | | | | 0.8 | |
| | | | | | | | | 1,358,857 | | | | 0.6 | |
| | | | | | Draegerwerk AG & Co. KGaA | | | 2,156,777 | | | | 0.9 | |
| | | | | | | | | 1,157,261 | | | | 0.5 | |
| | | | | | | | | 993,645 | | | | 0.4 | |
| | | | | | | | | 2,231,182 | | | | 0.9 | |
| | | | | | | | | 1,343,392 | | | | 0.5 | |
| | | | | | | | | 1,388,219 | | | | 0.6 | |
| | | | | | | | | 11,274,774 | | | | 4.7 | |
| | | | | | | | | 23,913,589 | | | | 9.9 | |
|
| |
| | | | | | | | | 28,111 | | | | 0.0 | |
| |
COMMON STOCK: (continued) |
| |
| | | | | | Techtronic Industries Co. | | $ | 1,553,374 | | | | 0.6 | |
| | | | | | | | | 8,384,092 | | | | 3.5 | |
| | | | | | | | | 9,937,466 | | | | 4.1 | |
|
| |
| | | | | | | | | 2,904,522 | | | | 1.2 | |
|
| |
| | | | | | | | | 1,118,624 | | | | 0.5 | |
|
| |
| | | | | | | | | 1,300,020 | | | | 0.6 | |
| | | | | | | | | 2,717,839 | | | | 1.1 | |
| | | | | | | | | 4,017,859 | | | | 1.7 | |
|
| |
| | | | | | | | | 127,756 | | | | 0.0 | |
|
| |
| | | | | | | | | 1,270,403 | | | | 0.5 | |
| | | | | | | | | 1,091,665 | | | | 0.5 | |
| | | | | | | | | 1,156,850 | | | | 0.5 | |
| | | | | | | | | 4,409,003 | | | | 1.8 | |
| | | | | | | | | 7,927,921 | | | | 3.3 | |
|
| |
| | | | | | | | | 1,797,724 | | | | 0.7 | |
| | | | | | | | | 1,462,111 | | | | 0.6 | |
| | | | | | | | | 1,666,810 | | | | 0.7 | |
| | | | | | | | | 39,376,118 | | | | 16.3 | |
| | | | | | | | | 44,302,763 | | | | 18.3 | |
|
| |
| | | | | | | | | 1,017,444 | | | | 0.4 | |
| | | | | | | | | 1,297,608 | | | | 0.5 | |
| | | | | | | | | 2,315,052 | | | | 0.9 | |
|
| |
| | | | | | | | | 745,446 | | | | 0.3 | |
|
| |
| | | | | | | | | 1,330,435 | | | | 0.6 | |
| | | | | | | | | 997,561 | | | | 0.4 | |
| | | | | | | | | 780,207 | | | | 0.3 | |
| | | | | | | | | 3,108,203 | | | | 1.3 | |
|
| |
| | | | | | | | | 991,672 | | | | 0.4 | |
| | | | | | | | | 1,410,394 | | | | 0.6 | |
| | | | | | | | | 2,402,066 | | | | 1.0 | |
|
| |
| | | | | | | | | 3,281,365 | | | | 1.3 | |
|
| |
| | | | | | | | | 220,798 | | | | 0.1 | |
|
| |
| | | | | | | | | 383,526 | | | | 0.2 | |
See Accompanying Notes to Financial Statements
88
SUMMARY PORTFOLIO OF INVESTMENTS
AS OF OCTOBER 31, 2012 (CONTINUED)
ING INTERNATIONAL SMALL CAP FUND
Shares
|
|
|
|
|
|
|
| Value
|
| Percentage
of Net
Assets
|
|---|
| |
COMMON STOCK: (continued) |
| |
| | | | | | | | $ | 66,098 | | | | 0.0 | |
|
| |
| | | | | | | | | 44,389 | | | | 0.0 | |
|
| |
| | | | | | | | | 286,039 | | | | 0.1 | |
|
| |
| | | | | | Flextronics International Ltd. | | | 1,194,384 | | | | 0.5 | |
| | | | | | Mapletree Commercial Trust | | | 268,279 | | | | 0.1 | |
| | | | | | Mapletree Industrial Trust | | | 931,494 | | | | 0.4 | |
| | | | | | United Overseas Land Ltd. | | | 1,124,367 | | | | 0.5 | |
| | | | | | | | | 3,742,087 | | | | 1.5 | |
| | | | | | | | | 7,260,611 | | | | 3.0 | |
|
| |
| | | | | | | | | 677,123 | | | | 0.3 | |
|
| |
| | | | | | | | | 995,822 | | | | 0.4 | |
| | | | | | | | | 6,272,166 | | | | 2.6 | |
| | | | | | | | | 7,267,988 | | | | 3.0 | |
|
| |
| | | | | | | | | 3,124,755 | | | | 1.3 | |
|
| |
| | | | | | | | | 2,054,632 | | | | 0.9 | |
| | | | | | | | | 1,160,955 | | | | 0.5 | |
| | | | | | | | | 1,555,574 | | | | 0.6 | |
| | | | | | | | | 4,890,784 | | | | 2.0 | |
| | | | | | | | | 9,661,945 | | | | 4.0 | |
|
| |
| | | | | | | | | 4,595,088 | | | | 1.9 | |
|
| |
| | | | | | | | | 1,029,344 | | | | 0.4 | |
| | | | | | Total Access Communication PCL | | | 1,041,963 | | | | 0.5 | |
| | | | | | | | | 1,009,556 | | | | 0.4 | |
| | | | | | | | | 3,080,863 | | | | 1.3 | |
|
| |
| | | | | | | | | 1,312,544 | | | | 0.5 | |
|
| United Arab Emirates: 0.1% |
| | | | | | | | | 239,492 | | | | 0.1 | |
|
| |
| | | | | | | | | 1,166,081 | | | | 0.5 | |
| | | | | | | | | 1,091,284 | | | | 0.4 | |
| | | | | | Dechra Pharmaceuticals PLC | | | 1,130,791 | | | | 0.5 | |
| | | | | | | | | 999,257 | | | | 0.4 | |
| | | | | | | | | 2,086,891 | | | | 0.9 | |
| | | | | | | | | 1,376,348 | | | | 0.6 | |
| |
COMMON STOCK: (continued) |
| United Kingdom: (continued) |
| | | | | | Intermediate Capital Group PLC | | $ | 1,102,438 | | | | 0.4 | |
| | | | | | | | | 1,001,944 | | | | 0.4 | |
| | | | | | Micro Focus International PLC | | | 1,001,837 | | | | 0.4 | |
| | | | | | | | | 1,117,451 | | | | 0.5 | |
| | | | | | | | | 1,306,396 | | | | 0.5 | |
| | | | | | | | | 28,791,864 | | | | 11.9 | |
| | | | | | | | | 42,172,582 | | | | 17.4 | |
|
| |
| | | | | | | | | 923,870 | | | | 0.4 | |
| |
| | | | | | | | | | | | | | |
| | | | | | | | | 236,885,428 | | | | 97.8 | |
| |
|
| |
| | | | | | | | | 162,615 | | | | 0.1 | |
| |
| | | | | | | | | | | | | | |
| | | | | | | | | 162,615 | | | |
0.1 |
|
| |
| | | | | | Total Long-Term Investments | | | | | | | | |
| | | | | | | | | 237,048,043 | | | | 97.9 | |
| |
Principal Amount†
|
|
|
|
|
|
|
| Value
|
| Percentage
of Net
Assets
|
|---|
| |
SHORT-TERM INVESTMENTS: 1.0% |
| Securities Lending Collateralcc(1): 0.7% |
| | | | | | Daiwa Capital Markets, Repurchase Agreement dated 10/31/12, 0.38%, due 11/01/12 (Repurchase Amount $722,027, collateralized by various U.S. Government and U.S. Government Agency Obligations, 0.000%–6.500%, Market Value plus accrued interest $736,459, due 01/15/14–11/01/42) | | | 722,019 | | | | 0.3 | |
| | | | | | Merrill Lynch & Co., Inc., Repurchase Agreement dated 10/31/12, 0.33%, due 11/01/12 (Repurchase Amount $1,000,009, collateralized by various U.S. Government Agency Obligations, 3.000%–4.500%, Market Value plus accrued interest $1,020,000, due 01/01/27–10/20/42) | | | 1,000,000 | | | | 0.4 | |
| | | | | | | | | 1,722,019 | | | | 0.7 | |
See Accompanying Notes to Financial Statements
89
SUMMARY PORTFOLIO OF INVESTMENTS
AS OF OCTOBER 31, 2012 (CONTINUED)
ING INTERNATIONAL SMALL CAP FUND
Shares
|
|
|
|
|
|
|
| Value
|
| Percentage
of Net
Assets
|
|---|
| |
SHORT-TERM INVESTMENTS: (continued) |
| |
| | | | | | BlackRock Liquidity Funds, TempFund, Institutional Class | | | | | | | | |
| | | | | | | | $ | 632,563 | | | |
0.3 |
|
| |
| | | | | | Total Short-Term Investments | | | | | | | | |
| | | | | | | | | 2,354,582 | | | |
1.0 |
|
| |
| | | | | | Total Investments in Securities
(Cost $225,345,980) | | $ | 239,402,625 | | | | 98.9 | |
| | | | | | Assets in Excess of Other Liabilities | | | 2,770,605 | | | | 1.1 | |
| | | | | | | | $ | 242,173,230 | | | | 100.0 | |
“Other Securities” represents issues not identified as the top 50 holdings in terms of market value and issues or issuers not exceeding 1% of net assets individually or in aggregate respectively as of October 31, 2012.
The following footnotes apply to either the individual securities noted or one or more of the securities aggregated and listed as a single line item.
| † | | Unless otherwise indicated, principal amount is shown in USD. |
| @ | | Non-income producing security |
| cc | | Securities purchased with cash collateral for securities loaned. |
| (1) | | Collateral received from brokers for securities lending was invested into these short-term investments. |
| (a) | | This grouping contains securities on loan. |
| | Cost for federal income tax purposes is $228,052,548. |
Net unrealized appreciation consists of: | | | | | | |
Gross Unrealized Appreciation | | | | $ | 43,637,136 | |
Gross Unrealized Depreciation | | | | | (32,287,059 | ) |
Net Unrealized Appreciation | | | | $ | 11,350,077 | |
Sector Diversification
|
|
|
| Percentage
of Net Assets
|
|---|
| | | | | 22.8 | % |
| | | | | 18.9 | |
| | | | | 13.1 | |
| | | | | 11.9 | |
| | | | | 11.9 | |
| | | | | 5.9 | |
| | | | | 5.3 | |
| | | | | 4.9 | |
Telecommunication Services | | | | | 2.2 | |
| | | | | 1.0 | |
| | | | | 1.0 | |
Assets in Excess of Other Liabilities | | | | | 1.1 | |
| | | | | 100.0 | % |
Fair Value Measurementsˆ
The following is a summary of the fair valuations according to the inputs used as of October 31, 2012 in valuing the assets and liabilities:(1)
| | | | Quoted Prices
in Active Markets
for Identical
Investments
(Level 1)
| | Significant
Other
Observable
Inputs#
(Level 2)
| | Significant
Unobservable
Inputs
(Level 3)
| | Fair Value
at
October 31, 2012
|
|---|
| | | | | | | | | | | | | | | | | | |
Investments, at fair value | | | | | | | | | | | | | | | | | | |
| | | | | | | | | | | | | | | | | | |
| | | | $ | 415,807 | | | $ | 14,633,385 | | | $ | — | | | $ | 15,049,192 | |
| | | | | 1,294,802 | | | | 2,321,476 | | | | — | | | | 3,616,278 | |
| | | | | 1,907,548 | | | | 1,030,078 | | | | — | | | | 2,937,626 | |
| | | | | 36,385 | | | | — | | | | — | | | | 36,385 | |
| | | | | 1,105,859 | | | | — | | | | — | | | | 1,105,859 | |
| | | | | 9,404,260 | | | | — | | | | — | | | | 9,404,260 | |
| | | | | 1,106,906 | | | | 2,228,862 | | | | 26,371 | | | | 3,362,139 | |
| | | | | 145,735 | | | | 2,421,719 | | | | — | | | | 2,567,454 | |
| | | | | 123,225 | | | | 257,073 | | | | — | | | | 380,298 | |
| | | | | 2,059,411 | | | | 8,918,072 | | | | — | | | | 10,977,483 | |
| | | | | 5,363,952 | | | | 18,549,637 | | | | — | | | | 23,913,589 | |
| | | | | 28,111 | | | | — | | | | — | | | | 28,111 | |
| | | | | 696,379 | | | | 9,178,157 | | | | 62,930 | | | | 9,937,466 | |
| | | | | 434,287 | | | | 2,424,861 | | | | 45,374 | | | | 2,904,522 | |
| | | | | — | | | | 1,118,624 | | | | — | | | | 1,118,624 | |
| | | | | 1,422,653 | | | | 2,595,206 | | | | — | | | | 4,017,859 | |
| | | | | — | | | | 127,756 | | | | — | | | | 127,756 | |
| | | | | 599,519 | | | | 7,328,402 | | | | — | | | | 7,927,921 | |
| | | | | 711,259 | | | | 43,591,504 | | | | — | | | | 44,302,763 | |
| | | | | 321,416 | | | | 1,993,636 | | | | — | | | | 2,315,052 | |
| | | | | 745,446 | | | | — | | | | — | | | | 745,446 | |
| | | | | 83,110 | | | | 3,025,093 | | | | — | | | | 3,108,203 | |
| | | | | — | | | | 2,402,066 | | | | — | | | | 2,402,066 | |
| | | | | 1,323,990 | | | | 1,957,375 | | | | — | | | | 3,281,365 | |
See Accompanying Notes to Financial Statements
90
SUMMARY PORTFOLIO OF INVESTMENTS
AS OF OCTOBER 31, 2012 (CONTINUED)
ING INTERNATIONAL SMALL CAP FUND
| | | | Quoted Prices
in Active Markets
for Identical
Investments
(Level 1)
| | Significant
Other
Observable
Inputs#
(Level 2)
| | Significant
Unobservable
Inputs
(Level 3)
| | Fair Value
at
October 31, 2012
|
|---|
| | | | $ | 220,798 | | | $ | — | | | $ | — | | | $ | 220,798 | |
| | | | | — | | | | 383,526 | | | | — | | | | 383,526 | |
| | | | | — | | | | 66,098 | | | | — | | | | 66,098 | |
| | | | | 44,389 | | | | — | | | | — | | | | 44,389 | |
| | | | | — | | | | 286,039 | | | | — | | | | 286,039 | |
| | | | | 1,531,841 | | | | 5,728,770 | | | | — | | | | 7,260,611 | |
| | | | | 250,409 | | | | 426,714 | | | | — | | | | 677,123 | |
| | | | | 969,636 | | | | 6,298,352 | | | | — | | | | 7,267,988 | |
| | | | | 846,296 | | | | 2,278,459 | | | | — | | | | 3,124,755 | |
| | | | | 2,685,693 | | | | 6,976,252 | | | | — | | | | 9,661,945 | |
| | | | | 551,666 | | | | 4,043,422 | | | | — | | | | 4,595,088 | |
| | | | | — | | | | 3,080,863 | | | | — | | | | 3,080,863 | |
| | | | | — | | | | 1,312,544 | | | | — | | | | 1,312,544 | |
| | | | | — | | | | 239,492 | | | | — | | | | 239,492 | |
| | | | | 5,915,233 | | | | 36,257,349 | | | | — | | | | 42,172,582 | |
| | | | | 923,870 | | | | — | | | | — | | | | 923,870 | |
| | | | | 43,269,891 | | | | 193,480,862 | | | | 134,675 | | | | 236,885,428 | |
| | | | | — | | | | 162,615 | | | | — | | | | 162,615 | |
| | | | | 632,563 | | | | 1,722,019 | | | | — | | | | 2,354,582 | |
Total Investments, at fair value | | | | $ | 43,902,454 | | | $ | 195,365,496 | | | $ | 134,675 | | | $ | 239,402,625 | |
| | | | | | | | | | | | | | | | | | |
| (1) | | For the year ended October 31, 2012, as a result of the fair value pricing procedures for international equities utilized by the Fund, certain securities have transferred in and out of Level 1 and Level 2 measurements during the year. The Fund’s policy is to recognize transfers between levels at the end of the reporting period. At October 31, 2012, securities valued at $2,606,043 and $22,682,702 were transferred from Level 1 to Level 2 and Level 2 and Level 1, respectively, within the fair value hierarchy. At October 31, 2012, certain securities valued at $43,575 transferred from Level 3 to Level 1 due to the availability of quoted prices in active markets. At October 31, 2012, certain securities valued at $3,181 transferred from Level 2 to Level 3 due to significant unobservable inputs. |
| ˆ | | See Note 2, “Significant Accounting Policies” in the Notes to Financial Statements for additional information. |
| # | | The earlier close of the foreign markets gives rise to the possibility that significant events, including broad market moves, may have occurred in the interim and may materially affect the value of those securities. To account for this, the Fund may frequently value many of its foreign equity securities using fair value prices based on third party vendor modeling tools to the extent available. Accordingly, a portion of the Fund’s investments are categorized as Level 2 investments. |
There were no transfers in or out of Levels 1, 2 or 3 of the fair value hierarchy during the year ended October 31, 2012.
The effect of derivative instruments on the Fund’s Statement of Operations for the year ended October 31, 2012 was as follows:
| | | | Amount of Realized Gain or (Loss)
on Derivatives Recognized in Income |
|---|
Derivatives not accounted for as
hedging instruments
| | | | Foreign currency
related transactions*
|
|---|
Foreign exchange contracts | | | | $ | 42,317 | |
| | | | $ | 42,317 | |
| | | | Change in Unrealized Appreciation
or (Depreciation) on Derivatives
Recognized in Income |
|---|
Derivatives not accounted for as
hedging instruments
| | | | Foreign currency
related transactions*
|
|---|
Foreign exchange contracts | | | | $ | 11,765 | |
| | | | $ | 11,765 | |
| * | | Amounts recognized for forward foreign currency contracts are included in net realized gain (loss) on foreign currency related transactions and net change in unrealized appreciation or depreciation on foreign currency related transactions. |
See Accompanying Notes to Financial Statements
91
SUMMARY PORTFOLIO OF INVESTMENTS
AS OF OCTOBER 31, 2012 (CONTINUED)
ING INTERNATIONAL VALUE CHOICE FUND
Shares
|
|
|
|
|
|
|
| Value
|
| Percentage
of Net
Assets
|
|---|
| |
|
| |
| | | | | | | | $ | 235,115 | | | | 1.0 | |
| | | | | | | | | 575,017 | | | | 2.5 | |
| | | | | | | | | 810,132 | | | | 3.5 | |
|
| |
| | | | | | | | | 261,604 | | | | 1.1 | |
| | | | | | | | | 390,476 | | | | 1.7 | |
| | | | | | | | | 652,080 | | | | 2.8 | |
|
| |
| | | | | | Banco Santander Brasil SA ADR | | | 225,059 | | | | 1.0 | |
| | | | | | Centrais Eletricas Brasileiras SA | | | 104,855 | | | | 0.4 | |
| | | | | | Centrais Eletricas Brasileiras SA ADR | | | 225,584 | | | | 1.0 | |
| | | | | | | | | 555,498 | | | | 2.4 | |
|
| |
| | | | | | | | | 855,765 | | | | 3.7 | |
| | | | | | | | | 530,693 | | | | 2.3 | |
| | | | | | | | | 530,379 | | | | 2.3 | |
| | | | | | | | | 363,421 | | | | 1.6 | |
| | | | | | | | | 2,280,258 | | | | 9.9 | |
|
| |
| | | | | | | | | 277,769 | | | | 1.2 | |
| | | | | | | | | 228,205 | | | | 1.0 | |
| | | | | | | | | 575,603 | | | | 2.5 | |
| | | | | | | | | 336,588 | | | | 1.5 | |
| | | | | | | | | 566,133 | | | | 2.4 | |
| | | | | | | | | 344,230 | | | | 1.5 | |
| | | | | | | | | 252,863 | | | | 1.1 | |
| | | | | | | | | 2,581,391 | | | | 11.2 | |
|
| |
| | | | | | | | | 466,216 | | | | 2.0 | |
| | | | | | | | | 381,572 | | | | 1.7 | |
| | | | | | | | | 847,788 | | | | 3.7 | |
|
| |
| | | | | | Teva Pharmaceutical Industries Ltd. ADR | | | 479,624 | | | | 2.1 | |
|
| |
| | | | | | Telecom Italia S.p.A. RNC | | | 543,544 | | | | 2.4 | |
| | | | | | | | | 206,842 | | | | 0.9 | |
| | | | | | | | | 750,386 | | | | 3.3 | |
|
| |
| | | | | | Sumitomo Mitsui Trust Holdings, Inc. | | | 438,195 | | | | 1.9 | |
| | | | | | | | | 456,837 | | | | 2.0 | |
| | | | | | Dai Nippon Printing Co., Ltd. | | | 375,561 | | | | 1.6 | |
| | | | | | | | | 220,407 | | | | 1.0 | |
| | | | | | Fuji Photo Film Co., Ltd. | | | 352,800 | | | | 1.5 | |
| | | | | | | | | 266,752 | | | | 1.2 | |
| |
COMMON STOCK: (continued) |
| |
| | | | | | | | $ | 436,481 | | | | 1.9 | |
| | | | | | Mitsui Sumitomo Insurance Group Holdings, Inc. | | | 579,991 | | | | 2.5 | |
| | | | | | | | | 348,569 | | | | 1.5 | |
| | | | | | Nippon Telegraph & Telephone Corp. ADR | | | 642,063 | | | | 2.8 | |
| | | | | | | | | 229,278 | | | | 1.0 | |
| | | | | | | | | 329,422 | | | | 1.4 | |
| | | | | | | | | 353,389 | | | | 1.5 | |
| | | | | | | | | 388,549 | | | | 1.7 | |
| | | | | | Seven & I Holdings Co., Ltd. | | | 363,905 | | | | 1.6 | |
| | | | | | | | | 435,342 | | | | 1.9 | |
| | | | | | | | | 352,876 | | | | 1.5 | |
| | | | | | | | | 360,027 | | | | 1.6 | |
| | | | | | | | | 6,930,444 | | | | 30.1 | |
|
| |
| | | | | | | | | 378,506 | | | | 1.6 | |
|
| |
| | | | | | | | | 232,693 | | | | 1.0 | |
| | | | | | | | | 129,820 | | | | 0.6 | |
| | | | | | | | | 362,513 | | | | 1.6 | |
|
| |
| | | | | | | | | 396,614 | | | | 1.7 | |
|
| |
| | | | | | AngloGold Ashanti Ltd ADR | | | 606,135 | | | | 2.6 | |
| | | | | | | | | 482,450 | | | | 2.1 | |
| | | | | | | | | 125,593 | | | | 0.6 | |
| | | | | | | | | 1,214,178 | | | | 5.3 | |
|
| |
| | | | | | Korea Electric Power Corp. ADR | | | 372,109 | | | | 1.6 | |
| | | | | | | | | 601,989 | | | | 2.6 | |
| | | | | | | | | 974,098 | | | | 4.2 | |
|
| |
| | | | | | Telefonaktiebolaget LM Ericsson ADR | | | 410,869 | | | | 1.8 | |
|
| |
| | | | | | | | | 664,410 | | | | 2.9 | |
|
| |
| | | | | | | | | 590,060 | | | | 2.6 | |
| | | | | | | | | 247,059 | | | | 1.1 | |
| | | | | | Polyus Gold International Ltd. | | | 243,784 | | | | 1.0 | |
| | | | | | | | | 481,926 | | | | 2.1 | |
| | | | | | | | | 1,562,829 | | | | 6.8 | |
|
See Accompanying Notes to Financial Statements
92
SUMMARY PORTFOLIO OF INVESTMENTS
AS OF OCTOBER 31, 2012 (CONTINUED)
ING INTERNATIONAL VALUE CHOICE FUND
Shares
|
|
|
|
|
|
|
| Value
|
| Percentage
of Net
Assets
|
|---|
| |
COMMON STOCK: (continued) |
| |
| | | | | | Axis Capital Holdings Ltd. | | $ | 375,493 | | | | 1.6 | |
| | | | | | | | | 239,325 | | | | 1.0 | |
| | | | | | Weatherford International Ltd. | | | 247,730 | | | | 1.1 | |
| | | | | | | | | 862,548 | | | |
3.7 |
|
| |
| | | | | | | | | | | | | | |
| | | | | | | | | 22,714,166 | | | |
98.6 |
|
| |
SHORT-TERM INVESTMENTS: 0.9% |
| |
| | | | | | BlackRock Liquidity Funds, TempFund, Institutional Class | | | | | | | | |
| | | | | | | | | 203,586 | | | |
0.9 |
|
| |
| | | | | | Total Short-Term Investments | | | | | | | | |
| | | | | | | | | 203,586 | | | |
0.9 |
|
| |
| | | | | | Total Investments in Securities
(Cost $24,040,922) | | $ | 22,917,752 | | | | 99.5 | |
| | | | | | Assets in Excess of Other Liabilities | | | 106,569 | | | | 0.5 | |
| | | | | | | | $ | 23,024,321 | | | | 100.0 | |
“Other Securities” represents issues not identified as the top 50 holdings in terms of market value and issues or issuers not exceeding 1% of net assets individually or in aggregate respectively as of October 31, 2012.
The following footnotes apply to either the individual securities noted or one or more of the securities aggregated and listed as a single line item.
| @ | | Non-income producing security
|
| ADR | | American Depositary Receipt |
| | Cost for federal income tax purposes is $25,200,154. |
Net unrealized depreciation consists of: | | | | | | |
Gross Unrealized Appreciation | | | | $ | 2,044,525 | |
Gross Unrealized Depreciation | | | | | (4,326,927 | ) |
Net Unrealized Depreciation | | | | $ | (2,282,402 | ) |
Sector Diversification
|
|
|
| Percentage
of Net Assets
|
|---|
| | | | | 15.8 | % |
| | | | | 13.0 | |
Telecommunication Services | | | | | 12.7 | |
| | | | | 10.7 | |
| | | | | 10.0 | |
| | | | | 9.0 | |
| | | | | 8.6 | |
| | | | | 8.1 | |
| | | | | 6.2 | |
| | | | | 4.5 | |
| | | | | 0.9 | |
Assets in Excess of Other Liabilities | | | | | 0.5 | |
| | | | | 100.0 | % |
Fair Value Measurementsˆ
The following is a summary of the fair valuations according to the inputs used as of October 31, 2012 in valuing the assets and liabilities:
| | | | Quoted Prices
in Active Markets
for Identical
Investments
(Level 1)
| | Significant
Other
Observable
Inputs#
(Level 2)
| | Significant
Unobservable
Inputs
(Level 3)
| | Fair Value
at
October 31, 2012
|
|---|
| | | | | | | | | | | | | | | | | | |
Investments, at fair value | | | | | | | | | | | | | | | | | | |
| | | | | | | | | | | | | | | | | | |
| | | | $ | — | | | $ | 810,132 | | | $ | — | | | $ | 810,132 | |
| | | | | — | | | | 652,080 | | | | — | | | �� | 652,080 | |
| | | | | 555,498 | | | | — | | | | — | | | | 555,498 | |
| | | | | 2,280,258 | | | | — | | | | — | | | | 2,280,258 | |
| | | | | — | | | | 2,581,391 | | | | — | | | | 2,581,391 | |
| | | | | — | | | | 847,788 | | | | — | | | | 847,788 | |
| | | | | 479,624 | | | | — | | | | — | | | | 479,624 | |
| | | | | — | | | | 750,386 | | | | — | | | | 750,386 | |
| | | | | 994,939 | | | | 5,935,505 | | | | — | | | | 6,930,444 | |
| | | | | — | | | | 378,506 | | | | — | | | | 378,506 | |
| | | | | — | | | | 362,513 | | | | — | | | | 362,513 | |
| | | | | 396,614 | | | | — | | | | — | | | | 396,614 | |
| | | | | 606,135 | | | | 608,043 | | | | — | | | | 1,214,178 | |
| | | | | 974,098 | | | | — | | | | — | | | | 974,098 | |
| | | | | 410,869 | | | | — | | | | — | | | | 410,869 | |
| | | | | 664,410 | | | | — | | | | — | | | | 664,410 | |
| | | | | 243,784 | | | | 1,319,045 | | | | — | | | | 1,562,829 | |
| | | | | 862,548 | | | | — | | | | — | | | | 862,548 | |
| | | | | 8,468,777 | | | | 14,245,389 | | | | — | | | | 22,714,166 | |
| | | | | 203,586 | | | | — | | | | — | | | | 203,586 | |
Total Investments, at fair value | | | | $ | 8,672,363 | | | $ | 14,245,389 | | | $ | — | | | $ | 22,917,752 | |
See Accompanying Notes to Financial Statements
93
SUMMARY PORTFOLIO OF INVESTMENTS
AS OF OCTOBER 31, 2012 (CONTINUED)
ING INTERNATIONAL VALUE CHOICE FUND
| ˆ | | See Note 2, “Significant Accounting Policies” in the Notes to Financial Statements for additional information. |
| # | | The earlier close of the foreign markets gives rise to the possibility that significant events, including broad market moves, may have occurred in the interim and may materially affect the value of those securities. To account for this, the Fund may frequently value many of its foreign equity securities using fair value prices based on third party vendor modeling tools to the extent available. Accordingly, a portion of the Fund’s investments are categorized as Level 2 investments. |
There were no transfers in or out of Levels 1, 2 or 3 of the fair value hierarchy during the year ended October 31, 2012.
See Accompanying Notes to Financial Statements
94
SUMMARY PORTFOLIO OF INVESTMENTS
AS OF OCTOBER 31, 2012
ING INTERNATIONAL VALUE FUND
Shares
|
|
|
|
|
|
|
| Value
|
| Percentage
of Net
Assets
|
|---|
| |
|
| |
| | | | | | | | $ | 7,785,225 | | | | 1.6 | |
|
| |
| | | | | | | | | 3,219,728 | | | | 0.7 | |
| | | | | | | | | 2,901,828 | | | | 0.6 | |
| | | | | | | | | 6,121,556 | | | | 1.3 | |
|
| |
| | | | | | | | | 7,195,608 | | | | 1.5 | |
|
| |
| | | | | | | | | 10,534,188 | | | | 2.2 | |
|
| |
| | | | | | | | | 7,084,300 | | | | 1.5 | |
|
| |
| | | | | | | | | 2,721,548 | | | | 0.6 | |
|
| |
| | | | | | | | | 2,563,714 | | | | 0.5 | |
|
| |
| | | | | | | | | 4,215,082 | | | | 0.9 | |
| | | | | | | | | 3,309,425 | | | | 0.7 | |
| | | | | | | | | 3,781,222 | | | | 0.8 | |
| | | | | | | | | 4,103,401 | | | | 0.8 | |
| | | | | | | | | 11,684,589 | | | | 2.4 | |
| | | | | | | | | 7,085,540 | | | | 1.5 | |
| | | | | | | | | 14,873,868 | | | | 3.1 | |
| | | | | | | | | 49,053,127 | | | | 10.2 | |
|
| |
| | | | | | | | | 3,238,736 | | | | 0.7 | |
| | | | | | | | | 4,003,689 | | | | 0.8 | |
| | | | | | | | | 8,497,058 | | | | 1.7 | |
| | | | | | | | | 13,824,016 | | | | 2.9 | |
| | | | | | | | | 29,563,499 | | | | 6.1 | |
|
| |
| | | | | | | | | 9,453,165 | | | | 2.0 | |
|
| |
| | | | | | | | | 2,327,952 | | | | 0.5 | |
|
| |
| | | | | | | | | 8,115,149 | | | | 1.7 | |
| | | | | | | | | 3,124,942 | | | | 0.6 | |
| | | | | | | | | 2,582,849 | | | | 0.5 | |
| | | | | | Telecom Italia S.p.A. RNC | | | 3,633,871 | | | | 0.8 | |
| | | | | | | | | 5,413,743 | | | | 1.1 | |
| | | | | | | | | 22,870,554 | | | | 4.7 | |
|
| |
| | | | | | | | | 3,266,218 | | | | 0.7 | |
| |
COMMON STOCK: (continued) |
| |
| | | | | | Dynam Japan Holdings Co. Ltd. | | $ | 1,054,982 | | | | 0.2 | |
| | | | | | Fuji Photo Film Co., Ltd. | | | 4,090,116 | | | | 0.8 | |
| | | | | | | | | 3,897,239 | | | | 0.8 | |
| | | | | | | | | 3,739,868 | | | | 0.8 | |
| | | | | | | | | 4,703,650 | | | | 1.0 | |
| | | | | | | | | 3,199,705 | | | | 0.7 | |
| | | | | | Nippon Telegraph & Telephone Corp. | | | 4,010,357 | | | | 0.8 | |
| | | | | | | | | 3,201,767 | | | | 0.7 | |
| | | | | | Seven & I Holdings Co., Ltd. | | | 5,803,978 | | | | 1.2 | |
| | | | | | Sumitomo Mitsui Financial Group, Inc. | | | 5,851,666 | | | | 1.2 | |
| | | | | | Tokio Marine Holdings, Inc. | | | 6,077,542 | | | | 1.2 | |
| | | | | | | | | 58,885,101 | | | | 12.2 | |
| | | | | | | | | 107,782,189 | | | | 22.3 | |
|
| |
| | | | | | | | | 3,376,937 | | | | 0.7 | |
|
| |
| | | | | | | | | 4,086,649 | | | | 0.9 | |
| | | | | | Royal Dutch Shell PLC — Class A | | | 8,157,746 | | | | 1.7 | |
| | | | | | Royal Dutch Shell PLC — Class B | | | 3,555,169 | | | | 0.7 | |
| | | | | | Koninklijke Philips Electronics NV | | | 3,546,878 | | | | 0.7 | |
| | | | | | | | | 6,017,252 | | | | 1.3 | |
| | | | | | | | | 4,901,618 | | | | 1.0 | |
| | | | | | | | | 6,462,354 | | | | 1.3 | |
| | | | | | | | | 36,727,666 | | | | 7.6 | |
|
| |
| | | | | | | | | 2,832,182 | | | | 0.6 | |
|
| |
| | | | | | | | | 2,170,155 | | | | 0.4 | |
|
| |
| | | | | | | | | 7,055,046 | | | | 1.5 | |
|
| |
| | | | | | | | | 3,315,684 | �� | | | 0.7 | |
|
| |
| | | | | | | | | 3,630,690 | | | | 0.7 | |
| | | | | | | | | 1,900,902 | | | | 0.4 | |
| | | | | | | | | 5,531,592 | | | | 1.1 | |
|
| |
| | | | | | | | | 3,296,250 | | | | 0.7 | |
| | | | | | | | | 3,723,291 | | | | 0.7 | |
| | | | | | | | | 7,019,541 | | | | 1.4 | |
See Accompanying Notes to Financial Statements
95
SUMMARY PORTFOLIO OF INVESTMENTS
AS OF OCTOBER 31, 2012 (CONTINUED)
ING INTERNATIONAL VALUE FUND
Shares
|
|
|
|
|
|
|
| Value
|
| Percentage
of Net
Assets
|
|---|
|
| |
COMMON STOCK: (continued) |
| |
| | | | | | Telefonaktiebolaget LM Ericsson | | $ | 6,215,857 | | | | 1.3 | |
|
| |
| | | | | | | | | 3,489,250 | | | | 0.7 | |
| | | | | | | | | 7,229,677 | | | | 1.5 | |
| | | | | | Roche Holding AG — Genusschein | | | 6,672,152 | | | | 1.4 | |
| | | | | | | | | 8,197,556 | | | | 1.7 | |
| | | | | | | | | 25,588,635 | | | | 5.3 | |
|
| |
| | | | | | | | | 5,867,846 | | | | 1.2 | |
| | | | | | | | | 3,454,428 | | | | 0.7 | |
| | | | | | | | | 6,238,863 | | | | 1.3 | |
| | | | | | | | | 5,856,610 | | | | 1.2 | |
| | | | | | | | | 6,235,247 | | | | 1.3 | |
| | | | | | | | | 3,243,097 | | | | 0.7 | |
| | | | | | | | | 7,979,291 | | | | 1.7 | |
| | | | | | | | | 6,015,997 | | | | 1.3 | |
| | | | | | | | | 4,546,214 | | | | 0.9 | |
| | | | | | | | | 3,902,886 | | | | 0.8 | |
| | | | | | | | | 4,940,179 | | | | 1.0 | |
| | | | | | | | | 6,712,705 | | | | 1.4 | |
| | | | | | | | | 6,948,700 | | | | 1.4 | |
| | | | | | | | | 25,850,563 | | | | 5.4 | |
| | | | | | | | | 97,792,626 | | | | 20.3 | |
|
| |
| | | | | | | | | 3,583,935 | | | | 0.7 | |
| | | | | | | | | 8,441,324 | | | | 1.8 | |
| | | | | | | | | 12,025,259 | | | |
2.5 |
|
| |
| | | | | | | | | | | | | | |
| | | | | | | | | 474,707,805 | | | |
98.4 |
|
| |
|
| |
| | | | | | | | | 68,849 | | | | 0.0 | |
| |
| | | | | | | | | | | | | | |
| | | | | | | | | 68,849 | | | |
0.0 |
|
| |
| | | | | | Total Long-Term Investments | | | | | | | | |
| | | | | | | | | 474,776,654 | | | | 98.4 | |
| |
Principal
Amount†
|
|
|
|
|
|
|
| Value
|
| Percentage
of Net
Assets
|
|---|
| |
SHORT-TERM INVESTMENTS: 1.6% |
| Securities Lending Collateralcc(1): 0.2% |
| | | | | | Daiwa Capital Markets, Repurchase Agreement dated 10/31/12, 0.38%, due 11/01/12 (Repurchase Amount $700,073, collateralized by various U.S. Government and U.S. Government Agency Obligations, 0.000%–6.500%, Market Value plus accrued interest $714,067, due 01/15/14–11/01/42) | | | | | | | | |
| | | | | | | | $ | 700,066 | | | | 0.2 | |
| |
Shares
|
|
|
|
|
|
|
| Value
|
| Percentage
of Net
Assets
|
|---|
| |
| | | | | | BlackRock Liquidity Funds, TempFund, Institutional Class | | | | | | | | |
| | | | | | | | | 6,924,432 | | | |
1.4 |
|
| |
| | | | | | Total Short-Term Investments | | | | | | | | |
| | | | | | | | | 7,624,498 | | | |
1.6 |
|
| |
| | | | | | Total Investments in Securities
(Cost $517,028,086) | | $ | 482,401,152 | | | | 100.0 | |
| | | | | | Assets in Excess of Other Liabilities | | | 182,401 | | | | — | |
| | | | | | | | $ | 482,583,553 | | | | 100.0 | |
“Other Securities” represents issues not identified as the top 50 holdings in terms of market value and issues or issuers not exceeding 1% of net assets individually or in aggregate respectively as of October 31, 2012.
The following footnotes apply to either the individual securities noted or one or more of the securities aggregated and listed as a single line item.
| † | | Unless otherwise indicated, principal amount is shown in USD. |
| # | | Securities with purchases pursuant to Rule 144A or section 4(2), under the Securities Act of 1933 and may not be resold subject to that rule except to qualified institutional buyers. |
| @ | | Non-income producing security |
| ADR | | American Depositary Receipt |
| cc | | Securities purchased with cash collateral for securities loaned. |
| (1) | | Collateral received from brokers for securities lending was invested into these short-term investments. |
| (a) | | This grouping contains securities on loan. |
| | Cost for federal income tax purposes is $528,336,347. |
Net unrealized depreciation consists of: | | | | | | |
Gross Unrealized Appreciation | | | | $ | 41,599,796 | |
Gross Unrealized Depreciation | | | | | (87,534,991 | ) |
Net Unrealized Depreciation | | | | $ | (45,935,195 | ) |
See Accompanying Notes to Financial Statements
96
SUMMARY PORTFOLIO OF INVESTMENTS
AS OF OCTOBER 31, 2012 (CONTINUED)
ING INTERNATIONAL VALUE FUND
Sector Diversification
|
|
|
| Percentage
of Net Assets
|
|---|
| | | | | 20.0 | % |
| | | | | 10.7 | |
| | | | | 10.2 | |
| | | | | 9.8 | |
Telecommunication Services | | | | | 9.3 | |
| | | | | 9.2 | |
| | | | | 8.7 | |
| | | | | 8.6 | |
| | | | | 8.5 | |
| | | | | 3.4 | |
| | | | | 1.6 | |
Assets in Excess of Other Liabilities | | | | | — | |
| | | | | 100.0 | % |
Fair Value Measurementsˆ
The following is a summary of the fair valuations according to the inputs used as of October 31, 2012 in valuing the assets and liabilities:
| | | | Quoted Prices
in Active Markets
for Identical
Investments
(Level 1)
| | Significant
Other
Observable
Inputs#
(Level 2)
| | Significant
Unobservable
Inputs
(Level 3)
| | Fair Value
at
October 31, 2012
|
|---|
| | | | | | | | | | | | | | | | | | |
Investments, at fair value | | | | | | | | | | | | | | | | | | |
| | | | | | | | | | | | | | | | | | |
| | | | $ | 2,567,862 | | | $ | 5,217,363 | | | $ | — | | | $ | 7,785,225 | |
| | | | | — | | | | 6,121,556 | | | | — | | | | 6,121,556 | |
| | | | | 7,195,608 | | | | — | | | | — | | | | 7,195,608 | |
| | | | | 10,534,188 | | | | — | | | | — | | | | 10,534,188 | |
| | | | | — | | | | 7,084,300 | | | | — | | | | 7,084,300 | |
| | | | | — | | | | 2,721,548 | | | | — | | | | 2,721,548 | |
| | | | | — | | | | 2,563,714 | | | | — | | | | 2,563,714 | |
| | | | | — | | | | 49,053,127 | | | | — | | | | 49,053,127 | |
| | | | | — | | | | 29,563,499 | | | | — | | | | 29,563,499 | |
| | | | | — | | | | 9,301,779 | | | | 151,386 | | | | 9,453,165 | |
| | | | | — | | | | 2,327,952 | | | | — | | | | 2,327,952 | |
| | | | | — | | | | 22,870,554 | | | | — | | | | 22,870,554 | |
| | | | | 1,054,982 | | | | 106,727,207 | | | | — | | | | 107,782,189 | |
| | | | | 3,376,937 | | | | — | | | | — | | | | 3,376,937 | |
| | | | | — | | | | 36,727,666 | | | | — | | | | 36,727,666 | |
| | | | | — | | | | 2,832,182 | | | | — | | | | 2,832,182 | |
| | | | | 2,170,155 | | | | — | | | | — | | | | 2,170,155 | |
| | | | | — | | | | 7,055,046 | | | | — | | | | 7,055,046 | |
| | | | | — | | | | 3,315,684 | | | | — | | | | 3,315,684 | |
| | | | | 3,630,690 | | | | 1,900,902 | | | | — | | | | 5,531,592 | |
| | | | | — | | | | 7,019,541 | | | | — | | | | 7,019,541 | |
| | | | | — | | | | 6,215,857 | | | | — | | | | 6,215,857 | |
| | | | | — | | | | 25,588,635 | | | | — | | | | 25,588,635 | |
| | | | | 6,634,267 | | | | 91,158,359 | | | | — | | | | 97,792,626 | |
| | | | | 12,025,259 | | | | — | | | | — | | | | 12,025,259 | |
| | | | | 49,189,948 | | | | 425,366,471 | | | | 151,386 | | | | 474,707,805 | |
| | | | | — | | | | 68,849 | | | | — | | | | 68,849 | |
| | | | | 6,924,432 | | | | 700,066 | | | | — | | | | 7,624,498 | |
Total Investments, at fair value | | | | $ | 56,114,380 | | | $ | 426,135,386 | | | $ | 151,386 | | | $ | 482,401,152 | |
| | | | | | | | | | | �� | | | | | | | |
| ˆ | | See Note 2, “Significant Accounting Policies” in the Notes to Financial Statements for additional information. |
| # | | The earlier close of the foreign markets gives rise to the possibility that significant events, including broad market moves, may have occurred in the interim and may materially affect the value of those securities. To account for this, the Fund may frequently value many of its foreign equity securities using fair value prices based on third party vendor modeling tools to the extent available. Accordingly, a portion of the Fund’s investments are categorized as Level 2 investments. |
There were no transfers in or out of Levels 1, 2 or 3 of the fair value hierarchy during the year ended October 31, 2012.
See Accompanying Notes to Financial Statements
97
PORTFOLIO OF INVESTMENTS
AS OF OCTOBER 31, 2012
ING RUSSIA FUND
Shares
|
|
|
|
|
|
|
| Value
|
| Percentage
of Net
Assets
|
|---|
| |
|
| Consumer Discretionary: 0.5% |
| | | | | | | | $ | 1,201,523 | | | | 0.5 | |
|
| |
| | | | | | | | | 11,803,821 | | | | 4.9 | |
| | | | | | | | | 2,977,976 | | | | 1.2 | |
| | | | | | | | | 1,520,000 | | | | 0.6 | |
| | | | | | | | | 16,301,797 | | | | 6.7 | |
|
| |
| | | | | | Eurasia Drilling Co. Ltd. GDR | | | 1,041,460 | | | | 0.4 | |
| | | | | | | | | 17,341,064 | | | | 7.1 | |
| | | | | | KazMunaiGas Exploration Production GDR | | | 1,625,900 | | | | 0.7 | |
| | | | | | | | | 25,201,182 | | | | 10.3 | |
| | | | | | | | | 10,705,525 | | | | 4.4 | |
| | | | | | | | | 1,617,696 | | | | 0.7 | |
| | | | | | | | | 12,202,035 | | | | 5.0 | |
| | | | | | | | | 4,681,748 | | | | 1.9 | |
| | | | | | | | | 4,893,600 | | | | 2.0 | |
| | | | | | | | | 1,532,053 | | | | 0.6 | |
| | | | | | | | | 10,033,644 | | | | 4.1 | |
| | | | | | | | | 12,915,315 | | | | 5.3 | |
| | | | | | | | | 103,791,222 | | | | 42.5 | |
|
| |
| | | | | | Halyk Savings Bank of Kazakhstan JSC GDR | | | 1,740,833 | | | | 0.7 | |
| | | | | | | | | 5,424,716 | | | | 2.2 | |
| | | | | | | | | 25,808,559 | | | | 10.6 | |
| | | | | | | | | 5,982,237 | | | | 2.4 | |
| | | | | | | | | 38,956,345 | | | | 15.9 | |
|
| |
| | | | | | MD Medical Group Investments PLC GDR | | | 2,626,290 | | | | 1.1 | |
|
| |
| | | | | | Globaltrans Investment PLC GDR | | | 2,560,400 | | | | 1.0 | |
|
| Information Technology: 1.4% |
| | | | | | | | | 1,888,010 | | | | 0.8 | |
| | | | | | | | | 1,501,560 | | | | 0.6 | |
| | | | | | | | | 3,389,570 | | | | 1.4 | |
|
| |
| | | | | | Eurasian Natural Resources Corp. | | | 1,211,306 | | | | 0.5 | |
| | | | | | | | | 2,041,525 | | | | 0.8 | |
| | | | | | | | | 4,786,379 | | | | 2.0 | |
| | | | | | | | | 7,331,743 | | | | 3.0 | |
| | | | | | | | | 2,317,921 | | | | 0.9 | |
| | | | | | | | | 1,042,028 | | | | 0.4 | |
| | | | | | Polymetal International PLC | | | 2,330,747 | | | | 1.0 | |
| |
COMMON STOCK: (continued) |
| |
| | | | | | | | $ | 4,959,953 | | | | 2.0 | |
| | | | | | | | | 11,455,192 | | | | 4.7 | |
| | | | | | | | | 37,476,794 | | | | 15.3 | |
|
| |
| | | | | | | | | 753,906 | | | | 0.3 | |
| | | | | | | | | 875,062 | | | | 0.4 | |
| | | | | | | | | 1,352,703 | | | | 0.6 | |
| | | | | | Mobile Telesystems OJSC ADR | | | 14,025,662 | | | | 5.7 | |
| | | | | | | | | 3,762,543 | | | | 1.5 | |
| | | | | | | | | 1,922,278 | | | | 0.8 | |
| | | | | | | | | 22,692,154 | | | | 9.3 | |
|
| |
| | | | | | Federal Grid Co. Unified Energy System JSC | | | 5,673,664 | | | | 2.3 | |
| | | | | | | | | 6,736,165 | | | | 2.8 | |
| | | | | | | | | 12,409,829 | | | |
5.1 |
|
| |
| | | | | | | | | | | | | | |
| | | | | | | | | 241,405,924 | | | |
98.8 |
|
| |
|
| |
| | | | | | | | | 2,703,119 | | | | 1.1 | |
| |
| | | | | | | | | | | | | | |
| | | | | | | | | 2,703,119 | | | |
1.1 |
|
| |
| | | | | | Total Long-Term Investments | | | | | | | | |
| | | | | | | | | 244,109,043 | | | | 99.9 | |
| |
Principal
Amount†
|
|
|
|
|
|
|
| Value
|
| Percentage
of Net
Assets
|
|---|
| |
SHORT-TERM INVESTMENTS: 5.8% |
| Securities Lending Collateralcc,(1): 5.8% |
| | | | | | Barclays Bank PLC, Repurchase Agreement dated 10/31/12, 0.30%, due 11/01/12 (Repurchase Amount $164,831, collateralized by various U.S. Government Securities, 0.375%–6.125%, Market Value plus accrued interest $168,127, due 04/15/15–05/15/38) | | | 164,830 | | | | 0.0 | |
| | | | | | Citigroup, Inc., Repurchase Agreement dated 10/31/12, 0.32%, due 11/01/12 (Repurchase Amount $3,343,984, collateralized by various U.S. Government and U.S. Government Agency Obligations, 0.000%–11.000%, Market Value plus accrued interest $3,410,835, due 11/15/12–09/20/62) | | | 3,343,955 | | | | 1.4 | |
See Accompanying Notes to Financial Statements
98
PORTFOLIO OF INVESTMENTS
AS OF OCTOBER 31, 2012 (CONTINUED)
ING RUSSIA FUND
Principal
Amount†
|
|
|
|
|
|
|
| Value
|
| Percentage
of Net
Assets
|
|---|
| |
SHORT-TERM INVESTMENTS: (continued) |
| Securities Lending Collateralcc,(1): (continued) |
| | | | | | Daiwa Capital Markets, Repurchase Agreement dated 10/31/12, 0.38%, due 11/01/12 (Repurchase Amount $539,166, collateralized by various U.S. Government and U.S. Government Agency Obligations, 0.000%–6.500%, Market Value plus accrued interest $549,943, due 01/15/14–11/01/42) | | $ | 539,160 | | | | 0.2 | |
| | | | | | Deutsche Bank AG, Repurchase Agreement dated 10/31/12, 0.35%, due 11/01/12 (Repurchase Amount $3,343,987, collateralized by various U.S. Government Securities, 0.000%–2.125%, Market Value plus accrued interest $3,410,834, due 07/15/15–02/15/41) | | | 3,343,955 | | | | 1.4 | |
| | | | | | Merrill Lynch & Co., Inc., Repurchase Agreement dated 10/31/12, 0.33%, due 11/01/12 (Repurchase Amount $3,343,985, collateralized by various U.S. Government Agency Obligations, 3.000%–4.500%, Market Value plus accrued interest $3,410,834, due 01/01/27–10/20/42) | | | 3,343,955 | | | | 1.4 | |
| |
SHORT-TERM INVESTMENTS: (continued) |
| Securities Lending Collateralcc,(1): (continued) |
| | | | | | Mizuho Securities USA Inc., Repurchase Agreement dated 10/31/12, 0.38%, due 11/01/12 (Repurchase Amount $3,343,990, collateralized by various U.S. Government Agency Obligations, 2.034%–11.000%, Market Value plus accrued interest $3,410,834, due 02/01/13–01/01/42) | | $ | 3,343,955 | | | | 1.4 | |
| | | | | | | | | 14,079,810 | | | |
5.8 |
|
| |
| | | | | | Total Short-Term Investments | | | | | | | | |
| | | | | | | | | 14,079,810 | | | |
5.8 |
|
| |
| | | | | | Total Investments in Securities
(Cost $207,261,456) | | $ | 258,188,853 | | | | 105.7 | |
| | | | | | Liabilities in Excess of Other Assets | | | (13,827,378 | ) | | | (5.7 | ) |
| | | | | | | | $ | 244,361,475 | | | | 100.0 | |
| † | | Unless otherwise indicated, principal amount is shown in USD. |
| # | | Securities with purchases pursuant to Rule 144A or section 4(2), under the Securities Act of 1933 and may not be resold subject to that rule except to qualified institutional buyers. |
| @ | | Non-income producing security |
| ADR | | American Depositary Receipt |
| GDR | | Global Depositary Receipt |
| cc | | Securities purchased with cash collateral for securities loaned. |
| L | | Loaned security, a portion or all of the security is on loan at October 31, 2012. |
| (1) | | Collateral received from brokers for securities lending was invested into these short-term investments. |
| | Cost for federal income tax purposes is $216,676,869. |
Net unrealized appreciation consists of: | | | | | | |
Gross Unrealized Appreciation | | | | $ | 70,044,295 | |
Gross Unrealized Depreciation | | | | | (28,532,311 | ) |
Net Unrealized Appreciation | | | | $ | 41,511,984 | |
Fair Value Measurementsˆ
The following is a summary of the fair valuations according to the inputs used as of October 31, 2012 in valuing the assets and liabilities:(1)
| | | | Quoted Prices
in Active Markets
for Identical
Investments
(Level 1)
| | Significant
Other
Observable
Inputs#
(Level 2)
| | Significant
Unobservable
Inputs
(Level 3)
| | Fair Value
at
October 31, 2012
|
|---|
| | | | | | | | | | | | | | | | | | |
Investments, at fair value | | | | | | | | | | | | | | | | | | |
| | | | | | | | | | | | | | | | | | |
| | | | $ | — | | | $ | 1,201,523 | | | $ | — | | | $ | 1,201,523 | |
| | | | | 1,520,000 | | | | 14,781,797 | | | | — | | | | 16,301,797 | |
| | | | | 29,486,238 | | | | 74,304,984 | | | | — | | | | 103,791,222 | |
| | | | | 1,740,833 | | | | 37,215,512 | | | | — | | | | 38,956,345 | |
| | | | | 2,626,290 | | | | — | | | | — | | | | 2,626,290 | |
See Accompanying Notes to Financial Statements
99
PORTFOLIO OF INVESTMENTS
AS OF OCTOBER 31, 2012 (CONTINUED)
ING RUSSIA FUND
| | | | Quoted Prices
in Active Markets
for Identical
Investments
(Level 1)
| | Significant
Other
Observable
Inputs#
(Level 2)
| | Significant
Unobservable
Inputs
(Level 3)
| | Fair Value
at
October 31, 2012
|
|---|
| | | | $ | 2,560,400 | | | $ | — | | | $ | — | | | $ | 2,560,400 | |
| | | | | 1,501,560 | | | | 1,888,010 | | | | — | | | | 3,389,570 | |
| | | | | 3,083,553 | | | | 34,393,241 | | | | — | | | | 37,476,794 | |
| | | | | 14,025,662 | | | | 8,666,492 | | | | — | | | | 22,692,154 | |
| | | | | — | | | | 12,409,829 | | | | — | | | | 12,409,829 | |
| | | | | 56,544,536 | | | | 184,861,388 | | | | — | | | | 241,405,924 | |
| | | | | — | | | | 2,703,119 | | | | — | | | | 2,703,119 | |
| | | | | — | | | | 14,079,810 | | | | — | | | | 14,079,810 | |
Total Investments, at fair value | | | | $ | 56,544,536 | | | $ | 201,644,317 | | | $ | — | | | $ | 258,188,853 | |
| | | | | | | | | | | | | | | | | | |
| (1) | | For the year ended October 31, 2012, as a result of the fair value pricing procedures for international equities utilized by the Fund, certain securities have transferred in and out of Level 1 and Level 2 measurements during the year. The Fund’s policy is to recognize transfers between levels at the end of the reporting period. At October 31, 2012, securities valued at $98,313,612 and $2,897,446 were transferred from Level 1 to Level 2 and Level 2 and Level 1, respectively, within the fair value hierarchy. |
| ˆ | | See Note 2, “Significant Accounting Policies” in the Notes to Financial Statements for additional information. |
| # | | The earlier close of the foreign markets gives rise to the possibility that significant events, including broad market moves, may have occurred in the interim and may materially affect the value of those securities. To account for this, the Fund may frequently value many of its foreign equity securities using fair value prices based on third party vendor modeling tools to the extent available. Accordingly, a portion of the Fund’s investments are categorized as Level 2 investments. |
There were no transfers in or out of Levels 1, 2 or 3 of the fair value hierarchy during the year ended October 31, 2012.
See Accompanying Notes to Financial Statements
100
TAX INFORMATION (UNAUDITED)
Dividends and distributions paid during the year ended October 31, 2012 were as follows:
Fund Name
| | | | Type
| | Per Share Amount
|
|---|
ING Diversified International Fund | | | | | | | | | | |
| | | | | NII | | | $ | 0.1054 | |
| | | | | NII | | | $ | 0.0225 | |
| | | | | NII | | | $ | 0.0227 | |
| | | | | NII | | | $ | 0.1319 | |
| | | | | NII | | | $ | 0.1126 | |
| | | | | NII | | | $ | 0.0855 | |
| | | | | NII | | | $ | 0.1343 | |
| | | | | | | | | | |
| | | | | NII | | | $ | 0.1447 | |
| | | | | NII | | | $ | 0.0602 | |
| | | | | NII | | | $ | 0.0610 | |
| | | | | NII | | | $ | 0.1800 | |
| | | | | NII | | | $ | 0.1460 | |
| | | | | NII | | | $ | 0.1117 | |
| | | | | NII | | | $ | 0.1744 | |
| | | | | STCG | | | $ | 0.3305 | |
| | | | | LTCG | | | $ | 0.1228 | |
| | | | | ROC | | | $ | 0.1644 | |
ING Global Value Choice Fund | | | | | | | | | | |
| | | | | NII | | | $ | 0.3054 | |
| | | | | NII | | | $ | — | |
| | | | | NII | | | $ | 0.0847 | |
| | | | | NII | | | $ | 0.4300 | |
| | | | | NII | | | $ | 0.3871 | |
| | | | | STCG | | | $ | 1.4720 | |
| | | | | LTCG | | | $ | 1.5798 | |
ING Index Plus International Equity Fund | | | | | | | | | | |
| | | | | NII | | | $ | 0.1853 | |
| | | | | NII | | | $ | 0.0932 | |
| | | | | NII | | | $ | 0.1217 | |
| | | | | NII | | | $ | 0.2229 | |
| | | | | NII | | | $ | 0.1864 | |
| | | | | NII | | | $ | 0.2191 | |
ING International Small Cap Fund | | | | | | | | | | |
| | | | | NII | | | $ | 0.5705 | |
| | | | | NII | | | $ | 0.1651 | |
| | | | | NII | | | $ | 0.3323 | |
| | | | | NII | | | $ | 0.7676 | |
| | | | | NII | | | $ | 0.6457 | |
| | | | | NII | | | $ | 0.7165 | |
ING International Value Choice Fund | | | | | | | | | | |
| | | | | NII | | | $ | 0.2727 | |
| | | | | NII | | | $ | 0.1484 | |
| | | | | NII | | | $ | 0.1833 | |
| | | | | NII | | | $ | 0.3032 | |
| | | | | NII | | | $ | 0.3013 | |
ING International Value Fund | | | | | | | | | | |
| | | | | NII | | | $ | 0.2786 | |
| | | | | NII | | | $ | 0.1626 | |
| | | | | NII | | | $ | 0.1944 | |
| | | | | NII | | | $ | 0.3320 | |
| | | | | NII | | | $ | 0.3148 | |
NII — Net investment income
STCG — Short-term capital gain
LTCG — Long-term capital gain
ROC — Return of capital
Of the ordinary distributions made during the year ended October 31, 2012, the following percentages qualify for the dividends received deduction (DRD) available to corporate shareholders:
Diversified International | | | | | 0.78 | % |
| | | | | 16.55 | % |
| | | | | 0.39 | % |
| | | | | 0.62 | % |
For the year ended October 31, 2012, the following are percentages of ordinary income dividends paid by the Funds (including creditable foreign taxes paid) that are designated as qualifying dividend income (QDI) subject to reduced income tax rates for individuals:
Diversified International | | | | | 100.00 | % |
| | | | | 37.51 | % |
Index Plus International Equity | | | | | 100.00 | % |
| | | | | 100.00 | % |
International Value Choice | | | | | 100.00 | % |
| | | | | 100.00 | % |
Pursuant to Internal Revenue Code Section 871(k)(1), the Funds designate the following percentages of net investment income distributions as interest-related dividends:
Pursuant to Internal Revenue Code Section 871(k)(2), the following Funds designate 100% of their short-term capital gain distributions as short-term capital gain dividends:
101
TAX INFORMATION (UNAUDITED) (CONTINUED)
Pursuant to Section 853 of the Internal Revenue Code, the Funds designate the following amounts as foreign taxes paid for the year ended October 31, 2012. Foreign taxes paid for purposes of Section 853 may be less than actual foreign taxes paid for financial statement purposes.
| | | | Creditable Foreign
Taxes Paid
| | Per Share
Amount
| | Portion of Ordinary Income
Distribution Derived from
Foreign Sourced Income*
|
|---|
Diversified International | | | | $ | 143,407 | | | $ | 0.0132 | | | | 84.25 | % |
| | | | $ | 510,446 | | | $ | 0.0743 | | | | 89.47 | % |
Index Plus International Equity | | | | $ | 200,347 | | | $ | 0.0280 | | | | 93.59 | % |
| | | | $ | 431,252 | | | $ | 0.0671 | | | | 74.57 | % |
International Value Choice | | | | $ | 72,086 | | | $ | 0.0287 | | | | 100.00 | % |
| | | | $ | 1,424,152 | | | $ | 0.0303 | | | | 94.01 | % |
| | | | $ | 758,990 | | | $ | 0.0972 | | | | 99.04 | % |
| * | | None of the funds listed above derived any income from ineligible foreign sources as defined under Section 901(j) of the Internal Revenue Code. |
Foreign taxes paid or withheld should be included in taxable income with an offsetting deduction from gross income or as a credit for taxes paid to foreign governments. Shareholders are strongly advised to consult their own tax advisors regarding the appropriate treatment of foreign taxes paid.
Above figures may differ from those cited elsewhere in this report due to differences in the calculation of income and gains under U.S. generally accepted accounting principles (book) purposes and Internal Revenue Service (tax) purposes.
Shareholders are strongly advised to consult their own tax advisers with respect to the tax consequences of their investments in the Funds. In January, shareholders, excluding corporate shareholders, receive an IRS 1099-DIV regarding the federal tax status of the dividends and distributions they received in the calendar year.
102
TRUSTEE AND OFFICER INFORMATION (UNAUDITED)
The business and affairs of the Trust are managed under the direction of the Trust’s Board. A Trustee who is not an interested person of the Trust, as defined in the 1940 Act, is an independent trustee (Independent Trustee). The Trustees and Officers of the Trust are listed below. The Statement of Additional Information includes additional information about trustees of the Trust and is available, without charge, upon request at (800) 992-0180.
Name, Address and Age
| | | | Position(s)
Held with the
Trust
| | Term of Office
and Length of
Time Served(1)
| | Principal
Occupation(s)—
During the Past 5 Years
| | Number of
Funds in
Fund
Complex
Overseen by
Trustee(2)
| | Other
Board Positions
Held by
Trustee
|
|---|
| |
| | | | | | | | | | | | | | | |
| |
Colleen D. Baldwin
7337 East Doubletree Ranch Rd.
Suite 100
Scottsdale, Arizona 85258
Age: 52 | | | | | | IMF November 2007–Present
IMT December 2007–Present | | President, Glantuam Partners, LLC, a business consulting firm (January 2009– Present). | | | | |
| |
John V. Boyer
7337 East Doubletree Ranch Rd.
Suite 100
Scottsdale, Arizona 85258
Age: 59 | | | | | | | | President and Chief Executive Officer, Bechtler Arts Foundation, an arts and education foundation (January 2008–Present). Formerly, Consultant (July 2007–February 2008). | | | | |
| |
Patricia W. Chadwick
7337 East Doubletree Ranch Rd.
Suite 100
Scottsdale, Arizona 85258
Age: 64 | | | | | | | | Consultant and President, Ravengate Partners LLC, a consulting firm that provides advice regarding financial markets and the global economy (January 2000–Present). | | | | Wisconsin Energy Corporation (June 2006–Present) and The Royce Fund, (35 funds) (December 2009–Present). |
| |
Peter S. Drotch
7337 East Doubletree Ranch Rd.
Suite 100
Scottsdale, Arizona 85258
Age: 70 | | | | | | IMF November 2007–Present
IMT December 2007–Present | | | | | | First Marblehead Corporation (September 2003–Present). |
| |
J. Michael Earley
7337 East Doubletree Ranch Rd.
Suite 100
Scottsdale, Arizona 85258
Age: 67 | | | | | | | | Retired. Formerly, Banking President and Chief Executive Officer, Bankers Trust Company, N.A., Des Moines (June 1992–December 2008). | | | | |
| |
Patrick W. Kenny
7337 East Doubletree Ranch Rd.
Suite 100
Scottsdale, Arizona 85258
Age: 69 | | | | | | | | Retired. Formerly, President and Chief Executive Officer, International Insurance Society (June 2001– June 2009). | | | | Assured Guaranty Ltd. (April 2004–Present). |
| |
Sheryl K. Pressler
7337 East Doubletree Ranch Rd.
Suite 100
Scottsdale, Arizona 85258
Age: 62 | | | | | | | | Consultant (May 2001– Present). | | | | Stillwater Mining Company (May 2002–Present). |
| |
Roger B. Vincent
7337 East Doubletree Ranch Rd.
Suite 100
Scottsdale, Arizona 85258
Age: 67 | | | | | | | | Retired. Formerly, President, Springwell Corporation, a corporate finance firm (March 1989–August 2011). | | | | UGI Corporation (February 2006–Present) and UGI Utilities, Inc. (February 2006–Present). |
103
TRUSTEE AND OFFICER INFORMATION (UNAUDITED) (CONTINUED)
Name, Address and Age
| | | | Position(s)
Held with the
Trust
| | Term of Office
and Length of
Time Served(1)
| | Principal
Occupation(s)—
During the Past 5 Years
| | Number of
Funds in
Fund
Complex
Overseen by
Trustee(2)
| | Other
Board Positions
Held by
Trustee
|
|---|
| |
Trustees who are “Interested Persons”: | | | | | | | | | | | | | | | |
| |
Robert W. Crispin(3)
7337 East Doubletree Ranch Rd.
Suite 100
Scottsdale, Arizona 85258
Age: 66 | | | | | | IMF November 2007–Present
IMT December 2007–Present | | | | | | Intact Financial Corporation (December 2004–Present) and PFM Group (November 2010–Present). |
| |
Shaun P. Mathews(3)
7337 East Doubletree Ranch Rd.
Suite 100
Scottsdale, Arizona 85258
Age: 57 | | | | | | IMF November 2007–Present
IMT December 2007–Present | | President and Chief Executive Officer, ING Investments, LLC (November 2006–Present). | | | | ING Capital Corporation, LLC (December 2005–Present). |
(1) | | Trustees serve until their successors are duly elected and qualified. The tenure of each Trustee is subject to the Board’s retirement policy which states that each duly elected or appointed Trustee who is not an “interested person” of the Trust, as defined in the 1940 Act, as amended (“Independent Trustees”), shall retire from service as a Trustee at the conclusion of the first regularly scheduled quarterly meeting of the Board that is held after the Trustee reaches the age of 72. A unanimous vote of the Board may extend the retirement date of a Trustee for up to one year. An extension may be permitted if the retirement would trigger a requirement to hold a meeting of shareholders of the Trust under applicable law, whether for purposes of appointing a successor to the Trustee or if otherwise necessary under applicable law, in which case the extension would apply until such time as the shareholder meeting can be held or is no longer needed. |
(2) | | Except for Mr. Mathews and for the purposes of this table “ING Fund Complex” means the following investment companies: ING Asia Pacific High Dividend Equity Income Fund; ING Emerging Markets High Dividend Equity Fund; ING Emerging Markets Local Bond Fund; ING Equity Trust; ING Funds Trust; ING Global Equity Dividend and Premium Opportunity Fund; ING Global Advantage and Premium Opportunity Fund; ING Global Strategic Income Fund; ING Infrastructure, Industrials and Materials Fund; ING International High Dividend Equity Income Fund; ING Investors Trust; ING Mayflower Trust; ING Mutual Funds; ING Partners, Inc.; ING Prime Rate Trust; ING Risk Managed Natural Resources Fund; ING Senior Income Fund; ING Separate Portfolios Trust; ING Variable Insurance Trust; and ING Variable Products Trust. For Mr. Mathews, the ING Fund Complex also includes the following investment companies: ING Balanced Portfolio, Inc.; ING Intermediate Bond Portfolio; ING Money Market Portfolio; ING Series Fund, Inc.; ING Strategic Allocation Portfolios, Inc.; ING Variable Funds; and ING Variable Portfolios, Inc. Therefore, for the purposes of this table with reference to Mr. Mathews, “Fund Complex” includes these investment companies. The number of funds in the ING Fund Complex is as of November 30, 2012. |
(3) | | Messrs. Crispin and Matthews are deemed “Interested Persons” of the Trust because of their current or prior affiliation with ING Groep, N.V., the parent corporation of the Investment Adviser(s) and the Distributor. |
104
TRUSTEE AND OFFICER INFORMATION (UNAUDITED) (CONTINUED)
Name, Address and Age
| | | | Position(s)
Held With
the Trust
| | Term of Office
and Length of
Time Served(1)
| | Principal Occupation(s)—
During the Past 5 Years
|
|---|
| |
Shaun P. Mathews
7337 East Doubletree Ranch Rd.
Suite 100
Scottsdale, Arizona 85258
Age: 57 | | | | President and Chief Executive Officer | | | | President and Chief Executive Officer, ING Investments, LLC (November 2006–Present). |
| |
Michael J. Roland
7337 East Doubletree Ranch Rd.
Suite 100
Scottsdale, Arizona 85258
Age: 54 | | | | | | | | Managing Director and Chief Operating Officer, ING Investments, LLC and ING Funds Services, LLC (April 2012–Present) and Chief Compliance Officer, Directed Services LLC and ING Investments, LLC (March 2011–Present). Formerly, Executive Vice President and Chief Operating Officer, ING Investments, LLC and ING Funds Services, LLC (January 2007–April 2012) and Chief Compliance Officer, ING Funds (March 2011–February 2012). |
| |
Stanley D. Vyner
230 Park Avenue
New York, New York 10169
Age: 62 | | | | Executive Vice President
Chief Investment Risk Officer | | IMF May 1999–Present
IMT November 1999–Present
September 2009–Present | | Executive Vice President, ING Investments, LLC (July 2000–Present) and Chief Investment Risk Officer, ING Investments, LLC (January 2003–Present). |
| |
Kevin M. Gleason
7337 East Doubletree Ranch Rd.
Suite 100
Scottsdale, Arizona 85258
Age: 46 | | | | | | | | Senior Vice President, ING Investment Management, LLC (February 2012– Present). Formerly, Assistant General Counsel and Assistant Secretary, The Northwestern Mutual Life Insurance Company (June 2004–January 2012). |
| |
Kimberly A. Anderson
7337 East Doubletree Ranch Rd.
Suite 100
Scottsdale, Arizona 85258
Age: 48 | | | | | | | | Senior Vice President, ING Investments, LLC (October 2003– Present). |
| |
Todd Modic
7337 East Doubletree Ranch Rd.
Suite 100
Scottsdale, Arizona 85258
Age: 45 | | | | Senior Vice President, Chief/Principal Financial Officer and Assistant Secretary | | | | Senior Vice President, ING Funds Services, LLC (March 2005–Present). |
| |
Robert Terris
7337 East Doubletree Ranch Rd.
Suite 100
Scottsdale, Arizona 85258
Age: 42 | | | | | | | | Senior Vice President, Head of Division Operations, ING Funds Services, LLC (May 2006–Present). |
| |
Julius Drelick
7337 East Doubletree Ranch Rd.
Suite 100
Scottsdale, Arizona 85258
Age: 46 | | | | | | | | Senior Vice President — Fund Compliance, ING Funds Services, LLC (June 2012–Present). Formerly, Vice President — Platform Product Management & Project Management, ING Investments, LLC (April 2007– June 2012). |
| |
Robyn L. Ichilov
7337 East Doubletree Ranch Rd.
Suite 100
Scottsdale, Arizona 85258
Age: 45 | | | | | | IMF May 1999–Present
IMT November 1999– Present | | Vice President and Treasurer, ING Funds Services, LLC (November 1995–Present) and ING Investments, LLC (August 1997–Present). Formerly, Treasurer, ING Funds (November 1999–February 2012). |
| |
Maria M. Anderson
7337 East Doubletree Ranch Rd.
Suite 100
Scottsdale, Arizona 85258
Age: 54 | | | | | | | | Vice President, ING Funds Services, LLC (September 2004–Present). |
105
TRUSTEE AND OFFICER INFORMATION (UNAUDITED) (CONTINUED)
Name, Address and Age
| | | | Position(s)
Held With
the Trust
| | Term of Office
and Length of
Time Served(1)
| | Principal Occupation(s)—
During the Past 5 Years
|
|---|
| |
Lauren D. Bensinger
7337 East Doubletree Ranch Rd.
Suite 100
Scottsdale, Arizona 85258
Age: 58 | | | | | | | | Vice President, ING Investments, LLC and ING Funds Services, LLC (February 1996–Present); Director of Compliance, ING Investments, LLC (October 2004–Present); and Vice President and Money Laundering Reporting Officer, ING Investments Distributor, LLC (April 2010–Present). Formerly, Chief Compliance Officer, ING Investments Distributor, LLC (August 1995–April 2010). |
| |
Jason Kadavy
7337 East Doubletree Ranch Rd.
Suite 100
Scottsdale, Arizona 85258
Age: 36 | | | | | | | | Vice President, ING Funds Services, LLC (July 2007–Present). |
| |
Fred Bedoya
7337 East Doubletree Ranch Rd.
Suite 100
Scottsdale, Arizona 85258
Age: 39 | | | | Vice President and Treasurer | | | | Vice President, ING Funds Services, LLC (March 2012–Present). Formerly, Assistant Vice President–Director, ING Funds Services, LLC (August 2003–March 2012). |
| |
Kimberly K. Springer
7337 East Doubletree Ranch Rd.
Suite 100
Scottsdale, Arizona 85258
Age: 55 | | | | | | | | Vice President — Platform Product Management & Project Management, ING Investments, LLC (July 2012– Present); Vice President, ING Investment Management — ING Funds (March 2010–Present) and Vice President, ING Funds Services, LLC (March 2006–Present). Formerly Managing Paralegal, Registration Statements (June 2003–July 2012). |
| |
Craig Wheeler
7337 East Doubletree Ranch Rd.
Suite 100
Scottsdale, Arizona 85258
Age: 43 | | | | | | | | Assistant Vice President — Director of Tax, ING Funds Services, LLC (March 2008–Present). Formerly, Tax Manager, ING Funds Services, LLC (March 2005–March 2008). |
| |
Theresa K. Kelety
7337 East Doubletree Ranch Rd.
Suite 100
Scottsdale, Arizona 85258
Age: 49 | | | | | | | | Vice President and Senior Counsel, ING Investment Management — ING Funds (March 2010–Present). Formerly, Senior Counsel, ING Americas, U.S. Legal Services (April 2008–March 2010) and Counsel, ING Americas, U.S. Legal Services (April 2003–April 2008). |
| |
Huey P. Falgout, Jr.
7337 East Doubletree Ranch Rd.
Suite 100
Scottsdale, Arizona 85258
Age: 49 | | | | | | | | Senior Vice President and Chief Counsel, ING Investment Management — ING Funds (March 2010–Present). Formerly, Chief Counsel, ING Americas, U.S. Legal Services (October 2003–March 2010). |
| |
Paul Caldarelli
7337 East Doubletree Ranch Rd.
Suite 100
Scottsdale, Arizona 85258
Age: 61 | | | | | | | | Vice President and Senior Counsel, ING Investment Management — ING Funds (March 2010–Present). Formerly, Senior Counsel, ING Americas, U.S. Legal Services (April 2008–March 2010) and Counsel, ING Americas, U.S. Legal Services (May 2005–April 2008). |
(1) | | The Officers hold office until the next annual meeting of the Board of Trustees and until their successors shall have been elected and qualified. |
106
ADVISORY CONTRACT APPROVAL DISCUSSION (UNAUDITED)
ING International Value Equity Fund (formerly, ING Global Value Choice Fund)
ING International Value Equity Fund (formerly, ING Global Value Choice Fund) had been sub-advised by Tradewinds Global Investors, LLC (“Tradewinds”) since its inception in February 2005. At a meeting of the Board held on September 6, 2012, the Board, including a majority of the independent trustees (“Independent Trustees″), determined to: (1) terminate Tradewinds as sub-adviser to the Fund effective November 13, 2012; (2) appoint ING Investment Management Co. LLC (“ING IM”) as sub-adviser to the Fund; (3) approve an interim sub-advisory agreement with ING IM that became effective on November 30, 2012 (the “Interim Agreement”), under which ING IM would serve as the sub-adviser to the Fund and provide day-to-day management services to the Fund for a period of up to 150 days; and (4) approve a new sub-advisory contract (“Sub-Advisory Contract”) with ING IM under which it would continue to serve as sub-adviser (“Sub-Adviser”) to the Fund upon expiration of the 150 day period of the Interim Agreement. The Sub-Advisory Contract is subject to shareholder approval and is expected to become effective in March 2013. The Interim Agreement was put into place to bridge the period between the termination of Tradewinds and the date of a Special Meeting of Shareholders that was called for the purpose of determining whether to approve the Sub-Advisory Contract.
In determining whether to approve the Interim Agreement and the Sub-Advisory Contract (together, the “Sub-Advisory Agreements”) with ING IM, the Board received and evaluated such information as it deemed necessary for an informed determination of whether the Sub-Advisory Agreements with ING IM should be approved for the Fund. The materials provided to the Board to inform its consideration of whether to approve the Sub-Advisory Agreements with ING IM included the following: (1) ING IM’s presentation before the Joint Meeting of the Domestic Equity Funds Investment Review Committee and the International/Balanced/Fixed Income Funds Investment Review Committee at their September 5, 2012 meeting; (2) memoranda and related materials provided to the Board in advance of its September 6, 2012 meeting discussing: (a) Management’s rationale for appointing ING IM as the sub-adviser to the Fund, including the turnover in the portfolio management team, changes in leadership at Tradewinds, and the Fund’s performance relative to its benchmark and selected peer group (“Selected Peer Group”), (b) the performance of ING IM in managing the International Value Strategy, which is managed in an investment style that is similar to its proposed management of the Fund, and (c) ING IM’s considerable firm-wide resources, investment philosophy, and overall investment process; (3) Fund Analysis and Comparison Tables for the Fund that provide information about the performance and projected net expense ratio of the Fund as compared with a representative group of mutual funds with similar investment programs to the investment program of the Fund as modified in connection with the appointment of ING IM; (4) ING IM’s responses to inquiries from K&L Gates LLP, counsel to the Independent Trustees; (5) supporting documentation, including copies of the form of the Sub-Advisory Agreements; and (6) other information relevant to the Board’s evaluation.
In reaching its decision to engage ING IM, the Board, including a majority of the Independent Trustees, considered a number of factors, including, but not limited to, the following: (1) the view of ING Investments, LLC (“IIL”) with respect to the reputation of ING IM as a manager to other portfolios in the ING Funds complex; (2) the strength and reputation of ING IM in the industry; (3) the nature, extent, and quality of the services to be provided by ING IM under the proposed Sub-Advisory Agreements; (4) the personnel, operations, financial condition, and investment management capabilities, methodologies and resources of ING IM and their fit among the stable of managers in the ING Funds line-up; (5) the compensation under the Sub-Advisory Agreements in light of the services to be provided by ING IM; (6) the costs for the services to be provided by ING IM, including that the management fee rate would not change upon the appointment of ING IM; (7) the sub-advisory fee rate payable by IIL to ING IM; (8) ING IM’s operations and compliance programs, including the policies and procedures intended to assure compliance with the Federal securities laws; (9) the appropriateness of the selection of ING IM in light of the Fund’s investment objective and investor base; and (10) ING IM’s Code of Ethics, which had previously been approved by the Board and related procedures for complying with that Code.
After its deliberation, the Board reached the following conclusions: (1) ING IM should be appointed to serve as sub-adviser to the Fund under the Sub-Advisory Agreements with IIL; (2) the sub-advisory fee rate payable by IIL to ING IM is reasonable in the context of all factors considered by the Board; and (3) ING IM maintains appropriate compliance programs, with this conclusion based upon, among other things, a representation from the Fund’s Chief Compliance Officer that ING IM’s compliance policies and procedures are reasonably designed to assure compliance with the Federal securities laws. Based on these conclusions and other factors, the Board voted to approve the Sub-Advisory Agreements for the Fund. During their deliberations, different Board members may have given different weight to different individual factors and related conclusions.
ING International Value Choice Fund
ING International Value Choice Fund had been sub-advised by Tradewinds since its inception in February 2005. At a meeting of the Board held on September 6, 2012, the Board, including a majority of the
107
ADVISORY CONTRACT APPROVAL DISCUSSION (UNAUDITED) (CONTINUED)
Independent Trustees, determined to: (1) approve the merger of the Fund with and into ING International Value Equity Fund (formerly, ING Global Value Choice Fund), a series of ING Mutual Funds in March 2013 (the “Merger”), subject to shareholder approval of the Merger; (2) terminate Tradewinds as sub-adviser to the Fund effective November 13, 2012; (3) appoint ING IM as sub-adviser to the Fund; (4) approve an interim sub-advisory agreement with ING IM that became effective on November 30, 2012 (the “Interim Agreement”), under which ING IM would serve as the sub-adviser to the Fund and provide day-to-day management services to the Fund for a period of up to 150 days; and (5) approve a new sub-advisory contract (“Sub-Advisory Contract”) with ING IM under which it would continue to serve as sub-adviser to the Fund upon expiration of the 150 day period of the Interim Agreement. The Merger is subject to shareholder approval and is expected to become effective in March 2013. The Sub-Advisory Contract is also subject to shareholder approval and is expected to become effective in March 2013 in the event the merger is not approved or the closing date of the merger takes place after the expiration of the Interim Agreement. The Interim Agreement was put into place to bridge the period between the termination of Tradewinds and the date of a Special Meeting of Shareholders that was called for the purpose of determining whether to approve the Merger.
In determining whether to approve the Interim Agreement and the Sub-Advisory Contract (together, the “Sub-Advisory Agreements”) with ING IM, the Board received and evaluated such information as it deemed necessary for an informed determination of whether the Sub-Advisory Agreements with ING IM should be approved for the Fund. The materials provided to the Board to inform its consideration of whether to approve the Sub-Advisory Agreements with ING IM included the following: (1) ING IM’s presentation before the Joint Meeting of the Domestic Equity Funds Investment Review Committee and the International/Balanced/Fixed Income Funds Investment Review Committee at their September 5, 2012 meeting; (2) memoranda and related materials provided to the Board in advance of its September 6, 2012 meeting discussing: (a) Management’s rationale for proposing the Merger and appointing ING IM as the sub-adviser to the Fund, including the turnover in the portfolio management team, changes in leadership at Tradewinds, and the Fund’s performance relative to its benchmark and Selected Peer Group, (b) the performance of ING IM in managing the International Value Strategy, which is managed in an investment style that is similar to its proposed management of the ING International Equity Fund, which the Fund was proposed to merge into, and (c) ING IM’s considerable firm-wide resources, investment philosophy, and overall investment process; (3) Fund Analysis and Comparison Tables for the Fund that provide information about the performance and projected net expense ratio of the Fund as compared with a representative group of mutual funds with similar investment programs to the investment program of the Fund as modified in connection with the appointment of ING IM; (4) ING IM’s responses to inquiries from K&L Gates LLP, counsel to the Independent Trustees; (5) supporting documentation, including copies of the form of the Sub-Advisory Agreements; and (6) other information relevant to the Board’s evaluation.
In reaching its decision to engage ING IM, the Board, including a majority of the Independent Trustees, considered a number of factors, including, but not limited to, the following: (1) the view of IIL with respect to the reputation of ING IM as a manager to other portfolios in the ING Funds complex; (2) the strength and reputation of ING IM in the industry; (3) the nature, extent, and quality of the services to be provided by ING IM under the proposed Sub-Advisory Agreements; (4) the personnel, operations, financial condition, and investment management capabilities, methodologies and resources of ING IM and their fit among the stable of managers in the ING Funds line-up; (5) the compensation under the Sub-Advisory Agreements in light of the services to be provided by ING IM; (6) the costs for the services to be provided by ING IM, including that the management fee rate would not change upon the appointment of ING IM; (7) the sub-advisory fee rate payable by IIL to ING IM; (8) ING IM’s operations and compliance programs, including the policies and procedures intended to assure compliance with the Federal securities laws; (9) the appropriateness of the selection of ING IM in light of the Fund’s investment objective and investor base; and (10) ING IM’s Code of Ethics, which had previously been approved by the Board and related procedures for complying with that Code.
After its deliberation, the Board reached the following conclusions: (1) ING IM should be appointed to serve as sub-adviser to the Fund under the Sub-Advisory Agreements with IIL; (2) the sub-advisory fee rate payable by IIL to ING IM is reasonable in the context of all factors considered by the Board; and (3) ING IM maintains appropriate compliance programs, with this conclusion based upon, among other things, a representation from the Fund’s Chief Compliance Officer that ING IM’s compliance policies and procedures are reasonably designed to assure compliance with the Federal securities laws. Based on these conclusions and other factors, the Board voted to approve the Sub-Advisory Agreements for the Fund. During their deliberations, different Board members may have given different weight to different individual factors and related conclusions.
108
(THIS PAGE INTENTIONALLY LEFT BLANK)
Investment Adviser
ING Investments, LLC
7337 East Doubletree Ranch Road, Suite 100
Scottsdale, Arizona 85258
Administrator
ING Funds Services, LLC
7337 East Doubletree Ranch Road, Suite 100
Scottsdale, Arizona 85258
Distributor
ING Investments Distributor, LLC
7337 East Doubletree Ranch Road, Suite 100
Scottsdale, Arizona 85258
Transfer Agent
BNY Mellon Investment Servicing (U.S.) Inc.
301 Bellevue Parkway
Wilmington, Delaware 19809
Independent Registered Public Accounting Firm
KPMG LLP
Two Financial Center
60 South Street
Boston, Massachusetts 02111
Custodian
The Bank of New York Mellon
One Wall Street
New York, New York 10286
Legal Counsel
Dechert LLP
1775 I Street, N.W.
Washington, D.C. 20006
For more complete information, or to obtain a prospectus on any ING Fund, please call your investment professional or ING Investments Distributor, LLC at (800) 992-0180 or log on to www.inginvestment.com. The prospectus should be read carefully before investing. Consider the fund’s investment objectives, risks, charges and expenses carefully before investing. The prospectus contains this information and other information about the fund. Check with your investment professional to determine which funds are available for sale within their firm. Not all funds are available for sale at all firms.
AR-UINTDIF (1012-122012)
Item 2. Code of Ethics.
As of the end of the period covered by this report, Registrant had adopted a code of ethics, as defined in Item 2 of Form N-CSR, that applies to the Registrant’s principal executive officer and principal financial officer. There were no amendments to the Code during the period covered by the report. The Registrant did not grant any waivers, including implicit waivers, from any provisions of the Code during the period covered by this report. The code of ethics is filed herewith pursuant to Item 10 (a)(l), Exhibit 99.CODE ETH.
Item 3. Audit Committee Financial Expert.
The Board of Trustees has determined that J. Michael Earley, Peter S. Drotch and Colleen Baldwin are audit committee financial experts, as defined in Item 3 of Form N-CSR. Mr. Earley, Mr. Drotch and Ms. Baldwin are “independent” for purposes of Item 3 of Form N-CSR.
Item 4. Principal Accountant Fees and Services.
| (a) | | Audit Fees: The aggregate fees billed for each of the last two fiscal years for professional services rendered by KPMG LLP (“KPMG”), the principal accountant for the audit of the registrant’s annual financial statements, for services that are normally provided by the accountant in connection with statutory and regulatory filings or engagements for those fiscal years were $22,708 for year ended October 31, 2012 and $37,318 for year ended October 31, 2011. |
| |
| (b) | | Audit-Related Fees: The aggregate fees billed in each of the last two fiscal years for assurance and related services by KPMG that are reasonably related to the performance of the audit of the registrant’s financial statements and are not reported under paragraph (a) of this Item were $2,400 for the year ended October 31, 2012 and $2,400 for the year ended October 31, 2011. |
| |
| (c) | | Tax Fees: The aggregate fees billed in each of the last two fiscal years for professional services rendered by KPMG for tax compliance, tax advice, and tax planning were $9,457 in the year ended October 31, 2012 and $7,414 in the year ended October 31, 2011. Such services induced review of excise distribution calculations (if applicable), preparation of the Funds’ federal, state and excise tax returns, tax services related to mergers and routine consulting. |
| |
| (d) | | All Other Fees: The aggregate fees billed in each of the last two fiscal years for products and services provided by KPMG, other than the services reported in paragraphs (a) through (c) of this Item were $0 for the year ended October 31, 2012 and $0 for the year ended October 31, 2011. |
| |
| (e) | | (1) Audit Committee Pre-Approval Policies and Procedures |
AUDIT AND NON-AUDIT SERVICES
PRE-APPROVAL POLICY
I.
Statement of Principles
Under the Sarbanes-Oxley Act of 2002 (the “Act”), the Audit Committee of the Board of Directors or Trustees (the “Committee”) of the ING Funds (each a “Fund,” collectively, the “Funds”) set out on Exhibit A to this Audit and Non-Audit Services Pre-Approval Policy (“Policy”) is responsible for the oversight of the work of the Funds’ independent auditors. As part of its responsibilities, the Committee must pre-approve the audit and non-audit services performed by the auditors in order to assure that the provision of these services does not impair the auditors’ independence from the Funds. The Committee has adopted, and the Board has ratified, this Policy, which sets out the procedures and conditions under which the services of the independent auditors may be pre-approved.
Under Securities and Exchange Commission (“SEC”) rules promulgated in accordance with the Act, the Funds may establish two different approaches to pre-approving audit and non-audit services. The Committee may approve services without consideration of specific case-by-case services (“general pre-approval”) or it may pre-approve specific services (“specific pre-approval”). The Committee believes that the combination of these approaches contemplated in this Policy results in an effective and efficient method for pre-approving audit and non-audit services to be performed by the Funds’ independent auditors. Under this Policy, services that are not of a type that may receive general pre-approval require specific pre-approval by the Committee. Any proposed services that exceed pre-approved cost levels or budgeted amounts will also require the Committee’s specific pre-approval.
For both types of approval, the Committee considers whether the subject services are consistent with the SEC’s rules on auditor independence and that such services are compatible with maintaining the auditors independence. The Committee also considers whether a particular audit firm is in the best position to provide effective and efficient services to the Funds. Reasons that the auditors are in the best position include the auditors’ familiarity with the Funds’ business, personnel, culture, accounting systems, risk profile, and other factors, and whether the services will enhance the Funds’ ability to manage and control risk or improve audit quality. Such factors will be considered as a whole, with no one factor being determinative.
The appendices attached to this Policy describe the audit, audit-related, tax-related, and other services that have the Committee’s general pre-approval. For any service that has been approved through general pre-approval, the general pre-approval will remain in place for a period 12 months from the date of pre-approval, unless the Committee determines that a different period is appropriate. The Committee will annually review and pre-approve the services that may be provided by the independent auditors without specific pre-approval. The Committee will revise the list of services subject to general pre-approval as appropriate. This Policy does not serve as a delegation to Fund management of the Committee’s duty to pre-approve services performed by the Funds’ independent auditors.
II.
Audit Services
The annual audit services engagement terms and fees are subject to the Committee’s specific pre-approval. Audit services are those services that are normally provided by auditors in connection with statutory and regulatory filings or engagements or those that generally only independent auditors can reasonably provide. They include the Funds’ annual financial statement audit and procedures that the independent auditors must perform in order to form an opinion on the Funds’ financial statements (e.g., information systems and procedural reviews and testing). The Committee will monitor the audit services engagement and approve any changes in terms, conditions or fees deemed by the Committee to be necessary or appropriate.
The Committee may grant general pre-approval to other audit services, such as statutory audits and services associated with SEC registration statements, periodic reports and other documents filed with the SEC or issued in connection with securities offerings.
The Committee has pre-approved the audit services listed on Appendix A. The Committee must specifically approve all audit services not listed on Appendix A.
III.
Audit-related Services
Audit-related services are assurance and related services that are reasonably related to the performance of the audit or the review of the Funds’ financial statements or are traditionally performed by the independent auditors. The Committee believes that the provision of audit-related services will not impair the independent auditors’ independence, and therefore may grant pre-approval to audit-related services. Audit-related services include accounting consultations related to accounting, financial reporting or disclosure matters not classified as “audit services;” assistance with understanding and implementing new accounting and financial reporting guidance from rulemaking authorities; agreed-upon or expanded audit procedures relating to accounting and/or billing records required to respond to or comply with financial, accounting or regulatory reporting matters; and assistance with internal control reporting requirements under Form N-SAR or Form N-CSR.
The Committee has pre-approved the audit-related services listed on Appendix B. The Committee must specifically approve all audit-related services not listed on Appendix B.
IV.
Tax Services
The Committee believes the independent auditors can provide tax services to the Funds, including tax compliance, tax planning, and tax advice, without compromising the auditors’ independence. Therefore, the Committee may grant general pre-approval with respect to tax services historically provided by the Funds’ independent auditors that do not, in the Committee’s view, impair auditor independence and that are consistent with the SEC’s rules on auditor independence.
The Committee will not grant pre-approval if the independent auditors initially recommends a transaction the sole business purpose of which is tax avoidance and the tax treatment of which may not be supported in the Internal Revenue Code and related regulations. The Committee may consult
2
outside counsel to determine that tax planning and reporting positions are consistent with this Policy.
The Committee has pre-approved the tax-related services listed on Appendix C. The Committee must specifically approve all tax-related services not listed on Appendix C.
V.
Other Services
The Committee believes it may grant approval of non-audit services that are permissible services for independent auditors to a Fund. The Committee has determined to grant general pre-approval to other services that it believes are routine and recurring, do not impair auditor independence, and are consistent with SEC rules on auditor independence.
The Committee has pre-approved the non-audit services listed on Appendix D. The Committee must specifically approve all non-audit services not listed on Appendix D.
A list of the SEC’s prohibited non-audit services is attached to this Policy as Appendix E. The SEC’s rules and relevant guidance should be consulted to determine the precise definitions of these impermissible services and the applicability of exceptions to certain of the SEC’s prohibitions.
VI.
Pre-approval of Fee levels and Budgeted Amounts
The Committee will annually establish pre-approval fee levels or budgeted amounts for audit, audit-related, tax and non-audit services to be provided to the Funds by the independent auditors. Any proposed services exceeding these levels or amounts require the Committee’s specific pre-approval. The Committee considers fees for audit and non-audit services when deciding whether to pre-approve services. The Committee may determine, for a pre-approval period of 12 months, the appropriate ratio between the total amount of fees for the Fund’s audit, audit-related, and tax services (including fees for services provided to Fund affiliates that are subject to pre-approval), and the total amount of fees for certain permissible non-audit services for the Fund classified as other services (including any such services provided to Fund affiliates that are subject to pre-approval).
VII.
Procedures
Requests or applications for services to be provided by the independent auditors will be submitted to management. If management determines that the services do not fall within those services generally pre-approved by the Committee and set out in the appendices to these procedures, management will submit the services to the Committee or its delagee. Any such submission will include a detailed description of the services to be rendered. Notwithstanding this paragraph, the Committee will, on a quarterly basis, receive from the independent auditors a list of services provided for the previous calendar quarter on a cumulative basis by the auditors during the Pre-Approval Period.
3
VIII.
Delegation
The Committee may delegate pre-approval authority to one or more of the Committee’s members. Any member or members to whom such pre-approval authority is delegated must report any pre-approval decisions, including any pre-approved services, to the Committee at its next scheduled meeting. The Committee will identify any member to whom pre-approval authority is delegated in writing. The member will retain such authority for a period of 12 months from the date of pre-approval unless the Committee determines that a different period is appropriate. The period of delegated authority may be terminated by the Committee or at the option of the member.
IX.
Additional Requirements
The Committee will take any measures the Committee deems necessary or appropriate to oversee the work of the independent auditors and to assure the auditors’ independence from the Funds. This may include reviewing a formal written statement from the independent auditors delineating all relationships between the auditors and the Funds, consistent with Independence Standards Board No. 1, and discussing with the auditors their methods and procedures for ensuring independence.
Effective April 23, 2008, the KPMG LLP (“KPMG”) audit team for the ING Funds accepted the global responsibility for monitoring the auditor independence for KPMG relative to the ING Funds. Using a proprietary system called Sentinel, the audit team is able to identify and manage potential conflicts of interest across the member firms of the KPMG International Network and prevent the provision of prohibited services to the ING entities that would impair KPMG independence with the respect to the ING Funds. In addition to receiving pre-approval from the ING Funds Audit Committee for services provided to the ING Funds and for services for ING entities in the Investment Company Complex, the audit team has developed a process for periodic notification via email to the ING Funds’ Audit Committee Chairpersons regarding requests to provide services to ING Groep NV and its affiliates from KPMG offices worldwide. Additionally, KPMG provides a quarterly summary of the fees for services that have commenced for ING Groep NV and Affiliates at each Audit Committee Meeting.
4
Last Approved: November 17, 2011
5
Appendix A
Pre-Approved Audit Services for the Pre-Approval Period January 1, 2012 through December 31, 2012
| | |
Service |
| The Fund(s) | Fee Range |
Statutory audits or financial audits (including tax services associated with audit services) | √ | As presented to Audit Committee1 |
Services associated with SEC registration statements, periodic reports and other documents filed with the SEC or other documents issued in connection with securities offerings (e.g., consents), and assistance in responding to SEC comment letters. | √ | Not to exceed $9,750 per filing |
Consultations by Fund management with respect to accounting or disclosure treatment of transactions or events and/or the actual or potential effect of final or proposed rules, standards or interpretations by the SEC, Financial Accounting Standards Board, or other regulatory or standard setting bodies. | √ | Not to exceed $8,000 during the Pre-Approval Period |
Seed capital audit and related review and issuance of consent on the N-2 registration statement | √ | Not to exceed $13,000 per audit |
____________________
1
For new Funds launched during the Pre-Approval Period, the fee ranges pre-approved will be the same as those for existing Funds, pro-rated in accordance with inception dates as provided in the auditors’ Proposal or any Engagement Letter covering the period at issue. Fees in the Engagement Letter will be controlling.
6
Appendix B
Pre-Approved Audit-Related Services for the Pre-Approval Period January 1, 2012 through December 31, 2012
| | | |
Service |
| The Fund(s) | Fund Affiliates | Fee Range |
Services related to Fund mergers (Excludes tax services - See Appendix C for tax services associated with Fund mergers) | √ | √ | Not to exceed $10,000 per merger |
Consultations by Fund management with respect to accounting or disclosure treatment of transactions or events and/or the actual or potential effect of final or proposed rules, standards or interpretations by the SEC, Financial Accounting Standards Board, or other regulatory or standard setting bodies. [Note: Under SEC rules some consultations may be “audit” services and others may be “audit-related” services.] | √ | | Not to exceed $5,000 per occurrence during the Pre-Approval Period |
Review of the Funds’ semi-annual and quarterly financial statements | √ | | Not to exceed $2,400 per set of financial statements per fund |
Reports to regulatory or government agencies related to the annual engagement | √ | | Up to $5,000 per occurrence during the Pre-Approval Period |
Regulatory compliance assistance | √ | √ | Not to exceed $5,000 per quarter |
Training courses | | √ | Not to exceed $2,000 per course |
For Prime Rate Trust, agreed upon procedures for quarterly reports to rating agencies | √ | | Not to exceed $9,450 per quarter |
| | | |
7
Appendix C
Pre-Approved Tax Services for the Pre-Approval Period January 1, 2012 through December 31, 2012
| | | |
Service |
| The Fund(s) | Fund Affiliates | Fee Range |
Preparation of federal and state income tax returns and federal excise tax returns for the Funds including assistance and review with excise tax distributions | √ | | As presented to Audit Committee2 |
Review of IRC Sections 851(b) and 817(h) diversification testing on a real-time basis | √ | | As presented to Audit Committee2 |
Assistance and advice regarding year-end reporting for 1099’s | √ | | As presented to Audit Committee2 |
Tax assistance and advice regarding statutory, regulatory or administrative developments | √ | √ | Not to exceed $5,000 for the Funds or for the Funds’ investment adviser during the Pre-Approval Period |
____________________
2
For new Funds launched during the Pre-Approval Period, the fee ranges pre-approved will be the same as those for existing Funds, pro-rated in accordance with inception dates as provided in the auditors’ Proposal or any Engagement Letter covering the period at issue. Fees in the Engagement Letter will be controlling.
8
Appendix C, continued
| | | |
Service |
| The Fund(s) | Fund Affiliates | Fee Range |
Tax training courses | | √ | Not to exceed $2,000 per course during the Pre-Approval Period |
Tax services associated with Fund mergers | √ | √ | Not to exceed $4,000 per fund per merger during the Pre-Approval Period |
Other tax-related assistance and consultation, including, without limitation, assistance in evaluating derivative financial instruments and international tax issues, qualification and distribution issues, and similar routine tax consultations. | √ | | Not to exceed $120,000 during the Pre-Approval Period |
9
Appendix D
Pre-Approved Other Services for the Pre-Approval Period January 1, 2012 through December 31, 2012
| | | |
Service |
| The Fund(s) | Fund Affiliates | Fee Range |
Agreed-upon procedures for Class B share 12b-1 programs | | √ | Not to exceed $60,000 during the Pre-Approval Period |
Security counts performed pursuant to Rule 17f-2 of the 1940 Act (i.e., counts for Funds holding securities with affiliated sub-custodians) Cost to be borne 50% by the Funds and 50% by ING Investments, LLC. | √ | √ | Not to exceed $5,000 per Fund during the Pre-Approval Period |
Agreed upon procedures for 15 (c) FACT Books | √ | | Not to exceed $35,000 during the Pre-Approval Period |
10
Appendix E
Prohibited Non-Audit Services
Dated:
January 1, 2012 to December 31, 2012
·
Bookkeeping or other services related to the accounting records or financial statements of the Funds
·
Financial information systems design and implementation
·
Appraisal or valuation services, fairness opinions, or contribution-in-kind reports
·
Actuarial services
·
Internal audit outsourcing services
·
Management functions
·
Human resources
·
Broker-dealer, investment adviser, or investment banking services
·
Legal services
·
Expert services unrelated to the audit
·
Any other service that the Public Company Accounting Oversight Board determines, by regulation, is impermissible
11
EXHIBIT A
ING EQUITY TRUST
ING FUNDS TRUST
ING ASIA PACIFIC HIGH DIVIDEND EQUITY INCOME FUND
ING GLOBAL ADVANTAGE AND PREMIUM OPPORTUNITY FUND
ING GLOBAL EQUITY DIVIDEND AND PREMIUM OPPORTUNITY FUND
ING INTERNATIONAL HIGH DIVIDEND EQUITY INCOME FUND
ING INFRASTRUCTURE, INDUSTRIALS, AND MATERIALS FUND
ING RISK MANAGED NATURAL RESOURCES FUNDING INVESTORS TRUST
ING MAYFLOWER TRUST
ING MUTUAL FUNDS
ING PARTNERS, INC.
ING PRIME RATE TRUST
ING SENIOR INCOME FUND
ING SEPARATE PORTFOLIOS TRUST
ING VARIABLE INSURANCE TRUST
ING VARIABLE PRODUCTS TRUST
ING EMERGING MARKETS LOCAL BOND FUND
ING EMERING MARKETS HIGH DIVIDEND EQUITY FUND
| | | |
| (e)(2) | | Percentage of services referred to in 4(b) – (4)(d) that were approved by the audit committee |
| | | |
| | 100% of the services were approved by the audit committee. |
| | | |
| (f) | | Percentage of hours expended attributable to work performed by other than full time employees of KPMG if greater than 50%. |
| | | |
| | Not applicable. |
| | | |
| (g) | | Non-Audit Fees: The non-audit fees billed by the registrant’s accountant for services rendered to the registrant, and rendered to the registrant’s investment adviser, and any entity controlling, controlled by, or under common control with the adviser that provides ongoing services to the registrant for each of the last two fiscal years of the registrant were $351,837 for year ended October 31, 2012 and $50,106 for year ended October 31, 2011. |
| | | |
| (h) | | Principal Accountants Independence: The Registrant’s Audit committee has considered whether the provision of non-audit services that were rendered to the registrant’s investment adviser and any entity controlling, controlled by, or under common control with the investment adviser that provides ongoing services to the registrant that were not pre-approved pursuant to Rule 2-01(c)(7)(ii) of Regulation S-X is compatible with maintaining KPMG’s independence. |
Item 5. Audit Committee of Listed Registrants.
Not applicable.
Item 6. Schedule of Investments
ING INTERNATIONAL VALUE FUND | SUMMARY PORTFOLIO OF INVESTMENTS |
AS OF OCTOBER 31, 2012 |
| | Shares | | | | Value | Percentage
of Net
Assets |
| | COMMON STOCK: 98.4% |
| | | | Australia: 1.6% |
| | 118,005 | | Australia & New Zealand Banking Group Ltd. | 3,113,136 | 0 .7 |
| | 36,300 | | BHP Billiton Ltd. ADR | 2,567,862 | 0 .5 |
| | 205,144 | | Iluka Resources Ltd. | 2,104,227 | 0 .4 |
| | | | | 7,785,225 | 1 .6 |
| | | | | | |
| | | | Belgium: 1.3% |
| | 110,129 | | Belgacom S.A. | 3,219,728 | 0 .7 |
| | 123,359 | | KBC Groep NV | 2,901,828 | 0 .6 |
| | | | | 6,121,556 | 1 .3 |
| | | | | | |
| | | | Brazil: 1.5% |
| | 63,592 | | Banco do Brasil S.A. | 678,486 | 0 .1 |
| | 144,000 | | Banco Santander Brasil SA ADR | 979,200 | 0 .2 |
| | 196,071 | | Centrais Eletricas Brasileiras SA ADR | 1,090,155 | 0 .2 |
| | 120,170 | | Petroleo Brasileiro SA ADR | 2,467,090 | 0 .5 |
| | 55,530 | | Telefonica Brasil SA ADR | 1,222,770 | 0 .3 |
| | 43,608 | | Tim Participacoes SA ADR | 757,907 | 0 .2 |
| | | | | 7,195,608 | 1 .5 |
| | | | | | |
| | | | Canada: 2.2% |
| | 74,500 | | Barrick Gold Corp. | 3,017,250 | 0 .6 |
| | 177,000 | | Kinross Gold Corp. | 1,768,230 | 0 .4 |
| | 27,900 | | Magna International, Inc. | 1,239,039 | 0 .2 |
| | 29,600 | | National Bank Of Canada | 2,287,387 | 0 .5 |
| | 66,100 | | Suncor Energy, Inc. | 2,222,282 | 0 .5 |
| | | | | 10,534,188 | 2 .2 |
| | | | | | |
| | | | China: 1.5% |
| | 232,500 | | China Mobile Ltd. | 2,578,831 | 0 .6 |
| | 754,000 | | China Overseas Land & Investment Ltd. | 1,963,302 | 0 .4 |
| | 3,182,000 | | Huaneng Power International, Inc. | 2,542,167 | 0 .5 |
| | 190,000 | @,X | Sino-Forest Corp. | – | – |
| | | | | 7,084,300 | 1 .5 |
| | | | | | |
| | | | Denmark: 0.6% |
| | 173,971 | @ | Danske Bank A/S | 2,721,548 | 0 .6 |
| | | | | | |
| | | | Finland: 0.5% |
| | 405,293 | | Stora Enso OYJ (Euro Denominated Security) | 2,563,714 | 0 .5 |
| | | | | | |
| | | | France: 10.2% |
| | 13,083 | | Air Liquide | 1,544,467 | 0 .3 |
| | 264,457 | | AXA S.A. | 4,215,082 | 0 .9 |
| | 65,605 | | BNP Paribas | 3,309,425 | 0 .7 |
| | 156,569 | | Carrefour S.A. | 3,781,222 | 0 .8 |
| | 277,335 | | France Telecom S.A. | 3,099,900 | 0 .6 |
| | 178,780 | | Gaz de France | 4,103,401 | 0 .9 |
| | 332,128 | | Natixis | 1,090,067 | 0 .2 |
| | 55,118 | | Renault S.A. | 2,471,420 | 0 .5 |
| | 133,041 | | Sanofi-Aventis | 11,684,589 | 2 .4 |
| | 43,100 | | Schneider Electric S.A. | 2,698,675 | 0 .6 |
| | 81,018 | @ | Societe Generale | 2,583,823 | 0 .5 |
| | 12,284 | | Technip S.A. | 1,385,516 | 0 .3 |
| | 140,670 | | Total S.A. | 7,085,540 | 1 .5 |
| | | | | 49,053,127 | 10 .2 |
| | | | | | |
| | | | Germany: 6.1% |
| | 28,659 | | BASF AG | 2,377,263 | 0 .5 |
| | 24,843 | | Bayer AG | 2,166,126 | 0 .4 |
| | 32,206 | | Bayerische Motoren Werke AG | 2,574,726 | 0 .5 |
| | 8,470 | | DaimlerChrysler AG | 396,774 | 0 .1 |
| | 28,500 | | Deutsche Bank AG | 1,298,199 | 0 .3 |
| | 163,359 | | Deutsche Post AG | 3,238,736 | 0 .7 |
| | 350,941 | | Deutsche Telekom AG | 4,003,689 | 0 .8 |
| | 112,085 | | E.ON AG | 2,551,612 | 0 .5 |
| | 33,725 | | SAP AG | 2,459,316 | 0 .5 |
| | 84,331 | | Siemens AG | 8,497,058 | 1 .8 |
| | | | | 29,563,499 | 6 .1 |
| | | | | | |
| | | | Hong Kong: 2.0% |
| | 494,000 | | AIA Group Ltd. | 1,948,073 | 0 .4 |
| | 6,582,000 | @,X | Chaoda Modern Agriculture Holdings Ltd. | 151,386 | 0 .1 |
| | 510,000 | L | Esprit Holdings Ltd. | 659,446 | 0 .1 |
| | 281,500 | | Power Assets Holdings Ltd. | 2,392,059 | 0 .5 |
| | 397,000 | | Wharf Holdings Ltd. | 2,706,866 | 0 .6 |
| | 463,500 | | Yue Yuen Industrial Holdings | 1,595,335 | 0 .3 |
| | | | | 9,453,165 | 2 .0 |
| | | | | | |
| | | | Israel: 0.5% |
| | 186,078 | | Israel Chemicals Ltd. | 2,327,952 | 0 .5 |
| | | | | | |
| | | | Italy: 4.7% |
| | 651,064 | | Enel S.p.A. | 2,451,730 | 0 .5 |
| | 352,667 | | ENI S.p.A. | 8,115,149 | 1 .7 |
| | 258,225 | | Fiat Industrial SpA | 2,798,882 | 0 .6 |
| | 1,939,890 | | Intesa Sanpaolo S.p.A. | 3,124,942 | 0 .6 |
| | 123,300 | | Intesa Sanpaolo SpA | 163,131 | 0 .0 |
| | 2,799,503 | | Telecom Italia S.p.A. | 2,582,849 | 0 .5 |
| | 4,538,016 | | Telecom Italia S.p.A. RNC | 3,633,871 | 0 .8 |
| | | | | 22,870,554 | 4 .7 |
| | | | | | |
| | | | Japan: 22.3% |
| | 48,500 | | Astellas Pharma, Inc. | 2,412,273 | 0 .5 |
| | 49,600 | | Bridgestone Corp. | 1,158,607 | 0 .2 |
| | 100,500 | | Canon, Inc. | 3,266,217 | 0 .7 |
| | 705,590 | | Sumitomo Mitsui Trust Holdings, Inc. | 2,141,326 | 0 .4 |
| | 379,600 | | Dai Nippon Printing Co., Ltd. | 2,689,865 | 0 .5 |
| | 127,036 | | Daiichi Sankyo Co., Ltd. | 1,944,420 | 0 .4 |
| | 596,800 | #,@ | Dynam Japan Holdings Co. Ltd. | 1,054,982 | 0 .2 |
| | 242,300 | | Fuji Photo Film Co., Ltd. | 4,090,116 | 0 .8 |
| | 241,000 | | Hachijuni Bank Ltd. | 1,244,959 | 0 .2 |
| | 734,888 | | Hitachi Ltd. | 3,897,239 | 0 .8 |
| | 124,400 | | Honda Motor Co., Ltd. | 3,739,868 | 0 .8 |
| | 133,800 | | Hoya Corp. | 2,709,788 | 0 .6 |
| | 285 | | Inpex Holdings, Inc. | 1,623,607 | 0 .3 |
| | 170,100 | | Japan Tobacco, Inc. | 4,703,650 | 1 .0 |
ING INTERNATIONAL VALUE FUND | SUMMARY PORTFOLIO OF INVESTMENTS |
AS OF OCTOBER 31, 2012 (CONTINUED) |
| | Shares | | | | Value | Percentage
of Net
Assets |
| | COMMON STOCK: (continued) |
| | | | Japan: (continued) |
| | 93,000 | | JGC Corp. | 3,199,705 | 0 .7 |
| | 50,300 | | Kao Corp. | 1,413,006 | 0 .3 |
| | 95,200 | | Komatsu Ltd. | 1,994,882 | 0 .4 |
| | 72,400 | | Mabuchi Motor Co., Ltd. | 3,068,082 | 0 .6 |
| | 49,500 | | Makita Corp. | 1,959,745 | 0 .4 |
| | 391,500 | | Mitsubishi UFJ Financial Group, Inc. | 1,771,134 | 0 .4 |
| | 158,800 | | Mitsui Sumitomo Insurance Group Holdings, Inc. | 2,693,057 | 0 .6 |
| | 14,200 | | Nintendo Co., Ltd. | 1,833,215 | 0 .4 |
| | 87,700 | | Nippon Telegraph & Telephone Corp. | 4,010,357 | 0 .8 |
| | 343,900 | | Nissan Motor Co., Ltd. | 2,876,160 | 0 .6 |
| | 83,000 | | NKSJ Holdings, Inc. | 1,513,052 | 0 .3 |
| | 2,024 | | NTT DoCoMo, Inc. | 2,932,831 | 0 .6 |
| | 160,600 | | Omron Corp. | 3,201,767 | 0 .7 |
| | 31,600 | | Ono Pharmaceutical Co., Ltd. | 1,907,980 | 0 .4 |
| | 26,460 | | ORIX Corp. | 2,717,706 | 0 .6 |
| | 43,500 | | Rohm Co., Ltd. | 1,404,888 | 0 .3 |
| | 36,900 | | Sankyo Co., Ltd. | 1,671,803 | 0 .3 |
| | 45,600 | | Secom Co., Ltd. | 2,322,595 | 0 .5 |
| | 44,500 | | Sega Sammy Holdings, Inc. | 838,755 | 0 .2 |
| | 188,200 | | Seven & I Holdings Co., Ltd. | 5,803,978 | 1 .2 |
| | 147,200 | | Shiseido Co., Ltd. | 1,862,859 | 0 .4 |
| | 83,000 | | Sony Corp. | 982,753 | 0 .2 |
| | 191,500 | | Sumitomo Mitsui Financial Group, Inc. | 5,851,666 | 1 .2 |
| | 12,400 | | Taisho Pharmaceutical Holdings Co. Ltd. | 1,001,434 | 0 .2 |
| | 31,200 | | TDK Corp. | 1,173,243 | 0 .2 |
| | 229,600 | | Tokio Marine Holdings, Inc. | 6,077,542 | 1 .3 |
| | 60,900 | | Tokyo Electron Ltd. | 2,742,349 | 0 .6 |
| | 59,100 | | Toyota Motor Corp. | 2,278,728 | 0 .5 |
| | | | | 107,782,189 | 22 .3 |
| | | | | | |
| | | | Mexico: 0.7% |
| | 85,900 | | America Movil SAB de CV ADR | 2,172,411 | 0 .5 |
| | 133,244 | @ | Cemex SAB de CV ADR | 1,204,526 | 0 .2 |
| | | | | 3,376,937 | 0 .7 |
| | | | | | |
| | | | Netherlands: 7.6% |
| | 503,627 | | Aegon NV | 2,816,597 | 0 .6 |
| | 29,745 | | Akzo Nobel NV | 1,618,956 | 0 .3 |
| | 56,949 | | European Aeronautic Defence and Space Co. NV | 2,026,801 | 0 .4 |
| | 320,912 | | Koninklijke Ahold NV | 4,086,649 | 0 .9 |
| | 237,745 | | Royal Dutch Shell PLC - Class A | 8,157,746 | 1 .7 |
| | 100,506 | | Royal Dutch Shell PLC - Class B | 3,555,169 | 0 .7 |
| | 141,615 | | Koninklijke Philips Electronics NV | 3,546,878 | 0 .7 |
| | 163,715 | | Unilever NV | 6,017,252 | 1 .3 |
| | 253,352 | | Wolters Kluwer NV | 4,901,618 | 1 .0 |
| | | | | 36,727,666 | 7 .6 |
| | | | | | |
| | | | Norway: 0.6% |
| | 114,994 | | Statoil ASA | 2,832,182 | 0 .6 |
| | | | | | |
| | | | Russia: 0.4% |
| | 35,900 | | Lukoil OAO ADR | 2,170,155 | 0 .4 |
| | | | | | |
| | | | Singapore: 1.5% |
| | 286,000 | | Oversea-Chinese Banking Corp. | 2,125,657 | 0 .5 |
| | 940,100 | | Singapore Telecommunications Ltd. | 2,476,237 | 0 .5 |
| | 164,500 | | United Overseas Bank Ltd. | 2,453,152 | 0 .5 |
| | | | | 7,055,046 | 1 .5 |
| | | | | | |
| | | | South Africa: 0.7% |
| | 161,957 | | Gold Fields Ltd. | 2,012,158 | 0 .4 |
| | 72,300 | | Impala Platinum Holdings Ltd. | 1,303,526 | 0 .3 |
| | | | | 3,315,684 | 0 .7 |
| | | | | | |
| | | | South Korea: 1.1% |
| | 214,200 | | KT Corp. ADR | 3,630,690 | 0 .7 |
| | 6,047 | | Posco | 1,900,902 | 0 .4 |
| | | | | 5,531,592 | 1 .1 |
| | | | | | |
| | | | Spain: 1.4% |
| | 463,636 | | Banco Popular Espanol S.A. | 725,023 | 0 .1 |
| | 129,829 | | Gas Natural SDG S.A. | 2,017,101 | 0 .4 |
| | 288,085 | | Indra Sistemas S.A. | 3,296,250 | 0 .7 |
| | 74,338 | | Telefonica S.A. | 981,167 | 0 .2 |
| | | | | 7,019,541 | 1 .4 |
| | | | | | |
| | | | Sweden: 1.3% |
| | 701,637 | | Telefonaktiebolaget LM Ericsson | 6,215,857 | 1 .3 |
| | | | | | |
| | | | Switzerland: 5.3% |
| | 1,555 | | Givaudan | 1,555,448 | 0 .3 |
| | 54,959 | | Nestle S.A. | 3,489,250 | 0 .7 |
| | 119,894 | | Novartis AG | 7,229,677 | 1 .5 |
| | 34,638 | | Roche Holding AG - Genusschein | 6,672,152 | 1 .4 |
| | 223,300 | @ | STMicroelectronics NV | 1,315,178 | 0 .3 |
| | 44,610 | | Swiss Re Ltd. | 3,086,894 | 0 .6 |
| | 149,300 | | UBS AG - Reg | 2,240,036 | 0 .5 |
| | | | | 25,588,635 | 5 .3 |
| | | | | | |
| | | | United Kingdom: 20.3% |
| | 126,530 | | AstraZeneca PLC | 5,867,846 | 1 .2 |
| | 684,412 | | BAE Systems PLC | 3,454,428 | 0 .7 |
| | 1,687,199 | | Barclays PLC | 6,238,863 | 1 .3 |
| | 182,725 | | BHP Billiton PLC | 5,856,610 | 1 .2 |
| | 873,081 | | BP PLC | 6,235,247 | 1 .3 |
| | 55,500 | | BP PLC ADR | 2,380,395 | 0 .5 |
| | 173,847 | @ | CRH PLC | 3,243,097 | 0 .7 |
| | 27,200 | @ | Ensco PLC | 1,572,704 | 0 .3 |
| | 356,097 | | GlaxoSmithKline PLC | 7,979,292 | 1 .7 |
| | 1,581,120 | | Home Retail Group | 2,919,049 | 0 .6 |
| | 610,181 | | HSBC Holdings PLC | 6,015,997 | 1 .3 |
| | 55,647 | | Imperial Tobacco Group PLC | 2,104,554 | 0 .4 |
| | 1,159,934 | | ITV PLC | 1,623,936 | 0 .3 |
| | 270,300 | | J Sainsbury PLC | 1,549,809 | 0 .3 |
| | 337,500 | | Kingfisher PLC | 1,580,191 | 0 .3 |
| | 1,213,522 | | Legal & General Group PLC | 2,630,599 | 0 .6 |
| | 6,903,804 | @ | Lloyds TSB Group PLC | 4,546,214 | 1 .0 |
| | | | | | | |
ING INTERNATIONAL VALUE FUND | SUMMARY PORTFOLIO OF INVESTMENTS |
AS OF OCTOBER 31, 2012 (CONTINUED) |
| | Shares | | | | Value | Percentage
of Net
Assets |
| | COMMON STOCK: (continued) |
| | | | United Kingdom: (continued) |
| | 404,551 | | Marks & Spencer Group PLC | 2,574,827 | 0 .5 |
| | 284,183 | | Prudential PLC | 3,902,886 | 0 .8 |
| | 98,889 | | Rio Tinto PLC | 4,940,179 | 1 .0 |
| | 51,800 | | Signet Jewelers Ltd. | 2,681,168 | 0 .6 |
| | 1,297,273 | | Tesco PLC | 6,712,705 | 1 .4 |
| | 2,558,755 | | Vodafone Group PLC | 6,948,700 | 1 .4 |
| | 515,231 | | WM Morrison Supermarkets PLC | 2,230,840 | 0 .5 |
| | 154,927 | | WPP PLC | 2,002,490 | 0 .4 |
| | | | | 97,792,626 | 20 .3 |
| | | | | | |
| | | | United States: 2.5% |
| | 84,700 | | Coca-Cola Enterprises, Inc. | 2,662,968 | 0 .6 |
| | 65,700 | | Newmont Mining Corp. | 3,583,935 | 0 .7 |
| | 55,000 | @ | Rowan Companies PLC | 1,744,050 | 0 .4 |
| | 36,200 | @ | Seagate Technology | 988,984 | 0 .2 |
| | 94,634 | @ | TE Connectivity Ltd. | 3,045,322 | 0 .6 |
| | | | | 12,025,259 | 2 .5 |
| | | | | | |
| | | Total Common Stock | | | |
| | | (Cost $509,403,588) | 474,707,805 | 98 .4 |
| | | | | |
| | RIGHTS: 0.0% |
| | | | Bermuda: 0.0% |
| | 255,000 | @ | Esprit Holdings Ltd. | 68,849 | 0 .0 |
| | | | | | |
| | | Total Rights | | | |
| | | (Cost $–) | 68,849 | 0 .0 |
| | | | | |
| | | Total Long-Term Investments | | | |
| | | (Cost $509,403,588) | 474,776,654 | 98 .4 |
| | | | | |
Principal
Amount† | | | | Value | Percentage
of Net
Assets |
| SHORT-TERM INVESTMENTS: 1.6% |
| | | | Securities Lending Collateralcc(1): 0.2% |
| | 700,066 | | Daiwa Capital Markets, Repurchase Agreement dated 10/31/12, 0.38%, due 11/01/12 (Repurchase Amount $700,073, collateralized by various U.S. Government and U.S. Government Agency Obligations, 0.000%-6.500%, Market Value plus accrued interest $714,067, due 01/15/14-11/01/42) | | |
| | | | (Cost $700,066) | 700,066 | 0 .2 |
| | | | | | |
| | Shares | | | | Value | Percentage
of Net
Assets |
| | | | Mutual Funds: 1.4% |
| | 6,924,432 | | BlackRock Liquidity Funds, TempFund, Institutional Class | | |
| | | | (Cost $6,924,432) | 6,924,432 | 1 .4 |
| | | | | | |
| | | Total Short-Term Investments | | | |
| | | (Cost $7,624,498) | 7,624,498 | 1 .6 |
| | | | | |
| | | Total Investments in Securities
(Cost $517,028,086) | $ 482,401,152 | 100 .0 |
| | | Assets in Excess of Other Liabilities | 182,401 | – |
| | | Net Assets | $ 482,583,553 | 100 .0 |
| |
| † | Unless otherwise indicated, principal amount is shown in USD. |
| # | Securities with purchases pursuant to Rule 144A or section 4(2), under the Securities Act of 1933 and may not be resold subject to that rule except to qualified institutional buyers. |
| @ | Non-income producing security
|
| ADR | American Depositary Receipt |
| cc | Securities purchased with cash collateral for securities loaned. |
| L | Loaned security, a portion or all of the security is on loan at October 31, 2012. |
| X | Fair value determined by ING Funds Valuation Committee appointed by the Funds' Board of Directors/Trustees. |
| (1) | Collateral received from brokers for securities lending was invested into these short-term investments. |
| | Cost for federal income tax purposes is $528,336,347. |
| | Net unrealized depreciation consists of: |
| | Gross Unrealized Appreciation | $41,599,796 |
| | Gross Unrealized Depreciation | (87,534,991) |
| | Net Unrealized Depreciation | $(45,935,195) |
| |
| Sector Diversification | Percentage
of Net Assets | |
| Financials | 20 .1 | % |
| Energy | 10 .7 | |
| Health Care | 10 .1 | |
| Consumer Staples | 9 .9 | |
| Materials | 9 .2 | |
| Telecommunication Services | 9 .2 | |
| Information Technology | 8 .7 | |
| Industrials | 8 .6 | |
| Consumer Discretionary | 8 .4 | |
| Utilities | 3 .5 | |
| Short-Term Investments | 1 .6 | |
| Assets in Excess of Other Liabilities | – | |
| Net Assets | 100 .0 | % |
| | |
Item 7. Disclosure of Proxy Voting Policies and Procedures for Closed-End Management Investment Companies.
Not applicable.
Item 8. Portfolio Managers of Closed-End Management Investment Companies.
Not applicable.
Item 9. Purchases of Equity Securities by Closed-End Management Investment Company and Affiliated Purchasers
Not applicable.
Item 10. Submission of Matters to a Vote of Security Holders.
The Board has a Nominating Committee for the purpose of considering and presenting to the Board candidates it proposes for nomination to fill Independent Trustee vacancies on the Board. The Committee currently consists of all Independent Trustees of the Board (6 individuals). The Nominating Committee operates pursuant to a Charter approved by the Board. The primary purpose of the Nominating Committee is to consider and present to the Board the candidates it proposes for nomination to fill vacancies on the Board. In evaluating candidates, the Nominating Committee may consider a variety of factors, but it has not at this time set any specific minimum qualifications that must be met. Specific qualifications of candidates for Board membership will be based on the needs of the Board at the time of nomination.
The Nominating Committee is willing to consider nominations received from shareholders and shall assess shareholder nominees in the same manner as it reviews its own nominees. A shareholder nominee for director should be submitted in writing to the Fund’s Secretary. Any such shareholder nomination should include at a minimum the following information as to each individual proposed for nomination as trustee: such individual’s written consent to be named in the proxy statement as a nominee (if nominated) and to serve as a trustee (if elected), and all information relating to such individual that is required to be disclosed in the solicitation of proxies for election of trustees, or is otherwise required, in each case under applicable federal securities laws, rules and regulations.
The Secretary shall submit all nominations received in a timely manner to the Nominating Committee. To be timely, any such submission must be delivered to the Fund’s Secretary not earlier than the 90th day prior to such meeting and not later than the close of business on the later of the 60th day prior to such meeting or the 10th day following the day on which public announcement of the date of the meeting is first made, by either disclosure in a press release or in a document publicly filed by the Fund with the Securities and Exchange Commission.
Item 11. Controls and Procedures.
| (a) | | Based on our evaluation conducted within 90 days of the filing date, hereof, the design and operation of the registrant’s disclosure controls and procedures are effective to ensure that material information relating to the registrant is made known to the certifying officers by others within the appropriate entities, particularly during the period in which Forms N-CSR are being prepared, and the registrant’s disclosure controls and procedures allow timely preparation and review of the information for the registrant’s Form N-CSR and the officer certifications of such Form N-CSR. |
| |
| (b) | | There were no significant changes in the registrant’s internal controls that occurred during the second fiscal quarter of the period covered by this report that has materially affected, or is reasonably likely to materially affect, the registrant’s internal control over financial reporting. |
Item 12. Exhibits.
| (a)(1) | | Code of Ethics pursuant to Item 2 of Form N-CSR is filed and attached hereto as EX-99.CODE ETH. |
| |
| (a)(2) | | A separate certification for each principal executive officer and principal financial officer of the registrant as required by Rule 30a-2 under the Act (17 CFR 270.30a-2) is attached hereto as EX-99.CERT. |
| |
| (b) | | The officer certifications required by Section 906 of the Sarbanes-Oxley Act of 2002 are attached hereto as EX-99.906CERT. |
| |
| (3) | | Not applicable. |
SIGNATURES
Pursuant to the requirements of the Securities Exchange Act of 1934 and the Investment Company Act of 1940, the registrant has duly caused this report to be signed on its behalf by the undersigned, thereunto duly authorized.
(Registrant): ING Mayflower Trust
| | | | | |
| By | | /s/ Shaun P, Mathews Shaun P. Mathews | | |
| | President and Chief Executive Officer | | |
Date: January 7, 2013
Pursuant to the requirements of the Securities Exchange Act of 1934 and the Investment Company Act of 1940, this report has been signed below by the following persons on behalf of the registrant and in the capacities and on the dates indicated.
| | | | | |
| By | | /s/ Shaun P. Mathews Shaun P. Mathews | | |
| | President and Chief Executive Officer | | |
Date: January 7, 2013
| | | | | |
| By | | /s/ Todd Modic Todd Modic | | |
| | Senior Vice President and Chief Financial Officer | | |
Date: January 7, 2013

 E-Delivery Sign-up — details inside