PRESIDENT’S LETTER
Diversification Still Works
Dear Shareholder,
The difficult markets of 2008–09 may have made some investors skeptical about the benefits of diversification. For a time, it did seem as if every asset was losing value and there was no safe place to hide. Today, however, as we approach the end of what is shaping up to be the second consecutive year of solid equity market returns, the value of diversification has been reestablished in the minds of most investors.
For some investors, however, it can be tempting to try to outsmart the markets, abandoning diversified positions to sidestep impending risks or to crowd into an area of strong returns. The problem with this approach is that it tends to be reactionary and ill-timed; investors generally buy in when prices are already high, leaving themselves overly exposed to risks of declines.
A recent example can be found at the end of 2009. Convinced that inflation was going to increase dramatically, some investors tried to game the system by selling long-dated bonds and buying short-term Treasury bills. When inflation went briefly to zero, short-term Treasuries generated losses; the 20-year Treasury bond, on the other hand, has been one of the best performing assets in 2010. Another example of this kind of herd behavior occurred during the dot-com bubble of the late 1990s; investors turned their portfolios into wholesale bets on Internet technology stocks, with serious consequences when the bubble burst.
With 20/20 hindsight, it’s easy to see how abandoning the principles of diversification led to trouble. It’s harder to see how investors continue to stray from the path; lately, some investors have attempted to outrun risk by concentrating on bonds, only to miss out on the sharp equity market recovery.
If straying from diversification is the problem, we believe staying with diversification is the solution. In our opinion, an investor should own the market and should do so from a global perspective. As we’ve noted many times before, it’s important to discuss any proposed changes thoroughly with your financial advisor before taking any action. Thank you for your continued confidence in ING Funds. We look forward to serving your investment needs in the future.
Shaun P. Mathews
President and Chief Executive Officer
ING Funds
November 5, 2010
The views expressed in the President’s Letter reflect those of the President as of the date of the letter. Any such views are subject to change at any time based upon market or other conditions and ING Funds disclaims any responsibility to update such views. These views may not be relied on as investment advice and because investment decisions for an ING Fund are based on numerous factors, may not be relied on as an indication of investment intent on behalf of any ING Fund. Reference to specific company securities should not be construed as recommendations or investment advice.International investing poses special risks including currency fluctuation, economic and political risks not found in investments that are solely domestic.
For more complete information, or to obtain a prospectus for any ING Fund, please call your investment professional or ING Investments Distributor, LLC at (800) 992-0180 or log on to www.ingfunds.com. The prospectus should be read carefully before investing. Consider the fund’s investment objectives, risks, charges and expenses carefully before investing. The prospectus contains this information and other information about the fund. Check with your investment professional to determine which funds are available for sale within their firm. Not all funds are available for sale at all firms.
2
MARKET PERSPECTIVE: YEAR ENDED OCTOBER 31, 2010
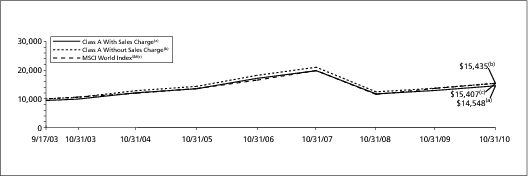
In the first half of our fiscal year, global equities, in the form of the MSCI World IndexSM measured in local currencies, including net reinvested dividends (“MSCI” for regions discussed below), peaked on April 15, with a gain of over 15% since October 31, 2009. But then a confluence of local and global concerns sent prices reeling and in the next 12 weeks the gain was turned into a small loss. In the end, sentiment improved again and for the whole fiscal year ended October 31, 2010 the index returned 11.67%. (The MSCI World IndexSM returned 12.74% for the one year ended October 31, 2010, measured in U.S. dollars.)
By April, the 12-month rally had become increasingly edgy. The rescue of failing institutions by governments and central banks, together with unprecedented fiscal and monetary stimulus to counter the ensuing recession had led to enormous, unsustainable budget deficits. Stimulus would have to be reduced and debt redeemed. In this environment, markets from stocks to bonds to currencies were buffeted by news and events relating to three main themes: the stuttering US economic recovery, a sovereign debt crisis in the Eurozone and growth dynamics in China.
In the U.S., quarterly gross domestic product (“GDP”) growth (annualized) was decelerating, from 5.6% to 2.7% to 1.7% in the second quarter of 2010. Employment and housing were the focus of attention. The National Bureau of Economic Research declared the recession over from June of 2009 after 18 months, during which some 8.7 million jobs had been lost. Any credible economic rebound required their fast recovery. But the data over the period were less than encouraging. By September, the private sector was only averaging 91,000 new jobs per month and the unemployment rate seemed stuck between 9.5% and 10%. Of those unemployed, 42% had been jobless for at least 27 weeks.
The housing market had been improving, boosted by a program of tax credits for certain home buyers. But after the program expired in April sales of new and existing home sales collapsed, with a high proportion of distressed sales. House prices (based on the S&P/Case-Shiller 20-City Composite Home Price Index), resumed annual increases from February, but as our fiscal year ended the pace was slowing with the index still 29% below the peak reached more than four years ago.
In the Eurozone, default seemed likely on billions of euro of Greece’s maturing bonds. Amid downgrades, soaring yields, fears of contagion and doubts about the viability of the euro itself, Eurozone countries argued amongst themselves until at last, in early May, finance ministers and the International Monetary Fund agreed on a Financial Stabilization “mechanism” funded with up to e750 billion. The European Central Bank (“ECB”) started buying the worst-affected countries’ sovereign debt, much of it held in the vulnerable European banking system. This, plus positive results from some rather soft stress testing on banks, seemed to calm nerves, although uncertainty persisted.
Investors watched nervously as China wrestled with inflation and a housing bubble. The authorities repeatedly raised banks’ reserve ratio requirements and tightened the rules on mortgage issuance. GDP growth slipped to 10.3% in the second quarter and to 9.6% in the third. But with September’s property price index still increasing at over 9% per annum and inflation at a two year high, the Bank of China unexpectedly raised interest rates for the first time since 2007.
In currencies, the dollar showed strength in the first half of the fiscal year. But from early June, gloom about the Eurozone was increasingly replaced by renewed pessimism about the dollar over a stalling economy and the perceived threat of debasement through an expected second round of quantitative easing. For the whole year, the dollar gained 6.12% against the euro, 3.00% against the pound but lost 11.57% to the yen, which in October breached 15-year high levels.
The prospect of more quantitative easing, which undermined the dollar, acted to boost the prices of other asset classes.
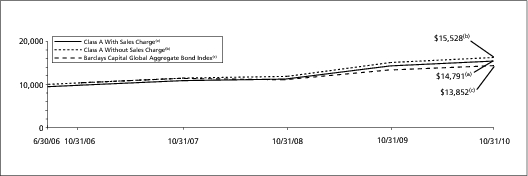
In U.S. fixed income markets the Barclays Capital U.S. Aggregate Bond Index of investment grade bonds returned 8.01% for the fiscal year, mostly in the second half. Among the sub-components, the Barclays Capital Corporate Investment Grade Bond Index, with a return of 11.61%, outperformed the Barclays Capital U.S. Treasury Index, with a return of 7.20%, mostly in the first half. The Barclays Capital High Yield Bond — 2% Issuer Constrained Composite Index gained 19.10%.
U.S. equities, represented by S&P 500® Index including dividends, rose 16.52% in the fiscal year. A small gain of 0.74% in the second half concealed a 16% drop in the 10 weeks after April 23 and the index’s best September, a return of 8.92%, since 1939. Despite broader economic concerns, prices were supported by strong earnings reports, with average operating earnings per share for S&P 500® companies marking their the fourth straight quarter of annual growth.
In international markets, the MSCI Japan® Index lost 6.76% for the fiscal year after sagging 16.66% in the second half. Strong 5% annualized first quarter GDP growth shriveled to an export-dependent 1.5% in the second, vulnerable to the irrepressible yen, with household demand still fragile and consumer prices in retreat. The MSCI Europe ex UK® Index returned 10.03%, including a small second half gain of 2.78%. The sovereign debt trauma subsided after it became clear that the ECB stood behind the banking system. In the meantime, GDP grew 1.0% in the second quarter over the first, boosting investor optimism. The MSCI UK® Index advanced 16.07%, of which 3.85% came in the second half. This was despite the prospect of severe public spending cuts to eliminate an 11% budget deficit. Supporting sentiment was the return to profit of most banks and the best annual GDP growth, 2.8%, in three years.
Parentheses denote a negative number.
Past performance does not guarantee future results. The performance quoted represents past performance. Investment return and principal value of an investment will fluctuate, and shares, when redeemed, may be worth more or less than their original cost. The Funds’ performance is subject to change since the period’s end and may be lower or higher than the performance data shown. Please call (800) 992-0180 or log on to www.ingfunds.com to obtain performance data current to the most recent month end.
Market Perspective reflects the views of ING’s Chief Investment Risk Officer only through the end of the period, and is subject to change based on market and other conditions.
3
BENCHMARK DESCRIPTIONS
| Index | | | | Description |
|---|
MSCI World IndexSM | | | | An unmanaged index that measures the performance of over 1,400 securities listed on exchanges in the U.S., Europe, Canada, Australia, New Zealand and the Far East. |
| S&P/Case-Shiller 20-City Composite Home Price Index | | | | A composite index of the home price index for the top 20 Metropolitan Statistical Areas in the United States. The index is published monthly by Standard & Poor’s. |
| Barclays Capital U.S. Aggregate Bond Index | | | | An unmanaged index of publicly issued investment grade U.S. Government, mortgage-backed, asset-backed and corporate debt securities. |
| Barclays Capital Corporate Investment Grade Bond Index | | | | The corporate component of the Barclays Capital U.S. Credit Index. The U.S. Credit Index includes publicly-issued U.S. corporate and specified foreign debentures and secured notes that meet the specified maturity, liquidity, and quality requirements. The index includes both corporate and non-corporate sectors. The corporate sectors are industrial, utility and finance, which includes both U.S. and non-U.S. corporations. |
| Barclays Capital U.S. Treasury Index | | | | An unmanaged index that includes public obligations of the U.S. Treasury. Treasury bills, certain special issues, such as state and local government series bonds (SLGs), as well as U.S. Treasury TIPS and STRIPS, are excluded. |
| Barclays Capital High Yield Bond — 2% Issuer Constrained Composite Index | | | | An unmanaged index that includes all fixed income securities having a maximum quality rating of Ba1, a minimum amount outstanding of $150 million, and at least one year to maturity. |
| S&P 500® Index | | | | An unmanaged index that measures the performance of securities of approximately 500 large-capitalization companies whose securities are traded on major U.S. stock markets. |
| MSCI Japan® Index | | | | A free float-adjusted market capitalization index that is designed to measure developed market equity performance in Japan. |
| MSCI Europe ex UK® Index | | | | A free float-adjusted market capitalization index that is designed to measure developed market equity performance in Europe, excluding the UK. |
| MSCI UK® Index | | | | A free float-adjusted market capitalization index that is designed to measure developed market equity performance in the UK. |
| S&P North American Natural Resources Sector Index | | | | An unmanaged index and a market-capitalization weighted index of stocks designed to measure the performance of companies in the natural resources sector, which includes energy, precious metals, timber and other sub-sectors. Each sector index is a modified-capitalization weighted index, the constituents of which are selected according to objective screening criteria. The weight of a particular stock in each Sector Index is capped at a cap level determined on a sector-by-sector basis. |
| S&P Developed Property Index | | | | An unmanaged float-adjusted index which defines and measure the investable universe of publicly traded property companies domiciled in developed countries that derive more than half of their revenue from property-related activities, such as property ownership, management, development, rental and investment. |
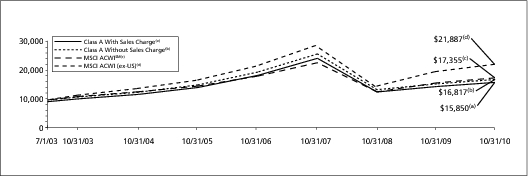
MSCI All Country World IndexSM | | | | A free-float adjusted market capitalization index that is designed to measure equity market performance in the global developed and emerging markets. |
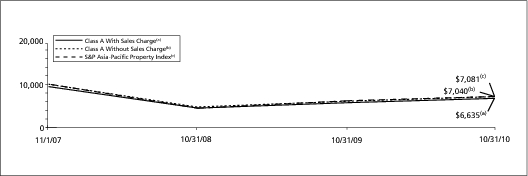
| S&P Asia-Pacific Property Index | | | | An unmanaged float-adjusted index which defines and measures the investable universe of publicly traded property companies domiciled in developed countries in the Asia Pacific region, that derive more than half of their revenue from property-related activities, such as property ownership, management, development, rental and investment. It includes the reinvestment of dividends but is gross of withholding taxes on dividends and does not reflect fees, brokerage commissions or other expenses of investing. |
4
BENCHMARK DESCRIPTIONS (CONTINUED)
| Index | | | | Description |
|---|
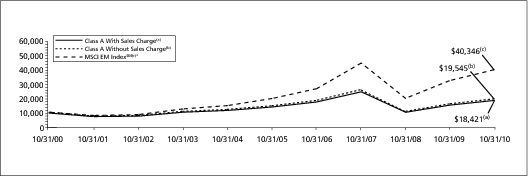
MSCI Emerging Markets IndexSM | | | | An unmanaged index that measures the performance of securities listed on exchanges in developing nations throughout the world. It includes the reinvestment of dividends and distributions net of withholding taxes, but does not reflect fees, brokerage commissions or other expenses of investing. |
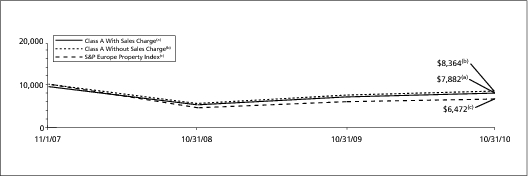
| S&P Europe Property Index | | | | An unmanaged float-adjusted index which defines and measures the investable universe of publicly traded property companies domiciled in developed European countries, that derive more than half of their revenue from property-related activities, such as property ownership, management, development, rental and investment. It includes the reinvestment of dividends but is gross of withholding taxes on dividends and does not reflect fees, brokerage commissions or other expenses of investing. |
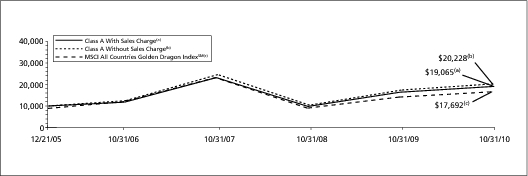
| MSCI All Countries Golden Dragon Index | | | | A broad-based, unmanaged index of common stocks traded in China, Hong Kong and Taiwan. It is an aggregate of the MSCI Hong Kong Index, the MSCI China Free Index and the MSCI Taiwan Index. |
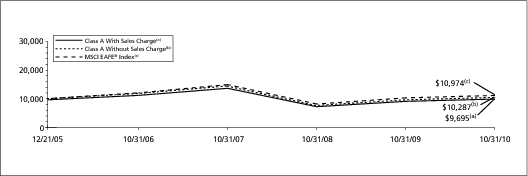
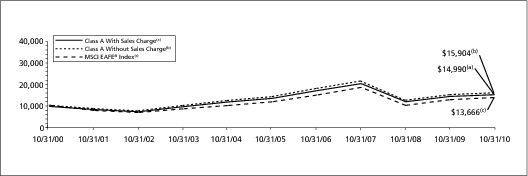
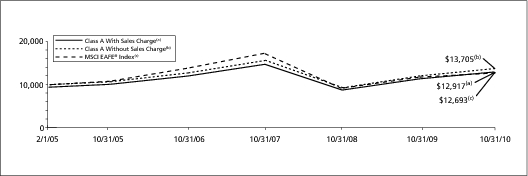
MSCI Europe, Australasia and Far East®
(“MSCI EAFE”) Index | | | | An unmanaged index that measures the performance of securities listed on exchanges in Europe, Australasia and the Far East. It includes the reinvestment of dividends net of withholding taxes, but does not reflect fees, brokerage commissions or other expenses of investing. |
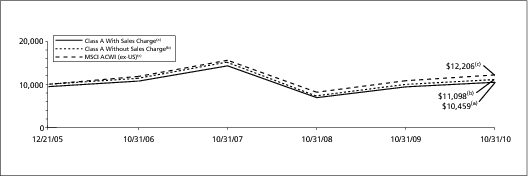
MSCI All Country World (ex-US) IndexSM | | | | A free float-adjusted market capitalization index that is designed to measure equity market performance in global developed and emerging markets, excluding the U.S. It includes the reinvestment of dividends net of withholding taxes, but does not reflect fees, brokerage commissions or other expenses of investing. |
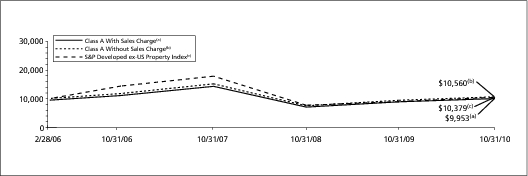
| S&P Developed ex-US Property Index | | | | An unmanaged float-adjusted index which defines and measure the investable universe of publicly traded property companies domiciled in developed countries, outside of the United States, that derive more than half of their revenue from property-related activities, such as property ownership, management, development, rental and investment. It includes the reinvestment of dividends but is gross of withholding taxes on dividends and does not reflect fees, brokerage commissions or other expenses of investing. |
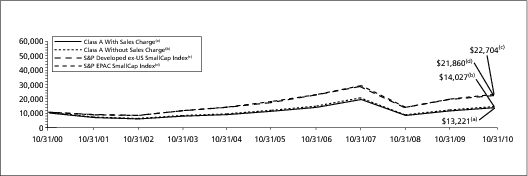
| S&P Developed ex-US SmallCap Index | | | | An unmanaged float-adjusted index which captures the bottom 15% of companies in the developed markets, based on the cumulative market capitalization of each country, excluding the United States, within the S&P Global Broad Market Index, which covers all publicly listed equities in 47 countries with a float-adjusted market capitalization of US$100 million or greater and a minimum annual trading liquidity of US$50 million. |
| S&P Euro-Pacific Asia Composite SmallCap Index | | | | An unmanaged float-adjusted index which captures the bottom 15% of companies in the developed European and Pacific markets, based on the cumulative market capitalization of each country, within the S&P Global Broad Market Index, which covers all publicly listed equities in 47 countries with a float adjusted market capitalization of US$100 million or greater and a minimum annual trading liquidity of US $50 million. |
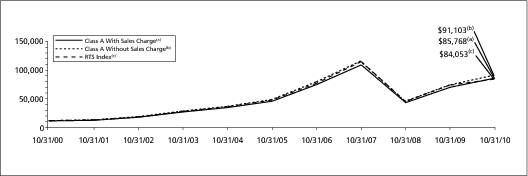
| Russia Trading System Index | | | | A capitalization-weighted index that is calculated in U.S. dollars. The index tracks the performance of Russia’s most active stocks traded on the RTS. The index is operated by the National Association of Participants in the Securities Markets, a non-profit body. |
| MSCI Russia 10/40 Index | | | | A free float-adjusted market capitalization weighted index that is designed to measure the equity market performance of the Russian market taking into account the Undertakings for Collective Investment in Transferable Securities (UCITS III) directive which constrains the weight of any single group entity, as defined therein, at 10%of a fund’s total assets and the sum of the weights of all group entities representing more than 5%of the fund at 40% of the fund’s total assets. |
5
ING GLOBAL EQUITY DIVIDEND FUND | | PORTFOLIO MANAGERS’ REPORT
|
Investment Type Allocation
as of October 31, 2010
(as a percent of net assets)
|
| Common Stock | | | | | 94.2 | % |
| Real Estate Investment Trusts | | | | | 1.1 | % |
| Other Assets and Liabilities — Net* | | | | | 4.7 | % |
| Net Assets | | | | | 100.0 | % |
| |
| * Includes short-term investments related to securities lending collateral. |
| |
Portfolio holdings are subject to change daily.
|
ING Global Equity Dividend Fund (“Global Equity Dividend” or the “Fund”) seeks growth of capital with dividend income as a secondary consideration. The Fund is managed by Nicolas Simar, Head of Value/High Dividend, Moudy El Khodr, Senior Investment Manager Equities, and Kris Hermie, CFA, Senior Investment Manager of ING Investment Management Advisors B.V. — the Sub-Adviser.
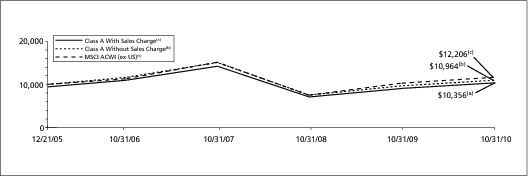
Performance: For the year ended October 31, 2010, the Fund’s Class A shares, excluding sales charges, provided a total return of 12.46%, compared to the MSCI World IndexSM, which returned 12.74% for the same period.
Portfolio Specifics: During the period, market attention shifted to focus increasingly on macroeconomic perspectives. There was a “search for comfort” in economic data to confirm the recovery and dispel fears of a double-dip recession. But the news also brought general sovereign risk back to the front burner several times with Southern European countries in the spotlight. In addition to downgrades of certain countries, and the Dubai World story, Greece was the next center of attention as investors focused on the risks of its sovereign debt crisis spreading contagion to the weakest countries of the euro zone. These events increased market nervousness and market volatility. The Fund held no exposure to Greece for the period under review.
The investments of the Fund outperformed the benchmark, but not by enough to cover the expense ratio. Stock selection contributed to results, while sector allocation detracted. The sectors that detracted the most from results were consumer discretionary and materials. Weak stock selection and sector allocation in consumer discretionary hurt the most. Sector allocation in materials and industrials also detracted. The Fund strongly benefited from selection among consumer staples stocks, healthcare and utilities.
Among the top contributing stocks for the period were Emerson Electric Co., Sara Lee Corp., E.I. DuPont de Nemours & Co. and KT Corp. (Korean Telecom). Emerson benefited from the better economic environment, beating earnings expectations. Sara Lee benefited from profits that beat Wall Street estimates; several brand transactions gave evidence of restructuring their portfolio, which also was supportive.
Top Ten Holdings*
as of October 31, 2010
(as a percent of net assets)
|
| Royal Dutch Shell PLC | | | | | 1.6 | % |
| Baxter International, Inc. | | | | | 1.6 | % |
| Gaz de France Suez | | | | | 1.5 | % |
| Total S.A. | | | | | 1.5 | % |
| Chevron Corp. | | | | | 1.5 | % |
| Pitney Bowes, Inc. | | | | | 1.5 | % |
| Sanofi-Aventis | | | | | 1.5 | % |
| Nintendo Co., Ltd. | | | | | 1.5 | % |
| Vivendi | | | | | 1.5 | % |
| ExxonMobil Corp. | | | | | 1.5 | % |
| |
| * Excludes short-term investments related to securities lending collateral. |
| |
Portfolio holdings are subject to change daily.
|
During the period, the Fund sold its position in Dow Chemical Co., mainly for valuation reasons after the stock rallied strongly. We also sold Emerson and Sara Lee during the period. The Fund initiated a position in ConAgra Foods, Inc. — as valuation spreads increased, comparable companies left this stock behind at what we believed to be an attractive valuation. Baxter International, Inc. also was introduced as a new position. During the period the stock came under strong pressure, which pushed its valuation to levels we believed were too low.
Many of the relative detractors from performance were stocks that the Fund did not own. For example, the biggest detraction came from not owning Apple Inc. On the other hand, Fund overweights also hurt results: positions in BP PLC, U.S. financial services company H&R Block Inc. and Japanese bank Mizuho Financial Group Inc. The Fund sold H&R Block because of the uncertainty surrounding the company, which we believed would result in a lower sustainable dividend.
Current Strategy and Outlook: Our outlook for the Fund remains positive. We believe investments in quality defensive stocks may give the Fund potential downside protection and lower volatility. Under current market conditions, we believe these potential benefits could contribute to performance. Regardless of scenario, the Fund seeks to identify sectors or stocks where it may exploit temporary under valuations to capture unrecognized value.

 E-Delivery Sign-up – details inside