| | |
| | | |
| | | OMB APPROVAL |
| | | OMB Number: 3235-0570 |
| | | Expires: August 31, 2011 |
| | | Estimated average burden hours per response: 18.9 |
UNITED STATES
SECURITIES AND EXCHANGE COMMISSION
Washington, D.C. 20549
FORM N-CSR
CERTIFIED SHAREHOLDER REPORT OF
REGISTERED MANAGEMENT INVESTMENT COMPANIES
Investment Company Act file number: 811-7978
ING Mayflower Trust
(Exact name of registrant as specified in charter)
| | | |
| 7337 E. Doubletree Ranch Rd., Scottsdale, AZ | | 85258 |
| (Address of principal executive offices) | | (Zip code) |
CT Corporation System, 101 Federal Street, Boston, MA 02110
(Name and address of agent for service)
Registrant’s telephone number, including area code: 1-800-992-0180
| | | |
| Date of fiscal year end: | | October 31 |
| | | | | | | | | |
| Date of reporting period: | | November 1, 2007 to October 31, 2008 |
Annual Report
October 31, 2008
Classes A, B, C, I, O, Q, R and W
Global Equity Funds
n ING Global Equity Dividend Fund
n ING Global Natural Resources Fund
n ING Global Real Estate Fund
n ING Global Value Choice Fund
International Equity Funds
n ING Asia-Pacific Real Estate Fund
n ING Disciplined International SmallCap Fund
n ING Emerging Countries Fund
n ING European Real Estate Fund
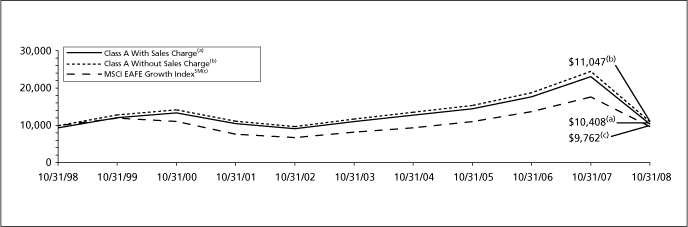
n ING Foreign Fund
n ING Greater China Fund
n ING Index Plus International Equity Fund
n ING International Capital Appreciation Fund
n ING International Equity Dividend Fund
n ING International Growth Opportunities Fund
n ING International Real Estate Fund
| | |
| | n | ING International SmallCap Multi-Manager Fund (formerly, ING International SmallCap Fund) |
n ING International Value Fund
n ING International Value Choice Fund
n ING Russia Fund
Global and International Fixed-Income Funds
n ING Emerging Markets Fixed Income Fund
n ING Global Bond Fund
International Fund-of-Funds
n ING Diversified International Fund
 E-Delivery Sign-up — details inside
This report is submitted for general information to shareholders of the ING Funds. It is not authorized for distribution to prospective shareholders unless accompanied or preceded by a prospectus which includes details regarding the funds’ investment objectives, risks, charges, expenses and other information. This information should be read carefully.
MUTUAL FUNDS
Go Paperless with E-Delivery!
Sign up now for on-line prospectuses, fund reports, and proxy statements. In less than five minutes, you can help reduce paper mail and lower fund costs.
Just go to www.ingfunds.com, click on the E-Delivery icon from the home page, follow the directions and complete the quick 5 Steps to Enroll.
You will be notified by e-mail when these communications become available on the internet. Documents that are not available on the internet will continue to be sent by mail.
PROXY VOTING INFORMATION
A description of the policies and procedures that the Funds use to determine how to vote proxies related to portfolio securities is available: (1) without charge, upon request, by calling Shareholder Services toll-free at (800) 992-0180; (2) on the Funds’ website at www.ingfunds.com; and (3) on the U.S. Securities and Exchange Commission’s (“SEC”) website at www.sec.gov. Information regarding how the Funds voted proxies related to portfolio securities during the most recent 12-month period ended June 30 is available without charge on the Funds’ website at www.ingfunds.com and on the SEC’s website at www.sec.gov.
QUARTERLY PORTFOLIO HOLDINGS
The Funds file their complete schedule of portfolio holdings with the SEC for the first and third quarters of each fiscal year on Form N-Q. The Funds’ Forms N-Q are available on the SEC’s website at www.sec.gov. The Funds’ Forms N-Q may be reviewed and copied at the SEC’s Public Reference Room in Washington, DC, and information on the operation of the Public Reference Room may be obtained by calling (800) SEC-0330; and is available upon request from the Funds by calling Shareholder Services toll-free at (800) 992-0180.
(THIS PAGE INTENTIONALLY LEFT BLANK)
PRESIDENT’S LETTER
Dear shareholders,
We are in the midst of one of the most challenging periods ever faced by investors, and we at ING Funds are aware of the anxiety that you may be feeling at this time.
I want to assure you that we are actively engaged in monitoring the situation and are committed to keeping you fully informed of how the rapidly unfolding events around us may impact your investments with our company.
We recognize that the confidence of many investors is being tested, perhaps as never before. It is understandable that some of you may be second guessing your investment strategy due to these recent events. We encourage you to work with your investment professional and seek out their advice about your portfolio in light of the current conditions. But we also urge investors not to make rash decisions. ING Funds still believes that a well-diversified, globally allocated portfolio remains the most effective investment strategy of all. We ask that investors not lose sight of their commitment to the long-term.
We thank you for your support and confidence and we look forward to continuing to do business with you in the future.
Sincerely,
Shaun P. Mathews
CEO
ING Funds
November 7, 2008
The views expressed in the President’s Letter reflect those of the President as of the date of the letter. Any such views are subject to change at any time based upon market or other conditions and ING Funds disclaims any responsibility to update such views. These views may not be relied on as investment advice and because investment decisions for an ING Fund are based on numerous factors, may not be relied on as an indication of investment intent on behalf of any ING Fund. Reference to specific company securities should not be construed as recommendations or investment advice.
International investing poses special risks including currency fluctuation, economic and political risks not found in investments that are solely domestic.
For more complete information, or to obtain a prospectus for any ING Fund, please call your investment professional or ING Funds Distributor, LLC at (800) 992-0180 or log on to www.ingfunds.com. The prospectus should be read carefully before investing. Consider the fund’s investment objectives, risks, charges and expenses carefully before investing. The prospectus contains this information and other information about the fund. Check with your investment professional to determine which funds are available for sale within their firm. Not all funds are available for sale at all firms.
1
Market Perspective: Year Ended October 31, 2008
For a while, as we reached the mid-way point of the fiscal year, it seemed as if the worst of the 10-month long global credit crisis had passed. But by October 31, 2008 the world’s credit markets were again staring into an ever deeper abyss of systemic failure. Global equities in the form of the Morgan Stanley Capital International (“MSCI”) World® Index(1) measured in local currencies, including net reinvested dividends (“MSCI” for regions discussed below) plunged 30.90% in the six months ended October 31, 2008, (down 38.70% for the entire fiscal year). (The MSCI World® Index plunged 41.85% for the entire fiscal year, measured in US dollars.) In currencies, the dollar appreciated by 19.6% against the euro and 20.30% against the pound in the second half of the fiscal year, as the outlook for the Eurozone and UK economies grew increasingly stark. However, the dollar fell 6.00% against the Japanese yen as carry-trades (essentially short yen positions) were unwound with risk aversion soaring to new levels. The dollar’s movement against the euro, pound and Japanese yen for the entire fiscal year was 10.40%, 25.20% and (14.30)%, respectively. The price of oil peaked at about $147 in mid July 2008, but the combination of a strengthening dollar and fading demand drove it to less than half of that price on October 31, 2008.
As explained in our semi-annual report, the Federal Reserve Board (the “Fed”) reduced the federal funds rate by a cumulative 325 basis points (or 3.25%) and the discount rate by 400 basis points (or 4.00%) from August 2007 through April 2008. In the wake of Bear Stearns’ forced sale to JP Morgan in March, the discount window was opened to other primary dealers. April’s near 6.00% rise in global equities seemed like a giant sigh of relief.
But it soon became obvious that little had changed. The housing market continued its inexorable slide, with the Standard & Poor’s (“S&P”)/Case-Shiller National U.S. Home Price Index(2) of house prices in 20 major cities reported in October as down a record 16.60%. In September, one in every 475 housing units in the country received a foreclosure notice. Banks continued to restrict credit and 30-year fixed mortgage rates reached a six-year high. By October, payrolls had fallen for nine consecutive months and the unemployment rate rose to 6.10%, a five-year high. Third quarter gross domestic product (“GDP”) registered its first decline since 2001.
Yet it was more crises in the financial sector that brought matters to a head.
In September 2008, the U.S. Department of the Treasury (“Treasury”) took control of the Federal National Mortgage Association (“Fannie Mae”) and the Federal Home Loan Mortgage Corporation (“Freddie Mac”), putting them into “conservatorship”. Merrill Lynch and Wachovia were forced into the arms of stronger institutions, with official encouragement. Global insurer AIG received a massive government loan of $85 billion. But Lehman Brothers was left to file for Chapter 11 protection.
It was soon realized that allowing Lehman Brothers to fall threatened to turn a credit crisis into a credit market collapse. Short term Lehman Brothers commercial paper was widely held in money market funds, which now showed signs of turning their backs on commercial credit all together.
So, after more than one year of the credit crisis, nothing that had been tried had worked. The U.S. Government was now in the position of choosing winners and losers among financial institutions. Credit markets faced systemic collapse. A systemic remedy was called for.
On Friday, September 19, 2008, Treasury Secretary Paulson proposed a Troubled Asset Relief Plan (“TARP”) under which a $700 billion fund would be set up to buy illiquid mortgage securities from financial institutions. The following month he announced that $250 billion of the TARP fund would be used to recapitalize nine banks (evidently whether they liked it or not) and that the Federal Deposit Insurance Corporation (“FDIC”) would guarantee inter-bank debt.
Since then the London Interbank Offered Rate (“LIBOR”) has fallen every day and for now it appears that economies and markets will be able to confront the inevitable recession with at least a functioning credit system. But it was close.
Market movements for the period were defined by the trauma of its final two months.
In US fixed income markets, the Lehman Brothers® U.S. Aggregate Bond (“LBAB”) Index(3) of investment grade bonds fell 3.60% in the six month period ended October 31, 2008 (+0.30% for the entire fiscal year). But high yield bonds, represented by the Lehman Brothers® High Yield Bond — 2% Issuer Constrained
2
Market Perspective: Year Ended October 31, 2008
Composite Index(4), acted more like equities, returning (24.90)% for the six month period ended October 31, 2008 (-25.40% for the entire fiscal year).
U.S. equities, represented by the Standard & Poor’s Composite Stock Price 500® (“S&P 500®”) Index(5) including dividends, returned (29.30)% for the six month period ended October 31, 2008 (down 36.10% for the entire fiscal year). Profits for S&P 500® companies suffered their fourth straight quarter of decline, led down by the financials sector. Amid record volatility, the low point was reached on October 27, 2008, after which the index recovered 14.00% to month-end.
In international markets, the MSCI Japan® Index(6) dropped 36.90% in the six months through October 31, 2008 (-46.70% for the entire fiscal year). The export dependent economy suffered from slowing global demand and a rising yen, while high food and (until later) energy prices, plus political deadlock, sapped domestic confidence. Japan’s longest postwar expansion came to an end with a quarterly decline in GDP of 0.70%. The MSCI Europe ex UK® Index(7) slumped 31.9% for the six months through October 31, 2008 (-41.80% for the entire fiscal year), beset by sharply falling economic activity and inflation at a 16-year high causing the European Central Bank (“ECB”) to raise interest rates as late as July. But by October 2008, with GDP officially in decline, the ECB was reducing them again. In the UK, the MSCI UK® Index(8) fell 25.50% for the six months through October 31, 2008 (-32.70% for the entire fiscal year). Quarterly GDP declined by 0.50%, the most in sixteen years. The slide in house prices was accelerating. As everywhere else, lenders were tightening their rules and banks were in trouble. As our fiscal year ended, the government was buying large stakes in banks for its own account.
(1) The MSCI World® Index is an unmanaged index that measures the performance of over 1,400 securities listed on exchanges in the U.S., Europe, Canada, Australia, New Zealand and the Far East.
(2) The S&P/Case-Shiller National U.S. Home Price Index tracks the value of single-family housing within the United States. The index is a composite of single-family home price indices for the nine U.S. Census divisions and is calculated quarterly.
(3) The LBAB Index is an unmanaged index of publicly issued investment grade U.S. Government, mortgage-backed, asset-backed and corporate debt securities.
(4) The Lehman Brothers® High Yield Bond — 2% Issuer Constrained Composite Index is an unmanaged index that measures the performance of non-investment grade fixed-income securities.
(5) The S&P 500® Index is an unmanaged index that measures the performance of securities of approximately 500 of the largest companies in the United States.
(6) The MSCI Japan® Index is a free float-adjusted market capitalization index that is designed to measure developed market equity performance in Japan.
(7) The MSCI Europe ex UK® Index is a free float adjusted market capitalization index that is designed to measure developed market equity performance in Europe, excluding the UK.
(8) The MSCI UK® Index is a free float-adjusted market capitalization index that is designed to measure developed market equity performance in the UK.
All indices are unmanaged and investors cannot invest directly in an index.
Past performance does not guarantee future results. The performance quoted represents past performance. Investment return and principal value of an investment will fluctuate, and shares, when redeemed, may be worth more or less than their original cost. The Funds’ performance is subject to change since the period’s end and may be lower or higher than the performance data shown. Please call (800) 992-0180 or log on to www.ingfunds.com to obtain performance data current to the most recent month end.
Market Perspective reflects the views of ING’s Chief Investment Risk Officer only through the end of the period, and is subject to change based on market and other conditions.
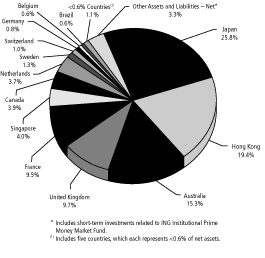
ING Global Equity Dividend Fund
Portfolio Managers’ Report
Country Allocation
as of October 31, 2008
(as a percent of net assets)
Portfolio holdings are subject to change daily.
ING Global Equity Dividend Fund (the “Fund”) seeks growth of capital with dividend income as a secondary consideration. The Fund is managed by Nicolas Simar, Head of Value/High Dividend, Moudy El Khodr, Senior Investment Manager Equities, and Kris Hermie, CFA, Senior Investment Manager of ING Investment Management Advisors B.V.— the Sub-Adviser.
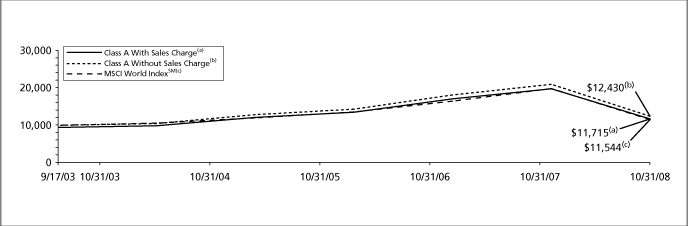
Performance: For the year ended October 31, 2008, the Fund’s Class A shares, excluding sales charges, provided a total return of (40.84)% compared to the Morgan Stanley Capital International World Indexsm(1) (“MSCI World Indexsm”), which returned (41.85)% for the same period.
Portfolio Specifics: The Fund uses the MSCI World Indexsm as its benchmark to reflect the strategic emphasis of the Fund. The Fund’s fiscal year was marked by a full fledged bear market. Earnings peaked in the summer of 2007. The financial sector’s problems with the subprime and credit crisis accumulated over the period, leading to broader economic impacts. From a slowdown, the global economy moved into recession. By the end of June 2008, only the materials and energy sectors were positive and then they also succumbed.
It should be noted that the pursuit of high dividend paying stocks typically leads the Fund to overweight financials and overweight Europe and underweight Japan and the United States. Each of those positions carried substantial disadvantages over the fiscal year, the first because of the problems in the financial industry as described, the last three because of the weaker European currencies and stronger yen.
In the first six months of the fiscal year, the Fund underperformed as financials delivered poor performance (the Fund was overweight) and the metals and miners segment of materials remained robust (the Fund was underweight). After June the Fund started to outperform; however, in the ensuing months this reversal only amounted to a third of the outperformance. The majority was due to choices in other sectors and new stocks that were incorporated into the portfolio. While at the beginning of the fall of the market, dividend investing did not deliver downside protection, in the last four months the Fund outperformed significantly. The Fund benefited from its value bias, as value started to have the upper hand over growth.
The sector that detracted the most from results was financials and only in the last few months did we relatively outperform in this sector. The largest gain came from the utilities sector, due to holding securities that underperformed less than the sector as a whole. The losses among financials, however, were almost twice the utilities’ gain. Stock picking accounted for a greater proportion of the contributions in telecoms and energy than in utilities, where sector allocation played a more significant role.
Current Strategy and Outlook: Our outlook for the Fund remains positive. We believe that after the general sell-off of the last few months, investors will pay more attention to the dividend theme in a market caught between a rock and a hard place. On the downside, low valuation may prevent further falls; but we believe earnings revisions, deleveraging and poorer economic data may limit the near-term upside before the economy recovers from this recession. We believe the current stage in the style cycle is more favorable for dividend investing, as are the recovery and boom phases. The last couple of months are a good grounding as not only in the down months did the Fund outperform but in July and August, the Fund delivered a positive absolute performance. We continue to look for individual stocks to exploit any temporary undervaluations that may take place.
| |
| (1) | This MSCI World Indexsm is an unmanaged index that measures the performance of over 1,400 securities listed on exchanges in the U.S., Europe, Canada, Australia, New Zealand and the Far East. It includes the reinvestment of dividends net of withholding taxes, but does not reflect fees, brokerage commissions or other expenses of investing. |
Portfolio holdings and characteristics are subject to change and may not be representative of current holdings and characteristics. The outlook for this Fund may differ from that presented for other ING Funds. Performance for the different classes of shares will vary based on differences in fees associated with each class.
Top Ten Holdings*
as of October 31, 2008
(as a percent of net assets)
| | | | | |
| ENI S.p.A. | | | 1.7 | % |
| BP PLC | | | 1.6 | % |
| Bank of America Corp. | | | 1.6 | % |
| Total SA | | | 1.6 | % |
| General Electric Co. | | | 1.5 | % |
| Vivendi | | | 1.5 | % |
| BNP Paribas | | | 1.5 | % |
| Pfizer, Inc. | | | 1.4 | % |
| Intesa Sanpaolo S.p.A. | | | 1.4 | % |
| Citigroup, Inc. | | | 1.4 | % |
* Excludes short-term investments related to securities lending collateral.
Portfolio holdings are subject to change daily.
4
ING Global Equity Dividend Fund
Portfolio Managers’ Report
| | | | | | | | | | | | | | | | | | | | | | | | | | | | | | | | | |
| Average Annual Total Returns for the Periods Ended October 31, 2008 |
| | | | | | | Since Inception
| | Since Inception
| | Since Inception
| | Since Inception
| | Since Inception
| | Since Inception
|
| | | | | | | of Class A
| | of Class B
| | of Class C
| | of Class I
| | of Class O
| | of Class W
|
| | | 1 Year | | 5 Year | | September 17, 2003 | | October 24, 2003 | | October 29, 2003 | | August 1, 2007 | | November 15, 2006 | | February 12, 2008 |
| |
Including Sales Charge: | | | | | | | | | | | | | | | | | | | | | | | | | | | | | | | | |
Class A(1) | | | (44.25 | )% | | | 2.22 | % | | | 3.13 | % | | | — | | | | — | | | | — | | | | — | | | | — | |
Class B(2) | | | (43.93 | )% | | | 2.39 | % | | | — | | | | 2.89 | % | | | — | | | | — | | | | — | | | | — | |
Class C(3) | | | (41.81 | )% | | | 2.70 | % | | | — | | | | — | | | | 2.78 | % | | | — | | | | | | | | — | |
| Class I | | | (40.49 | )% | | | — | | | | — | | | | — | | | | — | | | | (30.13 | )% | | | — | | | | — | |
| Class O | | | (40.83 | )% | | | — | | | | — | | | | — | | | | — | | | | — | | | | (17.78 | )% | | | — | |
| Class W | | | — | | | | — | | | | — | | | | — | | | | — | | | | — | | | | — | | | | (31.78 | )% |
Excluding Sales Charge: | | | | | | | | | | | | | | | | | | | | | | | | | | | | | | | | |
| Class A | | | (40.84 | )% | | | 3.44 | % | | | 4.33 | % | | | — | | | | — | | | | — | | | | — | | | | — | |
| Class B | | | (41.32 | )% | | | 2.69 | % | | | — | | | | 3.04 | % | | | — | | | | — | | | | — | | | | — | |
| Class C | | | (41.29 | )% | | | 2.70 | % | | | | | | | — | | | | 2.78 | % | | | — | | | | — | | | | — | |
| Class I | | | (40.49 | )% | | | — | | | | — | | | | — | | | | — | | | | (30.13 | )% | | | — | | | | — | |
| Class O | | | (40.83 | )% | | | — | | | | | | | | — | | | | — | | | | — | | | | (17.78 | )% | | | — | |
| Class W | | | — | | | | — | | | | — | | | | — | | | | — | | | | — | | | | — | | | | (31.78 | )% |
MSCI World Indexsm(4) | | | (41.85 | )% | | | 1.73 | % | | | 2.86 | %(5) | | | 1.73 | %(6) | | | 1.73 | %(6) | | | (31.13 | )% | | | (16.33 | )%(7) | | | (33.50 | )%(8) |
Based on a $10,000 initial investment, the graph and table above illustrate the total return of ING Global Equity Dividend Fund against the index indicated. The index is unmanaged and has no cash in its portfolio, imposes no sales charges and incurs no operating expenses. An investor cannot invest directly in the index. The Fund’s performance is shown both with and without the imposition of sales charges.
The graph and performance table do not reflect the deduction of taxes that a shareholder will pay on Fund distributions or the redemption of Fund Shares.
The performance shown may include the effect of fee waivers and/or expense reimbursements by the Investment Adviser and/or other service providers, which have the effect of increasing total return. Had all fees and expenses been considered, the total returns would have been lower.
Performance data represents past performance and is no assurance of future results. Investment return and principal value of an investment in the Fund will fluctuate. Shares, when sold, may be worth more or less than their original cost. The Fund’s current performance may be lower or higher than the performance data shown. Please log on to www.ingfunds.com or call (800) 992-0180 to get performance through the most recent month end.
It is important to note that the Fund has a limited operating history. Performance over a longer period of time may be more meaningful than short-term performance.
This report contains statements that may be “forward-looking” statements. Actual results may differ materially from those projected in the “forward-looking” statements.
The views expressed in this report reflect those of the portfolio managers, only through the end of the period as stated on the cover. The portfolio managers’ views are subject to change at any time based on market and other conditions.
Fund holdings are subject to change daily.
| |
| (1) | Reflects deduction of the maximum Class A sales charge of 5.75%. |
| (2) | Reflects deduction of the Class B deferred sales charge of 5% and 1%, respectively, for the 1 year and since inception returns. |
| (3) | Reflects deduction of the Class C deferred sales charge of 1% for the 1 year return. |
| (4) | The MSCI World Indexsm is a free float-adjusted market capitalization index that is designed to measure global developed market equity performance. It includes the reinvestment of dividends net of withholding taxes, but does not reflect fees, brokerage commissions or other expenses of investing. |
| (5) | Since inception performance for the index is shown from October 1, 2003. |
| (6) | Since inception performance for the index is shown from November 1, 2003. |
| (7) | Since inception performance for the index is shown from November 1, 2006. |
| (8) | Since inception performance for the index is shown from February 1, 2008. |
5
ING Global Natural Resources Fund
Portfolio Managers’ Report
Country Allocation
as of October 31, 2008
(as a percent of net assets)
Portfolio holdings are subject to change daily.
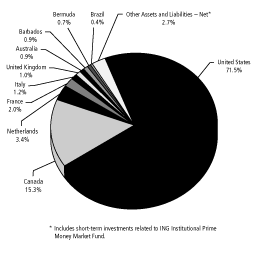
ING Global Natural Resources Fund (the “Fund”) seeks to attain long-term capital appreciation. The Fund is managed by James A. Vail, CFA, Portfolio Manager and David Powers, Portfolio Manager, both of ING Investment Management Co. — the Sub-Adviser.
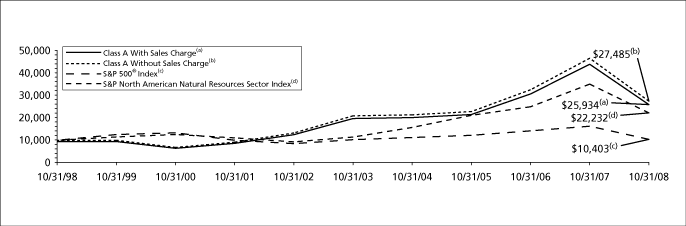
Performance: For the year ended October 31, 2008, the Fund’s Class A shares, excluding sales charges, provided a total return of (41.12)% compared to the Standard & Poor’s 500® Composite Stock Price Index(1) (“S&P 500® Index”) and the Standard & Poor’s (“S&P”) North American Natural Resources Sector Index(2) which returned (36.10)% and (39.50)%, respectively, for the same period.
Portfolio Specifics: In the beginning of the period, natural resources prices began to experience increased volatility. On the energy front, oil scarcity drove up crude prices as intermediate- to long-term supply additions remained uncertain. The weak dollar, stagflation concerns and the lack of confidence in housing, financials and consumer discretionary added support for commodities and the energy sector. Record price levels for gold, crude oil and other commodities were attained during the period of severe volatility but had shifted downward in a major reversal of the price cycle by period-end. The recent decline of crude oil and other commodities has been affected by fears of global economic slowing, increased credit pressures and unwinding of hedge positions.
The Fund benefited from its energy stock selection, particularly among integrated oil and gas companies. Royal Dutch Shell PLC and Total SA ADR were among the top performers. Integrated oil continues to be the Fund’s largest overweight as we believe these companies are well positioned to weather the global crisis due to their diverse business mixes, strong balance sheets and high dividend yields. Our large-cap value bias within energy helped relative returns towards the end of the period. Our decision to underweight mid- and small-cap exploration and production companies had a favorable impact, as momentum stocks lost their steam and more fundamentally-based value stocks began to outperform. We have moved to an overweight position in energy, as its growth potential is less dependent on emerging markets, especially China, than material companies.
Weak materials stock selection, arising from an overweight to diversified metals and mining and precious metals and minerals, acted as a drag on performance. Within diversified metals and mining, our investments in Boart Longyear Group, Consolidated Thompson Iron Mines Ltd. and Frontera Copper Corp. underperformed during the period. These mid-cap names declined significantly due to apprehension over global economic slowdown and its impact on overall demand and infrastructure spending. We reduced the Fund’s exposure to diversified metals and mining as our concerns increased about incremental global slowing.
Current Strategy and Outlook: We remain convinced that we are in the midst of a longer and stronger natural resource cycle, driven by industrialization and urbanization in emerging economies and by an acceleration of global infrastructure spending. The current global financial stress will, in our opinion, cause a longer than estimated interruption in this secular theme. If commodity prices continue to fall and stay low, however, new supply additions will be questioned. Global mining and energy development costs have risen and, although cyclical, are expected to stay elevated, raising the marginal price needed to justify new investment. We believe that demand will recover, and we would expect to see firmer prices and strong cash flows from the industry then. As the timing of this is uncertain, the Fund remains defensively positioned with an overweight in the integrated oil sector and underweight the materials. We believe in this environment a cautious stance is warranted.
| |
| (1) | The S&P 500® Index is an unmanaged index that measures the performance of securities of approximately 500 of the largest companies in the United States. |
| |
| (2) | The S&P North American Natural Resources Sector Index (formerly, the S&P GSSI Natural Resources Index) is an unmanaged index and a market-capitalization weighted index of stocks designed to measure the performance of companies in the natural resources sector, which includes energy, precious metals, timber and other sub-sectors. Each sector index is a modified-capitalization weighted index, the constituents of which are selected according to objective screening criteria. The weight of a particular stock in each Sector Index is capped at a cap level determined on a sector-by-sector basis. |
Portfolio holdings and characteristics are subject to change and may not be representative of current holdings and characteristics. The outlook for this Fund may differ from that presented for other ING Funds. Performance for the different classes of shares will vary based on differences in fees associated with each class.
Top Ten Holdings
as of October 31, 2008
(as a percent of net assets)
| | | | | |
| ExxonMobil Corp. | | | 12.0 | % |
| Chevron Corp. | | | 8.8 | % |
| Schlumberger Ltd. | | | 5.0 | % |
| ConocoPhillips | | | 4.9 | % |
| Encana Corp. | | | 4.7 | % |
| Apache Corp. | | | 4.7 | % |
| Occidental Petroleum Corp. | | | 4.6 | % |
| Devon Energy Corp. | | | 4.2 | % |
| Marathon Oil Corp. | | | 3.5 | % |
| Royal Dutch Shell PLC ADR – Class A | | | 3.5 | % |
Portfolio holdings are subject to change daily.
6
ING Global Natural Resources Fund
Portfolio Managers’ Report
| | | | | | | | | | | | | | | | | | | | | |
| Average Annual Total Returns for the Periods Ended October 31, 2008 |
| | | | | | | | | Since Inception
| | Since Inception
|
| | | | | | | | | of Class I
| | of Class W
|
| | | 1 Year | | 5 Year | | 10 Year | | August 1, 2007 | | February 12, 2008 |
| |
Including Sales Charge: | | | | | | | | | | | | | | | | | | | | |
Class A(1) | | | (44.53 | )% | | | 4.37 | % | | | 9.99 | % | | | | | | | — | |
| Class I | | | (40.87 | )% | | | — | | | | — | | | | (25.50 | )% | | | — | |
| Class W | | | — | | | | — | | | | — | | | | — | | | | (34.66 | )% |
Excluding Sales Charge: | | | | | | | | | | | | | | | | | | | | |
| Class A | | | (41.12 | )% | | | 5.60 | % | | | 10.63 | % | | | — | | | | — | |
| Class I | | | (40.87 | )% | | | — | | | | — | | | | (25.20 | )% | | | — | |
| Class W | | | — | | | | — | | | | — | | | | — | | | | (34.66 | )% |
S&P 500® Index(2) | | | (36.10 | )% | | | 0.26 | % | | | 0.40 | % | | | (26.24 | )% | | | (28.56 | )%(4) |
S&P North American Natural Resources Sector Index(3) | | | (39.50 | )% | | | 13.17 | % | | | 8.31 | % | | | (26.70 | )% | | | (33.57 | )%(4) |
Based on a $10,000 initial investment, the graph and table above illustrate the total return of ING Global Natural Resources Fund against the indices indicated. An index is unmanaged and has no cash in its portfolio, imposes no sales charge and incurs no operating expenses. An investor cannot invest directly in an index. The Fund’s performance is shown both with and without the imposition of sales charges.
The graph and performance table do not reflect the deduction of taxes that a shareholder will pay on Fund distributions or the redemption of Fund shares.
The performance shown may include the effect of fee waivers and/or expense reimbursements by the Investment Adviser and/or other service providers, which have the effect of increasing total return. Had all fees and expenses been considered, the total returns would have been lower.
Performance data represents past performance and is no assurance of future results. Investment return and principal value of an investment in the Fund will fluctuate. Shares, when sold, may be worth more or less than their original cost. The Fund’s current performance may be lower or higher than the performance data shown. Please log on to www.ingfunds.com or call (800) 992-0180 to get performance through the most recent month end.
This report contains statements that may be “forward-looking” statements. Actual results may differ materially from those projected in the “forward-looking” statements.
The views expressed in this report reflect those of the portfolio managers, only through the end of the period as stated on the cover. The portfolio managers’ views are subject to change at any time based on market and other conditions.
Fund Holdings are subject to change daily.
| |
| (1) | Reflects deduction of the maximum Class A sales charge of 5.75%. |
| |
| |
| (2) | The S&P 500® Index is an unmanaged index that measures the performance of securities of approximately 500 of the largest companies in the United States. |
| |
| |
| (3) | The S&P North American Natural Resources Sector Index (formerly, the S&P GSSI Natural Resources Index) is an unmanaged index and a market-capitalization weighted index of stocks designed to measure the performance of companies in the natural resources sector, which includes energy, precious metals, timber and other sub-sectors. Each sector index is a modified-capitalization weighted index, the constituents of which are selected according to objective screening criteria. The weight of a particular stock in each Sector Index is capped at a cap level determined on a sector-by-sector basis. |
| |
| |
| (4) | Since inception performance for index is shown from February 1, 2008. |
7
ING Global Real Estate Fund
Portfolio Managers’ Report
Country Allocation
as of October 31, 2008
(as a percent of net assets)
Portfolio holdings are subject to change daily.
ING Global Real Estate Fund (the “Fund”) seeks to provide investors with high total return, consisting of capital appreciation and current income. The Fund is managed by T. Ritson Ferguson, Chief Investment Officer and Portfolio Manager, Steven D. Burton, Managing Director and Portfolio Manager and Joseph P. Smith, Managing Director and Portfolio Manager, of ING Clarion Real Estate Securities L.P. — the Sub-Adviser.
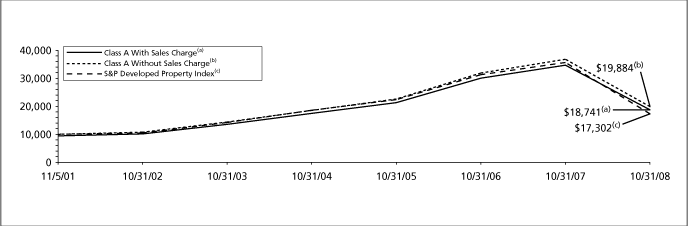
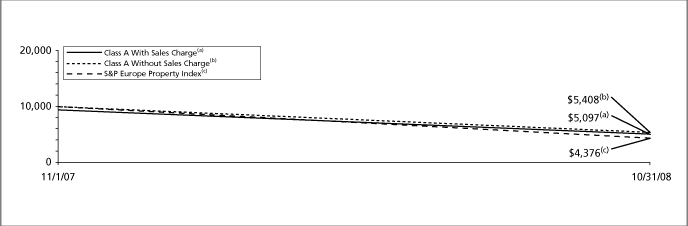
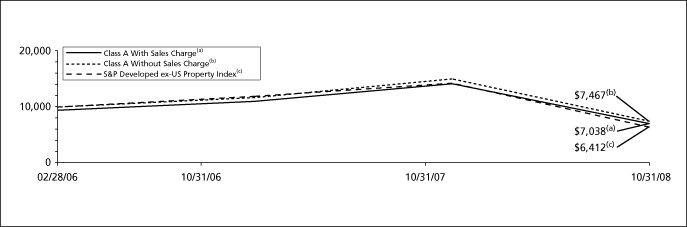
Performance: For the year ended October 31, 2008, the Fund’s Class A shares, excluding sales charges, provided a total return of (46.00)% compared to the Standard & Poor’s (“S&P”) Developed Property Index(1), which returned (51.48)% for the same period.
Portfolio Specifics: The past twelve months has proved to be a very difficult period for the world’s listed real estate markets as tightening credit market conditions and a slowing global economy have provided significant headwinds to the world’s capital markets. Investor concerns continue to center on the ramifications of the credit crunch, including the lack of liquidity and scarcity of available capital. Governments and Central Banks have responded aggressively to these issues via significant capital support to financial institutions as well as interest rate cuts. Though all regions experienced a significant sell-off over the past twelve months, North American property stocks fared the best, down 41.5%, followed by the European and Asia Pacific regions which were down 56.2% and 57.2%, respectively. In the North American region, U.S. property stocks held up well until the market decline in October which accounted for three-quarters of the 40.8% decline generated during the past twelve months. Within the European region, the return differential between countries was quite substantial, ranging from a (16.9)% return posted by Switzerland, the best-performing market during the period, to a (87.1)% return posted by Norway, the poorest-performing market during the period. On whole, the countries which fared the best in the current environment were the countries in the Benelux region as well as Switzerland and France; the countries which fared the worst were in Southern, Central and Eastern Europe as well as the Scandanavian region. Within the Asia-Pacific region, negative performance was driven most notably by Australia, which was down 69% for the period. Hong Kong- and Singapore-based property companies with exposure to development in mainland China also performed particularly poorly during the period, in a complete reversal from 2007 when these companies significantly outperformed.
Fund outperformance for the period was driven by stock selection and country allocation as both stock selection and country allocation were positive across all regions. Stock selection, which accounted for roughly 60% of the period’s outperformance, was especially strong in the Asia-Pacific region as the Fund maintained its tilt towards conservatively-managed companies, defensive property types, and rock-solid balance sheets. Examples of Fund holdings along these lines include Australian global mall operator Westfield Group, Hong Kong shopping center company Link Real Estate Investment Trust, and Tokyo office landlord Mitsubishi Estate Co., Ltd., all of which outperformed their respective countries’ average return for the period. Conversely, the Fund avoided investments in companies with the opposite characteristics, especially companies with above-average leverage or any prospective refinancing concerns. Stock selection in the U.S. added significantly to relative returns as overweight positions in outperforming companies in the healthcare sector (Ventas, Inc., Nationwide Health Properties, Inc. and Omega Healthcare Investors, Inc.) and retail sector (Federal Realty Investment Trust, Simon Property Group, Inc. and Tanger Factory Outlet Centers, Inc.) were some of the best-performing stocks from a relative perspective. Within Europe, overweight positions in outperforming French retail property companies Unibail-Rodamco and Mercialys boosted relative returns.
Country allocation decisions added value, helped by overweights to outperforming property markets in Americas (Brazil and the U.S.), selective country allocation decisions in Europe, and an underweight to the underperforming Asian property markets (Singapore and Hong Kong).
Current Strategy and Outlook: The Fund continues to maintain a defensive positioning, with a bias toward high-quality companies. We remain overweight sectors and geographies offering long-term leases and high percentages of earnings from recurring sources (primarily contract lease rental income). We prefer companies offering more transparency, strong balance sheets and good, experienced management teams. This focus on quality has driven our significant outperformance in the trying times of the past year. Conversely, we are avoiding companies dependent on acquisitions and/or development activities for earnings growth.
This bear market has already reached levels and duration comparable to past severe market declines. The extreme volatility in the market is an indicator that the normal fundamental underpinnings of the market’s price discovery mechanism have broken down. In our view, with past bear markets as a gauge, it seems we may be nearing the end of this correction.
Global property companies remain attractively valued. We estimate the average global property company is trading at a 28% discount to our internal estimate of inherent private real estate market value, ranging from the low, a 5% discount in the U.K., to the high, a 50% discount in Hong Kong. In our opinion, the market continues to price in a highly pessimistic scenario in terms of a global economic slowdown.
(1) The S&P Developed Property Index (formerly, the S&P/Citigroup BMI World Property Index) is an unmanaged float-adjusted index which defines and measure the investable universe of publicly traded property companies domiciled in developed countries that derive more than half of their revenue from property-related activities, such as property ownership, management, development, rental and investment.
Portfolio holdings and characteristics are subject to change and may not be representative of current holdings and characteristics. The outlook for this Fund may differ from that presented for other ING Funds. Performance for the different classes of shares will vary based on differences in fees associated with each class.
Top Ten Holdings*
as of October 31, 2008
(as a percent of net assets)
| | | | | |
| Westfield Group | | | 6.0 | % |
| Mitsubishi Estate Co., Ltd. | | | 5.4 | % |
| Simon Property Group, Inc. | | | 5.0 | % |
| Unibail | | | 4.3 | % |
| Cheung Kong Holdings Ltd. | | | 3.8 | % |
| Mitsui Fudosan Co., Ltd. | | | 3.5 | % |
| Federal Realty Investment Trust | | | 2.7 | % |
| Vornado Realty Trust | | | 2.7 | % |
| Ventas, Inc. | | | 2.4 | % |
| Sun Hung Kai Properties Ltd. | | | 2.3 | % |
| | | |
| | * | Excludes short-term investments related to ING Institutional Prime Money Market Fund and securities lending collateral. | |
Portfolio holdings are subject to change daily.
8
ING Global Real Estate Fund
Portfolio Managers’ Report
| | | | | | | | | | | | | | | | | | | | | | | | | | | | | | | | | |
| Average Annual Total Returns for the Periods Ended October 31, 2008 |
| | | | | | | Since Inception
| | Since Inception
| | Since Inception
| | Since Inception
| | Since Inception
| | Since Inception
|
| | | | | | | of Class A
| | of Class B
| | of Class C
| | of Class I
| | of Class O
| | of Class W
|
| | | 1 Year | | 5 Year | | November 5, 2001 | | March 15, 2002 | | January 8, 2002 | | June 3, 2005 | | November 15, 2006 | | February 12, 2008 |
| |
Including Sales Charge: | | | | | | | | | | | | | | | | | | | | | | | | | | | | | | | | |
Class A(1) | | | (49.11 | )% | | | 5.43 | % | | | 9.40 | % | | | — | | | | — | | | | — | | | | — | | | | — | |
Class B(2) | | | (48.98 | )% | | | 5.60 | % | | | — | | | | 8.25 | % | | | — | | | | — | | | | — | | | | — | |
Class C(3) | | | (46.90 | )% | | | 5.94 | % | | | — | | | | — | | | | 8.55 | % | | | — | | | | — | | | | — | |
| Class I | | | (45.77 | )% | | | — | | | | — | | | | — | | | | — | | | | (1.68 | )% | | | — | | | | — | |
| Class O | | | (46.03 | )% | | | — | | | | — | | | | — | | | | — | | | | — | | | | (21.35 | )% | | | — | |
| Class W | | | — | | | | — | | | | — | | | | — | | | | — | | | | — | | | | — | | | | (33.53 | )% |
Excluding Sales Charge: | | | | | | | | | | | | | | | | | | | | | | | | | | | | | | | | |
| Class A | | | (46.00 | )% | | | 6.69 | % | | | 10.33 | % | | | — | | | | — | | | | — | | | | — | | | | — | |
| Class B | | | (46.40 | )% | | | 5.89 | % | | | — | | | | 8.25 | % | | | — | | | | — | | | | — | | | | — | |
| Class C | | | (46.38 | )% | | | 5.91 | % | | | — | | | | — | | | | 8.55 | % | | | — | | | | — | | | | — | |
| Class I | | | (45.77 | )% | | | — | | | | — | | | | — | | | | — | | | | (1.68 | )% | | | — | | | | — | |
| Class O | | | (46.03 | )% | | | — | | | | — | | | | — | | | | — | | | | — | | | | (21.35 | )% | | | — | |
| Class W | | | — | | | | — | | | | — | | | | — | | | | — | | | | — | | | | — | | | | (33.53 | )% |
S&P Developed Property Index(4) | | | (51.48 | )% | | | 4.01 | % | | | 8.14 | %(5) | | | 6.96 | %(6) | | | 7.48 | %(7) | | | (5.38 | )%(8) | | | (28.45 | )%(9) | | | (13.33 | )%(10) |
Based on a $10,000 initial investment, the graph and table above illustrate the total return of ING Global Real Estate Fund against the index indicated. The index is unmanaged and has no cash in its portfolio, imposes no sales charge and incurs no operating expenses. An investor cannot invest directly in the index. The Fund’s performance is shown both with and without the imposition of sales charges.
The graph and performance table do not reflect the deduction of taxes that a shareholder will pay on Fund distributions or the redemption of Fund shares.
The performance shown may include the effect of fee waivers and/or expense reimbursements by the Investment Adviser and/or other service providers, which have the effect of increasing total return. Had all fees and expenses been considered, the total returns would have been lower.
Performance data represents past performance and is no assurance of future results. Investment return and principal value of an investment in the Fund will fluctuate. Shares, when sold, may be worth more or less than their original cost. The Fund’s current performance may be lower or higher than the performance data shown. Please log on to www.ingfunds.com or call (800) 992-0180 to get performance through the most recent month end.
This report contains statements that may be “forward-looking” statements. Actual results may differ materially from those projected in the “forward-looking” statements.
The views expressed in this report reflect those of the portfolio managers, only through the end of the period as stated on the cover. The portfolio managers’ views are subject to change at any time based on market and other conditions.
Fund holdings are subject to change daily.
| |
| (1) | Reflects deduction of the maximum Class A sales charge of 5.75%. |
| (2) | Reflects deduction of the Class B deferred sales charge of 5% and 2%, respectively, for the 1 year and 5 year returns. |
| (3) | Reflects deduction of the Class C deferred sales charge of 1% for the 1 year return. |
| (4) | The S&P Developed Property Index (formerly, the S&P/Citigroup BMI World Property Index) is an unmanaged float-adjusted index which defines and measure the investable universe of publicly traded property companies domiciled in developed countries that derive more than half of their revenue from property-related activities, such as property ownership, management, development, rental and investment. |
| (5) | Since inception performance for index is shown from November 1, 2001. |
| (6) | Since inception performance for index is shown from March 1, 2002. |
| (7) | Since inception performance for index is shown from January 1, 2002. |
| (8) | Since inception performance for index is shown from June 1, 2005. |
| (9) | Since inception performance for index is shown from November 1, 2006. |
| (10) | Since inception performance for index is shown from February 1, 2008. |
9
ING Global Value Choice Fund
Portfolio Managers’ Report
Country Allocation
as of October 31, 2008
(as a percent of net assets)
Portfolio holdings are subject to change daily.
ING Global Value Choice Fund (the “Fund”) seeks long-term capital appreciation. The Fund is managed by David B. Iben, CFA, Portfolio Manager of Tradewinds Global Investors, LLC (“Tradewinds”) — the Sub-Adviser.
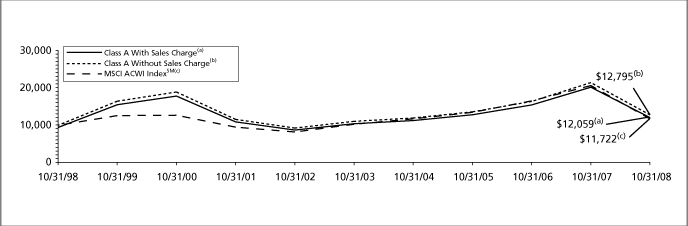
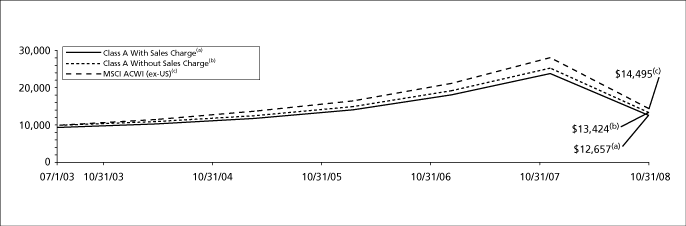
Performance: For the year ended October 31, 2008, the Fund’s Class A shares, excluding sales charges, provided a total return of (40.34)% compared to the Morgan Stanley Capital International All Country World Indexsm(1) (“MSCI ACWIsm”) which returned (43.57)% for the same period.
Portfolio Specifics: The Fund returned negative absolute returns during the twelve month period ending October 31, 2008, yet outperformed its benchmark. The Fund remained significantly underweight versus the benchmark in the financials sector, which for the period was fortunate given the relative underperformance of financials. The Fund’s Japanese holdings represented the largest non-U.S. country weighting and significantly outperformed versus the benchmark for the year. A significant portion of the Fund’s absolute negative performance for the period was due to its overweight position in the materials sector.
Among the securities that contributed to performance, Amgen, Inc. was the largest overall contributor to returns. The biotechnology company performed well, after it announced earnings that beat Wall Street’s expectations and disclosed positive results from an osteoporosis clinical trial in July. Electronic Data Systems Corp. , a global technology services company that delivers business solutions, also aided returns. Its share price appreciated considerably when Hewlett-Packard Co. announced that it would acquire the company at a premium.
We believe there was somewhat indiscriminate selling overall in the materials sector, especially during the third quarter of calendar year 2008, and many of the Fund’s holdings in this sector were not immune to the markets downward price pressures. AngloGold Ashanti Ltd. ADR, a global gold producer with operations and exploration programs around the world, performed poorly due to, among other things, general weakness in the gold industry, and was a large detractor to overall returns.
Korea Electric Power Corp. ADR (“KEPCO”) was another detractor from overall returns. The company’s share price declined significantly throughout the period after the newly-elected South Korean government failed to grant the company a tariff adjustment in late December 2007, while coal and liquefied natural gas prices, which account for the majority of KEPCO’s fuel costs, posted steep increases. The government’s action created investor uncertainty about the company. In addition, the weaker Korean Won also negatively affected returns. We believe KEPCO continues to be significantly undervalued.
Sprint Nextel Corp., a provider of wireless and wireline communication products and services, was another large detractor from performance for the period.
The consumer staples sector underperformed, primarily due to protein providers Marine Harvest, Smithfield Foods, Inc. and Tyson Foods. The companies faced operational challenges, such as fish disease problems in South America, and rising food costs, and more recently declined in the period based upon concerns regarding the breaching of financial covenants.
Current Strategy and Outlook: In this volatile environment, capital preservation has become much more difficult than in previous downturns. When managing the Fund, we think of the investments we make as long term holdings, with our sector weights coming through from bottom-up analysis driven by our desire to buy quality companies at attractive valuation, not to time the market. This has put us in very good stead for many years now, with very high levels of alpha generation. However, this also means that at certain times we may return negative performance, and the last twelve months were an example of that. We continue to find good opportunities in many areas such as materials, energy and certain consumer names. We believe that over the longer term the Fund is well positioned and continues to own companies with real barriers to entry and, which in our view have just become even more attractively valued versus their intrinsic worth.
| |
| (1) | The MSCI ACWIsm is a free-float adjusted market capitalization index that is designed to measure equity market performance in the global developed and emerging markets. |
Portfolio holdings and characteristics are subject to change and may not be representative of current holdings and characteristics. The outlook for this Fund may differ from that presented for other ING Funds. Performance for the different classes of shares will vary based on differences in fees associated with each class.
Top Ten Holdings*
as of October 31, 2008
(as a percent of net assets)
| | | | | |
| Nippon Telegraph & Telephone Corp. ADR | | | 4.5 | % |
| Anglogold Ashanti Ltd. ADR | | | 4.0 | % |
| Newmont Mining Corp. | | | 3.9 | % |
| Sanofi-Aventis ADR | | | 3.8 | % |
| Barrick Gold Corp. | | | 3.5 | % |
| Korea Electric Power Corp. ADR | | | 3.2 | % |
| Stolt-Nielsen SA | | | 3.0 | % |
| Centrais Eletricas Brasileiras SA ADR – Class B | | | 2.9 | % |
| Sekisui House Ltd. | | | 2.8 | % |
| UBS AG – New | | | 2.6 | % |
| | | |
| | * | Excludes short-term investments related to securities lending collateral. | |
Portfolio holdings are subject to change daily.
10
ING Global Value Choice Fund
Portfolio Managers’ Report
| | | | | | | | | | | | | | | | | |
| Average Annual Total Returns for the Periods Ended October 31, 2008 |
| | | | | | | | | Since Inception
|
| | | | | | | | | of Class I
|
| | | 1 Year | | 5 Year | | 10 Year | | September 6, 2006 |
| |
Including Sales Charge: | | | | | | | | | | | | | | | | |
Class A(1) | | | (43.77 | )% | | | 1.73 | % | | | 1.89 | % | | | — | |
Class B(2) | | | (43.77 | )% | | | 1.88 | % | | | 1.80 | % | | | — | |
Class C(3) | | | (41.39 | )% | | | 2.25 | % | | | 1.81 | % | | | — | |
| Class I | | | (40.13 | )% | | | — | | | | — | | | | (9.71 | )% |
| Class Q | | | (40.31 | )% | | | 3.18 | % | | | 2.74 | % | | | — | |
Excluding Sales Charge: | | | | | | | | | | | | | | | | |
| Class A | | | (40.34 | )% | | | 2.94 | % | | | 2.49 | % | | | — | |
| Class B | | | (40.81 | )% | | | 2.25 | % | | | 1.80 | % | | | — | |
| Class C | | | (40.79 | )% | | | 2.25 | % | | | 1.81 | % | | | — | |
| Class I | | | (40.13 | )% | | | — | | | | — | | | | (9.71 | )% |
| Class Q | | | (40.31 | )% | | | 3.18 | % | | | 2.74 | % | | | — | |
MSCI ACWISM(4) | | | (43.57 | )% | | | 2.13 | % | | | 1.60 | %(5) | | | (13.21 | )%(6) |
Based on a $10,000 initial investment, the graph and table above illustrate the total return of ING Global Value Choice Fund against the index indicated. The index is unmanaged and has no cash in its portfolio, imposes no sales charge and incurs no operating expenses. An investor cannot invest directly in an index. The Fund’s performance is shown both with and without the imposition of sales charges.
The graph and performance table do not reflect the deduction of taxes that a shareholder will pay on Fund distributions or the redemption of Fund shares.
The performance shown may include the effect of fee waivers and/or expense reimbursements by the Investment Adviser and/or other service providers, which have the effect of increasing total return. Had all fees and expenses been considered, the total returns would have been lower.
Performance data represents past performance and is no assurance of future results. Investment return and principal value of an investment in the Fund will fluctuate. Shares, when sold, may be worth more or less than their original cost. The Fund’s current performance may be lower or higher than the performance data shown. Please log on to www.ingfunds.com or call (800) 992-0180 to get performance through the most recent month end.
This report contains statements that may be “forward-looking” statements. Actual results may differ materially from those projected in the “forward-looking” statements.
The views expressed in this report reflect those of the portfolio managers, only through the end of the period as stated on the cover. The portfolio managers’ views are subject to change at any time based on market and other conditions.
Fund holdings are subject to change daily.
| |
| (1) | Reflects deduction of the maximum Class A sales charge of 5.75%. |
| (2) | Reflects deduction of the Class B deferred sales charge of 5% and 2%, respectively, for the 1 year and 5 year returns. |
| (3) | Reflects deduction of the Class C deferred sales charge of 1% for the 1 year return. |
| (4) | The MSCI ACWISM is a free-float adjusted market capitalization index that is designed to measure equity market performance in the global developed and emerging markets. |
| (5) | Net return for index is shown from November 1, 2002. |
| (6) | Since inception performance for the index is shown from September 1, 2006. |
Prior to April 24, 2006, the Fund was advised by a different sub-adviser.
11
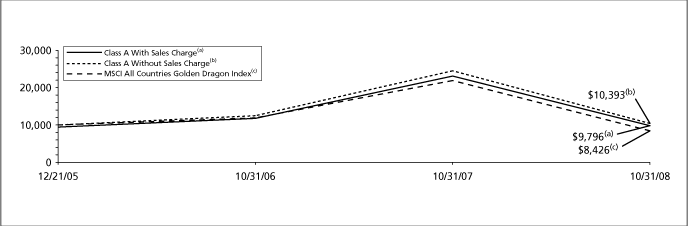
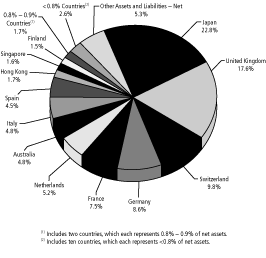
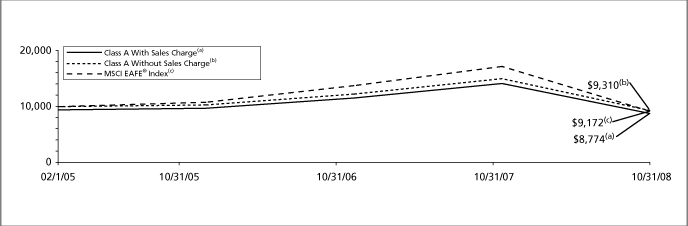
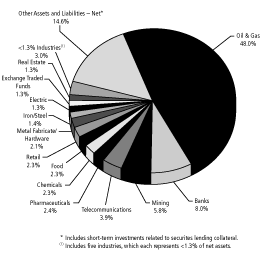
ING Asia-Pacific Real Estate Fund
Portfolio Managers’ Report
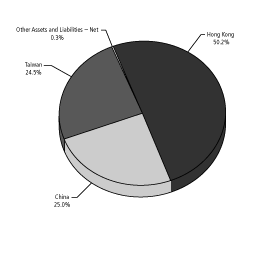
Country Allocation
as of October 31, 2008
(as a percent of net assets)
| | | | | | |
| Japan | | | 43.9 | | % |
| Hong Kong | | | 30.4 | | % |
| Australia | | | 22.2 | | % |
| Singapore | | | 8.0 | | % |
| New Zealand | | | 1.3 | | % |
| Other Assets and Liabilities – Net | | | (5.8 | | )% |
| Net Assets | | | 100.0 | | % |
Portfolio holdings are subject to change daily.
ING Asia-Pacific Real Estate Fund (the “Fund”) seeks to provide investors with high total return, consisting of capital appreciation and current income. The Fund is managed by T. Ritson Ferguson, Chief Investment Officer, CFA and Steven D. Burton, Managing Director, CFA, both of ING Clarion Real Estate Securities L.P. — the Sub-Adviser.
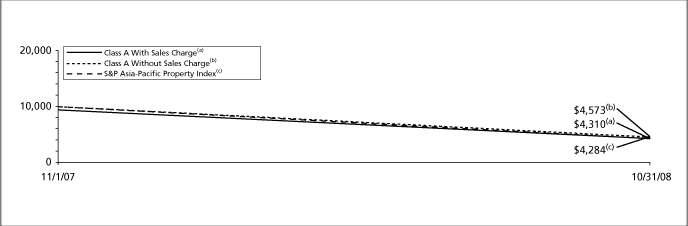
Performance: Since inception on November 1, 2007 through October 31, 2008, the Fund’s Class A shares, excluding sales charges, provided a total return of (54.27)% compared to the Standard & Poor’s (“S&P”) Asia-Pacific Property Index(1) which returned (57.16)% for the same period.
Portfolio Specifics: The past twelve months proved to be a very difficult period for the world’s listed real estate markets as tightening credit market conditions and a slowing global economy have provided significant headwinds to the world’s capital markets. The Asia-Pacific region showed particular sensitivity to ongoing concerns regarding the effects of slowing global economic growth on export-based economies. From a relative standpoint, Asia-Pacific property companies underperformed other regional investment strategies during the period — though it should be noted that all regions experienced a significant sell-off over the past twelve months. Negative performance was driven most notably by Australia, which was down 69% for the period. Hong Kong- and Singapore-based property companies with exposure to development in mainland China also performed particularly poorly during the period, in a complete reversal from 2007 when these companies significantly outperformed.
The Fund outperformed the benchmark for the period, the result of positive stock selection and country allocation decisions. Stock selection accounted for nearly three-quarters of the Fund’s relative outperformance during the period and was positive in Australia, Japan, and Singapore, though the Fund’s Hong Kong holdings underperformed during the period. In Australia, stock selection was led by overweights to outperforming companies CFS Retail Property Trust, Commonwealth Property Office Fund and Westfield Group as well as underweights to underperforming companies Centro Retail Trust, Macquarie Office Trust, Macquarie Goodman Group and FKP Property Group. In Japan, overweights to outperforming office companies Mitsui Fudosan Co., Ltd., Japan Real Estate Investment Corp., Nomura Real Estate Office Fund, Inc. and Nippon Building Fund, Inc. added value during the period as the Tokyo office market fared quite well. While the Tokyo office market is not immune to economic slowdown, vacancy remains fairly low in a global context at about 4.0%. In Singapore, overweights to outperforming companies CapitaMall Trust and Ascendas Real Estate Investment Trust, along with underweights to underperforming developers such as Keppel Land Ltd. also helped relative performance. Country allocation benefited from an underweight to the underperforming property market in Singapore which was down 63.9% for the period.
Current Strategy and Outlook: We remain cautious on many of the Asian markets. Why? Values look interesting, but the current and continuing weakness is a function of several variables: (1) no yield support — dividend levels in Asia are, generally, low; (2) a lower proportion of revenues come from long-term contract rents for many companies; and (3) a higher proportion of revenues come from development activities which, by nature, bring above-average risk. In this environment, investors crave (even demand) certainty. Sectors and geographies offering long-term leases and high percentages of earnings from recurring sources (primarily contract lease rental income) have been the outperformers so far this year. Asia looks cheap from a valuation standpoint, with price-to-NAV discounts ranging from 20% to 50%. However, many Asian companies have 50% or more of their income from sources other than rental income (e.g., development profits). In our opinion, there is clear evidence that cash flow from these activities is unlikely to grow and may contract significantly in these difficult times. Absent certainty, we prefer investing in companies offering more transparency, strong balance sheets and good, experienced management teams. This focus on quality has driven our significant outperformance in the trying times of the past year.
This bear market has already reached levels and duration comparable to past severe market declines. We believe the extreme volatility in the market is an indicator that the normal fundamental underpinnings of the market’s price discovery mechanism have broken down. In our view, with past bear markets as a gauge, it seems we may be nearing the end of this correction.
Most Asia-Pacific property companies continue to trade at steep discounts to NAV; Australia 18% discount, Singapore 40% discount, Japan 44% discount, and Hong Kong 50% discount. In our opinion, the market has priced in an overly pessimistic economic scenario.
We believe the rationale for an Asia-Pacific listed property strategy remains very much intact including the opportunity for diversification in the region, access to solid long-term underlying property fundamentals and the continued expansion of the REIT structure throughout the region. We believe this remains true even under the likely scenario of slowing global economic growth over the coming year.
| |
| (1) | The S&P Asia-Pacific Property Index is an unmanaged float-adjusted index which defines and measures the investable universe of publicly traded property companies domiciled in developed countries in the Asia Pacific region, that derive more than half of their revenue from property-related activities, such as property ownership, management, development, rental and investment. |
Portfolio holdings and characteristics are subject to change and may not be representative of current holdings and characteristics. The outlook for this Fund may differ from that presented for other ING Funds. Performance for the different classes of shares will vary based on differences in fees associated with each class.
Top Ten Holdings
as of October 31, 2008
(as a percent of net assets)
| | | | | |
| Mitsubishi Estate Co., Ltd. | | | 12.6 | % |
| Westfield Group | | | 12.5 | % |
| Mitsui Fudosan Co., Ltd. | | | 9.6 | % |
| Cheung Kong Holdings Ltd. | | | 8.8 | % |
| Sun Hung Kai Properties Ltd. | | | 6.3 | % |
| Nippon Building Fund, Inc. | | | 4.6 | % |
| Japan Real Estate Investment Corp. | | | 4.1 | % |
| Sumitomo Realty & Development Co., Ltd. | | | 3.7 | % |
| Hang Lung Properties Ltd. | | | 3.5 | % |
| Stockland | | | 2.7 | % |
Portfolio holdings are subject to change daily.
12
ING Asia-Pacific Real Estate Fund
Portfolio Managers’ Report
| | | | | |
| Cumulative Total Returns for the Period Ended October 31, 2008 |
| | | Since Inception
|
| | | of Classes A, B, C, and I
|
| | | November 1, 2007 |
| |
Including Sales Charge: | | | | |
Class A(1) | | | (56.90 | )% |
Class B(2) | | | (56.88 | )% |
Class C(3) | | | (55.07 | )% |
| Class I | | | (54.25 | )% |
Excluding Sales Charge: | | | | |
| Class A | | | (54.27 | )% |
| Class B | | | (54.63 | )% |
| Class C | | | (54.62 | )% |
| Class I | | | (54.25 | )% |
S&P Asia-Pacific Property Index(4) | | | (57.16 | )% |
Based on a $10,000 initial investment, the table and graph above illustrate the total return of ING Asia-Pacific Real Estate Fund against the index indicated. The index is unmanaged and has no cash in its portfolio, imposes no sales charge and incurs no operating expenses. An investor cannot invest directly in the index. The Fund’s performance is shown both with and without the imposition of sales charges.
The graph and performance table do not reflect the deduction of taxes that a shareholder will pay on Fund distributions or the redemption of Fund Shares.
The performance shown may include the effect of the waivers and/or expense reimbursements by the Investment Adviser and/or other service providers, which have the effect of increasing total return. Had all fees and expenses been considered, the total returns would have been lower.
Performance data represents past performance and is no assurance of future results. Investment return and principal value of an investment in the Fund will fluctuate. Shares, when sold, may be worth more or less than their original cost. The Fund’s current performance may be lower or higher than the performance data shown. Please log on to www.ingfunds.com or call (800) 992-0180 to get performance through the most recent month end.
It is important to note that the Fund has a limited operating history. Performance over a longer period of time may be more meaningful than short-term performance.
This report contains statements that may be “forward-looking” statements. Actual results may differ materially from those projected in the “forward-looking” statements.
The views expressed in this report reflect those of the portfolio managers, only through the end of the period as stated on the cover. The portfolio managers’ views are subject to change at any time based on market and other conditions.
Fund holdings are subject to change daily.
| |
| (1) | Reflects deduction of the maximum Class A sales charge of 5.75%. |
| (2) | Reflects deduction of the Class B deferred sales charge of 5% for the since inception return. |
| (3) | Reflects deduction of the Class C deferred sales charge of 1% for the since inception return. |
| (4) | The S&P Asia-Pacific Property Index is an unmanaged float-adjusted index which defines and measures the investable universe of publicly traded property companies domiciled in developed countries in the Asia Pacific region, that derive more than half of their revenue from property-related activities, such as property ownership, management, development, rental and investment. |
13
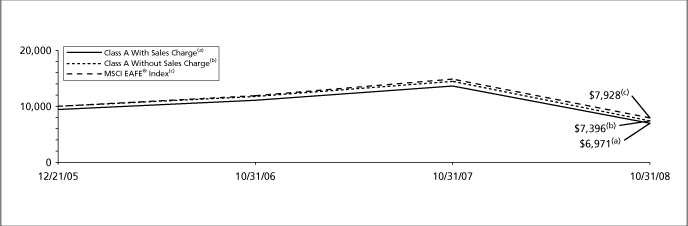
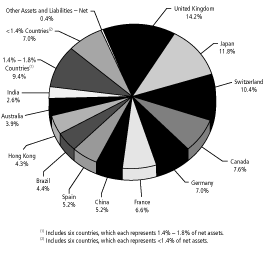
ING Disciplined International SmallCap Fund
Portfolio Managers’ Report
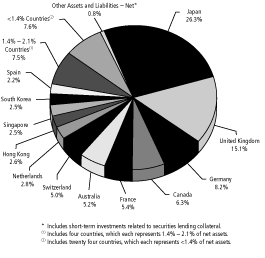
Country Allocation
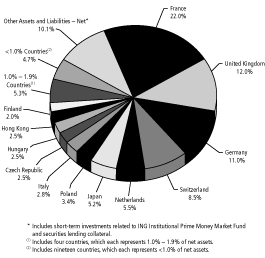
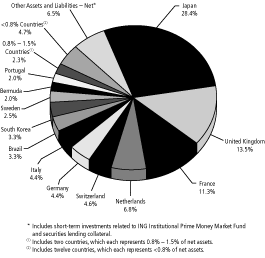
as of October 31, 2008
(as a percent of net assets)
| | | | | | |
| Japan | | | 27.1 | | % |
| United Kingdom | | | 13.7 | | % |
| France | | | 10.7 | | % |
| Germany | | | 8.1 | | % |
| Canada | | | 6.9 | | % |
| Switzerland | | | 6.9 | | % |
| Italy | | | 5.9 | | % |
| Australia | | | 5.1 | | % |
| South Korea | | | 3.2 | | % |
| Netherlands | | | 2.3 | | % |
| Hong Kong | | | 2.0 | | % |
| Belgium | | | 1.8 | | % |
Countries less than 1.8%(1) | | | 6.9 | | % |
| Other Assets and Liabilities – Net* | | | (0.6 | | )% |
| Net Assets | | | 100.0 | | % |
| | | |
| | * | Includes short-term investments related to repurchase agreement. | |
| | | |
| | (1) | Includes ten countries, which each represents less than 1.8% of net assets. | |
Portfolio holdings are subject to change daily.
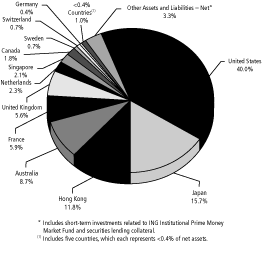
ING Disciplined International SmallCap Fund (the “Fund”) seeks long term capital appreciation. The Fund is managed by Omar Aguilar, Ph.D., Portfolio Manager and Vincent Costa, CFA, Portfolio Manager, both of ING Investment Management Co. — the Sub-Adviser.
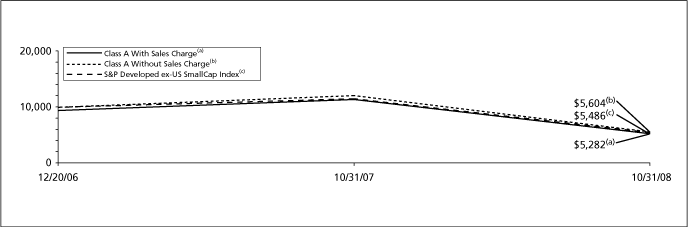
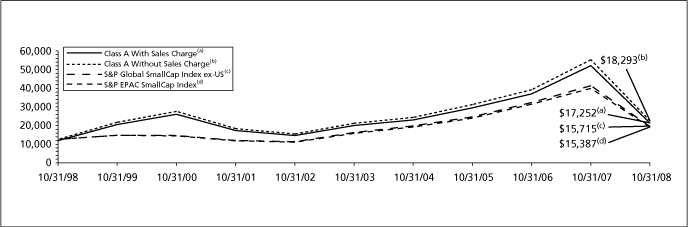
Performance: For the year ended October 31, 2008, the Fund’s Class A shares, excluding sales charges, provided a total return of (53.65)% compared to the Standard and Poor’s (“S&P”) Developed ex-US SmallCap Index(1), which returned (53.76)% for the same period.
Portfolio Specifics: Factor performance had a roller coaster year with no clear leadership trend emerging for the period.
Overall, valuation factors struggled in the last two months of 2007 and in the second quarter of 2008, hurting returns during these periods. Returns in valuation and quality factors drove performance in the first and third quarters of 2008, with factors like free cash flow to enterprise value, book to price and share buybacks benefiting performance. In October, despite all the turmoil and volatility, all three of our factor categories — value, quality and market recognition — worked well, making it the strongest month for the one year period for the strategy.
Security selection in the financials, consumer staples, consumer discretionary and health care sector benefited returns for the period. These gains were partially offset by selection in the materials sector.
Underweight positions in the health care and utilities sectors hurt returns during the period.
The top contributors during the period were underweight positions in Compagnie Generale des Etablissements Michelin, Deutsche Postbank AG and Adidas AG. The top detractors included overweight positions in were Aareal Bank AG, Pacific Brands Ltd., and Gerdau AmeriSteel Corp.
Current Strategy and Outlook: Our research builds a structured Fund of stocks with fundamental characteristics that we believe will translate into a performance advantage over the benchmark. Our analysis positions the Fund to capitalize on what we believe are high quality companies with superior business momentum, growing earnings and attractive valuations.
| |
| (1) | The S&P Developed ex-US SmallCap Index (formerly, the S&P/Citigroup Extended Market Index World ex-U.S.) is an unmanaged float-adjusted index which captures the smallest 15% of companies in the developed markets, based on the cumulative market capitalization of each country, excluding the United States, within the S&P Global Broad Market Index, which covers all publicly listed equities in 47 countries with a float adjusted market capitalization of US $100 million or greater and a minimum annual trading liquidity of US $50 million. |
Portfolio holdings and characteristics are subject to change and may not be representative of current holdings and characteristics. The outlook for this Fund may differ from that presented for other ING Funds. Performance for the different classes of shares will vary based on differences in fees associated with each class.
Top Ten Holdings*
as of October 31, 2008
(as a percent of net assets)
| | | | | | |
| Instituto Finanziario Industriale S.p.A. | | | 1.2 | | % |
| Rinnai Corp. | | | 1.2 | | % |
| Brit Insurance Holdings PLC | | | 1.2 | | % |
| WH Smith PLC | | | 1.2 | | % |
| Catlin Group Ltd. | | | 1.2 | | % |
| Fuji Soft, Inc. | | | 1.1 | | % |
| PSP Swiss Property AG | | | 1.1 | | % |
| Safran SA | | | 1.1 | | % |
| Deutsche Lufthansa AG | | | 1.1 | | % |
| Norddeutsche Affinerie AG | | | 1.0 | | % |
| | | |
| | * | Excludes short-term investments related to repurchase agreement. | |
Portfolio holdings are subject to change daily.
14
ING Disciplined International SmallCap Fund
Portfolio Managers’ Report
| | | | | | | | | |
| Average Annual Total Returns for the Periods Ended October 31, 2008 |
| | | | | Since Inception
|
| | | | | of Classes A, B, C and I
|
| | | 1 Year | | December 20, 2006 |
| |
Including Sales Charge: | | | | | | | | |
Class A(1) | | | (56.32 | )% | | | (28.98 | )% |
Class B(2) | | | (56.29 | )% | | | (28.78 | )% |
Class C(3) | | | (54.49 | )% | | | (27.24 | )% |
| Class I | | | (53.58 | )% | | | (26.49 | )% |
Excluding Sales Charge: | | | | | | | | |
| Class A | | | (53.65 | )% | | | (26.69 | )% |
| Class B | | | (54.04 | )% | | | (27.24 | )% |
| Class C | | | (54.04 | )% | | | (27.24 | )% |
| Class I | | | (53.58 | )% | | | (26.49 | )% |
S&P Developed ex-US SmallCap Index(4) | | | (53.76 | )% | | | (27.90 | )%(5) |
Based on a $10,000 initial investment, the graph and table above illustrate the total return of ING Disciplined International SmallCap Fund against the index indicated. The index is unmanaged and has no cash in its portfolio, imposes no sales charge and incurs no operating expenses. An investor cannot invest directly in the index. The Fund’s performance is shown both with and without the imposition of sales charges.
The graph and performance table do not reflect the deduction of taxes that a shareholder will pay on Fund distributions or the redemption of Fund shares.
The performance shown may include the effect of fee waivers and/or expense reimbursements by the Investment Adviser and/or other service providers, which have the effect of increasing total return. Had all fees and expenses been considered, the total returns would have been lower.
Performance data represents past performance and is no assurance of future results. Investment return and principal value of an investment in the Fund will fluctuate. Shares, when sold, may be worth more or less than their original cost. The Fund’s current performance may be lower or higher than the performance data shown. Please log on to www.ingfunds.com or call (800) 992-0180 to get performance through the most recent month end.
It is important to note that the Fund has a limited operating history. Performance over a longer period of time may be more meaningful than short-term performance.
Fund holdings are subject to change daily.
| |
| (1) | Reflects deduction of the maximum Class A sales charge of 5.75%. |
| (2) | Reflects deduction of the Class B deferred sales charge of 5% and 4%, respectively, for the 1 year and since inception returns. |
| (3) | Reflects deduction of the Class C deferred sales charge of 1% for the 1 year return. |
| (4) | The S&P Developed ex-US SmallCap Index (formerly, the S&P/Citigroup Extended Market Index ex-U.S.) is an unmanaged float-adjusted index which captures the smallest 15% of companies in the developed markets, based on the cumulative market capitalization of each country, excluding the United States, within the S&P Global Broad Market Index, which covers all publicly listed equities in 47 countries with a float adjusted market capitalization of US $100 million or greater and a minimum annual trading liquidity of US $50 million. |
| (5) | Since inception performance for the index is shown from January 1, 2007. |
15
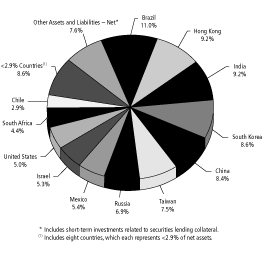
ING Emerging Countries Fund
Portfolio Managers’ Report
Country Allocation
as of October 31, 2008
(as a percent of net assets)
Portfolio holdings are subject to change daily.
ING Emerging Countries Fund (the “Fund”) seeks maximum long-term capital appreciation. The Fund is managed by Jan-Wim Derks, Michiel Bootsma and Roberto Lampl, Portfolio Managers of ING Investment Management Advisors, B.V. (“IIMA”) — the Sub-Adviser(1).
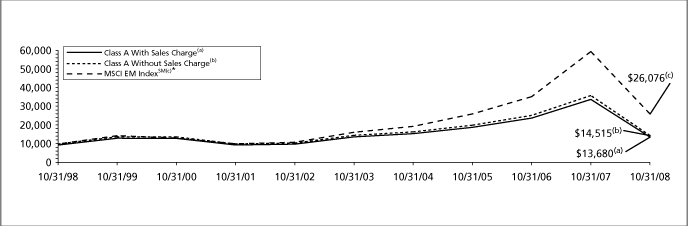
Performance: For the year ended October 31, 2008, the Fund’s Class A shares, excluding sales charges, provided a total return of (59.64)% compared to the Morgan Stanley Capital International Emerging Markets IndexSM(2) (“MSCI EM IndexSM”), which returned (56.35)% for the same period.
Portfolio Specifics: Brandes — For the period from November 1, 2007, through June 10, 2008, the Fund’s holdings in the specialty retail, textiles, apparel & luxury goods, and automobiles industries tended to weigh on performance. Holdings experiencing declines within these industries included JD Group (South Africa — specialty retail), Weiqiao Textile (China — textiles, apparel & luxury goods), and Hyundai Motor (South Korea — automobiles). In addition, holdings in the wireless telecommunication services, air freight & logistics, and electronic equipment, instruments & components industries registered declines. Select positions in the diversified telecommunication services industry advanced, including Brasil Telecom (Brazil) and Tele Norte Leste Participações (Brazil).
Declines for the Fund’s South Korea-, South Africa-, and China-based holdings proved the greatest detriment to overall results during the period. Detractors based in these countries included Dae Duck Electronics (South Korea — electronic equipment, instruments, & components), Imperial Holdings (South Africa — air freight & logistics), and Weiqiao Textile (China — textiles, apparel & luxury goods). Conversely, advances for Brazilian holdings helped performance, such as Eletrobras (electric utilities) and Marfrig Frigorificos (food products). Prior to June 10, 2008, the Fund’s most substantial weightings were in Brazil and South Korea, and in the diversified telecommunication services industry.
The Fund’s stock selection in and overweight allocation to the diversified telecommunication services industry helped relative results. The Fund also benefited from stock selection in the commercial banks and insurance industries. Weighing on relative performance was the Fund’s lack of exposure to the oil, gas & consumable fuels and metals & mining industries. The Fund’s stock selection in the specialty retail and textiles, apparel & luxury goods industries also negatively impacted performance relative to the benchmark. Keep in mind that the Fund’s weightings for industries are not the product of “top-down” forecasts or opinions, but merely stem from our company-by-company search for compelling investment opportunities.
IIMA — Since June, emerging equities have generally underperformed developed equities. Deteriorating global growth prospects, falling commodity prices and a strengthening dollar have pushed emerging markets down. In October, the downturn accelerated as more banks in the United States and Europe needed government support to strengthen their balance sheets. During the period from June 10 to October 31, 2008, the main reason for the Fund’s underperformance was security selection among the banks; food, beverage and tobacco; and energy companies. By country it was stock selection in Brazil, Mexico and Indonesia. In terms of country allocation the main detractor was an overweight in Russia. Stocks bringing much of the above together were Petrobras, Gazprom, Rosneft, Vale do Rio Doce, Empresas Icab, Bumi Resources and Sberbank.
The two most beneficial stock positions for the period were Indian telecom Bharti Airtel and Beijing Enterprise, the Chinese conglomerate, both of which were defensive choices.
The most important portfolio changes in the period were the reduction of Fund positions in Petrobras and Vale, the Brazilian oil and iron ore mining companies, which took the Fund’s position in Brazil to an underweight; the sale of the Fund’s position in Sberbank, the Russian bank; and the opening of a position in Shenhua Energy, a high-quality coal-based energy company with relatively high earnings visibility.
Current Strategy and Outlook: Emerging equities have generally underperformed developed equities, primarily as a result of global liquidity constraints and overall risk aversion, but later also because of the sharp decline in global trade growth. The poor outlook for growth in the developed world is forcing most emerging economies to adjust their projections for domestic demand growth. The recent currency corrections have speeded up this process.
With emerging markets again trading at a substantial discount to developed markets and with the main economic problems for the next years predominantly in the United States and Europe, we believe that once the dust settles in global markets emerging equities are likely to strongly outperform developed equities. For the next few years, we believe economic growth is likely to be negative in the developed world, while in emerging markets, growth should still be close to 4% on average. The recent correction has led to a substantial fall in valuations in emerging markets. With growth holding up reasonably well and with inflation likely to have peaked, we see value increasing in emerging equities.
| |
| (1) | Effective June 10, 2008, IIMA began sub-advising the Fund. Prior the June 10, 2008, the Fund was sub-advised by Brandes Investment Partners, L.P. |
| |
| (2) | The MSCI EM Indexsm is an unmanaged index that measures the performance of securities listed on exchanges in developing nations throughout the world. It includes the reinvestment of dividends and distributions net of withholding taxes, but does not reflect fees, brokerage commissions or other expenses of investing. |
Portfolio holdings and characteristics are subject to change and may not be representative of current holdings and characteristics. The outlook for this Fund may differ from that presented for other ING Funds. Performance for the different classes of shares will vary based on differences in fees associated with each class.
Top Ten Holdings*
as of October 31, 2008
(as a percent of net assets)
| | | | | |
| Teva Pharmaceutical Industries Ltd. ADR | | | 4.4 | % |
| China Mobile Ltd. | | | 4.1 | % |
| Taiwan Semiconductor Manufacturing Co., Ltd. | | | 3.9 | % |
| Samsung Electronics Co., Ltd. | | | 3.9 | % |
| iShares MSCI Taiwan Index Fund | | | 3.7 | % |
| OAO Gazprom ADR | | | 2.8 | % |
| Bharti Airtel Ltd. | | | 2.7 | % |
| iShares FTSE/Xinhua China 25 Index Fund | | | 2.6 | % |
| OAO Rosneft Oil Co. GDR | | | 2.2 | % |
| Housing Development Finance Corp. | | | 2.2 | % |
| | | |
| | * | Excludes short-term investments related to securities lending collateral. | |
Portfolio holdings are subject to change daily.
16
ING Emerging Countries Fund
Portfolio Managers’ Report
| | | | | | | | | | | | | | | | | | | | | |
| Average Annual Total Returns For The Periods Ended October 31, 2008 |
| | | | | | | | | Since Inception
| | Since Inception
|
| | | | | | | | | of Class I
| | of Class W
|
| | | 1 Year | | 5 Year | | 10 Year | | December 21, 2005 | | February 12, 2008 |
| |
Including Sales Charge: | | | | | | | | | | | | | | | | | | | | |
Class A(1) | | | (61.96 | )% | | | (1.36 | )% | | | 3.18 | % | | | — | | | | — | |
Class B(2) | | | (61.88 | )% | | | (1.29 | )% | | | 3.13 | % | | | — | | | | — | |
Class C(3) | | | (60.31 | )% | | | (0.92 | )% | | | 2.99 | % | | | — | | | | — | |
| Class I | | | (59.48 | )% | | | — | | | | — | | | | (12.96 | )% | | | | |
| Class Q | | | (59.53 | )% | | | (0.04 | )% | | | 3.95 | % | | | — | | | | — | |
| Class W | | | — | | | | — | | | | — | | | | — | | | | (53.42 | )% |
Excluding Sales Charge: | | | | | | | | | | | | | | | | | | | | |
| Class A | | | (59.64 | )% | | | (0.18 | )% | | | 3.79 | % | | | — | | | | — | |
| Class B | | | (59.94 | )% | | | (0.91 | )% | | | 3.13 | % | | | — | | | | — | |
| Class C | | | (59.92 | )% | | | (0.92 | )% | | | 2.99 | % | | | — | | | | — | |
| Class I | | | (59.48 | )% | | | — | | | | — | | | | (12.96 | )% | | | | |
| Class Q | | | (59.53 | )% | | | (0.04 | )% | | | 3.95 | % | | | — | | | | — | |
| Class W | | | — | | | | — | | | | — | | | | — | | | | (53.42 | )% |
MSCI EM IndexSM(4) | | | (56.35 | )% | | | 9.51 | %(5) | | | 10.05 | % | | | (5.09 | )%(6) | | | (46.51 | )%(7) |
Based on a $10,000 initial investment, the graph and table above illustrate the total return of ING Emerging Countries Fund against the index indicated. The index is unmanaged and has no cash in its portfolio, imposes no sales charge and incurs no operating expenses. An investor cannot invest directly in the index. The Fund’s performance is shown both with and without the imposition of sales charges.
The graph and performance table do not reflect the deduction of taxes that a shareholder will pay on Fund distributions or the redemption of Fund shares.
The performance shown may include the effect of fee waivers and/or expense reimbursements by the Investment Adviser and/or other service providers, which have the effect of increasing total return. Had all fees and expenses been considered, the total returns would have been lower.
Performance data represents past performance and is no assurance of future results. Investment return and principal value of an investment in the Fund will fluctuate. Shares, when sold, may be worth more or less than their original cost. The Fund’s current performance may be lower or higher than the performance data shown. Please log on to www.ingfunds.com or call (800) 992-0180 to get performance through the most recent month end.
This report contains statements that may be “forward-looking” statements. Actual results may differ materially from those projected in the “forward-looking” statements.
The views expressed in this report reflect those of the portfolio managers, only through the end of the period as stated on the cover. The portfolio managers’ views are subject to change at any time based on market and other conditions.
Fund holdings are subject to change daily.
| |
| * | Prior to October 31, 2001, the MSCI EM IndexSM did not include the deduction of withholding taxes. |
| (1) | Reflects deduction of the maximum Class A sales charge of 5.75%. |
| (2) | Reflects deduction of the Class B deferred sales charge of 5% and 2%, respectively, for the 1 year and 5 year returns. |
| (3) | Reflects deduction of the Class C deferred sales charge of 1% for the 1 year return. |
| (4) | The MSCI EM IndexSM is an unmanaged index that measures the performance of securities listed on exchanges in developing nations throughout the world. It includes the reinvestment of dividends and distributions net of withholding taxes, but does not reflect fees, brokerage commissions or other expenses of investing. |
| (5) | Net return for index is shown from November 1, 2002. |
| (6) | Since inception performance for index is shown from January 1, 2006. |
| (7) | Since inception performance for index is shown from February 1, 2008. |
Prior to March 1, 2005, the Fund was advised by a different sub-adviser.
17
ING European Real Estate Fund
Portfolio Managers’ Report
Country Allocation
as of October 31, 2008
(as a percent of net assets)
Portfolio holdings are subject to change daily.
ING European Real Estate Fund (the “Fund”) seeks to provide investors with high total return, consisting of capital appreciation and current income. The Fund is managed by T. Ritson Ferguson, Chief Investment Officer, CFA and Steven D. Burton, Managing Director, CFA of ING Clarion Real Estate Securities L.P. — the Sub-Adviser.
Performance: Since inception on November 1, 2007 through October 31, 2008, the Fund’s Class A shares, excluding sales charges, provided a total return of (45.92)% compared to the Standard & Poor’s Europe Property Index(1) (“S&P Europe Property Index”) which returned (56.24)% for the same period.
Portfolio Specifics: The past twelve months proved to be a very difficult period for the world’s listed real estate markets as tightening credit market conditions and a slowing global economy have provided significant headwinds to the world’s capital markets. From a relative standpoint, European property companies have fared better than Asia-Pacific property companies but have lagged North American property companies — though it should be noted that all regions experienced a significant sell-off over the past twelve months. Within the European region, the return differential between countries was quite substantial, ranging from a (16.9)% return posted by Switzerland, the best-performing market during the period, to a (87.1)% return posted by Norway, the poorest-performing market during the period. On whole, the countries which fared the best in the current environment in addition to Switzerland were the countries in the Benelux region and France. The countries which fared the worst were in the Southern, Central Eastern and Scandinavian regions.
The Fund outperformed the benchmark for the period by more than 1000 basis points (or 10%) as the result of superior stock selection and country allocation decisions. Stock selection was especially strong in France, where overweights to pan-European mall company Unibail-Rodamco (the Fund’s largest single position), shopping center company Mercialys and office company Silic drove the majority of outperformance. Stock selection was also strong in the U.K and Germany during the period.
Country allocation decisions added value through overweights to outperforming property markets in France, the Netherlands and Switzerland, along with underweights to underperforming property markets in Austria, Germany and Spain.
Current Strategy and Outlook: The Fund continues to maintain a defensive positioning, with a bias toward high-quality companies. We remain overweight sectors and geographies offering long-term leases and high percentages of earnings from recurring sources (primarily contract lease rental income). We prefer companies offering more transparency, strong balance sheets and good, experienced management teams. This focus on quality has driven our outperformance in the trying times of the past year. Conversely, we are avoiding companies dependent on acquisitions and/or development activities for earnings growth.
This bear market has already reached levels and duration comparable to past severe market declines. The extreme volatility in the market is, in our opinion, an indicator that the normal fundamental underpinnings of the market’s price discovery mechanism have broken down. In our view, with past bear markets as a gauge, it seems we may be nearing the end of this correction.
European property companies remain attractively valued. We estimate that U.K. property companies now trade at an approximate 5% discount to our internal estimate of inherent private real estate market value. On the continent, we estimate this discount to be approximately 21%. In our opinion, the market continues to price in a highly pessimistic scenario in terms of a global economic slowdown.
We believe the investment rationale for a European listed property strategy remains very much intact including diversification via low correlation to broad equities and bonds, attractive current yield, attractive valuations and the gradual spread of the real estate investment trust (“REIT”) structure to an increased number of countries. This remains true even under the scenario of slowing global economic growth over the coming year.
| |
| (1) | The S&P Europe Property Index is an unmanaged float-adjusted index which defines and measures the investable universe of publicly traded property companies domiciled in developed European countries, that derive more than half of their revenue from property-related activities, such as property ownership, management, development, rental and investment. |
Portfolio holdings and characteristics are subject to change and may not be representative of current holdings and characteristics. The outlook for this Fund may differ from that presented for other ING Funds. Performance for the different classes of shares will vary based on differences in fees associated with each class.
Top Ten Holdings*
as of October 31, 2008
(as a percent of net assets)
| | | | | |
| Unibail | | | 19.9 | % |
| Land Securities Group PLC | | | 13.9 | % |
| British Land Co. PLC | | | 6.5 | % |
| Hammerson PLC | | | 4.7 | % |
| Corio NV | | | 4.6 | % |
| Wereldhave NV | | | 4.5 | % |
| Societe Immobiliere de Location pour l’Industrie et le Commerce | | | 3.5 | % |
| Mercialys | | | 3.2 | % |
| Eurocommercial Properties NV | | | 3.1 | % |
| Deutsche Euroshop AG | | | 2.9 | % |
| | | |
| | * | Excludes short-term investments related to ING Institutional Prime Money Market Fund. | |
Portfolio holdings are subject to change daily.
18
ING European Real Estate Fund
Portfolio Managers’ Report
| | | | | |
| Cumulative Total Returns for the Period Ended October 31, 2008 |
| | | Since Inception
|
| | | of Classes A, B, C and I
|
| | | November 1, 2007 |
| |
Including Sales Charge: | | | | |
Class A(1) | | | (49.03) | % |
Class B(2) | | | (49.00) | % |
Class C(3) | | | (47.10) | % |
| Class I | | | (45.77) | % |
Excluding Sales Charge: | | | | |
| Class A | | | (45.92) | % |
| Class B | | | (46.34) | % |
| Class C | | | (46.57) | % |
| Class I | | | (45.77) | % |
S&P Europe Property Index(4) | | | (56.24) | % |
Based on a $10,000 initial investment, the table and graph above illustrate the total return of ING European Real Estate Fund against the index indicated. The index is unmanaged and has no cash in its portfolio, imposes no sales charge and incurs no operating expenses. An investor cannot invest directly in the index. The Fund’s performance is shown both with and without the imposition of sales charges.
The graph and performance table do not reflect the deduction of taxes that a shareholder will pay on Fund distributions or the redemption of Fund Shares.
The performance shown may include the effect of the waivers and/or expense reimbursements by the Investment Adviser and/or other service providers, which have the effect of increasing total return. Had all fees and expenses been considered, the total returns would have been lower.
Performance data represents past performance and is no assurance of future results. Investment return and principal value of an investment in the Fund will fluctuate. Shares, when sold, may be worth more or less than their original cost. The Fund’s current performance may be lower or higher than the performance data shown. Please log on to www.ingfunds.com or call (800) 992-0180 to get performance through the most recent month end.
It is important to note that the Fund has a limited operating history. Performance over a longer period of time may be more meaningful than short-term performance.
This report contains statements that may be “forward-looking” statements. Actual results may differ materially from those projected in the “forward-looking” statements.
The views expressed in this report reflect those of the portfolio managers, only through the end of the period as stated on the cover. The portfolio managers’ views are subject to change at any time based on market and other conditions.
Fund holdings are subject to change daily.
| |
| (1) | Reflects deduction of the maximum Class A sales charge of 5.75%. |
| (2) | Reflects deduction of the Class B deferred sales charge of 5% for the since inception return. |
| (3) | Reflects deduction of the Class C deferred sales charge of 1% for the since inception return. |
| (4) | The S&P Europe Property Index is an unmanaged float-adjusted index which defines and measures the investable universe of publicly traded property companies domiciled in developed European countries, that derive more than half of their revenue from property-related activities, such as property ownership, management, development, rental and investment. |
19
ING Foreign Fund
Portfolio Managers’ Report
Country Allocation
as of October 31, 2008
(as a percent of net assets)
Portfolio holdings are subject to change daily.
ING Foreign Fund (the “Fund”) seeks long-term growth of capital. The Fund is managed by Rudolph-Riad Younes, CFA Managing Director and Head of International Equity and Richard Pell, Chief Investment and Chief Executive Officer, both of Artio Global Management LLC — the Sub-Adviser.
Performance: For the year ended October 31, 2008, the Fund’s Class A shares, excluding sales charges, provided a total return of (47.01)% compared to the Morgan Stanley Capital International All Country World (ex-US) Indexsm(1) (“MSCI ACWI (ex-US)”), which returned (48.53)% for the same period.
Portfolio Specifics: During the period, the Fund outperformed its benchmark, although absolute returns for both the Fund and markets were heavily impacted by one of the worst global financial crises on record. Our decision to hold cash was rewarded amid what seemed to be free-falling equity markets. From a sector perspective, materials had the largest positive contribution to relative returns. Early in the period, Potash Corp. of Saskatchewan (Canada) and Yara International ASA (Norway) experienced a rapid rise in their share prices as the demand for crop nutrients rose. During the last few months of the fiscal year, we began to reduce our exposure to these companies which proved beneficial. We also reduced exposure to metals and mining companies, including positions in Russia which we originally purchased based on their inexpensive valuations. Moving into July 2008 (prior to the Russian/Georgian conflict), we moved to reduce our weighting to Russia. The Japanese market suffered declines less than that of other developed markets and our decision to underweight equities there had a negative impact on results. However, our decision to maintain additional exposure to the Japanese yen more than made up for this as the yen rallied.
Emerging market exposure hurt, particularly financials. Holdings in State Bank of India Ltd. and Suzlon Energy Ltd. (India) underperformed. Additionally, OTP Bank Nyrt (Hungary) and Bank Polska Kasa Opieki and Powszechna Kasa Oszczednosci Bank Polski SA (Poland) detracted. The global financial and economic turmoil that has impacted the Central and Eastern European economies will, in the short to medium term, slow growth from the overheated pace of the last few years. The region must be alert to likely developments in currency markets as foreign currency-denominated loans recently became popular in the region as well as the potential deterioration in loan quality should we move into a deeper cyclical slowdown. The global turmoil may actually move the new European Union member countries to re-focus on reforms and strive for adoption of the euro as soon as possible.
Other significant detractors were our exposure to utilities and industrials. Finally, our decision to hedge a portion of our European holdings (both in developed and emerging markets) back to the US dollar helped as the euro and many emerging market currencies declined over the period.
Current Strategy and Outlook: We are currently underweight emerging markets based on our belief that over the short to intermediate term, they will underperform developed markets. We continue to hold select emerging market companies largely in Central and Eastern Europe. We believe Western Europe offers very attractive valuation levels, however we remain underweight developed market financials. In general, we prefer larger-capitalization companies with low leverage and low commodity exposure and those which are likely beneficiaries of a stronger US dollar. We are also finding opportunities within the health care and consumer staples sectors.
| |
| (1) | The MSCI ACWI (ex-US) is a free float-adjusted market capitalization index that is designed to measure equity market performance in the global developed and emerging markets, excluding the US. It includes the reinvestment of dividends net of withholding taxes, but does not reflect fees, brokerage commissions or other expenses of investing. |
Portfolio holdings and characteristics are subject to change and may not be representative of current holdings and characteristics. The outlook for this Fund may differ from that presented for other ING Funds. Performance for the different classes of shares will vary based on differences in fees associated with each class.
Top Ten Holdings*
as of October 31, 2008
(as a percent of net assets)
| | | | | |
| Lyxor ETF DJ Stoxx 600 Banks | | | 4.9 | % |
| Total SA | | | 3.8 | % |
| Nestle SA | | | 2.9 | % |
| Sanofi-Aventis | | | 2.6 | % |
| Komercni Banka A/S | | | 2.5 | % |
| E.ON AG | | | 2.4 | % |
| Unilever NV | | | 2.3 | % |
| Tracker Fund of Hong Kong | | | 2.2 | % |
| Roche Holding AG | | | 2.1 | % |
| Novartis AG | | | 2.1 | % |
| | | |
| | * | Excludes short-term investments related to ING Institutional Prime Money Market Fund and securities lending collateral. | |
Portfolio holdings are subject to change daily.
20
ING Foreign Fund
Portfolio Managers’ Report
| | | | | | | | | | | | | | | | | | | | | | | | | | | | | | | | | |
| Average Annual Total Returns for the Periods Ended October 31, 2008 |
| | | | | | | Since Inception
| | Since Inception
| | Since Inception
| | Since Inception
| | Since Inception
| | Since Inception
|
| | | | | | | of Class A
| | of Class B
| | of Class C
| | of Class I
| | of Class Q
| | of Class W
|
| | | 1 Year | | 5 Year | | July 1, 2003 | | July 8, 2003 | | July 7, 2003 | | September 8, 2003 | | July 10, 2003 | | February 12, 2008 |
| |
Including Sales Charge: | | | | | | | | | | | | | | | | | | | | | | | | | | | | | | | | |
Class A(1) | | | (50.07 | )% | | | 2.82 | % | | | 4.51 | % | | | — | | | | — | | | | — | | | | — | | | | — | |
Class B(2) | | | (49.87 | )% | | | 2.91 | % | | | — | | | | 4.19 | % | | | — | | | | — | | | | — | | | | — | |
Class C(3) | | | (47.89 | )% | | | 3.26 | % | | | — | | | | — | | | | 4.41 | % | | | — | | | | — | | | | — | |
| Class I | | | (46.82 | )% | | | 4.36 | % | | | — | | | | — | | | | — | | | | 5.02 | % | | | — | | | | — | |
| Class Q | | | (47.00 | )% | | | 4.09 | % | | | | | | | — | | | | — | | | | — | | | | 5.47 | % | | | — | |
| Class W | | | — | | | | — | | | | — | | | | — | | | | — | | | | — | | | | — | | | | (37.94) | % |
Excluding Sales Charge: | | | | | | | | | | | | | | | | | | | | | | | | | | | | | | | | |
| Class A | | | (47.01 | )% | | | 4.04 | % | | | 5.67 | % | | | — | | | | — | | | | — | | | | — | | | | — | |
| Class B | | | (47.42 | )% | | | 3.26 | % | | | — | | | | 4.35 | % | | | — | | | | — | | | | — | | | | — | |
| Class C | | | (47.40 | )% | | | 3.26 | % | | | — | | | | — | | | | 4.41 | % | | | — | | | | — | | | | — | |
| Class I | | | (46.82 | )% | | | 4.36 | % | | | — | | | | — | | | | — | | | | 5.02 | % | | | — | | | | — | |
| Class Q | | | (47.00 | )% | | | 4.09 | % | | | | | | | — | | | | — | | | | — | | | | 5.47 | % | | | — | |
| Class W | | | — | | | | — | | | | — | | | | — | | | | — | | | | — | | | | — | | | | (37.94) | % |
MSCI ACWI (ex-US)(4) | | | (48.53 | )% | | | 4.61 | % | | | 7.20 | % | | | 7.20 | %(5) | | | 7.20 | %(5) | | | 6.30 | %(6) | | | 7.20 | %(5) | | | (39.43) | %(7) |
Based on a $10,000 initial investment, the graph and table above illustrate the total return of ING Foreign Fund against the index indicated. The index is unmanaged and has no cash in its portfolio, imposes no sales charge and incurs no operating expenses. An investor cannot invest directly in an index. The Fund’s performance is shown both with and without imposition of sales charges.
The graph and performance table do not reflect the deduction of taxes that a shareholder will pay on Fund distributions or the redemption of Fund shares.
The performance shown may include the effect of fee waivers and/or expense reimbursements by the Investment Adviser and/or other service providers, which have the effect of increasing total return. Had all fees and expenses been considered, the total returns would have been lower.
Performance data represents past performance and is no assurance of future results. Investment return and principal value of an investment in the Fund will fluctuate. Shares, when sold, may be worth more or less than their original cost. The Fund’s current performance may be lower or higher than the performance data shown. Please log on to www.ingfunds.com or call (800) 992-0180 to get performance through the most recent month end.
It is important to note that the Fund has a limited operating history. Performance over a longer period of time may be more meaningful than short-term performance.
This report contains statements that may be “forward-looking” statements. Actual results may differ materially from those projected in the “forward-looking” statements.
The views expressed in this report reflect those of the portfolio managers, only through the end of the period as stated on the cover. The portfolio managers’ views are subject to change at any time based on market and other conditions.
Fund holdings are subject to change daily.
| |
| (1) | Reflects deduction of the maximum Class A sales charge of 5.75%. |
| (2) | Reflects deduction of the Class B deferred sales charge of 5% and 2%, respectively, for the 1 year and since inception returns. |
| (3) | Reflects deduction of the Class C deferred sales charge of 1% for the 1 year return. |
| (4) | The MSCI ACWI (ex-US) is a free float-adjusted market capitalization index that is designed to measure equity market performance in the global developed and emerging markets, excluding the U.S. It includes the reinvestment of dividends and distributions net of withholding taxes, but does not reflect fees, brokerage commissions or other expenses of investing. |
| (5) | Since inception performance for the index is shown from July 1, 2003. |
| (6) | Since inception performance for the index is shown from September 1, 2003. |
| (7) | Since inception performance for the index is shown from February 1, 2008. |
21
ING Greater China Fund
Portfolio Managers’ Report
Country Allocation
as of October 31, 2008
(as a percent of net assets)
Portfolio holdings are subject to change daily.
ING Greater China Fund (the “Fund”) seeks long-term capital appreciation. The Fund is managed by Nick Toovey, CFA, Bratin Sanyal, Oscar Leung Kin Fai, CFA and Michael Hon Lung Chiu, CFA of ING Investment Management Asia/Pacific (Hong Kong) Limited — the Sub-Adviser.
Performance: For the year ended October 31, 2008, the Fund’s Class A shares, excluding sales charges, provided a total return of (57.63)% compared to the Morgan Stanley Capital International (“MSCI”) All Countries Golden Dragon Index(1), which returned (58.18)% for the same period.
Portfolio Specifics: The global markets faced significant pressure and China as an emerging market was not immune. Despite these headwinds, China continued to report decent economic growth. Inflation concerns diminished thanks to lower food prices. To boost demand, the People’s Bank of China cut interest rates and commercial bank reserve requirements. To safeguard the economy from a significant slowdown, the government announced fiscal measures such as tax cuts, higher infrastructure spending and property market stimulus.
In Hong Kong, the slowdown in the United States and China hurt the domestic economy, with property prices falling despite lower interest rates. In Taiwan, the market went up until April as the market welcomed a new, more China-friendly president. However, the performance of Taiwan was wiped out in the latter part of the year as the strong global headwinds adversely affected its financial and technology industries.
The Fund’s position in defensive sectors, such as telecom stocks in Taiwan and utility stocks in Hong Kong, added to results for the period. In late 2007 and early 2008, we overweighted Taiwan based on its political change but underweighted China due to the government’s credit tightening measures. Then we turned cautious on the economic situation as a whole so we overweighted Hong Kong but underweighted both China and Taiwan. After a sharp correction for China stocks, we began to increase the weighting to China in the expectation of further government economic stimulus and aggressive interest rate cuts.
In Taiwan, Chunghwa Telecom Co., Ltd. helped results due to its high dividend yield and stable business. In Hong Kong, CLP Holdings, Ltd. and HongKong Electric Holdings contributed to results. Overweights in China Shipping Development Co., Ltd. and China Overseas Land & Investment Ltd. outperformed other China financial and property stocks and added to results.
The Fund’s underweight position in consumer staples hurt performance. Stock selection in the information technology sector was unfavorable. An overweight position in mid-cap technology stocks underperformed the market. In terms of country allocation, Hong Kong added most of the value while Taiwan detracted. Stock selection among banks, however, added value.
Fund holdings in China Southern Airlines Co., Ltd. and Guangzhou R&F Properties Co., Ltd. detracted the most from performance. Investors were selling highly leveraged companies on concerns about the risks of refinancing. Rising steel prices in China hurt the performance of Dongfang Electrical Machinery Co., Ltd. The Fund’s overweight position in AU Optronics Corp. suffered from declining demand for LCD products. Underweights in Taiwan Semiconductor Manufacturing Co., Ltd. and Tencent Holdings Ltd. also hurt the Fund as those companies performed strongly compared to other technology stocks.
Current Strategy and Outlook: In the past two months, China has reacted aggressively to the slowdown in the domestic market with monetary and fiscal measures. The People’s Bank of China has cut interest rates twice in October, three times in the last two months, to help lower borrowing costs. The central bank has also taken measures such as reducing the reserve requirement of commercial banks, and has lifted the system loan growth quota to stimulate new loan growth. On the fiscal side, the government has sped up infrastructure spending to boost domestic demand.
Admittedly, 2009 will be a challenging year for China as it confronts a global recession and a domestic slowdown at the same time. On the other hand, after a major correction, valuations of many Chinese stocks have come down to levels we believe are attractive. We have increased the Fund’s China exposure to an overweight to capture what we feel is better potential in the near term. We believe the longer term outlook for Taiwan is positive, however, without major new catalysts in the near future we remained cautious and look for better opportunities elsewhere.
| |
| (1) | The MSCI All Countries Golden Dragon Index is a broad-based, unmanaged index of common stocks traded in China, Hong Kong and Taiwan. It is an aggregate of the MSCI Hong Kong Index, the MSCI China Free Index and the MSCI Taiwan Index. |
Portfolio holdings and characteristics are subject to change and may not be representative of current holdings and characteristics. The outlook for this Fund may differ from that presented for other ING Funds. Performance for the different classes of shares will vary based on differences in fees associated with each class.
Top Ten Holdings
as of October 31, 2008
(as a percent of net assets)
| | | | | |
| China Mobile Ltd. | | | 10.0 | % |
| China Life Insurance Co., Ltd. | | | 4.8 | % |
| Chunghwa Telecom Co., Ltd. | | | 4.4 | % |
| AU Optronics Corp. | | | 3.8 | % |
| Taiwan Semiconductor Manufacturing Co., Ltd. | | | 3.7 | % |
| Hong Kong Exchanges and Clearing Ltd. | | | 3.6 | % |
| Hutchison Whampoa Ltd. | | | 3.6 | % |
| China Overseas Land & Investment Ltd. | | | 3.6 | % |
| Industrial and Commercial Bank of China Ltd. | | | 3.5 | % |
| CNOOC Ltd. | | | 3.4 | % |
Portfolio holdings are subject to change daily.
22
ING Greater China Fund
Portfolio Managers’ Report
| | | | | | | | | | | | | | | | | | | | | | | | | |
| Average Annual Total Returns for the Periods Ended October 31, 2008 |
| | | | | Since Inception
| | Since Inception
| | Since Inception
| | Since Inception
| | Since Inception
|
| | | | | of Class A
| | of Class B
| | of Class C
| | of Class I
| | of Class O
|
| | | 1 Year | | December 21, 2005 | | January 6, 2006 | | January 11, 2006 | | May 8, 2006 | | June 4, 2008 |
| |
Including Sales Charge: | | | | | | | | | | | | | | | | | | | | | | | | |
Class A(1) | | | (60.06 | )% | | | (0.71 | )% | | | — | | | | — | | | | — | | | | — | |
Class B(2) | | | (59.83 | )% | | | — | | | | (2.37 | )% | | | — | | | | — | | | | — | |
Class C(3) | | | (58.32 | )% | | | — | | | | — | | | | (1.66 | )% | | | — | | | | — | |
| Class I | | | (57.42 | )% | | | — | | | | — | | | | — | | | | (7.86 | )% | | | — | |
| Class O | | | — | | | | — | | | | — | | | | — | | | | — | | | | (44.98 | )% |
Excluding Sales Charge: | | | | | | | | | | | | | | | | | | | | | | | | |
| Class A | | | (57.63 | )% | | | 1.36 | % | | | — | | | | — | | | | — | | | | — | |
| Class B | | | (57.95 | )% | | | — | | | | (1.43 | )% | | | — | | | | — | | | | — | |
| Class C | | | (57.94 | )% | | | — | | | | — | | | | (1.66 | )% | | | — | | | | — | |
| Class I | | | (57.42 | )% | | | — | | | | — | | | | — | | | | (7.86 | )% | | | — | |
| Class O | | | — | | | | — | | | | — | | | | — | | | | — | | | | (44.98 | )% |
MSCI All Countries Golden Dragon Index(4) | | | (58.18 | )% | | | (5.86 | )%(5) | | | (5.86 | )%(5) | | | (5.86 | )%(5) | | | (12.02 | )%(6) | | | (48.56 | )%(7) |
Based on a $10,000 initial investment, the graph and table above illustrate the total return of ING Greater China Fund against the index indicated. The index is unmanaged and has no cash in its portfolio, imposes no sales charge and incurs no operating expenses. An investor cannot invest directly in the index. The Fund’s performance is shown both with and without the imposition of sales charges.
The graph and performance table do not reflect the deduction of taxes that a shareholder will pay on Fund distributions or the redemption of Fund shares.
The performance shown may include the effect of fee waivers and/or expense reimbursements by the Investment Adviser and/or other service providers, which have the effect of increasing total return. Had all fees and expenses been considered, the total returns would have been lower.
Performance data represents past performance and is no assurance of future results. Investment return and principal value of an investment in the Fund will fluctuate. Shares, when sold, may be worth more or less than their original cost. The Fund’s current performance may be lower or higher than the performance data shown. Please log on to www.ingfunds.com or call (800) 992-0180 to get performance through the most recent month end.
It is important to note that the Fund has a limited operating history. Performance over a longer period of time may be more meaningful than short-term performance.
This report contains statements that may be “forward-looking” statements. Actual results may differ materially from those projected in the “forward-looking” statements.
The views expressed in this report reflect those of the portfolio managers, only through the end of the period as stated on the cover. The portfolio managers’ views are subject to change at any time based on market and other conditions.
Fund holdings are subject to change daily.
| |
| (1) | Reflects deduction of the maximum Class A sales charge of 5.75%. |
| (2) | Reflects deduction of the Class B deferred sales charge of 5% and 3%, respectively, for the 1 year and since inception returns. |
| (3) | Reflects deduction of the Class C deferred sales charge of 1% for the 1 year return. |
| (4) | The MSCI All Countries Golden Dragon Index is a broad-based, unmanaged index of common stocks traded in China, Hong Kong and Taiwan. It is an aggregate of the MSCI Hong Kong Index, the MSCI China Free Index and the MSCI Taiwan Index. |
| (5) | Since inception performance for the index is shown from January 1, 2006. |
| (6) | Since inception performance for the index is shown from May 1, 2006. |
| (7) | Since inception performance for the index is shown from June 1, 2008. |
23
ING Index Plus International Equity Fund
Portfolio Managers’ Report
Country Allocation
as of October 31, 2008
(as a percent of net assets)
Portfolio holdings are subject to change daily.
ING Index Plus International Equity Fund (the “Fund”) seeks to outperform the total return performance of the Morgan Stanley Capital International — Europe, Australasia and Far East® Index(1) (“MSCI EAFE® Index”) while maintaining a market level of risk. The Fund is managed by Carl Ghielen, Portfolio Manager and Martin Jansen, Portfolio Manager, both of ING Investment Management Advisors B.V. — the Sub Adviser.
Performance: For the year ended October 31, 2008, the Fund’s Class A shares, excluding sales charges, provided a total return of (48.51)% compared to the MSCI EAFE® Index, which returned (46.62)% for the same period.
Portfolio Specifics: The Fund’s strategy is designed to add value to the MSCI EAFE® benchmark through bottom-up security selection on the basis of customized sector models, while maintaining approximate benchmark weights of regions/countries, sectors and industries represented in the benchmark. The active risk is substantially controlled by the relatively large number of securities in the portfolio (between 280 and 380). As a first step, the best ranked 200 stocks are selected for inclusion across countries, sectors and industries. To ensure that appropriate index weights and an index-like profile are maintained, 80-180 of the next most attractive securities are added. The Fund is rebalanced monthly to maintain the desired tilt to stocks ranking well in the individual sectors and industries represented in the benchmark.
The predictive power of the quantitative models in exceptionally volatile and turbulent markets proved problematic. The Fund’s return underperformed that of the benchmark for the Fund for the year ended October 31, 2008 due to adverse stock selection in all the regional components of the MSCI EAFE®Index. Modest value and small capitalization tilts constituted a headwind in the first half of the reporting year, but abated thereafter when markets sold off broadly. By design the Fund’s sector and region weights approximate those of the benchmark; while this normally does not add value, the wide inter-sector dispersion in a turbulent year resulted in a modest contribution from sector positioning.
The predictive power of the individual factors included in each of the international sector models for a particular reporting period substantially determines the stock selection result in each sector. For this reporting period, our positioning in consumer discretionary had the largest negative impact, especially in Europe. In both Europe and Japan the valuation factors in our sector regional models for financials and industrials proved ineffective. In contrast, cashflow and valuation factors added value in the healthcare sector, and modestly so in energy.
Current Strategy and Outlook: By design, the Fund maintains approximate benchmark weights of the regions, economic sectors and industries constituting the MSCI EAFE® Index. Stock selection flows from the sector/industry ranking models. We seek to maintain portfolio characteristics of the Fund within an acceptable band around the benchmark. Our most attractively ranked stocks may have individual overweights of up to 50 basis points (or 0.50%), while for risk control purposes the maximum allowable underweight per security is 50 basis points.
Within this context, the Fund currently has a modest tilt towards lower valuation and smaller capitalization stocks and has a resultant modest focus on stocks linked primarily to local economies.
| |
| (1) | The MSCI EAFE® Index is an unmanaged index that measures the performance of securities listed on exchanges in Europe, Australasia and the Far East. It includes the reinvestment of dividends net of withholding taxes, but does not reflect fees, brokerage commissions or other expenses of investing. |
Portfolio holdings and characteristics are subject to change and may not be representative of current holdings and characteristics. The outlook for this Fund may differ from that presented for other ING Funds. Performance for the different classes of shares will vary based on differences in fees associated with each class.
Top Ten Holdings
as of October 31, 2008
(as a percent of net assets)
| | | | | |
| Novartis AG | | | 2.0 | % |
| Total SA | | | 1.9 | % |
| Roche Holding AG | | | 1.8 | % |
| BP PLC | | | 1.7 | % |
| Nestle SA | | | 1.7 | % |
| Telefonica SA | | | 1.4 | % |
| HSBC Holdings PLC | | | 1.4 | % |
| Royal Dutch Shell PLC – Class B | | | 1.4 | % |
| AstraZeneca PLC | | | 1.3 | % |
| Nokia OYJ | | | 1.2 | % |
Portfolio holdings are subject to change daily.
24
ING Index Plus International Equity Fund
Portfolio Managers’ Report
| | | | | | | | | | | | | | | | | |
| Average Annual Total Returns for the Periods Ended October 31, 2008 |
| | | | | Since Inception
| | Since Inception
| | Since Inception
|
| | | | | of Classes A and I
| | of Classes B and C
| | of Class O
|
| | | 1 Year | | December 21, 2005 | | January 12, 2006 | | November 9, 2007 |
| |
Including Sales Charge: | | | | | | | | | | | | | | | | |
Class A(1) | | | (51.47 | )% | | | (11.84 | )% | | | — | | | | — | |
Class B(2) | | | (51.14 | )% | | | — | | | | (12.76 | )% | | | | |
Class C(3) | | | (49.37 | )% | | | — | | | | (12.02 | )% | | | | |
| Class I | | | (48.12 | )% | | | (9.41 | )% | | | — | | | | — | |
| Class O | | | — | | | | — | | | | — | | | | (45.16 | )% |
Excluding Sales Charge: | | | | | | | | | | | | | | | | |
| Class A | | | (48.51 | )% | | | (10.00 | )% | | | — | | | | — | |
| Class B | | | (48.88 | )% | | | — | | | | (11.94 | )% | | | | |
| Class C | | | (48.91 | )% | | | — | | | | (12.02 | )% | | | | |
| Class I | | | (48.12 | )% | | | (9.41 | )% | | | — | | | | — | |
| Class O | | | — | | | | — | | | | — | | | | (45.16 | )% |
MSCI EAFE® Index(4) | | | (46.62 | )% | | | (7.86 | )%(5) | | | (7.86 | )%(5) | | | (46.62 | )%(6) |
Based on a $10,000 initial investment, the graph and table above illustrate the total return of ING Index Plus International Equity Fund against the index indicated. The Index is unmanaged and has no cash in its portfolio, imposes no sales charge and incurs no operating expenses. An investor cannot invest directly in the index. The Fund’s performance is shown both with and without the imposition of sales charges.
The graph and performance table do not reflect the deduction of taxes that a shareholder will pay on Fund distributions or the redemption of Fund shares.
The performance shown may include the effect of fee waivers and/or expense reimbursements by the Investment Adviser and/or other service providers, which have the effect of increasing total return. Had all fees and expenses been considered, the total returns would have been lower.
Performance data represents past performance and is no assurance of future results. Investment return and principal value of an investment in the Fund will fluctuate. Shares, when sold, may be worth more or less than their original cost. The Fund’s current performance may be lower or higher than the performance data shown. Please log on to www.ingfunds.com or call (800) 992-0180 to get performance through the most recent month end.
It is important to note that the Fund has a limited operating history. Performance over a longer period of time may be more meaningful than short-term performance.
This report contains statements that may be “forward-looking” statements. Actual results may differ materially from those projected in the “forward-looking” statements.
The views expressed in this report reflect those of the portfolio managers, only through the end of the period as stated on the cover. The portfolio managers’ views are subject to change at any time based on market and other conditions.
Fund holdings are subject to change daily.
| |
| (1) | Reflects deduction of the maximum Class A sales charge of 5.75%. |
| |
| |
| (2) | Reflects deduction of the Class B deferred sales charge of 5% and 3%, respectively, for the 1 year and since inception returns. |
| |
| |
| (3) | Reflects deduction of the Class C deferred sales charge of 1% for the 1 year return. |
| |
| |
| (4) | The MSCI EAFE® Index is an unmanaged index that measures the performance of securities listed on exchanges in markets in Europe, Australasia and the Far East. It includes the reinvestment of dividends net of withholding taxes, but does not reflect fees, brokerage commissions or other expenses of investing. |
| |
| |
| (5) | Since inception performance for the index is shown from January 1, 2006. |
| |
| |
| (6) | Since inception performance for the index is shown from November 1, 2007. |
25
ING International Capital Appreciation Fund
Portfolio Managers’ Report
Country Allocation
as of October 31, 2008
(as a percent of net assets)
Portfolio holdings are subject to change daily.
ING International Capital Appreciation Fund (the “Fund”) seeks capital appreciation. The Fund is managed by a team of investment professionals led by Thomas R.H. Tibbles, CFA, Barry A. Lockhart, CFA, Trevor Graham, CFA, and Patrick Tan of Hansberger Global Investors, Inc. (“HGI”) — the Sub-Adviser.
Performance: For the year ended October 31, 2008, the Fund’s Class A shares, excluding sales charges, provided a total return of (52.69)% compared to the Morgan Stanley Capital International All Country World (ex-US) Indexsm(1)(“MSCI ACWI (ex-US)”), which returned (48.53)% for the same period.
Portfolio Specifics: The Fund underperformed the index during the year ending October 31, 2008 as the high quality bias in the large cap growth space did not reward investors. The majority of the Fund’s underperformance was driven by security selection due to the fundamental bottom-up strategy used by the manager.
According to attribution, the energy, industrials and financials sectors were the largest detractors over the past year, due primarily to negative stock selection. Within financials, National Bank of Greece SA and Prudential PLC were the largest detractors as the credit crisis spread beyond the US and concerns about financial liquidity weighed on investors minds. Renewable Energy Corp. A/S and Vestas Wind Systems A/S were among the largest detractors within the industrials sector as the global crisis of confidence and subsequent credit tightening potentially threatened the availability of capital expenditure financing. Wellstream Holdings PLC, an energy products company, also detracted from performance during the past year as the price of oil plunged in the third quarter of 2008.
From a sector perspective, the largest positive contributions to return came from the information technology, materials and telecommunication services sectors although every sector posted negative returns on an absolute basis. Strong relative performance in the information technology and telecommunication services sector was driven primarily by stock selection.
Attribution indicates that from a regional perspective, Japan, Pacific ex-Japan and Europe were the largest detractors from performance, primarily due to stock selection. Foxconn International Holdings Ltd. was down significantly as the prospects for global cellular handset sales diminished substantially given the current weak consumer environment.
The emerging markets region, although negative on an absolute basis, was the only region to post a positive contribution to performance because of positive security selection as well as a positive currency effect.
Current Strategy and Outlook: The financial crisis that gripped the U.S. in 2007 spread across the globe over the past year and has become an issue of liquidity and a global crisis of confidence. Although several coordinated measures have been taken by central banks worldwide, economic visibility remains low. We believe there are parts of the world, such as some emerging markets that will continue to grow although at much slower rates. It appears likely that there will be a recession in the developed world, although we believe the impact of such an event will not be felt as severely in emerging markets as it has been in previous occasions.
We continue to actively pursue a disciplined, consistent approach that seeks to select stocks from quality companies with strong secular growth profiles and compelling competitive advantages. We believe the Fund is well positioned to benefit over the coming year as capital returns to the market and investors turn their attention to high quality, large-cap stocks.
| |
| (1) | The MSCI ACWI (ex-US) is a free float-adjusted market capitalization index that is designed to measure equity market performance in global developed and emerging markets, excluding the U.S. It includes the reinvestment of dividends net of withholding taxes, but does not reflect fees, brokerage commissions or other expenses of investing. |
Portfolio holdings and characteristics are subject to change and may not be representative of current holdings and characteristics. The outlook for this Fund may differ from that presented for other ING Funds. Performance for the different classes of shares will vary based on differences in fees associated with each class.
Top Ten Holdings
as of October 31, 2008
(as a percent of net assets)
| | | | | |
| Roche Holding AG | | | 2.6 | % |
| Rogers Communications, Inc. | | | 2.4 | % |
| Iliad SA | | | 2.4 | % |
| Autonomy Corp. PLC | | | 2.3 | % |
| Novartis AG | | | 2.1 | % |
| Esprit Holdings Ltd. | | | 2.1 | % |
| Nintendo Co., Ltd. | | | 2.0 | % |
| Focus Media Holding Ltd. ADR | | | 2.0 | % |
| Manulife Financial Corp. | | | 2.0 | % |
| Telefonica SA | | | 1.9 | % |
Portfolio holdings are subject to change daily.
26
ING International Capital Appreciation Fund
Portfolio Managers’ Report
| | | | | | | | | | | | | | | | | |
| Average Annual Total Returns for the Periods Ended October 31, 2008 |
| | | | | Since Inception
| | Since Inception
| | Since Inception
|
| | | | | of Classes A and I
| | of Class B
| | of Class C
|
| | | 1 Year | | December 21, 2005 | | January 9, 2006 | | January 24, 2006 |
| |
Including Sales Charge: | | | | | | | | | | | | | | | | |
Class A(1) | | | (55.42 | )% | | | (12.60 | )% | | | — | | | | — | |
Class B(2) | | | (55.26 | )% | | | — | | | | (13.80 | )% | | | — | |
Class C(3) | | | (53.44 | )% | | | — | | | | — | | | | (12.65 | )% |
| Class I | | | (52.48 | )% | | | (10.47 | )% | | | — | | | | — | |
Excluding Sales Charge: | | | | | | | | | | | | | | | | |
| Class A | | | (52.69 | )% | | | (10.77 | )% | | | — | | | | — | |
| Class B | | | (53.01 | )% | | | — | | | | (12.92 | )% | | | — | |
| Class C | | | (52.99 | )% | | | — | | | | — | | | | 12.65 | % |
| Class I | | | (52.48 | )% | | | (10.47 | )% | | | — | | | | — | |
MSCI ACWI (ex-US)(4) | | | (48.53 | )% | | | (7.24 | )%(5) | | | (7.24 | )%(5) | | | (9.69 | )%(6) |
Based on a $10,000 initial investment, the graph and table above illustrate the total return of ING International Capital Appreciation Fund against the index indicated. The index is unmanaged and has no cash in its portfolio, imposes no sales charge and incurs no operating expenses. An investor cannot invest directly in the index. The Fund’s performance is shown both with and without the imposition of sales charges.
The graph and performance table do not reflect the deduction of taxes that a shareholder will pay on Fund distributions or the redemption of Fund shares.
The performance shown may include the effect of fee waivers and/or expense reimbursements by the Investment Adviser and/or other service providers, which have the effect of increasing total return. Had all fees and expenses been considered, the total returns would have been lower.
Performance data represents past performance and is no assurance of future results. Investment return and principal value of an investment in the Fund will fluctuate. Shares, when sold, may be worth more or less than their original cost. The Fund’s current performance may be lower or higher than the performance data shown. Please log on to www.ingfunds.com or call (800) 992-0180 to get performance through the most recent month end.
It is important to note that the Fund has a limited operating history. Performance over a longer period of time may be more meaningful than short-term performance.
This report contains statements that may be “forward-looking” statements. Actual results may differ materially from those projected in the “forward-looking” statements.
The views expressed in this report reflect those of the portfolio managers, only through the end of the period as stated on the cover. The portfolio managers’ views are subject to change at any time based on market and other conditions.
Fund holdings are subject to change daily.
| |
| (1) | Reflects deduction of the maximum Class A sales charge of 5.75%. |
| (2) | Reflects deduction of the Class B deferred sales charge of 5% and 3%, respectively, for the 1 year and since inception returns. |
| (3) | Reflects deduction of the Class C deferred sales charge of 1% for the 1 year return. |
| (4) | The MSCI ACWI (ex-US) is a free float-adjusted market capitalization index that is designed to measure equity market performance in global developed and emerging markets, excluding the U.S. It includes the reinvestment of dividends net of withholding taxes, but does not reflect fees, brokerage commissions or other expenses of investing. |
| (5) | Since inception performance for the index is shown from January 1, 2006. |
| (6) | Since inception performance for the index is shown from February 1, 2006. |
27
ING International Equity Dividend Fund
Portfolio Managers’ Report
Country Allocation
as of October 31, 2008
(as a percent of net assets)
Portfolio holdings are subject to change daily.
ING International Equity Dividend Fund (the “Fund”) seeks growth of capital with dividend income as a secondary consideration. The Fund is managed by Nicolas Simar, Head of Value/High Dividend, Moudy El Khodr, Senior Investment Manager Equities, and Kris Hermie, CFA, Senior Investment Manager of ING Investment Management Advisors B.V. — the Sub-Adviser.
Performance: For the year ended October 31, 2008, the Fund’s Class A shares, excluding sales charges, provided a total return of (46.79)% compared to the Morgan Stanley Capital International World ex-US Indexsm(1) (“MSCI World ex-US Indexsm”), which returned (46.55)% for the same period.
Portfolio Specifics: The Fund uses the MSCI World ex-US Indexsm as its benchmark to reflect the strategic emphasis of the Fund. The Fund’s fiscal year was marked by a full fledged bear market. Earnings peaked in the summer of 2007. The financial sector’s problems with the subprime and credit crisis accumulated over the period, leading to broader economic impacts. Following this slowdown, the global economy moved into recession. By the end of June 2008, only the materials and energy sectors were positive and then they also succumbed.
The Fund underperformed its benchmark for the 12-month period ended October 31, 2008. In the first six months, the Fund underperformed as financials delivered poor performance (the Fund was overweight) and the metals and mining segment of materials remained robust (the Fund was underweight). After June, the Fund’s overweighting of financials started to outperform and partially offset the detraction from the first half of the fiscal year. The Fund’s underweight of the materials sector proved beneficial for the year, as did its overweight of energy. It should be noted that the pursuit of high dividend paying stocks typically leads the Fund to overweight financials, overweight Europe and underweight Japan. Each of those positions carried substantial disadvantages over the fiscal year, the first because of the problems in the financial industry as described, the last two because of the weak European currencies and strong yen.
For the year as a whole, strong stock picking in energy and materials helped performance. In energy, active investing in the major integrated oilfield drilling companies added value. In materials, having at first been penalized by lack of exposure to the metals and mining stocks, when those stocks’ fortunes reversed, the Fund gained. Exposure to the paper, cement and chemicals sub-sectors of materials paid off as those sub-sectors outperformed the sector as a whole.
The sectors that detracted the most from results were financials and consumer discretionary. The latter fell with the consequences of the economic slowdown and profit warnings from key companies. Financials’ problems alone erased all gains from energy and materials. As the subprime and credit crisis worsened, companies announced more write-downs, capital increases and reduced or cancelled dividend payments. The U.S. and other governments intervened to bolster banks’ capital in an attempt to restart lending. Some financials folded either by being bought or by going bankrupt.
Current Strategy and Outlook: Our outlook for the Fund remains positive. We believe that, after the general sell-off of the last few months, investors will pay more attention to the dividend theme in a market caught between a rock and a hard place. On the downside, low valuation may prevent further falls; but earnings revisions, deleveraging and poorer economic data will likely limit the near-term upside before the economy recovers from this recession. We believe the current stage in the style cycle is more favorable for dividend investing, as are the recovery and boom phases. During the last couple of months in the period, the Fund outperformed during both up and down months, which may serve as a good grounding for the Fund. We continue to look for individual stocks to exploit any temporary undervaluations that may take place.
| |
| (1) | The MSCI World ex-US IndexSM is an unmanaged index that comprises the entire developed world less the United States. The designation of a country as developed arises primarily as a measurement of GDP per capital. |
Portfolio holdings and characteristics are subject to change and may not be representative of current holdings and characteristics. The outlook for this Fund may differ from that presented for other ING Funds. Performance for the different classes of shares will vary based on differences in fees associated with each class.
Top Ten Holdings
as of October 31, 2008
(as a percent of net assets)
| | | | | |
| Royal Dutch Shell PLC | | | 2.2 | % |
| Total SA | | | 2.2 | % |
| BP PLC | | | 2.2 | % |
| ENI S.p.A. | | | 2.2 | % |
| United Utilities Group PLC | | | 2.1 | % |
| Enerplus Resources Fund | | | 2.0 | % |
| Sanofi-Aventis | | | 1.9 | % |
| AstraZeneca PLC | | | 1.9 | % |
| E.ON AG | | | 1.9 | % |
| Scottish & Southern Energy PLC | | | 1.9 | % |
Portfolio holdings are subject to change daily.
28
ING International Equity Dividend Fund
Portfolio Managers’ Report
| | | | | | | | | | | | | |
| Average Annual Total Returns for the Periods Ended October 31, 2008 |
| | | | | Since Inception
| | Since Inception
|
| | | | | of Classes A, B, C and I
| | of Class W
|
| | | 1 Year | | June 28, 2007 | | February 12, 2008 |
| |
Including Sales Charge: | | | | | | | | | | | | |
Class A(1) | | | (49.82 | )% | | | (37.61 | )% | | | — | |
Class B(2) | | | (49.73 | )% | | | (37.12 | )% | | | — | |
Class C(3) | | | (47.70 | )% | | | (35.27 | )% | | | — | |
| Class I | | | (46.64 | )% | | | (34.62 | )% | | | — | |
| Class W | | | — | | | | — | | | | (37.11 | )% |
Excluding Sales Charge: | | | | | | | | | | | | |
| Class A | | | (46.79 | )% | | | (34.80 | )% | | | — | |
| Class B | | | (47.19 | )% | | | (35.26 | )% | | | — | |
| Class C | | | (47.20 | )% | | | (35.27 | )% | | | — | |
| Class I | | | (46.64 | )% | | | (34.62 | )% | | | — | |
| Class W | | | — | | | | — | | | | (37.11 | )% |
MSCI World ex-US IndexSM(4) | | | (46.55 | )% | | | (34.15 | )%(5) | | | (37.69 | )%(6) |
Based on a $10,000 initial investment, the graph and table above illustrate the total return of ING International Equity Dividend Fund against the index indicated. The index is unmanaged and has no cash in its portfolio, imposes no sales charges and incurs no operating expenses. An investor cannot invest directly in the index. The Fund’s performance is shown both with and without the imposition of sales charges.
The graph and performance table do not reflect the deduction of taxes that a shareholder will pay on Fund distributions or the redemption of Fund shares.
The performance shown may include the effect of fee waivers and/or expense reimbursements by the Investment Adviser and/or other service providers, which have the effect of increasing total return. Had all fees and expenses been considered, the total returns would have been lower.
Performance data represents past performance and is no assurance of future results. Investment return and principal value of an investment in the Fund will fluctuate. Shares, when sold, may be worth more or less than their original cost. The Fund’s current performance may be lower or higher than the performance data shown. Please log on to www.ingfunds.com or call (800) 992-0180 to get performance through the most recent month end.
It is important to note that the Fund has a limited operating history. Performance over a longer period of time may be more meaningful than short-term performance.
This report contains statements that may be “forward-looking” statements. Actual results may differ materially from those projected in the “forward-looking” statements.
The views expressed in this report reflect those of the portfolio managers, only through the end of the period as stated on the cover. The portfolio managers’ views are subject to change at any time based on market and other conditions.
Fund holdings are subject to change daily.
| |
| (1) | Reflects deduction of the maximum Class A sales charge of 5.75%. |
| (2) | Reflects deduction of the Class B deferred sales charge of 5% and 4%, respectively, for the 1 year and since inception returns. |
| (3) | Reflects deduction of the Class C deferred sales charge of 1% for the 1 year return. |
| (4) | The MSCI World ex-US Indexsm is an unmanaged index that comprises the entire developed world less the United States. The designation of a country as developed arises primarily as a measurement of GDP per capita. |
| (5) | Since inception performance for the index is shown from July 1, 2007. |
| (6) | Since inception performance for the index is shown from February 1, 2008. |
29
ING International Growth Opportunities Fund
Portfolio Managers’ Report
Country Allocation
as of October 31, 2008
(as a percent of net assets)
Portfolio holdings are subject to change daily.
ING International Growth Opportunities Fund (the “Fund”) seeks long-term growth of capital through investment in equity securities and equity equivalents of companies outside the U.S. The Fund is managed by Uri Landesman, Senior Vice President and Head of International Equity, Portfolio Manager of ING Investment Management Co. — the Sub-Adviser.
Performance: For the year ended October 31, 2008, the Fund’s Class A shares, excluding sales charges, provided a total return of (55.03)% compared to the Morgan Stanley Capital International — Europe, Australasia and Far East® Growth Index(1) (“MSCI EAFE® Growth Index”) which returned (44.85)% for the same period.
Portfolio Specifics: One can arguably spend hours trying to characterize the markets behavior over the past year; however at least one definition encapsulates this period: it is an unprecedented historical time. The 12 month period ended October 31, 2008 was affected by a litany of issues, including an escalating financial crisis, rampant inflation, a possible war between Iran and Israel, fears of a global recession, collapsing of storied companies and unparalleled levels of market volatility. Certainly the last twelve months have tested the fortitude of investors worldwide, as trillions of dollars have been wiped out. However, one must not forget that chaos breeds opportunity and that great wealth can be created when we enter a new bull market.
For the period, security selection was generally negative. Our selection coupled with a modest overweight within the materials sector detracted most from our results. The materials sector came out of favor towards mid year 2008 as commodity prices crumbled. Further detractions stemmed from both an overweight and security selection in the relatively weak financial sector. Regionally, the Fund’s exposure to non-benchmark emerging markets coupled with weak security selection in Europe proved detrimental.
The Fund’s overweight coupled with strong security selection within the energy sector proved beneficial. We additionally realized positive contributions from our underweight and strong security selection in the telecommunications sector. Regionally, our security selection within Japan added value.
Monsanto Co., a U.S. based producer of fertilizer and agricultural chemicals, was the greatest contributor to results for the period. In the earlier part of 2008, rising food prices pushed up demand for their products. Similarly, the Fund’s position in China’s oil giant PetroChina Co., Ltd. added value as share prices reacted positively to rising crude prices.
The Fund’s two greatest detractors from results were mining giants Anglo American Plc (UK) and Xstrata Plc (Swiss), which saw share prices slide dramatically over the period as commodity and metals pricing affected their profitability. Another important detractor was American International Group, Inc. (“AIG”), a U.S. based insurer, which suffered an 87% loss in share value on mortgage related woes. On September 17, the U.S. government rescued AIG by lending it $85 billion and taking an 80% stake in the company.
Current Strategy and Outlook: Consistent with our view of the market, we have been seeking to capitalize upon opportunities that the recent downturn has provided. With a high probability of a global recession the outlook for international markets remains highly uncertain. In our view, the globally coordinated support actions by authorities, which are continuing after period-end, should help markets stabilize. We seek opportunities where growth potential remains intact. The economic impact of the crisis has yet to be fully felt, so we expect continued high market volatility in the months ahead.
| |
| (1) | The MSCI EAFE® Growth Indexsm is an unmanaged index that measures the performance in 20 countries within Europe, Australasia and the Far East with a greater-than-average growth orientation. |
Portfolio holdings and characteristics are subject to change and may not be representative of current holdings and characteristics. The outlook for this Fund may differ from that presented for other ING Funds. Performance for the different classes of shares will vary based on differences in fees associated with each class.
Top Ten Holdings*
as of October 31, 2008
(as a percent of net assets)
| | | | | |
| Anglo American PLC | | | 4.2 | % |
| Bayer AG | | | 4.1 | % |
| ARM Holdings PLC | | | 4.0 | % |
| Tesco PLC | | | 4.0 | % |
| Namco Bandai Holdings, Inc. | | | 3.9 | % |
| Mitsubishi UFJ Financial Group PLC | | | 3.8 | % |
| Imperial Tobacco Group PLC | | | 3.7 | % |
| Nokia OYJ | | | 3.6 | % |
| InBev NV | | | 3.6 | % |
| Li & Fung Ltd. | | | 3.5 | % |
| | | |
| | * | Excludes short-term investments related to securities lending collateral. | |
Portfolio holdings are subject to change daily.
30
ING International Growth Opportunities Fund
Portfolio Managers’ Report
| | | | | | | | | | | | | | | | | | | | | | | | | | | | | |
| Average Annual Total Returns for the Periods Ended October 31, 2008 |
| | | | | | | | | Since Inception
| | Since Inception
| | Since Inception
| | Since Inception
|
| | | | | | | | | of Class B
| | of Class C
| | of Class I
| | of Class Q
|
| | | 1 Year | | 5 Year | | 10 Year | | August 22, 2000 | | September 15, 2000 | | January 15, 2002 | | February 26, 2001 |
| |
Including Sales Charge: | | | | | | | | | | | | | | | | | | | | | | | | | | | | |
Class A(1) | | | (57.61 | )% | | | (2.46 | )% | | | 0.40 | % | | | — | | | | — | | | | — | | | | — | |
Class B(2) | | | (57.27 | )% | | | (2.33 | )% | | | — | | | | (4.97 | )% | | | — | | | | — | | | | — | |
Class C(3) | | | (55.74 | )% | | | (2.02 | )% | | | — | | | | — | | | | (4.40 | )% | | | — | | | | — | |
| Class I | | | (54.86 | )% | | | (0.90 | )% | | | — | | | | — | | | | — | | | | (0.21 | )% | | | — | |
| Class Q | | | (54.96 | )% | | | (1.15 | )% | | | — | | | | — | | | | — | | | | — | | | | (2.72 | )% |
Excluding Sales Charge: | | | | | | | | | | | | | | | | | | | | | | | | | | | | |
| Class A | | | (55.03 | )% | | | (1.30 | )% | | | 1.00 | % | | | — | | | | — | | | | — | | | | — | |
| Class B | | | (55.41 | )% | | | (2.03 | )% | | | — | | | | (4.97 | )% | | | — | | | | — | | | | — | |
| Class C | | | (55.36 | )% | | | (2.02 | )% | | | — | | | | — | | | | (4.40 | )% | | | — | | | | — | |
| Class I | | | (54.86 | )% | | | (0.90 | )% | | | — | | | | — | | | | — | | | | (0.21 | )% | | | — | |
| Class Q | | | (54.96 | )% | | | (1.15 | )% | | | — | | | | — | | | | — | | | | — | | | | (2.72 | )% |
MSCI EAFE Growth IndexSM(4) | | | (44.85 | )% | | | 3.35 | % | | | (0.24 | )% | | | (4.73 | )%(5) | | | (3.96 | )%(5) | | | 1.52 | %(6) | | | (1.77 | )%(7) |
Based on a $10,000 initial investment, the graph and table above illustrate the total return of ING International Growth Opportunities Fund against the index indicated. The index is unmanaged and has no cash in its portfolio, imposes no sales charge and incurs no operating expenses. An investor cannot invest directly in an index. The Fund’s performance is shown both with and without the imposition of sales charges.
The graph and performance table do not reflect the deduction of taxes that a shareholder will pay on Fund distributions or the redemption of Fund shares.
The performance shown may include the effect of fee waivers and/or expense reimbursements by the Investment Adviser and/or other service providers, which have the effect of increasing total return. Had all fees and expenses been considered, the total returns would have been lower.
Performance data represents past performance and is no assurance of future results. Investment return and principal value of an investment in the Fund will fluctuate. Shares, when sold, may be worth more or less than their original cost. The Fund’s current performance may be lower or higher than the performance data shown. Please log on to www.ingfunds.com or call (800) 992-0180 to get performance through the most recent month end.
This report contains statements that may be “forward-looking” statements. Actual results may differ materially from those projected in the “forward-looking” statements.
The views expressed in this report reflect those of the portfolio managers, only through the end of the period as stated on the cover. The portfolio managers’ views are subject to change at any time based on market and other conditions.
Fund holdings are subject to change daily.
| |
| (1) | Reflects deduction of the maximum Class A sales charge of 5.75%. |
| (2) | Reflects deduction of the Class B deferred sales charge of 5% and 2%, respectively, for the 1 year and 5 year returns. |
| (3) | Reflects deduction of the Class C deferred sales charge of 1% for the 1 year return. |
| (4) | The MSCI EAFE Growth Indexsm is an unmanaged index that measures the performance in 20 countries within Europe, Australasia and the Far East with a greater-than-average growth orientation. |
| (5) | Since inception performance for the index is shown from September 1, 2000. |
| (6) | Since inception performance for the index is shown from January 1, 2002. |
| (7) | Since inception performance for the index is shown from March 1, 2001. |
Prior to July 26, 2000, the Fund was advised by a different sub-adviser.
31
ING International Real Estate Fund
Portfolio Managers’ Report
Country Allocation
as of October 31, 2008
(as a percent of net assets)
Portfolio holdings are subject to change daily.
ING International Real Estate Fund (the “Fund”) seeks to provide investors with high total return. The Fund is managed by T. Ritson Ferguson, Chief Investment Officer, CFA and Steven D. Burton, Managing Director, CFA of ING Clarion Real Estate Securities L.P. — the Sub-Adviser.
Performance: For the year ended October 31, 2008, the Fund’s Class A shares, excluding sales charges, provided a total return of (50.31)% compared to the Standard & Poor’s (“S&P”) Developed ex-US Property Index(1) which returned (56.64)% for the same period.
Portfolio Specifics: The past twelve months has proved to be a very difficult period for the world’s listed real estate markets as tightening credit market conditions and a slowing global economy have provided significant headwinds to the world’s capital markets. Investor concerns continue to center on the ramifications of the credit crunch, including lack of liquidity and scarcity of available capital. Governments and Central Banks have responded aggressively to these issues via significant capital support to financial institutions as well as interest rate cuts. Though all regions experienced a significant sell-off over the past twelve months, the Americas fared the best, down 51.2%, followed by the European and Asia Pacific regions which were down 56.2% and 57.2%, respectively. In the Americas, Canadian property stocks held up well until the market decline in October, which accounted for three-fifths of the decline generated during the past twelve months. Within the European region, the return differential between countries was quite substantial, ranging from a (16.9)% return posted by Switzerland, the best-performing market during the period, to a (87.1)% return posted by Norway, the poorest-performing market during the period. On whole, the countries which fared the best in the current environment were the countries in the Benelux region as well as Switzerland and France; the countries which fared the worst were in Southern, Central and Eastern Europe as well as the Scandinavian region. Within the Asia-Pacific region, negative performance was driven most notably by Australia, which was down 69% for the period. Hong Kong- and Singapore-based property companies with exposure to development in mainland China also performed particularly poorly during the period, in a complete reversal from 2007 when these companies significantly outperformed.
Fund outperformance for the period was driven by stock selection and regional allocation as both had a positive effect over all. Stock selection, which accounted for roughly 60% of the period’s outperformance, was especially strong in the Asia-Pacific region as the portfolio maintained its tilt towards conservatively-managed companies, defensive property types, and solid balance sheets. Examples of Fund holdings along these lines include Australian global mall operator Westfield Group, Hong Kong shopping center company the Link Real Estate Investment Trust, and Tokyo office landlord Mitsubishi Estate Co., Ltd., all of which outperformed their respective countries’ average return for the period. Conversely, the portfolio is avoiding investments in companies with the opposite characteristics, especially companies with above-average leverage or any prospective refinancing concerns. Within Europe, overweight positions in outperforming French retail property companies Unibail-Rodamco and Mercialys boosted relative returns. Country allocation decisions added value, helped by selective country allocation decisions in Europe and an underweight to the underperforming Singapore property market.
Current Strategy and Outlook: The Fund continues to maintain a defensive positioning, with a bias toward high-quality companies. We remain overweight sectors and geographies offering long-term leases and high percentages of earnings from recurring sources (primarily contract lease rental income). We prefer companies offering more transparency, strong balance sheets and good, experienced management teams. This focus on quality has driven our significant outperformance in the trying times of the past year. Conversely, we are avoiding companies dependent on acquisitions and/or development activities for earnings growth.
This bear market has already reached levels and duration comparable to past severe market declines. The extreme volatility in the market is an indicator that the normal fundamental underpinnings of the market’s price discovery mechanism have broken down. In our view, with past bear markets as a gauge, it seems we may be nearing the end of this correction.
International property companies remain attractively valued. We estimate the average international property company is trading at a 31% discount to our internal estimate of inherent private real estate market value, ranging from the low, a 5% discount in the U.K., to the high, a 50% discount in Hong Kong. In our opinion, the market continues to price in a too-pessimistic scenario in terms of a global economic slowdown.
| |
| (1) | The S&P Developed ex-US Property Index (formerly, the S&P/Citigroup BMI World Property ex-US Index) is an unmanaged float-adjusted index which defines and measure the investable universe of publicly traded property companies domiciled in developed countries, outside of the United States, that derive more than half of their revenue from property-related activities, such as property ownership, management, development, rental and investment. |
Portfolio holdings and characteristics are subject to change and may not be representative of current holdings and characteristics. The outlook for this Fund may differ from that presented for other ING Funds. Performance for the different classes of shares will vary based on differences in fees associated with each class.
Top Ten Holdings*
as of October 31, 2008
(as a percent of net assets)
| | | | | |
| Westfield Group | | | 9.8 | % |
| Mitsubishi Estate Co., Ltd. | | | 8.7 | % |
| Unibail | | | 7.6 | % |
| Cheung Kong Holdings Ltd. | | | 7.1 | % |
| Mitsui Fudosan Co., Ltd. | | | 6.2 | % |
| Sun Hung Kai Properties Ltd. | | | 3.6 | % |
| Land Securities Group PLC | | | 3.5 | % |
| Japan Real Estate Investment Corp. | | | 2.8 | % |
| Nippon Building Fund, Inc. | | | 2.7 | % |
| Link Real Estate Investment Trust | | | 2.4 | % |
| | | |
| | * | Excludes short-term investments related to ING Institutional Prime Money Market Fund. | |
Portfolio holdings are subject to change daily.
32
ING International Real Estate Fund
Portfolio Managers’ Report
| | | | | | | | | | | | | |
| Average Annual Total Returns for the Periods Ended October 31, 2008 |
| | | | | Since Inception
| | Since Inception
|
| | | | | of Classes A, B, C and I
| | of Class W
|
| | | 1 Year | | February 28, 2006 | | February 12, 2008 |
| |
Including Sales Charge: | | | | | | | | | | | | |
Class A(1) | | | (53.17 | )% | | | (12.31 | )% | | | — | |
Class B(2) | | | (53.09 | )% | | | (11.95 | )% | | | — | |
Class C(3) | | | (51.16 | )% | | | (11.02 | )% | | | — | |
| Class I | | | (50.14 | )% | | | (10.07 | )% | | | — | |
| Class W | | | — | | | | — | | | | (38.91 | )% |
Excluding Sales Charge: | | | | | | | | | | | | |
| Class A | | | (50.31 | )% | | | (10.35 | )% | | | — | |
| Class B | | | (50.72 | )% | | | (11.00 | )% | | | — | |
| Class C | | | (50.69 | )% | | | (11.02 | )% | | | — | |
| Class I | | | (50.14 | )% | | | (10.07 | )% | | | — | |
| Class W | | | — | | | | — | | | | (38.91 | )% |
S&P Developed ex-US Property Index(4) | | | (56.64 | )% | | | (15.31 | )%(5) | | | (47.93 | )%(6) |
Based on a $10,000 initial investment, the graph and table above illustrate the total return of ING International Real Estate Fund against the index indicated. The index is unmanaged and has no cash in its portfolio, imposes no sales charges and incurs no operating expenses. An investor cannot invest directly in the index. The Fund’s performance is shown both with and without the imposition of sales charges.
The graph and performance table do not reflect the deduction of taxes that a shareholder will pay on Fund distributions or the redemption of Fund Shares.
The performance shown may include the effect of fee waivers and/or expense reimbursements by the Investment Adviser and/or other service providers, which have the effect of increasing total return. Had all fees and expenses been considered, the total returns would have been lower.
The performance data represents past performance and is no assurance of future results. Investment return and principal value of an investment in the Fund will fluctuate. Shares, when sold, may be worth more or less than their original cost. The Fund’s current performance may be lower or higher than the performance data shown. Please log on to www.ingfunds.com or call (800) 992-0180 to get performance through the most recent month end.
It is important to note that the Fund has a limited operating history. Performance over a longer period of time may be more meaningful than short-term performance.
This report contains statements that may be “forward-looking” statements. Actual results may differ materially from those projected in the “forward-looking” statements.
The views expressed in this report reflect those of the portfolio managers, only through the end of the period as stated on the cover. The portfolio managers’ views are subject to change at any time based on market and other conditions.
Fund holdings are subject to change daily.
| |
| (1) | Reflects deduction of the maximum Class A sales charge of 5.75%. |
| (2) | Reflects deduction of the Class B deferred sales charge of 5% and 3%, respectively, for the 1 year and since inception returns. |
| (3) | Reflects deduction of the Class C deferred sales charge of 1% for the 1 year return. |
| (4) | The S&P Developed ex-US Property Index (formerly, the S&P/Citigroup BMI World Property ex-US Index) is an unmanaged float-adjusted index which defines and measure the investable universe of publicly traded property companies domiciled in developed countries, outside of the United States, that derive more than half of their revenue from property-related activities, such as property ownership, management, development, rental and investment. |
| (5) | Since inception performance of the index is shown from March 1, 2006. |
| (6) | Since inception performance of the index is shown from February 1, 2008. |
33
ING International SmallCap Multi-Manager Fund
Portfolio Managers’ Report
Country Allocation
as of October 31, 2008
(as a percent of net assets)
Portfolio holdings are subject to change daily.
ING International Small Cap Multi-Manager Fund (the “Fund”) seeks maximum long term capital appreciation. The Fund’s assets are managed by three sub-advisers — Acadian Asset Management LLC (“Acadian”), Batterymarch Financial Management, Inc. (“Batterymarch”) and Schroder Investment Management North America Inc. (“Schroders”)(1). Each manages a portion of the Fund’s assets that is allocated to the sub-adviser. The following individuals are primarily responsible for the day-to-day management of their respective portions of the Fund: John R. Chisholm, CFA, Executive Vice President and Co-Chief Investment Officer and Matthew J. Cohen, CFA, Senior Vice President, Portfolio Managers of Acadian; Charles F. Lovejoy, CFA, Director and Senior Portfolio Manager and Christopher W. Floyd, CFA, Portfolio Manager of Batterymarch; Matthew Dobbs, Portfolio Manager of Schroders.
Performance: For the year ended October 31, 2008, the Fund’s Class A shares, excluding sales charges, provided a total return of (59.84)% compared to the Standard & Poor’s (“S&P”) Developed ex-US SmallCap Index(2) and the S&P Europe Pacific Asia Composite (“EPAC”) SmallCap Index(3), which returned (53.76)% and (53.00)%, respectively, for the same period.
Portfolio Specifics: Acadian — In a highly difficult period for Acadian’s process, the portfolio trailed the benchmark by approximately 7.00%. This was largely the result of active stock selection, which detracted 5.70%. The portfolio was smaller in overall cap profile than the benchmark and also was positioned with a value tilt. This hurt performance over a highly volatile and risk-averse period where both value and smaller stocks underperformed significantly. Looking at specific markets, stock selection detracted the most value in Australia, France, Singapore and Japan. Services, materials and finance companies detracted most from return. In particular, a focus on materials stocks in Australia, Korea and China hurt, as falling commodity prices depressed the outlook for resource-driven companies. Being underweight Japanese banks was another key area of underperformance as this sector did unexpectedly well over the period. Country weights impacting return included the overweights in Australia and Singapore as well as the underweighting in Switzerland. Value lost from these positions was partly offset by some value added back from the overweighting in Japan. There was also some positive return seen in Canada and the U.K., particularly the focus on staples in Canada and energy in the U.K., while avoiding many stocks in the beleaguered U.K. finance sector. Batterymarch — Our investment process combines fundamental viewpoints with quantitative implementation. Thus our stock selection model worked well for the first half of the period when the market was driven by fundamentals, but struggled in the second half which was marked by frequent government intervention and resulting sector and stock reversals. The portfolio underperformed the benchmark by approximately 3.60%. Stock selection detracted from performance overall, although it was strong in the United Kingdom financials ex banks and consumer discretionary sectors, as well as in continental Europe telecommunication services. Selection in Japan was particularly weak, most notably in the materials sector. Allocation among the regions and sectors added value, with an underweight to Asia ex Japan being especially beneficial. Schroders — The period since inception has been one of the toughest for equity investors in living memory. A sharp tightening of credit, risk aversion and faltering economies have impacted equities, particularly smaller companies which are perceived as being more sensitive to the overall economy. The scale of declines has undoubtedly been exaggerated by lower liquidity, and some forced selling. The overall decline in the Fund has reflected these adverse conditions, but relative performance has been strong due to stock selection in continental Europe (notably among financials, energy and consumer discretionary stocks) and in smaller Asian markets. The portfolio outperformed the benchmark by approximately 3.00% for the period since Schroders began managing a portion of the Fund on December 17, 2007. Positioning in Japan was the major disappointment due to stock selection shortfalls, and our underweighting of high priced defensives.
Current Strategy and Outlook: Acadian — Current conditions are extraordinary, but we strongly believe they are temporary. We believe markets ultimately reward well-valued stocks with attractive earnings prospects and solid financial quality. Staying consistently exposed to a portfolio of stocks with these attributes, even through difficult periods where such attributes are underperforming, is in our view the best long-term investment strategy. We thus remain disciplined and focused on our normal process, and strongly believe our style will return to favor. This does not mean that we are ignoring the current conditions — far from it. We are monitoring the process continually and seeking to improve it. Our disciplined, bottom-up stock selection process has currently led the portfolio to be overweighted in Japan, Singapore, Germany, Canada and Australia, with emerging markets exposure in a number of markets including Taiwan, Turkey and India. Major markets where the portfolio is underweighted include the U.K., Spain, Switzerland, France, Italy and the Netherlands. Batterymarch — We continue to believe that, over the long-term, fundamentals remain the key driver of returns. However, we anticipate that in the short-term, markets may continue to be driven by headlines and government interventions, so we continue to adhere to the strict risk controls which are part of our process. As of October 31, 2008, we believe the portfolio remained attractively valued versus the benchmark, with a lower 12 month forward P/E (7.1x vs. 8.2x) and a comparable consensus expected annual earnings per share growth rate (11.3% vs. 11.1%). Schroders — We continue to seek companies offering superior and visible growth prospects. We believe this is all the more critical given the economic uncertainties ahead. In terms of the Fund positioning, we retain the overweight in smaller Asian markets and are modestly overweight in continental European markets, with a bias towards areas such as utilities, energy, health care and information technology services. We remain cautious on Japan, where a number of niche specialist industrial, material and information technology stocks form the bulk of our exposure, and on the United Kingdom as the economy enters the current downcycle structurally weak given a fast deflating real estate bubble, high household indebtedness, and a lack of fiscal options.
| |
| (1) | Schroders began managing its portion of the Fund effective December 17, 2007. |
| (2) | The S&P Developed ex-US SmallCap Index (formerly, the S&P/Citigroup Extended Market Index (“EMI”) World ex-US Index) is an unmanaged float-adjusted index which captures the bottom 15% of companies in the developed markets, based on the cumulative market capitalization of each country, excluding the United States, within the S&P Global Broad Market Index, which covers all publicly listed equities in 47 countries with a float adjusted market capitalization of US$100 million or greater and a minimum annual trading liquidity of US$50 million. |
| (3) | The S&P EPAC SmallCap Index (formerly, the S&P/Citigroup EMI EPAC Index) is an unmanaged float-adjusted index which captures the bottom 15% of companies in the developed European and Pacific markets, based on the cumulative market capitalization of each country, within the S&P Global Broad Market Index, which covers all publicly listed equities in 47 countries with a float adjusted market capitalization of US $100 million or greater and a minimum annual trading liquidity of US $50 million. |
Portfolio holdings and characteristics are subject to change and may not be representative of current holdings and characteristics. The outlook for this Fund may differ from that presented for other ING Funds. Performance for the different classes of shares will vary based on differences in fees associated with each class.
Top Ten Holdings*
as of October 31, 2008
(as a percent of net assets)
| | | | | |
| Singapore Petroleum Co., Ltd. | | | 1.4 | % |
| Norddeutsche Affinerie AG | | | 1.2 | % |
| Australian Worldwide Exploration Ltd. | | | 1.2 | % |
| MTU Aero Engines Holding AG | | | 1.0 | % |
| Rallye SA | | | 1.0 | % |
| Centennial Coal Co., Ltd. | | | 1.0 | % |
| Methanex Corp. | | | 1.0 | % |
| Aggreko PLC | | | 1.0 | % |
| Galenica AG | | | 0.9 | % |
| Celestica, Inc. | | | 0.9 | % |
| | | |
| | * | Excludes short-term investments related to securities lending collateral. | |
Portfolio holdings are subject to change daily.
34
ING International SmallCap Multi-Manager Fund
Portfolio Managers’ Report
| | | | | | | | | | | | | | | | | | | | | | | | | |
| Average Annual Total Returns for the Periods Ended October 31, 2008 |
| | | | | | | | | Since Inception
| | Since Inception
| | Since Inception
|
| | | | | | | | | of Class I
| | of Class O
| | of Class W
|
| | | 1 Year | | 5 Year | | 10 Year | | December 21, 2005 | | June 4, 2008 | | February 12, 2008 |
| |
Including Sales Charge: | | | | | | | | | | | | | | | | | | | | | | | | |
Class A(1) | | | (62.14 | )% | | | 0.10 | % | | | 5.60 | % | | | — | | | | — | | | | — | |
Class B(2) | | | (61.82 | )% | | | 0.29 | % | | | 5.55 | % | | | — | | | | — | | | | — | |
Class C(3) | | | (60.45 | )% | | | 0.63 | % | | | 5.53 | % | | | — | | | | — | | | | — | |
| Class I | | | (59.66 | )% | | | — | | | | — | | | | (13.12 | )% | | | — | | | | — | |
| Class O | | | — | | | | — | | | | — | | | | — | | | | (51.88 | )% | | | — | |
| Class Q | | | (59.78 | )% | | | 1.48 | % | | | 6.45 | % | | | — | | | | — | | | | — | |
| Class W | | | — | | | | — | | | | — | | | | — | | | | — | | | | (47.08 | )% |
Excluding Sales Charge: | | | | | | | | | | | | | | | | | | | | | | | | |
| Class A | | | (59.84 | )% | | | 1.29 | % | | | 6.22 | % | | | — | | | | — | | | | — | |
| Class B | | | (60.10 | )% | | | 0.64 | % | | | 5.55 | % | | | — | | | | — | | | | — | |
| Class C | | | (60.11 | )% | | | 0.63 | % | | | 5.53 | % | | | — | | | | — | | | | — | |
| Class I | | | (59.66 | )% | | | — | | | | — | | | | (13.12 | )% | | | — | | | | — | |
| Class O | | | — | | | | — | | | | — | | | | — | | | | (51.88 | )% | | | — | |
| Class Q | | | (59.78 | )% | | | 1.48 | % | | | 6.45 | % | | | — | | | | — | | | | — | |
| Class W | | | — | | | | — | | | | — | | | | — | | | | — | | | | (47.08 | )% |
S&P Developed ex-US SmallCap Index(4) | | | (53.76 | )% | | | 3.78 | % | | | 4.62 | % | | | (11.37 | )%(7) | | | (47.61 | )%(8) | | | (43.22 | )%(9) |
S&P EPAC SmallCap Index(5) | | | (53.00 | )% | | | 3.95 | %(6) | | | 4.40 | % | | | (11.05 | )%(7) | | | (46.84 | )%(8) | | | (42.32 | )%(9) |
Based on a $10,000 initial investment, the graph and table above illustrate the total return of ING International SmallCap Multi-Manager Fund against the indices indicated. An index is unmanaged and has no cash in its portfolio, imposes no sales charges and incurs no operating expenses. An investor cannot invest directly in an index. The Fund’s performance is shown both with and without the imposition of sales charge.
The graph and performance table do not reflect the deduction of taxes that a shareholder will pay on Fund distributions or the redemption of Fund Shares.
The performance shown may include the effect of fee waivers and/or expense reimbursements by the Investment Adviser and/or other service providers, which have the effect of increasing total return. Had all fees and expenses been considered, the total returns would have been lower.
Performance data represents past performance and is no assurance of future results. Investment return and principal value of an investment in the Fund will fluctuate. Shares, when sold, may be worth more or less than their original cost. The Fund’s current performance may be lower or higher than the performance data shown. Please log on to www.ingfunds.com or call (800) 992-0180 to get performance through the most recent month end.
This report contains statements that may be “forward-looking” statements. Actual results may differ materially from those projected in the “forward-looking” statements.
The views expressed in this report reflect those of the portfolio managers, only through the end of the period as stated on the cover. The portfolio managers’ views are subject to change at any time based on market and other conditions.
Fund holdings are subject to change daily.
| |
| (1) | Reflects deduction of the maximum Class A sales charge of 5.75%. |
| (2) | Reflects deduction of the Class B deferred sales charge of 5% and 2%, respectively, for the 1 year and 5 year returns. |
| (3) | Reflects deduction of the Class C deferred sales charge of 1% for the 1 year return. |
| (4) | The S&P Developed ex-US SmallCap Index (formerly, the S&P/Citigroup EMI World ex-US Index) is an unmanaged float-adjusted index which captures the bottom 15% of companies in the developed markets, based on the cumulative market capitalization of each country, excluding the United States, within the S&P Global Broad Market Index, which covers all publicly listed equities in 47 countries with a float adjusted market capitalization of US $100 million or greater and a minimum annual trading liquidity of US $50 million. |
| (5) | The S&P EPAC SmallCap Index (formerly, the S&P/Citigroup EMI EPAC Index) is an unmanaged float-adjusted index which captures the bottom 15% of companies in the developed European and Pacific markets, based on the cumulative market capitalization of each country, within the S&P Global Broad Market Index, which covers all publicly listed equities in 47 countries with a float adjusted market capitalization of US $100 million or greater and a minimum annual trading liquidity of US $50 million. |
| (6) | Net return for index is shown from November 1, 2001. |
| (7) | Since inception performance for the indices is shown from January 1, 2006. |
| (8) | Since inception performance for the indices is shown from June 1, 2008. |
| (9) | Since inception performance for the indices is shown from February 1, 2008. |
Prior to March 1, 2005, the Fund was advised by a different sub-adviser.
35
ING International Value Fund
Portfolio Managers’ Report
Country Allocation
as of October 31, 2008
(as a percent of net assets)
Portfolio holdings are subject to change daily.
ING International Value Fund (the “Fund”) seeks long-term capital appreciation. The Fund’s assets are managed by two sub-advisers — Brandes Investment Partners, L.P. (“Brandes”) and ING Investment Management Co. (“ING IM”)(1). Each manages a portion of the Fund’s assets that is allocated to the sub-adviser. The following people are responsible for the day-to-day operations of the Fund: Glenn R. Carlson, CFA, Chief Executive Officer, Brent V. Woods, CFA, Managing Director — Investments, Amelia Maccoun Morris, CFA, Director — Investments, Brent Fredberg, Senior Analyst, James Brown, CFA, Director — Investments and Keith Colestock, CFA, Director — Investments, comprise the voting members of Brandes’ Large Cap Investment Committee; Philip Schwartz is the Portfolio Manager for ING IM.
Performance: For the year ended October 31, 2008, the Fund’s Class A shares, excluding sales charges, provided a total return of (42.58)% compared to the Morgan Stanley Capital International — Europe, Australasia and Far East® Index (“MSCI EAFE® Index”)(2), which returned (46.62)% for the same period.
Portfolio Specifics: Brandes — The greatest overall detractors from performance during the period were holdings in the commercial banks industry. Mizuho Financial Group, Inc. (Japan) and Royal Bank of Scotland (United Kingdom) were key detractors within this industry. Positions in the diversified telecommunication services, communications equipment, and insurance industries also registered declines during the period. From these industries Telecom Italia Capital S.p.A. (Italy — diversified telecommunication services), Alcatel SA (France — communications equipment), and Aegon NV (Netherlands — insurance) performance weighed on returns.
Amid worldwide declines, Japan-based holdings proved the greatest detriment to overall results during the period, including Aiful Corp. (consumer finance) and Mitsubishi UFJ Financial Group, Inc. (commercial banks). In addition, positions based in the United Kingdom, France, and the Netherlands experienced stock price declines during the period. Holdings from these countries that experienced negative performance included ITV PLC (United Kingdom — media), Sanofi-Aventis (France — pharmaceuticals), and STMicroelectronics NV (Netherlands — semiconductors & semiconductor equipment). As of October 31, 2008 the Fund’s most substantial weightings were in Japan and the diversified telecommunication services industry.
On an industry basis, the Fund’s overweight allocation and stock selection for holdings in the diversified telecommunication services industry helped drive relative performance. Conversely, the Fund’s communications equipment industry holdings proved the greatest detriment to overall results during the period. The Fund’s lack of exposure to the oil, gas & consumable fuels industry also negatively impacted relative performance. In addition, the Fund’s selection within the food & staples retailing industry also helped performance. The Fund’s weightings are the product of a company-by-company search and not the product of “top down” forecasts or opinions.
ING IM — ING Investment Management began sub-advising a portion of the Fund’s portfolio in late October; this portion was fully funded on October 27, 2008. Returns for the four-day period ended October 31, 2008 were led by positive selection within information technology: Canon, Inc. a Japanese manufacturer of business machines, cameras and optical products, was the top contributor to results. The Fund’s overweight and strong security selection in the energy sector helped to bolster performance. The Fund’s energy positions, including Petroleo Brasileiro SA ADR, Total SA, BP PLC ADR and ENI S.p.A., were all up over 20% for the week. Within health care, a position in AstraZeneca PLC proved effective. However, selection within the telecommunications sector, specifically the Fund’s position in Nippon Telegraph and Telephone Corp., detracted from the result.
Current Strategy and Outlook: Brandes — During the twelve months ended October 31, 2008, the Fund’s country and industry exposures shifted slightly due to stock-specific buying and selling, as well as changes in the prices of holdings. For example, exposure to Japan and the pharmaceuticals industry increased, while exposure to Germany and the automobiles industry declined. In fact, we sold both automobile positions during the period. Overall, while we offer no predictions regarding the short-term direction of international equity markets, we believe the Fund remains well positioned to deliver favorable long-term results. We continue to believe that all holdings may be undervalued and consequently could appreciate if our assessment of their true worth is ultimately recognized by the market. ING IM — Going forward, we look to capitalize upon opportunities that the recent market dislocation has provided. Despite abating inflationary concerns, risks to the upside remain, as investors gauge the level of systemic risk that is inherent in the global economy. On the upside, however, we believe central banks have responded in a coordinated fashion, mitigating the potential for a severe downturn. We will seek further opportunities across a wide array of markets.
| |
| (1) | ING IM began managing its portion of the Fund effective October 27, 2008 and the Fund will reopen to the public effective November 3, 2008. |
| |
| (2) | The MSCI EAFE® Index is an unmanaged index that measures the performance of securities listed on exchanges in Europe, Australasia and the Far East. It includes the reinvestment of dividends net of withholding taxes, but does not reflect fees, brokerage commissions or other expenses of investing. |
Portfolio holdings and characteristics are subject to change and may not be representative of current holdings and characteristics. The outlook for this Fund may differ from that presented for other ING Funds. Performance for the different classes of shares will vary based on differences in fees associated with each class.
Top Ten Holdings*
as of October 31, 2008
(as a percent of net assets)
| | | | | |
| Deutsche Telekom AG | | | 3.1 | % |
| Sanofi-Aventis | | | 3.0 | % |
| Mitsubishi UFJ Financial Group, Inc. | | | 2.6 | % |
| Telefonaktiebolaget LM Ericsson | | | 2.3 | % |
| Mizuho Financial Group, Inc. | | | 2.1 | % |
| Portugal Telecom SGPS SA | | | 2.0 | % |
| Carrefour SA | | | 2.0 | % |
| Ono Pharmaceutical Co., Ltd. | | | 2.0 | % |
| Mitsui Sumitomo Insurance Group Holdings, Inc. | | | 2.0 | % |
| AstraZeneca PLC | | | 1.9 | % |
| | | |
| | * | Excludes short-term investments related to securities lending collateral. | |
Portfolio holdings are subject to change daily.
36
ING International Value Fund
Portfolio Managers’ Report
| | | | | | | | | | | | | | | | | | | | | |
| Average Annual Total Returns for the Periods Ended October 31, 2008 |
| | | | | | | | | Since Inception
| | Since Inception
|
| | | | | | | | | of Class I
| | of Class Q
|
| | | 1 Year | | 5 Year | | 10 Year | | June 18, 2001 | | January 24, 2000 |
| |
Including Sales Charge: | | | | | | | | | | | | | | | | | | | | |
Class A(1) | | | (45.88 | )% | | | 3.39 | % | | | 6.22 | % | | | — | | | | — | |
Class B(2) | | | (45.40 | )% | | | 3.63 | % | | | 6.10 | % | | | — | | | | — | |
Class C(3) | | | (43.42 | )% | | | 3.93 | % | | | 6.11 | % | | | — | | | | — | |
| Class I | | | (42.37 | )% | | | 5.03 | % | | | — | | | | 4.07 | % | | | — | |
| Class Q | | | (42.38 | )% | | | 4.86 | % | | | — | | | | — | | | | 3.19 | % |
Excluding Sales Charge: | | | | | | | | | | | | | | | | | | | | |
| Class A | | | (42.58 | )% | | | 4.62 | % | | | 6.85 | % | | | — | | | | — | |
| Class B | | | (43.00 | )% | | | 3.90 | % | | | 6.10 | % | | | — | | | | — | |
| Class C | | | (42.94 | )% | | | 3.93 | % | | | 6.11 | % | | | — | | | | — | |
| Class I | | | (42.37 | )% | | | 5.03 | % | | | — | | | | 4.07 | % | | | — | |
| Class Q | | | (42.38 | )% | | | 4.86 | % | | | — | | | | — | | | | 3.19 | % |
MSCI EAFE® Index(4) | | | (46.62 | )% | | | 3.60 | % | | | 1.67 | % | | | 2.05 | %(5) | | | (1.10 | )%(6) |
Based on a $10,000 initial investment, the graph and table above illustrate the total return of ING International Value Fund against the index indicated. The Index is unmanaged and has no cash in its portfolio, imposes no sales charge and incurs no operating expenses. An investor cannot invest directly in the index. The Fund’s performance is shown both with and without the imposition of sales charges.
The graph and performance table do not reflect the deduction of taxes that a shareholder will pay on Fund distributions or the redemption of Fund shares.
The performance shown may include the effect of the fee waivers and/or expense reimbursements by the Investment Adviser and/or other service providers, which have the effect of increasing total return. Had all fees and expenses been considered, the total returns would have been lower.
The performance data represents past performance and is no assurance of future results. Investment return and principal value of an investment in the Fund will fluctuate. Shares, when sold, may be worth more or less than their original cost. The Fund’s current performance may be lower or higher than the performance data shown. Please log on to www.ingfunds.com or call (800) 992-0180 to get performance through the most recent month end.
This report contains statements that may be “forward-looking” statements. Actual results may differ materially from those projected in the “forward-looking” statements.
The views expressed in this report reflect those of the portfolio managers, only through the end of the period as stated on the cover. The portfolio managers’ views are subject to change at any time based on market and other conditions.
Fund holdings are subject to change daily.
| |
| (1) | Reflects deduction of the maximum Class A sales charge of 5.75%. |
| (2) | Reflects deduction of the Class B deferred sales charge of 5% and 2%, respectively, for the 1 year and 5 year returns. |
| (3) | Reflects deduction of the Class C deferred sales charge of 1% for the 1 year return. |
| (4) | The MSCI EAFE® Index is an unmanaged index that measures the performance of securities listed on exchanges in Europe, Australasia and the Far East. It includes the reinvestment of dividends net of withholding taxes, but does not reflect fees, brokerage commissions or other expenses of investing. |
| (5) | Since inception performance for index is shown from July 1, 2001. |
| (6) | Since inception performance for index is shown from February 1, 2000. |
37
ING International Value Choice Fund
Portfolio Managers’ Report
Country Allocation
as of October 31, 2008
(as a percent of net assets)
Portfolio holdings are subject to change daily.
ING International Value Choice Fund (the “Fund”) seeks long term capital appreciation. The Fund is managed by Paul J. Hechmer, Portfolio Manager of Tradewinds Global Investors, LLC — the Sub-Adviser.
Performance: For the year ended October 31, 2008, the Fund’s Class A shares, excluding sales charges, provided a total return of (40.21)% compared to the Morgan Stanley Capital International — Europe, Australasia, Far East® Index(1) (“MSCI EAFE® Index”), which returned (46.62)% for the same period.
Portfolio Specifics: The Fund was down for the year ending October 31, 2008 but fared better than the MSCI EAFE® Index for the same period. Up until late 2007, the MSCI EAFE® Index had enjoyed nine consecutive calendar quarters of positive performance. Over this reporting period, global markets reversed course and posted significant negative returns, experienced periods of extreme volatility and culminated in a broad based sell-off.
The portfolio benefited from relative performance of individual holdings in several sectors including consumer staples, industrials, information technology and telecommunication services. From a regional perspective, our overweight exposure to Japan and our underweight to Europe (and therefore European currencies) helped relative returns as the yen appreciated significantly versus the euro and the Japanese Topix Index outperformed the European markets. In addition our stock selection in Japan was strong with names such as Seven & I Holdings Co., Ltd and Toppan Printing Co., Ltd. adding value.
Our longstanding underweight to financials continued to help us, as this area dominated the headlines, and was the largest overall contributor to relative returns. This contribution was derived primarily from our underweight in the sector rather than stock selection. The significant drop in this sector has allowed us to continue to increase our exposure from previous very low levels.
The Fund was also aided by a timely sale of Chunghwa Telecom Co., Ltd. in Taiwan and good relative performance of Gemalto NV in Europe.
The Fund’s allocation to and holdings in the energy sector were the largest detractor from relative performance. The markets did not differentiate much between the higher beta exploration and production companies and their presumably more defensive integrated brethren such as Royal Dutch Shell PLC and BP PLC, the Anglo-Dutch and British diversified energy companies. It is interesting to note that many energy stocks are down considerably more than the price depreciation of oil for the year.
Euro weakness favored our Finnish based paper companies, UPM Kymmene and Stora Enso OYJ, which bounced back strongly, toward the end of the period. Elsewhere in the materials sector, some of our holdings in the precious metals area helped, at least on a relative basis while others hurt. We were particularly hurt by our South African mining companies Anglogold Ashanti Ltd. ADR and Goldfields, and also by Apex Silver Mines Ltd. Overall, we believe our gold holdings continue to offer excellent value on an absolute basis. It is well worth noting that, even though the gold price fell about 14% for the period, the broad Philadelphia Gold and Silver index was down over 57% in the same time period.
Current Strategy and Outlook: It is somewhat trite to say that the markets clearly look more attractive to us now than at anytime in the past 5 years. But obviously that is the case. For the first time in at least 25 years (save one very brief period in early 2003), the non-financials European dividend yield is higher than the Pan-Euro bond yield. Further, we are starting to see the emergence of the so called “net-net” companies in Europe (they have existed on a small scale in Japan for a couple of years, and their numbers are growing rapidly). These are companies that sell for less than the net cash on their balance sheets, so that in a liquidation, you get the operations for free. Just as stocks overshoot to the upside, they often overdo it coming down. Increasingly, we see companies that appear to have “overdone it.” Top down concerns notwithstanding, it’s becoming easier and easier to become a “bull.” Our focus on providing superior risk adjusted returns over the long term is unchanged.
| |
| (1) | The MSCI EAFE® Index is an unmanaged index that measures the performance of securities listed on exchanges in markets in Europe, Australasia and the Far East. It includes the reinvestment of dividends net of withholding taxes, but does not reflect fees, brokerage commissions or other expenses of investing. |
Portfolio holdings and characteristics are subject to change and may not be representative of current holdings and characteristics. The outlook for this Fund may differ from that presented for other ING Funds. Performance for the different classes of shares will vary based on differences in fees associated with each class.
Top Ten Holdings
as of October 31, 2008
(as a percent of net assets)
| | | | | |
| Sanofi-Aventis | | | 4.1 | % |
| Dai Nippon Printing Co., Ltd. | | | 3.9 | % |
| Royal Dutch Shell PLC ADR – Class B | | | 3.8 | % |
| Stora Enso OYJ (Euro Denominated Security) | | | 3.7 | % |
| Nippon Telegraph & Telephone Corp. ADR | | | 3.4 | % |
| Anglogold Ashanti Ltd. ADR | | | 3.3 | % |
| Fuji Photo Film Co., Ltd. | | | 3.1 | % |
| Mabuchi Motor Co., Ltd. | | | 3.0 | % |
| Nippon Oil Corp. | | | 2.8 | % |
| Newmont Mining Corp. | | | 2.7 | % |
Portfolio holdings are subject to change daily.
38
ING International Value Choice Fund
Portfolio Managers’ Report
| | | | | | | | | | | | | | | | | |
| Average Annual Total Returns for the Periods Ended October 31, 2008 |
| | | | | Since Inception
| | Since Inception
| | Since Inception
|
| | | | | of Classes A and B
| | of Class C
| | of Class I
|
| | | 1 Year | | February 1, 2005 | | February 4, 2005 | | December 21, 2005 |
| |
Including Sales Charge: | | | | | | | | | | | | | | | | |
Class A(1) | | | (43.66 | )% | | | (3.43 | )% | | | — | | | | — | |
Class B(2) | | | (43.16 | )% | | | (3.27 | )% | | | — | | | | — | |
Class C(3) | | | (41.12 | )% | | | — | | | | (2.62 | )% | | | — | |
| Class I | | | (39.96 | )% | | | — | | | | — | | | | (6.26 | )% |
Excluding Sales Charge: | | | | | | | | | | | | | | | | |
| Class A | | | (40.21 | )% | | | (1.89 | )% | | | — | | | | — | |
| Class B | | | (40.63 | )% | | | (2.63 | )% | | | — | | | | — | |
| Class C | | | (40.62 | )% | | | — | | | | (2.62 | )% | | | — | |
| Class I | | | (39.96 | )% | | | — | | | | — | | | | (6.26 | )% |
MSCI EAFE® Index(4) | | | (46.62 | )% | | | (2.28 | )% | | | (2.28 | )%(5) | | | (7.86 | )%(6) |
Based on a $10,000 initial investment, the graph and table above illustrate the total return of ING International Value Choice Fund against the index indicated. The index is unmanaged and has no cash in its portfolio, imposes no sales charge and incurs no operating expenses. An investor cannot invest directly in the index. The Fund’s performance is shown both with and without the imposition of sales charges.
The graph and performance table do not reflect the deduction of taxes that a shareholder will pay on Fund distributions or the redemption of Fund shares.
The performance shown may include the effect of fee waivers and/or expense reimbursements by the Investment Adviser and/or other service providers, which have the effect of increasing total return. Had all fees and expenses been considered, the total returns would have been lower.
Performance data represents past performance and is no assurance of future results. Investment return and principal value of an investment in the Fund will fluctuate. Shares, when sold, may be worth more or less than their original cost. The Fund’s current performance may be lower or higher than the performance data shown. Please log on to www.ingfunds.com or call (800) 992-0180 to get performance through the most recent month end.
It is important to note that the Fund has a limited operating history. Performance over a longer period of time may be more meaningful than short-term performance.
This report contains statements that may be “forward-looking” statements. Actual results may differ materially from those projected in the “forward-looking” statements.
The views expressed in this report reflect those of the portfolio managers, only through the end of the period as stated on the cover. The portfolio managers’ views are subject to change at any time based on market and other conditions.
Fund Holdings are subject to change daily.
| |
| (1) | Reflects deduction of the maximum Class A sales charge of 5.75%. |
| (2) | Reflects deduction of the Class B deferred sales charge of 5% and 3%, respectively, for the 1 year and since inception returns. |
| (3) | Reflects deduction of the Class C deferred sales charge of 1% for the 1 year return. |
| (4) | The MSCI EAFE® Index is an unmanaged index that measures the performance of securities listed on exchanges in markets in Europe, Australasia and the Far East. It includes the reinvestment of dividends net of withholding taxes, but does not reflect fees, brokerage commissions or other expenses of investing. |
| (5) | Since inception performance for index is shown from February 1, 2005. |
| (6) | Since inception performance for index is shown from January 1, 2006. |
39
ING Russia Fund
Portfolio Managers’ Report
Industry Allocation
as of October 31, 2008
(as a percent of net assets)
Portfolio holdings are subject to change daily.
ING Russia Fund (the “Fund”) seeks long-term capital appreciation through investment primarily in equity securities of Russian companies. The Fund is managed by Jan-Wim Derks, Gus Robertson and Remco Vergeer(1) of ING Investment Management Advisors, B.V. — the Sub-Adviser.
Performance: For the year ended October 31, 2008, the Fund’s Class A shares, excluding sales charges, provided a total return of (61.70)% compared to the Morgan Stanley Capital International Emerging Markets (“MSCI EM”) Indexsm(2) and the Russian Trading System (“RTS”) Index(3), which returned (56.35)% and (65.00)%, respectively, for the same period.
Portfolio Specifics: The Russian equity market recovered in the second half of 2007 when it became clear that the Presidential elections of December would not change the leadership in the country. President Putin named Dmitry Medvedev as his successor, while he assumed the position of Prime Minister. The last few months of 2007 were particularly strong months for Russian equities, because of both falling political risk and the strengthening risk appetite in global markets.
In January 2008, equities came down as inflation fears increased, wiping out much of the gains of the last quarter of 2007. The Russian market recovered again in May, and even reached a new historic high on the back of corporate tax cuts for Russia’s ailing energy sector. Then, in a bid to reduce inflationary pressures, the government told several large companies to desist from raising prices for consumers. Steel maker Mechel OAO was the main victim of this increasing state interference.
The war with Georgia created more doubts about the Russian investment climate, as relations with the West deteriorated sharply. Since the summer, Russian equities have fallen faster than other emerging markets. The main concern has been the dire state of the Russian financial sector, which has suffered deeply from the global credit crisis.
The Fund’s underweight in the energy sector helped in the first part of the fiscal year but detracted from results for the fiscal year as a whole. The domestic-demand-related stocks performed well, as investment and consumption growth reached record-high levels. The energy sector was not able to benefit from rising oil prices, as high taxes and the strong ruble affected corporate profitability. In the last few months of the period, Fund performance benefited from our preference for large cap stocks and defensive sectors such as telecom and consumer staples.
On a stock level, the Fund’s position in Pharmastandard was among the biggest contributors to the performance. Pharmastandard, a generic pharmaceutical producer, was a good relative performer thanks to the defensive nature of its sector and the increasing healthcare spending in Russia.
Current Outlook and Strategy: For the next few quarters, investors will focus on the banking system and the government’s attempts to bring confidence back. It would be good news if the authorities would use the current crisis situation to force a serious consolidation in the banking sector. In our opinion, if regulation is tightened at the same time, the system could come out of this crisis stronger than it was before. We believe it probably will take quarters, perhaps years, before confidence is restored and credit growth starts recovering. One of the risks that could put the equity market under more pressure in coming months or quarters is a possible ruble devaluation. So far, the Russian authorities have been able to keep the ruble stable relative to the basket of euros and dollars they use as a reference point. But after having spent more than 20% of total foreign exchange reserves in only a few months time, it is becoming increasingly unlikely that this strategy is sustainable. A cheaper ruble would help to prevent balance of payment problems at a later stage, but it would also lead to more inflationary pressure.
| |
| (1) | Mr. Vergeer was added as a portfolio manager to the Fund effective May 1, 2008. |
| (2) | The MSCI EM Indexsm is an unmanaged index that measures the performance of securities listed on exchanges in developing nations throughout the world. It includes the reinvestment of dividends net of withholding taxes, but does not reflect fees, brokerage commissions or other expenses of investing. |
| (3) | The RTS Index is a capitalization-weighted index that is calculated in U.S. dollars. The index tracks the performance of Russia’s most active stocks traded on the RTS. The index is operated by the National Association of Participants in the Securities Markets, a non-profit body. |
Portfolio holdings and characteristics are subject to change and may not be representative of current holdings and characteristics. The outlook for this Fund may differ from that presented for other ING Funds.
Top Ten Holdings*
as of October 31, 2008
(as a percent of net assets)
| | | | | |
| Lukoil-Spon ADR | | | 13.7 | % |
| OAO Rosneft Oil Co. GDR | | | 9.0 | % |
| OAO Gazprom | | | 8.0 | % |
| Surgutneftegaz ADR | | | 5.8 | % |
| Novatek OAO GDR | | | 5.4 | % |
| MMC Norilsk Nickel ADR | | | 4.2 | % |
| Sberbank RF | | | 4.2 | % |
| VTB Bank OJSC GDR | | | 3.6 | % |
| Tatneft GDR | | | 3.1 | % |
| OAO Gazprom ADR | | | 2.9 | % |
| | | |
| | * | Excludes short-term investments related to securities lending collateral. | |
Portfolio holdings are subject to change daily.
40
ING Russia Fund
Portfolio Managers’ Report
| | | | | | | | | | | | | |
| Average Annual Total Returns for the Periods Ended October 31, 2008 |
| | | 1 Year | | 5 Year | | 10 Year |
| |
Including Sales Charge: | | | | | | | | | | | | |
Class A(1) | | | (63.91 | )% | | | 9.18 | % | | | 28.34 | % |
Excluding Sales Charge: | | | | | | | | | | | | |
| Class A | | | (61.70 | )%(2) | | | 10.48 | % | | | 29.11 | % |
MSCI EM IndexSM(3) | | | (56.35 | )% | | | 9.51 | %(4) | | | 10.05 | % |
RTS Index(5) | | | (65.00 | )% | | | 9.74 | % | | | 29.64 | % |
Based on a $10,000 initial investment, the graph and table above illustrate the total return of ING Russia Fund against the indices indicated. An index is unmanaged and has no cash in its portfolio, imposes no sales charge and incurs no operating expenses. An investor cannot invest directly in an index. The Fund’s performance is shown both with and without the imposition of sales charges.
The graph and performance table do not reflect the deduction of taxes that a shareholder will pay on Fund distributions or the redemption of Fund shares.
The performance shown may include the effect of fee waivers and/or expense reimbursements by the Investment Adviser and/or other service providers, which have the effect of increasing total return. Had all fees and expenses been considered, the total returns would have been lower.
Performance data represents past performance and is no assurance of future results. Investment return and principal value of an investment in the Fund will fluctuate. Shares, when sold, may be worth more or less than their original cost. The Fund’s current performance may be lower or higher than the performance data shown. Please log on to www.ingfunds.com or call (800) 992-0180 to get performance through the most recent month end.
This report contains statements that may be “forward-looking” statements. Actual results may differ materially from those projected in the “forward-looking” statements.
The views expressed in this report reflect those of the portfolio managers, only through the end of the period as stated on the cover. The portfolio managers’ views are subject to change at any time based on market and other conditions.
Fund holdings are subject to change daily.
| |
| * | The graph above illustrates the gross returns for the MSCI EM IndexSM for the first three years of the ten year period and net index returns for last seven years of the ten year period. |
| |
| (1) | Reflects deduction of the maximum Class A sales charge of 5.75%. |
| |
| |
| (2) | Redemptions on shares held less than 365 days are subject to a redemption fee of 2% of the redemption proceeds. |
| |
| |
| (3) | The MSCI EM IndexSM is an unmanaged index that measures the performance of securities listed on exchanges in developing nations throughout the world. It includes the reinvestment of dividends net of withholding taxes, but does not reflect fees, brokerage commissions or other expenses of investing. |
| |
| |
| (4) | Net return for index is shown from November 1, 2001. |
| |
| |
| (5) | The RTS Index is a capitalization-weighted index that is calculated in U.S. dollars. The index tracks the performance of Russia’s most active stocks traded on the RTS. The index is operated by the National Association of Participants in the Securities Markets, a non-profit body. |
41
ING Emerging Markets Fixed Income Fund
Portfolio Managers’ Report
Country Allocation
as of October 31, 2008
(as a percent of net assets)
Portfolio holdings are subject to change daily.
ING Emerging Markets Fixed Income Fund (the “Fund”) seeks to maximize total return. The Fund is managed by Gorky Urquieta, Senior Investment Manager and Daniel Eustaquio, Senior Portfolio Manager, of ING Investment Management Advisors, B.V. — the Sub-Adviser.
Performance: For the year ended October 31, 2008, the Fund’s Class A shares, excluding sales charges, provided a total return of (31.16)% compared to the JPMorgan Emerging Markets Bond Index Global Diversified(1) (“JPMorgan EMB Index Global Diversified”), which returned (20.22)% for the same period.
Portfolio Specifics: The reporting period was negative for every risky asset class. The financial crisis spread out over the globe and caused more and more casualties (e.g., Bear Stearns, AIG and Lehman Brothers). A real distrust in the global financial system emerged as inter bank lending came to a halt. The impact of this financial crisis on the real economy became clear at the end of the reporting period. We believe the developed world will enter a recession, whereas emerging markets will see a sharp slowdown in growth.
Although emerging market assets have outperformed risky assets in the developed world for quite some time, the last two months were among the most negative periods ever for emerging market debt. The global financial crisis prompted a massive sell-off of emerging market assets. The process was made worse because of forced selling by leveraged investors.
Overall, spreads on emerging market debt widened sharply, with corporate bonds underperforming government bonds. Currencies of emerging markets came under substantial pressure as well, particularly those markets that are commodity exporters. Finally, local bonds saw an increase in yield although the magnitude of the absolute performance was less negative than hard currency bonds.
Over the reporting period the Fund underperformed the benchmark. One of the main drivers of underperformance was the Fund’s overweight in higher beta countries such as Argentina and Venezuela, the negative effects of which were compounded by political instability in those countries. Currency exposures in Turkey, Hungary and Mexico also detracted from results. The Fund’s credit risk overweight (i.e., lower than benchmark credit quality) and corporate instrument selection (mostly in Russia, Ukraine and Kazakhstan) suffered from the market turmoil as well. Exposure to financial issues also hurt results.
Current Strategy and Outlook: The Fund’s duration is now lower than the benchmark. The portfolio is geared towards countries with net creditor positions, large foreign reserves, current account surpluses and stronger fiscal profiles. The ability to pay of these countries is strong, while their reliance on additional funding is limited. We believe that markets are to some extent dislocated from payment ability and therefore we prefer to hold on to these positions. Furthermore, we are holding on to the Fund’s quasi-sovereign and corporate overweight, as current valuations are attractive in the medium term. With regard to local bond positions, we believe opportunities and inflation pressures are likely to be subdued. In our opinion, lower growth is likely to open the door to interest rate cuts.
| |
| (1) | The JPMorgan EMB Index Global Diversified is a uniquely-weighted version of the Emerging Markets Bond Index Global. It limits the weights of those index countries with larger debt stocks by only including specified portions of these countries’ eligible current face amounts of debt outstanding. |
Portfolio holdings and characteristics are subject to change and may not be representative of current holdings and characteristics. The outlook for this Fund may differ from that presented for other ING Funds. Performance for the different classes of shares will vary based on differences in fees associated with each class.
Top Ten Holdings
as of October 31, 2008
(as a percent of net assets)
| | | | | |
| | | | | |
| Mexican Bonos, 7.750%, due 12/14/17 | | | 4.8 | % |
| | | | | |
| Malaysia Government International Bond, 4.240%, due 02/07/18 | | | 3.6 | % |
| | | | | |
| Federal Republic of Brazil, 12.500%, due 01/05/16 | | | 2.8 | % |
| | | | | |
| Hungary Government International Bond, 6.750%, due 02/12/13 | | | 2.5 | % |
| | | | | |
| Republic of Iraq, 5.800%, due 01/15/28 | | | 2.0 | % |
| | | | | |
| Petroleos de Venezuela SA, 5.375%, due 04/12/27 | | | 1.9 | % |
| | | | | |
| JPMorgan Chase London, Discount Note, due 06/17/21 | | | 1.9 | % |
| | | | | |
| Russia Government International Bond, 7.500%, due 03/31/30 | | | 1.8 | % |
| | | | | |
| KazMunaiGaz Finance Sub BV, 9.125%, due 07/02/18 | | | 1.7 | % |
| | | | | |
| Turkey Government International Bond, 16.000%, due 03/07/12 | | | 1.6 | % |
Portfolio holdings are subject to change daily.
42
ING Emerging Markets Fixed Income Fund
Portfolio Managers’ Report
| | | | | | | | | | | | | | | | | | | |
| Average Annual Total Returns for the Periods Ended October 31, 2008 |
| | | | | Since Inception
| | Since Inception
| | Since Inception
| | Since Inception
|
| | | | | of Class A
| | of Class B
| | of Class C
| | of Class I
|
| | | 1 Year | | December 21, 2005 | | January 4, 2006 | | March 1, 2006 | | February 7, 2006 |
| |
Including Sales Charge: | | | | | | | | | | | | | | | | | | |
Class A(1) | | (32.91)% | | | (9.15) | % | | | | | | | | | | | | |
Class B(2) | | (34.90)% | | | | | | | (9.36) | % | | | | | | | | |
Class C(3) | | (32.34)% | | | | | | | | | | | (10.35) | % | | | | |
| Class I | | (30.95)% | | | | | | | | | | | | | | | (16.15) | % |
Excluding Sales Charge: | | | | | | | | | | | | | | | | | | |
| Class A | | (31.16)% | | | (7.25) | % | | | | | | | | | | | | |
| Class B | | (31.67)% | | | | | | | (8.53) | % | | | | | | | | |
| Class C | | (31.69)% | | | | | | | | | | | (10.35) | % | | | | |
| Class I | | (30.95)% | | | | | | | | | | | | | | | (16.15) | % |
JPMorgan EMB Index Global Diversified(4) | | (20.22)% | | | (2.63) | %(5) | | | (2.63) | %(5) | | | (4.01) | % | | | (8.84) | %(6) |
Based on a $10,000 initial investment, the graph and table above illustrate the total return of ING Emerging Markets Fixed Income Fund against the index indicated. The index is unmanaged and has no cash in its portfolio, imposes no sales charge and incurs no operating expenses. An investor cannot invest directly in the index. The Fund’s performance is shown both with and without the imposition of sales charges.
The graph and performance table do not reflect the deduction of taxes that a shareholder will pay on Fund distributions or the redemption of Fund shares.
The performance shown may include the effect of fee waivers and/or expense reimbursements by the Investment Adviser and/or other service providers, which have the effect of increasing total return. Had all fees and expenses been considered, the total returns would have been lower.
Performance data represents past performance and is no assurance of future results. Investment return and principal value of an investment in the Fund will fluctuate. Shares, when sold, may be worth more or less than their original cost. The Fund’s current performance may be lower or higher than the performance data shown. Please log on to www.ingfunds.com or call (800) 992-0180 to get performance through the most recent month end.
It is important to note that the fund has a limited operating history. Performance over a longer period of time may be more meaningful than short-term performance.
This report contains statements that may be “forward-looking” statements. Actual results may differ materially from those projected in the “forward-looking” statements.
The views expressed in this report reflect those of the portfolio managers, only through the end of the period as stated on the cover. The portfolio managers’ views are subject to change at any time based on market and other conditions.
Fund holdings are subject to change daily.
| |
| (1) | Effective July 31, 2006, the maximum Class A sales charge was lowered to 2.50%. Return calculations with a starting date prior to July 31, 2006 are based on a 5.75% sales charge, while returns with a starting date on or after July 31, 2006 are based on a 2.50% sales charge. |
| (2) | Reflects deduction of the Class B deferred sales charge of 5% and 3%, respectively, for the 1 year and since inception returns. |
| (3) | Reflects deduction of the Class C deferred sales charge of 1% for the 1 year return. |
| (4) | The JPMorgan EMB Index Global Diversified is a uniquely-weighted version of the Emerging Markets Bond Index Global. It limits the weights of those index countries with larger debt stocks by only including specified portions of these countries’ eligible current face amounts of debt outstanding. |
| (5) | Since inception performance for index is shown from January 1, 2006. |
| (6) | Since inception performance for index is shown from January 1, 2007. |
43
ING Global Bond Fund
Portfolio Managers’ Report
Investment Type Allocation
as of October 31, 2008
(as a percent of net assets)
Portfolio holdings are subject to change daily.
ING Global Bond Fund (the “Fund”) seeks to maximize total return through a combination of current income and capital appreciation. The Fund is managed by James B. Kauffmann, Portfolio Manager of ING Investment Management Co. — the Sub-Adviser.
Performance: For the year ended October 31, 2008, the Fund’s Class A shares, excluding sales charges, provided a total return of 3.04% compared to the Lehman Brothers Global Aggregate Index(1) (the “Index”), which returned (2.57)% for the same period.
Portfolio Specifics: The collapse of the U.S. sub-prime mortgage market and the reversal of the housing boom escalated into a full-blown global financial crisis in 2008. Defaults and foreclosures not only caused banks to lose billions of dollars on securities tied to these mortgages but banks also lost any incentive to lend, and credit for consumers and businesses vanished. As losses mounted and the cost of borrowing skyrocketed, many large financial institutions began to fail or merge.
The financial crisis took on a more global scale in September, as Lehman Brothers filed for bankruptcy and Merrill Lynch was taken over by Bank of America. As confidence plummeted and volatility spiked, governments around the world were forced to inject billions of dollars into various rescue packages. Leverage continued to be unwound rapidly amid fear and illiquidity, causing all financial asset prices except government bonds to plummet. An official recession was confirmed in both the eurozone and Japan after both markets contracted in the second and third quarters.
Emerging economies suffered as investors rapidly withdrew money. The currencies of these countries depreciated sharply, falling on average 25% versus the U.S. dollar. The U.S. was perceived to be ahead of the curve and other countries were seen as having further to go in their respective downturns. Only the Japanese yen outperformed the dollar, appreciating as investors unwound levered trades.
Fund performance was attributed to having overweight exposure to interest rates in various global markets. In the United States, the Fund was overweight the two-year sector and underweight longer-dated maturities, and thus benefited from the steepening of the yield curve as shorter maturities outperformed longer maturities. The Fund was also positioned for and benefited from similar moves in global yield curves, including Germany, Canada, the UK, Australia and New Zealand.
Through the first half of the year the Fund benefited from being overweight the Australian dollar, the euro and the British pound. With fear returning to the markets around mid-year, the Fund gained by underweighting the Australian, Canadian and New Zealand dollars. We also positioned the Fund for emerging market weakness during the second half of the year — the Fund benefited from net short exposures to the Hungarian forint and the Russian ruble.
Another significant contributor to performance was a sizeable underweight to global credit over the past year. As financial institutions and investors alike exited corporate bonds and mortgage-backed securities, their prices suffered dramatic losses, and the Fund gained from owning fewer of these assets than the benchmark.
Current Strategy and Outlook: The global economy is entering recession, and most countries are now showing signs of significant slowdown. The International Monetary Fund recently revised its outlook to include the first contraction of growth in the developed economies as a whole since World War II. We foresee a deep recession in the United States. The economy will not recover anytime soon, as we still have not felt the full effects of the troubles and leverage at major financial entities, a dreadful housing market, a frozen credit market and plunging consumer confidence. A banking crisis and recession in the developed world should lead to further declines in energy, metal and agricultural prices.
We expect most major central banks outside the U.S. to continue to lower short-term rates. If the European Central Bank continues to focus on price stability instead of aggressively easing its interest rate, this reluctance could lead to an even deeper and more drawn-out downturn in eurozone growth. We also will be watching central bank actions and markets in Australia and New Zealand, where we see more easing to come than the market is currently pricing.
Risk-taking has been a cornerstone of our economy and a reason for its growth. We believe this environment will lead to reduced risk-taking by financial institutions, large corporations and the global population in general.
| |
| (1) | The Lehman Brothers Global Aggregate Index provides a broad based measure of the global investment-grade fixed income markets. The three major components of this index are the U.S. Aggregate, the Pan-European Aggregate, and the Asian-Pacific Aggregate Indices. |
Portfolio holdings and characteristics are subject to change and may not be representative of current holdings and characteristics. The outlook for this Fund may differ from that presented for other ING Funds. Performance for the different classes of shares will vary based on differences in fees associated with each class.
Top Ten Holdings*
as of October 31, 2008
(as a percent of net assets)
| | | | | |
| | | | | |
| Canadian Government International Bond, 2.750%, due 12/01/10 | | | 14.1 | % |
| | | | | |
| U.S. Treasury Note, 1.500%, due 10/31/10 | | | 8.7 | % |
| | | | | |
| Bundesobligation, 3.500%, due 04/08/11 | | | 8.1 | % |
| | | | | |
| Bundesobligation, Discount Note, due 10/11/13 | | | 4.6 | % |
| | | | | |
| United Kingdom Gilt Bond, 4.750%, due 06/07/10 | | | 4.4 | % |
| | | | | |
| Federal National Mortgage Association, 6.000%, due 11/15/33 | | | 4.0 | % |
| | | | | |
| Federal National Mortgage Association, 5.500%, due 11/13/33 | | | 3.5 | % |
| | | | | |
| U.S. Treasury Note, 3.125%, due 09/30/13 | | | 3.5 | % |
| | | | | |
| Bundesrepublik Deutschland, 4.250%, due 07/04/17 | | | 3.1 | % |
| | | | | |
| Federal National Mortgage Association, 5.000%, due 11/15/37 | | | 2.5 | % |
| | | |
| | * | Excludes short-term investments related to ING Institutional Prime Money Market Fund. | |
Portfolio holdings are subject to change daily.
44
ING Global Bond Fund
Portfolio Managers’ Report
| | | | | | | | | | | | | |
| Average Annual Total Returns for the Periods Ended October 31, 2008 |
| | | | | Since Inception
| | Since Inception
|
| | | | | of Classes A, B, C and I
| | of Class O
|
| | | 1 Year | | June 30, 2006 | | June 4, 2008 |
| |
Including Sales Charge: | | | | | | | | | | | | |
Class A(1) | | | 0.47 | % | | | 4.53 | % | | | — | |
Class B(2) | | | (2.56 | )% | | | 4.70 | % | | | — | |
Class C(3) | | | 1.34 | % | | | 5.98 | % | | | — | |
| Class I | | | 3.78 | % | | | 7.22 | % | | | — | |
| Class O | | | — | | | | — | | | | (3.61 | )% |
Excluding Sales Charge: | | | | | | | | | | | | |
| Class A | | | 3.04 | % | | | 6.73 | % | | | — | |
| Class B | | | 2.26 | % | | | 5.90 | % | | | — | |
| Class C | | | 2.31 | % | | | 5.98 | % | | | — | |
| Class I | | | 3.78 | % | | | 7.22 | % | | | — | |
| Class O | | | — | | | | — | | | | (3.70 | )% |
Lehman Brothers Global Aggregate Index(4) | | | (2.57 | )% | | | 3.94%(5) | | | | (7.30)%(6) | |
Based on a $10,000 initial investment, the table and graph above illustrate the total return of ING Global Bond Fund against the index indicated. The index is unmanaged and has no cash in its portfolio, imposes no sales charge and incurs no operating expenses. An investor cannot invest directly in the index. The Fund’s performance is shown both with and without the imposition of sales charges.
The graph and performance table do not reflect the deduction of taxes that a shareholder will pay on Fund distributions or the redemption of Fund shares.
The performance shown may include the effect of fee waivers and/or expense reimbursements by the Investment Adviser and/or other service providers, which have the effect of increasing total return. Had all fees and expenses been considered, and the total returns would have been lower.
Performance data represents past performance and is no assurance of future results. Investment return and principal value of an investment in the Fund will fluctuate. Shares, when sold, may be worth more or less than their original cost. The Fund’s current performance may be lower or higher than the performance data shown. Please log on to www.ingfunds.com or call (800) 992-0180 to get performance through the most recent month end.
It is important to note that the Fund has a limited operating history. Performance over a longer period of time may be more meaningful than short-term performance.
This report contains statements that may be “forward-looking” statements. Actual results may differ materially from those projected in the “forward-looking” statements.
The views expressed in this report reflect those of the portfolio managers, only through the end of the period as stated on the cover. The portfolio managers’ views are subject to change at any time based on market and other conditions.
Fund holdings are subject to change daily.
| |
| (1) | Effective July 31, 2006, the maximum Class A sales charge was lowered to 2.50% Return calculations with a starting date prior to July 31, 2006 are based on a 4.75% sales charge, while returns with a starting date on or after July 31, 2006 are based on a 2.50% sales charge. |
| (2) | Reflects deduction of the Class B deferred sales charge of 5% and 3%, respectively, for the 1 year and since inception returns. |
| (3) | Reflects deduction of the Class C deferred sales charge of 1% for the 1 year return. |
| (4) | The Lehman Brothers Global Aggregate Index provides a broad-based measure of the global investment-grade fixed income markets. The three major components of this index are the U.S. Aggregate, the Pan-European Aggregate, and the Asian-Pacific Aggregate Indices. |
| (5) | Since inception performance for the index is shown from July 1, 2006. |
| (6) | Since inception performance for the index is shown from June 1, 2008. |
45
ING Diversified International Fund
Portfolio Managers’ Report
Asset Allocation
as of October 31, 2008
(as a percent of net assets)
| | | | | | |
| ING Emerging Countries Fund – Class I | | | 4.1 | | % |
| ING Foreign Fund – Class I | | | 25.0 | | % |
| ING Index Plus International Equity Fund – Class I | | | 10.5 | | % |
| ING International Capital Appreciation Fund – Class I | | | 17.9 | | % |
| ING International Equity Dividend Fund – Class I | | | 12.5 | | % |
| ING International Growth Opportunities Fund – Class I | | | 4.3 | | % |
| ING International Real Estate Fund – Class I | | | 5.7 | | % |
| ING International SmallCap Multi-Manager Fund – Class I | | | 7.5 | | % |
| ING International Value Choice Fund – Class I | | | 12.4 | | % |
| Other Assets and Liabilities – Net | | | 0.1 | | % |
| | | | | | |
| | | | 100 | | % |
| | | | | | |
Portfolio holdings are subject to change daily.
ING Diversified International Fund (the “Fund”) seeks long term growth of capital. The Fund invests in a combination of other ING Funds (“Underlying Funds”) according to target allocations determined by ING Investments, LLC. The Fund is managed by ING Investments, LLC, under the guidance of an Investment Review Committee.(1)
Portfolio Specifics: The Fund’s approximate target investment allocations (expressed as a percentage of its net assets) among the asset classes in which the Fund invests are set out below. As these are target allocations, the actual allocations of the Fund’s assets may deviate from the percentages shown.
Assets will be allocated among the Underlying Funds and markets based on judgments made by ING Investments, LLC. The performance of the Fund reflects the performance of the Underlying Funds in which it invests and the weightings of the Fund’s assets in each Underlying Fund.
There is a risk that the Fund may allocate assets to an Underlying Fund or market that underperforms other asset classes. The Fund may be underweighted in assets or a market that is experiencing significant returns (or relative out performance) or overweighted in assets or a market with significant declines (or relative under performance).
The Investment Review Committee allocates the Fund’s assets among the Underlying Funds based on advice from ING Investment Management Co., a consultant to the Investment Committee.
Performance: For the year ended October 31, 2008, the Fund’s Class A shares, excluding sales charges, provided a total return of (50.04)% compared to the Morgan Stanley Capital International All Country World (ex-US) IndexSM(2) (“MSCI ACWI (ex-US)”) which returned (48.53)% for the same period. The following Underlying Funds detracted from Fund performance relative to their respective asset class benchmark: ING Emerging Countries, ING Foreign, ING International Capital Appreciation, ING Index Plus International Equity, ING International SmallCap Multi-Manager and ING International Growth Opportunities. This was slightly offset by the following Underlying Funds that outperformed their respective asset class benchmark:, ING International Equity Dividend, ING International Real Estate, and ING International Value Choice.
A good deal of the underperformance of the Fund arose due to differences in the makeup of the benchmark, MSCI ACWI (ex-US), and the holdings of the Fund. Non-benchmark holdings did not benefit the Fund during this period, with real estate the worst performing asset class, and small cap underperforming as well. It is worth noting that the Fund tends to have a structurally lower weighting in Canada than the benchmark, which can have a material effect when natural resources are very weak or strong.
Current Strategy and Outlook: During the year, on a tactical basis, we removed the Fund’s long held growth bias and moved to neutral positions in both large growth and large value. We also moved to neutralize both emerging markets and real estate. In addition, we moved to an underweight position in small cap, from a neutral position. The outlook for small cap developed market stocks is fundamentally tied to the strength of local and regional economies. With the domestic demand outlook in the major international economies weakening, a lower-than-strategic exposure to this relatively risky asset class is warranted in our view. While emerging market valuations have maintained a modest premium to their developed market counterparts, we believe that the developed economies are better positioned to weather economic weakness. The Fund remains overweight in large core. The global impact of the U.S. sub-prime mortgage crisis and stress in global credit markets as a whole has significantly clouded the outlook for the remainder of 2008, and into the next calendar year. The high probability of a recession in the United States and decelerating growth in Europe make this a problematic year for earnings.
| |
| (1) | The members of the Investment Review Committee are: William A. Evans, Michael J. Roland, and Paul Zemsky. Effective December 31, 2007, Paul Zemsky replaced Stan D. Vyner as a member of the Investment Review Committee. |
| |
| (2) | The MSCI ACWI (ex-US)sm measures the returns of equities of companies which are domiciled outside the U.S. It includes the reinvestment of dividends and distributions net of withholding taxes, but does not reflect fees, brokerage commissions or other expenses of investing. |
Portfolio holdings and characteristics are subject to change and may not be representative of current holdings and characteristics. The outlook for this Fund may differ from that presented for other ING Funds. Performance for the different classes of shares will vary based on differences in fees associated with each class.
Target Allocations
as of October 31, 2008
(as a percent of net assets)
| | | | | |
| International Core | | | 37.0 | % |
| International Growth | | | 17.5 | % |
| International Value | | | 17.5 | % |
| International Small Cap | | | 8.0 | % |
| Emerging Markets | | | 15.0 | % |
| International Real Estate | | | 5.0 | % |
Portfolio holdings are subject to change daily.
46
ING Diversified International Fund
Portfolio Managers’ Report
| | | | | | | | | | | | | | | | | | | | | |
| Average Annual Total Returns for the Periods Ended October 31, 2008 |
| | | | | Since Inception
| | Since Inception
| | Since Inception
| | Since Inception
|
| | | | | of Classes A, B, C and I
| | of Class O
| | of Class R
| | of Class W
|
| | | 1 Year | | December 21, 2005 | | June 4, 2008 | | December 12, 2006 | | February 12, 2008 |
| |
Including Sales Charge: | | | | | | | | | | | | | | | | | | | | |
Class A(1) | | | (52.90) | % | | | (11.32) | % | | | — | | | | — | | | | — | |
Class B(2) | | | (52.86) | % | | | (11.08) | % | | | — | | | | — | | | | — | |
Class C(3) | | | (50.91) | % | | | (10.16) | % | | | — | | | | — | | | | — | |
| Class I | | | (49.97) | % | | | (9.37) | % | | | — | | | | — | | | | — | |
| Class O | | | — | | | | — | | | | (43.88) | % | | | — | | | | — | |
| Class R | | | (50.18) | % | | | — | | | | | | | | (23.07) | % | | | | |
| Class W | | | — | | | | — | | | | — | | | | — | | | | (40.10) | % |
Excluding Sales Charge: | | | | | | | | | | | | | | | | | | | | |
| Class A | | | (50.04) | % | | | (9.47) | % | | | — | | | | — | | | | — | |
| Class B | | | (50.43) | % | | | (10.15) | % | | | — | | | | — | | | | — | |
| Class C | | | (50.43) | % | | | (10.16) | % | | | — | | | | — | | | | — | |
| Class I | | | (49.97) | % | | | (9.37) | % | | | — | | | | — | | | | — | |
| Class O | | | — | | | | — | | | | (43.88) | % | | | — | | | | — | |
| Class R | | | (50.18) | % | | | — | | | | — | | | | (23.07) | % | | | — | |
| Class W | | | — | | | | — | | | | — | | | | — | | | | (40.10) | % |
MSCI ACWI (ex-US) IndexSM(4) | | | (48.53) | % | | | (7.24) | %(5) | | | (44.11) | %(6) | | | (19.62) | %(7) | | | (39.43) | %(8) |
Based on a $10,000 initial investment, the table and graph above illustrate the total return of ING Diversified International Fund against the index indicated. The index is unmanaged and has no cash in its portfolio, imposes no sales charge and incurs no operating expenses. An investor cannot invest directly in the index. The Fund’s performance is shown both with and without the imposition of sales charges.
The graph and performance table do not reflect the deduction of taxes that a shareholder will pay on Fund distributions or the redemption of Fund Shares.
The performance shown may include the effect of the waivers and/or expense reimbursements by the Investment Adviser and/or other service providers, which have the effect of increasing total return. Had all fees and expenses been considered, the total returns would have been lower.
Performance data represents past performance and is no assurance of future results. Investment return and principal value of an investment in the Fund will fluctuate. Shares, when sold, may be worth more or less than their original cost. The Fund’s current performance may be lower or higher than the performance data shown. Please log on to www.ingfunds.com or call (800) 992-0180 to get performance through the most recent month end.
It is important to note that the Fund has a limited operating history. Performance over a longer period of time may be more meaningful than short-term performance.
This report contains statements that may be “forward-looking” statements. Actual results may differ materially from those projected in the “forward-looking” statements.
The views expressed in this report reflect those of the portfolio managers, only through the end of the period as stated on the cover. The portfolio managers’ views are subject to change at any time based on market and other conditions.
Fund holdings are subject to change daily.
| |
| (1) | Reflects deduction of the maximum Class A sales charge of 5.75%. |
| (2) | Reflects deduction of the Class B deferred sales charge of 5% and 3%, respectively, for the 1 year and since inception returns. |
| (3) | Reflects deduction of the Class C deferred sales charge of 1% for the 1 year return. |
| (4) | The MSCI ACWI (ex-US) measures the returns of equities of companies which are domiciled outside the U.S. It includes the reinvestment of dividends and distributions net of withholding taxes, but does not reflect fees, brokerage commissions or other expenses of investing. |
| (5) | Since inception performance of the index is shown from January 1, 2006. |
| (6) | Since inception performance of the index is shown from June 1, 2008. |
| (7) | Since inception performance of the index is shown from December 1, 2006. |
| (8) | Since inception performance of the index is shown from February 1, 2008. |
47
As a shareholder of a Fund, you incur two types of costs: (1) transaction costs, including sales charges (loads) on purchase payments, redemption fees, and exchange fees; and (2) ongoing costs, including management fees, distribution and/or service (12b-1) fees, and other Fund expenses. These Examples are intended to help you understand your ongoing costs (in dollars) of investing in a Fund and to compare these costs with the ongoing costs of investing in other mutual funds.
The Examples are based on an investment of $1,000 invested at the beginning of the period and held for the entire period from May 1, 2008 to October 31, 2008. The Funds’ expenses are shown without the imposition of any sales charges or fees. Expenses would have been higher if such charges were included.
Actual Expenses
The first section of the table shown, “Actual Fund Return,” provides information about actual account values and actual expenses. You may use the information in this section, together with the amount you invested, to estimate the expenses that you paid over the period. Simply divide your account value by $1,000 (for example, an $8,600 account value divided by $1,000 = 8.6), then multiply the result by the number in the first section under the heading entitled “Expenses Paid During the Period” to estimate the expenses you paid on your account during this period.
Hypothetical Example for Comparison Purposes
The second section of the table shown, “Hypothetical (5% return before expenses),” provides information about hypothetical account values and hypothetical expenses based on the Fund’s actual expense ratio and an assumed rate of return of 5% per year before expenses, which is not the Fund’s actual return. The hypothetical account values and expenses may not be used to estimate the actual ending account balance or expenses you paid for the period. You may use this information to compare the ongoing costs of investing in each Fund and other funds. To do so, compare this 5% hypothetical example with the 5% hypothetical examples that appear in the shareholder reports of the other funds.
Please note that the expenses shown in the table are meant to highlight your ongoing costs only and do not reflect any transactional costs, such as sales charges (loads), redemption fees, or exchange fees. Therefore, the hypothetical lines of the table are useful in comparing ongoing costs only, and will not help you determine the relative total costs of owning different funds. In addition, if these transactional costs were included, your costs would have been higher.
| | | | | | | | | | | | | | | | | |
| | | Beginning
| | Ending
| | | | Expenses Paid
|
| | | Account
| | Account
| | Annualized
| | During the
|
| | | Value
| | Value
| | Expense
| | Period Ended
|
ING Global Equity Dividend Fund | | May 1, 2008 | | October 31, 2008 | | Ratio | | October 31, 2008* |
| |
| Actual Fund Return | | | | | | | | | | | | | | | | |
| Class A | | $ | 1,000.00 | | | $ | 660.40 | | | | 1.41 | % | | $ | 5.88 | |
| Class B | | | 1,000.00 | | | | 657.80 | | | | 2.16 | | | | 9.00 | |
| Class C | | | 1,000.00 | | | | 657.80 | | | | 2.16 | | | | 9.00 | |
| Class I | | | 1,000.00 | | | | 662.30 | | | | 1.06 | | | | 4.43 | |
| Class O | | | 1,000.00 | | | | 660.90 | | | | 1.41 | | | | 5.89 | |
| Class W | | | 1,000.00 | | | | 661.40 | | | | 1.06 | | | | 4.43 | |
| Hypothetical (5% return before expenses) | | | | | | | | | | | | | | | | |
| Class A | | $ | 1,000.00 | | | $ | 1,018.05 | | | | 1.41 | % | | $ | 7.15 | |
| Class B | | | 1,000.00 | | | | 1,014.28 | | | | 2.16 | | | | 10.94 | |
| Class C | | | 1,000.00 | | | | 1,014.28 | | | | 2.16 | | | | 10.94 | |
| Class I | | | 1,000.00 | | | | 1,019.81 | | | | 1.06 | | | | 5.38 | |
| Class O | | | 1,000.00 | | | | 1,018.05 | | | | 1.41 | | | | 7.15 | |
| Class W | | | 1,000.00 | | | | 1,019.81 | | | | 1.06 | | | | 5.38 | |
| |
| * | Expenses are equal to each Fund’s respective annualized expense ratios multiplied by the average account value over the period, multiplied by 184/366 to reflect the most recent fiscal half-year. |
48
SHAREHOLDER EXPENSE EXAMPLES (Unaudited) (continued)
| | | | | | | | | | | | | | | | | |
| | | Beginning
| | Ending
| | | | Expenses Paid
|
| | | Account
| | Account
| | Annualized
| | During the
|
| | | Value
| | Value
| | Expense
| | Period Ended
|
ING Global Natural Resources Fund | | May 1, 2008 | | October 31, 2008 | | Ratio | | October 31, 2008* |
| |
| Actual Fund Return | | | | | | | | | | | | | | | | |
| Class A | | $ | 1,000.00 | | | $ | 568.80 | | | | 1.46 | % | | $ | 5.76 | |
| Class I | | | 1,000.00 | | | | 570.10 | | | | 1.11 | | | | 4.38 | |
| Class W | | | 1,000.00 | | | | 570.40 | | | | 1.11 | | | | 4.38 | |
| Hypothetical (5% return before expenses) | | | | | | | | | | | | | | | | |
| Class A | | $ | 1,000.00 | | | $ | 1,017.80 | | | | 1.46 | % | | $ | 7.41 | |
| Class I | | | 1,000.00 | | | | 1,019.56 | | | | 1.11 | | | | 5.63 | |
| Class W | | | 1,000.00 | | | | 1,019.56 | | | | 1.11 | | | | 5.63 | |
| | | | | | | | | | | | | | | | | |
ING Global Real Estate Fund | | | | | | | | | | | | | | | | |
| | | | | | | | | | | | | | | | | |
| Actual Fund Return | | | | | | | | | | | | | | | | |
| Class A | | $ | 1,000.00 | | | $ | 609.80 | | | | 1.41 | % | | $ | 5.71 | |
| Class B | | | 1,000.00 | | | | 607.90 | | | | 2.16 | | | | 8.73 | |
| Class C | | | 1,000.00 | | | | 607.90 | | | | 2.16 | | | | 8.73 | |
| Class I | | | 1,000.00 | | | | 611.40 | | | | 1.01 | | | | 4.09 | |
| Class O | | | 1,000.00 | | | | 609.80 | | | | 1.41 | | | | 5.71 | |
| Class W | | | 1,000.00 | | | | 611.30 | | | | 1.01 | | | | 4.09 | |
| Hypothetical (5% return before expenses) | | | | | | | | | | | | | | | | |
| Class A | | $ | 1,000.00 | | | $ | 1,018.05 | | | | 1.41 | % | | $ | 7.15 | |
| Class B | | | 1,000.00 | | | | 1,014.28 | | | | 2.16 | | | | 10.94 | |
| Class C | | | 1,000.00 | | | | 1,014.28 | | | | 2.16 | | | | 10.94 | |
| Class I | | | 1,000.00 | | | | 1,020.06 | | | | 1.01 | | | | 5.13 | |
| Class O | | | 1,000.00 | | | | 1,018.05 | | | | 1.41 | | | | 7.15 | |
| Class W | | | 1,000.00 | | | | 1,020.06 | | | | 1.01 | | | | 5.13 | |
| | | | | | | | | | | | | | | | | |
ING Global Value Choice Fund | | | | | | | | | | | | | | | | |
| | | | | | | | | | | | | | | | | |
| Actual Fund Return | | | | | | | | | | | | | | | | |
| Class A | | $ | 1,000.00 | | | $ | 653.50 | | | | 1.55 | % | | $ | 6.44 | |
| Class B | | | 1,000.00 | | | | 650.60 | | | | 2.30 | | | | 9.54 | |
| Class C | | | 1,000.00 | | | | 650.70 | | | | 2.30 | | | | 9.54 | |
| Class I | | | 1,000.00 | | | | 654.50 | | | | 1.22 | | | | 5.07 | |
| Class Q | | | 1,000.00 | | | | 653.50 | | | | 1.47 | | | | 6.11 | |
| Hypothetical (5% return before expenses) | | | | | | | | | | | | | | | | |
| Class A | | $ | 1,000.00 | | | $ | 1,017.34 | | | | 1.55 | % | | $ | 7.86 | |
| Class B | | | 1,000.00 | | | | 1,013.57 | | | | 2.30 | | | | 11.64 | |
| Class C | | | 1,000.00 | | | | 1,013.57 | | | | 2.30 | | | | 11.64 | |
| Class I | | | 1,000.00 | | | | 1,019.00 | | | | 1.22 | | | | 6.19 | |
| Class Q | | | 1,000.00 | | | | 1,017.75 | | | | 1.47 | | | | 7.46 | |
| |
| * | Expenses are equal to each Fund’s respective annualized expense ratios multiplied by the average account value over the period, multiplied by 184/366 to reflect the most recent fiscal half-year. |
49
SHAREHOLDER EXPENSE EXAMPLES (Unaudited) (continued)
| | | | | | | | | | | | | | | | | |
| | | Beginning
| | Ending
| | | | Expenses Paid
|
| | | Account
| | Account
| | Annualized
| | During the
|
| | | Value
| | Value
| | Expense
| | Period Ended
|
ING Asia-Pacific Real Estate Fund | | May 1, 2008 | | October 31, 2008 | | Ratio | | October 31, 2008* |
| |
| Actual Fund Return | | | | | | | | | | | | | | | | |
| Class A | | $ | 1,000.00 | | | $ | 567.80 | | | | 1.75 | % | | $ | 6.90 | |
| Class B | | | 1,000.00 | | | | 565.60 | | | | 2.50 | | | | 9.84 | |
| Class C | | | 1,000.00 | | | | 565.50 | | | | 2.50 | | | | 9.84 | |
| Class I | | | 1,000.00 | | | | 568.10 | | | | 1.50 | | | | 5.91 | |
| Hypothetical (5% return before expenses) | | | | | | | | | | | | | | | | |
| Class A | | $ | 1,000.00 | | | $ | 1,016.34 | | | | 1.75 | % | | $ | 8.87 | |
| Class B | | | 1,000.00 | | | | 1,012.57 | | | | 2.50 | | | | 12.65 | |
| Class C | | | 1,000.00 | | | | 1,012.57 | | | | 2.50 | | | | 12.65 | |
| Class I | | | 1,000.00 | | | | 1,017.60 | | | | 1.50 | | | | 7.61 | |
| | | | | | | | | | | | | | | | | |
ING Disciplined International SmallCap Fund | | | | | | | | | | | | | | | | |
| | | | | | | | | | | | | | | | | |
| Actual Fund Return | | | | | | | | | | | | | | | | |
| Class A | | $ | 1,000.00 | | | $ | 548.60 | | | | 1.13 | % | | $ | 4.40 | |
| Class B | | | 1,000.00 | | | | 546.40 | | | | 1.88 | | | | 7.31 | |
| Class C | | | 1,000.00 | | | | 546.40 | | | | 1.88 | | | | 7.31 | |
| Class I | | | 1,000.00 | | | | 549.00 | | | | 0.83 | | | | 3.23 | |
| Hypothetical (5% return before expenses) | | | | | | | | | | | | | | | | |
| Class A | | $ | 1,000.00 | | | $ | 1,019.46 | | | | 1.13 | % | | $ | 5.74 | |
| Class B | | | 1,000.00 | | | | 1,015.69 | | | | 1.88 | | | | 9.53 | |
| Class C | | | 1,000.00 | | | | 1,015.69 | | | | 1.88 | | | | 9.53 | |
| Class I | | | 1,000.00 | | | | 1,020.96 | | | | 0.83 | | | | 4.22 | |
| | | | | | | | | | | | | | | | | |
ING Emerging Countries Fund | | | | | | | | | | | | | | | | |
| | | | | | | | | | | | | | | | | |
| Actual Fund Return | | | | | | | | | | | | | | | | |
| Class A | | $ | 1,000.00 | | | $ | 432.90 | | | | 1.96 | % | | $ | 7.06 | |
| Class B | | | 1,000.00 | | | | 431.00 | | | | 2.71 | | | | 9.75 | |
| Class C | | | 1,000.00 | | | | 431.10 | | | | 2.71 | | | | 9.75 | |
| Class I | | | 1,000.00 | | | | 434.00 | | | | 1.63 | | | | 5.88 | |
| Class Q | | | 1,000.00 | | | | 433.60 | | | | 1.88 | | | | 6.78 | |
| Class W | | | 1,000.00 | | | | 434.00 | | | | 1.63 | | | | 5.88 | |
| Hypothetical (5% return before expenses) | | | | | | | | | | | | | | | | |
| Class A | | $ | 1,000.00 | | | $ | 1,015.28 | | | | 1.96 | % | | $ | 9.93 | |
| Class B | | | 1,000.00 | | | | 1,011.51 | | | | 2.71 | | | | 13.70 | |
| Class C | | | 1,000.00 | | | | 1,011.51 | | | | 2.71 | | | | 13.70 | |
| Class I | | | 1,000.00 | | | | 1,016.94 | | | | 1.63 | | | | 8.26 | |
| Class Q | | | 1,000.00 | | | | 1,015.69 | | | | 1.88 | | | | 9.53 | |
| Class W | | | 1,000.00 | | | | 1,016.94 | | | | 1.63 | | | | 8.26 | |
| |
| * | Expenses are equal to each Fund’s respective annualized expense ratios multiplied by the average account value over the period, multiplied by 184/366 to reflect the most recent fiscal half-year. |
50
SHAREHOLDER EXPENSE EXAMPLES (Unaudited) (continued)
| | | | | | | | | | | | | | | | | |
| | | Beginning
| | Ending
| | | | Expenses Paid
|
| | | Account
| | Account
| | Annualized
| | During the
|
| | | Value
| | Value
| | Expense
| | Period Ended
|
ING European Real Estate Fund | | May 1, 2008 | | October 31, 2008 | | Ratio | | October 31, 2008* |
| |
| Actual Fund Return | | | | | | | | | | | | | | | | |
| Class A | | $ | 1,000.00 | | | $ | 572.80 | | | | 1.75 | % | | $ | 6.92 | |
| Class B | | | 1,000.00 | | | | 570.50 | | | | 2.50 | | | | 9.87 | |
| Class C | | | 1,000.00 | | | | 568.50 | | | | 2.50 | | | | 9.86 | |
| Class I | | | 1,000.00 | | | | 573.20 | | | | 1.40 | | | | 5.54 | |
| Hypothetical (5% return before expenses) | | | | | | | | | | | | | | | | |
| Class A | | $ | 1,000.00 | | | $ | 1,016.34 | | | | 1.75 | % | | $ | 8.87 | |
| Class B | | | 1,000.00 | | | | 1,012.57 | | | | 2.50 | | | | 12.65 | |
| Class C | | | 1,000.00 | | | | 1,012.57 | | | | 2.50 | | | | 12.65 | |
| Class I | | | 1,000.00 | | | | 1,018.10 | | | | 1.40 | | | | 7.10 | |
| | | | | | | | | | | | | | | | | |
ING Foreign Fund | | | | | | | | | | | | | | | | |
| | | | | | | | | | | | | | | | | |
| Actual Fund Return | | | | | | | | | | | | | | | | |
| Class A | | $ | 1,000.00 | | | $ | 589.30 | | | | 1.60 | % | | $ | 6.39 | |
| Class B | | | 1,000.00 | | | | 587.40 | | | | 2.35 | | | | 9.38 | |
| Class C | | | 1,000.00 | | | | 587.20 | | | | 2.35 | | | | 9.38 | |
| Class I | | | 1,000.00 | | | | 590.40 | | | | 1.27 | | | | 5.08 | |
| Class Q | | | 1,000.00 | | | | 589.20 | | | | 1.52 | | | | 6.07 | |
| Class W | | | 1,000.00 | | | | 590.60 | | | | 1.27 | | | | 5.08 | |
| Hypothetical (5% return before expenses) | | | | | | | | | | | | | | | | |
| Class A | | $ | 1,000.00 | | | $ | 1,017.09 | | | | 1.60 | % | | $ | 8.11 | |
| Class B | | | 1,000.00 | | | | 1,013.32 | | | | 2.35 | | | | 11.89 | |
| Class C | | | 1,000.00 | | | | 1,013.32 | | | | 2.35 | | | | 11.89 | |
| Class I | | | 1,000.00 | | | | 1,018.75 | | | | 1.27 | | | | 6.44 | |
| Class Q | | | 1,000.00 | | | | 1,017.50 | | | | 1.52 | | | | 7.71 | |
| Class W | | | 1,000.00 | | | | 1,018.75 | | | | 1.27 | | | | 6.44 | |
| | | | | | | | | | | | | | | | | |
ING Greater China Fund | | | | | | | | | | | | | | | | |
| | | | | | | | | | | | | | | | | |
| Actual Fund Return | | | | | | | | | | | | | | | | |
| Class A | | $ | 1,000.00 | | | $ | 518.80 | | | | 1.96 | % | | $ | 7.48 | |
| Class B | | | 1,000.00 | | | | 516.50 | | | | 2.71 | | | | 10.33 | |
| Class C | | | 1,000.00 | | | | 516.80 | | | | 2.71 | | | | 10.33 | |
| Class I | | | 1,000.00 | | | | 520.50 | | | | 1.70 | | | | 6.50 | |
Class O(1) | | | 1,000.00 | | | | 550.20 | | | | 1.96 | | | | 6.23 | |
| Hypothetical (5% return before expenses) | | | | | | | | | | | | | | | | |
| Class A | | $ | 1,000.00 | | | $ | 1,015.28 | | | | 1.96 | % | | $ | 9.93 | |
| Class B | | | 1,000.00 | | | | 1,011.51 | | | | 2.71 | | | | 13.70 | |
| Class C | | | 1,000.00 | | | | 1,011.51 | | | | 2.71 | | | | 13.70 | |
| Class I | | | 1,000.00 | | | | 1,016.59 | | | | 1.70 | | | | 8.62 | |
| Class O | | | 1,000.00 | | | | 1,015.28 | | | | 1.96 | | | | 9.93 | |
| |
| (1) | Commencement of operations for Class O was June 4, 2008. Expenses paid reflect the 150 day period ended October 31, 2008. |
| |
| * | Expenses are equal to each Fund’s respective annualized expense ratios multiplied by the average account value over the period, multiplied by 184/366 to reflect the most recent fiscal half-year. |
51
SHAREHOLDER EXPENSE EXAMPLES (Unaudited) (continued)
| | | | | | | | | | | | | | | | | |
| | | Beginning
| | Ending
| | | | Expenses Paid
|
| | | Account
| | Account
| | Annualized
| | During the
|
| | | Value
| | Value
| | Expense
| | Period Ended
|
ING Index Plus International Equity Fund | | May 1, 2008 | | October 31, 2008 | | Ratio | | October 31, 2008* |
| |
| Actual Fund Return | | | | | | | | | | | | | | | | |
| Class A | | $ | 1,000.00 | | | $ | 583.10 | | | | 1.17 | % | | $ | 4.66 | |
| Class B | | | 1,000.00 | | | | 581.30 | | | | 1.92 | | | | 7.63 | |
| Class C | | | 1,000.00 | | | | 580.40 | | | | 1.92 | | | | 7.63 | |
| Class I | | | 1,000.00 | | | | 586.30 | | | | 0.50 | | | | 1.99 | |
| Class O | | | 1,000.00 | | | | 582.60 | | | | 1.19 | | | | 4.73 | |
| Hypothetical (5% return before expenses) | | | | | | | | | | | | | | | | |
| Class A | | $ | 1,000.00 | | | $ | 1,019.25 | | | | 1.17 | % | | $ | 5.94 | |
| Class B | | | 1,000.00 | | | | 1,015.48 | | | | 1.92 | | | | 9.73 | |
| Class C | | | 1,000.00 | | | | 1,015.48 | | | | 1.92 | | | | 9.73 | |
| Class I | | | 1,000.00 | | | | 1,022.62 | | | | 0.50 | | | | 2.54 | |
| Class O | | | 1,000.00 | | | | 1,019.15 | | | | 1.19 | | | | 6.04 | |
| | | | | | | | | | | | | | | | | |
ING International Capital Appreciation Fund | | | | | | | | | | | | | | | | |
| | | | | | | | | | | | | | | | | |
| Actual Fund Return | | | | | | | | | | | | | | | | |
| Class A | | $ | 1,000.00 | | | $ | 526.70 | | | | 1.46 | % | | $ | 5.60 | |
| Class B | | | 1,000.00 | | | | 524.70 | | | | 2.21 | | | | 8.47 | |
| Class C | | | 1,000.00 | | | | 525.10 | | | | 2.21 | | | | 8.47 | |
| Class I | | | 1,000.00 | | | | 527.80 | | | | 1.13 | | | | 4.34 | |
| Hypothetical (5% return before expenses) | | | | | | | | | | | | | | | | |
| Class A | | $ | 1,000.00 | | | $ | 1,017.80 | | | | 1.46 | % | | $ | 7.41 | |
| Class B | | | 1,000.00 | | | | 1,014.03 | | | | 2.21 | | | | 11.19 | |
| Class C | | | 1,000.00 | | | | 1,014.03 | | | | 2.21 | | | | 11.19 | |
| Class I | | | 1,000.00 | | | | 1,019.46 | | | | 1.13 | | | | 5.74 | |
| | | | | | | | | | | | | | | | | |
ING International Equity Dividend Fund | | | | | | | | | | | | | | | | |
| | | | | | | | | | | | | | | | | |
| Actual Fund Return | | | | | | | | | | | | | | | | |
| Class A | | $ | 1,000.00 | | | $ | 587.90 | | | | 1.40 | % | | $ | 5.59 | |
| Class B | | | 1,000.00 | | | | 585.80 | | | | 2.15 | | | | 8.57 | |
| Class C | | | 1,000.00 | | | | 585.60 | | | | 2.15 | | | | 8.57 | |
| Class I | | | 1,000.00 | | | | 588.90 | | | | 1.06 | | | | 4.23 | |
| Class W | | | 1,000.00 | | | | 587.50 | | | | 1.06 | | | | 4.23 | |
| Hypothetical (5% return before expenses) | | | | | | | | | | | | | | | | |
| Class A | | $ | 1,000.00 | | | $ | 1,018.10 | | | | 1.40 | % | | $ | 7.10 | |
| Class B | | | 1,000.00 | | | | 1,014.33 | | | | 2.15 | | | | 10.89 | |
| Class C | | | 1,000.00 | | | | 1,014.33 | | | | 2.15 | | | | 10.89 | |
| Class I | | | 1,000.00 | | | | 1,019.81 | | | | 1.06 | | | | 5.38 | |
| Class W | | | 1,000.00 | | | | 1,019.81 | | | | 1.06 | | | | 5.38 | |
| |
| * | Expenses are equal to each Fund’s respective annualized expense ratios multiplied by the average account value over the period, multiplied by 184/366 to reflect the most recent fiscal half-year. |
52
SHAREHOLDER EXPENSE EXAMPLES (Unaudited) (continued)
| | | | | | | | | | | | | | | | | |
| | | Beginning
| | Ending
| | | | Expenses Paid
|
| | | Account
| | Account
| | Annualized
| | During the
|
| | | Value
| | Value
| | Expense
| | Period Ended
|
ING International Growth Opportunities Fund | | May 1, 2008 | | October 31, 2008 | | Ratio | | October 31, 2008* |
| |
| Actual Fund Return | | | | | | | | | | | | | | | | |
| Class A | | $ | 1,000.00 | | | $ | 492.00 | | | | 1.74 | % | | $ | 6.53 | |
| Class B | | | 1,000.00 | | | | 489.90 | | | | 2.49 | | | | 9.33 | |
| Class C | | | 1,000.00 | | | | 489.90 | | | | 2.49 | | | | 9.33 | |
| Class I | | | 1,000.00 | | | | 492.90 | | | | 1.37 | | | | 5.14 | |
| Class Q | | | 1,000.00 | | | | 492.00 | | | | 1.50 | | | | 5.63 | |
| Hypothetical (5% return before expenses) | | | | | | | | | | | | | | | | |
| Class A | | $ | 1,000.00 | | | $ | 1,016.39 | | | | 1.74 | % | | $ | 8.82 | |
| Class B | | | 1,000.00 | | | | 1,012.62 | | | | 2.49 | | | | 12.60 | |
| Class C | | | 1,000.00 | | | | 1,012.62 | | | | 2.49 | | | | 12.60 | |
| Class I | | | 1,000.00 | | | | 1,018.25 | | | | 1.37 | | | | 6.95 | |
| Class Q | | | 1,000.00 | | | | 1,017.60 | | | | 1.50 | | | | 7.61 | |
| | | | | | | | | | | | | | | | | |
ING International Real Estate Fund | | | | | | | | | | | | | | | | |
| | | | | | | | | | | | | | | | | |
| Actual Fund Return | | | | | | | | | | | | | | | | |
| Class A | | $ | 1,000.00 | | | $ | 579.50 | | | | 1.50 | % | | $ | 5.96 | |
| Class B | | | 1,000.00 | | | | 576.90 | | | | 2.25 | | | | 8.92 | |
| Class C | | | 1,000.00 | | | | 577.20 | | | | 2.25 | | | | 8.92 | |
| Class I | | | 1,000.00 | | | | 580.60 | | | | 1.18 | | | | 4.69 | |
| Class W | | | 1,000.00 | | | | 579.40 | | | | 1.20 | | | | 4.76 | |
| Hypothetical (5% return before expenses) | | | | | | | | | | | | | | | | |
| Class A | | $ | 1,000.00 | | | $ | 1,017.60 | | | | 1.50 | % | | $ | 7.61 | |
| Class B | | | 1,000.00 | | | | 1,013.83 | | | | 2.25 | | | | 11.39 | |
| Class C | | | 1,000.00 | | | | 1,013.83 | | | | 2.25 | | | | 11.39 | |
| Class I | | | 1,000.00 | | | | 1,019.20 | | | | 1.18 | | | | 5.99 | |
| Class W | | | 1,000.00 | | | | 1,019.10 | | | | 1.20 | | | | 6.09 | |
| |
| * | Expenses are equal to each Fund’s respective annualized expense ratios multiplied by the average account value over the period, multiplied by 184/366 to reflect the most recent fiscal half-year. |
53
SHAREHOLDER EXPENSE EXAMPLES (Unaudited) (continued)
| | | | | | | | | | | | | | | | | |
| | | Beginning
| | Ending
| | | | Expenses Paid
|
| | | Account
| | Account
| | Annualized
| | During the
|
| | | Value
| | Value
| | Expense
| | Period Ended
|
ING International SmallCap Multi-Manager Fund | | May 1, 2008 | | October 31, 2008 | | Ratio | | October 31, 2008* |
| |
| Actual Fund Return | | | | | | | | | | | | | | | | |
| Class A | | $ | 1,000.00 | | | $ | 488.70 | | | | 1.70 | % | | $ | 6.36 | |
| Class B | | | 1,000.00 | | | | 487.30 | | | | 2.35 | | | | 8.79 | |
| Class C | | | 1,000.00 | | | | 487.00 | | | | 2.35 | | | | 8.78 | |
| Class I | | | 1,000.00 | | | | 489.80 | | | | 1.29 | | | | 4.83 | |
Class O(1) | | | 1,000.00 | | | | 481.20 | | | | 1.60 | | | | 4.86 | |
| Class Q | | | 1,000.00 | | | | 489.10 | | | | 1.54 | | | | 5.76 | |
| Class W | | | 1,000.00 | | | | 490.10 | | | | 1.29 | | | | 4.83 | |
| Hypothetical (5% return before expenses) | | | | | | | | | | | | | | | | |
| Class A | | $ | 1,000.00 | | | $ | 1,016.59 | | | | 1.70 | % | | $ | 8.62 | |
| Class B | | | 1,000.00 | | | | 1,013.32 | | | | 2.35 | | | | 11.89 | |
| Class C | | | 1,000.00 | | | | 1,013.32 | | | | 2.35 | | | | 11.89 | |
| Class I | | | 1,000.00 | | | | 1,018.65 | | | | 1.29 | | | | 6.55 | |
| Class O | | | 1,000.00 | | | | 1,017.09 | | | | 1.60 | | | | 8.11 | |
| Class Q | | | 1,000.00 | | | | 1,017.39 | | | | 1.54 | | | | 7.81 | |
| Class W | | | 1,000.00 | | | | 1,018.65 | | | | 1.29 | | | | 6.55 | |
| | | | | | | | | | | | | | | | | |
ING International Value Fund | | | | | | | | | | | | | | | | |
| | | | | | | | | | | | | | | | | |
| Actual Fund Return | | | | | | | | | | | | | | | | |
| Class A | | $ | 1,000.00 | | | $ | 629.90 | | | | 1.58 | % | | $ | 6.47 | |
| Class B | | | 1,000.00 | | | | 627.50 | | | | 2.28 | | | | 9.33 | |
| Class C | | | 1,000.00 | | | | 627.70 | | | | 2.18 | | | | 8.92 | |
| Class I | | | 1,000.00 | | | | 631.20 | | | | 1.28 | | | | 5.25 | |
| Class Q | | | 1,000.00 | | | | 630.90 | | | | 1.28 | | | | 5.25 | |
| Hypothetical (5% return before expenses) | | | | | | | | | | | | | | | | |
| Class A | | $ | 1,000.00 | | | $ | 1,017.19 | | | | 1.58 | % | | $ | 8.01 | |
| Class B | | | 1,000.00 | | | | 1,013.67 | | | | 2.28 | | | | 11.54 | |
| Class C | | | 1,000.00 | | | | 1,014.18 | | | | 2.18 | | | | 11.04 | |
| Class I | | | 1,000.00 | | | | 1,018.70 | | | | 1.28 | | | | 6.50 | |
| Class Q | | | 1,000.00 | | | | 1,018.70 | | | | 1.28 | | | | 6.50 | |
| |
| (1) | Commencement of operations for Class O was June 4, 2008. Expenses paid reflect the 150 day period ended October 31, 2008. |
| |
| * | Expenses are equal to each Fund’s respective annualized expense ratios multiplied by the average account value over the period, multiplied by 184/366 to reflect the most recent fiscal half-year. |
54
SHAREHOLDER EXPENSE EXAMPLES (Unaudited) (continued)
| | | | | | | | | | | | | | | | | |
| | | Beginning
| | Ending
| | | | Expenses Paid
|
| | | Account
| | Account
| | Annualized
| | During the
|
| | | Value
| | Value
| | Expense
| | Period Ended
|
ING International Value Choice Fund | | May 1, 2008 | | October 31, 2008 | | Ratio | | October 31, 2008* |
| |
| Actual Fund Return | | | | | | | | | | | | | | | | |
| Class A | | $ | 1,000.00 | | | $ | 632.10 | | | | 1.65 | % | | $ | 6.77 | |
| Class B | | | 1,000.00 | | | | 630.00 | | | | 2.40 | | | | 9.83 | |
| Class C | | | 1,000.00 | | | | 630.10 | | | | 2.40 | | | | 9.83 | |
| Class I | | | 1,000.00 | | | | 633.50 | | | | 1.30 | | | | 5.34 | |
| Hypothetical (5% return before expenses) | | | | | | | | | | | | | | | | |
| Class A | | $ | 1,000.00 | | | $ | 1,016.84 | | | | 1.65 | % | | $ | 8.36 | |
| Class B | | | 1,000.00 | | | | 1,013.07 | | | | 2.40 | | | | 12.14 | |
| Class C | | | 1,000.00 | | | | 1,013.07 | | | | 2.40 | | | | 12.14 | |
| Class I | | | 1,000.00 | | | | 1,018.60 | | | | 1.30 | | | | 6.60 | |
| | | | | | | | | | | | | | | | | |
ING Russia Fund | | | | | | | | | | | | | | | | |
| | | | | | | | | | | | | | | | | |
| Actual Fund Return | | | | | | | | | | | | | | | | |
| Class A | | $ | 1,000.00 | | | $ | 388.10 | | | | 2.06 | % | | $ | 7.19 | |
| Hypothetical (5% return before expenses) | | | | | | | | | | | | | | | | |
| Class A | | $ | 1,000.00 | | | $ | 1,014.78 | | | | 2.06 | % | | $ | 10.43 | |
| | | | | | | | | | | | | | | | | |
ING Emerging Markets Fixed Income Fund | | | | | | | | | | | | | | | | |
| | | | | | | | | | | | | | | | | |
| Actual Fund Return | | | | | | | | | | | | | | | | |
| Class A | | $ | 1,000.00 | | | $ | 694.00 | | | | 1.15 | % | | $ | 4.90 | |
| Class B | | | 1,000.00 | | | | 691.50 | | | | 1.90 | | | | 8.08 | |
| Class C | | | 1,000.00 | | | | 690.40 | | | | 1.90 | | | | 8.07 | |
| Class I | | | 1,000.00 | | | | 695.20 | | | | 0.86 | | | | 3.66 | |
| Hypothetical (5% return before expenses) | | | | | | | | | | | | | | | | |
| Class A | | $ | 1,000.00 | | | $ | 1,019.36 | | | | 1.15 | % | | $ | 5.84 | |
| Class B | | | 1,000.00 | | | | 1,015.58 | | | | 1.90 | | | | 9.63 | |
| Class C | | | 1,000.00 | | | | 1,015.58 | | | | 1.90 | | | | 9.63 | |
| Class I | | | 1,000.00 | | | | 1,020.81 | | | | 0.86 | | | | 4.37 | |
| |
| * | Expenses are equal to each Fund’s respective annualized expense ratios multiplied by the average account value over the period, multiplied by 184/366 to reflect the most recent fiscal half-year. |
55
SHAREHOLDER EXPENSE EXAMPLES (Unaudited) (continued)
| | | | | | | | | | | | | | | | | |
| | | Beginning
| | Ending
| | | | Expenses Paid
|
| | | Account
| | Account
| | Annualized
| | During the
|
| | | Value
| | Value
| | Expense
| | Period Ended
|
ING Global Bond Fund | | May 1, 2008 | | October 31, 2008 | | Ratio | | October 31, 2008* |
| |
| Actual Fund Return | | | | | | | | | | | | | | | | |
| Class A | | $ | 1,000.00 | | | $ | 946.10 | | | | 0.93 | % | | $ | 4.55 | |
| Class B | | | 1,000.00 | | | | 943.00 | | | | 1.68 | | | | 8.21 | |
| Class C | | | 1,000.00 | | | | 943.30 | | | | 1.68 | | | | 8.21 | |
| Class I | | | 1,000.00 | | | | 948.70 | | | | 0.62 | | | | 3.04 | |
Class O(1) | | | 1,000.00 | | | | 963.00 | | | | 0.93 | | | | 3.74 | |
| Hypothetical (5% return before expenses) | | | | | | | | | | | | | | | | |
| Class A | | $ | 1,000.00 | | | $ | 1,020.46 | | | | 0.93 | % | | $ | 4.72 | |
| Class B | | | 1,000.00 | | | | 1,016.69 | | | | 1.68 | | | | 8.52 | |
| Class C | | | 1,000.00 | | | | 1,016.69 | | | | 1.68 | | | | 8.52 | |
| Class I | | | 1,000.00 | | | | 1,022.02 | | | | 0.62 | | | | 3.15 | |
| Class O | | | 1,000.00 | | | | 1,020.46 | | | | 0.93 | | | | 4.72 | |
| | | | | | | | | | | | | | | | | |
ING Diversified International Fund(2) | | | | | | | | | | | | | | | | |
| | | | | | | | | | | | | | | | | |
| Actual Fund Return | | | | | | | | | | | | | | | | |
| Class A | | $ | 1,000.00 | | | $ | 560.20 | | | | 0.31 | % | | $ | 1.22 | |
| Class B | | | 1,000.00 | | | | 557.50 | | | | 1.06 | | | | 4.15 | |
| Class C | | | 1,000.00 | | | | 557.60 | | | | 1.06 | | | | 4.15 | |
| Class I | | | 1,000.00 | | | | 560.20 | | | | 0.06 | | | | 0.24 | |
Class O(1) | | | 1,000.00 | | | | 561.20 | | | | 0.31 | | | | 0.99 | |
| Class R | | | 1,000.00 | | | | 559.30 | | | | 0.56 | | | | 2.19 | |
| Class W | | | 1,000.00 | | | | 559.50 | | | | 0.06 | | | | 0.24 | |
| Hypothetical (5% return before expenses) | | | | | | | | | | | | | | | | |
| Class A | | $ | 1,000.00 | | | $ | 1,023.58 | | | | 0.31 | % | | $ | 1.58 | |
| Class B | | | 1,000.00 | | | | 1,019.81 | | | | 1.06 | | | | 5.38 | |
| Class C | | | 1,000.00 | | | | 1,019.81 | | | | 1.06 | | | | 5.38 | |
| Class I | | | 1,000.00 | | | | 1,024.83 | | | | 0.06 | | | | 0.31 | |
Class O(1) | | | 1,000.00 | | | | 1,023.58 | | | | 0.31 | | | | 1.58 | |
| Class R | | | 1,000.00 | | | | 1,022.32 | | | | 0.56 | | | | 2.85 | |
| Class W | | | 1,000.00 | | | | 1,024.83 | | | | 0.06 | | | | 0.31 | |
| |
| (1) | Commencement of operations for Class O was June 4, 2008. Expenses paid reflect the 150 day period ended October 31, 2008. |
| (2) | The annualized expense ratios do not include expenses of underlying funds. |
| |
| * | Expenses are equal to each Fund’s respective annualized expense ratios multiplied by the average account value over the period, multiplied by 184/366 to reflect the most recent fiscal half-year. |
56
REPORT OF INDEPENDENT REGISTERED PUBLIC ACCOUNTING FIRM
The Shareholders and Board of Trustees
ING Mutual Funds and ING Mayflower Trust
We have audited the accompanying statements of assets and liabilities, including the portfolios of investments, of ING Global Equity Dividend Fund, ING Global Natural Resources Fund, ING Global Real Estate Fund, ING Global Value Choice Fund, ING Asia-Pacific Real Estate Fund, ING Disciplined International SmallCap Fund, ING Emerging Countries Fund, ING European Real Estate Fund, ING Foreign Fund, ING Greater China Fund, ING Index Plus International Equity Fund, ING International Capital Appreciation Fund, ING International Equity Dividend Fund, ING International Growth Opportunities Fund, ING International Real Estate Fund, ING International SmallCap Multi-Manager Fund (formerly, ING International SmallCap Fund), ING International Value Choice Fund, ING Russia Fund, ING Emerging Markets Fixed Income Fund, ING Global Bond Fund, ING Diversified International Fund, each a series of ING Mutual Funds, and of ING International Value Fund, a series of ING Mayflower Trust, as of October 31, 2008, and the related statements of operations for the year or period then ended, the statements of changes in net assets for each of the years or periods in the two-year period then ended, and the financial highlights for each of the years or periods in the five-year period then ended. These financial statements and financial highlights are the responsibility of management. Our responsibility is to express an opinion on these financial statements and financial highlights based on our audits.
We conducted our audits in accordance with the standards of the Public Company Accounting Oversight Board (United States). Those standards require that we plan and perform the audits to obtain reasonable assurance about whether the financial statements and financial highlights are free of material misstatement. An audit includes examining, on a test basis, evidence supporting the amounts and disclosures in the financial statements. Our procedures included confirmation of securities owned as of October 31, 2008, by correspondence with the custodian, transfer agent, and brokers, or by other appropriate auditing procedures where replies from brokers were not received. An audit also includes assessing the accounting principles used and significant estimates made by management, as well as evaluating the overall financial statement presentation. We believe that our audits provide a reasonable basis for our opinion.
In our opinion, the financial statements and financial highlights referred to above present fairly, in all material respects, the financial position of the aforementioned funds as of October 31, 2008, and the results of their operations, the changes in their net assets, and the financial highlights for the periods specified in the first paragraph above, in conformity with U.S. generally accepted accounting principles.
Boston, Massachusetts
December 30, 2008
57
STATEMENTS OF ASSETS AND LIABILITIES as of October 31, 2008
| | | | | | | | | | | | | | | | | |
| | | ING
| | ING
| | ING
| | ING
|
| | | Global
| | Global
| | Global
| | Global
|
| | | Equity
| | Natural
| | Real
| | Value
|
| | | Dividend
| | Resources
| | Estate
| | Choice
|
| | | Fund | | Fund | | Fund | | Fund |
| |
ASSETS: | | | | | | | | | | | | | | | | |
| Investments in securities at value+* | | $ | 144,700,977 | | | $ | 81,476,367 | | | $ | 1,258,639,279 | | | $ | 71,768,235 | |
| Investments in affiliates** | | | — | | | | — | | | | 673,737 | | | | — | |
| Short-term investments*** | | | 7,031,111 | | | | — | | | | 136,229,615 | | | | 12,656,612 | |
| Short-term investments in affiliates at amortized cost | | | — | | | | 1,950,000 | | | | 83,965,902 | | | | 1,521,276 | |
| Cash | | | 4,002,677 | | | | — | | | | — | | | | — | |
| Foreign currencies at value**** | | | 645,223 | | | | 236,003 | | | | 255,386 | | | | — | |
| Receivables: | | | | | | | | | | | | | | | | |
| Investment securities sold | | | 627,685 | | | | 678,055 | | | | 2,867,160 | | | | 489,803 | |
| Fund shares sold | | | 127,669 | | | | 107,687 | | | | 9,536,856 | | | | 364,642 | |
| Dividends and interest | | | 433,842 | | | | 50,917 | | | | 3,714,361 | | | | 146,880 | |
| Prepaid expenses | | | 49,483 | | | | 21,597 | | | | 102,532 | | | | 31,187 | |
| Reimbursement due from manager | | | 25,949 | | | | — | | | | — | | | | — | |
| | | | | | | | | | | | | | | | | |
| Total assets | | | 157,644,616 | | | | 84,520,626 | | | | 1,495,984,828 | | | | 86,978,635 | |
| | | | | | | | | | | | | | | | | |
| | | | | | | | | | | | | | | | | |
| LIABILITIES: | | | | | | | | | | | | | | | | |
| Payable for investment securities purchased | | | 657,143 | | | | 381,674 | | | | 47,026,541 | | | | 462,294 | |
| Payable for fund shares redeemed | | | 497,980 | | | | 205,872 | | | | 5,923,836 | | | | 239,449 | |
| Payable upon receipt of securities loaned | | | 7,140,453 | | | | — | | | | 138,652,357 | | | | 12,910,571 | |
| Payable to affiliates | | | 188,399 | | | | 88,390 | | | | 1,273,319 | | | | 90,467 | |
| Payable to custodian due to bank overdraft | | | — | | | | 1,392 | | | | 32,298 | | | | — | |
| Payable for directors fees | | | 560 | | | | 19,242 | | | | 3,493 | | | | 20,548 | |
| Other accrued expenses and liabilities | | | 176,136 | | | | 82,721 | | | | 1,114,903 | | | | 93,195 | |
| | | | | | | | | | | | | | | | | |
| Total liabilities | | | 8,660,671 | | | | 779,291 | | | | 194,026,747 | | | | 13,816,524 | |
| | | | | | | | | | | | | | | | | |
NET ASSETS | | $ | 148,983,945 | | | $ | 83,741,335 | | | $ | 1,301,958,081 | | | $ | 73,162,111 | |
| | | | | | | | | | | | | | | | | |
| | | | | | | | | | | | | | | | | |
NET ASSETS WERE COMPRISED OF: | | | | | | | | | | | | | | | | |
| Paid-in capital | | $ | 255,536,647 | | | $ | 117,183,795 | | | $ | 2,130,801,646 | | | $ | 262,723,343 | |
| Distributions in excess of net investment income | | | (917 | ) | | | — | | | | (42,244,315 | ) | | | (3,478 | ) |
| Accumulated net realized gain (loss) on investments and foreign currency related transactions | | | (31,531,647 | ) | | | 3,240,279 | | | | (259,595,775 | ) | | | (149,034,423 | ) |
| Net unrealized depreciation on investments and foreign currency related transactions | | | (75,020,138 | ) | | | (36,682,739 | ) | | | (527,003,475 | ) | | | (40,523,331 | ) |
| | | | | | | | | | | | | | | | | |
NET ASSETS | | $ | 148,983,945 | | | $ | 83,741,335 | | | $ | 1,301,958,081 | | | $ | 73,162,111 | |
| | | | | | | | | | | | | | | | | |
| | | | | | | | | | | | | | | | | |
| | | | | | | | | | | | | | | | |
| + Including securities loaned at value | | $ | 6,784,510 | | | $ | — | | | $ | 143,983,741 | | | $ | 12,549,229 | |
| * Cost of investments in securities | | $ | 219,587,966 | | | $ | 118,132,510 | | | $ | 1,781,646,449 | | | $ | 112,044,055 | |
| ** Cost of investments in affiliates | | $ | — | | | $ | — | | | $ | 2,242,416 | | | $ | — | |
| *** Cost of short-term investments | | $ | 7,140,453 | | | $ | — | | | $ | 138,652,357 | | | $ | 12,910,571 | |
| **** Cost of foreign currencies | | $ | 641,877 | | | $ | 262,179 | | | $ | 253,545 | | | $ | — | |
See Accompanying Notes to Financial Statements
58
STATEMENTS OF ASSETS AND LIABILITIES as of October 31, 2008 (continued)
| | | | | | | | | | | | | | | | | |
| | | ING
| | ING
| | ING
| | ING
|
| | | Global
| | Global
| | Global
| | Global
|
| | | Equity
| | Natural
| | Real
| | Value
|
| | | Dividend
| | Resources
| | Estate
| | Choice
|
| | | Fund | | Fund | | Fund | | Fund |
| |
Class A: | | | | | | | | | | | | | | | | |
| Net assets | | $ | 63,133,997 | | | $ | 83,713,299 | | | $ | 836,314,069 | | | $ | 38,258,339 | |
| Shares authorized | | | unlimited | | | | unlimited | | | | unlimited | | | | unlimited | |
| Par value | | $ | — | | | $ | — | | | $ | — | | | $ | — | |
| Shares outstanding | | | 7,200,269 | | | | 12,413,051 | | | | 66,559,493 | | | | 2,271,585 | |
| Net asset value and redemption price per share | | $ | 8.77 | | | $ | 6.74 | | | $ | 12.56 | | | $ | 16.84 | |
Maximum offering price per share (5.75%)(1) | | $ | 9.31 | | | $ | 7.15 | | | $ | 13.33 | | | $ | 17.87 | |
Class B: | | | | | | | | | | | | | | | | |
| Net assets | | $ | 21,311,013 | | | | n/a | | | $ | 23,663,249 | | | $ | 6,721,846 | |
| Shares authorized | | | unlimited | | | | n/a | | | | unlimited | | | | unlimited | |
| Par value | | $ | — | | | | n/a | | | $ | — | | | $ | — | |
| Shares outstanding | | | 2,437,803 | | | | n/a | | | | 2,220,705 | | | | 371,298 | |
Net asset value and redemption price per share(2) | | $ | 8.74 | | | | n/a | | | $ | 10.66 | | | $ | 18.10 | |
| Maximum offering price per share | | $ | 8.74 | | | | n/a | | | $ | 10.66 | | | $ | 18.10 | |
Class C: | | | | | | | | | | | | | | | | |
| Net assets | | $ | 48,566,998 | | | | n/a | | | $ | 153,109,514 | | | $ | 21,044,828 | |
| Shares authorized | | | unlimited | | | | n/a | | | | unlimited | | | | unlimited | |
| Par value | | $ | — | | | | n/a | | | $ | — | | | $ | — | |
| Shares outstanding | | | 5,569,378 | | | | n/a | | | | 13,649,727 | | | | 1,308,743 | |
Net asset value and redemption price per share(2) | | $ | 8.72 | | | | n/a | | | $ | 11.22 | | | $ | 16.08 | |
| Maximum offering price per share | | $ | 8.72 | | | | n/a | | | $ | 11.22 | | | $ | 16.08 | |
Class I: | | | | | | | | | | | | | | | | |
| Net assets | | $ | 1,206,732 | | | $ | 674 | | | $ | 225,880,580 | | | $ | 5,793,987 | |
| Shares authorized | | | unlimited | | | | unlimited | | | | unlimited | | | | unlimited | |
| Par value | | $ | — | | | $ | — | | | $ | — | | | $ | — | |
| Shares outstanding | | | 137,472 | | | | 100 | | | | 17,973,329 | | | | 342,389 | |
| Net asset value and redemption price per share | | $ | 8.78 | | | $ | 6.75 | | | $ | 12.57 | | | $ | 16.92 | |
| Maximum offering price per share | | $ | 8.78 | | | $ | 6.75 | | | $ | 12.57 | | | $ | 16.92 | |
Class O: | | | | | | | | | | | | | | | | |
| Net assets | | $ | 14,695,213 | | | | n/a | | | $ | 12,758,157 | | | | n/a | |
| Shares authorized | | | unlimited | | | | n/a | | | | unlimited | | | | n/a | |
| Par value | | $ | — | | | | n/a | | | $ | — | | | | n/a | |
| Shares outstanding | | | 1,678,318 | | | | n/a | | | | 1,016,307 | | | | n/a | |
| Net asset value and redemption price per share | | $ | 8.76 | | | | n/a | | | $ | 12.55 | | | | n/a | |
| Maximum offering price per share | | $ | 8.76 | | | | n/a | | | $ | 12.55 | | | | n/a | |
Class Q: | | | | | | | | | | | | | | | | |
| Net assets | | | n/a | | | | n/a | | | | n/a | | | $ | 1,343,111 | |
| Shares authorized | | | n/a | | | | n/a | | | | n/a | | | | unlimited | |
| Par value | | | n/a | | | | n/a | | | | n/a | | | $ | — | |
| Shares outstanding | | | n/a | | | | n/a | | | | n/a | | | | 67,887 | |
| Net asset value and redemption price per share | | | n/a | | | | n/a | | | | n/a | | | $ | 19.78 | |
| Maximum offering price per share | | | n/a | | | | n/a | | | | n/a | | | $ | 19.78 | |
Class W: | | | | | | | | | | | | | | | | |
| Net assets | | $ | 69,992 | | | $ | 27,362 | | | $ | 50,232,512 | | | | n/a | |
| Shares authorized | | | unlimited | | | | unlimited | | | | unlimited | | | | n/a | |
| Par value | | $ | — | | | $ | — | | | $ | — | | | | n/a | |
| Shares outstanding | | | 7,343 | | | | 3,262 | | | | 3,988,910 | | | | n/a | |
| Net asset value and redemption price per share | | $ | 9.53 | | | $ | 8.39 | | | $ | 12.59 | | | | n/a | |
| Maximum offering price per share | | $ | 9.53 | | | $ | 8.39 | | | $ | 12.59 | | | | n/a | |
| |
| (1) | Maximum offering price is computed at 100/94.25 of net asset value. On purchases of $50,000 or more, the offering price is reduced. |
| (2) | Redemption price per share may be reduced for any applicable contingent deferred sales charges. |
See Accompanying Notes to Financial Statements
59
STATEMENTS OF ASSETS AND LIABILITIES as of October 31, 2008
| | | | | | | | | | | | | | | | | |
| | | ING
| | ING
| | | | ING
|
| | | Asia-Pacific
| | Disciplined
| | ING
| | European
|
| | | Real
| | International
| | Emerging
| | Real
|
| | | Estate
| | SmallCap
| | Countries
| | Estate
|
| | | Fund | | Fund | | Fund | | Fund |
| |
ASSETS: | | | | | | | | | | | | | | | | |
| Investments in securities at value+* | | $ | 7,082,457 | | | $ | 220,889,459 | | | $ | 94,901,237 | | | $ | 3,004,462 | |
| Investments in affiliates** | | | — | | | | 321,880 | | | | — | | | | — | |
| Short-term investments*** | | | — | | | | — | | | | 12,022,302 | | | | — | |
| Short-term investments in affiliates at amortized cost | | | — | | | | — | | | | — | | | | 149,159 | |
| Short-term investments at amortized cost | | | — | | | | 14,271,000 | | | | — | | | | — | |
| Cash | | | — | | | | 961 | | | | 4,836,473 | | | | — | |
| Foreign currencies at value**** | | | 2,032 | | | | 1,115,615 | | | | 2,627,085 | | | | 3,951 | |
| Receivables: | | | | | | | | | | | | | | | | |
| Investment securities sold | | | 184,684 | | | | 5,068,105 | | | | 6,756,314 | | | | 117,929 | |
| Fund shares sold | | | — | | | | 255,453 | | | | 251,411 | | | | 3,230 | |
| Dividends and interest | | | 37,713 | | | | 819,490 | | | | 245,104 | | | | 8,602 | |
| Prepaid expenses | | | 29,158 | | | | 29,298 | | | | 47,467 | | | | 29,101 | |
| Reimbursement due from manager | | | 20,328 | | | | — | | | | — | | | | 20,675 | |
| | | | | | | | | | | | | | | | | |
| Total assets | | | 7,356,372 | | | | 242,771,261 | | | | 121,687,393 | | | | 3,337,109 | |
| | | | | | | | | | | | | | | | | |
| | | | | | | | | | | | | | | | | |
LIABILITIES: | | | | | | | | | | | | | | | | |
| Payable for investment securities purchased | | | 154,992 | | | | 22,730,096 | | | | 6,256,326 | | | | 90,076 | |
| Payable for fund shares redeemed | | | 224,654 | | | | — | | | | 208,381 | | | | — | |
| Payable upon receipt of securities loaned | | | — | | | | — | | | | 12,164,927 | | | | — | |
| Payable to affiliates | | | 11,402 | | | | 127,009 | | | | 154,824 | | | | 4,153 | |
| Payable to custodian due to bank overdraft | | | 251,198 | | | | — | | | | — | | | | — | |
| Payable for directors fees | | | 1,578 | | | | 1,252 | | | | 38,839 | | | | 2,260 | |
| Other accrued expenses and liabilities | | | 17,361 | | | | 109,680 | | | | 175,400 | | | | 25,002 | |
| | | | | | | | | | | | | | | | | |
| Total liabilities | | | 661,185 | | | | 22,968,037 | | | | 18,998,697 | | | | 121,491 | |
| | | | | | | | | | | | | | | | | |
NET ASSETS | | $ | 6,695,187 | | | $ | 219,803,224 | | | $ | 102,688,696 | | | $ | 3,215,618 | |
| | | | | | | | | | | | | | | | | |
| | | | | | | | | | | | | | | | | |
NET ASSETS WERE COMPRISED OF: | | | | | | | | | | | | | | | | |
| Paid-in capital | | $ | 12,134,679 | | | $ | 431,184,688 | | | $ | 217,789,598 | | | $ | 6,059,270 | |
| Undistributed net investment income | | | 10,178 | | | | 7,905,967 | | | | 2,746,170 | | | | 95,557 | |
| Accumulated net realized loss on investments and foreign currency related transactions | | | (2,033,363 | ) | | | (79,181,144 | ) | | | (63,181,013 | ) | | | (1,259,955 | ) |
| Net unrealized depreciation on investments and foreign currency related transactions | | | (3,416,307 | ) | | | (140,106,287 | ) | | | (54,666,059 | ) | | | (1,679,254 | ) |
| | | | | | | | | | | | | | | | | |
NET ASSETS | | $ | 6,695,187 | | | $ | 219,803,224 | | | $ | 102,688,696 | | | $ | 3,215,618 | |
| | | | | | | | | | | | | | | | | |
| | | | | | | | | | | | | | | | | |
| | | | | | | | | | | | | | | | |
| + Including securities loaned at value | | $ | — | | | $ | — | | | $ | 11,598,481 | | | $ | — | |
| * Cost of investments in securities | | $ | 10,499,719 | | | $ | 361,063,303 | | | $ | 149,413,719 | | | $ | 4,682,616 | |
| ** Cost of investments in affiliates | | $ | — | | | $ | 598,955 | | | $ | — | | | $ | — | |
| *** Cost of short-term investments | | $ | — | | | $ | — | | | $ | 12,164,927 | | | $ | — | |
| **** Cost of foreign currencies | | $ | 1,948 | | | $ | 1,020,422 | | | $ | 2,626,939 | | | $ | 4,072 | |
See Accompanying Notes to Financial Statements
60
STATEMENTS OF ASSETS AND LIABILITIES as of October 31, 2008 (continued)
| | | | | | | | | | | | | | | | | |
| | | ING
| | ING
| | | | ING
|
| | | Asia-Pacific
| | Disciplined
| | ING
| | European
|
| | | Real
| | International
| | Emerging
| | Real
|
| | | Estate
| | SmallCap
| | Countries
| | Estate
|
| | | Fund | | Fund | | Fund | | Fund |
| |
Class A: | | | | | | | | | | | | | | | | |
| Net assets | | $ | 3,144,161 | | | $ | 72,766 | | | $ | 60,206,569 | | | $ | 3,156,626 | |
| Shares authorized | | | unlimited | | | | unlimited | | | | unlimited | | | | unlimited | |
| Par value | | $ | — | | | $ | — | | | $ | — | | | $ | — | |
| Shares outstanding | | | 697,281 | | | | 13,314 | | | | 3,752,536 | | | | 591,978 | |
| Net asset value and redemption price per share | | $ | 4.51 | | | $ | 5.47 | | | $ | 16.04 | | | $ | 5.33 | |
Maximum offering price per share (5.75%)(1) | | $ | 4.79 | | | $ | 5.80 | | | $ | 17.02 | | | $ | 5.66 | |
Class B: | | | | | | | | | | | | | | | | |
| Net assets | | $ | 18,209 | | | $ | 2,941 | | | $ | 4,311,837 | | | $ | 10,335 | |
| Shares authorized | | | unlimited | | | | unlimited | | | | unlimited | | | | unlimited | |
| Par value | | $ | — | | | $ | — | | | $ | — | | | $ | — | |
| Shares outstanding | | | 4,046 | | | | 543 | | | | 274,171 | | | | 1,943 | |
Net asset value and redemption price per share(2) | | $ | 4.50 | | | $ | 5.42 | | | $ | 15.73 | | | $ | 5.32 | |
| Maximum offering price per share | | $ | 4.50 | | | $ | 5.42 | | | $ | 15.73 | | | $ | 5.32 | |
Class C: | | | | | | | | | | | | | | | | |
| Net assets | | $ | 3,532,362 | | | $ | 70,190 | | | $ | 14,585,899 | | | $ | 48,119 | |
| Shares authorized | | | unlimited | | | | unlimited | | | | unlimited | | | | unlimited | |
| Par value | | $ | — | | | $ | — | | | $ | — | | | $ | — | |
| Shares outstanding | | | 784,891 | | | | 12,946 | | | | 984,373 | | | | 9,076 | |
Net asset value and redemption price per share(2) | | $ | 4.50 | | | $ | 5.42 | | | $ | 14.82 | | | $ | 5.30 | |
| Maximum offering price per share | | $ | 4.50 | | | $ | 5.42 | | | $ | 14.82 | | | $ | 5.30 | |
Class I: | | | | | | | | | | | | | | | | |
| Net assets | | $ | 455 | | | $ | 219,657,327 | | | $ | 18,428,828 | | | $ | 538 | |
| Shares authorized | | | unlimited | | | | unlimited | | | | unlimited | | | | unlimited | |
| Par value | | $ | — | | | $ | — | | | $ | — | | | $ | — | |
| Shares outstanding | | | 101 | | | | 39,999,676 | | | | 1,143,910 | | | | 101 | |
| Net asset value and redemption price per share | | $ | 4.50 | | | $ | 5.49 | | | $ | 16.11 | | | $ | 5.33 | |
| Maximum offering price per share | | $ | 4.50 | | | $ | 5.49 | | | $ | 16.11 | | | $ | 5.33 | |
Class Q: | | | | | | | | | | | | | | | | |
| Net assets | | | n/a | | | | n/a | | | $ | 5,119,691 | | | | n/a | |
| Shares authorized | | | n/a | | | | n/a | | | | unlimited | | | | n/a | |
| Par value | | | n/a | | | | n/a | | | $ | — | | | | n/a | |
| Shares outstanding | | | n/a | | | | n/a | | | | 307,489 | | | | n/a | |
| Net asset value and redemption price per share | | | n/a | | | | n/a | | | $ | 16.65 | | | | n/a | |
| Maximum offering price per share | | | n/a | | | | n/a | | | $ | 16.65 | | | | n/a | |
Class W: | | | | | | | | | | | | | | | | |
| Net assets | | | n/a | | | | n/a | | | $ | 35,872 | | | | n/a | |
| Shares authorized | | | n/a | | | | n/a | | | | unlimited | | | | n/a | |
| Par value | | | n/a | | | | n/a | | | $ | — | | | | n/a | |
| Shares outstanding | | | n/a | | | | n/a | | | | 2,129 | | | | n/a | |
| Net asset value and redemption price per share | | | n/a | | | | n/a | | | $ | 16.85 | | | | n/a | |
| Maximum offering price per share | | | n/a | | | | n/a | | | $ | 16.85 | | | | n/a | |
| |
| (1) | Maximum offering price is computed at 100/94.25 of net asset value. On purchases of $50,000 or more, the offering price is reduced. |
| (2) | Redemption price per share may be reduced for any applicable contingent deferred sales charges. |
See Accompanying Notes to Financial Statements
61
STATEMENTS OF ASSETS AND LIABILITIES as of October 31, 2008
| | | | | | | | | | | | | | | | | |
| | | | | | | ING
| | ING
|
| | | | | ING
| | Index Plus
| | International
|
| | | ING
| | Greater
| | International
| | Capital
|
| | | Foreign
| | China
| | Equity
| | Appreciation
|
| | | Fund | | Fund | | Fund | | Fund |
| |
ASSETS: | | | | | | | | | | | | | | | | |
| Investments in securities at value+* | | $ | 306,285,392 | | | $ | 25,235,351 | | | $ | 102,951,516 | | | $ | 49,964,322 | |
| Short-term investments** | | | 7,449,055 | | | | — | | | | — | | | | — | |
| Short-term investments in affiliates at amortized cost | | | 15,469,336 | | | | — | | | | — | | | | — | |
| Cash | | | — | | | | 39,066 | | | | 845,869 | | | | 99,005 | |
| Foreign currencies at value*** | | | 15,861,673 | | | | 26,876 | | | | 4,400,141 | | | | — | |
| Receivables: | | | | | | | | | | | | | | | | |
| Investment securities sold | | | 36,551,293 | | | | 478,338 | | | | 65 | | | | 964,530 | |
| Fund shares sold | | | 321,151 | | | | 29,536 | | | | 41,111 | | | | 12,484 | |
| Dividends and interest | | | 1,460,038 | | | | 73,941 | | | | 608,820 | | | | 226,393 | |
| Unrealized appreciation on forward foreign currency contracts | | | 23,422,334 | | | | — | | | | — | | | | — | |
| Prepaid expenses | | | 48,862 | | | | 42,946 | | | | 50,279 | | | | 34,364 | |
| Reimbursement due from manager | | | — | | | | — | | | | 241,857 | | | | — | |
| | | | | | | | | | | | | | | | | |
| Total assets | | | 406,869,134 | | | | 25,926,054 | | | | 109,139,658 | | | | 51,301,098 | |
| | | | | | | | | | | | | | | | | |
| | | | | | | | | | | | | | | | | |
LIABILITIES: | | | | | | | | | | | | | | | | |
| Payable for investment securities purchased | | | 46,946,795 | | | | 475,429 | | | | — | | | | 526,458 | |
| Payable for fund shares redeemed | | | 1,528,590 | | | | 36,017 | | | | 92,281 | | | | 64,127 | |
| Payable upon receipt of securities loaned | | | 7,602,351 | | | | — | | | | — | | | | — | |
| Unrealized depreciation on forward foreign currency contracts | | | 9,017,154 | | | | — | | | | — | | | | — | |
| Payable to affiliates | | | 487,215 | | | | 39,653 | | | | 128,316 | | | | 45,793 | |
| Payable to custodian due to bank overdraft | | | 166,651 | | | | — | | | | — | | | | — | |
| Payable to custodian due to foreign currency overdraft**** | | | — | | | | — | | | | — | | | | 106,098 | |
| Payable for directors fees | | | 516 | | | | 221 | | | | 2,666 | | | | 420 | |
| Other accrued expenses and liabilities | | | 386,054 | | | | 54,134 | | | | 211,581 | | | | 56,486 | |
| Payable for borrowings against line of credit | | | — | | | | — | | | | — | | | | 340,000 | |
| | | | | | | | | | | | | | | | | |
| Total liabilities | | | 66,135,326 | | | | 605,454 | | | | 434,844 | | | | 1,139,382 | |
| | | | | | | | | | | | | | | | | |
NET ASSETS | | $ | 340,733,808 | | | $ | 25,320,600 | | | $ | 108,704,814 | | | $ | 50,161,716 | |
| | | | | | | | | | | | | | | | | |
| | | | | | | | | | | | | | | | | |
NET ASSETS WERE COMPRISED OF: | | | | | | | | | | | | | | | | |
| Paid-in capital | | $ | 473,508,998 | | | $ | 38,539,556 | | | $ | 209,074,684 | | | $ | 93,443,806 | |
| Undistributed net investment income (distributions in excess of net investment income) | | | (3,840,375 | ) | | | 1,754,292 | | | | 4,340,300 | | | | 1,056,223 | |
| Accumulated net realized loss on investments, foreign currency related transactions, and futures | | | (100,294,397 | ) | | | (201,885 | ) | | | (46,071,339 | ) | | | (9,838,467 | ) |
| Net unrealized depreciation on investments and foreign currency related transactions | | | (28,640,418 | ) | | | (14,771,363 | ) | | | (58,638,831 | ) | | | (34,499,846 | ) |
| | | | | | | | | | | | | | | | | |
NET ASSETS | | $ | 340,733,808 | | | $ | 25,320,600 | | | $ | 108,704,814 | | | $ | 50,161,716 | |
| | | | | | | | | | | | | | | | | |
| | | | | | | | | | | | | | | | | |
| | | | | | | | | | | | | | | | |
| + Including securities loaned at value | | $ | 6,888,038 | | | $ | — | | | $ | — | | | $ | — | |
| * Cost of investments in securities | | $ | 349,338,659 | | | $ | 40,005,814 | | | $ | 161,277,901 | | | $ | 84,454,490 | |
| ** Cost of short-term investments | | $ | 7,602,351 | | | $ | — | | | $ | — | | | $ | — | |
| *** Cost of foreign currencies | | $ | 15,872,309 | | | $ | 27,020 | | | $ | 4,721,198 | | | $ | — | |
| **** Cost of foreign currency overdraft | | $ | — | | | $ | — | | | $ | — | | | $ | 106,098 | |
See Accompanying Notes to Financial Statements
62
STATEMENTS OF ASSETS AND LIABILITIES as of October 31, 2008 (continued)
| | | | | | | | | | | | | | | | | |
| | | | | | | ING
| | ING
|
| | | | | ING
| | Index Plus
| | International
|
| | | ING
| | Greater
| | International
| | Capital
|
| | | Foreign
| | China
| | Equity
| | Appreciation
|
| | | Fund | | Fund | | Fund | | Fund |
| |
Class A: | | | | | | | | | | | | | | | | |
| Net assets | | $ | 151,246,448 | | | $ | 20,481,140 | | | $ | 9,445,716 | | | $ | 1,612,429 | |
| Shares authorized | | | unlimited | | | | unlimited | | | | unlimited | | | | unlimited | |
| Par value | | $ | — | | | $ | — | | | $ | — | | | $ | — | |
| Shares outstanding | | | 12,950,289 | | | | 2,217,532 | | | | 1,488,104 | | | | 240,482 | |
| Net asset value and redemption price per share | | $ | 11.68 | | | $ | 9.24 | | | $ | 6.35 | | | $ | 6.70 | |
Maximum offering price per share (5.75%)(1) | | $ | 12.39 | | | $ | 9.80 | | | $ | 6.74 | | | $ | 7.11 | |
Class B: | | | | | | | | | | | | | | | | |
| Net assets | | $ | 18,831,416 | | | $ | 1,900,536 | | | $ | 1,570,636 | | | $ | 277,792 | |
| Shares authorized | | | unlimited | | | | unlimited | | | | unlimited | | | | unlimited | |
| Par value | | $ | — | | | $ | — | | | $ | — | | | $ | — | |
| Shares outstanding | | | 1,683,304 | | | | 209,316 | | | | 249,822 | | | | 42,199 | |
Net asset value and redemption price per share(2) | | $ | 11.19 | | | $ | 9.08 | | | $ | 6.29 | | | $ | 6.58 | |
| Maximum offering price per share | | $ | 11.19 | | | $ | 9.08 | | | $ | 6.29 | | | $ | 6.58 | |
Class C: | | | | | | | | | | | | | | | | |
| Net assets | | $ | 102,273,644 | | | $ | 2,694,220 | | | $ | 1,310,836 | | | $ | 353,676 | |
| Shares authorized | | | unlimited | | | | unlimited | | | | unlimited | | | | unlimited | |
| Par value | | $ | — | | | $ | — | | | $ | — | | | $ | — | |
| Shares outstanding | | | 9,123,617 | | | | 296,448 | | | | 208,596 | | | | 53,609 | |
Net asset value and redemption price per share(2) | | $ | 11.21 | | | $ | 9.09 | | | $ | 6.28 | | | $ | 6.60 | |
| Maximum offering price per share | | $ | 11.21 | | | $ | 9.09 | | | $ | 6.28 | | | $ | 6.60 | |
Class I: | | | | | | | | | | | | | | | | |
| Net assets | | $ | 68,019,790 | | | $ | 39,020 | | | $ | 54,838,439 | | | $ | 47,917,819 | |
| Shares authorized | | | unlimited | | | | unlimited | | | | unlimited | | | | unlimited | |
| Par value | | $ | — | | | $ | — | | | $ | — | | | $ | — | |
| Shares outstanding | | | 5,707,434 | | | | 4,206 | | | | 8,543,926 | | | | 7,121,169 | |
| Net asset value and redemption price per share | | $ | 11.92 | | | $ | 9.28 | | | $ | 6.42 | | | $ | 6.73 | |
| Maximum offering price per share | | $ | 11.92 | | | $ | 9.28 | | | $ | 6.42 | | | $ | 6.73 | |
Class O: | | | | | | | | | | | | | | | | |
| Net assets | | | n/a | | | $ | 205,684 | | | $ | 41,539,187 | | | | n/a | |
| Shares authorized | | | n/a | | | | unlimited | | | | unlimited | | | | n/a | |
| Par value | | | n/a | | | $ | — | | | $ | — | | | | n/a | |
| Shares outstanding | | | n/a | | | | 22,211 | | | | 6,580,359 | | | | n/a | |
| Net asset value and redemption price per share | | | n/a | | | $ | 9.26 | | | $ | 6.31 | | | | n/a | |
| Maximum offering price per share | | | n/a | | | $ | 9.26 | | | $ | 6.31 | | | | n/a | |
Class Q: | | | | | | | | | | | | | | | | |
| Net assets | | $ | 66,432 | | | | n/a | | | | n/a | | | | n/a | |
| Shares authorized | | | unlimited | | | | n/a | | | | n/a | | | | n/a | |
| Par value | | $ | — | | | | n/a | | | | n/a | | | | n/a | |
| Shares outstanding | | | 5,663 | | | | n/a | | | | n/a | | | | n/a | |
| Net asset value and redemption price per share | | $ | 11.73 | | | | n/a | | | | n/a | | | | n/a | |
| Maximum offering price per share | | $ | 11.73 | | | | n/a | | | | n/a | | | | n/a | |
Class W: | | | | | | | | | | | | | | | | |
| Net assets | | $ | 296,078 | | | | n/a | | | | n/a | | | | n/a | |
| Shares authorized | | | unlimited | | | | n/a | | | | n/a | | | | n/a | |
| Par value | | $ | — | | | | n/a | | | | n/a | | | | n/a | |
| Shares outstanding | | | 23,296 | | | | n/a | | | | n/a | | | | n/a | |
| Net asset value and redemption price per share | | $ | 12.71 | | | | n/a | | | | n/a | | | | n/a | |
| Maximum offering price per share | | $ | 12.71 | | | | n/a | | | | n/a | | | | n/a | |
| |
| (1) | Maximum offering price is computed at 100/94.25 of net asset value. On purchases of $50,000 or more, the offering price is reduced. |
| (2) | Redemption price per share may be reduced for any applicable contingent deferred sales charges. |
See Accompanying Notes to Financial Statements
63
STATEMENTS OF ASSETS AND LIABILITIES as of October 31, 2008
| | | | | | | | | | | | | | | | | |
| | | ING
| | ING
| | ING
| | ING
|
| | | International
| | International
| | International
| | International
|
| | | Equity
| | Growth
| | Real
| | SmallCap
|
| | | Dividend
| | Opportunities
| | Estate
| | Multi-Manager
|
| | | Fund | | Fund | | Fund | | Fund |
| |
ASSETS: | | | | | | | | | | | | | | | | |
| Investments in securities at value+* | | $ | 35,303,021 | | | $ | 62,084,898 | | | $ | 406,891,066 | | | $ | 392,088,172 | |
| Investments in affiliates** | | | — | | | | — | | | | — | | | | 391,776 | |
| Short-term investments*** | | | — | | | | 6,150,930 | | | | — | | | | 6,972,221 | |
| Short-term investments in affiliates at amortized cost | | | — | | | | — | | | | 11,711,220 | | | | — | |
| Cash | | | 549,977 | | | | — | | | | — | | | | 6,248,254 | |
| Foreign currencies at value**** | | | 55,895 | | | | 295,949 | | | | 91,777 | | | | 964,026 | |
| Receivables: | | | | | | | | | | | | | | | | |
| Investment securities sold | | | 90,532 | | | | 983,219 | | | | 396,795 | | | | 8,167,586 | |
| Fund shares sold | | | 834 | | | | 84,482 | | | | 3,107,134 | | | | 745,051 | |
| Dividends and interest | | | 97,417 | | | | 334,624 | | | | 2,014,997 | | | | 1,545,227 | |
| Prepaid expenses | | | 41,671 | | | | 29,542 | | | | 26,848 | | | | 74,106 | |
| Reimbursement due from manager | | | 20,408 | | | | — | | | | 9,716 | | | | 3,905 | |
| | | | | | | | | | | | | | | | | |
| Total assets | | | 36,159,755 | | | | 69,963,644 | | | | 424,249,553 | | | | 417,200,324 | |
| | | | | | | | | | | | | | | | | |
| | | | | | | | | | | | | | | | | |
LIABILITIES: | | | | | | | | | | | | | | | | |
| Payable for investment securities purchased | | | — | | | | 1,184 | | | | 989,954 | | | | 9,090,494 | |
| Payable for fund shares redeemed | | | 51,816 | | | | 138,696 | | | | 1,779,049 | | | | 1,182,305 | |
| Payable upon receipt of securities loaned | | | — | | | | 6,221,322 | | | | — | | | | 7,042,553 | |
| Payable to affiliates | | | 29,285 | | | | 84,436 | | | | 467,863 | | | | 513,167 | |
| Payable to custodian due to bank overdraft | | | — | | | | 235,954 | | | | — | | | | — | |
| Payable for directors fees | | | 1,132 | | | | 18,703 | | | | 521 | | | | 835 | |
| Other accrued expenses and liabilities | | | 38,221 | | | | 75,668 | | | | 190,739 | | | | 409,552 | |
| Payable for borrowings against line of credit | | | — | | | | — | | | | — | | | | 3,330,000 | |
| | | | | | | | | | | | | | | | | |
| Total liabilities | | | 120,454 | | | | 6,775,963 | | | | 3,428,126 | | | | 21,568,906 | |
| | | | | | | | | | | | | | | | | |
NET ASSETS | | $ | 36,039,301 | | | $ | 63,187,681 | | | $ | 420,821,427 | | | $ | 395,631,418 | |
| | | | | | | | | | | | | | | | | |
| | | | | | | | | | | | | | | | | |
NET ASSETS WERE COMPRISED OF: | | | | | | | | | | | | | | | | |
| Paid-in capital | | $ | 66,974,548 | | | $ | 120,059,478 | | | $ | 769,225,735 | | | $ | 842,488,646 | |
| Undistributed net investment income (distribution in excess of net investment income) | | | (63 | ) | | | 186,726 | | | | (10,247 | ) | | | 10,631,527 | |
| Accumulated net realized loss on investments and foreign currency related transactions | | | (10,277,194 | ) | | | (5,056,803 | ) | | | (108,529,946 | ) | | | (159,372,381 | ) |
| Net unrealized depreciation on investments and foreign currency related transactions | | | (20,657,990 | ) | | | (52,001,720 | ) | | | (239,864,115 | ) | | | (298,116,374 | ) |
| | | | | | | | | | | | | | | | | |
NET ASSETS | | $ | 36,039,301 | | | $ | 63,187,681 | | | $ | 420,821,427 | | | $ | 395,631,418 | |
| | | | | | | | | | | | | | | | | |
| | | | | | | | | | | | | | | | | |
| | | | | | | | | | | | | | | | |
| + Including securities loaned at value | | $ | — | | | $ | 5,666,508 | | | $ | — | | | $ | 6,608,433 | |
| * Cost of investments in securities | | $ | 55,952,546 | | | $ | 114,001,970 | | | $ | 646,758,388 | | | $ | 690,226,911 | |
| ** Cost of investments in affiliates | | $ | — | | | $ | — | | | $ | — | | | $ | 375,295 | |
| *** Cost of short-term investments | | $ | — | | | $ | 6,221,322 | | | $ | — | | | $ | 7,042,553 | |
| **** Cost of foreign currencies | | $ | 53,972 | | | $ | 308,982 | | | $ | 90,340 | | | $ | 967,050 | |
See Accompanying Notes to Financial Statements
64
STATEMENTS OF ASSETS AND LIABILITIES as of October 31, 2008 (continued)
| | | | | | | | | | | | | | | | | |
| | | ING
| | ING
| | ING
| | ING
|
| | | International
| | International
| | International
| | International
|
| | | Equity
| | Growth
| | Real
| | SmallCap
|
| | | Dividend
| | Opportunities
| | Estate
| | Multi-Manager
|
| | | Fund | | Fund | | Fund | | Fund |
| |
Class A: | | | | | | | | | | | | | | | | |
| Net assets | | $ | 1,520,567 | | | $ | 25,104,359 | | | $ | 89,623,401 | | | $ | 160,896,312 | |
| Shares authorized | | | unlimited | | | | unlimited | | | | unlimited | | | | unlimited | |
| Par value | | $ | — | | | $ | — | | | $ | — | | | $ | — | |
| Shares outstanding | | | 283,907 | | | | 4,264,349 | | | | 12,971,793 | | | | 7,079,874 | |
| Net asset value and redemption price per share | | $ | 5.36 | | | $ | 5.89 | | | $ | 6.91 | | | $ | 22.73 | |
Maximum offering price per share (5.75%)(1) | | $ | 5.69 | | | $ | 6.25 | | | $ | 7.33 | | | $ | 24.12 | |
Class B: | | | | | | | | | | | | | | | | |
| Net assets | | $ | 164,539 | | | $ | 4,475,757 | | | $ | 4,003,577 | | | $ | 11,891,978 | |
| Shares authorized | | | unlimited | | | | unlimited | | | | unlimited | | | | unlimited | |
| Par value | | $ | — | | | $ | — | | | $ | — | | | $ | — | |
| Shares outstanding | | | 30,783 | | | | 805,491 | | | | 581,538 | | | | 506,574 | |
Net asset value and redemption price per share(2) | | $ | 5.35 | | | $ | 5.56 | | | $ | 6.88 | | | $ | 23.48 | |
| Maximum offering price per share | | $ | 5.35 | | | $ | 5.56 | | | $ | 6.88 | | | $ | 23.48 | |
Class C: | | | | | | | | | | | | | | | | |
| Net assets | | $ | 730,239 | | | $ | 6,657,204 | | | $ | 36,660,790 | | | $ | 29,760,281 | |
| Shares authorized | | | unlimited | | | | unlimited | | | | unlimited | | | | unlimited | |
| Par value | | $ | — | | | $ | — | | | $ | — | | | $ | — | |
| Shares outstanding | | | 136,571 | | | | 1,195,934 | | | | 5,329,561 | | | | 1,406,812 | |
Net asset value and redemption price per share(2) | | $ | 5.35 | | | $ | 5.57 | | | $ | 6.88 | | | $ | 21.15 | |
| Maximum offering price per share | | $ | 5.35 | | | $ | 5.57 | | | $ | 6.88 | | | $ | 21.15 | |
Class I: | | | | | | | | | | | | | | | | |
| Net assets | | $ | 33,612,246 | | | $ | 16,963,877 | | | $ | 290,226,800 | | | $ | 139,212,589 | |
| Shares authorized | | | unlimited | | | | unlimited | | | | unlimited | | | | unlimited | |
| Par value | | $ | — | | | $ | — | | | $ | — | | | $ | — | |
| Shares outstanding | | | 6,274,454 | | | | 2,886,381 | | | | 41,937,961 | | | | 6,093,000 | |
| Net asset value and redemption price per share | | $ | 5.36 | | | $ | 5.88 | | | $ | 6.92 | | | $ | 22.85 | |
| Maximum offering price per share | | $ | 5.36 | | | $ | 5.88 | | | $ | 6.92 | | | $ | 22.85 | |
Class O: | | | | | | | | | | | | | | | | |
| Net assets | | | n/a | | | | n/a | | | | n/a | | | $ | 61,776 | |
| Shares authorized | | | n/a | | | | n/a | | | | n/a | | | | unlimited | |
| Par value | | | n/a | | | | n/a | | | | n/a | | | $ | — | |
| Shares outstanding | | | n/a | | | | n/a | | | | n/a | | | | 2,716 | |
| Net asset value and redemption price per share | | | n/a | | | | n/a | | | | n/a | | | $ | 22.75 | |
| Maximum offering price per share | | | n/a | | | | n/a | | | | n/a | | | $ | 22.75 | |
Class Q: | | | | | | | | | | | | | | | | |
| Net assets | | | n/a | | | $ | 9,986,484 | | | | n/a | | | $ | 43,442,661 | |
| Shares authorized | | | n/a | | | | unlimited | | | | n/a | | | | unlimited | |
| Par value | | | n/a | | | $ | — | | | | n/a | | | $ | — | |
| Shares outstanding | | | n/a | | | | 1,713,035 | | | | n/a | | | | 1,755,618 | |
| Net asset value and redemption price per share | | | n/a | | | $ | 5.83 | | | | n/a | | | $ | 24.74 | |
| Maximum offering price per share | | | n/a | | | $ | 5.83 | | | | n/a | | | $ | 24.74 | |
Class W: | | | | | | | | | | | | | | | | |
| Net assets | | $ | 11,710 | | | | n/a | | | $ | 306,859 | | | $ | 10,365,821 | |
| Shares authorized | | | unlimited | | | | n/a | | | | unlimited | | | | unlimited | |
| Par value | | $ | — | | | | n/a | | | $ | — | | | $ | — | |
| Shares outstanding | | | 2,185 | | | | n/a | | | | 44,380 | | | | 386,280 | |
| Net asset value and redemption price per share | | $ | 5.36 | | | | n/a | | | $ | 6.91 | | | $ | 26.83 | |
| Maximum offering price per share | | $ | 5.36 | | | | n/a | | | $ | 6.91 | | | $ | 26.83 | |
| |
| (1) | Maximum offering price is computed at 100/94.25 of net asset value. On purchases of $50,000 or more, the offering price is reduced. |
| (2) | Redemption price per share may be reduced for any applicable contingent deferred sales charges. |
See Accompanying Notes to Financial Statements
65
STATEMENTS OF ASSETS AND LIABILITIES as of October 31, 2008
| | | | | | | | | | | | | |
| | | ING
| | ING
| | |
| | | International
| | International
| | ING
|
| | | Value
| | Value Choice
| | Russia
|
| | | Fund | | Fund | | Fund |
| |
ASSETS: | | | | | | | | | | | | |
| Investments in securities at value+* | | $ | 1,956,416,835 | | | $ | 48,357,442 | | | $ | 222,895,209 | |
| Short-term investments** | | | 110,326,097 | | | | — | | | | 32,130,516 | |
| Short-term investments in affiliates at amortized cost | | | 21,129,814 | | | | — | | | | — | |
| Cash | | | 150 | | | | — | | | | 24,874,542 | |
| Receivables: | | | | | | | | | | | | |
| Investment securities sold | | | 123,710,357 | | | | 1,587,733 | | | | 22,945,545 | |
| Fund shares sold | | | 1,638,529 | | | | 16,825 | | | | 677,572 | |
| Dividends and interest | | | 15,103,419 | | | | 175,973 | | | | 4,888,498 | |
| Prepaid expenses | | | 66,072 | | | | 21,997 | | | | 28,432 | |
| | | | | | | | | | | | | |
| Total assets | | | 2,228,391,273 | | | | 50,159,970 | | | | 308,440,314 | |
| | | | | | | | | | | | | |
| | | | | | | | | | | | | |
LIABILITIES: | | | | | | | | | | | | |
| Payable for investment securities purchased | | | 7,604,934 | | | | 413 | | | | 9,673,451 | |
| Payable for fund shares redeemed | | | 9,917,750 | | | | 1,016,156 | | | | 3,644,916 | |
| Payable upon receipt of securities loaned | | | 111,387,120 | | | | — | | | | 32,873,094 | |
| Payable to affiliates | | | 2,733,198 | | | | 55,278 | | | | 372,434 | |
| Payable to custodian due to bank overdraft | | | — | | | | 15,199 | | | | — | |
| Payable to custodian due to foreign currency overdraft*** | | | 3,021,923 | | | | 1,366 | | | | — | |
| Payable for directors fees | | | 24,564 | | | | 1,399 | | | | 18,811 | |
| Other accrued expenses and liabilities | | | 1,590,203 | | | | 35,910 | | | | 730,239 | |
| | | | | | | | | | | | | |
| Total liabilities | | | 136,279,692 | | | | 1,125,721 | | | | 47,312,945 | |
| | | | | | | | | | | | | |
NET ASSETS | | $ | 2,092,111,581 | | | $ | 49,034,249 | | | $ | 261,127,369 | |
| | | | | | | | | | | | | |
| | | | | | | | | | | | | |
NET ASSETS WERE COMPRISED OF: | | | | | | | | | | | | |
| Paid-in capital | | $ | 2,968,551,186 | | | $ | 76,742,270 | | | $ | 405,877,023 | |
| Undistributed net investment income | | | 63,338,094 | | | | 557,203 | | | | — | |
| Accumulated net realized gain (loss) on investments and foreign currency related transactions | | | 256,975,690 | | | | (1,044,972 | ) | | | 81,796,694 | |
| Net unrealized depreciation on investments and foreign currency related transactions | | | (1,196,753,389 | ) | | | (27,220,252 | ) | | | (226,546,348 | ) |
| | | | | | | | | | | | | |
NET ASSETS | | $ | 2,092,111,581 | | | $ | 49,034,249 | | | $ | 261,127,369 | |
| | | | | | | | | | | | | |
| | | | | | | | | | | | | |
| | | | | | | | | | | | |
| + Including securities loaned at value | | $ | 100,135,669 | | | $ | — | | | $ | 31,708,315 | |
| * Cost of investments in securities | | $ | 3,159,672,707 | | | $ | 75,597,882 | | | $ | 448,548,296 | |
| ** Cost of short-term investments | | $ | 111,387,120 | | | $ | — | | | $ | 32,873,094 | |
| *** Cost of foreign currency overdraft | | $ | 3,009,379 | | | $ | 1,332 | | | $ | — | |
See Accompanying Notes to Financial Statements
66
STATEMENTS OF ASSETS AND LIABILITIES as of October 31, 2008 (continued)
| | | | | | | | | | | | | |
| | | ING
| | ING
| | |
| | | International
| | International
| | ING
|
| | | Value
| | Value Choice
| | Russia
|
| | | Fund | | Fund | | Fund |
| |
Class A: | | | | | | | | | | | | |
| Net assets | | $ | 931,161,998 | | | $ | 8,939,869 | | | $ | 261,127,369 | |
| Shares authorized | | | unlimited | | | | unlimited | | | | unlimited | |
| Par value | | $ | 0.01 | | | $ | — | | | $ | — | |
| Shares outstanding | | | 83,633,665 | | | | 1,182,801 | | | | 10,201,207 | |
| Net asset value and redemption price per share | | $ | 11.13 | | | $ | 7.56 | | | $ | 25.60 | |
Maximum offering price per share (5.75%)(1) | | $ | 11.81 | | | $ | 8.02 | | | $ | 27.16 | |
Class B: | | | | | | | | | | | | |
| Net assets | | $ | 85,873,276 | | | $ | 1,738,374 | | | | n/a | |
| Shares authorized | | | unlimited | | | | unlimited | | | | n/a | |
| Par value | | $ | 0.01 | | | $ | — | | | | n/a | |
| Shares outstanding | | | 7,890,386 | | | | 233,739 | | | | n/a | |
Net asset value and redemption price per share(2) | | $ | 10.88 | | | $ | 7.44 | | | | n/a | |
| Maximum offering price per share | | $ | 10.88 | | | $ | 7.44 | | | | n/a | |
Class C: | | | | | | | | | | | | |
| Net assets | | $ | 326,811,972 | | | $ | 2,267,459 | | | | n/a | |
| Shares authorized | | | unlimited | | | | unlimited | | | | n/a | |
| Par value | | $ | 0.01 | | | $ | — | | | | n/a | |
| Shares outstanding | | | 30,283,030 | | | | 304,004 | | | | n/a | |
Net asset value and redemption price per share(2) | | $ | 10.79 | | | $ | 7.46 | | | | n/a | |
| Maximum offering price per share | | $ | 10.79 | | | $ | 7.46 | | | | n/a | |
Class I: | | | | | | | | | | | | |
| Net assets | | $ | 735,621,537 | | | $ | 36,088,547 | | | | n/a | |
| Shares authorized | | | unlimited | | | | unlimited | | | | n/a | |
| Par value | | $ | 0.01 | | | $ | — | | | | n/a | |
| Shares outstanding | | | 65,921,935 | | | | 4,770,258 | | | | n/a | |
| Net asset value and redemption price per share | | $ | 11.16 | | | $ | 7.57 | | | | n/a | |
| Maximum offering price per share | | $ | 11.16 | | | $ | 7.57 | | | | n/a | |
Class Q: | | | | | | | | | | | | |
| Net assets | | $ | 12,642,798 | | | | n/a | | | | n/a | |
| Shares authorized | | | unlimited | | | | n/a | | | | n/a | |
| Par value | | $ | 0.01 | | | | n/a | | | | n/a | |
| Shares outstanding | | | 1,130,648 | | | | n/a | | | | n/a | |
| Net asset value and redemption price per share | | $ | 11.18 | | | | n/a | | | | n/a | |
| Maximum offering price per share | | $ | 11.18 | | | | n/a | | | | n/a | |
| |
| (1) | Maximum offering price is computed at 100/94.25 of net asset value. On purchases of $50,000 or more, the offering price is reduced. |
| (2) | Redemption price per share may be reduced for any applicable contingent deferred sales charges. |
See Accompanying Notes to Financial Statements
67
STATEMENTS OF ASSETS AND LIABILITIES as of October 31, 2008
| | | | | | | | | | | | | |
| | | ING
| | | | |
| | | Emerging
| | ING
| | ING
|
| | | Markets
| | Global
| | Diversified
|
| | | Fixed Income
| | Bond
| | International
|
| | | Fund | | Fund | | Fund |
| |
ASSETS: | | | | | | | | | | | | |
| Investments in securities at value* | | $ | 177,402,904 | | | $ | 100,285,342 | | | $ | — | |
| Investments in affiliates** | | | — | | | | — | | | | 267,830,664 | |
| Short-term investments*** | | | — | | | | 794,889 | | | | — | |
| Short-term investments in affiliates at amortized cost | | | — | | | | 21,125,000 | | | | — | |
| Short-term investments at amortized cost | | | — | | | | 568,000 | | | | — | |
| Cash | | | 45,642,803 | | | | 11,563,563 | | | | 1,123,333 | |
| Cash collateral for futures | | | 98,600 | | | | 1,994,764 | | | | — | |
| Foreign currencies at value**** | | | — | | | | 6,778,146 | | | | — | |
| Receivables: | | | | | | | | | | | | |
| Investment securities sold on a delayed-delivery or when-issued basis | | | — | | | | 22,388,945 | | | | — | |
| Investment securities sold | | | 10,238,563 | | | | 7,353,008 | | | | 337,507 | |
| Fund shares sold | | | 307,334 | | | | 355,143 | | | | 521,864 | |
| Dividends and interest | | | 5,010,376 | | | | 918,502 | | | | — | |
| Variation margin | | | — | | | | 160,121 | | | | — | |
| Unrealized appreciation on forward foreign currency contracts | | | 1,776,184 | | | | 4,464,332 | | | | — | |
| Upfront payments made on swap agreements | | | — | | | | 45,647 | | | | — | |
| Unrealized appreciation on swap agreements | | | — | | | | 944,995 | | | | — | |
| Prepaid expenses | | | 40,585 | | | | 45,966 | | | | 83,396 | |
| Reimbursement due from manager | | | — | | | | 19,174 | | | | 150,170 | |
| | | | | | | | | | | | | |
| Total assets | | | 240,517,349 | | | | 179,805,537 | | | | 270,046,934 | |
| | | | | | | | | | | | | |
| | | | | | | | | | | | | |
LIABILITIES: | | | | | | | | | | | | |
| Payable for investment securities purchased on a delayed-delivery or when-issued basis | | | — | | | | 38,012,644 | | | | — | |
| Payable for investment securities purchased | | | — | | | | 22,396,713 | | | | 4,493 | |
| Payable for terminated investment contracts | | | — | | | | 163,367 | | | | — | |
| Payable for fund shares redeemed | | | 25,477 | | | | 687,664 | | | | 1,495,521 | |
| Payable for futures variation margin | | | 8,157 | | | | 198,768 | | | | — | |
| Unrealized depreciation on forward foreign currency contracts | | | 3,620,004 | | | | 4,059,554 | | | | — | |
| Upfront payments received on swap agreements | | | — | | | | 2,549 | | | | — | |
| Unrealized depreciation on swap agreements | | | — | | | | 866,400 | | | | — | |
| Income distribution payable | | | — | | | | 675 | | | | — | |
| Payable to affiliates | | | 145,880 | | | | 91,759 | | | | 153,811 | |
| Payable to custodian due to foreign currency overdraft***** | | | 4,369,669 | | | | — | | | | — | |
| Payable for directors fees | | | 361 | | | | 724 | | | | 1,157 | |
| Other accrued expenses and liabilities | | | 67,538 | | | | 55,196 | | | | 263,369 | |
| | | | | | | | | | | | | |
| Total liabilities | | | 8,237,086 | | | | 66,536,013 | | | | 1,918,351 | |
| | | | | | | | | | | | | |
NET ASSETS | | $ | 232,280,263 | | | $ | 113,269,524 | | | $ | 268,128,583 | |
| | | | | | | | | | | | | |
| | | | | | | | | | | | | |
NET ASSETS WERE COMPRISED OF: | | | | | | | | | | | | |
| Paid-in capital | | $ | 339,327,103 | | | $ | 118,621,609 | | | $ | 466,155,686 | |
| Undistributed net investment income | | | 782,266 | | | | 23,882 | | | | 20,777,313 | |
| Accumulated net realized gain (loss) on investments, foreign currency related transactions, futures, swaps, and written options | | | (8,327,885 | ) | | | 1,074,790 | | | | (41,077,362 | ) |
| Net unrealized depreciation on investments, foreign currency related transactions, futures, and swaps | | | (99,501,221 | ) | | | (6,450,757 | ) | | | (177,727,054 | ) |
| | | | | | | | | | | | | |
NET ASSETS | | $ | 232,280,263 | | | $ | 113,269,524 | | | $ | 268,128,583 | |
| | | | | | | | | | | | | |
| | | | | | | | | | | | | |
| | | | | | | | | | | | |
| * Cost of investments in securities | | $ | 274,923,243 | | | $ | 107,872,266 | | | $ | — | |
| ** Cost of investments in affiliates | | $ | — | | | $ | — | | | $ | 445,557,718 | |
| *** Cost of short-term investments | | $ | — | | | $ | 910,610 | | | $ | — | |
| **** Cost of foreign currencies | | $ | — | | | $ | 7,055,370 | | | $ | — | |
| ***** Cost of foreign currency overdraft | | $ | 4,351,163 | | | $ | — | | | $ | — | |
See Accompanying Notes to Financial Statements
68
STATEMENTS OF ASSETS AND LIABILITIES as of October 31, 2008 (continued)
| | | | | | | | | | | | | |
| | | ING
| | | | |
| | | Emerging
| | ING
| | ING
|
| | | Markets
| | Global
| | Diversified
|
| | | Fixed Income
| | Bond
| | International
|
| | | Fund | | Fund | | Fund |
| |
Class A: | | | | | | | | | | | | |
| Net assets | | $ | 2,779,145 | | | $ | 79,450,550 | | | $ | 167,282,067 | |
| Shares authorized | | | unlimited | | | | unlimited | | | | unlimited | |
| Par value | | $ | — | | | $ | — | | | $ | — | |
| Shares outstanding | | | 414,392 | | | | 7,793,109 | | | | 22,930,865 | |
| Net asset value and redemption price per share | | $ | 6.71 | | | $ | 10.19 | | | $ | 7.30 | |
| Maximum offering price per share | | $ | 6.88 | (1) | | $ | 10.46 | (1) | | $ | 7.75 | (2) |
Class B: | | | | | | | | | | | | |
| Net assets | | $ | 209,545 | | | $ | 4,085,028 | | | $ | 20,167,431 | |
| Shares authorized | | | unlimited | | | | unlimited | | | | unlimited | |
| Par value | | $ | — | | | $ | — | | | $ | — | |
| Shares outstanding | | | 31,335 | | | | 401,978 | | | | 2,792,787 | |
Net asset value and redemption price per share(3) | | $ | 6.69 | | | $ | 10.16 | | | $ | 7.22 | |
| Maximum offering price per share | | $ | 6.69 | | | $ | 10.16 | | | $ | 7.22 | |
Class C: | | | | | | | | | | | | |
| Net assets | | $ | 1,017,535 | | | $ | 29,009,097 | | | $ | 78,834,425 | |
| Shares authorized | | | unlimited | | | | unlimited | | | | unlimited | |
| Par value | | $ | — | | | $ | — | | | $ | — | |
| Shares outstanding | | | 152,245 | | | | 2,843,781 | | | | 10,933,555 | |
Net asset value and redemption price per share(3) | | $ | 6.68 | | | $ | 10.20 | | | $ | 7.21 | |
| Maximum offering price per share | | $ | 6.68 | | | $ | 10.20 | | | $ | 7.21 | |
Class I: | | | | | | | | | | | | |
| Net assets | | $ | 228,274,038 | | | $ | 502,999 | | | $ | 15,596 | |
| Shares authorized | | | unlimited | | | | unlimited | | | | unlimited | |
| Par value | | $ | — | | | $ | — | | | $ | — | |
| Shares outstanding | | | 34,124,602 | | | | 49,271 | | | | 2,135 | |
| Net asset value and redemption price per share | | $ | 6.69 | | | $ | 10.21 | | | $ | 7.30 | |
| Maximum offering price per share | | $ | 6.69 | | | $ | 10.21 | | | $ | 7.30 | |
Class O: | | | | | | | | | | | | |
| Net assets | | | n/a | | | $ | 221,850 | | | $ | 140,170 | |
| Shares authorized | | | n/a | | | | unlimited | | | | unlimited | |
| Par value | | | n/a | | | $ | — | | | $ | — | |
| Shares outstanding | | | n/a | | | | 21,855 | | | | 19,217 | |
| Net asset value and redemption price per share | | | n/a | | | $ | 10.15 | | | $ | 7.29 | |
| Maximum offering price per share | | | n/a | | | $ | 10.15 | | | $ | 7.29 | |
Class R: | | | | | | | | | | | | |
| Net assets | | | n/a | | | | n/a | | | $ | 182,563 | |
| Shares authorized | | | n/a | | | | n/a | | | | unlimited | |
| Par value | | | n/a | | | | n/a | | | $ | — | |
| Shares outstanding | | | n/a | | | | n/a | | | | 25,283 | |
| Net asset value and redemption price per share | | | n/a | | | | n/a | | | $ | 7.22 | |
| Maximum offering price per share | | | n/a | | | | n/a | | | $ | 7.22 | |
Class W: | | | | | | | | | | | | |
| Net assets | | | n/a | | | | n/a | | | $ | 1,506,331 | |
| Shares authorized | | | n/a | | | | n/a | | | | unlimited | |
| Par value | | | n/a | | | | n/a | | | $ | — | |
| Shares outstanding | | | n/a | | | | n/a | | | | 206,489 | |
| Net asset value and redemption price per share | | | n/a | | | | n/a | | | $ | 7.29 | |
| Maximum offering price per share | | | n/a | | | | n/a | | | $ | 7.29 | |
| |
| (1) | Maximum offering price is 2.50% and is computed at 100/97.50 of net asset value. On purchases of $100,000 or more, the offering price is reduced. |
| (2) | Maximum offering price is 5.75% and computed at 100/94.25 of net asset value. On purchases of $100,000 or more, the offering price is reduced. |
| (3) | Redemption price per share may be reduced for any applicable contingent deferred sales charges. |
See Accompanying Notes to Financial Statements
69
STATEMENTS OF OPERATIONS for the year ended October 31, 2008
| | | | | | | | | | | | | | | | | |
| | | ING
| | ING
| | ING
| | ING
|
| | | Global
| | Global
| | Global
| | Global
|
| | | Equity
| | Natural
| | Real
| | Value
|
| | | Dividend
| | Resources
| | Estate
| | Choice
|
| | | Fund | | Fund | | Fund | | Fund |
| |
INVESTMENT INCOME: | | | | | | | | | | | | | | | | |
Dividends, net of foreign taxes withheld*(1) | | $ | 14,287,405 | | | $ | 2,580,793 | | | $ | 47,024,008 | | | $ | 1,980,620 | |
| Interest | | | 69,793 | | | | 6,570 | | | | 841,511 | | | | 120,168 | |
| Securities lending income, net | | | 112,977 | | | | — | | | | 696,647 | | | | 162,461 | |
| | | | | | | | | | | | | | | | | |
| Total investment income | | | 14,470,175 | | | | 2,587,363 | | | | 48,562,166 | | | | 2,263,249 | |
| | | | | | | | | | | | | | | | | |
| | | | | | | | | | | | | | | | | |
EXPENSES: | | | | | | | | | | | | | | | | |
| Investment management fees | | | 1,921,120 | | | | 1,183,178 | | | | 11,202,285 | | | | 1,076,022 | |
| Distribution and service fees: | | | | | | | | | | | | | | | | |
| Class A | | | 305,554 | | | | 352,700 | | | | 2,610,344 | | | | 154,334 | |
| Class B | | | 403,751 | | | | — | | | | 408,133 | | | | 149,987 | |
| Class C | | | 898,175 | | | | — | | | | 2,410,335 | | | | 339,081 | |
| Class O | | | 53,929 | | | | — | | | | 50,489 | | | | — | |
| Class Q | | | — | | | | — | | | | — | | | | 5,466 | |
| Transfer agent fees: | | | | | | | | | | | | | | | | |
| Class A | | | 191,365 | | | | 149,162 | | | | 1,888,451 | | | | 93,863 | |
| Class B | | | 63,586 | | | | — | | | | 73,466 | | | | 25,076 | |
| Class C | | | 141,732 | | | | — | | | | 434,467 | | | | 55,790 | |
| Class I | | | 266 | | | | — | | | | 55,290 | | | | 1,204 | |
| Class O | | | 32,986 | | | | — | | | | 36,425 | | | | — | |
| Class Q | | | — | | | | — | | | | — | | | | 327 | |
| Class W | | | 14 | | | | — | | | | 8,186 | | | | — | |
| Administrative service fees | | | 274,441 | | | | 141,088 | | | | 1,537,802 | | | | 117,223 | |
| Shareholder reporting expense | | | 316,284 | | | | 100,090 | | | | 1,420,133 | | | | 70,376 | |
| Registration fees | | | 98,203 | | | | 53,738 | | | | 192,631 | | | | 62,195 | |
| Professional fees | | | 44,933 | | | | 25,362 | | | | 144,842 | | | | 21,041 | |
| Custody and accounting expense | | | 94,278 | | | | 38,370 | | | | 519,348 | | | | 31,937 | |
| Directors fees | | | 8,562 | | | | 2,928 | | | | 42,106 | | | | 10,301 | |
| Miscellaneous expense | | | 11,940 | | | | 9,276 | | | | 38,006 | | | | 9,726 | |
| Interest expense | | | 456 | | | | 7,001 | | | | 1,725 | | | | 832 | |
| Foreign overdraft expense | | | 19,829 | | | | — | | | | — | | | | — | |
| | | | | | | | | | | | | | | | | |
| Total expenses | | | 4,881,404 | | | | 2,062,893 | | | | 23,074,464 | | | | 2,224,781 | |
| Net waived and reimbursed fees | | | (46,818 | ) | | | (276 | ) | | | (7,607 | ) | | | (74,748 | ) |
| Brokerage commission recapture | | | — | | | | — | | | | (447 | ) | | | (17,971 | ) |
| | | | | | | | | | | | | | | | | |
| Net expenses | | | 4,834,586 | | | | 2,062,617 | | | | 23,066,410 | | | | 2,132,062 | |
| | | | | | | | | | | | | | | | | |
| Net investment income | | | 9,635,589 | | | | 524,746 | | | | 25,495,756 | | | | 131,187 | |
| | | | | | | | | | | | | | | | | |
| | | | | | | | | | | | | | | | | |
REALIZED AND UNREALIZED GAIN (LOSS) ON INVESTMENTS AND FOREIGN CURRENCY RELATED TRANSACTIONS: | | | | | | | | | | | | | | | | |
| Net realized gain (loss) on: | | | | | | | | | | | | | | | | |
| Investments | | | (30,213,467 | ) | | | 6,588,019 | | | | (220,841,645 | ) | | | 6,461,914 | |
| Foreign currency related transactions | | | (631,243 | ) | | | (23,721 | ) | | | (602,190 | ) | | | (91,681 | ) |
| | | | | | | | | | | | | | | | | |
| Net realized gain (loss) on investments and foreign currency related transactions | | | (30,844,710 | ) | | | 6,564,298 | | | | (221,443,835 | ) | | | 6,370,233 | |
| | | | | | | | | | | | | | | | | |
| Net change in unrealized appreciation or depreciation on: | | | | | | | | | | | | | | | | |
| Investments | | | (106,332,585 | ) | | | (68,152,816 | ) | | | (761,672,499 | ) | | | (59,945,807 | ) |
| Foreign currency related transactions | | | (43,417 | ) | | | (32,227 | ) | | | (27,631 | ) | | | 8,283 | |
| | | | | | | | | | | | | | | | | |
| Net change in unrealized appreciation or depreciation on investments and foreign currency related transactions | | | (106,376,002 | ) | | | (68,185,043 | ) | | | (761,700,130 | ) | | | (59,937,524 | ) |
| | | | | | | | | | | | | | | | | |
| Net realized and unrealized loss on investments and foreign currency related transactions | | | (137,220,712 | ) | | | (61,620,745 | ) | | | (983,143,965 | ) | | | (53,567,291 | ) |
| | | | | | | | | | | | | | | | | |
Decrease in net assets resulting from operations | | $ | (127,585,123 | ) | | $ | (61,095,999 | ) | | $ | (957,648,209 | ) | | $ | (53,436,104 | ) |
| | | | | | | | | | | | | | | | | |
| | | | | | | | | | | | | | | | | |
| | | | | | | | | | | | | | | | |
| * Foreign taxes withheld | | $ | 886,730 | | | $ | 99,620 | | | $ | 3,898,366 | | | $ | 108,121 | |
(1) Dividends from affiliates | | $ | — | | | $ | 12,150 | | | $ | 243,833 | | | $ | 5,392 | |
See Accompanying Notes to Financial Statements
70
STATEMENTS OF OPERATIONS for the year ended October 31, 2008
| | | | | | | | | | | | | | | | | |
| | | ING
| | ING
| | | | ING
|
| | | Asia-Pacific
| | Disciplined
| | ING
| | European
|
| | | Real
| | International
| | Emerging
| | Real
|
| | | Estate
| | SmallCap
| | Countries
| | Estate
|
| | | Fund | | Fund | | Fund | | Fund |
| |
INVESTMENT INCOME: | | | | | | | | | | | | | | | | |
Dividends, net of foreign taxes withheld*(1) | | $ | 197,766 | | | $ | 9,416,705 | | | $ | 8,324,779 | | | $ | 165,579 | |
| Interest | | | 3,486 | | | | 1,015,599 | | | | 673,679 | | | | 3,256 | |
| Securities lending income, net | | | — | | | | — | | | | 152,335 | | | | — | |
| | | | | | | | | | | | | | | | | |
| Total investment income | | | 201,252 | | | | 10,432,304 | | | | 9,150,793 | | | | 168,835 | |
| | | | | | | | | | | | | | | | | |
| | | | | | | | | | | | | | | | | |
EXPENSES: | | | | | | | | | | | | | | | | |
| Investment management fees | | | 59,451 | | | | 2,131,092 | | | | 3,044,161 | | | | 51,356 | |
| Distribution and service fees: | | | | | | | | | | | | | | | | |
| Class A | | | 10,782 | | | | 235 | | | | 519,164 | | | | 12,633 | |
| Class B | | | 197 | | | | 44 | | | | 118,167 | | | | 103 | |
| Class C | | | 16,120 | | | | 425 | | | | 395,060 | | | | 712 | |
| Class Q | | | — | | | | — | | | | 37,420 | | | | — | |
| Transfer agent fees: | | | | | | | | | | | | | | | | |
| Class A | | | 6,890 | | | | 45 | | | | 187,671 | | | | 5,205 | |
| Class B | | | 7 | | | | 2 | | | | 14,935 | | | | 15 | |
| Class C | | | 577 | | | | 22 | | | | 49,941 | | | | 81 | |
| Class I | | | 1 | | | | 4,473 | | | | 11,759 | | | | — | |
| Class Q | | | — | | | | — | | | | 7,278 | | | | — | |
| Class W | | | — | | | | — | | | | 17 | | | | — | |
| Administrative service fees | | | 5,945 | | | | 355,178 | | | | 243,529 | | | | 5,135 | |
| Shareholder reporting expense | | | 2,520 | | | | 54,848 | | | | 205,088 | | | | 2,789 | |
| Registration fees | | | 13,040 | | | | 52,428 | | | | 92,922 | | | | 14,234 | |
| Professional fees | | | 15,281 | | | | 50,838 | | | | 35,356 | | | | 17,886 | |
| Custody and accounting expense | | | 27,936 | | | | 265,630 | | | | 297,644 | | | | 16,865 | |
| Directors fees | | | 1,738 | | | | 10,364 | | | | 9,551 | | | | 2,402 | |
| Offering expense | | | 95,526 | | | | — | | | | — | | | | 93,519 | |
| Miscellaneous expense | | | 3,117 | | | | 15,617 | | | | 13,771 | | | | 6,632 | |
| Interest expense | | | — | | | | 14,677 | | | | 11,290 | | | | — | |
| | | | | | | | | | | | | | | | | |
| Total expenses | | | 259,128 | | | | 2,955,918 | | | | 5,294,724 | | | | 229,567 | |
| Net waived and reimbursed fees | | | (142,894 | ) | | | — | | | | (237,321 | ) | | | (138,639 | ) |
| Brokerage commission recapture | | | — | | | | — | | | | (43,884 | ) | | | — | |
| | | | | | | | | | | | | | | | | |
| Net expenses | | | 116,234 | | | | 2,955,918 | | | | 5,013,519 | | | | 90,928 | |
| | | | | | | | | | | | | | | | | |
| Net investment income | | | 85,018 | | | | 7,476,386 | | | | 4,137,274 | | | | 77,907 | |
| | | | | | | | | | | | | | | | | |
| | | | | | | | | | | | | | | | | |
REALIZED AND UNREALIZED GAIN (LOSS) ON INVESTMENTS AND FOREIGN CURRENCY RELATED TRANSACTIONS: | | | | | | | | | | | | | | | | |
| Net realized gain (loss) on: | | | | | | | | | | | | | | | | |
| Investments | | | (2,015,703 | ) | | | (72,489,793 | ) | | | (63,120,629 | ) | | | (1,146,491 | ) |
| Foreign currency related transactions | | | (28,539 | ) | | | 18,800 | | | | (1,129,591 | ) | | | (23,492 | ) |
| | | | | | | | | | | | | | | | | |
| Net realized loss on investments and foreign currency related transactions | | | (2,044,242 | ) | | | (72,470,993 | ) | | | (64,250,220 | ) | | | (1,169,983 | ) |
| | | | | | | | | | | | | | | | | |
| Net change in unrealized appreciation or depreciation on: | | | | | | | | | | | | | | | | |
| Investments | | | (3,417,262 | ) | | | (163,316,064 | ) | | | (112,316,226 | ) | | | (1,678,154 | ) |
| Foreign currency related transactions | | | 955 | | | | 268,556 | | | | (12,051 | ) | | | (1,100 | ) |
| | | | | | | | | | | | | | | | | |
| Net change in unrealized appreciation or depreciation on investments and foreign currency related transactions | | | (3,416,307 | ) | | | (163,047,508 | ) | | | (112,328,277 | ) | | | (1,679,254 | ) |
| | | | | | | | | | | | | | | | | |
| Net realized and unrealized loss on investments and foreign currency related transactions | | | (5,460,549 | ) | | | (235,518,501 | ) | | | (176,578,497 | ) | | | (2,849,237 | ) |
| | | | | | | | | | | | | | | | | |
Decrease in net assets resulting from operations | | $ | (5,375,531 | ) | | $ | (228,042,115 | ) | | $ | (172,441,223 | ) | | $ | (2,771,330 | ) |
| | | | | | | | | | | | | | | | | |
| | | | | | | | | | | | | | | | | |
| | | | | | | | | | | | | | | | |
| * Foreign taxes withheld | | $ | 20,239 | | | $ | 956,791 | | | $ | 706,291 | | | $ | 26,944 | |
(1) Dividends from affiliates | | $ | 1,438 | | | $ | — | | | $ | — | | | $ | 652 | |
See Accompanying Notes to Financial Statements
71
STATEMENTS OF OPERATIONS for the year ended October 31, 2008
| | | | | | | | | | | | | | | | | |
| | | | | | | ING
| | ING
|
| | | | | ING
| | Index Plus
| | International
|
| | | ING
| | Greater
| | International
| | Capital
|
| | | Foreign
| | China
| | Equity
| | Appreciation
|
| | | Fund | | Fund | | Fund | | Fund |
| |
INVESTMENT INCOME: | | | | | | | | | | | | | | | | |
Dividends, net of foreign taxes withheld*(1) | | $ | 14,534,000 | | | $ | 1,314,461 | | | $ | 6,768,633 | | | $ | 2,586,595 | |
| Interest | | | 1,101,840 | | | | 21,541 | | | | 297,839 | | | | 145,328 | |
| Securities lending income, net | | | 188,212 | | | | — | | | | — | | | | — | |
| | | | | | | | | | | | | | | | | |
| Total investment income | | | 15,824,052 | | | | 1,336,002 | | | | 7,066,472 | | | | 2,731,923 | |
| | | | | | | | | | | | | | | | | |
| | | | | | | | | | | | | | | | | |
EXPENSES: | | | | | | | | | | | | | | | | |
| Investment management fees | | | 6,139,143 | | | | 672,510 | | | | 1,150,534 | | | | 1,044,605 | |
| Distribution and service fees: | | | | | | | | | | | | | | | | |
| Class A | | | 741,749 | | | | 116,587 | | | | 41,747 | | | | 10,696 | |
| Class B | | | 380,723 | | | | 48,725 | | | | 31,685 | | | | 7,179 | |
| Class C | | | 1,865,596 | | | | 68,723 | | | | 22,963 | | | | 9,350 | |
| Class O | | | — | | | | 128 | | | | 161,422 | | | | — | |
| Class Q | | | 1,643 | | | | — | | | | — | | | | — | |
| Transfer agent fees: | | | | | | | | | | | | | | | | |
| Class A | | | 283,379 | | | | 64,909 | | | | 71,410 | | | | 3,623 | |
| Class B | | | 36,392 | | | | 6,797 | | | | 13,770 | | | | 614 | |
| Class C | | | 178,180 | | | | 9,601 | | | | 9,842 | | | | 790 | |
| Class I | | | 16,106 | | | | 63 | | | | 4,135 | | | | 3,596 | |
| Class O | | | — | | | | 71 | | | | 279,472 | | | | — | |
| Class Q | | | 34 | | | | — | | | | — | | | | — | |
| Class W | | | 7 | | | | — | | | | — | | | | — | |
| Administrative service fees | | | 627,837 | | | | 58,478 | | | | 209,188 | | | | 122,893 | |
| Shareholder reporting expense | | | 286,423 | | | | 26,906 | | | | 172,571 | | | | 12,807 | |
| Registration fees | | | 108,290 | | | | 66,184 | | | | 78,736 | | | | 59,224 | |
| Professional fees | | | 66,125 | | | | 15,577 | | | | 98,592 | | | | 14,238 | |
| Custody and accounting expense | | | 667,681 | | | | 73,890 | | | | 140,544 | | | | 58,190 | |
| Directors fees | | | 20,092 | | | | 1,176 | | | | 8,868 | | | | 2,230 | |
| Miscellaneous expense | | | 20,818 | | | | 5,637 | | | | 22,841 | | | | 4,966 | |
| Interest expense | | | 2,763 | | | | 875 | | | | 52,262 | | | | 3,370 | |
| Foreign overdraft expense | | | — | | | | — | | | | 267,146 | | | | — | |
| | | | | | | | | | | | | | | | | |
| Total expenses | | | 11,442,981 | | | | 1,236,837 | | | | 2,837,728 | | | | 1,358,371 | |
| Net recouped (waived and reimbursed) fees | | | (31,310 | ) | | | (1 | ) | | | (900,183 | ) | | | 66,285 | |
| Brokerage commission recapture | | | (5,073 | ) | | | — | | | | — | | | | (3,066 | ) |
| | | | | | | | | | | | | | | | | |
| Net expenses | | | 11,406,598 | | | | 1,236,836 | | | | 1,937,545 | | | | 1,421,590 | |
| | | | | | | | | | | | | | | | | |
| Net investment income | | | 4,417,454 | | | | 99,166 | | | | 5,128,927 | | | | 1,310,333 | |
| | | | | | | | | | | | | | | | | |
| | | | | | | | | | | | | | | | | |
REALIZED AND UNREALIZED GAIN (LOSS) ON INVESTMENTS, FOREIGN CURRENCY RELATED TRANSACTIONS, AND FUTURES: | | | | | | | | | | | | | | | | |
| Net realized gain (loss) on: | | | | | | | | | | | | | | | | |
| Investments | | | (98,278,832 | ) | | | 2,393,183 | | | | (47,890,487 | ) | | | (8,119,504 | ) |
| Foreign currency related transactions | | | (13,646,911 | ) | | | (38,797 | ) | | | (610,889 | ) | | | (240,497 | ) |
| Futures | | | — | | | | — | | | | 2,338,608 | | | | — | |
| | | | | | | | | | | | | | | | | |
| Net realized gain (loss) on investments, foreign currency related transactions, and futures | | | (111,925,743 | ) | | | 2,354,386 | | | | (46,162,768 | ) | | | (8,360,001 | ) |
| | | | | | | | | | | | | | | | | |
| Net change in unrealized appreciation or depreciation on: | | | | | | | | | | | | | | | | |
| Investments | | | (256,093,107 | ) | | | (47,932,045 | ) | | | (75,097,252 | ) | | | (62,260,229 | ) |
| Foreign currency related transactions | | | 21,570,344 | | | | (1,365 | ) | | | (349,909 | ) | | | (8,896 | ) |
| | | | | | | | | | | | | | | | | |
| Net change in unrealized appreciation or depreciation on investments and foreign currency related transactions | | | (234,522,763 | ) | | | (47,933,410 | ) | | | (75,447,161 | ) | | | (62,269,125 | ) |
| | | | | | | | | | | | | | | | | |
| Net realized and unrealized loss on investments, foreign currency related transactions, and futures | | | (346,448,506 | ) | | | (45,579,024 | ) | | | (121,609,929 | ) | | | (70,629,126 | ) |
| | | | | | | | | | | | | | | | | |
Decrease in net assets resulting from operations | | $ | (342,031,052 | ) | | $ | (45,479,858 | ) | | $ | (116,481,002 | ) | | $ | (69,318,793 | ) |
| | | | | | | | | | | | | | | | | |
| | | | | | | | | | | | | | | | | |
| | | | | | | | | | | | | | | | |
| * Foreign taxes withheld | | $ | 1,659,112 | | | $ | 116,293 | | | $ | 721,041 | | | $ | 267,060 | |
(1) Dividends from affiliates | | $ | 87,076 | | | $ | — | | | $ | — | | | $ | — | |
See Accompanying Notes to Financial Statements
72
STATEMENTS OF OPERATIONS for the year ended October 31, 2008
| | | | | | | | | | | | | | | | | |
| | | ING
| | ING
| | | | ING
|
| | | International
| | International
| | ING
| | International
|
| | | Equity
| | Growth
| | International
| | SmallCap
|
| | | Dividend
| | Opportunities
| | Real Estate
| | Multi-Manager
|
| | | Fund | | Fund | | Fund | | Fund |
| |
INVESTMENT INCOME: | | | | | | | | | | | | | | | | |
Dividends, net of foreign taxes withheld*(1) | | $ | 2,812,816 | | | $ | 2,552,617 | | | $ | 19,144,421 | | | $ | 23,530,276 | |
| Interest | | | 56,972 | | | | 6,938 | | | | 424,229 | | | | 590,200 | |
| Securities lending income, net | | | — | | | | 46,577 | | | | — | | | | 419,886 | |
| | | | | | | | | | | | | | | | | |
| Total investment income | | | 2,869,788 | | | | 2,606,132 | | | | 19,568,650 | | | | 24,540,362 | |
| | | | | | | | | | | | | | | | | |
| | | | | | | | | | | | | | | | | |
EXPENSES: | | | | | | | | | | | | | | | | |
| Investment management fees | | | 406,444 | | | | 1,191,453 | | | | 5,449,831 | | | | 7,916,854 | |
| Distribution and service fees: | | | | | | | | | | | | | | | | |
| Class A | | | 8,157 | | | | 129,567 | | | | 491,898 | | | | 1,240,697 | |
| Class B | | | 2,488 | | | | 118,384 | | | | 78,751 | | | | 363,589 | |
| Class C | | | 13,881 | | | | 152,469 | | | | 849,931 | | | | 685,971 | |
| Class O | | | — | | | | — | | | | — | | | | 37 | |
| Class Q | | | — | | | | 59,725 | | | | — | | | | 230,927 | |
| Transfer agent fees: | | | | | | | | | | | | | | | | |
| Class A | | | 4,814 | | | | 64,882 | | | | 179,531 | | | | 354,981 | |
| Class B | | | 352 | | | | 14,907 | | | | 7,175 | | | | 36,388 | |
| Class C | | | 2,037 | | | | 19,092 | | | | 77,409 | | | | 68,686 | |
| Class I | | | 22,648 | | | | 2,023 | | | | 55,368 | | | | 112,315 | |
| Class O | | | — | | | | — | | | | — | | | | 15 | |
| Class Q | | | 77 | | | | 2,885 | | | | — | | | | 37,364 | |
| Class S | | | 28 | | | | — | | | | — | | | | — | |
| Class W | | | — | | | | — | | | | 263 | | | | 605 | |
| Administrative service fees | | | 54,192 | | | | 119,144 | | | | 588,103 | | | | 825,270 | |
| Shareholder reporting expense | | | 9,956 | | | | 115,460 | | | | 173,694 | | | | 368,939 | |
| Registration fees | | | 63,962 | | | | 63,914 | | | | 87,306 | | | | 143,101 | |
| Professional fees | | | 14,125 | | | | 30,016 | | | | 46,206 | | | | 206,597 | |
| Custody and accounting expense | | | 46,201 | | | | 83,594 | | | | 306,692 | | | | 659,085 | |
| Directors fees | | | 2,172 | | | | 3,827 | | | | 15,836 | | | | 24,699 | |
| Offering expense | | | 70,682 | | | | — | | | | — | | | | — | |
| Miscellaneous expense | | | 6,007 | | | | 13,800 | | | | 14,358 | | | | 36,861 | |
| Interest expense | | | — | | | | 5,772 | | | | 2,705 | | | | 108,972 | |
| | | | | | | | | | | | | | | | | |
| Total expenses | | | 728,223 | | | | 2,190,914 | | | | 8,425,057 | | | | 13,421,953 | |
| Net recouped (waived and reimbursed) fees | | | (122,873 | ) | | | (31,854 | ) | | | 137,094 | | | | (89 | ) |
| Brokerage commission recapture | | | — | | | | — | | | | — | | | | (10,373 | ) |
| | | | | | | | | | | | | | | | | |
| Net expenses | | | 605,350 | | | | 2,159,060 | | | | 8,562,151 | | | | 13,411,491 | |
| | | | | | | | | | | | | | | | | |
| Net investment income | | | 2,264,438 | | | | 447,072 | | | | 11,006,499 | | | | 11,128,871 | |
| | | | | | | | | | | | | | | | | |
| | | | | | | | | | | | | | | | | |
REALIZED AND UNREALIZED GAIN (LOSS) ON INVESTMENTS AND FOREIGN CURRENCY RELATED TRANSACTIONS: | | | | | | | | | | | | | | | | |
| Net realized loss on: | | | | | | | | | | | | | | | | |
| Investments (net of Indian capital gains tax withheld)** | | | (9,991,605 | ) | | | (5,096,807 | ) | | | (91,534,522 | ) | | | (157,669,074 | ) |
| Foreign currency related transactions | | | (297,232 | ) | | | (112,209 | ) | | | (738,804 | ) | | | (1,147,362 | ) |
| | | | | | | | | | | | | | | | | |
| Net realized loss on investments and foreign currency related transactions | | | (10,288,837 | ) | | | (5,209,016 | ) | | | (92,273,326 | ) | | | (158,816,436 | ) |
| | | | | | | | | | | | | | | | | |
| Net change in unrealized appreciation or depreciation on: | | | | | | | | | | | | | | | | |
| Investments | | | (24,079,693 | ) | | | (77,305,228 | ) | | | (314,324,666 | ) | | | (509,341,588 | ) |
| Foreign currency related transactions | | | (7,936 | ) | | | (38,041 | ) | | | (10,627 | ) | | | 267,370 | |
| | | | | | | | | | | | | | | | | |
| Net change in unrealized appreciation or depreciation on investments and foreign currency related transactions | | | (24,087,629 | ) | | | (77,343,269 | ) | | | (314,335,293 | ) | | | (509,074,218 | ) |
| | | | | | | | | | | | | | | | | |
| Net realized and unrealized loss on investments and foreign currency related transactions, and futures | | | (34,376,466 | ) | | | (82,552,285 | ) | | | (406,608,619 | ) | | | (667,890,654 | ) |
| | | | | | | | | | | | | | | | | |
Decrease in net assets resulting from operations | | $ | (32,112,028 | ) | | $ | (82,105,213 | ) | | $ | (395,602,120 | ) | | $ | (656,761,783 | ) |
| | | | | | | | | | | | | | | | | |
| | | | | | | | | | | | | | | | | |
| | | | | | | | | | | | | | | | |
| * Foreign taxes withheld | | $ | 307,338 | | | $ | 225,550 | | | $ | 2,464,573 | | | $ | 2,371,564 | |
| ** Foreign tax on sale of Indian investments | | $ | — | | | $ | 40,004 | | | $ | — | | | $ | 23,280 | |
(1) Dividends from affiliates | | $ | — | | | $ | 89,024 | | | $ | 97,662 | | | $ | 2,573 | |
See Accompanying Notes to Financial Statements
73
STATEMENTS OF OPERATIONS for the year ended October 31, 2008
| | | | | | | | | | | | | |
| �� | | | | ING
| | |
| | | ING
| | International
| | |
| | | International
| | Value
| | ING
|
| | | Value
| | Choice
| | Russia
|
| | | Fund | | Fund | | Fund |
| |
INVESTMENT INCOME: | | | | | | | | | | | | |
Dividends, net of foreign taxes withheld*(1) | | $ | 136,676,276 | | | $ | 1,525,096 | | | $ | 11,007,833 | |
| Interest | | | 1,426,213 | | | | 75,899 | | | | 113,014 | |
| Securities lending income, net | | | 851,049 | | | | — | | | | 760,593 | |
| | | | | | | | | | | | | |
| Total investment income | | | 138,953,538 | | | | 1,600,995 | | | | 11,881,440 | |
| | | | | | | | | | | | | |
| | | | | | | | | | | | | |
EXPENSES: | | | | | | | | | | | | |
| Investment management fees | | | 39,611,610 | | | | 757,506 | | | | 10,207,354 | |
| Distribution and service fees: | | | | | | | | | | | | |
| Class A | | | 5,006,016 | | | | 36,872 | | | | 2,041,471 | |
| Class B | | | 1,884,057 | | | | 30,816 | | | | — | |
| Class C | | | 5,829,967 | | | | 38,955 | | | | — | |
| Class Q | | | 52,661 | | | | — | | | | — | |
| Transfer agent fees: | | | | | | | | | | | | |
| Class A | | | 1,526,757 | | | | 15,601 | | | | 789,917 | |
| Class B | | | 175,237 | | | | 3,215 | | | | — | |
| Class C | | | 534,090 | | | | 4,061 | | | | — | |
| Class I | | | 865,404 | | | | 2,859 | | | | — | |
| Class Q | | | 11,476 | | | | — | | | | — | |
| Administrative service fees | | | 3,961,108 | | | | 75,749 | | | | 816,580 | |
| Shareholder reporting expense | | | 1,306,285 | | | | 21,741 | | | | 470,864 | |
| Registration fees | | | 108,305 | | | | 48,541 | | | | 57,184 | |
| Professional fees | | | 314,210 | | | | 15,849 | | | | 66,564 | |
| Custody and accounting expense | | | 1,179,413 | | | | 28,068 | | | | 2,256,540 | |
| Directors fees | | | 115,722 | | | | 1,810 | | | | 38,332 | |
| Miscellaneous expense | | | 774,291 | | | | 9,835 | | | | 11,270 | |
| Interest expense | | | 57,989 | | | | 261 | | | | 25,617 | |
| | | | | | | | | | | | | |
| Total expenses | | | 63,314,598 | | | | 1,091,739 | | | | 16,781,693 | |
| Net recouped (waived and reimbursed) fees | | | (587,700 | ) | | | 19,213 | | | | — | |
| Brokerage commission recapture | | | (154,041 | ) | | | (2,659 | ) | | | — | |
| | | | | | | | | | | | | |
| Net expenses | | | 62,572,857 | | | | 1,108,293 | | | | 16,781,693 | |
| | | | | | | | | | | | | |
| Net investment income (loss) | | | 76,380,681 | | | | 492,702 | | | | (4,900,253 | ) |
| | | | | | | | | | | | | |
| | | | | | | | | | | | | |
REALIZED AND UNREALIZED GAIN (LOSS) ON INVESTMENTS AND FOREIGN CURRENCY RELATED TRANSACTIONS: | | | | | | | | | | | | |
| Net realized gain (loss) on: | | | | | | | | | | | | |
| Investments | | | 518,317,287 | | | | (237,571 | ) | | | 165,653,180 | |
| Foreign currency related transactions | | | (13,210,374 | ) | | | (163,819 | ) | | | (95,243 | ) |
| | | | | | | | | | | | | |
| Net realized gain (loss) on investments and foreign currency related transactions | | | 505,106,913 | | | | (401,390 | ) | | | 165,557,937 | |
| | | | | | | | | | | | | |
| Net change in unrealized appreciation or depreciation on: | | | | | | | | | | | | |
| Investments | | | (2,422,088,781 | ) | | | (35,729,481 | ) | | | (675,569,278 | ) |
| Foreign currency related transactions | | | 7,358,563 | | | | 20,682 | | | | (151,924 | ) |
| | | | | | | | | | | | | |
| Net change in unrealized appreciation or depreciation on investments and foreign currency related transactions | | | (2,414,730,218 | ) | | | (35,708,799 | ) | | | (675,721,202 | ) |
| | | | | | | | | | | | | |
| Net realized and unrealized loss on investments and foreign currency related transactions | | | (1,909,623,305 | ) | | | (36,110,189 | ) | | | (510,163,265 | ) |
| | | | | | | | | | | | | |
Decrease in net assets resulting from operations | | $ | (1,833,242,624 | ) | | $ | (35,617,487 | ) | | $ | (515,063,518 | ) |
| | | | | | | | | | | | | |
| | | | | | | | | | | | | |
| | | | | | | | | | | | |
| * Foreign taxes withheld | | $ | 14,233,084 | | | $ | 132,497 | | | $ | 1,880,909 | |
(1) Dividends from affiliates | | $ | 45,276 | | | $ | 4,723 | | | $ | — | |
See Accompanying Notes to Financial Statements
74
STATEMENTS OF OPERATIONS for the year ended October 31, 2008
| | | | | | | | | | | | | |
| | | ING
| | | | |
| | | Emerging
| | | | |
| | | Markets
| | ING
| | ING
|
| | | Fixed
| | Global
| | Diversified
|
| | | Income
| | Bond
| | International
|
| | | Fund | | Fund | | Fund |
| |
INVESTMENT INCOME: | | | | | | | | | | | | |
| Dividends | | $ | 165,430 | | | $ | — | | | $ | — | |
| Dividends from affiliates | | | — | | | | 716,132 | | | | — | |
| Dividends from affiliated underlying funds | | | — | | | | — | | | | 8,821,631 | |
| Interest | | | 23,005,092 | | | | 2,301,575 | | | | — | |
| | | | | | | | | | | | | |
| Total investment income | | | 23,170,522 | | | | 3,017,707 | | | | 8,821,631 | |
| | | | | | | | | | | | | |
| | | | | | | | | | | | | |
EXPENSES: | | | | | | | | | | | | |
| Investment management fees | | | 1,924,618 | | | | 351,474 | | | | — | |
| Distribution and service fees: | | | | | | | | | | | | |
| Class A | | | 15,601 | | | | 164,591 | | | | 820,374 | |
| Class B | | | 3,471 | | | | 27,411 | | | | 365,716 | |
| Class C | | | 17,128 | | | | 188,855 | | | | 1,459,396 | |
| Class O | | | — | | | | 103 | | | | 68 | |
| Class R | | | — | | | | — | | | | 1,652 | |
| Transfer agent fees: | | | | | | | | | | | | |
| Class A | | | 2,473 | | | | 43,998 | | | | 362,225 | |
| Class B | | | 144 | | | | 1,901 | | | | 40,599 | |
| Class C | | | 709 | | | | 13,169 | | | | 162,846 | |
| Class I | | | 7,681 | | | | 49 | | | | 28 | |
| Class O | | | — | | | | 34 | | | | 97 | |
| Class R | | | — | | | | — | | | | 361 | |
| Class W | | | — | | | | — | | | | 1,854 | |
| Administrative service fees | | | 300,110 | | | | 87,867 | | | | 511,849 | |
| Shareholder reporting expense | | | 45,255 | | | | 13,957 | | | | 270,689 | |
| Registration fees | | | 68,855 | | | | 67,467 | | | | 120,150 | |
| Professional fees | | | 44,433 | | | | 14,730 | | | | 100,880 | |
| Custody and accounting expense | | | 120,598 | | | | 72,245 | | | | 35,962 | |
| Directors fees | | | 8,911 | | | | 2,554 | | | | 16,334 | |
| Miscellaneous expense | | | 6,998 | | | | 13,480 | | | | 22,928 | |
| Interest expense | | | 607 | | | | 837 | | | | — | |
| Foreign overdraft expense | | | 51,171 | | | | 16,587 | | | | — | |
| | | | | | | | | | | | | |
| Total expenses | | | 2,618,763 | | | | 1,081,309 | | | | 4,294,008 | |
| Net waived and reimbursed fees | | | — | | | | (107,136 | ) | | | (1,337,950 | ) |
| | | | | | | | | | | | | |
| Net expenses | | | 2,618,763 | | | | 974,173 | | | | 2,956,058 | |
| | | | | | | | | | | | | |
| Net investment income | | | 20,551,759 | | | | 2,043,534 | | | | 5,865,573 | |
| | | | | | | | | | | | | |
| | | | | | | | | | | | | |
REALIZED AND UNREALIZED GAIN (LOSS) ON INVESTMENTS, INVESTMENTS IN AFFILIATED UNDERLYING FUNDS, FOREIGN CURRENCY RELATED TRANSACTIONS, FUTURES, SWAPS, AND WRITTEN OPTIONS: | | | | | | | | | | | | |
| Net realized gain (loss) on: | | | | | | | | | | | | |
| Investments | | | (8,196,900 | ) | | | 1,342,139 | | | | — | |
| Distributions of realized gains from affiliated underlying funds | | | — | | | | — | | | | 40,616,904 | |
| Sale of investments in affiliated underlying funds | | | — | | | | — | | | | (59,139,484 | ) |
| Foreign currency related transactions | | | (5,040,473 | ) | | | 1,690,360 | | | | — | |
| Futures | | | 549,810 | | | | 164,762 | | | | — | |
| Swaps | | | — | | | | (18,705 | ) | | | — | |
| Written options | | | — | | | | 8,160 | | | | — | |
| | | | | | | | | | | | | |
| Net realized gain (loss) on investments, investments in affiliated underlying funds, foreign currency related transactions, futures, swaps, and written options | | | (12,687,563 | ) | | | 3,186,716 | | | | (18,522,580 | ) |
| | | | | | | | | | | | | |
| Net change in unrealized appreciation or depreciation on: | | | | | | | | | | | | |
| Investments | | | (98,188,231 | ) | | | (8,952,481 | ) | | | — | |
| Investments in affiliated underlying funds | | | — | | | | — | | | | (292,969,322 | ) |
| Foreign currency related transactions | | | (2,096,695 | ) | | | (9,778 | ) | | | — | |
| Futures | | | 109,777 | | | | 1,229,015 | | | | — | |
| Swaps | | | — | | | | 113,764 | | | | — | |
| | | | | | | | | | | | | |
| Net change in unrealized appreciation or depreciation on investments, investments in affiliated underlying funds, foreign currency related transactions, futures, and swaps | | | (100,175,149 | ) | | | (7,619,480 | ) | | | (292,969,322 | ) |
| | | | | | | | | | | | | |
| Net realized and unrealized loss on investments, investments in affiliated underlying funds, foreign currency related transactions, futures, swaps, and written options | | | (112,862,712 | ) | | | (4,432,764 | ) | | | (311,491,902 | ) |
| | | | | | | | | | | | | |
Decrease in net assets resulting from operations | | $ | (92,310,953 | ) | | $ | (2,389,230 | ) | | $ | (305,626,329 | ) |
| | | | | | | | | | | | | |
See Accompanying Notes to Financial Statements
75
STATEMENTS OF CHANGES IN NET ASSETS
| | | | | | | | | | | | | | | | | |
| | | ING Global Equity Dividend Fund | | ING Global Natural Resources Fund |
| | | Year Ended
| | Year Ended
| | Year Ended
| | Year Ended
|
| | | October 31,
| | October 31,
| | October 31,
| | October 31,
|
| | | 2008 | | 2007 | | 2008 | | 2007 |
| |
FROM OPERATIONS: | | | | | | | | | | | | | | | | |
| Net investment income (loss) | | $ | 9,635,589 | | | $ | 9,943,310 | | | $ | 524,746 | | | $ | (367,759 | ) |
| Net realized gain (loss) on investments and foreign currency related transactions | | | (30,844,710 | ) | | | 27,811,655 | | | | 6,564,298 | | | | 26,954,117 | |
| Net change in unrealized appreciation or depreciation on investments and foreign currency related transactions | | | (106,376,002 | ) | | | 6,761,896 | | | | (68,185,043 | ) | | | 21,662,769 | |
| | | | | | | | | | | | | | | | | |
| Increase (decrease) in net assets resulting from operations | | | (127,585,123 | ) | | | 44,516,861 | | | | (61,095,999 | ) | | | 48,249,127 | |
| | | | | | | | | | | | | | | | | |
| | | | | | | | | | | | | | | | | |
FROM DISTRIBUTIONS TO SHAREHOLDERS: | | | | | | | | | | | | | | | | |
| Net investment income: | | | | | | | | | | | | | | | | |
| Class A | | | (4,919,694 | ) | | | (5,670,697 | ) | | | (1,172,269 | ) | | | (2,937,873 | ) |
| Class B | | | (1,311,619 | ) | | | (1,472,137 | ) | | | — | | | | — | |
| Class C | | | (2,963,675 | ) | | | (2,980,276 | ) | | | — | | | | — | |
| Class I | | | (16,676 | ) | | | (8 | ) | | | (25 | ) | | | — | |
| Class O | | | (927,480 | ) | | | (499,649 | ) | | | — | | | | — | |
| Class W | | | (1,617 | ) | | | — | | | | — | | | | — | |
| Net realized gains: | | | | | | | | | | | | | | | | |
| Class A | | | (12,404,290 | ) | | | (5,696,724 | ) | | | (27,001,614 | ) | | | (3,999,909 | ) |
| Class B | | | (3,985,012 | ) | | | (2,232,186 | ) | | | — | | | | — | |
| Class C | | | (8,739,875 | ) | | | (3,980,153 | ) | | | — | | | | — | |
| Class I | | | (77 | ) | | | — | | | | (401 | ) | | | — | |
| Class O | | | (1,777,436 | ) | | | (83,443 | ) | | | — | | | | — | |
| Return of capital: | | | | | | | | | | | | | | | | |
| Class A | | | (432,988 | ) | | | — | | | | — | | | | — | |
| Class B | | | (143,749 | ) | | | — | | | | — | | | | — | |
| Class C | | | (322,744 | ) | | | — | | | | — | | | | — | |
| Class I | | | (1,297 | ) | | | — | | | | — | | | | — | |
| Class O | | | (80,273 | ) | | | — | | | | — | | | | — | |
| Class W | | | (86 | ) | | | — | | | | — | | | | — | |
| | | | | | | | | | | | | | | | | |
| Total distributions | | | (38,028,588 | ) | | | (22,615,273 | ) | | | (28,174,309 | ) | | | (6,937,782 | ) |
| | | | | | | | | | | | | | | | | |
| | | | | | | | | | | | | | | | | |
FROM CAPITAL SHARE TRANSACTIONS: | | | | | | | | | | | | | | | | |
| Net proceeds from sale of shares | | | 50,356,257 | | | | 202,562,312 | | | | 20,082,371 | | | | 16,678,962 | |
| Reinvestment of distributions | | | 26,212,767 | | | | 14,663,596 | | | | 25,092,370 | | | | 6,190,526 | |
| | | | | | | | | | | | | | | | | |
| | | | 76,569,024 | | | | 217,225,908 | | | | 45,174,741 | | | | 22,869,488 | |
| Cost of shares redeemed | | | (151,235,644 | ) | | | (81,136,802 | ) | | | (29,532,033 | ) | | | (27,924,321 | ) |
| | | | | | | | | | | | | | | | | |
| Net increase (decrease) in net assets resulting from capital share transactions | | | (74,666,620 | ) | | | 136,089,106 | | | | 15,642,708 | | | | (5,054,833 | ) |
| | | | | | | | | | | | | | | | | |
| Net increase (decrease) in net assets | | | (240,280,331 | ) | | | 157,990,694 | | | | (73,627,600 | ) | | | 36,256,512 | |
| | | | | | | | | | | | | | | | | |
| | | | | | | | | | | | | | | | | |
NET ASSETS: | | | | | | | | | | | | | | | | |
| Beginning of year | | | 389,264,276 | | | | 231,273,582 | | | | 157,368,935 | | | | 121,112,423 | |
| | | | | | | | | | | | | | | | | |
| End of year | | $ | 148,983,945 | | | $ | 389,264,276 | | | $ | 83,741,335 | | | $ | 157,368,935 | |
| | | | | | | | | | | | | | | | | |
| Undistributed net investment income (distributions in excess of net investment income) at end of year | | $ | (917 | ) | | $ | 2,265,845 | | | $ | — | | | $ | 515,975 | |
| | | | | | | | | | | | | | | | | |
See Accompanying Notes to Financial Statements
76
STATEMENTS OF CHANGES IN NET ASSETS
| | | | | | | | | | | | | | | | | |
| | | ING Global Real Estate Fund | | ING Global Value Choice Fund |
| | | Year Ended
| | Year Ended
| | Year Ended
| | Year Ended
|
| | | October 31,
| | October 31,
| | October 31,
| | October 31,
|
| | | 2008 | | 2007 | | 2008 | | 2007 |
| |
FROM OPERATIONS: | | | | | | | | | | | | | | | | |
| Net investment income (loss) | | $ | 25,495,756 | | | $ | 9,309,818 | | | $ | 131,187 | | | $ | (279,174 | ) |
| Net realized gain (loss) on investments and foreign currency related transactions | | | (221,443,835 | ) | | | 3,038,303 | | | | 6,370,233 | | | | 20,403,387 | |
| Net change in unrealized appreciation or depreciation on investments and foreign currency related transactions | | | (761,700,130 | ) | | | 111,748,957 | | | | (59,937,524 | ) | | | 11,089,799 | |
| | | | | | | | | | | | | | | | | |
| Increase (decrease) in net assets resulting from operations | | | (957,648,209 | ) | | | 124,097,078 | | | | (53,436,104 | ) | | | 31,214,012 | |
| | | | | | | | | | | | | | | | | |
| | | | | | | | | | | | | | | | | |
FROM DISTRIBUTIONS TO SHAREHOLDERS: | | | | | | | | | | | | | | | | |
| Net investment income: | | | | | | | | | | | | | | | | |
| Class A | | | (38,019,770 | ) | | | (36,353,919 | ) | | | (330,676 | ) | | | — | |
| Class B | | | (1,594,287 | ) | | | (2,289,473 | ) | | | — | | | | — | |
| Class C | | | (8,408,664 | ) | | | (9,440,529 | ) | | | (28,732 | ) | | | — | |
| Class I | | | (6,003,778 | ) | | | (1,235,834 | ) | | | (77,786 | ) | | | — | |
| Class O | | | (781,015 | ) | | | (800,532 | ) | | | — | | | | — | |
| Class Q | | | — | | | | — | | | | (15,997 | ) | | | — | |
| Class W | | | (687,839 | ) | | | — | | | | — | | | | — | |
| Net realized gains: | | | | | | | | | | | | | | | | |
| Class A | | | (1,914,849 | ) | | | (7,533,675 | ) | | | — | | | | — | |
| Class B | | | (111,208 | ) | | | (577,495 | ) | | | — | | | | — | |
| Class C | | | (570,013 | ) | | | (2,018,085 | ) | | | — | | | | — | |
| Class I | | | (144,690 | ) | | | (167,262 | ) | | | — | | | | — | |
| Class O | | | (44,110 | ) | | | (47,650 | ) | | | — | | | | — | |
| | | | | | | | | | | | | | | | | |
| Total distributions | | | (58,280,223 | ) | | | (60,464,454 | ) | | | (453,191 | ) | | | — | |
| | | | | | | | | | | | | | | | | |
| | | | | | | | | | | | | | | | | |
FROM CAPITAL SHARE TRANSACTIONS: | | | | | | | | | | | | | | | | |
| Net proceeds from sale of shares | | | 1,452,693,092 | | | | 1,452,457,984 | | | | 48,823,856 | | | | 23,951,269 | |
| Reinvestment of distributions | | | 45,987,277 | | | | 46,781,605 | | | | 305,217 | | | | — | |
| | | | | | | | | | | | | | | | | |
| | | | 1,498,680,369 | | | | 1,499,239,589 | | | | 49,129,073 | | | | 23,951,269 | |
| Cost of shares redeemed | | | (760,365,301 | ) | | | (602,805,919 | ) | | | (52,760,826 | ) | | | (30,529,879 | ) |
| | | | | | | | | | | | | | | | | |
| Net increase (decrease) in net assets resulting from capital share transactions | | | 738,315,068 | | | | 896,433,670 | | | | (3,631,753 | ) | | | (6,578,610 | ) |
| | | | | | | | | | | | | | | | | |
| Net increase (decrease) in net assets | | | (277,613,364 | ) | | | 960,066,294 | | | | (57,521,048 | ) | | | 24,635,402 | |
| | | | | | | | | | | | | | | | | |
| | | | | | | | | | | | | | | | | |
NET ASSETS: | | | | | | | | | | | | �� | | | | |
| Beginning of year | | | 1,579,571,445 | | | | 619,505,151 | | | | 130,683,159 | | | | 106,047,757 | |
| | | | | | | | | | | | | | | | | |
| End of year | | $ | 1,301,958,081 | | | $ | 1,579,571,445 | | | $ | 73,162,111 | | | $ | 130,683,159 | |
| | | | | | | | | | | | | | | | | |
| Undistributed net investment income (distributions in excess of net investment income) at end of year | | $ | (42,244,315 | ) | | $ | (8,882,330 | ) | | $ | (3,478 | ) | | $ | 409,172 | |
| | | | | | | | | | | | | | | | | |
See Accompanying Notes to Financial Statements
77
STATEMENTS OF CHANGES IN NET ASSETS
| | | | | | | | | | | | | |
| | | ING Asia-Pacific Real Estate Fund | | ING Disciplined International SmallCap Fund |
| | | Year Ended
| | Year Ended
| | December 20, 2006(1)
|
| | | October 31,
| | October 31,
| | to October 31,
|
| | | 2008 | | 2008 | | 2007 |
| |
FROM OPERATIONS: | | | | | | | | | | | | |
| Net investment income | | $ | 85,018 | | | $ | 7,476,386 | | | $ | 2,228,967 | |
| Net realized gain (loss) on investments and foreign currency related transactions | | | (2,044,242 | ) | | | (72,470,993 | ) | | | 2,282,503 | |
| Net change in unrealized appreciation or depreciation on investments and foreign currency related transactions | | | (3,416,307 | ) | | | (163,047,508 | ) | | | 22,941,221 | |
| | | | | | | | | | | | | |
| Increase (decrease) in net assets resulting from operations | | | (5,375,531 | ) | | | (228,042,115 | ) | | | 27,452,691 | |
| | | | | | | | | | | | | |
| | | | | | | | | | | | | |
FROM DISTRIBUTIONS TO SHAREHOLDERS: | | | | | | | | | | | | |
| Net investment income: | | | | | | | | | | | | |
| Class A | | | (59,954 | ) | | | (541 | ) | | | — | |
| Class B | | | (206 | ) | | | (2 | ) | | | — | |
| Class C | | | (8,444 | ) | | | (25 | ) | | | — | |
| Class I | | | (12 | ) | | | (2,965,190 | ) | | | — | |
| Net realized gains: | | | | | | | | | | | | |
| Class A | | | — | | | | (1,783 | ) | | | — | |
| Class B | | | — | | | | (84 | ) | | | — | |
| Class C | | | — | | | | (892 | ) | | | — | |
| Class I | | | — | | | | (7,916,891 | ) | | | — | |
| | | | | | | | | | | | | |
| Total distributions | | | (68,616 | ) | | | (10,885,408 | ) | | | — | |
| | | | | | | | | | | | | |
| | | | | | | | | | | | | |
FROM CAPITAL SHARE TRANSACTIONS: | | | | | | | | | | | | |
| Net proceeds from sale of shares | | | 13,425,429 | | | | 185,423,219 | | | | 492,620,976 | |
| Reinvestment of distributions | | | 7,752 | | | | 10,885,000 | | | | — | |
| | | | | | | | | | | | | |
| | | | 13,433,181 | | | | 196,308,219 | | | | 492,620,976 | |
| Cost of shares redeemed | | | (1,293,847 | ) | | | (203,364,251 | ) | | | (54,286,888 | ) |
| | | | | | | | | | | | | |
| Net increase (decrease) in net assets resulting from capital share transactions | | | 12,139,334 | | | | (7,056,032 | ) | | | 438,334,088 | |
| | | | | | | | | | | | | |
| Net increase (decrease) in net assets | | | 6,695,187 | | | | (245,983,555 | ) | | | 465,786,779 | |
| | | | | | | | | | | | | |
| | | | | | | | | | | | | |
NET ASSETS: | | | | | | | | | | | | |
| Beginning of period | | | — | | | | 465,786,779 | | | | — | |
| | | | | | | | | | | | | |
| End of period | | $ | 6,695,187 | | | $ | 219,803,224 | | | $ | 465,786,779 | |
| | | | | | | | | | | | | |
| Undistributed net investment income at end of period | | $ | 10,178 | | | $ | 7,905,967 | | | $ | 2,461,339 | |
| | | | | | | | | | | | | |
| |
| (1) | Commencement of operations |
See Accompanying Notes to Financial Statements
78
STATEMENTS OF CHANGES IN NET ASSETS
| | | | | | | | | | | | | |
| | | ING Emerging Countries Fund | | ING European Real Estate Fund |
| | | Year Ended
| | Year Ended
| | Year Ended
|
| | | October 31,
| | October 31,
| | October 31,
|
| | | 2008 | | 2007 | | 2008 |
| |
FROM OPERATIONS: | | | | | | | | | | | | |
| Net investment income | | $ | 4,137,274 | | | $ | 3,516,628 | | | $ | 77,907 | |
| Net realized gain (loss) on investments and foreign currency related transactions | | | (64,250,220 | ) | | | 46,867,839 | | | | (1,169,983 | ) |
| Net change in unrealized appreciation or depreciation on investments and foreign currency related transactions | | | (112,328,277 | ) | | | 39,650,088 | | | | (1,679,254 | ) |
| | | | | | | | | | | | | |
| Increase (decrease) in net assets resulting from operations | | | (172,441,223 | ) | | | 90,034,555 | | | | (2,771,330 | ) |
| | | | | | | | | | | | | |
| | | | | | | | | | | | | |
FROM DISTRIBUTIONS TO SHAREHOLDERS: | | | | | | | | | | | | |
| Net investment income: | | | | | | | | | | | | |
| Class A | | | (2,167,642 | ) | | | (1,896,150 | ) | | | (76,349 | ) |
| Class B | | | (57,378 | ) | | | (83,261 | ) | | | (197 | ) |
| Class C | | | (291,243 | ) | | | (323,450 | ) | | | (619 | ) |
| Class I | | | (594,705 | ) | | | (446,558 | ) | | | (15 | ) |
| Class M | | | — | | | | (13,746 | ) | | | — | |
| Class Q | | | (242,630 | ) | | | (179,954 | ) | | | — | |
| Net realized gains: | | | | | | | | | | | | |
| Class A | | | (5,291,718 | ) | | | — | | | | — | |
| Class B | | | (440,600 | ) | | | — | | | | — | |
| Class C | | | (1,550,833 | ) | | | — | | | | — | |
| Class I | | | (1,150,536 | ) | | | — | | | | — | |
| Class Q | | | (551,176 | ) | | | — | | | | — | |
| Class W | | | (11 | ) | | | — | | | | — | |
| | | | | | | | | | | | | |
| Total distributions | | | (12,338,472 | ) | | | (2,943,119 | ) | | | (77,180 | ) |
| | | | | | | | | | | | | |
| | | | | | | | | | | | | |
FROM CAPITAL SHARE TRANSACTIONS: | | | | | | | | | | | | |
| Net proceeds from sale of shares | | | 76,881,539 | | | | 112,724,921 | | | | 6,945,489 | |
| Reinvestment of distributions | | | 10,561,811 | | | | 2,492,354 | | | | 14,148 | |
| | | | | | | | | | | | | |
| | | | 87,443,350 | | | | 115,217,275 | | | | 6,959,637 | |
| Cost of shares redeemed | | | (130,619,438 | ) | | | (79,923,522 | ) | | | (895,509 | ) |
| | | | | | | | | | | | | |
| Net increase (decrease) in net assets resulting from capital share transactions | | | (43,176,088 | ) | | | 35,293,753 | | | | 6,064,128 | |
| | | | | | | | | | | | | |
| Net increase (decrease) in net assets | | | (227,955,783 | ) | | | 122,385,189 | | | | 3,215,618 | |
| | | | | | | | | | | | | |
| | | | | | | | | | | | | |
NET ASSETS: | | | | | | | | | | | | |
| Beginning of year | | | 330,644,479 | | | | 208,259,290 | | | | — | |
| | | | | | | | | | | | | |
| End of year | | $ | 102,688,696 | | | $ | 330,644,479 | | | $ | 3,215,618 | |
| | | | | | | | | | | | | |
| Undistributed net investment income at end of year | | $ | 2,746,170 | | | $ | 3,092,434 | | | $ | 95,557 | |
| | | | | | | | | | | | | |
See Accompanying Notes to Financial Statements
79
STATEMENTS OF CHANGES IN NET ASSETS
| | | | | | | | | | | | | | | | | |
| | | ING Foreign Fund | | ING Greater China Fund |
| | | Year Ended
| | Year Ended
| | Year Ended
| | Year Ended
|
| | | October 31,
| | October 31,
| | October 31,
| | October 31,
|
| | | 2008 | | 2007 | | 2008 | | 2007 |
| |
FROM OPERATIONS: | | | | | | | | | | | | | | | | |
| Net investment income | | $ | 4,417,454 | | | $ | 2,085,807 | | | $ | 99,166 | | | $ | 210,200 | |
| Net realized gain (loss) on investments and foreign currency related transactions | | | (111,925,743 | ) | | | 47,020,133 | | | | 2,354,386 | | | | 7,910,177 | |
| Net change in unrealized appreciation or depreciation on investments and foreign currency related transactions | | | (234,522,763 | ) | | | 111,918,325 | | | | (47,933,410 | ) | | | 29,642,227 | |
| | | | | | | | | | | | | | | | | |
| Increase (decrease) in net assets resulting from operations | | | (342,031,052 | ) | | | 161,024,265 | | | | (45,479,858 | ) | | | 37,762,604 | |
| | | | | | | | | | | | | | | | | |
| | | | | | | | | | | | | | | | | |
FROM DISTRIBUTIONS TO SHAREHOLDERS: | | | | | | | | | | | | | | | | |
| Net investment income: | | | | | | | | | | | | | | | | |
| Class A | | | — | | | | — | | | | (206,726 | ) | | | (127,574 | ) |
| Class B | | | — | | | | — | | | | — | | | | (9,360 | ) |
| Class C | | | — | | | | — | | | | — | | | | (5,789 | ) |
| Class I | | | — | | | | — | | | | (210 | ) | | | (143 | ) |
| Net realized gains: | | | | | | | | | | | | | | | | |
| Class A | | | (20,918,671 | ) | | | (8,170,693 | ) | | | (6,348,739 | ) | | | (219 | ) |
| Class B | | | (3,020,180 | ) | | | (1,424,431 | ) | | | (607,794 | ) | | | (24 | ) |
| Class C | | | (13,831,219 | ) | | | (5,882,217 | ) | | | (1,066,835 | ) | | | (21 | ) |
| Class I | | | (6,602,918 | ) | | | (2,373,358 | ) | | | (4,310 | ) | | | — | |
| Class Q | | | (50,212 | ) | | | (43,762 | ) | | | — | | | | — | |
| | | | | | | | | | | | | | | | | |
| Total distributions | | | (44,423,200 | ) | | | (17,894,461 | ) | | | (8,234,614 | ) | | | (143,130 | ) |
| | | | | | | | | | | | | | | | | |
| | | | | | | | | | | | | | | | | |
FROM CAPITAL SHARE TRANSACTIONS: | | | | | | | | | | | | | | | | |
| Net proceeds from sale of shares | | | 177,808,541 | | | | 228,656,436 | | | | 21,915,224 | | | | 51,182,704 | |
| Reinvestment of distributions | | | 32,055,604 | | | | 12,389,371 | | | | 5,628,333 | | | | 73,388 | |
| | | | | | | | | | | | | | | | | |
| | | | 209,864,145 | | | | 241,045,807 | | | | 27,543,557 | | | | 51,256,092 | |
| Cost of shares redeemed | | | (224,896,551 | ) | | | (116,454,629 | ) | | | (42,164,045 | ) | | | (23,031,761 | ) |
| | | | | | | | | | | | | | | | | |
| Net increase (decrease) in net assets resulting from capital share transactions | | | (15,032,406 | ) | | | 124,591,178 | | | | (14,620,488 | ) | | | 28,224,331 | |
| | | | | | | | | | | | | | | | | |
| Net increase (decrease) in net assets | | | (401,486,658 | ) | | | 267,720,982 | | | | (68,334,960 | ) | | | 65,843,805 | |
| | | | | | | | | | | | | | | | | |
| | | | | | | | | | | | | | | | | |
NET ASSETS: | | | | | | | | | | | | | | | | |
| Beginning of year | | | 742,220,466 | | | | 474,499,484 | | | | 93,655,560 | | | | 27,811,755 | |
| | | | | | | | | | | | | | | | | |
| End of year | | $ | 340,733,808 | | | $ | 742,220,466 | | | $ | 25,320,600 | | | $ | 93,655,560 | |
| | | | | | | | | | | | | | | | | |
| Undistributed net investment income (distributions in excess of net investment income) at end of year | | $ | (3,840,375 | ) | | $ | 6,305,480 | | | $ | 1,754,292 | | | $ | 197,081 | |
| | | | | | | | | | | | | | | | | |
See Accompanying Notes to Financial Statements
80
STATEMENTS OF CHANGES IN NET ASSETS
| | | | | | | | | | | | | | | | | |
| | | ING Index Plus International Equity Fund | | ING International Capital Appreciation Fund |
| | | Year Ended
| | Year Ended
| | Year Ended
| | Year Ended
|
| | | October 31,
| | October 31,
| | October 31,
| | October 31,
|
| | | 2008 | | 2007 | | 2008 | | 2007 |
| |
FROM OPERATIONS: | | | | | | | | | | | | | | | | |
| Net investment income | | $ | 5,128,927 | | | $ | 1,813,920 | | | $ | 1,310,333 | | | $ | 420,935 | |
| Net realized gain (loss) on investments, foreign currency related transactions, and futures | | | (46,162,768 | ) | | | 12,541,967 | | | | (8,360,001 | ) | | | 5,266,719 | |
| Net change in unrealized appreciation or depreciation on investments, foreign currency related transactions, and futures | | | (75,447,161 | ) | | | 7,978,045 | | | | (62,269,125 | ) | | | 24,274,753 | |
| | | | | | | | | | | | | | | | | |
| Increase (decrease) in net assets resulting from operations | | | (116,481,002 | ) | | | 22,333,932 | | | | (69,318,793 | ) | | | 29,962,407 | |
| | | | | | | | | | | | | | | | | |
| | | | | | | | | | | | | | | | | |
FROM DISTRIBUTIONS TO SHAREHOLDERS: | | | | | | | | | | | | | | | | |
| Net investment income: | | | | | | | | | | | | | | | | |
| Class A | | | (28,649 | ) | | | (87,342 | ) | | | (46,790 | ) | | | (23,107 | ) |
| Class B | | | (8,557 | ) | | | (1,478 | ) | | | (6,221 | ) | | | (260 | ) |
| Class C | | | (13,088 | ) | | | (2,010 | ) | | | (7,324 | ) | | | (23 | ) |
| Class I | | | (2,125,491 | ) | | | (863,636 | ) | | | (1,713,778 | ) | | | (383,682 | ) |
| Class O | | | (19 | ) | | | — | | | | — | | | | — | |
| Net realized gains: | | | | | | | | | | | | | | | | |
| Class A | | | (221,431 | ) | | | (291,175 | ) | | | (171,474 | ) | | | (108,029 | ) |
| Class B | | | (74,576 | ) | | | (6,890 | ) | | | (29,527 | ) | | | (1,967 | ) |
| Class C | | | (113,554 | ) | | | (12,818 | ) | | | (33,222 | ) | | | (1,476 | ) |
| Class I | | | (11,934,519 | ) | | | (1,953,787 | ) | | | (4,964,217 | ) | | | (1,126,292 | ) |
| Class O | | | (106 | ) | | | — | | | | — | | | | — | |
| | | | | | | | | | | | | | | | | |
| Total distributions | | | (14,519,990 | ) | | | (3,219,136 | ) | | | (6,972,553 | ) | | | (1,644,836 | ) |
| | | | | | | | | | | | | | | | | |
| | | | | | | | | | | | | | | | | |
FROM CAPITAL SHARE TRANSACTIONS: | | | | | | | | | | | | | | | | |
| Net proceeds from sale of shares | | | 110,662,967 | | | | 62,111,210 | | | | 24,115,204 | | | | 73,718,329 | |
| Proceeds from shares issued in merger (Note 14) | | | 128,431,314 | | | | — | | | | — | | | | — | |
| Reinvestment of distributions | | | 14,382,164 | | | | 2,857,702 | | | | 6,792,519 | | | | 1,517,633 | |
| | | | | | | | | | | | | | | | | |
| | | | 253,476,445 | | | | 64,968,912 | | | | 30,907,723 | | | | 75,235,962 | |
| Cost of shares redeemed | | | (136,788,066 | ) | | | (52,958,552 | ) | | | (51,860,888 | ) | | | (7,155,866 | ) |
| | | | | | | | | | | | | | | | | |
| Net increase (decrease) in net assets resulting from capital share transactions | | | 116,688,379 | | | | 12,010,360 | | | | (20,953,165 | ) | | | 68,080,096 | |
| | | | | | | | | | | | | | | | | |
| Net increase (decrease) in net assets | | | (14,312,613 | ) | | | 31,125,156 | | | | (97,244,511 | ) | | | 96,397,667 | |
| | | | | | | | | | | | | | | | | |
| | | | | | | | | | | | | | | | | |
NET ASSETS: | | | | | | | | | | | | | | | | |
| Beginning of year | | | 123,017,427 | | | | 91,892,271 | | | | 147,406,227 | | | | 51,008,560 | |
| | | | | | | | | | | | | | | | | |
| End of year | | $ | 108,704,814 | | | $ | 123,017,427 | | | $ | 50,161,716 | | | $ | 147,406,227 | |
| | | | | | | | | | | | | | | | | |
| Undistributed net investment income at end of year | | $ | 4,340,300 | | | $ | 2,158,663 | | | $ | 1,056,223 | | | $ | 1,765,493 | |
| | | | | | | | | | | | | | | | | |
See Accompanying Notes to Financial Statements
81
STATEMENTS OF CHANGES IN NET ASSETS
| | | | | | | | | | | | | | | | | |
| | | ING International Equity Dividend Fund | | ING International Growth Opportunities Fund |
| | | Year Ended
| | June 28, 2007(1)
| | Year Ended
| | Year Ended
|
| | | October 31,
| | to October 31,
| | October 31,
| | October 31,
|
| | | 2008 | | 2007 | | 2008 | | 2007 |
| |
FROM OPERATIONS: | | | | | | | | | | | | | | | | |
| Net investment income | | $ | 2,264,438 | | | $ | 193,602 | | | $ | 447,072 | | | $ | 128,203 | |
| Net realized gain (loss) on investments and foreign currency related transactions | | | (10,288,837 | ) | | | 130,192 | | | | (5,209,016 | ) | | | 23,520,588 | |
| Net change in unrealized appreciation or depreciation on investments and foreign currency related transactions | | | (24,087,629 | ) | | | 3,429,639 | | | | (77,343,269 | ) | | | 11,840,950 | |
| | | | | | | | | | | | | | | | | |
| Increase (decrease) in net assets resulting from operations | | | (32,112,028 | ) | | | 3,753,433 | | | | (82,105,213 | ) | | | 35,489,741 | |
| | | | | | | | | | | | | | | | | |
| | | | | | | | | | | | | | | | | |
FROM DISTRIBUTIONS TO SHAREHOLDERS: | | | | | | | | | | | | | | | | |
| Net investment income: | | | | | | | | | | | | | | | | |
| Class A | | | (126,779 | ) | | | — | | | | (83,294 | ) | | | (680,068 | ) |
| Class B | | | (8,400 | ) | | | — | | | | — | | | | (66,840 | ) |
| Class C | | | (45,080 | ) | | | — | | | | — | | | | (70,208 | ) |
| Class I | | | (2,166,707 | ) | | | — | | | | (34,259 | ) | | | (212,485 | ) |
| Class Q | | | — | | | | — | | | | (72,032 | ) | | | (379,024 | ) |
| Class W | | | (479 | ) | | | — | | | | — | | | | — | |
| Net realized gains: | | | | | | | | | | | | | | | | |
| Class A | | | (15,847 | ) | | | — | | | | (9,478,153 | ) | | | (5,041,992 | ) |
| Class B | | | (884 | ) | | | — | | | | (2,585,626 | ) | | | (1,473,205 | ) |
| Class C | | | (6,628 | ) | | | — | | | | (2,917,744 | ) | | | (1,405,761 | ) |
| Class I | | | (212,974 | ) | | | — | | | | (1,529,095 | ) | | | (1,170,829 | ) |
| Class Q | | | — | | | | — | | | | (4,653,527 | ) | | | (2,425,795 | ) |
| Return of capital: | | | | | | | | | | | | | | | | |
| Class A | | | (11,426 | ) | | | — | | | | — | | | | — | |
| Class B | | | (931 | ) | | | — | | | | — | | | | — | |
| Class C | | | (5,015 | ) | | | — | | | | — | | | | — | |
| Class I | | | (179,688 | ) | | | — | | | | — | | | | — | |
| Class W | | | (40 | ) | | | — | | | | — | | | | — | |
| | | | | | | | | | | | | | | | | |
| Total distributions | | | (2,780,878 | ) | | | — | | | | (21,353,730 | ) | | | (12,926,207 | ) |
| | | | | | | | | | | | | | | | | |
| | | | | | | | | | | | | | | | | |
FROM CAPITAL SHARE TRANSACTIONS: | | | | | | | | | | | | | | | | |
| Net proceeds from sale of shares | | | 24,737,239 | | | | 57,663,013 | | | | 48,218,002 | | | | 24,042,736 | |
| Reinvestment of distributions | | | 2,727,933 | | | | — | | | | 18,757,432 | | | | 11,571,000 | |
| | | | | | | | | | | | | | | | | |
| | | | 27,465,172 | | | | 57,663,013 | | | | 66,975,434 | | | | 35,613,736 | |
| Cost of shares redeemed | | | (17,839,256 | ) | | | (110,155 | ) | | | (44,157,319 | ) | | | (46,253,686 | ) |
| | | | | | | | | | | | | | | | | |
| Net increase (decrease) in net assets resulting from capital share transactions | | | 9,625,916 | | | | 57,552,858 | | | | 22,818,115 | | | | (10,639,950 | ) |
| | | | | | | | | | | | | | | | | |
| Net increase (decrease) in net assets | | | (25,266,990 | ) | | | 61,306,291 | | | | (80,640,828 | ) | | | 11,923,584 | |
| | | | | | | | | | | | | | | | | |
| | | | | | | | | | | | | | | | | |
NET ASSETS: | | | | | | | | | | | | | | | | |
| Beginning of period | | | 61,306,291 | | | | — | | | | 143,828,509 | | | | 131,904,925 | |
| | | | | | | | | | | | | | | | | |
| End of period | | $ | 36,039,301 | | | $ | 61,306,291 | | | $ | 63,187,681 | | | $ | 143,828,509 | |
| | | | | | | | | | | | | | | | | |
| Undistributed net investment income (distributions in excess of net investment income) at end of period | | $ | (63 | ) | | $ | 314,015 | | | $ | 186,726 | | | $ | 118,948 | |
| | | | | | | | | | | | | | | | | |
| |
| (1) | Commencement of operations |
See Accompanying Notes to Financial Statements
82
STATEMENTS OF CHANGES IN NET ASSETS
| | | | | | | | | | | | | | | | | |
| | | ING International Real
| | ING International SmallCap
|
| | | Estate Fund | | Multi-Manager Fund |
| | | Year Ended
| | Year Ended
| | Year Ended
| | Year Ended
|
| | | October 31,
| | October 31,
| | October 31,
| | October 31,
|
| | | 2008 | | 2007 | | 2008 | | 2007 |
| |
FROM OPERATIONS: | | | | | | | | | | | | | | | | |
| Net investment income | | $ | 11,006,499 | | | $ | 2,572,223 | | | $ | 11,128,871 | | | $ | 6,261,927 | |
| Net realized gain (loss) on investments and foreign currency related transactions | | | (92,273,326 | ) | | | (5,927,606 | ) | | | (158,816,436 | ) | | | 139,620,023 | |
| Net change in unrealized appreciation or depreciation on investments and foreign currency related transactions | | | (314,335,293 | ) | | | 67,077,885 | | | | (509,074,218 | ) | | | 138,128,121 | |
| | | | | | | | | | | | | | | | | |
| Increase (decrease) in net assets resulting from operations | | | (395,602,120 | ) | | | 63,722,502 | | | | (656,761,783 | ) | | | 284,010,071 | |
| | | | | | | | | | | | | | | | | |
| | | | | | | | | | | | | | | | | |
FROM DISTRIBUTIONS TO SHAREHOLDERS: | | | | | | | | | | | | | | | | |
| Net investment income: | | | | | | | | | | | | | | | | |
| Class A | | | (6,762,764 | ) | | | (3,122,648 | ) | | | (2,482,496 | ) | | | (1,450,677 | ) |
| Class B | | | (208,426 | ) | | | (87,059 | ) | | | — | | | | — | |
| Class C | | | (2,311,512 | ) | | | (800,946 | ) | | | — | | | | (3,361 | ) |
| Class I | | | (9,218,250 | ) | | | (1,247,020 | ) | | | (2,905,473 | ) | | | (1,454,644 | ) |
| Class Q | | | — | | | | — | | | | (658,389 | ) | | | (542,824 | ) |
| Class W | | | (3,394 | ) | | | — | | | | — | | | | — | |
| Net realized gains: | | | | | | | | | | | | | | | | |
| Class A | | | — | | | | — | | | | (60,574,187 | ) | | | — | |
| Class B | | | — | | | | — | | | | (7,140,703 | ) | | | — | |
| Class C | | | — | | | | — | | | | (12,894,884 | ) | | | — | |
| Class I | | | — | | | | — | | | | (43,991,753 | ) | | | — | |
| Class O | | | — | | | | — | | | | (1 | ) | | | — | |
| Class Q | | | — | | | | — | | | | (14,059,252 | ) | | | — | |
| Class W | | | — | | | | — | | | | (131 | ) | | | — | |
| Return of capital: | | | | | | | | | | | | | | | | |
| Class A | | | (3,653,580 | ) | | | — | | | | — | | | | — | |
| Class B | | | (146,325 | ) | | | — | | | | — | | | | — | |
| Class C | | | (1,612,691 | ) | | | — | | | | — | | | | — | |
| Class I | | | (4,371,301 | ) | | | — | | | | — | | | | — | |
| Class W | | | (1,599 | ) | | | — | | | | — | | | | — | |
| | | | | | | | | | | | | | | | | |
| Total distributions | | | (28,289,842 | ) | | | (5,257,673 | ) | | | (144,707,269 | ) | | | (3,451,506 | ) |
| | | | | | | | | | | | | | | | | |
| | | | | | | | | | | | | | | | | |
FROM CAPITAL SHARE TRANSACTIONS: | | | | | | | | | | | | | | | | |
| Net proceeds from sale of shares | | | 609,238,402 | | | | 476,221,868 | | | | 267,975,778 | | | | 582,975,064 | |
| Reinvestment of distributions | | | 13,626,372 | | | | 3,314,796 | | | | 106,441,115 | | | | 2,386,090 | |
| | | | | | | | | | | | | | | | | |
| | | | 622,864,774 | | | | 479,536,664 | | | | 374,416,893 | | | | 585,361,154 | |
| Cost of shares redeemed | | | (309,952,586 | ) | | | (97,047,896 | ) | | | (378,623,842 | ) | | | (251,064,888 | ) |
| | | | | | | | | | | | | | | | | |
| Net increase (decrease) in net assets resulting from capital share transactions | | | 312,912,188 | | | | 382,488,768 | | | | (4,206,949 | ) | | | 334,296,266 | |
| | | | | | | | | | | | | | | | | |
| Net increase (decrease) in net assets | | | (110,979,774 | ) | | | 440,953,597 | | | | (805,676,001 | ) | | | 614,854,831 | |
| | | | | | | | | | | | | | | | | |
| | | | | | | | | | | | | | | | | |
NET ASSETS: | | | | | | | | | | | | | | | | |
| Beginning of year | | | 531,801,201 | | | | 90,847,604 | | | | 1,201,307,419 | | | | 586,452,588 | |
| | | | | | | | | | | | | | | | | |
| End of year | | $ | 420,821,427 | | | $ | 531,801,201 | | | $ | 395,631,418 | | | $ | 1,201,307,419 | |
| | | | | | | | | | | | | | | | | |
| Undistributed net investment income (distributions in excess of net investment income) at end of year | | $ | (10,247 | ) | | $ | 18,780,674 | | | $ | 10,631,527 | | | $ | 6,310,276 | |
| | | | | | | | | | | | | | | | | |
See Accompanying Notes to Financial Statements
83
STATEMENTS OF CHANGES IN NET ASSETS
| | | | | | | | | | | | | | | | | |
| | | | | ING International Value
|
| | | ING International Value Fund | | Choice Fund |
| | | Year Ended
| | Year Ended
| | Year Ended
| | Year Ended
|
| | | October 31,
| | October 31,
| | October 31,
| | October 31,
|
| | | 2008 | | 2007 | | 2008 | | 2007 |
| |
FROM OPERATIONS: | | | | | | | | | | | | | | | | |
| Net investment income | | $ | 76,380,681 | | | $ | 56,997,675 | | | $ | 492,702 | | | $ | 961,863 | |
| Net realized gain (loss) on investments and foreign currency related transactions | | | 505,106,913 | | | | 773,210,681 | | | | (401,390 | ) | | | 11,127,404 | |
| Net change in unrealized appreciation or depreciation on investments and foreign currency related transactions | | | (2,414,730,218 | ) | | | 111,070,822 | | | | (35,708,799 | ) | | | 5,114,818 | |
| | | | | | | | | | | | | | | | | |
| Increase (decrease) in net assets resulting from operations | | | (1,833,242,624 | ) | | | 941,279,178 | | | | (35,617,487 | ) | | | 17,204,085 | |
| | | | | | | | | | | | | | | | | |
| | | | | | | | | | | | | | | | | |
FROM DISTRIBUTIONS TO SHAREHOLDERS: | | | | | | | | | | | | | | | | |
| Net investment income: | | | | | | | | | | | | | | | | |
| Class A | | | (20,593,112 | ) | | | (18,482,190 | ) | | | (112,875 | ) | | | (98,246 | ) |
| Class B | | | (250,157 | ) | | | (533,208 | ) | | | (307 | ) | | | — | |
| Class C | | | (2,488,818 | ) | | | (1,845,996 | ) | | | — | | | | — | |
| Class I | | | (29,292,792 | ) | | | (22,422,943 | ) | | | (693,103 | ) | | | (317,928 | ) |
| Class Q | | | (353,269 | ) | | | (267,155 | ) | | | — | | | | — | |
| Net realized gains: | | | | | | | | | | | | | | | | |
| Class A | | | (304,767,165 | ) | | | (197,689,141 | ) | | | (2,221,665 | ) | | | (310,768 | ) |
| Class B | | | (41,150,109 | ) | | | (36,175,155 | ) | | | (507,826 | ) | | | (60,618 | ) |
| Class C | | | (110,803,630 | ) | | | (73,056,964 | ) | | | (656,889 | ) | | | (75,307 | ) |
| Class I | | | (313,841,980 | ) | | | (171,997,304 | ) | | | (8,389,969 | ) | | | (671,110 | ) |
| Class Q | | | (3,792,184 | ) | | | (2,584,599 | ) | | | — | | | | — | |
| | | | | | | | | | | | | | | | | |
| Total distributions | | | (827,333,216 | ) | | | (525,054,655 | ) | | | (12,582,634 | ) | | | (1,533,977 | ) |
| | | | | | | | | | | | | | | | | |
| | | | | | | | | | | | | | | | | |
FROM CAPITAL SHARE TRANSACTIONS: | | | | | | | | | | | | | | | | |
| Net proceeds from sale of shares | | | 671,204,202 | | | | 981,748,449 | | | | 29,490,166 | | | | 62,085,850 | |
| Reinvestment of distributions | | | 592,109,119 | | | | 372,072,665 | | | | 11,960,549 | | | | 1,417,746 | |
| | | | | | | | | | | | | | | | | |
| | | | 1,263,313,321 | | | | 1,353,821,114 | | | | 41,450,715 | | | | 63,503,596 | |
| Cost of shares redeemed | | | (1,909,403,374 | ) | | | (1,219,257,275 | ) | | | (29,962,847 | ) | | | (56,041,699 | ) |
| | | | | | | | | | | | | | | | | |
| Net increase (decrease) in net assets resulting from capital share transactions | | | (646,090,053 | ) | | | 134,563,839 | | | | 11,487,868 | | | | 7,461,897 | |
| | | | | | | | | | | | | | | | | |
| Net increase (decrease) in net assets | | | (3,306,665,893 | ) | | | 550,788,362 | | | | (36,712,253 | ) | | | 23,132,005 | |
| | | | | | | | | | | | | | | | | |
| | | | | | | | | | | | | | | | | |
NET ASSETS: | | | | | | | | | | | | | | | | |
| Beginning of year | | | 5,398,777,474 | | | | 4,847,989,112 | | | | 85,746,502 | | | | 62,614,497 | |
| | | | | | | | | | | | | | | | | |
| End of year | | $ | 2,092,111,581 | | | $ | 5,398,777,474 | | | $ | 49,034,249 | | | $ | 85,746,502 | |
| | | | | | | | | | | | | | | | | |
| Undistributed net investment income at end of year | | $ | 63,338,094 | | | $ | 52,954,318 | | | $ | 557,203 | | | $ | 809,824 | |
| | | | | | | | | | | | | | | | | |
See Accompanying Notes to Financial Statements
84
STATEMENTS OF CHANGES IN NET ASSETS
| | | | | | | | | | | | | | | | | |
| | | | | ING Emerging Markets
|
| | | ING Russia Fund | | Fixed Income Fund |
| | | Year Ended
| | Year Ended
| | Year Ended
| | Year Ended
|
| | | October 31,
| | October 31,
| | October 31,
| | October 31,
|
| | | 2008 | | 2007 | | 2008 | | 2007 |
| |
FROM OPERATIONS: | | | | | | | | | | | | | | | | |
| Net investment income (loss) | | $ | (4,900,253 | ) | | $ | (4,511,889 | ) | | $ | 20,551,759 | | | $ | 7,527,851 | |
| Net realized gain (loss) on investments, foreign currency related transactions, and futures | | | 165,557,937 | | | | 142,284,643 | | | | (12,687,563 | ) | | | (723,798 | ) |
| Net change in unrealized appreciation or depreciation on investments, foreign currency related transactions, and futures | | | (675,721,202 | ) | | | 177,636,410 | | | | (100,175,149 | ) | | | 406,474 | |
| | | | | | | | | | | | | | | | | |
| Increase (decrease) in net assets resulting from operations | | | (515,063,518 | ) | | | 315,409,164 | | | | (92,310,953 | ) | | | 7,210,527 | |
| | | | | | | | | | | | | | | | | |
| | | | | | | | | | | | | | | | | |
FROM DISTRIBUTIONS TO SHAREHOLDERS: | | | | | | | | | | | | | | | | |
| Net investment income: | | | | | | | | | | | | | | | | |
| Class A | | | — | | | | — | | | | (292,759 | ) | | | (1,326,791 | ) |
| Class B | | | — | | | | — | | | | (13,847 | ) | | | (17,775 | ) |
| Class C | | | — | | | | — | | | | (66,887 | ) | | | (40,349 | ) |
| Class I | | | — | | | | — | | | | (14,370,474 | ) | | | (6,243,283 | ) |
| Net realized gains: | | | | | | | | | | | | | | | | |
| Class A | | | (137,654,710 | ) | | | (43,574,710 | ) | | | — | | | | (71,166 | ) |
| Class B | | | — | | | | — | | | | — | | | | (814 | ) |
| Class C | | | — | | | | — | | | | — | | | | (946 | ) |
| Return of capital: | | | | | | | | | | | | | | | | |
| Class A | | | — | | | | — | | | | (104,244 | ) | | | — | |
| Class B | | | — | | | | — | | | | (6,301 | ) | | | — | |
| Class C | | | — | | | | — | | | | (31,271 | ) | | | — | |
| Class I | | | — | | | | — | | | | (5,361,910 | ) | | | — | |
| | | | | | | | | | | | | | | | | |
| Total distributions | | | (137,654,710 | ) | | | (43,574,710 | ) | | | (20,247,693 | ) | | | (7,701,124 | ) |
| | | | | | | | | | | | | | | | | |
| | | | | | | | | | | | | | | | | |
FROM CAPITAL SHARE TRANSACTIONS: | | | | | | | | | | | | | | | | |
| Net proceeds from sale of shares | | | 221,879,155 | | | | 280,987,914 | | | | 133,122,757 | | | | 310,896,270 | |
| Reinvestment of distributions | | | 116,874,956 | | | | 37,402,991 | | | | 20,075,844 | | | | 6,461,870 | |
| | | | | | | | | | | | | | | | | |
| | | | 338,754,111 | | | | 318,390,905 | | | | 153,198,601 | | | | 317,358,140 | |
| Redemption fee proceeds (Note 4) | | | 1,344,090 | | | | 3,086,432 | | | | — | | | | — | |
| Cost of shares redeemed | | | (348,756,344 | ) | | | (422,755,301 | ) | | | (124,022,111 | ) | | | (27,962,963 | ) |
| | | | | | | | | | | | | | | | | |
| Net increase (decrease) in net assets resulting from capital share transactions | | | (8,658,143 | ) | | | (101,277,964 | ) | | | 29,176,490 | | | | 289,395,177 | |
| | | | | | | | | | | | | | | | | |
| Net increase (decrease) in net assets | | | (661,376,371 | ) | | | 170,556,490 | | | | (83,382,156 | ) | | | 288,904,580 | |
| | | | | | | | | | | | | | | | | |
| | | | | | | | | | | | | | | | | |
NET ASSETS: | | | | | | | | | | | | | | | | |
| Beginning of year | | | 922,503,740 | | | | 751,947,250 | | | | 315,662,419 | | | | 26,757,839 | |
| | | | | | | | | | | | | | | | | |
| End of year | | $ | 261,127,369 | | | $ | 922,503,740 | | | $ | 232,280,263 | | | $ | 315,662,419 | |
| | | | | | | | | | | | | | | | | |
| Undistributed net investment income at end of year | | $ | — | | | $ | — | | | $ | 782,266 | | | $ | — | |
| | | | | | | | | | | | | | | | | |
See Accompanying Notes to Financial Statements
85
STATEMENTS OF CHANGES IN NET ASSETS
| | | | | | | | | | | | | | | | | |
| | | | | ING Diversified
|
| | | ING Global Bond Fund | | International Fund |
| | | Year Ended
| | Year Ended
| | Year Ended
| | Year Ended
|
| | | October 31,
| | October 31,
| | October 31,
| | October 31,
|
| | | 2008 | | 2007 | | 2008 | | 2007 |
| |
FROM OPERATIONS: | | | | | | | | | | | | | | | | |
| Net investment income | | $ | 2,043,534 | | | $ | 823,069 | | | $ | 5,865,573 | | | $ | 431,276 | |
| Net realized gain (loss) on investments, investments in affiliated underlying funds, foreign currency related transactions, futures, swaps, and written options | | | 3,186,716 | | | | 798,273 | | | | (18,522,580 | ) | | | 7,816,137 | |
| Net change in unrealized appreciation or depreciation on investments, investments in affiliated underlying funds, foreign currency related transactions, futures, and swaps | | | (7,619,480 | ) | | | 939,686 | | | | (292,969,322 | ) | | | 97,142,153 | |
| | | | | | | | | | | | | | | | | |
| Increase (decrease) in net assets resulting from operations | | | (2,389,230 | ) | | | 2,561,028 | | | | (305,626,329 | ) | | | 105,389,566 | |
| | | | | | | | | | | | | | | | | |
| | | | | | | | | | | | | | | | | |
FROM DISTRIBUTIONS TO SHAREHOLDERS: | | | | | | | | | | | | | | | | |
| Net investment income: | | | | | | | | | | | | | | | | |
| Class A | | | (3,359,515 | ) | | | (1,111,960 | ) | | | (6,883,232 | ) | | | (968,683 | ) |
| Class B | | | (100,198 | ) | | | (6,982 | ) | | | (519,915 | ) | | | (17,195 | ) |
| Class C | | | (710,709 | ) | | | (15,266 | ) | | | (2,156,592 | ) | | | (76,872 | ) |
| Class I | | | (9,087 | ) | | | (47 | ) | | | (586 | ) | | | (55 | ) |
| Class O | | | (1,127 | ) | | | — | | | | — | | | | — | |
| Class R | | | — | | | | — | | | | (6,279 | ) | | | (472 | ) |
| Net realized gains: | | | | | | | | | | | | | | | | |
| Class A | | | (369,378 | ) | | | (443,199 | ) | | | (2,346,495 | ) | | | — | |
| Class B | | | (6,552 | ) | | | (718 | ) | | | (269,552 | ) | | | — | |
| Class C | | | (30,696 | ) | | | (756 | ) | | | (1,057,058 | ) | | | — | |
| Class I | | | (12 | ) | | | (18 | ) | | | (180 | ) | | | — | |
| Class R | | | — | | | | — | | | | (2,520 | ) | | | — | |
| | | | | | | | | | | | | | | | | |
| Total distributions | | | (4,587,274 | ) | | | (1,578,946 | ) | | | (13,242,409 | ) | | | (1,063,277 | ) |
| | | | | | | | | | | | | | | | | |
| | | | | | | | | | | | | | | | | |
FROM CAPITAL SHARE TRANSACTIONS: | | | | | | | | | | | | | | | | |
| Net proceeds from sale of shares | | | 125,112,248 | | | | 4,813,090 | | | | 166,546,295 | | | | 299,856,179 | |
| Reinvestment of distributions | | | 2,140,936 | | | | 44,534 | | | | 9,865,969 | | | | 792,330 | |
| | | | | | | | | | | | | | | | | |
| | | | 127,253,184 | | | | 4,857,624 | | | | 176,412,264 | | | | 300,648,509 | |
| Cost of shares redeemed | | | (37,864,589 | ) | | | (830,470 | ) | | | (185,570,371 | ) | | | (71,791,916 | ) |
| | | | | | | | | | | | | | | | | |
| Net increase (decrease) in net assets resulting from capital share transactions | | | 89,388,595 | | | | 4,027,154 | | | | (9,158,107 | ) | | | 228,856,593 | |
| | | | | | | | | | | | | | | | | |
| Net increase (decrease) in net assets | | | 82,412,091 | | | | 5,009,236 | | | | (328,026,845 | ) | | | 333,182,882 | |
| | | | | | | | | | | | | | | | | |
| | | | | | | | | | | | | | | | | |
NET ASSETS: | | | | | | | | | | | | | | | | |
| Beginning of year | | | 30,857,433 | | | | 25,848,197 | | | | 596,155,428 | | | | 262,972,546 | |
| | | | | | | | | | | | | | | | | |
| End of year | | $ | 113,269,524 | | | $ | 30,857,433 | | | $ | 268,128,583 | | | $ | 596,155,428 | |
| | | | | | | | | | | | | | | | | |
| Undistributed net investment income at end of year | | $ | 23,882 | | | $ | 24,974 | | | $ | 20,777,313 | | | $ | 3,523,584 | |
| | | | | | | | | | | | | | | | | |
See Accompanying Notes to Financial Statements
86
ING Global Equity Dividend Fund
Financial Highlights
Selected data for a share of beneficial interest outstanding throughout each year.
| | | | | | | | | | | | | | | | | | | | | | | |
| | | | | Class A |
| | | | | Year Ended October 31, |
| | | | | 2008 | | 2007 | | 2006 | | 2005 | | 2004 |
| |
|
Per Share Operating Performance: | | | | | | | | | | | | | | | | | | | | | | |
| Net asset value, beginning of year | | $ | | | 16.84 | | | | 15.76 | | | | 13.07 | | | | 12.41 | | | | 10.49 | |
| Income (loss) from investment operations: | | | | | | | | | | | | | | | | | | | | | | |
| Net investment income | | $ | | | 0.56 | | | | 0.54 | * | | | 0.54 | | | | 0.47 | * | | | 0.44 | |
| Net realized and unrealized gain (loss) on investments | | $ | | | (6.84 | ) | | | 1.84 | | | | 2.85 | | | | 0.92 | | | | 1.87 | |
| Total from investment operations | | $ | | | (6.28 | ) | | | 2.38 | | | | 3.39 | | | | 1.39 | | | | 2.31 | |
| Less distributions from: | | | | | | | | | | | | | | | | | | | | | | |
| Net investment income | | $ | | | 0.54 | | | | 0.55 | | | | 0.51 | | | | 0.54 | | | | 0.39 | |
| Net realized gains on investments | | $ | | | 1.20 | | | | 0.75 | | | | 0.19 | | | | 0.19 | | | | — | |
| Return of capital | | $ | | | 0.05 | | | | — | | | | — | | | | — | | | | — | |
| Total distributions | | $ | | | 1.79 | | | | 1.30 | | | | 0.70 | | | | 0.73 | | | | 0.39 | |
| Net asset value, end of year | | $ | | | 8.77 | | | | 16.84 | | | | 15.76 | | | | 13.07 | | | | 12.41 | |
Total Return(1) | | % | | | (40.84 | ) | | | 15.80 | | | | 26.56 | | | | 11.45 | | | | 22.59 | |
| | | | | | | | | | | | | | | | | | | | | | | |
| | | | | | | | | | | | | | | | | | | | | | | |
Ratios and Supplemental Data: | | | | | | | | | | | | | | | | | | | | | | |
| Net assets, end of year (000’s) | | $ | | | 63,134 | | | | 182,669 | | | | 108,911 | | | | 73,186 | | | | 11,316 | |
| Ratios to average net assets: | | | | | | | | | | | | | | | | | | | | | | |
| Gross expenses prior to expense waiver/recoupment | | % | | | 1.42 | | | | 1.26 | | | | 1.27 | | | | 1.28 | | | | 3.44 | |
Net expenses after expense waiver/recoupment(2) | | % | | | 1.41 | | | | 1.26 | | | | 1.33 | | | | 1.40 | | | | 1.40 | |
Net investment income after expense waiver/recoupment(2) | | % | | | 3.85 | | | | 3.31 | | | | 3.76 | | | | 3.60 | | | | 4.39 | |
| Portfolio turnover rate | | % | | | 46 | | | | 36 | | | | 50 | | | | 57 | | | | 60 | |
|
| | | | | | | | | | | | | | | | | | | | | | | |
| | | | | Class B |
| | | | | Year Ended October 31, |
| | | | | 2008 | | 2007 | | 2006 | | 2005 | | 2004 |
| |
|
Per Share Operating Performance: | | | | | | | | | | | | | | | | | | | | | | |
| Net asset value, beginning of year | | $ | | | 16.79 | | | | 15.72 | | | | 13.05 | | | | 12.37 | | | | 10.49 | |
| Income (loss) from investment operations: | | | | | | | | | | | | | | | | | | | | | | |
| Net investment income | | $ | | | 0.46 | | | | 0.39 | | | | 0.43 | | | | 0.37 | * | | | 0.42 | |
| Net realized and unrealized gain (loss) on investments | | $ | | | (6.82 | ) | | | 1.86 | | | | 2.84 | | | | 0.92 | | | | 1.82 | |
| Total from investment operations | | $ | | | (6.36 | ) | | | 2.25 | | | | 3.27 | | | | 1.29 | | | | 2.24 | |
| Less distributions from: | | | | | | | | | | | | | | | | | | | | | | |
| Net investment income | | $ | | | 0.44 | | | | 0.43 | | | | 0.41 | | | | 0.42 | | | | 0.36 | |
| Net realized gains on investments | | $ | | | 1.20 | | | | 0.75 | | | | 0.19 | | | | 0.19 | | | | — | |
| Return of capital | | $ | | | 0.05 | | | | — | | | | — | | | | — | | | | — | |
| Total distributions | | $ | | | 1.69 | | | | 1.18 | | | | 0.60 | | | | 0.61 | | | | 0.36 | |
| Net asset value, end of year | | $ | | | 8.74 | | | | 16.79 | | | | 15.72 | | | | 13.05 | | | | 12.37 | |
Total Return(1) | | % | | | (41.32 | ) | | | 14.94 | | | | 25.55 | | | | 10.65 | | | | 21.92 | |
| | | | | | | | | | | | | | | | | | | | | | | |
| | | | | | | | | | | | | | | | | | | | | | | |
Ratios and Supplemental Data: | | | | | | | | | | | | | | | | | | | | | | |
| Net assets, end of year (000’s) | | $ | | | 21,311 | | | | 58,093 | | | | 44,936 | | | | 28,811 | | | | 3,303 | |
| Ratios to average net assets: | | | | | | | | | | | | | | | | | | | | | | |
| Gross expenses prior to expense waiver/recoupment | | % | | | 2.17 | | | | 2.01 | | | | 2.02 | | | | 2.03 | | | | 4.19 | |
Net expenses after expense waiver/recoupment(2) | | % | | | 2.16 | | | | 2.01 | | | | 2.08 | | | | 2.15 | | | | 2.15 | |
Net investment income after expense waiver/recoupment(2) | | % | | | 3.11 | | | | 2.53 | | | | 3.05 | | | | 2.83 | | | | 4.03 | |
| Portfolio turnover rate | | % | | | 46 | | | | 36 | | | | 50 | | | | 57 | | | | 60 | |
|
| | |
| (1) | | Total return is calculated assuming reinvestment of all dividends and capital gain distributions at net asset value and excluding the deduction of sales charges. |
| |
| (2) | | The Investment Adviser has agreed to limit expenses, (excluding interest, taxes, brokerage commissions, extraordinary expenses and acquired fund fees and expenses) subject to possible recoupment by the Investment Adviser within three years of being incurred. |
| |
| * | | Calculated using average number of shares outstanding throughout the period. |
See Accompanying Notes to Financial Statements
87
ING Global Equity Dividend Fund (continued)
Financial Highlights
Selected data for a share of beneficial interest outstanding throughout each period.
| | | | | | | | | | | | | | | | | | | | | | | |
| | | | | Class C |
| | | | | Year Ended October 31, |
| | | | | 2008 | | 2007 | | 2006 | | 2005 | | 2004 |
| |
|
Per Share Operating Performance: | | | | | | | | | | | | | | | | | | | | | | |
| Net asset value, beginning of year | | $ | | | 16.75 | | | | 15.69 | | | | 13.02 | | | | 12.37 | | | | 10.48 | |
| Income (loss) from investment operations: | | | | | | | | | | | | | | | | | | | | | | |
| Net investment income | | $ | | | 0.44 | | | | 0.39 | | | | 0.43 | | | | 0.37 | * | | | 0.39 | |
| Net realized and unrealized gain (loss) on investments | | $ | | | (6.78 | ) | | | 1.86 | | | | 2.84 | | | | 0.90 | | | | 1.86 | |
| Total from investment operations | | $ | | | (6.34 | ) | | | 2.25 | | | | 3.27 | | | | 1.27 | | | | 2.25 | |
| Less distributions from: | | | | | | | | | | | | | | | | | | | | | | |
| Net investment income | | $ | | | 0.44 | | | | 0.44 | | | | 0.41 | | | | 0.43 | | | | 0.36 | |
| Net realized gains on investments | | $ | | | 1.20 | | | | 0.75 | | | | 0.19 | | | | 0.19 | | | | — | |
| Return of capital | | $ | | | 0.05 | | | | — | | | | — | | | | — | | | | — | |
| Total distributions | | $ | | | 1.69 | | | | 1.19 | | | | 0.60 | | | | 0.62 | | | | 0.36 | |
| Net asset value, end of year | | $ | | | 8.72 | | | | 16.75 | | | | 15.69 | | | | 13.02 | | | | 12.37 | |
Total Return(2) | | % | | | (41.29 | ) | | | 14.94 | | | | 25.62 | | | | 10.51 | | | | 21.99 | |
| | | | | | | | | | | | | | | | | | | | | | | |
| | | | | | | | | | | | | | | | | | | | | | | |
Ratios and Supplemental Data: | | | | | | | | | | | | | | | | | | | | | | |
| Net assets, end of year (000’s) | | $ | | | 48,567 | | | | 124,765 | | | | 77,426 | | | | 48,965 | | | | 3,655 | |
| Ratios to average net assets: | | | | | | | | | | | | | | | | | | | | | | |
| Gross expenses prior to expense waiver/recoupment | | % | | | 2.17 | | | | 2.01 | | | | 2.02 | | | | 2.03 | | | | 4.19 | |
Net expenses after expense waiver/recoupment(4) | | % | | | 2.16 | | | | 2.01 | | | | 2.08 | | | | 2.15 | | | | 2.15 | |
Net investment income after expense waiver/recoupment(4) | | % | | | 3.13 | | | | 2.54 | | | | 3.03 | | | | 2.82 | | | | 3.99 | |
| Portfolio turnover rate | | % | | | 46 | | | | 36 | | | | 50 | | | | 57 | | | | 60 | |
|
| | | | | | | | | | | |
| | | | | Class I |
| | | | | Year
| | August 1,
|
| | | | | Ended
| | 2007(1) to
|
| | | | | October 31,
| | October 31,
|
| | | | | 2008 | | 2007 |
| |
|
Per Share Operating Performance: | | | | | | | | | | |
| Net asset value, beginning of period | | $ | | | 16.83 | | | | 15.81 | |
| Income (loss) from investment operations: | | | | | | | | | | |
| Net investment income | | $ | | | 0.47 | | | | 0.12 | * |
| Net realized and unrealized gain (loss) on investments | | $ | | | (6.68 | ) | | | 1.03 | |
| Total from investment operations | | $ | | | (6.21 | ) | | | 1.15 | |
| Less distributions from: | | | | | | | | | | |
| Net investment income | | $ | | | 0.59 | | | | 0.13 | |
| Net realized gains on investments | | $ | | | 1.20 | | | | — | |
| Return of capital | | $ | | | 0.05 | | | | — | |
| Total distributions | | $ | | | 1.84 | | | | 0.13 | |
| Net asset value, end of period | | $ | | | 8.78 | | | | 16.83 | |
Total Return(2) | | % | | | (40.49 | ) | | | 7.26 | |
| | | | | | | | | | | |
| | | | | | | | | | | |
Ratios and Supplemental Data: | | | | | | | | | | |
| Net assets, end of period (000’s) | | $ | | | 1,207 | | | | 1 | |
| Ratios to average net assets: | | | | | | | | | | |
Gross expenses prior to expense waiver(3) | | % | | | 1.07 | | | | 0.90 | |
Net expense after expense waiver(3)(4) | | % | | | 1.06 | | | | 0.90 | |
Net investment income after expense waiver(3)(4) | | % | | | 3.16 | | | | 2.98 | |
| Portfolio turnover rate | | % | | | 46 | | | | 36 | |
|
| | |
| (1) | | Commencement of operations. |
| |
| (2) | | Total return is calculated assuming reinvestment of all dividends and capital gain distributions at net asset value and excluding the deduction of sales charges. Total return for less than one year is not annualized. |
| |
| (3) | | Annualized for periods less than one year. |
| |
| (4) | | The Investment Adviser has agreed to limit expenses, (excluding interest, taxes, brokerage commissions, extraordinary expenses and acquired fund fees and expenses) subject to possible recoupment by the Investment Adviser within three years of being incurred. |
| |
| * | | Calculated using average number of shares outstanding throughout the period. |
See Accompanying Notes to Financial Statements
88
ING Global Equity Dividend Fund (continued)
Financial Highlights
Selected data for a share of beneficial interest outstanding throughout each period.
| | | | | | | | | | | |
| | | | | Class O |
| | | | | Year
| | November 15,
|
| | | | | Ended
| | 2006(1) to
|
| | | | | October 31,
| | October 31,
|
| | | | | 2008 | | 2007 |
| |
|
Per Share Operating Performance: | | | | | | | | | | |
| Net asset value, beginning of period | | $ | | | 16.83 | | | | 15.86 | |
| Income (loss) from investment operations: | | | | | | | | | | |
| Net investment income | | $ | | | 0.51 | * | | | 0.55 | * |
| Net realized and unrealized gain (loss) on investments | | $ | | | (6.78 | ) | | | 1.74 | |
| Total from investment operations | | $ | | | (6.27 | ) | | | 2.29 | |
| Less distributions from: | | | | | | | | | | |
| Net investment income | | $ | | | 0.55 | | | | 0.57 | |
| Net realized gains on investments | | $ | | | 1.20 | | | | 0.75 | |
| Return of capital | | $ | | | 0.05 | | | | — | |
| Total distributions | | $ | | | 1.80 | | | | 1.32 | |
| Net asset value, end of period | | $ | | | 8.76 | | | | 16.83 | |
Total Return(2) | | % | | | (40.83 | ) | | | 15.12 | |
| | | | | | | | | | | |
| | | | | | | | | | | |
Ratios and Supplemental Data: | | | | | | | | | | |
| Net assets, end of period (000’s) | | $ | | | 14,695 | | | | 23,737 | |
| Ratios to average net assets: | | | | | | | | | | |
Gross expenses prior to expense waiver(3) | | % | | | 1.42 | | | | 1.26 | |
Net expense after expense waiver(3)(4) | | % | | | 1.41 | | | | 1.26 | |
Net investment income after expense waiver(3)(4) | | % | | | 3.95 | | | | 3.46 | |
| Portfolio turnover rate | | % | | | 46 | | | | 36 | |
|
| | | | | | | |
| | | | | Class W |
| | | | | February 12,
|
| | | | | 2008(1) to
|
| | | | | October 31,
|
| | | | | 2008 |
| |
|
Per Share Operating Performance: | | | | | | |
| Net asset value, beginning of period | | $ | | | 14.51 | |
| Income (loss) from investment operations: | | | | | | |
| Net investment income | | $ | | | 0.35 | |
| Net realized and unrealized loss on investments | | $ | | | (4.83 | ) |
| Total from investment operations | | $ | | | (4.48 | ) |
| Less distributions from: | | | | | | |
| Net investment income | | $ | | | 0.46 | |
| Return of capital | | $ | | | 0.04 | |
| Total distributions | | $ | | | 0.50 | |
| Net asset value, end of period | | $ | | | 9.53 | |
Total Return(2) | | % | | | (31.78 | ) |
| | | | | | | |
| | | | | | | |
Ratios and Supplemental Data: | | | | | | |
| Net assets, end of period (000’s) | | $ | | | 70 | |
| Ratios to average net assets: | | | | | | |
Gross expenses prior to expense waiver(3) | | % | | | 1.07 | |
Net expense after expense waiver(3)(4) | | % | | | 1.06 | |
Net investment income after expense waiver(3)(4) | | % | | | 3.38 | |
| Portfolio turnover rate | | % | | | 46 | |
|
| | |
| (1) | | Commencement of operations. |
| |
| (2) | | Total return is calculated assuming reinvestment of all dividends and capital gain distributions at net asset value and excluding the deduction of sales charges. Total return for less than one year is not annualized. |
| |
| (3) | | Annualized for periods less than one year. |
| |
| * | | Calculated using average number of shares outstanding throughout the period. |
| |
| (4) | | The Investment Adviser has agreed to limit expenses, (excluding interest, taxes, brokerage commissions, extraordinary expenses and acquired fund fees and expenses) subject to possible recoupment by the Investment Adviser within three years of being incurred. |
See Accompanying Notes to Financial Statements
89
ING Global Natural Resources Fund
Financial Highlights
Selected data for a share of beneficial interest outstanding throughout each period.
| | | | | | | | | | | | | | | | | | | | | | | |
| | | | | Class A |
| | | | | Year Ended October 31, |
| | | | | 2008 | | 2007 | | 2006 | | 2005 | | 2004 |
| |
|
Per Share Operating Performance: | | | | | | | | | | | | | | | | | | | | | | |
| Net asset value, beginning of year | | $ | | | 14.18 | | | | 10.46 | | | | 7.34 | | | | 7.09 | | | | 6.94 | |
| Income (loss) from investment operations: | | | | | | | | | | | | | | | | | | | | | | |
| Net investment income (loss) | | $ | | | 0.05 | | | | (0.03 | ) | | | (0.06 | ) | | | (0.06 | ) | | | (0.05 | ) |
| Net realized and unrealized gain (loss) on investments | | $ | | | (4.92 | ) | | | 4.36 | | | | 3.20 | | | | 0.54 | | | | 0.20 | |
| Total from investment operations | | $ | | | (4.87 | ) | | | 4.33 | | | | 3.14 | | | | 0.48 | | | | 0.15 | |
| Less distributions from: | | | | | | | | | | | | | | | | | | | | | | |
| Net investment income | | $ | | | 0.11 | | | | 0.26 | | | | 0.02 | | | | 0.23 | | | | — | |
| Net realized gains on investments | | $ | | | 2.46 | | | | 0.35 | | | | — | | | | — | | | | — | |
| Total distributions | | $ | | | 2.57 | | | | 0.61 | | | | 0.02 | | | | 0.23 | | | | — | |
| Net asset value, end of year | | $ | | | 6.74 | | | | 14.18 | | | | 10.46 | | | | 7.34 | | | | 7.09 | |
Total Return(2) | | % | | | (41.12 | ) | | | 43.22 | | | | 42.76 | | | | 6.81 | | | | 2.16 | |
| | | | | | | | | | | | | | | | | | | | | | | |
| | | | | | | | | | | | | | | | | | | | | | | |
Ratios and Supplemental Data: | | | | | | | | | | | | | | | | | | | | | | |
| Net assets, end of year (000’s) | | $ | | | 83,713 | | | | 157,367 | | | | 121,112 | | | | 87,441 | | | | 91,756 | |
| Ratios to average net assets: | | | | | | | | | | | | | | | | | | | | | | |
| Expenses | | % | | | 1.46 | † | | | 1.44 | † | | | 1.42 | | | | 1.56 | | | | 1.44 | |
| Net investment income (loss) | | % | | | 0.37 | † | | | (0.28 | )† | | | (0.61 | ) | | | (0.77 | ) | | | (0.69 | ) |
| Portfolio turnover rate | | % | | | 116 | | | | 121 | | | | 158 | | | | 78 | | | | 77 | |
|
| | | | | | | | | | | |
| | | | | Class I |
| | | | | Year
| | August 1,
|
| | | | | Ended
| | 2007(1) to
|
| | | | | October 31,
| | October 31,
|
| | | | | 2008 | | 2007 |
| |
|
Per Share Operating Performance: | | | | | | | | | | |
| Net asset value, beginning of period | | $ | | | 14.19 | | | | 12.07 | |
| Income from investment operations: | | | | | | | | | | |
| Net investment income | | $ | | | 0.12 | * | | | 0.00 | ** |
| Net realized and unrealized gain (loss) on investments | | $ | | | (4.95 | ) | | | 2.12 | |
| Total from investment operations | | $ | | | (4.83 | ) | | | 2.12 | |
| Less distributions from: | | | | | | | | | | |
| Net investment income | | $ | | | 0.15 | | | | — | |
| Net realized gains on investments | | $ | | | 2.46 | | | | — | |
| Total distributions | | $ | | | 2.61 | | | | — | |
| Net asset value, end of period | | $ | | | 6.75 | | | | 14.19 | |
Total Return(2) | | % | | | (40.87 | ) | | | 17.56 | |
| | | | | | | | | | | |
| | | | | | | | | | | |
Ratios and Supplemental Data: | | | | | | | | | | |
| Net assets, end of period (000’s) | | $ | | | 1 | | | | 2 | |
| Ratios to average net assets: | | | | | | | | | | |
Expenses(3) | | % | | | 1.11 | † | | | 1.08 | † |
Net investment income(3) | | % | | | 1.04 | † | | | 0.09 | † |
| Portfolio turnover rate | | % | | | 116 | | | | 121 | |
|
| | |
| (1) | | Commencement of operations. |
| |
| (2) | | Total return is calculated assuming reinvestment of all dividends and capital gain distributions at net asset value and excluding the deduction of sales charges. Total return for less than one year is not annualized. |
| |
| (3) | | Annualized for periods less than one year. |
| |
| * | | Calculated using average number of shares outstanding throughout the period. |
| |
| ** | | Amount is less than $0.005. |
| |
| † | | Impact of waiving the advisory fee for the ING Institutional Prime Money Market Fund holding has less than 0.01% impact on the expense ratio and net investment income or loss ratio. |
See Accompanying Notes to Financial Statements
90
ING Global Natural Resources Fund (continued)
Financial Highlights
Selected data for a share of beneficial interest outstanding throughout the period.
| | | | | | | |
| | | | | Class W |
| | | | | February 12,
|
| | | | | 2008(1) to
|
| | | | | October 31,
|
| | | | | 2008 |
| |
|
Per Share Operating Performance: | | | | | | |
| Net asset value, beginning of period | | $ | | | 12.84 | |
| Income (loss) from investment operations: | | | | | | |
| Net investment income | | $ | | | 0.03 | * |
| Net realized and unrealized loss on investments | | $ | | | (4.48 | ) |
| Total from investment operations | | $ | | | (4.45 | ) |
| Net asset value, end of period | | $ | | | 8.39 | |
Total Return(2) | | % | | | (34.66 | ) |
| | | | | | | |
Ratios and Supplemental Data: | | | | | | |
| Net assets, end of period (000’s) | | $ | | | 27 | |
| Ratios to average net assets: | | | | | | |
Expenses(3) | | % | | | 1.11 | † |
Net investment income(3) | | % | | | 0.38 | † |
| Portfolio turnover rate | | % | | | 116 | |
|
| | |
| (1) | | Commencement of operations. |
| |
| (2) | | Total return is calculated assuming reinvestment of all dividends and capital gain distributions at net asset value. Total return for less than one year is not annualized. |
| |
| (3) | | Annualized for periods less than one year. |
| |
| * | | Calculated using average number of shares outstanding throughout period. |
| |
| † | | Impact of waiving the advisory fee for the ING Institutional Prime Money Market Fund holding has less than 0.01% impact on expense ratio and net investment income ratio. |
See Accompanying Notes to Financial Statements
91
ING Global Real Estate Fund
Financial Highlights
Selected data for a share of beneficial interest outstanding throughout each year.
| | | | | | | | | | | | | | | | | | | | | | | |
| | | | | Class A |
| | | | | Year Ended October 31, |
| | | | | 2008 | | 2007 | | 2006 | | 2005 | | 2004 |
| |
|
Per Share Operating Performance: | | | | | | | | | | | | | | | | | | | | | | |
| Net asset value, beginning of year | | $ | | | 24.19 | | | | 22.23 | | | | 17.14 | | | | 15.40 | | | | 13.06 | |
| Income (loss) from investment operations: | | | | | | | | | | | | | | | | | | | | | | |
| Net investment income | | $ | | | 0.33 | * | | | 0.22 | * | | | 0.20 | * | | | 0.26 | *† | | | 0.27 | |
| Net realized and unrealized gain (loss) on investments | | $ | | | (11.19 | ) | | | 3.13 | | | | 6.41 | | | | 2.94 | † | | | 3.26 | |
| Total from investment operations | | $ | | | (10.86 | ) | | | 3.35 | | | | 6.61 | | | | 3.20 | | | | 3.53 | |
| Less distributions from: | | | | | | | | | | | | | | | | | | | | | | |
| Net investment income | | $ | | | 0.73 | | | | 1.08 | | | | 0.46 | | | | 0.54 | | | | 0.43 | |
| Net realized gains on investments | | $ | | | 0.04 | | | | 0.31 | | | | 1.06 | | | | 0.92 | | | | 0.76 | |
| Total distributions | | $ | | | 0.77 | | | | 1.39 | | | | 1.52 | | | | 1.46 | | | | 1.19 | |
| Net asset value, end of year | | $ | | | 12.56 | | | | 24.19 | | | | 22.23 | | | | 17.14 | | | | 15.40 | |
Total Return(1) | | % | | | (46.00 | ) | | | 15.44 | | | | 41.09 | | | | 21.95 | | | | 28.90 | |
| | | | | | | | | | | | | | | | | | | | | | | |
| | | | | | | | | | | | | | | | | | | | | | | |
Ratios and Supplemental Data: | | | | | | | | | | | | | | | | | | | | | | |
| Net assets, end of year (000’s) | | $ | | | 836,314 | | | | 1,115,493 | | | | 467,405 | | | | 138,314 | | | | 95,561 | |
| Ratios to average net assets: | | | | | | | | | | | | | | | | | | | | | | |
| Gross expenses prior to expense waiver/recoupment and brokerage commission recapture | | % | | | 1.41 | | | | 1.30 | | | | 1.39 | | | | 1.50 | | | | 1.55 | |
Net expenses after expense waiver/recoupment and prior to brokerage commission recapture(2) | | % | | | 1.41 | †† | | | 1.30 | | | | 1.39 | | | | 1.59 | | | | 1.75 | |
Net expenses after expense waiver/recoupment and brokerage commission recapture(2) | | % | | | 1.41 | †† | | | 1.30 | | | | 1.39 | | | | 1.59 | | | | 1.75 | |
Net investment income after expense waiver/recoupment and brokerage commission recapture(2) | | % | | | 1.76 | †† | | | 0.96 | | | | 1.04 | | | | 1.58 | † | | | 2.55 | |
| Portfolio turnover rate | | % | | | 44 | | | | 57 | | | | 39 | | | | 91 | | | | 129 | |
|
| | |
| (1) | | Total return is calculated assuming reinvestment of all dividends and capital gain distributions at net asset value and excluding the deduction of sales charges. |
| |
| (2) | | The Investment Adviser has agreed to limit expenses, (excluding interest, taxes, brokerage commissions, extraordinary expenses and acquired fund fees and expenses) subject to possible recoupment by the Investment Adviser within three years of being incurred. |
| |
| * | | Calculated using average number of shares outstanding throughout the period. |
| |
| † | | Effective November 1, 2004, the Fund adopted a policy to reduce cost of investments for financial statement purposes by the distributions received in excess of income from Real Estate Investment Trusts. The effect of this change for the twelve months ended October 31, 2005 was to decrease the net investment income per share by $0.12, increase net realized and unrealized gain on investments per share by $0.12 and decrease the ratio of net investment income to average net assets from 2.31% to 1.58% for Class A. |
| |
| †† | | Impact of waiving the advisory fee for the ING Institutional Prime Money Market Fund holding has less than 0.01% impact on the expense ratio and net investment income ratio. |
See Accompanying Notes to Financial Statements
92
ING Global Real Estate Fund (continued)
Financial Highlights
Selected data for a share of beneficial interest outstanding throughout each year.
| | | | | | | | | | | | | | | | | | | | | | | |
| | | | | Class B |
| | | | | Year Ended October 31, |
| | | | | 2008 | | 2007 | | 2006 | | 2005 | | 2004 |
| |
|
Per Share Operating Performance: | | | | | | | | | | | | | | | | | | | | | | |
| Net asset value, beginning of year | | $ | | | 20.67 | | | | 19.20 | | | | 15.01 | | | | 13.67 | | | | 11.74 | |
| Income (loss) from investment operations: | | | | | | | | | | | | | | | | | | | | | | |
| Net investment income | | $ | | | 0.16 | * | | | 0.04 | * | | | 0.05 | * | | | 0.12 | *† | | | 0.14 | |
| Net realized and unrealized gain (loss) on investments | | $ | | | (9.52 | ) | | | 2.69 | | | | 5.56 | | | | 2.59 | † | | | 2.90 | |
| Total from investment operations | | $ | | | (9.36 | ) | | | 2.73 | | | | 5.61 | | | | 2.71 | | | | 3.04 | |
| Less distributions from: | | | | | | | | | | | | | | | | | | | | | | |
| Net investment income | | $ | | | 0.61 | | | | 0.95 | | | | 0.36 | | | | 0.45 | | | | 0.35 | |
| Net realized gains on investments | | $ | | | 0.04 | | | | 0.31 | | | | 1.06 | | | | 0.92 | | | | 0.76 | |
| Total distributions | | $ | | | 0.65 | | | | 1.26 | | | | 1.42 | | | | 1.37 | | | | 1.11 | |
| Net asset value, end of year | | $ | | | 10.66 | | | | 20.67 | | | | 19.20 | | | | 15.01 | | | | 13.67 | |
Total Return(1) | | % | | | (46.40 | ) | | | 14.59 | | | | 40.04 | | | | 21.05 | | | | 27.89 | |
| | | | | | | | | | | | | | | | | | | | | | | |
| | | | | | | | | | | | | | | | | | | | | | | |
Ratios and Supplemental Data: | | | | | | | | | | | | | | | | | | | | | | |
| Net assets, end of year (000’s) | | $ | | | 23,663 | | | | 57,837 | | | | 31,677 | | | | 12,302 | | | | 4,736 | |
| Ratios to average net assets: | | | | | | | | | | | | | | | | | | | | | | |
| Gross expenses prior to expense waiver/recoupment and brokerage commission recapture | | % | | | 2.16 | | | | 2.05 | | | | 2.14 | | | | 2.25 | | | | 2.30 | |
Net expenses after expense waiver/recoupment and prior to brokerage commission recapture(2) | | % | | | 2.16 | †† | | | 2.05 | | | | 2.14 | | | | 2.34 | | | | 2.50 | |
Net expenses after expense waiver/recoupment and brokerage commission recapture(2) | | % | | | 2.16 | †† | | | 2.05 | | | | 2.14 | | | | 2.34 | | | | 2.50 | |
Net investment income after expense waiver/recoupment and brokerage commission recapture(2) | | % | | | 0.99 | †† | | | 0.22 | | | | 0.31 | | | | 0.79 | † | | | 1.78 | |
| Portfolio turnover rate | | % | | | 44 | | | | 57 | | | | 39 | | | | 91 | | | | 129 | |
|
| | |
| (1) | | Total return is calculated assuming reinvestment of all dividends and capital gain distributions at net asset value and excluding the deduction of sales charges. |
| |
| (2) | | The Investment Adviser has agreed to limit expenses, (excluding interest, taxes, brokerage commissions, extraordinary expenses and acquired fund fees and expenses) subject to possible recoupment by the Investment Adviser within three years of being incurred. |
| |
| * | | Calculated using average number of shares outstanding throughout the period. |
| |
| † | | Effective November 1, 2004, the Fund adopted a policy to reduce cost of investments for financial statement purposes by the distributions received in excess of income from Real Estate Investment Trusts. The effect of this change for the twelve months ended October 31, 2005 was to decrease the net investment income per share by $0.10, increase net realized and unrealized gain on investments per share by $0.10 and decrease the ratio of net investment income to average net assets from 1.51% to 0.79% for Class B. |
| |
| †† | | Impact of waiving the advisory fee for the ING Institutional Prime Money Market Fund holding has less than 0.01% impact on the expense ratio and net investment income ratio. |
See Accompanying Notes to Financial Statements
93
ING Global Real Estate Fund (continued)
Financial Highlights
Selected data for a share of beneficial interest outstanding throughout each year.
| | | | | | | | | | | | | | | | | | | | | | | |
| | | | | Class C |
| | | | | Year Ended October 31, |
| | | | | 2008 | | 2007 | | 2006 | | 2005 | | 2004 |
| |
|
Per Share Operating Performance: | | | | | | | | | | | | | | | | | | | | | | |
| Net asset value, beginning of year | | $ | | | 21.70 | | | | 20.10 | | | | 15.65 | | | | 14.19 | | | | 12.14 | |
| Income (loss) from investment operations: | | | | | | | | | | | | | | | | | | | | | | |
| Net investment income | | $ | | | 0.16 | | | | 0.04 | * | | | 0.05 | * | | | 0.12 | *† | | | 0.14 | |
| Net realized and unrealized gain (loss) on investments | | $ | | | (9.99 | ) | | | 2.82 | | | | 5.82 | | | | 2.71 | † | | | 3.02 | |
| Total from investment operations | | $ | | | (9.83 | ) | | | 2.86 | | | | 5.87 | | | | 2.83 | | | | 3.16 | |
| Less distributions from: | | | | | | | | | | | | | | | | | | | | | | |
| Net investment income | | $ | | | 0.61 | | | | 0.95 | | | | 0.36 | | | | 0.45 | | | | 0.35 | |
| Net realized gains on investments | | $ | | | 0.04 | | | | 0.31 | | | | 1.06 | | | | 0.92 | | | | 0.76 | |
| Total distributions | | $ | | | 0.65 | | | | 1.26 | | | | 1.42 | | | | 1.37 | | | | 1.11 | |
| Net asset value, end of year | | $ | | | 11.22 | | | | 21.70 | | | | 20.10 | | | | 15.65 | | | | 14.19 | |
Total Return(1) | | % | | | (46.38 | ) | | | 14.57 | | | | 40.06 | | | | 21.11 | | | | 27.93 | |
| | | | | | | | | | | | | | | | | | | | | | | |
| | | | | | | | | | | | | | | | | | | | | | | |
Ratios and Supplemental Data: | | | | | | | | | | | | | | | | | | | | | | |
| Net assets, end of year (000’s) | | $ | | | 153,110 | | | | 303,235 | | | | 109,197 | | | | 27,989 | | | | 7,817 | |
| Ratios to average net assets: | | | | | | | | | | | | | | | | | | | | | | |
| Gross expenses prior to expense waiver/recoupment and brokerage commission recapture | | % | | | 2.16 | | | | 2.05 | | | | 2.14 | | | | 2.25 | | | | 2.30 | |
Net expenses after expense waiver/recoupment and prior to brokerage commission recapture(2) | | % | | | 2.16 | †† | | | 2.05 | | | | 2.14 | | | | 2.34 | | | | 2.50 | |
Net expenses after expense waiver/recoupment and brokerage commission recapture(2) | | % | | | 2.16 | †† | | | 2.05 | | | | 2.14 | | | | 2.34 | | | | 2.50 | |
Net investment income after expense waiver/recoupment and brokerage commission recapture(2) | | % | | | 0.99 | | | | 0.20 | | | | 0.29 | | | | 0.78 | † | | | 1.72 | |
| Portfolio turnover rate | | % | | | 44 | | | | 57 | | | | 39 | | | | 91 | | | | 129 | |
|
| | |
| (1) | | Total return is calculated assuming reinvestment of all dividends and capital gain distributions at net asset value and excluding the deduction of sales charges. |
| |
| (2) | | The Investment Adviser has agreed to limit expenses, (excluding interest, taxes, brokerage commission, extraordinary expenses and acquired fund fees and expenses) subject to possible recoupment by the Investment Adviser within three years of being incurred. |
| |
| * | | Calculated using average number of shares outstanding throughout the period. |
| |
| † | | Effective November 1, 2004, the Fund adopted a policy to reduce cost of investments for financial statement purposes by the distributions received in excess of income from Real Estate Investment Trusts. The effect of this change for the twelve months ended October 31, 2005 was to decrease the net investment income per share by $0.11, increase net realized and unrealized gain on investments per share by $0.11 and decrease the ratio of net investment income to average net assets from 1.51% to 0.78% for Class C. |
| |
| †† | | Impact of waiving the advisory fee for the ING institutional Prime Money Market Fund holding has less than 0.01% impact on the expense ratio and net investment income ratio. |
See Accompanying Notes to Financial Statements
94
ING Global Real Estate Fund (continued)
Financial Highlights
Selected data for a share of beneficial interest outstanding throughout each period.
| | | | | | | | | | | | | | | | | | | |
| | | | | Class I |
| | | | | | | | | | | June 3,
|
| | | | | Year Ended
| | 2005(1) to
|
| | | | | October 31, | | October 31,
|
| | | | | 2008 | | 2007 | | 2006 | | 2005 |
| |
|
Per Share Operating Performance: | | | | | | | | | | | | | | | | | | |
| Net asset value, beginning of period | | $ | | | 24.21 | | | | 22.23 | | | | 17.14 | | | | 16.32 | |
| Income (loss) from investment operations: | | | | | | | | | | | | | | | | | | |
| Net investment income | | $ | | | 0.38 | * | | | 0.28 | * | | | 0.28 | * | | | 0.14 | *†† |
| Net realized and unrealized gain (loss) on investments | | $ | | | (11.17 | ) | | | 3.16 | | | | 6.39 | | | | 0.86 | †† |
| Total from investment operations | | $ | | | (10.79 | ) | | | 3.44 | | | | 6.67 | | | | 1.00 | |
| Less distributions from: | | | | | | | | | | | | | | | | | | |
| Net investment income | | $ | | | 0.81 | | | | 1.15 | | | | 0.52 | | | | 0.18 | |
| Net realized gains on investments | | $ | | | 0.04 | | | | 0.31 | | | | 1.06 | | | | — | |
| Total distributions | | $ | | | 0.85 | | | | 1.46 | | | | 1.58 | | | | 0.18 | |
| Net asset value, end of period | | $ | | | 12.57 | | | | 24.21 | | | | 22.23 | | | | 17.14 | |
Total Return(2) | | % | | | (45.77 | ) | | | 15.88 | | | | 41.49 | | | | 6.14 | |
| | | | | | | | | | | | | | | | | | | |
| | | | | | | | | | | | | | | | | | | |
Ratios and Supplemental Data: | | | | | | | | | | | | | | | | | | |
| Net assets, end of period (000’s) | | $ | | | 225,881 | | | | 76,869 | | | | 11,226 | | | | 1,681 | |
| Ratios to average net assets: | | | | | | | | | | | | | | | | | | |
Gross expenses prior to expense waiver/recoupment and brokerage commission recapture(3) | | % | | | 1.01 | | | | 0.95 | | | | 1.06 | | | | 1.22 | |
Net expenses after expense waiver/recoupment and prior to brokerage commission recapture(3)(4) | | % | | | 1.01 | † | | | 0.95 | | | | 1.06 | | | | 1.30 | |
Net expenses after expense waiver/recoupment and brokerage commission recapture(3)(4) | | % | | | 1.01 | † | | | 0.95 | | | | 1.06 | | | | 1.30 | |
Net investment income after expense waiver/recoupment and brokerage commission recapture(3)(4) | | % | | | 2.12 | † | | | 1.24 | | | | 1.40 | | | | 0.85 | †† |
| Portfolio turnover rate | | % | | | 44 | | | | 57 | | | | 39 | | | | 91 | |
| | | | | | | | | | | | | | | | | | | |
|
| | |
| (1) | | Commencement of operations. |
| |
| (2) | | Total return is calculated assuming reinvestment of all dividends and capital gain distributions at net asset value and excluding the deduction of sales charges. Total return for less than one year is not annualized. |
| |
| (3) | | Annualized for periods less than one year. |
| |
| (4) | | The Investment Adviser has agreed to limit expenses, (excluding interest, taxes, brokerage commissions, extraordinary expenses and acquired fund fees and expenses) subject to possible recoupment by the Investment Adviser within three years of being incurred. |
| |
| * | | Calculated using average number of shares outstanding throughout the period. |
| |
| † | | Impact of waiving the advisory fee for the ING Institutional Prime Money Market Fund holding has less than 0.01% impact on the expense ratio and net investment income ratio. |
| |
| †† | | Effective November 1, 2004, the Fund adopted a policy to reduce cost of investments for financial statement purposes by the distributions received in excess of income from Real Estate Investment Trusts. The effect of this change for the five months ended October 31, 2005 was to decrease the net investment income per share by $0.30, increase net realized and unrealized gain on investments per share by $0.30 and decrease the ratio of net investment income to average net assets from 2.60% to 0.85% for Class I. |
See Accompanying Notes to Financial Statements
95
ING Global Real Estate Fund (continued)
Financial Highlights
Selected data for a share of beneficial interest outstanding throughout the period.
| | | | | | | | | | | |
| | | | | Class O |
| | | | | Year
| | November 15,
|
| | | | | Ended
| | 2006(1) to
|
| | | | | October 31,
| | October 31,
|
| | | | | 2008 | | 2007 |
| |
|
Per Share Operating Performance: | | | | | | | | | | |
| Net asset value, beginning of period | | $ | | | 24.19 | | | | 22.20 | |
| Income (loss) from investment operations: | | | | | | | | | | |
| Net investment income | | $ | | | 0.33 | * | | | 0.20 | * |
| Net realized and unrealized gain (loss) on investments | | $ | | | (11.19 | ) | | | 3.20 | |
| Total from investment operations | | $ | | | (10.86 | ) | | | 3.40 | |
| Less distributions from: | | | | | | | | | | |
| Net investment income | | $ | | | 0.74 | | | | 1.10 | |
| Net realized gains on investments | | $ | | | 0.04 | | | | 0.31 | |
| Total distributions | | $ | | | 0.78 | | | | 1.41 | |
| Net asset value, end of period | | $ | | | 12.55 | | | | 24.19 | |
Total Return(2) | | % | | | (46.03 | ) | | | 15.68 | |
| | | | | | | | | | | |
| | | | | | | | | | | |
Ratios and Supplemental Data: | | | | | | | | | | |
| Net assets, end of period (000’s) | | $ | | | 12,758 | | | | 26,137 | |
| Ratios to average net assets: | | | | | | | | | | |
Gross expenses prior to brokerage commission recapture(3) | | % | | | 1.41 | | | | 1.30 | |
Net expenses after brokerage commission recapture(3) | | % | | | 1.41 | † | | | 1.30 | |
Net investment income after brokerage commission recapture(3) | | % | | | 1.74 | † | | | 0.90 | |
| Portfolio turnover rate | | % | | | 44 | | | | 57 | |
|
| | | | | | | |
| | | | | Class W |
| | | | | February 12,
|
| | | | | 2008(1) to
|
| | | | | October 31,
|
| | | | | 2008 |
| |
|
Per Share Operating Performance: | | | | | | |
| Net asset value, beginning of period | | $ | | | 19.29 | |
| Income (loss) from investment operations: | | | | | | |
| Net investment income | | $ | | | 0.28 | |
| Net realized and unrealized loss on investments | | $ | | | (6.65 | ) |
| Total from investment operations | | $ | | | (6.37 | ) |
| Less distributions from: | | | | | | |
| Net investment income | | $ | | | 0.33 | |
| Total distributions | | $ | | | 0.33 | |
| Net asset value, end of period | | $ | | | 12.59 | |
Total Return(2) | | % | | | (33.53 | ) |
| | | | | | | |
| | | | | | | |
Ratios and Supplemental Data: | | | | | | |
| Net assets, end of period (000’s) | | $ | | | 50,233 | |
| Ratios to average net assets: | | | | | | |
Expenses(3) | | % | | | 1.01 | † |
Net investment income(3) | | % | | | 1.95 | † |
| Portfolio turnover rate | | % | | | 44 | |
|
| | |
| (1) | | Commencement of operations. |
| |
| (2) | | Total return is calculated assuming reinvestment of all dividends and capital gain distributions at net asset value. Total return for less than one year is not annualized. |
| |
| (3) | | Annualized for periods less than one year. |
| |
| * | | Calculated using average number of shares outstanding throughout the period. |
| |
| † | | Impact of waiving the advisory fee for the ING Institutional Prime Money Market Fund holding has less than 0.01% impact on the expense ratio and net investment income ratio. |
See Accompanying Notes to Financial Statements
96
ING Global Value Choice Fund
Financial Highlights
Selected data for a share of beneficial interest outstanding throughout each year.
| | | | | | | | | | | | | | | | | | | | | | | |
| | | | | Class A |
| | | | | Year Ended October 31, |
| | | | | 2008 | | 2007 | | 2006 | | 2005 | | 2004 |
| |
|
Per Share Operating Performance: | | | | | | | | | | | | | | | | | | | | | | |
| Net asset value, beginning of year | | $ | | | 28.40 | | | | 21.72 | | | | 18.16 | | | | 15.96 | | | | 14.76 | |
| Income (loss) from investment operations: | | | | | | | | | | | | | | | | | | | | | | |
| Net investment income (loss) | | $ | | | 0.11 | | | | 0.01 | | | | 0.08 | | | | 0.09 | | | | (0.04 | ) |
| Net realized and unrealized gain (loss) on investments | | $ | | | (11.51 | ) | | | 6.67 | | | | 3.62 | | | | 2.11 | | | | 1.24 | |
| Total from investment operations | | $ | | | (11.40 | ) | | | 6.68 | | | | 3.70 | | | | 2.20 | | | | 1.20 | |
| Less distributions from: | | | | | | | | | | | | | | | | | | | | | | |
| Net investment income | | $ | | | 0.16 | | | | — | | | | 0.14 | | | | — | | | | — | |
| Total distributions | | $ | | | 0.16 | | | | — | | | | 0.14 | | | | — | | | | — | |
| Payment by affiliate | | $ | | | — | | | | — | | | | — | | | | 0.00 | ** | | | — | |
| Net asset value, end of year | | $ | | | 16.84 | | | | 28.40 | | | | 21.72 | | | | 18.16 | | | | 15.96 | |
Total Return(1) | | % | | | (40.34 | ) | | | 30.76 | | | | 20.48 | | | | 13.78 | † | | | 8.13 | |
| | | | | | | | | | | | | | | | | | | | | | | |
Ratios and Supplemental Data: | | | | | | | | | | | | | | | | | | | | | | |
| Net assets, end of year (000’s) | | $ | | | 38,258 | | | | 58,600 | | | | 47,305 | | | | 41,941 | | | | 46,133 | |
| Ratios to average net assets: | | | | | | | | | | | | | | | | | | | | | | |
| Gross expenses prior to expense waiver/recoupment and brokerage commission recapture | | % | | | 1.62 | | | | 1.77 | | | | 1.78 | | | | 1.90 | | | | 1.77 | |
Net expenses after expense waiver/recoupment and prior to brokerage commission recapture(2) | | % | | | 1.55 | †† | | | 1.82 | | | | 1.78 | | | | 1.85 | | | | 1.85 | |
Net expenses after expense waiver/recoupment and brokerage commission recapture(2) | | % | | | 1.53 | †† | | | 1.81 | | | | 1.77 | | | | 1.85 | | | | 1.85 | |
Net investment income (loss) after expense waiver/recoupment and brokerage commission recapture(2) | | % | | | 0.41 | †† | | | 0.04 | | | | 0.40 | | | | 0.46 | | | | (0.21 | ) |
| Portfolio turnover rate | | % | | | 73 | | | | 66 | | | | 77 | | | | 129 | | | | 101 | |
|
| | | | | | | | | | | | | | | | | | | | | | | |
| | | | | Class B |
| | | | | Year Ended October 31, |
| | | | | 2008 | | 2007 | | 2006 | | 2005 | | 2004 |
| |
|
Per Share Operating Performance: | | | | | | | | | | | | | | | | | | | | | | |
| Net asset value, beginning of year | | $ | | | 30.58 | | | | 23.54 | | | | 19.67 | | | | 17.39 | | | | 16.19 | |
| Income (loss) from investment operations: | | | | | | | | | | | | | | | | | | | | | | |
| Net investment loss | | $ | | | (0.11 | )* | | | (0.17 | )* | | | (0.04 | ) | | | (0.04 | ) | | | (0.17 | ) |
| Net realized and unrealized gain (loss) on investments | | $ | | | (12.37 | ) | | | 7.21 | | | | 3.91 | | | | 2.32 | | | | 1.37 | |
| Total from investment operations | | $ | | | (12.48 | ) | | | 7.04 | | | | 3.87 | | | | 2.28 | | | | 1.20 | |
| Payment by affiliate | | $ | | | — | | | | — | | | | — | | | | 0.00 | ** | | | — | |
| Net asset value, end of year | | $ | | | 18.10 | | | | 30.58 | | | | 23.54 | | | | 19.67 | | | | 17.39 | |
Total Return(1) | | % | | | (40.81 | ) | | | 29.91 | | | | 19.67 | | | | 13.11 | † | | | 7.41 | |
| | | | | | | | | | | | | | | | | | | | | | | |
Ratios and Supplemental Data: | | | | | | | | | | | | | | | | | | | | | | |
| Net assets, end of year (000’s) | | $ | | | 6,722 | | | | 22,049 | | | | 21,364 | | | | 23,483 | | | | 28,559 | |
| Ratios to average net assets: | | | | | | | | | | | | | | | | | | | | | | |
| Gross expenses prior to expense waiver/recoupment and brokerage commission recapture | | % | | | 2.37 | | | | 2.42 | | | | 2.43 | | | | 2.55 | | | | 2.42 | |
Net expenses after expense waiver/recoupment and prior to brokerage commission recapture(2) | | % | | | 2.30 | †† | | | 2.47 | | | | 2.43 | | | | 2.50 | | | | 2.50 | |
Net expenses after expense waiver/recoupment and brokerage commission recapture(2) | | % | | | 2.28 | †† | | | 2.46 | | | | 2.42 | | | | 2.50 | | | | 2.50 | |
Net investment loss after expense waiver/recoupment and brokerage commission recapture(2) | | % | | | (0.39 | )†† | | | (0.62 | ) | | | (0.25 | ) | | | (0.19 | ) | | | (0.87 | ) |
| Portfolio turnover rate | | % | | | 73 | | | | 66 | | | | 77 | | | | 129 | | | | 101 | |
|
| | |
| (1) | | Total return is calculated assuming reinvestment of all dividends and capital gain distributions at net asset value and excluding the deduction of sales charges. |
| |
| (2) | | The Investment Adviser has agreed to limit expenses, (excluding interest, taxes, brokerage commissions, extraordinary expenses and acquired fund fees and expenses) subject to possible recoupment by the Investment Adviser within three years of being incurred. |
| |
| * | | Calculated using average number of shares outstanding throughout the period. |
| |
| ** | | Amount is less than $0.005. |
| |
| † | | In 2005, there was no impact on total return due to payment by affiliate. |
| |
| †† | | Impact of waiving the advisory fee for the ING Institutional Prime Money Market Fund holding has less than 0.01% impact on the expense ratio and net investment income or loss ratio. |
See Accompanying Notes to Financial Statements
97
ING Global Value Choice Fund (continued)
Financial Highlights
Selected data for a share of beneficial interest outstanding throughout each period.
| | | | | | | | | | | | | | | | | | | | | | | |
| | | | | Class C |
| | | | | Year Ended October 31, |
| | | | | 2008 | | 2007 | | 2006 | | 2005 | | 2004 |
| |
|
Per Share Operating Performance: | | | | | | | | | | | | | | | | | | | | | | |
| Net asset value, beginning of year | | $ | | | 27.18 | | | | 20.93 | | | | 17.50 | | | | 15.48 | | | | 14.41 | |
| Income (loss) from investment operations: | | | | | | | | | | | | | | | | | | | | | | |
| Net investment loss | | $ | | | (0.09 | ) | | | (0.14 | )* | | | (0.05 | ) | | | (0.04 | ) | | | (0.15 | ) |
| Net realized and unrealized gain (loss) on investments | | $ | | | (10.99 | ) | | | 6.39 | | | | 3.50 | | | | 2.06 | | | | 1.22 | |
| Total from investment operations | | $ | | | (11.08 | ) | | | 6.25 | | | | 3.45 | | | | 2.02 | | | | 1.07 | |
| Less distributions from: | | | | | | | | | | | | | | | | | | | | | | |
| Net investment income | | $ | | | 0.02 | | | | — | | | | 0.02 | | | | — | | | | — | |
| Total distributions | | $ | | | 0.02 | | | | — | | | | 0.02 | | | | — | | | | — | |
| Payment by affiliate | | $ | | | — | | | | — | | | | — | | | | 0.00 | ** | | | — | |
| Net asset value, end of year | | $ | | | 16.08 | | | | 27.18 | | | | 20.93 | | | | 17.50 | | | | 15.48 | |
Total Return(2) | | % | | | (40.79 | ) | | | 29.86 | | | | 19.73 | | | | 13.05 | † | | | 7.43 | |
| | | | | | | | | | | | | | | | | | | | | | | |
Ratios and Supplemental Data: | | | | | | | | | | | | | | | | | | | | | | |
| Net assets, end of year (000’s) | | $ | | | 21,045 | | | | 39,537 | | | | 31,612 | | | | 30,918 | | | | 35,784 | |
| Ratios to average net assets: | | | | | | | | | | | | | | | | | | | | | | |
| Gross expenses prior to expense waiver/recoupment and brokerage commission recapture | | % | | | 2.37 | | | | 2.42 | | | | 2.43 | | | | 2.55 | | | | 2.42 | |
Net expenses after expense waiver/recoupment and prior to brokerage commission recapture(4) | | % | | | 2.30 | †† | | | 2.47 | | | | 2.43 | | | | 2.50 | | | | 2.50 | |
Net expenses after expense waiver/recoupment and brokerage commission recapture(4) | | % | | | 2.28 | †† | | | 2.46 | | | | 2.42 | | | | 2.50 | | | | 2.50 | |
Net investment loss after expense waiver/recoupment and brokerage commission recapture(4) | | % | | | (0.36 | )†† | | | (0.60 | ) | | | (0.26 | ) | | | (0.19 | ) | | | (0.87 | ) |
| Portfolio turnover rate | | % | | | 73 | | | | 66 | | | | 77 | | | | 129 | | | | 101 | |
|
| | | | | | | | | | | | | | | |
| | | | | Class I |
| | | | | | | | | September 6,
|
| | | | | Year Ended
| | 2006(1) to
|
| | | | | October 31, | | October 31,
|
| | | | | 2008 | | 2007 | | 2006 |
| |
|
Per Share Operating Performance: | | | | | | | | | | | | | | |
| Net asset value, beginning of period | | $ | | | 28.57 | | | | 21.73 | | | | 21.31 | |
| Income (loss) from investment operations: | | | | | | | | | | | | | | |
| Net investment income (loss) | | $ | | | 0.22 | | | | 0.15 | | | | (0.11 | ) |
| Net realized and unrealized gain (loss) on investments | | $ | | | (11.59 | ) | | | 6.69 | | | | 0.53 | |
| Total from investment operations | | $ | | | (11.37 | ) | | | 6.84 | | | | 0.42 | |
| Less distribution from: | | | | | | | | | | | | | | |
| Net investment income | | $ | | | 0.28 | | | | — | | | | — | |
| Total distributions | | $ | | | 0.28 | | | | — | | | | — | |
| Net asset value, end of period | | $ | | | 16.92 | | | | 28.57 | | | | 21.73 | |
Total Return(2) | | % | | | (40.13 | ) | | | 31.48 | | | | 1.97 | |
| | | | | | | | | | | | | | | |
| | | | | | | | | | | | | | | |
Ratios/Supplemental Data: | | | | | | | | | | | | | | |
| Net assets, end of period (000’s) | | $ | | | 5,794 | | | | 7,845 | | | | 3,010 | |
| Ratio to average net assets: | | | | | | | | | | | | | | |
Gross expenses prior to expense waiver/recoupment and brokerage commission recapture(3) | | % | | | 1.22 | | | | 1.25 | | | | 1.27 | |
Net expenses after expense waiver/recoupment and prior to brokerage commission recapture(3)(4) | | % | | | 1.22 | †† | | | 1.30 | | | | 1.26 | |
Net expenses after expense waiver/recoupment and brokerage commission recapture(3)(4) | | % | | | 1.20 | †† | | | 1.29 | | | | 1.26 | |
Net investment income (loss) after expense waiver/recoupment and brokerage commission recapture(3)(4) | | % | | | 0.76 | †† | | | 0.67 | | | | (0.69 | ) |
| Portfolio turnover rate | | % | | | 73 | | | | 66 | | | | 77 | |
|
| | |
| (1) | | Commencement of operations. |
| |
| (2) | | Total return is calculated assuming reinvestment of all dividends and capital gain distributions at net asset value and excluding the deduction of sales charges. Total return for less than one year is not annualized. |
| |
| (3) | | Annualized for periods less than one year. |
| |
| (4) | | The Investment Adviser has agreed to limit expenses, (excluding interest, taxes, brokerage commissions, extraordinary expenses and acquired fund fees and expenses) subject to possible recoupment by the Investment Adviser within three years of being incurred. |
| |
| * | | Calculated using average number of shares outstanding throughout the period. |
| |
| ** | | Amount is less than $0.005. |
| |
| † | | In 2005, there was no impact on total return due to payment by affiliate. |
| |
| †† | | Impact on waiving advisory fee for the ING Institutional Prime Money Market Fund holding has less than 0.01% impact on the expense ratio and net investment or loss ratio. |
See Accompanying Notes to Financial Statements
98
ING Global Value Choice Fund (continued)
Financial Highlights
Selected data for a share of beneficial interest outstanding throughout each year.
| | | | | | | | | | | | | | | | | | | | | | | |
| | | | | Class Q |
| | | | | Year Ended October 31, |
| | | | | 2008 | | 2007 | | 2006 | | 2005 | | 2004 |
| |
|
Per Share Operating Performance: | | | | | | | | | | | | | | | | | | | | | | |
| Net asset value, beginning of year | | $ | | | 33.36 | | | | 25.44 | | | | 21.25 | | | | 18.61 | | | | 17.17 | |
| Income (loss) from investment operations: | | | | | | | | | | | | | | | | | | | | | | |
| Net investment income (loss) | | $ | | | 0.13 | | | | 0.08 | * | | | 0.18 | * | | | 0.15 | | | | 0.01 | |
| Net realized and unrealized gain (loss) on investments | | $ | | | (13.51 | ) | | | 7.84 | | | | 4.20 | | | | 2.49 | | | | 1.43 | |
| Total from investment operations | | $ | | | (13.38 | ) | | | 7.92 | | | | 4.38 | | | | 2.64 | | | | 1.44 | |
| Less distributions from: | | | | | | | | | | | | | | | | | | | | | | |
| Net investment income | | $ | | | 0.20 | | | | — | | | | 0.19 | | | | — | | | | — | |
| Total distributions | | $ | | | 0.20 | | | | — | | | | 0.19 | | | | — | | | | — | |
| Payment by affiliate | | $ | | | — | | | | — | | | | — | | | | 0.00 | ** | | | — | |
| Net asset value, end of year | | $ | | | 19.78 | | | | 33.36 | | | | 25.44 | | | | 21.25 | | | | 18.61 | |
Total Return(1) | | % | | | (40.31 | ) | | | 31.13 | | | | 20.75 | | | | 14.19 | † | | | 8.39 | |
| | | | | | | | | | | | | | | | | | | | | | | |
Ratios and Supplemental Data: | | | | | | | | | | | | | | | | | | | | | | |
| Net assets, end of year (000’s) | | $ | | | 1,343 | | | | 2,652 | | | | 2,757 | | | | 4,387 | | | | 4,223 | |
| Ratios to average net assets: | | | | | | | | | | | | | | | | | | | | | | |
| Gross expenses prior to expense waiver/recoupment and brokerage commission recapture | | % | | | 1.47 | | | | 1.50 | | | | 1.52 | | | | 1.60 | | | | 1.51 | |
Net expenses after expense waiver/recoupment and prior to brokerage commission recapture(2) | | % | | | 1.47 | †† | | | 1.55 | | | | 1.52 | | | | 1.55 | | | | 1.59 | |
Net expenses after expense waiver/recoupment and brokerage commission recapture(2) | | % | | | 1.45 | †† | | | 1.54 | | | | 1.51 | | | | 1.55 | | | | 1.59 | |
Net investment income after expense waiver/recoupment and brokerage commission recapture(2) | | % | | | 0.46 | †† | | | 0.29 | | | | 0.75 | | | | 0.75 | | | | 0.05 | |
| Portfolio turnover rate | | % | | | 73 | | | | 66 | | | | 77 | | | | 129 | | | | 101 | |
| | | | | | | | | | | | | | | | | | | | | | | |
|
| | |
| (1) | | Total return is calculated assuming reinvestment of all dividends and capital gain distributions at net asset value and excluding the deduction of sales charges. |
| |
| (2) | | The Investment Adviser has agreed to limit expenses, (excluding interest, taxes, brokerage commissions, extraordinary expenses and acquired fund fees and expenses) subject to possible recoupment by the Investment Adviser within three years of being incurred. |
| |
| * | | Calculated using average number of shares outstanding throughout the period. |
| |
| ** | | Amount is less than $0.005. |
| |
| † | | In 2005, there was no impact on total return due to payment by affiliate. |
| |
| †† | | Impact of waiving the advisory fee for the ING Institutional Prime Money Market Fund holding has less than 0.01% impact on the expense ratio and net investment income ratio. |
See Accompanying Notes to Financial Statements
99
ING Asia-Pacific Real Estate Fund
Financial Highlights
Selected data for a share of beneficial interest outstanding throughout each period.
| | | | | | | | | | | | | | | | | | | |
| | | | | Class A | | Class B | | Class C | | Class I |
| | | | | November 1,
| | November 1,
| | November 1,
| | November 1,
|
| | | | | 2007(1) to
| | 2007(1) to
| | 2007(1) to
| | 2007(1) to
|
| | | | | October 31,
| | October 31,
| | October 31,
| | October 31,
|
| | | | | 2008 | | 2008 | | 2008 | | 2008 |
| |
|
Per Share Operating Performance: | | | | | | | | | | | | | | | | | | |
| Net asset value, beginning of period | | $ | | | 10.00 | | | | 10.00 | | | | 10.00 | | | | 10.00 | |
| Income (loss) from investment operations: | | | | | | | | | | | | | | | | | | |
| Net investment income | | $ | | | 0.11 | | | | 0.07 | | | | 0.06 | * | | | 0.13 | |
| Net realized and unrealized loss on investments | | $ | | | (5.50 | ) | | | (5.51 | ) | | | (5.50 | ) | | | (5.51 | ) |
| Total from investment operations | | $ | | | (5.39 | ) | | | (5.44 | ) | | | (5.44 | ) | | | (5.38 | ) |
| Less distributions from: | | | | | | | | | | | | | | | | | | |
| Net investment income | | $ | | | 0.10 | | | | 0.06 | | | | 0.06 | | | | 0.12 | |
| Total distributions | | $ | | | 0.10 | | | | 0.06 | | | | 0.06 | | | | 0.12 | |
| Net asset value, end of period | | $ | | | 4.51 | | | | 4.50 | | | | 4.50 | | | | 4.50 | |
Total Return(2) | | % | | | (54.27 | ) | | | (54.63 | ) | | | (54.62 | ) | | | (54.25 | ) |
| | | | | | | | | | | | | | | | | | | |
| | | | | | | | | | | | | | | | | | | |
Ratios and Supplemental Data: | | | | | | | | | | | | | | | | | | |
| Net assets, end of period (000’s) | | $ | | | 3,144 | | | | 18 | | | | 3,532 | | | | 0 | ** |
| Ratios to average net assets: | | | | | | | | | | | | | | | | | | |
Gross expenses prior to expense waiver(3) | | % | | | 4.14 | | | | 4.89 | | | | 4.89 | | | | 3.89 | |
Net expenses after expense waiver(3)(4) | | % | | | 1.75 | | | | 2.50 | | | | 2.50 | | | | 1.50 | |
Net investment income after expense waiver(3)(4) | | % | | | 1.54 | | | | 1.15 | | | | 1.12 | | | | 1.77 | |
| Portfolio turnover rate | | % | | | 81 | | | | 81 | | | | 81 | | | | 81 | |
|
| | |
| (1) | | Commencement of operations. |
| |
| (2) | | Total return is calculated assuming reinvestment of dividends and capital gain distributions at net asset value and excluding the deduction of sales charge. Total return for less than one year is not annualized. |
| |
| (3) | | Annualized for periods less than one year. |
| |
| (4) | | The Investment Adviser has agreed to limit expense, (excluding interest, taxes, brokerage commissions, extraordinary expense and acquired fund fees and expenses) subject to possible recoupment by the Investment Adviser within three years of being incurred. |
| |
| * | | Calculated using average number of shares outstanding throughout the period. |
| |
| ** | | Amount is less than $500. |
See Accompanying Notes to Financial Statements
100
ING Disciplined International SmallCap Fund
Financial Highlights
Selected data for a share of beneficial interest outstanding throughout each period.
| | | | | | | | | | | | | | | | | | | |
| | | | | Class A | | Class B |
| | | | | Year
| | December 20,
| | Year
| | December 20,
|
| | | | | Ended
| | 2006(1) to
| | Ended
| | 2006(1) to
|
| | | | | October 31,
| | October 31,
| | October 31,
| | October 31,
|
| | | | | 2008 | | 2007 | | 2008 | | 2007 |
| |
|
Per Share Operating Performance: | | | | | | | | | | | | | | | | | | |
| Net asset value, beginning of period | | $ | | | 12.09 | | | | 10.00 | | | | 12.02 | | | | 10.00 | |
| Income (loss) from investment operations: | | | | | | | | | | | | | | | | | | |
| Net investment income | | $ | | | 0.18 | * | | | 0.14 | * | | | 0.10 | * | | | 0.06 | * |
| Net realized and unrealized gain (loss) on investments | | $ | | | (6.55 | ) | | | 1.95 | | | | (6.50 | ) | | | 1.96 | |
| Total from investment operations | | $ | | | (6.37 | ) | | | 2.09 | | | | (6.40 | ) | | | 2.02 | |
| Less distributions from: | | | | | | | | | | | | | | | | | | |
| Net investment income | | $ | | | 0.06 | | | | — | | | | 0.01 | | | | — | |
| Net realized gains on investments | | $ | | | 0.19 | | | | — | | | | 0.19 | | | | — | |
| Total distributions | | $ | | | 0.25 | | | | — | | | | 0.20 | | | | — | |
| Net asset value, end of period | | $ | | | 5.47 | | | | 12.09 | | | | 5.42 | | | | 12.02 | |
Total Return(2) | | % | | | (53.65 | ) | | | 20.90 | | | | (54.04 | ) | | | 20.20 | |
| | | | | | | | | | | | | | | | | | | |
| | | | | | | | | | | | | | | | | | | |
Ratios and Supplemental Data: | | | | | | | | | | | | | | | | | | |
| Net assets, end of period (000’s) | | $ | | | 73 | | | | 69 | | | | 3 | | | | 5 | |
| Ratios to average net assets: | | | | | | | | | | | | | | | | | | |
Expenses(3) | | % | | | 1.13 | | | | 1.11 | | | | 1.88 | | | | 1.86 | |
Net investment income(3) | | % | | | 1.96 | | | | 1.37 | | | | 1.13 | | | | 0.67 | |
| Portfolio turnover rate | | % | | | 148 | | | | 116 | | | | 148 | | | | 116 | |
|
| | | | | | | | | | | | | | | | | | | |
| | | | | Class C | | Class I |
| | | | | Year
| | December 20,
| | Year
| | December 20,
|
| | | | | Ended
| | 2006(1) to
| | Ended
| | 2006(1) to
|
| | | | | October 31,
| | October 31,
| | October 31,
| | October 31,
|
| | | | | 2008 | | 2007 | | 2008 | | 2007 |
| |
|
Per Share Operating Performance: | | | | | | | | | | | | | | | | | | |
| Net asset value, beginning of period | | $ | | | 12.02 | | | | 10.00 | | | | 12.13 | | | | 10.00 | |
| Income (loss) from investment operations: | | | | | | | | | | | | | | | | | | |
| Net investment income | | $ | | | 0.03 | * | | | 0.02 | * | | | 0.20 | * | | | 0.13 | * |
| Net realized and unrealized gain (loss) on investments | | $ | | | (6.43 | ) | | | 2.00 | | | | (6.58 | ) | | | 2.00 | |
| Total from investment operations | | $ | | | (6.40 | ) | | | 2.02 | | | | (6.38 | ) | | | 2.13 | |
| Less distributions from: | | | | | | | | | | | | | | | | | | |
| Net investment income | | $ | | | 0.01 | | | | — | | | | 0.07 | | | | — | |
| Net realized gains on investments | | $ | | | 0.19 | | | | — | | | | 0.19 | | | | — | |
| Total distributions | | $ | | | 0.20 | | | | — | | | | 0.26 | | | | — | |
| Net asset value, end of period | | $ | | | 5.42 | | | | 12.02 | | | | 5.49 | | | | 12.13 | |
Total Return(2) | | % | | | (54.04 | ) | | | 20.20 | | | | (53.58 | ) | | | 21.30 | |
| | | | | | | | | | | | | | | | | | | |
| | | | | | | | | | | | | | | | | | | |
Ratios and Supplemental Data: | | | | | | | | | | | | | | | | | | |
| Net assets, end of period (000’s) | | $ | | | 70 | | | | 55 | | | | 219,657 | | | | 465,657 | |
| Ratios to average net assets: | | | | | | | | | | | | | | | | | | |
Expenses(3) | | % | | | 1.88 | | | | 1.86 | | | | 0.83 | | | | 0.86 | |
Net investment income(3) | | % | | | 0.34 | | | | 0.25 | | | | 2.11 | | | | 1.29 | |
| Portfolio turnover rate | | % | | | 148 | | | | 116 | | | | 148 | | | | 116 | |
|
| | |
| (1) | | Commencement of operations. |
| |
| (2) | | Total return is calculated assuming reinvestment of dividends and capital gain distributions at net asset value and excluding the deduction of sales charge. Total return for less than one year is not annualized. |
| |
| (3) | | Annualized for periods less than one year. |
| |
| * | | Calculated using average number of shares outstanding throughout the period. |
See Accompanying Notes to Financial Statements
101
ING Emerging Countries Fund
Financial Highlights
Selected data for a share of beneficial interest outstanding throughout each year.
| | | | | | | | | | | | | | | | | | | | | | | |
| | | | | Class A |
| | | | | Year Ended October 31, |
| | | | | 2008 | | 2007 | | 2006 | | 2005 | | 2004 |
| |
|
Per Share Operating Performance: | | | | | | | | | | | | | | | | | | | | | | |
| Net asset value, beginning of year | | $ | | | 41.48 | | | | 29.62 | | | | 23.60 | | | | 19.40 | | | | 17.32 | |
| Income (loss) from investment operations: | | | | | | | | | | | | | | | | | | | | | | |
| Net investment income | | $ | | | 0.71 | | | | 0.47 | | | | 0.48 | | | | 0.19 | | | | 0.09 | |
| Net realized and unrealized gain (loss) on investments | | $ | | | (24.59 | ) | | | 11.82 | | | | 5.68 | | | | 3.98 | | | | 2.08 | |
| Total from investment operations | | $ | | | (23.88 | ) | | | 12.29 | | | | 6.16 | | | | 4.17 | | | | 2.17 | |
| Less distributions from: | | | | | | | | | | | | | | | | | | | | | | |
| Net investment income | | $ | | | 0.45 | | | | 0.43 | | | | 0.14 | | | | 0.02 | | | | 0.09 | |
| Net realized gains on investments | | $ | | | 1.11 | | | | — | | | | — | | | | — | | | | — | |
| Total distributions | | $ | | | 1.56 | | | | 0.43 | | | | 0.14 | | | | 0.02 | | | | 0.09 | |
| Payment by affiliate | | $ | | | — | | | | — | | | | — | | | | 0.05 | | | | 0.00 | * |
| Net asset value, end of year | | $ | | | 16.04 | | | | 41.48 | | | | 29.62 | | | | 23.60 | | | | 19.40 | |
Total Return(1) | | % | | | (59.64 | ) | | | 41.93 | | | | 26.19 | | | | 21.76 | †† | | | 12.58 | † |
| | | | | | | | | | | | | | | | | | | | | | | |
Ratios and Supplemental Data: | | | | | | | | | | | | | | | | | | | | | | |
| Net assets, end of year (000’s) | | $ | | | 60,207 | | | | 197,307 | | | | 123,219 | | | | 87,143 | | | | 67,282 | |
| Ratios to average net assets: | | | | | | | | | | | | | | | | | | | | | | |
| Gross expenses prior to expense waiver/recoupment and brokerage commission recapture | | % | | | 2.10 | | | | 1.99 | | | | 2.02 | | | | 2.09 | | | | 2.10 | |
Net expenses after expense waiver/recoupment and prior to brokerage commission recapture(2) | | % | | | 1.96 | | | | 1.89 | | | | 1.92 | | | | 2.00 | | | | 2.20 | |
Net expenses after expense waiver/recoupment and brokerage commission recapture(2) | | % | | | 1.94 | | | | 1.86 | | | | 1.91 | | | | 2.00 | | | | 2.20 | |
Net investment income after expense waiver/recoupment and brokerage commission recapture(2) | | % | | | 1.86 | | | | 1.42 | | | | 1.80 | | | | 0.91 | | | | 0.41 | |
| Portfolio turnover rate | | % | | | 177 | | | | 51 | | | | 35 | | | | 124 | | | | 88 | |
|
| | |
| (1) | | Total return is calculated assuming reinvestment of all dividends and capital gain distributions at net asset value and excluding the deduction of sales charges. |
| |
| (2) | | The Investment Adviser has agreed to limit expenses, (excluding interest, taxes, brokerage commissions, extraordinary expenses and acquired fund fees and expenses) subject to possible recoupment by the Investment Adviser within three years of being incurred. |
| |
| * | | Amount is less than $0.005. |
| |
| † | | In 2004, 0.06% of the total return consists of a gain on the disposition of an investment not meeting the Fund’s investment restrictions. Excluding this item, total return would have been 12.52% for Class A. |
| |
| †† | | In 2005, 0.26% of the total return consists of a payment by affiliate. Excluding this item, total return would have been 21.50% for Class A. |
See Accompanying Notes to Financial Statements
102
ING Emerging Countries Fund (continued)
Financial Highlights
Selected data for a share of beneficial interest outstanding throughout each year.
| | | | | | | | | | | | | | | | | | | | | | | |
| | | | | Class B |
| | | | | Year Ended October 31, |
| | | | | 2008 | | 2007 | | 2006 | | 2005 | | 2004 |
| |
|
Per Share Operating Performance: | | | | | | | | | | | | | | | | | | | | | | |
| Net asset value, beginning of year | | $ | | | 40.67 | | | | 29.04 | | | | 23.17 | | | | 19.17 | | | | 17.15 | |
| Income (loss) from investment operations: | | | | | | | | | | | | | | | | | | | | | | |
| Net investment income (loss) | | $ | | | 0.36 | * | | | 0.24 | * | | | 0.28 | * | | | 0.04 | | | | (0.04 | ) |
| Net realized and unrealized gain (loss) on investments | | $ | | | (24.05 | ) | | | 11.57 | | | | 5.59 | | | | 3.91 | | | | 2.06 | |
| Total from investment operations | | $ | | | (23.69 | ) | | | 11.81 | | | | 5.87 | | | | 3.95 | | | | 2.02 | |
| Less distributions from: | | | | | | | | | | | | | | | | | | | | | | |
| Net investment income | | $ | | | 0.14 | | | | 0.18 | | | | — | | | | — | | | | — | |
| Net realized gains on investments | | $ | | | 1.11 | | | | — | | | | — | | | | — | | | | — | |
| Total distributions | | $ | | | 1.25 | | | | 0.18 | | | | — | | | | — | | | | — | |
| Payment by affiliate | | $ | | | — | | | | — | | | | — | | | | 0.05 | | | | 0.00 | ** |
| Net asset value, end of year | | $ | | | 15.73 | | | | 40.67 | | | | 29.04 | | | | 23.17 | | | | 19.17 | |
Total Return(1) | | % | | | (59.94 | ) | | | 40.85 | | | | 25.33 | | | | 20.87 | †† | | | 11.78 | † |
| | | | | | | | | | | | | | | | | | | | | | | |
Ratios and Supplemental Data: | | | | | | | | | | | | | | | | | | | | | | |
| Net assets, end of year (000’s) | | $ | | | 4,312 | | | | 16,648 | | | | 13,575 | | | | 12,562 | | | | 12,581 | |
| Ratios to average net assets: | | | | | | | | | | | | | | | | | | | | | | |
| Gross expenses prior to expense waiver/recoupment and brokerage commission recapture | | % | | | 2.75 | | | | 2.64 | | | | 2.67 | | | | 2.74 | | | | 2.75 | |
Net expenses after expense waiver/recoupment and prior to brokerage commission recapture(2) | | % | | | 2.71 | | | | 2.64 | | | | 2.67 | | | | 2.74 | | | | 2.85 | |
Net expenses after expense waiver/recoupment and brokerage commission recapture(2) | | % | | | 2.69 | | | | 2.61 | | | | 2.66 | | | | 2.74 | | | | 2.85 | |
Net investment income (loss) after expense waiver/recoupment and brokerage commission recapture(2) | | % | | | 1.10 | | | | 0.67 | | | | 1.06 | | | | 0.14 | | | | (0.30 | ) |
| Portfolio turnover rate | | % | | | 177 | | | | 51 | | | | 35 | | | | 124 | | | | 88 | |
|
| | |
| (1) | | Total return is calculated assuming reinvestment of all dividends and capital gain distributions at net asset value and excluding the deduction of sales charges. |
| |
| (2) | | The Investment Adviser has agreed to limit expenses, (excluding interest, taxes, brokerage commissions, extraordinary expenses and acquired fund fees and expenses) subject to possible recoupment by the Investment Adviser within three years of being incurred. |
| |
| * | | Calculated using average number of shares outstanding throughout the period. |
| |
| ** | | Amount is less than $0.005. |
| |
| † | | In 2004, 0.06% of the total return consists of a gain on the disposition of an investment not meeting the Fund’s investment restrictions. Excluding this item, total return would have been 11.72% for Class B. |
| |
| †† | | In 2005, 0.26% of the total return consists of a payment by affiliate. Excluding this item, total return would have been 20.61% for Class B. |
See Accompanying Notes to Financial Statements
103
ING Emerging Countries Fund (continued)
Financial Highlights
Selected data for a share of beneficial interest outstanding throughout each year.
| | | | | | | | | | | | | | | | | | | | | | | |
| | | | | Class C |
| | | | | Year Ended October 31, |
| | | | | 2008 | | 2007 | | 2006 | | 2005 | | 2004 |
| |
|
Per Share Operating Performance: | | | | | | | | | | | | | | | | | | | | | | |
| Net asset value, beginning of year | | $ | | | 38.45 | | | | 27.53 | | | | 22.04 | | | | 18.24 | | | | 16.32 | |
| Income (loss) from investment operations: | | | | | | | | | | | | | | | | | | | | | | |
| Net investment income (loss) | | $ | | | 0.34 | * | | | 0.20 | | | | 0.25 | | | | 0.03 | | | | (0.03 | ) |
| Net realized and unrealized gain (loss) on investments | | $ | | | (22.65 | ) | | | 10.97 | | | | 5.31 | | | | 3.72 | | | | 1.95 | |
| Total from investment operations | | $ | | | (22.31 | ) | | | 11.17 | | | | 5.56 | | | | 3.75 | | | | 1.92 | |
| Less distributions from: | | | | | | | | | | | | | | | | | | | | | | |
| Net investment income | | $ | | | 0.21 | | | | 0.25 | | | | 0.07 | | | | — | | | | — | |
| Net realized gains on investments | | $ | | | 1.11 | | | | — | | | | — | | | | — | | | | — | |
| Total distributions | | $ | | | 1.32 | | | | 0.25 | | | | 0.07 | | | | — | | | | — | |
| Payment by affiliate | | $ | | | — | | | | — | | | | — | | | | 0.05 | | | | 0.00 | ** |
| Net asset value, end of year | | $ | | | 14.82 | | | | 38.45 | | | | 27.53 | | | | 22.04 | | | | 18.24 | |
Total Return(1) | | % | | | (59.92 | ) | | | 40.82 | | | | 25.29 | | | | 20.83 | †† | | | 11.76 | † |
| | | | | | | | | | | | | | | | | | | | | | | |
Ratios and Supplemental Data: | | | | | | | | | | | | | | | | | | | | | | |
| Net assets, end of year (000’s) | | $ | | | 14,586 | | | | 53,885 | | | | 35,847 | | | | 20,985 | | | | 9,680 | |
| Ratios to average net assets: | | | | | | | | | | | | | | | | | | | | | | |
| Gross expenses prior to expense waiver/recoupment and brokerage commission recapture | | % | | | 2.75 | | | | 2.64 | | | | 2.67 | | | | 2.74 | | | | 2.75 | |
Net expenses after expense waiver/recoupment and prior to brokerage commission recapture(2) | | % | | | 2.71 | | | | 2.64 | | | | 2.67 | | | | 2.74 | | | | 2.85 | |
Net expenses after expense waiver/recoupment and brokerage commission recapture(2) | | % | | | 2.69 | | | | 2.61 | | | | 2.66 | | | | 2.74 | | | | 2.85 | |
Net investment income (loss) after expense waiver/recoupment and brokerage commission recapture(2) | | % | | | 1.11 | | | | 0.65 | | | | 1.12 | | | | 0.25 | | | | (0.20 | ) |
| Portfolio turnover rate | | % | | | 177 | | | | 51 | | | | 35 | | | | 124 | | | | 88 | |
|
| | |
| (1) | | Total return is calculated assuming reinvestment of all dividends and capital gain distributions at net asset value and excluding the deduction of sales charges. |
| |
| (2) | | The Investment Adviser has agreed to limit expenses, (excluding interest, taxes, brokerage commissions, extraordinary expenses and acquired fund fees and expenses) subject to possible recoupment by the Investment Adviser within three years of being incurred. |
| |
| * | | Calculated using average number of shares outstanding throughout the period. |
| |
| ** | | Amount is less than $0.005. |
| |
| † | | In 2004, 0.06% of the total return consists of a gain on an investment not meeting the Fund’s investment restrictions. Excluding this item, total return would have been 11.70% for Class C. |
| |
| †† | | In 2005, 0.27% of the total return consists of a payment by affiliate. Excluding this item, total return would have been 20.56% for Class C. |
See Accompanying Notes to Financial Statements
104
ING Emerging Countries Fund (continued)
Financial Highlights
Selected data for a share of beneficial interest outstanding throughout each period.
| | | | | | | | | | | | | | | |
| | | | | Class I |
| | | | | | | | | December 21,
|
| | | | | Year Ended
| | 2005(1) to
|
| | | | | October 31, | | October 31,
|
| | | | | 2008 | | 2007 | | 2006 |
| |
|
Per Share Operating Performance: | | | | | | | | | | | | | | |
| Net asset value, beginning of period | | $ | | | 41.63 | | | | 29.72 | | | | 25.52 | |
| Income (loss) from investment operations: | | | | | | | | | | | | | | |
| Net investment income | | $ | | | 0.56 | * | | | 0.55 | | | | 0.65 | * |
| Net realized and unrealized gain (loss) on investments | | $ | | | (24.40 | ) | | | 11.90 | | | | 3.55 | |
| Total from investment operations | | $ | | | (23.84 | ) | | | 12.45 | | | | 4.20 | |
| Less distribution from: | | | | | | | | | | | | | | |
| Net investment income | | $ | | | 0.57 | | | | 0.54 | | | | — | |
| Net realized gains on investments | | $ | | | 1.11 | | | | — | | | | — | |
| Total distributions | | $ | | | 1.68 | | | | 0.54 | | | | — | |
| Net asset value, end of period | | $ | | | 16.11 | | | | 41.63 | | | | 29.72 | |
Total Return(2) | | % | | | (59.48 | ) | | | 42.41 | | | | 16.46 | |
| | | | | | | | | | | | | | | |
| | | | | | | | | | | | | | | |
Ratios and Supplemental Data: | | | | | | | | | | | | | | |
| Net assets, end of period (000’s) | | $ | | | 18,429 | | | | 41,551 | | | | 23,456 | |
| Ratio to average net assets: | | | | | | | | | | | | | | |
Gross expenses prior to expense waiver/recoupment and brokerage commission recapture(3) | | % | | | 1.67 | | | | 1.56 | | | | 1.55 | |
Net expenses after expense waiver/recoupment and prior to brokerage commission recapture(3)(4) | | % | | | 1.63 | | | | 1.56 | | | | 1.55 | |
Net expenses after expense waiver/recoupment and brokerage commission recapture(3)(4) | | % | | | 1.61 | | | | 1.53 | | | | 1.54 | |
Net investment income after expense waiver/recoupment and brokerage commission recapture(3)(4) | | % | | | 1.79 | | | | 1.71 | | | | 2.73 | |
| Portfolio turnover rate | | % | | | 177 | | | | 51 | | | | 35 | |
|
| | |
| (1) | | Commencement of operations. |
| |
| (2) | | Total return is calculated assuming reinvestment of all dividends and capital gain distributions at net asset value and excluding the deduction of sales charges. Total return for less than one year is not annualized. |
| |
| (3) | | Annualized for periods less than one year. |
| |
| (4) | | The Investment Adviser has agreed to limit expenses, (excluding interest, taxes, brokerage commissions, extraordinary expenses and acquired fund fees and expenses) subject to possible recoupment by the Investment Adviser within three years of being incurred. |
| |
| * | | Calculated using average number of shares outstanding throughout the period. |
See Accompanying Notes to Financial Statements
105
ING Emerging Countries Fund (continued)
Financial Highlights
Selected data for a share of beneficial interest outstanding throughout each period.
| | | | | | | | | | | | | | | | | | | | | | | | | | | |
| | | | | Class Q | | Class W |
| | | | | | | | | | | | | | | February 12,
|
| | | | | Year Ended
| | 2008(1) to
|
| | | | | October 31, | | October 31,
|
| | | | | 2008 | | 2007 | | 2006 | | 2005 | | 2004 | | 2008 |
| |
|
Per Share Operating Performance: | | | | | | | | | | | | | | | | | | | | | | | | | | |
| Net asset value, beginning of period | | $ | | | 42.92 | | | | 30.62 | | | | 24.38 | | | | 20.03 | | | | 17.89 | | | | 36.18 | |
| Income (loss) from investment operations: | | | | | | | | | | | | | | | | | | | | | | | | | | |
| Net investment income | | $ | | | 0.91 | | | | 0.44 | | | | 0.59 | * | | | 0.26 | | | | 0.09 | | | | 0.54 | * |
| Net realized and unrealized gain (loss) on investments | | $ | | | (25.58 | ) | | | 12.31 | | | | 5.81 | | | | 4.07 | | | | 2.17 | | | | (19.86 | ) |
| Total from investment operations | | $ | | | (24.67 | ) | | | 12.75 | | | | 6.40 | | | | 4.33 | | | | 2.26 | | | | (19.32 | ) |
| Less distributions from: | | | | | | | | | | | | | | | | | | | | | | | | | | |
| Net investment income | | $ | | | 0.49 | | | | 0.45 | | | | 0.16 | | | | 0.03 | | | | 0.12 | | | | — | |
| Net realized gains on investments | | $ | | | 1.11 | | | | — | | | | — | | | | — | | | | — | | | | 0.01 | |
| Total distributions | | $ | | | 1.60 | | | | 0.45 | | | | 0.16 | | | | 0.03 | | | | 0.12 | | | | 0.01 | |
| Payment by affiliate | | $ | | | — | | | | — | | | | — | | | | 0.05 | | | | 0.00 | ** | | | — | |
| Net asset value, end of period | | $ | | | 16.65 | | | | 42.92 | | | | 30.62 | | | | 24.38 | | | | 20.03 | | | | 16.85 | |
Total Return(2) | | % | | | (59.53 | ) | | | 42.05 | | | | 26.37 | | | | 21.89 | †† | | | 12.70 | † | | | (53.42 | ) |
| | | | | | | | | | | | | | | | | | | | | | | | | | | |
| | | | | | | | | | | | | | | | | | | | | | | | | | | |
Ratios and Supplemental Data: | | | | | | | | | | | | | | | | | | | | | | | | | | |
| Net assets, end of period (000’s) | | $ | | | 5,120 | | | | 21,253 | | | | 10,700 | | | | 10,776 | | | | 8,929 | | | | 36 | |
| Ratios to average net assets: | | | | | | | | | | | | | | | | | | | | | | | | | | |
Gross expenses prior to expense waiver/recoupment and brokerage commission recapture(3) | | % | | | 1.92 | | | | 1.81 | | | | 1.80 | | | | 1.85 | | | | 2.00 | | | | 1.67 | |
Net expenses after expense waiver/recoupment and prior to brokerage commission recapture(3)(4) | | % | | | 1.88 | | | | 1.81 | | | | 1.80 | | | | 1.85 | | | | 2.10 | | | | 1.63 | |
Net expenses after expense waiver/recoupment and brokerage commission recapture(3)(4) | | % | | | 1.86 | | | | 1.78 | | | | 1.79 | | | | 1.85 | | | | 2.10 | | | | 1.61 | |
Net investment income after expense waiver/recoupment and brokerage commission recapture(3)(4) | | % | | | 1.98 | | | | 1.49 | | | | 2.09 | | | | 1.12 | | | | 0.36 | | | | 2.48 | |
| Portfolio turnover rate | | % | | | 177 | | | | 51 | | | | 35 | | | | 124 | | | | 88 | | | | 177 | |
|
| | |
| (1) | | Commencement of operations. |
| |
| (2) | | Total return is calculated assuming reinvestment of all dividends and capital gain distributions at net asset value and excluding the deduction of sale changes. |
| |
| (3) | | Annualized for periods less than one year. |
| |
| (4) | | The Investment Adviser has agreed to limit expenses, (excluding interest, taxes, brokerage commissions, extraordinary expenses and acquired fund fees and expenses) subject to possible recoupment by the Investment Adviser within three years of being incurred. |
| |
| * | | Calculated using average number of shares outstanding throughout the period. |
| |
| ** | | Amount is less than $0.005. |
| |
| † | | In 2004, 0.06% of the total return consists of a gain on an investment not meeting the Fund’s investment restrictions. Excluding this item, total return would have been 12.64% for Class Q. |
| |
| †† | | In 2005, 0.25% of the total return consists of a payment by affiliate. Excluding this item, total return would have been 21.64% for Class Q. |
See Accompanying Notes to Financial Statements
106
ING European Real Estate Fund
Financial Highlights
Selected data for a share of beneficial interest outstanding throughout each period.
| | | | | | | | | | | | | | | | | | | |
| | | | | Class A | | Class B | | Class C | | Class I |
| | | | | November 1,
| | November 1,
| | November 1,
| | November 1,
|
| | | | | 2007(1) to
| | 2007(1) to
| | 2007(1) to
| | 2007(1) to
|
| | | | | October 31,
| | October 31,
| | October 31,
| | October 31,
|
| | | | | 2008 | | 2008 | | 2008 | | 2008 |
| |
|
Per Share Operating Performance: | | | | | | | | | | | | | | | | | | |
| Net asset value, beginning of period | | $ | | | 10.00 | | | | 10.00 | | | | 10.00 | | | | 10.00 | |
| Income (loss) from investment operations: | | | | | | | | | | | | | | | | | | |
| Net investment income | | $ | | | 0.13 | * | | | 0.07 | * | | | 0.09 | | | | 0.15 | * |
| Net realized and unrealized loss on investments | | $ | | | (4.68 | ) | | | (4.68 | ) | | | (4.72 | ) | | | (4.68 | ) |
| Total from investment operations | | $ | | | (4.55 | ) | | | (4.61 | ) | | | (4.63 | ) | | | (4.53 | ) |
| Less distributions from: | | | | | | | | | | | | | | | | | | |
| Net investment income | | $ | | | 0.12 | | | | 0.07 | | | | 0.07 | | | | 0.14 | |
| Total distributions | | $ | | | 0.12 | | | | 0.07 | | | | 0.07 | | | | 0.14 | |
| Net asset value, end of period | | $ | | | 5.33 | | | | 5.32 | | | | 5.30 | | | | 5.33 | |
Total Return(2) | | % | | | (45.92 | ) | | | (46.34 | ) | | | (46.57 | ) | | | (45.77 | ) |
| | | | | | | | | | | | | | | | | | | |
| | | | | | | | | | | | | | | | | | | |
Ratios and Supplemental Data: | | | | | | | | | | | | | | | | | | |
| Net assets, end of period (000’s) | | $ | | | 3,157 | | | | 10 | | | | 48 | | | | 1 | |
| Ratios to average net assets: | | | | | | | | | | | | | | | | | | |
Gross expenses prior to expense waiver(3) | | % | | | 4.45 | | | | 5.20 | | | | 5.20 | | | | 4.10 | |
Net expenses after expense waiver(3)(4) | | % | | | 1.75 | † | | | 2.50 | † | | | 2.50 | † | | | 1.40 | † |
Net investment income after expense waiver(3)(4) | | % | | | 1.52 | † | | | 0.85 | † | | | 1.13 | † | | | 1.75 | † |
| Portfolio turnover rate | | % | | | 162 | | | | 162 | | | | 162 | | | | 162 | |
|
| | |
| (1) | | Commencement of operations. |
| |
| (2) | | Total return is calculated assuming reinvestment of dividends and capital gain distributions at net asset value and excluding the deduction of sales charge. Total return for less than one year is not annualized. |
| |
| (3) | | Annualized for periods less than one year. |
| |
| (4) | | The Investment Adviser has agreed to limit expense, (excluding interest, taxes, brokerage commissions, extraordinary expense and acquired fund fees and expenses) subject to possible recoupment by the Investment Adviser within three years of being incurred. |
| |
| * | | Calculated using average number of shares outstanding throughout the period. |
| |
| † | | Impact of waiving the advisory fee for the ING Institutional Prime Money Market Fund holding has less than 0.01% impact on the expense ratio and net investment income ratio. |
See Accompanying Notes to Financial Statements
107
ING Foreign Fund
Financial Highlights
Selected data for a share of beneficial interest outstanding throughout each year.
| | | | | | | | | | | | | | | | | | | | | | | |
| | | | | Class A |
| | | | | Year Ended October 31, |
| | | | | 2008 | | 2007 | | 2006 | | 2005 | | 2004 |
| |
|
Per Share Operating Performance: | | | | | | | | | | | | | | | | | | | | | | |
| Net asset value, beginning of year | | $ | | | 23.54 | | | | 18.56 | | | | 14.79 | | | | 12.38 | | | | 11.01 | |
| Income (loss) from investment operations: | | | | | | | | | | | | | | | | | | | | | | |
| Net investment income | | $ | | | 0.18 | * | | | 0.10 | | | | 0.08 | * | | | 0.06 | | | | 0.11 | |
| Net realized and unrealized gain (loss) on investments | | $ | | | (10.65 | ) | | | 5.56 | | | | 4.05 | | | | 2.35 | | | | 1.44 | |
| Total from investment operations | | $ | | | (10.47 | ) | | | 5.66 | | | | 4.13 | | | | 2.41 | | | | 1.55 | |
| Less distributions from: | | | | | | | | | | | | | | | | | | | | | | |
| Net investment income | | $ | | | — | | | | — | | | | — | | | | — | | | | 0.04 | |
| Return of capital | | $ | | | — | | | | — | | | | — | | | | — | | | | 0.10 | |
| Net realized gains on investments | | $ | | | 1.39 | | | | 0.68 | | | | 0.36 | | | | — | | | | 0.04 | |
| Total distributions | | $ | | | 1.39 | | | | 0.68 | | | | 0.36 | | | | — | | | | 0.18 | |
| Net asset value, end of year | | $ | | | 11.68 | | | | 23.54 | | | | 18.56 | | | | 14.79 | | | | 12.38 | |
Total Return(1) | | % | | | (47.01 | ) | | | 31.32 | | | | 28.39 | | | | 19.47 | | | | 14.25 | |
| | | | | | | | | | | | | | | | | | | | | | | |
Ratios and Supplemental Data: | | | | | | | | | | | | | | | | | | | | | | |
| Net assets, end of year (000’s) | | $ | | | 151,246 | | | | 349,917 | | | | 219,819 | | | | 122,883 | | | | 62,949 | |
| Ratios to average net assets: | | | | | | | | | | | | | | | | | | | | | | |
| Gross expenses prior to expense waiver/recoupment and brokerage commission recapture | | % | | | 1.61 | | | | 1.54 | | | | 1.58 | | | | 1.66 | | | | 1.95 | |
Net expenses after expense waiver/recoupment and prior to brokerage commission recapture(2) | | % | | | 1.60 | † | | | 1.54 | | | | 1.65 | | | | 1.68 | | | | 1.70 | |
Net expenses after expense waiver/recoupment and brokerage commission recapture(2) | | % | | | 1.60 | † | | | 1.54 | | | | 1.65 | | | | 1.68 | | | | 1.70 | |
Net investment income after expense waiver/recoupment and brokerage commission recapture(2) | | % | | | 0.93 | † | | | 0.59 | | | | 0.49 | | | | 0.53 | | | | 0.37 | |
| Portfolio turnover rate | | % | | | 116 | | | | 69 | | | | 65 | | | | 81 | | | | 141 | |
|
| | |
| (1) | | Total return is calculated assuming reinvestment of all dividends and capital gain distributions at net asset value and excluding the deduction of sales charges. |
| |
| (2) | | The Investment Adviser has agreed to limit expenses, (excluding interest, taxes, brokerage commissions, extraordinary expenses and acquired fund fees and expenses) subject to possible recoupment by the Investment Adviser within three years of being incurred. |
| |
| * | | Calculated using average number of shares outstanding throughout the period. |
| |
| † | | Impact of waiving the advisory fee for the ING Institutional Prime Money Market Fund holding has less than 0.01% impact on the expense ratio and net investment income ratio. |
See Accompanying Notes to Financial Statements
108
ING Foreign Fund (continued)
Financial Highlights
Selected data for a share of beneficial interest outstanding throughout each year.
| | | | | | | | | | | | | | | | | | | | | | | |
| | | | | Class B |
| | | | | Year Ended October 31, |
| | | | | 2008 | | 2007 | | 2006 | | 2005 | | 2004 |
| |
|
Per Share Operating Performance: | | | | | | | | | | | | | | | | | | | | | | |
| Net asset value, beginning of year | | $ | | | 22.78 | | | | 18.11 | | | | 14.55 | | | | 12.26 | | | | 10.99 | |
| Income (loss) from investment operations: | | | | | | | | | | | | | | | | | | | | | | |
| Net investment income (loss) | | $ | | | 0.02 | * | | | (0.03 | ) | | | (0.04 | )* | | | (0.03 | ) | | | (0.05 | )* |
| Net realized and unrealized gain (loss) on investments | | $ | | | (10.22 | ) | | | 5.38 | | | | 3.96 | | | | 2.32 | | | | 1.49 | |
| Total from investment operations | | $ | | | (10.20 | ) | | | 5.35 | | | | 3.92 | | | | 2.29 | | | | 1.44 | |
| Less distributions from: | | | | | | | | | | | | | | | | | | | | | | |
| Net investment income | | $ | | | — | | | | — | | | | — | | | | — | | | | 0.03 | |
| Return of capital | | $ | | | — | | | | — | | | | — | | | | — | | | | 0.10 | |
| Net realized gains on investments | | $ | | | 1.39 | | | | 0.68 | | | | 0.36 | | | | — | | | | 0.04 | |
| Total distributions | | $ | | | 1.39 | | | | 0.68 | | | | 0.36 | | | | — | | | | 0.17 | |
| Net asset value, end of year | | $ | | | 11.19 | | | | 22.78 | | | | 18.11 | | | | 14.55 | | | | 12.26 | |
Total Return(1) | | % | | | (47.42 | ) | | | 30.35 | | | | 27.40 | | | | 18.68 | | | | 13.32 | |
| | | | | | | | | | | | | | | | | | | | | | | |
Ratios and Supplemental Data: | | | | | | | | | | | | | | | | | | | | | | |
| Net assets, end of year (000’s) | | $ | | | 18,831 | | | | 50,276 | | | | 38,136 | | | | 22,944 | | | | 11,263 | |
| Ratios to average net assets: | | | | | | | | | | | | | | | | | | | | | | |
| Gross expenses prior to expense waiver/recoupment and brokerage commission recapture | | % | | | 2.36 | | | | 2.29 | | | | 2.33 | | | | 2.41 | | | | 2.70 | |
Net expenses after expense waiver and prior to brokerage commission recapture(2) | | % | | | 2.35 | † | | | 2.29 | | | | 2.40 | | | | 2.43 | | | | 2.45 | |
Net expenses after expense waiver/recoupment and brokerage commission recapture(2) | | % | | | 2.35 | † | | | 2.29 | | | | 2.40 | | | | 2.43 | | | | 2.45 | |
Net investment income (loss) after expense waiver/recoupment and brokerage commission recapture(2) | | % | | | 0.11 | † | | | (0.16 | ) | | | (0.24 | ) | | | (0.23 | ) | | | (0.46 | ) |
| Portfolio turnover rate | | % | | | 116 | | | | 69 | | | | 65 | | | | 81 | | | | 141 | |
|
| | |
| (1) | | Total return is calculated assuming reinvestment of all dividends and capital gain distributions at net asset value and excluding the deduction of sales charges. |
| |
| (2) | | The Investment Adviser has agreed to limit expenses, (excluding interest, taxes, brokerage commissions, extraordinary expenses and acquired fund fees and expenses) subject to possible recoupment by the Investment Adviser within three years of being incurred. |
| |
| * | | Calculated using average number of shares outstanding throughout the period. |
| |
| † | | Impact of waiving the advisory fee for the ING Institutional Prime Money Market Fund holding has less than 0.01% impact on the expense ratio and net investment income ratio. |
See Accompanying Notes to Financial Statements
109
ING Foreign Fund (continued)
Financial Highlights
Selected data for a share of beneficial interest outstanding throughout each year.
| | | | | | | | | | | | | | | | | | | | | | | |
| | | | | Class C |
| | | | | Year Ended October 31, |
| | | | | 2008 | | 2007 | | 2006 | | 2005 | | 2004 |
| |
|
Per Share Operating Performance: | | | | | | | | | | | | | | | | | | | | | | |
| Net asset value, beginning of year | | $ | | | 22.81 | | | | 18.14 | | | | 14.57 | | | | 12.28 | | | | 11.01 | |
| Income (loss) from investment operations: | | | | | | | | | | | | | | | | | | | | | | |
| Net investment income (loss) | | $ | | | 0.03 | * | | | (0.03 | ) | | | (0.04 | )* | | | (0.03 | ) | | | (0.04 | )* |
| Net realized and unrealized gain (loss) on investments | | $ | | | (10.24 | ) | | | 5.38 | | | | 3.97 | | | | 2.32 | | | | 1.48 | |
| Total from investment operations | | $ | | | (10.21 | ) | | | 5.35 | | | | 3.93 | | | | 2.29 | | | | 1.44 | |
| Less distributions from: | | | | | | | | | | | | | | | | | | | | | | |
| Net investment income | | $ | | | — | | | | — | | | | — | | | | — | | | | 0.03 | |
| Return of capital | | $ | | | — | | | | — | | | | — | | | | — | | | | 0.10 | |
| Net realized gains on investments | | $ | | | 1.39 | | | | 0.68 | | | | 0.36 | | | | — | | | | 0.04 | |
| Total distributions | | $ | | | 1.39 | | | | 0.68 | | | | 0.36 | | | | — | | | | 0.17 | |
| Net asset value, end of year | | $ | | | 11.21 | | | | 22.81 | | | | 18.14 | | | | 14.57 | | | | 12.28 | |
Total Return(1) | | % | | | (47.40 | ) | | | 30.30 | | | | 27.43 | | | | 18.65 | | | | 13.28 | |
| | | | | | | | | | | | | | | | | | | | | | | |
Ratios and Supplemental Data: | | | | | | | | | | | | | | | | | | | | | | |
| Net assets, end of year (000’s) | | $ | | | 102,274 | | | | 232,439 | | | | 154,101 | | | | 87,877 | | | | 41,424 | |
| Ratios to average net assets: | | | | | | | | | | | | | | | | | | | | | | |
| Gross expenses prior to expense waiver/recoupment and brokerage commission recapture | | % | | | 2.36 | | | | 2.29 | | | | 2.33 | | | | 2.41 | | | | 2.70 | |
Net expenses after expense waiver/recoupment and prior to brokerage commission recapture(2) | | % | | | 2.35 | † | | | 2.29 | | | | 2.40 | | | | 2.43 | | | | 2.45 | |
Net expenses after expense waiver/recoupment and brokerage commission recapture(2) | | % | | | 2.35 | † | | | 2.29 | | | | 2.40 | | | | 2.43 | | | | 2.45 | |
Net investment income (loss) after expense waiver/recoupment and brokerage commission recapture(2) | | % | | | 0.14 | † | | | (0.14 | ) | | | (0.26 | ) | | | (0.27 | ) | | | (0.41 | ) |
| Portfolio turnover rate | | % | | | 116 | | | | 69 | | | | 65 | | | | 81 | | | | 141 | |
|
| | |
| (1) | | Total return is calculated assuming reinvestment of all dividends and capital gain distributions at net asset value and excluding the deduction of sales charges. Total return for less than one year is not annualized. |
| |
| (2) | | The Investment Adviser has agreed to limit expenses, (excluding interest, taxes, brokerage commissions, extraordinary expenses and acquired fund fees and expenses) subject to possible recoupment by the Investment Adviser within three years of being incurred. |
| |
| * | | Calculated using average number of shares outstanding throughout the period. |
| |
| † | | Impact of waiving the advisory fee for the ING Institutional Prime Money Market Fund holding has less than 0.01% impact on the expense ratio and net investment income ratio. |
See Accompanying Notes to Financial Statements
110
ING Foreign Fund (continued)
Financial Highlights
Selected data for a share of beneficial interest outstanding throughout each year.
| | | | | | | | | | | | | | | | | | | | | | | |
| | | | | Class I |
| | | | | Year Ended October 31, |
| | | | | 2008 | | 2007 | | 2006 | | 2005 | | 2004 |
| |
|
Per Share Operating Performance: | | | | | | | | | | | | | | | | | | | | | | |
| Net asset value, beginning of year | | $ | | | 23.91 | | | | 18.78 | | | | 14.93 | | | | 12.45 | | | | 11.05 | |
| Income (loss) from investment operations: | | | | | | | | | | | | | | | | | | | | | | |
| Net investment income | | $ | | | 0.24 | * | | | 0.16 | | | | 0.13 | * | | | 0.34 | | | | 0.19 | |
| Net realized and unrealized gain (loss) on investments | | $ | | | (10.84 | ) | | | 5.65 | | | | 4.08 | | | | 2.14 | | | | 1.39 | |
| Total from investment operations | | $ | | | (10.60 | ) | | | 5.81 | | | | 4.21 | | | | 2.48 | | | | 1.58 | |
| Less distributions from: | | | | | | | | | | | | | | | | | | | | | | |
| Net investment income | | $ | | | — | | | | — | | | | — | | | | — | | | | 0.04 | |
| Return of capital | | $ | | | — | | | | — | | | | — | | | | — | | | | 0.10 | |
| Net realized gains on investments | | $ | | | 1.39 | | | | 0.68 | | | | 0.36 | | | | — | | | | 0.04 | |
| Total distributions | | $ | | | 1.39 | | | | 0.68 | | | | 0.36 | | | | — | | | | 0.18 | |
| Net asset value, end of year | | $ | | | 11.92 | | | | 23.91 | | | | 18.78 | | | | 14.93 | | | | 12.45 | |
Total Return(1) | | % | | | (46.82 | ) | | | 31.76 | | | | 28.67 | | | | 19.92 | | | | 14.53 | |
| | | | | | | | | | | | | | | | | | | | | | | |
Ratios and Supplemental Data: | | | | | | | | | | | | | | | | | | | | | | |
| Net assets, end of year (000’s) | | $ | | | 68,020 | | | | 108,732 | | | | 61,248 | | | | 1,049 | | | | 2,547 | |
| Ratios to average net assets: | | | | | | | | | | | | | | | | | | | | | | |
| Gross expenses prior to expense waiver/recoupment and brokerage commission recapture | | % | | | 1.28 | | | | 1.21 | | | | 1.28 | | | | 1.34 | | | | 1.50 | |
Net expenses after expense waiver/recoupment and prior to brokerage commission recapture(2) | | % | | | 1.27 | † | | | 1.21 | | | | 1.35 | | | | 1.35 | | | | 1.25 | |
Net expenses after expense waiver/recoupment and brokerage commission recapture(2) | | % | | | 1.27 | † | | | 1.21 | | | | 1.34 | | | | 1.35 | | | | 1.25 | |
Net investment income after expense waiver/recoupment and brokerage commission recapture(2) | | % | | | 1.26 | † | | | 0.94 | | | | 0.78 | | | | 0.97 | | | | 1.58 | |
| Portfolio turnover rate | | % | | | 116 | | | | 69 | | | | 65 | | | | 81 | | | | 141 | |
|
| | |
| (1) | | Total return is calculated assuming reinvestment of all dividends and capital gain distributions at net asset value and excluding the deduction of sales charges. |
| |
| (2) | | The Investment Adviser has agreed to limit expenses, (excluding interest, taxes, brokerage commissions, extraordinary expenses and acquired fund fees and expenses) subject to possible recoupment by the Investment Adviser within three years of being incurred. |
| |
| * | | Calculated using average number of shares outstanding throughout the period. |
| |
| † | | Impact of waiving the advisory fee for the ING Institutional Prime Money Market Fund holding has less than 0.01% impact on the expense ratio and net investment income ratio. |
See Accompanying Notes to Financial Statements
111
ING Foreign Fund (continued)
Financial Highlights
Selected data for a share of beneficial interest outstanding throughout each year.
| | | | | | | | | | | | | | | | | | | | | | | |
| | | | | Class Q |
| | | | | Year Ended October 31, |
| | | | | 2008 | | 2007 | | 2006 | | 2005 | | 2004 |
| |
|
Per Share Operating Performance: | | | | | | | | | | | | | | | | | | | | | | |
| Net asset value, beginning of year | | $ | | | 23.63 | | | | 18.61 | | | | 14.82 | | | | 12.40 | | | | 11.02 | |
| Income (loss) from investment operations: | | | | | | | | | | | | | | | | | | | | | | |
| Net investment income | | $ | | | 0.18 | * | | | 0.17 | * | | | 0.07 | * | | | 0.08 | | | | 0.09 | |
| Net realized and unrealized gain (loss) on investments | | $ | | | (10.69 | ) | | | 5.53 | | | | 4.08 | | | | 2.34 | | | | 1.46 | |
| Total from investment operations | | $ | | | (10.51 | ) | | | 5.70 | | | | 4.15 | | | | 2.42 | | | | 1.55 | |
| Less distributions from: | | | | | | | | | | | | | | | | | | | | | | |
| Net investment income | | $ | | | — | | | | — | | | | — | | | | — | | | | 0.03 | |
| Return of capital | | $ | | | — | | | | — | | | | — | | | | — | | | | 0.10 | |
| Net realized gains on investments | | $ | | | 1.39 | | | | 0.68 | | | | 0.36 | | | | — | | | | 0.04 | |
| Total distributions | | $ | | | 1.39 | | | | 0.68 | | | | 0.36 | | | | — | | | | 0.17 | |
| Net asset value, end of year | | $ | | | 11.73 | | | | 23.63 | | | | 18.61 | | | | 14.82 | | | | 12.40 | |
Total Return(1) | | % | | | (47.00 | ) | | | 31.45 | | | | 28.47 | | | | 19.52 | | | | 14.28 | |
| | | | | | | | | | | | | | | | | | | | | | | |
Ratios and Supplemental Data: | | | | | | | | | | | | | | | | | | | | | | |
| Net assets, end of year (000’s) | | $ | | | 66 | | | | 856 | | | | 1,196 | | | | 1,079 | | | | 1,054 | |
| Ratios to average net assets: | | | | | | | | | | | | | | | | | | | | | | |
| Gross expenses prior to expense waiver/recoupment and brokerage commission recapture | | % | | | 1.53 | | | | 1.45 | | | | 1.53 | | | | 1.59 | | | | 1.85 | |
Net expenses after expense waiver/recoupment and prior to brokerage commission recapture(2) | | % | | | 1.52 | † | | | 1.45 | | | | 1.60 | | | | 1.60 | | | | 1.60 | |
Net expenses after expense waiver/recoupment and brokerage commission recapture(2) | | % | | | 1.52 | † | | | 1.45 | | | | 1.60 | | | | 1.60 | | | | 1.60 | |
Net investment income after expense waiver/recoupment and brokerage commission recapture(2) | | % | | | 0.94 | † | | | 0.82 | | | | 0.43 | | | | 0.53 | | | | 0.34 | |
| Portfolio turnover rate | | % | | | 116 | | | | 69 | | | | 65 | | | | 81 | | | | 141 | |
|
| | |
| (1) | | Total return is calculated assuming reinvestment of all dividends and capital gain distributions at net asset value and excluding the deduction of sales charges. |
| |
| (2) | | The Investment Adviser has agreed to limit expenses, (excluding interest, taxes, brokerage commissions, extraordinary expenses and acquired fund fees and expenses) subject to possible recoupment by the Investment Adviser within three years of being incurred. |
| |
| * | | Calculated using average number of shares outstanding throughout the period. |
| |
| † | | Impact of waiving the advisory fee for the ING Institutional Prime Money Market Fund holding has less than 0.01% impact on the expense ratio and net investment income ratio. |
See Accompanying Notes to Financial Statements
112
ING Foreign Fund (continued)
Financial Highlights
Selected data for a share of beneficial interest outstanding throughout the period.
| | | | | | | |
| | | | | Class W |
| | | | | February 12,
|
| | | | | 2008(1) to
|
| | | | | October 31,
|
| | | | | 2008 |
| |
|
Per Share Operating Performance: | | | | | | |
| Net asset value, beginning of period | | $ | | | 20.48 | |
| Income (loss) from investment operations: | | | | | | |
| Net investment income | | $ | | | 0.27 | * |
| Net realized and unrealized loss on investments | | $ | | | (8.04 | ) |
| Total from investment operations | | $ | | | (7.77 | ) |
| Net asset value, end of period | | $ | | | 12.71 | |
Total Return(2) | | % | | | (37.94 | ) |
| | | | | | | |
| | | | | | | |
Ratios and Supplemental Data: | | | | | | |
| Net assets, end of period (000’s) | | $ | | | 296 | |
| Ratios to average net assets: | | | | | | |
Gross expenses prior to expense waiver(3) | | % | | | 1.28 | |
Net expenses after expense waiver(3)(4) | | % | | | 1.27 | † |
Net investment income after expense waiver(3)(4) | | % | | | 2.03 | † |
| Portfolio turnover rate | | % | | | 116 | |
|
| | |
| (1) | | Commencement of operations. |
| |
| (2) | | Total return is calculated assuming reinvestment of all dividends and capital gain distributions at net asset value. Total return for less than one year is not annualized. |
| |
| (3) | | Annualized for periods less than one year. |
| |
| (4) | | The Investment Adviser has agreed to limit expenses (excluding interest, taxes, brokerage commissions, extraordinary expenses and acquired fund fees and expenses) subject to possible recoupment by the Investment Adviser within three years of being incurred. |
| |
| * | | Calculated using average number of shares outstanding throughout the period. |
| |
| † | | Impact of waiving the advisory fee for the ING Institutional Prime Money Market Fund holding has less than 0.01% impact on the expense ratio and net investment income ratio. |
See Accompanying Notes to Financial Statements
113
ING Greater China Fund
Financial Highlights
Selected data for a share of beneficial interest outstanding throughout each period.
| | | | | | | | | | | | | | | | | | | | | | | | | | | |
| | | | | Class A | | Class B |
| | | | | | | | | December 21,
| | | | | | January 6,
|
| | | | | Year Ended
| | 2005(1) to
| | Year Ended
| | 2006(1) to
|
| | | | | October 31, | | October 31,
| | October 31, | | October 31,
|
| | | | | 2008 | | 2007 | | 2006 | | 2008 | | 2007 | | 2006 |
| |
|
Per Share Operating Performance: | | | | | | | | | | | | | | | | | | | | | | | | | | |
| Net asset value, beginning of period | | $ | | | 24.43 | | | | 12.49 | | | | 10.00 | | | | 24.14 | | | | 12.42 | | | | 10.60 | |
| Income (loss) from investment operations: | | | | | | | | | | | | | | | | | | | | | | | | | | |
| Net investment income (loss) | | $ | | | 0.05 | * | | | 0.07 | | | | 0.06 | | | | (0.05 | ) | | | (0.03 | )* | | | 0.05 | * |
| Net realized and unrealized gain (loss) on investments | | $ | | | (13.12 | ) | | | 11.93 | | | | 2.43 | | | | (12.95 | ) | | | 11.79 | | | | 1.77 | |
| Total from investment operations | | $ | | | (13.07 | ) | | | 12.00 | | | | 2.49 | | | | (13.00 | ) | | | 11.76 | | | | 1.82 | |
| Less distributions from: | | | | | | | | | | | | | | | | | | | | | | | | | | |
| Net investment income | | $ | | | 0.06 | | | | 0.06 | | | | — | | | | — | | | | 0.04 | | | | — | |
| Net realized gains on investments | | $ | | | 2.06 | | | | 0.00 | ** | | | — | | | | 2.06 | | | | 0.00 | ** | | | — | |
| Total distributions | | $ | | | 2.12 | | | | 0.06 | | | | — | | | | 2.06 | | | | 0.04 | | | | — | |
| Net asset value, end of period | | $ | | | 9.24 | | | | 24.43 | | | | 12.49 | | | | 9.08 | | | | 24.14 | | | | 12.42 | |
Total Return(2) | | % | | | (57.63 | ) | | | 96.41 | | | | 24.90 | | | | (57.95 | ) | | | 94.92 | | | | 17.17 | |
| | | | | | | | | | | | | | | | | | | | | | | | | | | |
Ratios and Supplemental Data: | | | | | | | | | | | | | | | | | | | | | | | | | | |
| Net assets, end of period (000’s) | | $ | | | 20,481 | | | | 73,804 | | | | 23,709 | | | | 1,901 | | | | 7,414 | | | | 1,957 | |
| Ratios to average net assets: | | | | | | | | | | | | | | | | | | | | | | | | | | |
Expenses(3) | | % | | | 1.96 | | | | 1.91 | | | | 2.64 | | | | 2.71 | | | | 2.66 | | | | 3.39 | |
Net investment income (loss)(3) | | % | | | 0.32 | | | | 0.54 | | | | 0.75 | | | | (0.33 | ) | | | (0.19 | ) | | | 0.47 | |
| Portfolio turnover rate | | % | | | 159 | | | | 109 | | | | 108 | | | | 159 | | | | 109 | | | | 108 | |
|
| | | | | | | | | | | | | | | | | | | | | | | | | | | | | | | |
| | | | | Class C | | Class I | | Class O |
| | | | | | | | | January 11,
| | | | | | May 8,
| | June 4,
|
| | | | | Year Ended
| | 2006(1) to
| | Year Ended
| | 2006(1) to
| | 2008(1) to
|
| | | | | October 31, | | October 31,
| | October 31, | | October 31,
| | October 31,
|
| | | | | 2008 | | 2007 | | 2006 | | 2008 | | 2007 | | 2006 | | 2008 |
| |
|
Per Share Operating Performance: | | | | | | | | | | | | | | | | | | | | | | | | | | | | | | |
| Net asset value, beginning of period | | $ | | | 24.16 | | | | 12.43 | | | | 10.67 | | | | 24.46 | | | | 12.50 | | | | 12.84 | | | | 16.83 | |
| Income (loss) from investment operations: | | | | | | | | | | | | | | | | | | | | | | | | | | | | | | |
| Net investment income (loss) | | $ | | | (0.09 | )* | | | (0.03 | )* | | | 0.05 | * | | | 0.16 | * | | | 0.11 | | | | 0.08 | | | | 0.11 | * |
| Net realized and unrealized gain (loss) on investments | | $ | | | (12.92 | ) | | | 11.79 | | | | 1.71 | | | | (13.18 | ) | | | 11.93 | | | | (0.42 | ) | | | (7.68 | ) |
| Total from investment operations | | $ | | | (13.01 | ) | | | 11.76 | | | | 1.76 | | | | (13.02 | ) | | | 12.04 | | | | (0.34 | ) | | | (7.57 | ) |
| Less distributions from: | | | | | | | | | | | | | | | | | | | | | | | | | | | | | | |
| Net investment income | | $ | | | — | | | | 0.03 | | | | — | | | | 0.10 | | | | 0.08 | | | | — | | | | — | |
| Net realized gains on investments | | $ | | | 2.06 | | | | 0.00 | ** | | | — | | | | 2.06 | | | | 0.00 | ** | | | — | | | | — | |
| Total distributions | | $ | | | 2.06 | | | | 0.03 | | | | — | | | | 2.16 | | | | 0.08 | | | | — | | | | — | |
| Net asset value, end of period | | $ | | | 9.09 | | | | 24.16 | | | | 12.43 | | | | 9.28 | | | | 24.46 | | | | 12.50 | | | | 9.26 | |
Total Return(2) | | % | | | (57.94 | ) | | | 94.75 | | | | 16.49 | | | | (57.42 | ) | | | 96.81 | | | | (2.65 | ) | | | (44.98 | ) |
| | | | | | | | | | | | | | | | | | | | | | | | | | | | | | | |
| | | | | | | | | | | | | | | | | | | | | | | | | | | | | | | |
Ratios and Supplemental Data: | | | | | | | | | | | | | | | | | | | | | | | | | | | | | | |
| Net assets, end of period (000’s) | | $ | | | 2,694 | | | | 12,386 | | | | 2,124 | | | | 39 | | | | 52 | | | | 22 | | | | 206 | |
| Ratios to average net assets: | | | | | | | | | | | | | | | | | | | | | | | | | | | | | | |
Expenses(3) | | % | | | 2.71 | | | | 2.66 | | | | 3.39 | | | | 1.70 | | | | 1.66 | | | | 2.39 | | | | 1.96 | |
Net investment income (loss)(3) | | % | | | (0.52 | ) | | | (0.20 | ) | | | 0.53 | | | | 1.02 | | | | 0.73 | | | | 1.47 | | | | 2.23 | |
| Portfolio turnover rate | | % | | | 159 | | | | 109 | | | | 108 | | | | 159 | | | | 109 | | | | 108 | | | | 159 | |
|
| | |
| (1) | | Commencement of operations. |
| |
| (2) | | Total return is calculated assuming reinvestment of dividends and capital gain distributions at net asset value and excluding the deduction of sales charges. Total return for less than one year is not annualized. |
| |
| (3) | | Annualized for periods less than one year. |
| |
| * | | Calculated using average number of shares outstanding throughout the period. |
| |
| ** | | Amount is less than $0.005. |
See Accompanying Notes to Financial Statements
114
ING Index Plus International Equity Fund
Financial Highlights
Selected data for a share of beneficial interest outstanding throughout each period.
| | | | | | | | | | | | | | | | | | | | | | | | | | | |
| | | | | Class A | | Class B |
| | | | | | | | | December 21,
| | | | | | January 12,
|
| | | | | Year Ended
| | 2005(1) to
| | Year Ended
| | 2006(1) to
|
| | | | | October 31, | | October 31,
| | October 31, | | October 31,
|
| | | | | 2008 | | 2007 | | 2006 | | 2008 | | 2007 | | 2006 |
| |
|
Per Share Operating Performance: | | | | | | | | | | | | | | | | | | | | | | | | | | |
| Net asset value, beginning of period | | $ | | | 13.95 | | | | 11.68 | | | | 10.00 | | | | 13.90 | | | | 11.63 | | | | 10.43 | |
| Income (loss) from investment operations: | | | | | | | | | | | | | | | | | | | | | | | | | | |
| Net investment income | | $ | | | 0.19 | * | | | 0.14 | * | | | 0.14 | * | | | 0.12 | * | | | 0.09 | * | | | 0.06 | * |
| Net realized and unrealized gain (loss) on investments | | $ | | | (6.24 | ) | | | 2.48 | | | | 1.54 | | | | (6.20 | ) | | | 2.51 | | | | 1.14 | |
| Total from investment operations | | $ | | | (6.05 | ) | | | 2.62 | | | | 1.68 | | | | (6.08 | ) | | | 2.60 | | | | 1.20 | |
| Less distributions from: | | | | | | | | | | | | | | | | | | | | | | | | | | |
| Net investment income | | $ | | | 0.18 | | | | 0.08 | | | | — | | | | 0.16 | | | | 0.06 | | | | — | |
| Net realized gains on investments | | $ | | | 1.37 | | | | 0.27 | | | | — | | | | 1.37 | | | | 0.27 | | | | — | |
| Total distributions | | $ | | | 1.55 | | | | 0.35 | | | | — | | | | 1.53 | | | | 0.33 | | | | — | |
| Net asset value, end of period | | $ | | | 6.35 | | | | 13.95 | | | | 11.68 | | | | 6.29 | | | | 13.90 | | | | 11.63 | |
Total Return(2) | | % | | | (48.51 | ) | | | 22.98 | | | | 16.80 | | | | (48.88 | ) | | | 22.85 | | | | 11.51 | |
| | | | | | | | | | | | | | | | | | | | | | | | | | | |
| | | | | | | | | | | | | | | | | | | | | | | | | | | |
Ratios and Supplemental Data: | | | | | | | | | | | | | | | | | | | | | | | | | | |
| Net assets, end of period (000’s) | | $ | | | 9,446 | | | | 2,233 | | | | 12,513 | | | | 1,571 | | | | 734 | | | | 264 | |
| Ratios to average net assets: | | | | | | | | | | | | | | | | | | | | | | | | | | |
Gross expenses prior to expense waiver/recoupment(3) | | % | | | 1.73 | | | | 1.13 | | | | 1.30 | | | | 2.48 | | | | 1.89 | | | | 2.05 | |
Net expenses after expense waiver/recoupment(3)(4) | | % | | | 1.30 | | | | 1.16 | | | | 1.15 | | | | 2.05 | | | | 1.92 | | | | 1.90 | |
Net investment income after expense waiver/recoupment(3)(4) | | % | | | 1.93 | | | | 1.17 | | | | 1.50 | | | | 1.22 | | | | 0.67 | | | | 0.64 | |
| Portfolio turnover rate | | % | | | 215 | | | | 213 | | | | 188 | | | | 215 | | | | 213 | | | | 188 | |
|
| | | | | | | | | | | | | | | | | | | | | | | | | | | |
| | | | | Class C | | Class I |
| | | | | | | | | January 12,
| | | | | | December 21,
|
| | | | | Year Ended
| | 2006(1) to
| | Year Ended
| | 2005(1) to
|
| | | | | October 31, | | October 31,
| | October 31, | | October 31,
|
| | | | | 2008 | | 2007 | | 2006 | | 2008 | | 2007 | | 2006 |
| |
|
Per Share Operating Performance: | | | | | | | | | | | | | | | | | | | | | | | | | | |
| Net asset value, beginning of period | | $ | | | 13.89 | | | | 11.61 | | | | 10.43 | | | | 14.06 | | | | 11.70 | | | | 10.00 | |
| Income (loss) from investment operations: | | | | | | | | | | | | | | | | | | | | | | | | | | |
| Net investment income | | $ | | | 0.12 | * | | | 0.09 | * | | | 0.08 | * | | | 0.29 | * | | | 0.20 | | | | 0.16 | * |
| Net realized and unrealized gain (loss) on investments | | $ | | | (6.20 | ) | | | 2.50 | | | | 1.10 | | | | (6.32 | ) | | | 2.55 | | | | 1.54 | |
| Total from investment operations | | $ | | | (6.08 | ) | | | 2.59 | | | | 1.18 | | | | (6.03 | ) | | | 2.75 | | | | 1.70 | |
| Less distributions from: | | | | | | | | | | | | | | | | | | | | | | | | | | |
| Net investment income | | $ | | | 0.16 | | | | 0.04 | | | | — | | | | 0.24 | | | | 0.12 | | | | — | |
| Net realized gains on investments | | $ | | | 1.37 | | | | 0.27 | | | | — | | | | 1.37 | | | | 0.27 | | | | — | |
| Total distributions | | $ | | | 1.53 | | | | 0.31 | | | | — | | | | 1.61 | | | | 0.39 | | | | — | |
| Net asset value, end of period | | $ | | | 6.28 | | | | 13.89 | | | | 11.61 | | | | 6.42 | | | | 14.06 | | | | 11.70 | |
Total Return(2) | | % | | | (48.91 | ) | | | 22.81 | | | | 11.31 | | | | (48.12 | ) | | | 24.14 | | | | 17.00 | |
| | | | | | | | | | | | | | | | | | | | | | | | | | | |
| | | | | | | | | | | | | | | | | | | | | | | | | | | |
Ratios and Supplemental Data: | | | | | | | | | | | | | | | | | | | | | | | | | | |
| Net assets, end of period (000’s) | | $ | | | 1,311 | | | | 1,126 | | | | 534 | | | | 54,838 | | | | 118,924 | | | | 78,581 | |
| Ratios to average net assets: | | | | | | | | | | | | | | | | | | | | | | | | | | |
Gross expenses prior to expense waiver/recoupment(3) | | % | | | 2.48 | | | | 1.89 | | | | 2.05 | | | | 1.05 | | | | 0.84 | | | | 1.05 | |
Net expenses after expense waiver/recoupment(3)(4) | | % | | | 2.05 | | | | 1.92 | | | | 1.90 | | | | 0.62 | | | | 0.87 | | | | 0.90 | |
Net investment income after expense waiver/recoupment(3)(4) | | % | | | 1.16 | | | | 0.69 | | | | 0.87 | | | | 2.80 | | | | 1.78 | | | | 1.69 | |
| Portfolio turnover rate | | % | | | 215 | | | | 213 | | | | 188 | | | | 215 | | | | 213 | | | | 188 | |
|
| | |
| (1) | | Commencement of operations. |
| |
| (2) | | Total return is calculated assuming reinvestment of dividends and capital gain distributions at net asset value and excluding the deduction of sales charges. Total return for less than one year is not annualized. |
| |
| (3) | | Annualized for periods less than one year. |
| |
| (4) | | The Investment Adviser has agreed to limit expenses, excluding interest, taxes, brokerage commissions, extraordinary expenses and acquired fund fees and expenses) subject to possible recoupment by the Investment Adviser within three years of being incurred. |
| |
| * | | Calculated using average number of shares outstanding throughout the period. |
See Accompanying Notes to Financial Statements
115
ING Index Plus International Equity Fund (continued)
Financial Highlights
Selected data for a share of beneficial interest outstanding throughout the period.
| | | | | | | |
| | | | | Class O |
| | | | | November 12,
|
| | | | | 2007(1) to
|
| | | | | October 31,
|
| | | | | 2008 |
| |
|
Per Share Operating Performance: | | | | | | |
| Net asset value, beginning of period | | $ | | | 13.09 | |
| Income (loss) from investment operations: | | | | | | |
| Net investment income | | $ | | | 0.19 | * |
| Net realized and unrealized loss on investments | | $ | | | (5.36 | ) |
| Total from investment operations | | $ | | | (5.17 | ) |
| Less distributions from: | | | | | | |
| Net investment income | | $ | | | 0.24 | |
| Net realized gains on investments | | $ | | | 1.37 | |
| Total distributions | | $ | | | 1.61 | |
| Net asset value, end of period | | $ | | | 6.31 | |
Total Return(2) | | % | | | (45.16 | ) |
| | | | | | | |
| | | | | | | |
Ratios and Supplemental Data: | | | | | | |
| Net assets, end of period (000’s) | | $ | | | 41,539 | |
| Ratios to average net assets: | | | | | | |
Gross expenses prior to expense waiver/recoupment(3) | | % | | | 1.73 | |
Net expenses after expense waiver/recoupment(3)(4) | | % | | | 1.30 | |
Net investment income after expense waiver/recoupment(3)(4) | | % | | | 2.03 | |
| Portfolio turnover rate | | % | | | 215 | |
|
| | |
| (1) | | Commencement of operations. |
| |
| (2) | | Total return is calculated assuming reinvestment of dividends and capital gain distributions at net asset value and excluding the deduction of sales charge. Total return for less than one year is not annualized. |
| |
| (3) | | Annualized for periods less than one year. |
| |
| (4) | | The Investment Adviser has agreed to limit expenses, excluding interest, taxes, brokerage commissions, extraordinary expenses and acquired fund fees and expenses) subject to possible recoupment by the Investment Adviser within three years of being incurred. |
| |
| * | | Calculated using average number of shares outstanding throughout the period. |
See Accompanying Notes to Financial Statements
116
ING International Capital Appreciation Fund
Financial Highlights
Selected data for a share of beneficial interest outstanding throughout each period.
| | | | | | | | | | | | | | | | | | | | | | | | | | | |
| | | | | Class A | | Class B |
| | | | | | | | | December 21,
| | | | | | January 9,
|
| | | | | Year Ended
| | 2005(1) to
| | Year Ended
| | 2006(1) to
|
| | | | | October 31, | | October 31,
| | October 31, | | October 31,
|
| | | | | 2008 | | 2007 | | 2006 | | 2008 | | 2007 | | 2006 |
| |
|
Per Share Operating Performance: | | | | | | | | | | | | | | | | | | | | | | | | | | |
| Net asset value, beginning of period | | $ | | | 14.86 | | | | 11.39 | | | | 10.00 | | | | 14.67 | | | | 11.33 | | | | 10.42 | |
| Income (loss) from investment operations: | | | | | | | | | | | | | | | | | | | | | | | | | | |
| Net investment income (loss) | | $ | | | 0.12 | | | | 0.01 | * | | | 0.04 | | | | (0.01 | )* | | | (0.09 | ) | | | (0.04 | )* |
| Net realized and unrealized gain (loss) on investments | | $ | | | (7.64 | ) | | | 3.76 | | | | 1.35 | | | | (7.47 | ) | | | 3.71 | | | | 0.95 | |
| Total from investment operations | | $ | | | (7.52 | ) | | | 3.77 | | | | 1.39 | | | | (7.48 | ) | | | 3.62 | | | | 0.91 | |
| Less distributions from: | | | | | | | | | | | | | | | | | | | | | | | | | | |
| Net investment income | | $ | | | 0.14 | | | | 0.05 | | | | — | | | | 0.11 | | | | 0.03 | | | | — | |
| Net realized gains on investments | | $ | | | 0.50 | | | | 0.25 | | | | — | | | | 0.50 | | | | 0.25 | | | | — | |
| Total distributions | | $ | | | 0.64 | | | | 0.30 | | | | — | | | | 0.61 | | | | 0.28 | | | | — | |
| Net asset value, end of period | | $ | | | 6.70 | | | | 14.86 | | | | 11.39 | | | | 6.58 | | | | 14.67 | | | | 11.33 | |
Total Return(2) | | % | | | (52.69 | ) | | | 33.89 | | | | 13.90 | | | | (53.01 | ) | | | 32.67 | | | | 8.73 | |
| | | | | | | | | | | | | | | | | | | | | | | | | | | |
| | | | | | | | | | | | | | | | | | | | | | | | | | | |
Ratios and Supplemental Data: | | | | | | | | | | | | | | | | | | | | | | | | | | |
| Net assets, end of period (000’s) | | $ | | | 1,612 | | | | 4,592 | | | | 3,677 | | | | 278 | | | | 943 | | | | 66 | |
| Ratios to average net assets: | | | | | | | | | | | | | | | | | | | | | | | | | | |
Gross expenses prior to expense waiver/recoupment and brokerage commission recapture(3) | | % | | | 1.41 | | | | 1.48 | | | | 1.84 | | | | 2.16 | | | | 2.23 | | | | 2.59 | |
Net expenses after expense waiver/recoupment and prior to brokerage commission recapture(3)(4) | | % | | | 1.46 | | | | 1.50 | | | | 1.50 | | | | 2.21 | | | | 2.25 | | | | 2.25 | |
Net expenses after expense waiver/recoupment and brokerage commission recapture(3)(4) | | % | | | 1.46 | | | | 1.50 | | | | 1.50 | | | | 2.21 | | | | 2.25 | | | | 2.25 | |
Net investment income (loss) after expense waiver/recoupment and brokerage commission recapture(3)(4) | | % | | | 0.73 | | | | 0.08 | | | | 0.32 | | | | (0.11 | ) | | | (0.88 | ) | | | (0.43 | ) |
| Portfolio turnover rate | | % | | | 83 | | | | 71 | | | | 91 | | | | 83 | | | | 71 | | | | 91 | |
|
| | | | | | | | | | | | | | | | | | | | | | | | | | | |
| | | | | Class C | | Class I |
| | | | | | | | | January 24,
| | | | | | December 21,
|
| | | | | Year Ended
| | 2006(1) to
| | Year Ended
| | 2005(1) to
|
| | | | | October 31, | | October 31,
| | October 31, | | October 31,
|
| | | | | 2008 | | 2007 | | 2006 | | 2008 | | 2007 | | 2006 |
| |
|
Per Share Operating Performance: | | | | | | | | | | | | | | | | | | | | | | | | | | |
| Net asset value, beginning of period | | $ | | | 14.71 | | | | 11.35 | | | | 10.28 | | | | 14.90 | | | | 11.43 | | | | 10.00 | |
| Income (loss) from investment operations: | | | | | | | | | | | | | | | | | | | | | | | | | | |
| Net investment income (loss) | | $ | | | 0.00 | *,** | | | (0.12 | ) | | | (0.03 | ) | | | 0.17 | | | | 0.06 | * | | | 0.02 | |
| Net realized and unrealized gain (loss) on investments | | $ | | | (7.50 | ) | | | 3.73 | | | | 1.10 | | | | (7.67 | ) | | | 3.75 | | | | 1.41 | |
| Total from investment operations | | $ | | | (7.50 | ) | | | 3.61 | | | | 1.07 | | | | (7.50 | ) | | | 3.81 | | | | 1.43 | |
| Less distributions from: | | | | | | | | | | | | | | | | | | | | | | | | | | |
| Net investment income | | $ | | | 0.11 | | | | 0.00 | ** | | | — | | | | 0.17 | | | | 0.09 | | | | — | |
| Net realized gains on investments | | $ | | | 0.50 | | | | 0.25 | | | | — | | | | 0.50 | | | | 0.25 | | | | — | |
| Total distributions | | $ | | | 0.61 | | | | 0.25 | | | | — | | | | 0.67 | | | | 0.34 | | | | — | |
| Net asset value, end of period | | $ | | | 6.60 | | | | 14.71 | | | | 11.35 | | | | 6.73 | | | | 14.90 | | | | 11.43 | |
Total Return(2) | | % | | | (52.99 | ) | | | 32.45 | | | | 10.41 | | | | (52.48 | ) | | | 34.14 | | | | 14.30 | |
| | | | | | | | | | | | | | | | | | | | | | | | | | | |
| | | | | | | | | | | | | | | | | | | | | | | | | | | |
Ratios and Supplemental Data: | | | | | | | | | | | | | | | | | | | | | | | | | | |
| Net assets, end of period (000’s) | | $ | | | 354 | | | | 971 | | | | 65 | | | | 47,918 | | | | 140,901 | | | | 47,200 | |
| Ratios to average net assets: | | | | | | | | | | | | | | | | | | | | | | | | | | |
Gross expenses prior to expense waiver/
recoupment and brokerage commission recapture(3) | | % | | | 2.16 | | | | 2.23 | | | | 2.59 | | | | 1.08 | | | | 1.13 | | | | 1.56 | |
Net expenses after expense waiver/recoupment and prior to brokerage commission recapture(3)(4) | | % | | | 2.21 | | | | 2.25 | | | | 2.25 | | | | 1.13 | | | | 1.15 | | | | 1.22 | |
Net expenses after expense waiver/recoupment and brokerage commission recapture(3)(4) | | % | | | 2.21 | | | | 2.25 | | | | 2.25 | | | | 1.13 | | | | 1.15 | | | | 1.22 | |
Net investment income (loss) after expense waiver/recoupment and brokerage commission recapture(3)(4) | | % | | | 0.01 | | | | (0.97 | ) | | | (0.50 | ) | | | 1.09 | | | | 0.47 | | | | 0.39 | |
| Portfolio turnover rate | | % | | | 83 | | | | 71 | | | | 91 | | | | 83 | | | | 71 | | | | 91 | |
|
| | |
| (1) | | Commencement of operations. |
| (2) | | Total return is calculated assuming reinvestment of dividends and capital gain distributions at net asset value and excluding the deduction of sales charges. Total return for less than one year is not annualized. |
| (3) | | Annualized for periods less than one year. |
| (4) | | The Investment Adviser has agreed to limit expenses, (excluding interest, taxes, brokerage commissions, extraordinary expenses and acquired fund fees and expenses) subject to possible recoupment by the Investment Adviser within three years of being incurred. |
| * | | Calculated using average number of shares outstanding throughout the period. |
| ** | | Amount is less than $0.005. |
See Accompanying Notes to Financial Statements
117
ING International Equity Dividend Fund
Financial Highlights
Selected data for a share of beneficial interest outstanding throughout each period.
| | | | | | | | | | | | | | | | | | | |
| | | | | Class A | | Class B |
| | | | | | | June 28,
| | | | June 28,
|
| | | | | Year Ended
| | 2007(1) to
| | Year Ended
| | 2007(1) to
|
| | | | | October 31,
| | October 31,
| | October 31,
| | October 31,
|
| | | | | 2008 | | 2007 | | 2008 | | 2007 |
| |
|
Per Share Operating Performance: | | | | | | | | | | | | | | | | | | |
| Net asset value, beginning of period | | $ | | | 10.57 | | | | 10.00 | | | | 10.55 | | | | 10.00 | |
| Income (loss) from investment operations: | | | | | | | | | | | | | | | | | | |
| Net investment income | | $ | | | 0.38 | | | | 0.06 | * | | | 0.29 | * | | | 0.03 | * |
| Net realized and unrealized gain (loss) on investments | | $ | | | (5.18 | ) | | | 0.51 | | | | (5.15 | ) | | | 0.52 | |
| Total from investment operations | | $ | | | (4.80 | ) | | | 0.57 | | | | (4.86 | ) | | | 0.55 | |
| Less distributions from: | | | | | | | | | | | | | | | | | | |
| Net investment income | | $ | | | 0.34 | | | | — | | | | 0.27 | | | | — | |
| Net realized gains on investments | | $ | | | 0.04 | | | | — | | | | 0.04 | | | | — | |
| Return of capital | | | | | 0.03 | | | | — | | | | 0.03 | | | | — | |
| Total distributions | | $ | | | 0.41 | | | | — | | | | 0.34 | | | | — | |
| Net asset value, end of period | | $ | | | 5.36 | | | | 10.57 | | | | 5.35 | | | | 10.55 | |
Total Return(2) | | % | | | (46.79 | ) | | | 5.70 | | | | (47.19 | ) | | | 5.50 | |
| | | | | | | | | | | | | | | | | | | |
Ratios and Supplemental Data: | | | | | | | | | | | | | | | | | | |
| Net assets, end of period (000’s) | | $ | | | 1,521 | | | | 4,122 | | | | 165 | | | | 239 | |
| Ratios to average net assets: | | | | | | | | | | | | | | | | | | |
Gross expenses prior to expense waiver(3) | | % | | | 1.63 | | | | 1.64 | | | | 2.38 | | | | 2.39 | |
Net expenses after expense waiver(3)(4) | | % | | | 1.40 | | | | 1.40 | | | | 2.15 | | | | 2.15 | |
Net investment income after expense waiver(3)(4) | | % | | | 4.02 | | | | 1.81 | | | | 3.43 | | | | 1.09 | |
| Portfolio turnover rate | | % | | | 66 | | | | 7 | | | | 66 | | | | 7 | |
|
| | | | | | | | | | | | | | | | | | | | | | | |
| | | | | Class C | | Class I | | Class W |
| | | | | | | June 28,
| | | | June 28,
| | February 12,
|
| | | | | Year Ended
| | 2007(1) to
| | Year Ended
| | 2007(1) to
| | 2008(1) to
|
| | | | | October 31,
| | October 31,
| | October 31,
| | October 31,
| | October 31,
|
| | | | | 2008 | | 2007 | | 2008 | | 2007 | | 2008 |
| |
|
Per Share Operating Performance: | | | | | | | | | | | | | | | | | | | | | | |
| Net asset value, beginning of period | | $ | | | 10.55 | | | | 10.00 | | | | 10.58 | | | | 10.00 | | | | 8.86 | |
| Income (loss) from investment operations: | | | | | | | | | | | | | | | | | | | | | | |
| Net investment income | | $ | | | 0.28 | * | | | 0.03 | * | | | 0.36 | * | | | 0.07 | * | | | 0.22 | * |
| Net realized and unrealized gain (loss) on investments | | $ | | | (5.14 | ) | | | 0.52 | | | | (5.14 | ) | | | 0.51 | | | | (3.41 | ) |
| Total from investment operations | | $ | | | (4.86 | ) | | | 0.55 | | | | (4.78 | ) | | | 0.58 | | | | (3.19 | ) |
| Less distributions from: | | | | | | | | | | | | | | | | | | | | | | |
| Net investment income | | $ | | | 0.27 | | | | — | | | | 0.37 | | | | — | | | | 0.29 | |
| Net realized gains on investments | | $ | | | 0.04 | | | | — | | | | 0.04 | | | | — | | | | — | |
| Return of capital | | | | | 0.03 | | | | — | | | | 0.03 | | | | — | | | | 0.02 | |
| Total distributions | | $ | | | 0.34 | | | | — | | | | 0.44 | | | | — | | | | 0.31 | |
| Net asset value, end of period | | $ | | | 5.35 | | | | 10.55 | | | | 5.36 | | | | 10.58 | | | | 5.36 | |
Total Return(2) | | % | | | (47.20 | ) | | | 5.50 | | | | (46.64 | ) | | | 5.80 | | | | (37.11 | ) |
| | | | | | | | | | | | | | | | | | | | | | | |
Ratios and Supplemental Data: | | | | | | | | | | | | | | | | | | | | | | |
| Net assets, end of period (000’s) | | $ | | | 730 | | | | 1,334 | | | | 33,612 | | | | 55,611 | | | | 12 | |
| Ratios to average net assets: | | | | | | | | | | | | | | | | | | | | | | |
Gross expenses prior to expense waiver(3) | | % | | | 2.38 | | | | 2.39 | | | | 1.29 | | | | 1.39 | | | | 1.29 | |
Net expenses after expense waiver(3)(4) | | % | | | 2.15 | | | | 2.15 | | | | 1.06 | | | | 1.15 | | | | 1.06 | |
Net investment income after expense waiver(3)(4) | | % | | | 3.25 | | | | 1.08 | | | | 4.22 | | | | 1.95 | | | | 4.06 | |
| Portfolio turnover rate | | % | | | 66 | | | | 7 | | | | 66 | | | | 7 | | | | 66 | |
|
| | |
| (1) | | Commencement of operations. |
| |
| (2) | | Total return is calculated assuming reinvestment of dividends and capital gain distributions at net asset value and excluding the deduction of sales charge. Total return for less than one year is not annualized. |
| |
| (3) | | Annualized for periods less than one year. |
| |
| (4) | | The Investment Adviser has agreed to limit expenses, (excluding interest, taxes, brokerage commissions, extraordinary expenses and acquired fund fees and expenses) subject to possible recoupment by the Investment Adviser within three years of being incurred. |
| |
| * | | Calculated using average number of shares outstanding throughout the period. |
See Accompanying Notes to Financial Statements
118
ING International Growth Opportunities Fund
Financial Highlights
Selected data for a share of beneficial interest outstanding throughout each year.
| | | | | | | | | | | | | | | | | | | | | | | |
| | | | | Class A |
| | | | | Year Ended October 31, |
| | | | | 2008 | | 2007 | | 2006 | | 2005 | | 2004 |
| |
|
Per Share Operating Performance: | | | | | | | | | | | | | | | | | | | | | | |
| Net asset value, beginning of year | | $ | | | 15.61 | | | | 13.20 | | | | 10.97 | | | | 9.78 | | | | 8.48 | |
| Income (loss) from investment operations: | | | | | | | | | | | | | | | | | | | | | | |
| Net investment income | | $ | | | 0.07 | | | | 0.03 | | | | 0.12 | | | | 0.10 | | | | 0.09 | |
| Net realized and unrealized gain (loss) on investments | | $ | | | (7.47 | ) | | | 3.67 | | | | 2.28 | | | | 1.18 | | | | 1.22 | |
| Total from investment operations | | $ | | | (7.40 | ) | | | 3.70 | | | | 2.40 | | | | 1.28 | | | | 1.31 | |
| Less distributions from: | | | | | | | | | | | | | | | | | | | | | | |
| Net investment income | | $ | | | 0.02 | | | | 0.15 | | | | 0.17 | | | | 0.10 | | | | 0.01 | |
| Net realized gains on investments | | $ | | | 2.30 | | | | 1.14 | | | | — | | | | — | | | | — | |
| Total distributions | | $ | | | 2.32 | | | | 1.29 | | | | 0.17 | | | | 0.10 | | | | 0.01 | |
| Redemption fees applied to capital | | $ | | | — | | | | — | | | | — | | | | — | | | | 0.00 | ** |
| Payment by affiliate | | $ | | | — | | | | — | | | | — | | | | 0.01 | | | | — | |
| Net asset value, end of year | | $ | | | 5.89 | | | | 15.61 | | | | 13.20 | | | | 10.97 | | | | 9.78 | |
Total Return(1) | | % | | | (55.03 | ) | | | 30.37 | | | | 22.12 | | | | 13.30 | †† | | | 15.49 | |
| | | | | | | | | | | | | | | | | | | | | | | |
| | | | | | | | | | | | | | | | | | | | | | | |
Ratios and Supplemental Data: | | | | | | | | | | | | | | | | | | | | | | |
| Net assets, end of year (000’s) | | $ | | | 25,104 | | | | 64,631 | | | | 58,697 | | | | 51,193 | | | | 47,551 | |
| Ratios to average net assets: | | | | | | | | | | | | | | | | | | | | | | |
| Gross expenses prior to expense waiver/recoupment | | % | | | 1.74 | | | | 1.65 | | | | 1.65 | | | | 1.65 | | | | 1.64 | |
Net expenses after expense waiver/recoupment(2) | | % | | | 1.74 | | | | 1.65 | † | | | 1.65 | | | | 1.65 | | | | 1.68 | |
Net investment income after expense waiver/recoupment(2) | | % | | | 0.45 | | | | 0.23 | † | | | 0.96 | | | | 0.94 | | | | 0.78 | |
| Portfolio turnover rate | | % | | | 146 | | | | 130 | | | | 173 | | | | 116 | | | | 90 | |
|
| | | | | | | | | | | | | | | | | | | | | | | |
| | | | | Class B |
| | | | | Year Ended October 31, |
| | | | | 2008 | | 2007 | | 2006 | | 2005 | | 2004 |
| |
|
Per Share Operating Performance: | | | | | | | | | | | | | | | | | | | | | | |
| Net asset value, beginning of year | | $ | | | 14.96 | | | | 12.69 | | | | 10.55 | | | | 9.43 | | | | 8.22 | |
| Income (loss) from investment operations: | | | | | | | | | | | | | | | | | | | | | | |
| Net investment income (loss) | | $ | | | (0.04 | )* | | | (0.07 | )* | | | 0.03 | * | | | 0.02 | | | | (0.00 | )** |
| Net realized and unrealized gain (loss) on investments | | $ | | | (7.06 | ) | | | 3.53 | | | | 2.20 | | | | 1.14 | | | | 1.21 | |
| Total from investment operations | | $ | | | (7.10 | ) | | | 3.46 | | | | 2.23 | | | | 1.16 | | | | 1.21 | |
| Less distributions from: | | | | | | | | | | | | | | | | | | | | | | |
| Net investment income | | $ | | | — | | | | 0.05 | | | | 0.09 | | | | 0.05 | | | | — | |
| Net realized gains of investments | | $ | | | 2.30 | | | | 1.14 | | | | — | | | | — | | | | — | |
| Total distributions | | $ | | | 2.30 | | | | 1.19 | | | | 0.09 | | | | 0.05 | | | | — | |
| Payment by affiliate | | $ | | | — | | | | — | | | | — | | | | 0.01 | | | | — | |
| Net asset value, end of year | | $ | | | 5.56 | | | | 14.96 | | | | 12.69 | | | | 10.55 | | | | 9.43 | |
Total Return(1) | | % | | | (55.41 | ) | | | 29.42 | | | | 21.23 | | | | 12.41 | †† | | | 14.72 | |
| | | | | | | | | | | | | | | | | | | | | | | |
| | | | | | | | | | | | | | | | | | | | | | | |
Ratios and Supplemental Data: | | | | | | | | | | | | | | | | | | | | | | |
| Net assets, end of year (000’s) | | $ | | | 4,476 | | | | 17,311 | | | | 16,822 | | | | 16,338 | | | | 15,069 | |
| Ratios to average net assets: | | | | | | | | | | | | | | | | | | | | | | |
| Gross expenses prior to expense waiver/recoupment | | % | | | 2.49 | | | | 2.40 | | | | 2.40 | | | | 2.40 | | | | 2.39 | |
Net expenses after expense waiver/recoupment(2) | | % | | | 2.49 | | | | 2.40 | † | | | 2.40 | | | | 2.40 | | | | 2.43 | |
Net investment income (loss) after expense waiver/recoupment(2) | | % | | | (0.38 | ) | | | (0.51 | )† | | | 0.22 | | | | 0.19 | | | | (0.02 | ) |
| Portfolio turnover rate | | % | | | 146 | | | | 130 | | | | 173 | | | | 116 | | | | 90 | |
|
| | |
| (1) | | Total return is calculated assuming reinvestment of all dividends and capital gain distributions at net asset value and excluding the deduction of sales charges. |
| |
| (2) | | The Investment Adviser has agreed to limit expenses, (excluding interest, taxes, brokerage commissions, extraordinary expenses and acquired fund fees and expenses) subject to possible recoupment by the Investment Adviser within three years of being incurred. |
| |
| * | | Calculated using average number of shares outstanding throughout the period. |
| |
| ** | | Amount is less than $0.005 or more than $(0.005). |
| |
| † | | Impact of waiving the advisory fee for the ING Institutional Prime Money Market Fund holding has less than 0.01% impact on the expense ratio and net investment income or loss ratio. |
| |
| †† | | In 2005, 0.10% of the total return on Class A and Class B, consists of a payment by affiliate. Excluding this item, total return would have been 13.20% and 12.31% for Class A and Class B, respectively. |
See Accompanying Notes to Financial Statements
119
ING International Growth Opportunities Fund (continued)
Financial Highlights
Selected data for a share of beneficial interest outstanding throughout each year.
| | | | | | | | | | | | | | | | | | | | | | | |
| | | | | Class C |
| | | | | Year Ended October 31, |
| | | | | 2008 | | 2007 | | 2006 | | 2005 | | 2004 |
| |
|
Per Share Operating Performance: | | | | | | | | | | | | | | | | | | | | | | |
| Net asset value, beginning of year | | $ | | | 14.97 | | | | 12.70 | | | | 10.55 | | | | 9.42 | | | | 8.22 | |
| Income (loss) from investment operations: | | | | | | | | | | | | | | | | | | | | | | |
| Net investment income (loss) | | $ | | | (0.04 | ) | | | (0.07 | ) | | | 0.04 | | | | 0.03 | | | | (0.00 | )** |
| Net realized and unrealized gain (loss) on investments | | $ | | | (7.06 | ) | | | 3.54 | | | | 2.19 | | | | 1.13 | | | | 1.20 | |
| Total from investment operations | | $ | | | (7.10 | ) | | | 3.47 | | | | 2.23 | | | | 1.16 | | | | 1.20 | |
| Less distributions from: | | | | | | | | | | | | | | | | | | | | | | |
| Net investment income | | $ | | | — | | | | 0.06 | | | | 0.08 | | | | 0.04 | | | | — | |
| Net realized gains on investments | | $ | | | 2.30 | | | | 1.14 | | | | — | | | | — | | | | — | |
| Total distributions | | $ | | | 2.30 | | | | 1.20 | | | | 0.08 | | | | 0.04 | | | | — | |
| Payment by affiliate | | $ | | | — | | | | — | | | | — | | | | 0.01 | | | | — | |
| Net asset value, end of year | | $ | | | 5.57 | | | | 14.97 | | | | 12.70 | | | | 10.55 | | | | 9.42 | |
Total Return(1) | | % | | | (55.36 | ) | | | 29.46 | | | | 21.25 | | | | 12.46 | †† | | | 14.60 | |
| | | | | | | | | | | | | | | | | | | | | | | |
| | | | | | | | | | | | | | | | | | | | | | | |
Ratios and Supplemental Data: | | | | | | | | | | | | | | | | | | | | | | |
| Net assets, end of year (000’s) | | $ | | | 6,657 | | | | 19,104 | | | | 15,918 | | | | 15,008 | | | | 16,230 | |
| Ratios to average net assets: | | | | | | | | | | | | | | | | | | | | | | |
| Gross expenses prior to expense waiver/recoupment | | % | | | 2.49 | | | | 2.40 | | | | 2.40 | | | | 2.40 | | | | 2.39 | |
Net expenses after expense waiver/recoupment(2) | | % | | | 2.49 | | | | 2.40 | † | | | 2.40 | | | | 2.40 | | | | 2.43 | |
Net investment income (loss) after expense waiver/recoupment(2) | | % | | | (0.30 | ) | | | (0.52 | )† | | | 0.21 | | | | 0.18 | | | | (0.04 | ) |
| Portfolio turnover rate | | % | | | 146 | | | | 130 | | | | 173 | | | | 116 | | | | 90 | |
|
| | | | | | | | | | | | | | | | | | | | | | | |
| | | | | Class I |
| | | | | Year Ended October 31, |
| | | | | 2008 | | 2007 | | 2006 | | 2005 | | 2004 |
| |
|
Per Share Operating Performance: | | | | | | | | | | | | | | | | | | | | | | |
| Net asset value, beginning of year | | $ | | | 15.57 | | | | 13.16 | | | | 10.94 | | | | 9.76 | | | | 8.45 | |
| Income (loss) from investment operations: | | | | | | | | | | | | | | | | | | | | | | |
| Net investment income | | $ | | | 0.09 | * | | | 0.06 | * | | | 0.15 | * | | | 0.14 | | | | 0.09 | |
| Net realized and unrealized gain (loss) on investments | | $ | | | (7.43 | ) | | | 3.70 | | | | 2.29 | | | | 1.18 | | | | 1.25 | |
| Total from investment operations | | $ | | | (7.34 | ) | | | 3.76 | | | | 2.44 | | | | 1.32 | | | | 1.34 | |
| Less distributions from: | | | | | | | | | | | | | | | | | | | | | | |
| Net investment income | | $ | | | 0.05 | | | | 0.21 | | | | 0.22 | | | | 0.15 | | | | 0.03 | |
| Net realized gains on investments | | $ | | | 2.30 | | | | 1.14 | | | | — | | | | — | | | | — | |
| Total distributions | | $ | | | 2.35 | | | | 1.35 | | | | 0.22 | | | | 0.15 | | | | 0.03 | |
| Payment by affiliate | | $ | | | — | | | | — | | | | — | | | | 0.01 | | | | — | |
| Net asset value, end of year | | $ | | | 5.88 | | | | 15.57 | | | | 13.16 | | | | 10.94 | | | | 9.76 | |
Total Return(1) | | % | | | (54.86 | ) | | | 31.02 | | | | 22.56 | | | | 13.73 | †† | | | 15.94 | |
| | | | | | | | | | | | | | | | | | | | | | | |
| | | | | | | | | | | | | | | | | | | | | | | |
Ratios and Supplemental Data: | | | | | | | | | | | | | | | | | | | | | | |
| Net assets, end of year (000’s) | | $ | | | 16,964 | | | | 10,251 | | | | 13,354 | | | | 23,452 | | | | 17,211 | |
| Ratios to average net assets: | | | | | | | | | | | | | | | | | | | | | | |
| Gross expenses prior to expense waiver/recoupment | | % | | | 1.37 | | | | 1.28 | | | | 1.25 | | | | 1.26 | | | | 1.22 | |
Net expenses after expense waiver/recoupment(2) | | % | | | 1.37 | | | | 1.28 | † | | | 1.25 | | | | 1.26 | | | | 1.26 | |
Net investment income after expense waiver/recoupment(2) | | % | | | 0.87 | | | | 0.46 | † | | | 1.27 | | | | 1.34 | | | | 1.13 | |
| Portfolio turnover rate | | % | | | 146 | | | | 130 | | | | 173 | | | | 116 | | | | 90 | |
|
| | |
| (1) | | Total return is calculated assuming reinvestment of all dividends and capital gain distributions at net asset value and excluding the deduction of sales charges. |
| (2) | | The Investment Adviser has agreed to limit expenses, (excluding interest, taxes, brokerage commissions, extraordinary expenses and acquired fund fees and expenses) subject to possible recoupment by the Investment Adviser within three years of being incurred. |
| * | | Calculated using average number of shares outstanding throughout the period. |
| ** | | Amount is less than $0.005 or more than $(0.005). |
| † | | Impact of waiving the advisory fee for the ING Institutional Prime Money Market Fund holding has less than 0.01% impact on the expense ratio and net investment income or loss ratio. |
| †† | | In 2005, 0.10% of the total return on Class C and Class I, consists of a payment by affiliate. Excluding this item, total return would have been 12.36% and 13.63% for Class C and Class I, respectively. |
See Accompanying Notes to Financial Statements
120
ING International Growth Opportunities Fund (continued)
Financial Highlights
Selected data for a share of beneficial interest outstanding throughout each year.
| | | | | | | | | | | | | | | | | | | | | | | |
| | | | | Class Q |
| | | | | Year Ended October 31, |
| | | | | 2008 | | 2007 | | 2006 | | 2005 | | 2004 |
| |
|
Per Share Operating Performance: | | | | | | | | | | | | | | | | | | | | | | |
| Net asset value, beginning of year | | $ | | | 15.47 | | | | 13.10 | | | | 10.89 | | | | 9.72 | | | | 8.43 | |
| Income (loss) from investment operations: | | | | | | | | | | | | | | | | | | | | | | |
| Net investment income | | $ | | | 0.09 | | | | 0.05 | | | | 0.14 | | | | 0.08 | | | | 0.06 | |
| Net realized and unrealized gain (loss) on investments | | $ | | | (7.39 | ) | | | 3.64 | | | | 2.27 | | | | 1.20 | | | | 1.25 | |
| Total from investment operations | | $ | | | (7.30 | ) | | | 3.69 | | | | 2.41 | | | | 1.28 | | | | 1.31 | |
| Less distributions from: | | | | | | | | | | | | | | | | | | | | | | |
| Net investment income | | $ | | | 0.04 | | | | 0.18 | | | | 0.20 | | | | 0.12 | | | | 0.02 | |
| Net realized gains on investments | | $ | | | 2.30 | | | | 1.14 | | | | — | | | | — | | | | — | |
| Total distributions | | $ | | | 2.34 | | | | 1.32 | | | | 0.20 | | | | 0.12 | | | | 0.02 | |
| Payment by affiliate | | $ | | | — | | | | — | | | | — | | | | 0.01 | | | | — | |
| Net asset value, end of year | | $ | | | 5.83 | | | | 15.47 | | | | 13.10 | | | | 10.89 | | | | 9.72 | |
Total Return(1) | | % | | | (54.96 | ) | | | 30.55 | | | | 22.38 | | | | 13.41 | †† | | | 15.61 | |
| | | | | | | | | | | | | | | | | | | | | | | |
Ratios and Supplemental Data: | | | | | | | | | | | | | | | | | | | | | | |
| Net assets, end of year (000’s) | | $ | | | 9,986 | | | | 32,532 | | | | 27,114 | | | | 14,544 | | | | 7,274 | |
| Ratios to average net assets: | | | | | | | | | | | | | | | | | | | | | | |
| Gross expenses prior to expense waiver/recoupment | | % | | | 1.62 | | | | 1.52 | | | | 1.50 | | | | 1.51 | | | | 1.56 | |
Net expenses after expense waiver/recoupment(2) | | % | | | 1.50 | | | | 1.52 | † | | | 1.50 | | | | 1.51 | | | | 1.60 | |
Net investment income after expense waiver/recoupment(2) | | % | | | 0.68 | | | | 0.40 | † | | | 1.19 | | | | 1.00 | | | | 0.73 | |
| Portfolio turnover rate | | % | | | 146 | | | | 130 | | | | 173 | | | | 116 | | | | 90 | |
|
| | |
| (1) | | Total return is calculated assuming reinvestment of all dividends and capital gain distributions at net asset value and excluding the deduction of sales charges. |
| |
| (2) | | The Investment Adviser has agreed to limit expenses, (excluding interest, taxes, brokerage commissions, extraordinary expenses and acquired fund fees and expenses) subject to possible recoupment by the Investment Adviser within three years of being incurred. |
| |
| † | | Impact of waiving the advisory fee for the ING Institutional Prime Money Market Fund holding has less than 0.01% impact on the expense ratio and net investment income ratio. |
| |
| †† | | In 2005, 0.10% of the total return on Class Q, consists of a payment by affiliate. Excluding this item, total return would have been 13.31% for Class Q. |
See Accompanying Notes to Financial Statements
121
ING International Real Estate Fund
Financial Highlights
Selected data for a share of beneficial interest outstanding throughout each period.
| | | | | | | | | | | | | | | | | | | | | | | | | | | |
| | | | | Class A | | Class B |
| | | | | | | | | February 28,
| | Year
| | February 28,
|
| | | | | Year Ended
| | 2006(1) to
| | Ended
| | 2006(1) to
|
| | | | | October 31, | | October 31,
| | October 31, | | October 31,
|
| | | | | 2008 | | 2007 | | 2006 | | 2008 | | 2007 | | 2006 |
| |
|
Per Share Operating Performance: | | | | | | | | | | | | | | | | | | | | | | | | | | |
| Net asset value, beginning of period | | $ | | | 14.56 | | | | 11.63 | | | | 10.00 | | | | 14.50 | | | | 11.59 | | | | 10.00 | |
| Income (loss) from investment operations: | | | | | | | | | | | | | | | | | | | | | | | | | | |
| Net investment income | | $ | | | 0.33 | | | | 0.13 | * | | | 0.09 | * | | | 0.25 | | | | 0.03 | * | | | 0.04 | * |
| Net realized and unrealized gain (loss) on investments | | $ | | | (7.43 | ) | | | 3.14 | | | | 1.60 | | | | (7.41 | ) | | | 3.14 | | | | 1.59 | |
| Total from investment operations | | $ | | | (7.10 | ) | | | 3.27 | | | | 1.69 | | | | (7.16 | ) | | | 3.17 | | | | 1.63 | |
| Less distributions from: | | | | | | | | | | | | | | | | | | | | | | | | | | |
| Net investment income | | $ | | | 0.36 | | | | 0.34 | | | | 0.06 | | | | 0.27 | | | | 0.26 | | | | 0.04 | |
| Return of capital | | $ | | | 0.19 | | | | — | | | | — | | | | 0.19 | | | | — | | | | — | |
| Total distributions | | $ | | | 0.55 | | | | 0.34 | | | | 0.06 | | | | 0.46 | | | | 0.26 | | | | 0.04 | |
| Net asset value, end of period | | $ | | | 6.91 | | | | 14.56 | | | | 11.63 | | | | 6.88 | | | | 14.50 | | | | 11.59 | |
Total Return(2) | | % | | | (50.31 | ) | | | 28.49 | | | | 16.94 | | | | (50.72 | ) | | | 27.69 | | | | 16.38 | |
| | | | | | | | | | | | | | | | | | | | | | | | | | | |
| | | | | | | | | | | | | | | | | | | | | | | | | | | |
Ratios and Supplemental Data: | | | | | | | | | | | | | | | | | | | | | | | | | | |
| Net assets, end of period (000’s) | | $ | | | 89,623 | | | | 271,425 | | | | 49,798 | | | | 4,004 | | | | 11,819 | | | | 1,639 | |
| Ratios to average net assets: | | | | | | | | | | | | | | | | | | | | | | | | | | |
Gross expenses prior to expense waiver/recoupment(3) | | % | | | 1.48 | | | | 1.51 | | | | 2.01 | | | | 2.23 | | | | 2.26 | | | | 2.76 | |
Net expenses after expense waiver/recoupment(3)(4) | | % | | | 1.50 | † | | | 1.50 | | | | 1.50 | | | | 2.25 | † | | | 2.25 | | | | 2.25 | |
Net investment income after expense waiver/recoupment(3)(4) | | % | | | 1.76 | † | | | 0.99 | | | | 1.33 | | | | 1.00 | † | | | 0.25 | | | | 0.51 | |
| Portfolio turnover rate | | % | | | 46 | | | | 44 | | | | 29 | | | | 46 | | | | 44 | | | | 29 | |
|
| | | | | | | | | | | | | | | | | | | | | | | | | | | |
| | | | | Class C | | Class I |
| | | | | | | | | February 28,
| | | | | | February 28,
|
| | | | | Year Ended
| | 2006(1) to
| | Year Ended
| | 2006(1) to
|
| | | | | October 31, | | October 31,
| | October 31, | | October 31,
|
| | | | | 2008 | | 2007 | | 2006 | | 2008 | | 2007 | | 2006 |
| |
|
Per Share Operating Performance: | | | | | | | | | | | | | | | | | | | | | | | | | | |
| Net asset value, beginning of period | | $ | | | 14.49 | | | | 11.59 | | | | 10.00 | | | | 14.58 | | | | 11.64 | | | | 10.00 | |
| Income (loss) from investment operations: | | | | | | | | | | | | | | | | | | | | | | | | | | |
| Net investment income | | $ | | | 0.29 | | | | 0.03 | * | | | 0.04 | * | | | 0.23 | * | | | 0.16 | * | | | 0.08 | * |
| Net realized and unrealized gain (loss) on investments | | $ | | | (7.44 | ) | | | 3.13 | | | | 1.59 | | | | (7.31 | ) | | | 3.15 | | | | 1.63 | |
| Total from investment operations | | $ | | | (7.15 | ) | | | 3.16 | | | | 1.63 | | | | (7.08 | ) | | | 3.31 | | | | 1.71 | |
| Less distributions from: | | | | | | | | | | | | | | | | | | | | | | | | | | |
| Net investment income | | $ | | | 0.27 | | | | 0.26 | | | | 0.04 | | | | 0.39 | | | | 0.37 | | | | 0.07 | |
| Return of capital | | $ | | | 0.19 | | | | — | | | | — | | | | 0.19 | | | | — | | | | — | |
| Total distributions | | $ | | | 0.46 | | | | 0.26 | | | | 0.04 | | | | 0.58 | | | | 0.37 | | | | 0.07 | |
| Net asset value, end of period | | $ | | | 6.88 | | | | 14.49 | | | | 11.59 | | | | 6.92 | | | | 14.58 | | | | 11.64 | |
Total Return(2) | | % | | | (50.69 | ) | | | 27.58 | | | | 16.31 | | | | (50.14 | ) | | | 28.80 | | | | 17.23 | |
| | | | | | | | | | | | | | | | | | | | | | | | | | | |
| | | | | | | | | | | | | | | | | | | | | | | | | | | |
Ratios and Supplemental Data: | | | | | | | | | | | | | | | | | | | | | | | | | | |
| Net assets, end of period (000’s) | | $ | | | 36,661 | | | | 121,529 | | | | 17,075 | | | | 290,227 | | | | 127,029 | | | | 22,336 | |
| Ratios to average net assets: | | | | | | | | | | | | | | | | | | | | | | | | | | |
Gross expenses prior to expense waiver/recoupment(3) | | % | | | 2.23 | | | | 2.26 | | | | 2.76 | | | | 1.16 | | | | 1.26 | | | | 1.76 | |
Net expenses after expense waiver/recoupment(3)(4) | | % | | | 2.25 | † | | | 2.25 | | | | 2.25 | | | | 1.18 | † | | | 1.25 | | | | 1.25 | |
Net investment income after expense waiver/recoupment(3)(4) | | % | | | 1.00 | † | | | 0.24 | | | | 0.54 | | | | 2.22 | † | | | 1.22 | | | | 1.09 | |
| Portfolio turnover rate | | % | | | 46 | | | | 44 | | | | 29 | | | | 46 | | | | 44 | | | | 29 | |
|
| | |
| (1) | | Commencement of operations. |
| |
| (2) | | Total return is calculated assuming reinvestment of dividends and capital gain distributions at net asset value and excluding the deduction of sales charges. Total return for less than one year is not annualized. |
| |
| (3) | | Annualized for periods less than one year. |
| |
| (4) | | The Investment Adviser has agreed to limit expenses, (excluding interest, taxes, brokerage commissions, extraordinary expenses and acquired fund fees and expenses) subject to possible recoupment by the Investment Adviser within three years of being incurred. |
| |
| * | | Calculated using average number of shares outstanding throughout the period. |
| |
| † | | Impact of waiving the advisory fee for the ING Institutional Prime Money Market Fund holding has less than 0.01% impact on the expense ratio and net investment income ratio. |
See Accompanying Notes to Financial Statements
122
ING International Real Estate Fund (continued)
Financial Highlights
Selected data for a share of beneficial interest outstanding throughout the period.
| | | | | | | |
| | | | | Class W |
| | | | | February 12,
|
| | | | | 2008(1) to
|
| | | | | October 31,
|
| | | | | 2008 |
| |
|
Per Share Operating Performance: | | | | | | |
| Net asset value, beginning of period | | $ | | | 11.48 | |
| Income (loss) from investment operations: | | | | | | |
| Net investment income | | $ | | | 0.17 | * |
| Net realized and unrealized loss on investments | | $ | | | (4.59 | ) |
| Total from investment operations | | $ | | | (4.42 | ) |
| Less distributions from: | | | | | | |
| Net investment income | | $ | | | 0.10 | |
| Return of capital | | $ | | | 0.05 | |
| Total distributions | | $ | | | 0.15 | |
| Net asset value, end of period | | $ | | | 6.91 | |
Total Return(2) | | % | | | (38.91 | ) |
| | | | | | | |
| | | | | | | |
Ratios and Supplemental Data: | | | | | | |
| Net assets, end of period (000’s) | | $ | | | 307 | |
| Ratios to average net assets: | | | | | | |
Gross expenses prior to expense recoupment(3) | | % | | | 1.18 | |
Net expenses after expense recoupment(3)(4) | | % | | | 1.20 | † |
Net investment income after expense recoupment(3)(4) | | % | | | 2.45 | † |
| Portfolio turnover rate | | % | | | 46 | |
|
| | |
| (1) | | Commencement of operations. |
| |
| (2) | | Total return is calculated assuming reinvestment of dividends and capital gain distributions at net asset value and excluding the deduction of sales charge. Total return for less than one year is not annualized. |
| |
| (3) | | Annualized for periods less than one year. |
| |
| (4) | | The Investment Adviser has agreed to limit expenses (excluding interest, taxes, brokerage commissions, extraordinary expenses and acquired fund fees and expenses) subject to possible recoupment by the Investment Adviser within three years of being incurred. |
| |
| * | | Calculated using average number of shares outstanding throughout the period. |
| |
| † | | Impact of waiving the advisory fee for the ING Institutional Prime Money Market Fund holding has less than 0.01% impact on the expense ratio and net investment income ratio. |
See Accompanying Notes to Financial Statements
123
ING International SmallCap Multi-Manager Fund
Financial Highlights
Selected data for a share of beneficial interest outstanding throughout each year.
| | | | | | | | | | | | | | | | | | | | | | | |
| | | | | Class A |
| | | | | Year Ended October 31, |
| | | | | 2008 | | 2007 | | 2006 | | 2005 | | 2004 |
| |
|
Per Share Operating Performance: | | | | | | | | | | | | | | | | | | | | | | |
| Net asset value, beginning of year | | $ | | | 66.43 | | | | 47.15 | | | | 37.75 | | | | 29.27 | | | | 25.37 | |
| Income (loss) from investment operations: | | | | | | | | | | | | | | | | | | | | | | |
| Net investment income | | $ | | | 0.65 | | | | 0.31 | | | | 0.29 | | | | 0.33 | * | | | 0.02 | |
| Net realized and unrealized gain (loss) on investments | | $ | | | (36.15 | ) | | | 19.25 | | | | 9.44 | | | | 8.05 | | | | 3.86 | |
| Total from investment operations | | $ | | | (35.50 | ) | | | 19.56 | | | | 9.73 | | | | 8.38 | | | | 3.88 | |
| Less distributions from: | | | | | | | | | | | | | | | | | | | | | | |
| Net investment income | | $ | | | 0.32 | | | | 0.28 | | | | 0.33 | | | | — | | | | 0.00 | ** |
| Net realized gains on investments | | $ | | | 7.88 | | | | — | | | | — | | | | — | | | | — | |
| Total distributions | | $ | | | 8.20 | | | | 0.28 | | | | 0.33 | | | | — | | | | 0.00 | ** |
| Payment by affiliate | | $ | | | — | | | | — | | | | — | | | | 0.10 | | | | 0.02 | |
| Net asset value, end of year | | $ | | | 22.73 | | | | 66.43 | | | | 47.15 | | | | 37.75 | | | | 29.27 | |
Total Return(1) | | % | | | (59.84 | ) | | | 41.67 | | | | 25.91 | | | | 28.97 | †† | | | 15.39 | † |
| | | | | | | | | | | | | | | | | | | | | | | |
Ratios and Supplemental Data: | | | | | | | | | | | | | | | | | | | | | | |
| Net assets, end of year (000’s) | | $ | | | 160,896 | | | | 523,535 | | | | 243,020 | | | | 173,612 | | | | 154,658 | |
| Ratios to average net assets: | | | | | | | | | | | | | | | | | | | | | | |
| Gross expenses prior to expense waiver/recoupment | | % | | | 1.70 | | | | 1.60 | | | | 1.66 | | | | 1.74 | | | | 1.72 | |
Net expenses after expense waiver/recoupment(2) | | % | | | 1.70 | | | | 1.60 | | | | 1.66 | | | | 1.74 | | | | 1.75 | |
Net investment income after expense waiver/recoupment(2) | | % | | | 1.27 | | | | 0.67 | | | | 0.67 | | | | 0.98 | | | | 0.07 | |
| Portfolio turnover rate | | % | | | 84 | | | | 93 | | | | 85 | | | | 124 | | | | 106 | |
|
| | | | | | | | | | | | | | | | | | | | | | | |
| | | | | Class B |
| | | | | Year Ended October 31, |
| | | | | 2008 | | 2007 | | 2006 | | 2005 | | 2004 |
| |
|
Per Share Operating Performance: | | | | | | | | | | | | | | | | | | | | | | |
| Net asset value, beginning of year | | $ | | | 68.31 | | | | 48.53 | | | | 38.83 | | | | 30.30 | | | | 26.43 | |
| Income (loss) from investment operations: | | | | | | | | | | | | | | | | | | | | | | |
| Net investment income (loss) | | $ | | | 0.21 | * | | | 0.00 | * ** | | | (0.01 | )* | | | 0.10 | * | | | (0.19 | ) |
| Net realized and unrealized gain (loss) on investments | | $ | | | (37.16 | ) | | | 19.78 | | | | 9.75 | | | | 8.33 | | | | 4.04 | |
| Total from investment operations | | $ | | | (36.95 | ) | | | 19.78 | | | | 9.74 | | | | 8.43 | | | | 3.85 | |
| Less distributions from: | | | | | | | | | | | | | | | | | | | | | | |
| Net investment income | | $ | | | — | | | | — | | | | 0.04 | | | | — | | | | — | |
| Net realized gains on investments | | $ | | | 7.88 | | | | — | | | | — | | | | — | | | | — | |
| Total distributions | | $ | | | 7.88 | | | | — | | | | 0.04 | | | | — | | | | — | |
| Payment by affiliate | | $ | | | — | | | | — | | | | — | | | | 0.10 | | | | 0.02 | |
| Net asset value, end of year | | $ | | | 23.48 | | | | 68.31 | | | | 48.53 | | | | 38.83 | | | | 30.30 | |
Total Return(1) | | % | | | (60.10 | ) | | | 40.76 | | | | 25.10 | | | | 28.15 | †† | | | 14.64 | † |
| | | | | | | | | | | | | | | | | | | | | | | |
Ratios and Supplemental Data: | | | | | | | | | | | | | | | | | | | | | | |
| Net assets, end of year (000’s) | | $ | | | 11,892 | | | | 65,619 | | | | 58,469 | | | | 57,131 | | | | 58,318 | |
| Ratios to average net assets: | | | | | | | | | | | | | | | | | | | | | | |
| Gross expenses prior to expense waiver/recoupment | | % | | | 2.35 | | | | 2.25 | | | | 2.31 | | | | 2.39 | | | | 2.37 | |
Net expenses after expense waiver/recoupment(2) | | % | | | 2.35 | | | | 2.25 | | | | 2.31 | | | | 2.39 | | | | 2.40 | |
Net investment income (loss) after expense waiver/recoupment(2) | | % | | | 0.45 | | | | 0.00 | ** | | | (0.03 | ) | | | 0.29 | | | | (0.60 | ) |
| Portfolio turnover rate | | % | | | 84 | | | | 93 | | | | 85 | | | | 124 | | | | 106 | |
|
| | |
| (1) | | Total return is calculated assuming reinvestment of all dividends and capital gain distributions at net asset value and excluding the deduction of sales charges. |
| |
| (2) | | The Investment Adviser has agreed to limit expenses, (excluding interest, taxes, brokerage commissions, extraordinary expenses and acquired fund fees and expenses) subject to possible recoupment by ING Investments, LLC within three years of being incurred. |
| |
| * | | Calculated using average number of shares outstanding throughout the period. |
| |
| ** | | Amount is less than $0.005 or 0.005%. |
| |
| † | | In 2004, the Sub-Adviser fully reimbursed the Fund for a loss incurred from a transaction not meeting the Fund’s investment guidelines, which otherwise would have reduced total return by 0.07%. |
| |
| †† | | In 2005, 0.34% and 0.33% of the total return on Class A and Class B, respectively, consists of a payment by affiliate. Excluding this item, total return would have been 28.63% and 27.82% on Class A and Class B, respectively. |
See Accompanying Notes to Financial Statements
124
ING International SmallCap Multi-Manager Fund (continued)
Financial Highlights
Selected data for a share of beneficial interest outstanding throughout each period.
| | | | | | | | | | | | | | | | | | | | | | | |
| | | | | Class C |
| | | | | Year Ended October 31, |
| | | | | 2008 | | 2007 | | 2006 | | 2005 | | 2004 |
| |
|
Per Share Operating Performance: | | | | | | | | | | | | | | | | | | | | | | |
| Net asset value, beginning of year | | $ | | | 62.48 | | | | 44.39 | | | | 35.59 | | | | 27.77 | | | | 24.23 | |
| Income (loss) from investment operations: | | | | | | | | | | | | | | | | | | | | | | |
| Net investment income (loss) | | $ | | | 0.34 | | | | 0.00 | * ** | | | (0.00 | )** | | | 0.10 | * | | | (0.17 | ) |
| Net realized and unrealized gain (loss) on investments | | $ | | | (33.79 | ) | | | 18.09 | | | | 8.91 | | | | 7.62 | | | | 3.70 | |
| Total from investment operations | | $ | | | (33.45 | ) | | | 18.09 | | | | 8.91 | | | | 7.72 | | | | 3.53 | |
| Less distributions from: | | | | | | | | | | | | | | | | | | | | | | |
| Net investment income | | $ | | | — | | | | 0.00 | ** | | | 0.11 | | | | — | | | | — | |
| Net realized gains on investments | | $ | | | 7.88 | | | | — | | | | — | | | | — | | | | — | |
| Total distributions | | $ | | | 7.88 | | | | 0.00 | ** | | | 0.11 | | | | — | | | | — | |
| Payment by affiliate | | $ | | | — | | | | — | | | | — | | | | 0.10 | | | | 0.01 | |
| Net asset value, end of year | | $ | | | 21.15 | | | | 62.48 | | | | 44.39 | | | | 35.59 | | | | 27.77 | |
Total Return(2) | | % | | | (60.11 | ) | | | 40.76 | | | | 25.09 | | | | 28.16 | †† | | | 14.61 | † |
| | | | | | | | | | | | | | | | | | | | | | | |
Ratios and Supplemental Data: | | | | | | | | | | | | | | | | | | | | | | |
| Net assets, end of year (000’s) | | $ | | | 29,760 | | | | 104,274 | | | | 65,534 | | | | 52,420 | | | | 47,793 | |
| Ratios to average net assets: | | | | | | | | | | | | | | | | | | | | | | |
Gross expenses prior to expense waiver/recoupment(3) | | % | | | 2.35 | | | | 2.25 | | | | 2.31 | | | | 2.39 | | | | 2.37 | |
Net expenses after expense waiver/recoupment(3)(4) | | % | | | 2.35 | | | | 2.25 | | | | 2.31 | | | | 2.39 | | | | 2.40 | |
Net investment income (loss) after expense waiver/recoupment(3)(4) | | % | | | 0.58 | | | | 0.01 | | | | (0.01 | ) | | | 0.30 | | | | (0.60 | ) |
| Portfolio turnover rate | | % | | | 84 | | | | 93 | | | | 85 | | | | 124 | | | | 106 | |
|
| | | | | | | | | | | | | | | | | | | |
| | | | | Class I | | Class O |
| | | | | | | | | December 21,
| | June 4,
|
| | | | | Year Ended
| | 2005(1) to
| | 2008(1) to
|
| | | | | October 31, | | October 31,
| | October 31,
|
| | | | | 2008 | | 2007 | | 2006 | | 2008 |
| |
|
Per Share Operating Performance: | | | | | | | | | | | | | | | | | | |
| Net asset value, beginning of period | | $ | | | 66.72 | | | | 47.35 | | | | 40.64 | | | | 47.28 | |
| Income (loss) from investment operations: | | | | | | | | | | | | | | | | | | |
| Net investment income | | $ | | | 0.78 | | | | 0.60 | | | | 0.39 | * | | | 0.18 | * |
| Net realized and unrealized gain (loss) on investments | | $ | | | (36.25 | ) | | | 19.25 | | | | 6.32 | | | | (24.71 | ) |
| Total from investment operations | | $ | | | (35.47 | ) | | | 19.85 | | | | 6.71 | | | | (24.53 | ) |
| Less distributions from: | | | | | | | | | | | | | | | | | | |
| Net investment income | | $ | | | 0.52 | | | | 0.48 | | | | — | | | | — | |
| Net realized gains on investments | | $ | | | 7.88 | | | | — | | | | — | | | | — | |
| Total distributions | | $ | | | 8.40 | | | | 0.48 | | | | — | | | | — | |
| Net asset value, end of period | | $ | | | 22.85 | | | | 66.72 | | | | 47.35 | | | | 22.75 | |
Total Return(2) | | % | | | (59.66 | ) | | | 42.24 | | | | 16.51 | | | | (51.88 | ) |
| | | | | | | | | | | | | | | | | | | |
| | | | | | | | | | | | | | | | | | | |
Ratios and Supplemental Data: | | | | | | | | | | | | | | | | | | |
| Net assets, end of period (000’s) | | $ | | | 139,213 | | | | 376,737 | | | | 137,184 | | | | 62 | |
| Ratios to average net assets: | | | | | | | | | | | | | | | | | | |
Gross expenses prior to expense waiver/recoupment(3) | | % | | | 1.29 | | | | 1.20 | | | | 1.20 | | | | 1.60 | |
Net expenses after expense waiver/recoupment(3)(4) | | % | | | 1.29 | | | | 1.20 | | | | 1.20 | | | | 1.60 | |
Net investment income after expense waiver/recoupment(3)(4) | | % | | | 1.71 | | | | 1.12 | | | | 1.02 | | | | 1.39 | |
| Portfolio turnover rate | | % | | | 84 | | | | 93 | | | | 85 | | | | 84 | |
|
| | |
| (1) | | Commencement of operations. |
| |
| (2) | | Total return is calculated assuming reinvestment of all dividends and capital gain distributions at net asset value and excluding the deduction of sales charges. Total return for less than one year is not annualized. |
| |
| (3) | | Annualized for periods less than one year. |
| |
| (4) | | The Investment Adviser has agreed to limit expenses, (excluding interest, taxes, brokerage commissions, extraordinary expenses and acquired fund fees and expenses) subject to possible recoupment by the Investment Adviser within three years of being incurred. |
| |
| * | | Calculated using average number of shares outstanding throughout the period. |
| |
| ** | | Amount is more than $(0.005) or less than $0.005. |
| |
| † | | In 2004, the Sub-Adviser fully reimbursed the Fund for a loss incurred from a transaction not meeting the Fund’s investment guidelines, which otherwise would have reduced total return by 0.07%. |
| |
| †† | | In 2005, 0.36% of the total return consists of a payment by affiliate. Excluding this item, total return would have been 27.80%. |
See Accompanying Notes to Financial Statements
125
ING International SmallCap Multi-Manager Fund (continued)
Financial Highlights
Selected data for a share of beneficial interest outstanding throughout each period.
| | | | | | | | | | | | | | | | | | | | | | | |
| | | | | Class Q |
| | | | | Year Ended October 31, |
| | | | | 2008 | | 2007 | | 2006 | | 2005 | | 2004 |
| |
|
Per Share Operating Performance: | | | | | | | | | | | | | | | | | | | | | | |
| Net asset value, beginning of year | | $ | | | 71.41 | | | | 50.65 | | | | 40.53 | | | | 31.34 | | | | 27.11 | |
| Income (loss) from investment operations: | | | | | | | | | | | | | | | | | | | | | | |
| Net investment income | | $ | | | 0.79 | | | | 0.48 | | | | 0.37 | | | | 0.43 | * | | | 0.10 | |
| Net realized and unrealized gain (loss) on investments | | $ | | | (39.21 | ) | | | 20.62 | | | | 10.16 | | | | 8.66 | | | | 4.13 | |
| Total from investment operations | | $ | | | (38.42 | ) | | | 21.10 | | | | 10.53 | | | | 9.09 | | | | 4.23 | |
| Less distributions from: | | | | | | | | | | | | | | | | | | | | | | |
| Net investment income | | $ | | | 0.37 | | | | 0.34 | | | | 0.41 | | | | — | | | | 0.01 | |
| Net realized gains on investments | | $ | | | 7.88 | | | | — | | | | — | | | | — | | | | — | |
| Total distributions | | $ | | | 8.25 | | | | 0.34 | | | | 0.41 | | | | — | | | | 0.01 | |
| Payment by affiliate | | $ | | | — | | | | — | | | | — | | | | 0.10 | | | | 0.01 | |
| Net asset value, end of year | | $ | | | 24.74 | | | | 71.41 | | | | 50.65 | | | | 40.53 | | | | 31.34 | |
Total Return(2) | | % | | | (59.78 | ) | | | 41.87 | | | | 26.14 | | | | 29.32 | †† | | | 15.66 | † |
| | | | | | | | | | | | | | | | | | | | | | | |
Ratios and Supplemental Data: | | | | | | | | | | | | | | | | | | | | | | |
| Net assets, end of year (000’s) | | $ | | | 43,443 | | | | 131,142 | | | | 82,245 | | | | 57,846 | | | | 61,166 | |
| Ratios to average net assets: | | | | | | | | | | | | | | | | | | | | | | |
Gross expenses prior to expense waiver/recoupment(3) | | % | | | 1.54 | | | | 1.45 | | | | 1.48 | | | | 1.49 | | | | 1.47 | |
Net expenses after expense waiver/recoupment(3)(4) | | % | | | 1.54 | | | | 1.45 | | | | 1.48 | | | | 1.49 | | | | 1.50 | |
Net investment income after expense waiver/recoupment(3)(4) | | % | | | 1.47 | | | | 0.81 | | | | 0.83 | | | | 1.18 | | | | 0.28 | |
| Portfolio turnover rate | | % | | | 84 | | | | 93 | | | | 85 | | | | 124 | | | | 106 | |
|
| | | | | | | |
| | | | | Class W |
| | | | | February 12,
|
| | | | | 2008(1) to
|
| | | | | October 31,
|
| | | | | 2008 |
| |
|
Per Share Operating Performance: | | | | | | |
| Net asset value, beginning of period | | $ | | | 50.70 | |
| Income (loss) from investment operations: | | | | | | |
| Net investment income | | $ | | | 0.50 | * |
| Net realized and unrealized loss on investments | | $ | | | (24.37 | ) |
| Total from investment operations | | $ | | | (23.87 | ) |
| Net asset value, end of period | | $ | | | 26.83 | |
Total Return(2) | | % | | | (47.08 | ) |
| | | | | | | |
| | | | | | | |
Ratios and Supplemental Data: | | | | | | |
| Net assets, end of period (000’s) | | $ | | | 10,366 | |
| Ratios to average net assets: | | | | | | |
Expenses(3) | | % | | | 1.29 | |
Net investment income(3) | | % | | | 1.80 | |
| Portfolio turnover rate | | % | | | 84 | |
|
| | |
| (1) | | Commencement of operations. |
| |
| (2) | | Total return is calculated assuming reinvestment of all dividends and capital gain distributions at net asset value and excluding the deduction of sales charges. |
| |
| (3) | | Annualized for periods less than one year. |
| |
| (4) | | The Investment Adviser has agreed to limit expenses, (excluding interest, taxes, brokerage commissions, extraordinary expenses and acquired fund fees and expenses) subject to possible recoupment by the Investment Adviser within three years of being incurred. |
| |
| * | | Calculated using average number of shares outstanding throughout the period. |
| |
| † | | In 2004, the Sub-Adviser fully reimbursed the Fund for a loss incurred from a transaction not meeting the Fund’s investment guidelines, which otherwise would have reduced total return by 0.07%. |
| |
| †† | | In 2005, 0.36% of the total return consists of a payment by affiliate. Excluding this item, total return would have been 28.96%. |
See Accompanying Notes to Financial Statements
126
ING International Value Fund
Financial Highlights
Selected data for a share of beneficial interest outstanding throughout each year.
| | | | | | | | | | | | | | | | | | | | | | | | | | | |
| | | | | | | Class A |
| | | | | | | Year Ended October 31, |
| | | | | | | 2008 | | 2007 | | 2006 | | 2005 | | 2004 |
| |
|
Per Share Operating Performance: | | | | | | | | | | | | | | | | | | | | | | | | | | |
| Net asset value, beginning of year | | $ | | | | | | | 23.15 | | | | 21.52 | | | | 18.33 | | | | 16.90 | | | | 13.71 | |
| Income (loss) from investment operations: | | | | | | | | | | | | | | | | | | | | | | | | | | |
| Net investment income | | $ | | | | | | | 0.39 | | | | 0.24 | * | | | 0.18 | * | | | 0.17 | | | | 0.13 | |
| Net realized and unrealized gain (loss) on investments | | $ | | | | | | | (8.83 | ) | | | 3.73 | | | | 4.58 | | | | 2.28 | | | | 3.15 | |
| Total from investment operations | | $ | | | | | | | (8.44 | ) | | | 3.97 | | | | 4.76 | | | | 2.45 | | | | 3.28 | |
| Less distributions from: | | | | | | | | | | | | | | | | | | | | | | | | | | |
| Net investment income | | $ | | | | | | | 0.23 | | | | 0.20 | | | | 0.16 | | | | 0.22 | | | | 0.09 | |
| Net realized gains on investments | | $ | | | | | | | 3.35 | | | | 2.14 | | | | 1.41 | | | | 0.80 | | | | — | |
| Total distributions | | $ | | | | | | | 3.58 | | | | 2.34 | | | | 1.57 | | | | 1.02 | | | | 0.09 | |
| Payment by affiliate | | $ | | | | | | | — | | | | — | | | | — | | | | 0.00 | ** | | | — | |
| Net asset value, end of year | | $ | | | | | | | 11.13 | | | | 23.15 | | | | 21.52 | | | | 18.33 | | | | 16.90 | |
Total Return(1) | | % | | | | | | | (42.58 | ) | | | 19.87 | | | | 27.64 | | | | 15.06 | † | | | 24.03 | |
| | | | | | | | | | | | | | | | | | | | | | | | | | | |
Ratios and Supplemental Data: | | | | | | | | | | | | | | | | | | | | | | | | | | |
| Net assets, end of year (000’s) | | $ | | | | | | | 931,162 | | | | 2,136,218 | | | | 1,995,027 | | | | 1,732,332 | | | | 1,869,868 | |
| Ratios to average net assets: | | | | | | | | | | | | | | | | | | | | | | | | | | |
| Gross expenses prior to brokerage commission recapture | | % | | | | | | | 1.58 | | | | 1.59 | | | | 1.60 | | | | 1.60 | | | | 1.61 | |
| Net expenses after brokerage commission recapture | | % | | | | | | | 1.57 | †† | | | 1.59 | | | | 1.60 | | | | 1.60 | | | | 1.61 | |
| Net investment income after brokerage commission recapture | | % | | | | | | | 1.95 | †† | | | 1.08 | | | | 0.90 | | | | 0.88 | | | | 0.79 | |
| Portfolio turnover rate | | % | | | | | | | 23 | | | | 32 | | | | 25 | | | | 21 | | | | 29 | |
|
| | | | | | | | | | | | | | | | | | | | | | | | | | | |
| | | | | | | Class B |
| | | | | | | Year Ended October 31, |
| | | | | | | 2008 | | 2007 | | 2006 | | 2005 | | 2004 |
| |
|
Per Share Operating Performance: | | | | | | | | | | | | | | | | | | | | | | | | | | |
| Net asset value, beginning of year | | $ | | | | | | | 22.64 | | | | 21.07 | | | | 17.95 | | | | 16.58 | | | | 13.45 | |
| Income (loss) from investment operations: | | | | | | | | | | | | | | | | | | | | | | | | | | |
| Net investment income (loss) | | $ | | | | | | | 0.19 | * | | | 0.08 | * | | | 0.04 | * | | | 0.05 | | | | 0.02 | |
| Net realized and unrealized gain (loss) on investments | | $ | | | | | | | (8.58 | ) | | | 3.66 | | | | 4.50 | | | | 2.23 | | | | 3.11 | |
| Total from investment operations | | $ | | | | | | | (8.39 | ) | | | 3.74 | | | | 4.54 | | | | 2.28 | | | | 3.13 | |
| Less distributions from: | | | | | | | | | | | | | | | | | | | | | | | | | | |
| Net investment income | | $ | | | | | | | 0.02 | | | | 0.03 | | | | 0.01 | | | | 0.11 | | | | — | |
| Net realized gains on investments | | $ | | | | | | | 3.35 | | | | 2.14 | | | | 1.41 | | | | 0.80 | | | | — | |
| Total distributions | | $ | | | | | | | 3.37 | | | | 2.17 | | | | 1.42 | | | | 0.91 | | | | — | |
| Payment by affiliate | | $ | | | | | | | — | | | | — | | | | — | | | | 0.00 | ** | | | — | |
| Net asset value, end of year | | $ | | | | | | | 10.88 | | | | 22.64 | | | | 21.07 | | | | 17.95 | | | | 16.58 | |
Total Return(1) | | % | | | | | | | (43.00 | ) | | | 19.03 | | | | 26.81 | | | | 14.21 | † | | | 23.27 | |
| | | | | | | | | | | | | | | | | | | | | | | | | | | |
| | | | | | | | | | | | | | | | | | | | | | | | | | | |
Ratios and Supplemental Data: | | | | | | | | | | | | | | | | | | | | | | | | | | |
| Net assets, end of year (000’s) | | $ | | | | | | | 85,873 | | | | 301,705 | | | | 368,952 | | | | 411,071 | | | | 454,952 | |
| Ratios to average net assets: | | | | | | | | | | | | | | | | | | | | | | | | | | |
| Gross expenses prior to brokerage commission recapture | | % | | | | | | | 2.28 | | | | 2.29 | | | | 2.30 | | | | 2.30 | | | | 2.31 | |
| Net expenses after brokerage commission recapture | | % | | | | | | | 2.27 | †† | | | 2.29 | | | | 2.30 | | | | 2.30 | | | | 2.31 | |
| Net investment income (loss) after brokerage commission recapture | | % | | | | | | | 1.12 | †† | | | 0.39 | | | | 0.20 | | | | 0.17 | | | | 0.09 | |
| Portfolio turnover rate | | % | | | | | | | 23 | | | | 32 | | | | 25 | | | | 21 | | | | 29 | |
|
| | |
| (1) | | Total return is calculated assuming reinvestment of all dividends and capital gain distributions at net asset value and excluding the deduction of sales charges. |
| |
| * | | Calculated using average number of shares outstanding throughout the period. |
| |
| ** | | Amount is less than $0.005. |
| |
| † | | In 2005, there was no impact on total return due to payment by affiliate. |
| |
| †† | | Impact of waiving the advisory fee for the ING Institutional Prime Money Market Fund holding has less than 0.01% impact on the expense ratio and net investment income or loss ratio. |
See Accompanying Notes to Financial Statements
127
ING International Value Fund (continued)
Financial Highlights
Selected data for a share of beneficial interest outstanding throughout each year.
| | | | | | | | | | | | | | | | | | | | | | | |
| | | | | Class C |
| | | | | Year Ended October 31, |
| | | | | 2008 | | 2007 | | 2006 | | 2005 | | 2004 |
| |
|
Per Share Operating Performance: | | | | | | | | | | | | | | | | | | | | | | |
| Net asset value, beginning of year | | $ | | | 22.52 | | | | 20.98 | | | | 17.91 | | | | 16.54 | | | | 13.42 | |
| Income (loss) from investment operations: | | | | | | | | | | | | | | | | | | | | | | |
| Net investment income | | $ | | | 0.27 | | | | 0.08 | * | | | 0.05 | | | | 0.04 | | | | 0.02 | |
| Net realized and unrealized gain (loss) on investments | | $ | | | (8.57 | ) | | | 3.65 | | | | 4.46 | | | | 2.24 | | | | 3.10 | |
| Total from investment operations | | $ | | | (8.30 | ) | | | 3.73 | | | | 4.51 | | | | 2.28 | | | | 3.12 | |
| Less distributions from: | | | | | | | | | | | | | | | | | | | | | | |
| Net investment income | | $ | | | 0.08 | | | | 0.05 | | | | 0.03 | | | | 0.11 | | | | — | |
| Net realized gains on investments | | $ | | | 3.35 | | | | 2.14 | | | | 1.41 | | | | 0.80 | | | | — | |
| Total distributions | | $ | | | 3.43 | | | | 2.19 | | | | 1.44 | | | | 0.91 | | | | — | |
| Payment by affiliate | | $ | | | — | | | | — | | | | — | | | | 0.00 | ** | | | — | |
| Net asset value, end of year | | $ | | | 10.79 | | | | 22.52 | | | | 20.98 | | | | 17.91 | | | | 16.54 | |
Total Return(1) | | % | | | (42.94 | ) | | | 19.10 | | | | 26.71 | | | | 14.25 | † | | | 23.25 | |
| | | | | | | | | | | | | | | | | | | | | | | |
Ratios and Supplemental Data: | | | | | | | | | | | | | | | | | | | | | | |
| Net assets, end of year (000’s) | | $ | | | 326,812 | | | | 757,941 | | | | 729,067 | | | | 663,626 | | | | 675,039 | |
| Ratios to average net assets: | | | | | | | | | | | | | | | | | | | | | | |
| Gross expenses prior to expense waiver and brokerage commission recapture | | % | | | 2.28 | | | | 2.29 | | | | 2.30 | | | | 2.30 | | | | 2.31 | |
| Net expenses after expense waiver and prior to brokerage commission recapture | | % | | | 2.18 | †† | | | 2.28 | | | | 2.30 | | | | 2.30 | | | | 2.31 | |
| Net expenses after expense waiver and brokerage commission recapture | | % | | | 2.17 | †† | | | 2.28 | | | | 2.30 | | | | 2.30 | | | | 2.31 | |
| Net investment income after expense waiver and brokerage commission recapture | | % | | | 1.34 | †† | | | 0.38 | | | | 0.20 | | | | 0.15 | | | | 0.09 | |
| Portfolio turnover rate | | % | | | 23 | | | | 32 | | | | 25 | | | | 21 | | | | 29 | |
|
| | | | | | | | | | | | | | | | | | | | | | | |
| | | | | Class I |
| | | | | Year Ended October 31, |
| | | | | 2008 | | 2007 | | 2006 | | 2005 | | 2004 |
| |
|
Per Share Operating Performance: | | | | | | | | | | | | | | | | | | | | | | |
| Net asset value, beginning of year | | $ | | | 23.22 | | | | 21.58 | | | | 18.38 | | | | 16.96 | | | | 13.74 | |
| Income (loss) from investment operations: | | | | | | | | | | | | | | | | | | | | | | |
| Net investment income | | $ | | | 0.47 | | | | 0.32 | * | | | 0.25 | | | | 0.20 | | | | 0.16 | |
| Net realized and unrealized gain (loss) on investments | | $ | | | (8.87 | ) | | | 3.74 | | | | 4.60 | | | | 2.31 | | | | 3.20 | |
| Total from investment operations | | $ | | | (8.40 | ) | | | 4.06 | | | | 4.85 | | | | 2.51 | | | | 3.36 | |
| Less distributions from: | | | | | | | | | | | | | | | | | | | | | | |
| Net investment income | | $ | | | 0.31 | | | | 0.28 | | | | 0.24 | | | | 0.29 | | | | 0.14 | |
| Net realized gains on investments | | $ | | | 3.35 | | | | 2.14 | | | | 1.41 | | | | 0.80 | | | | — | |
| Total distributions | | $ | | | 3.66 | | | | 2.42 | | | | 1.65 | | | | 1.09 | | | | 0.14 | |
| Payment by affiliate | | $ | | | — | | | | — | | | | — | | | | 0.00 | ** | | | — | |
| Net asset value, end of year | | $ | | | 11.16 | | | | 23.22 | | | | 21.58 | | | | 18.38 | | | | 16.96 | |
Total Return(1) | | % | | | (42.37 | ) | | | 20.31 | | | | 28.15 | | | | 15.42 | † | | | 24.67 | |
| | | | | | | | | | | | | | | | | | | | | | | |
Ratios and Supplemental Data: | | | | | | | | | | | | | | | | | | | | | | |
| Net assets, end of year (000’s) | | $ | | | 735,622 | | | | 2,176,402 | | | | 1,728,560 | | | | 1,221,594 | | | | 831,142 | |
| Ratios to average net assets: | | | | | | | | | | | | | | | | | | | | | | |
| Gross expenses prior to brokerage commission recapture | | % | | | 1.28 | | | | 1.23 | | | | 1.22 | | | | 1.23 | | | | 1.21 | |
| Net expenses after brokerage commission recapture | | % | | | 1.27 | †† | | | 1.23 | | | | 1.22 | | | | 1.23 | | | | 1.21 | |
| Net investment income after brokerage commission recapture | | % | | | 2.23 | †† | | | 1.45 | | | | 1.26 | | | | 1.18 | | | | 1.18 | |
| Portfolio turnover rate | | % | | | 23 | | | | 32 | | | | 25 | | | | 21 | | | | 29 | |
|
| | |
| (1) | | Total return is calculated assuming reinvestment of all dividends and capital gain distributions at net asset value and excluding the deduction of sales charges. |
| |
| * | | Calculated using average number of shares outstanding through the period. |
| |
| ** | | Amount is less than $0.005. |
| |
| † | | In 2005, there was no impact on total return due to payment by affiliate. |
| |
| †† | | Impact of waiving the advisory fee for the ING Institutional Prime Money Market Fund holding has less than 0.01% impact on the expense ratio and net investment income ratio. |
See Accompanying Notes to Financial Statements
128
ING International Value Fund (continued)
Financial Highlights
Selected data for a share of beneficial interest outstanding throughout each year.
| | | | | | | | | | | | | | | | | | | | | | | |
| | | | | Class Q |
| | | | | Year Ended October 31, |
| | | | | 2008 | | 2007 | | 2006 | | 2005 | | 2004 |
| |
|
Per Share Operating Performance: | | | | | | | | | | | | | | | | | | | | | | |
| Net asset value, beginning of year | | $ | | | 23.26 | | | | 21.57 | | | | 18.37 | | | | 16.94 | | | | 13.73 | |
| Income (loss) from investment operations: | | | | | | | | | | | | | | | | | | | | | | |
| Net investment income | | $ | | | 0.43 | | | | 0.31 | * | | | 0.21 | * | | | 0.19 | | | | 0.14 | |
| Net realized and unrealized gain (loss) on investments | | $ | | | (8.85 | ) | | | 3.74 | | | | 4.59 | | | | 2.29 | | | | 3.17 | |
| Total from investment operations | | $ | | | (8.42 | ) | | | 4.05 | | | | 4.80 | | | | 2.48 | | | | 3.31 | |
| Less distributions from: | | | | | | | | | | | | | | | | | | | | | | |
| Net investment income | | $ | | | 0.31 | | | | 0.22 | | | | 0.19 | | | | 0.25 | | | | 0.10 | |
| Net realized gains on investments | | $ | | | 3.35 | | | | 2.14 | | | | 1.41 | | | | 0.80 | | | | — | |
| Total distributions | | $ | | | 3.66 | | | | 2.36 | | | | 1.60 | | | | 1.05 | | | | 0.10 | |
| Payment by affiliate | | $ | | | — | | | | — | | | | — | | | | 0.00 | ** | | | — | |
| Net asset value, end of year | | $ | | | 11.18 | | | | 23.26 | | | | 21.57 | | | | 18.37 | | | | 16.94 | |
Total Return(1) | | % | | | (42.38 | ) | | | 20.25 | | | | 27.82 | | | | 15.20 | † | | | 24.32 | |
| | | | | | | | | | | | | | | | | | | | | | | |
Ratios and Supplemental Data: | | | | | | | | | | | | | | | | | | | | | | |
| Net assets, end of year (000’s) | | $ | | | 12,643 | | | | 26,512 | | | | 26,383 | | | | 27,993 | | | | 28,862 | |
| Ratios to average net assets: | | | | | | | | | | | | | | | | | | | | | | |
| Gross expenses prior to expense waiver and brokerage commission recapture | | % | | | 1.53 | | | | 1.48 | | | | 1.47 | | | | 1.48 | | | | 1.46 | |
| Net expenses after expense waiver and prior to brokerage commission recapture | | % | | | 1.28 | †† | | | 1.27 | | | | 1.47 | | | | 1.48 | | | | 1.46 | |
| Net expenses after expense waiver and brokerage commission recapture | | % | | | 1.27 | †† | | | 1.27 | | | | 1.47 | | | | 1.48 | | | | 1.46 | |
| Net investment income after expense waiver brokerage commission recapture | | % | | | 2.30 | †† | | | 1.40 | | | | 1.06 | | | | 0.99 | | | | 0.89 | |
| Portfolio turnover rate | | % | | | 23 | | | | 32 | | | | 25 | | | | 21 | | | | 29 | |
|
| | |
| (1) | | Total return is calculated assuming reinvestment of all dividends and capital gain distributions at net asset value and excluding the deduction of sales charges. |
| |
| * | | Calculated using average number of shares outstanding throughout the period. |
| |
| ** | | Amount is less than $0.005. |
| |
| † | | In 2005, there was no impact on total return due to payment by affiliate. |
| |
| †† | | Impact of waiving the advisory fee for the ING Institutional Prime Money Market Fund holding has less than 0.01% impact on the expense ratio and net investment income ratio. |
See Accompanying Notes to Financial Statements
129
ING International Value Choice Fund
Financial Highlights
Selected data for a share of beneficial interest outstanding throughout each period.
| | | | | | | | | | | | | | | | | | | |
| | | | | Class A |
| | | | | | | | | | | February 1,
|
| | | | | Year Ended
| | 2005(1) to
|
| | | | | October 31, | | October 31,
|
| | | | | 2008 | | 2007 | | 2006 | | 2005 |
| |
|
Per Share Operating Performance: | | | | | | | | | | | | | | | | | | |
| Net asset value, beginning of period | | $ | | | 14.89 | | | | 12.42 | | | | 10.70 | | | | 10.00 | |
| Income (loss) from investment operations: | | | | | | | | | | | | | | | | | | |
| Net investment income | | $ | | | 0.06 | | | | 0.10 | * | | | 0.12 | * | | | 0.11 | * |
| Net realized and unrealized gain (loss) on investments | | $ | | | (5.31 | ) | | | 2.65 | | | | 1.86 | | | | 0.59 | |
| Total from investment operations | | $ | | | (5.25 | ) | | | 2.75 | | | | 1.98 | | | | 0.70 | |
| Less distributions from: | | | | | | | | | | | | | | | | | | |
| Net investment income | | $ | | | 0.10 | | | | 0.07 | | | | 0.10 | | | | — | |
| Net realized gains on investments | | $ | | | 1.98 | | | | 0.21 | | | | 0.16 | | | | — | |
| Total distributions | | $ | | | 2.08 | | | | 0.28 | | | | 0.26 | | | | — | |
| Net asset value, end of period | | $ | | | 7.56 | | | | 14.89 | | | | 12.42 | | | | 10.70 | |
Total Return(2) | | % | | | (40.21 | ) | | | 22.48 | | | | 18.82 | | | | 7.00 | |
| | | | | | | | | | | | | | | | | | | |
| | | | | | | | | | | | | | | | | | | |
Ratios and Supplemental Data: | | | | | | | | | | | | | | | | | | |
| Net assets, end of period (000’s) | | $ | | | 8,940 | | | | 16,598 | | | | 17,962 | | | | 6,115 | |
| Ratios to average net assets: | | | | | | | | | | | | | | | | | | |
Gross expenses prior to expense waiver/recoupment and brokerage commission recapture(3) | | % | | | 1.62 | | | | 1.63 | | | | 1.71 | | | | 3.44 | |
Net expenses after expense waiver/recoupment and prior to brokerage commission recapture(3)(4) | | % | | | 1.65 | † | | | 1.70 | | | | 1.70 | | | | 1.70 | |
Net expenses after expense waiver/recoupment and brokerage commission recapture(3)(4) | | % | | | 1.64 | † | | | 1.70 | | | | 1.69 | | | | 1.70 | |
Net investment income after expense waiver/recoupment and brokerage commission recapture(3)(4) | | % | | | 0.52 | † | | | 0.77 | | | | 1.04 | | | | 1.08 | |
| Portfolio turnover rate | | % | | | 73 | | | | 88 | | | | 31 | | | | 24 | |
|
| | |
| (1) | | Commencement of operations. |
| (2) | | Total return is calculated assuming reinvestment of all dividends and capital gain distributions at net asset value and excluding the deduction of sales charges. Total return for less than one year is not annualized. |
| (3) | | Annualized for periods less than one year. |
| (4) | | The Investment Adviser has agreed to limit expenses, (excluding interest, taxes, brokerage commissions, extraordinary expenses and acquired fund fees and expenses) subject to possible recoupment by the Investment Adviser within three years of being incurred. |
| * | | Calculated using average number of shares outstanding throughout the period. |
| † | | Impact of waiving the advisory fee for the ING Institutional Prime Money Market Fund holding has less than 0.01% impact on the expense ratio and net investment income ratio. |
See Accompanying Notes to Financial Statements
130
ING International Value Choice Fund (continued)
Financial Highlights
Selected data for a share of beneficial interest outstanding throughout each period.
| | | | | | | | | | | | | | | | | | | |
| | | | | Class B |
| | | | | | | | | | | February 1,
|
| | | | | Year Ended
| | 2005(1) to
|
| | | | | October 31, | | October 31,
|
| | | | | 2008 | | 2007 | | 2006 | | 2005 |
| |
|
Per Share Operating Performance: | | | | | | | | | | | | | | | | | | |
| Net asset value, beginning of period | | $ | | | 14.67 | | | | 12.27 | | | | 10.65 | | | | 10.00 | |
| Income (loss) from investment operations: | | | | | | | | | | | | | | | | | | |
| Net investment income (loss) | | $ | | | (0.03 | )* | | | 0.00 | * ** | | | 0.04 | * | | | 0.04 | * |
| Net realized and unrealized gain (loss) on investments | | $ | | | (5.22 | ) | | | 2.61 | | | | 1.82 | | | | 0.61 | |
| Total from investment operations | | $ | | | (5.25 | ) | | | 2.61 | | | | 1.86 | | | | 0.65 | |
| Less distributions from: | | | | | | | | | | | | | | | | | | |
| Net investment income | | $ | | | 0.00 | ** | | | — | | | | 0.08 | | | | — | |
| Net realized gains on investments | | $ | | | 1.98 | | | | 0.21 | | | | 0.16 | | | | — | |
| Total distributions | | $ | | | 1.98 | | | | 0.21 | | | | 0.24 | | | | — | |
| Net asset value, end of period | | $ | | | 7.44 | | | | 14.67 | | | | 12.27 | | | | 10.65 | |
Total Return(2) | | % | | | (40.63 | ) | | | 21.54 | | | | 17.77 | | | | 6.50 | |
| | | | | | | | | | | | | | | | | | | |
| | | | | | | | | | | | | | | | | | | |
Ratios and Supplemental Data: | | | | | | | | | | | | | | | | | | |
| Net assets, end of period (000’s) | | $ | | | 1,738 | | | | 3,805 | | | | 3,565 | | | | 1,427 | |
| Ratios to average net assets: | | | | | | | | | | | | | | | | | | |
Gross expenses prior to expense waiver/recoupment and brokerage commission recapture(3) | | % | | | 2.37 | | | | 2.38 | | | | 2.46 | | | | 4.19 | |
Net expenses after expense waiver/recoupment and prior to brokerage commission recapture(3)(4) | | % | | | 2.40 | † | | | 2.45 | | | | 2.45 | | | | 2.45 | |
Net expenses after expense waiver/recoupment and brokerage commission recapture(3)(4) | | % | | | 2.39 | † | | | 2.45 | | | | 2.44 | | | | 2.45 | |
Net investment income (loss) after expense waiver/recoupment and brokerage commission recapture(3)(4) | | % | | | (0.27 | )† | | | 0.01 | | | | 0.35 | | | | 0.36 | |
| Portfolio turnover rate | | % | | | 73 | | | | 88 | | | | 31 | | | | 24 | |
|
| | |
| (1) | | Commencement of operations. |
| (2) | | Total return is calculated assuming reinvestment of all dividends and capital gain distributions at net asset value and excluding the deduction of sales charges. Total return for less than one year is not annualized. |
| (3) | | Annualized for periods less than one year. |
| (4) | | The Investment Adviser has agreed to limit expenses, (excluding interest, taxes, brokerage commissions, extraordinary expenses and acquired fund fees and expenses) subject to possible recoupment by the Investment Adviser within three years of being incurred. |
| * | | Calculated using average number of shares outstanding throughout the period. |
| ** | | Amount is less than $0.005. |
| † | | Impact of waiving the advisory fee for the ING Institutional Prime Money Market Fund holding has less than 0.01% impact on the expense ratio and net investment income ratio. |
See Accompanying Notes to Financial Statements
131
ING International Value Choice Fund (continued)
Financial Highlights
Selected data for a share of beneficial interest outstanding throughout each period.
| | | | | | | | | | | | | | | | | | | |
| | | | | Class C |
| | | | | | | | | | | February 4,
|
| | | | | Year Ended
| | 2005(1) to
|
| | | | | October 31, | | October 31,
|
| | | | | 2008 | | 2007 | | 2006 | | 2005 |
| |
|
Per Share Operating Performance: | | | | | | | | | | | | | | | | | | |
| Net asset value, beginning of period | | $ | | | 14.70 | | | | 12.29 | | | | 10.66 | | | | 10.01 | |
| Income (loss) from investment operations: | | | | | | | | | | | | | | | | | | |
| Net investment income (loss) | | $ | | | (0.03 | )* | | | 0.00 | ** | | | 0.04 | * | | | 0.04 | * |
| Net realized and unrealized gain (loss) on investments | | $ | | | (5.23 | ) | | | 2.62 | | | | 1.83 | | | | 0.61 | |
| Total from investment operations | | $ | | | (5.26 | ) | | | 2.62 | | | | 1.87 | | | | 0.65 | |
| Less distributions from: | | | | | | | | | | | | | | | | | | |
| Net investment income | | $ | | | — | | | | — | | | | 0.08 | | | | — | |
| Net realized gains on investments | | $ | | | 1.98 | | | | 0.21 | | | | 0.16 | | | | — | |
| Total distributions | | $ | | | 1.98 | | | | 0.21 | | | | 0.24 | | | | — | |
| Net asset value, end of period | | $ | | | 7.46 | | | | 14.70 | | | | 12.29 | | | | 10.66 | |
Total Return(2) | | % | | | (40.62 | ) | | | 21.58 | | | | 17.78 | | | | 6.49 | |
| | | | | | | | | | | | | | | | | | | |
| | | | | | | | | | | | | | | | | | | |
Ratios and Supplemental Data: | | | | | | | | | | | | | | | | | | |
| Net assets, end of period (000’s) | | $ | | | 2,267 | | | | 4,930 | | | | 4,189 | | | | 1,796 | |
| Ratios to average net assets: | | | | | | | | | | | | | | | | | | |
Gross expenses prior to expense waiver and brokerage commission recapture(3) | | % | | | 2.37 | | | | 2.38 | | | | 2.46 | | | | 4.19 | |
Net expenses after expense waiver and prior to brokerage commission recapture(3)(4) | | % | | | 2.40 | † | | | 2.45 | | | | 2.45 | | | | 2.45 | |
Net expenses after expense waiver and brokerage commission recapture(3)(4) | | % | | | 2.39 | † | | | 2.45 | | | | 2.44 | | | | 2.45 | |
Net investment income (loss) after expense waiver and brokerage commission recapture(3)(4) | | % | | | (0.25 | )† | | | 0.00 | ** | | | 0.33 | | | | 0.35 | |
| Portfolio turnover rate | | % | | | 73 | | | | 88 | | | | 31 | | | | 24 | |
|
| | |
| (1) | | Commencement of operations. |
| |
| (2) | | Total return is calculated assuming reinvestment of all dividends and capital gain distributions at net asset value and excluding the deduction of sales charges. Total return for less than one year is not annualized. |
| |
| (3) | | Annualized for periods less than one year. |
| |
| (4) | | The Investment Adviser has agreed to limit expenses, (excluding interest, taxes, brokerage commissions, extraordinary expenses and acquired fund fees and expenses) subject to possible recoupment by the Investment Adviser within three years of being incurred. |
| |
| * | | Calculated using average number of shares outstanding throughout the period. |
| |
| ** | | Amount is less than $0.005 or 0.005%. |
| † | | Impact of waiving the advisory fee for the ING Institutional Prime Money Market Fund holding has less than 0.01% impact on the expense ratio and net investment income ratio. |
See Accompanying Notes to Financial Statements
132
ING International Value Choice Fund (continued)
Financial Highlights
Selected data for a share of beneficial interest outstanding throughout each period.
| | | | | | | | | | | | | | | |
| | | | | Class I |
| | | | | | | | | December 21,
|
| | | | | Year Ended
| | 2005(1) to
|
| | | | | October 31, | | October 31,
|
| | | | | 2008 | | 2007 | | 2006 |
| |
|
Per Share Operating Performance: | | | | | | | | | | | | | | |
| Net asset value, beginning of period | | $ | | | 14.92 | | | | 12.42 | | | | 11.04 | |
| Income (loss) from investment operations: | | | | | | | | | | | | | | |
| Net investment income | | $ | | | 0.09 | | | | 0.17 | * | | | 0.16 | * |
| Net realized and unrealized gain (loss) on investments | | $ | | | (5.30 | ) | | | 2.64 | | | | 1.22 | |
| Total from investment operations | | $ | | | (5.21 | ) | | | 2.81 | | | | 1.38 | |
| Less distributions from: | | | | | | | | | | | | | | |
| Net investment income | | $ | | | 0.16 | | | | 0.10 | | | | — | |
| Net realized gains on investments | | $ | | | 1.98 | | | | 0.21 | | | | — | |
| Total distributions | | $ | | | 2.14 | | | | 0.31 | | | | — | |
| Net asset value, end of period | | $ | | | 7.57 | | | | 14.92 | | | | 12.42 | |
Total Return(2) | | % | | | (39.96 | ) | | | 23.04 | | | | 12.50 | |
| | | | | | | | | | | | | | | |
| | | | | | | | | | | | | | | |
Ratios and Supplemental Data: | | | | | | | | | | | | | | |
| Net assets, end of period (000’s) | | $ | | | 36,089 | | | | 60,413 | | | | 36,899 | |
| Ratios to average net assets: | | | | | | | | | | | | | | |
Gross expenses prior to expense waiver and brokerage commission recapture(3) | | % | | | 1.27 | | | | 1.24 | | | | 1.36 | |
Net expenses after expense waiver and prior to brokerage commission recapture(3)(4) | | % | | | 1.30 | † | | | 1.31 | | | | 1.35 | |
Net expenses after expense waiver and brokerage commission recapture(3)(4) | | % | | | 1.29 | † | | | 1.31 | | | | 1.34 | |
Net investment income after expense waiver and brokerage commission recapture(3)(4) | | % | | | 0.80 | † | | | 1.29 | | | | 1.56 | |
| Portfolio turnover rate | | % | | | 73 | | | | 88 | | | | 31 | |
|
| | |
| (1) | | Commencement of operations. |
| |
| (2) | | Total return is calculated assuming reinvestment of all dividends and capital gain distributions at net asset value and excluding the deduction of sales charges. Total return for less than one year is not annualized. |
| |
| (3) | | Annualized for periods less than one year. |
| |
| (4) | | The Investment Adviser has agreed to limit expenses, (excluding interest, taxes, brokerage commissions, extraordinary expenses and acquired fund fees and expenses) subject to possible recoupment by the Investment Adviser within three years of being incurred. |
| |
| * | | Calculated using average number of shares outstanding throughout the period. |
| † | | Impact of waiving the advisory fee for the ING Institutional Prime Money Market Fund holding has less than 0.01% impact on the expense ratio and net investment income ratio. |
See Accompanying Notes to Financial Statements
133
ING Russia Fund
Financial Highlights
Selected data for a share of beneficial interest outstanding throughout each year.
| | | | | | | | | | | | | | | | | | | | | | | |
| | | | | Class A |
| | | | | Year Ended October 31, |
| | | | | 2008 | | 2007 | | 2006 | | 2005 | | 2004 |
| |
|
Per Share Operating Performance: | | | | | | | | | | | | | | | | | | | | | | |
| Net asset value, beginning of year | | $ | | | 78.13 | | | | 55.81 | | | | 33.49 | | | | 25.01 | | | | 19.13 | |
| Income (loss) from investment operations: | | | | | | | | | | | | | | | | | | | | | | |
| Net investment income (loss) | | $ | | | (0.48 | ) | | | (0.33 | )* | | | (0.27 | ) | | | (0.00 | )** | | | 0.04 | |
| Net realized and unrealized gain (loss) on investments | | $ | | | (40.46 | ) | | | 25.77 | | | | 22.37 | | | | 8.39 | | | | 5.69 | |
| Total from investment operations | | $ | | | (40.94 | ) | | | 25.44 | | | | 22.10 | | | | 8.39 | | | | 5.73 | |
| Less distributions from: | | | | | | | | | | | | | | | | | | | | | | |
| Net investment income | | $ | | | — | | | | — | | | | — | | | | 0.01 | | | | 0.02 | |
| Net realized gains on investments | | $ | | | 11.59 | | | | 3.12 | | | | — | | | | — | | | | — | |
| Total distributions | | $ | | | 11.59 | | | | 3.12 | | | | — | | | | 0.01 | | | | 0.02 | |
| Redemption fees applied to capital | | $ | | | 0.00 | ** | | | 0.00 | ** | | | 0.22 | | | | 0.10 | | | | 0.17 | |
| Net asset value, end of year | | $ | | | 25.60 | | | | 78.13 | | | | 55.81 | | | | 33.49 | | | | 25.01 | |
Total Return(1) | | % | | | (61.70 | ) | | | 47.16 | | | | 66.65 | | | | 33.98 | | | | 30.88 | |
| | | | | | | | | | | | | | | | | | | | | | | |
| | | | | | | | | | | | | | | | | | | | | | | |
Ratios and Supplemental Data: | | | | | | | | | | | | | | | | | | | | | | |
| Net assets, end of year (000’s) | | $ | | | 261,127 | | | | 922,504 | | | | 751,947 | | | | 271,603 | | | | 212,180 | |
| Ratios to average net assets: | | | | | | | | | | | | | | | | | | | | | | |
| Expenses | | % | | | 2.06 | | | | 1.96 | | | | 1.98 | | | | 2.13 | | | | 2.01 | |
| Net investment income (loss) | | % | | | (0.60 | ) | | | (0.52 | ) | | | (0.64 | ) | | | (0.01 | ) | | | 0.15 | |
| Portfolio turnover rate | | % | | | 43 | | | | 12 | | | | 20 | | | | 26 | | | | 54 | |
|
| | |
| (1) | | Total return is calculated assuming reinvestment of all dividends and capital gain distributions at net asset value and excluding the deduction of sales charges. |
| |
| * | | Calculated using average number of shares outstanding throughout the period. |
| |
| ** | | Amount is more than $(0.005) or less than $0.005. |
See Accompanying Notes to Financial Statements
134
ING Emerging Markets Fixed Income Fund
Financial Highlights
Selected data for a share of beneficial interest outstanding throughout each period.
| | | | | | | | | | | | | | | | | | | | | | | | | | | |
| | | | | Class A | | Class B |
| | | | | | | | | December 21,
| | | | | | January 4,
|
| | | | | Year Ended
| | 2005(1) to
| | Year Ended
| | 2006(1) to
|
| | | | | October 31, | | October 31,
| | October 31, | | October 31,
|
| | | | | 2008 | | 2007 | | 2006 | | 2008 | | 2007 | | 2006 |
| |
|
Per Share Operating Performance: | | | | | | | | | | | | | | | | | | | | | | | | | | |
| Net asset value, beginning of period | | $ | | | 10.39 | | | | 10.33 | | | | 10.00 | | | | 10.36 | | | | 10.30 | | | | 10.15 | |
| Income (loss) from investment operations: | | | | | | | | | | | | | | | | | | | | | | | | | | |
| Net investment income | | $ | | | 0.72 | | | | 0.66 | * | | | 0.64 | * | | | 0.58 | | | | 0.54 | * | | | 0.59 | * |
| Net realized and unrealized gain (loss) on investments | | $ | | | (3.77 | ) | | | 0.06 | | | | 0.26 | | | | (3.69 | ) | | | 0.10 | | | | 0.09 | |
| Total from investment operations | | $ | | | (3.05 | ) | | | 0.72 | | | | 0.90 | | | | (3.11 | ) | | | 0.64 | | | | 0.68 | |
| Less distributions from: | | | | | | | | | | | | | | | | | | | | | | | | | | |
| Net investment income | | $ | | | 0.45 | | | | 0.63 | | | | 0.57 | | | | 0.38 | | | | 0.55 | | | | 0.53 | |
| Net realized gains on investments | | $ | | | — | | | | 0.03 | | | | — | | | | — | | | | 0.03 | | | | — | |
| Return of capital | | $ | | | 0.18 | | | | — | | | | — | | | | 0.18 | | | | — | | | | — | |
| Total distributions | | $ | | | 0.63 | | | | 0.66 | | | | 0.57 | | | | 0.56 | | | | 0.58 | | | | 0.53 | |
| Net asset value, end of period | | $ | | | 6.71 | | | | 10.39 | | | | 10.33 | | | | 6.69 | | | | 10.36 | | | | 10.30 | |
Total Return(2) | | % | | | (31.16 | ) | | | 7.18 | | | | 9.28 | | | | (31.67 | ) | | | 6.40 | | | | 6.92 | |
| | | | | | | | | | | | | | | | | | | | | | | | | | | |
| | | | | | | | | | | | | | | | | | | | | | | | | | | |
Ratios and Supplemental Data: | | | | | | | | | | | | | | | | | | | | | | | | | | |
| Net assets, end of period (000’s) | | $ | | | 2,779 | | | | 10,539 | | | | 26,121 | | | | 210 | | | | 404 | | | | 293 | |
| Ratios to average net assets: | | | | | | | | | | | | | | | | | | | | | | | | | | |
Gross expenses prior to expense waiver/recoupment(4) | | % | | | 1.15 | | | | 1.12 | | | | 2.41 | | | | 1.90 | | | | 1.87 | | | | 3.16 | |
Net expenses after expense waiver/recoupment(3)(4) | | % | | | 1.15 | | | | 1.20 | | | | 1.25 | | | | 1.90 | | | | 1.95 | | | | 2.00 | |
Net investment income after expense waiver/recoupment(3)(4) | | % | | | 6.49 | | | | 6.39 | | | | 7.36 | | | | 5.80 | | | | 5.22 | | | | 6.91 | |
| Portfolio turnover rate | | % | | | 61 | | | | 29 | | | | 56 | | | | 61 | | | | 29 | | | | 56 | |
|
| | | | | | | | | | | | | | | | | | | | | | | | | | | | | | | |
| | | | | Class C | | Class I |
| | | | | | | | | March 1,
| | Year
| | December 20,
| | May 1,
| | February 7,
|
| | | | | Year Ended
| | 2006(1) to
| | Ended
| | 2006(5) to
| | 2006 to
| | 2006(1) to
|
| | | | | October 31, | | October 31,
| | October 31,
| | October 31,
| | August 24,
| | April 30,
|
| | | | | 2008 | | 2007 | | 2006 | | 2008 | | 2007 | | 2006(5) | | 2006 |
| |
|
Per Share Operating Performance: | | | | | | | | | | | | | | | | | | | | | | | | | | | | | | |
| Net asset value, beginning of period | | $ | | | 10.35 | | | | 10.29 | | | | 10.43 | | | | 10.36 | | | | 10.48 | | | | 10.18 | | | | 10.24 | |
| Income (loss) from investment operations: | | | | | | | | | | | | | | | | | | | | | | | | | | | | | | |
| Net investment income | | $ | | | 0.59 | | | | 0.53 | | | | 0.61 | * | | | 0.65 | | | | 0.54 | | | | 0.26 | * | | | 0.28 | * |
| Net realized and unrealized gain (loss) on investments | | $ | | | (3.70 | ) | | | 0.11 | | | | (0.34 | ) | | | (3.66 | ) | | | (0.11 | ) | | | (0.28 | ) | | | (0.19 | ) |
| Total from investment operations | | $ | | | (3.11 | ) | | | 0.64 | | | | 0.27 | | | | (3.01 | ) | | | 0.43 | | | | (0.02 | ) | | | 0.09 | |
| Less distributions from: | | | | | | | | | | | | | | | | | | | | | | | | | | | | | | |
| Net investment income | | $ | | | 0.38 | | | | 0.55 | | | | 0.41 | | | | 0.48 | | | | 0.55 | | | | 0.06 | | | | 0.15 | |
| Net realized gains on investments | | $ | | | — | | | | 0.03 | | | | — | | | | — | | | | — | | | | — | | | | — | |
| Return of capital | | $ | | | 0.18 | | | | — | | | | — | | | | 0.18 | | | | — | | | | — | | | | — | |
| Total distributions | | $ | | | 0.56 | | | | 0.58 | | | | 0.41 | | | | 0.66 | | | | 0.55 | | | | 0.06 | | | | 0.15 | |
| Net asset value, end of period | | $ | | | 6.68 | | | | 10.35 | | | | 10.29 | | | | 6.69 | | | | 10.36 | | | | 10.10 | | | | 10.18 | |
Total Return(2) | | % | | | (31.69 | ) | | | 6.41 | | | | 2.75 | | | | (30.95 | ) | | | 4.25 | | | | (0.15 | ) | | | 0.91 | |
| | | | | | | | | | | | | | | | | | | | | | | | | | | | | | | |
| | | | | | | | | | | | | | | | | | | | | | | | | | | | | | | |
Ratios and Supplemental Data: | | | | | | | | | | | | | | | | | | | | | | | | | | | | | | |
| Net assets, end of period (000’s) | | $ | | | 1,018 | | | | 1,564 | | | | 344 | | | | 228,274 | | | | 303,156 | | | | 13 | | | | 13 | |
| Ratios to average net assets: | | | | | | | | | | | | | | | | | | | | | | | | | | | | | | |
Gross expenses prior to expense waiver/recoupment(4) | | % | | | 1.90 | | | | 1.87 | | | | 3.16 | | | | 0.86 | | | | 0.84 | | | | 2.33 | | | | 2.65 | |
Net expenses after expense waiver/recoupment(3)(4) | | % | | | 1.90 | | | | 1.95 | | | | 2.00 | | | | 0.86 | | | | 0.92 | | | | 1.06 | | | | 1.00 | |
Net investment income after expense waiver/recoupment(3)(4) | | % | | | 5.81 | | | | 4.87 | | | | 7.09 | | | | 6.86 | | | | 5.36 | | | | 8.32 | | | | 7.79 | |
| Portfolio turnover rate | | % | | | 61 | | | | 29 | | | | 56 | | | | 61 | | | | 29 | | | | 29 | | | | 26 | |
|
| | |
| (1) | | Commencement of operations. |
| |
| (2) | | Total return is calculated assuming reinvestment of dividends and capital gain distributions at net asset value and excluding the deduction of sales charges. Total return for less than one year is not annualized. |
| |
| (3) | | The Investment Adviser has agreed to limit expenses, (excluding interest, taxes, brokerage commissions, extraordinary expenses and acquired fund fees and expenses) subject to possible recoupment by the Investment Adviser within three years of being incurred. |
| |
| (4) | | Annualized for periods less than one year. |
| |
| (5) | | Class I was fully redeemed on August 25, 2006 and re-commenced operations on December 20, 2006. |
| |
| * | | Calculated using average number of shares outstanding throughout the period. |
See Accompanying Notes to Financial Statements
135
ING Global Bond Fund
Financial Highlights
Selected data for a share of beneficial interest outstanding throughout each period.
| | | | | | | | | | | | | | | | | | | | | | | | | | | |
| | | | | Class A | | Class B |
| | | | | | | | | June 30,
| | | | | | June 30,
|
| | | | | Year Ended
| | 2006(1) to
| | Year Ended
| | 2006(1) to
|
| | | | | October 31, | | October 31,
| | October 31, | | October 31,
|
| | | | | 2008 | | 2007 | | 2006 | | 2008 | | 2007 | | 2006 |
| |
|
Per Share Operating Performance: | | | | | | | | | | | | | | | | | | | | | | | | | | |
| Net asset value, beginning of period | | $ | | | 10.59 | | | | 10.25 | | | | 10.00 | | | | 10.55 | | | | 10.24 | | | | 10.00 | |
| Income from investment operations: | | | | | | | | | | | | | | | | | | | | | | | | | | |
| Net investment income | | $ | | | 0.27 | * | | | 0.31 | * | | | 0.08 | * | | | 0.18 | * | | | 0.25 | * | | | 0.06 | * |
| Net realized and unrealized gain on investments | | $ | | | 0.07 | | | | 0.64 | | | | 0.23 | | | | 0.08 | | | | 0.62 | | | | 0.22 | |
| Total from investment operations | | $ | | | 0.34 | | | | 0.95 | | | | 0.31 | | | | 0.26 | | | | 0.87 | | | | 0.28 | |
| Less distributions from: | | | | | | | | | | | | | | | | | | | | | | | | | | |
| Net investment income | | $ | | | 0.62 | | | | 0.43 | | | | 0.06 | | | | 0.53 | | | | 0.38 | | | | 0.04 | |
| Net realized gains on investments | | $ | | | 0.12 | | | | 0.18 | | | | — | | | | 0.12 | | | | 0.18 | | | | — | |
| Total distributions | | $ | | | 0.74 | | | | 0.61 | | | | 0.06 | | | | 0.65 | | | | 0.56 | | | | 0.04 | |
| Net asset value, end of period | | $ | | | 10.19 | | | | 10.59 | | | | 10.25 | | | | 10.16 | | | | 10.55 | | | | 10.24 | |
Total Return(2) | | % | | | 3.04 | | | | 9.61 | | | | 3.13 | | | | 2.26 | | | | 8.74 | | | | 2.84 | |
| | | | | | | | | | | | | | | | | | | | | | | | | | | |
| | | | | | | | | | | | | | | | | | | | | | | | | | | |
Ratios and Supplemental Data: | | | | | | | | | | | | | | | | | | | | | | | | | | |
| Net assets, end of period (000’s) | | $ | | | 79,451 | | | | 28,887 | | | | 25,784 | | | | 4,085 | | | | 342 | | | | 28 | |
| Ratios to average net assets: | | | | | | | | | | | | | | | | | | | | | | | | | | |
Gross expenses prior to expense waiver(3) | | % | | | 1.05 | | | | 1.46 | | | | 1.38 | | | | 1.80 | | | | 2.21 | | | | 2.13 | |
Net expenses after expense waiver(3)(4) | | % | | | 0.93 | † | | | 0.90 | † | | | 0.90 | | | | 1.68 | † | | | 1.65 | † | | | 1.65 | |
Net investment income after expense waiver(3)(4) | | % | | | 2.53 | † | | | 3.08 | | | | 2.41 | | | | 1.71 | | | | 2.44 | | | | 2.00 | |
| Portfolio turnover rate | | % | | | 830 | | | | 858 | | | | 451 | | | | 830 | | | | 858 | | | | 451 | |
|
| | | | | | | | | | | | | | | | | | | | | | | | | | | | | | | |
| | | | | Class C | | Class I | | Class O |
| | | | | | | | | June 30,
| | | | | | June 30,
| | June 4,
|
| | | | | Year Ended
| | 2006(1) to
| | Year Ended
| | 2006(1) to
| | 2008(1) to
|
| | | | | October 31, | | October 31,
| | October 31, | | October 31,
| | October 31,
|
| | | | | 2008 | | 2007 | | 2006 | | 2008 | | 2007 | | 2006 | | 2008 |
| |
|
Per Share Operating Performance: | | | | | | | | | | | | | | | | | | | | | | | | | | | | | | |
| Net asset value, beginning of period | | $ | | | 10.59 | | | | 10.24 | | | | 10.00 | | | | 10.58 | | | | 10.25 | | | | 10.00 | | | | 10.65 | |
| Income (loss) from investment operations: | | | | | | | | | | | | | | | | | | | | | | | | | | | | | | |
| Net investment income | | $ | | | 0.18 | * | | | 0.24 | * | | | 0.06 | * | | | 0.28 | * | | | 0.35 | * | | | 0.09 | * | | | 0.10 | * |
| Net realized and unrealized gain (loss) on investments | | $ | | | 0.09 | | | | 0.64 | | | | 0.22 | | | | 0.14 | | | | 0.63 | | | | 0.23 | | | | (0.49) | |
| Total from investment operations | | $ | | | 0.27 | | | | 0.88 | | | | 0.28 | | | | 0.42 | | | | 0.98 | | | | 0.32 | | | | (0.39) | |
| Less distributions from: | | | | | | | | | | | | | | | | | | | | | | | | | | | | | | |
| Net investment income | | $ | | | 0.54 | | | | 0.35 | | | | 0.04 | | | | 0.67 | | | | 0.47 | | | | 0.07 | | | | 0.11 | |
| Net realized gains on investments | | $ | | | 0.12 | | | | 0.18 | | | | — | | | | 0.12 | | | | 0.18 | | | | — | | | | — | |
| Total distributions | | $ | | | 0.66 | | | | 0.53 | | | | 0.04 | | | | 0.79 | | | | 0.65 | | | | 0.07 | | | | 0.11 | |
| Net asset value, end of period | | $ | | | 10.20 | | | | 10.59 | | | | 10.24 | | | | 10.21 | | | | 10.58 | | | | 10.25 | | | | 10.15 | |
Total Return(2) | | % | | | 2.31 | | | | 8.90 | | | | 2.82 | | | | 3.78 | | | | 9.88 | | | | 3.23 | | | | (3.70) | |
| | | | | | | | | | | | | | | | | | | | | | | | | | | | | | | |
| | | | | | | | | | | | | | | | | | | | | | | | | | | | | | | |
Ratios and Supplemental Data: | | | | | | | | | | | | | | | | | | | | | | | | | | | | | | |
| Net assets, end of period (000’s) | | $ | | | 29,009 | | | | 1,627 | | | | 36 | | | | 503 | | | | 1 | | | | 1 | | | | 222 | |
| Ratios to average net assets: | | | | | | | | | | | | | | | | | | | | | | | | | | | | | | |
Gross expenses prior to expense waiver(3) | | % | | | 1.80 | | | | 2.21 | | | | 2.13 | | | | 0.74 | | | | 1.00 | | | | 1.03 | | | | 1.05 | |
Net expenses after expense waiver(3)(4) | | % | | | 1.68 | † | | | 1.65 | † | | | 1.65 | | | | 0.62 | † | | | 0.61 | † | | | 0.55 | | | | 0.93 | † |
Net investment income after expense waiver(3)(4) | | % | | | 1.71 | † | | | 2.33 | | | | 1.68 | | | | 2.69 | | | | 3.47 | | | | 2.68 | | | | 2.47 | † |
| Portfolio turnover rate | | % | | | 830 | | | | 858 | | | | 451 | | | | 830 | | | | 858 | | | | 451 | | | | 830 | |
|
| | |
| (1) | | Commencement of operations. |
| |
| (2) | | Total return is calculated assuming reinvestment of dividends and capital gain distributions at net asset value and excluding the deduction of sales charge. Total return for less than one year is not annualized. |
| |
| (3) | | Annualized for periods less than one year. |
| |
| (4) | | The Investment Adviser has agreed to limit expenses, (excluding interest, taxes, brokerage commissions, extraordinary expenses and acquired fund fees and expenses) subject to possible recoupment by the Investment Adviser within three years of being incurred. |
| |
| * | | Calculated using average number of shares outstanding throughout the period. |
| |
| † | | Impact of waiving the advisory fee for the ING Institutional Prime Money Market Fund holding has less than 0.01% impact on the expense ratio and net investment income ratio. |
See Accompanying Notes to Financial Statements
136
ING Diversified International Fund
Financial Highlights
Selected data for a share of beneficial interest outstanding throughout each period.
| | | | | | | | | | | | | | | | | | | | | | | | | | | |
| | | | | Class A | | Class B |
| | | | | | | | | December 21,
| | | | | | December 21,
|
| | | | | Year Ended
| | 2005(1) to
| | Year Ended
| | 2005(1) to
|
| | | | | October 31, | | October 31,
| | October 31, | | October 31,
|
| | | | | 2008 | | 2007 | | 2006 | | 2008 | | 2007 | | 2006 |
| |
|
Per Share Operating Performance: | | | | | | | | | | | | | | | | | | | | | | | | | | |
| Net asset value, beginning of period | | $ | | | 14.98 | | | | 11.61 | | | | 10.00 | | | | 14.84 | | | | 11.54 | | | | 10.00 | |
| Income (loss) from investment operations: | | | | | | | | | | | | | | | | | | | | | | | | | | |
| Net investment income (loss) | | $ | | | 0.17 | | | | 0.05 | * | | | (0.03 | )* | | | 0.07 | | | | (0.04 | ) | | | (0.10 | )* |
| Net realized and unrealized gain (loss) on investments in affiliates | | $ | | | (7.50 | ) | | | 3.38 | | | | 1.64 | | | | (7.43 | ) | | | 3.35 | | | | 1.64 | |
| Total from investment operations | | $ | | | (7.33 | ) | | | 3.43 | | | | 1.61 | | | | (7.36 | ) | | | 3.31 | | | | 1.54 | |
| Less distributions from: | | | | | | | | | | | | | | | | | | | | | | | | | | |
| Net investment income | | $ | | | 0.26 | | | | 0.06 | | | | — | | | | 0.17 | | | | 0.01 | | | | — | |
| Net realized gains on investments | | $ | | | 0.09 | | | | — | | | | — | | | | 0.09 | | | | — | | | | — | |
| Total distributions | | $ | | | 0.35 | | | | 0.06 | | | | — | | | | 0.26 | | | | 0.01 | | | | — | |
| Net asset value, end of period | | $ | | | 7.30 | | | | 14.98 | | | | 11.61 | | | | 7.22 | | | | 14.84 | | | | 11.54 | |
Total Return(2) | | % | | | (50.04 | ) | | | 29.66 | | | | 16.10 | | | | (50.43 | ) | | | 28.68 | | | | 15.40 | |
| | | | | | | | | | | | | | | | | | | | | | | | | | | |
| | | | | | | | | | | | | | | | | | | | | | | | | | | |
Ratios and Supplemental Data: | | | | | | | | | | | | | | | | | | | | | | | | | | |
| Net assets, end of period (000’s) | | $ | | | 167,282 | | | | 383,364 | | | | 170,108 | | | | 20,167 | | | | 43,667 | | | | 23,035 | |
| Ratios to average net assets: | | | | | | | | | | | | | | | | | | | | | | | | | | |
Gross expenses prior to expense waiver(4)(5) | | % | | | 0.57 | | | | 0.55 | | | | 0.66 | | | | 1.32 | | | | 1.30 | | | | 1.41 | |
Net expenses after expense waiver(3)(4)(5) | | % | | | 0.31 | | | | 0.21 | | | | 0.35 | | | | 1.06 | | | | 0.96 | | | | 1.10 | |
Net investment income (loss) after expense waiver(3)(4)(5) | | % | | | 1.41 | | | | 0.37 | | | | (0.35 | ) | | | 0.67 | | | | (0.34 | ) | | | (1.10 | ) |
| Portfolio turnover rate | | % | | | 55 | | | | 32 | | | | 30 | | | | 55 | | | | 32 | | | | 30 | |
|
| | | | | | | | | | | | | | | | | | | | | | | | | | | |
| | | | | Class C | | Class I |
| | | | | | | | | December 21,
| | | | | | December 21,
|
| | | | | Year Ended
| | 2005(1) to
| | Year Ended
| | 2005(1) to
|
| | | | | October 31, | | October 31,
| | October 31, | | October 31,
|
| | | | | 2008 | | 2007 | | 2006 | | 2008 | | 2007 | | 2006 |
| |
|
Per Share Operating Performance: | | | | | | | | | | | | | | | | | | | | | | | | | | |
| Net asset value, beginning of period | | $ | | | 14.83 | | | | 11.54 | | | | 10.00 | | | | 14.99 | | | | 11.63 | | | | 10.00 | |
| Income (loss) from investment operations: | | | | | | | | | | | | | | | | | | | | | | | | | | |
| Net investment income (loss) | | $ | | | 0.07 | | | | (0.05 | )* | | | (0.10 | )* | | | 0.21 | | | | 0.03 | * | | | (0.01 | )* |
| Net realized and unrealized gain (loss) on investments in affiliates | | $ | | | (7.42 | ) | | | 3.35 | | | | 1.64 | | | | (7.53 | ) | | | 3.41 | | | | 1.64 | |
| Total from investment operations | | $ | | | (7.35 | ) | | | 3.30 | | | | 1.54 | | | | (7.32 | ) | | | 3.44 | | | | 1.63 | |
| Less distributions from: | | | | | | | | | | | | | | | | | | | | | | | | | | |
| Net investment income | | $ | | | 0.18 | | | | 0.01 | | | | — | | | | 0.28 | | | | 0.08 | | | | — | |
| Net realized gains on investments | | $ | | | 0.09 | | | | — | | | | — | | | | 0.09 | | | | — | | | | — | |
| Total distributions | | $ | | | 0.27 | | | | 0.01 | | | | — | | | | 0.37 | | | | 0.08 | | | | — | |
| Net asset value, end of period | | $ | | | 7.21 | | | | 14.83 | | | | 11.54 | | | | 7.30 | | | | 14.99 | | | | 11.63 | |
Total Return(2) | | % | | | (50.43 | ) | | | 28.63 | | | | 15.40 | | | | (49.97 | ) | | | 29.69 | | | | 16.30 | |
| | | | | | | | | | | | | | | | | | | | | | | | | | | |
| | | | | | | | | | | | | | | | | | | | | | | | | | | |
Ratios and Supplemental Data: | | | | | | | | | | | | | | | | | | | | | | | | | | |
| Net assets, end of period (000’s) | | $ | | | 78,834 | | | | 168,661 | | | | 69,825 | | | | 16 | | | | 32 | | | | 4 | |
| Ratios to average net assets: | | | | | | | | | | | | | | | | | | | | | | | | | | |
Gross expenses prior to expense waiver(4)(5) | | % | | | 1.32 | | | | 1.30 | | | | 1.41 | | | | 0.32 | | | | 0.30 | | | | 0.45 | |
Net expenses after expense waiver(3)(4)(5) | | % | | | 1.06 | | | | 0.96 | | | | 1.10 | | | | 0.06 | | | | 0.09 | | | | 0.10 | |
Net investment income (loss) after expense waiver(3)(4)(5) | | % | | | 0.67 | | | | (0.39 | ) | | | (1.10 | ) | | | 1.69 | | | | 0.21 | | | | (0.13 | ) |
| Portfolio turnover rate | | % | | | 55 | | | | 32 | | | | 30 | | | | 55 | | | | 32 | | | | 30 | |
|
| | |
| (1) | | Commencement of operations. |
| |
| (2) | | Total return is calculated assuming reinvestment of dividends and capital gain distributions at net asset value and excluding the deduction of sales charge. Total return for less than one year is not annualized. |
| |
| (3) | | The Investment Adviser has agreed to limit expenses, (excluding interest, taxes, brokerage commissions, extraordinary expenses and acquired fund fees and expenses) subject to possible recoupment by the Investment Adviser within three years of being incurred. |
| |
| (4) | | Annualized for periods less than one year. |
| |
| (5) | | Expense ratios do not include expenses of Underlying Funds. |
| |
| * | | Calculated using average number of shares outstanding throughout the period. |
See Accompanying Notes to Financial Statements
137
ING Diversified International Fund (continued)
Financial Highlights
Selected data for a share of beneficial interest outstanding throughout each period.
| | | | | | | | | | | | | | | | | | | |
| | | | | Class O | | Class R | | Class W |
| | | | | June 4,
| | | | December 12,
| | February 12,
|
| | | | | 2008(1) to
| | Year Ended
| | 2006(1) to
| | 2008(1) to
|
| | | | | October 31,
| | October 31,
| | October 31,
| | October 31,
|
| | | | | 2008 | | 2008 | | 2007 | | 2008 |
| |
|
Per Share Operating Performance: | | | | | | | | | | | | | | | | | | |
| Net asset value, beginning of period | | $ | | | 12.99 | | | | 14.82 | | | | 12.19 | | | | 12.17 | |
| Income (loss) from investment operations: | | | | | | | | | | | | | | | | | | |
| Net investment income (loss) | | $ | | | 0.02 | * | | | 0.15 | | | | (0.05 | )* | | | 0.06 | * |
| Net realized and unrealized gain (loss) on investments in affiliates | | $ | | | (5.72 | ) | | | (7.44 | ) | | | 2.76 | | | | (4.94 | ) |
| Total from investment operations | | $ | | | (5.70 | ) | | | (7.29 | ) | | | 2.71 | | | | (4.88 | ) |
| Less distributions from: | | | | | | | | | | | | | | | | | | |
| Net investment income | | $ | | | — | | | | 0.22 | | | | 0.08 | | | | — | |
| Net realized gains on investments | | $ | | | — | | | | 0.09 | | | | — | | | | — | |
| Total distributions | | $ | | | — | | | | 0.31 | | | | 0.08 | | | | — | |
| Net asset value, end of period | | $ | | | 7.29 | | | | 7.22 | | | | 14.82 | | | | 7.29 | |
Total Return(2) | | % | | | (43.88 | ) | | | (50.18 | ) | | | 22.33 | | | | (40.10 | ) |
| | | | | | | | | | | | | | | | | | | |
| | | | | | | | | | | | | | | | | | | |
Ratios and Supplemental Data: | | | | | | | | | | | | | | | | | | |
| Net assets, end of period (000’s) | | $ | | | 140 | | | | 183 | | | | 432 | | | | 1,506 | |
| Ratios to average net assets: | | | | | | | | | | | | | | | | | | |
Gross expenses prior to expense waiver(3)(5) | | % | | | 0.57 | | | | 0.82 | | | | 0.80 | | | | 0.32 | |
Net expenses after expense waiver(3)(4)(5) | | % | | | 0.31 | | | | 0.56 | | | | 0.46 | | | | 0.06 | |
Net investment income (loss) after expense waiver(3)(4)(5) | | % | | | 0.48 | | | | 1.26 | | | | (0.46 | ) | | | 0.80 | |
| Portfolio turnover rate | | % | | | 55 | | | | 55 | | | | 32 | | | | 55 | |
|
| | |
| (1) | | Commencement of operations. |
| |
| (2) | | Total return is calculated assuming reinvestment of dividends and capital gain distributions at net asset value and excluding the deduction of sales charges. Total return for less than one year is not annualized. |
| |
| (3) | | Annualized for periods less than one year. |
| |
| (4) | | The Investment Adviser has agreed to limit expenses, (excluding interest, taxes, brokerage commissions, extraordinary expenses and acquired fund fees and expenses) subject to possible recoupment by the Investment Adviser within three years of being incurred. |
| |
| (5) | | Expense ratios do not include expenses of Underlying Funds. |
| |
| * | | Calculated using average number of shares outstanding throughout the period. |
See Accompanying Notes to Financial Statements
138
NOTE 1 — ORGANIZATION
Organization. The ING Funds included in this report are comprised of ING Mutual Funds (“IMF”) and ING Mayflower Trust (“IMT”) (each a “Registrant” and collectively, the “Registrants”); both are organized as open-end investment management companies registered under the Investment Company Act of 1940, as amended (“1940 Act”).
IMF is a Delaware statutory trust organized December 18, 1992 with twenty-one separate active series, all of which are included in this report, (each, a “Fund” and collectively, the “IMF Funds”): ING Global Equity Dividend Fund (“Global Equity Dividend”), ING Global Natural Resources Fund (“Global Natural Resources”), ING Global Real Estate Fund (“Global Real Estate”), ING Global Value Choice Fund (“Global Value Choice”), ING Asia-Pacific Real Estate Fund (Asia-Pacific Real Estate), ING Disciplined International SmallCap Fund (“Disciplined International SmallCap”), ING Emerging Countries Fund (“Emerging Countries”), ING European Real Estate Fund (“European Real Estate”), ING Foreign Fund (“Foreign”), ING Greater China Fund (“Greater China”), ING Index Plus International Equity Fund (“Index Plus International Equity”), ING International Capital Appreciation Fund (“International Capital Appreciation”), ING International Equity Dividend Fund (“International Equity Dividend”), ING International Growth Opportunities Fund (“International Growth Opportunities”), ING International Real Estate Fund (“International Real Estate”), ING International SmallCap Multi-Manager Fund (“International SmallCap Multi-Manager”), ING International Value Choice Fund (“International Value Choice”), ING Russia Fund (“Russia”), ING Emerging Markets Fixed Income Fund (“Emerging Markets Fixed Income”), ING Global Bond Fund (“Global Bond”) and ING Diversified International Fund (“Diversified International”). IMT is a Massachusetts business trust organized August 18, 1993 with one series, ING International Value Fund (“International Value”) (a “Fund” and together with the IMF Funds, the “Funds”). The investment objective of each Fund is described in the Funds’ prospectuses.
Each Fund offers at least one or more of the following classes of shares: Class A, Class B, Class C, Class I, Class O, Class Q, Class R and Class W. The separate classes of shares differ principally in the applicable sales charges (if any), distribution fees and shareholder servicing fees and transfer agent fees. Generally, shareholders of each class also bear certain expenses that pertain to that particular class. All shareholders bear the common expenses of the Fund and earn income and realized gains/losses from the portfolio pro rata based on the average daily net assets of each class, without distinction between share classes. Common expenses of the Funds (including custodial asset-based fees, legal and audit fees, printing and mailing expenses, transfer agency out-of-pocket expenses, and fees and expenses of the independent trustees) are allocated to each Fund in proportion to its average net assets. Expenses directly attributable to a particular fund (including advisory, administration, custodial transaction-based, registration, other professional, distribution and/or service fees, certain taxes, and offering costs) are charged directly to that Fund. Differences in per share dividend rates generally result from the differences in separate class expenses, including distribution and shareholder servicing fees. Class B shares, along with their pro rata reinvested dividend shares, automatically convert to Class A shares eight years after purchase.
Emerging Countries does not impose any front-end sales charge (load) on purchases of Class A shares of Emerging Countries by its former Class M shareholders for the life of their account.
Diversified International seeks to achieve its investment objective by investing in other Underlying Funds and uses asset allocation strategies to determine how much to invest in the Underlying Funds.
NOTE 2 — SIGNIFICANT ACCOUNTING POLICIES
The following significant accounting policies are consistently followed by the Funds in the preparation of their financial statements, and such policies are in conformity with U.S. generally accepted accounting principles for investment companies.
| |
| A. | Security Valuation. For all Funds except Russia and Diversified International, investments in equity securities traded on a national securities exchange are valued at the last reported sale price. Securities reported by National Association of Securities Dealers Automated Quotation System (“NASDAQ”) will be valued at the NASDAQ official closing prices. Securities traded on an exchange or NASDAQ for which there has been no sale, securities traded in the over-the-counter-market, gold and silver bullion, platinum and palladium are valued at the mean between the last reported |
139
NOTES TO FINANCIAL STATEMENTS as of October 31, 2008 (continued)
NOTE 2 — SIGNIFICANT ACCOUNTING POLICIES (continued)
| |
| bid and ask prices. All investments quoted in foreign currencies will be valued daily in U.S. dollars on the basis of the foreign currency exchange rates prevailing at that time. Debt securities are valued at prices obtained from independent services or from one or more dealers making markets in the securities and may be adjusted based on the Funds’ valuation procedures. U.S. government obligations are valued by using market quotations or independent pricing services that use prices provided by market-makers or estimates of market values obtained from yield data relating to instruments or securities with similar characteristics. |
Securities and assets for which market quotations are not readily available (which may include certain restricted securities which are subject to limitations as to their sale) are valued at their fair values, as defined by the 1940 Act, and as determined in good faith by or under the supervision of the Funds’ Board in accordance with methods that are specifically authorized by the Board. Securities traded on exchanges, including foreign exchanges, which close earlier than the time that a Fund calculates its next net asset value (“NAV”) may also be valued at their fair values, as defined by the 1940 Act, and as determined in good faith by or under the supervision of a Fund’s Board, in accordance with methods that are specifically authorized by the Board. The valuation techniques applied in any specific instance are likely to vary from case to case. With respect to a restricted security, for example, consideration is generally given to the cost of the investment, the market value of any unrestricted securities of the same class at the time of valuation, the potential expiration of restrictions on the security, the existence of any registration rights, the costs to a Fund related to registration of the security, as well as factors relevant to the issuer itself. Consideration may also be given to the price and extent of any public trading in similar securities of the issuer or comparable companies’ securities.
The value of a foreign security traded on an exchange outside the United States is generally based on its price on the principal foreign exchange where it trades as of the time a Fund determines its NAV or if the foreign exchange closes prior to the time the Fund determines its NAV, the most recent closing price of the foreign security on its principal exchange. Trading in certain non-U.S. securities may not take place on all days on which the New York Stock Exchange (“NYSE”) is open. Further, trading takes place in various foreign markets on days on which the NYSE is not open. Consequently, the calculation of a Fund’s NAV may not take place contemporaneously with the determination of the prices of securities held by a Fund in foreign securities markets. Further, the value of a Fund’s assets may be significantly affected by foreign trading on days when a shareholder cannot purchase or redeem shares of the Fund. In calculating a Fund’s NAV, foreign securities in foreign currency are converted to U.S. dollar equivalents.
If an event occurs after the time at which the market for foreign securities held by a Fund closes but before the time that a Fund’s next NAV is calculated, such event may cause the closing price on the foreign exchange to not represent a readily available reliable market value quotation for such securities at the time a Fund determines its NAV. In such a case, a Fund will use the fair value of such securities as determined under the Funds’ valuation procedures. Events after the close of trading on a foreign market that could require a Fund to fair value some or all of its foreign securities include, among others, securities trading in the U.S. and other markets, corporate announcements, natural and other disasters, and political and other events. Among other elements of analysis in the determination of a security’s fair value, the Board has authorized the use of one or more independent research services to assist with such determinations. An independent research service may use statistical analyses and quantitative models to help determine fair value as of the time a Fund calculates its NAV. There can be no assurance that such models accurately reflect the behavior of the applicable markets or the effect of the behavior of such markets on the fair value of securities, or that such markets will continue to behave in a fashion that is consistent with such models. Unlike the closing price of a security on an exchange, fair value determinations employ elements of judgment. Consequently, the fair value assigned to a security may not represent the actual value that a Fund could obtain if it were to sell the security at the time of the
140
NOTES TO FINANCIAL STATEMENTS as of October 31, 2008 (continued)
NOTE 2 — SIGNIFICANT ACCOUNTING POLICIES (continued)
close of the NYSE. Pursuant to procedures adopted by the Board, a Fund is not obligated to use the fair valuations suggested by any research service, and valuation recommendations provided by such research services may be overridden if other events have occurred or if other fair valuations are determined in good faith to be more accurate. Unless an event is such that it causes a Fund to determine that the closing prices for one or more securities do not represent readily available reliable market value quotations at the time the Fund determines its NAV, events that occur between the time of the close of the foreign market on which they are traded and the close of regular trading on the NYSE will not be reflected in the Fund’s NAV. Investments in securities maturing in 60 days or less from the date of acquisition are valued at amortized cost which approximates market value.
For the Russia Fund, the valuation procedures for Russian equity securities are to price local shares according to the most recent available bid prices. If securities are not listed on the Russian Trade System (the “RTS”) or on any other pricing service that lists available bid quotes, then the mean of at least two broker bid quotes is used. For equity securities of an issuer in Russia for which there are no readily available reliable market value quotations, the following benchmark pricing procedure shall apply on any day on which the largest securities exchange in Russia declines by 2.5% or more; the price of the security shall be adjusted by the amount of the downward change in a composite of the other companies that are publicly traded in the same sector as the issuer, if ascertainable, and if not ascertainable, by the amount of downward change in the RTS.
For Diversified International and other Funds with holdings in open end investment companies, the valuations of the Funds’ investments in Underlying Funds are based on the NAVs of the Underlying Funds each business day. In general, assets of the Underlying Funds are valued based on actual or estimated market value, with special provisions for assets not having readily available market quotations and short-term debt securities, and for situations where market quotations are deemed unreliable. Investments in securities maturing in 60 days or less from the date of acquisition are valued at amortized cost which approximates market value. Securities prices may be obtained from automated pricing services. Shares of investment companies held by the Underlying Funds will generally be valued at the latest NAV reported by that investment company.
| |
| B. | Security Transactions and Revenue Recognition. Securities transactions are accounted for on the trade date. Realized gains and losses are reported on the basis of identified cost of securities sold. Interest income is recorded on an accrual basis. Dividend income is recorded, net of any applicable withholding tax, on the ex-dividend date, or for certain foreign securities, when the information becomes available to the Funds. Premium amortization and discount accretion are determined by the effective yield method. |
For Diversified International, capital gain dividends from Underlying Funds are recorded as distributions of realized gains from affiliated Underlying Funds.
Global Real Estate and International Real Estate estimate components of distributions from real estate investment trusts (“REITs”). Distributions received in excess of income are recorded as a reduction of cost of the related investments. If the Funds no longer own the applicable securities, any distributions received in excess of income are recorded as realized gains.
| |
| C. | Foreign Currency Translation. The books and records of the Funds and Underlying Funds are maintained in U.S. dollars. Any foreign currency amounts are translated into U.S. dollars on the following basis: |
| | |
| | (1) | Market value of investment securities, other assets and liabilities — at the exchange rates prevailing at the end of the day. |
| |
| | (2) | Purchases and sales of investment securities, income and expenses — at the rates of exchange prevailing on the respective dates of such transactions. |
Although the net assets and the market values are presented at the foreign exchange rates at the end of the day, the Funds and Underlying Funds do not isolate the portion of the results of operations resulting from changes in foreign exchange rates on investments from the fluctuations arising from changes in market prices of securities held. Such fluctuations are included with the net realized and unrealized gains or losses from investments. For
141
NOTES TO FINANCIAL STATEMENTS as of October 31, 2008 (continued)
NOTE 2 — SIGNIFICANT ACCOUNTING POLICIES (continued)
securities that are subject to foreign withholding tax upon disposition, liabilities are recorded on the Statements of Assets and Liabilities for the estimated tax withholding based on the securities’ current market value. Upon disposition, realized gains or losses on such securities are recorded net of foreign withholding tax.
Reported net realized foreign exchange gains or losses arise from sales of foreign currencies, currency gains or losses realized between the trade and settlement dates on securities transactions, the difference between the amounts of dividends, interest, and foreign withholding taxes recorded on a Fund’s or an Underlying Fund’s books, and the U.S. dollar equivalent of the amounts actually received or paid. Net unrealized foreign exchange gains and losses arise from changes in the value of assets and liabilities other than investments in securities at fiscal year end, resulting from changes in the exchange rate. Foreign security and currency transactions may involve certain considerations and risks not typically associated with investing in U.S. companies and U.S. government securities. These risks include, but are not limited to revaluation of currencies and future adverse political and economic developments which could cause securities and their markets to be less liquid and prices more volatile than those of comparable U.S. companies and U.S. government securities. The foregoing risks are even greater with respect to securities of issuers in emerging markets.
| |
| D. | Forward Foreign Currency Transactions and Futures Contracts. Each Fund and Underlying Fund may enter into forward foreign currency exchange transactions to convert to and from different foreign currencies and to and from the U.S. dollar, generally in connection with the planned purchases or sales of securities. The Funds and Underlying Funds either enter into these transactions on a spot basis at the spot rate prevailing in the foreign currency exchange market or may use forward foreign currency contracts to purchase or sell foreign currencies. When the contract is fulfilled or closed, gains or losses are realized. Until then, the gain or loss is included in unrealized appreciation or depreciation. Risks may arise upon entering into forward contracts from the potential inability of counterparties to meet the terms of their forward contracts and from unanticipated movements in the value of foreign currencies relative to the U.S. dollar. |
Each Fund and Underlying Fund may enter into futures contracts involving foreign currency, interest rates, securities and securities indices. Each Fund and Underlying Fund intends to limit its use of futures contracts and futures options to “bona fide hedging” transactions, as such term is defined in applicable regulations, interpretations and practice. A futures contract obligates the seller of the contract to deliver and the purchaser of the contract to take delivery of the type of foreign currency, financial instrument or security called for in the contract at a specified future time for a specified price. Upon entering into such a contract, a Fund or an Underlying Fund is required to deposit and maintain as collateral such initial margin as required by the exchange on which the contract is traded. Pursuant to the contract, a Fund or an Underlying Fund agrees to receive from or pay to the broker an amount equal to the daily fluctuations in the value of the contract. Such receipts or payments are known as variation margin and are recorded as unrealized gains or losses by the Fund or an Underlying Fund. When the contract is closed, the Fund or Underlying Fund records a realized gain or loss equal to the difference between the value of the contract at the time it was opened and the value at the time it was closed.
| |
| E. | Distributions to Shareholders. The Funds record distributions to their shareholders on ex-dividend date. Each Fund pays dividends and capital gains, if any, annually (except, Global Equity Dividend, Global Real Estate, Asia-Pacific Real Estate, European Real Estate, International Equity Dividend and International Real Estate, which pay dividends, if any, quarterly and Emerging Markets Fixed Income and Global Bond, which pay dividends monthly). The Funds may make distributions on a more frequent basis to comply with the distribution requirements of the Internal Revenue Code. The characteristics of income and gains to be distributed are determined in accordance with income tax regulations, which may differ from U.S. generally accepted accounting principles for investment companies. |
142
NOTES TO FINANCIAL STATEMENTS as of October 31, 2008 (continued)
NOTE 2 — SIGNIFICANT ACCOUNTING POLICIES (continued)
| |
| F. | Federal Income Taxes. It is the policy of the Funds to comply with subchapter M of the Internal Revenue Code and related excise tax provisions applicable to regulated investment companies and to distribute substantially all of their net investment income and any net realized capital gains to their shareholders. Therefore, no federal income tax provision is required. Management has considered the sustainability of the Funds’ tax positions taken on federal income tax returns for all open tax years in making this determination. No capital gain distributions shall be made until any capital loss carryforwards have been fully utilized or expire. |
The Funds may utilize equalization accounting for tax purposes, whereby a portion of redemption payments are treated as distributions of income or gain.
| |
| G. | Use of Estimates. The preparation of financial statements in conformity with U.S. generally accepted accounting principles requires management to make estimates and assumptions that affect the reported amounts of assets and liabilities and disclosure of contingent assets and liabilities at the date of the financial statements and the reported amounts of increases and decreases in net assets from operations during the reporting period. Actual results could differ from those estimates. |
| |
| H. | Organization Expenses and Offering Costs. Costs incurred with the organization of the Funds and Underlying Funds are expensed as incurred. Costs incurred with the offering of shares of the Funds and Underlying Funds are deferred and amortized over a twelve-month period on a straight-line basis. |
| |
| I. | Repurchase Agreements. Each Fund and Underlying Fund may invest in repurchase agreements only with government securities dealers recognized by the Board of Governors of the Federal Reserve System. Under such agreements, the seller of the security agrees to repurchase it at a mutually agreed upon time and price. The resale price is in excess of the purchase price and reflects an agreed upon interest rate for the period of time the agreement is outstanding. The period of the repurchase agreements is usually short, from overnight to one week, while the underlying securities generally have longer maturities. Each Fund and Underlying Fund will receive as collateral securities acceptable to it whose market value is equal to at least 100% of the carrying amount of the repurchase agreements, plus accrued interest, being invested by the Fund or Underlying Fund. The underlying collateral is valued daily on a mark to market basis to assure that the value, including accrued interest is at least equal to the repurchase price. There would be potential loss to the Fund or Underlying Fund in the event the Fund or Underlying Fund is delayed or prevented from exercising its right to dispose of the collateral, and it might incur disposition costs in liquidating the collateral. |
| |
| J. | Securities Lending. Each Fund and Underlying Fund has the option to temporarily loan up to 30% of its total assets to brokers, dealers or other financial institutions in exchange for a negotiated lender’s fee. The borrower is required to fully collateralize the loans with cash or U.S. government securities. Generally, in the event of counterparty default, each Fund and Underlying Fund has the right to use collateral to offset losses incurred. There would be potential loss to a Fund or Underlying Fund in the event the Fund or Underlying Fund is delayed or prevented from exercising its right to dispose of the collateral. Each Fund and Underlying Fund bears the risk of loss with respect to the investment of collateral. Engaging in securities lending could have a leveraging effect, which may intensify the credit, market and other risks associated with investing in a Fund or Underlying Fund. |
| |
| K. | Options Contracts. All Funds and Underlying Funds may purchase put and call options and may write (sell) put options and covered call options. The Funds and Underlying Funds may engage in option transactions as a hedge against adverse movements in the value of portfolio holdings or to increase market exposure. Option contracts are valued daily and unrealized gains or losses are recorded based upon the last sales price on the principal exchange on which the options are traded. The Funds and Underlying Funds will realize a gain or loss upon the expiration or closing of the option contract. When an option is exercised, the proceeds on sales of the underlying security for a written call option, the purchase cost |
143
NOTES TO FINANCIAL STATEMENTS as of October 31, 2008 (continued)
NOTE 2 — SIGNIFICANT ACCOUNTING POLICIES (continued)
| |
| of the security for a written put option, or the cost of the security for a purchased put or call option is adjusted by the amount of premium received or paid. Realized and unrealized gains or losses on option contracts are reflected in the accompanying financial statements. The value of an option purchased or written is marked to market daily and is valued at the closing price on the exchange on which it is traded or, if not traded on an exchange or no closing price is available, at the mean between the last bid and asked prices. The risk in writing a covered call option is that the Funds and Underlying Funds give up the opportunity for profit if the market price of the security increases and the option is exercised. The risk in writing a put option is that the Funds and Underlying Funds may incur a loss if the market price of the security decreases and the option is exercised. The risk in buying an option is that the Funds and Underlying Funds pay a premium whether or not the option is exercised. Risks may also arise from an illiquid secondary market or from the inability of counterparties to meet the terms of the contract. |
| |
| L. | Swap Contracts. Certain Funds and Underlying Funds may enter into interest rate swaps, currency swaps and other types of swap agreements, including swaps on securities and indices. A swap is an agreement between two parties pursuant to which each party agrees to make one or more payments to the other on regularly scheduled dates over a stated term, based on different interest rates, currency exchange rates, security prices, the prices or rates of other types of financial instruments or assets or the levels of specified indices. During the term of the swap, changes in the value of the swap, if any, are recognized by marking-to-market the value of the swap and are recorded as an unrealized gain or loss on the Statements of Operations. Upfront payments made and/or received by the Portfolio, are recorded as an asset or liability on the Statements of Assets or Liabilities. Periodic payments made and/or received are recorded as a realized gain or loss on the Statements of Operations. Derivatives are also subject to credit risks related to the counterparty’s ability to perform, and any deterioration in the counterparty’s creditworthiness could adversely affect the instrument. |
| |
| M. | Illiquid and Restricted Securities. Each Fund and Underlying Fund may not invest more than 15% of its net assets in illiquid securities. Illiquid securities are not readily marketable. Disposing of illiquid investments may involve time-consuming negotiation and legal expenses, and it may be difficult or impossible for the Funds and Underlying Funds to sell them promptly at an acceptable price. Each Fund and Underlying Fund may also invest in restricted securities which include those sold under Rule 144A of the Securities Act of 1933 (“1933 Act”) or securities offered pursuant to Section 4(2) of the 1933 Act, and/or are subject to legal or contractual restrictions on resale and may not be publicly sold without registration under the 1933 Act. Certain restricted securities may be considered liquid pursuant to procedures adopted by the Board or may be deemed illiquid because they may not be readily marketable. Illiquid and restricted securities are valued using market quotations when readily available. In the absence of market quotations, the securities are valued based upon their fair value determined in good faith under procedures approved by the Board. |
| |
| N. | Delayed Delivery or When-Issued Transaction. The Funds and Underlying Funds may purchase or sell securities on a when-issued or forward commitment basis. The price of the securities and date when the securities will be delivered and paid for are fixed at the time the transaction is negotiated. The market value of these securities is identified in each Fund’s Portfolio of Investments. Losses may arise due to changes in the market value of the securities or from the inability of counterparties to meet the terms of the contract. In connection with such purchases, the Funds and Underlying Funds are required to segregate liquid assets sufficient to cover the purchase price. |
| |
| O. | Indemnifications. In the normal course of business, each Trust may enter into contracts that provide certain indemnifications. Each Trust’s maximum exposure under these arrangements is dependent on future claims that may be made against the Funds and, therefore, cannot be estimated; however, based |
144
NOTES TO FINANCIAL STATEMENTS as of October 31, 2008 (continued)
| |
| on experience, the risk of loss from such claims is considered remote. |
NOTE 3 — INVESTMENT TRANSACTIONS
For the year ended October 31, 2008, the cost of purchases and the proceeds from the sales of securities, excluding U.S. government and short-term securities, were as follows:
| | | | | | | | | |
| | | Purchases | | Sales |
| |
| Global Equity Dividend | | $ | 123,620,083 | | | $ | 222,693,001 | |
| Global Natural Resources | | | 164,039,949 | | | | 178,176,681 | |
| Global Real Estate | | | 1,366,748,164 | | | | 665,210,599 | |
| Global Value Choice | | | 81,776,009 | | | | 81,823,369 | |
| Asia-Pacific Real Estate | | | 17,352,817 | | | | 4,835,839 | |
| Disciplined International SmallCap | | | 524,467,401 | | | | 530,843,661 | |
| Emerging Countries | | | 422,374,632 | | | | 479,223,866 | |
| European Real Estate | | | 13,778,810 | | | | 7,949,703 | |
| Foreign | | | 684,011,257 | | | | 755,846,060 | |
| Greater China | | | 91,561,024 | | | | 111,796,741 | |
| Index Plus International Equity | | | 524,418,473 | | | | 418,864,192 | |
| International Capital Appreciation | | | 101,146,539 | | | | 124,692,642 | |
| International Equity Dividend | | | 46,789,468 | | | | 33,932,211 | |
| International Growth Opportunities | | | 173,364,050 | | | | 168,996,075 | |
| International Real Estate | | | 561,169,901 | | | | 265,364,029 | |
| International SmallCap Multi-Manager | | | 693,737,147 | | | | 808,645,406 | |
| International Value | | | 1,041,462,518 | | | | 918,332,432 | |
| International Value Choice | | | 56,005,686 | | | | 52,504,273 | |
| Russia | | | 334,686,560 | | | | 514,439,861 | |
| Emerging Markets Fixed Income | | | 170,256,783 | | | | 168,129,297 | |
| Global Bond | | | 94,584,257 | | | | 41,729,743 | |
| Diversified International | | | 281,314,738 | | | | 297,506,334 | |
Purchase and sales of long-term U.S. government securities not included above were as follows:
| | | | | | | | | |
| | | Purchases | | Sales |
| |
| Global Bond | | $ | 566,529,692 | | | $ | 542,839,228 | |
NOTE 4 — REDEMPTION FEES
A 2% redemption fee is charged on shares of Russia that are redeemed (including in connection with an exchange) within 365 days or less from their date of purchase. The redemption fee is recorded as an addition to paid-in capital. Total redemption fee proceeds for the years ended October 31, 2008 and October 31, 2007 were $1,344,090 and $3,086,432, respectively, and are set forth in the Statements of Changes in Net Assets.
NOTE 5 — INVESTMENT MANAGEMENT AND ADMINISTRATIVE FEES
Each of the Funds have entered into an investment management agreement (“Management Agreements”) with ING Investments, LLC (“ING Investments” or “Investment Adviser”). The Management Agreements compensate the Investment Adviser with a fee, computed daily and payable monthly, based on the average daily net assets of each Fund, at the following annual rates:
| | | |
| | | As a Percentage of Average Net Assets |
| |
| Global Equity Dividend | | 0.70% |
| Global Natural Resources | | 1.00% on first $50 million; and 0.75% thereafter |
| Global Real Estate | | 0.80% on the first $250 million; 0.775% on the next $250 million; and 0.70% thereafter |
| Global Value Choice(1) | | 0.90% on the first $500 million; 0.80% on the next $500 million; and 0.75% thereafter |
| Asia-Pacific Real Estate | | 1.00% on the first $250 million; 0.90% on the next $250 million; 0.80% thereafter |
| Disciplined International SmallCap | | 0.60% |
| Emerging Countries | | 1.25% |
| European Real Estate | | 1.00% on the first $250 million; 0.90% on the next $250 million; 0.80% thereafter |
| Foreign(2) | | 1.00% on the first $500 million; and 0.90% thereafter |
| Greater China | | 1.15% on the first $100 million; 1.05% on the next $150 million; and 0.95% thereafter |
| Index Plus International Equity | | 0.55% |
| International Capital Appreciation | | 0.85% on the first $500 million; 0.80% on the next $500 million; and 0.75% thereafter |
| International Equity Dividend | | 0.75% |
| International Growth Opportunities | | 1.00% |
| International Real Estate | | 1.00% on the first $250 million; 0.90% on the next $250 million; and 0.80% thereafter |
International SmallCap
Multi-Manager | | 1.00% on first $500 million;
0.90% on next $500 million; and
0.85% thereafter |
| International Value(3) | | 1.00% on the first $5 billion; 0.95% on the next $2.5 billion; 0.90% on the next $2.5 billion; and 0.85% thereafter |
| International Value Choice | | 1.00% |
| Russia | | 1.25% |
| Emerging Markets Fixed Income | | 0.65% on the first $250 million; 0.60% on the next $250 million; and 0.55% thereafter |
| Global Bond | | 0.40% |
| Diversified International | | 0.00% |
| |
| (1) | Prior to January 2, 2008, the investment management fee was 1.00% on the first $250 million, 0.90% on the next $250 million, 0.80% on the next $500 million, and 0.75% thereafter. |
| |
| (2) | ING Investments has contractually agreed to waive a portion of the advisory fee for ING Foreign Fund. This advisory fee waiver will continue through at least May 1, 2009. There is no guarantee that this waiver will continue after this date. This agreement will only renew if ING Investments elects to renew it. |
| |
| (3) | Prior to October 27, 2008 the investment management fee was 1.00% of average daily net assets. |
ING Investments has contractually agreed to waive a portion of the advisory fee for Emerging Countries and
145
NOTES TO FINANCIAL STATEMENTS as of October 31, 2008 (continued)
NOTE 5 — INVESTMENT MANAGEMENT AND ADMINISTRATIVE FEES (continued)
Foreign. The waiver is calculated as 50% of the difference between the former sub-advisory fee minus the new sub-advisory fee.
For the year ended October 31, 2008, ING Investments waived $88,990 and $28,665 in advisory fees for Emerging Countries and Foreign, respectively.
ING Investment Management Advisors B.V. (“IIMA”), a registered investment adviser, serves as the Sub-Adviser to Global Equity Dividend, Emerging Countries, Index Plus International Equity, International Equity Dividend, International Value Opportunities, Russia and Emerging Markets Fixed Income pursuant to a sub-advisory agreement between the Investment Adviser and IIMA.
ING Clarion Real Estate Securities L.P. (“ING CRES”) a registered investment adviser, serves as the Sub-Adviser to Asia-Pacific Real Estate, European Real Estate, Global Real Estate and International Real Estate pursuant to a sub-advisory agreement between the Investment Adviser and ING CRES.
Tradewinds Global Investors, LLC (“Tradewinds”), a registered investment adviser, serves as the Sub-Adviser to Global Value Choice and International Value Choice pursuant to a sub-advisory agreement between the Investment Adviser and Tradewinds.
Brandes Investment Partners, L.P. (“Brandes”), a registered investment adviser, serves as one of the Sub-Advisers to International Value pursuant to a sub-advisory agreement between the Investment Adviser and Brandes.
Artio Global Investment Management LLC (whose name changed on June 15, 2008 from Julius Baer Investment Management LLC), a registered investment adviser, serves as the Sub-Adviser to Foreign pursuant to a sub-advisory agreement between the Investment Adviser and the sub-adviser.
ING Investment Management Co. (“ING IM”), a registered investment adviser, serves as sub-adviser to Disciplined International SmallCap, Global Natural Resources, International Growth Opportunities and Global Bond and as one of the Sub-Advisers to International Value, pursuant to a sub-advisory agreement between the Investment Adviser and ING IM.
Acadian Asset Management LLC (“Acadian”), a registered investment adviser, serves as one of the Sub-Advisers to International SmallCap Multi-Manager pursuant to a sub-advisory agreement between the Investment Adviser and Acadian. Batterymarch Financial Management, Inc. (“Batterymarch”) serves as the second Sub-Adviser to International SmallCap Multi-Manager pursuant to a sub-advisory agreement between the Investment Adviser and Batterymarch. Schroder Investment Management North America, Inc. (“Schroders”), serves as the third Sub-Adviser to International SmallCap Multi-Manager pursuant to a sub-advisory agreement between the Investment Adviser and Schroders.
ING Investment Management Asia/Pacific (Hong Kong) Limited (“ING Asia”), a registered investment adviser, serves as the Sub-Adviser to Greater China pursuant to a sub-advisory agreement between the Investment Adviser and ING Asia.
Hansberger Global Investors, Inc. (“HGI”), a registered investment adviser, serves as the Sub-Adviser to International Capital Appreciation pursuant to a sub-advisory agreement between the Investment Adviser and HGI.
For Diversified International, ING Investment Management Co. (the “Consultant” or “ING IM”) is a consultant to the Investment Adviser. The Consultant provides tactical allocation recommendations to the Investment Adviser. The Investment Adviser has set up an Investment Committee made up of a team of professionals to consider, review and implement the recommendations of the Consultant, and retains discretion over implementation of the Consultant’s recommendations. The Consultant provides ongoing recommendations to the Investment Committee of the Investment Adviser quarterly or as warranted by market conditions.
ING Funds are permitted to invest end-of-day cash balances into ING Institutional Prime Money Market Fund. Investment management fees paid by the Funds will be reduced by an amount equal to the management fees paid indirectly to ING Institutional Prime Money Market Fund with respect to assets invested by the Funds. For the year ended October 31, 2008, the
146
NOTES TO FINANCIAL STATEMENTS as of October 31, 2008 (continued)
NOTE 5 — INVESTMENT MANAGEMENT AND ADMINISTRATIVE FEES (continued)
following funds waived such management fees which are not subject to recoupment:
| | | | | |
| Global Natural Resources | | $ | 276 | |
| Global Real Estate | | | 7,607 | |
| Global Value Choice | | | 171 | |
| Asia-Pacific Real Estate | | | 46 | |
| European Real Estate | | | 21 | |
| Foreign | | | 2,645 | |
| Index Plus International Equity | | | 57 | |
| International Growth Opportunities | | | 2,222 | |
| International Real Estate | | | 3,125 | |
| International SmallCap Multi-Manager | | | 89 | |
| International Value | | | 1,727 | |
| International Value Choice | | | 153 | |
| Global Bond | | | 20,639 | |
ING Funds Services, LLC (the “Administrator”), serves as administrator to each Fund. The Funds pay the Administrator a fee calculated at an annual rate of 0.10% of each Fund’s average daily net assets.
International Value also pays the Administrator an annual shareholder account-servicing fee of $5.00 for each account of beneficial owners of shares.
The Investment Adviser, ING IM, ING CRES, IIMA, ING Asia and the Administrator are indirect, wholly-owned subsidiaries of ING Groep N.V. (“ING Groep”). ING Groep is a global financial institution of Dutch origin offering banking, investments, life insurance and retirement services to over 75 million private, corporate and institutional clients in more than 50 countries. With a diverse workforce of about 125,000 people, ING Groep comprises a broad spectrum of prominent companies that increasingly serve their clients under the ING brand.
On October 19, 2008, ING Groep announced that it reached an agreement with the Dutch government to strengthen its capital position, creating a strong buffer to navigate the current market and economic environment. ING Groep will issue non-voting core Tier-1 securities for a total consideration of EUR 10 billion to the Dutch State. The transaction boosts ING Bank’s core Tier-1 ratio, strengthens the insurance balance sheet and reduces ING Groep’s Debt/Equity ratio.
NOTE 6 — DISTRIBUTION AND SERVICE FEES
Each share class of the Funds, except Class I and Class W, has adopted a Plan pursuant to Rule 12b-1 under the 1940 Act (the “12b-1 Plans”), whereby ING Funds Distributor, LLC (“IFD” or the “Distributor”), an indirect, wholly-owned subsidiary of ING Groep, is reimbursed or compensated (depending on the class of shares) by the Funds for expenses incurred in the distribution of each Funds’ shares (“Distribution Fees”). Pursuant to the 12b-1 Plans, the Distributor is entitled to a payment each month for expenses incurred in the distribution and promotion of each Fund’s shares, including expenses incurred in printing prospectuses and reports used for sales purposes, expenses incurred in preparing and printing sales literature and other such distribution related expenses, including any distribution or shareholder servicing fees (“Service Fees”) paid to securities dealers who have executed a distribution agreement with the Distributor. Under the 12b-1 Plans, each class of shares of a Fund pays the Distributor a Distribution and/or Service Fee based on average daily net assets at the following annual rates:
| | | | | | | | | | | | | | | | | | | | | | | | | |
| | | Class A | | Class B | | Class C | | Class O | | Class Q | | Class R |
| |
| Global Equity Dividend | | | 0.25% | | | | 1.00 | % | | | 1.00 | % | | | 0.25 | % | | | N/A | | | | N/A | |
| Global Natural Resources | | | 0.25% | | | | N/A | | | | N/A | | | | N/A | | | | N/A | | | | N/A | |
| Global Real Estate | | | 0.25% | | | | 1.00 | % | | | 1.00 | % | | | 0.25 | % | | | N/A | | | | N/A | |
| Global Value Choice | | | 0.25% | (1) | | | 1.00 | %(1) | | | 1.00 | %(1) | | | N/A | | | | 0.25 | % | | | N/A | |
| Asia-Pacific Real Estate | | | 0.25% | | | | 1.00 | % | | | 1.00 | % | | | N/A | | | | N/A | | | | N/A | |
| Disciplined International SmallCap | | | 0.25% | | | | 1.00 | % | | | 1.00 | % | | | N/A | | | | N/A | | | | N/A | |
| Emerging Countries | | | 0.35% | (2) | | | 1.00 | % | | | 1.00 | % | | | N/A | | | | 0.25 | % | | | N/A | |
| European Real Estate | | | 0.25% | | | | 1.00 | % | | | 1.00 | % | | | N/A | | | | N/A | | | | N/A | |
| Foreign | | | 0.25% | | | | 1.00 | % | | | 1.00 | % | | | N/A | | | | 0.25 | % | | | N/A | |
| Greater China | | | 0.25% | | | | 1.00 | % | | | 1.00 | % | | | 0.25 | % | | | N/A | | | | N/A | |
| Index Plus International Equity | | | 0.25% | | | | 1.00 | % | | | 1.00 | % | | | 0.25 | % | | | N/A | | | | N/A | |
| International Capital Appreciation | | | 0.25% | | | | 1.00 | % | | | 1.00 | % | | | N/A | | | | N/A | | | | N/A | |
| International Equity Dividend | | | 0.25% | | | | 1.00 | % | | | 1.00 | % | | | N/A | | | | N/A | | | | N/A | |
| International Growth Opportunities | | | 0.25% | | | | 1.00 | % | | | 1.00 | % | | | N/A | | | | 0.25 | % | | | N/A | |
| International Real Estate | | | 0.25% | | | | 1.00 | % | | | 1.00 | % | | | N/A | | | | N/A | | | | N/A | |
| International SmallCap Multi-Manager | | | 0.35% | | | | 1.00 | % | | | 1.00 | % | | | 0.25 | % | | | 0.25 | % | | | N/A | |
| International Value | | | 0.30% | | | | 1.00 | % | | | 1.00 | %(3) | | | N/A | | | | 0.25 | %(3) | | | N/A | |
| International Value Choice | | | 0.25% | | | | 1.00 | % | | | 1.00 | % | | | N/A | | | | N/A | | | | N/A | |
| Russia | | | 0.25% | | | | N/A | | | | N/A | | | | N/A | | | | N/A | | | | N/A | |
| Emerging Markets Fixed Income | | | 0.25% | | | | 1.00 | % | | | 1.00 | % | | | N/A | | | | N/A | | | | N/A | |
| Global Bond | | | 0.25% | | | | 1.00 | % | | | 1.00 | % | | | 0.25 | % | | | N/A | | | | N/A | |
| Diversified International | | | 0.25% | | | | 1.00 | % | | | 1.00 | % | | | 0.25 | % | | | N/A | | | | 0.50 | % |
| |
| (1) | Prior to January 2, 2008 the fee for Global Value Choice Class A was 0.35%. The Distributor voluntarily has agreed to waive a portion of the service fee on Class A, Class B and Class C shares. |
| |
| (2) | The Distributor has agreed to waive 0.10% of the Distribution Fee for Class A shares of Emerging Countries for the period from January 1, 2008 through December 31, 2008. Previously, the Distributor had agreed to waive 0.10% of the Distribution Fee for Class A shares of Emerging Countries for the period from January 1, 2007 through December 31, 2007. |
147
NOTES TO FINANCIAL STATEMENTS as of October 31, 2008 (continued)
NOTE 6 — DISTRIBUTION AND SERVICE FEES (continued)
| |
| (3) | The Distributor has voluntarily agreed to waive 0.25% of the Distribution Fee for Class Q shares and a portion of the Distribution Fee for Class C shares of International Value for the period from January 1, 2007 through December 31, 2008. |
Fees paid to the Distributor by class during the year ended October 31, 2008 are shown in the accompanying Statements of Operations. The Distributor voluntarily waived $31,987 of 12b-1 fees for International Growth Opportunities of Class Q shares.
The Distributor also receives the proceeds of the initial sales charge paid by shareholders upon the purchase of Class A shares, and the contingent deferred sales charge paid by shareholders upon certain redemptions for Class A and Class C shares. For the year ended October 31, 2008, the Distributor retained the following amounts in sales charges for the Funds:
| | | | | | | | | |
| | | Class A
| | Class C
|
| | | Shares | | Shares |
| |
Initial Sales Charges: | | | | | | | | |
| Global Equity Dividend | | $ | 31,112 | | | | N/A | |
| Global Natural Resources | | | 46,274 | | | | N/A | |
| Global Real Estate | | | 204,247 | | | | N/A | |
| Global Value Choice | | | 19,334 | | | | N/A | |
| Asia-Pacific Real Estate | | | 1,128 | | | | N/A | |
| Disciplined International SmallCap | | | 223 | | | | N/A | |
| Emerging Countries | | | 24,864 | | | | N/A | |
| European Real Estate | | | 2,050 | | | | N/A | |
| Foreign | | | 42,978 | | | | N/A | |
| Greater China | | | 36,194 | | | | N/A | |
| Index Plus International Equity | | | 1,538 | | | | N/A | |
| International Capital Appreciation | | | 4,007 | | | | N/A | |
| International Equity Dividend | | | 2,078 | | | | N/A | |
| International Growth Opportunities | | | 4,356 | | | | N/A | |
| International Real Estate | | | 26,026 | | | | N/A | |
| International SmallCap Multi-Manager | | | 27,155 | | | | N/A | |
| International Value | | | 1,141 | | | | N/A | |
| International Value Choice | | | 5,426 | | | | N/A | |
| Russia | | | 507,712 | | | | N/A | |
| Emerging Markets Fixed Income | | | 1,391 | | | | N/A | |
| Global Bond | | | 38,003 | | | | N/A | |
| Diversified International | | | 141,086 | | | | N/A | |
| | | | | | | | | |
| | | | | | | | | |
Contingent Deferred Sales Charges: | | | | | | | | |
| Global Equity Dividend | | | 2,950 | | | | 13,206 | |
| Global Natural Resources | | | 13 | | | | — | |
| Global Real Estate | | | 14,354 | | | | 102,953 | |
| Global Value Choice | | | 388 | | | | 4,474 | |
| Asia-Pacific Real Estate | | | — | | | | 70 | |
| Disciplined International SmallCap | | | — | | | | 274 | |
| Emerging Countries | | | 4,189 | | | | 15,227 | |
| European Real Estate | | | — | | | | 282 | |
| Foreign | | | 5,387 | | | | 20,139 | |
| Greater China | | | 2,612 | | | | 11,709 | |
| Index Plus International Equity | | | — | | | | 313 | |
| International Capital Appreciation | | | — | | | | 231 | |
| International Equity Dividend | | | — | | | | 330 | |
| International Growth Opportunities | | | — | | | | 534 | |
| International Real Estate | | | 18,455 | | | | 30,095 | |
| International SmallCap Multi-Manager | | | 8,432 | | | | 17,549 | |
| International Value | | | 2,933 | | | | 1,186 | |
| International Value Choice | | | — | | | | 899 | |
| Emerging Markets Fixed Income | | | — | | | | 1,097 | |
| Global Bond | | | 3,285 | | | | 18,407 | |
| Diversified International Fund | | | 10,334 | | | | 43,462 | |
NOTE 7 — OTHER TRANSACTIONS WITH AFFILIATES AND RELATED PARTIES
At October 31, 2008, the Funds had the following amounts recorded in payable to affiliates on the accompanying Statements of Assets and Liabilities (See Notes 5 and 6):
| | | | | | | | | | | | | | | | | | | | | |
| | | | | | | Accrued
| | | | |
| | | Accrued
| | | | Shareholder
| | | | |
| | | Investment
| | Accrued
| | Service and
| | | | |
| | | Management
| | Administrative
| | Distribution
| | Accrued
| | |
Fund | | Fees | | Fees | | Fees | | Recoupment | | Total |
| |
| Global Equity Dividend | | $ | 93,387 | | | $ | 13,341 | | | $ | 81,671 | | | $ | — | | | $ | 188,399 | |
| Global Natural Resources | | | 63,603 | | | | 7,083 | | | | 17,704 | | | | — | | | | 88,390 | |
| Global Real Estate | | | 818,899 | | | | 111,980 | | | | 342,440 | | | | — | | | | 1,273,319 | |
| Global Value Choice | | | 58,560 | | | | 6,515 | | | | 25,392 | | | | — | | | | 90,467 | |
| Asia-Pacific Real Estate | | | 6,390 | | | | 640 | | | | 4,372 | | | | — | | | | 11,402 | |
| Disciplined International SmallCap | | | 108,797 | | | | 18,133 | | | | 79 | | | | — | | | | 127,009 | |
| Emerging Countries | | | 114,118 | | | | 9,129 | | | | 31,391 | | | | 186 | | | | 154,824 | |
| European Real Estate | | | 3,045 | | | | 305 | | | | 803 | | | | — | | | | 4,153 | |
| Foreign | | | 311,767 | | | | 31,216 | | | | 144,232 | | | | — | | | | 487,215 | |
| Greater China | | | 27,843 | | | | 2,421 | | | | 9,389 | | | | — | | | | 39,653 | |
| Index Plus International Equity | | | 53,761 | | | | 9,775 | | | | 64,780 | | | | — | | | | 128,316 | |
| International Capital Appreciation | | | 40,016 | | | | 4,707 | | | | 1,070 | | | | — | | | | 45,793 | |
| International Equity Dividend | | | 24,822 | | | | 3,310 | | | | 1,153 | | | | — | | | | 29,285 | |
| International Growth Opportunities | | | 59,619 | | | | 5,962 | | | | 18,855 | | | | — | | | | 84,436 | |
| International Real Estate | | | 361,373 | | | | 37,989 | | | | 58,796 | | | | 9,705 | | | | 467,863 | |
| International SmallCap Multi-Manager | | | 373,461 | | | | 37,035 | | | | 102,671 | | | | — | | | | 513,167 | |
| International Value | | | 1,911,075 | | | | 191,257 | | | | 630,866 | | | | — | | | | 2,733,198 | |
| International Value Choice | | | 44,955 | | | | 4,503 | | | | 5,820 | | | | — | | | | 55,278 | |
| Russia | | | 290,964 | | | | 23,277 | | | | 58,193 | | | | — | | | | 372,434 | |
| Emerging Markets Fixed Income | | | 124,753 | | | | 19,206 | | | | 1,921 | | | | — | | | | 145,880 | |
| Global Bond | | | 36,676 | | | | 9,657 | | | | 45,426 | | | | — | | | | 91,759 | |
| Diversified International | | | — | | | | 24,676 | | | | 129,135 | | | | — | | | | 153,811 | |
At October 31, 2008, the following indirect, wholly owned subsidiaries of ING Groep owned the following Funds:
ING Diversified International — Emerging Countries (10.60%); Foreign (19.05%); Index Plus International Equity (25.73%); International Capital Appreciation (95.50%); International Growth Opportunities (18.14%); International Equity Dividend (93.25%);
148
NOTES TO FINANCIAL STATEMENTS as of October 31, 2008 (continued)
NOTE 7 — OTHER TRANSACTIONS WITH AFFILIATES AND RELATED PARTIES (continued)
International SmallCap Multi-Manager (5.11%); and International Value Choice (66.14%).
ING Life Insurance and Annuity Company — Asia Pacific Real Estate (33.64%); European Real Estate (83.01%); Global Bond (21.43%); Greater China (16.07%); and International SmallCap Multi-Manager (7.10%).
ING LifeStyle Aggressive Growth Portfolio — Disciplined International SmallCap (16.53%).
ING LifeStyle Growth Portfolio — Disciplined International SmallCap (41.04%) and Emerging Markets Fixed Income (39.16%).
ING LifeStyle Moderate Growth Portfolio — Disciplined International SmallCap (28.54%) and Emerging Markets Fixed Income (32.67%).
ING LifeStyle Moderate Portfolio — Disciplined International SmallCap (12.92%) and Emerging Markets Fixed Income (24.66%).
ING Luxembourg SA — International Real Estate (11.79%).
ING National Trust — International Growth Opportunities (13.78%).
ING Strategic Allocation Growth — Index Plus International Equity (8.41%).
ING Strategic Allocation Moderate — Index Plus International Equity (6.74%).
Control is defined by the 1940 Act as the beneficial ownership, either directly or through one or more controlled companies, of more than 25% of the voting securities of a company. Investment activities of these shareholders could have a material impact on the Funds.
The Investment Adviser may request that the Funds’ portfolio managers use their best efforts (subject to obtaining best execution of each transaction) to allocate a portfolio’s equity security transactions through certain designated broker-dealers. The designated broker-dealer, in turn, will reimburse a portion of the brokerage commissions to pay certain expenses of that Fund. Any amounts credited to a Fund are reflected as a reimbursement of expenses in the Statements of Operations.
The Registrants have adopted a Retirement Policy covering all independent trustees of the Funds who will have served as an independent trustee for at least five years at the time of retirement. Benefits under this plan are based on an annual rate as defined in the plan agreement.
The following Funds placed a portion of their portfolio transactions with brokerage firms which are affiliates of the investment adviser. The commissions paid to these affiliated firms were:
| | | | | | | |
| | | Affiliated
| | Commissions
|
Fund | | Brokers | | Paid |
| |
| Global Real Estate | | ING Baring LLC | | $ | 129,492 | |
| Asia Pacific Real Estate | | ING Baring LLC | | | 1,444 | |
| Emerging Countries | | ING Baring LLC | | | 11,862 | |
| Foreign | | ING Baring LLC | | | 11,736 | |
| | | ING Financial Markets LLC | | | 5,664 | |
| Greater China | | ING Baring LLC | | | 27,010 | |
| International Real Estate | | ING Baring LLC | | | 74,990 | |
| Russia | | ING Baring LLC | | | 27,824 | |
NOTE 8 — OTHER ACCRUED EXPENSES AND LIABILITIES
At October 31, 2008, the Funds had the following payables included in Other Accrued Expenses and Liabilities on the Statements of Assets and Liabilities that exceeded 5% of total liabilities:
| | | | | | | |
Fund | | Accrued Expenses | | Amount |
| |
| European Real Estate | | Audit | | $ | 9,137 | |
| Index Plus International Equity | | Custody | | | 37,846 | |
| | | Transfer Agent | | | 68,566 | |
| | | Audit | | | 37,440 | |
| | | Postage | | | 22,599 | |
| | | Printing | | | 23,707 | |
| International Equity Dividend | | Custody | | | 8,697 | |
| | | Transfer Agent | | | 8,918 | |
| | | Audit | | | 8,131 | |
| Diversified International | | Transfer Agent | | | 119,825 | |
NOTE 9 — EXPENSE LIMITATIONS
The Investment Adviser has agreed to limit expenses, excluding interest expense, taxes, brokerage commissions and extraordinary expenses (and acquired fund fees and expenses) to the levels listed below:
Maximum Operating Expense Limit (as a percentage of average net assets)
| | | | | | | | | | | | | | | | | | | | | | | | | | | | | | | | | |
| | | Class A | | Class B | | Class C | | Class I | | Class O | | Class Q | | Class R | | Class W |
| |
| Global Equity Dividend | | | 1.40 | % | | | 2.15 | % | | | 2.15 | % | | | 1.15 | % | | | 1.40 | % | | | N/A | | | | N/A | | | | 1.15 | % |
| | | | | | | | | | | | | | | | | | | | | | | | | | | | | | | | | |
| Global Natural Resources | | | 2.75 | % | | | N/A | | | | N/A | | | | 2.50 | % | | | N/A | | | | N/A | | | | N/A | | | | 2.50 | % |
| | | | | | | | | | | | | | | | | | | | | | | | | | | | | | | | | |
| Global Real Estate | | | 1.75 | % | | | 2.50 | % | | | 2.50 | % | | | 1.50 | % | | | 1.75 | % | | | N/A | | | | N/A | | | | 1.50 | % |
| | | | | | | | | | | | | | | | | | | | | | | | | | | | | | | | | |
Global Value Choice(1) | | | 1.50 | % | | | 2.25 | % | | | 2.25 | % | | | 1.25 | % | | | N/A | | | | 1.50 | % | | | N/A | | | | N/A | |
| | | | | | | | | | | | | | | | | | | | | | | | | | | | | | | | | |
| Asia-Pacific Real Estate | | | 1.75 | % | | | 2.50 | % | | | 2.50 | % | | | 1.50 | % | | | N/A | | | | N/A | | | | N/A | | | | N/A | |
| | | | | | | | | | | | | | | | | | | | | | | | | | | | | | | | | |
| Disciplined International SmallCap | | | 1.20 | % | | | 1.95 | % | | | 1.95 | % | | | 0.95 | % | | | N/A | | | | N/A | | | | N/A | | | | N/A | |
| | | | | | | | | | | | | | | | | | | | | | | | | | | | | | | | | |
Emerging Countries(2) | | | 2.25 | % | | | 2.90 | % | | | 2.90 | % | | | 1.90 | % | | | N/A | | | | 2.15 | % | | | N/A | | | | 1.90 | % |
| | | | | | | | | | | | | | | | | | | | | | | | | | | | | | | | | |
| European Real Estate | | | 1.75 | % | | | 2.50 | % | | | 2.50 | % | | | 1.50 | % | | | N/A | | | | N/A | | | | N/A | | | | N/A | |
| | | | | | | | | | | | | | | | | | | | | | | | | | | | | | | | | |
Foreign(3) | | | 1.95 | % | | | 2.70 | % | | | 2.70 | % | | | 1.60 | % | | | N/A | | | | 1.85 | % | | | N/A | | | | 1.45 | % |
149
NOTES TO FINANCIAL STATEMENTS as of October 31, 2008 (continued)
NOTE 9 — EXPENSE LIMITATIONS (continued)
| | | | | | | | | | | | | | | | | | | | | | | | | | | | | | | | | |
| | | Class A | | Class B | | Class C | | Class I | | Class O | | Class Q | | Class R | | Class W |
| |
| | | | | | | | | | | | | | | | | | | | | | | | | | | | | | | | | |
Greater China(4) | | | N/A | | | | N/A | | | | N/A | | | | N/A | | | | N/A | | | | N/A | | | | N/A | | | | N/A | |
| | | | | | | | | | | | | | | | | | | | | | | | | | | | | | | | | |
| Index Plus International Equity | | | 1.15 | % | | | 1.90 | % | | | 1.90 | % | | | 0.90 | % | | | 1.15 | % | | | N/A | | | | N/A | | | | N/A | |
| | | | | | | | | | | | | | | | | | | | | | | | | | | | | | | | | |
| International Capital Appreciation | | | 1.50 | % | | | 2.25 | % | | | 2.25 | % | | | 1.25 | % | | | N/A | | | | N/A | | | | N/A | | | | N/A | |
| | | | | | | | | | | | | | | | | | | | | | | | | | | | | | | | | |
| International Equity Dividend | | | 1.40 | % | | | 2.15 | % | | | 2.15 | % | | | 1.15 | % | | | N/A | | | | N/A | | | | N/A | | | | 1.15 | % |
| | | | | | | | | | | | | | | | | | | | | | | | | | | | | | | | | |
International Growth Opportunities(5) | | | 2.75 | % | | | 3.50 | % | | | 3.50 | % | | | 2.50 | % | | | N/A | | | | 2.75 | % | | | N/A | | | | N/A | |
| | | | | | | | | | | | | | | | | | | | | | | | | | | | | | | | | |
| International Real Estate | | | 1.50 | % | | | 2.25 | % | | | 2.25 | % | | | 1.25 | % | | | N/A | | | | N/A | | | | N/A | | | | 1.25 | % |
| | | | | | | | | | | | | | | | | | | | | | | | | | | | | | | | | |
| International SmallCap Multi-Manager | | | 1.95 | % | | | 2.60 | % | | | 2.60 | % | | | 1.40 | % | | | 1.85 | % | | | 1.85 | % | | | N/A | | | | 1.60 | % |
| | | | | | | | | | | | | | | | | | | | | | | | | | | | | | | | | |
| International Value | | | N/A | | | | N/A | | | | N/A | | | | N/A | | | | N/A | | | | N/A | | | | N/A | | | | N/A | |
| | | | | | | | | | | | | | | | | | | | | | | | | | | | | | | | | |
| International Value Choice | | | 1.70 | % | | | 2.45 | % | | | 2.45 | % | | | 1.45 | % | | | N/A | | | | N/A | | | | N/A | | | | N/A | |
| | | | | | | | | | | | | | | | | | | | | | | | | | | | �� | | | | | |
| Russia | | | 3.35 | % | | | N/A | | | | N/A | | | | N/A | | | | N/A | | | | N/A | | | | N/A | | | | N/A | |
| | | | | | | | | | | | | | | | | | | | | | | | | | | | | | | | | |
| Emerging Markets Fixed Income | | | 1.25 | % | | | 2.00 | % | | | 2.00 | % | | | 1.00 | % | | | N/A | | | | N/A | | | | N/A | | | | N/A | |
| | | | | | | | | | | | | | | | | | | | | | | | | | | | | | | | | |
| Global Bond | | | 0.90 | % | | | 1.65 | % | | | 1.65 | % | | | 0.61 | % | | | 0.90 | % | | | N/A | | | | N/A | | | | N/A | |
| | | | | | | | | | | | | | | | | | | | | | | | | | | | | | | | | |
Diversified International(6) | | | 0.35 | % | | | 1.10 | % | | | 1.10 | % | | | 0.10 | % | | | 0.35 | % | | | N/A | | | | 0.60 | % | | | 0.10 | % |
| |
| (1) | Prior to January 2, 2008, Global Value Choice limits were 1.85%, 2.50%, 2.50%, 1.50%, and 1.75% for Classes A, B, C, I and Q respectively. |
| (2) | Effective January 1, 2008, pursuant to a side agreement, ING Investments has lowered the expense limits for Emerging Countries through at least March 1, 2009. The expense limits for Emerging Countries are 2.10%, 2.85%, 2.85% and 2.10% for Class A, B, C and Q shares, respectively. If, after March 1, 2009, ING Investments elects not to renew the side agreement, the expense limits will revert to the limits listed in the table above. There is no guarantee that this side agreement will continue after that date. The side agreement will only renew if ING Investments elects to renew it. Any fees waived pursuant to the side agreement shall not be eligible for recoupment. |
| (3) | Pursuant to a side agreement dated March 1, 2008, ING Investments has lowered the expense limits for Foreign through at least March 1, 2009. The expense limits for Foreign are 1.70%, 2.45%, 2.45%, 1.35% and 1.60% for Class A, B, C, I and Q shares, respectively. If, after March 1, 2009, ING Investments elects not to renew the side agreement, the expense limits will revert to the limits listed in the table above. There is no guarantee that this side agreement will continue after that date. The side agreement will only renew if ING Investments elects to renew it. |
| (4) | Pursuant to a side agreement dated November 1, 2007, the expense limits for Greater China are 2.10%, 2.85%, 2.85% and 1.85% for Class A, B, C and I shares, respectively, through March 1, 2009. Effective December 17, 2007, the expense limit for Class O shares is 2.10% through March 1, 2010. There is no guarantee that this side agreement will continue after that date. This side agreement will only renew if ING Investments elects to renew it. Any fees waived pursuant to the side agreement shall not be eligible for recoupment. |
| (5) | Pursuant to a side agreement dated March 1, 2008, ING Investments has lowered the expense limits for International Growth Opportunities through at least March 1, 2009. The expense limits for International Growth Opportunities are 1.95%, 2.70%, 2.70%, 1.60% and 1.85% for Class A, B, C, I and Q shares, respectively. If, after March 1, 2009, ING Investments elects not to renew the side agreement, the expense limits will revert to the limits listed in the table above. There is no guarantee that this side agreement will continue after that date. The side agreement will only renew if ING Investments elects to renew it. |
| (6) | The operating expense limits for Diversified International set out above apply only at the fund level and do not limit the fees payable by the underlying investment companies in which the fund invests. The total expense limits including the underlying investment companies are 1.47%, 2.22%, 2.22% 1.22% and 1.72% for Class A, B, C, I and R shares, respectively. Effective December 17, 2007, the total expense limit was 1.22% for Class W shares. |
The Investment Adviser may at a later date recoup from a Fund management fees waived and other expenses assumed by the Investment Adviser during the previous 36 months, but only if, after such recoupment, a Fund’s expense ratio does not exceed the percentage described above. Waived and reimbursed fees net of any recoupment by the Investment Adviser of such waived and reimbursed fees are reflected on the accompanying Statement of Operations for each Fund. Amounts payable by the Investment Adviser are reflected on the accompanying Statements of Assets and Liabilities for each Fund.
As of October 31, 2008, the amounts of waived or reimbursed fees that are subject to possible recoupment by the Investment Adviser, and the related expiration dates, are as follows:
| | | | | | | | | | | | | | | | | |
| | | 2009 | | 2010 | | 2011 | | Total |
| |
| Global Equity Dividend | | $ | — | | | $ | — | | | $ | 46,818 | | | $ | 46,818 | |
| Asia-Pacific Real Estate | | | — | | | | — | | | | 142,848 | | | | 142,848 | |
| European Real Estate | | | — | | | | — | | | | 138,620 | | | | 138,620 | |
| Index Plus International Equity | | | — | | | | — | | | | 936,939 | | | | 936,939 | |
| International Equity Dividend | | | — | | | | 24,309 | | | | 122,873 | | | | 147,182 | |
| Global Bond | | | 39,924 | | | | 148,408 | | | | 86,497 | | | | 274,829 | |
| Diversified International | | | 372,357 | | | | 1,428,892 | | | | 1,337,950 | | | | 3,139,199 | |
The expense limitation agreements are contractual and shall renew automatically for one-year terms unless ING Investments or IMF provides written notice of the termination of the expense limitation agreement at least 90 days prior to the end of the then current term.
NOTE 10 — WRITTEN OPTIONS
Transactions in written options for Global Bond for the year ended October 31, 2008 were as follows:
| | | | | | | | | |
| | | EUR
| | |
| | | Notional | | Premium |
| |
| Balance at 10/31/07 | | | — | | | $ | — | |
| Options Written | | | 5,000,000 | | | | 8,160 | |
| Options Expired | | | (5,000,000 | ) | | | (8,160 | ) |
| Balance at 10/31/08 | | | — | | | $ | — | |
| | | | | | | | | |
NOTE 11 — LINE OF CREDIT
All of the Funds included in this report, in addition to certain other funds managed by the Investment Adviser, have entered into an unsecured committed revolving line of credit agreement (the “Credit Agreement”) with The Bank of New York Mellon (“BNY”) for an aggregate amount of $125,000,000.
150
NOTES TO FINANCIAL STATEMENTS as of October 31, 2008 (continued)
NOTE 11 — LINE OF CREDIT (continued)
The proceeds may be used only to: (1) temporarily finance the purchase and sale of securities; (2) finance the redemption of shares of an investor in the Funds; and (3) enable the Funds to meet other emergency expenses as defined in the Credit Agreement. The Funds to which the line of credit is available pay a commitment fee equal to 0.07% per annum on the daily unused portion of the committed line amount payable quarterly in arrears.
The following Funds utilized the line of credit during the year ended October 31, 2008:
| | | | | | | | | | | | | |
| | | | | | | Approximate
|
| | | | | | | Weighted
|
| | | | | Approximate
| | Average
|
| | | | | Average Daily
| | Interest Rate
|
| | | Days
| | Balance for
| | for Days
|
Fund | | Utilized | | Days Utilized | | Utilized |
| |
| Global Equity Dividend | | | 6 | | | $ | 1,555,000 | | | | 1.79 | % |
| Global Natural Resources | | | 109 | | | | 669,725 | | | | 3.51 | % |
| Global Real Estate | | | 6 | | | | 3,320,000 | | | | 3.17 | % |
| Global Value Choice | | | 15 | | | | 825,667 | | | | 2.46 | % |
| Disciplined International SmallCap | | | 64 | | | | 2,698,906 | | | | 3.11 | % |
| Emerging Countries | | | 30 | | | | 5,178,000 | | | | 2.66 | % |
| Foreign | | | 13 | | | | 5,256,923 | | | | 1.48 | % |
| Greater China | | | 29 | | | | 685,517 | | | | 1.61 | % |
| Index Plus International Equity | | | 66 | | | | 7,209,318 | | | | 4.02 | % |
International Capital Appreciation(1) | | | 64 | | | | 834,219 | | | | 2.31 | % |
| International Growth Opportunities | | | 54 | | | | 1,080,741 | | | | 3.62 | % |
| International Real Estate | | | 7 | | | | 10,635,714 | | | | 1.33 | % |
International SmallCap Multi-Manager(2) | | | 200 | | | | 4,936,120 | | | | 4.04 | % |
| International Value | | | 69 | | | | 12,254,638 | | | | 2.51 | % |
| International Value Choice | | | 6 | | | | 535,000 | | | | 2.98 | % |
| Russia | | | 49 | | | | 7,842,041 | | | | 2.44 | % |
| Emerging Markets Fixed Income | | | 5 | | | | 1,670,000 | | | | 2.66 | % |
| Global Bond | | | 6 | | | | 1,075,000 | | | | 4.75 | % |
| |
| (1) | At October 31, 2008, International Capital Appreciation had an outstanding balance of $340,000. |
| |
| (2) | At October 31, 2008, International SmallCap Multi-Manager had an outstanding balance of $3,300,000. |
151
NOTES TO FINANCIAL STATEMENTS as of October 31, 2008 (continued)
NOTE 11 — LINE OF CREDIT (continued)
NOTE 12 — CAPITAL SHARES
Transactions in capital shares and dollars were as follows:
| | | | | | | | | | | | | | | | | | | | | | | | | |
| | | Class A | | Class B | | Class C |
| | | Year Ended
| | Year Ended
| | Year Ended
| | Year Ended
| | Year Ended
| | Year Ended
|
| | | October 31,
| | October 31,
| | October 31,
| | October 31,
| | October 31,
| | October 31,
|
| | | 2008 | | 2007 | | 2008 | | 2007 | | 2008 | | 2007 |
| |
| | | | | | | | | | | | | | | | | | | | | | | | | |
Global Equity Dividend
(Number of Shares) | | | | | | | | | | | | | | | | | | | | | | | | |
| Shares sold | | | 1,684,371 | | | | 6,497,494 | | | | 209,008 | | | | 1,035,641 | | | | 939,460 | | | | 3,220,887 | |
| Reinvestment of distributions | | | 898,653 | | | | 465,717 | | | | 285,087 | | | | 161,965 | | | | 532,700 | | | | 259,339 | |
| Shares redeemed | | | (6,232,831 | ) | | | (3,024,146 | ) | | | (1,516,147 | ) | | | (595,508 | ) | | | (3,351,816 | ) | | | (965,038 | ) |
| | | | | | | | | | | | | | | | | | | | | | | | | |
| Net increase (decrease) in shares outstanding | | | (3,649,807 | ) | | | 3,939,065 | | | | (1,022,052 | ) | | | 602,098 | | | | (1,879,656 | ) | | | 2,515,188 | |
| | | | | | | | | | | | | | | | | | | | | | | | | |
Global Equity Dividend ($) | | | | | | | | | | | | | | | | | | | | | | | | |
| Shares sold | | $ | 22,771,615 | | | $ | 104,816,704 | | | $ | 2,887,159 | | | $ | 16,616,360 | | | $ | 12,444,478 | | | $ | 51,629,780 | |
| Reinvestment of distributions | | | 12,354,667 | | | | 7,440,753 | | | | 3,919,259 | | | | 2,570,336 | | | | 7,312,315 | | | | 4,112,436 | |
| Shares redeemed | | | (80,691,472 | ) | | | (48,779,296 | ) | | | (19,421,680 | ) | | | (9,575,960 | ) | | | (42,088,864 | ) | | | (15,559,185 | ) |
| | | | | | | | | | | | | | | | | | | | | | | | | |
| Net increase (decrease) | | $ | (45,565,190 | ) | | $ | 63,478,161 | | | $ | (12,615,262 | ) | | $ | 9,610,736 | | | $ | (22,332,071 | ) | | $ | 40,183,031 | |
| | | | | | | | | | | | | | | | | | | | | | | | | |
| | | | | | | | | | | | | | | | | | | | | | | | | |
| | | Class I | | Class O | | Class W | | |
| | | | | August 1,
| | | | November 15,
| | February 12,
| | |
| | | Year Ended
| | 2007(1) to
| | Year Ended
| | 2006(1) to
| | 2008(1) to
| | |
| | | October 31,
| | October 31,
| | October 31,
| | October 31,
| | October 31,
| | |
| | | 2008 | | 2007 | | 2008 | | 2007 | | 2008 | | |
| |
| | | | | | | | | | | | | | | | | | | | | | | | | |
Global Equity Dividend
(Number of Shares) | | | | | | | | | | | | | | | | | | | | | | | | |
| Shares sold | | | 138,648 | | | | 64 | | | | 782,090 | | | | 1,823,965 | | | | 7,672 | | | | | |
| Reinvestment of distributions | | | 1,647 | | | | — | | | | 191,680 | | | | 33,142 | | | | 89 | | | | | |
| Shares redeemed | | | (2,887 | ) | | | — | | | | (706,072 | ) | | | (446,487 | ) | | | (418 | ) | | | | |
| | | | | | | | | | | | | | | | | | | | | | | | | |
| Net increase in shares outstanding | | | 137,408 | | | | 64 | | | | 267,698 | | | | 1,410,620 | | | | 7,343 | | | | | |
| | | | | | | | | | | | | | | | | | | | | | | | | |
Global Equity Dividend ($) | | | | | | | | | | | | | | | | | | | | | | | | |
| Shares sold | | $ | 1,611,488 | | | $ | 1,018 | | | $ | 10,540,572 | | | $ | 29,498,450 | | | $ | 100,945 | | | | | |
| Reinvestment of distributions | | | 17,934 | | | | — | | | | 2,607,486 | | | | 540,071 | | | | 1,106 | | | | | |
| Shares redeemed | | | (27,782 | ) | | | — | | | | (9,001,556 | ) | | | (7,222,361 | ) | | | (4,290 | ) | | | | |
| | | | | | | | | | | | | | | | | | | | | | | | | |
| Net increase | | $ | 1,601,640 | | | $ | 1,018 | | | $ | 4,146,502 | | | $ | 22,816,160 | | | $ | 97,761 | | | | | |
| | | | | | | | | | | | | | | | | | | | | | | | | |
| | | | | | | | | | | | | | | | | | | | | | | | | |
| | | | | | | | | | | | | | | | | | | | | | | | | |
| | | Class A | | Class I | | Class W | | |
| | | | | | | | | August 1,
| | February 12,
| | |
| | | Year Ended
| | Year Ended
| | Year Ended
| | 2007(1) to
| | 2008(1) to
| | |
| | | October 31,
| | October 31,
| | October 31,
| | October 31,
| | October 31,
| | |
| | | 2008 | | 2007 | | 2008 | | 2007 | | 2008 | | |
| |
Global Natural Resources
(Number of Shares) | | | | | | | | | | | | | | | | | | | | | | | | |
| Shares sold | | | 1,790,153 | | | | 1,398,112 | | | | 7 | | | | 157 | | | | 4,103 | | | | | |
| Reinvestment of distributions | | | 2,336,443 | | | | 570,030 | | | | 20 | | | | — | | | | (1 | ) | | | | |
| Shares redeemed | | | (2,810,465 | ) | | | (2,449,466 | ) | | | (83 | ) | | | (1 | ) | | | (840 | ) | | | | |
| | | | | | | | | | | | | | | | | | | | | | | | | |
| Net increase (decrease) in shares outstanding | | | 1,316,131 | | | | (481,324 | ) | | | (56 | ) | | | 156 | | | | 3,262 | | | | | |
| | | | | | | | | | | | | | | | | | | | | | | | | |
Global Natural Resources ($) | | | | | | | | | | | | | | | | | | | | | | | | |
| Shares sold | | $ | 20,032,450 | | | $ | 16,676,935 | | | $ | 100 | | | $ | 2,027 | | | $ | 49,821 | | | | | |
| Reinvestment of distributions | | | 25,092,175 | | | | 6,190,526 | | | | 209 | | | | — | | | | (14 | ) | | | | |
| Shares redeemed | | | (29,521,523 | ) | | | (27,924,309 | ) | | | (913 | ) | | | (12 | ) | | | (9,597 | ) | | | | |
| | | | | | | | | | | | | | | | | | | | | | | | | |
| Net increase (decrease) | | $ | 15,603,102 | | | $ | (5,056,848 | ) | | $ | (604 | ) | | $ | 2,015 | | | $ | 40,210 | | | | | |
| | | | | | | | | | | | | | | | | | | | | | | | | |
| |
| (1) | Commencement of operations. |
NOTES TO FINANCIAL STATEMENTS as of October 31, 2008 (continued)
NOTE 12 — CAPITAL SHARES (continued)
| | | | | | | | | | | | | | | | | | | | | | | | | |
| | | Class A | | Class B | | Class C |
| | | Year Ended
| | Year Ended
| | Year Ended
| | Year Ended
| | Year Ended
| | Year Ended
|
| | | October 31,
| | October 31,
| | October 31,
| | October 31,
| | October 31,
| | October 31,
|
| | | 2008 | | 2007 | | 2008 | | 2007 | | 2008 | | 2007 |
| |
| | | | | | | | | | | | | | | | | | | | | | | | | |
Global Real Estate
(Number of Shares) | | | | | | | | | | | | | | | | | | | | | | | | |
| Shares sold | | | 51,167,781 | | | | 44,628,840 | | | | 352,926 | | | | 1,826,489 | | | | 5,702,611 | | | | 11,726,737 | |
| Reinvestment of distributions | | | 1,640,309 | | | | 1,488,668 | | | | 77,469 | | | | 108,319 | | | | 352,125 | | | | 364,760 | |
| Shares redeemed | | | (32,356,404 | ) | | | (21,034,520 | ) | | | (1,008,421 | ) | | | (786,045 | ) | | | (6,377,998 | ) | | | (3,551,184 | ) |
| | | | | | | | | | | | | | | | | | | | | | | | | |
| Net increase (decrease) in shares outstanding | | | 20,451,686 | | | | 25,082,988 | | | | (578,026 | ) | | | 1,148,763 | | | | (323,262 | ) | | | 8,540,313 | |
| | | | | | | | | | | | | | | | | | | | | | | | | |
Global Real Estate ($) | | | | | | | | | | | | | | | | | | | | | | | | |
| Shares sold | | $ | 937,189,621 | | | $ | 1,053,431,057 | | | $ | 5,817,538 | | | $ | 37,270,066 | | | $ | 98,932,052 | | | $ | 250,279,742 | |
| Reinvestment of distributions | | | 31,783,397 | | | | 34,928,676 | | | | 1,303,042 | | | | 2,180,962 | | | | 6,199,754 | | | | 7,711,845 | |
| Shares redeemed | | | (577,604,547 | ) | | | (490,048,454 | ) | | | (15,872,425 | ) | | | (15,294,287 | ) | | | (104,028,388 | ) | | | (72,337,353 | ) |
| | | | | | | | | | | | | | | | | | | | | | | | | |
| Net increase (decrease) | | $ | 391,368,471 | | | $ | 598,311,279 | | | $ | (8,751,845 | ) | | $ | 24,156,741 | | | $ | 1,103,418 | | | $ | 185,654,234 | |
| | | | | | | | | | | | | | | | | | | | | | | | | |
| | | | | | | | | | | | | | | | | | | | | | | | | |
| | | | | | | | | | | | | | | | | | | | | | | | | |
| | | Class I | | Class O | | Class W | | |
| | | | | | | | | November 15,
| | February 12,
| | |
| | | Year Ended
| | Year Ended
| | Year Ended
| | 2006(1) to
| | 2008(1) to
| | |
| | | October 31,
| | October 31,
| | October 31,
| | October 31,
| | October 31,
| | |
| | | 2008 | | 2007 | | 2008 | | 2007 | | 2008 | | |
| |
Global Real Estate
(Number of Shares) | | | | | | | | | | | | | | | | | | | | | | | | |
| Shares sold | | | 17,361,717 | | | | 2,833,616 | | | | 353,337 | | | | 1,927,071 | | | | 4,363,284 | | | | | |
| Reinvestment of distributions | | | 287,474 | | | | 51,336 | | | | 38,884 | | | | 32,070 | | | | 36,962 | | | | | |
| Shares redeemed | | | (2,851,439 | ) | | | (214,363 | ) | | | (456,536 | ) | | | (878,519 | ) | | | (411,336 | ) | | | | |
| | | | | | | | | | | | | | | | | | | | | | | | | |
| Net increase (decrease) in shares outstanding | | | 14,797,752 | | | | 2,670,589 | | | | (64,315 | ) | | | 1,080,622 | | | | 3,988,910 | | | | | |
| | | | | | | | | | | | | | | | | | | | | | | | | |
Global Real Estate ($) | | | | | | | | | | | | | | | | | | | | | | | | |
| Shares sold | | $ | 322,700,380 | | | $ | 65,388,279 | | | $ | 6,903,345 | | | $ | 46,088,840 | | | $ | 81,150,156 | | | | | |
| Reinvestment of distributions | | | 5,302,392 | | | | 1,203,302 | | | | 762,024 | | | | 756,820 | | | | 636,668 | | | | | |
| Shares redeemed | | | (47,800,551 | ) | | | (4,776,229 | ) | | | (8,610,674 | ) | | | (20,349,596 | ) | | | (6,448,716 | ) | | | | |
| | | | | | | | | | | | | | | | | | | | | | | | | |
| Net increase (decrease) | | $ | 280,202,221 | | | $ | 61,815,352 | | | $ | (945,305 | ) | | $ | 26,496,064 | | | $ | 75,338,108 | | | | | |
| | | | | | | | | | | | | | | | | | | | | | | | | |
| | | | | | | | | | | | | | | | | | | | | | | | | |
| | | | | | | | | | | | | | | | | | | | | | | | | |
| | | Class A | | Class B | | Class C |
| | | Year Ended
| | Year Ended
| | Year Ended
| | Year Ended
| | Year Ended
| | Year Ended
|
| | | October 31,
| | October 31,
| | October 31,
| | October 31,
| | October 31,
| | October 31,
|
| | | 2008 | | 2007 | | 2008 | | 2007 | | 2008 | | 2007 |
| |
Global Value Choice
(Number of Shares) | | | | | | | | | | | | | | | | | | | | | | | | |
| Shares sold | | | 1,396,794 | | | | 413,843 | | | | 108,879 | | | | 125,643 | | | | 271,913 | | | | 224,819 | |
| Reinvestment of distributions | | | 7,665 | | | | — | | | | — | | | | — | | | | 565 | | | | — | |
| Shares redeemed | | | (1,196,047 | ) | | | (528,474 | ) | | | (458,496 | ) | | | (312,118 | ) | | | (418,092 | ) | | | (281,123 | ) |
| | | | | | | | | | | | | | | | | | | | | | | | | |
| Net increase (decrease) in shares outstanding | | | 208,412 | | | | (114,631 | ) | | | (349,617 | ) | | | (186,475 | ) | | | (145,614 | ) | | | (56,304 | ) |
| | | | | | | | | | | | | | | | | | | | | | | | | |
Global Value Choice ($) | | | | | | | | | | | | | | | | | | | | | | | | |
| Shares sold | | $ | 34,725,305 | | | $ | 10,390,704 | | | $ | 2,970,432 | | | $ | 3,421,856 | | | $ | 6,485,007 | | | $ | 5,420,100 | |
| Reinvestment of distributions | | | 197,906 | | | | — | | | | — | | | | — | | | | 14,032 | | | | — | |
| Shares redeemed | | | (27,864,080 | ) | | | (13,039,443 | ) | | | (12,293,459 | ) | | | (8,358,692 | ) | | | (9,480,420 | ) | | | (6,746,051 | ) |
| | | | | | | | | | | | | | | | | | | | | | | | | |
| Net increase (decrease) | | $ | 7,059,131 | | | $ | (2,648,739 | ) | | $ | (9,323,027 | ) | | $ | (4,936,836 | ) | | $ | (2,981,381 | ) | | $ | (1,325,951 | ) |
| | | | | | | | | | | | | | | | | | | | | | | | | |
| |
| (1) | Commencement of operations. |
153
NOTES TO FINANCIAL STATEMENTS as of October 31, 2008 (continued)
NOTE 12 — CAPITAL SHARES (continued)
| | | | | | | | | | | | | | | | | | | | | | | | | |
| | | Class I | | Class Q | | | | |
| | | Year Ended
| | Year Ended
| | Year Ended
| | Year Ended
| | | | |
| | | October 31,
| | October 31,
| | October 31,
| | October 31,
| | | | |
| | | 2008 | | 2007 | | 2008 | | 2007 | | | | |
| |
| | | | | | | | | | | | | | | | | | | | | | | | | |
Global Value Choice
(Number of Shares) | | | | | | | | | | | | | | | | | | | | | | | | |
| Shares sold | | | 164,533 | | | | 185,884 | | | | 17,033 | | | | 9,271 | | | | | | | | | |
| Reinvestment of distributions | | | 3,007 | | | | — | | | | 511 | | | | — | | | | | | | | | |
| Shares redeemed | | | (99,756 | ) | | | (49,776 | ) | | | (29,161 | ) | | | (38,134 | ) | | | | | | | | |
| | | | | | | | | | | | | | | | | | | | | | | | | |
| Net increase (decrease) in shares outstanding | | | 67,784 | | | | 136,108 | | | | (11,617 | ) | | | (28,863 | ) | | | | | | | | |
| | | | | | | | | | | | | | | | | | | | | | | | | |
Global Value Choice ($) | | | | | | | | | | | | | | | | | | | | | | | | |
| Shares sold | | $ | 4,158,310 | | | $ | 4,448,082 | | | $ | 484,802 | | | $ | 270,527 | | | | | | | | | |
| Reinvestment of distributions | | | 77,786 | | | | — | | | | 15,493 | | | | — | | | | | | | | | |
| Shares redeemed | | | (2,306,604 | ) | | | (1,272,296 | ) | | | (816,263 | ) | | | (1,113,397 | ) | | | | | | | | |
| | | | | | | | | | | | | | | | | | | | | | | | | |
| Net increase (decrease) | | $ | 1,929,492 | | | $ | 3,175,786 | | | $ | (315,968 | ) | | $ | (842,870 | ) | | | | | | | | |
| | | | | | | | | | | | | | | | | | | | | | | | | |
| | | | | | | | | | | | | | | | | | | | | | | | | |
| | | | | | | | | | | | | | | | | | | | | | | | | |
| | | Class A | | Class B | | Class C | | Class I | | | | |
| | | Year Ended
| | Year Ended
| | Year Ended
| | Year Ended
| | | | |
| | | October 31,
| | October 31,
| | October 31,
| | October 31,
| | | | |
| | | 2008 | | 2008 | | 2008 | | 2008 | | | | |
| |
Asia-Pacific Real Estate
(Number of Shares) | | | | | | | | | | | | | | | | | | | | | | | | |
| Shares sold | | | 780,760 | | | | 4,402 | | | | 974,716 | | | | 102 | | | | | | | | | |
| Reinvestment of distributions | | | 980 | | | | 26 | | | | 110 | | | | — | | | | | | | | | |
| Shares redeemed | | | (84,459 | ) | | | (382 | ) | | | (189,935 | ) | | | (1 | ) | | | | | | | | |
| | | | | | | | | | | | | | | | | | | | | | | | | |
| Net increase in shares outstanding | | | 697,281 | | | | 4,046 | | | | 784,891 | | | | 101 | | | | | | | | | |
| | | | | | | | | | | | | | | | | | | | | | | | | |
Asia-Pacific Real Estate ($) | | | | | | | | | | | | | | | | | | | | | | | | |
| Shares sold | | $ | 6,996,175 | | | $ | 35,352 | | | $ | 6,392,882 | | | $ | 1,020 | | | | | | | | | |
| Reinvestment of distributions | | | 6,748 | | | | 201 | | | | 803 | | | | — | | | | | | | | | |
| Shares redeemed | | | (456,097 | ) | | | (3,153 | ) | | | (834,587 | ) | | | (10 | ) | | | | | | | | |
| | | | | | | | | | | | | | | | | | | | | | | | | |
| Net increase | | $ | 6,546,826 | | | $ | 32,400 | | | $ | 5,559,098 | | | $ | 1,010 | | | | | | | | | |
| | | | | | | | | | | | | | | | | | | | | | | | | |
| | | | | | | | | | | | | | | | | | | | | | | | | |
| | | | | | | | | | | | | | | | | | | | | | | | | |
| | | Class A | | Class B | | Class C |
| | | | | December 20,
| | | | December 20,
| | | | December 20,
|
| | | Year Ended
| | 2006(1) to
| | Year Ended
| | 2006(1) to
| | Year Ended
| | 2006(1) to
|
| | | October 31,
| | October 31,
| | October 31,
| | October 31,
| | October 31,
| | October 31,
|
| | | 2008 | | 2007 | | 2008 | | 2007 | | 2008 | | 2007 |
| |
Disciplined International SmallCap
(Number of Shares) | | | | | | | | | | | | | | | | | | | | | | | | |
| Shares sold | | | 19,758 | | | | 9,086 | | | | 217 | | | | 439 | | | | 12,431 | | | | 5,041 | |
| Reinvestment of distributions | | | 191 | | | | — | | | | 7 | | | | — | | | | 88 | | | | — | |
| Shares redeemed | | | (12,354 | ) | | | (3,367 | ) | | | (120 | ) | | | — | | | | (4,187 | ) | | | (427 | ) |
| | | | | | | | | | | | | | | | | | | | | | | | | |
| Net increase in shares outstanding | | | 7,595 | | | | 5,719 | | | | 104 | | | | 439 | | | | 8,332 | | | | 4,614 | |
| | | | | | | | | | | | | | | | | | | | | | | | | |
Disciplined International SmallCap ($) | | | | | | | | | | | | | | | | | | | | | | | | |
| Shares sold | | $ | 202,660 | | | $ | 103,553 | | | $ | 2,108 | | | $ | 4,533 | | | $ | 107,822 | | | $ | 57,840 | |
| Reinvestment of distributions | | | 1,955 | | | | — | | | | 67 | | | | — | | | | 897 | | | | — | |
| Shares redeemed | | | (131,071 | ) | | | (37,185 | ) | | | (1,189 | ) | | | — | | | | (38,859 | ) | | | (4,978 | ) |
| | | | | | | | | | | | | | | | | | | | | | | | | |
| Net increase | | $ | 73,544 | | | $ | 66,368 | | | $ | 986 | | | $ | 4,533 | | | $ | 69,860 | | | $ | 52,862 | |
| | | | | | | | | | | | | | | | | | | | | | | | | |
| |
| (1) | Commencement of operations. |
154
NOTES TO FINANCIAL STATEMENTS as of October 31, 2008 (continued)
NOTE 12 — CAPITAL SHARES (continued)
| | | | | | | | | | | | | | | | | | | | | | | | | |
| | | Class I | | | | | | | | |
| | | | | December 20,
| | | | | | | | |
| | | Year Ended
| | 2006(1) to
| | | | | | | | |
| | | October 31,
| | October 31,
| | | | | | | | |
| | | 2008 | | 2007 | | | | | | | | |
| |
| | | | | | | | | | | | | | | | | | | | | | | | | |
Disciplined International SmallCap
(Number of Shares) | | | | | | | | | | | | | | | | | | | | | | | | |
| Shares sold | | | 21,115,273 | | | | 43,082,677 | | | | | | | | | | | | | | | | | |
| Reinvestment of distributions | | | 1,061,868 | | | | — | | | | | | | | | | | | | | | | | |
| Shares redeemed | | | (20,578,255 | ) | | | (4,681,887 | ) | | | | | | | | | | | | | | | | |
| | | | | | | | | | | | | | | | | | | | | | | | | |
| Net increase in shares outstanding | | | 1,598,886 | | | | 38,400,790 | | | | | | | | | | | | | | | | | |
| | | | | | | | | | | | | | | | | | | | | | | | | |
Disciplined International SmallCap ($) | | | | | | | | | | | | | | | | | | | | | | | | |
| Shares sold | | $ | 185,110,629 | | | $ | 492,455,050 | | | | | | | | | | | | | | | | | |
| Reinvestment of distributions | | | 10,882,081 | | | | — | | | | | | | | | | | | | | | | | |
| Shares redeemed | | | (203,193,132 | ) | | | (54,244,725 | ) | | | | | | | | | | | | | | | | |
| | | | | | | | | | | | | | | | | | | | | | | | | |
| Net increase (decrease) | | $ | (7,200,422 | ) | | $ | 438,210,325 | | | | | | | | | | | | | | | | | |
| | | | | | | | | | | | | | | | | | | | | | | | | |
| | | | | | | | | | | | | | | | | | | | | | | | | |
| | | | | | | | | | | | | | | | | | | | | | | | | |
| | | Class A | | Class B | | Class C |
| | | Year Ended
| | Year Ended
| | Year Ended
| | Year Ended
| | Year Ended
| | Year Ended
|
| | | October 31,
| | October 31,
| | October 31,
| | October 31,
| | October 31,
| | October 31,
|
| | | 2008 | | 2007 | | 2008 | | 2007 | | 2008 | | 2007 |
| |
Emerging Countries
(Number of Shares) | | | | | | | | | | | | | | | | | | | | | | | | |
| Shares sold | | | 822,906 | | | | 1,677,506 | | | | 48,419 | | | | 120,366 | | | | 173,763 | | | | 415,931 | |
| Proceeds from shares issued in merger | | | — | | | | 48,167 | | | | — | | | | — | | | | — | | | | — | |
| Reinvestment of distributions | | | 176,088 | | | | 49,397 | | | | 12,124 | | | | 2,139 | | | | 40,672 | | | | 6,705 | |
| Shares redeemed | | | (2,002,850 | ) | | | (1,177,964 | ) | | | (195,755 | ) | | | (180,617 | ) | | | (631,418 | ) | | | (323,475 | ) |
| | | | | | | | | | | | | | | | | | | | | | | | | |
| Net increase (decrease) in shares outstanding | | | (1,003,856 | ) | | | 597,106 | | | | (135,212 | ) | | | (58,112 | ) | | | (416,983 | ) | | | 99,161 | |
| | | | | | | | | | | | | | | | | | | | | | | | | |
Emerging Countries ($) | | | | | | | | | | | | | | | | | | | | | | | | |
| Shares sold | | $ | 28,711,056 | | | $ | 61,051,631 | | | $ | 1,665,983 | | | $ | 4,540,140 | | | $ | 5,571,813 | | | $ | 14,223,797 | |
| Proceeds from shares issued in merger | | | — | | | | 1,570,432 | | | | — | | | | — | | | | — | | | | — | |
| Reinvestment of distributions | | | 6,292,464 | | | | 1,591,065 | | | | 427,641 | | | | 67,985 | | | | 1,351,224 | | | | 201,560 | |
| Shares redeemed | | | (63,446,626 | ) | | | (42,526,644 | ) | | | (5,956,437 | ) | | | (6,583,827 | ) | | | (17,685,013 | ) | | | (10,757,579 | ) |
| | | | | | | | | | | | | | | | | | | | | | | | | |
| Net increase (decrease) | | $ | (28,443,106 | ) | | $ | 21,686,484 | | | $ | (3,862,813 | ) | | $ | (1,975,702 | ) | | $ | (10,761,976 | ) | | $ | 3,667,778 | |
| | | | | | | | | | | | | | | | | | | | | | | | | |
| | | | | | | | | | | | | | | | | | | | | | | | | |
| | | | | | | | | | | | | | | | | | | | | | | | | |
| | | Class I | | Class M | | Class Q |
| | | Year Ended
| | Year Ended
| | Year Ended
| | Year Ended
| | Year Ended
| | Year Ended
|
| | | October 31,
| | October 31,
| | October 31,
| | October 31,
| | October 31,
| | October 31,
|
| | | 2008 | | 2007 | | 2008 | | 2007 | | 2008 | | 2007 |
| |
Emerging Countries
(Number of Shares) | | | | | | | | | | | | | | | | | | | | | | | | |
| Shares sold | | | 1,116,587 | | | | 517,678 | | | | — | | | | 49 | | | | 108,895 | | | | 383,862 | |
| Proceeds from shares issued in merger | | | — | | | | — | | | | — | | | | (48,826 | ) | | | — | | | | — | |
| Reinvestment of distributions | | | 48,781 | | | | 13,851 | | | | — | | | | 425 | | | | 20,139 | | | | 5,154 | |
| Shares redeemed | | | (1,019,536 | ) | | | (322,580 | ) | | | — | | | | (1,853 | ) | | | (316,696 | ) | | | (243,283 | ) |
| | | | | | | | | | | | | | | | | | | | | | | | | |
| Net increase (decrease) in shares outstanding | | | 145,832 | | | | 208,949 | | | | — | | | | (50,205 | ) | | | (187,662 | ) | | | 145,733 | |
| | | | | | | | | | | | | | | | | | | | | | | | | |
Emerging Countries ($) | | | | | | | | | | | | | | | | | | | | | | | | |
| Shares sold | | $ | 36,867,641 | | | $ | 18,694,152 | | | $ | — | | | $ | 1,496 | | | $ | 3,902,063 | | | $ | 14,213,705 | |
| Proceeds from shares issued in merger | | | — | | | | — | | | | — | | | | (1,570,432 | ) | | | — | | | | — | |
| Reinvestment of distributions | | | 1,745,240 | | | | 446,558 | | | | — | | | | 13,499 | | | | 745,231 | | | | 171,687 | |
| Redemption fee proceeds | | | — | | | | — | | | | — | | | | — | | | | — | | | | — | |
| Shares redeemed | | | (33,127,020 | ) | | | (11,228,172 | ) | | | — | | | | (57,877 | ) | | | (10,326,260 | ) | | | (8,769,423 | ) |
| | | | | | | | | | | | | | | | | | | | | | | | | |
| Net increase (decrease) | | $ | 5,485,861 | | | $ | 7,912,538 | | | $ | — | | | $ | (1,613,314 | ) | | $ | (5,678,966 | ) | | $ | 5,615,969 | |
| | | | | | | | | | | | | | | | | | | | | | | | | |
| |
| (1) | Commencement of operations. |
155
NOTES TO FINANCIAL STATEMENTS as of October 31, 2008 (continued)
NOTE 12 — CAPITAL SHARES (continued)
| | | | | | | | | | | | | | | | | | | | | | | | | |
| | | Class W | | | | | | | | | | |
| | | February 12,
| | | | | | | | | | |
| | | 2008(1) to
| | | | | | | | | | |
| | | October 31,
| | | | | | | | | | |
| | | 2008 | | | | | | | | | | |
| |
| | | | | | | | | | | | | | | | | | | | | | | | | |
Emerging Countries
(Number of Shares) | | | | | | | | | | | | | | | | | | | | | | | | |
| Shares sold | | | 4,607 | | | | | | | | | | | | | | | | | | | | | |
| Reinvestment of distributions | | | 1 | | | | | | | | | | | | | | | | | | | | | |
| Shares redeemed | | | (2,479 | ) | | | | | | | | | | | | | | | | | | | | |
| | | | | | | | | | | | | | | | | | | | | | | | | |
| Net increase in shares outstanding | | | 2,129 | | | | | | | | | | | | | | | | | | | | | |
| | | | | | | | | | | | | | | | | | | | | | | | | |
Emerging Countries ($) | | | | | | | | | | | | | | | | | | | | | | | | |
| Shares sold | | $ | 162,983 | | | | | | | | | | | | | | | | | | | | | |
| Reinvestment of distributions | | | 11 | | | | | | | | | | | | | | | | | | | | | |
| Shares redeemed | | | (78,082 | ) | | | | | | | | | | | | | | | | | | | | |
| | | | | | | | | | | | | | | | | | | | | | | | | |
| Net increase | | $ | 84,912 | | | | | | | | | | | | | | | | | | | | | |
| | | | | | | | | | | | | | | | | | | | | | | | | |
| | | | | | | | | | | | | | | | | | | | | | | | | |
| | | | | | | | | | | | | | | | | | | | | | | | | |
| | | Class A | | Class B | | Class C | | Class I | | | | |
| | | Year Ended
| | Year Ended
| | Year Ended
| | Year Ended
| | | | |
| | | October 31,
| | October 31,
| | October 31,
| | October 31,
| | | | |
| | | 2008 | | 2008 | | 2008 | | 2008 | | | | |
| |
European Real Estate
(Number of Shares) | | | | | | | | | | | | | | | | | | | | | | | | |
| Shares sold | | | 693,672 | | | | 3,076 | | | | 19,205 | | | | 102 | | | | | | | | | |
| Reinvestment of distributions | | | 1,632 | | | | 24 | | | | 66 | | | | — | | | | | | | | | |
| Shares redeemed | | | (103,326 | ) | | | (1,157 | ) | | | (10,195 | ) | | | (1 | ) | | | | | | | | |
| | | | | | | | | | | | | | | | | | | | | | | | | |
| Net increase in shares outstanding | | | 591,978 | | | | 1,943 | | | | 9,076 | | | | 101 | | | | | | | | | |
| | | | | | | | | | | | | | | | | | | | | | | | | |
European Real Estate ($) | | | | | | | | | | | | | | | | | | | | | | | | |
| Shares sold | | $ | 6,733,767 | | | $ | 28,991 | | | $ | 181,711 | | | $ | 1,020 | | | | | | | | | |
| Reinvestment of distributions | | | 13,407 | | | | 196 | | | | 545 | | | | — | | | | | | | | | |
| Shares redeemed | | | (796,654 | ) | | | (9,393 | ) | | | (89,452 | ) | | | (10 | ) | | | | | | | | |
| | | | | | | | | | | | | | | | | | | | | | | | | |
| Net increase | | $ | 5,950,520 | | | $ | 19,794 | | | $ | 92,804 | | | $ | 1,010 | | | | | | | | | |
| | | | | | | | | | | | | | | | | | | | | | | | | |
| | | | | | | | | | | | | | | | | | | | | | | | | |
| | | | | | | | | | | | | | | | | | | | | | | | | |
| | | Class A | | Class B | | Class C |
| | | Year Ended
| | Year Ended
| | Year Ended
| | Year Ended
| | Year Ended
| | Year Ended
|
| | | October 31,
| | October 31,
| | October 31,
| | October 31,
| | October 31,
| | October 31,
|
| | | 2008 | | 2007 | | 2008 | | 2007 | | 2008 | | 2007 |
| |
Foreign
(Number of Shares) | | | | | | | | | | | | | | | | | | | | | | | | |
| Shares sold | | | 4,911,276 | | | | 5,586,881 | | | | 239,123 | | | | 465,033 | | | | 1,811,561 | | | | 2,788,802 | |
| Reinvestment of distributions | | | 689,975 | | | | 268,335 | | | | 113,030 | | | | 54,324 | | | | 458,623 | | | | 201,179 | |
| Shares redeemed | | | (7,518,393 | ) | | | (2,834,087 | ) | | | (876,325 | ) | | | (418,014 | ) | | | (3,336,522 | ) | | | (1,297,440 | ) |
| | | | | | | | | | | | | | | | | | | | | | | | | |
| Net increase (decrease) in shares outstanding | | | (1,917,142 | ) | | | 3,021,129 | | | | (524,172 | ) | | | 101,343 | | | | (1,066,338 | ) | | | 1,692,541 | |
| | | | | | | | | | | | | | | | | | | | | | | | | |
Foreign ($) | | | | | | | | | | | | | | | | | | | | | | | | |
| Shares sold | | $ | 94,565,312 | | | $ | 116,065,154 | | | $ | 4,648,104 | | | $ | 9,375,051 | | | $ | 33,659,479 | | | $ | 55,924,710 | |
| Reinvestment of distributions | | | 14,109,997 | | | | 5,170,819 | | | | 2,230,091 | | | | 1,019,661 | | | | 9,062,384 | | | | 3,781,772 | |
| Shares redeemed | | | (128,973,992 | ) | | | (58,600,260 | ) | | | (15,036,348 | ) | | | (8,375,577 | ) | | | (57,534,479 | ) | | | (26,171,530 | ) |
| | | | | | | | | | | | | | | | | | | | | | | | | |
| Net increase (decrease) | | $ | (20,298,683 | ) | | $ | 62,635,713 | | | $ | (8,158,153 | ) | | $ | 2,019,135 | | | $ | (14,812,616 | ) | | $ | 33,534,952 | |
| | | | | | | | | | | | | | | | | | | | | | | | | |
| |
| (1) | Commencement of operations. |
156
NOTES TO FINANCIAL STATEMENTS as of October 31, 2008 (continued)
NOTE 12 — CAPITAL SHARES (continued)
| | | | | | | | | | | | | | | | | | | | | | | | | |
| | | Class I | | Class Q | | Class W | | |
| | | | | | | | | | | February 12,
| | |
| | | Year Ended
| | Year Ended
| | Year Ended
| | Year Ended
| | 2008(1) to
| | |
| | | October 31,
| | October 31,
| | October 31,
| | October 31,
| | October 31,
| | |
| | | 2008 | | 2007 | | 2008 | | 2007 | | 2008 | | |
| |
| | | | | | | | | | | | | | | | | | | | | | | | | |
Foreign
(Number of Shares) | | | | | | | | | | | | | | | | | | | | | | | | |
| Shares sold | | | 2,258,533 | | | | 2,245,294 | | | | — | | | | 234 | | | | 42,471 | | | | | |
| Reinvestment of distributions | | | 317,295 | | | | 121,586 | | | | 2,445 | | | | 2,264 | | | | — | | | | | |
| Shares redeemed | | | (1,415,836 | ) | | | (1,080,849 | ) | | | (33,010 | ) | | | (30,513 | ) | | | (19,175 | ) | | | | |
| | | | | | | | | | | | | | | | | | | | | | | | | |
| Net increase (decrease) in shares outstanding | | | 1,159,992 | | | | 1,286,031 | | | | (30,565 | ) | | | (28,015 | ) | | | 23,296 | | | | | |
| | | | | | | | | | | | | | | | | | | | | | | | | |
Foreign ($) | | | | | | | | | | | | | | | | | | | | | | | | |
| Shares sold | | $ | 44,056,759 | | | $ | 47,286,509 | | | $ | — | | | $ | 5,012 | | | $ | 878,887 | | | | | |
| Reinvestment of distributions | | | 6,602,918 | | | | 2,373,357 | | | | 50,214 | | | | 43,762 | | | | — | | | | | |
| Shares redeemed | | | (22,601,262 | ) | | | (22,654,368 | ) | | | (440,821 | ) | | | (652,894 | ) | | | (309,649 | ) | | | | |
| | | | | | | | | | | | | | | | | | | | | | | | | |
| Net increase (decrease) | | $ | 28,058,415 | | | $ | 27,005,498 | | | $ | (390,607 | ) | | $ | (604,120 | ) | | $ | 569,238 | | | | | |
| | | | | | | | | | | | | | | | | | | | | | | | | |
| | | | | | | | | | | | | | | | | | | | | | | | | |
| | | | | | | | | | | | | | | | | | | | | | | | | |
| | | Class A | | Class B | | Class C |
| | | Year Ended
| | Year Ended
| | Year Ended
| | Year Ended
| | Year Ended
| | Year Ended
|
| | | October 31,
| | October 31,
| | October 31,
| | October 31,
| | October 31,
| | October 31,
|
| | | 2008 | | 2007 | | 2008 | | 2007 | | 2008 | | 2007 |
| |
Greater China
(Number of Shares) | | | | | | | | | | | | | | | | | | | | | | | | |
| Shares sold | | | 947,515 | | | | 2,196,767 | | | | 92,034 | | | | 295,918 | | | | 173,882 | | | | 559,664 | |
| Reinvestment of distributions | | | 239,370 | | | | 4,251 | | | | 29,578 | | | | 626 | | | | 49,298 | | | | 357 | |
| Shares redeemed | | | (1,990,551 | ) | | | (1,077,963 | ) | | | (219,342 | ) | | | (146,993 | ) | | | (439,357 | ) | | | (218,283 | ) |
| | | | | | | | | | | | | | | | | | | | | | | | | |
| Net increase (decrease) in shares outstanding | | | (803,666 | ) | | | 1,123,055 | | | | (97,730 | ) | | | 149,551 | | | | (216,177 | ) | | | 341,738 | |
| | | | | | | | | | | | | | | | | | | | | | | | | |
Greater China ($) | | | | | | | | | | | | | | | | | | | | | | | | |
| Shares sold | | $ | 16,713,689 | | | $ | 36,379,127 | | | $ | 1,652,070 | | | $ | 4,827,247 | | | $ | 3,131,398 | | | $ | 9,969,510 | |
| Reinvestment of distributions | | | 4,242,198 | | | | 59,565 | | | | 517,910 | | | | 8,720 | | | | 863,707 | | | | 4,978 | |
| Shares redeemed | | | (31,428,443 | ) | | | (17,193,019 | ) | | | (3,355,264 | ) | | | (2,430,746 | ) | | | (7,284,343 | ) | | | (3,407,996 | ) |
| | | | | | | | | | | | | | | | | | | | | | | | | |
| Net increase (decrease) | | $ | (10,472,556 | ) | | $ | 19,245,673 | | | $ | (1,185,284 | ) | | $ | 2,405,221 | | | $ | (3,289,238 | ) | | $ | 6,566,492 | |
| | | | | | | | | | | | | | | | | | | | | | | | | |
| | | | | | | | | | | | | | | | | | | | | | | | | |
| | | | | | | | | | | | | | | | | | | | | | | | | |
| | | Class I | | Class O | | | | | | |
| | | | | | | June 4,
| | | | | | |
| | | Year Ended
| | Year Ended
| | 2008(1) to
| | | | | | |
| | | October 31,
| | October 31,
| | October 31,
| | | | | | |
| | | 2008 | | 2007 | | 2008 | | | | | | |
| |
Greater China
(Number of Shares) | | | | | | | | | | | | | | | | | | | | | | | | |
| Shares sold | | | 1,864 | | | | 338 | | | | 29,666 | | | | | | | | | | | | | |
| Reinvestment of distributions | | | 255 | | | | 9 | | | | — | | | | | | | | | | | | | |
| Shares redeemed | | | (31 | ) | | | — | | | | (7,455 | ) | | | | | | | | | | | | |
| | | | | | | | | | | | | | | | | | | | | | | | | |
| Net increase in shares outstanding | | | 2,088 | | | | 347 | | | | 22,211 | | | | | | | | | | | | | |
| | | | | | | | | | | | | | | | | | | | | | | | | |
Greater China ($) | | | | | | | | | | | | | | | | | | | | | | | | |
| Shares sold | | $ | 28,250 | | | $ | 6,820 | | | $ | 389,817 | | | | | | | | | | | | | |
| Reinvestment of distributions | | | 4,518 | | | | 125 | | | | — | | | | | | | | | | | | | |
| Shares redeemed | | | (628 | ) | | | — | | | | (95,367 | ) | | | | | | | | | | | | |
| | | | | | | | | | | | | | | | | | | | | | | | | |
| Net increase | | $ | 32,140 | | | $ | 6,945 | | | $ | 294,450 | | | | | | | | | | | | | |
| | | | | | | | | | | | | | | | | | | | | | | | | |
| |
| (1) | Commencement of operations. |
157
NOTES TO FINANCIAL STATEMENTS as of October 31, 2008 (continued)
NOTE 12 — CAPITAL SHARES (continued)
| | | | | | | | | | | | | | | | | | | | | | | | | |
| | | Class A | | Class B | | Class C |
| | | Year Ended
| | Year Ended
| | Year Ended
| | Year Ended
| | Year Ended
| | Year Ended
|
| | | October 31,
| | October 31,
| | October 31,
| | October 31,
| | October 31,
| | October 31,
|
| | | 2008 | | 2007 | | 2008 | | 2007 | | 2008 | | 2007 |
| |
| | | | | | | | | | | | | | | | | | | | | | | | | |
Index Plus International Equity
(Number of Shares) | | | | | | | | | | | | | | | | | | | | | | | | |
| Shares sold | | | 127,395 | | | | 128,123 | | | | 12,177 | | | | 32,179 | | | | 30,434 | | | | 53,278 | |
| Proceeds from shares issued in merger | | | 2,083,276 | | | | — | | | | 355,813 | | | | — | | | | 197,636 | | | | — | |
| Reinvestment of distributions | | | 15,616 | | | | 1,989 | | | | 6,215 | | | | 632 | | | | 5,787 | | | | 773 | |
| Shares redeemed | | | (898,337 | ) | | | (1,041,019 | ) | | | (177,202 | ) | | | (2,719 | ) | | | (106,330 | ) | | | (18,988 | ) |
| | | | | | | | | | | | | | | | | | | | | | | | | |
| Net increase (decrease) in shares outstanding | | | 1,327,950 | | | | (910,907 | ) | | | 197,003 | | | | 30,092 | | | | 127,527 | | | | 35,063 | |
| | | | | | | | | | | | | | | | | | | | | | | | | |
Index Plus International Equity ($) | | | | | | | | | | | | | | | | | | | | | | | | |
| Shares sold | | $ | 1,262,851 | | | $ | 1,644,502 | | | $ | 132,214 | | | $ | 413,854 | | | $ | 324,453 | | | $ | 680,086 | |
| Proceeds from shares issued in merger | | | 24,809,468 | | | | — | | | | 4,223,697 | | | | — | | | | 2,343,627 | | | | — | |
| Reinvestment of distributions | | | 183,797 | | | | 23,642 | | | | 72,966 | | | | 7,493 | | | | 67,879 | | | | 9,149 | |
| Shares redeemed | | | (9,088,911 | ) | | | (13,003,326 | ) | | | (1,667,340 | ) | | | (36,087 | ) | | | (1,040,718 | ) | | | (234,315 | ) |
| | | | | | | | | | | | | | | | | | | | | | | | | |
| Net increase (decrease) | | $ | 17,167,205 | | | $ | (11,335,182 | ) | | $ | 2,761,537 | | | $ | 385,260 | | | $ | 1,695,241 | | | $ | 454,920 | |
| | | | | | | | | | | | | | | | | | | | | | | | | |
| | | | | | | | | | | | | | | | | | | | | | | | | |
| | | | | | | | | | | | | | | | | | | | | | | | | |
| | | Class I | | Class O | | | | | | |
| | | | | | | November 9,
| | | | | | |
| | | Year Ended
| | Year Ended
| | 2007(1) to
| | | | | | |
| | | October 31,
| | October 31,
| | October 31,
| | | | | | |
| | | 2008 | | 2007 | | 2008 | | | | | | |
| |
Index Plus International Equity
(Number of Shares) | | | | | | | | | | | | | | | | | | | | | | | | |
| Shares sold | | | 8,828,357 | | | | 4,628,592 | | | | 1,292,028 | | | | | | | | | | | | | |
| Proceeds from shares issued in merger | | | 523,573 | | | | — | | | | 7,673,371 | | | | | | | | | | | | | |
| Reinvestment of distributions | | | 1,189,238 | | | | 237,356 | | | | 62 | | | | | | | | | | | | | |
| Shares redeemed | | | (10,454,928 | ) | | | (3,125,186 | ) | | | (2,385,102 | ) | | | | | | | | | | | | |
| | | | | | | | | | | | | | | | | | | | | | | | | |
| Net increase in shares outstanding | | | 86,240 | | | | 1,740,762 | | | | 6,580,359 | | | | | | | | | | | | | |
| | | | | | | | | | | | | | | | | | | | | | | | | |
Index Plus International Equity($) | | | | | | | | | | | | | | | | | | | | | | | | |
| Shares sold | | $ | 95,723,393 | | | $ | 59,372,768 | | | $ | 13,220,056 | | | | | | | | | | | | | |
| Proceeds from shares issued in merger | | | 6,258,727 | | | | — | | | | 90,795,795 | | | | | | | | | | | | | |
| Reinvestment of distributions | | | 14,056,792 | | | | 2,817,418 | | | | 730 | | | | | | | | | | | | | |
| Shares redeemed | | | (102,148,610 | ) | | | (39,684,824 | ) | | | (22,842,487 | ) | | | | | | | | | | | | |
| | | | | | | | | | | | | | | | | | | | | | | | | |
| Net increase | | $ | 13,890,302 | | | $ | 22,505,362 | | | $ | 81,174,094 | | | | | | | | | | | | | |
| | | | | | | | | | | | | | | | | | | | | | | | | |
| | | | | | | | | | | | | | | | | | | | | | | | | |
| | | | | | | | | | | | | | | | | | | | | | | | | |
| | | Class A | | Class B | | Class C |
| | | Year Ended
| | Year Ended
| | Year Ended
| | Year Ended
| | Year Ended
| | Year Ended
|
| | | October 31,
| | October 31,
| | October 31,
| | October 31,
| | October 31,
| | October 31,
|
| | | 2008 | | 2007 | | 2008 | | 2007 | | 2008 | | 2007 |
| |
International Capital Appreciation
(Number of Shares) | | | | | | | | | | | | | | | | | | | | | | | | |
| Shares sold | | | 96,218 | | | | 192,965 | | | | 46,616 | | | | 61,628 | | | | 53,113 | | | | 66,475 | |
| Reinvestment of distributions | | | 4,821 | | | | 413 | | | | 2,138 | | | | 115 | | | | 1,936 | | | | 123 | |
| Shares redeemed | | | (169,646 | ) | | | (207,146 | ) | | | (70,820 | ) | | | (3,275 | ) | | | (67,450 | ) | | | (6,361 | ) |
| | | | | | | | | | | | | | | | | | | | | | | | | |
| Net increase (decrease) in shares outstanding | | | (68,607 | ) | | | (13,768 | ) | | | (22,066 | ) | | | 58,468 | | | | (12,401 | ) | | | 60,237 | |
| | | | | | | | | | | | | | | | | | | | | | | | | |
International Capital Appreciation ($) | | | | | | | | | | | | | | | | | | | | | | | | |
| Shares sold | | $ | 1,239,482 | | | $ | 2,368,777 | | | $ | 580,009 | | | $ | 807,880 | | | $ | 645,740 | | | $ | 888,507 | |
| Reinvestment of distributions | | | 62,381 | | | | 4,867 | | | | 27,323 | | | | 1,344 | | | | 24,821 | | | | 1,448 | |
| Shares redeemed | | | (1,327,786 | ) | | | (2,460,407 | ) | | | (807,705 | ) | | | (40,301 | ) | | | (714,775 | ) | | | (80,137 | ) |
| | | | | | | | | | | | | | | | | | | | | | | | | |
| Net increase (decrease) | | $ | (25,923 | ) | | $ | (86,763 | ) | | $ | (200,373 | ) | | $ | 768,923 | | | $ | (44,214 | ) | | $ | 809,818 | |
| | | | | | | | | | | | | | | | | | | | | | | | | |
| |
| (1) | Commencement of operations. |
158
NOTES TO FINANCIAL STATEMENTS as of October 31, 2008 (continued)
NOTE 12 — CAPITAL SHARES (continued)
| | | | | | | | | | | | | | | | | | | | | | | | | |
| | | Class I | | | | | | | | |
| | | Year Ended
| | Year Ended
| | | | | | | | |
| | | October 31,
| | October 31,
| | | | | | | | |
| | | 2008 | | 2007 | | | | | | | | |
| |
| | | | | | | | | | | | | | | | | | | | | | | | | |
International Capital Appreciation
(Number of Shares) | | | | | | | | | | | | | | | | | | | | | | | | |
| Shares sold | | | 1,662,796 | | | | 5,530,264 | | | | | | | | | | | | | | | | | |
| Reinvestment of distributions | | | 515,675 | | | | 128,072 | | | | | | | | | | | | | | | | | |
| Shares redeemed | | | (4,514,825 | ) | | | (331,815 | ) | | | | | | | | | | | | | | | | |
| | | | | | | | | | | | | | | | | | | | | | | | | |
| Net increase (decrease) in shares outstanding | | | (2,336,354 | ) | | | 5,326,521 | | | | | | | | | | | | | | | | | |
| | | | | | | | | | | | | | | | | | | | | | | | | |
International Capital Appreciation ($) | | | | | | | | | | | | | | | | | | | | | | | | |
| Shares sold | | $ | 21,649,973 | | | $ | 69,653,165 | | | | | | | | | | | | | | | | | |
| Reinvestment of distributions | | | 6,677,994 | | | | 1,509,974 | | | | | | | | | | | | | | | | | |
| Shares redeemed | | | (49,010,622 | ) | | | (4,575,021 | ) | | | | | | | | | | | | | | | | |
| | | | | | | | | | | | | | | | | | | | | | | | | |
| Net increase (decrease) | | $ | (20,682,655 | ) | | $ | 66,588,118 | | | | | | | | | | | | | | | | | |
| | | | | | | | | | | | | | | | | | | | | | | | | |
| | | | | | | | | | | | | | | | | | | | | | | | | |
| | | | | | | | | | | | | | | | | | | | | | | | | |
| | | Class A | | Class B | | Class C |
| | | | | June 28,
| | | | June 28,
| | | | June 28,
|
| | | Year Ended
| | 2007(1) to
| | Year Ended
| | 2007(1) to
| | Year Ended
| | 2007(1) to
|
| | | October 31,
| | October 31,
| | October 31,
| | October 31,
| | October 31,
| | October 31,
|
| | | 2008 | | 2007 | | 2008 | | 2007 | | 2008 | | 2007 |
| |
International Equity Dividend
(Number of Shares) | | | | | | | | | | | | | | | | | | | | | | | | |
| Shares sold | | | 131,103 | | | | 393,069 | | | | 10,393 | | | | 22,651 | | | | 81,875 | | | | 126,454 | |
| Reinvestment of distributions | | | 13,987 | | | | — | | | | 134 | | | | — | | | | 5,557 | | | | — | |
| Shares redeemed | | | (251,121 | ) | | | (3,131 | ) | | | (2,364 | ) | | | (31 | ) | | | (77,315 | ) | | | — | |
| | | | | | | | | | | | | | | | | | | | | | | | | |
| Net increase (decrease) in shares outstanding | | | (106,031 | ) | | | 389,938 | | | | 8,163 | | | | 22,620 | | | | 10,117 | | | | 126,454 | |
| | | | | | | | | | | | | | | | | | | | | | | | | |
International Equity Dividend ($) | | | | | | | | | | | | | | | | | | | | | | | | |
| Shares sold | | $ | 1,187,362 | | | $ | 3,902,205 | | | $ | 97,508 | | | $ | 218,286 | | | $ | 786,475 | | | $ | 1,252,342 | |
| Reinvestment of distributions | | | 119,484 | | | | — | | | | 1,126 | | | | — | | | | 47,456 | | | | — | |
| Shares redeemed | | | (2,057,092 | ) | | | (31,138 | ) | | | (16,666 | ) | | | (310 | ) | | | (635,175 | ) | | | — | |
| | | | | | | | | | | | | | | | | | | | | | | | | |
| Net increase (decrease) | | $ | (750,246 | ) | | $ | 3,871,067 | | | $ | 81,968 | | | $ | 217,976 | | | $ | 198,756 | | | $ | 1,252,342 | |
| | | | | | | | | | | | | | | | | | | | | | | | | |
| | | | | | | | | | | | | | | | | | | | | | | | | |
| | | | | | | | | | | | | | | | | | | | | | | | | |
| | | Class I | | Class W | | | | | | |
| | | | | June 28,
| | February 12,
| | | | | | |
| | | Year Ended
| | 2007(1) to
| | 2008(1) to
| | | | | | |
| | | October 31,
| | October 31,
| | October 31,
| | | | | | |
| | | 2008 | | 2007 | | 2008 | | | | | | |
| |
International Equity Dividend
(Number of Shares) | | | | | | | | | | | | | | | | | | | | | | | | |
| Shares sold | | | 2,645,507 | | | | 5,265,562 | | | | 2,222 | | | | | | | | | | | | | |
| Reinvestment of distributions | | | 307,787 | | | | — | | | | 67 | | | | | | | | | | | | | |
| Shares redeemed | | | (1,936,510 | ) | | | (7,892 | ) | | | (104 | ) | | | | | | | | | | | | |
| | | | | | | | | | | | | | | | | | | | | | | | | |
| Net increase in shares outstanding | | | 1,016,784 | | | | 5,257,670 | | | | 2,185 | | | | | | | | | | | | | |
| | | | | | | | | | | | | | | | | | | | | | | | | |
International Equity Dividend ($) | | | | | | | | | | | | | | | | | | | | | | | | |
| Shares sold | | $ | 22,644,879 | | | $ | 52,290,180 | | | $ | 21,015 | | | | | | | | | | | | | |
| Reinvestment of distributions | | | 2,559,356 | | | | — | | | | 511 | | | | | | | | | | | | | |
| Shares redeemed | | | (15,129,428 | ) | | | (78,707 | ) | | | (895 | ) | | | | | | | | | | | | |
| | | | | | | | | | | | | | | | | | | | | | | | | |
| Net increase | | $ | 10,074,807 | | | $ | 52,211,473 | | | $ | 20,631 | | | | | | | | | | | | | |
| | | | | | | | | | | | | | | | | | | | | | | | | |
| |
| (1) | Commencement of operations. |
159
NOTES TO FINANCIAL STATEMENTS as of October 31, 2008 (continued)
NOTE 12 — CAPITAL SHARES (continued)
| | | | | | | | | | | | | | | | | | | | | | | | | |
| | | Class A | | Class B | | Class C |
| | | Year Ended
| | Year Ended
| | Year Ended
| | Year Ended
| | Year Ended
| | Year Ended
|
| | | October 31,
| | October 31,
| | October 31,
| | October 31,
| | October 31,
| | October 31,
|
| | | 2008 | | 2007 | | 2008 | | 2007 | | 2008 | | 2007 |
| |
| | | | | | | | | | | | | | | | | | | | | | | | | |
International Growth Opportunities
(Number of Shares) | | | | | | | | | | | | | | | | | | | | | | | | |
| Shares sold | | | 689,059 | | | | 606,666 | | | | 78,682 | | | | 90,648 | | | | 215,015 | | | | 150,534 | |
| Reinvestment of distributions | | | 724,639 | | | | 424,904 | | | | 184,188 | | | | 101,617 | | | | 136,334 | | | | 65,339 | |
| Shares redeemed | | | (1,288,594 | ) | | | (1,337,839 | ) | | | (614,692 | ) | | | (360,538 | ) | | | (431,904 | ) | | | (192,575 | ) |
| | | | | | | | | | | | | | | | | | | | | | | | | |
| Net increase (decrease) in shares outstanding | | | 125,104 | | | | (306,269 | ) | | | (351,822 | ) | | | (168,273 | ) | | | (80,555 | ) | | | 23,298 | |
| | | | | | | | | | | | | | | | | | | | | | | | | |
International Growth Opportunities ($) | | | | | | | | | | | | | | | | | | | | | | | | |
| Shares sold | | $ | 7,810,339 | | | $ | 8,143,922 | | | $ | 878,212 | | | $ | 1,180,526 | | | $ | 2,394,268 | | | $ | 1,979,430 | |
| Reinvestment of distributions | | | 8,779,114 | | | | 5,354,882 | | | | 2,121,081 | | | | 1,234,642 | | | | 1,571,233 | | | | 793,868 | |
| Shares redeemed | | | (13,206,986 | ) | | | (17,966,521 | ) | | | (6,290,257 | ) | | | (4,705,424 | ) | | | (3,806,058 | ) | | | (2,507,472 | ) |
| | | | | | | | | | | | | | | | | | | | | | | | | |
| Net increase (decrease) | | $ | 3,382,467 | | | $ | (4,467,717 | ) | | $ | (3,290,964 | ) | | $ | (2,290,256 | ) | | $ | 159,443 | | | $ | 265,826 | |
| | | | | | | | | | | | | | | | | | | | | | | | | |
| | | | | | | | | | | | | | | | | | | | | | | | | |
| | | | | | | | | | | | | | | | | | | | | | | | | |
| | | Class I | | Class Q | | | | |
| | | Year Ended
| | Year Ended
| | Year Ended
| | Year Ended
| | | | |
| | | October 31,
| | October 31,
| | October 31,
| | October 31,
| | | | |
| | | 2008 | | 2007 | | 2008 | | 2007 | | | | |
| |
International Growth Opportunities
(Number of Shares) | | | | | | | | | | | | | | | | | | | | | | | | |
| Shares sold | | | 2,932,823 | | | | 360,989 | | | | 476,814 | | | | 594,965 | | | | | | | | | |
| Reinvestment of distributions | | | 129,807 | | | | 110,577 | | | | 394,356 | | | | 225,064 | | | | | | | | | |
| Shares redeemed | | | (834,771 | ) | | | (827,433 | ) | | | (1,261,072 | ) | | | (787,068 | ) | | | | | | | | |
| | | | | | | | | | | | | | | | | | | | | | | | | |
| Net increase (decrease) in shares outstanding | | | 2,227,859 | | | | (355,867 | ) | | | (389,902 | ) | | | 32,961 | | | | | | | | | |
| | | | | | | | | | | | | | | | | | | | | | | | | |
International Growth Opportunities ($) | | | | | | | | | | | | | | | | | | | | | | | | |
| Shares sold | | $ | 31,597,804 | | | $ | 4,754,225 | | | $ | 5,537,379 | | | $ | 7,984,633 | | | | | | | | | |
| Reinvestment of distributions | | | 1,563,352 | | | | 1,383,313 | | | | 4,722,652 | | | | 2,804,295 | | | | | | | | | |
| Shares redeemed | | | (7,367,699 | ) | | | (10,767,823 | ) | | | (13,486,319 | ) | | | (10,306,446 | ) | | | | | | | | |
| | | | | | | | | | | | | | | | | | | | | | | | | |
| Net increase (decrease) | | $ | 25,793,457 | | | $ | (4,630,285 | ) | | $ | (3,226,288 | ) | | $ | 482,482 | | | | | | | | | |
| | | | | | | | | | | | | | | | | | | | | | | | | |
| | | | | | | | | | | | | | | | | | | | | | | | | |
| | | | | | | | | | | | | | | | | | | | | | | | | |
| | | Class A | | Class B | | Class C |
| | | Year Ended
| | Year Ended
| | Year Ended
| | Year Ended
| | Year Ended
| | Year Ended
|
| | | October 31,
| | October 31,
| | October 31,
| | October 31,
| | October 31,
| | October 31,
|
| | | 2008 | | 2007 | | 2008 | | 2007 | | 2008 | | 2007 |
| |
International Real Estate
(Number of Shares) | | | | | | | | | | | | | | | | | | | | | | | | |
| Shares sold | | | 8,574,151 | | | | 19,878,781 | | | | 71,839 | | | | 767,102 | | | | 2,194,498 | | | | 8,245,988 | |
| Reinvestment of distributions | | | 545,171 | | | | 123,340 | | | | 23,566 | | | | 5,012 | | | | 169,409 | | | | 30,706 | |
| Shares redeemed | | | (14,791,771 | ) | | | (5,641,413 | ) | | | (329,118 | ) | | | (98,193 | ) | | | (5,422,977 | ) | | | (1,361,519 | ) |
| | | | | | | | | | | | | | | | | | | | | | | | | |
| Net increase (decrease) in shares outstanding | | | (5,672,449 | ) | | | 14,360,708 | | | | (233,713 | ) | | | 673,921 | | | | (3,059,070 | ) | | | 6,915,175 | |
| | | | | | | | | | | | | | | | | | | | | | | | | |
International Real Estate ($) | | | | | | | | | | | | | | | | | | | | | | | | |
| Shares sold | | $ | 100,590,258 | | | $ | 265,384,203 | | | $ | 857,933 | | | $ | 10,170,413 | | | $ | 25,813,659 | | | $ | 109,483,769 | |
| Reinvestment of distributions | | | 6,416,280 | | | | 1,645,656 | | | | 282,366 | | | | 65,277 | | | | 2,032,768 | | | | 401,088 | |
| Shares redeemed | | | (154,954,852 | ) | | | (74,585,692 | ) | | | (3,544,764 | ) | | | (1,277,012 | ) | | | (56,377,064 | ) | | | (17,644,347 | ) |
| | | | | | | | | | | | | | | | | | | | | | | | | |
| Net increase (decrease) | | $ | (47,948,314 | ) | | $ | 192,444,167 | | | $ | (2,404,465 | ) | | $ | 8,958,678 | | | $ | (28,530,637 | ) | | $ | 92,240,510 | |
| | | | | | | | | | | | | | | | | | | | | | | | | |
160
NOTES TO FINANCIAL STATEMENTS as of October 31, 2008 (continued)
NOTE 12 — CAPITAL SHARES (continued)
| | | | | | | | | | | | | | | | | | | | | | | | | |
| | | Class I | | Class W | | | | | | |
| | | | | | | February 12,
| | | | | | |
| | | Year Ended
| | Year Ended
| | 2008(1) to
| | | | | | |
| | | October 31,
| | October 31,
| | October 31,
| | | | | | |
| | | 2008 | | 2007 | | 2008 | | | | | | |
| |
| | | | | | | | | | | | | | | | | | | | | | | | | |
International Real Estate
(Number of Shares) | | | | | | | | | | | | | | | | | | | | | | | | |
| Shares sold | | | 43,441,169 | | | | 6,969,530 | | | | 52,809 | | | | | | | | | | | | | |
| Reinvestment of distributions | | | 428,870 | | | | 90,632 | | | | 124 | | | | | | | | | | | | | |
| Shares redeemed | | | (10,642,891 | ) | | | (268,863 | ) | | | (8,553 | ) | | | | | | | | | | | | |
| | | | | | | | | | | | | | | | | | | | | | | | | |
| Net increase in shares outstanding | | | 33,227,148 | | | | 6,791,299 | | | | 44,380 | | | | | | | | | | | | | |
| | | | | | | | | | | | | | | | | | | | | | | | | |
International Real Estate ($) | | | | | | | | | | | | | | | | | | | | | | | | |
| Shares sold | | $ | 481,407,853 | | | $ | 91,183,483 | | | $ | 568,699 | | | | | | | | | | | | | |
| Reinvestment of distributions | | | 4,893,801 | | | | 1,202,775 | | | | 1,157 | | | | | | | | | | | | | |
| Shares redeemed | | | (95,017,074 | ) | | | (3,540,845 | ) | | | (58,832 | ) | | | | | | | | | | | | |
| | | | | | | | | | | | | | | | | | | | | | | | | |
| Net increase | | $ | 391,284,580 | | | $ | 88,845,413 | | | $ | 511,024 | | | | | | | | | | | | | |
| | | | | | | | | | | | | | | | | | | | | | | | | |
| | | | | | | | | | | | | | | | | | | | | | | | | |
| | | | | | | | | | | | | | | | | | | | | | | | | |
| | | Class A | | Class B | | Class C |
| | | Year Ended
| | Year Ended
| | Year Ended
| | Year Ended
| | Year Ended
| | Year Ended
|
| | | October 31,
| | October 31,
| | October 31,
| | October 31,
| | October 31,
| | October 31,
|
| | | 2008 | | 2007 | | 2008 | | 2007 | | 2008 | | 2007 |
| |
International SmallCap Multi-Manager (Number of Shares) | | | | | | | | | | | | | | | | | | | | | | | | |
| Shares sold | | | 2,979,636 | | | | 5,045,814 | | | | 50,690 | | | | 120,228 | | | | 219,882 | | | | 517,439 | |
| Reinvestment of distributions | | | 998,861 | | | | 20,929 | | | | 118,804 | | | | — | | | | 221,078 | | | | 53 | |
| Shares redeemed | | | (4,779,374 | ) | | | (2,339,921 | ) | | | (623,581 | ) | | | (364,409 | ) | | | (703,134 | ) | | | (324,780 | ) |
| | | | | | | | | | | | | | | | | | | | | | | | | |
| Net increase (decrease) in shares outstanding | | | (800,877 | ) | | | 2,726,822 | | | | (454,087 | ) | | | (244,181 | ) | | | (262,174 | ) | | | 192,712 | |
| | | | | | | | | | | | | | | | | | | | | | | | | |
International SmallCap Multi-Manager ($) | | | | | | | | | | | | | | | | | | | | | | | | |
| Shares sold | | $ | 136,744,112 | | | $ | 301,848,369 | | | $ | 2,540,227 | | | $ | 7,497,411 | | | $ | 9,721,747 | | | $ | 29,552,044 | |
| Reinvestment of distributions | | | 47,137,719 | | | | 1,059,446 | | | | 5,829,623 | | | | — | | | | 9,767,028 | | | | 2,524 | |
| Shares redeemed | | | (202,990,223 | ) | | | (137,896,302 | ) | | | (28,106,960 | ) | | | (21,737,439 | ) | | | (27,322,204 | ) | | | (17,907,434 | ) |
| | | | | | | | | | | | | | | | | | | | | | | | | |
| Net increase (decrease) | | $ | (19,108,392 | ) | | $ | 165,011,513 | | | $ | (19,737,110 | ) | | $ | (14,240,028 | ) | | $ | (7,833,429 | ) | | $ | 11,647,134 | |
| | | | | | | | | | | | | | | | | | | | | | | | | |
| | | | | | | | | | | | | | | | | | | | | | | | | |
| | | | | | | | | | | | | | | | | | | | | | | | | |
| | | Class I | | Class Q | | Class O | | Class W |
| | | | | | | | | | | June 4,
| | February 12,
|
| | | Year Ended
| | Year Ended
| | Year Ended
| | Year Ended
| | 2008(1) to
| | 2008(1) to
|
| | | October 31,
| | October 31,
| | October 31,
| | October 31,
| | October 31,
| | October 31,
|
| | | 2008 | | 2007 | | 2008 | | 2007 | | 2008 | | 2008 |
| |
International SmallCap Multi-Manager (Number of Shares) | | | | | | | | | | | | | | | | | | | | | | | | |
| Shares sold | | | 1,741,676 | | | | 3,249,235 | | | | 441,947 | | | | 851,771 | | | | 4,615 | | | | 424,319 | |
| Reinvestment of distributions | | | 627,880 | | | | 16,186 | | | | 273,392 | | | | 9,277 | | | | — | | | | 2 | |
| Shares redeemed | | | (1,922,882 | ) | | | (516,468 | ) | | | (796,120 | ) | | | (648,584 | ) | | | (1,899 | ) | | | (38,041 | ) |
| | | | | | | | | | | | | | | | | | | | | | | | | |
| Net increase (decrease) in shares outstanding | | | 446,674 | | | | 2,748,953 | | | | (80,781 | ) | | | 212,464 | | | | 2,716 | | | | 386,280 | |
| | | | | | | | | | | | | | | | | | | | | | | | | |
International SmallCap Multi-Manager ($) | | | | | | | | | | | | | | | | | | | | | | | | |
| Shares sold | | $ | 77,860,724 | | | $ | 188,727,994 | | | $ | 21,564,716 | | | $ | 55,349,246 | | | $ | 150,303 | | | $ | 19,393,949 | |
| Reinvestment of distributions | | | 29,679,191 | | | | 819,983 | | | | 14,027,428 | | | | 504,137 | | | | — | | | | 126 | |
| Shares redeemed | | | (82,207,122 | ) | | | (32,274,836 | ) | | | (36,553,425 | ) | | | (41,248,877 | ) | | | (54,844 | ) | | | (1,389,064 | ) |
| | | | | | | | | | | | | | | | | | | | | | | | | |
| Net increase (decrease) | | $ | 25,332,793 | | | $ | 157,273,141 | | | $ | (961,281 | ) | | $ | 14,604,506 | | | $ | 95,459 | | | $ | 18,005,011 | |
| | | | | | | | | | | | | | | | | | | | | | | | | |
| |
| (1) | Commencement of operations. |
161
NOTES TO FINANCIAL STATEMENTS as of October 31, 2008 (continued)
NOTE 12 — CAPITAL SHARES (continued)
| | | | | | | | | | | | | | | | | | | | | | | | | |
| | | Class A | | Class B | | Class C |
| | | Year Ended
| | Year Ended
| | Year Ended
| | Year Ended
| | Year Ended
| | Year Ended
|
| | | October 31,
| | October 31,
| | October 31,
| | October 31,
| | October 31,
| | October 31,
|
| | | 2008 | | 2007 | | 2008 | | 2007 | | 2008 | | 2007 |
| |
| | | | | | | | | | | | | | | | | | | | | | | | | |
International Value
(Number of Shares) | | | | | | | | | | | | | | | | | | | | | | | | |
| Shares sold | | | 15,008,226 | | | | 16,368,193 | | | | 413,342 | | | | 453,105 | | | | 1,347,145 | | | | 834,396 | |
| Reinvestment of distributions | | | 13,738,713 | | | | 7,950,487 | | | | 1,777,035 | | | | 1,377,293 | | | | 4,567,631 | | | | 2,721,822 | |
| Shares redeemed | | | (37,372,970 | ) | | | (24,751,517 | ) | | | (7,626,050 | ) | | | (6,016,199 | ) | | | (9,292,377 | ) | | | (4,638,571 | ) |
| | | | | | | | | | | | | | | | | | | | | | | | | |
| Net decrease in shares outstanding | | | (8,626,031 | ) | | | (432,837 | ) | | | (5,435,673 | ) | | | (4,185,801 | ) | | | (3,377,601 | ) | | | (1,082,353 | ) |
| | | | | | | | | | | | | | | | | | | | | | | | | |
International Value ($) | | | | | | | | | | | | | | | | | | | | | | | | |
| Shares sold | | $ | 263,356,450 | | | $ | 353,613,593 | | | $ | 7,656,523 | | | $ | 9,307,026 | | | $ | 24,318,686 | | | $ | 16,733,659 | |
| Reinvestment of distributions | | | 253,006,563 | | | | 162,571,673 | | | | 32,199,846 | | | | 27,711,130 | | | | 81,988,970 | | | | 54,463,672 | |
| Shares redeemed | | | (604,941,068 | ) | | | (539,661,218 | ) | | | (129,928,893 | ) | | | (129,493,665 | ) | | | (144,620,438 | ) | | | (98,807,462 | ) |
| | | | | | | | | | | | | | | | | | | | | | | | | |
| Net decrease | | $ | (88,578,055 | ) | | $ | (23,475,952 | ) | | $ | (90,072,524 | ) | | $ | (92,475,509 | ) | | $ | (38,312,782 | ) | | $ | (27,610,131 | ) |
| | | | | | | | | | | | | | | | | | | | | | | | | |
| | | | | | | | | | | | | | | | | | | | | | | | | |
| | | | | | | | | | | | | | | | | | | | | | | | | |
| | | Class I | | Class Q | | | | |
| | | Year Ended
| | Year Ended
| | Year Ended
| | Year Ended
| | | | |
| | | October 31,
| | October 31,
| | October 31,
| | October 31,
| | | | |
| | | 2008 | | 2007 | | 2008 | | 2007 | | | | |
| |
International Value
(Number of Shares) | | | | | | | | | | | | | | | | | | | | | | | | |
| Shares sold | | | 21,346,501 | | | | 27,853,117 | | | | 80,922 | | | | 4,986 | | | | | | | | | |
| Reinvestment of distributions | | | 12,048,408 | | | | 6,124,030 | | | | 168,251 | | | | 102,040 | | | | | | | | | |
| Shares redeemed | | | (61,196,377 | ) | | | (20,350,068 | ) | | | (258,323 | ) | | | (190,516 | ) | | | | | | | | |
| | | | | | | | | | | | | | | | | | | | | | | | | |
| Net increase (decrease) in shares outstanding | | | (27,801,468 | ) | | | 13,627,079 | | | | (9,150 | ) | | | (83,490 | ) | | | | | | | | |
| | | | | | | | | | | | | | | | | | | | | | | | | |
International Value ($) | | | | | | | | | | | | | | | | | | | | | | | | |
| Shares sold | | $ | 374,519,708 | | | $ | 601,984,171 | | | $ | 1,352,835 | | | $ | 110,000 | | | | | | | | | |
| Reinvestment of distributions | | | 221,811,196 | | | | 125,236,405 | | | | 3,102,544 | | | | 2,089,785 | | | | | | | | | |
| Shares redeemed | | | (1,025,849,999 | ) | | | (447,151,806 | ) | | | (4,062,976 | ) | | | (4,143,124 | ) | | | | | | | | |
| | | | | | | | | | | | | | | | | | | | | | | | | |
| Net increase (decrease) | | $ | (429,519,095 | ) | | $ | 280,068,770 | | | $ | 392,403 | | | $ | (1,943,339 | ) | | | | | | | | |
| | | | | | | | | | | | | | | | | | | | | | | | | |
| | | | | | | | | | | | | | | | | | | | | | | | | |
| | | | | | | | | | | | | | | | | | | | | | | | | |
| | | Class A | | Class B | | Class C |
| | | Year Ended
| | Year Ended
| | Year Ended
| | Year Ended
| | Year Ended
| | Year Ended
|
| | | October 31,
| | October 31,
| | October 31,
| | October 31,
| | October 31,
| | October 31,
|
| | | 2008 | | 2007 | | 2008 | | 2007 | | 2008 | | 2007 |
| |
International Value Choice
(Number of Shares) | | | | | | | | | | | | | | | | | | | | | | | | |
| Shares sold | | | 686,849 | | | | 196,008 | | | | 42,499 | | | | 40,254 | | | | 63,426 | | | | 85,318 | |
| Reinvestment of distributions | | | 176,805 | | | | 26,003 | | | | 29,707 | | | | 3,151 | | | | 39,133 | | | | 4,177 | |
| Shares redeemed | | | (795,921 | ) | | | (553,686 | ) | | | (97,833 | ) | | | (74,651 | ) | | | (133,854 | ) | | | (94,956 | ) |
| | | | | | | | | | | | | | | | | | | | | | | | | |
| Net increase (decrease) in shares outstanding | | | 67,733 | | | | (331,675 | ) | | | (25,627 | ) | | | (31,246 | ) | | | (31,295 | ) | | | (5,461 | ) |
| | | | | | | | | | | | | | | | | | | | | | | | | |
International Value Choice ($) | | | | | | | | | | | | | | | | | | | | | | | | |
| Shares sold | | $ | 7,157,841 | | | $ | 2,591,527 | | | $ | 499,053 | | | $ | 523,398 | | | $ | 741,122 | | | $ | 1,113,930 | |
| Reinvestment of distributions | | | 2,075,696 | | | | 334,923 | | | | 345,496 | | | | 40,274 | | | | 456,287 | | | | 53,511 | |
| Shares redeemed | | | (7,750,036 | ) | | | (7,400,948 | ) | | | (1,061,670 | ) | | | (971,726 | ) | | | (1,515,447 | ) | | | (1,252,071 | ) |
| | | | | | | | | | | | | | | | | | | | | | | | | |
| Net increase (decrease) | | $ | 1,483,501 | | | $ | (4,474,498 | ) | | $ | (217,121 | ) | | $ | (408,054 | ) | | $ | (318,038 | ) | | $ | (84,630 | ) |
| | | | | | | | | | | | | | | | | | | | | | | | | |
162
NOTES TO FINANCIAL STATEMENTS as of October 31, 2008 (continued)
NOTE 12 — CAPITAL SHARES (continued)
| | | | | | | | | | | | | | | | | | | | | | | | | |
| | | Class I | | | | | | | | |
| | | Year Ended
| | Year Ended
| | | | | | | | |
| | | October 31,
| | October 31,
| | | | | | | | |
| | | 2008 | | 2007 | | | | | | | | |
| |
| | | | | | | | | | | | | | | | | | | | | | | | | |
International Value Choice
(Number of Shares) | | | | | | | | | | | | | | | | | | | | | | | | |
| Shares sold | | | 1,789,120 | | | | 4,387,177 | | | | | | | | | | | | | | | | | |
| Reinvestment of distributions | | | 775,006 | | | | 76,908 | | | | | | | | | | | | | | | | | |
| Shares redeemed | | | (1,843,757 | ) | | | (3,383,938 | ) | | | | | | | | | | | | | | | | |
| | | | | | | | | | | | | | | | | | | | | | | | | |
| Net increase in shares outstanding | | | 720,369 | | | | 1,080,147 | | | | | | | | | | | | | | | | | |
| | | | | | | | | | | | | | | | | | | | | | | | | |
International Value Choice ($) | | | | | | | | | | | | | | | | | | | | | | | | |
| Shares sold | | $ | 21,092,150 | | | $ | 57,856,995 | | | | | | | | | | | | | | | | | |
| Reinvestment of distributions | | | 9,083,070 | | | | 989,038 | | | | | | | | | | | | | | | | | |
| Shares redeemed | | | (19,635,694 | ) | | | (46,416,954 | ) | | | | | | | | | | | | | | | | |
| | | | | | | | | | | | | | | | | | | | | | | | | |
| Net increase | | $ | 10,539,526 | | | $ | 12,429,079 | | | | | | | | | | | | | | | | | |
| | | | | | | | | | | | | | | | | | | | | | | | | |
| | | | | | | | | | | | | | | | | | | | | | | | | |
| | | | | | | | | | | | | | | | | | | | | | | | | |
| | | Class A | | | | | | | | |
| | | Year Ended
| | Year Ended
| | | | | | | | |
| | | October 31,
| | October 31,
| | | | | | | | |
| | | 2008 | | 2007 | | | | | | | | |
| |
Russia
(Number of Shares) | | | | | | | | | | | | | | | | | | | | | | | | |
| Shares sold | | | 3,508,454 | | | | 4,435,492 | | | | | | | | | | | | | | | | | |
| Reinvestment of distributions | | | 1,701,980 | | | | 613,999 | | | | | | | | | | | | | | | | | |
| Shares redeemed | | | (6,816,631 | ) | | | (6,715,298 | ) | | | | | | | | | | | | | | | | |
| | | | | | | | | | | | | | | | | | | | | | | | | |
| Net decrease in shares outstanding | | | (1,606,197 | ) | | | (1,665,807 | ) | | | | | | | | | | | | | | | | |
| | | | | | | | | | | | | | | | | | | | | | | | | |
Russia ($) | | | | | | | | | | | | | | | | | | | | | | | | |
| Shares sold | | $ | 221,879,155 | | | $ | 280,987,914 | | | | | | | | | | | | | | | | | |
| Reinvestment of distributions | | | 116,874,956 | | | | 37,402,991 | | | | | | | | | | | | | | | | | |
| Redemption fee proceeds | | | 1,344,090 | | | | 3,086,432 | | | | | | | | | | | | | | | | | |
| Shares redeemed | | | (348,756,344 | ) | | | (422,755,301 | ) | | | | | | | | | | | | | | | | |
| | | | | | | | | | | | | | | | | | | | | | | | | |
| Net decrease | | $ | (8,658,143 | ) | | $ | (101,277,964 | ) | | | | | | | | | | | | | | | | |
| | | | | | | | | | | | | | | | | | | | | | | | | |
| | | | | | | | | | | | | | | | | | | | | | | | | |
| | | | | | | | | | | | | | | | | | | | | | | | | |
| | | Class A | | Class B | | Class C |
| | | Year Ended
| | Year Ended
| | Year Ended
| | Year Ended
| | Year Ended
| | Year Ended
|
| | | October 31,
| | October 31,
| | October 31,
| | October 31,
| | October 31,
| | October 31,
|
| | | 2008 | | 2007 | | 2008 | | 2007 | | 2008 | | 2007 |
| |
Emerging Markets Fixed Income
(Number of Shares) | | | | | | | | | | | | | | | | | | | | | | | | |
| Shares sold | | | 252,204 | | | | 574,996 | | | | 3,762 | | | | 12,563 | | | | 71,595 | | | | 121,704 | |
| Reinvestment of distributions | | | 26,782 | | | | 17,007 | | | | 1,607 | | | | 1,367 | | | | 6,655 | | | | 2,892 | |
| Shares redeemed | | | (878,847 | ) | | | (2,107,447 | ) | | | (13,009 | ) | | | (3,405 | ) | | | (77,077 | ) | | | (6,959 | ) |
| | | | | | | | | | | | | | | | | | | | | | | | | |
| Net increase (decrease) in shares outstanding | | | (599,861 | ) | | | (1,515,444 | ) | | | (7,640 | ) | | | 10,525 | | | | 1,173 | | | | 117,637 | |
| | | | | | | | | | | | | | | | | | | | | | | | | |
Emerging Markets Fixed Income ($) | | | | | | | | | | | | | | | | | | | | | | | | |
| Shares sold | | $ | 2,502,888 | | | $ | 5,985,060 | | | $ | 36,830 | | | $ | 129,139 | | | $ | 714,968 | | | $ | 1,261,502 | |
| Reinvestment of distributions | | | 263,152 | | | | 174,982 | | | | 15,738 | | | | 14,047 | | | | 64,586 | | | | 29,610 | |
| Shares redeemed | | | (8,666,811 | ) | | | (21,814,799 | ) | | | (118,714 | ) | | | (34,681 | ) | | | (688,196 | ) | | | (71,700 | ) |
| | | | | | | | | | | | | | | | | | | | | | | | | |
| Net increase (decrease) | | $ | (5,900,771 | ) | | $ | (15,654,757 | ) | | $ | (66,146 | ) | | $ | 108,505 | | | $ | 91,358 | | | $ | 1,219,412 | |
| | | | | | | | | | | | | | | | | | | | | | | | | |
163
NOTES TO FINANCIAL STATEMENTS as of October 31, 2008 (continued)
NOTE 12 — CAPITAL SHARES (continued)
| | | | | | | | | | | | | | | | | | | | | | | | | |
| | | Class I | | | | | | | | |
| | | | | December 20,
| | | | | | | | |
| | | Year Ended
| | 2006(1) to
| | | | | | | | |
| | | October 31,
| | October 31,
| | | | | | | | |
| | | 2008 | | 2007 | | | | | | | | |
| |
| | | | | | | | | | | | | | | | | | | | | | | | | |
Emerging Markets Fixed Income
(Number of Shares) | | | | | | | | | | | | | | | | | | | | | | | | |
| Shares sold | | | 14,539,689 | | | | 29,241,272 | | | | | | | | | | | | | | | | | |
| Reinvestment of distributions | | | 2,018,022 | | | | 617,893 | | | | | | | | | | | | | | | | | |
| Shares redeemed | | | (11,690,948 | ) | | | (601,326 | ) | | | | | | | | | | | | | | | | |
| | | | | | | | | | | | | | | | | | | | | | | | | |
| Net increase in shares outstanding | | | 4,866,763 | | | | 29,257,839 | | | | | | | | | | | | | | | | | |
| | | | | | | | | | | | | | | | | | | | | | | | | |
Emerging Markets Fixed Income ($) | | | | | | | | | | | | | | | | | | | | | | | | |
| Shares sold | | $ | 129,868,071 | | | $ | 303,520,569 | | | | | | | | | | | | | | | | | |
| Reinvestment of distributions | | | 19,732,368 | | | | 6,243,231 | | | | | | | | | | | | | | | | | |
| Shares redeemed | | | (114,548,390 | ) | | | (6,041,783 | ) | | | | | | | | | | | | | | | | |
| | | | | | | | | | | | | | | | | | | | | | | | | |
| Net increase | | $ | 35,052,049 | | | $ | 303,722,017 | | | | | | | | | | | | | | | | | |
| | | | | | | | | | | | | | | | | | | | | | | | | |
| | | | | | | | | | | | | | | | | | | | | | | | | |
| | | | | | | | | | | | | | | | | | | | | | | | | |
| | | Class A | | Class B | | Class C |
| | | Year Ended
| | Year Ended
| | Year Ended
| | Year Ended
| | Year Ended
| | Year Ended
|
| | | October 31,
| | October 31,
| | October 31,
| | October 31,
| | October 31,
| | October 31,
|
| | | 2008 | | 2007 | | 2008 | | 2007 | | 2008 | | 2007 |
| |
Global Bond
(Number of Shares) | | | | | | | | | | | | | | | | | | | | | | | | |
| Shares sold | | | 7,456,121 | | | | 274,870 | | | | 482,365 | | | | 33,601 | | | | 3,471,699 | | | | 160,111 | |
| Reinvestment of distributions | | | 137,999 | | | | 3,007 | | | | 7,800 | | | | 658 | | | | 50,068 | | | | 673 | |
| Shares redeemed | | | (2,528,202 | ) | | | (66,579 | ) | | | (120,595 | ) | | | (4,564 | ) | | | (831,577 | ) | | | (10,660 | ) |
| | | | | | | | | | | | | | | | | | | | | | | | | |
| Net increase in shares outstanding | | | 5,065,918 | | | | 211,298 | | | | 369,570 | | | | 29,695 | | | | 2,690,190 | | | | 150,124 | |
| | | | | | | | | | | | | | | | | | | | | | | | | |
Global Bond ($) | | | | | | | | | | | | | | | | | | | | | | | | |
| Shares sold | | $ | 80,606,536 | | | $ | 2,826,384 | | | $ | 5,209,000 | | | $ | 339,806 | | | $ | 37,418,779 | | | $ | 1,646,890 | |
| Reinvestment of distributions | | | 1,503,470 | | | | 30,842 | | | | 84,783 | | | | 6,727 | | | | 547,180 | | | | 6,965 | |
| Shares redeemed | | | (26,720,683 | ) | | | (676,036 | ) | | | (1,265,336 | ) | | | (45,456 | ) | | | (8,772,866 | ) | | | (108,978 | ) |
| | | | | | | | | | | | | | | | | | | | | | | | | |
| Net increase | | $ | 55,389,323 | | | $ | 2,181,190 | | | $ | 4,028,447 | | | $ | 301,077 | | | $ | 29,193,093 | | | $ | 1,544,877 | |
| | | | | | | | | | | | | | | | | | | | | | | | | |
| | | | | | | | | | | | | | | | | | | | | | | | | |
| | | | | | | | | | | | | | | | | | | | | | | | | |
| | | Class I | | Class O | | | | | | |
| | | | | | | June 4,
| | | | | | |
| | | Year Ended
| | Year Ended
| | 2008(1) to
| | | | | | |
| | | October 31,
| | October 31,
| | October 31,
| | | | | | |
| | | 2008 | | 2007 | | 2008 | | | | | | |
| |
Global Bond
(Number of Shares) | | | | | | | | | | | | | | | | | | | | | | | | |
| Shares sold | | | 146,220 | | | | 1 | | | | 27,965 | | | | | | | | | | | | | |
| Reinvestment of distributions | | | 511 | | | | — | | | | 2 | | | | | | | | | | | | | |
| Shares redeemed | | | (97,562 | ) | | | — | | | | (6,112 | ) | | | | | | | | | | | | |
| | | | | | | | | | | | | | | | | | | | | | | | | |
| Net increase in shares outstanding | | | 49,169 | | | | 1 | | | | 21,855 | | | | | | | | | | | | | |
| | | | | | | | | | | | | | | | | | | | | | | | | |
Global Bond ($) | | | | | | | | | | | | | | | | | | | | | | | | |
| Shares sold | | $ | 1,585,456 | | | $ | 10 | | | $ | 292,477 | | | | | | | | | | | | | |
| Reinvestment of distributions | | | 5,482 | | | | — | | | | 21 | | | | | | | | | | | | | |
| Shares redeemed | | | (1,042,215 | ) | | | — | | | | (63,489 | ) | | | | | | | | | | | | |
| | | | | | | | | | | | | | | | | | | | | | | | | |
| Net increase | | $ | 548,723 | | | $ | 10 | | | $ | 229,009 | | | | | | | | | | | | | |
| | | | | | | | | | | | | | | | | | | | | | | | | |
| |
| (1) | Commencement of operations. |
164
NOTES TO FINANCIAL STATEMENTS as of October 31, 2008 (continued)
NOTE 12 — CAPITAL SHARES (continued)
| | | | | | | | | | | | | | | | | | | | | | | | | |
| | | Class A | | Class B | | Class C |
| | | Year Ended
| | Year Ended
| | Year Ended
| | Year Ended
| | Year Ended
| | Year Ended
|
| | | October 31,
| | October 31,
| | October 31,
| | October 31,
| | October 31,
| | October 31,
|
| | | 2008 | | 2007 | | 2008 | | 2007 | | 2008 | | 2007 |
| |
| | | | | | | | | | | | | | | | | | | | | | | | | |
Diversified International
(Number of Shares) | | | | | | | | | | | | | | | | | | | | | | | | |
| Shares sold | | | 8,841,423 | | | | 14,796,567 | | | | 654,048 | | | | 1,227,737 | | | | 3,391,624 | | | | 6,505,341 | |
| Reinvestment of distributions | | | 515,063 | | | | 58,638 | | | | 48,497 | | | | 1,114 | | | | 164,842 | | | | 4,093 | |
| Shares redeemed | | | (12,019,529 | ) | | | (3,910,709 | ) | | | (851,393 | ) | | | (282,859 | ) | | | (3,992,949 | ) | | | (1,190,161 | ) |
| | | | | | | | | | | | | | | | | | | | | | | | | |
| Net increase (decrease) in shares outstanding | | | (2,663,043 | ) | | | 10,944,496 | | | | (148,848 | ) | | | 945,992 | | | | (436,483 | ) | | | 5,319,273 | |
| | | | | | | | | | | | | | | | | | | | | | | | | |
Diversified International ($) | | | | | | | | | | | | | | | | | | | | | | | | |
| Shares sold | | $ | 111,719,950 | | | $ | 196,674,148 | | | $ | 8,251,659 | | | $ | 16,173,010 | | | $ | 42,957,806 | | | $ | 85,984,708 | |
| Reinvestment of distributions | | | 6,979,408 | | | | 727,447 | | | | 654,909 | | | | 13,771 | | | | 2,222,086 | | | | 50,585 | |
| Shares redeemed | | | (131,771,713 | ) | | | (51,884,948 | ) | | | (9,548,622 | ) | | | (3,741,472 | ) | | | (43,316,760 | ) | | | (15,544,550 | ) |
| | | | | | | | | | | | | | | | | | | | | | | | | |
| Net increase (decrease) | | $ | (13,072,355 | ) | | $ | 145,516,647 | | | $ | (642,054 | ) | | $ | 12,445,309 | | | $ | 1,863,132 | | | $ | 70,490,743 | |
| | | | | | | | | | | | | | | | | | | | | | | | | |
| | | | | | | | | | | | | | | | | | | | | | | | | |
| | | | | | | | | | | | | | | | | | | | | | | | | |
| | | Class I | | Class O | | Class R | | Class W |
| | | | | | | June 4,
| | | | December 12,
| | February 12,
|
| | | Year Ended
| | Year Ended
| | 2008(1) to
| | Year Ended
| | 2006(1) to
| | 2008(1) to
|
| | | October 31,
| | October 31,
| | October 31,
| | October 31,
| | October 31,
| | October 31,
|
| | | 2008 | | 2007 | | 2008 | | 2008 | | 2007 | | 2008 |
| |
Diversified International
(Number of Shares) | | | | | | | | | | | | | | | | | | | | | | | | |
| Shares sold | | | 7 | | | | 36,440 | | | | 29,313 | | | | 1,146 | | | | 39,818 | | | | 294,208 | |
| Reinvestment of distributions | | | 57 | | | | 4 | | | | — | | | | 655 | | | | 38 | | | | — | |
| Shares redeemed | | | (47 | ) | | | (34,712 | ) | | | (10,096 | ) | | | (5,672 | ) | | | (10,702 | ) | | | (87,719 | ) |
| | | | | | | | | | | | | | | | | | | | | | | | | |
| Net increase (decrease) in shares outstanding | | | 17 | | | | 1,732 | | | | 19,217 | | | | (3,871 | ) | | | 29,154 | | | | 206,489 | |
| | | | | | | | | | | | | | | | | | | | | | | | | |
Diversified International ($) | | | | | | | | | | | | | | | | | | | | | | | | |
| Shares sold | | $ | 100 | | | $ | 522,197 | | | $ | 279,607 | | | $ | 14,594 | | | $ | 502,116 | | | $ | 3,322,579 | |
| Reinvestment of distributions | | | 766 | | | | 55 | | | | — | | | | 8,800 | | | | 472 | | | | — | |
| Shares redeemed | | | (640 | ) | | | (476,693 | ) | | | (91,526 | ) | | | (68,665 | ) | | | (144,253 | ) | | | (772,445 | ) |
| | | | | | | | | | | | | | | | | | | | | | | | | |
| Net increase (decrease) | | $ | 226 | | | $ | 45,559 | | | $ | 188,081 | | | $ | (45,271 | ) | | $ | 358,335 | | | $ | 2,550,134 | |
| | | | | | | | | | | | | | | | | | | | | | | | | |
| |
| (1) | Commencement of operations. |
NOTE 13 — ILLIQUID SECURITIES
Pursuant to guidelines adopted by the Funds’ Board, the following securities have been deemed to be illiquid. The Funds currently limit investments in illiquid securities to 15% of a Fund’s net assets, at market value, at time of purchase. Fair value for certain securities was determined by ING Funds Valuation Committee appointed by the Fund’s Board and in accordance with the methods specifically authorized by the Board.
| | | | | | | | | | | | | | | | | | | | | |
| | | | | | | Initial
| | | | | | Percent
|
| | | | | | | Acquisition
| | | | | | of Net
|
Fund | | Security | | Shares | | Date | | Cost | | Value | | Assets |
| |
| Global Natural Resources | | Shore Gold, Inc. | | 189,116 | | | 09/19/07 | | | $ | 660,013 | | | $ | 98,849 | | | | 0.1 | % |
| | | | | | | | | | | | | | | | | | | | | |
| | | | | | | | | | | $ | 660,013 | | | $ | 98,849 | | | | 0.1 | % |
| | | | | | | | | | | | | | | | | | | | | |
| Global Real Estate | | Safestore Holdings Ltd. | | 3,353,865 | | | 03/09/07 | | | $ | 13,805,038 | | | $ | 5,023,489 | | | | 0.4 | % |
| | | | | | | | | | | | | | | | | | | | | |
| | | | | | | | | | | $ | 13,805,038 | | | $ | 5,023,489 | | | | 0.4 | % |
| | | | | | | | | | | | | | | | | | | | | |
| Emerging Countries | | LSR Group GDR | | 190,392 | | | 06/17/08 | | | $ | 2,949,961 | | | $ | 474,076 | | | | 0.5 | % |
| | | | | | | | | | | | | | | | | | | | | |
| | | | | | | | | | | $ | 2,949,961 | | | $ | 474,076 | | | | 0.5 | % |
| | | | | | | | | | | | | | | | | | | | | |
| Foreign | | Federal Grid Co Unitied Energy System JSC GDR | | 70,735 | | | 08/28/08 | | | $ | 431,484 | | | $ | 109,745 | | | | 0.1 | % |
| | | Inter Rao Ues OAO GDR | | 14,630 | | | 08/28/08 | | | | 92,169 | | | | 31,345 | | | | 0.0 | % |
| | | Kusbassenergo OJSC — Spon GDR | | 4,865 | | | 08/28/08 | | | | 25,663 | | | | 8,087 | | | | 0.0 | % |
| | | Mosenergo OAO — Spon GDR | | 23,485 | | | 08/28/08 | | | | 114,489 | | | | 37,001 | | | | 0.0 | % |
| | | Wholesale Power-1 OAO GDR | | 67,340 | | | 08/28/08 | | | | 153,199 | | | | 24,876 | | | | 0.0 | % |
| | | Wholesale Power-2 OAO GDR | | 17,500 | | | 08/28/08 | | | | 76,125 | | | | 17,907 | | | | 0.0 | % |
165
NOTES TO FINANCIAL STATEMENTS as of October 31, 2008 (continued)
NOTE 13 — ILLIQUID SECURITIES (continued)
| | | | | | | | | | | | | | | | | | | | | |
| | | | | | | Initial
| | | | | | Percent
|
| | | | | | | Acquisition
| | | | | | of Net
|
Fund | | Security | | Shares | | Date | | Cost | | Value | | Assets |
| |
| | | Wholesale Power-3 OAO GDR | | 28,770 | | | 08/28/08 | | | $ | 97,099 | | | $ | 18,439 | | | | 0.0 | % |
| | | Wholesale Power-6 OAO GDR | | 20,405 | | | 08/28/08 | | | | 71,418 | | | | 18,467 | | | | 0.0 | % |
| | | Open Investments | | 200 | | | 09/25/07 | | | | 58,144 | | | | 7,887 | | | | 0.0 | % |
| | | Silvinit BRD | | 1,897 | | | 05/10/07 | | | | 562,232 | | | | 369,915 | | | | 0.1 | % |
| | | Territorial Generating Co.-1 — Spon GDR | | 26,740 | | | 08/28/08 | | | | 72,867 | | | | 14,817 | | | | 0.0 | % |
| | | Territorial Generating Co.-14 JSC — Spon GDR | | 1,120 | | | 08/28/08 | | | | 9,072 | | | | 2,358 | | | | 0.0 | % |
| | | Territorial Generating Co.-2 — Spon GDR | | 4,515 | | | 08/28/08 | | | | 44,473 | | | | 9,840 | | | | 0.0 | % |
| | | Territorial Generating Co.-4 — Spon GDR | | 11,095 | | | 08/28/08 | | | | 57,417 | | | | 21,722 | | | | 0.0 | % |
| | | Territorial Generating Co.-9 — Spon GDR | | 11,760 | | | 08/28/08 | | | | 35,280 | | | | 12,164 | | | | 0.0 | % |
| | | Deutsche Bank AG, London (Pending Spin-off of Unified Energy Sys- REG S GDR) | | 35 | | | 11/21/07 | | | | 13,706 | | | | 6,063 | | | | 0.0 | % |
| | | Deutsche Bank AG, London (Pending Spin-off of Unified Energy Sys- REG S GDR) | | 35 | | | 11/21/07 | | | | 374,865 | | | | 52,786 | | | | 0.0 | % |
| | | URSA Bank | | 141,747 | | | 05/10/07 | | | | 305,862 | | | | 25,514 | | | | 0.0 | % |
| | | Territorial Generating Co. — Spon GDR | | 11,690 | | | 08/28/08 | | | | 63,711 | | | | 11,228 | | | | 0.0 | % |
| | | Wimm-Bill-Dann Foods — Class S | | 6,550 | | | 07/03/07 | | | | 556,784 | | | | 85,150 | | | | 0.1 | % |
| | | Yenisei Territorial — Spon GDR | | 12,040 | | | 08/28/08 | | | | 26,789 | | | | 8,829 | | | | 0.0 | % |
| | | | | | | | | | | | | | | | | | | | | |
| | | | | | | | | | | $ | 3,242,848 | | | $ | 894,140 | | | | 0.3 | % |
| | | | | | | | | | | | | | | | | | | | | |
| Greater China | | Chuang’s China Investments | | 2,921,000 | | | 07/25/07 | | | | 540,505 | | | | 26,647 | | | | 0.1 | % |
| | | | | | | | | | | | | | | | | | | | | |
| | | | | | | | | | | $ | 540,505 | | | $ | 26,647 | | | | 0.1 | % |
| | | | | | | | | | | | | | | | | | | | | |
| International Real Estate | | Central Pattana PCL | | 1,929,000 | | | 03/01/06 | | | $ | 1,293,212 | | | $ | 519,454 | | | | 0.2 | % |
| | | Safestore Holdings Ltd. | | 1,457,200 | | | 03/09/07 | | | | 5,133,073 | | | | 2,182,625 | | | | 0.5 | % |
| | | Yatra Capital Ltd. | | 90,700 | | | 11/27/06 | | | | 1,191,305 | | | | 464,752 | | | | 0.1 | % |
| | | | | | | | | | | | | | | | | | | | | |
| | | | | | | | | | | $ | 7,617,590 | | | $ | 3,166,831 | | | | 0.8 | % |
| | | | | | | | | | | | | | | | | | | | | |
| International SmallCap Multi-Manager | | Meiban Group Ltd. | | 1,973,000 | | | 07/02/07 | �� | | $ | 731,136 | | | $ | 159,649 | | | | 0.1 | % |
| | | Octaviar Ltd. | | 673,856 | | | 09/11/06 | | | | 2,852,642 | | | | 62,693 | | | | 0.0 | % |
| | | Super Coffeemix Manufacturing Ltd. | | 336,000 | | | 06/10/08 | | | | 191,413 | | | | 111,048 | | | | 0.0 | % |
| | | Waseda Academy Co., Ltd. | | 14,000 | | | 01/18/07 | | | | 249,325 | | | | 120,800 | | | | 0.0 | % |
| | | | | | | | | | | | | | | | | | | | | |
| | | | | | | | | | | $ | 4,024,516 | | | $ | 454,190 | | | | 0.1 | % |
| | | | | | | | | | | | | | | | | | | | | |
| Russia | | Bank St. Petersburg BRD — Class S | | 1,709,000 | | | 11/02/07 | | | $ | 8,893,549 | | | $ | 512,700 | | | | 0.2 | % |
| | | Efes Breweries International NV GDR | | 300,400 | | | 01/25/06 | | | $ | 9,188,514 | | | | 1,813,454 | | | | 0.7 | % |
| | | LSR Group GDR | | 811,680 | | | 11/09/07 | | | $ | 11,769,360 | | | | 2,021,083 | | | | 0.8 | % |
| | | Moscow City Telephone | | 135,000 | | | 04/18/02 | | | $ | 1,079,980 | | | | 1,458,000 | | | | 0.5 | % |
| | | Novorossiysk Sea Trade Port BRD | | 6,060,000 | | | 11/02/07 | | | $ | 1,551,360 | | | | 303,000 | | | | 0.1 | % |
| | | Open Investments | | 33,000 | | | 11/07/07 | | | $ | 9,071,850 | | | | 1,301,370 | | | | 0.5 | % |
| | | RBC Information Systems | | 1,324,122 | | | 06/16/04 | | | $ | 7,874,627 | | | | 1,721,359 | | | | 0.7 | % |
| | | RenShares Utilities Ltd. | | 1,899,872 | | | 08/26/05 | | | $ | 2,744,925 | | | | 2,659,821 | | | | 1.0 | % |
| | | Uralsvyazinform | | 68,909,100 | | | 06/18/99 | | | $ | 1,335,399 | | | | 964,727 | | | | 0.4 | % |
| | | Vsmpo-Avisma Corp. | | 36,800 | | | 04/06/04 | | | $ | 5,412,132 | | | | 1,840,000 | | | | 0.7 | % |
| | | | | | | | | | | | | | | | | | | | | |
| | | | | | | | | | | $ | 58,921,696 | | | $ | 14,595,514 | | | | 5.6 | % |
| | | | | | | | | | | | | | | | | | | | | |
| Emerging Markets Fixed Income* | | Alfa Bond Issuance PLC for OJSC Alfa Bank, 8.635%, due 02/22/17 | | 1,200,000 | | | 05/02/07 | | | $ | 1,202,706 | | | $ | 535,821 | | | | 0.2 | % |
| | | Alfa MTN Invest Ltd., 9.250%, due 06/24/13 | | 1,150,000 | | | 06/19/08 | | | | 1,150,000 | | | | 610,158 | | | | 0.3 | % |
| | | Alto Parana SA, 6.375%, due 06/09/17 | | 620,000 | | | 06/07/07 | | | | 615,660 | | | | 516,088 | | | | 0.2 | % |
| | | Banco Credito Del Peru, 7.170%, due 10/15/22 | | 3,900,000 | | | 10/19/07 | | | | 1,291,391 | | | | 1,272,218 | | | | 0.5 | % |
| | | Banco Do Brasil, 9.750%, due 07/18/17 | | 2,300,000 | | | 07/13/07 | | | | 1,235,364 | | | | 756,404 | | | | 0.3 | % |
| | | Banco Safra Ltd., 10.875%, due 04/03/17 | | 2,400,000 | | | 06/11/07 | | | | 1,271,694 | | | | 675,744 | | | | 0.3 | % |
166
NOTES TO FINANCIAL STATEMENTS as of October 31, 2008 (continued)
NOTE 13 — ILLIQUID SECURITIES (continued)
| | | | | | | | | | | | | | | | | | | | | |
| | | | | | | Initial
| | | | | | Percent
|
| | | | | | | Acquisition
| | | | | | of Net
|
Fund | | Security | | Shares | | Date | | Cost | | Value | | Assets |
| |
| | | Banco Votorantim, 10.625%, due 04/10/14 | | 250,000 | | | 03/29/07 | | | $ | 121,869 | | | $ | 38,327 | | | | 0.0 | % |
| | | Banco Votorantim, 10.625%, due 04/10/14 | | 2,300,000 | | | 06/11/07 | | | | 1,235,076 | | | | 767,021 | | | | 0.3 | % |
| | | Bangkok Bank PCL/Hong Kong | | 800,000 | | | 12/11/07 | | | | 896,515 | | | | 463,682 | | | | 0.2 | % |
| | | Barclays Bank CLN, Discount Note, due 12/17/12 | | 1,300,000 | | | 12/14/07 | | | | 1,494,976 | | | | 961,740 | | | | 0.4 | % |
| | | Barclays Bank CLN, Discount Note, due 03/17/13 | | 1,200,000 | | | 12/13/07 | | | | 1,474,339 | | | | 895,680 | | | | 0.4 | % |
| | | Belize Government International Bond, 4.250% (step rate 6.000%), due 02/20/29 | | 330,000 | | | 05/02/07 | | | | 288,229 | | | | 173,250 | | | | 0.1 | % |
| | | Bosnia & Herzegovina Government International Bond, 17.500%, due 12/11/17 | | 750,000 | | | 08/29/06 | | | | 417,906 | | | | 219,938 | | | | 0.1 | % |
| | | Cia de Transporte de Energia Electrica de Alta Tension SA, 8.875%, due 12/15/16 | | 100,000 | | | 12/15/06 | | | | 100,000 | | | | 32,500 | | | | 0.0 | % |
| | | Citic Resources Finance Ltd., 6.750%, due 05/15/14 | | 265,000 | | | 05/14/07 | | | | 264,274 | | | | 139,125 | | | | 0.1 | % |
| | | Citic Resources Finance Ltd., 6.750%, due 05/15/14 | | 400,000 | | | 09/20/07 | | | | 390,309 | | | | 190,000 | | | | 0.1 | % |
| | | City of Kiev Ukraine, 8.000%, due 11/06/15 | | 550,000 | | | 02/17/06 | | | | 574,320 | | | | 211,750 | | | | 0.1 | % |
| | | Earls Eight Ltd., 8.000% (step rate 9.000%), due 12/31/12 | | 200,000 | | | 12/07/06 | | | | 194,537 | | | | 117,260 | | | | 0.1 | % |
| | | El Salvador Government International Bond, 8.250%, due 04/10/32 | | 2,440,000 | | | 08/30/06 | | | | 2,981,005 | | | | 1,598,200 | | | | 0.7 | % |
| | | Credit Suisse First Boston International for CJSC The EXIM of Ukraine, 6.800%, due 10/04/12 | | 1,400,000 | | | 05/01/07 | | | | 1,386,447 | | | | 637,000 | | | | 0.3 | % |
| | | HSBK Europe BV, 7.250%, due 05/03/17 | | 400,000 | | | 04/26/07 | | | | 399,436 | | | | 206,000 | | | | 0.1 | % |
| | | HSBK Europe BV, 7.250%, due 05/03/17 | | 600,000 | | | 06/28/07 | | | | 585,000 | | | | 270,000 | | | | 0.1 | % |
| | | Interoceanica IV Finance Ltd., 6.020%, due 11/30/25 | | 1,181,082 | | | 05/03/07 | | | | 619,964 | | | | 435,347 | | | | 0.2 | % |
| | | JPMorgan Chase London, Discount Note, due 06/17/21 | | 4,920,000 | | | 09/03/08 | | | | 5,796,588 | | | | 4,392,576 | | | | 1.9 | % |
| | | Kazkommerts International BV, 7.500%, due 11/29/16 | | 1,410,000 | | | 11/21/06 | | | | 1,356,809 | | | | 613,686 | | | | 0.3 | % |
| | | Kuznetski Capital for Bank of Moscow, 7.500%, due 11/25/15 | | 1,500,000 | | | 10/20/06 | | | | 1,546,822 | | | | 574,470 | | | | 0.2 | % |
| | | Lebanon Government International Bond, 8.250%, due 04/12/21 | | 210,000 | | | 01/18/07 | | | | 207,468 | | | | 155,925 | | | | 0.1 | % |
| | | Majapahit Holding BV, 7.250%, due 06/28/17 | | 1,480,000 | | | 06/22/07 | | | | 1,456,522 | | | | 885,969 | | | | 0.4 | % |
| | | Majapahit Holding BV, 7.875%, due 06/29/37 | | 2,235,000 | | | 06/21/07 | | | | 2,200,323 | | | | 1,195,725 | | | | 0.5 | % |
| | | Majapahit Holding BV, 7.750%, due 10/17/16 | | 100,000 | | | 10/11/06 | | | | 98,976 | | | | 65,500 | | | | 0.0 | % |
| | | Majapahit Holding BV, 7.750%, due 10/17/16 | | 650,000 | | | 05/25/07 | | | | 685,704 | | | | 391,056 | | | | 0.2 | % |
| | | Province of Mendoza, 5.500%, due 09/04/18 | | 781,950 | | | 10/24/06 | | | | 601,268 | | | | 340,148 | | | | 0.1 | % |
| | | Standard Bank (Nak), 8.125%, due 09/30/09 | | 500,000 | | | 05/02/07 | | | | 503,606 | | | | 251,375 | | | | 0.1 | % |
| | | National Power Corp., 9.625%, due 05/15/28 | | 450,000 | | | 02/01/06 | | | | 493,747 | | | | 348,750 | | | | 0.1 | % |
| | | National Power Corp., 6.875%, due 11/02/16 | | 305,000 | | | 10/25/06 | | | | 305,446 | | | | 230,275 | | | | 0.1 | % |
| | | National Power Corp., 6.875%, due 11/02/16 | | 1,300,000 | | | 08/28/07 | | | | 1,258,755 | | | | 881,685 | | | | 0.4 | % |
| | | Pakistan Government International Bond, 7.125%, due 03/31/16 | | 610,000 | | | 10/31/07 | | | | 577,583 | | | | 232,057 | | | | 0.1 | % |
167
NOTES TO FINANCIAL STATEMENTS as of October 31, 2008 (continued)
NOTE 13 — ILLIQUID SECURITIES (continued)
| | | | | | | | | | | | | | | | | | | | | |
| | | | | | | Initial
| | | | | | Percent
|
| | | | | | | Acquisition
| | | | | | of Net
|
Fund | | Security | | Shares | | Date | | Cost | | Value | | Assets |
| |
| | | Islamic Republic of Pakistan, 6.875%, due 06/01/17 | | 3,695,000 | | | 07/25/07 | | | $ | 3,277,055 | | | $ | 1,339,438 | | | | 0.6 | % |
| | | Peru Enhanced Pass-through Finance Ltd., 6.910%, due 05/31/18 | | 246,100 | | | 12/14/06 | | | | 171,997 | | | | 128,398 | | | | 0.1 | % |
| | | Peru Enhanced Pass-through Finance Ltd., 7.030%, due 05/31/18 | | 2,953,201 | | | 06/28/07 | | | | 2,080,498 | | | | 1,540,780 | | | | 0.6 | % |
| | | Peru Government International Bond, 6.900%, due 08/12/37 | | 5,000,000 | | | 07/20/07 | | | | 1,583,531 | | | | 1,144,098 | | | | 0.5 | % |
| | | Petroleum Co. of Trinidad & Tobago Ltd., 6.000%, due 05/08/22 | | 2,515,000 | | | 06/28/07 | | | | 2,422,046 | | | | 1,935,041 | | | | 0.8 | % |
| | | Province of Buenos Aires Argentina, 3.000% (step rate 4.000%), due 05/15/35 | | 4,550,000 | | | 05/30/06 | | | | 2,056,260 | | | | 548,275 | | | | 0.2 | % |
| | | Province of Buenos Aires Argentina, 3.000% (step rate 4.000%), due 05/15/35 | | 1,050,000 | | | 01/27/06 | | | | 510,725 | | | | 126,525 | | | | 0.1 | % |
| | | Province of Buenos Aires Argentina, 9.625%, due 04/18/28 | | 4,130,000 | | | 05/01/07 | | | | 4,124,477 | | | | 753,725 | | | | 0.3 | % |
| | | Province of Buenos Aires Argentina, 9.375%, due 09/14/18 | | 2,480,000 | | | 11/02/06 | | | | 2,153,946 | | | | 452,600 | | | | 0.2 | % |
| | | Provincia Del Neuquen Titulo Provincial, 8.656%, due 10/18/14 | | 444,500 | | | 05/21/07 | | | | 459,606 | | | | 317,818 | | | | 0.1 | % |
| | | Republic of Iraq, 5.800%, due 01/15/28 | | 9,050,000 | | | 05/03/06 | | | | 5,707,814 | | | | 4,570,250 | | | | 2.0 | % |
| | | Shinhan Bank, 6.819%, due 09/20/36 | | 1,280,000 | | | 09/24/07 | | | | 1,251,027 | | | | 617,236 | | | | 0.3 | % |
| | | Sibacademfinance PLC for URSA Bank, 9.125%, due 02/26/10 | | 25,000,000 | | | 06/04/07 | | | | 981,573 | | | | 648,765 | | | | 0.3 | % |
| | | Standard Bank PLC, 15.000%, due 03/12/12 | | 2,025,785 | | | 06/28/07 | | | | 2,025,785 | | | | 1,489,059 | | | | 0.6 | % |
| | | Standard Bank PLC, 16.000%, due 07/20/09 | | 143,584 | | | 01/26/07 | | | | 143,584 | | | | 135,756 | | | | 0.1 | % |
| | | Transportadora Gas del Norte, 8.000%, due 12/31/12 | | 1,285,000 | | | 05/24/07 | | | | 1,270,865 | | | | 584,675 | | | | 0.3 | % |
| | | Transportadora Gas del Norte, 6.500% (step rate 7.500%), due 12/31/12 | | 40,368 | | | 10/31/06 | | | | 39,093 | | | | 18,367 | | | | 0.0 | % |
| | | TuranAlem Finance BV, 8.250%, due 01/22/37 | | 1,500,000 | | | 08/30/07 | | | | 1,306,426 | | | | 483,750 | | | | 0.2 | % |
| | | UBS AG, 9.850%, due 08/02/17 | | 2,000,000 | | | 07/26/07 | | | | 1,997,040 | | | | 2,005,457 | | | | 0.8 | % |
| | | UBS AG, Discount Note, due 09/04/17 | | 1,200,000 | | | 12/13/07 | | | | 1,198,466 | | | | 1,232,068 | | | | 0.5 | % |
| | | UBS AG, Discount Note, due 12/27/13 | | 400,000 | | | 01/05/07 | | | | 397,866 | | | | 445,491 | | | | 0.2 | % |
| | | UK SPV Credit Finance PLC for JSC Commercial Bank Privatbank, 8.000%, due 02/06/12 | | 2,800,000 | | | 01/25/07 | | | | 2,776,562 | | | | 868,000 | | | | 0.4 | % |
| | | Ukraine Government International Bond, 6.580%, due 11/21/16 | | 360,000 | | | 07/31/07 | | | | 350,276 | | | | 149,400 | | | | 0.1 | % |
| | | Ukraine Government International Bond, 7.650%, due 06/11/13 | | 1,180,000 | | | 10/20/06 | | | | 1,235,661 | | | | 601,800 | | | | 0.3 | % |
| | | Woori Bank, 6.208%, due 05/02/37 | | 1,230,000 | | | 09/20/07 | | | | 1,141,071 | | | | 897,157 | | | | 0.3 | % |
| | | | | | | | | | | | | | | | | | | | | |
| | | | | | | | | | | $ | 77,943,884 | | | $ | 45,316,379 | | | | 19.5 | % |
| | | | | | | | | | | | | | | | | | | | | |
| |
| * | Due to market conditions, ING Fund Compliance requested that all sub-advisors complete an additional certification to confirm that a recent assessment of the liquidity of each funds holdings was conducted. All sub-advisers responded affirmatively, with Emerging Markets Fixed Income reporting an increased number of illiquid securities due to recent market conditions. |
168
NOTES TO FINANCIAL STATEMENTS as of October 31, 2008 (continued)
NOTE 14 — REORGANIZATION
On December 9, 2007, Index Plus International Equity, as listed below (“Acquiring Fund”), acquired the assets and certain liabilities of ING International Equity Fund, also listed below (“Acquired Fund”), in a tax-free reorganization in exchange for shares of the Acquiring Fund, pursuant to a plan of reorganization approved by the Acquired Fund’s shareholders. The number and value of shares issued by the Acquiring Fund are presented in Note 12 — Capital Share Transactions. Net assets and unrealized appreciation as of the reorganization date were as follows:
| | | | | | | | | | | | | | | | | | | | | | | |
| | | | | | | | | Acquired
| | | | |
| | | | | | | | | Capital Loss
| | Acquired Fund
| | |
Acquiring
| | Acquired
| | Total Net Assets of
| | Total Net Assets of
| | Carry forwards
| | Unrealized
| | Conversion
|
Fund | | Fund | | Acquired Fund (000’s) | | Acquiring Fund (000’s) | | (000’s) | | Depreciation (000’s) | | Ratio |
| |
Index Plus
International
Equity | | ING International
Equity Fund | | $ | 128,431 | | | $ | 122,957 | | | $ | 13,594 | | | $ | 3,120 | | | | 1.0243 | |
The net assets of Index Plus International Equity after the acquisition were $251,388,007.
NOTE 15 — CONCENTRATION OF RISKS
Foreign Securities (All Funds). Investments in foreign securities may entail risks not present in domestic investments. Since securities in which the Funds and Underlying Funds may invest are denominated in foreign currencies, changes in the relationship of these foreign currencies to the U.S. dollar can significantly affect the value of the investments and earnings of the Funds and Underlying Funds. Foreign investments may also subject the Funds and Underlying Funds to foreign government exchange restrictions, expropriation, taxation or other political, social or economic developments, as well as changes vis-a-vis the U.S. dollar from movements in currency, and changes in security value and interest rate, all of which could affect the market and/or credit risk of the Funds’ and Underlying Funds’ investments.
Emerging Markets Investments (All Funds except Index Plus International Equity). Because of less developed markets and economies and, in some countries, less mature governments and governmental institutions, the risks of investing in foreign securities can be intensified in the case of investments in issuers domiciled or doing substantial business in emerging market countries.
Industry Concentration (Global Natural Resources, Global Real Estate, Asia-Pacific Real Estate, European Real Estate and International Real Estate). As a result of each Fund and each Underlying Fund concentrating its assets in securities related to a particular industry, each Fund or Underlying Fund may be subject to greater market fluctuation than a fund that invests in securities representing a broader range of investment alternatives.
Geographic Concentration (Asia-Pacific Real Estate, European Real Estate, Greater China and Russia). As a result of each Fund concentrating its assets in a single region of the world, each Fund’s performance may be more volatile than that of a fund that invests globally. If securities in the region that each Fund is concentrated fall out of favor, it may cause a Fund to underperform in relation to funds that focus on other types of stocks.
Non-Diversified (Global Natural Resources, Global Real Estate, Asia-Pacific Real Estate, Disciplined International SmallCap, European Real Estate, Greater China, International Real Estate, Russia, Emerging Markets Fixed Income and Global Bond). The Funds and Underlying Funds are each classified as non-diversified investment companies under the 1940 Act, which means that each Fund or Underlying Fund is not limited by the 1940 Act in the proportion of assets that they may invest in the obligations of a single issuer. Declines in the value of that single company can significantly impact the value of a Fund or Underlying Fund. The investment of a large percentage of a Fund’s or Underlying Fund’s assets in the securities of a small number of issuers may cause a Fund’s share price to fluctuate more than that of a diversified investment company. Conversely, even though classified as non-diversified, a Fund or Underlying Fund may actually maintain a portfolio that is diversified with a large number of issuers. In such an event, a Fund or Underlying Fund would benefit less from appreciation in a single corporate issuer than if it had greater exposure to that issuer.
Restricted and Illiquid Securities (Greater China, Russia and Emerging Markets Fixed Income). If a security is illiquid, a Fund may not be able to sell the security at a time when the Investment Adviser or a Sub-Adviser might wish to sell, and the security could have the effect of decreasing the overall level of a Fund’s liquidity. Further, the lack of an established secondary market may make it more difficult to value illiquid securities, which could vary from the
169
NOTES TO FINANCIAL STATEMENTS as of October 31, 2008 (continued)
NOTE 15 — CONCENTRATION OF RISKS (continued)
amount a Fund could realize upon disposition. Restricted securities, i.e., securities subject to legal or contractual restrictions on resale, may be illiquid. However, some restricted securities may be treated as liquid, although they may be less liquid than registered securities traded on established secondary markets.
Rule 144A Securities (Global Real Estate, Global Value Choice, Asia-Pacific Real Estate, European Real Estate, Greater China, International Real Estate and International Value Choice). Rule 144A securities are securities that are not registered, but which are bought and sold solely by institutional investors. Each Fund generally considers Rule 144A securities to be “liquid” although the market for such securities typically is less active than public securities markets and may lead to less ability to sell these securities.
During the period, Lehman Brothers Holdings, Inc. (LBHI) and certain of its affiliates sought protection under the insolvency laws of their jurisdictions of organization, including the United States, the United Kingdom and Japan. For the period ended October 31, 2008, Global Bond had outstanding securities trades with counterparties affiliated with LBHI. As a result of these events, LBHI’s affiliates were unable to fulfill their commitments and, in certain cases, Global Bond may have terminated its trades and related agreements with the relevant entities and, where appropriate, is in the process of initiating claims for damages. Management has determined that the financial impact to the Funds relating to these events is immaterial.
NOTE 16 — SECURITIES LENDING
Under an agreement with The Bank of New York Mellon (“BNY”), the Funds can lend their securities to approved brokers, dealers and other financial institutions. Loans are collateralized by cash and U.S. government securities. The collateral is equal to at least 105% of the market value of non-U.S. securities loaned and 102% of the market value of U.S. securities loaned when the transaction is entered into and is adjusted daily for changes in the market values of the securities on loan. The cash collateral received is invested in approved investments as defined in the Securities Lending Agreement with BNY (the “Agreement”). The Funds bear the risk of loss with respect to the investment of collateral. Currently, the cash collateral
NOTE 16 — SECURITIES LENDING (continued)
is invested in the Bank of New York Mellon Corp. Institutional Cash Reserves Fund (“BICR Fund”). BNY serves as investment manager, custodian and operational trustee of the BICR Fund. As of October 31, 2008, the BICR Fund held certain defaulted securities that had market values significantly below amortized cost. The investment in the BICR Fund is included in the Portfolio of Investments under Securities Lending Collateral and the unrealized loss on such investment is included in Net Unrealized Depreciation on the Statements of Assets and Liabilities. Subsequent to October 31, 2008, the Funds agreed, in principle, to the terms of capital support extended by The Bank of New York Mellon Corporation (“BNYC”), an affiliated company of BNY, for the certain defaulted securities held by the BICR Fund. BNYC will support the value of these securities up to a certain amount and subject, in part, to the Funds’ continued lending of securities. The recorded value of each Fund’s investment in the BICR Fund will include the value of the underlying securities held by the BICR Fund and the estimated value of the support to be provided by BNYC.
Generally, in the event of counterparty default, the Funds have the right to use the collateral to offset losses incurred. The Agreement contains certain guarantees by BNY in the event of counterparty default and/or a borrower’s failure to return a loaned security; however, there would be a potential loss to the Funds in the event the Funds are delayed or prevented from exercising their right to dispose of the collateral. Engaging in securities lending could have a leveraging effect, which may intensify the credit, market and other risks associated with investing in a Fund. At October 31, 2008, the following Funds had securities on loan with the following market values:
| | | | | | | | | |
| | | Value of
| | |
| | | Securities
| | Value of
|
Fund | | Loaned | | Collateral |
| |
| Global Equity Dividend | | $ | 6,784,510 | | | $ | 7,031,111 | |
| Global Real Estate | | | 143,983,741 | | | | 136,229,615 | |
| Global Value Choice | | | 12,549,229 | | | | 12,656,612 | |
| Emerging Countries | | | 11,598,481 | | | | 12,022,302 | |
| Foreign | | | 6,888,038 | | | | 7,449,055 | |
| International Growth Opportunities | | | 5,666,508 | | | | 6,150,930 | |
| International SmallCap Multi-Manager | | | 6,608,433 | | | | 6,972,221 | |
| International Value | | | 100,135,669 | | | | 110,326,097 | |
| Russia | | | 31,708,315 | | | | 32,130,516 | |
170
NOTES TO FINANCIAL STATEMENTS as of October 31, 2008 (continued)
NOTE 17 — FEDERAL INCOME TAXES
The amount of distributions from net investment income and net realized capital gains are determined in accordance with federal income tax regulations, which may differ from U.S. generally accepted accounting principles for investment companies. These book/tax differences may be either temporary or permanent. Permanent differences are reclassified within the capital accounts based on their federal tax-basis treatment; temporary differences are not reclassified. Key differences include the treatment of short-term capital gains, foreign currency transactions, equalization, and wash sale deferrals. Distributions in excess of net investment income and/or net realized capital gains for tax purposes are reported as return of capital.
The following permanent tax differences have been reclassified as of October 31, 2008:
| | | | | | | | | | | | | | | | | |
| | | | | Undistributed
| | Accumulated
| | |
| | | Paid-in
| | Net Investment Income
| | Net Realized
| | |
| | | Capital | | On Investments | | Gains / (Losses) | | |
| |
| Global Equity Dividend | | $ | 356,453 | | | $ | (1,761,590 | ) | | $ | 1,405,137 | | | | | |
| Global Natural Resources | | | 2,046,139 | | | | 131,573 | | | | (2,177,712 | ) | | | | |
Global Real Estate(1) | | | 4,315,681 | | | | (3,362,388 | ) | | | (953,293 | ) | | | | |
| Global Value Choice | | | (405,632 | ) | | | (90,646 | ) | | | 496,278 | | | | | |
| Asia-Pacific Real Estate | | | (4,655 | ) | | | (6,224 | ) | | | 10,879 | | | | | |
| Disciplined International SmallCap | | | (21,851 | ) | | | 934,000 | | | | (912,149 | ) | | | | |
| Emerging Countries | | | (3,321,808 | ) | | | (1,129,940 | ) | | | 4,451,748 | | | | | |
| European Real Estate | | | (4,858 | ) | | | 94,830 | | | | (89,972 | ) | | | | |
| Foreign | | | (483,610 | ) | | | (14,563,309 | ) | | | 15,046,919 | | | | | |
| Greater China | | | 704,722 | | | | 1,664,981 | | | | (2,369,703 | ) | | | | |
| Index Plus International Equity | | | — | | | | (771,486 | ) | | | 771,486 | | | | | |
| International Capital Appreciation | | | — | | | | (245,490 | ) | | | 245,490 | | | | | |
| International Equity Dividend | | | (765 | ) | | | (231,071 | ) | | | 231,836 | | | | | |
| International Growth Opportunities | | | (1,838,680 | ) | | | (189,709 | ) | | | 2,028,389 | | | | | |
| International Real Estate | | | (12 | ) | | | (11,293,074 | ) | | | 11,293,086 | | | | | |
| International SmallCap Multi-Manager | | | 2 | | | | (761,262 | ) | | | 761,260 | | | | | |
| International Value | | | 261,128,276 | | | | (13,018,757 | ) | | | (248,109,519 | ) | | | | |
| International Value Choice | | | — | | | | 60,962 | | | | (60,962 | ) | | | | |
| Russia | | | 78,258,958 | | | | 4,900,253 | | | | (83,159,211 | ) | | | | |
| Emerging Markets Fixed Income | | | — | | | | (5,025,526 | ) | | | 5,025,526 | | | | | |
| Global Bond | | | — | | | | 2,136,010 | | | | (2,136,010 | ) | | | | |
| Diversified International | | | — | | | | 20,954,760 | | | | (20,954,760 | ) | | | | |
| |
| (1) | As of the Fund’s tax year ended December 31, 2007. |
Dividends paid by the Funds from net investment income and distributions of net realized short-term capital gains are, for federal income tax purposes, taxable as ordinary income to shareholders.
171
NOTES TO FINANCIAL STATEMENTS as of October 31, 2008 (continued)
NOTE 17 — FEDERAL INCOME TAXES (continued)
The tax composition of dividends and distributions to shareholders was as follows:
| | | | | | | | | | | | | | | | | | | | | | | | | | | | | |
| | | Year Ended October 31, 2008 | | Year Ended October 31, 2007 |
| | | | | | | | | Dividends Paid
| | | | | | Dividends Paid
|
| | | Ordinary
| | Long-Term
| | Return of
| | Deduction on
| | Ordinary
| | Long-Term
| | Deduction on
|
| | | Income | | Capital Gains | | Capital | | Redemptions | | Income | | Capital Gains | | Redemptions |
| |
| Global Equity Dividend | | $ | 16,829,413 | | | $ | 20,212,116 | | | $ | 987,059 | | | $ | — | | | $ | 18,796,716 | | | $ | 3,818,557 | | | $ | 362,377 | |
| Global Natural Resources | | | 20,465,025 | | | | 7,709,284 | | | | — | | | | 2,046,138 | | | | 2,937,873 | | | | 3,999,909 | | | | — | |
Global Real Estate(1) | | | 54,457,206 | | | | 3,823,017 | | | | — | | | | 4,315,681 | | | | 51,930,847 | | | | 8,533,607 | | | | — | |
| Global Value Choice | | | 453,191 | | | | — | | | | — | | | | — | | | | — | | | | — | | | | — | |
| Asia-Pacific Real Estate | | | 68,616 | | | | — | | | | — | | | | — | | | | — | | | | — | | | | — | |
| Disciplined International SmallCap | | | 10,885,408 | | | | — | | | | — | | | | — | | | | — | | | | — | | | | — | |
| Emerging Countries | | | 3,353,946 | | | | 8,984,526 | | | | — | | | | — | | | | 2,943,119 | | | | — | | | | — | |
| European Real Estate | | | 77,180 | | | | — | | | | — | | | | — | | | | — | | | | — | | | | — | |
| Foreign | | | 4,162,876 | | | | 40,260,324 | | | | — | | | | — | | | | 5,017,181 | | | | 12,877,280 | | | | — | |
| Greater China | | | 6,807,369 | | | | 1,427,245 | | | | — | | | | 704,722 | | | | 143,130 | | | | — | | | | — | |
| Index Plus International Equity | | | 11,803,802 | | | | 2,716,188 | | | | — | | | | — | | | | 3,219,136 | | | | — | | | | — | |
| International Capital Appreciation | | | 5,739,016 | | | | 1,233,537 | | | | — | | | | — | | | | 1,644,836 | | | | — | | | | — | |
| International Equity Dividend | | | 2,583,013 | | | | — | | | | 197,865 | | | | — | | | | — | | | | — | | | | — | |
| International Growth Opportunities | | | 10,559,321 | | | | 10,794,409 | | | | — | | | | — | | | | 3,156,568 | | | | 9,769,639 | | | | — | |
| International Real Estate | | | 18,504,346 | | | | — | | | | 9,785,496 | | | | — | | | | 5,257,673 | | | | — | | | | — | |
| International SmallCap Multi-Manager | | | 78,413,094 | | | | 66,294,175 | | | | — | | | | — | | | | 3,451,506 | | | | — | | | | — | |
| International Value | | | 169,348,535 | | | | 657,984,681 | | | | — | | | | 122,133,081 | | | | 122,228,627 | | | | 402,826,028 | | | | 83,732,774 | |
| International Value Choice | | | 4,885,936 | | | | 7,696,698 | | | | — | | | | — | | | | 1,154,606 | | | | 379,371 | | | | — | |
| Russia | | | — | | | | 137,654,710 | | | | — | | | | 54,251,300 | | | | — | | | | 43,574,710 | | | | 23,691,103 | |
| Emerging Markets Fixed Income | | | 14,743,967 | | | | — | | | | 5,503,726 | | | | — | | | | 7,701,124 | | | | — | | | | — | |
| Global Bond | | | 4,587,274 | | | | — | | | | — | | | | — | | | | 1,570,829 | | | | 8,117 | | | | — | |
| Diversified International | | | 11,317,059 | | | | 1,925,350 | | | | — | | | | — | | | | 1,063,277 | | | | — | | | | 19,330 | |
| |
| (1) | Composition of dividends and distributions presented herein is based on the Fund’s tax year-end of December 31, 2007. |
172
NOTES TO FINANCIAL STATEMENTS as of October 31, 2008 (continued)
NOTE 17 — FEDERAL INCOME TAXES (continued)
The tax-basis components of distributable earnings and the expiration dates of the capital loss carryforwards which may be used to offset future realized capital gains for federal income tax purposes as of October 31, 2008 were:
| | | | | | | | | | | | | | | | | | | | | | | | | | | | | |
| | | Undistributed
| | Undistributed
| | Unrealized
| | Post-October
| | Post-October
| | | | |
| | | Ordinary
| | Long-Term
| | Appreciation/
| | Capital Loss
| | PFIC Loss
| | Capital Loss
| | Expiration
|
| | | Income | | Capital Gains | | (Depreciation) | | Deferred | | Deferred | | Carryforwards | | Dates |
| |
| Global Equity Dividend | | $ | — | | | $ | — | | | $ | (81,657,462 | ) | | $ | — | | | $ | — | | | $ | (24,895,240 | ) | | | 2016 | |
| Global Natural Resources | | | — | | | | 5,302,516 | | | | (38,744,976 | ) | | | — | | | | — | | | | — | | | | — | |
Global Real Estate(1) | | | — | | | | 1,490,719 | | | | (613,765,103 | ) | | | (13,204,478 | ) | | | (35,512,284 | ) | | | — | | | | — | |
| Global Value Choice | | | — | | | | — | | | | (40,890,857 | ) | | | — | | | | — | | | | (60,707,345 | ) | | | 2009 | |
| | | | | | | | | | | | | | | | | | | | | | | | (81,779,077 | ) | | | 2010 | |
| | | | | | | | | | | | | | | | | | | | | | | | (6,183,953 | ) | | | 2011 | |
| | | | | | | | | | | | | | | | | | | | | | | | | | | | | |
| | | | | | | | | | | | | | | | | | | | | | | $ | (148,670,375 | ) | | | | |
| | | | | | | | | | | | | | | | | | | | | | | | | | | | | |
| Asia-Pacific Real Estate | | | 10,095 | | | | — | | | | (4,117,756 | ) | | | — | | | | — | | | | (1,331,831 | ) | | | 2016 | |
| Disciplined International SmallCap | | | 7,938,474 | | | | — | | | | (146,070,521 | ) | | | — | | | | — | | | | (73,249,417 | ) | | | 2016 | |
| Emerging Countries | | | 2,746,170 | | | | — | | | | (64,756,716 | ) | | | — | | | | — | | | | (53,090,356 | ) | | | 2016 | |
| European Real Estate | | | 95,760 | | | | — | | | | (2,067,073 | ) | | | — | | | | — | | | | (872,339 | ) | | | 2016 | |
| Foreign | | | 10,422,707 | | | | — | | | | (70,517,583 | ) | | | — | | | | — | | | | (72,680,314 | ) | | | 2016 | |
| Greater China | | | 1,754,292 | | | | 255,507 | | | | (15,228,755 | ) | | | — | | | | — | | | | — | | | | — | |
| Index Plus International Equity | | | 4,340,365 | | | | — | | | | (66,977,435 | ) | | | — | | | | — | | | | (37,732,800 | ) | | | 2016 | |
| International Capital Appreciation | | | 1,054,798 | | | | — | | | | (38,079,789 | ) | | | — | | | | — | | | | (6,257,099 | ) | | | 2016 | |
| International Equity Dividend | | | — | | | | — | | | | (21,245,454 | ) | | | — | | | | — | | | | (9,689,793 | ) | | | 2016 | |
| International Growth Opportunities | | | 187,257 | | | | — | | | | (52,137,198 | ) | | | — | | | | — | | | | (4,921,856 | ) | | | 2016 | |
| International Real Estate | | | — | | | | — | | | | (276,937,528 | ) | | | — | | | | — | | | | (26,312 | ) | | | 2014 | |
| | | | | | | | | | | | | | | | | | | | | | | | (2,515,843 | ) | | | 2015 | |
| | | | | | | | | | | | | | | | | | | | | | | | (68,924,625 | ) | | | 2016 | |
| | | | | | | | | | | | | | | | | | | | | | | | | | | | | |
| | | | | | | | | | | | | | | | | | | | | | | $ | (71,466,780 | ) | | | | |
| | | | | | | | | | | | | | | | | | | | | | | | | | | | | |
| International SmallCap Multi-Manager | | | 10,691,669 | | | | — | | | | (304,493,075 | ) | | | — | | | | — | | | | (153,055,822 | ) | | | 2016 | |
| International Value | | | 94,762,532 | | | | 257,239,139 | | | | (1,228,441,276 | ) | | | — | | | | — | | | | — | | | | — | |
| International Value Choice | | | 568,651 | | | | — | | | | (28,080,682 | ) | | | — | | | | — | | | | (195,990 | ) | | | 2016 | |
| Russia | | | — | | | | 82,386,197 | | | | (227,135,851 | ) | | | — | | | | — | | | | — | | | | — | |
| Emerging Markets Fixed Income | | | — | | | | — | | | | (98,866,204 | ) | | | — | | | | — | | | | (593,649 | ) | | | 2015 | |
| | | | | | | | | | | | | | | | | | | | | | | | (7,586,987 | ) | | | 2016 | |
| | | | | | | | | | | | | | | | | | | | | | | | | | | | | |
| | | | | | | | | | | | | | | | | | | | | | | $ | (8,180,636 | ) | | | | |
| | | | | | | | | | | | | | | | | | | | | | | | | | | | | |
| Global Bond | | | 1,841,225 | | | | — | | | | (7,192,635 | ) | | | — | | | | — | | | | — | | | | — | |
| Diversified International | | | 20,777,313 | | | | — | | | | (190,744,358 | ) | | | — | | | | — | | | | (28,060,058 | ) | | | 2016 | |
| |
| (1) | As of the Fund’s tax year ended December 31, 2007. |
The Funds’ major tax jurisdictions are federal and Arizona. The earliest tax year that remains subject to examination by these jurisdictions is 2003.
173
NOTES TO FINANCIAL STATEMENTS as of October 31, 2008 (continued)
NOTE 18 — OTHER ACCOUNTING PRONOUNCEMENTS
On September 15, 2006, the FASB issued Statement of Financial Accounting Standards No. 157 (“SFAS No. 157”), “Fair Value Measurements.” The new accounting statement defines fair value, establishes a framework for measuring fair value in generally accepted accounting principles (“GAAP”), and expands disclosures about fair value measurements. SFAS No. 157 defines fair value as the price that would be received to sell an asset or paid to transfer a liability in an orderly transaction between market participants at the measurement date (an exit price). SFAS No. 157 also stipulates that, as a market-based measurement, fair value should be determined based on the assumptions that market participants would use in pricing the asset or liability, and establishes a fair value hierarchy that distinguishes between (a) market participant assumptions developed based on market data obtained from sources independent of the reporting entity (observable inputs) and (b) the reporting entity’s own assumptions about market participant assumptions developed based on the best information available in the circumstances (unobservable inputs). SFAS No. 157 is effective for financial statements issued for fiscal years beginning after November 15, 2007. As of October 31, 2008, management of the Funds has determined SFAS No. 157 will not materially impact the manner in which the Funds determine the value of investments but will require additional disclosures.
On March 19, 2008, the FASB issued Statement of Financial Accounting Standards No. 161 (“SFAS No. 161”), “Disclosure about Derivative Instruments and Hedging Activities.” This new accounting statement requires enhanced disclosures about an entity’s derivative and hedging activities. Entities are required to provide enhanced disclosures about (a) how and why an entity invests in derivatives, (b) how derivatives are accounted for under SFAS No. 133, and (c) how derivatives affect an entity’s financial position, financial performance, and cash flows. SFAS No. 161 also requires enhanced disclosures regarding credit-risk-related contingent features of derivative instruments. SFAS No. 161 is effective for financial statements issued for fiscal years and interim periods beginning after November 15, 2008. As of October 31, 2008, management of the Funds is currently assessing the impact of the expanded financial statement disclosures that will result from adopting SFAS No. 161.
On September 12, 2008, the FASB issued FASB Staff Position (“FSP”) No. 133-1 and FASB Interpretation Number (“FIN”) 45-4, “Disclosures about Credit Derivatives and Certain Guarantees: An Amendment of FASB Statement No. 133 and FASB Interpretation No. 45; and Clarification of the Effective Date of FASB Statement No. 161.” The FSP is intended to improve disclosures about credit derivatives by requiring more information about the potential adverse effects of changes in credit risk on the financial position, financial performance, and cash flows of the sellers of credit derivatives. It amends FASB Statement No. 133, “Accounting for Derivative Instruments and Hedging Activities,” to require disclosures by sellers of credit derivatives, including credit derivatives embedded in hybrid instruments. The FSP also amends FIN 45, “Guarantor’s Accounting and Disclosure Requirements for Guarantees, Including Indirect Guarantees of Indebtedness to Others,” to require an additional disclosure about the current status of the payment/performance risk of a guarantee. This amendment of FIN 45 reflects the Board’s belief that instruments with similar risks should have similar disclosures. These amendments are effective for financial statements issued for fiscal years and interim periods ending after November 15, 2008. As of October 31, 2008, management of the Funds is currently assessing the impact of adopting FSP No. 133-1 and FIN 45-4.
174
NOTES TO FINANCIAL STATEMENTS as of October 31, 2008 (continued)
NOTE 19 — SUBSEQUENT EVENTS
Dividends: Subsequent to October 31, 2008, the following Funds paid dividends and distributions of:
| | | | | | | | | | | | | | | | | | | | | |
| | | Net Investment
| | Short-Term
| | Long-Term
| | Payable
| | Record
|
| | | Income | | Capital Gains | | Capital Gains | | Date | | Date |
| |
International Value | | | | | | | | | | | | | | | | | | | | |
| Class A | | $ | 0.3445 | | | $ | 0.1686 | | | $ | 1.2129 | | | | November 5, 2008 | | | | October 31, 2008 | |
| Class B | | $ | 0.1618 | | | $ | 0.1686 | | | $ | 1.2129 | | | | November 5, 2008 | | | | October 31, 2008 | |
| Class C | | $ | 0.2302 | | | $ | 0.1686 | | | $ | 1.2129 | | | | November 5, 2008 | | | | October 31, 2008 | |
| Class I | | $ | 0.4094 | | | $ | 0.1686 | | | $ | 1.2129 | | | | November 5, 2008 | | | | October 31, 2008 | |
| Class Q | | $ | 0.4124 | | | $ | 0.1686 | | | $ | 1.2129 | | | | November 5, 2008 | | | | October 31, 2008 | |
| | | | | | | | | | | | | | | | | | | | | |
Russia | | | | | | | | | | | | | | | | | | | | |
| Class A | | $ | — | | | $ | — | | | $ | 8.0810 | | | | November 5, 2008 | | | | October 31, 2008 | |
| | | | | | | | | | | | | | | | | | | | | |
Emerging Markets Fixed Income | | | | | | | | | | | | | | | | | | | | |
| Class A | | $ | 0.0300 | | | $ | — | | | $ | — | | | | November 5, 2008 | | | | October 31, 2008 | |
| Class B | | $ | 0.0256 | | | $ | — | | | $ | — | | | | November 5, 2008 | | | | October 31, 2008 | |
| Class C | | $ | 0.0256 | | | $ | — | | | $ | — | | | | November 5, 2008 | | | | October 31, 2008 | |
| Class I | | $ | 0.0327 | | | $ | — | | | $ | — | | | | November 5, 2008 | | | | October 31, 2008 | |
| Class A | | $ | 0.0060 | | | $ | — | | | $ | — | | | | December 3, 2008 | | | | November 28, 2008 | |
| Class B | | $ | 0.0021 | | | $ | — | | | $ | — | | | | December 3, 2008 | | | | November 28, 2008 | |
| Class C | | $ | 0.0020 | | | $ | — | | | $ | — | | | | December 3, 2008 | | | | November 28, 2008 | |
| Class I | | $ | 0.0085 | | | $ | — | | | $ | — | | | | December 3, 2008 | | | | November 28, 2008 | |
| | | | | | | | | | | | | | | | | | | | | |
Global Bond | | | | | | | | | | | | | | | | | | | | |
| Class A | | $ | 0.0025 | | | $ | — | | | $ | — | | | | December 1, 2008 | | | | Daily | |
| Class B | | $ | — | | | $ | — | | | $ | — | | | | December 1, 2008 | | | | Daily | |
| Class C | | $ | — | | | $ | — | | | $ | — | | | | December 1, 2008 | | | | Daily | |
| Class I | | $ | 0.0132 | | | $ | — | | | $ | — | | | | December 1, 2008 | | | | Daily | |
| Class O | | $ | 0.0112 | | | $ | — | | | $ | — | | | | December 1, 2008 | | | | Daily | |
In connection with the addition of a second sleeve managed by ING Investment Management Co. on October 27, 2008, ING International Value Fund reopened to the public on November 3, 2008.
NOTE 20 — INFORMATION REGARDING TRADING OF ING’S U.S. MUTUAL FUNDS
As discussed in earlier supplements that were previously filed with the SEC, ING Investments, the adviser to the ING Funds, has reported to the Boards of Directors/Trustees (the “Boards”) of the ING Funds that, like many U.S. financial services companies, ING Investments and certain of its U.S. affiliates have received informal and formal requests for information since September 2003 from various governmental and self-regulatory agencies in connection with investigations related to mutual funds and variable insurance products. ING Investments has advised the Boards that it and its affiliates have cooperated fully with each request.
In addition to responding to regulatory and governmental requests, ING Investments reported that management of U.S. affiliates of ING Groep N.V., including ING Investments (collectively, “ING”), on their own initiative, have conducted, through independent special counsel and a national accounting firm, an extensive internal review of trading in ING insurance, retirement, and mutual fund products. ING’s internal review related to mutual fund trading has been completed. ING has reported that, of the millions of customer relationships that ING maintains, the internal review identified several isolated arrangements allowing third parties to engage in frequent trading of mutual funds within ING’s variable insurance and mutual fund products, and identified other circumstances where frequent trading occurred, despite measures taken by ING intended to combat market timing. ING further reported that each of these arrangements has been terminated and fully disclosed to regulators. The results of the internal review were also reported to the independent members of the Boards.
ING Investments has advised the Boards that most of the identified arrangements were initiated prior to ING’s acquisition of the businesses in question in the U.S. ING Investments further reported that the companies in question did not receive special benefits in return for any of these arrangements, which have all been terminated.
Based on the internal review, ING Investments has advised the Boards that the identified arrangements do not represent a systemic problem in any of the companies that were involved.
175
NOTES TO FINANCIAL STATEMENTS as of October 31, 2008 (continued)
NOTE 20 — INFORMATION REGARDING TRADING OF ING’S U.S. MUTUAL FUNDS (continued)
Despite the extensive internal review conducted through independent special counsel and a national accounting firm, there can be no assurance that the instances of inappropriate trading reported to the Boards are the only instances of such trading respecting the ING Funds.
ING Investments reported to the Boards that ING is committed to conducting its business with the highest standards of ethical conduct with zero tolerance for noncompliance. Accordingly, ING Investments advised the Boards that ING management was disappointed that its voluntary internal review identified these situations. Viewed in the context of the breadth and magnitude of its U.S. business as a whole, ING management does not believe that ING’s acquired companies had systemic ethical or compliance issues in these areas. Nonetheless, ING Investments reported that given ING’s refusal to tolerate any lapses, it has taken the steps noted below, and will continue to seek opportunities to further strengthen the internal controls of its affiliates.
| |
| • | ING has agreed with the ING Funds to indemnify and hold harmless the ING Funds from all damages resulting from wrongful conduct by ING or its employees or from ING’s internal investigation, any investigations conducted by any governmental or self-regulatory agencies, litigation or other formal proceedings, including any proceedings by the SEC. ING Investments reported to the Boards that the indemnification commitments made by ING Funds related to mutual fund trading have been settled and restitution amounts prepared by an independent consultant have been paid to the affected ING Funds. The net aggregate settlement amounts received by the Funds on December 17, 2008 are as follows: |
| | | | | |
| Emerging Countries | | $ | 437,763 | |
| International Growth Opportunities | | $ | 194,530 | |
| International SmallCap Multi-Manager | | $ | 1,028,303 | |
| International Value | | $ | 55,278 | |
| |
| • | ING updated its Code of Conduct for employees reinforcing its employees’ obligation to conduct personal trading activity consistent with the law, disclosed limits, and other requirements. |
Other Regulatory Matters
The New York Attorney General and other federal and state regulators are also conducting broad inquiries and investigations involving the insurance industry. These initiatives currently focus on, among other things, compensation and other sales incentives; potential conflicts of interest; potential anti-competitive activity; reinsurance; marketing practices (including suitability); specific product types (including group annuities and indexed annuities); fund selection for investment products and brokerage sales; and disclosure. It is likely that the scope of these industry investigations will further broaden before they conclude. ING has received formal and informal requests in connection with such investigations, and is cooperating fully with each request.
Other federal and state regulators could initiate similar actions in this or other areas of ING’s businesses. These regulatory initiatives may result in new legislation and regulation that could significantly affect the financial services industry, including businesses in which ING is engaged. In light of these and other developments, ING continuously reviews whether modifications to its business practices are appropriate. At this time, in light of the current regulatory factors, ING U.S. is actively engaged in reviewing whether any modifications in our practices are appropriate for the future.
There can be no assurance that these matters, or the adverse publicity associated with them, will not result in increased fund redemptions, reduced sale of fund shares, or other adverse consequences to ING Funds.
176
PORTFOLIO OF INVESTMENTS
ING Global Equity Dividend Fund
as of October 31, 2008
| | | | | | | | | | | | | | | |
| Shares | | | | | | | | Value |
| |
| |
| |
COMMON STOCK: 95.1% |
| | | | | | | |
| | | | | | | Australia: 6.4% |
| | 125,793 | | | | | Australia & New Zealand Banking Group Ltd. | | $ | 1,474,608 | |
| | 163,045 | | | | | Crown Ltd. | | | 729,694 | |
| | 426,341 | | | | | Foster’s Group Ltd. | | | 1,629,812 | |
| | 633,732 | | | | | Insurance Australia Group | | | 1,605,322 | |
| | 534,026 | | | | | Macquarie Airports Management Ltd. | | | 759,478 | |
| | 196,563 | | | | | Suncorp-Metway Ltd. | | | 1,058,134 | |
| | 173,761 | | | | | TABCORP Holdings Ltd. | | | 796,628 | |
| | 102,717 | | | | | Wesfarmers Ltd. | | | 1,476,203 | |
| | | | | | | | | | | |
| | | | | | | | | | | | | | 9,529,879 | |
| | | | | | | | | | | | | | | |
| | | | | | | |
| | | | | | | Belgium: 1.5% |
| | 43,307 | | | | | Belgacom SA | | | 1,481,732 | |
| | 25,304 | | | | | Elia System Operator SA | | | 791,265 | |
| | | | | | | | | | | |
| | | | | | | | | | | | | | 2,272,997 | |
| | | | | | | | | | | | | | | |
| | | | | | | |
| | | | | | | Bermuda: 0.5% |
| | 175,860 | | | | | Hiscox Ltd. | | | 696,845 | |
| | | | | | | | | | | |
| | | | | | | | | | | | | | 696,845 | |
| | | | | | | | | | | | | | | |
| | | | | | | |
| | | | | | | Brazil: 0.5% |
| | 56,975 | | | | | Tele Norte Leste Participacoes SA ADR | | | 773,721 | |
| | | | | | | | | | | |
| | | | | | | | | | | | | | 773,721 | |
| | | | | | | | | | | | | | | |
| | | | | | | |
| | | | | | | Canada: 3.6% |
| | 48,806 | | | @,#
| | Bell Aliant Regional Communications Income Fund | | | 972,232 | |
| | 35,716 | | | | | Enerplus Resources Fund | | | 953,974 | |
| | 145,951 | | | | | Precision Drilling Trust | | | 1,574,183 | |
| | 61,994 | | | | | TransCanada Corp. | | | 1,873,244 | |
| | | | | | | | | | | |
| | | | | | | | | | | | | | 5,373,633 | |
| | | | | | | | | | | | | | | |
| | | | | | | |
| | | | | | | Finland: 0.4% |
| | 42,721 | | | | | Nokia OYJ | | | 654,409 | |
| | | | | | | | | | | |
| | | | | | | | | | | | | | 654,409 | |
| | | | | | | | | | | | | | | |
| | | | | | | |
| | | | | | | France: 9.9% |
| | 41,102 | | | | | Accor SA | | | 1,599,088 | |
| | 30,605 | | | | | BNP Paribas | | | 2,209,723 | |
| | 39,414 | | | | | Bouygues SA | | | 1,678,261 | |
| | 60,590 | | | | | France Telecom SA | | | 1,527,813 | |
| | 23,570 | | | | | Sanofi-Aventis | | | 1,493,328 | |
| | 42,023 | | | | | Total SA | | | 2,311,831 | |
| | 46,504 | | | | | Vinci SA | | | 1,673,557 | |
| | 86,183 | | | | | Vivendi | | | 2,252,748 | |
| | | | | | | | | | | |
| | | | | | | | | | | | | | 14,746,349 | |
| | | | | | | | | | | | | | | |
| | | | | | | |
| | | | | | | Germany: 2.0% |
| | 45,340 | | | | | E.ON AG | | | 1,735,201 | |
| | 9,607 | | | | | Muenchener Rueckversicherungs AG | | | 1,272,631 | |
| | | | | | | | | | | |
| | | | | | | | | | | | | | 3,007,832 | |
| | | | | | | | | | | | | | | |
| | | | | | | |
| | | | | | | Hungary: 1.1% |
| | 99,007 | | | L | | Magyar Telekom Telecommunications PLC ADR | | | 1,574,211 | |
| | | | | | | | | | | |
| | | | | | | | | | | | | | 1,574,211 | |
| | | | | | | | | | | | | | | |
| | | | | | | |
| | | | | | | Ireland: 1.0% |
| | 213,586 | | | | | Allied Irish Banks PLC | | | 1,155,554 | |
| | 87,499 | | | | | Irish Life & Permanent PLC | | | 272,510 | |
| | | | | | | | | | | |
| | | | | | | | | | | | | | 1,428,064 | |
| | | | | | | | | | | | | | | |
| | | | | | | |
| | | | | | | Israel: 0.6% |
| | 418,199 | | | | | Bank Hapoalim BM | | | 946,977 | |
| | | | | | | | | | | |
| | | | | | | | | | | | | | 946,977 | |
| | | | | | | | | | | | | | | |
| | | | | | | |
| | | | | | | Italy: 8.4% |
| | 44,411 | | | | | Banche Popolari Unite Scpa | | | 749,219 | |
| | 252,930 | | | | | Enel S.p.A. | | | 1,692,167 | |
| | 105,576 | | | | | ENI S.p.A. | | | 2,519,905 | |
| | 566,258 | | | | | Intesa Sanpaolo S.p.A. | | | 2,072,444 | |
| | 99,564 | | | | | Italcementi S.p.A. RNC | | | 692,818 | |
| | 326,810 | | | | | Mediaset S.p.A. | | | 1,775,554 | |
| | 284,395 | | | | | Snam Rete Gas S.p.A. | | | 1,439,650 | |
| | 1,862,599 | | | | | Telecom Italia S.p.A. RNC | | | 1,567,423 | |
| | | | | | | | | | | |
| | | | | | | | | | | | | | 12,509,180 | |
| | | | | | | | | | | | | | | |
| | | | | | | |
| | | | | | | Japan: 0.8% |
| | 3,600 | | | | | Nintendo Co., Ltd. | | | 1,156,710 | |
| | | | | | | | | | | |
| | | | | | | | | | | | | | 1,156,710 | |
| | | | | | | | | | | | | | | |
| | | | | | | |
| | | | | | | Netherlands: 2.9% |
| | 20,620 | | | | | Akzo Nobel NV | | | 857,092 | |
| | 42,892 | | | | | Randstad Holdings NV | | | 833,724 | |
| | 53,024 | | | @ | | Royal Dutch Shell PLC | | | 1,469,665 | |
| | 45,484 | | | | | Unilever NV | | | 1,096,141 | |
| | | | | | | | | | | |
| | | | | | | | | | | | | | 4,256,622 | |
| | | | | | | | | | | | | | | |
| | | | | | | |
| | | | | | | New Zealand: 0.5% |
| | 532,404 | | | | | Telecom Corp. of New Zealand Ltd. | | | 721,683 | |
| | | | | | | | | | | |
| | | | | | | | | | | | | | 721,683 | |
| | | | | | | | | | | | | | | |
| | | | | | | |
| | | | | | | Poland: 1.1% |
| | 218,205 | | | | | Telekomunikacja Polska SA | | | 1,648,794 | |
| | | | | | | | | | | |
| | | | | | | | | | | | | | 1,648,794 | |
| | | | | | | | | | | | | | | |
| | | | | | | |
| | | | | | | Singapore: 0.6% |
| | 116,000 | | | | | DBS Group Holdings Ltd. | | | 885,485 | |
| | | | | | | | | | | |
| | | | | | | | | | | | | | 885,485 | |
| | | | | | | | | | | | | | | |
| | | | | | | |
| | | | | | | South Korea: 1.1% |
| | 56,943 | | | L | | KT Corp. ADR | | | 714,635 | |
| | 17,771 | | | | | S-Oil Corp. | | | 900,386 | |
| | | | | | | | | | | |
| | | | | | | | | | | | | | 1,615,021 | |
| | | | | | | | | | | | | | | |
| | | | | | | |
| | | | | | | Spain: 3.3% |
| | 138,106 | | | | | Banco Bilbao Vizcaya Argentaria SA | | | 1,602,903 | |
| | 179,912 | | | | | Banco Santander Central Hispano SA | | | 1,945,778 | |
| | 74,907 | | | | | Telefonica SA | | | 1,386,899 | |
| | | | | | | | | | | |
| | | | | | | | | | | | | | 4,935,580 | |
| | | | | | | | | | | | | | | |
| | | | | | | |
| | | | | | | Sweden: 1.7% |
| | 191,807 | | | | | Svenska Cellulosa AB — B Shares | | | 1,416,379 | |
| | 125,094 | | | L | | Swedbank AB | | | 1,033,767 | |
| | | | | | | | | | | |
| | | | | | | | | | | | | | 2,450,146 | |
| | | | | | | | | | | | | | | |
| | | | | | | |
| | | | | | | Taiwan: 1.1% |
| | 206,331 | | | | | Taiwan Semiconductor Manufacturing Co., Ltd. ADR | | | 1,704,294 | |
| | | | | | | | | | | |
| | | | | | | | | | | | | | 1,704,294 | |
| | | | | | | | | | | | | | | |
| | | | | | | |
| | | | | | | Thailand: 0.5% |
| | 250,100 | | | | | Siam Cement PCL | | | 756,463 | |
| | | | | | | | | | | |
| | | | | | | | | | | | | | 756,463 | |
| | | | | | | | | | | | | | | |
| | | | | | | |
| | | | | | | United Kingdom: 12.6% |
| | 35,231 | | | | | AstraZeneca PLC | | | 1,493,035 | |
| | 297,490 | | | | | Aviva PLC | | | 1,774,529 | |
| | 463,398 | | | | | BBA Aviation PLC | | | 594,618 | |
| | 284,434 | | | | | BP PLC | | | 2,318,565 | |
| | 61,040 | | | | | British American Tobacco PLC | | | 1,674,283 | |
| | 1,029,728 | | | | | Cattles PLC | | | 549,194 | |
| | 46,844 | | | | | Diageo PLC | | | 714,863 | |
| | 104,644 | | | | | GlaxoSmithKline PLC | | | 2,011,670 | |
| | 123,908 | | | | | HSBC Holdings PLC | | | 1,467,592 | |
See Accompanying Notes to Financial Statements
177
PORTFOLIO OF INVESTMENTS
ING Global Equity Dividend Fund
as of October 31, 2008 (continued)
| | | | | | | | | | | | | | | |
| Shares | | | | | | | | Value |
| |
| |
| | | | | | | United Kingdom (continued) |
| | 1,210,440 | | | | | Legal & General Group PLC | | $ | 1,392,116 | |
| | 196,763 | | | | | Marks & Spencer Group PLC | | | 697,556 | |
| | 193,255 | | | | | Tate & Lyle PLC | | | 1,148,897 | |
| | 130,467 | | | | | United Utilities Group PLC | | | 1,473,232 | |
| | 761,195 | | | | | Vodafone Group PLC | | | 1,464,321 | |
| | | | | | | | | | | |
| | | | | | | | | | | | | | 18,774,471 | |
| | | | | | | | | | | | | | | |
| | | | | | | |
| | | | | | | United States: 33.0% |
| | 52,129 | | | | | AGL Resources, Inc. | | | 1,584,722 | |
| | 41,130 | | | | | Altria Group, Inc. | | | 789,285 | |
| | 45,517 | | | L | | Ameren Corp. | | | 1,477,027 | |
| | 33,484 | | | | | Arthur J. Gallagher & Co. | | | 815,670 | |
| | 53,803 | | | | | AT&T, Inc. | | | 1,440,306 | |
| | 95,879 | | | | | Bank of America Corp. | | | 2,317,395 | |
| | 91,915 | | | | | Bristol-Myers Squibb Co. | | | 1,888,853 | |
| | 29,253 | | | L | | Carnival Corp. | | | 743,026 | |
| | 147,457 | | | | | Citigroup, Inc. | | | 2,012,788 | |
| | 35,739 | | | | | Coca-Cola Co. | | | 1,574,660 | |
| | 32,988 | | | | | Consolidated Edison, Inc. | | | 1,429,040 | |
| | 59,451 | | | | | Dow Chemical Co. | | | 1,585,558 | |
| | 41,739 | | | | | Duke Energy Corp. | | | 683,685 | |
| | 35,335 | | | | | EI Du Pont de Nemours & Co. | | | 1,130,720 | |
| | 13,641 | | | | | Exelon Corp. | | | 739,888 | |
| | 111,862 | | | L | | Fifth Third Bancorp. | | | 1,213,703 | |
| | 59,833 | | | | | Foot Locker, Inc. | | | 874,758 | |
| | 117,387 | | | L | | General Electric Co. | | | 2,290,220 | |
| | 35,697 | | | L | | Home Depot, Inc. | | | 842,092 | |
| | 12,628 | | | | | Kinder Morgan Energy Partners LP | | | 682,543 | |
| | 58,496 | | | | | Kraft Foods, Inc. | | | 1,704,573 | |
| | 89,070 | | | L | | Leggett & Platt, Inc. | | | 1,546,255 | |
| | 72,162 | | | | | Macy’s, Inc. | | | 886,871 | |
| | 114,376 | | | L | | Masco Corp. | | | 1,160,916 | |
| | 46,524 | | | | | MeadWestvaco Corp. | | | 652,732 | |
| | 48,929 | | | | | Merck & Co., Inc. | | | 1,514,353 | |
| | 51,861 | | | | | Newell Rubbermaid, Inc. | | | 713,089 | |
| | 108,811 | | | | | NiSource, Inc. | | | 1,410,191 | |
| | 120,097 | | | | | Pfizer, Inc. | | | 2,126,918 | |
| | 36,509 | | | | | Philip Morris International, Inc. | | | 1,587,046 | |
| | 28,646 | | | | | Reynolds American, Inc. | | | 1,402,508 | |
| | 158,843 | | | L | | Sara Lee Corp. | | | 1,775,865 | |
| | 87,914 | | | | | Seagate Technology, Inc. | | | 595,178 | |
| | 46,605 | | | | | Southern Co. | | | 1,600,416 | |
| | 46,047 | | | | | Spectra Energy Corp. | | | 890,089 | |
| | 27,952 | | | | | Sunoco, Inc. | | | 852,536 | |
| | 45,533 | | | | | US Bancorp. | | | 1,357,339 | |
| | 19,659 | | | | | UST, Inc. | | | 1,328,752 | |
| | | | | | | | | | | |
| | | | | | | | | | | | | | 49,221,566 | |
| | | | | | | | | | | | | | | |
| | | | | | | Total Common Stock
(Cost $214,327,058 ) | | | 141,640,932 | |
| | | | | | | | | | | |
| |
REAL ESTATE INVESTMENT TRUSTS: 2.0% |
| | | | | | | |
| | | | | | | Australia: 0.5% |
| | 74,151 | | | | | Westfield Group | | | 818,977 | |
| | | | | | | | | | | |
| | | | | | | | | | | | | | 818,977 | |
| | | | | | | | | | | | | | | |
| | | | | | | |
| | | | | | | Germany: 0.1% |
| | 22,502 | | | | | Alstria Office AG | | | 143,886 | |
| | | | | | | | | | | |
| | | | | | | | | | | | | | 143,886 | |
| | | | | | | | | | | | | | | |
| | | | | | | |
| | | | | | | Netherlands: 0.5% |
| | 12,736 | | | | | Corio NV | | | 680,609 | |
| | | | | | | | | | | |
| | | | | | | | | | | | | | 680,609 | |
| | | | | | | | | | | | | | | |
| | | | | | | |
| | | | | | | United States: 0.9% |
| | 51,122 | | | | | Duke Realty Corp. | | | 721,331 | |
| | 21,017 | | | L | | Rayonier, Inc. | | | 695,242 | |
| | | | | | | | | | | |
| | | | | | | | | | | | | | 1,416,573 | |
| | | | | | | | | | | | | | | |
| | | | | | | Total Real Estate Investment Trusts
(Cost $5,260,908 ) | | | 3,060,045 | |
| | | | | | | | | | | |
| | | | | | | Total Long-Term Investments
(Cost $219,587,966 ) | | | 144,700,977 | |
| | | | | | | | | | | |
Principal
| | | | | | | | |
| Amount | | | | | | | | Value |
| |
| |
| |
SHORT-TERM INVESTMENTS: 4.7% |
| | | | | | | |
| | | | | | | Securities Lending Collateralcc: 4.7% |
| $ | 7,140,453 | | | | | Bank of New York Mellon Corp. Institutional Cash Reserves | | $ | 7,031,111 | |
| | | | | | | | | | | |
| | | | | | | Total Short-Term Investments
(Cost $7,140,453) | | | 7,031,111 | |
| | | | | | | | | | | |
| | | | | Total Investments in Securities |
| | | | | (Cost $226,728,419)* | | | 101.8 | % | | $ | 151,732,088 | |
| | | | | Other Assets and
Liabilities - Net | | | (1.8 | ) | | | (2,748,143 | ) |
| | | | | | | | | | | | | |
| | | | | Net Assets | | | 100.0 | % | | $ | 148,983,945 | |
| | | | | | | | | | | | | |
| | | |
| @ | | Non-income producing security |
| ADR | | American Depositary Receipt |
| # | | Securities with purchases pursuant to Rule 144A or section 4(2), under the Securities Act of 1933 and may not be resold subject to that rule except to qualified institutional buyers. Unless otherwise noted, these securities have been determined to be liquid under the guidelines established by the Funds’ Board of Directors/Trustees. |
| cc | | Securities purchased with cash collateral for securities loaned. |
| L | | Loaned security, a portion or all of the security is on loan at October 31, 2008. |
| | | |
| * | | Cost for federal income tax purposes is $233,364,094. |
| | | |
| | | Net unrealized depreciation consists of: |
| | | | | |
| Gross Unrealized Appreciation | | $ | 607,179 | |
| Gross Unrealized Depreciation | | | (82,239,185 | ) |
| | | | | |
| Net Unrealized Depreciation | | $ | (81,632,006 | ) |
| | | | | |
| | | | | |
| | | Percentage of
|
| Industry | | Net Assets |
|
| |
| Aerospace/Defense | | | 0.4 | % |
| Agriculture | | | 4.5 | |
| Banks | | | 15.8 | |
| Beverages | | | 2.6 | |
| Building Materials | | | 1.7 | |
| Chemicals | | | 2.4 | |
| Commercial Services | | | 0.6 | |
| Computers | | | 0.4 | |
| Diversified | | | 0.9 | |
| Diversified Financial Services | | | 0.5 | |
| Electric | | | 6.8 | |
| Engineering & Construction | | | 2.8 | |
| Entertainment | | | 0.5 | |
| Food | | | 3.8 | |
| Forest Products & Paper | | | 1.9 | |
| Gas | | | 3.0 | |
| Housewares | | | 0.5 | |
| Insurance | | | 5.1 | |
| Leisure Time | | | 0.5 | |
| Lodging | | | 1.6 | |
| Media | | | 2.7 | |
| Miscellaneous Manufacturing | | | 3.6 | |
See Accompanying Notes to Financial Statements
178
PORTFOLIO OF INVESTMENTS
ING Global Equity Dividend Fund
as of October 31, 2008 (continued)
| | | | | |
| | | Percentage of
|
| Industry | | Net Assets |
|
| |
| Office Property | | | 0.1 | % |
| Oil & Gas | | | 8.7 | |
| Pharmaceuticals | | | 7.1 | |
| Pipelines | | | 2.3 | |
| Retail | | | 2.2 | |
| Semiconductors | | | 1.1 | |
| Shopping Centers | | | 0.5 | |
| Telecommunications | | | 10.7 | |
| Toys/Games/Hobbies | | | 0.8 | |
| Water | | | 1.0 | |
| Short-Term Investments | | | 4.7 | |
| Other Assets and Liabilities — Net | | | (1.8 | ) |
| | | | | |
Net Assets | | | 100.0 | % |
| | | | | |
See Accompanying Notes to Financial Statements
179
PORTFOLIO OF INVESTMENTS
ING Global Natural Resources Fund
as of October 31, 2008
| | | | | | | | | | | | | | | |
| Shares | | | | | | | | Value |
| |
| |
| |
COMMON STOCK: 97.3% |
| | | | | | | |
| | | | | | | Australia: 0.9% |
| | 520,600 | | | | | Boart Longyear Group | | $ | 151,049 | |
| | 333,200 | | | @ | | Centamin Egypt Ltd. | | | 157,574 | |
| | 110,467 | | | @ | | Sino Gold Ltd. | | | 254,439 | |
| | 161,081 | | | @ | | White Energy Co., Ltd. | | | 210,180 | |
| | | | | | | | | | | |
| | | | | | | | | | | | | | 773,242 | |
| | | | | | | | | | | | | | | |
| | | | | | | |
| | | | | | | Barbados: 0.9% |
| | 53,645 | | | @ | | Nabors Industries Ltd. | | | 771,415 | |
| | | | | | | | | | | |
| | | | | | | | | | | | | | 771,415 | |
| | | | | | | | | | | | | | | |
| | | | | | | |
| | | | | | | Bermuda: 0.7% |
| | 20,400 | | | | | Nordic American Tanker Shipping | | | 604,860 | |
| | | | | | | | | | | |
| | | | | | | | | | | | | | 604,860 | |
| | | | | | | | | | | | | | | |
| | | | | | | |
| | | | | | | Brazil: 0.4% |
| | 11,300 | | | | | Petroleo Brasileiro SA ADR | | | 303,857 | |
| | | | | | | | | | | |
| | | | | | | | | | | | | | 303,857 | |
| | | | | | | | | | | | | | | |
| | | | | | | |
| | | | | | | Canada: 15.3% |
| | 33,006 | | | | | Barrick Gold Corp. | | | 749,896 | |
| | 23,160 | | | | | Canadian Natural Resources Ltd. | | | 1,170,043 | |
| | 420,484 | | | @ | | Catalyst Paper Corp. | | | 136,056 | |
| | 186,187 | | | @ | | Consolidated Thompson Iron Mines Ltd. | | | 301,223 | |
| | 73,267 | | | @ | | Eldorado Gold Corp. (Canadian Denominated Security) | | | 302,721 | |
| | 77,655 | | | | | Encana Corp. | | | 3,953,416 | |
| | 250,983 | | | @ | | European Goldfields Ltd. | | | 314,432 | |
| | 20,372 | | | | | GoldCorp, Inc. | | | 380,142 | |
| | 68,624 | | | | | Iamgold Corp. | | | 226,459 | |
| | 41,505 | | | | | Kinross Gold Corp. | | | 432,897 | |
| | 43,027 | | | @ | | MAG Silver Corp. | | | 178,134 | |
| | 21,268 | | | | | Major Drilling Group International | | | 291,326 | |
| | 44,474 | | | | | Nexen, Inc. | | | 711,139 | |
| | 135,723 | | | @ | | Premier Gold Mines Ltd. | | | 182,420 | |
| | 189,116 | | | @,I | | Shore Gold, Inc. | | | 98,849 | |
| | 24,137 | | | @ | | Sino-Forest Corp. | | | 225,890 | |
| | 43,915 | | | | | Suncor Energy, Inc. | | | 1,050,447 | |
| | 174,788 | | | | | Talisman Energy, Inc. | | | 1,761,863 | |
| | 49,264 | | | @ | | Viterra, Inc. | | | 312,677 | |
| | | | | | | | | | | |
| | | | | | | | | | | | | | 12,780,030 | |
| | | | | | | | | | | | | | | |
| | | | | | | |
| | | | | | | France: 2.0% |
| | 30,468 | | | | | Total SA ADR | | | 1,689,146 | |
| | | | | | | | | | | |
| | | | | | | | | | | | | | 1,689,146 | |
| | | | | | | | | | | | | | | |
| | | | | | | |
| | | | | | | Italy: 1.2% |
| | 20,774 | | | | | ENI S.p.A. ADR | | | 998,191 | |
| | | | | | | | | | | |
| | | | | | | | | | | | | | 998,191 | |
| | | | | | | | | | | | | | | |
| | | | | | | |
| | | | | | | Netherlands: 3.4% |
| | 51,836 | | | | | Royal Dutch Shell PLC ADR — Class A | | | 2,892,967 | |
| | | | | | | | | | | |
| | | | | | | | | | | | | | 2,892,967 | |
| | | | | | | | | | | | | | | |
| | | | | | | |
| | | | | | | United Kingdom: 1.0% |
| | 11,077 | | | | | BP PLC ADR | | | 550,527 | |
| | 8,567 | | | | | Randgold Resources Ltd. ADR | | | 265,663 | |
| | | | | | | | | | | |
| | | | | | | | | | | | | | 816,190 | |
| | | | | | | | | | | | | | | |
| | | | | | | |
| | | | | | | United States: 71.5% |
| | 42,414 | | | | | Anadarko Petroleum Corp. | | | 1,497,214 | |
| | 47,434 | | | | | Apache Corp. | | | 3,905,241 | |
| | 18,503 | | | | | Arch Coal, Inc. | | | 396,149 | |
| | 140,792 | | | | | BJ Services Co. | | | 1,809,177 | |
| | 98,825 | | | | | Chevron Corp. | | | 7,372,344 | |
| | 28,786 | | | | | Cimarex Energy Co. | | | 1,164,682 | |
| | 79,104 | | | | | ConocoPhillips | | | 4,114,990 | |
| | 12,065 | | | | | Consol Energy, Inc. | | | 378,720 | |
| | 43,278 | | | | | Devon Energy Corp. | | | 3,499,459 | |
| | 43,757 | | | | | Diana Shipping, Inc. | | | 727,679 | |
| | 6,600 | | | | | EOG Resources, Inc. | | | 534,072 | |
| | 135,328 | | | | | ExxonMobil Corp. | | | 10,030,511 | |
| | 17,439 | | | | | Freeport-McMoRan Copper & Gold, Inc. | | | 507,475 | |
| | 101,374 | | | | | Halliburton Co. | | | 2,006,191 | |
| | 25,373 | | | | | Hess Corp. | | | 1,527,708 | |
| | 108,558 | | | @ | | Key Energy Services, Inc. | | | 673,060 | |
| | 102,116 | | | | | Marathon Oil Corp. | | | 2,971,576 | |
| | 13,063 | | | | | Newmont Mining Corp. | | | 344,079 | |
| | 69,067 | | | | | Occidental Petroleum Corp. | | | 3,835,981 | |
| | 101,409 | | | | | Patterson-UTI Energy, Inc. | | | 1,345,697 | |
| | 18,893 | | | | | Peabody Energy Corp. | | | 651,997 | |
| | 81,388 | | | | | Schlumberger Ltd. | | | 4,203,693 | |
| | 4,451 | | | | | Smith International, Inc. | | | 153,470 | |
| | 15,431 | | | @ | | Stone Energy Corp. | | | 468,177 | |
| | 12,760 | | | | | Sunoco, Inc. | | | 389,180 | |
| | 36,770 | | | | | Tidewater, Inc. | | | 1,603,540 | |
| | 32,603 | | | @ | | Transocean, Inc. | | | 2,684,205 | |
| | 14,481 | | | | | W&T Offshore, Inc. | | | 277,601 | |
| | 21,491 | | | | | XTO Energy, Inc. | | | 772,601 | |
| | | | | | | | | | | |
| | | | | | | | | | | | | | 59,846,469 | |
| | | | | | | | | | | | | | | |
| | | | | | | Total Common Stock
(Cost $118,132,510 ) | | | 81,476,367 | |
| | | | | | | | | | | |
Principal
| | | | | | | | |
| Amount | | | | | | | | Value |
| |
| |
| |
SHORT-TERM INVESTMENTS: 2.3% |
| | | | | | | |
| | | | | | | Affiliated Mutual Fund: 2.3% |
| $ | 1,950,000 | | | | | ING Institutional Prime Money Market Fund | | $ | 1,950,000 | |
| | | | | | | | | | | |
| | | | | | | Total Short-Term Investments
(Cost $1,950,000) | | | 1,950,000 | |
| | | | | | | | | | | |
| | | | | Total Investments in Securities |
| | | | | (Cost $120,082,510)* | | | 99.6 | % | | $ | 83,426,367 | |
| | | | | Other Assets and
Liabilities - Net | | | 0.4 | | | | 314,968 | |
| | | | | | | | | | | | | |
| | | | | Net Assets | | | 100.0 | % | | $ | 83,741,335 | |
| | | | | | | | | | | | | |
| | | |
| @ | | Non-income producing security |
| ADR | | American Depositary Receipt |
| I | | Illiquid Security |
| | | |
| * | | Cost for federal income tax purposes is $122,144,747. |
| | | |
| | | Net unrealized depreciation consists of: |
| | | | | |
| Gross Unrealized Appreciation | | $ | 62,534 | |
| Gross Unrealized Depreciation | | | (38,780,914 | ) |
| | | | | |
| Net Unrealized Depreciation | | $ | (38,718,380 | ) |
| | | | | |
| | | | | |
| | | Percentage of
|
| Industry | | Net Assets |
|
| |
| Coal | | | 1.9 | % |
| Engineering & Construction | | | 0.2 | |
| Forest Products & Paper | | | 0.4 | |
| Iron/Steel | | | 0.4 | |
| Mining | | | 5.6 | |
| Oil & Gas | | | 74.3 | |
| Oil & Gas Services | | | 10.6 | |
| Transportation | | | 3.9 | |
| Short-Term Investments | | | 2.3 | |
| Other Assets and Liabilities — Net | | | 0.4 | |
| | | | | |
Net Assets | | | 100.0 | % |
| | | | | |
See Accompanying Notes to Financial Statements
180
PORTFOLIO OF INVESTMENTS
ING Global Real Estate Fund
as of October 31, 2008
| | | | | | | | | | | | | | | |
| Shares | | | | | | | | Value |
| |
| |
| |
COMMON STOCK: 24.9% |
| | | | | | | |
| | | | | | | Brazil: 0.3% |
| | 815,700 | | | @ | | BR Malls Participacoes SA | | $ | 3,012,047 | |
| | 322,500 | | | | | Brascan Residential Properties SA (Brazil) (Issuer: Merrill Lynch) | | | 459,970 | |
| | | | | | | | | | | |
| | | | | | | | | | | | | | 3,472,017 | |
| | | | | | | | | | | | | | | |
| | | | | | | |
| | | | | | | Canada: 0.2% |
| | 266,900 | | | L | | Brookfield Properties Co. (U.S. Denominated Security) | | | 2,693,021 | |
| | | | | | | | | | | |
| | | | | | | | | | | | | | 2,693,021 | |
| | | | | | | | | | | | | | | |
| | | | | | | |
| | | | | | | Finland: 0.2% |
| | 1,365,966 | | | L | | Citycon OYJ | | | 3,237,386 | |
| | | | | | | | | | | |
| | | | | | | | | | | | | | 3,237,386 | |
| | | | | | | | | | | | | | | |
| | | | | | | |
| | | | | | | Germany: 0.4% |
| | 220,337 | | | | | Deutsche Euroshop AG | | | 5,646,326 | |
| | | | | | | | | | | |
| | | | | | | | | | | | | | 5,646,326 | |
| | | | | | | | | | | | | | | |
| | | | | | | |
| | | | | | | Hong Kong: 10.4% |
| | 5,107,300 | | | | | Cheung Kong Holdings Ltd. | | | 49,037,869 | |
| | 3,578,000 | | | | | Hang Lung Group Ltd. | | | 11,513,914 | |
| | 6,053,000 | | | | | Hang Lung Properties Ltd. | | | 14,790,469 | |
| | 2,476,700 | | | | | Hongkong Land Holdings Ltd. | | | 6,735,405 | |
| | 2,279,000 | | | | | Hysan Development Co., Ltd. | | | 3,573,611 | |
| | 1,331,800 | | | | | Kerry Properties Ltd. | | | 3,345,541 | |
| | 8,681,700 | | | | | Sino Land Co. | | | 7,632,782 | |
| | 3,482,200 | | | | | Sun Hung Kai Properties Ltd. | | | 30,507,915 | |
| | 4,173,975 | | | | | Wharf Holdings Ltd. | | | 8,328,001 | |
| | | | | | | | | | | |
| | | | | | | | | | | | | | 135,465,507 | |
| | | | | | | | | | | | | | | |
| | | | | | | |
| | | | | | | India: 0.1% |
| | 1,023,600 | | | @ | | Unitech Ltd. (Global Instrument, Issuer: Macquarie Group Ltd.) | | | 1,001,865 | |
| | | | | | | | | | | |
| | | | | | | | | | | | | | 1,001,865 | |
| | | | | | | | | | | | | | | |
| | | | | | | |
| | | | | | | Japan: 10.8% |
| | 227,300 | | | | | Aeon Mall Co., Ltd. | | | 5,611,101 | |
| | 3,951,100 | | | | | Mitsubishi Estate Co., Ltd. | | | 70,579,884 | |
| | 2,633,600 | | | | | Mitsui Fudosan Co., Ltd. | | | 45,938,594 | |
| | 2,648 | | | | | NTT Urban Development Corp. | | | 2,716,607 | |
| | 937,200 | | | | | Sumitomo Realty & Development Co., Ltd. | | | 15,269,653 | |
| | | | | | | | | | | |
| | | | | | | | | | | | | | 140,115,839 | |
| | | | | | | | | | | | | | | |
| | | | | | | |
| | | | | | | Singapore: 0.7% |
| | 4,555,400 | | | | | CapitaLand Ltd. | | | 9,129,780 | |
| | | | | | | | | | | |
| | | | | | | | | | | | | | 9,129,780 | |
| | | | | | | | | | | | | | | |
| | | | | | | |
| | | | | | | Sweden: 0.7% |
| | 530,700 | | | | | Castellum AB | | | 3,602,564 | |
| | 971,656 | | | | | Hufvudstaden AB | | | 6,142,272 | |
| | | | | | | | | | | |
| | | | | | | | | | | | | | 9,744,836 | |
| | | | | | | | | | | | | | | |
| | | | | | | |
| | | | | | | Switzerland: 0.7% |
| | 197,530 | | | @ | | PSP Swiss Property AG | | | 8,546,181 | |
| | | | | | | | | | | |
| | | | | | | | | | | | | | 8,546,181 | |
| | | | | | | | | | | | | | | |
| | | | | | | |
| | | | | | | United Kingdom: 0.4% |
| | 3,353,865 | | | I | | Safestore Holdings Ltd. | | | 5,023,489 | |
| | | | | | | | | | | |
| | | | | | | | | | | | | | 5,023,489 | |
| | | | | | | | | | | | | | | |
| | | | | | | Total Common Stock
(Cost $465,169,602) | | | 324,076,247 | |
| | | | | | | | | | | |
| |
REAL ESTATE INVESTMENT TRUSTS: 71.7% |
| | | | | | | |
| | | | | | | Australia: 8.7% |
| | 7,263,300 | | | | | CFS Retail Property Trust | | | 9,770,099 | |
| | 4,124,400 | | | | | Commonwealth Property Office Fund | | | 3,644,548 | |
| | 9,171,200 | | | | | DB Rreef Trust | | | 4,570,406 | |
| | 4,883,600 | | | | | GPT Group | | | 2,443,952 | |
| | 992,465 | | | | | Macquarie CountryWide Trust | | | 158,637 | |
| | 2,319,031 | | | | | Macquarie Goodman Group | | | 1,463,130 | |
| | 2,237,600 | | | X | | Mirvac Group | | | 1,464,690 | |
| | 4,267,800 | | | | | Stockland | | | 11,476,448 | |
| | 7,101,754 | | | | | Westfield Group | | | 78,436,930 | |
| | | | | | | | | | | |
| | | | | | | | | | | | | | 113,428,840 | |
| | | | | | | | | | | | | | | |
| | | | | | | |
| | | | | | | Belgium: 0.3% |
| | 35,514 | | | | | Cofinimmo | | | 4,425,391 | |
| | | | | | | | | | | |
| | | | | | | | | | | | | | 4,425,391 | |
| | | | | | | | | | | | | | | |
| | | | | | | |
| | | | | | | Canada: 1.6% |
| | 295,000 | | | @,# | | Calloway Real Estate Investment Trust | | | 3,610,098 | |
| | 193,078 | | | | | Canadian Real Estate Investment Trust | | | 4,156,952 | |
| | 932,900 | | | | | RioCan Real Estate Investment Trust | | | 13,010,909 | |
| | | | | | | | | | | |
| | | | | | | | | | | | | | 20,777,959 | |
| | | | | | | | | | | | | | | |
| | | | | | | |
| | | | | | | France: 5.9% |
| | 113,789 | | | | | Klepierre | | | 2,620,996 | |
| | 441,219 | | | L | | Mercialys | | | 14,369,384 | |
| | 38,013 | | | | | Societe Immobiliere de Location pour l’Industrie et le Commerce | | | 3,388,562 | |
| | 375,396 | | | | | Unibail | | | 56,303,706 | |
| | | | | | | | | | | |
| | | | | | | | | | | | | | 76,682,648 | |
| | | | | | | | | | | | | | | |
| | | | | | | |
| | | | | | | Hong Kong: 1.4% |
| | 10,171,500 | | | | | Link Real Estate Investment Trust | | | 18,186,803 | |
| | | | | | | | | | | |
| | | | | | | | | | | | | | 18,186,803 | |
| | | | | | | | | | | | | | | |
| | | | | | | |
| | | | | | | Japan: 4.9% |
| | 462 | | | | | Japan Logistics Fund, Inc. | | | 2,920,583 | |
| | 3,110 | | | | | Japan Real Estate Investment Corp. | | | 27,539,360 | |
| | 894 | | | | | Japan Retail Fund Investment Corp. | | | 3,228,768 | |
| | 1,126 | | | | | Kenedix Realty Investment Corp. | | | 1,631,984 | |
| | 331 | | | | | Nippon Accommodations Fund, Inc. | | | 1,621,661 | |
| | 2,722 | | | | | Nippon Building Fund, Inc. | | | 26,155,671 | |
| | | | | | | | | | | |
| | | | | | | | | | | | | | 63,098,027 | |
| | | | | | | | | | | | | | | |
| | | | | | | |
| | | | | | | Netherlands: 2.3% |
| | 399,070 | | | | | Corio NV | | | 21,326,218 | |
| | 153,123 | | | | | Eurocommercial Properties NV | | | 5,070,627 | |
| | 46,178 | | | | | Wereldhave NV | | | 3,838,106 | |
| | | | | | | | | | | |
| | | | | | | | | | | | | | 30,234,951 | |
| | | | | | | | | | | | | | | |
| | | | | | | |
| | | | | | | Singapore: 1.4% |
| | 5,854,400 | | | @ | | Ascendas Real Estate Investment Trust | | | 6,514,641 | |
| | 7,297,948 | | | @ | | CapitaMall Trust | | | 9,677,866 | |
| | 3,605,600 | | | @ | | Macquarie MEAG Prime Real Estate Investment Trust | | | 1,274,778 | |
| | | | | | | | | | | |
| | | | | | | | | | | | | | 17,467,285 | |
| | | | | | | | | | | | | | | |
| | | | | | | |
| | | | | | | United Kingdom: 5.2% |
| | 983,600 | | | | | British Land Co. PLC | | | 9,808,048 | |
| | 387,128 | | | | | Brixton PLC | | | 1,041,296 | |
See Accompanying Notes to Financial Statements
181
PORTFOLIO OF INVESTMENTS
ING Global Real Estate Fund
as of October 31, 2008 (continued)
| | | | | | | | | | | | | | | |
| Shares | | | | | | | | Value |
| |
| |
| | | | | | | United Kingdom (continued) |
| | 169,330 | | | | | Derwent Valley Holdings PLC | | $ | 1,983,279 | |
| | 696,596 | | | | | Great Portland Estates PLC | | | 3,102,006 | |
| | 1,185,632 | | | | | Hammerson PLC | | | 13,665,011 | |
| | 1,502,317 | | | | | Land Securities Group PLC | | | 26,667,214 | |
| | 669,159 | | | | | Liberty International PLC | | | 7,445,480 | |
| | 925,900 | | | | | Segro PLC | | | 4,180,015 | |
| | | | | | | | | | | |
| | | | | | | | | | | | | | 67,892,349 | |
| | | | | | | | | | | | | | | |
| | | | | | | |
| | | | | | | United States: 40.0% |
| | 144,200 | | | | | Acadia Realty Trust | | | 2,605,694 | |
| | 232,200 | | | | | AMB Property Corp. | | | 5,579,766 | |
| | 211,610 | | | | | AvalonBay Communities, Inc. | | | 15,028,542 | |
| | 276,200 | | | | | BioMed Realty Trust, Inc. | | | 3,880,610 | |
| | 420,700 | | | L | | Boston Properties, Inc. | | | 29,819,216 | |
| | 336,900 | | | L | | BRE Properties, Inc. | | | 11,727,489 | |
| | 191,800 | | | L | | Corporate Office Properties Trust SBI MD | | | 5,963,062 | |
| | 331,110 | | | L | | Digital Realty Trust, Inc. | | | 11,085,563 | |
| | 392,100 | | | | | Douglas Emmett, Inc. | | | 5,920,710 | |
| | 800,200 | | | L | | Equity Residential | | | 27,950,986 | |
| | 151,800 | | | L | | Essex Property Trust, Inc. | | | 14,770,140 | |
| | 322,300 | | | L | | Extra Space Storage, Inc. | | | 3,709,673 | |
| | 575,600 | | | L | | Federal Realty Investment Trust | | | 35,267,012 | |
| | 410,100 | | | L | | General Growth Properties, Inc. | | | 1,697,814 | |
| | 501,500 | | | | | HCP, Inc. | | | 15,009,895 | |
| | 410,400 | | | L | | Health Care Real Estate Investment Trust, Inc. | | | 18,266,904 | |
| | 250,000 | | | | | Highwoods Properties, Inc. | | | 6,205,000 | |
| | 232,800 | | | L | | Home Properties, Inc. | | | 9,426,072 | |
| | 1,325,710 | | | L | | Host Hotels & Resorts, Inc. | | | 13,707,841 | |
| | 615,400 | | | | | Kimco Realty Corp. | | | 13,895,732 | |
| | 97,400 | | | | | LaSalle Hotel Properties | | | 1,371,392 | |
| | 437,575 | | | | | Liberty Property Trust | | | 10,436,164 | |
| | 518,300 | | | L | | Macerich Co. | | | 15,248,386 | |
| | 630,900 | | | | | Nationwide Health Properties, Inc. | | | 18,826,056 | |
| | 400,800 | | | | | Omega Healthcare Investors, Inc. | | | 6,040,056 | |
| | 606,400 | | | | | Prologis | | | 8,489,600 | |
| | 338,554 | | | | | Public Storage, Inc. | | | 27,592,151 | |
| | 162,200 | | | L | | Regency Centers Corp. | | | 6,400,412 | |
| | 962,250 | | | | | Simon Property Group, Inc. | | | 64,499,618 | |
| | 96,300 | | | L | | SL Green Realty Corp. | | | 4,048,452 | |
| | 363,900 | | | | | Tanger Factory Outlet Centers, Inc. | | | 13,162,263 | |
| | 370,400 | | | L | | Taubman Centers, Inc. | | | 12,304,688 | |
| | 748,000 | | | L | | UDR, Inc. | | | 14,780,480 | |
| | 867,900 | | | L | | Ventas, Inc. | | | 31,296,474 | |
| | 499,400 | | | L | | Vornado Realty Trust | | | 35,232,670 | |
| | | | | | | | | | | |
| | | | | | | | | | | | | | 521,246,583 | |
| | | | | | | | | | | | | | | |
| | | | | | | Total Real Estate Investment Trusts
(Cost $1,311,909,624) | | | 933,440,836 | |
| | | | | | | | | | | |
| |
MUTUAL FUNDS: 0.1% |
| | | | | | | |
| | | | | | | Luxembourg: 0.1% |
| | 338,640 | | | | | Prologis European Properties | | | 1,122,196 | |
| | | | | | | | | | | |
| | | | | | | | | | | | | | 1,122,196 | |
| | | | | | | | | | | | | | | |
| | | | | | | |
| | | | | | | United Kingdom: 0.0% |
| | 1,266,400 | | | ** | | ING UK Real Estate Income Trust Ltd. | | | 673,737 | |
| | | | | | | | | | | |
| | | | | | | | | | | | | | 673,737 | |
| | | | | | | | | | | | | | | |
| | | | | | | Total Mutual Funds
(Cost $6,809,639) | | | 1,795,933 | |
| | | | | | | | | | | |
| | | | | | | Total Long-Term Investments
(Cost $1,783,888,865) | | | 1,259,313,016 | |
| | | | | | | | | | | |
| |
SHORT-TERM INVESTMENTS: 16.9% |
| | | | | | | |
| | | | | | | Affiliated Mutual Fund: 6.4% |
| | 83,965,902 | | | ** | | ING Institutional Prime Money Market Fund | | | 83,965,902 | |
| | | | | | | | | | | |
| | | | | | | Total Mutual Fund
(Cost $83,965,902) | | | 83,965,902 | |
| | | | | | | | | | | |
Principal
| | | | | | | | |
| Amount | | | | | | | | Value |
| |
| |
| | | | | | | |
| | | | | | | Securities Lending CollateralCC: 10.5% |
| $ | 138,652,357 | | | | | Bank of New York Mellon Corp. Institutional Cash Reserves | | $ | 136,229,615 | |
| | | | | | | | | | | |
| | | | | | | Total Securities Lending Collateral
(Cost $138,652,357) | | | 136,229,615 | |
| | | | | | | | | | | |
| | | | | | | Total Short-Term Investments
(Cost $222,618,259) | | | 220,195,517 | |
| | | | | | | | | | | |
| | | | | Total Investments in Securities |
| | | | | (Cost $2,006,507,124)* | | | 113.6 | % | | $ | 1,479,508,533 | |
| | | | | Other Assets and
Liabilities - Net | | | (13.6 | ) | | | (177,550,452 | ) |
| | | | | | | | | | | | | |
| | | | | Net Assets | | | 100.0 | % | | $ | 1,301,958,081 | |
| | | | | | | | | | | | | |
| | | |
| @ | | Non-income producing security |
| # | | Securities with purchases pursuant to Rule 144A or section 4(2), under the Securities Act of 1933 and may not be resold subject to that rule except to qualified institutional buyers. Unless otherwise noted, these securities have been determined to be liquid under the guidelines established by the Funds’ Board of Directors/Trustees. |
| cc | | Securities purchased with cash collateral for securities loaned. |
| I | | Illiquid Security |
| L | | Loaned security, a portion or all of the security is on loan at October 31, 2008. |
| ** | | Investment in affiliate |
| X | | Fair value determined by ING Funds Valuation Committee appointed by the Funds’ Board of Directors/Trustees. |
| | | |
| * | | Cost for federal income tax purposes is $2,093,122,656. |
| | | |
| | | Net unrealized depreciation consists of: |
| | | | | |
| Gross Unrealized Appreciation | | $ | 2,285,362 | |
| Gross Unrealized Depreciation | | | (615,899,485 | ) |
| | | | | |
| Net Unrealized Depreciation | | $ | (613,614,123 | ) |
| | | | | |
| | | | | |
| | | Percentage of
|
| Industry | | Net Assets |
|
| |
| Apartments | | | 7.3 | % |
| Closed-End Funds | | | 0.1 | |
| Diversified | | | 19.9 | |
| Engineering & Construction | | | 0.1 | |
| Health Care | | | 6.9 | |
| Holding Companies — Diversified | | | 0.6 | |
| Home Builders | | | 0.0 | |
| Hotels | | | 1.2 | |
| Office Property | | | 9.5 | |
| Real Estate | | | 23.8 | |
| Regional Malls | | | 7.2 | |
| Shopping Centers | | | 16.0 | |
| Storage | | | 2.4 | |
| Storage/Warehousing | | | 0.4 | |
| Warehouse/Industrial | | | 1.3 | |
| Short-Term Investments | | | 16.9 | |
| Other Assets and Liabilities — Net | | | (13.6 | ) |
| | | | | |
Net Assets | | | 100.0 | % |
| | | | | |
See Accompanying Notes to Financial Statements
182
PORTFOLIO OF INVESTMENTS
ING Global Value Choice Fund
as of October 31, 2008
| | | | | | | | | | | | | | | |
| Shares | | | | | | | | Value |
| |
| |
| |
COMMON STOCK: 98.1% |
| | | | | | | |
| | | | | | | Australia: 1.2% |
| | 53,600 | | | L | | Alumina Ltd. ADR | | $ | 306,592 | |
| | 313,300 | | | | | Minara Resources Ltd. | | | 216,128 | |
| | 400,500 | | | @ | | Mineral Deposits Ltd. | | | 157,639 | |
| | 222,400 | | | @ | | Moto Goldmines Ltd. | | | 182,673 | |
| | | | | | | | | | | |
| | | | | | | | | | | | | | 863,032 | |
| | | | | | | | | | | | | | | |
| | | | | | | |
| | | | | | | Brazil: 3.3% |
| | 191,800 | | | L | | Centrais Eletricas Brasileiras SA ADR — Class B | | | 2,114,883 | |
| | 11,700 | | | L | | Cia de Saneamento Basico do Estado de Sao Paulo ADR | | | 269,100 | |
| | | | | | | | | | | |
| | | | | | | | | | | | | | 2,383,983 | |
| | | | | | | | | | | | | | | |
| | | | | | | |
| | | | | | | Canada: 8.6% |
| | 43,264 | | | @,L | | AbitibiBowater, Inc. | | | 84,365 | |
| | 112,000 | | | | | Barrick Gold Corp. | | | 2,544,640 | |
| | 100,600 | | | L | | Cameco Corp. | | | 1,631,732 | |
| | 182,700 | | | @,L | | Crystallex International Corp. | | | 71,253 | |
| | 302,000 | | | @ | | Eastern Platinum Ltd. | | | 90,202 | |
| | 457,800 | | | @ | | Gabriel Resources Ltd. | | | 474,778 | |
| | 50,100 | | | @,L | | Ivanhoe Mines Ltd. | | | 133,767 | |
| | 71,100 | | | @ | | Patheon, Inc. | | | 116,799 | |
| | 12,700 | | | L | | Petro-Canada | | | 316,992 | |
| | 4,100 | | | @ | | Rona, Inc. | | | 39,969 | |
| | 33,900 | | | | | Suncor Energy, Inc. | | | 810,888 | |
| | | | | | | | | | | |
| | | | | | | | | | | | | | 6,315,385 | |
| | | | | | | | | | | | | | | |
| | | | | | | |
| | | | | | | Cayman Islands: 0.3% |
| | 152,500 | | | @,L | | Apex Silver Mines Ltd. | | | 202,825 | |
| | | | | | | | | | | |
| | | | | | | | | | | | | | 202,825 | |
| | | | | | | | | | | | | | | |
| | | | | | | |
| | | | | | | China: 0.8% |
| | 7,320 | | | | | PetroChina Co., Ltd. ADR | | | 545,926 | |
| | | | | | | | | | | |
| | | | | | | | | | | | | | 545,926 | |
| | | | | | | | | | | | | | | |
| | | | | | | |
| | | | | | | Finland: 1.7% |
| | 88,300 | | | | | UPM-Kymmene OYJ | | | 1,248,591 | |
| | | | | | | | | | | |
| | | | | | | | | | | | | | 1,248,591 | |
| | | | | | | | | | | | | | | |
| | | | | | | |
| | | | | | | France: 7.5% |
| | 13,500 | | | | | Electricite de France | | | 811,128 | |
| | 88,800 | | | | | Sanofi-Aventis ADR | | | 2,807,856 | |
| | 5,050 | | | | | Technip SA | | | 151,223 | |
| | 11,300 | | | | | Technip SA ADR | | | 342,390 | |
| | 34,775 | | | | | Thales SA | | | 1,395,351 | |
| | | | | | | | | | | |
| | | | | | | | | | | | | | 5,507,948 | |
| | | | | | | | | | | | | | | |
| | | | | | | |
| | | | | | | India: 2.7% |
| | 72,150 | | | L | | ICICI Bank Ltd. ADR | | | 1,233,044 | |
| | 129,600 | | | L | | Tata Motors Ltd. ADR | | | 758,160 | |
| | | | | | | | | | | |
| | | | | | | | | | | | | | 1,991,204 | |
| | | | | | | | | | | | | | | |
| | | | | | | |
| | | | | | | Italy: 1.4% |
| | 32,000 | | | | | ERG S.p.A. | | | 427,831 | |
| | 737,600 | | | | | Telecom Italia S.p.A. RNC | | | 620,709 | |
| | | | | | | | | | | |
| | | | | | | | | | | | | | 1,048,540 | |
| | | | | | | | | | | | | | | |
| | | | | | | |
| | | | | | | Japan: 19.5% |
| | 29,300 | | | | | Advantest Corp. | | | 420,988 | |
| | 300 | | | | | Fields Corp. | | | 371,451 | |
| | 5,800 | | | | | Hakuhodo DY Holdings, Inc. | | | 264,103 | |
| | 42,400 | | | | | JS Group Corp. | | | 549,039 | |
| | 35,000 | | | | | Kao Corp. | | | 1,023,456 | |
| | 27,000 | | | | | Kissei Pharmaceutical Co., Ltd. | | | 615,725 | |
| | 241,000 | | | | | Nippon Oil Corp. | | | 989,248 | |
| | 163,000 | | | | | Nippon Telegraph & Telephone Corp. ADR | | | 3,317,050 | |
| | 97,800 | | | | | Paramount Bed Co., Ltd. | | | 1,274,497 | |
| | 202,000 | | | | | Sekisui House Ltd. | | | 2,025,564 | |
| | 282,000 | | | | | Sumitomo Osaka Cement Co., Ltd. | | | 443,030 | |
| | 120,000 | | | | | Sumitomo Trust & Banking Co., Ltd. | | | 555,729 | |
| | 98,000 | | | | | Toppan Printing Co., Ltd. | | | 720,587 | |
| | 21,000 | | | | | Toppan Printing Co., Ltd. ADR | | | 735,000 | |
| | 33,100 | | | | | Toyo Seikan Kaisha Ltd. | | | 408,374 | |
| | 452 | | | | | TV Asahi Corp. | | | 570,736 | |
| | | | | | | | | | | |
| | | | | | | | | | | | | | 14,284,577 | |
| | | | | | | | | | | | | | | |
| | | | | | | |
| | | | | | | Norway: 2.0% |
| | 4,210,400 | | | @,L | | Marine Harvest | | | 680,087 | |
| | 38,800 | | | L | | Statoil ASA ADR | | | 779,880 | |
| | | | | | | | | | | |
| | | | | | | | | | | | | | 1,459,967 | |
| | | | | | | | | | | | | | | |
| | | | | | | |
| | | | | | | Papua New Guinea: 1.4% |
| | 820,004 | | | @ | | Lihir Gold Ltd. | | | 1,023,181 | |
| | | | | | | | | | | |
| | | | | | | | | | | | | | 1,023,181 | |
| | | | | | | | | | | | | | | |
| | | | | | | |
| | | | | | | South Africa: 6.0% |
| | 161,665 | | | | | Anglogold Ashanti Ltd. ADR | | | 2,950,385 | |
| | 208,700 | | | | | Gold Fields Ltd. | | | 1,452,867 | |
| | | | | | | | | | | |
| | | | | | | | | | | | | | 4,403,252 | |
| | | | | | | | | | | | | | | |
| | | | | | | |
| | | | | | | South Korea: 3.8% |
| | 235,750 | | | L | | Korea Electric Power Corp. ADR | | | 2,333,925 | |
| | 35,200 | | | L | | KT Corp. ADR | | | 441,760 | |
| | | | | | | | | | | |
| | | | | | | | | | | | | | 2,775,685 | |
| | | | | | | | | | | | | | | |
| | | | | | | |
| | | | | | | Switzerland: 3.7% |
| | 56,800 | | | | | Addax Petroleum Corp. | | | 848,254 | |
| | 111,500 | | | @,L | | UBS AG — New | | | 1,884,350 | |
| | | | | | | | | | | |
| | | | | | | | | | | | | | 2,732,604 | |
| | | | | | | | | | | | | | | |
| | | | | | | |
| | | | | | | Thailand: 0.6% |
| | 3,897,200 | | | | | Krung Thai Bank PCL | | | 443,086 | |
| | | | | | | | | | | |
| | | | | | | | | | | | | | 443,086 | |
| | | | | | | | | | | | | | | |
| | | | | | | |
| | | | | | | Turkey: 0.6% |
| | 35,600 | | | L | | Turkcell Iletisim Hizmet AS ADR | | | 436,812 | |
| | | | | | | | | | | |
| | | | | | | | | | | | | | 436,812 | |
| | | | | | | | | | | | | | | |
| | | | | | | |
| | | | | | | United Kingdom: 8.1% |
| | 30,600 | | | L | | AstraZeneca PLC ADR | | | 1,299,276 | |
| | 17,800 | | | | | BP PLC ADR | | | 884,660 | |
| | 32,139 | | | @ | | Lighthouse Caledonia ASA | | | 17,736 | |
| | 183,500 | | | | | Mondi PLC | | | 665,987 | |
| | 209,100 | | | | | Stolt-Nielsen SA | | | 2,161,458 | |
| | 46,200 | | | | | Vodafone Group PLC ADR | | | 890,274 | |
| | | | | | | | | | | |
| | | | | | | | | | | | | | 5,919,391 | |
| | | | | | | | | | | | | | | |
| | | | | | | |
| | | | | | | United States: 24.9% |
| | 109,751 | | | @ | | Allied Waste Industries, Inc. | | | 1,143,605 | |
| | 7,330 | | | @ | | Amgen, Inc. | | | 438,994 | |
| | 56,600 | | | | | BJ Services Co. | | | 727,310 | |
| | 252 | | | | | CA, Inc. | | | 4,486 | |
| | 14,900 | | | | | ConocoPhillips | | | 775,098 | |
| | 16,200 | | | | | Consol Energy, Inc. | | | 508,518 | |
| | 96,425 | | | @ | | eBay, Inc. | | | 1,472,410 | |
| | 34,300 | | | | | Idacorp, Inc. | | | 914,438 | |
| | 45,825 | | | | | Microsoft Corp. | | | 1,023,272 | |
| | 107,000 | | | L | | Newmont Mining Corp. | | | 2,818,380 | |
| | 30,850 | | | | | Peabody Energy Corp. | | | 1,064,634 | |
| | 142,600 | | | @,L | | Smithfield Foods, Inc. | | | 1,500,152 | |
| | 394,600 | | | | | Sprint Nextel Corp. | | | 1,235,098 | |
| | 43,000 | | | @ | | Tech Data Corp. | | | 922,350 | |
| | 35,900 | | | L | | Tesoro Petroleum Corp. | | | 347,153 | |
| | 201,200 | | | | | Tyson Foods, Inc. | | | 1,758,488 | |
See Accompanying Notes to Financial Statements
183
PORTFOLIO OF INVESTMENTS
ING Global Value Choice Fund
as of October 31, 2008 (continued)
| | | | | | | | | | | | | | | |
| Shares | | | | | | | | Value |
| |
| |
| | | | | | | United States (continued) |
| | 31,000 | | | @ | | Viacom — Class B | | $ | 626,820 | |
| | 28,000 | | | | | Wyeth | | | 901,040 | |
| | | | | | | | | | | |
| | | | | | | | | | | | | | 18,182,246 | |
| | | | | | | | | | | | | | | |
| | | | | | | Total Common Stock
(Cost $112,044,055 ) | | | 71,768,235 | |
| | | | | | | | | | | |
| |
SHORT-TERM INVESTMENTS: 19.8% |
| | | | | | | |
| | | | | | | Affiliated Mutual Fund: 2.1% |
| | 1,521,276 | | | | | ING Institutional Prime Money Market Fund | | | 1,521,276 | |
| | | | | | | | | | | |
| | | | | | | Total Mutual Fund
(Cost $1,521,276 ) | | | 1,521,276 | |
| | | | | | | | | | | |
Principal
| | | | | | | | |
| Amount | | | | | | | | Value |
| |
| |
| | | | | | | |
| | | | | | | Securities Lending CollateralCC: 17.3% |
| $ | 12,910,571 | | | | | Bank of New York Mellon Corp. Institutional Cash Reserves | | $ | 12,656,612 | |
| | | | | | | | | | | |
| | | | | | | Total Securities Lending Collateral
(Cost $12,910,571) | | | 12,656,612 | |
| | | | | | | | | | | |
| | | | | | | Total Short-Term Investments
(Cost $14,431,847) | | | 14,177,888 | |
| | | | | | | | | | | |
| | | | | Total Investments in Securities |
| | | | | (Cost $126,475,902)* | | | 117.5 | % | | $ | 85,946,123 | |
| | | | | Other Assets and
Liabilities - Net | | | (17.5 | ) | | | (12,784,012 | ) |
| | | | | | | | | | | | | |
| | | | | Net Assets | | | 100.0 | % | | $ | 73,162,111 | |
| | | | | | | | | | | | | |
| | | |
| @ | | Non-income producing security |
| ADR | | American Depositary Receipt |
| cc | | Securities purchased with cash collateral for securities loaned. |
| L | | Loaned security, a portion or all of the security is on loan at October 31, 2008. |
| | | |
| * | | Cost for federal income tax purposes is $126,839,950. |
| | | |
| | | Net unrealized depreciation consists of: |
| | | | | |
| Gross Unrealized Appreciation | | $ | 494,172 | |
| Gross Unrealized Depreciation | | | (41,387,999 | ) |
| | | | | |
| Net Unrealized Depreciation | | $ | (40,893,827 | ) |
| | | | | |
| | | | | |
| | | Percentage of
|
| Industry | | Net Assets |
|
| |
| Advertising | | | 0.4 | % |
| Aerospace/Defense | | | 1.9 | |
| Auto Manufacturers | | | 1.0 | |
| Banks | | | 5.6 | |
| Biotechnology | | | 0.6 | |
| Building Materials | | | 1.4 | |
| Coal | | | 2.1 | |
| Commercial Services | | | 2.0 | |
| Cosmetics/Personal Care | | | 1.4 | |
| Distribution/Wholesale | | | 1.3 | |
| Electric | | | 8.4 | |
| Electronics | | | 0.6 | |
| Environmental Control | | | 1.6 | |
| Food | | | 5.4 | |
| Forest Products & Paper | | | 2.7 | |
| Healthcare — Products | | | 1.7 | |
| Home Builders | | | 2.8 | |
| Internet | | | 2.0 | |
| Leisure Time | | | 0.5 | |
| Media | | | 1.6 | |
| Mining | | | 19.5 | |
| Oil & Gas | | | 9.2 | |
| Oil & Gas Services | | | 1.7 | |
| Packaging & Containers | | | 0.6 | |
| Pharmaceuticals | | | 7.8 | |
| Retail | | | 0.1 | |
| Software | | | 1.4 | |
| Telecommunications | | | 9.5 | |
| Transportation | | | 2.9 | |
| Water | | | 0.4 | |
| Short-Term Investments | | | 19.4 | |
| Other Assets and Liabilities — Net | | | (17.5 | ) |
| | | | | |
Net Assets | | | 100.0 | % |
| | | | | |
See Accompanying Notes to Financial Statements
184
PORTFOLIO OF INVESTMENTS
ING Asia-Pacific Real Estate Fund
as of October 31, 2008
| | | | | | | | | | | | | | | |
| Shares | | | | | | | | Value |
| |
| |
| |
COMMON STOCK: 61.5% |
| | | | | | | |
| | | | | | | Australia: 0.6% |
| | 8,000 | | | | | Lend Lease Corp., Ltd. | | $ | 37,018 | |
| | | | | | | | | | | |
| | | | | | | | | | | | | | 37,018 | |
| | | | | | | | | | | | | | | |
| | | | | | | |
| | | | | | | Hong Kong: 27.7% |
| | 61,600 | | | | | Cheung Kong Holdings Ltd. | | | 591,454 | |
| | 38,000 | | | | | China Resources Land Ltd. | | | 38,465 | |
| | 36,000 | | | | | Hang Lung Group Ltd. | | | 115,847 | |
| | 95,000 | | | | | Hang Lung Properties Ltd. | | | 232,132 | |
| | 21,900 | | | | | Henderson Land Development Co., Ltd. | | | 79,199 | |
| | 49,600 | | | | | Hongkong Land Holdings Ltd. | | | 134,888 | |
| | 14,000 | | | | | Hopewell Holdings | | | 43,527 | |
| | 50,000 | | | | | Hysan Development Co., Ltd. | | | 78,403 | |
| | 10,000 | | | | | Kerry Properties Ltd. | | | 25,120 | |
| | 27,000 | | | | | Shun TAK Holdings Ltd. | | | 5,381 | |
| | 72,000 | | | | | Sino Land Co. | | | 63,301 | |
| | 48,400 | | | | | Sun Hung Kai Properties Ltd. | | | 424,037 | |
| | 11,000 | | | | | Wharf Holdings Ltd. | | | 21,947 | |
| | | | | | | | | | | |
| | | | | | | | | | | | | | 1,853,701 | |
| | | | | | | | | | | | | | | |
| | | | | | | |
| | | | | | | Japan: 29.5% |
| | 6,000 | | | | | Aeon Mall Co., Ltd. | | | 148,115 | |
| | 47,100 | | | | | Mitsubishi Estate Co., Ltd. | | | 841,364 | |
| | 36,900 | | | | | Mitsui Fudosan Co., Ltd. | | | 643,658 | |
| | 98 | | | | | NTT Urban Development Corp. | | | 100,539 | |
| | 15,000 | | | | | Sumitomo Realty & Development Co., Ltd. | | | 244,393 | |
| | | | | | | | | | | |
| | | | | | | | | | | | | | 1,978,069 | |
| | | | | | | | | | | | | | | |
| | | | | | | |
| | | | | | | Singapore: 3.7% |
| | 89,000 | | | | | CapitaLand Ltd. | | | 178,371 | |
| | 16,000 | | | | | City Developments Ltd. | | | 70,753 | |
| | | | | | | | | | | |
| | | | | | | | | | | | | | 249,124 | |
| | | | | | | | | | | | | | | |
| | | | | | | Total Common Stock
(Cost $6,095,063 ) | | | 4,117,912 | |
| | | | | | | | | | | |
| |
REAL ESTATE INVESTMENT TRUSTS: 44.3% |
| | | | | | | |
| | | | | | | Australia: 21.6% |
| | 135,000 | | | | | CFS Retail Property Trust | | | 181,593 | |
| | 91,000 | | | | | Commonwealth Property Office Fund | | | 80,413 | |
| | 149,000 | | | | | Dexus Property Group | | | 74,253 | |
| | 72,400 | | | | | GPT Group | | | 36,232 | |
| | 41,300 | | | | | Macquarie Goodman Group | | | 26,057 | |
| | 38,600 | | | | | Mirvac Group | | | 25,267 | |
| | 68,000 | | | | | Stockland | | | 182,857 | |
| | 76,000 | | | | | Westfield Group | | | 839,399 | |
| | | | | | | | | | | |
| | | | | | | | | | | | | | 1,446,071 | |
| | | | | | | | | | | | | | | |
| | | | | | | |
| | | | | | | Hong Kong: 2.7% |
| | 100,000 | | | | | Link Real Estate Investment Trust | | | 178,802 | |
| | | | | | | | | | | |
| | | | | | | | | | | | | | 178,802 | |
| | | | | | | | | | | | | | | |
| | | | | | | |
| | | | | | | Japan: 14.4% |
| | 14 | | | | | Frontier Real Estate Investment Corp. | | | 76,611 | |
| | 12 | | | | | Fukuoka Real Estate Investment Trust Corp. | | | 47,160 | |
| | 31 | | | | | Japan Real Estate Investment Corp. | | | 274,508 | |
| | 8 | | | | | Nippon Accommodations Fund, Inc. | | | 39,194 | |
| | 32 | | | | | Nippon Building Fund, Inc. | | | 307,488 | |
| | 26 | | | | | Nomura Real Estate Office Fund, Inc. | | | 147,816 | |
| | 12 | | | | | Tokyu Real Estate Investment Trust, Inc. | | | 69,141 | |
| | | | | | | | | | | |
| | | | | | | | | | | | | | 961,918 | |
| | | | | | | | | | | | | | | |
| | | | | | | |
| | | | | | | New Zealand: 1.3% |
| | 141,000 | | | | | Kiwi Income Property Trust | | | 86,407 | |
| | | | | | | | | | | |
| | | | | | | | | | | | | | 86,407 | |
| | | | | | | | | | | | | | | |
| | | | | | | |
| | | | | | | Singapore: 4.3% |
| | 106,000 | | | @ | | Ascendas Real Estate Investment Trust | | | 117,954 | |
| | 59,000 | | | @ | | CapitaCommercial Trust | | | 40,532 | |
| | 83,200 | | | @ | | CapitaMall Trust | | | 110,332 | |
| | 68,000 | | | @ | | Fortune Real Estate Investment Trust | | | 17,190 | |
| | 15,100 | | | @ | | Macquarie MEAG Prime Real Estate Investment Trust | | | 5,339 | |
| | | | | | | | | | | |
| | | | | | | | | | | | | | 291,347 | |
| | | | | | | | | | | | | | | |
| | | | | | | Total Real Estate Investment Trusts
(Cost $4,404,656 ) | | | 2,964,545 | |
| | | | | | | | | | | |
| | | | | Total Investments in Securities |
| | | | | (Cost $10,499,719)* | | | 105.8 | % | | $ | 7,082,457 | |
| | | | | Other Assets and
Liabilities - Net | | | (5.8 | ) | | | (387,270 | ) |
| | | | | | | | | | | | | |
| | | | | Net Assets | | | 100.0 | % | | $ | 6,695,187 | |
| | | | | | | | | | | | | |
| | | |
| @ | | Non-income producing security |
| | | |
| * | | Cost for federal income tax purposes is $11,201,251. |
| | | |
| | | Net unrealized depreciation consists of: |
| | | | | |
| Gross Unrealized Appreciation | | $ | 200 | |
| Gross Unrealized Depreciation | | | (4,118,994 | ) |
| | | | | |
| Net Unrealized Depreciation | | $ | (4,118,794 | ) |
| | | | | |
| | | | | |
| | | Percentage of
|
| Industry | | Net Assets |
|
| |
| Apartments | | | 0.6 | % |
| Diversified | | | 9.5 | |
| Holding Companies — Diversified | | | 0.3 | |
| Lodging | | | 1.1 | |
| Office Property | | | 13.1 | |
| Real Estate | | | 60.1 | |
| Shopping Centers | | | 21.1 | |
| Other Assets and Liabilities — Net | | | (5.8 | ) |
| | | | | |
Net Assets | | | 100.0 | % |
| | | | | |
See Accompanying Notes to Financial Statements
185
PORTFOLIO OF INVESTMENTS
ING Disciplined International SmallCap Fund
as of October 31, 2008
| | | | | | | | | | | | | | | |
| Shares | | | | | | | | Value |
| |
| |
| |
COMMON STOCK: 95.8% |
| | | | | | | |
| | | | | | | Australia: 4.5% |
| | 165,303 | | | | | Ansell Ltd. | | $ | 1,390,635 | |
| | 111,258 | | | | | Ausenco Ltd. | | | 322,900 | |
| | 387,760 | | | | | Australian Infrastructure Fund | | | 420,187 | |
| | 940,579 | | | @ | | Australian Worldwide Exploration Ltd. | | | 1,571,162 | |
| | 1,211,604 | | | | | Challenger Financial Services Group Ltd. | | | 1,335,946 | |
| | 85,584 | | | | | Computershare Ltd. | | | 483,850 | |
| | 40,104 | | | | | Felix Resources Ltd. | | | 319,143 | |
| | 30,862 | | | | | Flight Centre Ltd. | | | 288,887 | |
| | 390,542 | | | | | Goodman Fielder Ltd. | | | 433,408 | |
| | 411,083 | | | | | Incitec Pivot Ltd. | | | 1,102,124 | |
| | 394,719 | | | | | Macmahon Holdings Ltd. | | | 191,579 | |
| | 119,777 | | | | | Macquarie Media Group Ltd. | | | 100,127 | |
| | 179,305 | | | | | Metcash Ltd. | | | 483,950 | |
| | 31,003 | | | | | Monadelphous Group Ltd. | | | 166,016 | |
| | 67,247 | | | @,X | | Octaviar Ltd. | | | 6,256 | |
| | 1,635,809 | | | | | Pacific Brands Ltd. | | | 1,097,363 | |
| | 255,543 | | | | | PMP Ltd. | | | 164,294 | |
| | | | | | | | | | | |
| | | | | | | | | | | | | | 9,877,827 | |
| | | | | | | | | | | | | | | |
| | | | | | | |
| | | | | | | Belgium: 1.8% |
| | 5,010 | | | | | EVS Broadcast Equipment SA | | | 323,516 | |
| | 52,413 | | | | | Omega Pharma SA | | | 1,930,566 | |
| | 21,240 | | | @ | | RHJ International | | | 114,965 | |
| | 29,905 | | | | | Tessenderlo Chemie NV | | | 1,183,016 | |
| | 22,993 | | | | | Umicore | | | 411,191 | |
| | | | | | | | | | | |
| | | | | | | | | | | | | | 3,963,254 | |
| | | | | | | | | | | | | | | |
| | | | | | | |
| | | | | | | Bermuda: 1.4% |
| | 461,235 | | | | | Catlin Group Ltd. | | | 2,577,449 | |
| | 75,500 | | | @ | | Global Sources Ltd. | | | 596,450 | |
| | | | | | | | | | | |
| | | | | | | | | | | | | | 3,173,899 | |
| | | | | | | | | | | | | | | |
| | | | | | | |
| | | | | | | Canada: 6.9% |
| | 49,400 | | | | | AGF Management Ltd. | | | 543,880 | |
| | 11,900 | | | | | Astral Media Inc. | | | 275,162 | |
| | 19,300 | | | | | Atco Ltd. | | | 629,936 | |
| | 315,100 | | | @ | | Celestica, Inc. | | | 1,524,129 | |
| | 68,300 | | | | | Chemtrade Logistics Income Fund | | | 633,530 | |
| | 265,300 | | | | | Daylight Resources Trust | | | 1,738,878 | |
| | 39,400 | | | | | Emera, Inc. | | | 701,832 | |
| | 79,000 | | | | | Enerflex Systems Income Fund | | | 688,210 | |
| | 44,400 | | | | | Energy Savings Income Fund | | | 449,415 | |
| | 54,100 | | | | | Forzani Group Ltd. | | | 392,745 | |
| | 237,900 | | | | | Gerdau AmeriSteel Corp. | | | 1,273,090 | |
| | 75,400 | | | @ | | Great Canadian Gaming Corp. | | | 312,785 | |
| | 1 | | | | | Harvest Energy Trust | | | 6 | |
| | 120,400 | | | | | Jazz Air Income Fund | | | 424,542 | |
| | 16,800 | | | | | Labrador Iron Ore Royalty Income Fund | | | 461,641 | |
| | 18,000 | | | | | Laurentian Bank of Canada | | | 610,504 | |
| | 12,800 | | | | | Northbridge Financial Corp. | | | 317,743 | |
| | 385,500 | | | @ | | Northgate Minerals Corp. | | | 246,275 | |
| | 69,800 | | | | | Russel Metals, Inc. | | | 1,253,771 | |
| | 56,900 | | | | | Silvercorp Metals, Inc. | | | 110,467 | |
| | 41,700 | | | | | Superior Plus Income Fund | | | 414,820 | |
| | 73,800 | | | | | Teranet Income Fund | | | 581,681 | |
| | 23,000 | | | | | Transcontinental, Inc. | | | 232,805 | |
| | 53,700 | | | | | Trilogy Energy Trust | | | 269,547 | |
| | 42,700 | | | | | Vermilion Energy Trust | | | 1,059,263 | |
| | | | | | | | | | | |
| | | | | | | | | | | | | | 15,146,657 | |
| | | | | | | | | | | | | | | |
| | | | | | | |
| | | | | | | Denmark: 0.0% |
| | 8,650 | | | @ | | Alm. Brand Skadesforsikring A/S | | | 117,241 | |
| | | | | | | | | | | |
| | | | | | | | | | | | | | 117,241 | |
| | | | | | | | | | | | | | | |
| | | | | | | |
| | | | | | | Finland: 0.8% |
| | 97,746 | | | | | KCI Konecranes OYJ | | | 1,661,048 | |
| | | | | | | | | | | |
| | | | | | | | | | | | | | 1,661,048 | |
| | | | | | | | | | | | | | | |
| | | | | | | |
| | | | | | | France: 9.8% |
| | 36,694 | | | | | Accor SA | | | 1,427,593 | |
| | 26,346 | | | | | Air France-KLM | | | 379,585 | |
| | 243,083 | | | @ | | Altran Technologies SA | | | 1,221,604 | |
| | 13,873 | | | | | Arkema | | | 317,530 | |
| | 4,771 | | | | | Bacou Dalloz | | | 293,461 | |
| | 8,081 | | | | | Capgemini SA | | | 260,368 | |
| | 30,896 | | | @ | | Compagnie Generale de Geophysique SA | | | 499,570 | |
| | 34,556 | | | | | Eurazeo | | | 2,080,496 | |
| | 50,904 | | | @ | | Eutelsat Communications | | | 1,092,566 | |
| | 590 | | | | | Generale de Sante | | | 6,194 | |
| | 853,757 | | | | | Havas SA | | | 1,703,504 | |
| | 61,802 | | | | | Ingenico | | | 965,219 | |
| | 33,666 | | | | | IPSOS | | | 846,330 | |
| | 21,316 | | | | | Lagardere SCA | | | 847,525 | |
| | 45,056 | | | | | Legrand SA | | | 749,772 | |
| | 28,187 | | | | | Nexans SA | | | 1,607,785 | |
| | 24,041 | | | | | Remy Cointreau SA | | | 1,000,329 | |
| | 188,579 | | | | | Safran SA | | | 2,393,363 | |
| | 101,683 | | | | | Scor SA | | | 1,665,937 | |
| | 26,967 | | | | | Sechilienne-Sidec | | | 1,035,434 | |
| | 17,191 | | | | | Technip SA | | | 514,788 | |
| | 2,604 | | | @ | | UbiSoft Entertainment | | | 137,645 | |
| | 4,646 | | | | | Vilmorin & Cie | | | 453,970 | |
| | | | | | | | | | | |
| | | | | | | | | | | | | | 21,500,568 | |
| | | | | | | | | | | | | | | |
| | | | | | | |
| | | | | | | Germany: 7.5% |
| | 148,714 | | | | | Aareal Bank AG | | | 1,199,479 | |
| | 8,439 | | | | | Adidas AG | | | 288,987 | |
| | 10,043 | | | | | Deutsche Beteiligungs AG | | | 133,592 | |
| | 169,635 | | | | | Deutsche Lufthansa AG | | | 2,360,204 | |
| | 47,222 | | | @ | | Freenet AG | | | 284,876 | |
| | 147,998 | | | | | Gildemeister AG | | | 1,443,663 | |
| | 62,162 | | | | | Hypo Real Estate Holding AG | | | 397,012 | |
| | 72,411 | | | | | IWKA AG | | | 1,258,104 | |
| | 30,088 | | | @ | | Jenoptik AG | | | 182,391 | |
| | 1,450 | | | | | KWS Saat AG | | | 179,138 | |
| | 25,085 | | | | | Leoni AG | | | 317,844 | |
| | 42,093 | | | | | MAN AG | | | 2,044,267 | |
| | 114,395 | | | | | Medion AG | | | 1,073,480 | |
| | 8,695 | | | | | MVV Energie AG | | | 342,013 | |
| | 70,204 | | | | | Norddeutsche Affinerie AG | | | 2,247,904 | |
| | 23,583 | | | | | Salzgitter AG | | | 1,550,863 | |
| | 9,611 | | | | | United Internet AG | | | 86,252 | |
| | 9,685 | | | | | Wacker Chemie AG | | | 1,053,839 | |
| | | | | | | | | | | |
| | | | | | | | | | | | | | 16,443,908 | |
| | | | | | | | | | | | | | | |
| | | | | | | |
| | | | | | | Hong Kong: 2.0% |
| | 380,000 | | | | | Great Eagle Holding Co. | | | 436,244 | |
| | 2,597,000 | | | | | Henderson Investment Ltd. | | | 120,634 | |
| | 482,400 | | | | | Hkr International Ltd. | | | 118,375 | |
| | 277,500 | | | | | Hongkong & Shanghai Hotels | | | 262,109 | |
| | 344,000 | | | | | Hopewell Holdings | | | 1,069,525 | |
| | 736,000 | | | | | Hysan Development Co., Ltd. | | | 1,154,093 | |
| | 43,500 | | | @ | | Khd Humboldt Wedag International | | | 742,980 | |
| | 199,000 | | | | | Pacific Basin Shipping Ltd. | | | 106,554 | |
| | 836,000 | | | | | Texwinca Holdings Ltd. | | | 390,701 | |
| | | | | | | | | | | |
| | | | | | | | | | | | | | 4,401,215 | |
| | | | | | | | | | | | | | | |
| | | | | | | |
| | | | | | | Ireland: 0.2% |
| | 92,976 | | | | | United Drug PLC | | | 361,274 | |
| | | | | | | | | | | |
| | | | | | | | | | | | | | 361,274 | |
| | | | | | | | | | | | | | | |
| | | | | | | |
| | | | | | | Italy: 4.7% |
| | 56,362 | | | | | Banca Popolare dell’Etruria e del Lazio | | | 369,697 | |
| | 12,343 | | | | | Biesse S.p.A. | | | 79,500 | |
See Accompanying Notes to Financial Statements
186
PORTFOLIO OF INVESTMENTS
ING Disciplined International SmallCap Fund
as of October 31, 2008 (continued)
| | | | | | | | | | | | | | | |
| Shares | | | | | | | | Value |
| |
| |
| | | | | | | Italy (continued) |
| | 16,289 | | | | | Buzzi Unicem S.p.A. RNC | | $ | 138,818 | |
| | 188,631 | | | | | Cementir S.p.A. | | | 592,048 | |
| | 296,184 | | | | | Davide Campari-Milano S.p.A. | | | 2,067,370 | |
| | 248,810 | | | | | IMMSI S.p.A. | | | 221,561 | |
| | 84,009 | | | | | Indesit Co. S.p.A. | | | 684,450 | |
| | 27,425 | | | | | Permasteelisa S.p.A. | | | 399,144 | |
| | 342,607 | | | | | Piaggio & C S.p.A. | | | 612,711 | |
| | 99,734 | | | | | Piccolo Credito Valtellinese Scarl | | | 753,584 | |
| | 120,165 | | | | | Recordati S.p.A. | | | 567,942 | |
| | 152,609 | | | | | Safilo Group S.p.A. | | | 150,167 | |
| | 19,516,317 | | | @ | | Seat Pagine Gialle S.p.A. | | | 1,712,289 | |
| | 162,565 | | | | | Trevi Finanziaria S.p.A. | | | 1,888,919 | |
| | | | | | | | | | | |
| | | | | | | | | | | | | | 10,238,200 | |
| | | | | | | | | | | | | | | |
| | | | | | | |
| | | | | | | Japan: 26.9% |
| | 138,000 | | | | | Akita Bank Ltd. | | | 573,740 | |
| | 63,000 | | | | | Asahi Diamond Industrial Co., Ltd | | | 293,544 | |
| | 78,000 | | | | | Bank of Nagoya Ltd. | | | 469,540 | |
| | 40,600 | | | | | Chudenko Corp. | | | 609,312 | |
| | 70,100 | | | | | Chuo Denki Kogyo Co., Ltd. | | | 506,425 | |
| | 182,000 | | | | | Daishi Bank Ltd. | | | 708,691 | |
| | 225,200 | | | | | DCM Japan Holdings Co., Ltd. | | | 1,650,520 | |
| | 13,300 | | | | | Fuji Machine Manufacturing Co., Ltd. | | | 114,848 | |
| | 148,400 | | | | | Fuji Soft, Inc. | | | 2,490,967 | |
| | 718,000 | | | | | Fujibo Holdings, Inc. | | | 635,990 | |
| | 121,000 | | | | | Fukuyama Transporting Co., Ltd. | | | 514,058 | |
| | 137,200 | | | | | Glory Ltd. | | | 1,966,227 | |
| | 54,000 | | | | | H2O Retailing Corp. | | | 329,449 | |
| | 70,000 | | | | | Higo Bank Ltd. | | | 387,453 | |
| | 164,000 | | | | | Hitachi Capital Corp. | | | 1,309,263 | |
| | 40,700 | | | | | Hitachi Information Systems Ltd. | | | 755,280 | |
| | 63,000 | | | | | Hitachi Kokusai Electric, Inc. | | | 299,341 | |
| | 34,200 | | | | | Hitachi Software Engineering Co., Ltd. | | | 482,393 | |
| | 393,000 | | | | | Hokkoku Bank Ltd. | | | 1,479,480 | |
| | 66,900 | | | | | House Foods Corp. | | | 1,087,434 | |
| | 94,000 | | | | | Hyakugo Bank Ltd. | | | 527,967 | |
| | 33,700 | | | | | Itochu Enex Co., Ltd. | | | 169,956 | |
| | 181,000 | | | | | Itoham Foods, Inc. | | | 555,708 | |
| | 20,000 | | | | | Japan Digital Laboratory Co. | | | 190,653 | |
| | 108,000 | | | | | Japan Radio Co., Ltd. | | | 187,960 | |
| | 64,000 | | | | | Jeol Ltd. | | | 181,202 | |
| | 117,000 | | | | | Juroku Bank Ltd. | | | 431,534 | |
| | 101,000 | | | | | Kagoshima Bank Ltd. | | | 640,322 | |
| | 83,000 | | | | | Kaken Pharmaceutical Co., Ltd. | | | 689,337 | |
| | 240,000 | | | | | Kandenko Co., Ltd. | | | 1,261,110 | |
| | 33,000 | | | | | Kanto Auto Works Ltd. | | | 400,991 | |
| | 65,000 | | | | | Keiyo Bank Ltd. | | | 291,403 | |
| | 192,000 | | | | | Kinden Corp. | | | 1,603,147 | |
| | 59,100 | | | | | Koa Corp. | | | 306,079 | |
| | 95,100 | | | | | Komori Corp. | | | 1,087,287 | |
| | 57,000 | | | | | Kyudenko Corp. | | | 404,761 | |
| | 56,400 | | | | | Matsumotokiyoshi Holdings Co., Ltd. | | | 1,105,617 | |
| | 214,000 | | | | | Mitsubishi Steel Manufacturing Co., Ltd. | | | 607,670 | |
| | 738,000 | | | | | Mitsui Mining Co., Ltd. | | | 1,408,478 | |
| | 209,000 | | | | | Mitsui Sugar Co., Ltd. | | | 734,344 | |
| | 52,200 | | | | | NEC Networks & System Integration Corp. | | | 591,548 | |
| | 162,000 | | | | | Nichirei Corp. | | | 687,247 | |
| | 29,100 | | | | | Nifco, Inc. | | | 427,703 | |
| | 84,000 | | | | | Nihon Parkerizing Co., Ltd. | | | 990,551 | |
| | 78,000 | | | | | Nippon Chemical Industrial Co., Ltd. | | | 137,508 | |
| | 119,600 | | | | | Nippon Shinyaku Co., Ltd. | | | 1,182,444 | |
| | 128,000 | | | | | Nippon Synthetic Chemical Industry Co., Ltd. | | | 297,262 | |
| | 111,000 | | | | | Nissan Shatai Co., Ltd. | | | 724,985 | |
| | 800,000 | | | | | Nitto Boseki Co., Ltd. | | | 1,187,567 | |
| | 199,400 | | | | | NSD CO., Ltd. | | | 1,486,046 | |
| | 10,100 | | | | | Okinawa Electric Power Co., Inc. | | | 592,140 | |
| | 132,000 | | | | | O-M Ltd. | | | 523,900 | |
| | 72,900 | | | | | Rinnai Corp. | | | 2,665,848 | |
| | 33,800 | | | | | Ryosan Co., Ltd. | | | 643,090 | |
| | 239,000 | | | | | Sanden Corp. | | | 668,338 | |
| | 115,000 | | | | | San-In Godo Bank Ltd. | | | 823,208 | |
| | 33,000 | | | | | Sanken Electric Co., Ltd. | | | 117,956 | |
| | 95,100 | | | | | Shima Seiki Manufacturing Ltd. | | | 1,761,066 | |
| | 20,500 | | | | | Sugi Pharmacy Co., Ltd. | | | 492,995 | |
| | 83,800 | | | @ | | Suruga Corp. | | | — | |
| | 54,000 | | | | | Taihei Dengyo Kaisha Ltd. | | | 446,272 | |
| | 29,600 | | | | | Taikisha Ltd. | | | 422,503 | |
| | 211,000 | | | | | Tamura Corp. | | | 474,501 | |
| | 50,000 | | | | | Tochigi Bank Ltd. | | | 308,019 | |
| | 569,000 | | | | | Toho Zinc Co., Ltd. | | | 1,167,784 | |
| | 212,500 | | | | | Tokai Rika Co., Ltd. | | | 2,149,611 | |
| | 138,000 | | | | | Tomy Co., Ltd. | | | 901,594 | |
| | 836 | | | | | Tosei Corp. | | | 126,503 | |
| | 47,000 | | | | | Toyo Kohan Co., Ltd. | | | 138,256 | |
| | 76,000 | | | | | Toyo Suisan Kaisha Ltd. | | | 1,959,553 | |
| | 193,300 | | | | | TS Tech Co., Ltd. | | | 1,447,950 | |
| | 60,600 | | | | | Unipres Corp. | | | 496,454 | |
| | 122,000 | | | | | Wacoal Holdings Corp. | | | 1,321,685 | |
| | 90,000 | | | | | Yamaguchi Financial Group, Inc. | | | 860,844 | |
| | 64,500 | | | | | Yamanashi Chuo Bank Ltd. | | | 366,851 | |
| | 45,500 | | | | | Yamato Kogyo Co., Ltd. | | | 1,075,336 | |
| | | | | | | | | | | |
| | | | | | | | | | | | | | 59,114,599 | |
| | | | | | | | | | | | | | | |
| | | | | | | |
| | | | | | | Netherlands: 2.3% |
| | 60,294 | | | | | Boskalis Westminster | | | 1,990,499 | |
| | 107,909 | | | @ | | Crucell NV | | | 1,255,889 | |
| | 34,851 | | | @ | | Gemalto NV | | | 976,431 | |
| | 51,459 | | | | | OCE NV | | | 238,138 | |
| | 43,365 | | | | | OPG Groep NV | | | 624,015 | |
| | | | | | | | | | | |
| | | | | | | | | | | | | | 5,084,972 | |
| | | | | | | | | | | | | | | |
| | | | | | | |
| | | | | | | Norway: 0.6% |
| | 192,800 | | | @ | | Ementor ASA | | | 587,450 | |
| | 38,600 | | | | | Norwegian Property ASA | | | 57,529 | |
| | 28,700 | | | @ | | ODIM ASA | | | 174,926 | |
| | 70,000 | | | @ | | TGS Nopec Geophysical Co. ASA | | | 389,229 | |
| | 70,358 | | | | | Veidekke ASA | | | 217,807 | |
| | | | | | | | | | | |
| | | | | | | | | | | | | | 1,426,941 | |
| | | | | | | | | | | | | | | |
| | | | | | | |
| | | | | | | South Korea: 3.2% |
| | 113,202 | | | | | Asiana Airlines | | | 337,978 | |
| | 6,410 | | | | | Binggrae Co., Ltd. | | | 176,865 | |
| | 90,880 | | | | | Daesang Corp. | | | 341,565 | |
| | 229,750 | | | | | Daou Technology, Inc. | | | 516,764 | |
| | 14,170 | | | | | Dongkuk Steel Mill Co., Ltd. | | | 230,422 | |
| | 27,060 | | | | | Huchems Fine Chemical Corp. | | | 435,162 | |
| | 4,482 | | | @ | | KISCO Corp. | | | 70,135 | |
| | 96,680 | | | | | Kolon Engineering & Construction Co., Ltd. | | | 288,227 | |
| | 79,100 | | | @ | | Kolon Industries, Inc. | | | 1,312,100 | |
| | 1,357 | | | | | Korea Iron & Steel Co., Ltd. | | | 26,480 | |
| | 204,452 | | | | | Korea Technology Investment Corp. | | | 159,483 | |
| | 20,708 | | | | | Korea Zinc Co., Ltd. | | | 1,037,759 | |
| | 10,520 | | | | | Kumho Electric, Inc. | | | 143,224 | |
| | 9,794 | | | @ | | LG Life Sciences Ltd. | | | 232,649 | |
| | 55,880 | | | | | LG Telecom Ltd. | | | 398,337 | |
| | 31,160 | | | @ | | Lotte Midopa Co., Ltd. | | | 153,396 | |
| | 1,685 | | | | | Lotte Samkang Co., Ltd. | | | 155,707 | |
| | 67,470 | | | | | S&T Dynamics Co., Ltd. | | | 384,466 | |
| | 584,000 | | | | | STX Pan Ocean Co., Ltd. | | | 318,323 | |
| | 22,108 | | | @ | | TK Corp. | | | 358,415 | |
| | | | | | | | | | | |
| | | | | | | | | | | | | | 7,077,457 | |
| | | | | | | | | | | | | | | |
| | | | | | | | | | | | | | | |
See Accompanying Notes to Financial Statements
187
PORTFOLIO OF INVESTMENTS
ING Disciplined International SmallCap Fund
as of October 31, 2008 (continued)
| | | | | | | | | | | | | | | |
| Shares | | | | | | | | Value |
| |
| |
| | | | | | | |
| | | | | | | Spain: 1.1% |
| | 28,334 | | | | | Corporacion Financiera Alba SA | | $ | 834,694 | |
| | 292,277 | | | | | Iberia Lineas Aereas de Espana | | | 689,535 | |
| | 49,512 | | | | | Viscofan SA | | | 851,609 | |
| | | | | | | | | | | |
| | | | | | | | | | | | | | 2,375,838 | |
| | | | | | | | | | | | | | | |
| | | | | | | |
| | | | | | | Sweden: 0.8% |
| | 90,000 | | | @ | | Betsson AB | | | 765,527 | |
| | 5,275 | | | | | Lundbergforetagen AB — B Shares | | | 167,915 | |
| | 137,400 | | | @ | | PA Resources AB | | | 345,979 | |
| | 216,414 | | | | | RNB Retail and Brands AB | | | 116,273 | |
| | 33,700 | | | | | Wihlborgs Fastigheter AB | | | 356,849 | |
| | | | | | | | | | | |
| | | | | | | | | | | | | | 1,752,543 | |
| | | | | | | | | | | | | | | |
| | | | | | | |
| | | | | | | Switzerland: 6.9% |
| | 52,145 | | | | | Adecco SA | | | 1,813,962 | |
| | 33,502 | | | | | Baloise Holding AG | | | 1,791,168 | |
| | 7,124 | | | | | Bobst Group AG | | | 257,827 | |
| | 2,051 | | | | | Flughafen Zuerich AG | | | 546,478 | |
| | 4,361 | | | | | Galenica AG | | | 1,318,632 | |
| | 2,530 | | | | | Geberit AG — Reg | | | 262,853 | |
| | 317 | | | | | Jelmoli Holding AG | | | 558,671 | |
| | 27,160 | | | | | Pargesa Holding SA | | | 2,080,519 | |
| | 55,606 | | | @ | | PSP Swiss Property AG | | | 2,405,806 | |
| | 3,362 | | | | | Rieter Holding AG | | | 582,560 | |
| | 2,889 | | | | | Schweizerhall Holding AG | | | 598,282 | |
| | 13,790 | | | @ | | Swiss Life Holding | | | 1,242,564 | |
| | 27,726 | | | @ | | Swiss Prime Site AG | | | 1,275,853 | |
| | 20,204 | | | @ | | Temenos Group AG — Reg | | | 253,042 | |
| | 172 | | | | | Vetropack Holding AG | | | 230,619 | |
| | | | | | | | | | | |
| | | | | | | | | | | | | | 15,218,836 | |
| | | | | | | | | | | | | | | |
| | | | | | | |
| | | | | | | United Kingdom: 13.6% |
| | 104,504 | | | | | Amec PLC | | | 874,339 | |
| | 392,412 | | | | | ARM Holdings PLC | | | 611,820 | |
| | 25,920 | | | | | Axon Group PLC | | | 264,576 | |
| | 196,344 | | | | | Balfour Beatty PLC | | | 793,438 | |
| | 50,126 | | | | | Bellway PLC | | | 436,686 | |
| | 896,149 | | | | | Brit Insurance Holdings PLC | | | 2,635,519 | |
| | 142,877 | | | | | Britvic PLC | | | 524,818 | |
| | 216,720 | | | | | Cable & Wireless PLC | | | 429,536 | |
| | 57,611 | | | | | Capital & Regional PLC | | | 42,510 | |
| | 23,801 | | | | | Chemring Group PLC | | | 610,609 | |
| | 216,899 | | | @ | | Colt Telecom Group SA | | | 222,854 | |
| | 45,907 | | | | | De La Rue PLC | | | 662,245 | |
| | 1,195,888 | | | | | Dimension Data Holdings PLC | | | 574,514 | |
| | 17,917 | | | | | Drax Group PLC | | | 166,490 | |
| | 426,375 | | | | | Filtrona PLC | | | 856,495 | |
| | 1,028,540 | | | | | Friends Provident PLC | | | 1,179,412 | |
| | 794,081 | | | | | Game Group PLC | | | 1,665,712 | |
| | 71,076 | | | | | Greene King PLC | | | 367,047 | |
| | 5,386 | | | | | Greggs PLC | | | 282,996 | |
| | 131,742 | | | | | Informa PLC | | | 446,337 | |
| | 199,504 | | | | | JKX Oil & Gas PLC | | | 489,259 | |
| | 35,957 | | | | | Keller Group PLC | | | 302,441 | |
| | 154,381 | | | | | Meggitt PLC | | | 338,205 | |
| | 417,484 | | | | | Millennium & Copthorne Hotels PLC | | | 1,422,932 | |
| | 70,997 | | | | | Mondi PLC | | | 257,674 | |
| | 51,133 | | | | | Morgan Sindall PLC | | | 414,183 | |
| | 259,617 | | | | | Pennon Group PLC | | | 2,246,645 | |
| | 33,274 | | | | | Petrofac Ltd. | | | 230,348 | |
| | 161,412 | | | | | PV Crystalox Solar PLC | | | 352,505 | |
| | 195,732 | | | | | Spectris PLC | | | 1,571,079 | |
| | 138,030 | | | | | Spirax-Sarco Engineering PLC | | | 1,775,995 | |
| | 1,894,609 | | | | | Spirent Communications PLC | | | 1,657,409 | |
| | 627,081 | | | | | Stagecoach Group PLC | | | 1,882,850 | |
| | 103,727 | | | | | Weir Group PLC | | | 582,718 | |
| | 437,081 | | | | | WH Smith PLC | | | 2,627,875 | |
| | | | | | | | | | | |
| | | | | | | | | | | | | | 29,800,071 | |
| | | | | | | | | | | | | | | |
| | | | | | | |
| | | | | | | United States: 0.8% |
| | 6,400 | | | | | Core Laboratories NV | | | 471,680 | |
| | 223,500 | | | | | Virgin Media, Inc. | | | 1,287,360 | |
| | | | | | | | | | | |
| | | | | | | | | | | | | | 1,759,040 | |
| | | | | | | | | | | | | | | |
| | | | | | | Total Common Stock
(Cost $343,866,758) | | | 210,495,388 | |
| | | | | | | | | | | |
| |
REAL ESTATE INVESTMENT TRUSTS: 1.9% |
| | | | | | | |
| | | | | | | Australia: 0.4% |
| | 3,152,135 | | | | | Centro Retail Trust | | | 235,619 | |
| | 671,495 | | | | | Commonwealth Property Office Fund | | | 593,370 | |
| | | | | | | | | | | |
| | | | | | | | | | | | | | 828,989 | |
| | | | | | | | | | | | | | | |
| | | | | | | |
| | | | | | | France: 0.9% |
| | 28,793 | | | | | Gecina SA | | | 1,999,539 | |
| | | | | | | | | | | |
| | | | | | | | | | | | | | 1,999,539 | |
| | | | | | | | | | | | | | | |
| | | | | | | |
| | | | | | | Japan: 0.2% |
| | 237 | | | | | DA Office Investment Corp. | | | 457,182 | |
| | | | | | | | | | | |
| | | | | | | | | | | | | | 457,182 | |
| | | | | | | | | | | | | | | |
| | | | | | | |
| | | | | | | Netherlands: 0.0% |
| | 1,181 | | | | | Nieuwe Steen Investments Funds NV | | | 20,618 | |
| | | | | | | | | | | |
| | | | | | | | | | | | | | 20,618 | |
| | | | | | | | | | | | | | | |
| | | | | | | |
| | | | | | | Singapore: 0.4% |
| | 1,917,000 | | | @ | | Suntec Real Estate Investment Trust | | | 917,634 | |
| | | | | | | | | | | |
| | | | | | | | | | | | | | 917,634 | |
| | | | | | | | | | | | | | | |
| | | | | | | Total Real Estate Investment Trusts
(Cost $7,477,480) | | | 4,223,962 | |
| | | | | | | | | | | |
| |
EXCHANGE-TRADED FUNDS: 0.8% |
| | | | | | | |
| | | | | | | Developed Markets: 0.8% |
| | 41,700 | | | | | iShares MSCI EAFE Index Fund | | | 1,860,654 | |
| | | | | | | | | | | |
| | | | | | | Total Exchange-Traded Funds
(Cost $1,733,572) | | | 1,860,654 | |
| | | | | | | | | | | |
| |
MUTUAL FUNDS: 0.3% |
| | | | | | | |
| | | | | | | Australia: 0.2% |
| | 438,977 | | | ** | | ING Office Fund | | | 321,880 | |
| | | | | | | | | | | |
| | | | | | | | | | | | | | 321,880 | |
| | | | | | | | | | | | | | | |
| | | | | | | |
| | | | | | | United Kingdom: 0.1% |
| | 11,117 | | | | | Caledonia Investments PLC | | | 271,539 | |
| | | | | | | | | | | |
| | | | | | | | | | | | | | 271,539 | |
| | | | | | | | | | | | | | | |
| | | | | | | Total Mutual Funds
(Cost $1,049,301) | | | 593,419 | |
| | | | | | | | | | | |
| |
PREFERRED STOCK: 1.8% |
| | | | | | | |
| | | | | | | Germany: 0.6% |
| | 17,512 | | | | | Draegerwerk AG | | | 676,343 | |
| | 17,879 | | | | | Fuchs Petrolub AG | | | 634,629 | |
| | | | | | | | | | | |
| | | | | | | | | | | | | | 1,310,972 | |
| | | | | | | | | | | | | | | |
| | | | | | | |
| | | | | | | Italy: 1.2% |
| | 312,333 | | | @ | | Instituto Finanziario Industriale S.p.A. | | | 2,726,944 | |
| | | | | | | | | | | |
| | | | | | | | | | | | | | 2,726,944 | |
| | | | | | | | | | | | | | | |
| | | | | | | Total Preferred Stock
(Cost $7,535,147) | | | 4,037,916 | |
| | | | | | | | | | | |
| | | | | | | Total Long-Term Investments
(Cost $361,662,258) | | | 221,211,339 | |
| | | | | | | | | | | |
| | | | | | | | | | | | | | | |
See Accompanying Notes to Financial Statements
188
PORTFOLIO OF INVESTMENTS
ING Disciplined International SmallCap Fund
as of October 31, 2008 (continued)
| | | | | | | | | | | | | | | |
Principal
| | | | | | | | |
| Amount | | | | | | | | Value |
| |
| |
SHORT-TERM INVESTMENTS: 6.5% |
| | | | | | | |
| | | | | | | Repurchase Agreement: 6.5% |
| $ | 14,271,000 | | | | | Deutsche Bank Repurchase Agreement dated 10/31/08, 0.200%, due 11/03/08, $14,271,238 to be received upon repurchase (Collateralized by $14,786,000 various U.S. Government Agency Obligations, 5.125% – 5.520%, Market Value plus accrued interest $14,557,313, due 06/18/18-04/12/19) | | $ | 14,271,000 | |
| | | | | | | | | | | |
| | | | | | | Total Short-Term Investments
(Cost $14,271,000) | | | 14,271,000 | |
| | | | | | | | | | | |
| | | | | Total Investments in Securities |
| | | | | (Cost $375,933,258)* | | | 107.1 | % | | $ | 235,482,339 | |
| | | | | Other Assets and
Liabilities - Net | | | (7.1 | ) | | | (15,679,115 | ) |
| | | | | | | | | | | | | |
| | | | | Net Assets | | | 100.0 | % | | $ | 219,803,224 | |
| | | | | | | | | | | | | |
| | | |
| @ | | Non-income producing security |
| ** | | Investment in affiliate |
| X | | Fair value determined by ING Funds Valuation Committee appointed by the Funds’ Board of Directors/Trustees. |
| | | |
| * | | Cost for federal income tax purposes is $381,864,985. |
| | | |
| | | Net unrealized depreciation consists of: |
| | | | | |
| Gross Unrealized Appreciation | | $ | 491,492 | |
| Gross Unrealized Depreciation | | | (146,874,138 | ) |
| | | | | |
| Net Unrealized Depreciation | | $ | (146,382,646 | ) |
| | | | | |
| | | | | |
| | | Percentage of
|
| Industry | | Net Assets |
|
| |
| Advertising | | | 1.2 | % |
| Aerospace/Defense | | | 1.2 | |
| Agriculture | | | 0.3 | |
| Airlines | | | 1.9 | |
| Apparel | | | 0.7 | |
| Auto Manufacturers | | | 0.5 | |
| Auto Parts & Equipment | | | 2.5 | |
| Banks | | | 5.1 | |
| Beverages | | | 1.6 | |
| Biotechnology | | | 0.6 | |
| Building Materials | | | 1.7 | |
| Chemicals | | | 3.5 | |
| Closed-End Funds | | | 0.1 | |
| Coal | | | 0.2 | |
| Commercial Services | | | 1.9 | |
| Computers | | | 1.9 | |
| Distribution/Wholesale | | | 0.6 | |
| Diversified | | | 1.3 | |
| Diversified Financial Services | | | 1.5 | |
| Electric | | | 1.0 | |
| Electrical Components & Equipment | | | 1.3 | |
| Electronics | | | 2.6 | |
| Energy — Alternate Sources | | | 0.5 | |
| Engineering & Construction | | | 6.0 | |
| Entertainment | | | 0.5 | |
| Environmental Control | | | 0.3 | |
| Food | | | 3.5 | |
| Forest Products & Paper | | | 0.1 | |
| Gas | | | 0.2 | |
| Hand/Machine Tools | | | 2.1 | |
| Healthcare — Products | | | 0.4 | |
| Healthcare — Services | | | 0.0 | |
| Holding Companies — Diversified | | | 1.3 | |
| Home Builders | | | 0.2 | |
| Home Furnishings | | | 0.3 | |
| Household Products/Wares | | | 0.5 | |
| Insurance | | | 5.3 | |
| Internet | | | 1.1 | |
| Investment Companies | | | 2.6 | |
| Iron/Steel | | | 3.0 | |
| Leisure Time | | | 0.5 | |
| Lodging | | | 1.4 | |
| Machinery — Diversified | | | 4.0 | |
| Media | | | 1.5 | |
| Metal Fabricate/Hardware | | | 1.7 | |
| Mining | | | 1.8 | |
| Miscellaneous Manufacturing | | | 1.8 | |
| Office Property | | | 0.5 | |
| Office/Business Equipment | | | 0.1 | |
| Oil & Gas | | | 2.8 | |
| Oil & Gas Services | | | 1.7 | |
| Open-End Funds | | | 0.2 | |
| Packaging & Containers | | | 0.1 | |
| Pharmaceuticals | | | 3.4 | |
| Real Estate | | | 3.3 | |
| Retail | | | 4.5 | |
| Semiconductors | | | 0.5 | |
| Shopping Centers | | | 0.1 | |
| Software | | | 2.3 | |
| Telecommunications | | | 2.7 | |
| Textiles | | | 1.0 | |
| Toys/Games/Hobbies | | | 0.4 | |
| Transportation | | | 1.3 | |
| Venture Capital | | | 0.1 | |
| Water | | | 1.0 | |
| Other Long-Term Investments | | | 0.8 | |
| Short-Term Investments | | | 6.5 | |
| Other Assets and Liabilities — Net | | | (7.1 | ) |
| | | | | |
Net Assets | | | 100.0 | % |
| | | | | |
See Accompanying Notes to Financial Statements
189
PORTFOLIO OF INVESTMENTS
ING Emerging Countries Fund
as of October 31, 2008
| | | | | | | | | | | | | | | |
| Shares | | | | | | | | Value |
| |
| |
| |
COMMON STOCK: 81.7% |
| | | | | | | |
| | | | | | | Bermuda: 1.0% |
| | 25,876 | | | | | Credicorp Ltd. | | $ | 1,016,151 | |
| | | | | | | | | | | |
| | | | | | | | | | | | | | 1,016,151 | |
| | | | | | | | | | | | | | | |
| | | | | | | |
| | | | | | | Brazil: 9.9% |
| | 27,217 | | | | | Cia de Bebidas das Americas ADR | | | 1,156,723 | |
| | 87,000 | | | L | | Cia Energetica de Minas Gerais ADR | | | 1,323,270 | |
| | 117,411 | | | L | | Cia Vale do Rio Doce ADR | | | 1,540,432 | |
| | 130,597 | | | | | Cia Vale do Rio Doce SP ADR | | | 1,529,291 | |
| | 113,949 | | | | | Petroleo Brasileiro SA | | | 1,508,450 | |
| | 82,293 | | | | | Petroleo Brasileiro SA ADR | | | 1,816,207 | |
| | 20,871 | | | | | Uniao de Bancos Brasileiros SA GDR | | | 1,316,543 | |
| | | | | | | | | | | |
| | | | | | | | | | | | | | 10,190,916 | |
| | | | | | | | | | | | | | | |
| | | | | | | |
| | | | | | | Chile: 2.9% |
| | 33,150 | | | L | | Empresa Nacional de Electricidad SA ADR | | | 1,233,180 | |
| | 121,394 | | | | | Enersis SA ADR | | | 1,748,074 | |
| | | | | | | | | | | |
| | | | | | | | | | | | | | 2,981,254 | |
| | | | | | | | | | | | | | | |
| | | | | | | |
| | | | | | | China: 5.8% |
| | 504,500 | | | | | China Life Insurance Co., Ltd. | | | 1,348,223 | |
| | 451,000 | | | | | China National Building Material Co., Ltd. | | | 262,642 | |
| | 959,000 | | | | | China Shenhua Energy Co., Ltd. | | | 1,820,739 | |
| | 3,344,000 | | | L | | Industrial and Commercial Bank of China Ltd. | | | 1,573,421 | |
| | 3,176,000 | | | @ | | Shanghai Electric Group Co., Ltd. | | | 961,039 | |
| | | | | | | | | | | |
| | | | | | | | | | | | | | 5,966,064 | |
| | | | | | | | | | | | | | | |
| | | | | | | |
| | | | | | | Czech Republic: 1.5% |
| | 13,300 | | | | | CEZ A/S | | | 581,691 | |
| | 44,253 | | | | | Telefonica O2 Czech Republic A/S | | | 945,657 | |
| | | | | | | | | | | |
| | | | | | | | | | | | | | 1,527,348 | |
| | | | | | | | | | | | | | | |
| | | | | | | |
| | | | | | | Hong Kong: 8.3% |
| | 498,000 | | | | | Beijing Enterprises Holdings Ltd. | | | 1,927,730 | |
| | 483,000 | | | | | China Mobile Ltd. | | | 4,252,002 | |
| | 1,143,000 | | | L | | China Overseas Land & Investment Ltd. | | | 1,290,753 | |
| | 1,290,000 | | | | | CNOOC Ltd. | | | 1,059,193 | |
| | | | | | | | | | | |
| | | | | | | | | | | | | | 8,529,678 | |
| | | | | | | | | | | | | | | |
| | | | | | | |
| | | | | | | India: 9.2% |
| | 72,305 | | | | | Bharat Heavy Electricals | | | 1,920,900 | |
| | 205,233 | | | @ | | Bharti Airtel Ltd. | | | 2,771,308 | |
| | 86,573 | | | | | Hindustan Lever Ltd. | | | 393,172 | |
| | 61,019 | | | | | Housing Development Finance Corp. | | | 2,214,946 | |
| | 186,107 | | | | | ICICI Bank Ltd. | | | 1,545,252 | |
| | 409,507 | | | | | Jaiprakash Associates Ltd. | | | 616,959 | |
| | | | | | | | | | | |
| | | | | | | | | | | | | | 9,462,537 | |
| | | | | | | | | | | | | | | |
| | | | | | | |
| | | | | | | Indonesia: 1.9% |
| | 7,020,300 | | | X | | Bumi Resources Tbk PT | | | 1,376,185 | |
| | 1,217,500 | | | | | Telekomunikasi Indonesia Tbk PT | | | 609,099 | |
| | | | | | | | | | | |
| | | | | | | | | | | | | | 1,985,284 | |
| | | | | | | | | | | | | | | |
| | | | | | | |
| | | | | | | Israel: 5.3% |
| | 79,900 | | | | | Israel Chemicals Ltd. | | | 805,862 | |
| | 18,765 | | | | | Makhteshim-Agan Industries Ltd. | | | 71,056 | |
| | 106,344 | | | L | | Teva Pharmaceutical Industries Ltd. ADR | | | 4,560,031 | |
| | | | | | | | | | | |
| | | | | | | | | | | | | | 5,436,949 | |
| | | | | | | | | | | | | | | |
| | | | | | | |
| | | | | | | Malaysia: 0.2% |
| | 431,500 | | | @ | | Proton Holdings Bhd | | | 250,550 | |
| | | | | | | | | | | |
| | | | | | | | | | | | | | 250,550 | |
| | | | | | | | | | | | | | | |
| | | | | | | |
| | | | | | | Mauritius: 0.8% |
| | 5,947,000 | | | | | Golden Agri-Resources Ltd. | | | 793,618 | |
| | | | | | | | | | | |
| | | | | | | | | | | | | | 793,618 | |
| | | | | | | | | | | | | | | |
| | | | | | | |
| | | | | | | Mexico: 5.4% |
| | 45,947 | | | | | America Movil SA de CV ADR | | | 1,421,600 | |
| | 29,565 | | | | | Fomento Economico Mexicano SA de CV ADR | | | 747,699 | |
| | 330,900 | | | | | Grupo Financiero Banorte SA de CV | | | 606,125 | |
| | 82,100 | | | | | Grupo Televisa SA ADR | | | 1,449,886 | |
| | 487,400 | | | | | Wal-Mart de Mexico SA de CV | | | 1,310,592 | |
| | | | | | | | | | | |
| | | | | | | | | | | | | | 5,535,902 | |
| | | | | | | | | | | | | | | |
| | | | | | | |
| | | | | | | Peru: 0.6% |
| | 47,341 | | | | | Cia de Minas Buenaventura SA ADR | | | 598,390 | |
| | | | | | | | | | | |
| | | | | | | | | | | | | | 598,390 | |
| | | | | | | | | | | | | | | |
| | | | | | | |
| | | | | | | Russia: 6.9% |
| | 190,392 | | | @,I | | LSR Group GDR | | | 474,076 | |
| | 38,300 | | | @ | | Mobile Telesystems Finance SA ADR | | | 1,499,445 | |
| | 144,851 | | | @ | | OAO Gazprom ADR | | | 2,884,430 | |
| | 488,100 | | | @ | | OAO Rosneft Oil Co. GDR | | | 2,240,105 | |
| | | | | | | | | | | |
| | | | | | | | | | | | | | 7,098,056 | |
| | | | | | | | | | | | | | | |
| | | | | | | |
| | | | | | | South Africa: 4.4% |
| | 273,900 | | | | | Imperial Holdings Ltd. | | | 1,564,014 | |
| | 241,520 | | | | | Jd Group Ltd. | | | 694,919 | |
| | 78,000 | | | | | MTN Group Ltd. | | | 875,871 | |
| | 47,300 | | | | | Sasol Ltd. | | | 1,396,197 | |
| | | | | | | | | | | |
| | | | | | | | | | | | | | 4,531,001 | |
| | | | | | | | | | | | | | | |
| | | | | | | |
| | | | | | | South Korea: 7.5% |
| | 15,300 | | | L | | GS Engineering & Construction Corp. | | | 726,687 | |
| | 9,432 | | | | | Samsung Electronics Co., Ltd. | | | 3,976,566 | |
| | 81,610 | | | L | | Samsung Techwin Co., Ltd. | | | 1,729,785 | |
| | 3,580 | | | | | Shinsegae Co., Ltd. | | | 1,256,532 | |
| | | | | | | | | | | |
| | | | | | | | | | | | | | 7,689,570 | |
| | | | | | | | | | | | | | | |
| | | | | | | |
| | | | | | | Taiwan: 7.5% |
| | 794,970 | | | | | Chunghwa Telecom Co., Ltd. | | | 1,315,304 | |
| | 252,490 | | | | | Hon Hai Precision Industry Co., Ltd. — GDR | | | 1,233,304 | |
| | 2,765,722 | | | | | Taiwan Semiconductor Manufacturing Co., Ltd. | | | 4,024,275 | |
| | 1,308,000 | | | | | Uni-President Enterprises Corp. | | | 1,118,077 | |
| | | | | | | | | | | |
| | | | | | | | | | | | | | 7,690,960 | |
| | | | | | | | | | | | | | | |
| | | | | | | |
| | | | | | | Turkey: 2.0% |
| | 1,229,861 | | | @ | | Turkiye Garanti Bankasi A/S | | | 2,065,654 | |
| | | | | | | | | | | |
| | | | | | | | | | | | | | 2,065,654 | |
| | | | | | | | | | | | | | | |
| | | | | | | |
| | | | | | | United Kingdom: 0.6% |
| | 91,658 | | | | | Antofagasta PLC | | | 566,303 | |
| | | | | | | | | | | |
| | | | | | | | | | | | | | 566,303 | |
| | | | | | | | | | | | | | | |
| | | | | | | Total Common Stock
(Cost $135,057,981) | | | 83,916,185 | |
| | | | | | | | | | | |
| |
EXCHANGE-TRADED FUNDS: 9.6% |
| | | | | | | |
| | | | | | | China: 2.6% |
| | 106,900 | | | L | | iShares FTSE/Xinhua China 25 Index Fund | | | 2,689,604 | |
| | | | | | | | | | | |
| | | | | | | | | | | | | | 2,689,604 | |
| | | | | | | | | | | | | | | |
| | | | | | | | | | | | | | | |
See Accompanying Notes to Financial Statements
190
PORTFOLIO OF INVESTMENTS
ING Emerging Countries Fund
as of October 31, 2008 (continued)
| | | | | | | | | | | | | | | |
| Shares | | | | | | | | Value |
| |
| |
| | | | | | | |
| | | | | | | Hong Kong: 0.9% |
| | 580,600 | | | @ | | iShares Asia Trust — MSCI China Tracker | | $ | 907,978 | |
| | | | | | | | | | | |
| | | | | | | | | | | | | | 907,978 | |
| | | | | | | | | | | | | | | |
| | | | | | | |
| | | | | | | South Korea: 1.1% |
| | 39,200 | | | | | iShares MSCI South Korea Index Fund | | | 1,103,088 | |
| | | | | | | | | | | |
| | | | | | | | | | | | | | 1,103,088 | |
| | | | | | | | | | | | | | | |
| | | | | | | |
| | | | | | | United States: 5.0% |
| | 429,800 | | | L | | iShares MSCI Taiwan Index Fund | | | 3,790,836 | |
| | 51,200 | | | | | iShares S&P Latin America 40 Index Fund | | | 1,361,920 | |
| | | | | | | | | | | |
| | | | | | | | | | | | | | 5,152,756 | |
| | | | | | | | | | | | | | | |
| | | | | | | Total Exchange-Traded Funds
(Cost $12,219,405) | | | 9,853,426 | |
| | | | | | | | | | | |
| |
PREFERRED STOCK: 1.1% |
| | | | | | | |
| | | | | | | Brazil: 1.1% |
| | 354,800 | | | | | Investimentos Itau SA | | | 1,131,626 | |
| | | | | | | | | | | |
| | | | | | | Total Preferred Stock
(Cost $2,136,333) | | | 1,131,626 | |
| | | | | | | | | | | |
| | | | | | | Total Long-Term Investments
(Cost $149,413,719) | | | 94,901,237 | |
| | | | | | | | | | | |
Principal
| | | | | | | | |
| Amount | | | | | | | | Value |
| |
| |
| |
SHORT-TERM INVESTMENTS: 11.7% |
| | | | | | | |
| | | | | | | Securities Lending CollateralCC: 11.7% |
| $ | 12,164,927 | | | | | Bank of New York Mellon Corp. Institutional Cash Reserves | | $ | 12,022,302 | |
| | | | | | | | | | | |
| | | | | | | Total Short-Term Investments
(Cost $12,164,927) | | | 12,022,302 | |
| | | | | | | | | | | |
| | | | | Total Investments in Securities |
| | | | | (Cost $161,578,646)* | | | 104.1 | % | | $ | 106,923,539 | |
| | | | | Other Assets and
Liabilities - Net | | | (4.1 | ) | | | (4,234,843 | ) |
| | | | | | | | | | | | | |
| | | | | Net Assets | | | 100.0 | % | | $ | 102,688,696 | |
| | | | | | | | | | | | | |
| | | |
| @ | | Non-income producing security |
| ADR | | American Depositary Receipt |
| GDR | | Global Depositary Receipt |
| cc | | Securities purchased with cash collateral for securities loaned. |
| I | | Illiquid Security |
| L | | Loaned security, a portion or all of the security is on loan at October 31, 2008. |
| X | | Fair value determined by ING Funds Valuation Committee appointed by the Funds’ Board of Directors/Trustees. |
| | | |
| * | | Cost for federal income tax purposes is $171,669,303. |
| | | |
| | | Net unrealized depreciation consists of: |
| | | | | |
| Gross Unrealized Appreciation | | $ | 742,125 | |
| Gross Unrealized Depreciation | | | (65,487,889 | ) |
| | | | | |
| Net Unrealized Depreciation | | $ | (64,745,764 | ) |
| | | | | |
| | | | | |
| | | Percentage of
|
| Industry | | Net Assets |
|
| |
| Agriculture | | | 0.8 | % |
| Auto Manufacturers | | | 0.2 | |
| Banks | | | 7.3 | |
| Beverages | | | 1.9 | |
| Building Materials | | | 0.3 | |
| Chemicals | | | 0.9 | |
| Coal | | | 3.1 | |
| Diversified Financial Services | | | 2.7 | |
| Electric | | | 4.8 | |
| Electrical Components & Equipment | | | 1.9 | |
| Electronics | | | 1.2 | |
| Engineering & Construction | | | 1.3 | |
| Food | | | 1.1 | |
| Holding Companies — Diversified | | | 4.5 | |
| Household Products/Wares | | | 0.4 | |
| Insurance | | | 1.3 | |
| Machinery — Diversified | | | 0.9 | |
| Media | | | 1.4 | |
| Mining | | | 4.1 | |
| Oil & Gas | | | 10.6 | |
| Pharmaceuticals | | | 4.4 | |
| Real Estate | | | 1.7 | |
| Retail | | | 3.2 | |
| Semiconductors | | | 9.5 | |
| Telecommunications | | | 13.3 | |
| Other Long-Term Investments | | | 9.6 | |
| Short-Term Investments | | | 11.7 | |
| Other Assets and Liabilities — Net | | | (4.1 | ) |
| | | | | |
Net Assets | | | 100.0 | % |
| | | | | |
See Accompanying Notes to Financial Statements
191
PORTFOLIO OF INVESTMENTS
ING European Real Estate Fund
as of October 31, 2008
| | | | | | | | | | | | | | | |
| Shares | | | | | | | | Value |
| |
| |
| |
COMMON STOCK: 13.5% |
| | | | | | | |
| | | | | | | Austria: 0.4% |
| | 12,400 | | | @ | | Immofinanz Immobilien Anlagen AG | | $ | 13,831 | |
| | | | | | | | | | | |
| | | | | | | | | | | | | | 13,831 | |
| | | | | | | | | | | | | | | |
| | | | | | | |
| | | | | | | Finland: 1.7% |
| | 23,334 | | | | | Citycon OYJ | | | 55,302 | |
| | | | | | | | | | | |
| | | | | | | | | | | | | | 55,302 | |
| | | | | | | | | | | | | | | |
| | | | | | | |
| | | | | | | Germany: 2.9% |
| | 3,600 | | | | | Deutsche Euroshop AG | | | 92,253 | |
| | | | | | | | | | | |
| | | | | | | | | | | | | | 92,253 | |
| | | | | | | | | | | | | | | |
| | | | | | | |
| | | | | | | Sweden: 1.7% |
| | 7,800 | | | | | Castellum AB | | | 52,949 | |
| | | | | | | | | | | |
| | | | | | | | | | | | | | 52,949 | |
| | | | | | | | | | | | | | | |
| | | | | | | |
| | | | | | | Switzerland: 4.0% |
| | 1,390 | | | @ | | PSP Swiss Property AG | | | 60,139 | |
| | 1,500 | | | @ | | Swiss Prime Site AG | | | 69,025 | |
| | | | | | | | | | | |
| | | | | | | | | | | | | | 129,164 | |
| | | | | | | | | | | | | | | |
| | | | | | | |
| | | | | | | United Kingdom: 2.8% |
| | 5,043 | | | | | Helical Bar PLC | | | 24,246 | |
| | 44,600 | | | | | Safestore Holdings Ltd. | | | 66,803 | |
| | | | | | | | | | | |
| | | | | | | | | | | | | | 91,049 | |
| | | | | | | | | | | | | | | |
| | | | | | | Total Common Stock
(Cost $699,027) | | | 434,548 | |
| | | | | | | | | | | |
| |
REAL ESTATE INVESTMENT TRUSTS: 79.4% |
| | | | | | | |
| | | | | | | Belgium: 2.6% |
| | 680 | | | | | Cofinimmo | | | 84,735 | |
| | | | | | | | | | | |
| | | | | | | | | | | | | | 84,735 | |
| | | | | | | | | | | | | | | |
| | | | | | | |
| | | | | | | France: 30.3% |
| | 580 | | | | | Fonciere Des Regions | | | 38,353 | |
| | 730 | | | | | ICADE | | | 43,635 | |
| | 1,618 | | | | | Klepierre | | | 37,269 | |
| | 3,160 | | | | | Mercialys | | | 102,913 | |
| | 1,280 | | | | | Societe Immobiliere de Location pour l’Industrie et le Commerce | | | 114,102 | |
| | 4,260 | | | | | Unibail | | | 638,935 | |
| | | | | | | | | | | |
| | | | | | | | | | | | | | 975,207 | |
| | | | | | | | | | | | | | | |
| | | | | | | |
| | | | | | | Netherlands: 12.7% |
| | 2,755 | | | | | Corio NV | | | 147,227 | |
| | 2,990 | | | | | Eurocommercial Properties NV | | | 99,013 | |
| | 900 | | | | | Nieuwe Steen Investments Funds NV | | | 15,712 | |
| | 1,739 | | | | | Wereldhave NV | | | 144,538 | |
| | | | | | | | | | | |
| | | | | | | | | | | | | | 406,490 | |
| | | | | | | | | | | | | | | |
| | | | | | | |
| | | | | | | United Kingdom: 33.8% |
| | 20,920 | | | | | British Land Co. PLC | | | 208,605 | |
| | 10,917 | | | | | Brixton PLC | | | 29,365 | |
| | 7,300 | | | | | Derwent Valley Holdings PLC | | | 85,501 | |
| | 3,740 | | | | | Great Portland Estates PLC | | | 16,655 | |
| | 13,028 | | | | | Hammerson PLC | | | 150,154 | |
| | 25,100 | | | | | Land Securities Group PLC | | | 445,543 | |
| | 7,890 | | | | | Liberty International PLC | | | 87,789 | |
| | 9,500 | | | | | Segro PLC | | | 42,888 | |
| | 3,840 | | | | | Shaftesbury PLC | | | 20,655 | |
| | | | | | | | | | | |
| | | | | | | | | | | | | | 1,087,155 | |
| | | | | | | | | | | | | | | |
| | | | | | | Total Real Estate Investment Trusts
(Cost $3,927,107) | | | 2,553,587 | |
| | | | | | | | | | | |
| |
MUTUAL FUNDS: 0.5% |
| | | | | | | |
| | | | | | | Luxembourg: 0.5% |
| | 4,927 | | | | | Prologis European Properties | | | 16,327 | |
| | | | | | | | | | | |
| | | | | | | Total Mutual Funds
(Cost $56,482 ) | | | 16,327 | |
| | | | | | | | | | | |
| | | | | | | Total Long-Term Investments
(Cost $4,682,616 ) | | | 3,004,462 | |
| | | | | | | | | | | |
Principal
| | | | | | | | |
| Amount | | | | | | | | Value |
| |
| |
| |
SHORT-TERM INVESTMENTS: 4.7% |
| | | | | | | |
| | | | | | | Affiliated Mutual Fund: 4.7% |
| $ | 149,159 | | | | | ING Institutional Prime Money Market Fund | | $ | 149,159 | |
| | | | | | | | | | | |
| | | | | | | Total Short-Term Investments
(Cost $149,159 ) | | | 149,159 | |
| | | | | | | | | | | |
| | | | | Total Investments in Securities |
| | | | | (Cost $4,831,775)* | | | 98.1 | % | | $ | 3,153,621 | |
| | | | | Other Assets and
Liabilities - Net | | | 1.9 | | | | 61,997 | |
| | | | | | | | | | | | | |
| | | | | Net Assets | | | 100.0 | % | | $ | 3,215,618 | |
| | | | | | | | | | | | | |
| | | |
| @ | | Non-income producing security |
| | | |
| * | | Cost for federal income tax purposes is $5,219,391. |
| | | |
| | | Net unrealized depreciation consists of: |
| | | | | |
| Gross Unrealized Appreciation | | $ | 454 | |
| Gross Unrealized Depreciation | | | (2,066,224 | ) |
| | | | | |
| Net Unrealized Depreciation | | $ | (2,065,770 | ) |
| | | | | |
| | | | | |
| | | Percentage of
|
| Industry | | Net Assets |
|
| |
| Closed-End Funds | | | 0.5 | % |
| Diversified | | | 71.3 | |
| Office Property | | | 8.1 | |
| Real Estate | | | 11.4 | |
| Storage/Warehousing | | | 2.1 | |
| Short-Term Investments | | | 4.7 | |
| Other Assets and Liabilities — Net | | | 1.9 | |
| | | | | |
Net Assets | | | 100.0 | % |
| | | | | |
See Accompanying Notes to Financial Statements
192
PORTFOLIO OF INVESTMENTS
ING Foreign Fund
as of October 31, 2008
| | | | | | | | | | | | | | | |
| Shares | | | | | | | | Value |
| |
| |
| |
COMMON STOCK: 81.6% |
| | | | | | | | | | | | | | | |
| | | | | | | |
| | | | | | | Australia: 0.8% |
| | 23,046 | | | | | BHP Billiton Ltd. | | $ | 442,742 | |
| | 845,981 | | | | | Macquarie Airports Management Ltd. | | | 1,203,133 | |
| | 23,069 | | | | | Newcrest Mining Ltd. | | | 317,117 | |
| | 13,241 | | | | | Rio Tinto Ltd. | | | 684,994 | |
| | | | | | | | | | | |
| | | | | | | | | | | | | | 2,647,986 | |
| | | | | | | | | | | | | | | |
| | | | | | | |
| | | | | | | Austria: 0.4% |
| | 4,643 | | | | | Flughafen Wien AG | | | 190,243 | |
| | 26,992 | | | | | OMV AG | | | 864,012 | |
| | 24,541 | | | | | Telekom Austria AG | | | 301,538 | |
| | | | | | | | | | | |
| | | | | | | | | | | | | | 1,355,793 | |
| | | | | | | | | | | | | | | |
| | | | | | | |
| | | | | | | Belgium: 0.0% |
| | 53,967 | | | | | Fortis | | | 62,525 | |
| | 2,148 | | | | | Kbc Ancora | | | 63,852 | |
| | | | | | | | | | | |
| | | | | | | | | | | | | | 126,377 | |
| | | | | | | | | | | | | | | |
| | | | | | | |
| | | | | | | Bermuda: 0.1% |
| | 13,337 | | | @,L | | Central European Media Enterprises Ltd. | | | 356,231 | |
| | | | | | | | | | | |
| | | | | | | | | | | | | | 356,231 | |
| | | | | | | | | | | | | | | |
| | | | | | | |
| | | | | | | Canada: 1.3% |
| | 105,489 | | | | | Barrick Gold Corp. | | | 2,412,077 | |
| | 73,289 | | | @ | | Eldorado Gold Corp. (Canadian Denominated Security) | | | 302,812 | |
| | 63,516 | | | @ | | Ivanhoe Mines Ltd. | | | 165,996 | |
| | 93,869 | | | | | Kinross Gold Corp. | | | 977,396 | |
| | 7,633 | | | @,L | | Research In Motion Ltd. | | | 384,932 | |
| | 29,529 | | | | | Talisman Energy, Inc. | | | 291,787 | |
| | | | | | | | | | | |
| | | | | | | | | | | | | | 4,535,000 | |
| | | | | | | | | | | | | | | |
| | | | | | | |
| | | | | | | China: 0.1% |
| | 534,732 | | | L | | Beijing Capital International Airport Co., Ltd. | | | 301,530 | |
| | | | | | | | | | | |
| | | | | | | | | | | | | | 301,530 | |
| | | | | | | | | | | | | | | |
| | | | | | | |
| | | | | | | Cyprus: 0.1% |
| | 55,108 | | | | | Bank of Cyprus Public Co., Ltd. | | | 286,927 | |
| | | | | | | | | | | |
| | | | | | | | | | | | | | 286,927 | |
| | | | | | | | | | | | | | | |
| | | | | | | |
| | | | | | | Czech Republic: 2.5% |
| | 54,985 | | | S | | Komercni Banka A/S | | | 8,372,251 | |
| | | | | | | | | | | |
| | | | | | | | | | | | | | 8,372,251 | |
| | | | | | | | | | | | | | | |
| | | | | | | |
| | | | | | | Denmark: 0.7% |
| | 2,008 | | | @ | | ALK-Abello A/S | | | 159,316 | |
| | 44,505 | | | | | Novo-Nordisk A/S | | | 2,385,609 | |
| | | | | | | | | | | |
| | | | | | | | | | | | | | 2,544,925 | |
| | | | | | | | | | | | | | | |
| | | | | | | |
| | | | | | | Finland: 2.0% |
| | 20,823 | | | | | Fortum OYJ | | | 511,747 | |
| | 321,845 | | | | | Nokia OYJ | | | 4,930,088 | |
| | 17,987 | | | | | OKO Bank | | | 242,007 | |
| | 25,562 | | | | | Orion OYJ | | | 375,634 | |
| | 90,164 | | | | | Stora Enso OYJ (Euro Denominated Security) | | | 838,474 | |
| | | | | | | | | | | |
| | | | | | | | | | | | | | 6,897,950 | |
| | | | | | | | | | | | | | | |
| | | | | | | |
| | | | | | | France: 17.1% |
| | 4,126 | | | | | Accor SA | | | 160,523 | |
| | 27,576 | | | | | ADP | | | 1,641,324 | |
| | 5,741 | | | | | Air Liquide | | | 495,420 | |
| | 7,315 | | | | | Alstom | | | 362,559 | |
| | 35,878 | | | | | AXA SA | | | 685,415 | |
| | 14,992 | | | | | Bouygues SA | | | 638,364 | |
| | 54,374 | | | | | Carrefour SA | | | 2,297,029 | |
| | 8,027 | | | | | Casino Guichard Perrachon SA | | | 561,111 | |
| | 25,530 | | | | | Cie de Saint-Gobain | | | 985,122 | |
| | 21,795 | | | | | Electricite de France | | | 1,309,521 | |
| | 5,471 | | | | | Eurazeo | | | 329,390 | |
| | 231,198 | | | | | France Telecom SA | | | 5,829,795 | |
| | 141,474 | | | | | Gaz de France | | | 6,297,529 | |
| | 88,487 | | | | | Groupe Danone | | | 4,927,037 | |
| | 4,604 | | | | | Lafarge SA | | | 304,359 | |
| | 19,005 | | | | | L’Oreal SA | | | 1,439,137 | |
| | 36,393 | | | | | LVMH Moet Hennessy Louis Vuitton SA | | | 2,421,736 | |
| | 16,451 | | | | | PPR | | | 1,048,430 | |
| | 4,248 | | | | | Remy Cointreau SA | | | 176,756 | |
| | 4,946 | | | | | Renault SA | | | 151,584 | |
| | 140,735 | | | | | Sanofi-Aventis | | | 8,916,570 | |
| | 5,357 | | | | | Schneider Electric SA | | | 321,086 | |
| | 18,075 | | | @ | | Suez Environnement SA | | | 345,563 | |
| | 233,803 | | | S | | Total SA | | | 12,862,317 | |
| | 25,323 | | | | | Vinci SA | | | 911,308 | |
| | 109,208 | | | | | Vivendi | | | 2,854,602 | |
| | | | | | | | | | | |
| | | | | | | | | | | | | | 58,273,587 | |
| | | | | | | | | | | | | | | |
| | | | | | | |
| | | | | | | Germany: 11.0% |
| | 3,261 | | | | | Adidas AG | | | 111,671 | |
| | 9,180 | | | | | Allianz AG | | | 690,790 | |
| | 70,943 | | | | | BASF AG | | | 2,381,617 | |
| | 47,546 | | | | | Bayer AG | | | 2,659,409 | |
| | 3,543 | | | @ | | Continental AG | | | 261,958 | |
| | 18,856 | | | | | DaimlerChrysler AG | | | 647,802 | |
| | 11,486 | | | | | Deutsche Post AG | | | 125,794 | |
| | 396,658 | | | | | Deutsche Telekom AG | | | 5,889,754 | |
| | 213,014 | | | | | E.ON AG | | | 8,152,228 | |
| | 81,292 | | | L | | Fraport AG Frankfurt Airport Services Worldwide | | | 2,594,487 | |
| | 26,215 | | | | | Fresenius AG | | | 1,553,761 | |
| | 59,738 | | | | | Fresenius Medical Care AG & Co. KGaA | | | 2,672,070 | |
| | 6,808 | | | | | Henkel KGaA | | | 166,044 | |
| | 4,439 | | | | | Merck KGaA | | | 392,241 | |
| | 4,377 | | | | | Muenchener Rueckversicherungs AG | | | 579,817 | |
| | 75,095 | | | | | Rhoen Klinikum AG | | | 1,615,057 | |
| | 38,019 | | | | | RWE AG | | | 3,161,576 | |
| | 28,308 | | | | | SAP AG | | | 999,175 | |
| | 46,644 | | | | | Siemens AG | | | 2,801,968 | |
| | 12,776 | | | @ | | UkrTelecom GDR | | | 29,262 | |
| | | | | | | | | | | |
| | | | | | | | | | | | | | 37,486,481 | |
| | | | | | | | | | | | | | | |
| | | | | | | |
| | | | | | | Greece: 0.2% |
| | 25,684 | | | | | Hellenic Telecommunications Organization SA | | | 362,504 | |
| | 99,745 | | | | | Veterin SA | | | 143,051 | |
| | | | | | | | | | | |
| | | | | | | | | | | | | | 505,555 | |
| | | | | | | | | | | | | | | |
| | | | | | | |
| | | | | | | Hong Kong: 0.3% |
| | 265,461 | | | | | China Merchants Holdings International Co., Ltd. | | | 632,433 | |
| | 310,871 | | | @,L | | Galaxy Entertainment Group Ltd. | | | 22,956 | |
| | 652,303 | | | | | GOME Electrical Appliances Holdings Ltd. | | | 130,294 | |
| | 1,381,040 | | | | | Shun TAK Holdings Ltd. | | | 275,259 | |
| | | | | | | | | | | |
| | | | | | | | | | | | | | 1,060,942 | |
| | | | | | | | | | | | | | | |
| | | | | | | |
| | | | | | | Hungary: 2.5% |
| | 652,022 | | | | | Magyar Telekom Telecommunications PLC | | | 2,062,996 | |
| | 353,913 | | | @,S,L | | OTP Bank Nyrt | | | 5,861,524 | |
| | 3,242 | | | | | Richter Gedeon Nyrt | | | 447,926 | |
| | | | | | | | | | | |
| | | | | | | | | | | | | | 8,372,446 | |
| | | | | | | | | | | | | | | |
| | | | | | | | | | | | | | | |
See Accompanying Notes to Financial Statements
193
PORTFOLIO OF INVESTMENTS
ING Foreign Fund
as of October 31, 2008 (continued)
| | | | | | | | | | | | | | | |
| Shares | | | | | | | | Value |
| |
| |
| | | | | | | |
| | | | | | | India: 1.0% |
| | 126,055 | | | @,# | | State Bank of India Ltd. (Equity Linked Certificate, Issuer: CLSA Financial Products Ltd.) | | $ | 2,828,781 | |
| | 24,142 | | | @,# | | State Bank of India Ltd.(Participation Certificate, Issuer: Citigroup Global Markets) | | | 541,767 | |
| | | | | | | | | | | |
| | | | | | | | | | | | | | 3,370,548 | |
| | | | | | | | | | | | | | | |
| | | | | | | |
| | | | | | | Ireland: 0.5% |
| | 48,326 | | | | | CRH PLC | | | 1,064,992 | |
| | 206,636 | | | @ | | Dragon Oil PLC | | | 534,644 | |
| | | | | | | | | | | |
| | | | | | | | | | | | | | 1,599,636 | |
| | | | | | | | | | | | | | | |
| | | | | | | |
| | | | | | | Italy: 2.8% |
| | 25,398 | | | | | Assicurazioni Generali S.p.A. | | | 641,398 | |
| | 75,233 | | | | | Buzzi Unicem S.p.A. | | | 914,229 | |
| | 88,665 | | | | | Credito Emiliano S.p.A. | | | 567,553 | |
| | 313,217 | | | | | Enel S.p.A. | | | 2,095,503 | |
| | 221,359 | | | | | ENI S.p.A. | | | 5,283,433 | |
| | 14,645 | | | | | Italcementi S.p.A. | | | 170,691 | |
| | | | | | | | | | | |
| | | | | | | | | | | | | | 9,672,807 | |
| | | | | | | | | | | | | | | |
| | | | | | | |
| | | | | | | Japan: 5.2% |
| | 6,601 | | | | | Aisin Seiki Co., Ltd. | | | 116,808 | |
| | 27,005 | | | S | | Canon, Inc. | | | 944,949 | |
| | 114 | | | | | Central Japan Railway Co. | | | 936,461 | |
| | 5,700 | | | | | Daikin Industries Ltd. | | | 128,207 | |
| | 14,608 | | | | | Daiwa Securities Group, Inc. | | | 82,587 | |
| | 15,888 | | | | | Denso Corp. | | | 309,666 | |
| | 194 | | | | | East Japan Railway Co. | | | 1,380,505 | |
| | 8,200 | | | | | Eisai Co., Ltd. | | | 266,047 | |
| | 5,100 | | | | | Fanuc Ltd. | | | 339,806 | |
| | 91 | | | | | Fuji Television Network, Inc. | | | 108,953 | |
| | 64,228 | | | S | | Honda Motor Co., Ltd. | | | 1,597,056 | |
| | 15,000 | | | | | Itochu Corp. | | | 79,271 | |
| | 158 | | | | | Japan Tobacco, Inc. | | | 560,533 | |
| | 146 | | | | | KDDI Corp. | | | 874,764 | |
| | 18,505 | | | | | Komatsu Ltd. | | | 203,438 | |
| | 15,319 | | | | | Kubota Corp. | | | 76,891 | |
| | 3,000 | | | | | Kyocera Corp. | | | 176,215 | |
| | 35,484 | | | | | Matsushita Electric Industrial Co., Ltd. | | | 571,425 | |
| | 10,700 | | | | | Mitsubishi Corp. | | | 179,352 | |
| | 59,000 | | | | | Mitsubishi Electric Corp. | | | 365,760 | |
| | 14,000 | | | | | Mitsui & Co., Ltd. | | | 135,653 | |
| | 7,723 | | | | | Mitsui Fudosan Co., Ltd. | | | 134,714 | |
| | 2,700 | | | | | Nidec Corp. | | | 145,215 | |
| | 2,901 | | | | | Nintendo Co., Ltd. | | | 932,115 | |
| | 48 | | | | | Nippon Telegraph & Telephone Corp. | | | 195,875 | |
| | 13,707 | | | | | Nissan Motor Co., Ltd. | | | 68,074 | |
| | 12,355 | | | | | Nomura Holdings, Inc. | | | 117,055 | |
| | 584 | | | | | NTT DoCoMo, Inc. | | | 926,194 | |
| | 3,167 | | | | | Olympus Corp. | | | 61,034 | |
| | 11,000 | | | | | Ricoh Co., Ltd. | | | 118,382 | |
| | 8,486 | | | | | Seven & I Holdings Co., Ltd. | | | 238,270 | |
| | 12,000 | | | | | Sharp Corp. | | | 85,647 | |
| | 6,000 | | | | | Shin-Etsu Chemical Co., Ltd. | | | 318,933 | |
| | 8,033 | | | | | Sony Corp. | | | 190,385 | |
| | 13,200 | | | | | Suzuki Motor Corp. | | | 193,701 | |
| | 10,300 | | | | | Takeda Pharmaceutical Co., Ltd. | | | 511,758 | |
| | 99,000 | | | S | | Toyota Motor Corp. | | | 3,866,041 | |
| | 3,310 | | | | | Yamada Denki Co., Ltd. | | | 180,164 | |
| | | | | | | | | | | |
| | | | | | | | | | | | | | 17,717,904 | |
| | | | | | | | | | | | | | | |
| | | | | | | |
| | | | | | | Luxembourg: 0.1% |
| | 16,369 | | | @ | | Arcelor | | | 425,748 | |
| | | | | | | | | | | |
| | | | | | | | | | | | | | 425,748 | |
| | | | | | | | | | | | | | | |
| | | | | | | |
| | | | | | | Mexico: 0.0% |
| | 45,023 | | | | | Grupo Cementos Chihuahua | | | 118,930 | |
| | | | | | | | | | | |
| | | | | | | | | | | | | | 118,930 | |
| | | | | | | | | | | | | | | |
| | | | | | | |
| | | | | | | Netherlands: 5.5% |
| | 28,389 | | | | | Aegon NV | | | 117,961 | |
| | 23,463 | | | | | Heineken NV | | | 791,483 | |
| | 22,135 | | | | | Koninklijke Philips Electronics NV | | | 409,051 | |
| | 16,734 | | | | | Reed Elsevier NV | | | 223,668 | |
| | 255,018 | | | @ | | Royal Dutch Shell PLC | | | 7,068,326 | |
| | 144,452 | | | | | Royal KPN NV | | | 2,034,347 | |
| | 7,518 | | | | | TNT NV | | | 158,660 | |
| | 325,658 | | | | | Unilever NV | | | 7,848,193 | |
| | | | | | | | | | | |
| | | | | | | | | | | | | | 18,651,689 | |
| | | | | | | | | | | | | | | |
| | | | | | | |
| | | | | | | New Zealand: 0.2% |
| | 495,417 | | | | | Auckland International Airport Ltd. | | | 530,296 | |
| | | | | | | | | | | |
| | | | | | | | | | | | | | 530,296 | |
| | | | | | | | | | | | | | | |
| | | | | | | |
| | | | | | | Poland: 3.4% |
| | 4,534 | | | @ | | Bank BPH | | | 73,952 | |
| | 45,482 | | | | | Bank Handlowy w Warszawie | | | 733,682 | |
| | 115,991 | | | | | Bank Pekao SA | | | 5,275,413 | |
| | 334,129 | | | | | Powszechna Kasa Oszczednosci Bank Polski SA | | | 3,774,929 | |
| | 243,771 | | | | | Telekomunikacja Polska SA | | | 1,841,975 | |
| | | | | | | | | | | |
| | | | | | | | | | | | | | 11,699,951 | |
| | | | | | | | | | | | | | | |
| | | | | | | |
| | | | | | | Portugal: 0.1% |
| | 68,109 | | | | | Energias de Portugal SA | | | 231,986 | |
| | | | | | | | | | | |
| | | | | | | | | | | | | | 231,986 | |
| | | | | | | | | | | | | | | |
| | | | | | | |
| | | | | | | Romania: 0.3% |
| | 198,352 | | | | | Romanian Bank for Development SA | | | 524,855 | |
| | 5,988,667 | | | | | SNP Petrom SA | | | 338,608 | |
| | | | | | | | | | | |
| | | | | | | | | | | | | | 863,463 | |
| | | | | | | | | | | | | | | |
| | | | | | | |
| | | | | | | Russia: 0.2% |
| | 35 | | | I | | Deutsche Bank AG, London (Pending Spin-off of Unified Energy Sys- REG S GDR) | | | 52,786 | |
| | 35 | | | I | | Deutsche Bank AG, London (Pending Spin-off of Unified Energy Sys- REG S GDR) | | | 6,063 | |
| | 35 | | | | | Deutsche Bank AG, London (Pending Spin-off of Unified Energy Sys- REG S GDR) | | | — | |
| | 70,735 | | | @,#,I | | Federal Grid Co Unitied Energy System JSC GDR | | | 109,745 | |
| | 14,630 | | | @,#,I | | Inter Rao Ues OAO GDR | | | 31,345 | |
| | 4,865 | | | @,#,I | | Kusbassenergo OJSC — Spon GDR | | | 8,087 | |
| | 23,485 | | | @,#,I | | Mosenerga OAO — Spon GDR | | | 37,001 | |
| | 67,340 | | | @,#,I | | Wholesale Power-1 OAO GDR | | | 24,876 | |
| | 17,500 | | | @,#,I | | Wholesale Power-2 OAO GDR | | | 17,907 | |
| | 28,770 | | | @,#,I | | Wholesale Power-3 OJSC — Spon GDR | | | 18,439 | |
| | 20,405 | | | @,#,I | | Wholesale Power-6 OAO GDR | | | 18,467 | |
| | 200 | | | @,I | | Open Investments | | | 7,887 | |
| | 3,500,000 | | | @ | | RAO Energy System of East OAO | | | 3,850 | |
| | 45,519 | | | @,#,L | | Sistema-Hals GDR | | | 13,656 | |
| | 11,690 | | | @,#,I | | Territorial Generating Co. — Spon GDR | | | 11,228 | |
| | 1,120 | | | @,#,I | | Territorial Generating Co. 14 JSC — Spon GDR | | | 2,358 | |
| | 26,740 | | | @,#,I | | Territorial Generating Co.-1 — Spon GDR | | | 14,817 | |
| | 4,515 | | | @,#,I | | Territorial Generating Co.-2 — Spon GDR | | | 9,840 | |
See Accompanying Notes to Financial Statements
194
PORTFOLIO OF INVESTMENTS
ING Foreign Fund
as of October 31, 2008 (continued)
| | | | | | | | | | | | | | | |
| Shares | | | | | | | | Value |
| |
| |
| | | | | | | Russia (continued) |
| | 11,095 | | | @,#,I | | Territorial Generating Co.-4 — Spon GDR | | $ | 21,722 | |
| | 11,760 | | | @,#,I | | Territorial Generating Co.-9 — Spon GDR | | | 12,164 | |
| | 6,550 | | | @,I | | Wimm-Bill-Dann Foods — Class S | | | 85,150 | |
| | 12,040 | | | @,#,I | | Yenisei Territorial — Spon GDR | | | 8,829 | |
| | | | | | | | | | | |
| | | | | | | | | | | | | | 516,217 | |
| | | | | | | | | | | | | | | |
| | | | | | | |
| | | | | | | Spain: 1.9% |
| | 84,522 | | | @ | | EDP Renovaveis SA | | | 434,049 | |
| | 46,799 | | | @ | | Iberdrola Renovables | | | 142,374 | |
| | 291,358 | | | | | Iberdrola SA | | | 2,108,660 | |
| | 10,634 | | | | | Inditex SA | | | 359,456 | |
| | 189,090 | | | | | Telefonica SA | | | 3,500,992 | |
| | | | | | | | | | | |
| | | | | | | | | | | | | | 6,545,531 | |
| | | | | | | | | | | | | | | |
| | | | | | | |
| | | | | | | Sweden: 0.4% |
| | 28,188 | | | | | Getinge AB | | | 394,242 | |
| | 10,262 | | | | | Hennes & Mauritz AB | | | 367,989 | |
| | 67,837 | | | | | Svenska Cellulosa AB — B Shares | | | 500,935 | |
| | 40,210 | | | | | TeliaSonera AB | | | 176,911 | |
| | | | | | | | | | | |
| | | | | | | | | | | | | | 1,440,077 | |
| | | | | | | | | | | | | | | |
| | | | | | | |
| | | | | | | Switzerland: 8.5% |
| | 33,022 | | | @ | | ABB Ltd. | | | 433,285 | |
| | 5,048 | | | | | BKW FMB Energie AG | | | 456,326 | |
| | 26,963 | | | | | Compagnie Financiere Richemont SA | | | 566,834 | |
| | 3,144 | | | | | Flughafen Zuerich AG | | | 837,701 | |
| | 24,314 | | | | | Holcim Ltd. | | | 1,381,017 | |
| | 250,910 | | | | | Nestle SA | | | 9,757,141 | |
| | 7,125 | | | | | Nobel Biocare Holding AG | | | 122,398 | |
| | 141,118 | | | | | Novartis AG | | | 7,162,870 | |
| | 47,730 | | | | | Roche Holding AG | | | 7,299,198 | |
| | 4,204 | | | | | Swatch Group AG — BR | | | 656,009 | |
| | 2,495 | | | | | Synthes, Inc. | | | 321,961 | |
| | | | | | | | | | | |
| | | | | | | | | | | | | | 28,994,740 | |
| | | | | | | | | | | | | | | |
| | | | | | | |
| | | | | | | Taiwan: 0.0% |
| | 589 | | | | | Cathay Financial Holding Co., Ltd. GDR | | | 6,288 | |
| | | | | | | | | | | |
| | | | | | | | | | | | | | 6,288 | |
| | | | | | | | | | | | | | | |
| | | | | | | |
| | | | | | | Ukraine: 0.3% |
| | 5,090,724 | | | @ | | JSCB Ukrsotsbank | | | 199,501 | |
| | 3,938,839 | | | @ | | Raiffeisen Bank Aval | | | 160,348 | |
| | 11,482 | | | @ | | Ukrnafta Oil Co. ADR | | | 188,134 | |
| | 10,545,713 | | | | | UkrTelecom | | | 552,225 | |
| | | | | | | | | | | |
| | | | | | | | | | | | | | 1,100,208 | |
| | | | | | | | | | | | | | | |
| | | | | | | |
| | | | | | | United Kingdom: 12.0% |
| | 51,146 | | | | | BHP Billiton PLC | | | 868,486 | |
| | 431,019 | | | | | BP PLC | | | 3,513,441 | |
| | 66,100 | | | | | British American Tobacco PLC | | | 1,813,075 | |
| | 392,988 | | | | | Cadbury PLC | | | 3,592,339 | |
| | 244,824 | | | S | | Diageo PLC | | | 3,736,137 | |
| | 345,112 | | | | | GlaxoSmithKline PLC | | | 6,634,412 | |
| | 85,421 | | | | | Imperial Tobacco Group PLC | | | 2,289,411 | |
| | 112,411 | | | | | National Grid PLC | | | 1,266,322 | |
| | 6,040 | | | | | Peter Hambro Mining PLC | | | 20,011 | |
| | 22,644 | | | | | Reckitt Benckiser PLC | | | 957,836 | |
| | 22,380 | | | | | Rio Tinto PLC | | | 1,045,417 | |
| | 77,388 | | | @ | | Rolls-Royce Group PLC | | | 409,453 | |
| | 4,426,594 | | | @ | | Rolls-Royce Group PLC — B Shares Entitlement | | | 7,124 | |
| | 37,443 | | | | | Scottish & Southern Energy PLC | | | 733,946 | |
| | 294,637 | | | | | Smith & Nephew PLC | | | 2,697,793 | |
| | 968,972 | | | | | Tesco PLC | | | 5,309,100 | |
| | 2,402,350 | | | S | | Vodafone Group PLC | | | 4,621,434 | |
| | 300,328 | | | | | WM Morrison Supermarkets PLC | | | 1,278,777 | |
| | 39,828 | | | | | WPP Group PLC | | | 238,241 | |
| | | | | | | | | | | |
| | | | | | | | | | | | | | 41,032,755 | |
| | | | | | | | | | | | | | | |
| | | | | | | |
| | | | | | | United States: 0.1% |
| | 9,771 | | | @ | | Dr Pepper Snapple Group, Inc. | | | 223,756 | |
| | | | | | | | | | | |
| | | | | | | | | | | | | | 223,756 | |
| | | | | | | | | | | | | | | |
| | | | | | | Total Common Stock
(Cost $321,474,645) | | | 277,866,511 | |
| | | | | | | | | | | |
| |
EXCHANGE-TRADED FUNDS: 8.2% |
| | | | | | | |
| | | | | | | France: 4.9% |
| | 664,710 | | | | | Lyxor ETF DJ Stoxx 600 Banks | | | 16,859,416 | |
| | | | | | | | | | | |
| | | | | | | | | | | | | | | |
| | | | | | | | | | | | | | 16,859,416 | |
| | | | | | | | | | | | | | | |
| | | | | | | |
| | | | | | | Hong Kong: 2.2% |
| | 4,066,000 | | | | | Tracker Fund of Hong Kong | | | 7,344,985 | |
| | | | | | | | | | | |
| | | | | | | | | | | | | | 7,344,985 | |
| | | | | | | | | | | | | | | |
| | | | | | | |
| | | | | | | South Korea: 1.1% |
| | 132,149 | | | | | iShares MSCI South Korea Index Fund | | | 3,718,673 | |
| | | | | | | | | | | |
| | | | | | | | | | | | | | 3,718,673 | |
| | | | | | | | | | | | | | | |
| | | | | | | Total Exchange-Traded Funds
(Cost $26,863,981) | | | 27,923,074 | |
| | | | | | | | | | | |
| |
MUTUAL FUNDS: 0.0% |
| | | | | | | |
| | | | | | | Russia: 0.0% |
| | 82,957 | | | @ | | RenShares Utilities Ltd. | | | 100,378 | |
| | | | | | | | | | | |
| | | | | | | Total Mutual Funds
(Cost $131,939) | | | 100,378 | |
| | | | | | | | | | | |
| |
PREFERRED STOCK: 0.1% |
| | | | | | | |
| | | | | | | Russia: 0.1% |
| | 1,897 | | | I | | Silvinit BRD | | | 369,915 | |
| | 141,747 | | | I | | URSA Bank | | | 25,514 | |
| | | | | | | | | | | |
| | | | | | | Total Preferred Stock
(Cost $868,094) | | | 395,429 | |
| | | | | | | | | | | |
| | | | | | | Total Long-Term Investments
(Cost $349,338,659) | | | 306,285,392 | |
| | | | | | | | | | | |
| |
SHORT-TERM INVESTMENTS: 6.7% |
| | | | | | | |
| | | | | | | Affiliated Mutual Fund: 4.5% |
| | 15,469,336 | | | | | ING Institutional Prime Money Market Fund | | | 15,469,336 | |
| | | | | | | | | | | |
| | | | | | | Total Mutual Fund
(Cost $15,469,336) | | | 15,469,336 | |
| | | | | | | | | | | |
Principal
| | | | | | | | |
| Amount | | | | | | | | Value |
| |
| |
| | | | | | | |
| | | | | | | Securities Lending CollateralCC: 2.2% |
| $ | 7,602,351 | | | | | Bank of New York Mellon Corp. Institutional Cash Reserves | | $ | 7,449,055 | |
| | | | | | | | | | | |
| | | | | | | Total Securities Lending Collateral
(Cost $7,602,351) | | | 7,449,055 | |
| | | | | | | | | | | |
| | | | | | | Total Short-Term Investments
(Cost $23,071,687) | | | 22,918,391 | |
| | | | | | | | | | | |
| | | | | Total Investments in Securities |
| | | | | (Cost $372,410,346)* | | | 96.6 | % | | $ | 329,203,783 | |
| | | | | Other Assets and
Liabilities - Net | | | 3.4 | | | | 11,530,025 | |
| | | | | | | | | | | | | |
| | | | | Net Assets | | | 100.0 | % | | $ | 340,733,808 | |
| | | | | | | | | | | | | |
See Accompanying Notes to Financial Statements
195
PORTFOLIO OF INVESTMENTS
ING Foreign Fund
as of October 31, 2008 (continued)
| | | |
| @ | | Non-income producing security |
| ADR | | American Depositary Receipt |
| GDR | | Global Depositary Receipt |
| # | | Securities with purchases pursuant to Rule 144A or section 4(2), under the Securities Act of 1933 and may not be resold subject to that rule except to qualified institutional buyers. Unless otherwise noted, these securities have been determined to be liquid under the guidelines established by the Funds’ Board of Directors/Trustees. |
| cc | | Securities purchased with cash collateral for securities loaned. |
| I | | Illiquid Security |
| S | | All or a portion of this security is segregated to cover collateral requirements for applicable futures, options, swaps, foreign forward currency contracts and/or when-issued or delayed-delivery securities. |
| L | | Loaned security, a portion or all of the security is on loan at October 31, 2008. |
| | | |
| * | | Cost for federal income tax purposes is $400,024,429. |
| | | |
| | | Net unrealized depreciation consists of: |
| | | | | |
| Gross Unrealized Appreciation | | $ | 10,918,817 | |
| Gross Unrealized Depreciation | | | (81,739,463 | ) |
| | | | | |
| Net Unrealized Depreciation | | $ | (70,820,646 | ) |
| | | | | |
| | | | | |
| | | Percentage of
|
| Industry | | Net Assets |
|
| |
| Aerospace/Defense | | | 0.1 | % |
| Agriculture | | | 1.4 | |
| Apparel | | | 0.0 | |
| Auto Manufacturers | | | 1.9 | |
| Auto Parts & Equipment | | | 0.2 | |
| Banks | | | 8.7 | |
| Beverages | | | 1.4 | |
| Building Materials | | | 1.5 | |
| Chemicals | | | 1.8 | |
| Computers | | | 0.1 | |
| Cosmetics/Personal Care | | | 0.4 | |
| Distribution/Wholesale | | | 0.1 | |
| Diversified Financial Services | | | 0.1 | |
| Electric | | | 6.0 | |
| Electrical Components & Equipment | | | 0.2 | |
| Electronics | | | 0.2 | |
| Energy — Alternate Sources | | | 0.2 | |
| Engineering & Construction | | | 2.7 | |
| Food | | | 10.5 | |
| Forest Products & Paper | | | 0.4 | |
| Gas | | | 1.9 | |
| Healthcare — Products | | | 1.5 | |
| Healthcare — Services | | | 1.3 | |
| Hedge Fund | | | 0.0 | |
| Holding Companies — Diversified | | | 0.9 | |
| Home Furnishings | | | 0.3 | |
| Household Products/Wares | | | 0.3 | |
| Insurance | | | 0.8 | |
| Investment Companies | | | 0.1 | |
| Iron/Steel | | | 0.1 | |
| Lodging | | | 0.1 | |
| Machinery — Construction & Mining | | | 0.1 | |
| Machinery — Diversified | | | 0.2 | |
| Media | | | 1.1 | |
| Mining | | | 2.1 | |
| Miscellaneous Manufacturing | | | 0.8 | |
| Office/Business Equipment | | | 0.3 | |
| Oil & Gas | | | 9.1 | |
| Pharmaceuticals | | | 10.2 | |
| Real Estate | | | 0.1 | |
| Retail | | | 1.0 | |
| Software | | | 0.3 | |
| Telecommunications | | | 10.0 | |
| Toys/Games/Hobbies | | | 0.3 | |
| Transportation | | | 0.8 | |
| Water | | | 0.1 | |
| Other Long-Term Investments | | | 8.2 | |
| Short-Term Investments | | | 6.7 | |
| Other Assets and Liabilities — Net | | | 3.4 | |
| | | | | |
Net Assets | | | 100.0 | % |
| | | | | |
At October 31, 2008 the following forward foreign currency contracts were outstanding for the ING Foreign Fund:
| | | | | | | | | | | | | | | | | | | | | |
| | | | | | | In
| | | | Unrealized
|
| | | | | Settlement
| | Exchange
| | | | Appreciation
|
Currency | | Buy/Sell | | Date | | For | | Value | | (Depreciation) |
| | | | | | | USD | | | | |
| |
Australian Dollar
AUD 9,494,143 | | | BUY | | | | 11/7/08 | | | | 6,237,462 | | | | 6,304,895 | | | $ | 67,433 | |
Australian Dollar
AUD 3,680,817 | | | BUY | | | | 1/29/09 | | | | 2,258,844 | | | | 2,427,099 | | | | 168,255 | |
Canadian Dollar
CAD 22,756,144 | | | BUY | | | | 11/6/08 | | | | 18,324,390 | | | | 18,878,813 | | | | 554,423 | |
Canadian Dollar
CAD 1,704,642 | | | BUY | | | | 12/22/08 | | | | 1,609,292 | | | | 1,414,327 | | | | (194,965 | ) |
Czech Koruna
CZK 51,326,863 | | | BUY | | | | 12/9/08 | | | | 2,959,259 | | | | 2,723,472 | | | | (235,787 | ) |
Czech Koruna
CZK 28,389,217 | | | BUY | | | | 12/9/08 | | | | 1,435,975 | | | | 1,506,370 | | | | 70,395 | |
Czech Koruna
CZK 22,442,721 | | | BUY | | | | 12/9/08 | | | | 1,153,867 | | | | 1,190,841 | | | | 36,974 | |
Czech Koruna
CZK 5,596,257 | | | BUY | | | | 12/9/08 | | | | 288,467 | | | | 296,945 | | | | 8,478 | |
Czech Koruna
CZK 54,550,605 | | | BUY | | | | 12/9/08 | | | | 2,828,141 | | | | 2,894,528 | | | | 66,387 | |
Czech Koruna
CZK 72,372,501 | | | BUY | | | | 12/9/08 | | | | 3,840,409 | | | | 3,840,182 | | | | (227 | ) |
Czech Koruna
CZK 12,308,990 | | | BUY | | | | 10/27/09 | | | | 666,071 | | | | 650,081 | | | | (15,990 | ) |
EU Euro
EUR 7,035,719 | | | BUY | | | | 12/2/08 | | | | 10,418,070 | | | | 8,956,774 | | | | (1,461,296 | ) |
EU Euro
EUR 4,778,731 | | | BUY | | | | 12/2/08 | | | | 6,153,332 | | | | 6,083,530 | | | | (69,802 | ) |
EU Euro
EUR 17,876,553 | | | BUY | | | | 12/8/08 | | | | 26,313,929 | | | | 22,755,944 | | | | (3,557,985 | ) |
EU Euro
EUR 4,965,386 | | | BUY | | | | 12/8/08 | | | | 6,173,946 | | | | 6,320,684 | | | | 146,738 | |
EU Euro
EUR 2,824,525 | | | BUY | | | | 12/8/08 | | | | 3,627,820 | | | | 3,595,477 | | | | (32,343 | ) |
EU Euro
EUR 15,322,681 | | | BUY | | | | 12/8/08 | | | | 19,849,768 | | | | 19,504,995 | | | | (344,773 | ) |
EU Euro
EUR 623,190 | | | BUY | | | | 12/8/08 | | | | 800,612 | | | | 793,289 | | | | (7,323 | ) |
EU Euro
EUR 3,442,896 | | | BUY | | | | 12/8/08 | | | | 4,426,531 | | | | 4,382,631 | | | | (43,900 | ) |
British Pound
GBP 7,812,924 | | | BUY | | | | 11/7/08 | | | | 12,649,904 | | | | 12,568,239 | | | | (81,665 | ) |
Japanese Yen
JPY 390,512,085 | | | BUY | | | | 11/4/08 | | | | 3,634,530 | | | | 3,964,753 | | | | 330,223 | |
Japanese Yen
JPY 2,658,780,768 | | | BUY | | | | 11/10/08 | | | | 24,618,340 | | | | 26,999,589 | | | | 2,381,249 | |
Japanese Yen
JPY 390,512,085 | | | BUY | | | | 12/29/08 | | | | 4,180,176 | | | | 3,975,917 | | | | (204,259 | ) |
South Korean Won
KRW 858,097,223 | | | BUY | | | | 11/4/08 | | | | 846,751 | | | | 665,185 | | | | (181,566 | ) |
South Korean Won
KRW 1,421,138,145 | | | BUY | | | | 12/4/08 | | | | 1,271,143 | | | | 1,107,368 | | | | (163,775 | ) |
Mexican Peso
MXN 19,657,329 | | | BUY | | | | 11/21/08 | | | | 1,836,739 | | | | 1,518,078 | | | | (318,661 | ) |
Mexican Peso
MXN 5,276,722 | | | BUY | | | | 11/21/08 | | | | 428,122 | | | | 407,506 | | | | (20,616 | ) |
Mexican Peso
MXN 6,418,885 | | | BUY | | | | 11/21/08 | | | | 535,152 | | | | 495,712 | | | | (39,440 | ) |
Mexican Peso
MXN 4,919,886 | | | BUY | | | | 11/21/08 | | | | 359,588 | | | | 379,948 | | | | 20,360 | |
Polish Zloty
PLN 3,000,784 | | | BUY | | | | 11/19/08 | | | | 973,885 | | | | 1,082,793 | | | | 108,908 | |
Polish Zloty
PLN 9,674,567 | | | BUY | | | | 11/19/08 | | | | 3,158,217 | | | | 3,490,937 | | | | 332,720 | |
Polish Zloty
PLN 3,651,867 | | | BUY | | | | 12/9/08 | | | | 1,415,233 | | | | 1,315,932 | | | | (99,301 | ) |
Polish Zloty
PLN 1,030,981 | | | BUY | | | | 12/9/08 | | | | 411,405 | | | | 371,509 | | | | (39,896 | ) |
Polish Zloty
PLN 6,649,028 | | | BUY | | | | 12/9/08 | | | | 2,162,497 | | | | 2,395,944 | | | | 233,447 | |
Polish Zloty
PLN 9,913,949 | | | BUY | | | | 12/9/08 | | | | 3,358,759 | | | | 3,572,442 | | | | 213,683 | |
See Accompanying Notes to Financial Statements
196
PORTFOLIO OF INVESTMENTS
ING Foreign Fund
as of October 31, 2008 (continued)
| | | | | | | | | | | | | | | | | | | | | |
| | | | | | | In
| | | | Unrealized
|
| | | | | Settlement
| | Exchange
| | | | Appreciation
|
Currency | | Buy/Sell | | Date | | For | | Value | | (Depreciation) |
| | | | | | | USD | | | | |
| |
Polish Zloty
PLN 2,603,615 | | | BUY | | | | 12/9/08 | | | | 922,940 | | | | 938,200 | | | | 15,260 | |
Polish Zloty
PLN 23,810,938 | | | BUY | | | | 12/9/08 | | | | 8,440,602 | | | | 8,580,153 | | | | 139,551 | |
Polish Zloty
PLN 6,649,028 | | | BUY | | | | 10/20/09 | | | | 2,487,302 | | | | 2,381,960 | | | | (105,342 | ) |
Polish Zloty
PLN 12,744,984 | | | BUY | | | | 11/19/09 | | | | 4,714,975 | | | | 4,565,787 | | | | (149,188 | ) |
| | | | | | | | | | | | | | | | | | | | | |
| | | | | | | | | | | | | | | | | | | $ | (2,473,616 | ) |
| | | | | | | | | | | | | | | | | | | | | |
Canadian Dollar
CAD 1,704,642 | | | SELL | | | | 12/22/08 | | | | 1,606,183 | | | | 1,414,327 | | | $ | 191,856 | |
Czech Koruna
CZK 137,540,223 | | | SELL | | | | 12/9/08 | | | | 7,879,252 | | | | 7,298,069 | | | | 581,183 | |
Czech Koruna
CZK 103,945,975 | | | SELL | | | | 12/9/08 | | | | 5,911,496 | | | | 5,515,513 | | | | 395,983 | |
Czech Koruna
CZK 15,295,317 | | | SELL | | | | 1/14/09 | | | | 829,104 | | | | 809,963 | | | | 19,141 | |
Czech Koruna
CZK 15,202,458 | | | SELL | | | | 1/14/09 | | | | 829,104 | | | | 805,045 | | | | 24,059 | |
Czech Koruna
CZK 4,088,610 | | | SELL | | | | 1/21/09 | | | | 217,624 | | | | 216,378 | | | | 1,246 | |
Czech Koruna
CZK 4,735,251 | | | SELL | | | | 4/20/09 | | | | 253,033 | | | | 250,119 | | | | 2,914 | |
Czech Koruna
CZK 3,042,813 | | | SELL | | | | 7/14/09 | | | | 165,821 | | | | 160,702 | | | | 5,119 | |
Czech Koruna
CZK 3,054,420 | | | SELL | | | | 10/14/09 | | | | 165,821 | | | | 161,315 | | | | 4,506 | |
Czech Koruna
CZK 28,781,239 | | | SELL | | | | 10/27/09 | | | | 1,435,975 | | | | 1,520,037 | | | | (84,062 | ) |
Czech Koruna
CZK 22,736,958 | | | SELL | | | | 10/27/09 | | | | 1,153,867 | | | | 1,200,818 | | | | (46,951 | ) |
Czech Koruna
CZK 5,668,374 | | | SELL | | | | 10/27/09 | | | | 288,467 | | | | 299,367 | | | | (10,900 | ) |
EU Euro
EUR 11,814,449 | | | SELL | | | | 12/2/08 | | | | 17,221,686 | | | | 15,040,304 | | | | 2,181,382 | |
EU Euro
EUR 19,388,767 | | | SELL | | | | 12/8/08 | | | | 27,857,199 | | | | 24,680,916 | | | | 3,176,283 | |
EU Euro
EUR 20,701,078 | | | SELL | | | | 12/8/08 | | | | 29,579,460 | | | | 26,351,421 | | | | 3,228,039 | |
EU Euro
EUR 9,599,567 | | | SELL | | | | 12/8/08 | | | | 13,878,814 | | | | 12,219,761 | | | | 1,659,053 | |
EU Euro
EUR 8,116,698 | | | SELL | | | | 12/8/08 | | | | 11,370,844 | | | | 10,332,144 | | | | 1,038,700 | |
EU Euro
EUR 18,275,099 | | | SELL | | | | 4/21/09 | | | | 24,457,566 | | | | 23,214,942 | | | | 1,242,624 | |
Japanese Yen
JPY 390,512,085 | | | SELL | | | | 11/4/08 | | | | 4,164,130 | | | | 3,964,753 | | | | 199,377 | |
Japanese Yen
JPY 513,652,561 | | | SELL | | | | 11/10/08 | | | | 4,794,442 | | | | 5,216,078 | | | | (421,636 | ) |
Japanese Yen
JPY 779,914,680 | | | SELL | | | | 11/10/08 | | | | 7,601,545 | | | | 7,919,937 | | | | (318,392 | ) |
Japanese Yen
JPY 227,522,792 | | | SELL | | | | 11/10/08 | | | | 2,391,704 | | | | 2,310,466 | | | | 81,238 | |
Japanese Yen
JPY 390,512,085 | | | SELL | | | | 12/29/08 | | | | 4,116,286 | | | | 3,975,917 | | | | 140,369 | |
South Korean Won
KRW 858,097,223 | | | SELL | | | | 11/4/08 | | | | 753,874 | | | | 665,185 | | | | 88,689 | |
South Korean Won
KRW 1,421,138,145 | | | SELL | | | | 12/4/08 | | | | 1,248,145 | | | | 1,107,368 | | | | 140,777 | |
Mexican Peso
MXN 36,272,822 | | | SELL | | | | 11/21/08 | | | | 3,513,957 | | | | 2,801,243 | | | | 712,714 | |
Polish Zloty
PLN 12,675,351 | | | SELL | | | | 11/19/08 | | | | 5,556,688 | | | | 4,573,730 | | | | 982,958 | |
Polish Zloty
PLN 23,655,611 | | | SELL | | | | 12/9/08 | | | | 9,751,232 | | | | 8,524,182 | | | | 1,227,050 | |
Polish Zloty
PLN 12,671,672 | | | SELL | | | | 12/9/08 | | | | 5,146,483 | | | | 4,566,174 | | | | 580,309 | |
Polish Zloty
PLN 6,649,028 | | | SELL | | | | 12/9/08 | | | | 2,684,402 | | | | 2,395,944 | | | | 288,458 | |
Polish Zloty
PLN 7,524,351 | | | SELL | | | | 12/9/08 | | | | 3,045,186 | | | | 2,711,363 | | | | 333,823 | |
Polish Zloty
PLN 6,649,028 | | | SELL | | | | 10/20/09 | | | | 2,120,564 | | | | 2,381,960 | | | | (261,396 | ) |
Polish Zloty
PLN 3,070,417 | | | SELL | | | | 11/19/09 | | | | 973,886 | | | | 1,099,952 | | | | (126,066 | ) |
Polish Zloty
PLN 9,674,567 | | | SELL | | | | 11/19/09 | | | | 3,086,184 | | | | 3,465,835 | | | | (379,651 | ) |
| | | | | | | | | | | | | | | | | | | | | |
| | | | | | | | | | | | | | | | | | | $ | 16,878,796 | |
| | | | | | | | | | | | | | | | | | | | | |
See Accompanying Notes to Financial Statements
197
PORTFOLIO OF INVESTMENTS
ING Greater China Fund
as of October 31, 2008
| | | | | | | | | | | | | | | |
| Shares | | | | | | | | Value |
| |
| |
| |
COMMON STOCK: 97.1% |
| | | | | | | |
| | | | | | | China: 25.0% |
| | 229,000 | | | | | China Coal Energy Co. — Shares H | | $ | 138,890 | |
| | 167,000 | | | | | China COSCO Holdings Co., Ltd. | | | 89,966 | |
| | 263,000 | | | | | China High Speed Transmission Equipment Group Co., Ltd. | | | 159,496 | |
| | 456,000 | | | | | China Life Insurance Co., Ltd. | | | 1,218,612 | |
| | 440,000 | | | | | China Petroleum & Chemical Corp. | | | 288,933 | |
| | 161,500 | | | | | China Shenhua Energy Co., Ltd. | | | 306,621 | |
| | 1,956,000 | | | | | China Shipping Container Lines Co., Ltd. | | | 217,052 | |
| | 1,428,000 | | | | | China Telecom Corp., Ltd. | | | 508,229 | |
| | 490,020 | | | | | China Vanke Co., Ltd. | | | 289,597 | |
| | 900,000 | | | | | Fujian Zijin Mining Industry Co., Ltd. | | | 267,095 | |
| | 480,800 | | | | | Guangzhou R&F Properties Co., Ltd. | | | 231,038 | |
| | 1,906,000 | | | | | Industrial and Commercial Bank of China Ltd. | | | 896,812 | |
| | 624,000 | | | | | Jiangsu Expressway Co., Ltd. | | | 436,460 | |
| | 1,102,000 | | | | | PetroChina Co., Ltd. | | | 828,584 | |
| | 80,000 | | | | | Ping An Insurance Group Co. of China Ltd. | | | 342,138 | |
| | 451,000 | | | | | Travelsky Technology Ltd. | | | 108,515 | |
| | | | | | | | | | | |
| | | | | | | | | | | | | | 6,328,038 | |
| | | | | | | | | | | | | | | |
| | | | | | | |
| | | | | | | Hong Kong: 47.6% |
| | 1,026,000 | | | | | Agile Property Holdings Ltd. | | | 340,920 | |
| | 89,000 | | | | | Cheung Kong Holdings Ltd. | | | 854,536 | |
| | 288,500 | | | | | China Mobile Ltd. | | | 2,539,757 | |
| | 812,000 | | | | | China Overseas Land & Investment Ltd. | | | 916,965 | |
| | 312,000 | | | | | China Resources Land Ltd. | | | 315,821 | |
| | 482,000 | | | | | China Unicom Ltd. | | | 684,125 | |
| | 494,000 | | | | | Chow Sang Sang Holdings International Ltd. | | | 220,198 | |
| | 2,921,000 | | | I | | Chuang’s China Investments | | | 26,647 | |
| | 93,000 | | | | | CLP Holdings Ltd. | | | 627,189 | |
| | 1,052,000 | | | | | CNOOC Ltd. | | | 863,776 | |
| | 76,500 | | | | | Esprit Holdings Ltd. | | | 434,680 | |
| | 43,100 | | | | | Hang Seng Bank Ltd. | | | 537,780 | |
| | 90,900 | | | | | Hong Kong Exchanges and Clearing Ltd. | | | 921,800 | |
| | 170,000 | | | | | Hutchison Whampoa Ltd. | | | 918,658 | |
| | 370,000 | | | | | Hysan Development Co., Ltd. | | | 580,183 | |
| | 380,500 | | | | | MTR Corp. | | | 843,162 | |
| | 48,000 | | | | | Sun Hung Kai Properties Ltd. | | | 420,533 | |
| | | | | | | | | | | |
| | | | | | | | | | | | | | 12,046,730 | |
| | | | | | | | | | | | | | | |
| | | | | | | |
| | | | | | | Taiwan: 24.5% |
| | 1,370,998 | | | | | AU Optronics Corp. | | | 957,323 | |
| | 246,750 | | | | | Cathay Financial Holding Co., Ltd. | | | 265,007 | |
| | 670,340 | | | | | Chunghwa Telecom Co., Ltd. | | | 1,109,098 | |
| | 684,280 | | | | | Far Eastern Textile Co., Ltd. | | | 397,162 | |
| | 124,200 | | | | | Hon Hai Precision Industry Co., Ltd. — GDR | | | 606,663 | |
| | 119,600 | | | | | Huang Hsiang Construction Co. | | | 46,012 | |
| | 81,365 | | | | | MediaTek, Inc. | | | 728,656 | |
| | 613,742 | | | | | Radium Life Tech Co., Ltd. | | | 222,121 | |
| | 38,987 | | | @ | | Taiwan Basket (Issuer: Deutsche Bank AG London) | | | 152,829 | |
| | 321,180 | | | | | Taiwan Cement Corp. | | | 164,921 | |
| | 285,000 | | | | | Taiwan Fertilizer Co., Ltd. | | | 351,687 | |
| | 635,512 | | | | | Taiwan Semiconductor Manufacturing Co., Ltd. | | | 924,706 | |
| | 16,921 | | | | | Taiwan Semiconductor Manufacturing Co., Ltd. ADR | | | 139,767 | |
| | 120,400 | | | # | | Wintek Corp. GDR | | | 150,945 | |
| | | | | | | | | | | |
| | | | | | | | | | | | | | 6,216,897 | |
| | | | | | | | | | | | | | | |
| | | | | | | Total Common Stock
(Cost $39,182,050) | | | 24,591,665 | |
| | | | | | | | | | | |
| |
REAL ESTATE INVESTMENT TRUSTS: 2.6% |
| | | | | | | |
| | | | | | | Hong Kong: 2.6% |
| | 360,000 | | | | | Link Real Estate Investment Trust | | | 643,686 | |
| | | | | | | | | | | |
| | | | | | | Total Real Estate Investment Trusts
(Cost $823,764) | | | 643,686 | |
| | | | | | | | | | | |
| | | | | Total Investments in Securities |
| | | | | (Cost $40,005,814)* | | | 99.7 | % | | $ | 25,235,351 | |
| | | | | Other Assets and
Liabilities - Net | | | 0.3 | | | | 85,249 | |
| | | | | | | | | | | | | |
| | | | | Net Assets | | | 100.0 | % | | $ | 25,320,600 | |
| | | | | | | | | | | | | |
| | | |
| @ | | Non-income producing security |
| ADR | | American Depositary Receipt |
| GDR | | Global Depositary Receipt |
| I | | Illiquid Security |
| # | | Securities with purchases pursuant to Rule 144A or section 4(2), under the Securities Act of 1933 and may not be resold subject to that rule except to qualified institutional buyers. Unless otherwise noted, these securities have been determined to be liquid under the guidelines established by the Funds’ Board of Directors/Trustees. |
| | | |
| * | | Cost for federal income tax purposes is $40,463,206. |
| | | |
| | | Net unrealized depreciation consists of: |
| | | | | |
| Gross Unrealized Appreciation | | $ | 103,975 | |
| Gross Unrealized Depreciation | | | (15,331,830 | ) |
| | | | | |
| Net Unrealized Depreciation | | $ | (15,227,855 | ) |
| | | | | |
| | | | | |
| | | Percentage of
|
| Industry | | Net Assets |
|
| |
| Apparel | | | 3.3 | % |
| Banks | | | 5.7 | |
| Building Materials | | | 0.6 | |
| Chemicals | | | 1.4 | |
| Coal | | | 1.8 | |
| Commercial Services | | | 1.7 | |
| Diversified Financial Services | | | 3.6 | |
| Electric | | | 2.5 | |
| Electrical Components & Equipment | | | 0.6 | |
| Electronics | | | 6.8 | |
| Equity Fund | | | 0.6 | |
| Holding Companies — Diversified | | | 3.7 | |
| Insurance | | | 7.2 | |
| Mining | | | 1.1 | |
| Oil & Gas | | | 7.8 | |
| Real Estate | | | 16.7 | |
| Retail | | | 0.9 | |
| Semiconductors | | | 7.1 | |
| Shopping Centers | | | 2.6 | |
| Software | | | 0.4 | |
| Telecommunications | | | 19.1 | |
| Transportation | | | 4.5 | |
| Other Assets and Liabilities — Net | | | 0.3 | |
| | | | | |
Net Assets | | | 100.0 | % |
| | | | | |
See Accompanying Notes to Financial Statements
198
PORTFOLIO OF INVESTMENTS
ING Index Plus International Equity Fund
as of October 31, 2008
| | | | | | | | | | | | | | | |
| Shares | | | | | | | | Value |
| |
| |
| |
COMMON STOCK: 94.0% |
| | | | | | | |
| | | | | | | Australia: 4.8% |
| | 21,438 | | | | | Alumina Ltd. | | $ | 30,509 | |
| | 7,106 | | | | | Australia & New Zealand Banking Group Ltd. | | | 83,300 | |
| | 12,573 | | | | | Babcock & Brown Ltd. | | | 10,987 | |
| | 21,860 | | | | | Bendigo Bank Ltd. | | | 192,843 | |
| | 40,902 | | | | | BHP Billiton Ltd. | | | 785,777 | |
| | 122,971 | | | | | BlueScope Steel Ltd. | | | 361,679 | |
| | 10,814 | | | | | Brambles Ltd. | | | 57,682 | |
| | 39,111 | | | | | Caltex Australia Ltd. | | | 246,332 | |
| | 28,556 | | | | | Coca-Cola Amatil Ltd. | | | 154,146 | |
| | 2,167 | | | | | Commonwealth Bank of Australia | | | 59,237 | |
| | 14,682 | | | | | Computershare Ltd. | | | 83,005 | |
| | 11,671 | | | | | CSL Ltd. | | | 283,836 | |
| | 166,382 | | | | | Harvey Norman Holdings Ltd. | | | 287,189 | |
| | 18,754 | | | | | Lion Nathan Ltd. | | | 110,827 | |
| | 300,614 | | | | | Macquarie Airports Management Ltd. | | | 427,526 | |
| | 21,971 | | | | | Macquarie Group Ltd. | | | 435,884 | |
| | 46,817 | | | | | National Australia Bank Ltd. | | | 759,657 | |
| | 80,250 | | | | | Qantas Airways Ltd. | | | 130,347 | |
| | 151,436 | | | | | Telstra Corp., Ltd. | | | 416,843 | |
| | 6,367 | | | | | Woodside Petroleum Ltd. | | | 179,900 | |
| | 3,550 | | | | | Woolworths Ltd. | | | 66,178 | |
| | | | | | | | | | | |
| | | | | | | | | | | | | | 5,163,684 | |
| | | | | | | | | | | | | | | |
| | | | | | | |
| | | | | | | Austria: 0.9% |
| | 1,281 | | | | | Erste Bank der Oesterreichischen Sparkassen AG | | | 34,151 | |
| | 12,778 | | | @ | | Immoeast Immobilien Anlagen AG | | | 15,406 | |
| | 83,100 | | | @ | | Immofinanz Immobilien Anlagen AG | | | 92,690 | |
| | 15,993 | | | | | OMV AG | | | 511,935 | |
| | 3,848 | | | | | Telekom Austria AG | | | 47,281 | |
| | 9,116 | | | | | Voestalpine AG | | | 222,471 | |
| | | | | | | | | | | |
| | | | | | | | | | | | | | 923,934 | |
| | | | | | | | | | | | | | | |
| | | | | | | |
| | | | | | | Belgium: 0.6% |
| | 3,125 | | | | | Dexia | | | 16,621 | |
| | 5,625 | | | | | Fortis | | | 6,517 | |
| | 4,142 | | | @ | | Fortis — STRIP VVPR | | | 53 | |
| | 1,066 | | | | | Groupe Bruxelles Lambert SA | | | 78,311 | |
| | 13,051 | | | | | InBev NV | | | 526,388 | |
| | | | | | | | | | | |
| | | | | | | | | | | | | | 627,890 | |
| | | | | | | | | | | | | | | |
| | | | | | | |
| | | | | | | Bermuda: 0.0% |
| | 3,400 | | | | | SeaDrill Ltd. ADR | | | 32,735 | |
| | | | | | | | | | | |
| | | | | | | | | | | | | | 32,735 | |
| | | | | | | | | | | | | | | |
| | | | | | | |
| | | | | | | Denmark: 0.5% |
| | 3,100 | | | | | Danske Bank A/S | | | 45,890 | |
| | 1,375 | | | | | Novo-Nordisk A/S | | | 73,704 | |
| | 9,093 | | | @ | | Vestas Wind Systems A/S | | | 372,450 | |
| | | | | | | | | | | |
| | | | | | | | | | | | | | 492,044 | |
| | | | | | | | | | | | | | | |
| | | | | | | |
| | | | | | | Finland: 1.5% |
| | 15,667 | | | | | Elisa OYJ | | | 235,671 | |
| | 493 | | | | | Kesko OYJ | | | 11,540 | |
| | 84,412 | | | | | Nokia OYJ | | | 1,293,040 | |
| | 3,622 | | | | | Sampo OYJ | | | 72,584 | |
| | 3,631 | | | | | YIT OYJ | | | 22,611 | |
| | | | | | | | | | | |
| | | | | | | | | | | | | | 1,635,446 | |
| | | | | | | | | | | | | | | |
| | | | | | | |
| | | | | | | France: 7.0% |
| | 2,285 | | | | | AXA SA | | | 43,653 | |
| | 5,084 | | | | | BNP Paribas | | | 367,072 | |
| | 332 | | | | | Bouygues SA | | | 14,137 | |
| | 16,362 | | | | | Carrefour SA | | | 691,212 | |
| | 195 | | | | | Christian Dior SA | | | 11,814 | |
| | 2,168 | | | @ | | Compagnie Generale de Geophysique SA | | | 35,055 | |
| | 8,617 | | | | | Compagnie Generale des Etablissements Michelin | | | 443,526 | |
| | 4,089 | | | | | Credit Agricole SA | | | 59,156 | |
| | 271 | | | | | Eiffage SA | | | 10,411 | |
| | 31,724 | | | | | France Telecom SA | | | 799,940 | |
| | 2,142 | | | | | Gaz de France | | | 95,348 | |
| | 3,294 | | | | | Lafarge SA | | | 217,758 | |
| | 7,650 | | | | | Natixis | | | 16,941 | |
| | 21,134 | | | | | Peugeot SA | | | 563,958 | |
| | 852 | | | | | PPR | | | 54,298 | |
| | 1,371 | | | | | Renault SA | | | 42,018 | |
| | 8,755 | | | | | Sanofi-Aventis | | | 554,692 | |
| | 11,223 | | | | | Schneider Electric SA | | | 672,680 | |
| | 566 | | | @ | | Suez Environnement SA | | | 10,821 | |
| | 1,030 | | | | | Technip SA | | | 30,844 | |
| | 37,851 | | | | | Total SA | | | 2,082,315 | |
| | 1,458 | | | | | Vinci SA | | | 52,470 | |
| | 27,613 | | | | | Vivendi | | | 721,780 | |
| | | | | | | | | | | |
| | | | | | | | | | | | | | 7,591,899 | |
| | | | | | | | | | | | | | | |
| | | | | | | |
| | | | | | | Germany: 8.5% |
| | 1,607 | | | | | Allianz AG | | | 120,926 | |
| | 18,975 | | | | | BASF AG | | | 637,007 | |
| | 9,440 | | | | | Bayer AG | | | 528,011 | |
| | 1,762 | | | | | Bayerische Motoren Werke AG | | | 44,737 | |
| | 901 | | | | | Continental AG | | | 38,809 | |
| | 15,100 | | | | | Deutsche Bank AG | | | 573,861 | |
| | 7,998 | | | | | Deutsche Boerse AG | | | 628,618 | |
| | 28,337 | | | | | Deutsche Lufthansa AG | | | 394,265 | |
| | 34,584 | | | | | Deutsche Post AG | | | 378,762 | |
| | 24,183 | | | | | Deutsche Telekom AG | | | 359,080 | |
| | 31,359 | | | | | E.ON AG | | | 1,200,136 | |
| | 3,743 | | | | | Fresenius Medical Care AG & Co. KGaA | | | 167,424 | |
| | 6,134 | | | | | Muenchener Rueckversicherungs AG | | | 812,566 | |
| | 12,380 | | | | | RWE AG | | | 1,029,493 | |
| | 11,530 | | | | | SAP AG | | | 406,970 | |
| | 9,863 | | | | | Siemens AG | | | 592,484 | |
| | 18,141 | | | | | ThyssenKrupp AG | | | 339,939 | |
| | 4,220 | | | | | TUI AG | | | 50,807 | |
| | 1,622 | | | | | Volkswagen AG | | | 981,756 | |
| | | | | | | | | | | |
| | | | | | | | | | | | | | 9,285,651 | |
| | | | | | | | | | | | | | | |
| | | | | | | |
| | | | | | | Greece: 0.8% |
| | 7,656 | | | | | Alpha Bank AE | | | 111,777 | |
| | 3,970 | | | | | Coca-Cola Hellenic Bottling Co. SA | | | 55,404 | |
| | 20,218 | | | | | Hellenic Telecommunications Organization SA | | | 285,357 | |
| | 14,971 | | | | | National Bank of Greece SA | | | 328,887 | |
| | 2,951 | | | | | OPAP SA | | | 64,434 | |
| | 3,116 | | | | | Piraeus Bank SA | | | 39,528 | |
| | | | | | | | | | | |
| | | | | | | | | | | | | | 885,387 | |
| | | | | | | | | | | | | | | |
| | | | | | | |
| | | | | | | Hong Kong: 1.7% |
| | 7,000 | | | | | Cheung Kong Holdings Ltd. | | | 67,211 | |
| | 25,000 | | | | | Hang Lung Properties Ltd. | | | 61,087 | |
| | 40,649 | | | | | Hang Seng Bank Ltd. | | | 507,197 | |
| | 202,000 | | | | | Hong Kong & China Gas | | | 355,880 | |
| | 18,500 | | | | | HongKong Electric Holdings | | | 99,713 | |
| | 21,000 | | | | | Hopewell Holdings | | | 65,291 | |
| | 9,000 | | | | | Hutchison Whampoa Ltd. | | | 48,635 | |
| | 90,400 | | | | | Lee & Man Paper Manufacturing Ltd. | | | 29,553 | |
| | 479,556 | | | | | New World Development Ltd. | | | 399,199 | |
| | 25,500 | | | | | Orient Overseas International Ltd. | | | 45,537 | |
| | 132,000 | | | X | | PCCW Ltd. | | | 49,393 | |
| | 10,000 | | | | | Shangri-La Asia Ltd. | | | 14,158 | |
| | 11,000 | | | | | Swire Pacific Ltd. | | | 77,470 | |
| | | | | | | | | | | |
| | | | | | | | | | | | | | 1,820,324 | |
| | | | | | | | | | | | | | | |
| | | | | | | |
| | | | | | | Ireland: 0.3% |
| | 56,337 | | | | | Allied Irish Banks PLC | | | 304,797 | |
| | | | | | | | | | | |
| | | | | | | | | | | | | | 304,797 | |
| | | | | | | | | | | | | | | |
| | | | | | | | | | | | | | | |
See Accompanying Notes to Financial Statements
199
PORTFOLIO OF INVESTMENTS
ING Index Plus International Equity Fund
as of October 31, 2008 (continued)
| | | | | | | | | | | | | | | |
| Shares | | | | | | | | Value |
| |
| |
| | | | | | | |
| | | | | | | Italy: 4.8% |
| | 14,192 | | | | | Banche Popolari Unite Scpa | | $ | 239,421 | |
| | 27,108 | | | | | Banco Popolare Scarl | | | 338,171 | |
| | 133,063 | | | | | Enel S.p.A. | | | 890,226 | |
| | 26,816 | | | | | ENI S.p.A. | | | 640,049 | |
| | 68,364 | | | | | Fiat S.p.A | | | 542,461 | |
| | 3,229 | | | | | Finmeccanica S.p.A. | | | 40,047 | |
| | 2,794 | | | | | Fondiaria-Sai S.p.A. | | | 52,490 | |
| | 200,454 | | | | | Intesa Sanpaolo S.p.A. | | | 733,640 | |
| | 1,117 | | | | | Italcementi S.p.A. | | | 13,019 | |
| | 1,514 | | | | | Italcementi S.p.A. RNC | | | 10,535 | |
| | 19,849 | | | | | Lottomatica S.p.A. | | | 463,434 | |
| | 2,141 | | | | | Mediaset S.p.A. | | | 11,632 | |
| | 307,995 | | | | | Parmalat S.p.A | | | 540,771 | |
| | 131,444 | | | | | Pirelli & C S.p.A. | | | 46,344 | |
| | 9,301 | | | | | Telecom Italia S.p.A. | | | 10,685 | |
| | 272,966 | | | | | UniCredito Italiano S.p.A. | | | 668,227 | |
| | 6,537 | | | | | Unipol S.p.A. | | | 11,598 | |
| | | | | | | | | | | |
| | | | | | | | | | | | | | 5,252,750 | |
| | | | | | | | | | | | | | | |
| | | | | | | |
| | | | | | | Japan: 22.8% |
| | 11,160 | | | | | Acom Co., Ltd. | | | 426,301 | |
| | 3,000 | | | | | Amada Co., Ltd. | | | 13,777 | |
| | 8,600 | | | | | Asahi Breweries Ltd. | | | 141,953 | |
| | 14,700 | | | | | Astellas Pharma, Inc. | | | 592,098 | |
| | 1,500 | | | | | Casio Computer Co., Ltd. | | | 9,635 | |
| | 68 | | | | | Central Japan Railway Co. | | | 558,591 | |
| | 12,000 | | | | | Chiba Bank Ltd. | | | 59,312 | |
| | 38,100 | | | | | Credit Saison Co., Ltd. | | | 404,336 | |
| | 8,000 | | | | | Dai Nippon Printing Co., Ltd. | | | 94,521 | |
| | 13,000 | | | | | Daihatsu Motor Co., Ltd. | | | 96,251 | |
| | 19,500 | | | | | Daiichi Sankyo Co., Ltd. | | | 399,846 | |
| | 21,800 | | | | | Hitachi High-Technologies Corp. | | | 353,579 | |
| | 138,000 | | | | | Hitachi Ltd. | | | 647,917 | |
| | 125,000 | | | | | Hokugin Financial Group, Inc. | | | 247,352 | |
| | 32 | | | | | Inpex Holdings, Inc. | | | 185,773 | |
| | 82,000 | | | | | Isuzu Motors Ltd. | | | 144,069 | |
| | 2,900 | | | | | Ito En Ltd. | | | 46,189 | |
| | 61,000 | | | | | Itochu Corp. | | | 322,370 | |
| | 2,500 | | | | | Itochu Techno-Solutions Corp. | | | 58,579 | |
| | 8,000 | | | | | Iyo Bank Ltd. | | | 86,304 | |
| | 4,900 | | | | | JSR Corp. | | | 55,271 | |
| | 25,000 | | | | | Kao Corp. | | | 731,040 | |
| | 138 | | | | | KDDI Corp. | | | 826,832 | |
| | 400 | | | | | Keyence Corp. | | | 76,652 | |
| | 6,000 | | | | | Kirin Brewery Co., Ltd. | | | 66,361 | |
| | 7,600 | | | | | Konami Corp. | | | 137,491 | |
| | 61,500 | | | | | Konica Minolta Holdings, Inc. | | | 403,889 | |
| | 3,200 | | | | | Kyushu Electric Power Co., Inc. | | | 73,360 | |
| | 7,700 | | | | | Makita Corp. | | | 139,619 | |
| | 19,000 | | | | | Matsushita Electric Industrial Co., Ltd. | | | 305,971 | |
| | 15,900 | | | | | Millea Holdings, Inc. | | | 490,450 | |
| | 9,000 | | | | | Mitsubishi Electric Corp. | | | 55,794 | |
| | 196,000 | | | | | Mitsubishi UFJ Financial Group, Inc. | | | 1,231,698 | |
| | 74,000 | | | | | Mitsui & Co., Ltd. | | | 717,024 | |
| | 32,000 | | | | | Mitsui OSK Lines Ltd. | | | 167,101 | |
| | 20 | | | | | Mizuho Financial Group, Inc. | | | 48,836 | |
| | 58,000 | | | | | NGK Insulators Ltd. | | | 602,426 | |
| | 11,000 | | | | | NHK Spring Co., Ltd. | | | 44,332 | |
| | 200 | | | | | Nintendo Co., Ltd. | | | 64,262 | |
| | 8,000 | | | | | Nippon Electric Glass Co., Ltd. | | | 48,120 | |
| | 14,000 | | | | | Nippon Oil Corp. | | | 57,467 | |
| | 199,000 | | | | | Nippon Steel Corp. | | | 669,817 | |
| | 21 | | | | | Nippon Telegraph & Telephone Corp. | | | 85,695 | |
| | 92,000 | | | | | Nippon Yusen KK | | | 444,883 | |
| | 234,000 | | | | | Nishi-Nippon City Bank Ltd. | | | 509,779 | |
| | 600 | | | | | Nitto Denko Corp. | | | 13,288 | |
| | 5,800 | | | | | NOK Corp. | | | 55,222 | |
| | 37 | | | | | NTT DoCoMo, Inc. | | | 58,680 | |
| | 94,000 | | | | | Okuma Corp. | | | 413,301 | |
| | 201,000 | | | | | Osaka Gas Co., Ltd. | | | 710,986 | |
| | 10,700 | | | | | Otsuka Corp. | | | 538,192 | |
| | 22,200 | | | | | Promise Co., Ltd. | | | 398,472 | |
| | 473 | | | | | Resona Holdings, Inc. | | | 496,002 | |
| | 33,000 | | | | | Ricoh Co., Ltd. | | | 355,147 | |
| | 500 | | | | | Sankyo Co., Ltd. | | | 22,247 | |
| | 40,000 | | | @ | | Sanyo Electric Co., Ltd. | | | 60,716 | |
| | 2,800 | | | | | Secom Co., Ltd. | | | 106,799 | |
| | 20,900 | | | | | Seven & I Holdings Co., Ltd. | | | 586,830 | |
| | 15,700 | | | | | Shimano, Inc. | | | 449,106 | |
| | 18,300 | | | | | Shin-Etsu Chemical Co., Ltd. | | | 972,745 | |
| | 800 | | | | | SMC Corp. | | | 75,522 | |
| | 35,100 | | | | | Sony Corp. | | | 831,882 | |
| | 53,900 | | | | | Stanley Electric Co., Ltd. | | | 677,655 | |
| | 62,200 | | | | | Sumitomo Electric Industries Ltd. | | | 503,605 | |
| | 38,000 | | | | | Sumitomo Metal Mining Co., Ltd. | | | 284,975 | |
| | 8 | | | | | Sumitomo Mitsui Financial Group, Inc. | | | 32,071 | |
| | 47,000 | | | | | Suruga Bank Ltd. | | | 442,434 | |
| | 2,400 | | | | | Suzuken Co., Ltd. | | | 51,280 | |
| | 4,400 | | | | | Suzuki Motor Corp. | | | 64,567 | |
| | 12,900 | | | | | Takeda Pharmaceutical Co., Ltd. | | | 640,939 | |
| | 22,000 | | | | | Toho Gas Co., Ltd. | | | 126,985 | |
| | 58,200 | | | | | Tokai Rika Co., Ltd. | | | 588,740 | |
| | 161,000 | | | | | Tokyo Gas Co., Ltd. | | | 692,293 | |
| | 51,700 | | | | | Toyota Boshoku Corp. | | | 461,158 | |
| | 20,200 | | | | | Toyota Motor Corp. | | | 788,829 | |
| | 18 | | | | | West Japan Railway Co. | | | 79,211 | |
| | 5,000 | | | | | Yamato Holdings Co., Ltd. | | | 55,237 | |
| | 2,300 | | | | | Yamato Kogyo Co., Ltd. | | | 54,358 | |
| | 41,000 | | | | | Yaskawa Electric Corp. | | | 179,924 | |
| | | | | | | | | | | |
| | | | | | | | | | | | | | 24,812,321 | |
| | | | | | | | | | | | | | | |
| | | | | | | |
| | | | | | | Luxembourg: 0.6% |
| | 27,016 | | | | | Arcelor Mittal | | | 661,119 | |
| | | | | | | | | | | |
| | | | | | | | | | | | | | 661,119 | |
| | | | | | | | | | | | | | | |
| | | | | | | |
| | | | | | | Mauritius: 0.3% |
| | 2,242,000 | | | | | Golden Agri-Resources Ltd. | | | 299,191 | |
| | | | | | | | | | | |
| | | | | | | | | | | | | | 299,191 | |
| | | | | | | | | | | | | | | |
| | | | | | | |
| | | | | | | Netherlands: 5.2% |
| | 63,019 | | | | | Aegon NV | | | 261,855 | |
| | 17,849 | | | | | ASML Holding NV | | | 312,471 | |
| | 19,273 | | | | | Heineken NV | | | 650,141 | |
| | 37,647 | | | | | Koninklijke Philips Electronics NV | | | 695,710 | |
| | 43,815 | | | | | Reed Elsevier NV | | | 585,634 | |
| | 525 | | | @ | | Royal Dutch Shell PLC | | | 14,551 | |
| | 46,344 | | | | | Royal Dutch Shell PLC — Class A | | | 1,273,289 | |
| | 55,679 | | | | | Royal Dutch Shell PLC — Class B | | | 1,509,555 | |
| | 4,960 | | | | | Royal KPN NV | | | 69,853 | |
| | 3,303 | | | @ | | TomTom | | | 25,179 | |
| | 11,264 | | | | | Unilever NV | | | 271,457 | |
| | | | | | | | | | | |
| | | | | | | | | | | | | | 5,669,695 | |
| | | | | | | | | | | | | | | |
| | | | | | | |
| | | | | | | New Zealand: 0.2% |
| | 67,205 | | | | | Fletcher Building Ltd. | | | 228,198 | |
| | | | | | | | | | | |
| | | | | | | | | | | | | | 228,198 | |
| | | | | | | | | | | | | | | |
| | | | | | | |
| | | | | | | Norway: 0.0% |
| | 7,200 | | | | | DnB NOR ASA | | | 41,726 | |
| | 600 | | | | | Statoil ASA | | | 12,068 | |
| | | | | | | | | | | |
| | | | | | | | | | | | | | 53,794 | |
| | | | | | | | | | | | | | | |
| | | | | | | |
| | | | | | | Portugal: 0.1% |
| | 18,191 | | | | | Energias de Portugal SA | | | 61,960 | |
| | 7,663 | | | | | Portugal Telecom SGPS SA | | | 50,400 | |
| | | | | | | | | | | |
| | | | | | | | | | | | | | 112,360 | |
| | | | | | | | | | | | | | | |
| | | | | | | |
| | | | | | | Singapore: 1.5% |
| | 275,000 | | | | | CapitaLand Ltd. | | | 551,146 | |
| | 19,000 | | | | | City Developments Ltd. | | | 84,019 | |
| | 15,000 | | | | | Jardine Cycle & Carriage Ltd. | | | 96,216 | |
| | 312,000 | | | | | Keppel Land Ltd. | | | 401,077 | |
| | 7,000 | | | | | Singapore Airlines Ltd. | | | 53,631 | |
See Accompanying Notes to Financial Statements
200
PORTFOLIO OF INVESTMENTS
ING Index Plus International Equity Fund
as of October 31, 2008 (continued)
| | | | | | | | | | | | | | | |
| Shares | | | | | | | | Value |
| |
| |
| | | | | | | Singapore (continued) |
| | 306,000 | | | | | United Overseas Land Ltd. | | $ | 400,562 | |
| | 7,000 | | | | | Wilmar International Ltd. | | | 12,106 | |
| | | | | | | | | | | |
| | | | | | | | | | | | | | 1,598,757 | |
| | | | | | | | | | | | | | | |
| | | | | | | |
| | | | | | | Spain: 4.5% |
| | 14,981 | | | | | ACS Actividades de Construccion y Servicios SA | | | 556,226 | |
| | 76,509 | | | | | Banco Bilbao Vizcaya Argentaria SA | | | 887,988 | |
| | 7,601 | | | | | Banco Popular Espanol SA | | | 69,174 | |
| | 113,249 | | | | | Banco Santander Central Hispano SA | | | 1,224,807 | |
| | 1,819 | | | | | Gas Natural SDG SA | | | 55,985 | |
| | 66,004 | | | | | Iberdrola SA | | | 477,694 | |
| | 1,553 | | | | | Inditex SA | | | 52,495 | |
| | 1,158 | | | | | Promotora de Informaciones SA (PRISA) | | | 4,536 | |
| | 2,271 | | | | | Repsol YPF SA | | | 43,185 | |
| | 82,706 | | | | | Telefonica SA | | | 1,531,298 | |
| | | | | | | | | | | |
| | | | | | | | | | | | | | 4,903,388 | |
| | | | | | | | | | | | | | | |
| | | | | | | |
| | | | | | | Sweden: 0.0% |
| | 3,300 | | | | | Electrolux AB | | | 30,380 | |
| | 1,200 | | | | | Sandvik AB | | | 7,788 | |
| | 1,109 | | | | | Tele2 AB — B Shares | | | 9,463 | |
| | | | | | | | | | | |
| | | | | | | | | | | | | | 47,631 | |
| | | | | | | | | | | | | | | |
| | | | | | | |
| | | | | | | Switzerland: 9.8% |
| | 61,918 | | | @ | | ABB Ltd. | | | 812,433 | |
| | 199 | | | | | Baloise Holding AG | | | 10,639 | |
| | 24,549 | | | | | Credit Suisse Group | | | 917,982 | |
| | 11,806 | | | | | Holcim Ltd. | | | 670,572 | |
| | 46,130 | | | | | Nestle SA | | | 1,793,857 | |
| | 42,542 | | | | | Novartis AG | | | 2,159,347 | |
| | 813 | | | | | Pargesa Holding SA | | | 62,278 | |
| | 13,129 | | | | | Roche Holding AG | | | 2,007,777 | |
| | 63 | | | | | SGS SA | | | 62,026 | |
| | 4,027 | | | @ | | Swiss Life Holding | | | 362,857 | |
| | 14,525 | | | | | Swiss Reinsurance | | | 605,746 | |
| | 310 | | | | | Syngenta AG | | | 57,949 | |
| | 2,058 | | | | | Synthes, Inc. | | | 265,569 | |
| | 6,119 | | | @ | | UBS AG — Reg | | | 103,823 | |
| | 21,915 | | | | | Xstrata PLC | | | 374,841 | |
| | 2,048 | | | | | Zurich Financial Services AG | | | 415,493 | |
| | | | | | | | | | | |
| | | | | | | | | | | | | | 10,683,189 | |
| | | | | | | | | | | | | | | |
| | | | | | | |
| | | | | | | United Kingdom: 17.6% |
| | 4,711 | | | | | 3i Group PLC | | | 41,092 | |
| | 5,623 | | | | | Anglo American PLC | | | 141,088 | |
| | 32,849 | | | | | AstraZeneca PLC | | | 1,392,090 | |
| | 26,671 | | | | | Aviva PLC | | | 159,093 | |
| | 133,220 | | | | | BAE Systems PLC | | | 748,824 | |
| | 127,452 | | | | | Barclays PLC | | | 365,351 | |
| | 31,038 | | | | | BG Group PLC | | | 456,381 | |
| | 56,462 | | | | | BHP Billiton PLC | | | 958,755 | |
| | 230,564 | | | | | BP PLC | | | 1,879,437 | |
| | 2,512 | | | | | British American Tobacco PLC | | | 68,902 | |
| | 13,662 | | | | | British Energy Group PLC | | | 163,410 | |
| | 100,945 | | | | | BT Group PLC | | | 189,680 | |
| | 253,740 | | | | | Cable & Wireless PLC | | | 502,909 | |
| | 13,156 | | | | | Capita Group PLC | | | 135,941 | |
| | 456 | | | | | Carnival PLC | | | 10,028 | |
| | 34,749 | | | | | Carphone Warehouse Group | | | 75,437 | |
| | 157,602 | | | | | Centrica PLC | | | 774,427 | |
| | 27,282 | | | | | Compass Group PLC | | | 126,864 | |
| | 74,420 | | | | | Daily Mail & General Trust | | | 350,440 | |
| | 67,693 | | | | | Diageo PLC | | | 1,033,029 | |
| | 10,158 | | | | | Experian Group Ltd. | | | 56,021 | |
| | 45,769 | | | | | GlaxoSmithKline PLC | | | 879,860 | |
| | 160,149 | | | | | HBOS PLC | | | 262,232 | |
| | 128,893 | | | | | HSBC Holdings PLC | | | 1,526,635 | |
| | 8,883 | | | | | Imperial Tobacco Group PLC | | | 238,078 | |
| | 70,152 | | | | | International Power PLC | | | 250,969 | |
| | 24,631 | | | | | Investec PLC | | | 93,539 | |
| | 122,706 | | | | | J Sainsbury PLC | | | 560,542 | |
| | 19,088 | | | | | Ladbrokes PLC | | | 48,644 | |
| | 362,186 | | | | | Legal & General Group PLC | | | 416,547 | |
| | 19,909 | | | | | Marks & Spencer Group PLC | | | 70,581 | |
| | 13,428 | | | | | Mondi PLC | | | 48,735 | |
| | 6,569 | | | | | National Grid PLC | | | 74,000 | |
| | 429,033 | | | | | Old Mutual PLC | | | 347,418 | |
| | 51,269 | | | | | Persimmon PLC | | | 248,205 | |
| | 14,349 | | | | | Punch Taverns PLC | | | 36,101 | |
| | 1,716 | | | | | Reckitt Benckiser PLC | | | 72,586 | |
| | 7,553 | | | | | Reed Elsevier PLC | | | 66,272 | |
| | 8,190 | | | | | Rio Tinto PLC | | | 382,572 | |
| | 516,981 | | | | | Royal Bank of Scotland Group PLC | | | 569,463 | |
| | 29,900 | | | | | Sage Group PLC | | | 83,706 | |
| | 13,198 | | | | | Shire Ltd. | | | 172,941 | |
| | 24,621 | | | | | Standard Chartered PLC | | | 406,912 | |
| | 25,325 | | | | | Standard Life PLC | | | 98,034 | |
| | 12,794 | | | | | Tate & Lyle PLC | | | 76,060 | |
| | 94,203 | | | | | Tesco PLC | | | 516,148 | |
| | 24,342 | | | | | Thomas Cook Group PLC | | | 66,036 | |
| | 5,882 | | | | | Unilever PLC | | | 132,144 | |
| | 436,725 | | | | | Vodafone Group PLC | | | 840,134 | |
| | 160,099 | | | | | WM Morrison Supermarkets PLC | | | 681,691 | |
| | 24,272 | | | | | Wolseley PLC | | | 132,832 | |
| | 9,372 | | | | | WPP Group PLC | | | 56,061 | |
| | | | | | | | | | | |
| | | | | | | | | | | | | | 19,084,877 | |
| | | | | | | | | | | | | | | |
| | | | | | | Total Common Stock
(Cost $160,245,585 ) | | | 102,171,061 | |
| | | | | | | | | | | |
| |
REAL ESTATE INVESTMENT TRUSTS: 0.6% |
| | | | | | | |
| | | | | | | France: 0.5% |
| | 3,764 | | | | | Unibail | | | 564,543 | |
| | | | | | | | | | | |
| | | | | | | | | | | | | | 564,543 | |
| | | | | | | | | | | | | | | |
| | | | | | | |
| | | | | | | Singapore: 0.1% |
| | 103,000 | | | @ | | CapitaCommercial Trust | | | 70,759 | |
| | | | | | | | | | | |
| | | | | | | | | | | | | | 70,759 | |
| | | | | | | | | | | | | | | |
| | | | | | | Total Real Estate Investment Trusts
(Cost $805,457 ) | | | 635,302 | |
| | | | | | | | | | | |
| |
PREFERRED STOCK: 0.1% |
| | | | | | | |
| | | | | | | Germany: 0.1% |
| | 452 | | | | | Bayerische Motoren Werke AG | | | 9,013 | |
| | 4,185 | | | | | Henkel KGaA — Vorzug | | | 119,656 | |
| | 149 | | | | | Porsche AG | | | 13,139 | |
| | 1,084 | | | | | ProSieben SAT.1 Media AG | | | 3,345 | |
| | | | | | | | | | | |
| | | | | | | Total Preferred Stock
(Cost $226,859 ) | | | 145,153 | |
| | | | | | | | | | | |
| |
RIGHTS: 0.0% |
| | | | | | | |
| | | | | | | Belgium: 0.0% |
| | 5,625 | | | | | Fortis | | | — | |
| | | | | | | | | | | |
| | | | | | | Total Rights
(Cost $-) | | | — | |
| | | | | | | | | | | |
| | | | | Total Investments in Securities |
| | | | | (Cost $161,277,901)* | | | 94.7 | % | | $ | 102,951,516 | |
| | | | | Other Assets and
Liabilities - Net | | | 5.3 | | | | 5,753,298 | |
| | | | | | | | | | | | | |
| | | | | Net Assets | | | 100.0 | % | | $ | 108,704,814 | |
| | | | | | | | | | | | | |
See Accompanying Notes to Financial Statements
201
PORTFOLIO OF INVESTMENTS
ING Index Plus International Equity Fund
as of October 31, 2008 (continued)
| | | |
| @ | | Non-income producing security |
| ADR | | American Depositary Receipt |
| STRIP | | Separate Trading of Registered Interest and Principal of Securities |
| X | | Fair value determined by ING Funds Valuation Committee appointed by the Funds’ Board of Directors/Trustees. |
| | | |
| * | | Cost for federal income tax purposes is $169,616,440. |
| | | |
| | | Net unrealized depreciation consists of: |
| | | | | |
| Gross Unrealized Appreciation | | $ | 624,452 | |
| Gross Unrealized Depreciation | | | (67,289,376 | ) |
| | | | | |
| Net Unrealized Depreciation | | $ | (66,664,924 | ) |
| | | | | |
| | | | | |
| | | Percentage of
|
| Industry | | Net Assets |
|
| |
| Aerospace/Defense | | | 0.7 | % |
| Agriculture | | | 0.6 | |
| Airlines | | | 0.5 | |
| Apparel | | | 0.0 | |
| Auto Manufacturers | | | 3.0 | |
| Auto Parts & Equipment | | | 2.6 | |
| Banks | | | 13.8 | |
| Beverages | | | 2.6 | |
| Biotechnology | | | 0.3 | |
| Building Materials | | | 1.0 | |
| Chemicals | | | 2.1 | |
| Commercial Services | | | 0.5 | |
| Computers | | | 0.6 | |
| Cosmetics/Personal Care | | | 0.7 | |
| Distribution/Wholesale | | | 1.5 | |
| Diversified | | | 0.6 | |
| Diversified Financial Services | | | 2.2 | |
| Electric | | | 4.0 | |
| Electrical Components & Equipment | | | 1.7 | |
| Electronics | | | 1.5 | |
| Engineering & Construction | | | 1.7 | |
| Entertainment | | | 0.5 | |
| Food | | | 4.9 | |
| Food Service | | | 0.1 | |
| Forest Products & Paper | | | 0.1 | |
| Gas | | | 2.6 | |
| Hand/Machine Tools | | | 0.2 | |
| Healthcare — Products | | | 0.2 | |
| Healthcare — Services | | | 0.2 | |
| Holding Companies — Diversified | | | 0.2 | |
| Home Builders | | | 0.2 | |
| Home Furnishings | | | 1.1 | |
| Household Products/Wares | | | 0.2 | |
| Insurance | | | 3.9 | |
| Investment Companies | | | 0.1 | |
| Iron/Steel | | | 2.1 | |
| Leisure Time | | | 0.5 | |
| Lodging | | | 0.1 | |
| Machinery — Diversified | | | 0.4 | |
| Media | | | 1.7 | |
| Mining | | | 2.7 | |
| Miscellaneous Manufacturing | | | 0.9 | |
| Office/Business Equipment | | | 0.3 | |
| Oil & Gas | | | 8.4 | |
| Oil & Gas Services | | | 0.1 | |
| Pharmaceuticals | | | 8.2 | |
| Real Estate | | | 1.9 | |
| Retail | | | 1.1 | |
| Semiconductors | | | 0.3 | |
| Software | | | 0.6 | |
| Telecommunications | | | 7.0 | |
| Toys/Games/Hobbies | | | 0.1 | |
| Transportation | | | 1.6 | |
| Venture Capital | | | 0.0 | |
| Water | | | 0.0 | |
| Other Assets and Liabilities — Net | | | 5.3 | |
| | | | | |
Net Assets | | | 100.0 | % |
| | | | | |
See Accompanying Notes to Financial Statements
202
PORTFOLIO OF INVESTMENTS
ING International Capital Appreciation Fund
as of October 31, 2008
| | | | | | | | | | | | | | | |
| Shares | | | | | | | | Value |
| |
| |
| |
COMMON STOCK: 99.6% |
| | | | | | | |
| | | | | | | Australia: 3.9% |
| | 42,188 | | | | | BHP Billiton Ltd. | | $ | 810,483 | |
| | 12,598 | | | | | Rio Tinto Ltd. | | | 651,730 | |
| | 17,922 | | | | | Woodside Petroleum Ltd. | | | 506,388 | |
| | | | | | | | | | | |
| | | | | | | | | | | | | | 1,968,601 | |
| | | | | | | | | | | | | | | |
| | | | | | | |
| | | | | | | Austria: 1.1% |
| | 20,530 | | | | | Erste Bank der Oesterreichischen Sparkassen AG | | | 547,330 | |
| | | | | | | | | | | |
| | | | | | | | | | | | | | 547,330 | |
| | | | | | | | | | | | | | | |
| | | | | | | |
| | | | | | | Brazil: 4.4% |
| | 51,731 | | | | | Banco Itau Holding Financeira SA ADR | | | 572,145 | |
| | 58,217 | | | | | Cia Vale do Rio Doce ADR | | | 763,807 | |
| | 32,343 | | | | | Petroleo Brasileiro SA ADR | | | 869,703 | |
| | | | | | | | | | | |
| | | | | | | | | | | | | | 2,205,655 | |
| | | | | | | | | | | | | | | |
| | | | | | | |
| | | | | | | Canada: 7.6% |
| | 57,538 | | | | | Cameco Corp. | | | 933,266 | |
| | 50,199 | | | | | Manulife Financial Corp. | | | 1,008,498 | |
| | 41,735 | | | | | Rogers Communications, Inc. | | | 1,211,570 | |
| | 26,606 | | | | | Suncor Energy, Inc. | | | 636,416 | |
| | | | | | | | | | | |
| | | | | | | | | | | | | | 3,789,750 | |
| | | | | | | | | | | | | | | |
| | | | | | | |
| | | | | | | China: 5.2% |
| | 757,000 | | | | | China Communications Construction Co., Ltd. | | | 536,202 | |
| | 340,000 | | | | | China Merchants Bank Co., Ltd. | | | 520,896 | |
| | 54,452 | | | @ | | Focus Media Holding Ltd. ADR | | | 1,008,996 | |
| | 1,536,000 | | | @ | | Foxconn International Holdings Ltd. | | | 565,183 | |
| | | | | | | | | | | |
| | | | | | | | | | | | | | 2,631,277 | |
| | | | | | | | | | | | | | | |
| | | | | | | |
| | | | | | | Denmark: 1.6% |
| | 19,118 | | | @ | | Vestas Wind Systems A/S | | | 783,074 | |
| | | | | | | | | | | |
| | | | | | | | | | | | | | 783,074 | |
| | | | | | | | | | | | | | | |
| | | | | | | |
| | | | | | | France: 6.6% |
| | 13,919 | | | | | Electricite de France | | | 836,303 | |
| | 13,630 | | | | | Groupe Danone | | | 758,931 | |
| | 14,951 | | | | | Iliad SA | | | 1,182,431 | |
| | 8,063 | | | | | LVMH Moet Hennessy Louis Vuitton SA | | | 536,544 | |
| | | | | | | | | | | |
| | | | | | | | | | | | | | 3,314,209 | |
| | | | | | | | | | | | | | | |
| | | | | | | |
| | | | | | | Germany: 7.0% |
| | 13,729 | | | | | Adidas AG | | | 470,140 | |
| | 11,739 | | | | | Deutsche Boerse AG | | | 922,649 | |
| | 24,361 | | | | | E.ON AG | | | 932,316 | |
| | 17,957 | | | | | SAP AG ADR | | | 634,421 | |
| | 5,119 | | | | | Wacker Chemie AG | | | 557,006 | |
| | | | | | | | | | | |
| | | | | | | | | | | | | | 3,516,532 | |
| | | | | | | | | | | | | | | |
| | | | | | | |
| | | | | | | Hong Kong: 4.3% |
| | 1,786,000 | | | | | Agile Property Holdings Ltd. | | | 593,453 | |
| | 181,400 | | | | | Esprit Holdings Ltd. | | | 1,030,733 | |
| | 262,000 | | | | | Li & Fung Ltd. | | | 525,838 | |
| | | | | | | | | | | |
| | | | | | | | | | | | | | 2,150,024 | |
| | | | | | | | | | | | | | | |
| | | | | | | |
| | | | | | | India: 2.6% |
| | 9,153 | | | | | HDFC Bank Ltd. ADR | | | 600,437 | |
| | 23,739 | | | | | Infosys Technologies Ltd. ADR | | | 696,027 | |
| | | | | | | | | | | |
| | | | | | | | | | | | | | 1,296,464 | |
| | | | | | | | | | | | | | | |
| | | | | | | |
| | | | | | | Israel: 1.8% |
| | 21,255 | | | | | Teva Pharmaceutical Industries Ltd. ADR | | | 911,414 | |
| | | | | | | | | | | |
| | | | | | | | | | | | | | 911,414 | |
| | | | | | | | | | | | | | | |
| | | | | | | |
| | | | | | | Italy: 1.5% |
| | 39,418 | | | | | Saipem S.p.A. | | | 740,902 | |
| | | | | | | | | | | |
| | | | | | | | | | | | | | 740,902 | |
| | | | | | | | | | | | | | | |
| | | | | | | |
| | | | | | | Japan: 11.8% |
| | 27,100 | | | | | Denso Corp. | | | 528,195 | |
| | 12,800 | | | | | Fanuc Ltd. | | | 852,847 | |
| | 63,000 | | | | | NGK Insulators Ltd. | | | 654,360 | |
| | 3,200 | | | | | Nintendo Co., Ltd. | | | 1,028,187 | |
| | 8,230 | | | | | ORIX Corp. | | | 845,576 | |
| | 18,100 | | | | | Shin-Etsu Chemical Co., Ltd. | | | 962,114 | |
| | 14,300 | | | | | Toyota Motor Corp. | | | 558,428 | |
| | 9,350 | | | | | Yamada Denki Co., Ltd. | | | 508,922 | |
| | | | | | | | | | | |
| | | | | | | | | | | | | | 5,938,629 | |
| | | | | | | | | | | | | | | |
| | | | | | | |
| | | | | | | Luxembourg: 1.3% |
| | 16,241 | | | @ | | Millicom International Cellular SA | | | 649,640 | |
| | | | | | | | | | | |
| | | | | | | | | | | | | | 649,640 | |
| | | | | | | | | | | | | | | |
| | | | | | | |
| | | | | | | Mexico: 1.2% |
| | 21,882 | | | | | Wal-Mart de Mexico SA de CV ADR | | | 582,061 | |
| | | | | | | | | | | |
| | | | | | | | | | | | | | 582,061 | |
| | | | | | | | | | | | | | | |
| | | | | | | |
| | | | | | | Netherlands: 1.1% |
| | 30,977 | | | | | Koninklijke Philips Electronics NV- NY Shares | | | 573,075 | |
| | | | | | | | | | | |
| | | | | | | | | | | | | | 573,075 | |
| | | | | | | | | | | | | | | |
| | | | | | | |
| | | | | | | Norway: 1.1% |
| | 59,810 | | | @ | | Renewable Energy Corp. A/S | | | 564,298 | |
| | | | | | | | | | | |
| | | | | | | | | | | | | | 564,298 | |
| | | | | | | | | | | | | | | |
| | | | | | | |
| | | | | | | Russia: 1.7% |
| | 42,446 | | | @ | | OAO Gazprom ADR | | | 845,231 | |
| | | | | | | | | | | |
| | | | | | | | | | | | | | 845,231 | |
| | | | | | | | | | | | | | | |
| | | | | | | |
| | | | | | | Singapore: 1.2% |
| | 186,000 | | | | | Keppel Corp., Ltd. | | | 579,891 | |
| | | | | | | | | | | |
| | | | | | | | | | | | | | 579,891 | |
| | | | | | | | | | | | | | | |
| | | | | | | |
| | | | | | | South Africa: 1.4% |
| | 64,389 | | | | | MTN Group Ltd. | | | 723,031 | |
| | | | | | | | | | | |
| | | | | | | | | | | | | | 723,031 | |
| | | | | | | | | | | | | | | |
| | | | | | | |
| | | | | | | South Korea: 1.4% |
| | 3,382 | | | # | | Samsung Electronics GDR | | | 700,790 | |
| | | | | | | | | | | |
| | | | | | | | | | | | | | 700,790 | |
| | | | | | | | | | | | | | | |
| | | | | | | |
| | | | | | | Spain: 5.2% |
| | 66,792 | | | | | Banco Bilbao Vizcaya Argentaria SA | | | 775,210 | |
| | 78,135 | | | | | Banco Santander Central Hispano SA | | | 845,043 | |
| | 52,236 | | | | | Telefonica SA | | | 967,147 | |
| | | | | | | | | | | |
| | | | | | | | | | | | | | 2,587,400 | |
| | | | | | | | | | | | | | | |
| | | | | | | |
| | | | | | | Switzerland: 10.4% |
| | 44,369 | | | @ | | ABB Ltd. | | | 582,170 | |
| | 24,935 | | | | | Credit Suisse Group | | | 932,416 | |
| | 21,336 | | | | | Nestle SA | | | 829,693 | |
| | 31,679 | | | | | Nobel Biocare Holding AG | | | 544,204 | |
| | 20,330 | | | | | Novartis AG | | | 1,031,910 | |
| | 8,462 | | | | | Roche Holding AG | | | 1,294,067 | |
| | | | | | | | | | | |
| | | | | | | | | | | | | | 5,214,460 | |
| | | | | | | | | | | | | | | |
| | | | | | | |
| | | | | | | United Kingdom: 14.2% |
| | 416,961 | | | | | ARM Holdings PLC | | | 650,095 | |
| | 71,815 | | | @ | | Autonomy Corp. PLC | | | 1,138,673 | |
| | 40,448 | | | | | BG Group PLC | | | 594,745 | |
| | 81,617 | | | | | British Sky Broadcasting PLC | | | 496,669 | |
| | 119,172 | | | | | ICAP PLC | | | 593,824 | |
| | 146,154 | | | | | Prudential PLC | | | 734,180 | |
| | 88,602 | | | | | Smith & Nephew PLC | | | 811,269 | |
See Accompanying Notes to Financial Statements
203
PORTFOLIO OF INVESTMENTS
ING International Capital Appreciation Fund
as of October 31, 2008 (continued)
| | | | | | | | | | | | | | | |
| Shares | | | | | | | | Value |
| |
| |
| | | | | | | United Kingdom (continued) |
| | 38,990 | | | | | Standard Chartered PLC | | $ | 644,388 | |
| | 139,865 | | | | | Tesco PLC | | | 766,335 | |
| | 52,019 | | | | | Vedanta Resources PLC | | | 720,406 | |
| | | | | | | | | | | |
| | | | | | | | | | | | | | 7,150,584 | |
| | | | | | | | | | | | | | | |
| | | | | Total Investments in Securities |
| | | | | (Cost $84,454,490)* | | | 99.6 | % | | $ | 49,964,322 | |
| | | | | Other Assets and
Liabilities - Net | | | 0.4 | | | | 197,394 | |
| | | | | | | | | | | | | |
| | | | | Net Assets | | | 100.0 | % | | $ | 50,161,716 | |
| | | | | | | | | | | | | |
| | | |
| @ | | Non-income producing security |
| ADR | | American Depositary Receipt |
| GDR | | Global Depositary Receipt |
| # | | Securities with purchases pursuant to Rule 144A or section 4(2), under the Securities Act of 1933 and may not be resold subject to that rule except to qualified institutional buyers. Unless otherwise noted, these securities have been determined to be liquid under the guidelines established by the Funds’ Board of Directors/Trustees. |
| | | |
| * | | Cost for federal income tax purposes is $88,035,858. |
| | | |
| | | Net unrealized depreciation consists of: |
| | | | | |
| Gross Unrealized Appreciation | | $ | 157,733 | |
| Gross Unrealized Depreciation | | | (38,229,269 | ) |
| | | | | |
| Net Unrealized Depreciation | | $ | (38,071,536 | ) |
| | | | | |
| | | | | |
| | | Percentage of
|
| Industry | | Net Assets |
|
| |
| Advertising | | | 2.0 | % |
| Apparel | | | 3.0 | |
| Auto Manufacturers | | | 1.1 | |
| Auto Parts & Equipment | | | 1.1 | |
| Banks | | | 10.8 | |
| Chemicals | | | 3.0 | |
| Distribution/Wholesale | | | 1.0 | |
| Diversified Financial Services | | | 4.7 | |
| Electric | | | 3.5 | |
| Electrical Components & Equipment | | | 1.6 | |
| Electronics | | | 2.4 | |
| Energy — Alternate Sources | | | 1.1 | |
| Engineering & Construction | | | 2.2 | |
| Food | | | 4.7 | |
| Healthcare — Products | | | 2.7 | |
| Holding Companies — Diversified | | | 2.2 | |
| Insurance | | | 3.5 | |
| Internet | | | 2.4 | |
| Machinery — Diversified | | | 1.7 | |
| Media | | | 1.0 | |
| Mining | | | 7.7 | |
| Oil & Gas | | | 6.9 | |
| Oil & Gas Services | | | 1.5 | |
| Pharmaceuticals | | | 6.5 | |
| Real Estate | | | 1.2 | |
| Retail | | | 2.2 | |
| Semiconductors | | | 2.7 | |
| Software | | | 4.9 | |
| Telecommunications | | | 8.2 | |
| Toys/Games/Hobbies | | | 2.1 | |
| Other Assets and Liabilities — Net | | | 0.4 | |
| | | | | |
Net Assets | | | 100.0 | % |
| | | | | |
See Accompanying Notes to Financial Statements
204
PORTFOLIO OF INVESTMENTS
ING International Equity Dividend Fund
as of October 31, 2008
| | | | | | | | | | | | | | | |
| Shares | | | | | | | | Value |
| |
| |
| |
COMMON STOCK: 96.8% |
| | | | | | | |
| | | | | | | Australia: 8.6% |
| | 40,159 | | | | | Australia & New Zealand Banking Group Ltd. | | $ | 470,764 | |
| | 71,286 | | | | | Crown Ltd. | | | 319,035 | |
| | 135,723 | | | | | Foster’s Group Ltd. | | | 518,841 | |
| | 163,037 | | | | | Insurance Australia Group | | | 412,993 | |
| | 192,238 | | | | | Macquarie Airports Management Ltd. | | | 273,396 | |
| | 64,079 | | | | | Suncorp-Metway Ltd. | | | 344,949 | |
| | 65,147 | | | | | TABCORP Holdings Ltd. | | | 298,674 | |
| | 32,792 | | | | | Wesfarmers Ltd. | | | 471,272 | |
| | | | | | | | | | | |
| | | | | | | | | | | | | | 3,109,924 | |
| | | | | | | | | | | | | | | |
| | | | | | | |
| | | | | | | Belgium: 3.1% |
| | 11,060 | | | | | Belgacom SA | | | 378,414 | |
| | 5,680 | | | | | Delhaize Group | | | 319,435 | |
| | 12,925 | | | | | Elia System Operator SA | | | 404,169 | |
| | | | | | | | | | | |
| | | | | | | | | | | | | | 1,102,018 | |
| | | | | | | | | | | | | | | |
| | | | | | | |
| | | | | | | Bermuda: 0.9% |
| | 79,008 | | | | | Hiscox Ltd. | | | 313,069 | |
| | | | | | | | | | | |
| | | | | | | | | | | | | | 313,069 | |
| | | | | | | | | | | | | | | |
| | | | | | | |
| | | | | | | Brazil: 0.6% |
| | 14,463 | | | | | Tele Norte Leste Participacoes SA ADR | | | 196,408 | |
| | | | | | | | | | | |
| | | | | | | | | | | | | | 196,408 | |
| | | | | | | | | | | | | | | |
| | | | | | | |
| | | | | | | Canada: 6.3% |
| | 22,738 | | | | | Bell Aliant Regional Communications Income Fund | | | 452,949 | |
| | 26,599 | | | | | Enerplus Resources Fund | | | 710,459 | |
| | 56,447 | | | | | Precision Drilling Trust | | | 608,820 | |
| | 16,581 | | | | | TransCanada Corp. | | | 501,021 | |
| | | | | | | | | | | |
| | | | | | | | | | | | | | 2,273,249 | |
| | | | | | | | | | | | | | | |
| | | | | | | |
| | | | | | | Finland: 2.3% |
| | 21,332 | | | | | Nokia OYJ | | | 326,768 | |
| | 35,973 | | | | | UPM-Kymmene OYJ | | | 508,670 | |
| | | | | | | | | | | |
| | | | | | | | | | | | | | 835,438 | |
| | | | | | | | | | | | | | | |
| | | | | | | |
| | | | | | | France: 12.5% |
| | 8,896 | | | | | Accor SA | | | 346,102 | |
| | 8,613 | | | | | BNP Paribas | | | 621,870 | |
| | 13,060 | | | | | Bouygues SA | | | 556,099 | |
| | 13,540 | | | | | France Telecom SA | | | 341,419 | |
| | 10,899 | | | | | Sanofi-Aventis | | | 690,530 | |
| | 14,220 | | | | | Total SA | | | 782,292 | |
| | 14,276 | | | | | Vinci SA | | | 513,756 | |
| | 24,349 | | | | | Vivendi | | | 636,462 | |
| | | | | | | | | | | |
| | | | | | | | | | | | | | 4,488,530 | |
| | | | | | | | | | | | | | | |
| | | | | | | |
| | | | | | | Germany: 3.8% |
| | 6,731 | | | | | Bayerische Motoren Werke AG | | | 170,901 | |
| | 17,636 | | | | | E.ON AG | | | 674,945 | |
| | 4,012 | | | | | Muenchener Rueckversicherungs AG | | | 531,466 | |
| | | | | | | | | | | |
| | | | | | | | | | | | | | 1,377,312 | |
| | | | | | | | | | | | | | | |
| | | | | | | |
| | | | | | | Hong Kong: 0.5% |
| | 27,500 | | | | | CLP Holdings Ltd. | | | 185,459 | |
| | | | | | | | | | | |
| | | | | | | | | | | | | | 185,459 | |
| | | | | | | | | | | | | | | |
| | | | | | | |
| | | | | | | Hungary: 0.7% |
| | 14,885 | | | | | Magyar Telekom Telecommunications PLC ADR | | | 236,672 | |
| | | | | | | | | | | |
| | | | | | | | | | | | | | 236,672 | |
| | | | | | | | | | | | | | | |
| | | | | | | |
| | | | | | | Ireland: 1.1% |
| | 59,608 | | | | | Allied Irish Banks PLC | | | 322,494 | |
| | 27,337 | | | | | Irish Life & Permanent PLC | | | 85,139 | |
| | | | | | | | | | | |
| | | | | | | | | | | | | | 407,633 | |
| | | | | | | | | | | | | | | |
| | | | | | | |
| | | | | | | Israel: 0.8% |
| | 127,069 | | | | | Bank Hapoalim BM | | | 287,737 | |
| | | | | | | | | | | |
| | | | | | | | | | | | | | 287,737 | |
| | | | | | | | | | | | | | | |
| | | | | | | |
| | | | | | | Italy: 9.9% |
| | 21,948 | | | | | Banche Popolari Unite Scpa | | | 370,266 | |
| | 93,021 | | | | | Enel S.p.A. | | | 622,335 | |
| | 32,571 | | | | | ENI S.p.A. | | | 777,410 | |
| | 134,564 | | | | | Intesa Sanpaolo S.p.A. | | | 492,490 | |
| | 32,363 | | | | | Italcementi S.p.A. RNC | | | 225,198 | |
| | 69,556 | | | | | Mediaset S.p.A. | | | 377,897 | |
| | 113,277 | | | | | Milano Assicurazioni S.p.A. | | | 370,323 | |
| | 403,385 | | | | | Telecom Italia S.p.A. RNC | | | 339,459 | |
| | | | | | | | | | | |
| | | | | | | | | | | | | | 3,575,378 | |
| | | | | | | | | | | | | | | |
| | | | | | | |
| | | | | | | Japan: 0.5% |
| | 500 | | | | | Nintendo Co., Ltd. | | | 160,654 | |
| | | | | | | | | | | |
| | | | | | | | | | | | | | 160,654 | |
| | | | | | | | | | | | | | | |
| | | | | | | |
| | | | | | | Netherlands: 5.1% |
| | 7,233 | | | | | Akzo Nobel NV | | | 300,647 | |
| | 13,176 | | | | | Randstad Holdings NV | | | 256,112 | |
| | 28,419 | | | | | Royal Dutch Shell PLC | | | 787,686 | |
| | 21,012 | | | | | Unilever NV | | | 506,379 | |
| | | | | | | | | | | |
| | | | | | | | | | | | | | 1,850,824 | |
| | | | | | | | | | | | | | | |
| | | | | | | |
| | | | | | | New Zealand: 0.8% |
| | 219,570 | | | | | Telecom Corp. of New Zealand Ltd. | | | 297,631 | |
| | | | | | | | | | | |
| | | | | | | | | | | | | | 297,631 | |
| | | | | | | | | | | | | | | |
| | | | | | | |
| | | | | | | Norway: 1.1% |
| | 65,562 | | | | | DnB NOR ASA | | | 379,954 | |
| | | | | | | | | | | |
| | | | | | | | | | | | | | 379,954 | |
| | | | | | | | | | | | | | | |
| | | | | | | |
| | | | | | | Poland: 0.8% |
| | 38,052 | | | | | Telekomunikacja Polska SA | | | 287,527 | |
| | | | | | | | | | | |
| | | | | | | | | | | | | | 287,527 | |
| | | | | | | | | | | | | | | |
| | | | | | | |
| | | | | | | Singapore: 0.7% |
| | 32,000 | | | | | DBS Group Holdings Ltd. | | | 244,272 | |
| | | | | | | | | | | |
| | | | | | | | | | | | | | 244,272 | |
| | | | | | | | | | | | | | | |
| | | | | | | |
| | | | | | | South Korea: 1.7% |
| | 19,179 | | | | | KT Corp. ADR | | | 240,696 | |
| | 7,524 | | | | | S-Oil Corp. | | | 381,211 | |
| | | | | | | | | | | |
| | | | | | | | | | | | | | 621,907 | |
| | | | | | | | | | | | | | | |
| | | | | | | |
| | | | | | | Spain: 5.9% |
| | 51,293 | | | | | Banco Bilbao Vizcaya Argentaria SA | | | 595,323 | |
| | 55,414 | | | | | Banco Santander Central Hispano SA | | | 599,312 | |
| | 76,580 | | | | | Iberdrola SA | | | 554,236 | |
| | 21,228 | | | | | Telefonica SA | | | 393,035 | |
| | | | | | | | | | | |
| | | | | | | | | | | | | | 2,141,906 | |
| | | | | | | | | | | | | | | |
| | | | | | | |
| | | | | | | Sweden: 2.0% |
| | 55,817 | | | | | Svenska Cellulosa AB — B Shares | | | 412,175 | |
| | 39,218 | | | | | Swedbank AB | | | 324,094 | |
| | | | | | | | | | | |
| | | | | | | | | | | | | | 736,269 | |
| | | | | | | | | | | | | | | |
| | | | | | | |
| | | | | | | Switzerland: 3.3% |
| | 10,566 | | | | | Novartis AG | | | 536,309 | |
| | 23,158 | | | | | STMicroelectronics NV | | | 190,366 | |
| | 2,265 | | | | | Zurich Financial Services AG | | | 459,518 | |
| | | | | | | | | | | |
| | | | | | | | | | | | | | 1,186,193 | |
| | | | | | | | | | | | | | | |
| | | | | | | |
| | | | | | | Taiwan: 1.1% |
| | 47,693 | | | | | Taiwan Semiconductor Manufacturing Co., Ltd. ADR | | | 393,944 | |
| | | | | | | | | | | |
| | | | | | | | | | | | | | 393,944 | |
| | | | | | | | | | | | | | | |
| | | | | | | | | | | | | | | |
See Accompanying Notes to Financial Statements
205
PORTFOLIO OF INVESTMENTS
ING International Equity Dividend Fund
as of October 31, 2008 (continued)
| | | | | | | | | | | | | | | |
| Shares | | | | | | | | Value |
| |
| |
| | | | | | | |
| | | | | | | Thailand: 0.7% |
| | 85,800 | | | | | Siam Cement PCL | | $ | 259,514 | |
| | | | | | | | | | | |
| | | | | | | | | | | | | | 259,514 | |
| | | | | | | | | | | | | | | |
| | | | | | | |
| | | | | | | United Kingdom: 22.0% |
| | 16,178 | | | | | AstraZeneca PLC | | | 685,599 | |
| | 67,395 | | | | | Aviva PLC | | | 402,011 | |
| | 111,162 | | | | | BBA Aviation PLC | | | 142,640 | |
| | 95,956 | | | | | BP PLC | | | 782,183 | |
| | 14,132 | | | | | British American Tobacco PLC | | | 387,631 | |
| | 162,451 | | | | | BT Group PLC | | | 305,253 | |
| | 11,066 | | | | | Carnival PLC | | | 243,358 | |
| | 382,532 | | | | | Cattles PLC | | | 204,019 | |
| | 17,075 | | | | | Diageo PLC | | | 260,573 | |
| | 33,133 | | | | | GlaxoSmithKline PLC | | | 636,947 | |
| | 40,065 | | | | | Greene King PLC | | | 206,901 | |
| | 55,989 | | | | | HSBC Holdings PLC | | | 663,145 | |
| | 74,471 | | | | | Marks & Spencer Group PLC | | | 264,012 | |
| | 63,360 | | | | | Rexam PLC | | | 381,795 | |
| | 34,193 | | | | | Scottish & Southern Energy PLC | | | 670,241 | |
| | 64,654 | | | | | Tate & Lyle PLC | | | 384,367 | |
| | 66,622 | | | | | United Utilities Group PLC | | | 752,295 | |
| | 291,612 | | | | | Vodafone Group PLC | | | 560,978 | |
| | | | | | | | | | | |
| | | | | | | | | | | | | | 7,933,948 | |
| | | | | | | | | | | | | | | |
| | | | | | | Total Common Stock
(Cost $55,299,756 ) | | | 34,883,370 | |
| | | | | | | | | | | |
| |
REAL ESTATE INVESTMENT TRUSTS: 1.2% |
| | | | | | | |
| | | | | | | Australia: 0.5% |
| | 15,845 | | | | | Westfield Group | | | 175,004 | |
| | | | | | | | | | | |
| | | | | | | | | | | | | | 175,004 | |
| | | | | | | | | | | | | | | |
| | | | | | | |
| | | | | | | Netherlands: 0.7% |
| | 4,578 | | | | | Corio NV | | | 244,647 | |
| | | | | | | | | | | |
| | | | | | | | | | | | | | 244,647 | |
| | | | | | | | | | | | | | | |
| | | | | | | Total Real Estate Investment Trusts
(Cost $652,790 ) | | | 419,651 | |
| | | | | | | | | | | |
| | | | | Total Investments in Securities |
| | | | | (Cost $55,952,546)* | | | 98.0 | % | | $ | 35,303,021 | |
| | | | | Other Assets and
Liabilities - Net | | | 2.0 | | | | 736,280 | |
| | | | | | | | | | | | | |
| | | | | Net Assets | | | 100.0 | % | | $ | 36,039,301 | |
| | | | | | | | | | | | | |
| | | |
| @ | | Non-income producing security |
| ADR | | American Depositary Receipt |
| | | |
| * | | Cost for federal income tax purposes is $56,539,947. |
| | | |
| | | Net unrealized depreciation consists of: |
| | | | | |
| Gross Unrealized Appreciation | | $ | 22,934 | |
| Gross Unrealized Depreciation | | | (21,259,860 | ) |
| | | | | |
| Net Unrealized Depreciation | | $ | (21,236,926 | ) |
| | | | | |
| | | | | |
| | | Percentage of
|
| Industry | | Net Assets |
|
| |
| Aerospace/Defense | | | 0.4 | % |
| Agriculture | | | 1.1 | |
| Auto Manufacturers | | | 0.5 | |
| Banks | | | 15.9 | |
| Beverages | | | 2.2 | |
| Building Materials | | | 1.3 | |
| Chemicals | | | 0.8 | |
| Commercial Services | | | 0.7 | |
| Diversified | | | 0.7 | |
| Diversified Financial Services | | | 0.8 | |
| Electric | | | 8.6 | |
| Engineering & Construction | | | 3.7 | |
| Entertainment | | | 0.8 | |
| Food | | | 3.4 | |
| Forest Products & Paper | | | 2.6 | |
| Insurance | | | 6.9 | |
| Leisure Time | | | 0.7 | |
| Lodging | | | 1.8 | |
| Media | | | 2.8 | |
| Miscellaneous Manufacturing | | | 1.3 | |
| Oil & Gas | | | 13.4 | |
| Packaging & Containers | | | 1.1 | |
| Pharmaceuticals | | | 7.1 | |
| Pipelines | | | 1.4 | |
| Retail | | | 1.3 | |
| Semiconductors | | | 1.6 | |
| Shopping Centers | | | 0.5 | |
| Telecommunications | | | 12.1 | |
| Toys/Games/Hobbies | | | 0.4 | |
| Water | | | 2.1 | |
| Other Assets and Liabilities — Net | | | 2.0 | |
| | | | | |
Net Assets | | | 100.0 | % |
| | | | | |
See Accompanying Notes to Financial Statements
206
PORTFOLIO OF INVESTMENTS
ING International Growth Opportunities Fund
as of October 31, 2008
| | | | | | | | | | | | | | | |
| Shares | | | | | | | | Value |
| |
| |
| |
COMMON STOCK: 97.8% |
| | | | | | | |
| | | | | | | Belgium: 3.6% |
| | 56,675 | | | L | | InBev NV | | $ | 2,285,882 | |
| | | | | | | | | | | |
| | | | | | | | | | | | | | 2,285,882 | |
| | | | | | | | | | | | | | | |
| | | | | | | |
| | | | | | | Brazil: 3.0% |
| | 166,600 | | | @ | | Cosan SA Industria e Comercio | | | 821,273 | |
| | 40,300 | | | | | Petroleo Brasileiro SA ADR | | | 1,083,667 | |
| | | | | | | | | | | |
| | | | | | | | | | | | | | 1,904,940 | |
| | | | | | | | | | | | | | | |
| | | | | | | |
| | | | | | | Canada: 8.2% |
| | 89,500 | | | | | Barrick Gold Corp. | | | 2,033,440 | |
| | 32,400 | | | | | EnCana Corp. | | | 1,645,940 | |
| | 29,600 | | | @,L | | Research In Motion Ltd. | | | 1,492,728 | |
| | | | | | | | | | | |
| | | | | | | | | | | | | | 5,172,108 | |
| | | | | | | | | | | | | | | |
| | | | | | | |
| | | | | | | China: 1.5% |
| | 97,649 | | | L | | Aluminum Corp. of China Ltd. ADR | | | 915,948 | |
| | | | | | | | | | | |
| | | | | | | | | | | | | | 915,948 | |
| | | | | | | | | | | | | | | |
| | | | | | | |
| | | | | | | Finland: 5.1% |
| | 150,350 | | | | | Nokia OYJ | | | 2,303,092 | |
| | 68,902 | | | | | Outotec OYJ | | | 920,852 | |
| | | | | | | | | | | |
| | | | | | | | | | | | | | 3,223,944 | |
| | | | | | | | | | | | | | | |
| | | | | | | |
| | | | | | | France: 1.7% |
| | 49,976 | | | @ | | Eutelsat Communications | | | 1,072,649 | |
| | | | | | | | | | | |
| | | | | | | | | | | | | | 1,072,649 | |
| | | | | | | | | | | | | | | |
| | | | | | | |
| | | | | | | Germany: 6.2% |
| | 46,442 | | | | | Bayer AG | | | 2,597,659 | |
| | 90,965 | | | | | GEA Group AG | | | 1,310,887 | |
| | | | | | | | | | | |
| | | | | | | | | | | | | | 3,908,546 | |
| | | | | | | | | | | | | | | |
| | | | | | | |
| | | | | | | Greece: 1.8% |
| | 52,860 | | | | | National Bank of Greece SA | | | 1,161,244 | |
| | | | | | | | | | | |
| | | | | | | | | | | | | | 1,161,244 | |
| | | | | | | | | | | | | | | |
| | | | | | | |
| | | | | | | Hong Kong: 5.8% |
| | 1,096,000 | | | | | Li & Fung Ltd. | | | 2,199,689 | |
| | 1,731,000 | | | | | New World Development Ltd. | | | 1,440,943 | |
| | | | | | | | | | | |
| | | | | | | | | | | | | | 3,640,632 | |
| | | | | | | | | | | | | | | |
| | | | | | | |
| | | | | | | Italy: 2.3% |
| | 121,242 | | | | | Prysmian S.p.A. | | | 1,470,795 | |
| | | | | | | | | | | |
| | | | | | | | | | | | | | 1,470,795 | |
| | | | | | | | | | | | | | | |
| | | | | | | |
| | | | | | | Japan: 10.9% |
| | 582 | | | | | Japan Tobacco, Inc. | | | 2,064,747 | |
| | 382,200 | | | | | Mitsubishi UFJ Financial Group, Inc. | | | 2,401,811 | |
| | 237,700 | | | | | Namco Bandai Holdings, Inc. | | | 2,444,364 | |
| | | | | | | | | | | |
| | | | | | | | | | | | | | 6,910,922 | |
| | | | | | | | | | | | | | | |
| | | | | | | |
| | | | | | | Russia: 4.4% |
| | 60,064 | | | @,L | | OAO Gazprom ADR | | | 1,196,059 | |
| | 15,308 | | | @,X | | Unified Energy System ADR | | | 1,561,416 | |
| | | | | | | | | | | |
| | | | | | | | | | | | | | 2,757,475 | |
| | | | | | | | | | | | | | | |
| | | | | | | |
| | | | | | | South Korea: 1.9% |
| | 44,498 | | | | | Hyundai Development Co. | | | 1,204,140 | |
| | | | | | | | | | | |
| | | | | | | | | | | | | | 1,204,140 | |
| | | | | | | | | | | | | | | |
| | | | | | | |
| | | | | | | Switzerland: 8.0% |
| | 33,898 | | | | | Credit Suisse Group | | | 1,267,577 | |
| | 66,469 | | | @,L | | Logitech International | | | 983,077 | |
| | | | | | | | | | | | | | | |
| | 96,040 | | | | | Xstrata PLC | | | | | | | 1,642,697 | |
| | 5,814 | | | | | Zurich Financial Services AG | | | 1,179,531 | |
| | | | | | | | | | | |
| | | | | | | | | | | | | | 5,072,882 | |
| | | | | | | | | | | | | | | |
| | | | | | | |
| | | | | | | Taiwan: 6.1% |
| | 607,522 | | | | | HON HAI Precision Industry Co., Ltd. | | | 1,466,373 | |
| | 1,178,600 | | | | | Synnex Technology International Corp. | | | 1,529,861 | |
| | 707,000 | | | | | Taiwan Fertilizer Co., Ltd. | | | 872,429 | |
| | | | | | | | | | | |
| | | | | | | | | | | | | | 3,868,663 | |
| | | | | | | | | | | | | | | |
| | | | | | | |
| | | | | | | United Kingdom: 27.3% |
| | 106,626 | | | | | Anglo American PLC | | | 2,675,378 | |
| | 1,631,060 | | | | | ARM Holdings PLC | | | 2,543,027 | |
| | 392,029 | | | | | Compass Group PLC | | | 1,822,967 | |
| | 344,204 | | | | | Game Group PLC | | | 722,023 | |
| | 86,743 | | | | | Imperial Tobacco Group PLC | | | 2,324,842 | |
| | 225,469 | | | | | Inmarsat PLC | | | 1,537,246 | |
| | 265,543 | | | | | International Power PLC | | | 949,980 | |
| | 50,176 | | | | | Reckitt Benckiser PLC | | | 2,122,433 | |
| | 459,527 | | | | | Tesco PLC | | | 2,517,797 | |
| | | | | | | | | | | |
| | | | | | | | | | | | | | 17,215,693 | |
| | | | | | | | | | | | | | | |
| | | | | | | Total Common Stock
(Cost $112,232,194) | | | 61,786,463 | |
| | | | | | | | | | | |
| |
PREFERRED STOCK: 0.5% |
| | | | | | | |
| | | | | | | Russia: 0.5% |
| | 609,051 | | | | | TNK-BP Holding | | | 298,435 | |
| | | | | | | | | | | |
| | | | | | | Total Preferred Stock
(Cost $1,769,776) | | | 298,435 | |
| | | | | | | | | | | |
| | | | | | | Total Long-Term Investments
(Cost $114,001,970) | | | 62,084,898 | |
| | | | | | | | | | | |
Principal
| | | | | | | | |
| Amount | | | | | | | | Value |
| |
| |
| |
SHORT-TERM INVESTMENTS: 9.7% |
| | | | | | | |
| | | | | | | Securities Lending Collateralcc: 9.7% |
| $ | 6,221,322 | | | | | Bank of New York Mellon Corp. Institutional Cash Reserves | | | | | | $ | 6,150,930 | |
| | | | | | | | | | | | | | | |
| | | | | | | Total Short-Term Investments
(Cost $6,221,322) | | | 6,150,930 | |
| | | | | | | | | | | |
| | | | | Total Investments in Securities |
| | | | | (Cost $120,223,292)* | | | 108.0 | % | | $ | 68,235,828 | |
| | | | | Other Assets and
Liabilities - Net | | | (8.0 | ) | | | (5,048,147 | ) |
| | | | | | | | | | | | | |
| | | | | Net Assets | | | 100.0 | % | | $ | 63,187,681 | |
| | | | | | | | | | | | | |
| | | |
| @ | | Non-income producing security |
| ADR | | American Depositary Receipt |
| cc | | Securities purchased with cash collateral for securities loaned. |
| L | | Loaned security, a portion or all of the security is on loan at October 31, 2008. |
| X | | Fair value determined by ING Funds Valuation Committee appointed by the Funds’ Board of Directors/Trustees. |
| | | |
| * | | Cost for federal income tax purposes is $120,358,239. |
| | | |
| | | Net unrealized depreciation consists of: |
| | | | | |
| Gross Unrealized Appreciation | | $ | — | |
| Gross Unrealized Depreciation | | | (52,122,411 | ) |
| | | | | |
| Net Unrealized Depreciation | | $ | (52,122,411 | ) |
| | | | | |
See Accompanying Notes to Financial Statements
207
PORTFOLIO OF INVESTMENTS
ING International Growth Opportunities Fund
as of October 31, 2008 (continued)
| | | | | |
| | | Percentage of
|
| Industry | | Net Assets |
|
| |
| Agriculture | | | 7.0 | % |
| Banks | | | 7.6 | |
| Beverages | | | 3.6 | |
| Chemicals | | | 5.5 | |
| Computers | | | 3.9 | |
| Distribution/Wholesale | | | 3.5 | |
| Electric | | | 4.0 | |
| Electrical Components & Equipment | | | 2.3 | |
| Electronics | | | 4.7 | |
| Food | | | 5.3 | |
| Food Service | | | 2.9 | |
| Holding Companies — Diversified | | | 4.5 | |
| Home Builders | | | 1.9 | |
| Household Products/Wares | | | 3.4 | |
| Insurance | | | 1.9 | |
| Machinery — Construction & Mining | | | 1.5 | |
| Mining | | | 11.5 | |
| Oil & Gas | | | 6.7 | |
| Real Estate | | | 2.3 | |
| Retail | | | 1.1 | |
| Semiconductors | | | 4.0 | |
| Telecommunications | | | 5.3 | |
| Toys/Games/Hobbies | | | 3.9 | |
| Short-Term Investments | | | 9.7 | |
| Other Assets and Liabilities — Net | | | (8.0 | ) |
| | | | | |
Net Assets | | | 100.0 | % |
| | | | | |
See Accompanying Notes to Financial Statements
208
PORTFOLIO OF INVESTMENTS
ING International Real Estate Fund
as of October 31, 2008
| | | | | | | | | | | | | | | |
| Shares | | | | | | | | Value |
| |
| |
| |
COMMON STOCK: 42.1% |
| | | | | | | | | | | | | | | |
| | | | | | | |
| | | | | | | Australia: 0.5% |
| | 487,100 | | | | | Lend Lease Corp., Ltd. | | $ | 2,253,932 | |
| | | | | | | | | | | |
| | | | | | | | | | | | | | 2,253,932 | |
| | | | | | | | | | | | | | | |
| | | | | | | |
| | | | | | | Brazil: 0.6% |
| | 671,900 | | | @ | | BR Malls Participacoes SA | | | 2,481,052 | |
| | | | | | | | | | | |
| | | | | | | | | | | | | | 2,481,052 | |
| | | | | | | | | | | | | | | |
| | | | | | | |
| | | | | | | Canada: 0.3% |
| | 129,250 | | | | | Brookfield Properties Co. (U.S. Denominated Security) | | | 1,304,133 | |
| | | | | | | | | | | |
| | | | | | | | | | | | | | 1,304,133 | |
| | | | | | | | | | | | | | | |
| | | | | | | |
| | | | | | | Finland: 0.5% |
| | 822,853 | | | | | Citycon OYJ | | | 1,950,190 | |
| | | | | | | | | | | |
| | | | | | | | | | | | | | 1,950,190 | |
| | | | | | | | | | | | | | | |
| | | | | | | |
| | | | | | | Germany: 0.6% |
| | 102,459 | | | | | Deutsche Euroshop AG | | | 2,625,601 | |
| | | | | | | | | | | |
| | | | | | | | | | | | | | 2,625,601 | |
| | | | | | | | | | | | | | | |
| | | | | | | |
| | | | | | | Hong Kong: 17.0% |
| | 3,117,300 | | | | | Cheung Kong Holdings Ltd. | | | 29,930,834 | |
| | 1,951,200 | | | | | Hang Lung Group Ltd. | | | 6,278,913 | |
| | 2,706,400 | | | | | Hang Lung Properties Ltd. | | | 6,613,072 | |
| | 1,869,600 | | | | | Hongkong Land Holdings Ltd. | | | 5,084,392 | |
| | 782,300 | | | | | Kerry Properties Ltd. | | | 1,965,173 | |
| | 3,953,700 | | | | | Sino Land Co. | | | 3,476,016 | |
| | 1,712,800 | | | | | Sun Hung Kai Properties Ltd. | | | 15,006,018 | |
| | 1,547,850 | | | | | Wharf Holdings Ltd. | | | 3,088,302 | |
| | | | | | | | | | | |
| | | | | | | | | | | | | | 71,442,720 | |
| | | | | | | | | | | | | | | |
| | | | | | | |
| | | | | | | India: 0.1% |
| | 382,800 | | | @ | | Unitech Ltd. (Global Instrument, Issuer: Macquarie Group Ltd.) | | | 374,672 | |
| | | | | | | | | | | |
| | | | | | | | | | | | | | 374,672 | |
| | | | | | | | | | | | | | | |
| | | | | | | |
| | | | | | | Japan: 18.0% |
| | 115,100 | | | | | Aeon Mall Co., Ltd. | | | 2,841,345 | |
| | 2,040,800 | | | | | Mitsubishi Estate Co., Ltd. | | | 36,455,525 | |
| | 1,502,700 | | | | | Mitsui Fudosan Co., Ltd. | | | 26,212,001 | |
| | 1,975 | | | | | NTT Urban Development Corp. | | | 2,026,171 | |
| | 504,600 | | | | | Sumitomo Realty & Development Co., Ltd. | | | 8,221,369 | |
| | | | | | | | | | | |
| | | | | | | | | | | | | | 75,756,411 | |
| | | | | | | | | | | | | | | |
| | | | | | | |
| | | | | | | Philippines: 0.3% |
| | 8,527,200 | | | | | Ayala Land, Inc. | | | 1,034,534 | |
| | | | | | | | | | | |
| | | | | | | | | | | | | | 1,034,534 | |
| | | | | | | | | | | | | | | |
| | | | | | | |
| | | | | | | Singapore: 1.2% |
| | 2,466,600 | | | | | CapitaLand Ltd. | | | 4,943,477 | |
| | | | | | | | | | | |
| | | | | | | | | | | | | | 4,943,477 | |
| | | | | | | | | | | | | | | |
| | | | | | | |
| | | | | | | Sweden: 1.3% |
| | 264,047 | | | | | Castellum AB | | | 1,792,437 | |
| | 589,301 | | | | | Hufvudstaden AB | | | 3,725,235 | |
| | | | | | | | | | | |
| | | | | | | | | | | | | | 5,517,672 | |
| | | | | | | | | | | | | | | |
| | | | | | | |
| | | | | | | Switzerland: 1.0% |
| | 96,890 | | | @ | | PSP Swiss Property AG | | | 4,191,968 | |
| | | | | | | | | | | |
| | | | | | | | | | | | | | 4,191,968 | |
| | | | | | | | | | | | | | | |
| | | | | | | |
| | | | | | | Thailand: 0.1% |
| | 1,929,000 | | | I | | Central Pattana PCL | | | 519,454 | |
| | | | | | | | | | | |
| | | | | | | | | | | | | | 519,454 | |
| | | | | | | | | | | | | | | |
| | | | | | | |
| | | | | | | United Kingdom: 0.6% |
| | 1,457,200 | | | I | | Safestore Holdings Ltd. | | | 2,182,625 | |
| | 90,700 | | | @,I | | Yatra Capital Ltd. | | | 464,752 | |
| | | | | | | | | | | |
| | | | | | | | | | | | | | 2,647,377 | |
| | | | | | | | | | | | | | | |
| | | | | | | Total Common Stock
(Cost $270,836,905 ) | | | 177,043,193 | |
| | | | | | | | | | | |
| |
REAL ESTATE INVESTMENT TRUSTS: 54.5% |
| | | | | | | Australia: 14.8% | | | | | | | | |
| | 4,759,300 | | | | | CFS Retail Property Trust | | | 6,401,888 | |
| | 3,293,700 | | | | | Challenger Diversified Property Group | | | 1,250,452 | |
| | 1,548,100 | | | | | Charter Hall Group | | | 460,363 | |
| | 1,563,500 | | | | | Commonwealth Property Office Fund | | | 1,381,595 | |
| | 5,028,600 | | | | | Dexus Property Group | | | 2,505,969 | |
| | 2,816,100 | | | | | GPT Group | | | 1,409,291 | |
| | 363,000 | | | | | Macquarie CountryWide Trust | | | 58,022 | |
| | 1,051,400 | | | | | Macquarie Goodman Group | | | 663,352 | |
| | 878,000 | | | | | Mirvac Group | | | 574,722 | |
| | 2,346,800 | | | | | Stockland | | | 6,310,729 | |
| | 3,727,939 | | | | | Westfield Group | | | 41,174,066 | |
| | | | | | | | | | | |
| | | | | | | | | | | | | | 62,190,449 | |
| | | | | | | | | | | | | | | |
| | | | | | | |
| | | | | | | Belgium: 0.6% |
| | 18,993 | | | | | Cofinimmo | | | 2,366,713 | |
| | | | | | | | | | | |
| | | | | | | | | | | | | | 2,366,713 | |
| | | | | | | | | | | | | | | |
| | | | | | | |
| | | | | | | Canada: 3.6% |
| | 102,800 | | | @,# | | Calloway Real Estate Investment Trust | | | 1,258,027 | |
| | 127,700 | | | | | Canadian Real Estate Investment Trust | | | 2,749,369 | |
| | 293,500 | | | | | Cominar Real Estate Investment Trust | | | 4,794,669 | |
| | 467,600 | | | | | RioCan Real Estate Investment Trust | | | 6,521,493 | |
| | | | | | | | | | | |
| | | | | | | | | | | | | | 15,323,558 | |
| | | | | | | | | | | | | | | |
| | | | | | | |
| | | | | | | France: 9.5% |
| | 78,530 | | | | | Klepierre | | | 1,808,846 | |
| | 131,451 | | | | | Mercialys | | | 4,281,026 | |
| | 18,349 | | | | | Societe Immobiliere de Location pour l’Industrie et le Commerce | | | 1,635,670 | |
| | 214,302 | | | | | Unibail | | | 32,142,049 | |
| | | | | | | | | | | |
| | | | | | | | | | | | | | 39,867,591 | |
| | | | | | | | | | | | | | | |
| | | | | | | |
| | | | | | | Germany: 0.2% |
| | 130,700 | | | | | Alstria Office AG | | | 835,746 | |
| | | | | | | | | | | |
| | | | | | | | | | | | | | 835,746 | |
| | | | | | | | | | | | | | | |
| | | | | | | |
| | | | | | | Hong Kong: 2.4% |
| | 5,685,800 | | | | | Link Real Estate Investment Trust | | | 10,166,300 | |
| | | | | | | | | | | |
| | | | | | | | | | | | | | 10,166,300 | |
| | | | | | | | | | | | | | | |
| | | | | | | |
| | | | | | | Japan: 7.8% |
| | 281 | | | | | Japan Logistics Fund, Inc. | | | 1,776,372 | |
| | 1,354 | | | | | Japan Real Estate Investment Corp. | | | 11,989,805 | |
| | 467 | | | | | Japan Retail Fund Investment Corp. | | | 1,686,616 | |
| | 968 | | | | | Kenedix Realty Investment Corp. | | | 1,402,985 | |
| | 118 | | | | | Nippon Accommodations Fund, Inc. | | | 578,115 | |
| | 1,177 | | | | | Nippon Building Fund, Inc. | | | 11,309,781 | |
| | 724 | | | | | Tokyu Real Estate Investment Trust, Inc. | | | 4,171,532 | |
| | | | | | | | | | | |
| | | | | | | | | | | | | | 32,915,206 | |
| | | | | | | | | | | | | | | |
| | | | | | | | | | | | | | | |
See Accompanying Notes to Financial Statements
209
PORTFOLIO OF INVESTMENTS
ING International Real Estate Fund
as of October 31, 2008 (continued)
| | | | | | | | | | | | | | | |
| Shares | | | | | | | | Value |
| |
| |
| | | | | | | |
| | | | | | | Netherlands: 3.7% |
| | 163,580 | | | | | Corio NV | | $ | 8,741,681 | |
| | 75,683 | | | | | Eurocommercial Properties NV | | | 2,506,222 | |
| | 53,200 | | | | | Wereldhave NV | | | 4,421,743 | |
| | | | | | | | | | | |
| | | | | | | | | | | | | | 15,669,646 | |
| | | | | | | | | | | | | | | |
| | | | | | | |
| | | | | | | Singapore: 2.8% |
| | 3,089,400 | | | @ | | Ascendas Real Estate Investment Trust | | | 3,437,813 | |
| | 3,650,300 | | | @ | | CapitaCommercial Trust | | | 2,507,675 | |
| | 3,451,781 | | | @ | | CapitaMall Trust | | | 4,577,434 | |
| | 3,667,500 | | | @ | | Macquarie MEAG Prime Real Estate Investment Trust | | | 1,296,663 | |
| | | | | | | | | | | |
| | | | | | | | | | | | | | 11,819,585 | |
| | | | | | | | | | | | | | | |
| | | | | | | |
| | | | | | | United Kingdom: 9.1% |
| | 560,300 | | | | | British Land Co. PLC | | | 5,587,077 | |
| | 298,327 | | | | | Brixton PLC | | | 802,439 | |
| | 121,600 | | | | | Derwent Valley Holdings PLC | | | 1,424,241 | |
| | 286,100 | | | | | Great Portland Estates PLC | | | 1,274,030 | |
| | 646,016 | | | | | Hammerson PLC | | | 7,445,663 | |
| | 826,580 | | | | | Land Securities Group PLC | | | 14,672,393 | |
| | 343,200 | | | | | Liberty International PLC | | | 3,818,657 | |
| | 512,800 | | | | | Segro PLC | | | 2,315,057 | |
| | 154,400 | | | | | Shaftesbury PLC | | | 830,500 | |
| | | | | | | | | | | |
| | | | | | | | | | | | | | 38,170,057 | |
| | | | | | | | | | | | | | | |
| | | | | | | Total Real Estate Investment Trusts
(Cost $373,807,797 ) | | | 229,324,851 | |
| | | | | | | | | | | |
| |
MUTUAL FUNDS: 0.1% |
| | | | | | | |
| | | | | | | Luxembourg: 0.1% |
| | 157,830 | | | | | Prologis European Properties | | | 523,022 | |
| | | | | | | | | | | |
| | | | | | | Total Mutual Funds
(Cost $2,113,686 ) | | | 523,022 | |
| | | | | | | | | | | |
| | | | | | | Total Long-Term Investments
(Cost $646,758,388 ) | | | 406,891,066 | |
| | | | | | | | | | | |
| |
SHORT-TERM INVESTMENTS: 2.8% |
| | | | | | | |
| | | | | | | Affiliated Mutual Fund: 2.8% |
| | 11,711,220 | | | | | ING Institutional Prime Money Market Fund | | | 11,711,220 | |
| | | | | | | | | | | |
| | | | | | | Total Short-Term Investments
(Cost $11,711,220 ) | | | 11,711,220 | |
| | | | | | | | | | | |
| | | | | Total Investments in Securities |
| | | | | (Cost $658,469,608)* | | | 99.5 | % | | $ | 418,602,286 | |
| | | | | Other Assets and
Liabilities - Net | | | 0.5 | | | | 2,219,141 | |
| | | | | | | | | | | | | |
| | | | | Net Assets | | | 100.0 | % | | $ | 420,821,427 | |
| | | | | | | | | | | | | |
| | | |
| @ | | Non-income producing security |
| # | | Securities with purchases pursuant to Rule 144A or section 4(2), under the Securities Act of 1933 and may not be resold subject to that rule except to qualified institutional buyers. Unless otherwise noted, these securities have been determined to be liquid under the guidelines established by the Funds’ Board of Directors/Trustees. |
| I | | Illiquid Security |
| | | |
| * | | Cost for federal income tax purposes is $695,532,774. |
| | | |
| | | Net unrealized depreciation consists of: |
| | | | | |
| Gross Unrealized Appreciation | | $ | — | |
| Gross Unrealized Depreciation | | | (276,930,488 | ) |
| | | | | |
| Net Unrealized Depreciation | | $ | (276,930,488 | ) |
| | | | | |
| | | | | |
| | | Percentage of
|
| Industry | | Net Assets |
|
| |
| Apartments | | | 0.1 | % |
| Closed-End Funds | | | 0.1 | |
| Diversified | | | 28.3 | |
| Engineering & Construction | | | 0.1 | |
| Holding Companies — Diversified | | | 0.8 | |
| Office Property | | | 8.3 | |
| Real Estate | | | 40.7 | |
| Shopping Centers | | | 17.4 | |
| Storage/Warehousing | | | 0.5 | |
| Warehouse/Industrial | | | 0.4 | |
| Short-Term Investments | | | 2.8 | |
| Other Assets and Liabilities — Net | | | 0.5 | |
| | | | | |
Net Assets | | | 100.0 | % |
| | | | | |
See Accompanying Notes to Financial Statements
210
PORTFOLIO OF INVESTMENTS
ING International SmallCap Multi-Manager Fund
as of October 31, 2008
| | | | | | | | | | | | | | | |
| Shares | | | | | | | | Value |
| |
| |
| |
COMMON STOCK: 97.2% |
| | | | | | | | | | | | | | | |
| | | | | | | |
| | | | | | | Australia: 4.9% |
| | 319,200 | | | | | Aditya Birla Minerals Ltd. | | $ | 58,316 | |
| | 90,080 | | | | | Ansell Ltd. | | | 757,810 | |
| | 84,614 | | | | | Ausenco Ltd. | | | 245,572 | |
| | 2,757,924 | | | @ | | Australian Worldwide Exploration Ltd. | | | 4,606,891 | |
| | 225,105 | | | @ | | Babcock & Brown Capital Ltd. | | | 293,806 | |
| | 18,268 | | | | | Bank of Queensland Ltd. | | | 163,518 | |
| | 171,385 | | | | | Bradken Ltd. | | | 565,229 | |
| | 652,480 | | | @ | | Carbon Energy Ltd. | | | 125,780 | |
| | 1,638,624 | | | | | Centennial Coal Co., Ltd. | | | 3,853,340 | |
| | 157,637 | | | | | Computershare Ltd. | | | 891,202 | |
| | 124,306 | | | | | Downer EDI Ltd. | | | 403,692 | |
| | 141,393 | | | | | Flight Centre Ltd. | | | 1,323,523 | |
| | 88,364 | | | @ | | Iluka Resources Ltd. | | | 213,671 | |
| | 201,300 | | | | | Incitec Pivot Ltd. | | | 539,690 | |
| | 81,161 | | | L | | JB Hi-Fi Ltd. | | | 476,425 | |
| | 53,813 | | | @ | | Karoon Gas Australia Ltd. | | | 77,192 | |
| | 30,599 | | | | | MacArthur Coal Ltd. | | | 123,507 | |
| | 183,999 | | | | | Macmahon Holdings Ltd. | | | 89,305 | |
| | 65,686 | | | | | Mineral Resources Ltd. | | | 108,755 | |
| | 449,400 | | | @,X | | Mount Gibson Iron Ltd. | | | 120,953 | |
| | 673,856 | | | @,I | | Octaviar Ltd. | | | 62,693 | |
| | 226,821 | | | | | PMP Ltd. | | | 145,828 | |
| | 350,154 | | | | | Publishing & Broadcasting Ltd. | | | 479,155 | |
| | 162,860 | | | @ | | Riversdale Mining Ltd. | | | 332,519 | |
| | 491,660 | | | | | Seven Network Ltd. | | | 2,063,296 | |
| | 5,061 | | | | | Sims Group Ltd. | | | 48,533 | |
| | 23,076 | | | | | Sonic Healthcare Ltd. | | | 210,884 | |
| | 42,938 | | | | | Spotless Group Ltd. | | | 72,063 | |
| | 151,200 | | | | | Straits Resources Ltd. | | | 131,806 | |
| | 430,430 | | | | | Sunland Group Ltd. | | | 284,584 | |
| | 149,714 | | | | | Tower Australia Group Ltd. | | | 209,517 | |
| | 54,610 | | | | | Transpacific Industries Group Ltd. | | | 130,026 | |
| | 35,074 | | | | | United Group Ltd. | | | 222,564 | |
| | | | | | | | | | | |
| | | | | | | | | | 19,431,645 | |
| | | | | | | | | | | |
| | | | | | | |
| | | | | | | Austria: 0.4% |
| | 11,000 | | | | | Andritz AG | | | 313,260 | |
| | 10,504 | | | @ | | bwin Interactive Entertainment | | | 189,795 | |
| | 10,000 | | | | | Kapsch TrafficCom AG | | | 205,250 | |
| | 20,000 | | | | | Rosenbauer International AG | | | 499,770 | |
| | 12,000 | | | | | Schoeller-Bleckmann Oilfield Equipment AG | | | 425,952 | |
| | | | | | | | | | | |
| | | | | | | | | | 1,634,027 | |
| | | | | | | | | | | |
| | | | | | | |
| | | | | | | Belgium: 1.4% |
| | 52,991 | | | @ | | AGFA-Gevaert NV | | | 221,788 | |
| | 4,005 | | | | | Bekaert SA | | | 394,103 | |
| | 4,915 | | | | | D’ieteren SA | | | 752,941 | |
| | 18,500 | | | | | EVS Broadcast Equipment SA | | | 1,194,622 | |
| | 9,294 | | | | | Mobistar SA | | | 616,750 | |
| | 15,000 | | | | | Oriflame Cosmetics SA | | | 468,622 | |
| | 39,700 | | | @ | | Telenet Group Holding NV | | | 616,598 | |
| | 29,855 | | | | | Tessenderlo Chemie NV | | | 1,181,038 | |
| | | | | | | | | | | |
| | | | | | | | | | 5,446,462 | |
| | | | | | | | | | | |
| | | | | | | |
| | | | | | | Bermuda: 0.7% |
| | 227,988 | | | | | Catlin Group Ltd. | | | 1,274,031 | |
| | 166,200 | | | | | Hiscox Ltd. | | | 658,567 | |
| | 156,142 | | | | | Lancashire Holdings Ltd. | | | 861,578 | |
| | | | | | | | | | | |
| | | | | | | | | | 2,794,176 | |
| | | | | | | | | | | |
| | | | | | | |
| | | | | | | British Virgin Islands: 0.0% |
| | 14,069 | | | | | Empire Online Ltd. | | | 3,170 | |
| | | | | | | | | | | |
| | | | | | | | | | 3,170 | |
| | | | | | | | | | | |
| | | | | | | |
| | | | | | | Canada: 6.2% |
| | 31,598 | | | @ | | Aastra Technologies Ltd. | | | 271,334 | |
| | 17,856 | | | @ | | ACE Aviation Holdings, Inc. | | | 81,480 | |
| | 11,600 | | | | | Aecon Group, Inc. | | | 72,277 | |
| | 40,800 | | | | | AGF Management Ltd. | | | 449,196 | |
| | 28,400 | | | @ | | Air Canada | | | 118,756 | |
| | 36,700 | | | | | Alimentation Couche-Tard, Inc. | | | 494,794 | |
| | 11,100 | | | | | Atco Ltd. | | | 362,295 | |
| | 11,400 | | | @ | | Atrium Innovations, Inc. | | | 99,217 | |
| | 177,900 | | | | | Biovail Corp. | | | 1,529,116 | |
| | 17,800 | | | | | Cascades, Inc. | | | 72,216 | |
| | 704,728 | | | @ | | Celestica, Inc. | | | 3,408,749 | |
| | 340,913 | | | @ | | CGI Group, Inc. — Class A | | | 2,720,968 | |
| | 49,239 | | | | | Chemtrade Logistics Income Fund | | | 456,726 | |
| | 61,900 | | | | | Daylight Resources Trust | | | 405,716 | |
| | 66,100 | | | | | Dorel Industries, Inc. | | | 1,453,289 | |
| | 8,200 | | | | | Emera, Inc. | | | 146,067 | |
| | 3,100 | | | | | Empire Co., Ltd. | | | 118,311 | |
| | 69,300 | | | | | Gerdau AmeriSteel Corp. | | | 370,850 | |
| | 10,376 | | | | | Home Capital Group, Inc. | | | 240,267 | |
| | 7,300 | | | | | Industrial Alliance Insurance | | | 151,415 | |
| | 12,700 | | | | | Jean Coutu Group, Inc. | | | 76,813 | |
| | 21,500 | | | | | Keyera Facilities Income Fund | | | 325,720 | |
| | 24,884 | | | | | Laurentian Bank of Canada | | | 843,987 | |
| | 21,000 | | | | | Manitoba Telecom Services, Inc. | | | 742,048 | |
| | 9,600 | | | | | Maple Leaf Foods, Inc. | | | 65,869 | |
| | 337,200 | | | | | Methanex Corp. | | | 3,829,974 | |
| | 12,100 | | | | | Metro, Inc. — Class A | | | 304,683 | |
| | 18,400 | | | | | Northbridge Financial Corp. | | | 456,756 | |
| | 44,467 | | | | | Nova Chemicals Corp. | | | 577,374 | |
| | 27,600 | | | | | Onex Corp. | | | 477,441 | |
| | 50,600 | | | @ | | Open Text Corp. | | | 1,282,947 | |
| | 1,300 | | | @ | | Pan Orient Energy Corp. | | | 5,231 | |
| | 105,960 | | | @ | | QuADRa Mining Ltd. | | | 439,559 | |
| | 14,900 | | | @ | | Rona, Inc. | | | 145,254 | |
| | 92,467 | | | | | Superior Plus Income Fund | | | 919,837 | |
| | 3,100 | | | | | West Fraser Timber Co., Ltd. | | | 82,329 | |
| | 33,700 | | | @ | | Westjet Airlines Ltd. | | | 292,180 | |
| | 70,600 | | | | | Westshore Terminals Income Fund | | | 644,907 | |
| | | | | | | | | | | |
| | | | | | | | | | 24,535,948 | |
| | | | | | | | | | | |
| | | | | | | |
| | | | | | | China: 0.3% |
| | 175,000 | | | | | Beijing Jingkelong Co., Ltd. | | | 40,767 | |
| | 238,000 | | | | | China Molybdenum Co., Ltd. | | | 74,529 | |
| | 302,000 | | | | | China National Building Material Co., Ltd. | | | 175,871 | |
| | 6,207 | | | | | Ctrip.com International Ltd. ADR | | | 189,810 | |
| | 268,000 | | | | | People’s Food Holdings Ltd. | | | 73,319 | |
| | 122,000 | | | | | Stella International Holdings Ltd. | | | 102,861 | |
| | 847,000 | | | | | SunVic Chemical Holdings Ltd. | | | 87,812 | |
| | 742,000 | | | | | Want Want China Holdings Ltd. | | | 279,370 | |
| | | | | | | | | | | |
| | | | | | | | | | 1,024,339 | |
| | | | | | | | | | | |
| | | | | | | |
| | | | | | | Denmark: 1.1% |
| | 6,250 | | | @ | | Alm. Brand Skadesforsikring A/S | | | 84,711 | |
| | 5,251 | | | | | Amagerbanken A/S | | | 60,601 | |
| | 2,175 | | | | | Coloplast A/S | | | 157,699 | |
| | 24,600 | | | | | East Asiatic Co., Ltd. A/S | | | 838,823 | |
| | 63,400 | | | | | H Lundbeck A/S | | | 1,132,615 | |
| | 74,360 | | | | | Sydbank A/S | | | 1,155,728 | |
| | 47,700 | | | @ | | TK Development | | | 206,236 | |
| | 1,775 | | | @ | | Topdanmark A/S | | | 191,766 | |
| | 7,100 | | | | | TrygVesta A/S | | | 426,917 | |
| | | | | | | | | | | |
| | | | | | | | | | 4,255,096 | |
| | | | | | | | | | | |
| | | | | | | |
| | | | | | | Finland: 0.9% |
| | 20,000 | | | | | Elisa OYJ | | | 300,850 | |
| | 100,000 | | | | | F-Secure OYJ | | | 311,935 | |
| | 83,484 | | | | | KCI Konecranes OYJ | | | 1,418,686 | |
| | 46,200 | | | | | OKO Bank | | | 621,601 | |
| | 59,937 | | | | | Oriola-KD OYJ | | | 116,241 | |
| | 5,791 | | | | | Orion OYJ | | | 85,099 | |
| | 6,651 | | | | | Sanoma-WSOY OYJ | | | 101,787 | |
| | 19,308 | | | | | Sponda OYJ | | | 86,507 | |
See Accompanying Notes to Financial Statements
211
PORTFOLIO OF INVESTMENTS
ING International SmallCap Multi-Manager Fund
as of October 31, 2008 (continued)
| | | | | | | | | | | | | | | |
| Shares | | | | | | | | Value |
| |
| |
| | | | | | | Finland (continued) |
| | 16,921 | | | | | Tietoenator OYJ | | $ | 187,663 | |
| | 7,400 | | | | | Wartsila OYJ | | | 187,489 | |
| | 14,307 | | | | | YIT OYJ | | | 89,093 | |
| | | | | | | | | | | |
| | | | | | | | | | 3,506,951 | |
| | | | | | | | | | | |
| | | | | | | |
| | | | | | | France: 5.4% |
| | 13,000 | | | | | Altamir Amboise | | | 52,122 | |
| | 25,592 | | | @ | | Alten | | | 644,954 | |
| | 51,700 | | | @ | | Altran Technologies SA | | | 259,816 | |
| | 6,643 | | | | | Bacou Dalloz | | | 408,607 | |
| | 63,080 | | | | | Beneteau SA | | | 586,519 | |
| | 23,345 | | | | | BioMerieux | | | 1,895,467 | |
| | 8,814 | | | | | Bonduelle S.C.A. | | | 739,408 | |
| | 1,820 | | | | | Bongrain SA | | | 101,214 | |
| | 12,700 | | | | | Bourbon SA | | | 358,092 | |
| | 9,610 | | | | | CNP Assurances | | | 774,354 | |
| | 1,300 | | | @ | | Easydentic | | | 23,931 | |
| | 157,381 | | | @ | | Groupe Eurotunnel SA | | | 1,079,464 | |
| | 21,242 | | | @ | | Homair SA | | | 52,958 | |
| | 45,374 | | | | | IMS-International Metal Service | | | 802,665 | |
| | 14,800 | | | | | Ipsen | | | 562,548 | |
| | 12,000 | | | | | Lagardere SCA | | | 477,121 | |
| | 9,000 | | | @ | | Meetic | | | 126,905 | |
| | 10,256 | | | | | Nexans SA | | | 585,002 | |
| | 1,972 | | | | | Pierre & Vacances | | | 90,310 | |
| | 196,071 | | | | | Rallye SA | | | 3,971,259 | |
| | 7,200 | | | | | Rubis | | | 398,782 | |
| | 27,900 | | | @ | | Saft Groupe SA | | | 815,107 | |
| | 24,900 | | | | | SEB SA | | | 836,706 | |
| | 4,718 | | | | | Sopra Group SA | | | 209,366 | |
| | 17,600 | | | @ | | Store Electronic | | | 268,994 | |
| | 13,000 | | | | | Sword Group | | | 229,630 | |
| | 13,716 | | | | | Teleperformance | | | 295,972 | |
| | 384,843 | | | @ | | Thomson | | | 539,570 | |
| | 40,949 | | | @ | | UbiSoft Entertainment | | | 2,164,532 | |
| | 55,474 | | | | | Valeo SA | | | 966,307 | |
| | 3,700 | | | | | Virbac SA | | | 242,002 | |
| | 24,900 | | | | | Zodiac SA | | | 973,628 | |
| | | | | | | | | | | |
| | | | | | | | | | 21,533,312 | |
| | | | | | | | | | | |
| | | | | | | |
| | | | | | | Germany: 7.8% |
| | 58,681 | | | | | Aareal Bank AG | | | 473,302 | |
| | 47,813 | | | | | Adidas AG | | | 1,637,321 | |
| | 5,189 | | | | | AMB Generali Holding AG | | | 567,481 | |
| | 48,630 | | | @,L | | Arques Industries AG | | | 175,914 | |
| | 22,450 | | | | | Bauer AG | | | 800,409 | |
| | 56,528 | | | | | Bechtle AG | | | 746,608 | |
| | 13,000 | | | | | Bilfinger Berger AG | | | 588,120 | |
| | 7,200 | | | @ | | Centrotherm Photovoltaics AG | | | 212,295 | |
| | 49,823 | | | | | Demag Cranes AG | | | 966,896 | |
| | 2,359 | | | | | Fielmann AG | | | 131,454 | |
| | 10,353 | | | | | Fresenius Medical Care AG & Co. KGaA | | | 463,088 | |
| | 16,600 | | | | | GEA Group AG | | | 239,221 | |
| | 3,546 | | | | | Gerry Weber International AG | | | 65,586 | |
| | 4,336 | | | | | Gesco AG | | | 199,067 | |
| | 240,385 | | | | | Gildemeister AG | | | 2,344,863 | |
| | 11,000 | | | | | Grenkeleasing AG | | | 300,837 | |
| | 56,873 | | | | | Hannover Rueckversicheru — Reg | | | 1,410,796 | |
| | 7,000 | | | | | Hawesko Holding AG | | | 150,079 | |
| | 30,934 | | | | | IWKA AG | | | 537,462 | |
| | 6,200 | | | | | K+S AG | | | 241,102 | |
| | 44,667 | | | @ | | KarstadtQuelle AG | | | 107,773 | |
| | 155,609 | | | | | Kloeckner & Co. AG | | | 2,269,309 | |
| | 7,945 | | | | | Koenig & Bauer AG | | | 85,960 | |
| | 751 | | | | | KWS Saat AG | | | 92,781 | |
| | 35,450 | | | | | Leoni AG | | | 449,175 | |
| | 7,390 | | | | | MAN AG | | | 358,899 | |
| | 167,732 | | | | | Medion AG | | | 1,573,992 | |
| | 2,750 | | | @ | | Morphosys AG | | | 168,656 | |
| | 204,919 | | | | | MTU Aero Engines Holding AG | | | 4,038,139 | |
| | 152,287 | | | | | Norddeutsche Affinerie AG | | | 4,876,170 | |
| | 1,098 | | | @ | | Open Business Club AG | | | 35,966 | |
| | 13,750 | | | | | Phoenix Solar AG | | | 419,423 | |
| | 20,550 | | | | | Rheinmetall AG | | | 626,283 | |
| | 37,535 | | | | | Salzgitter AG | | | 2,468,373 | |
| | 29,100 | | | | | Tognum AG | | | 324,563 | |
| | 5,800 | | | | | Wacker Chemie AG | | | 631,106 | |
| | | | | | | | | | | |
| | | | | | | | | | 30,778,469 | |
| | | | | | | | | | | |
| | | | | | | |
| | | | | | | Greece: 0.3% |
| | 149,223 | | | | | Anek Lines SA | | | 211,818 | |
| | 16,000 | | | @ | | Babis Vovos International Technical Co. | | | 299,908 | |
| | 4,900 | | | | | Fourlis Holdings SA | | | 54,503 | |
| | 7,200 | | | | | Frigoglass SA | | | 45,103 | |
| | 7,700 | | | | | Hellenic Exchanges SA Holding Clearing Settlement and Registry | | | 67,285 | |
| | 7,000 | | | | | Jumbo SA | | | 71,056 | |
| | 68,570 | | | | | Sidenor Steel Production & Manufacturing Co. SA | | | 303,057 | |
| | 31,664 | | | | | Veterin SA | | | 45,411 | |
| | | | | | | | | | | |
| | | | | | | | | | 1,098,141 | |
| | | | | | | | | | | |
| | | | | | | |
| | | | | | | Hong Kong: 2.6% |
| | 310,000 | | | | | Agile Property Holdings Ltd. | | | 103,007 | |
| | 246,000 | | | | | China Everbright Ltd. | | | 230,979 | |
| | 160,000 | | | | | China Insurance International Holdings Co., Ltd. | | | 373,014 | |
| | 320,000 | | | | | China Pharmaceutical Group Ltd. | | | 63,045 | |
| | 108,000 | | | | | Citic Pacific Ltd. | | | 69,677 | |
| | 474,400 | | | | | Dah Sing Banking Group Ltd. | | | 264,445 | |
| | 490,000 | | | | | First Pacific Co. | | | 197,959 | |
| | 4,408,000 | | | @ | | Global Green Tech Group Ltd. | | | 200,002 | |
| | 176,000 | | | | | Hang Lung Group Ltd. | | | 566,364 | |
| | 71,000 | | | | | Hysan Development Co., Ltd. | | | 111,332 | |
| | 180,000 | | | | | Industrial & Commercial Bank of China (Asia) Ltd. | | | 189,675 | |
| | 147,436 | | | | | Jinhui Shipping & Transportation Ltd. | | | 198,860 | |
| | 750,000 | | | | | Luk Fook Holdings International Ltd. | | | 179,715 | |
| | 2,002,000 | | | | | Midland Holdings Ltd. | | | 833,267 | |
| | 7,128,000 | | | | | Minmetals Resources Ltd. | | | 704,590 | |
| | 105,000 | | | | | MTR Corp. | | | 232,673 | |
| | 23,700 | | | | | Nam Tai Electronics, Inc. | | | 180,120 | |
| | 935,870 | | | | | OM Holdings Ltd. | | | 676,812 | |
| | 5,494,221 | | | | | Pacific Basin Shipping Ltd. | | | 2,941,866 | |
| | 850,000 | | | | | Prime Success International Group | | | 171,051 | |
| | 848,000 | | | @ | | Regal Hotels International Holdings Ltd. | | | 157,563 | |
| | 260,000 | | | | | Shenyin Wanguo HK Ltd. | | | 82,456 | |
| | 656,000 | | | | | Shougang Concord Century Holding | | | 22,772 | |
| | 62,385 | | | @ | | Sino Union Petroleum & Chemical International Ltd. | | | 4,261 | |
| | 6,898,000 | | | | | Sinolink Worldwide Holdings | | | 396,071 | |
| | 124,000 | | | | | Techtronic Industries Co. | | | 46,967 | |
| | 42,000 | | | | | Television Broadcasts Ltd. | | | 116,804 | |
| | 604,000 | | | | | Texwinca Holdings Ltd. | | | 282,277 | |
| | 168,194 | | | | | Vtech Holdings Ltd. | | | 626,473 | |
| | | | | | | | | | | |
| | | | | | | | | | 10,224,097 | |
| | | | | | | | | | | |
| | | | | | | |
| | | | | | | India: 0.7% |
| | 12,126 | | | | | Axis Bank Ltd. | | | 140,458 | |
| | 10,698 | | | | | Bajaj Auto Ltd. | | | 74,395 | |
| | 26,410 | | | | | Bank of Baroda | | | 129,658 | |
| | 85,241 | | | | | Canara Bank | | | 286,406 | |
| | 341,170 | | | | | Chambal Fertilizers & Chemicals Ltd. | | | 319,563 | |
| | 171,923 | | | | | Chennai Petroleum Corp., Ltd. | | | 428,305 | |
| | 90,344 | | | | | Great Eastern Shipping Co., Ltd. | | | 410,111 | |
| | 78,162 | | | | | Indian Bank | | | 207,751 | |
See Accompanying Notes to Financial Statements
212
PORTFOLIO OF INVESTMENTS
ING International SmallCap Multi-Manager Fund
as of October 31, 2008 (continued)
| | | | | | | | | | | | | | | |
| Shares | | | | | | | | Value |
| |
| |
| | | | | | | India (continued) |
| | 46,794 | | | | | Satyam Computer Services Ltd. | | $ | 288,287 | |
| | 12,486 | | | | | Tata Steel Ltd. | | | 54,424 | |
| | 9,356 | | | | | Tata Tea Ltd. | | | 98,120 | |
| | 228,314 | | | | | UCO Bank | | | 131,657 | |
| | 35,927 | | | | | Union Bank of India | | | 92,523 | |
| | | | | | | | | | | |
| | | | | | | | | | 2,661,658 | |
| | | | | | | | | | | |
| | | | | | | |
| | | | | | | Ireland: 0.5% |
| | 12,000 | | | | | DCC PLC | | | 187,687 | |
| | 2,100 | | | | | FBD Holdings PLC | | | 30,576 | |
| | 137,552 | | | | | Glanbia PLC | | | 526,203 | |
| | 37,200 | | | | | Kerry Group PLC | | | 846,619 | |
| | 55,700 | | | | | United Drug PLC | | | 216,432 | |
| | | | | | | | | | | |
| | | | | | | | | | 1,807,517 | |
| | | | | | | | | | | |
| | | | | | | |
| | | | | | | Israel: 0.1% |
| | 55,000 | | | @ | | Oridion Systems Ltd. | | | 348,107 | |
| | | | | | | | | | | |
| | | | | | | | | | 348,107 | |
| | | | | | | | | | | |
| | | | | | | |
| | | | | | | Italy: 1.8% |
| | 41,100 | | | | | ACEA S.p.A. | | | 535,914 | |
| | 249,974 | | | @ | | AS Roma S.p.A. | | | 191,472 | |
| | 84,000 | | | | | Azimut Holding S.p.A. | | | 482,141 | |
| | 48,655 | | | | | BasicNet S.p.A. | | | 81,865 | |
| | 100,900 | | | | | Brembo S.p.A. | | | 748,785 | |
| | 278,000 | | | | | CIR-Compagnie Industriali Riunite S.p.A. | | | 298,639 | |
| | 12,299 | | | | | Davide Campari-Milano S.p.A. | | | 85,847 | |
| | 38,500 | | | | | ERG S.p.A. | | | 514,734 | |
| | 2,941 | | | | | Fondiaria-Sai S.p.A. | | | 55,252 | |
| | 815 | | | @ | | GreenergyCapital S.p.A. | | | 516 | |
| | 122,821 | | | | | Indesit Co. S.p.A. | | | 1,000,665 | |
| | 110,500 | | | | | Landi Renzo S.p.A. | | | 415,409 | |
| | 226,700 | | | | | Maire Tecnimont S.p.A. | | | 413,527 | |
| | 117,247 | | | | | Parmalat S.p.A | | | 205,860 | |
| | 80,714 | | | | | Premafin Finanziaria S.p.A. | | | 143,615 | |
| | 30,163 | | | | | Prima Industrie S.p.A. | | | 383,657 | |
| | 82,100 | | | | | Prysmian S.p.A. | | | 995,961 | |
| | 128,734 | | | | | Recordati S.p.A. | | | 608,442 | |
| | 9,900 | | | | | Trevi Finanziaria S.p.A. | | | 115,033 | |
| | | | | | | | | | | |
| | | | | | | | | | 7,277,334 | |
| | | | | | | | | | | |
| | | | | | | |
| | | | | | | Japan: 26.2% |
| | 34,000 | | | | | 77 Bank Ltd. | | | 160,189 | |
| | 58,000 | | | | | Adores, Inc. | | | 107,074 | |
| | 33,700 | | | | | Aica Kogyo Co., Ltd. | | | 299,163 | |
| | 66,000 | | | | | Aichi Machine Industry Co., Ltd. | | | 130,656 | |
| | 8,176 | | | | | Aisan Industry Co., Ltd. | | | 52,218 | |
| | 295,200 | | | @ | | Allied Telesis Holdings KK | | | 118,760 | |
| | 11,400 | | | | | Aloka Co., Ltd. | | | 94,103 | |
| | 31,600 | | | | | Alpen Co., Ltd. | | | 549,506 | |
| | 65,700 | | | | | Alpine Electronics, Inc. | | | 577,955 | |
| | 56,200 | | | | | Alps Electric Co., Ltd. | | | 309,168 | |
| | 232,000 | | | | | Aozora Bank Ltd. | | | 193,723 | |
| | 36,800 | | | | | Arcs Co., Ltd. | | | 524,211 | |
| | 63 | | | | | Bals Corp. | | | 77,280 | |
| | 7,000 | | | | | Bank of Kyoto Ltd. | | | 73,631 | |
| | 58,000 | | | | | Calsonic Kansei Corp. | | | 100,473 | |
| | 35,400 | | | | | Canon Sales Co., Inc. | | | 592,212 | |
| | 130,000 | | | | | Century Leasing System, Inc. | | | 852,252 | |
| | 1,008,000 | | | @ | | Chori Co., Ltd. | | | 1,036,307 | |
| | 85,000 | | | | | Chugoku Marine Paints Ltd. | | | 432,686 | |
| | 13,000 | | | | | Chuo Denki Kogyo Co., Ltd. | | | 93,916 | |
| | 34,100 | | | | | Circle K Sunkus Co., Ltd. | | | 579,750 | |
| | 213,000 | | | | | Cosmo Oil Co., Ltd. | | | 453,108 | |
| | 97,900 | | | | | CSK Corp. | | | 818,256 | |
| | 83,000 | | | | | Daido Steel Co., Ltd. | | | 263,071 | |
| | 64,000 | | | | | Daihatsu Diesel Manufacturing Co., Ltd. | | | 308,952 | |
| | 57,000 | | | | | Daiichi Jitsugyo Co., Ltd. | | | 162,846 | |
| | 13,100 | | | | | Daiichikosho Co., Ltd. | | | 112,424 | |
| | 52,000 | | | | | Daishi Bank Ltd. | | | 202,483 | |
| | 12,000 | | | | | Daito Bank Ltd. | | | 7,944 | |
| | 5,200 | | | | | Daito Trust Construction Co., Ltd. | | | 219,362 | |
| | 235,000 | | | | | Daiwa Industries Ltd. | | | 627,918 | |
| | 32,300 | | | | | DC Co., Ltd. | | | 77,516 | |
| | 67,900 | | | | | DCM Japan Holdings Co., Ltd. | | | 497,648 | |
| | 63,000 | | | | | Dowa Holdings Co., Ltd. | | | 189,881 | |
| | 11,200 | | | | | DTS Corp. | | | 92,757 | |
| | 20,000 | | | | | Eagle Industry Co., Ltd. | | | 65,657 | |
| | 12,000 | | | | | Excel Co., Ltd. | | | 82,107 | |
| | 47,400 | | | | | Exedy Corp. | | | 679,109 | |
| | 51,800 | | | | | FamilyMart Co., Ltd. | | | 2,052,270 | |
| | 5,400 | | | | | Fancl Corp. | | | 67,704 | |
| | 15,900 | | | | | Ferrotec Corp. | | | 175,929 | |
| | 25,000 | | | | | Fuji Heavy Industries Ltd. | | | 87,942 | |
| | 80,000 | | | | | Fuji Machine Manufacturing Co., Ltd. | | | 690,812 | |
| | 40,100 | | | | | Fuji Oil Co., Ltd. | | | 460,335 | |
| | 9,000 | | | | | Fuji Soft, Inc. | | | 151,069 | |
| | 38,000 | | | | | Fujikura Kasei Co., Ltd. | | | 201,900 | |
| | 17,300 | | | | | Fujitsu Frontech Ltd. | | | 124,005 | |
| | 16,000 | | | | | Furukawa-Sky Aluminum Corp. | | | 31,948 | |
| | 23,400 | | | | | Futaba Industrial Co., Ltd. | | | 145,725 | |
| | 755 | | | | | Geo Co., Ltd. | | | 548,942 | |
| | 6,500 | | | | | Glory Ltd. | | | 93,152 | |
| | 152 | | | | | Gourmet Navigator, Inc. | | | 300,434 | |
| | 28,000 | | | | | Gunma Bank Ltd. | | | 142,972 | |
| | 224,000 | | | | | Hanwa Co., Ltd. | | | 591,332 | |
| | 17,400 | | | | | HIS Co., Ltd. | | | 251,869 | |
| | 22,000 | | | | | Hisaka Works Ltd. | | | 253,697 | |
| | 5,800 | | | | | Hitachi Information Systems Ltd. | | | 107,632 | |
| | 31,100 | | | | | Hitachi Software Engineering Co., Ltd. | | | 438,667 | |
| | 36,400 | | | | | Hitachi Transport System Ltd. | | | 486,774 | |
| | 23,000 | | | | | Hokkoku Bank Ltd. | | | 86,585 | |
| | 139,400 | | | | | Hosiden Corp. | | | 1,463,959 | |
| | 98,000 | | | | | Hosokawa Micron Corp. | | | 369,373 | |
| | 31,000 | | | | | Hyakugo Bank Ltd. | | | 174,117 | |
| | 19,000 | | | | | Hyakujushi Bank Ltd. | | | 94,840 | |
| | 68,600 | | | | | IBJ Leasing Co., Ltd. | | | 829,393 | |
| | 9,100 | | | | | Ichiyoshi Securities Co., Ltd. | | | 72,869 | |
| | 5,900 | | | | | Icom, Inc. | | | 113,436 | |
| | 754 | | | @ | | IDU Co. | | | 48,314 | |
| | 65,400 | | | | | Inabata & Co., Ltd. | | | 246,326 | |
| | 125,900 | | | | | Ines Corp. | | | 629,870 | |
| | 4,800 | | | | | Information Services International-Dentsu Ltd. | | | 30,484 | |
| | 35,100 | | | | | Inui Steamship Co., Ltd. | | | 264,702 | |
| | 41,037 | | | @ | | IT Holdings Corp. | | | 442,951 | |
| | 13,300 | | | | | Itochu Techno-Solutions Corp. | | | 311,643 | |
| | 241,000 | | | | | Itoham Foods, Inc. | | | 739,921 | |
| | 45,000 | | | | | Izumiya Co., Ltd. | | | 267,397 | |
| | 5,000 | | | @ | | Izutsuya Co., Ltd. | | | 2,631 | |
| | 778,000 | | | | | JFE Shoji Holdings, Inc. | | | 2,455,708 | |
| | 69,000 | | | | | Jidosha Buhin Kogyo Co., Ltd. | | | 127,484 | |
| | 176,000 | | | | | J-Oil Mills, Inc. | | | 711,809 | |
| | 40,300 | | | | | JSP Corp. | | | 281,902 | |
| | 12,000 | | | | | Kagawa Bank Ltd. | | | 66,821 | |
| | 29,000 | | | | | Kagoshima Bank Ltd. | | | 183,855 | |
| | 25,000 | | | | | Kaken Pharmaceutical Co., Ltd. | | | 207,632 | |
| | 2,102,000 | | | @ | | Kanematsu Corp. | | | 1,681,387 | |
| | 122,400 | | | | | Kanto Auto Works Ltd. | | | 1,487,313 | |
| | 17,333 | | | | | Kanto Tsukuba Bank Ltd. | | | 76,062 | |
| | 108,000 | | | | | Kawai Musical Instruments Manufacturing Co., Ltd. | | | 102,956 | |
| | 24,600 | | | L | | Keiyo Co., Ltd. | | | 128,271 | |
| | 25,000 | | | | | Kikkoman Corp. | | | 252,078 | |
| | 45,000 | | | | | Kinden Corp. | | | 375,738 | |
| | 16,000 | | | | | Kintetsu World Express, Inc. | | | 232,222 | |
| | 172,000 | | | | | Kinugawa Rubber Industrial Co., Ltd. | | | 242,082 | |
| | 1,170 | | | @ | | KK DaVinci Advisors | | | 94,869 | |
| | 3,700 | | | | | Kobayashi Pharmaceutical Co., Ltd. | | | 118,545 | |
See Accompanying Notes to Financial Statements
213
PORTFOLIO OF INVESTMENTS
ING International SmallCap Multi-Manager Fund
as of October 31, 2008 (continued)
| | | | | | | | | | | | | | | |
| Shares | | | | | | | | Value |
| |
| |
| | | | | | | Japan (continued) |
| | 93,000 | | | | | Koito Manufacturing Co., Ltd. | | $ | 722,203 | |
| | 629 | | | @ | | Kurimoto Ltd. | | | 432 | |
| | 24,800 | | | | | Kuroda Electric Co., Ltd. | | | 193,333 | |
| | 28,100 | | | | | Kyoden Co., Ltd. | | | 24,246 | |
| | 36,000 | | | | | Kyodo Printing Co., Ltd. | | | 82,022 | |
| | 436,000 | | | | | Kyodo Shiryo Co., Ltd. | | | 497,060 | |
| | 324 | | | | | Kyoei Tanker Co., Ltd. | | | 713 | |
| | 80,000 | | | | | Kyowa Exeo Corp. | | | 784,371 | |
| | 2,500 | | | | | Lawson, Inc. | | | 122,191 | |
| | 26,000 | | | | | Lintec Corp. | | | 304,193 | |
| | 145,000 | | | | | Marudai Food Co., Ltd. | | | 350,928 | |
| | 38,900 | | | | | Matsumotokiyoshi Holdings Co., Ltd. | | | 762,562 | |
| | 42,000 | | | | | Meiji Dairies Corp. | | | 191,561 | |
| | 43,000 | | | | | Meiji Seika Kaisha Ltd. | | | 175,833 | |
| | 18,500 | | | | | Mikuni Coca-Cola Bottling Co., Ltd. | | | 177,132 | |
| | 24,212 | | | | | Mimasu Semiconductor Industry Co., Ltd. | | | 216,534 | |
| | 32,000 | | | | | Ministop Co., Ltd. | | | 594,092 | |
| | 93,000 | | | | | Miraca Holdings, Inc. | | | 1,499,786 | |
| | 1,133,000 | | | | | Mitsubishi Paper Mills Ltd. | | | 1,631,708 | |
| | 99,000 | | | | | Mitsubishi Steel Manufacturing Co., Ltd. | | | 281,118 | |
| | 264,000 | | | | | Mitsui Sugar Co., Ltd. | | | 927,592 | |
| | 6,900 | | | | | Miura Co., Ltd. | | | 141,733 | |
| | 76,200 | | | | | Musashi Seimitsu Industry Co., Ltd. | | | 956,215 | |
| | 22,000 | | | | | Nabtesco Corp. | | | 134,174 | |
| | 92,000 | | | | | Nachi-Fujikoshi Corp. | | | 186,656 | |
| | 30,000 | | | | | Nagoya Railroad Co., Ltd. | | | 93,297 | |
| | 4,183 | | | | | Namura Shipbuilding Co., Ltd. | | | 9,617 | |
| | 11,400 | | | | | NEC Leasing Ltd. | | | 100,453 | |
| | 14,600 | | | | | NEC Networks & System Integration Corp. | | | 165,452 | |
| | 635 | | | | | Net One systems Co., Ltd. | | | 1,035,772 | |
| | 144,000 | | | | | NHK Spring Co., Ltd. | | | 580,351 | |
| | 17,000 | | | | | Nichi-iko Pharmaceutical Co., Ltd. | | | 359,288 | |
| | 562,000 | | | | | Nichirei Corp. | | | 2,384,151 | |
| | 12,200 | | | | | Nidec Copal Corp. | | | 111,338 | |
| | 64,700 | | | | | Nifco, Inc. | | | 950,941 | |
| | 7,980 | | | | | Nihon Chouzai Co., Ltd. | | | 122,143 | |
| | 37,000 | | | | | Nihon Parkerizing Co., Ltd. | | | 436,314 | |
| | 36,200 | | | | | Nihon Unisys Ltd. | | | 348,227 | |
| | 81,000 | | | | | Nippon Chemical Industrial Co., Ltd. | | | 142,797 | |
| | 199,000 | | | | | Nippon Denko Co., Ltd. | | | 912,314 | |
| | 37,000 | | | | | Nippon Flour Mills Co., Ltd. | | | 168,267 | |
| | 8,000 | | | | | Nippon Meat Packers, Inc. | | | 109,728 | |
| | 660 | | | | | Nippon Paper Group, Inc. | | | 1,763,945 | |
| | 23,000 | | | | | Nippon Seiki Co., Ltd. | | | 152,295 | |
| | 94,000 | | | | | Nippon Shinyaku Co., Ltd. | | | 929,346 | |
| | 86,000 | | | | | Nippon Soda Co., Ltd. | | | 244,636 | |
| | 137,000 | | | | | Nippon Steel Trading Co., Ltd. | | | 230,557 | |
| | 67,000 | | | | | Nippon Synthetic Chemical Industry Co., Ltd. | | | 155,598 | |
| | 71,000 | | | | | Nippon Thompson Co., Ltd. | | | 355,560 | |
| | 36,000 | | | | | Nipro Corp. | | | 551,911 | |
| | 49,400 | | | @ | | NIS Group Co., Ltd. | | | 19,683 | |
| | 17,000 | | | | | Nishimatsuya Chain Co. Ltd. | | | 171,299 | |
| | 228,000 | | | | | Nishi-Nippon City Bank Ltd. | | | 496,708 | |
| | 310,000 | | | | | Nissan Shatai Co., Ltd. | | | 2,024,732 | |
| | 174,000 | | | | | Nissay Dowa General Insurance Co., Ltd. | | | 774,006 | |
| | 8,500 | | | | | Nissha Printing Co., Ltd. | | | 472,683 | |
| | 168,000 | | | | | Nisshin Oillio Group Ltd. | | | 794,641 | |
| | 93,000 | | | | | Nisshin Steel Co., Ltd. | | | 124,544 | |
| | 1,700 | | | | | Nissin Food Products Co., Ltd. | | | 48,594 | |
| | 27,300 | | | | | Nitta Corp. | | | 305,041 | |
| | 199,000 | | | | | Nittetsu Mining Co., Ltd. | | | 509,720 | |
| | 2,370 | | | | | Obic Co., Ltd. | | | 290,094 | |
| | 33,000 | | | | | Ogaki Kyoritsu Bank Ltd. | | | 163,997 | |
| | 40,512 | | | | | Oiles Corp. | | | 437,736 | |
| | 39,000 | | | | | Oita Bank Ltd. | | | 242,077 | |
| | 18,000 | | | | | OJI Paper Co., Ltd. | | | 68,725 | |
| | 218,000 | | | @ | | Oki Electric Industry Ltd. | | | 180,528 | |
| | 36,670 | | | | | Okinawa Electric Power Co., Inc. | | | 2,149,878 | |
| | 106,000 | | | | | O-M Ltd. | | | 420,708 | |
| | 90 | | | | | Optex Co., Ltd. | | | 834 | |
| | 16,500 | | | | | Pigeon Corp. | | | 479,353 | |
| | 210 | | | | | Pilot Corp. | | | 411,839 | |
| | 192,300 | | | | | Pioneer Corp. | | | 570,434 | |
| | 26,500 | | | | | QP Corp. | | | 304,712 | |
| | 194 | | | | | Raysum Co., Ltd. | | | 65,515 | |
| | 71,016 | | | | | Ricoh Leasing Co., Ltd. | | | 956,067 | |
| | 16,700 | | | | | Right On Co., Ltd. | | | 228,630 | |
| | 3,400 | | | | | Rinnai Corp. | | | 124,333 | |
| | 600 | | | L | | Round One Corp. | | | 301,339 | |
| | 105,300 | | | L | | Saizeriya Co., Ltd. | | | 1,562,771 | |
| | 292,000 | | | | | Sanden Corp. | | | 816,547 | |
| | 22,000 | | | | | San-In Godo Bank Ltd. | | | 157,483 | |
| | 375,500 | | | @,L | | Sanix, Inc. | | | 509,465 | |
| | 140,000 | | | | | Sanki Engineering Co., Ltd. | | | 907,683 | |
| | 332,000 | | | @ | | Sanyo Electric Co., Ltd. | | | 503,939 | |
| | 144,000 | | | | | Sanyo Special Steel Co., Ltd. | | | 412,467 | |
| | 2,200 | | | | | Sato Corp. | | | 21,989 | |
| | 4,500 | | | | | Shimachu Co., Ltd. | | | 102,633 | |
| | 118,000 | | | | | Shinmaywa Industries Ltd. | | | 309,614 | |
| | 292,000 | | | | | Shinsho Corp. | | | 530,657 | |
| | 101,000 | | | | | Shizuoka Gas Co., Ltd. | | | 492,280 | |
| | 67,800 | | | | | Showa Shell Sekiyu KK | | | 553,877 | |
| | 72,800 | | | | | Siix Corp. | | | 227,292 | |
| | 1,638 | | | | | Sky Perfect Jsat Corp. | | | 617,836 | |
| | 22,100 | | | | | Sumida Corp. | | | 126,387 | |
| | 611,000 | | | | | Sumikin Bussan Corp. | | | 1,276,673 | |
| | 63,200 | | | | | Sumitomo Densetsu Co., Ltd. | | | 358,799 | |
| | 21,220 | | | | | Sumitomo Real Estate Sales | | | 574,985 | |
| | 5,200 | | | | | Suzuken Co., Ltd. | | | 111,106 | |
| | 48,600 | | | | | Tachi-S Co., Ltd. | | | 227,104 | |
| | 96,000 | | | | | Taihei Kogyo Co., Ltd. | | | 220,865 | |
| | 75,580 | | | | | Takefuji Corp. | | | 607,639 | |
| | 77,000 | | | | | Tanabe Seiyaku Co., Ltd. | | | 810,399 | |
| | 87,000 | | | | | TBK Co., Ltd. | | | 168,052 | |
| | 1,225 | | | | | Telepark Corp. | | | 1,030,535 | |
| | 7,500 | | | | | TKC Corp. | | | 132,824 | |
| | 483,000 | | | @ | | Toa Corp. | | | 597,299 | |
| | 138,000 | | | | | TOA Road Corp. | | | 129,785 | |
| | 382,000 | | | | | Toagosei Co., Ltd. | | | 819,706 | |
| | 28,000 | | | | | Toho Gas Co., Ltd. | | | 161,617 | |
| | 61,600 | | | | | Toho Pharmaceutical Co., Ltd. | | | 660,425 | |
| | 496 | | | | | Tohto Suisan Co., Ltd. | | | 656 | |
| | 246,000 | | | | | Tokyo Dome Corp. | | | 803,267 | |
| | 136,000 | | | | | Tokyo Tekko Co., Ltd. | | | 311,679 | |
| | 7,900 | | | | | Tokyo Tomin Bank Ltd. | | | 106,361 | |
| | 2,700 | | | | | Tokyu Community Corp. | | | 38,498 | |
| | 248,000 | | | @ | | Tonichi Carlife Group, Inc. | | | 115,637 | |
| | 131,000 | | | | | Toshiba Tec Corp. | | | 404,487 | |
| | 200,000 | | | | | Toyo Engineering Corp. | | | 574,864 | |
| | 304,000 | | | | | Toyo Kohan Co., Ltd. | | | 894,253 | |
| | 237,000 | | | | | Toyo Securities Co., Ltd. | | | 432,082 | |
| | 55,700 | | | | | Toyo Seikan Kaisha Ltd. | | | 687,203 | |
| | 17,000 | | | | | Toyo Suisan Kaisha Ltd. | | | 438,321 | |
| | 325,000 | | | | | Toyo Tire & Rubber Co., Ltd. | | | 798,646 | |
| | 24,700 | | | | | Toyoda Gosei Co., Ltd. | | | 346,779 | |
| | 129,800 | | | | | Toyota Auto Body Co., Ltd. | | | 2,080,948 | |
| | 24,000 | | | | | Trusco Nakayama Corp. | | | 315,033 | |
| | 118,600 | | | | | TS Tech Co., Ltd. | | | 888,395 | |
| | 207,000 | | | | | Tsubakimoto Chain Co. | | | 577,369 | |
| | 37,000 | | | | | Tsudakoma Corp. | | | 37,721 | |
| | 3,600 | | | | | Tsumura & Co. | | | 92,132 | |
| | 6,300 | | | | | Tsuruha Holdings, Inc. | | | 154,420 | |
| | 9,500 | | | | | Tsutsumi Jewelry Co., Ltd. | | | 185,079 | |
| | 129,000 | | | | | Ube Industries Ltd. | | | 271,423 | |
| | 82,000 | | | | | Uchida Yoko Co., Ltd. | | | 345,735 | |
| | 1,200 | | | | | Uni-Charm Corp. | | | 86,069 | |
| | 17,200 | | | | | Union Tool Co. | | | 381,404 | |
See Accompanying Notes to Financial Statements
214
PORTFOLIO OF INVESTMENTS
ING International SmallCap Multi-Manager Fund
as of October 31, 2008 (continued)
| | | | | | | | | | | | | | | |
| Shares | | | | | | | | Value |
| |
| |
| | | | | | | Japan (continued) |
| | 12,400 | | | | | Unipres Corp. | | $ | 101,585 | |
| | 244,588 | | | @ | | Usen Corp. | | | 334,262 | |
| | 41,000 | | | | | U-Shin Ltd. | | | 224,359 | |
| | 14,000 | | | I | | Waseda Academy Co., Ltd. | | | 120,800 | |
| | 7,400 | | | | | Weathernews, Inc. | | | 87,544 | |
| | 418 | | | | | Works Applications Co., Ltd. | | | 256,850 | |
| | 57 | | | | | Wowow, Inc. | | | 55,955 | |
| | 11,000 | | | | | Yamanashi Chuo Bank Ltd. | | | 62,564 | |
| | 38,500 | | | | | Yamato Kogyo Co., Ltd. | | | 909,900 | |
| | 73,000 | | | | | Yamazaki Baking Co., Ltd. | | | 969,943 | |
| | 345,200 | | | | | Yamazen Corp. | | | 1,090,705 | |
| | 31,000 | | | | | Yonekyu Corp. | | | 352,338 | |
| | 10,200 | | | | | Yorozu Corp. | | | 84,195 | |
| | 1,124,000 | | | | | Yuasa Trading Co., Ltd. | | | 1,130,680 | |
| | 7,700 | | | | | Yusen Air & Sea Service Co., Ltd. | | | 82,676 | |
| | | | | | | | | | | |
| | | | | | | | | | 103,721,613 | |
| | | | | | | | | | | |
| | | | | | | |
| | | | | | | Liechtenstein: 0.0% |
| | 1,051 | | | | | Verwalt & Privat-Bank AG | | | 145,798 | |
| | | | | | | | | | | |
| | | | | | | | | | 145,798 | |
| | | | | | | | | | | |
| | | | | | | |
| | | | | | | Luxembourg: 0.3% |
| | 28,756 | | | | | GAGFAH SA | | | 165,675 | |
| | 1,325,618 | | | | | Regus PLC | | | 997,355 | |
| | | | | | | | | | | |
| | | | | | | | | | 1,163,030 | |
| | | | | | | | | | | |
| | | | | | | |
| | | | | | | Malaysia: 0.3% |
| | 825,200 | | | | | Kulim Malaysia BHD | | | 911,693 | |
| | 1,142,300 | | | | | Lion Industries Corp. Bhd | | | 202,359 | |
| | | | | | | | | | | |
| | | | | | | | | | 1,114,052 | |
| | | | | | | | | | | |
| | | | | | | |
| | | | | | | Mexico: 0.2% |
| | 229,705 | | | @ | | Grupo Simec SAB de CV | | | 424,867 | |
| | 194,702 | | | @ | | Industrias CH SA — Series B | | | 393,111 | |
| | | | | | | | | | | |
| | | | | | | | | | 817,978 | |
| | | | | | | | | | | |
| | | | | | | |
| | | | | | | Netherlands: 2.6% |
| | 4,800 | | | | | Accell Group | | | 109,165 | |
| | 20,000 | | | | | Arcadis NV | | | 236,697 | |
| | 58,184 | | | L | | Draka Holding | | | 702,608 | |
| | 15,000 | | | | | Exact Holding NV | | | 349,839 | |
| | 25,600 | | | | | Fugro NV | | | 914,798 | |
| | 15,100 | | | @ | | Gemalto NV | | | 423,061 | |
| | 17,600 | | | | | Grontmij | | | 383,647 | |
| | 58,800 | | | | | Imtech NV | | | 898,311 | |
| | 38,000 | | | | | Innoconcepts | | | 309,156 | |
| | 60,763 | | | | | James Hardie Industries NV | | | 172,819 | |
| | 17,900 | | | | | Koninklijke DSM NV | | | 498,487 | |
| | 14,500 | | | | | Nutreco Holding NV | | | 462,313 | |
| | 302,736 | | | | | OCE NV | | | 1,400,978 | |
| | 38,700 | | | | | SBM Offshore NV | | | 680,735 | |
| | 16,000 | | | @ | | Smartrac NV | | | 225,689 | |
| | 16,850 | | | | | SNS Reaal | | | 123,606 | |
| | 45,424 | | | | | Ten Cate NV | | | 963,089 | |
| | 20,740 | | | | | TKH Group NV | | | 330,555 | |
| | 13,849 | | | | | Unit 4 Agresso NV | | | 207,445 | |
| | 11,973 | | | | | USG People NV | | | 125,142 | |
| | 168,944 | | | @ | | Van der Moolen Holding NV | | | 574,962 | |
| | | | | | | | | | | |
| | | | | | | | | | 10,093,102 | |
| | | | | | | | | | | |
| | | | | | | |
| | | | | | | New Zealand: 0.2% |
| | 15,713 | | | | | Contact Energy Ltd. | | | 66,619 | |
| | 124,911 | | | | | Fisher & Paykel Healthcare Corp. | | | 217,732 | |
| | 56,550 | | | | | Fletcher Building Ltd. | | | 192,019 | |
| | 117,488 | | | | | Telecom Corp. of New Zealand Ltd. | | | 159,257 | |
| | | | | | | | | | | |
| | | | | | | | | | 635,627 | |
| | | | | | | | | | | |
| | | | | | | |
| | | | | | | Norway: 0.2% |
| | 127,950 | | | @ | | Norske Skogindustrier ASA | | | 441,036 | |
| | 50,095 | | | @ | | ODIM ASA | | | 305,328 | |
| | 45,000 | | | @ | | Pronova BioPharma AS | | | 116,906 | |
| | 60,000 | | | @ | | StepStone ASA | | | 68,634 | |
| | | | | | | | | | | |
| | | | | | | | | | 931,904 | |
| | | | | | | | | | | |
| | | | | | | |
| | | | | | | Philippines: 0.0% |
| | 857,000 | | | | | Energy Development Corp. | | | 52,030 | |
| | 4,770 | | | | | Globe Telecom, Inc. | | | 88,578 | |
| | | | | | | | | | | |
| | | | | | | | | | 140,608 | |
| | | | | | | | | | | |
| | | | | | | |
| | | | | | | Poland: 0.0% |
| | 1,646 | | | @ | | Grupa Lotos SA | | | 11,650 | |
| | | | | | | | | | | |
| | | | | | | | | | 11,650 | |
| | | | | | | | | | | |
| | | | | | | |
| | | | | | | Portugal: 0.1% |
| | 58,100 | | | | | Jeronimo Martins | | | 296,497 | |
| | | | | | | | | | | |
| | | | | | | | | | 296,497 | |
| | | | | | | | | | | |
| | | | | | | |
| | | | | | | Singapore: 2.5% |
| | 720,000 | | | # | | ARA Asset Management Ltd. | | | 160,216 | |
| | 285,000 | | | | | Aztech Systems Ltd. | | | 19,775 | |
| | 186,000 | | | | | ComfortDelgro Corp., Ltd. | | | 152,566 | |
| | 288,000 | | | | | Goodpack Ltd. | | | 240,715 | |
| | 452,000 | | | | | Hong Leong Asia Ltd. | | | 183,146 | |
| | 89,000 | | | | | Jardine Cycle & Carriage Ltd. | | | 570,880 | |
| | 3,765,000 | | | | | LC Development Ltd. | | | 221,140 | |
| | 1,865,000 | | | | | Macquarie International Infrastructure Fund Ltd. | | | 496,555 | |
| | 1,973,000 | | | I | | Meiban Group Ltd. | | | 159,649 | |
| | 5,970,000 | | | | | Mercator Lines Singapore Ltd. | | | 603,566 | |
| | 67,000 | | | | | MobileOne Ltd. | | | 59,646 | |
| | 399,960 | | | L | | Neptune Orient Lines Ltd. | | | 337,809 | |
| | 950,000 | | | @,L | | Oceanus Group Ltd. | | | 91,809 | |
| | 148,000 | | | | | Parkway Holdings Ltd. | | | 158,681 | |
| | 3,810,000 | | | | | Singapore Petroleum Co., Ltd. | | | 5,433,587 | |
| | 164,000 | | | | | Singapore Post Ltd. | | | 78,649 | |
| | 317,000 | | | | | SMRT Corp., Ltd. | | | 333,903 | |
| | 102,000 | | | | | StarHub Ltd. | | | 165,598 | |
| | 336,000 | | | I | | Super Coffeemix Manufacturing Ltd. | | | 111,048 | |
| | 51,000 | | | | | Venture Corp., Ltd. | | | 186,373 | |
| | 223,000 | | | | | Yanlord Land Group Ltd. | | | 114,401 | |
| | 4,188,000 | | | @ | | Yongnam Holdings Ltd. | | | 174,286 | |
| | | | | | | | | | | |
| | | | | | | | | | 10,053,998 | |
| | | | | | | | | | | |
| | | | | | | |
| | | | | | | South Africa: 0.1% |
| | 51,148 | | | | | Aveng Ltd. | | | 252,878 | |
| | 21,752 | | | | | Murray & Roberts Holdings Ltd. | | | 147,262 | |
| | 11,324 | | | | | Sappi Ltd. | | | 69,811 | |
| | | | | | | | | | | |
| | | | | | | | | | 469,951 | |
| | | | | | | | | | | |
| | | | | | | |
| | | | | | | South Korea: 2.5% |
| | 26,822 | | | | | C-motech Co., Ltd. | | | 161,068 | |
| | 21,280 | | | | | Dongbu Insurance Co., Ltd. | | | 216,656 | |
| | 64,790 | | | | | Dongbu Steel Co., Ltd. | | | 317,311 | |
| | 10,540 | | | | | Dongkuk Steel Mill Co., Ltd. | | | 171,393 | |
| | 24,720 | | | @ | | Forhuman Co., Ltd. | | | 146,292 | |
| | 99,680 | | | | | From30 Co., Ltd. | | | 199,949 | |
| | 12,700 | | | | | Global & Yuasa Battery Co., Ltd. | | | 122,245 | |
| | 88,434 | | | @,L | | Halim Co., Ltd. | | | 79,340 | |
| | 8,470 | | | | | Hana Financial Group, Inc. | | | 134,514 | |
| | 10,820 | | | | | Hanshin Construction | | | 83,402 | |
| | 710 | | | @ | | Hite Brewery Co., Ltd. | | | 94,872 | |
| | 5,470 | | | @ | | Hite Holdings Co., Ltd. | | | 96,237 | |
| | 17,610 | | | L | | Honam Petrochemical Corp. | | | 720,834 | |
| | 1,447 | | | | | Hyundai Department Store Co., Ltd. | | | 70,717 | |
| | 17,400 | | | | | Hyundai DSF Co., Ltd. | | | 80,926 | |
| | 81,380 | | | | | Hyundai Marine & Fire Insurance Co., Ltd. | | | 691,878 | |
| | 41,360 | | | | | Industrial Bank of Korea | | | 237,754 | |
| | 66,890 | | | L | | Jinheung Mutual Savings Bank | | | 125,859 | |
| | 448 | | | | | KCC Corp. | | | 87,423 | |
| | 8,327 | | | | | KCC Engineering & Construction | | | 127,588 | |
See Accompanying Notes to Financial Statements
215
PORTFOLIO OF INVESTMENTS
ING International SmallCap Multi-Manager Fund
as of October 31, 2008 (continued)
| | | | | | | | | | | | | | | |
| Shares | | | | | | | | Value |
| |
| |
| | | | | | | South Korea (continued) |
| | 72,600 | | | @ | | Kia Motors Corp. | | $ | 611,572 | |
| | 6,843 | | | @ | | KISCO Corp. | | | 107,075 | |
| | 2,073 | | | | | Korea Iron & Steel Co., Ltd. | | | 40,452 | |
| | 18,360 | | | | | Korea Kumho Petrochemical | | | 248,706 | |
| | 19,690 | | | L | | Korean Petrochemical Industrial Co. | | | 261,847 | |
| | 23,890 | | | @ | | KP Chemical Corp. | | | 69,465 | |
| | 7,146 | | | | | Kyeryong Construction Industrial Co., Ltd. | | | 65,326 | |
| | 26,400 | | | @ | | LG Micron Ltd. | | | 532,336 | |
| | 152,240 | | | | | LG Telecom Ltd. | | | 1,085,233 | |
| | 54,430 | | | | | LIG Non-Life Insurance Co., Ltd. | | | 633,822 | |
| | 44,384 | | | | | People & Telecommunication, Inc. | | | 131,411 | |
| | 4,093 | | | | | Samsung Corp. | | | 131,151 | |
| | 2,591 | | | | | Samsung Engineering Co., Ltd. | | | 103,626 | |
| | 4,791 | | | @ | | Samsung SDI Co., Ltd. | | | 269,007 | |
| | 17,700 | | | | | Seah Besteel Corp. | | | 269,156 | |
| | 26,220 | | | | | SeAH Steel Corp. | | | 842,179 | |
| | 36,144 | | | L | | Taesan LCD Co., Ltd. | | | 30,802 | |
| | 15,938 | | | @ | | TK Corp. | | | 258,387 | |
| | 704 | | | | | Yuhan Corp. | | | 102,407 | |
| | | | | | | | | | | |
| | | | | | | | | | 9,760,218 | |
| | | | | | | | | | | |
| | | | | | | |
| | | | | | | Spain: 2.2% |
| | 38,500 | | | | | Banco Espanol de Credito SA (Banesto) | | | 486,286 | |
| | 3,919 | | | | | Construcciones y Auxiliar de Ferrocarriles SA | | | 1,095,556 | |
| | 453,110 | | | L | | Corp. Mapfre SA | | | 1,442,036 | |
| | 11,300 | | | | | Corporacion Financiera Alba SA | | | 332,888 | |
| | 5,543 | | | | | Ebro Puleva SA | | | 72,071 | |
| | 31,000 | | | | | Enagas | | | 605,667 | |
| | 39,300 | | | | | Grifols SA | | | 782,102 | |
| | 33,400 | | | | | Grupo Catalana Occidente SA | | | 525,281 | |
| | 33,200 | | | | | Indra Sistemas SA | | | 645,111 | |
| | 13,076 | | | | | Laboratorios Almirall SA | | | 115,840 | |
| | 2,279 | | | | | Laboratorios Farmaceuticos Rovi SA | | | 18,439 | |
| | 5,406 | | | | | Pescanova SA | | | 195,818 | |
| | 41,000 | | | | | Red Electrica de Espana | | | 1,797,082 | |
| | 4,449 | | | | | SOS Cuetara SA | | | 61,960 | |
| | 181,263 | | | | | Tubos Reunidos SA | | | 480,389 | |
| | 12,351 | | | | | Viscofan SA | | | 212,438 | |
| | | | | | | | | | | |
| | | | | | | | | | 8,868,964 | |
| | | | | | | | | | | |
| | | | | | | |
| | | | | | | Sweden: 1.9% |
| | 147,100 | | | | | BE Group AB | | | 431,276 | |
| | 41,200 | | | @ | | Betsson AB | | | 350,441 | |
| | 22,000 | | | | | Bure Equity AB | | | 95,821 | |
| | 3,502 | | | | | Elekta AB | | | 44,287 | |
| | 15,300 | | | | | Getinge AB | | | 213,988 | |
| | 258,536 | | | | | JM AB | | | 1,386,056 | |
| | 1,644 | | | | | Lundbergforetagen AB — B Shares | | | 52,332 | |
| | 267,700 | | | | | NCC AB | | | 2,187,452 | |
| | 215,200 | | | L | | Peab AB | | | 603,802 | |
| | 81,317 | | | L | | Peab AB | | | 334,626 | |
| | 6,012 | | | | | Ratos AB | | | 106,121 | |
| | 19,000 | | | | | Saab AB | | | 198,192 | |
| | 108,000 | | | @ | | SAS AB | | | 571,089 | |
| | 41,500 | | | | | Swedish Match AB | | | 576,305 | |
| | 857,000 | | | @ | | West Siberian Resources Ltd. GDR | | | 346,609 | |
| | | | | | | | | | | |
| | | | | | | | | | 7,498,397 | |
| | | | | | | | | | | |
| | | | | | | |
| | | | | | | Switzerland: 5.0% |
| | 31,500 | | | | | Addax Petroleum Corp. | | | 470,422 | |
| | 1,228 | | | | | Adecco SA | | | 42,718 | |
| | 1,339 | | | | | AFG Arbonia-Forster Holding | | | 168,756 | |
| | 768 | | | | | Allreal Holding AG | | | 78,194 | |
| | 26,300 | | | @ | | Aryzta AG | | | 938,579 | |
| | 16,225 | | | | | Baloise Holding AG | | | 867,462 | |
| | 13,000 | | | | | Bank Sarasin & Compagnie AG | | | 382,570 | |
| | 211 | | | @ | | Barry Callebaut AG | | | 105,444 | |
| | 5,060 | | | | | Bellevue Group AG | | | 175,009 | |
| | 6,400 | | | | | BKW FMB Energie AG | | | 578,543 | |
| | 2,541 | | | | | Bobst Group AG | | | 91,962 | |
| | 800 | | | | | Bucher Industries AG | | | 86,438 | |
| | 3,400 | | | | | Compagnie Financiere Tradition (CFT) | | | 282,913 | |
| | 2,486 | | | | | Dufry Group | | | 51,502 | |
| | 1,972 | | | | | Flughafen Zuerich AG | | | 525,428 | |
| | 4,809 | | | @ | | Forbo Holding AG | | | 1,182,209 | |
| | 11,277 | | | | | Galenica AG | | | 3,409,816 | |
| | 7,280 | | | @ | | Georg Fischer AG | | | 1,632,361 | |
| | 7,189 | | | | | Helvetia Holding AG | | | 1,232,369 | |
| | 8 | | | | | Huber & Suhner AG | | | 263 | |
| | 1,343 | | | | | Kuehne & Nagel International AG | | | 81,313 | |
| | 3,767 | | | | | Kuoni Reisen Holding | | | 1,103,695 | |
| | 4,700 | | | | | Lonza Group AG | | | 390,066 | |
| | 1,700 | | | @ | | Meyer Burger Technology AG | | | 237,084 | |
| | 14,949 | | | @ | | Micronas Semiconductor Hold | | | 56,159 | |
| | 63,500 | | | | | Mobilezone Holding AG | | | 410,667 | |
| | 7,000 | | | @ | | Newave Energy Holding SA | | | 241,273 | |
| | 10,800 | | | | | Pargesa Holding SA | | | 827,305 | |
| | 20,233 | | | @ | | PSP Swiss Property AG | | | 875,385 | |
| | 2,319 | | | | | Schweizerhall Holding AG | | | 480,241 | |
| | 330 | | | | | Sika AG | | | 260,197 | |
| | 468 | | | | | Swatch Group AG — BR | | | 73,029 | |
| | 5,548 | | | @ | | Swiss Life Holding | | | 499,909 | |
| | 2,140 | | | @ | | Swiss Prime Site AG | | | 98,475 | |
| | 5,585 | | | | | Syngenta AG | | | 1,044,022 | |
| | 29,200 | | | @ | | Temenos Group AG — Reg | | | 365,711 | |
| | 3,207 | | | | | Valiant Holding | | | 552,568 | |
| | 411 | | | | | Valora Holding AG | | | 59,590 | |
| | | | | | | | | | | |
| | | | | | | | | | 19,959,647 | |
| | | | | | | | | | | |
| | | | | | | |
| | | | | | | Taiwan: 2.1% |
| | 181,405 | | | | | Altek Corp. | | | 180,045 | |
| | 835,059 | | | @ | | Chia Hsin Cement Corp. | | | 258,246 | |
| | 601,000 | | | | | Chung HWA Pulp | | | 165,584 | |
| | 13,521,000 | | | | | Chunghwa Picture Tubes Ltd. | | | 1,369,842 | |
| | 823,791 | | | | | Eastern Media International Corp. | | | 92,930 | |
| | 734 | | | | | Everlight Electronics Co., Ltd. | | | 1,109 | |
| | 230,000 | | | | | Feng Hsin Iron & Steel Co. | | | 161,362 | |
| | 260,295 | | | | | Gamania Digital Entertainment Co., Ltd. | | | 113,953 | |
| | 503,000 | | | | | Gigabyte Technology Co., Ltd. | | | 177,093 | |
| | 1,590,000 | | | @ | | Grand Pacific Petrochemical Corp. | | | 223,783 | |
| | 2,933,757 | | | | | HannStar Display Corp. | | | 534,095 | |
| | 121,000 | | | | | Inventec Appliances Corp. | | | 116,338 | |
| | 1,962,000 | | | | | KGI Securities Co., Ltd. | | | 454,786 | |
| | 953,309 | | | | | King Yuan Electronics Co., Ltd. | | | 253,541 | |
| | 2,366,334 | | | | | Macronix International | | | 660,280 | |
| | 1,112,198 | | | | | Micro-Star International Co., Ltd. | | | 464,485 | |
| | 214,000 | | | | | Mitac International | | | 79,204 | |
| | 605 | | | | | Powertech Technology, Inc. | | | 855 | |
| | 60,000 | | | | | Sinon Corp. | | | 16,310 | |
| | 261,000 | | | | | Taishin Financial Holdings Co., Ltd. | | | 38,959 | |
| | 254,000 | | | @ | | Taiwan Business Bank | | | 49,791 | |
| | 160,022 | | | | | Taiwan Surface Mounting Technology Co., Ltd. | | | 126,206 | |
| | 9,469,000 | | | @ | | Tatung Co., Ltd. | | | 1,681,023 | |
| | 615,000 | | | | | TSRC Corp. | | | 430,168 | |
| | 160,000 | | | | | Ttet Union Corp. | | | 122,462 | |
| | 226 | | | | | Unimicron Technology Corp. | | | 125 | |
| | 2,017,050 | | | | | Yieh Phui Enterprise | | | 581,435 | |
| | | | | | | | | | | |
| | | | | | | | | | 8,354,010 | |
| | | | | | | | | | | |
| | | | | | | | | | | | | | | |
See Accompanying Notes to Financial Statements
216
PORTFOLIO OF INVESTMENTS
ING International SmallCap Multi-Manager Fund
as of October 31, 2008 (continued)
| | | | | | | | | | | | | | | |
| Shares | | | | | | | | Value |
| |
| |
| | | | | | | |
| | | | | | | Thailand: 0.2% |
| | 1,354,400 | | | | | Charoen Pokphand Foods PCL | | $ | 118,426 | |
| | 454,600 | | | | | CP ALL PCL | | | 100,362 | |
| | 71,100 | | | | | Electricity Generating PCL | | | 120,975 | |
| | 21,999,700 | | | | | G Steel PCL | | | 249,527 | |
| | 9,287,500 | | | | | Tata Steel Thailand PCL | | | 185,704 | |
| | 125,500 | | | | | Thai Union Frozen Products PCL | | | 59,438 | |
| | 123,900 | | | | | Total Access Communication PCL | | | 88,554 | |
| | | | | | | | | | | |
| | | | | | | | | | 922,986 | |
| | | | | | | | | | | |
| | | | | | | |
| | | | | | | Turkey: 0.7% |
| | 316,793 | | | @ | | Aksa Akrilik Kimya Sanayii | | | 327,324 | |
| | 171,008 | | | | | Anadolu Sigorta | | | 90,433 | |
| | 1 | | | | | Bolu Cimento Sanayii | | | 1 | |
| | 276,305 | | | | | Bossa Ticaret Sanayi Isletme | | | 257,364 | |
| | 293,012 | | | @ | | Dogan Sriketler Grubu Holdings | | | 231,030 | |
| | 266,973 | | | | | Eczacibasi Ilac Sanayi | | | 209,282 | |
| | 77,264 | | | | | Ford Otomotiv Sanayi A/S | | | 243,053 | |
| | 28,916 | | | @ | | Goodyear Lastikleri TAS | | | 143,073 | |
| | 49,616 | | | | | Mardin Cimento Sanayii | | | 113,055 | |
| | 1 | | | @ | | Petrol Ofisi | | | 2 | |
| | 244,931 | | | @ | | Turk Hava Yollari | | | 759,795 | |
| | 495,074 | | | @ | | Vestel Elektronik Sanayi | | | 285,435 | |
| | | | | | | | | | | |
| | | | | | | | | | 2,659,847 | |
| | | | | | | | | | | |
| | | | | | | |
| | | | | | | United Kingdom: 14.7% |
| | 11,194 | | | | | 3i Group PLC | | | 97,640 | |
| | 553,400 | | | @ | | Afren PLC | | | 424,616 | |
| | 540,463 | | | | | Aggreko PLC | | | 3,781,948 | |
| | 83,907 | | | | | Albemarle & Bond Holdings | | | 252,596 | |
| | 88,100 | | | | | Amec PLC | | | 737,093 | |
| | 437,000 | | | | | Amlin PLC | | | 2,237,693 | |
| | 33,337 | | | | | Arriva PLC | | | 322,516 | |
| | 83,972 | | | @ | | ASOS PLC | | | 352,501 | |
| | 72,503 | | | | | AssetCo PLC | | | 83,556 | |
| | 155,879 | | | | | Atkins WS PLC | | | 1,338,977 | |
| | 138,069 | | | | | Aveva Group PLC | | | 1,760,103 | |
| | 97,047 | | | @ | | Avocet Mining PLC | | | 110,603 | |
| | 1,019,324 | | | | | Beazley Group PLC | | | 1,737,813 | |
| | 28,571 | | | | | Bespak PLC | | | 160,932 | |
| | 88,866 | | | | | Bodycote International | | | 177,880 | |
| | 397,474 | | | | | Brit Insurance Holdings PLC | | | 1,168,947 | |
| | 98,100 | | | | | British Energy Group PLC | | | 1,173,365 | |
| | 48,224 | | | | | BSS Group PLC | | | 177,296 | |
| | 41,985 | | | | | Burberry Group PLC | | | 186,857 | |
| | 37,377 | | | @ | | Cape PLC | | | 44,270 | |
| | 282,765 | | | | | Cattles PLC | | | 150,810 | |
| | 228,725 | | | | | Charter International PLC | | | 1,490,797 | |
| | 526,952 | | | | | Chaucer Holdings PLC | | | 492,369 | |
| | 19,059 | | | | | Chemring Group PLC | | | 488,954 | |
| | 87,045 | | | | | Chloride Group PLC | | | 184,888 | |
| | 27,000 | | | | | Close Brothers Group PLC | | | 234,936 | |
| | 240,200 | | | | | Cobham PLC | | | 730,009 | |
| | 17,860 | | | | | Connaught PLC | | | 98,658 | |
| | 21,962 | | | | | Cranswick PLC | | | 224,264 | |
| | 92,137 | | | @ | | CSR PLC | | | 307,277 | |
| | 50,000 | | | | | Daily Mail & General Trust | | | 235,447 | |
| | 74,349 | | | | | Dairy Crest Group PLC | | | 371,465 | |
| | 43,400 | | | @ | | Dana Petroleum PLC | | | 698,199 | |
| | 97,788 | | | | | De La Rue PLC | | | 1,410,670 | |
| | 32,417 | | | | | Dechra Pharmaceuticals PLC | | | 206,037 | |
| | 398,512 | | | | | Dimension Data Holdings PLC | | | 212,014 | |
| | 191,255 | | | | | Drax Group PLC | | | 1,777,193 | |
| | 116,470 | | | | | eaga PLC | | | 224,028 | |
| | 195,556 | | | | | Elementis PLC | | | 184,110 | |
| | 130,252 | | | | | Evolution Group PLC | | | 174,022 | |
| | 98,070 | | | | | Ferrexpo PLC | | | 61,507 | |
| | 3,923 | | | | | Forth Ports PLC | | | 62,054 | |
| | 628,624 | | | | | Future PLC | | | 131,518 | |
| | 1,164,749 | | | | | Game Group PLC | | | 2,443,248 | |
| | 224,900 | | | | | GKN PLC | | | 431,251 | |
| | 8,223 | | | | | Greggs PLC | | | 432,060 | |
| | 42,913 | | | | | Group 4 Securicor PLC | | | 129,970 | |
| | 195,200 | | | | | Halfords Group PLC | | �� | 696,567 | |
| | 36,059 | | | | | Hamworthy KSE | | | 137,396 | |
| | 698,107 | | | | | HMV Group PLC | | | 1,118,222 | |
| | 49,814 | | | | | Home Retail Group | | | 158,771 | |
| | 25,000 | | | | | Hunting PLC | | | 173,112 | |
| | 259,429 | | | | | IG Group Holdings PLC | | | 1,212,054 | |
| | 174,900 | | | | | IMI PLC | | | 774,056 | |
| | 60,000 | | | | | Inchcape PLC | | | 76,504 | |
| | 34,836 | | | | | Intertek Group PLC | | | 412,566 | |
| | 74,500 | | | | | Investec PLC | | | 338,163 | |
| | 81,291 | | | | | ITE Group PLC | | | 110,836 | |
| | 141,912 | | | | | Jardine Lloyd Thompson Group PLC | | | 1,012,259 | |
| | 157,498 | | | | | Keller Group PLC | | | 1,324,746 | |
| | 31,760 | | | | | Kier Group PLC | | | 346,782 | |
| | 63,698 | | | | | Lavendon Group PLC | | | 143,747 | |
| | 39,282 | | | | | Liontrust Asset Management PLC | | | 73,630 | |
| | 77,153 | | | | | Micro Focus International PLC | | | 326,205 | |
| | 80,300 | | | | | Misys PLC | | | 143,785 | |
| | 67,355 | | | | | Mitie Group | | | 204,329 | |
| | 72,877 | | | | | Northumbrian Water Group PLC | | | 366,236 | |
| | 57,634 | | | | | Oxford Instruments PLC | | | 173,502 | |
| | 1,307,068 | | | | | Pendragon PLC | | | 107,141 | |
| | 30,000 | | | | | Pennon Group PLC | | | 259,611 | |
| | 131,100 | | | | | Petrofac Ltd. | | | 907,575 | |
| | 12,500 | | | @ | | Premier Oil PLC | | | 149,855 | |
| | 23,824 | | | | | Provident Financial PLC | | | 303,692 | |
| | 175,657 | | | | | PZ Cussons PLC | | | 354,568 | |
| | 50,428 | | | | | Ricardo PLC | | | 213,510 | |
| | 59,542 | | | | | Rotork PLC | | | 713,482 | |
| | 26,586 | | | | | Sage Group PLC | | | 74,428 | |
| | 267,455 | | | | | Savills PLC | | | 988,284 | |
| | 45,459 | | | @ | | SDL PLC | | | 177,594 | |
| | 111,162 | | | | | Senior PLC | | | 102,011 | |
| | 10,429 | | | | | Serco Group PLC | | | 62,194 | |
| | 6,388 | | | | | Severn Trent PLC | | | 141,196 | |
| | 30,443 | | | | | Shanks Group PLC | | | 61,531 | |
| | 18,730 | | | | | SIG PLC | | | 73,467 | |
| | 259,778 | | | | | Smiths News PLC | | | 238,091 | |
| | 85,290 | | | | | Spectris PLC | | | 684,596 | |
| | 25,883 | | | | | Speedy Hire PLC | | | 99,797 | |
| | 318,199 | | | | | Spice PLC | | | 484,252 | |
| | 53,804 | | | | | Spirax-Sarco Engineering PLC | | | 692,281 | |
| | 926,252 | | | | | Spirent Communications PLC | | | 810,287 | |
| | 1,520,091 | | | @ | | Sportingbet PLC | | | 622,399 | |
| | 31,856 | | | | | SSL International PLC | | | 215,151 | |
| | 36,000 | | | | | St. Ives Group PLC | | | 50,694 | |
| | 284,546 | | | | | Stagecoach Group PLC | | | 854,367 | |
| | 6,550 | | | | | Stolt-Nielsen SA | | | 67,707 | |
| | 17,314 | | | | | Synergy Health PLC | | | 104,969 | |
| | 103,391 | | | | | Tate & Lyle PLC | | | 614,657 | |
| | 308,100 | | | | | Taylor Nelson Sofres PLC | | | 1,215,958 | |
| | 62,718 | | | | | Thomas Cook Group PLC | | | 170,143 | |
| | 383,816 | | | | | Trinity Mirror PLC | | | 215,616 | |
| | 151,400 | | | | | TUI Travel PLC | | | 462,142 | |
| | 136,620 | | | | | Tullett Prebon PLC | | | 523,574 | |
| | 34,963 | | | | | Ultra Electronics Holdings | | | 620,235 | |
| | 23,403 | | | | | Venture Production PLC | | | 152,732 | |
| | 141,307 | | | | | Vitec Group PLC | | | 399,066 | |
| | 194,497 | | | | | VT Group PLC | | | 1,566,732 | |
| | 57,634 | | | | | Wetherspoon (J.D.) PLC | | | 239,794 | |
| | 478,126 | | | | | WH Smith PLC | | | 2,874,651 | |
| | 12,834 | | | L | | Willis Group Holdings Ltd. | | | 336,764 | |
| | | | | | | | | | | |
| | | | | | | | | | 58,245,219 | |
| | | | | | | | | | | |
| | | | | | | |
| | | | | | | United States: 0.1% |
| | 71,800 | | | L | | Virgin Media, Inc. | | | 413,568 | |
| | | | | | | | | | | |
| | | | | | | | | | 413,568 | |
| | | | | | | | | | | |
| | | | | | | Total Common Stock (Cost $674,569,015) | | | 384,639,113 | |
| | | | | | | | | | | |
| | | | | | | | | | | | | | | |
See Accompanying Notes to Financial Statements
217
PORTFOLIO OF INVESTMENTS
ING International SmallCap Multi-Manager Fund
as of October 31, 2008 (continued)
| | | | | | | | | | | | | | | |
| Shares | | | | | | | | Value |
| |
| |
| |
REAL ESTATE INVESTMENT TRUSTS: 1.0% |
| | | | | | | |
| | | | | | | Australia: 0.2% |
| | 350,000 | | | | | Commonwealth Property Office Fund | | $ | 309,279 | |
| | 6,421,222 | | | | | Macquarie DDR Trust | | | 398,272 | |
| | | | | | | | | | | |
| | | | | | | | | | 707,551 | |
| | | | | | | | | | | |
| | | | | | | |
| | | | | | | Belgium: 0.0% |
| | 824 | | | | | Cofinimmo | | | 102,678 | |
| | | | | | | | | | | |
| | | | | | | | | | 102,678 | |
| | | | | | | | | | | |
| | | | | | | |
| | | | | | | Canada: 0.1% |
| | 8,400 | | | | | Dundee Real Estate Investment Trust | | | 131,718 | |
| | | | | | | | | | | |
| | | | | | | | | | 131,718 | |
| | | | | | | | | | | |
| | | | | | | |
| | | | | | | France: 0.0% |
| | 2,535 | | | | | Mercialys | | | 82,559 | |
| | | | | | | | | | | |
| | | | | | | | | | 82,559 | |
| | | | | | | | | | | |
| | | | | | | |
| | | | | | | Germany: 0.0% |
| | 9,032 | | | | | Alstria Office AG | | | 57,754 | |
| | | | | | | | | | | |
| | | | | | | | | | 57,754 | |
| | | | | | | | | | | |
| | | | | | | |
| | | | | | | Hong Kong: 0.0% |
| | 300,000 | | | @ | | Champion Real Estate Investment Trust | | | 72,028 | |
| | | | | | | | | | | |
| | | | | | | | | | 72,028 | |
| | | | | | | | | | | |
| | | | | | | |
| | | | | | | Japan: 0.1% |
| | 145 | | | | | Nippon Commercial Investment Corp. | | | 89,245 | |
| | 24 | | | | | Nippon Residential Investment Corp. | | | 12,915 | |
| | 24 | | | | | Orix JREIT, Inc. | | | 110,020 | |
| | | | | | | | | | | |
| | | | | | | | | | 212,180 | |
| | | | | | | | | | | |
| | | | | | | |
| | | | | | | Netherlands: 0.2% |
| | 3,685 | | | | | Eurocommercial Properties NV | | | 122,028 | |
| | 15,943 | | | | | Nieuwe Steen Investments Funds NV | | | 278,335 | |
| | 31,155 | | | | | Vastned Offices | | | 410,829 | |
| | 1,513 | | | | | Vastned Retail NV | | | 77,405 | |
| | | | | | | | | | | |
| | | | | | | | | | 888,597 | |
| | | | | | | | | | | |
| | | | | | | |
| | | | | | | United Kingdom: 0.4% |
| | 78,455 | | | | | Brixton PLC | | | 211,028 | |
| | 52,285 | | | | | Great Portland Estates PLC | | | 232,830 | |
| | 8,751 | | | | | Hammerson PLC | | | 100,860 | |
| | 205,321 | | | | | Segro PLC | | | 926,930 | |
| | | | | | | | | | | |
| | | | | | | | | | 1,471,648 | |
| | | | | | | | | | | |
| | | | | | | Total Real Estate
Investment Trusts
(Cost $11,130,096) | | | 3,726,713 | |
| | | | | | | | | | | |
| |
MUTUAL FUNDS: 0.1% |
| | | | | | | |
| | | | | | | Australia: 0.1% |
| | 534,300 | | | ** | | ING Office Fund | | | 391,776 | |
| | | | | | | | | | | |
| | | | | | | Total Mutual Funds
(Cost $375,295) | | | 391,776 | |
| | | | | | | | | | | |
| |
PREFERRED STOCK: 0.9% |
| | | | | | | |
| | | | | | | Brazil: 0.2% |
| | 27,400 | | | | | Cia Paranaense de Energia | | | 301,255 | |
| | 47,500 | | | | | Metalurgica Gerdau SA | | | 423,806 | |
| | | | | | | | | | | |
| | | | | | | | | | 725,061 | |
| | | | | | | | | | | |
| | | | | | | |
| | | | | | | Germany: 0.4% |
| | 19,905 | | | | | Draegerwerk AG | | | 768,764 | |
| | 16,103 | | | | | Fresenius AG | | | 1,027,919 | |
| | 3,259 | | | | | Jungheinrich AG | | | 43,357 | |
| | | | | | | | | | | |
| | | | | | | | | | 1,840,040 | |
| | | | | | | | | | | |
| | | | | | | |
| | | | | | | Italy: 0.3% |
| | 131,001 | | | @ | | Instituto Finanziario Industriale S.p.A. | | | 1,143,755 | |
| | | | | | | | | | | |
| | | | | | | | | | 1,143,755 | |
| | | | | | | | | | | |
| | | | | | | Total Preferred Stock
(Cost $6,526,539) | | | 3,708,856 | |
| | | | | | | | | | | |
| |
RIGHTS: 0.0% |
| | | | | | | |
| | | | | | | Germany: 0.0% |
| | 7,200 | | | | | Centrotherm Photovoltaics AG | | | 13,490 | |
| | | | | | | | | | | |
| | | | | | | Total Rights
(Cost $—) | | | 13,490 | |
| | | | | | | | | | | |
| | | | | | | Total Long-Term Investments
(Cost $690,602,206) | | | 392,479,948 | |
| | | | | | | | | | | |
| | | | | | | | | | | | | | | |
| | | | | | | | | | | | | | | |
Principal
| | | | | | | | |
| Amount | | | | | | | | Value |
| |
| |
| |
SHORT-TERM INVESTMENTS: 1.8% |
| | | | | | | |
| | | | | | | Securities Lending CollateralCC: 1.8% |
| $ | 7,042,553 | | | | | Bank of New York Mellon Corp. Institutional Cash Reserves | | $ | 6,972,221 | |
| | | | | | | | | | | |
| | | | | | | Total Short-Term Investments
(Cost $7,042,553) | | | 6,972,221 | |
| | | | | | | | | | | |
| | | | | Total Investments in Securities |
| | | | | (Cost $697,644,759)* | | | 101.0 | % | | $ | 399,452,169 | |
| | | | | Other Assets and
Liabilities - Net | | | (1.0 | ) | | | (3,820,751 | ) |
| | | | | | | | | | | | | |
| | | | | Net Assets | | | 100.0 | % | | $ | 395,631,418 | |
| | | | | | | | | | | | | |
| | | |
| @ | | Non-income producing security |
| ADR | | American Depositary Receipt |
| GDR | | Global Depositary Receipt |
| # | | Securities with purchases pursuant to Rule 144A or section 4(2), under the Securities Act of 1933 and may not be resold subject to that rule except to qualified institutional buyers. Unless otherwise noted, these securities have been determined to be liquid under the guidelines established by the Funds’ Board of Directors/Trustees. |
| cc | | Securities purchased with cash collateral for securities loaned. |
| I | | Illiquid Security |
| L | | Loaned security, a portion or all of the security is on loan at October 31, 2008. |
| ** | | Investment in affiliate |
| X | | Fair value determined by ING Funds Valuation Committee appointed by the Funds’ Board of Directors/Trustees. |
| | | |
| * | | Cost for federal income tax purposes is $703,961,318. |
| | | |
| | | Net unrealized depreciation consists of: |
| | | | | |
| Gross Unrealized Appreciation | | $ | 1,530,239 | |
| Gross Unrealized Depreciation | | | (306,039,388 | ) |
| | | | | |
| Net Unrealized Depreciation | | $ | (304,509,149 | ) |
| | | | | |
See Accompanying Notes to Financial Statements
218
PORTFOLIO OF INVESTMENTS
ING International SmallCap Multi-Manager Fund
as of October 31, 2008 (continued)
| | | | | |
| | | Percentage of
|
| Industry | | Net Assets |
|
| |
| Advertising | | | 0.4 | % |
| Aerospace/Defense | | | 2.0 | |
| Agriculture | | | 0.4 | |
| Airlines | | | 0.5 | |
| Apartments | | | 0.0 | |
| Apparel | | | 0.6 | |
| Auto Manufacturers | | | 1.9 | |
| Auto Parts & Equipment | | | 3.2 | |
| Banks | | | 2.5 | |
| Beverages | | | 0.2 | |
| Biotechnology | | | 0.0 | |
| Building Materials | | | 1.0 | |
| Chemicals | | | 3.8 | |
| Coal | | | 1.1 | |
| Commercial Services | | | 2.8 | |
| Computers | | | 2.9 | |
| Cosmetics/Personal Care | | | 0.4 | |
| Distribution/Wholesale | | | 3.4 | |
| Diversified | | | 0.6 | |
| Diversified Financial Services | | | 2.7 | |
| Electric | | | 1.8 | |
| Electrical Components & Equipment | | | 2.0 | |
| Electronics | | | 3.3 | |
| Energy — Alternate Sources | | | 0.1 | |
| Engineering & Construction | | | 4.0 | |
| Entertainment | | | 0.3 | |
| Environmental Control | | | 0.2 | |
| Food | | | 4.7 | |
| Forest Products & Paper | | | 1.1 | |
| Gas | | | 0.5 | |
| Hand/Machine Tools | | | 1.2 | |
| Healthcare — Products | | | 0.9 | |
| Healthcare — Services | | | 0.7 | |
| Holding Companies — Diversified | | | 1.1 | |
| Home Builders | | | 0.1 | |
| Home Furnishings | | | 1.4 | |
| Household Products/Wares | | | 0.1 | |
| Insurance | | | 5.5 | |
| Internet | | | 0.3 | |
| Investment Companies | | | 0.7 | |
| Iron/Steel | | | 3.1 | |
| Leisure Time | | | 1.4 | |
| Lodging | | | 0.1 | |
| Machinery — Diversified | | | 2.1 | |
| Media | | | 1.3 | |
| Metal Fabricate/Hardware | | | 2.4 | |
| Mining | | | 1.1 | |
| Miscellaneous Manufacturing | | | 1.8 | |
| Office Property | | | 0.3 | |
| Office/Business Equipment | | | 0.4 | |
| Oil & Gas | | | 3.8 | |
| Oil & Gas Services | | | 1.1 | |
| Open-End Funds | | | 0.1 | |
| Packaging & Containers | | | 0.2 | |
| Pharmaceuticals | | | 3.8 | |
| Real Estate | | | 1.5 | |
| Retail | | | 6.3 | |
| Semiconductors | | | 0.5 | |
| Shipbuilding | | | 0.0 | |
| Shopping Centers | | | 0.1 | |
| Software | | | 2.2 | |
| Storage/Warehousing | | | 0.2 | |
| Telecommunications | | | 2.0 | |
| Textiles | | | 0.1 | |
| Transportation | | | 2.6 | |
| Trucking & Leasing | | | 0.1 | |
| Venture Capital | | | 0.0 | |
| Water | | | 0.2 | |
| Short-Term Investments | | | 1.8 | |
| Other Assets and Liabilities — Net | | | (1.0 | ) |
| | | | | |
Net Assets | | | 100.0 | % |
| | | | | |
See Accompanying Notes to Financial Statements
219
PORTFOLIO OF INVESTMENTS
ING International Value Fund
as of October 31, 2008
| | | | | | | | | | | | | | | |
| Shares | | | | | | | | Value |
| |
| |
| |
COMMON STOCK: 92.7% |
| | | | | | | |
| | | | | | | Bermuda: 2.0% |
| | 1,473,134 | | | | | Tyco Electronics Ltd. | | $ | 28,637,725 | |
| | 1,300,000 | | | L | | XL Capital Ltd. | | | 12,610,000 | |
| | | | | | | | | | | |
| | | | | | | | | | | | | | 41,247,725 | |
| | | | | | | | | | | | | | | |
| | | | | | | |
| | | | | | | Brazil: 3.3% |
| | 192,259 | | | L | | Brasil Telecom Participacoes SA ADR | | | 6,584,871 | |
| | 2,489,671 | | | | | Centrais Eletricas Brasileiras SA ADR — Class A | | | 30,125,019 | |
| | 3,542,186 | | | L | | Contax Participacoes SA ADR | | | 2,160,733 | |
| | 256,300 | | | | | Petroleo Brasileiro SA ADR | | | 6,891,907 | |
| | 1,130,854 | | | L | | Tele Norte Leste Participacoes SA ADR | | | 15,356,997 | |
| | 34,858 | | | L | | Telemig Celular Participation SA ADR | | | 1,102,559 | |
| | 220,358 | | | L | | Tim Participacoes SA ADR | | | 3,186,377 | |
| | 298,261 | | | @,L | | Vivo Participacoes SA ADR | | | 3,262,975 | |
| | | | | | | | | | | |
| | | | | | | | | | | | | | 68,671,438 | |
| | | | | | | | | | | | | | | |
| | | | | | | |
| | | | | | | Canada: 0.8% |
| | 876,800 | | | | | Bombardier, Inc. — Class B | | | 3,382,660 | |
| | 75,100 | | | | | EnCana Corp. | | | 3,815,127 | |
| | 243,900 | | | | | GoldCorp, Inc. | | | 4,551,174 | |
| | 3,464,370 | | | @,L | | Nortel Networks Corp. | | | 4,330,463 | |
| | | | | | | | | | | |
| | | | | | | | | | | | | | 16,079,424 | |
| | | | | | | | | | | | | | | |
| | | | | | | |
| | | | | | | China: 0.1% |
| | 4,908,000 | | | | | Huaneng Power International, Inc. | | | 2,387,672 | |
| | | | | | | | | | | |
| | | | | | | | | | | | | | 2,387,672 | |
| | | | | | | | | | | | | | | |
| | | | | | | |
| | | | | | | France: 11.0% |
| | 245,300 | | | | | Air France-KLM | | | 3,534,211 | |
| | 12,675,820 | | | @,L | | Alcatel SA | | | 32,732,112 | |
| | 299,800 | | | | | AXA SA ADR | | | 5,609,258 | |
| | 48,600 | | | | | BNP Paribas | | | 3,508,986 | |
| | 1,005,436 | | | | | Carrefour SA | | | 42,474,628 | |
| | 1,356,000 | | | | | Credit Agricole SA | | | 19,617,280 | |
| | 1,249,162 | | | | | France Telecom SA | | | 31,498,364 | |
| | 6,179,328 | | | L | | Natixis | | | 13,684,448 | |
| | 237,600 | | | | | Peugeot SA | | | 6,340,326 | |
| | 994,550 | | | | | Sanofi-Aventis | | | 63,011,862 | |
| | 135,600 | | | | | Total SA | | | 7,459,828 | |
| | | | | | | | | | | |
| | | | | | | | | | | | | | 229,471,303 | |
| | | | | | | | | | | | | | | |
| | | | | | | |
| | | | | | | Germany: 4.4% |
| | 394,000 | | | | | Deutsche Post AG | | | 4,315,069 | |
| | 4,357,619 | | | | | Deutsche Telekom AG | | | 64,703,858 | |
| | 137,600 | | | | | E.ON AG | | | 5,266,070 | |
| | 389,300 | | | L | | Hypo Real Estate Holding AG | | | 2,486,355 | |
| | 3,113,300 | | | @ | | Infineon Technologies AG | | | 9,739,257 | |
| | 530,090 | | | @,L | | Qimonda AG ADR | | | 121,921 | |
| | 84,000 | | | | | Siemens AG | | | 5,045,994 | |
| | | | | | | | | | | |
| | | | | | | | | | | | | | 91,678,524 | |
| | | | | | | | | | | | | | | |
| | | | | | | |
| | | | | | | Hong Kong: 0.7% |
| | 779,000 | | | | | Henderson Land Development Co., Ltd. | | | 2,817,170 | |
| | 1,423,000 | | | | | Hongkong Land Holdings Ltd. | | | 3,869,860 | |
| | 999,500 | | | | | Swire Pacific Ltd. | | | 7,039,215 | |
| | | | | | | | | | | |
| | | | | | | | | | | | | | 13,726,245 | |
| | | | | | | | | | | | | | | |
| | | | | | | |
| | | | | | | India: 0.4% |
| | 306,400 | | | | | ICICI Bank Ltd. ADR | | | 5,236,376 | |
| | 273,500 | | | | | Maruti Udyog Ltd. | | | 3,191,910 | |
| | | | | | | | | | | |
| | | | | | | | | | | | | | 8,428,286 | |
| | | | | | | | | | | | | | | |
| | | | | | | |
| | | | | | | Italy: 4.4% |
| | 351,100 | | | | | ENI S.p.A. | | | 8,380,113 | |
| | 10,135,782 | | | | | Intesa Sanpaolo S.p.A. | | | 37,095,885 | |
| | 9,779,185 | | | | | Telecom Italia S.p.A. | | | 11,234,004 | |
| | 35,875,700 | | | | | Telecom Italia S.p.A. RNC | | | 30,190,294 | |
| | 1,950,300 | | | | | Terna S.p.A | | | 6,289,977 | |
| | | | | | | | | | | |
| | | | | | | | | | | | | | 93,190,273 | |
| | | | | | | | | | | | | | | |
| | | | | | | |
| | | | | | | Japan: 28.4% |
| | 2,488,400 | | | L | | Aiful Corp. | | | 11,531,318 | |
| | 701,000 | | | | | Akita Bank Ltd. | | | 2,914,430 | |
| | 478,300 | | | | | Astellas Pharma, Inc. | | | 19,265,327 | |
| | 324,700 | | | | | Bridgestone Corp. | | | 5,676,727 | |
| | 211,100 | | | | | Canon, Inc. ADR | | | 7,234,397 | |
| | 1,892,000 | | | | | Dai Nippon Printing Co., Ltd. | | | 22,354,252 | |
| | 1,039,736 | | | | | Daiichi Sankyo Co., Ltd. | | | 21,319,703 | |
| | 500 | | | | | East Japan Railway Co. | | | 3,558,001 | |
| | 908,900 | | | | | Fuji Photo Film Co., Ltd. | | | 20,923,211 | |
| | 4,468,700 | | | | | Hitachi Ltd. | | | 20,980,786 | |
| | 8,800,800 | | | | | Mitsubishi UFJ Financial Group, Inc. | | | 55,305,741 | |
| | 1,489,000 | | | @ | | Mitsui Sumitomo Insurance Group Holdings, Inc. | | | 41,376,920 | |
| | 4,006,000 | | | | | Mitsui Trust Holdings, Inc. | | | 15,805,238 | |
| | 18,274 | | | | | Mizuho Financial Group, Inc. | | | 44,621,485 | |
| | 322,900 | | | | | Namco Bandai Holdings, Inc. | | | 3,320,510 | |
| | 8,200,000 | | | | | NEC Corp. | | | 24,311,066 | |
| | 654,000 | | | | | Nippon Express Co., Ltd. | | | 2,639,707 | |
| | 9,352 | | | | | Nippon Telegraph & Telephone Corp. | | | 38,162,919 | |
| | 934,400 | | | | | Ono Pharmaceutical Co., Ltd. | | | 41,652,491 | |
| | 777,300 | | | | | Rohm Co., Ltd. | | | 37,454,740 | |
| | 533,100 | | | | | Seven & I Holdings Co., Ltd. | | | 14,968,364 | |
| | 872,700 | | | | | Sony Corp. | | | 20,683,297 | |
| | 480,900 | | | | | Sumitomo Corp. | | | 4,230,978 | |
| | 8,869 | | | | | Sumitomo Mitsui Financial Group, Inc. | | | 35,554,626 | |
| | 270,000 | | | | | Taisho Pharmaceutical Co., Ltd. | | | 4,863,179 | |
| | 1,891,600 | | | | | Takefuji Corp. | | | 15,207,863 | |
| | 481,900 | | | | | TDK Corp. | | | 16,283,060 | |
| | 164,600 | | | | | Tokyo Electron Ltd. | | | 5,488,398 | |
| | 891,700 | | | | | Tokio Marine Holdings, Inc. | | | 27,505,284 | |
| | 213,900 | | | | | Toyota Motor Corp. | | | 8,352,992 | |
| | | | | | | | | | | |
| | | | | | | | | | | | | | 593,547,010 | |
| | | | | | | | | | | | | | | |
| | | | | | | |
| | | | | | | Luxembourg: 0.3% |
| | 250,700 | | | | | ArcelorMittal | | | 6,575,401 | |
| | | | | | | | | | | |
| | | | | | | | | | | | | | 6,575,401 | |
| | | | | | | | | | | | | | | |
| | | | | | | |
| | | | | | | Mexico: 1.5% |
| | 1,125,220 | | | L | | Telefonos de Mexico SA de CV ADR | | | 20,163,942 | |
| | 1,013,720 | | | L | | Telmex Internacional SAB de CV ADR | | | 10,633,923 | |
| | | | | | | | | | | |
| | | | | | | | | | | | | | 30,797,865 | |
| | | | | | | | | | | | | | | |
| | | | | | | |
| | | | | | | Netherlands: 6.8% |
| | 5,945,747 | | | | | Aegon NV | | | 24,705,583 | |
| | 600,500 | | | | | Akzo Nobel NV | | | 24,960,420 | |
| | 2,244,212 | | | | | Koninklijke Ahold NV | | | 24,092,465 | |
| | 499,300 | | | | | Royal KPN NV | | | 7,031,743 | |
| | 846,179 | | | | | SNS Reaal | | | 6,207,308 | |
| | 1,605,800 | | | | | Unilever NV | | | 38,698,970 | |
| | 907,832 | | | | | Wolters Kluwer NV | | | 16,070,761 | |
| | | | | | | | | | | |
| | | | | | | | | | | | | | 141,767,250 | |
| | | | | | | | | | | | | | | |
| | | | | | | |
| | | | | | | New Zealand: 0.7% |
| | 11,223,072 | | | | | Telecom Corp. of New Zealand Ltd. | | | 15,213,069 | |
| | | | | | | | | | | |
| | | | | | | | | | | | | | 15,213,069 | |
| | | | | | | | | | | | | | | |
| | | | | | | |
| | | | | | | Portugal: 2.0% |
| | 6,516,376 | | | | | Portugal Telecom SGPS SA | | | 42,858,384 | |
| | | | | | | | | | | |
| | | | | | | | | | | | | | 42,858,384 | |
| | | | | | | | | | | | | | | |
| | | | | | | | | | | | | | | |
See Accompanying Notes to Financial Statements
220
PORTFOLIO OF INVESTMENTS
ING International Value Fund
as of October 31, 2008 (continued)
| | | | | | | | | | | | | | | |
| Shares | | | | | | | | Value |
| |
| |
| | | | | | | |
| | | | | | | Russia: 0.1% |
| | 103,600 | | | @ | | OAO Gazprom ADR | | $ | 2,062,995 | |
| | | | | | | | | | | |
| | | | | | | | | | | | | | 2,062,995 | |
| | | | | | | | | | | | | | | |
| | | | | | | |
| | | | | | | Singapore: 0.2% |
| | 398,000 | | | | | United Overseas Bank Ltd. | | | 3,598,221 | |
| | | | | | | | | | | |
| | | | | | | | | | | | | | 3,598,221 | |
| | | | | | | | | | | | | | | |
| | | | | | | |
| | | | | | | South Korea: 3.3% |
| | 1,463,610 | | | | | Korea Electric Power Corp. | | | 29,082,873 | |
| | 1,371,710 | | | L | | KT Corp. ADR | | | 17,214,961 | |
| | 148,585 | | | | | SK Telecom Co., Ltd. | | | 23,583,249 | |
| | | | | | | | | | | |
| | | | | | | | | | | | | | 69,881,083 | |
| | | | | | | | | | | | | | | |
| | | | | | | |
| | | | | | | Spain: 0.7% |
| | 795,902 | | | | | Telefonica SA | | | 14,736,087 | |
| | | | | | | | | | | |
| | | | | | | | | | | | | | 14,736,087 | |
| | | | | | | | | | | | | | | |
| | | | | | | |
| | | | | | | Sweden: 2.5% |
| | 418,600 | | | | | Nordea Bank AB | | | 3,355,136 | |
| | 7,218,960 | | | | | Telefonaktiebolaget LM Ericsson | | | 49,142,373 | |
| | | | | | | | | | | |
| | | | | | | | | | | | | | 52,497,509 | |
| | | | | | | | | | | | | | | |
| | | | | | | |
| | | | | | | Switzerland: 4.6% |
| | 101,500 | | | | | Credit Suisse Group ADR | | | 3,796,100 | |
| | 4,576,400 | | | | | STMicroelectronics NV | | | 37,619,380 | |
| | 413,000 | | | | | STMicroelectronics NV-NY SHR | | | 3,411,380 | |
| | 471,310 | | | | | Swiss Reinsurance | | | 19,655,357 | |
| | 76,400 | | | | | Swisscom AG | | | 23,344,888 | |
| | 281,100 | | | | | Xstrata PLC | | | 4,808,018 | |
| | 21,900 | | | | | Zurich Financial Services AG | | | 4,443,020 | |
| | | | | | | | | | | |
| | | | | | | | | | | | | | 97,078,143 | |
| | | | | | | | | | | | | | | |
| | | | | | | |
| | | | | | | Taiwan: 0.7% |
| | 56,300,059 | | | | | United Microelectronics Corp. | | | 15,458,816 | |
| | | | | | | | | | | |
| | | | | | | | | | | | | | 15,458,816 | |
| | | | | | | | | | | | | | | |
| | | | | | | |
| | | | | | | Turkey: 0.3% |
| | 960,600 | | | @ | | KOC Holding A/S | | | 1,792,244 | |
| | 2,132,300 | | | @ | | Turkiye Garanti Bankasi A/S | | | 3,581,376 | |
| | | | | | | | | | | |
| | | | | | | | | | | | | | 5,373,620 | |
| | | | | | | | | | | | | | | |
| | | | | | | |
| | | | | | | United Kingdom: 13.5% |
| | 959,050 | | | | | AstraZeneca PLC | | | 40,643,055 | |
| | 3,284,691 | | | | | Barclays PLC | | | 9,415,831 | |
| | 82,600 | | | | | Barclays PLC ADR | | | 889,602 | |
| | 185,400 | | | | | BP PLC ADR | | | 9,214,380 | |
| | 2,807,000 | | | | | British Sky Broadcasting PLC | | | 17,081,596 | |
| | 544,800 | | | | | Cadbury PLC | | | 4,980,067 | |
| | 139,300 | | | | | Diageo PLC ADR | | | 8,663,067 | |
| | 2,052,666 | | | | | GlaxoSmithKline PLC | | | 39,460,327 | |
| | 2,363,760 | | | | | HSBC Holdings PLC | | | 27,996,860 | |
| | 51,009,626 | | | | | ITV PLC | | | 24,635,785 | |
| | 14,411,400 | | | | | Kingfisher PLC | | | 26,599,756 | |
| | 7,008,351 | | | | | Marks & Spencer Group PLC | | | 24,845,725 | |
| | 92,000 | | | | | Rio Tinto PLC | | | 4,297,514 | |
| | 16,436,349 | | | | | Royal Bank of Scotland Group PLC | | | 18,104,901 | |
| | 6,128,631 | | | | | WM Morrison Supermarkets PLC | | | 26,095,312 | |
| | | | | | | | | | | |
| | | | | | | | | | | | | | 282,923,778 | |
| | | | | | | | | | | | | | | |
| | | | | | | Total Common Stock
(Cost $3,144,647,546) | | | 1,939,250,121 | |
| | | | | | | | | | | |
| |
REAL ESTATE INVESTMENT TRUSTS: 0.3% |
| | | | | | | |
| | | | | | | France: 0.3% |
| | 42,600 | | | | | Unibail | | | 6,389,354 | |
| | | | | | | | | | | |
| | | | | | | | | | | | | | 6,389,354 | |
| | | | | | | | | | | | | | | |
| | | | | | | Total Real Estate Investment Trusts
(Cost $5,881,402) | | | 6,389,354 | |
| | | | | | | | | | | |
| |
EXCHANGE-TRADED FUNDS: 0.5% |
| | | | | | | |
| | | | | | | Developed Markets: 0.2% |
| | 117,000 | | | | | iShares MSCI EAFE Index Fund | | | 5,220,540 | |
| | | | | | | | | | | |
| | | | | | | | | | | | | | 5,220,540 | |
| | | | | | | | | | | | | | | |
| | | | | | | |
| | | | | | | Emerging Markets: 0.3% |
| | 218,000 | | | | | iShares MSCI Emerging Markets Index Fund | | | 5,556,820 | |
| | | | | | | | | | | |
| | | | | | | | | | | | | | 5,556,820 | |
| | | | | | | | | | | | | | | |
| | | | | | | Total Exchange-Traded Funds
(Cost $9,143,759) | | | 10,777,360 | |
| | | | | | | | | | | |
| | | | | | | Total Long-Term Investments
(Cost $3,159,672,707) | | | 1,956,416,835 | |
| | | | | | | | | | | |
| |
SHORT-TERM INVESTMENTS: 6.3% |
| | | | | | | |
| | | | | | | Affiliated Mutual Fund: 1.0% |
| | 21,129,814 | | | | | ING Institutional Prime Money Market Fund | | | 21,129,814 | |
| | | | | | | | | | | |
| | | | | | | Total Mutual Fund
(Cost $21,129,814) | | | 21,129,814 | |
| | | | | | | | | | | |
| | | | | | | | | | | | | | | |
Principal
| | | | | | | | |
| Amount | | | | | | | | Value |
| |
| |
| | | | | | | |
| | | | | | | Securities Lending CollateralCC: 5.3% |
| $ | 111,387,120 | | | | | Bank of New York Mellon Corp. Institutional Cash Reserves | | $ | 110,326,097 | |
| | | | | | | | | | | |
| | | | | | | Total Securities Lending Collateral
(Cost $111,387,120) | | | 110,326,097 | |
| | | | | | | | | | | |
| | | | | | | Total Short-Term Investments
(Cost $132,516,937) | | | 131,455,911 | |
| | | | | | | | | | | |
| | | | | Total Investments in Securities |
| | | | | (Cost $3,292,189,641)* | | | 99.8 | % | | $ | 2,087,872,746 | |
| | | | | Other Assets and
Liabilities - Net | | | 0.2 | | | | 4,238,835 | |
| | | | | | | | | | | | | |
| | | | | Net Assets | | | 100.0 | % | | $ | 2,092,111,581 | |
| | | | | | | | | | | | | |
| | | |
| @ | | Non-income producing security |
| ADR | | American Depositary Receipt |
| cc | | Securities purchased with cash collateral for securities loaned. |
| L | | Loaned security, a portion or all of the security is on loan at October 31, 2008. |
| | | |
| * | | Cost for federal income tax purposes is $3,322,562,337. |
| | | |
| | | Net unrealized depreciation consists of: |
| | | | | |
| Gross Unrealized Appreciation | | $ | 86,768,836 | |
| Gross Unrealized Depreciation | | | (1,321,458,427 | ) |
| | | | | |
| Net Unrealized Depreciation | | $ | (1,234,689,591 | ) |
| | | | | |
See Accompanying Notes to Financial Statements
221
PORTFOLIO OF INVESTMENTS
ING International Value Fund
as of October 31, 2008 (continued)
| | | | | |
| | | Percentage of
|
| Industry | | Net Assets |
|
| |
| Airlines | | | 0.2 | % |
| Auto Manufacturers | | | 0.9 | |
| Auto Parts & Equipment | | | 0.3 | |
| Banks | | | 14.9 | |
| Beverages | | | 0.4 | |
| Chemicals | | | 1.2 | |
| Commercial Services | | | 1.2 | |
| Computers | | | 0.8 | |
| Distribution/Wholesale | | | 0.2 | |
| Diversified | | | 0.3 | |
| Diversified Financial Services | | | 1.3 | |
| Electric | | | 3.5 | |
| Electrical Components & Equipment | | | 1.0 | |
| Electronics | | | 2.5 | |
| Food | | | 6.5 | |
| Holding Companies — Diversified | | | 0.4 | |
| Home Furnishings | | | 1.0 | |
| Insurance | | | 6.5 | |
| Iron/Steel | | | 0.3 | |
| Media | | | 2.8 | |
| Mining | | | 0.6 | |
| Miscellaneous Manufacturing | | | 1.4 | |
| Office/Business Equipment | | | 0.3 | |
| Oil & Gas | | | 1.8 | |
| Pharmaceuticals | | | 11.0 | |
| Real Estate | | | 0.3 | |
| Retail | | | 3.2 | |
| Semiconductors | | | 5.2 | |
| Telecommunications | | | 22.3 | |
| Toys/Games/Hobbies | | | 0.2 | |
| Transportation | | | 0.5 | |
| Other Long-Term Investments | | | 0.5 | |
| Short-Term Investments | | | 6.3 | |
| Other Assets and Liabilities — Net | | | 0.2 | |
| | | | | |
Net Assets | | | 100.0 | % |
| | | | | |
See Accompanying Notes to Financial Statements
222
PORTFOLIO OF INVESTMENTS
ING International Value Choice Fund
as of October 31, 2008
| | | | | | | | | | | | | | | |
| Shares | | | | | | | | Value |
| |
| |
| |
COMMON STOCK: 98.6% |
| | | | | | | |
| | | | | | | Australia: 2.1% |
| | 429,986 | | | | | Alumina Ltd. | | $ | 611,931 | |
| | 31,061 | | | | | Newcrest Mining Ltd. | | | 426,979 | |
| | | | | | | | | | | |
| | | | | | | | | | | | | | 1,038,910 | |
| | | | | | | | | | | | | | | |
| | | | | | | |
| | | | | | | Belgium: 1.6% |
| | 22,390 | | | | | Belgacom SA | | | 766,065 | |
| | | | | | | | | | | |
| | | | | | | | | | | | | | 766,065 | |
| | | | | | | | | | | | | | | |
| | | | | | | |
| | | | | | | Brazil: 1.8% |
| | 29,882 | | | | | Centrais Eletricas Brasileiras SA | | | 358,198 | |
| | 46,350 | | | | | Centrais Eletricas Brasileiras SA ADR — Class B | | | 511,078 | |
| | | | | | | | | | | |
| | | | | | | | | | | | | | 869,276 | |
| | | | | | | | | | | | | | | |
| | | | | | | |
| | | | | | | Canada: 8.8% |
| | 53,204 | | | | | Barrick Gold Corp. | | | 1,208,795 | |
| | 71,450 | | | @ | | Ivanhoe Mines Ltd. | | | 190,772 | |
| | 37,216 | | | | | Magna International, Inc. | | | 1,258,273 | |
| | 92,427 | | | @ | | OPTI Canada, Inc. | | | 246,155 | |
| | 25,750 | | | | | Petro-Canada | | | 642,720 | |
| | 32,653 | | | | | Suncor Energy, Inc. | | | 781,060 | |
| | | | | | | | | | | |
| | | | | | | | | | | | | | 4,327,775 | |
| | | | | | | | | | | | | | | |
| | | | | | | |
| | | | | | | Finland: 3.7% |
| | 192,690 | | | | | Stora Enso OYJ (Euro Denominated Security) | | | 1,791,907 | |
| | | | | | | | | | | |
| | | | | | | | | | | | | | 1,791,907 | |
| | | | | | | | | | | | | | | |
| | | | | | | |
| | | | | | | France: 11.3% |
| | 320,550 | | | @ | | Alcatel SA | | | 827,740 | |
| | 700 | | | | | Areva SA | | | 354,243 | |
| | 31,890 | | | | | Sanofi-Aventis | | | 2,020,460 | |
| | 6,190 | | | | | Societe Generale | | | 337,386 | |
| | 31,925 | | | | | Technip SA | | | 956,001 | |
| | 26,610 | | | | | Thales SA | | | 1,067,730 | |
| | | | | | | | | | | |
| | | | | | | | | | | | | | 5,563,560 | |
| | | | | | | | | | | | | | | |
| | | | | | | |
| | | | | | | Germany: 2.2% |
| | 18,139 | | | | | Siemens AG | | | 1,089,634 | |
| | | | | | | | | | | |
| | | | | | | | | | | | | | 1,089,634 | |
| | | | | | | | | | | | | | | |
| | | | | | | |
| | | | | | | Italy: 2.7% |
| | 1,583,790 | | | | | Telecom Italia S.p.A. RNC | | | 1,332,799 | |
| | | | | | | | | | | |
| | | | | | | | | | | | | | 1,332,799 | |
| | | | | | | | | | | | | | | |
| | | | | | | |
| | | | | | | Japan: 38.4% |
| | 62,200 | | | | | Coca-Cola West Holdings Co., Ltd. | | | 1,247,480 | |
| | 160,000 | | | | | Dai Nippon Printing Co., Ltd. | | | 1,890,420 | |
| | 66,400 | | | | | Fuji Photo Film Co., Ltd. | | | 1,528,552 | |
| | 79,300 | | | | | JS Group Corp. | | | 1,026,858 | |
| | 37,700 | | | | | Mabuchi Motor Co., Ltd. | | | 1,491,204 | |
| | 30,300 | | | | | Mitsui Sumitomo Insurance Group Holdings, Inc. | | | 841,988 | |
| | 334,000 | | | | | Nippon Oil Corp. | | | 1,370,992 | |
| | 82,060 | | | | | Nippon Telegraph & Telephone Corp. ADR | | | 1,669,921 | |
| | 18,300 | | | | | Rohm Co., Ltd. | | | 881,798 | |
| | 100,900 | | | | | Sega Sammy Holdings, Inc. | | | 762,785 | |
| | 124,000 | | | | | Sekisui House Ltd. | | | 1,243,415 | |
| | 28,400 | | | | | Seven & I Holdings Co., Ltd. | | | 797,414 | |
| | 48,600 | | | | | Shiseido Co., Ltd. | | | 999,958 | |
| | 135,000 | | | | | Sumitomo Trust & Banking Co., Ltd. | | | 625,196 | |
| | 68,010 | | | | | Takefuji Corp. | | | 546,779 | |
| | 69,700 | | | | | Toyo Seikan Kaisha Ltd. | | | 859,929 | |
| | 96,000 | | | | | Wacoal Holdings Corp. | | | 1,040,015 | |
| | | | | | | | | | | |
| | | | | | | | | | | | | | 18,824,704 | |
| | | | | | | | | | | | | | | |
| | | | | | | |
| | | | | | | Netherlands: 5.4% |
| | 27,214 | | | @ | | Gemalto NV | | | 762,463 | |
| | 33,997 | | | | | Royal Dutch Shell PLC ADR — Class B | | | 1,879,694 | |
| | | | | | | | | | | |
| | | | | | | | | | | | | | 2,642,157 | |
| | | | | | | | | | | | | | | |
| | | | | | | |
| | | | | | | Papua New Guinea: 0.7% |
| | 272,160 | | | @ | | Lihir Gold Ltd. | | | 339,595 | |
| | | | | | | | | | | |
| | | | | | | | | | | | | | 339,595 | |
| | | | | | | | | | | | | | | |
| | | | | | | |
| | | | | | | South Africa: 5.5% |
| | 87,848 | | | | | Anglogold Ashanti Ltd. ADR | | | 1,603,226 | |
| | 89,850 | | | | | Gold Fields Ltd. | | | 625,492 | |
| | 42,150 | | | | | Gold Fields Ltd. ADR | | | 280,298 | |
| | 16,506 | | | | | Impala Platinum Holdings Ltd. | | | 172,285 | |
| | | | | | | | | | | |
| | | | | | | | | | | | | | 2,681,301 | |
| | | | | | | | | | | | | | | |
| | | | | | | |
| | | | | | | South Korea: 5.7% |
| | 68,930 | | | | | Korea Electric Power Corp. ADR | | | 682,407 | |
| | 89,650 | | | | | KT Corp. ADR | | | 1,125,108 | |
| | 57,780 | | | | | SK Telecom Co., Ltd. ADR | | | 994,394 | |
| | | | | | | | | | | |
| | | | | | | | | | | | | | 2,801,909 | |
| | | | | | | | | | | | | | | |
| | | | | | | |
| | | | | | | Sweden: 1.0% |
| | 72,970 | | | | | Telefonaktiebolaget LM Ericsson ADR | | | 515,898 | |
| | | | | | | | | | | |
| | | | | | | | | | | | | | 515,898 | |
| | | | | | | | | | | | | | | |
| | | | | | | |
| | | | | | | Switzerland: 1.5% |
| | 43,480 | | | @ | | UBS AG | | | 734,812 | |
| | | | | | | | | | | |
| | | | | | | | | | | | | | 734,812 | |
| | | | | | | | | | | | | | | |
| | | | | | | |
| | | | | | | United Kingdom: 3.5% |
| | 28,714 | | | | | Lonmin PLC | | | 535,519 | |
| | 601,970 | | | | | Vodafone Group PLC | | | 1,158,018 | |
| | | | | | | | | | | |
| | | | | | | | | | | | | | 1,693,537 | |
| | | | | | | | | | | | | | | |
| | | | | | | |
| | | | | | | United States: 2.7% |
| | 51,010 | | | | | Newmont Mining Corp. | | | 1,343,603 | |
| | | | | | | | | | | |
| | | | | | | | | | | | | | 1,343,603 | |
| | | | | | | | | | | | | | | |
| | | | | Total Investments in Securities |
| | | | | (Cost $75,597,882)* | | | 98.6 | % | | $ | 48,357,442 | |
| | | | | Other Assets and
Liabilities - Net | | | 1.4 | | | | 676,807 | |
| | | | | | | | | | | | | |
| | | | | Net Assets | | | 100.0 | % | | $ | 49,034,249 | |
| | | | | | | | | | | | | |
| | | |
| @ | | Non-income producing security |
| ADR | | American Depositary Receipt |
| | | |
| * | | Cost for federal income tax purposes is $76,446,864. |
| | | |
| | | Net unrealized depreciation consists of: |
| | | | | |
| Gross Unrealized Appreciation | | $ | 128,804 | |
| Gross Unrealized Depreciation | | | (28,218,226 | ) |
| | | | | |
| Net Unrealized Depreciation | | $ | (28,089,422 | ) |
| | | | | |
See Accompanying Notes to Financial Statements
223
PORTFOLIO OF INVESTMENTS
ING International Value Choice Fund
as of October 31, 2008 (continued)
| | | | | |
| | | Percentage of
|
| Industry | | Net Assets |
|
| |
| Aerospace/Defense | | | 2.2 | % |
| Apparel | | | 2.1 | |
| Auto Parts & Equipment | | | 2.6 | |
| Banks | | | 3.5 | |
| Beverages | | | 2.5 | |
| Building Materials | | | 2.1 | |
| Commercial Services | | | 3.9 | |
| Computers | | | 1.6 | |
| Cosmetics/Personal Care | | | 2.0 | |
| Diversified Financial Services | | | 1.1 | |
| Electric | | | 3.2 | |
| Electronics | | | 3.0 | |
| Energy — Alternate Sources | | | 0.7 | |
| Forest Products & Paper | | | 3.7 | |
| Home Builders | | | 2.5 | |
| Insurance | | | 1.7 | |
| Leisure Time | | | 1.6 | |
| Mining | | | 15.0 | |
| Miscellaneous Manufacturing | | | 5.3 | |
| Oil & Gas | | | 10.0 | |
| Oil & Gas Services | | | 1.9 | |
| Packaging & Containers | | | 1.8 | |
| Pharmaceuticals | | | 4.1 | |
| Retail | | | 1.6 | |
| Semiconductors | | | 1.8 | |
| Telecommunications | | | 17.1 | |
| Other Assets and Liabilities — Net | | | 1.4 | |
| | | | | |
Net Assets | | | 100.0 | % |
| | | | | |
See Accompanying Notes to Financial Statements
224
PORTFOLIO OF INVESTMENTS
ING Russia Fund
as of October 31, 2008
| | | | | | | | | | | | | | | |
| Shares | | | | | | | | Value |
| |
| |
| |
COMMON STOCK: 83.1% |
| | | | | | | |
| | | | | | | Banks: 8.0% |
| | 1,709,000 | | | I | | Bank St. Petersburg BRD — Class S | | $ | 512,700 | |
| | 11,517,221 | | | | | Sberbank RF | | | 10,908,709 | |
| | 3,000,000 | | | | | VTB Bank OJSC GDR | | | 9,470,859 | |
| | | | | | | | | | | |
| | | | | | | | | | | | | | 20,892,268 | |
| | | | | | | | | | | | | | | |
| | | | | | | |
| | | | | | | Beverages: 0.7% |
| | 300,400 | | | @,I | | Efes Breweries International NV GDR | | | 1,813,454 | |
| | | | | | | | | | | |
| | | | | | | | | | | | | | 1,813,454 | |
| | | | | | | | | | | | | | | |
| | | | | | | |
| | | | | | | Chemicals: 2.3% |
| | 288,600 | | | | | Uralkali GDR | | | 6,033,112 | |
| | | | | | | | | | | |
| | | | | | | | | | | | | | 6,033,112 | |
| | | | | | | | | | | | | | | |
| | | | | | | |
| | | | | | | Coal: 0.5% |
| | 572,600 | | | | | Raspadskaya — Class S | | | 1,212,574 | |
| | | | | | | | | | | |
| | | | | | | | | | | | | | 1,212,574 | |
| | | | | | | | | | | | | | | |
| | | | | | | |
| | | | | | | Electric: 1.3% |
| | 180,000,000 | | | @ | | RusHydro | | | 3,323,700 | |
| | | | | | | | | | | |
| | | | | | | | | | | | | | 3,323,700 | |
| | | | | | | | | | | | | | | |
| | | | | | | |
| | | | | | | Food: 2.3% |
| | 77,200 | | | @,L | | Wimm-Bill-Dann Foods OJSC ADR | | | 3,392,168 | |
| | 263,800 | | | @ | | X5 Retail Group N.V. GDR | | | 2,690,760 | |
| | | | | | | | | | | |
| | | | | | | | | | | | | | 6,082,928 | |
| | | | | | | | | | | | | | | |
| | | | | | | |
| | | | | | | Internet: 0.7% |
| | 1,324,122 | | | @,I | | RBC Information Systems | | | 1,721,359 | |
| | | | | | | | | | | |
| | | | | | | | | | | | | | 1,721,359 | |
| | | | | | | | | | | | | | | |
| | | | | | | |
| | | | | | | Iron/Steel: 1.4% |
| | 139,947 | | | @,L | | Mechel OAO ADR | | | 1,283,314 | |
| | 2,571,400 | | | | | Novolipetsk Steel | | | 2,385,269 | |
| | | | | | | | | | | |
| | | | | | | | | | | | | | 3,668,583 | |
| | | | | | | | | | | | | | | |
| | | | | | | |
| | | | | | | Metal Fabricate/Hardware: 2.1% |
| | 344,700 | | | @,L | | TMK OAO GDR | | | 3,724,448 | |
| | 36,800 | | | I | | Vsmpo-Avisma Corp. | | | 1,840,000 | |
| | | | | | | | | | | |
| | | | | | | | | | | | | | 5,564,448 | |
| | | | | | | | | | | | | | | |
| | | | | | | |
| | | | | | | Mining: 5.8% |
| | 1,098,068 | | | | | MMC Norilsk Nickel ADR | | | 11,019,861 | |
| | 381,500 | | | L | | Polyus Gold Co. ZAO ADR | | | 4,233,595 | |
| | | | | | | | | | | |
| | | | | | | | | | | | | | 15,253,456 | |
| | | | | | | | | | | | | | | |
| | | | | | | |
| | | | | | | Oil & Gas: 48.0% |
| | 933,100 | | | L | | Lukoil-Spon ADR | | | 35,822,667 | |
| | 353,700 | | | | | Novatek OAO GDR | | | 13,987,373 | |
| | 4,239,600 | | | | | OAO Gazprom | | | 20,882,001 | |
| | 385,497 | | | @ | | OAO Gazprom ADR | | | 7,676,433 | |
| | 5,143,300 | | | @,L | | OAO Rosneft Oil Co. GDR | | | 23,604,864 | |
| | 2,330,700 | | | L | | Surgutneftegaz ADR | | | 15,067,269 | |
| | 187,600 | | | L | | Tatneft GDR | | | 8,217,334 | |
| | | | | | | | | | | |
| | | | | | | | | | | | | | 125,257,941 | |
| | | | | | | | | | | | | | | |
| | | | | | | |
| | | | | | | Pharmaceuticals: 2.4% |
| | 388,600 | | | @ | | Pharmstandard — Reg S GDR | | | 6,217,600 | |
| | | | | | | | | | | |
| | | | | | | | | | | | | | 6,217,600 | |
| | | | | | | | | | | | | | | |
| | | | | | | |
| | | | | | | Real Estate: 1.3% |
| | 811,680 | | | @,I | | LSR Group GDR | | | 2,021,083 | |
| | 33,000 | | | @,I | | Open Investments | | | 1,301,370 | |
| | | | | | | | | | | |
| | | | | | | | | | | | | | 3,322,453 | |
| | | | | | | | | | | | | | | |
| | | | | | | |
| | | | | | | Retail: 2.3% |
| | 378,100 | | | @ | | Magnit OAO | | | 6,049,600 | |
| | | | | | | | | | | |
| | | | | | | | | | | | | | 6,049,600 | |
| | | | | | | | | | | | | | | |
| | | | | | | |
| | | | | | | Telecommunications: 3.9% |
| | 422,400 | | | @ | | Comstar United Telesystems GDR | | | 1,183,077 | |
| | 127,200 | | | @,L | | Mobile Telesystems Finance SA ADR | | | 4,979,880 | |
| | 135,000 | | | I | | Moscow City Telephone | | | 1,458,000 | |
| | 68,909,100 | | | I | | Uralsvyazinform | | | 964,727 | |
| | 2,225,000 | | | | | VolgaTelecom | | | 1,617,900 | |
| | | | | | | | | | | |
| | | | | | | | | | | | | | 10,203,584 | |
| | | | | | | | | | | | | | | |
| | | | | | | |
| | | | | | | Transportation: 0.1% |
| | 6,060,000 | | | I | | Novorossiysk Sea Trade Port BRD | | | 303,000 | |
| | | | | | | | | | | |
| | | | | | | | | | | | | | 303,000 | |
| | | | | | | | | | | | | | | |
| | | | | | | Total Common Stock
(Cost $442,488,043 ) | | | 216,920,060 | |
| | | | | | | | | | | |
| |
EXCHANGE-TRADED FUNDS: 1.3% |
| | | | | | | |
| | | | | | | Exchange-Traded Funds: 1.3% |
| | 175,900 | | | | | Market Vectors Russia ETF | | | 3,315,328 | |
| | | | | | | | | | | |
| | | | | | | | | | | | | | 3,315,328 | |
| | | | | | | | | | | | | | | |
| | | | | | | Total Exchange-Traded Funds
(Cost $3,315,328 ) | | | 3,315,328 | |
| | | | | | | | | | | |
| |
HEDGE FUNDS: 1.0% |
| | | | | | | |
| | | | | | | Hedge Fund: 1.0% |
| | 1,899,872 | | | @,I | | RenShares Utilities Ltd. | | | 2,659,821 | |
| | | | | | | | | | | |
| | | | | | | Total Mutual Funds
(Cost $2,744,925 ) | | | 2,659,821 | |
| | | | | | | | | | | |
| | | | | | | Total Long-Term Investments
(Cost $448,548,296 ) | | | 222,895,209 | |
| | | | | | | | | | | |
Principal
| | | | | | | | |
| Amount | | | | | | | | Value |
| |
| |
| |
SHORT-TERM INVESTMENTS: 12.3% |
| | | | | | | |
| | | | | | | Securities Lending CollateralCC: 12.3% |
| $ | 32,873,094 | | | | | Bank of New York Mellon Corp. Institutional Cash Reserves | | $ | 32,130,516 | |
| | | | | | | | | | | |
| | | | | | | Total Short-Term Investments
(Cost $32,873,094) | | | 32,130,516 | |
| | | | | | | | | | | |
| | | | | Total Investments in Securities |
| | | | | (Cost $481,421,390)* | | | 97.7 | % | | $ | 255,025,725 | |
| | | | | Other Assets and
Liabilities - Net | | | 2.3 | | | | 6,101,644 | |
| | | | | | | | | | | | | |
| | | | | Net Assets | | | 100.0 | % | | $ | 261,127,369 | |
| | | | | | | | | | | | | |
| | | |
| @ | | Non-income producing security, |
| ADR | | American Depositary Receipt, |
| GDR | | Global Depositary Receipt, |
| cc | | Securities purchased with cash collateral for securities loaned. |
| I | | Illiquid Security |
| L | | Loaned security, a portion or all of the security is on loan at October 31, 2008. |
| | | |
| * | | Cost for federal income tax purposes is $482,010,893. |
| | | |
| | | Net unrealized depreciation consists of |
| | | | | |
| Gross Unrealized Appreciation | | $ | 3,989,175 | |
| Gross Unrealized Depreciation | | | (230,974,343 | ) |
| | | | | |
| Net Unrealized Depreciation | | $ | (226,985,168 | ) |
| | | | | |
See Accompanying Notes to Financial Statements
225
PORTFOLIO OF INVESTMENTS
ING Emerging Markets Fixed Income Fund
as of October 31, 2008
| | | | | | | | | | | | | | | |
Principal
| | | | | | | | |
| Amount | | | | | | | | Value |
| |
| |
| |
CORPORATE BONDS/NOTES: 28.9% |
| | | | | | | |
| | | | | | | Argentina: 0.5% |
| $ | 100,000 | | | #,C,I | | Cia de Transporte de Energia Electrica de Alta Tension SA, 8.875%, due 12/15/16 | | $ | 32,500 | |
| | 200,000 | | | +,#,I | | Earls Eight Ltd. CLN, 8.000% (step rate 9.000%), due 12/31/12 | | | 117,260 | |
| | 781,950 | | | I,S | | Province of Mendoza, 5.500%, due 09/04/18 | | | 340,148 | |
| | 40,368 | | | +,#,C,
I,S | | Transportadora Gas del Norte, 6.500% (step rate 7.500%), due 12/31/12 | | | 18,367 | |
| | 1,285,000 | | | #,I | | Transportadora Gas del Norte, 8.000%, due 12/31/12 | | | 584,675 | |
| | | | | | | | | | | |
| | | | | | | | | | | | | | 1,092,950 | |
| | | | | | | | | | | | | | | |
| | | | | | | |
| | | | | | | Brazil: 4.0% |
| | 1,000,000 | | | | | Banco BMG SA, 9.150%, due 01/15/16 | | | 580,000 | |
| BRL | 2,300,000 | | | #,I | | Banco Do Brasil, 9.750%, due 07/18/17 | | | 756,404 | |
| BRL | 2,400,000 | | | #,I | | Banco Safra Ltd., 10.875%, due 04/03/17 | | | 675,744 | |
| BRL | 2,300,000 | | | I | | Banco Votorantim, 10.625%, due 04/10/14 | | | 767,021 | |
| BRL | 250,000 | | | #,I | | Banco Votorantim, 10.625%, due 04/10/14 | | | 38,327 | |
| $ | 252,290 | | | S | | Citigroup Funding, Inc. CLN, 6.000%, due 08/17/10 | | | 292,033 | |
| | 2,401,717 | | | # | | Citigroup Funding, Inc. CLN, 6.000%, due 05/18/15 | | | 2,006,784 | |
| | 2,800,000 | | | | | Citigroup Funding, Inc. CLN, due 01/03/17 | | | 1,806,578 | |
| | 1,490,000 | | | C | | Petrobras International Finance Co., 5.875%, due 03/01/18 | | | 1,177,113 | |
| | 1,410,000 | | | C | | Usiminas Commercial Ltd., 7.250%, due 01/18/18 | | | 1,120,950 | |
| | | | | | | | | | | |
| | | | | | | | | | | | | | 9,220,954 | |
| | | | | | | | | | | | | | | |
| | | | | | | |
| | | | | | | Cayman Islands: 0.2% |
| | 800,000 | | | #,C | | Braskem Finance Ltd., 7.250%, due 06/05/18 | | | 576,000 | |
| | | | | | | | | | | |
| | | | | | | | | | | | | | 576,000 | |
| | | | | | | | | | | | | | | |
| | | | | | | |
| | | | | | | Chile: 0.2% |
| | 620,000 | | | #,C,I | | Alto Parana SA, 6.375%, due 06/09/17 | | | 516,088 | |
| | | | | | | | | | | |
| | | | | | | | | | | | | | 516,088 | |
| | | | | | | | | | | | | | | |
| | | | | | | |
| | | | | | | Colombia: 1.0% |
| | 835,000 | | | | | Bancolombia SA, 6.875%, due 05/25/17 | | | 655,475 | |
| | 695,000 | | | #,C | | EEB International Ltd., 8.750%, due 10/31/14 | | | 569,900 | |
| | 1,300,000 | | | #,C | | TGI International Ltd., 9.500%, due 10/03/17 | | | 1,007,500 | |
| | | | | | | | | | | |
| | | | | | | | | | | | | | 2,232,875 | |
| | | | | | | | | | | | | | | |
| | | | | | | |
| | | | | | | Cyprus: 0.3% |
| | 1,150,000 | | | #,I | | Alfa MTN Invest Ltd., 9.250%, due 06/24/13 | | | 610,158 | |
| | | | | | | | | | | |
| | | | | | | | | | | | | | 610,158 | |
| | | | | | | | | | | | | | | |
| | | | | | | |
| | | | | | | Dominican Republic: 0.7% |
| | 2,025,785 | | | #,I | | Standard Bank PLC CLN, 15.000%, due 03/12/12 | | | 1,489,059 | |
| | 143,584 | | | I | | Standard Bank PLC CLN, 16.000%, due 07/20/09 | | | 135,756 | |
| | | | | | | | | | | |
| | | | | | | | | | | | | | 1,624,815 | |
| | | | | | | | | | | | | | | |
| | | | | | | |
| | | | | | | Hong Kong: 0.3% |
| | 800,000 | | | I | | Bangkok Bank PCL, 9.025%, due 03/15/29 | | | 463,682 | |
| | 265,000 | | | #,C,I | | Citic Resources Finance Ltd., 6.750%, due 05/15/14 | | | 139,125 | |
| | 400,000 | | | C,I | | Citic Resources Finance Ltd., 6.750%, due 05/15/14 | | | 190,000 | |
| | | | | | | | | | | |
| | | | | | | | | | | | | | 792,807 | |
| | | | | | | | | | | | | | | |
| | | | | | | |
| | | | | | | Indonesia: 1.9% |
| | 1,300,000 | | | #,I | | Barclays Bank CLN, due 12/17/12 | | | 961,740 | |
| | 1,200,000 | | | #,I | | Barclays Bank CLN, due 03/17/13 | | | 895,680 | |
| | 1,480,000 | | | #,I | | Majapahit Holding BV, 7.250%, due 06/28/17 | | | 885,969 | |
| | 100,000 | | | #,I,S | | Majapahit Holding BV, 7.750%, due 10/17/16 | | | 65,500 | |
| | 650,000 | | | I,S | | Majapahit Holding BV, 7.750%, due 10/17/16 | | | 391,056 | |
| | 2,235,000 | | | #,I | | Majapahit Holding BV, 7.875%, due 06/29/37 | | | 1,195,725 | |
| | | | | | | | | | | |
| | | | | | | | | | | | | | 4,395,670 | |
| | | | | | | | | | | | | | | |
| | | | | | | |
| | | | | | | Israel: 0.6% |
| | 1,500,000 | | | C | | Israel Electric Corp., Ltd., 7.250%, due 01/15/19 | | | 1,344,588 | |
| | | | | | | | | | | |
| | | | | | | | | | | | | | 1,344,588 | |
| | | | | | | | | | | | | | | |
| | | | | | | |
| | | | | | | Kazakhstan: 2.8% |
| | 600,000 | | | I | | HSBK Europe BV, 7.250%, due 05/03/17 | | | 270,000 | |
| | 400,000 | | | #,I | | HSBK Europe BV, 7.250%, due 05/03/17 | | | 206,000 | |
| | 1,410,000 | | | #,I | | Kazkommerts International BV, 7.500%, due 11/29/16 | | | 613,686 | |
| | 1,700,000 | | | # | | KazMunaiGaz Finance Sub BV, 8.375%, due 07/02/13 | | | 1,147,500 | |
| | 6,400,000 | | | # | | KazMunaiGaz Finance Sub BV, 9.125%, due 07/02/18 | | | 3,872,000 | |
| | 1,500,000 | | | I | | TuranAlem Finance BV, 8.250%, due 01/22/37 | | | 483,750 | |
| | | | | | | | | | | |
| | | | | | | | | | | | | | 6,592,936 | |
| | | | | | | | | | | | | | | |
| | | | | | | | | | | | | | | |
See Accompanying Notes to Financial Statements
226
PORTFOLIO OF INVESTMENTS
ING Emerging Markets Fixed Income Fund
as of October 31, 2008 (continued)
| | | | | | | | | | | | | | | |
Principal
| | | | | | | | |
| Amount | | | | | | | | Value |
| |
| |
| | | | | | | |
| | | | | | | Mexico: 1.4% |
| $ | 1,100,000 | | | C | | Grupo Televisa SA, 6.000%, due 05/15/18 | | $ | 802,145 | |
| | 2,105,000 | | | #,C | | Pemex Project Funding Master Trust, 5.750%, due 03/01/18 | | | 1,652,425 | |
| | 955,000 | | | # | | Pemex Project Funding Master Trust, 6.625%, due 06/15/35 | | | 716,241 | |
| | | | | | | | | | | |
| | | | | | | | | | | | | | 3,170,811 | |
| | | | | | | | | | | | | | | |
| | | | | | | |
| | | | | | | Nigeria: 1.6% |
| | 400,000 | | | #,I | | UBS AG CLN, due 12/27/13 | | | 445,491 | |
| | 1,200,000 | | | #,I | | UBS AG CLN, due 09/04/17 | | | 1,232,068 | |
| | 2,000,000 | | | I | | UBS AG CLN, 9.850%, due 08/02/17 | | | 2,005,457 | |
| | | | | | | | | | | |
| | | | | | | | | | | | | | 3,683,016 | |
| | | | | | | | | | | | | | | |
| | | | | | | |
| | | | | | | Peru: 1.5% |
| | 3,900,000 | | | I | | Banco Credito Del Peru, 7.170%, due 10/15/22 | | | 1,272,218 | |
| | 320,000 | | | #,Z | | Interoceanica IV Finance Ltd. CLN, 5.870%, due 11/30/18 | | | 179,968 | |
| | 1,181,082 | | | #,I,Z | | Interoceanica IV Finance Ltd. CLN, 6.020%, due 11/30/25 | | | 435,347 | |
| | 246,100 | | | #,I,Z | | Peru Enhanced Pass-through Finance Ltd., 6.910%, due 05/31/18 | | | 128,398 | |
| | 2,953,201 | | | I,Z | | Peru Enhanced Pass-through Finance Ltd., 7.030%, due 05/31/18 | | | 1,540,780 | |
| | | | | | | | | | | |
| | | | | | | | | | | | | | 3,556,711 | |
| | | | | | | | | | | | | | | |
| | | | | | | |
| | | | | | | Philippines: 0.6% |
| | 1,300,000 | | | I,S | | National Power Corp., 6.875%, due 11/02/16 | | | 881,685 | |
| | 305,000 | | | #,I,S | | National Power Corp., 6.875%, due 11/02/16 | | | 230,275 | |
| | 450,000 | | | I,S | | National Power Corp., 9.625%, due 05/15/28 | | | 348,750 | |
| | | | | | | | | | | |
| | | | | | | | | | | | | | 1,460,710 | |
| | | | | | | | | | | | | | | |
| | | | | | | |
| | | | | | | Russia: 4.1% |
| | 1,200,000 | | | C,I | | Alfa Bond Issuance PLC for OJSC Alfa Bank, 8.635%, due 02/22/17 | | | 535,821 | |
| | 1,350,000 | | | S | | Gaz Capital for Gazprom, 8.625%, due 04/28/34 | | | 945,000 | |
| | 590,000 | | | S | | GAZ Capital SA, 6.510%, due 03/07/22 | | | 324,500 | |
| | 1,500,000 | | | C,I,S | | Kuznetski Capital for Bank of Moscow, 7.500%, due 11/25/15 | | | 574,470 | |
| | 545,000 | | | #,C | | Lukoil International Finance BV, 6.656%, due 06/07/22 | | | 273,863 | |
| | 2,400,000 | | | | | Morgan Stanley Bank AG for OAO Gazprom, 9.625%, due 03/01/13 | | | 2,059,322 | |
| | 1,060,000 | | | # | | RSHB Capital SA for OJSC Russian Agricultural Bank, 7.125%, due 01/14/14 | | | 715,500 | |
| | 995,000 | | | # | | RSHB Capital SA for OJSC Russian Agricultural Bank, 7.750%, due 05/29/18 | | | 631,825 | |
| RUB | 25,000,000 | | | I | | Sibacademfinance PLC for URSA Bank, 9.125%, due 02/26/10 | | | 648,765 | |
| | 2,000,000 | | | # | | TransCapitalInvest Ltd. for OJSC AK Transneft, 6.103%, due 06/27/12 | | | 1,200,864 | |
| | 700,000 | | | # | | TransCapitalInvest Ltd for OJSC AK Transneft, 8.700%, due 08/07/18 | | | 413,549 | |
| | 200,000 | | | # | | TransCapitalInvest Ltd. for OJSC AK Transneft, 7.700%, due 08/07/13 | | | 132,117 | |
| | 1,205,000 | | | | | UBS Luxembourg SA for OJSC Vimpel Communications, 8.250%, due 05/23/16 | | | 617,563 | |
| | 1,000,000 | | | # | | VIP FIN (Vimpelcom), 9.125%, due 04/30/18 | | | 517,342 | |
| | | | | | | | | | | |
| | | | | | | | | | | | | | 9,590,501 | |
| | | | | | | | | | | | | | | |
| | | | | | | |
| | | | | | | South Korea: 0.7% |
| | 1,280,000 | | | C,I | | Shinhan Bank, 6.819%, due 09/20/36 | | | 617,236 | |
| | 1,230,000 | | | C,I | | Woori Bank, 6.208%, due 05/02/37 | | | 897,157 | |
| | | | | | | | | | | |
| | | | | | | | | | | | | | 1,514,393 | |
| | | | | | | | | | | | | | | |
| | | | | | | |
| | | | | | | Trinidad And Tobago: 0.8% |
| | 2,515,000 | | | C,I | | Petroleum Co. of Trinidad & Tobago Ltd., 6.000%, due 05/08/22 | | | 1,935,041 | |
| | | | | | | | | | | |
| | | | | | | | | | | | | | 1,935,041 | |
| | | | | | | | | | | | | | | |
| | | | | | | |
| | | | | | | Turkey: 0.1% |
| TRY | 400,000 | | | S | | European Investment Bank, 10.000%, due 01/28/11 | | | 217,732 | |
| | | | | | | | | | | |
| | | | | | | | | | | | | | 217,732 | |
| | | | | | | | | | | | | | | |
| | | | | | | |
| | | | | | | Ukraine: 0.6% |
| $ | 550,000 | | | S,I | | City of Kiev Ukraine, 8.000%, due 11/06/15 | | | 211,750 | |
| | 500,000 | | | I | | Standard Bank (Nak), 8.125%, due 09/30/09 | | | 251,375 | |
| | 2,800,000 | | | #,I | | UK SPV Credit Finance PLC for JSC Commercial Bank Privatbank, 8.000%, due 02/06/12 | | | 868,000 | |
| | | | | | | | | | | |
| | | | | | | | | | | | | | 1,331,125 | |
| | | | | | | | | | | | | | | |
| | | | | | | |
| | | | | | | United Kingdom: 1.9% |
| | 4,920,000 | | | I | | JPMorgan Chase London, Discount Note, due 06/17/21 | | | 4,392,576 | |
| | | | | | | | | | | |
| | | | | | | | | | | | | | 4,392,576 | |
| | | | | | | | | | | | | | | |
| | | | | | | |
| | | | | | | Venezuela: 3.1% |
| | 7,500,000 | | | C | | Petroleos de Venezuela SA, 5.250%, due 04/12/17 | | | 2,868,750 | |
| | 12,315,000 | | | C | | Petroleos de Venezuela SA, 5.375%, due 04/12/27 | | | 4,402,613 | |
| | | | | | | | | | | |
| | | | | | | | | | | | | | 7,271,363 | |
| | | | | | | | | | | | | | | |
| | | | | | | Total Corporate Bonds/Notes
(Cost $105,324,349) | | | 67,123,820 | |
| | | | | | | | | | | |
| | | | | | | | | | | | | | | |
See Accompanying Notes to Financial Statements
227
PORTFOLIO OF INVESTMENTS
ING Emerging Markets Fixed Income Fund
as of October 31, 2008 (continued)
| | | | | | | | | | | | | | | |
Principal
| | | | | | | | |
| Amount | | | | | | | | Value |
| |
| |
| |
FOREIGN GOVERNMENT BONDS: 47.5% |
| | | | | | | |
| | | | | | | Argentina: 1.4% |
| $ | 2,000,000 | | | | | Argentina Government International Bond, 7.000%, due 10/03/15 | | $ | 401,000 | |
| | 9,005,000 | | | S | | Argentina Government International Bond, Series $GDP, due 12/15/35 | | | 405,225 | |
| ARS | 9,530,000 | | | S | | Argentina Government International Bond, Series PGDP, due 12/15/35 | | | 362,050 | |
| $ | 5,600,000 | | | +,#,I,
S | | Province of Buenos Aires Argentina, 3.000% (step rate 4.000%), due 05/15/35 | | | 674,800 | |
| | 2,480,000 | | | #,I | | Province of Buenos Aires Argentina, 9.375%, due 09/14/18 | | | 452,600 | |
| | 4,130,000 | | | I,S | | Province of Buenos Aires Argentina, 9.625%, due 04/18/28 | | | 753,725 | |
| | 444,500 | | | #,I | | Provincia Del Neuquen Titulo Provincial, 8.656%, due 10/18/14 | | | 317,818 | |
| | | | | | | | | | | |
| | | | | | | | | | | | | | 3,367,218 | |
| | | | | | | | | | | | | | | |
| | | | | | | |
| | | | | | | Belize: 0.1% |
| | 330,000 | | | +,C,I | | Belize Government International Bond, 4.250% (step rate 6.000%), due 02/20/29 | | | 173,250 | |
| | | | | | | | | | | |
| | | | | | | | | | | | | | 173,250 | |
| | | | | | | | | | | | | | | |
| | | | | | | |
| | | | | | | Bosnia and Herzegovina: 0.1% |
| DEM | 750,000 | | | S,Z,I | | Bosnia & Herzegovina Government International Bond, 17.500%, due 12/11/17 | | | 219,938 | |
| | | | | | | | | | | |
| | | | | | | | | | | | | | 219,938 | |
| | | | | | | | | | | | | | | |
| | | | | | | |
| | | | | | | Brazil: 5.7% |
| $ | 1,570,000 | | | # | | Banco Nacional de Desenvolvimento Economico e Social, 6.369%, due 06/16/18 | | | 1,248,150 | |
| | 2,800,000 | | | | | Brazil Government International Bond, 7.125%, due 01/20/37 | | | 2,585,800 | |
| | 1,080,000 | | | S | | Brazil Government International Bond, 8.750%, due 02/04/25 | | | 1,107,000 | |
| | 1,300,000 | | | C,S | | Brazil Government International Bond, 11.000%, due 08/17/40 | | | 1,518,400 | |
| BRL | 16,000,000 | | | | | Federal Republic of Brazil, 12.500%, due 01/05/16 | | | 6,462,036 | |
| $ | 310,000 | | | C | | Federative Republic of Brazil, 6.000%, due 01/17/17 | | | 281,325 | |
| | | | | | | | | | | |
| | | | | | | | | | | | | | 13,202,711 | |
| | | | | | | | | | | | | | | |
| | | | | | | |
| | | | | | | Colombia: 1.2% |
| | 50,000 | | | S | | Colombia Government International Bond, 10.000%, due 01/23/12 | | | 52,250 | |
| | 1,115,000 | | | S | | Republic of Colombia, 7.375%, due 01/27/17 | | | 1,009,075 | |
| | 1,055,000 | | | S | | Republic of Colombia, 8.125%, due 05/21/24 | | | 965,325 | |
| COP | 2,061,000,000 | | | | | Republic of Colombia, 9.850%, due 06/28/27 | | | 672,785 | |
| | | | | | | | | | | |
| | | | | | | | | | | | | | 2,699,435 | |
| | | | | | | | | | | | | | | |
| | | | | | | |
| | | | | | | Dominican Republic: 1.0% |
| $ | 2,267,927 | | | S | | Dominican Republic, 9.040%, due 01/23/18 | | | 1,361,890 | |
| | 2,115,000 | | | #,S | | Dominican Republic International Bond, 8.625%, due 04/20/27 | | | 920,025 | |
| | | | | | | | | | | |
| | | | | | | | | | | | | | 2,281,915 | |
| | | | | | | | | | | | | | | |
| | | | | | | |
| | | | | | | El Salvador: 1.0% |
| | 1,230,000 | | | | | El Salvador Government International Bond, 7.650%, due 06/15/35 | | | 658,050 | |
| | 2,440,000 | | | I,S | | El Salvador Government International Bond, 8.250%, due 04/10/32 | | | 1,598,200 | |
| | | | | | | | | | | |
| | | | | | | | | | | | | | 2,256,250 | |
| | | | | | | | | | | | | | | |
| | | | | | | |
| | | | | | | Ghana: 0.2% |
| | 900,000 | | | # | | Republic of Ghana, 8.500%, due 10/04/17 | | | 526,500 | |
| | | | | | | | | | | |
| | | | | | | | | | | | | | 526,500 | |
| | | | | | | | | | | | | | | |
| | | | | | | |
| | | | | | | Hungary: 3.8% |
| HUF | 1,450,000,000 | | | | | Hungary Government International Bond, 6.750%, due 02/12/13 | | | 5,855,627 | |
| HUF | 700,000,000 | | | | | Hungary Government International Bond, 8.000%, due 02/12/15 | | | 2,949,632 | |
| | | | | | | | | | | |
| | | | | | | | | | | | | | 8,805,259 | |
| | | | | | | | | | | | | | | |
| | | | | | | |
| | | | | | | Indonesia: 1.5% |
| $ | 2,415,000 | | | | | Indonesia Government International Bond, 7.500%, due 01/15/16 | | | 1,742,435 | |
| | 1,110,000 | | | # | | Indonesia Government International Bond, 7.750%, due 01/17/38 | | | 727,050 | |
| | 1,470,000 | | | S | | Indonesia Government International Bond, 8.500%, due 10/12/35 | | | 938,573 | |
| | | | | | | | | | | |
| | | | | | | | | | | | | | 3,408,058 | |
| | | | | | | | | | | | | | | |
| | | | | | | |
| | | | | | | Iraq: 2.0% |
| | 9,050,000 | | | C,I,S | | Republic of Iraq, 5.800%, due 01/15/28 | | | 4,570,250 | |
| | | | | | | | | | | |
| | | | | | | | | | | | | | 4,570,250 | |
| | | | | | | | | | | | | | | |
| | | | | | | |
| | | | | | | Lebanon: 0.1% |
| | 210,000 | | | I | | Lebanon Government International Bond, 8.250%, due 04/12/21 | | | 155,925 | |
| | | | | | | | | | | |
| | | | | | | | | | | | | | 155,925 | |
| | | | | | | | | | | | | | | |
| | | | | | | |
| | | | | | | Malaysia: 3.6% |
| MYR | 30,000,000 | | | | | Malaysia Government International Bond, 4.240%, due 02/07/18 | | | 8,366,688 | |
| | | | | | | | | | | |
| | | | | | | | | | | | | | 8,366,688 | |
| | | | | | | | | | | | | | | |
| | | | | | | | | | | | | | | |
See Accompanying Notes to Financial Statements
228
PORTFOLIO OF INVESTMENTS
ING Emerging Markets Fixed Income Fund
as of October 31, 2008 (continued)
| | | | | | | | | | | | | | | |
Principal
| | | | | | | | |
| Amount | | | | | | | | Value |
| |
| |
| | | | | | | |
| | | | | | | Mexico: 5.6% |
| MXN | 152,000,000 | | | | | Mexican Bonos, 7.750%, due 12/14/17 | | $ | 11,101,579 | |
| $ | 600,000 | | | | | Mexico Government International Bond, 7.500%, due 04/08/33 | | | 579,000 | |
| | 1,300,000 | | | | | Mexico Government International Bond, 8.300%, due 08/15/31 | | | 1,345,500 | |
| | | | | | | | | | | |
| | | | | | | | | | | | | | 13,026,079 | |
| | | | | | | | | | | | | | | |
| | | | | | | |
| | | | | | | Nigeria: 0.0% |
| | 500,000 | | | S | | Central Bank of Nigeria, 5.092%, due 01/05/10 | | | 68,750 | |
| | | | | | | | | | | |
| | | | | | | | | | | | | | 68,750 | |
| | | | | | | | | | | | | | | |
| | | | | | | |
| | | | | | | Pakistan: 0.7% |
| | 3,695,000 | | | I | | Islamic Republic of Pakistan, 6.875%, due 06/01/17 | | | 1,339,438 | |
| | 610,000 | | | I | | Pakistan Government International Bond, 7.125%, due 03/31/16 | | | 232,057 | |
| | | | | | | | | | �� | |
| | | | | | | | | | | | | | 1,571,495 | |
| | | | | | | | | | | | | | | |
| | | | | | | |
| | | | | | | Panama: 1.0% |
| | 50,000 | | | | | Panama Government International Bond, 6.700%, due 01/26/36 | | | 39,250 | |
| | 1,595,000 | | | S | | Panama Government International Bond, 7.125%, due 01/29/26 | | | 1,323,850 | |
| | 1,000,000 | | | | | Panama Government International Bond, 8.875%, due 09/30/27 | | | 935,000 | |
| | 130,000 | | | S | | Panama Government International Bond, 9.375%, due 04/01/29 | | | 126,750 | |
| | | | | | | | | | | |
| | | | | | | | | | | | | | 2,424,850 | |
| | | | | | | | | | | | | | | |
| | | | | | | |
| | | | | | | Peru: 1.2% |
| | 1,400,000 | | | | | Peru Government International Bond, 6.550%, due 03/14/37 | | | 973,000 | |
| PEN | 5,000,000 | | | #,I | | Peru Government International Bond, 6.900%, due 08/12/37 | | | 1,144,098 | |
| $ | 720,000 | | | S | | Peru Government International Bond, 7.350%, due 07/21/25 | | | 612,000 | |
| | | | | | | | | | | |
| | | | | | | | | | | | | | 2,729,098 | |
| | | | | | | | | | | | | | | |
| | | | | | | |
| | | | | | | Philippines: 0.9% |
| | 600,000 | | | | | Philippine Government International Bond, 8.875%, due 03/17/15 | | | 603,000 | |
| | 1,500,000 | | | | | Philippine Government International Bond, 9.000%, due 02/15/13 | | | 1,522,500 | |
| | | | | | | | | | | |
| | | | | | | | | | | | | | 2,125,500 | |
| | | | | | | | | | | | | | | |
| | | | | | | |
| | | | | | | Russia: 3.2% |
| | 4,792,200 | | | S | | Russia Government International Bond, 7.500%, due 03/31/30 | | | 4,196,161 | |
| | 2,800,000 | | | S | | Russia Government International Bond, 12.750%, due 06/24/28 | | | 3,248,605 | |
| | | | | | | | | | | |
| | | | | | | | | | | | | | 7,444,766 | |
| | | | | | | | | | | | | | | |
| | | | | | | |
| | | | | | | South Africa: 0.5% |
| | 1,705,000 | | | | | South Africa Government International Bond, 5.875%, due 05/30/22 | | | 1,095,242 | |
| | | | | | | | | | | |
| | | | | | | | | | | | | | 1,095,242 | |
| | | | | | | | | | | | | | | |
| | | | | | | |
| | | | | | | Turkey: 7.2% |
| | 4,050,000 | | | S | | Republic of Turkey, 7.000%, due 09/26/16 | | | 3,300,750 | |
| TRY | 4,800,000 | | | | | Turkey Government International Bond, due 04/14/10 | | | 2,276,840 | |
| TRY | 3,000,000 | | | | | Turkey Government International Bond, 14.000%, due 09/26/12 | | | 1,459,434 | |
| TRY | 3,000,000 | | | | | Turkey Government International Bond, 20.240%, due 06/26/13 | | | 1,997,020 | |
| $ | 1,000,000 | | | | | Turkey Government International Bond, 6.875%, due 03/17/36 | | | 685,000 | |
| | 2,250,000 | | | S | | Turkey Government International Bond, 7.375%, due 02/05/25 | | | 1,766,250 | |
| TRY | 3,080,000 | | | | | Turkey Government International Bond, 10.000%, due 02/15/12 | | | 1,560,297 | |
| TRY | 130,000 | | | | | Turkey Government International Bond, 14.000%, due 01/19/11 | | | 70,578 | |
| TRY | 7,000,000 | | | | | Turkey Government International Bond, 16.000%, due 03/07/12 | | | 3,732,305 | |
| | | | | | | | | | | |
| | | | | | | | | | | | | | 16,848,474 | |
| | | | | | | | | | | | | | | |
| | | | | | | |
| | | | | | | Ukraine: 0.6% |
| $ | 1,400,000 | | | I | | Credit Suisse First Boston International for CJSC The EXIM of Ukraine, 6.800%, due 10/04/12 | | | 637,000 | |
| | 360,000 | | | I | | Ukraine Government International Bond, 6.580%, due 11/21/16 | | | 149,400 | |
| | 1,180,000 | | | I,S | | Ukraine Government International Bond, 7.650%, due 06/11/13 | | | 601,800 | |
| | | | | | | | | | | |
| | | | | | | | | | | | | | 1,388,200 | |
| | | | | | | | | | | | | | | |
| | | | | | | |
| | | | | | | Uruguay: 2.0% |
| | 314,322 | | | S | | Oriental Republic of Uruguay, 7.625%, due 03/21/36 | | | 190,165 | |
| | 3,517,500 | | | & | | Uruguay Government International Bond, 7.875%, due 01/15/33 | | | 2,198,438 | |
| | 3,300,000 | | | S | | Uruguay Government International Bond, 8.000%, due 11/18/22 | | | 2,260,500 | |
| | | | | | | | | | | |
| | | | | | | | | | | | | | 4,649,103 | |
| | | | | | | | | | | | | | | |
| | | | | | | |
| | | | | | | Venezuela: 2.9% |
| | 2,200,000 | | | | | Bolivarian Republic of Venezuela, 9.375%, due 01/13/34 | | | 1,133,000 | |
| | 860,000 | | | | | Republic of Venezuela, 6.000%, due 12/09/20 | | | 359,050 | |
See Accompanying Notes to Financial Statements
229
PORTFOLIO OF INVESTMENTS
ING Emerging Markets Fixed Income Fund
as of October 31, 2008 (continued)
| | | | | | | | | | | | | | | |
Principal
| | | | | | | | |
| Amount | | | | | | | | Value |
| |
| |
| | | | | | | Venezuela (continued) |
| $ | 2,400,000 | | | | | Republic of Venezuela, 7.000%, due 03/31/38 | | $ | 996,000 | |
| | 2,000,000 | | | S | | Venezuela Government International Bond, 5.750%, due 02/26/16 | | | 930,000 | |
| | 4,900,000 | | | | | Venezuela Government International Bond, 7.000%, due 12/01/18 | | | 2,266,250 | |
| | 1,340,000 | | | | | Venezuela Government International Bond, 7.650%, due 04/21/25 | | | 609,700 | |
| | 540,000 | | | | | Venezuela Government International Bond, 9.000%, due 05/07/23 | | | 261,630 | |
| | 160,000 | | | | | Venezuela Government International Bond, 9.250%, due 05/07/28 | | | 78,800 | |
| | 340,000 | | | S | | Venezuela Government International Bond, 13.625%, due 08/15/18 | | | 239,700 | |
| | | | | | | | | | | |
| | | | | | | | | | | | | | 6,874,130 | |
| | | | | | | | | | | | | | | |
| | | | | | | Total Foreign Government Bonds
(Cost $169,598,894) | | | 110,279,084 | |
| | | | | | | | | | | |
| | | | | Total Investments in Securities |
| | | | | (Cost $274,923,243)* | | | 76.4 | % | | $ | 177,402,904 | |
| | | | | Other Assets and
Liabilities - Net | | | 23.6 | | | | 54,877,359 | |
| | | | | | | | | | | | | |
| | | | | Net Assets | | | 100.0 | % | | $ | 232,280,263 | |
| | | | | | | | | | | | | |
| | | |
| & | | Payment-in-kind |
| + | | Step-up basis bonds. Interest rates shown reflect current and next coupon rates. |
| # | | Securities with purchases pursuant to Rule 144A or section 4(2), under the Securities Act of 1933 and may not be resold subject to that rule except to qualified institutional buyers. Unless otherwise noted, these securities have been determined to be liquid under the guidelines established by the Funds’ Board of Directors/Trustees. |
| C | | Bond may be called prior to maturity date. |
| I | | Illiquid Security |
| S | | All or a portion of this security is segregated to cover collateral requirements for applicable futures, options, swaps, foreign forward currency contracts and/or when-issued or delayed-delivery securities. |
| Z | | Indicates Zero Coupon Bond; rate shown reflects current effective yield. |
| CLN | | Credit Linked Notes |
| ARS | | Argentine Peso |
| BRL | | Brazilian Real |
| COP | | Colombian Peso |
| DEM | | German Mark |
| HUF | | Hungarian Forint |
| MXN | | Mexican Peso |
| MYR | | Malaysian Ringgit |
| PEN | | Peruvian Nuevo Sol |
| RUB | | Russian Ruble |
| TRY | | Turkish Lira |
| | | |
| * | | Cost for federal income tax purposes is $274,964,153. |
| | | | | |
| | | | | |
| Net unrealized depreciation consists of: | | | | |
| | | | | |
| | | | | |
| Gross Unrealized Appreciation | | $ | 88,374 | |
| Gross Unrealized Depreciation | | | (97,649,623 | ) |
| | | | | |
| Net Unrealized Depreciation | | $ | (97,561,249 | ) |
| | | | | |
| | | | | |
| | | Percentage of
|
| Industry | | Net Assets |
|
| |
| Banks | | | 7.7 | % |
| Chemicals | | | 0.3 | |
| Diversified Financial Services | | | 5.7 | |
| Electric | | | 2.6 | |
| Foreign Government Bonds | | | 48.4 | |
| Forest Products & Paper | | | 0.2 | |
| Gas | | | 0.3 | |
| Iron/Steel | | | 0.5 | |
| Media | | | 0.3 | |
| Multi-National | | | 0.1 | |
| Municipal | | | 0.1 | |
| Oil & Gas | | | 9.3 | |
| Telecommunications | | | 0.5 | |
| Transportation | | | 0.4 | |
| Other Assets and Liabilities — Net | | | 23.6 | |
| | | | | |
Net Assets | | | 100.0 | % |
| | | | | |
At October 31, 2008 the following forward foreign currency contracts were outstanding for the ING Emerging Markets Fixed Income Fund:
| | | | | | | | | | | | | | | | | | | | | |
| | | | | | | In
| | | | Unrealized
|
| | | | | Settlement
| | Exchange
| | | | Appreciation
|
Currency | | Buy/Sell | | Date | | For | | Value | | (Depreciation) |
| | | | | | | USD | | | | |
| |
Brazilian Real
BRL 5,100,000 | | | BUY | | | | 11/6/08 | | | | 2,094,455 | | | | 2,348,295 | | | $ | 253,840 | |
Chilean Peso
CLP 2,800,000,000 | | | BUY | | | | 11/24/08 | | | | 5,253,283 | | | | 4,161,735 | | | | (1,091,548 | ) |
Czech Koruna
CZK 152,000,000 | | | BUY | | | | 11/24/08 | | | | 9,129,677 | | | | 8,070,258 | | | | (1,059,419 | ) |
EU Euro
EUR 2,000,000 | | | BUY | | | | 11/24/08 | | | | 2,875,200 | | | | 2,546,741 | | | | (328,459 | ) |
Malaysian Ringgit
MYR 15,500,000 | | | BUY | | | | 11/12/08 | | | | 4,511,192 | | | | 4,363,936 | | | | (147,256 | ) |
Peruvian Nuevo Sol
PEN 9,500,000 | | | BUY | | | | 11/6/08 | | | | 3,164,557 | | | | 3,086,611 | | | | (77,946 | ) |
Polish Zloty
PLN 29,000,000 | | | BUY | | | | 11/24/08 | | | | 10,552,362 | | | | 10,459,644 | | | | (92,718 | ) |
Russian Ruble
RUB 200,000,000 | | | BUY | | | | 11/10/08 | | | | 7,860,090 | | | | 7,303,881 | | | | (556,209 | ) |
South African Rand
ZAR 17,500,000 | | | BUY | | | | 11/6/08 | | | | 2,053,750 | | | | 1,787,301 | | | | (266,449 | ) |
South African Rand
ZAR 89,093,741 | | | BUY | | | | 11/28/08 | | | | 8,279,318 | | | | 9,043,638 | | | | 764,320 | |
| | | | | | | | | | | | | | | | | | | | | |
| | | | | | | | | | | | | | | | | | | $ | (2,601,844 | ) |
| | | | | | | | | | | | | | | | | | | | | |
Brazilian Real
BRL 5,100,000 | | | SELL | | | | 11/6/08 | | | | 2,526,003 | | | | 2,348,296 | | | $ | 177,707 | |
Hungarian Forint
HUF 274,000,000 | | | SELL | | | | 11/6/08 | | | | 1,539,758 | | | | 1,344,452 | | | | 195,306 | |
Mexican Peso
MXN 52,800,000 | | | SELL | | | | 11/18/08 | | | | 4,093,817 | | | | 4,081,271 | | | | 12,546 | |
Russian Ruble
RUB 200,000,000 | | | SELL | | | | 11/10/08 | | | | 7,421,150 | | | | 7,303,881 | | | | 117,269 | |
Turkish Lira
TRY 2,400,000 | | | SELL | | | | 11/6/08 | | | | 1,806,549 | | | | 1,551,353 | | | | 255,196 | |
| | | | | | | | | | | | | | | | | | | | | |
| | | | | | | | | | | | | | | | | | | $ | 758,024 | |
| | | | | | | | | | | | | | | | | | | | | |
ING Emerging Markets Fixed Income Fund Open Futures Contracts on October 31, 2008:
| | | | | | | | | | | | | |
| | | Number of
| | Expiration
| | Unrealized
|
Contract Description | | Contracts | | Date | | Appreciation |
| |
Long Contracts | | | | | | | | | | | | |
| | | | | | | | | | | | | |
U.S. Treasury 5-Year Note | | | 58 | | | | 12/31/08 | | | $ | 106,339 | |
| | | | | | | | | | | | | |
| | | | | | | | | | | $ | 106,339 | |
| | | | | | | | | | | | | |
See Accompanying Notes to Financial Statements
230
PORTFOLIO OF INVESTMENTS
ING Global Bond Fund
as of October 31, 2008
| | | | | | | | | | | | | | | |
Principal
| | | | | | | | |
| Amount | | | | | | | | Value |
| |
| |
| |
CORPORATE BONDS/NOTES: 13.1% |
| | | | | | | |
| | | | | | | Aerospace/Defense: 0.2% |
| $ | 250,000 | | | C,S | | United Technologies Corp., 5.375%, due 12/15/17 | | $ | 220,429 | |
| | | | | | | | | | | |
| | | | | | | | | | | | | | 220,429 | |
| | | | | | | | | | | | | | | |
| | | | | | | |
| | | | | | | Agriculture: 0.5% |
| | 400,000 | | | S | | Philip Morris International, Inc., 4.875%, due 05/16/13 | | | 371,646 | |
| | 250,000 | | | S | | Philip Morris International, Inc., 6.375%, due 05/16/38 | | | 198,734 | |
| | | | | | | | | | | |
| | | | | | | | | | | | | | 570,380 | |
| | | | | | | | | | | | | | | |
| | | | | | | |
| | | | | | | Airlines: 0.1% |
| | 150,000 | | | C,S | | Delta Airlines, Inc., 7.570%, due 11/18/10 | | | 124,500 | |
| | | | | | | | | | | |
| | | | | | | | | | | | | | 124,500 | |
| | | | | | | | | | | | | | | |
| | | | | | | |
| | | | | | | Banks: 2.3% |
| | 700,000 | | | C,S | | Bank of America Corp., 8.000%, due 12/29/49 | | | 524,868 | |
| | 500,000 | | | C,S | | Bank of America Corp., 8.125%, due 12/29/49 | | | 388,090 | |
| | 885,000 | | | C,S | | Citigroup, Inc., 8.400%, due 04/29/49 | | | 616,270 | |
| | 400,000 | | | S | | Fifth Third Bancorp., 8.250%, due 03/01/38 | | | 284,569 | |
| | 850,000 | | | C,S | | JPMorgan Chase & Co., 7.900%, due 04/29/49 | | | 690,647 | |
| | 3,000 | | | S | | National City Corp., 6.875%, due 05/15/19 | | | 2,240 | |
| | 77,000 | | | C,S | | Wachovia Corp., 7.980%, due 02/08/49 | | | 58,295 | |
| | | | | | | | | | | |
| | | | | | | | | | | | | | 2,564,979 | |
| | | | | | | | | | | | | | | |
| | | | | | | |
| | | | | | | Beverages: 1.3% |
| | BRL 900,000 | | | @@, #,
S | | Ambev International Finance Co., Ltd., 9.500%, due 07/24/17 | | | 299,100 | |
| $ | 750,000 | | | #,C,
S | | Dr Pepper Snapple Group, Inc., 6.820%, due 05/01/18 | | | 657,740 | |
| | 469,000 | | | C,S | | PepsiCo, Inc., 7.900%, due 11/01/18 | | | 495,659 | |
| | | | | | | | | | | |
| | | | | | | | | | | | | | 1,452,499 | |
| | | | | | | | | | | | | | | |
| | | | | | | |
| | | | | | | Computers: 0.7% |
| | 251,000 | | | C,S | | Hewlett-Packard Co., 5.500%, due 03/01/18 | | | 216,141 | |
| | 278,000 | | | C,S | | International Business Machines Corp., 7.625%, due 10/15/18 | | | 288,166 | |
| | 256,000 | | | C,S | | International Business Machines Corp., 8.000%, due 10/15/38 | | | 266,302 | |
| | | | | | | | | | | |
| | | | | | | | | | | | | | 770,609 | |
| | | | | | | | | | | | | | | |
| | | | | | | |
| | | | | | | Diversified Financial Services: 0.5% |
| | 90,000 | | | S | | American Express Co., 8.150%, due 03/19/38 | | | 70,662 | |
| | 83,000 | | | S | | Caterpillar Financial Services Corp., 5.450%, due 04/15/18 | | | 68,419 | |
| | 92,000 | | | S | | John Deere Capital Corp., 5.750%, due 09/10/18 | | | 76,822 | |
| | 369,000 | | | C,S | | National Rural Utilities Cooperative Finance Corp., 10.375%, due 11/01/18 | | | 391,778 | |
| | | | | | | | | | | |
| | | | | | | | | | | | | | 607,681 | |
| | | | | | | | | | | | | | | |
| | | | | | | |
| | | | | | | Electric: 0.3% |
| | 64,000 | | | C,S | | Commonwealth Edison Co., 4.700%, due 04/15/15 | | | 52,652 | |
| | 319,000 | | | C,S | | Constellation Energy Group, 7.600%, due 04/01/32 | | | 263,268 | |
| | | | | | | | | | | |
| | | | | | | | | | | | | | 315,920 | |
| | | | | | | | | | | | | | | |
| | | | | | | |
| | | | | | | Food: 0.4% |
| | 66,000 | | | S | | Kraft Foods, Inc., 6.125%, due 02/01/18 | | | 56,643 | |
| | 500,000 | | | S | | Kraft Foods, Inc., 6.500%, due 08/11/17 | | | 440,243 | |
| | | | | | | | | | | |
| | | | | | | | | | | | | | 496,886 | |
| | | | | | | | | | | | | | | |
| | | | | | | |
| | | | | | | Household Products/Wares: 0.7% |
| | 785,000 | | | S | | Kimberly-Clark Corp., 7.500%, due 11/01/18 | | | 798,506 | |
| | | | | | | | | | | |
| | | | | | | | | | | | | | 798,506 | |
| | | | | | | | | | | | | | | |
| | | | | | | |
| | | | | | | Media: 2.0% |
| | 250,000 | | | C,S | | Comcast Corp., 5.700%, due 05/15/18 | | | 206,928 | |
| | 76,000 | | | C,S | | Comcast Corp., 5.900%, due 03/15/16 | | | 65,497 | |
| | 250,000 | | | C,S | | Comcast Corp., 6.300%, due 11/15/17 | | | 216,400 | |
| | 84,000 | | | C,S | | Comcast Corp., 6.950%, due 08/15/37 | | | 68,679 | |
| | 451,000 | | | #,C, S | | COX Communications, Inc., 6.250%, due 06/01/18 | | | 368,602 | |
| | 397,000 | | | C,S | | News America, Inc., 6.150%, due 03/01/37 | | | 289,886 | |
| | 159,000 | | | C,S | | Time Warner Cable, Inc., 6.200%, due 07/01/13 | | | 145,195 | |
| | 350,000 | | | C,S | | Time Warner Cable, Inc., 6.750%, due 07/01/18 | | | 300,691 | |
| | 446,000 | | | C,S | | Time Warner, Inc., 7.700%, due 05/01/32 | | | 361,137 | |
| | 373,000 | | | C,S | | Viacom, Inc., 6.875%, due 04/30/36 | | | 262,752 | |
| | | | | | | | | | | |
| | | | | | | | | | | | | | 2,285,767 | |
| | | | | | | | | | | | | | | |
| | | | | | | |
| | | | | | | Miscellaneous Manufacturing: 0.2% |
| | 310,000 | | | C,S | | Honeywell International, Inc., 5.300%, due 03/01/18 | | | 273,257 | |
| | | | | | | | | | | |
| | | | | | | | | | | | | | 273,257 | |
| | | | | | | | | | | | | | | |
| | | | | | | |
| | | | | | | Retail: 0.1% |
| | 87,000 | | | C,S | | CVS Caremark Corp., 5.750%, due 06/01/17 | | | 70,325 | |
| | | | | | | | | | | |
| | | | | | | | | | | | | | 70,325 | |
| | | | | | | | | | | | | | | |
| | | | | | | |
| | | | | | | Software: 0.2% |
| | 159,000 | | | C,S | | Oracle Corp., 5.250%, due 01/15/16 | | | 140,439 | |
| | 86,000 | | | C,S | | Oracle Corp., 5.750%, due 04/15/18 | | | 75,384 | |
| | | | | | | | | | | |
| | | | | | | | | | | | | | 215,823 | |
| | | | | | | | | | | | | | | |
| | | | | | | | | | | | | | | |
See Accompanying Notes to Financial Statements
231
PORTFOLIO OF INVESTMENTS
ING Global Bond Fund
as of October 31, 2008 (continued)
| | | | | | | | | | | | | | | |
Principal
| | | | | | | | |
| Amount | | | | | | | | Value |
| |
| |
| | | | | | | |
| | | | | | | Telecommunications: 2.1% |
| $ | 290,000 | | | @@, C,
S | | British Telecommunications PLC, 5.950%, due 01/15/18 | | $ | 230,046 | |
| | 138,000 | | | @@, C,
S | | Deutsche Telekom International Finance BV, 5.875%, due 08/20/13 | | | 125,003 | |
| | 120,000 | | | C,S | | Embarq Corp., 6.738%, due 06/01/13 | | | 104,498 | |
| | 87,000 | | | @@, C,
S | | France Telecom SA, 8.500%, due 03/01/31 | | | 82,174 | |
| | 420,000 | | | @@, C,
S | | Telefonica Emisones SAU, 6.421%, due 06/20/16 | | | 365,114 | |
| | 580,000 | | | C,S | | Verizon Communications, Inc., 8.750%, due 11/01/18 | | | 593,218 | |
| | 570,000 | | | C,S | | Verizon Communications, Inc., 8.950%, due 03/01/39 | | | 579,975 | |
| | 420,000 | | | @@, C,
S | | Vodafone Group PLC, 5.625%, due 02/27/17 | | | 343,385 | |
| | | | | | | | | | | |
| | | | | | | | | | | | | | 2,423,413 | |
| | | | | | | | | | | | | | | |
| | | | | | | |
| | | | | | | Transportation: 1.5% |
| | 50,000 | | | C,S | | Burlington Northern Santa Fe Corp., 5.750%, due 03/15/18 | | | 43,863 | |
| | 162,000 | | | C,S | | Burlington Northern Santa Fe Corp., 6.150%, due 05/01/37 | | | 127,280 | |
| | 200,000 | | | C,S | | Burlington Northern Santa Fe Corp., 6.200%, due 08/15/36 | | | 157,590 | |
| | 518,000 | | | C,S | | CSX Corp., 6.250%, due 03/15/18 | | | 417,664 | |
| | 33,000 | | | C,S | | CSX Corp., 7.450%, due 04/01/38 | | | 25,468 | |
| | 200,000 | | | C,S | | Norfolk Southern Corp., 5.750%, due 04/01/18 | | | 172,453 | |
| | 42,000 | | | C,S | | Norfolk Southern Corp., 7.050%, due 05/01/37 | | | 36,371 | |
| | 250,000 | | | C,S | | Norfolk Southern Corp., 7.700%, due 05/15/17 | | | 246,178 | |
| | 350,000 | | | C,S | | Union Pacific Corp., 5.700%, due 08/15/18 | | | 294,901 | |
| | 127,000 | | | C,S | | Union Pacific Corp., 6.625%, due 02/01/29 | | | 103,456 | |
| | 24,000 | | | C,S | | Union Pacific Corp., 7.875%, due 01/15/19 | | | 23,795 | |
| | | | | | | | | | | |
| | | | | | | | | | | | | | 1,649,019 | |
| | | | | | | | | | | | | | | |
| | | | | | | Total Corporate Bonds/Notes
(Cost $15,220,743 ) | | | 14,839,993 | |
| | | | | | | | | | | |
| |
U.S. GOVERNMENT AGENCY OBLIGATIONS: 13.7% |
| | | | | | | |
| | | | | | | Federal National Mortgage Association: 11.5% |
| | 667,000 | | | W | | 5.000%, due 11/15/20 | | | 652,097 | |
| | 3,044,000 | | | W | | 5.000%, due 11/15/37 | | | 2,884,665 | |
| | 646,000 | | | W | | 5.500%, due 11/15/18 | | | 644,082 | |
| | 4,065,000 | | | W | | 5.500%, due 11/13/33 | | | 3,971,631 | |
| | 383,442 | | | S | | 5.500%, due 06/01/37 | | | 374,893 | |
| | 4,577,000 | | | W | | 6.000%, due 11/15/33 | | | 4,577,000 | |
| | | | | | | | | | | |
| | | | | | | | | | | | | | 13,104,368 | |
| | | | | | | | | | | | | | | |
| | | | | | | |
| | | | | | | Government National Mortgage Association: 2.2% |
| | 1,084,000 | | | W | | 5.000%, due 03/15/38 | | | 1,034,373 | |
| | 1,460,000 | | | W | | 5.500%, due 12/19/30 | | | 1,428,519 | |
| | | | | | | | | | | |
| | | | | | | | | | | | | | 2,462,892 | |
| | | | | | | | | | | | | | | |
| | | | | | | Total U.S. Government Agency Obligations
(Cost $15,992,561 ) | | | 15,567,260 | |
| | | | | | | | | | | |
| |
U.S. TREASURY OBLIGATIONS: 17.3% |
| | | | | | | |
| | | | | | | U.S. Treasury Bonds: 2.1% |
| | 995,000 | | | S | | 4.000%, due 08/15/18 | | | 996,633 | |
| | 1,347,000 | | | S | | 4.375%, due 02/15/38 | | | 1,351,421 | |
| | | | | | | | | | | |
| | | | | | | | | | | | | | 2,348,054 | |
| | | | | | | | | | | | | | | |
| | | | | | | |
| | | | | | | U.S. Treasury Notes: 12.2% |
| | 9,888,000 | | | S | | 1.500%, due 10/31/10 | | | 9,871,012 | |
| | 3,849,000 | | | S | | 3.125%, due 09/30/13 | | | 3,912,751 | |
| | | | | | | | | | | |
| | | | | | | | | | | | | | 13,783,763 | |
| | | | | | | | | | | | | | | |
| | | | | | | |
| | | | | | | Treasury Inflation Indexed Protected Securitiesip: 3.0% |
| | 1,280,135 | | | S | | 1.375%, due 07/15/18 | | | 1,077,891 | |
| | 2,516,618 | | | S | | 2.375%, due 04/15/11 | | | 2,386,660 | |
| | | | | | | | | | | |
| | | | | | | | | | | | | | 3,464,551 | |
| | | | | | | | | | | | | | | |
| | | | | | | Total U.S. Treasury Obligations
(Cost $19,794,603 ) | | | 19,596,368 | |
| | | | | | | | | | | |
| |
ASSET-BACKED SECURITIES: 1.3% |
| | | | | | | |
| | | | | | | Other Asset-Backed Securities: 1.3% |
| | 1,000,000 | | | #,C,
S | | Grand Horn Ltd., 5.419%, due 01/12/22 | | | 840,000 | |
| | 767,793 | | | @@, #,
C, S | | Liberty Square CDO Ltd., 4.846%, due 04/15/13 | | | 651,664 | |
| | | | | | | | | | | |
| | | | | | | Total Asset-Backed Securities
(Cost $1,663,888 ) | | | 1,491,664 | |
| | | | | | | | | | | |
| |
COLLATERALIZED MORTGAGE OBLIGATIONS: 3.8% |
| | 700,000 | | | C,S | | GE Capital Commercial Mortgage Corp., 5.340%, due 03/10/44 | | | 549,058 | |
| | 122,000 | | | C,S | | Greenwich Capital Commercial Funding Corp., 5.117%, due 04/10/37 | | | 115,145 | |
| | 700,000 | | | C,S | | Greenwich Capital Commercial Funding Corp., 5.475%, due 03/10/39 | | | 423,508 | |
| | 500,000 | | | C,S | | Greenwich Capital Commercial Funding Corp., 5.736%, due 12/10/49 | | | 373,756 | |
| | 1,027,000 | | | C,S | | GS Mortgage Securities Corp. II, 5.560%, due 11/10/39 | | | 794,435 | |
| | 250,000 | | | C,S | | JPMorgan Chase Commercial Mortgage Securities Corp., 4.865%, due 03/15/46 | | | 221,815 | |
| | 700,000 | | | C,S | | JPMorgan Chase Commercial Mortgage Securities Corp., 5.345%, due 12/15/44 | | | 563,116 | |
| | 97,000 | | | C,S | | LB-UBS Commercial Mortgage Trust, 5.103%, due 11/15/30 | | | 91,344 | |
See Accompanying Notes to Financial Statements
232
PORTFOLIO OF INVESTMENTS
ING Global Bond Fund
as of October 31, 2008 (continued)
| | | | | | | | | | | | | | | |
Principal
| | | | | | | | |
| Amount | | | | | | | | Value |
| |
| |
| $ | 500,000 | | | C,S | | LB-UBS Commercial Mortgage Trust, 5.156%, due 02/15/31 | | $ | 387,814 | |
| | 500,000 | | | C,S | | LB-UBS Commercial Mortgage Trust, 6.150%, due 04/15/41 | | | 398,902 | |
| | 500,000 | | | C,S | | LB-UBS Commercial Mortgage Trust, 6.320%, due 04/15/41 | | | 388,553 | |
| | | | | | | | | | | |
| | | | | | | Total Collateralized Mortgage Obligations
(Cost $5,315,001 ) | | | 4,307,446 | |
| | | | | | | | | | | |
| |
MUNICIPAL BONDS: 0.7% |
| | | | | | | |
| | | | | | | Louisiana: 0.4% |
| | 400,000 | | | C,S | | State of Louisiana, 5.000%, due 10/15/17 | | | 408,856 | |
| | | | | | | | | | | |
| | | | | | | | | | | | | | 408,856 | |
| | | | | | | | | | | | | | | |
| | | | | | | |
| | | | | | | Washington: 0.3% |
| | 400,000 | | | C,S | | State of Washington, 5.000%, due 01/01/33 | | | 373,920 | |
| | | | | | | | | | | |
| | | | | | | | | | | | | | 373,920 | |
| | | | | | | | | | | | | | | |
| | | | | | | Total Municipal Bonds
(Cost $817,928 ) | | | 782,776 | |
| | | | | | | | | | | |
| |
OTHER BONDS: 38.7% |
| | | | | | | |
| | | | | | | Foreign Government Bonds: 38.7% |
| | EUR 7,040,000 | | | @@,S | | Bundesobligation, 3.500%, due 04/08/11 | | | 9,131,362 | |
| | EUR 4,000,000 | | | | | Bundesobligation, 4.000%, due 10/11/13 | | | 5,193,860 | |
| | EUR 2,665,000 | | | @@,S | | Bundesrepublik Deutschland, 4.250%, due 07/04/17 | | | 3,488,620 | |
| | EUR 1,810,000 | | | @@,S | | Bundesrepublik Deutschland, 4.250%, due 07/04/39 | | | 2,224,130 | |
| | CAD 19,000,000 | | | @@,S | | Canadian Government International Bond, 2.750%, due 12/01/10 | | | 15,996,698 | |
| | EUR 930,000 | | | @@,S | | France Government International Bond, 3.250%, due 04/25/16 | | | 1,125,751 | |
| | EUR 915,000 | | | @@,S | | Italy Buoni Poliennali Del Tesoro, 3.750%, due 08/01/16 | | | 1,091,762 | |
| | GBP 230,000 | | | @@,S | | United Kingdom Gilt Bond, 4.250%, due 03/07/36 | | | 347,176 | |
| | GBP 3,000,000 | | | @@,S | | United Kingdom Gilt Bond, 4.750%, due 06/07/10 | | | 4,964,477 | |
| | UYU 6,067,000 | | | @@,S | | Uruguay Government International Bond, 4.250%, due 04/05/27 | | | 135,999 | |
| | | | | | | | | | | |
| | | | | | | Total Other Bonds
(Cost $49,067,542 ) | | | 43,699,835 | |
| | | | | | | | | | | |
| | | | | | | Total Long-Term Investments
(Cost $107,872,266 ) | | | 100,285,342 | |
| | | | | | | | | | | |
| Shares | | | | | | | | Value |
| |
| |
| |
SHORT-TERM INVESTMENTS: 19.9% |
| | | | | | | |
| | | | | | | Affiliated Mutual Fund: 18.7% |
| | 21,125,000 | | | S | | ING Institutional Prime Money Market Fund | | $ | 21,125,000 | |
| | | | | | | | | | | |
| | | | | | | Total Mutual Fund
(Cost $21,125,000 ) | | | 21,125,000 | |
| | | | | | | | | | | |
Principal
| | | | | | | | |
| Amount | | | | | | | | Value |
| |
| |
| | | | | | | |
| | | | | | | Foreign Government Securities: 0.7% |
| $ | 630,000 | | | Z | | German Treasury Bill, 3.330%, due 02/18/09 | | $ | 794,889 | |
| | | | | | | | | | | |
| | | | | | | Total Foreign Government Securities
(Cost $910,610 ) | | | 794,889 | |
| | | | | | | | | | | |
| | | | | | | |
| | | | | | | Repurchase Agreement: 0.5% |
| | 568,000 | | | S | | Deutsche Bank Repurchase Agreement dated 10/31/08, 0.200%, due 11/03/08, $568,009 to be received upon repurchase (Collateralized by $585,000 Federal Home Loan Bank, 5.125%, Market Value plus accrued interest $581,249, due 10/19/16) | | | 568,000 | |
| | | | | | | | | | | |
| | | | | | | Total Repurchase Agreement
(Cost $568,000 ) | | | 568,000 | |
| | | | | | | | | | | |
| | | | | | | Total Short-Term Investments
(Cost $22,603,610 ) | | | 22,487,889 | |
| | | | | | | | | | | |
| | | | | Total Investments in Securities |
| | | | | (Cost $130,475,876)* | | | 108.4 | % | | $ | 122,773,231 | |
| | | | | Other Assets and
Liabilities - Net | | | (8.4 | ) | | | (9,503,707 | ) |
| | | | | | | | | | | | | |
| | | | | Net Assets | | | 100.0 | % | | $ | 113,269,524 | |
| | | | | | | | | | | | | |
| | | |
| @@ | | Foreign Issuer |
| # | | Securities with purchases pursuant to Rule 144A or section 4(2), under the Securities Act of 1933 and may not be resold subject to that rule except to qualified institutional buyers. Unless otherwise noted, these securities have been determined to be liquid under the guidelines established by the Funds’ Board of Directors/Trustees. |
| C | | Bond may be called prior to maturity date. |
| ip | | Treasury inflation indexed protected security whose principal value is adjusted in accordance with changes to the Consumer Price Index. |
| W | | Settlement is on a when-issued or delayed-delivery basis. |
| S | | All or a portion of this security is segregated to cover collateral requirements for applicable futures, options, swaps, foreign forward currency contracts and/or when-issued or delayed-delivery securities. |
| Z | | Indicates Zero Coupon Bond; rate shown reflects current effective yield. |
| BRL | | Brazilian Real |
| CAD | | Canadian Dollar |
| EUR | | EU Euro |
| GBP | | British Pound |
| UYU | | Uruguayan Peso |
| | | |
| * | | Cost for federal income tax purposes is $130,560,608. |
| | | |
| | | Net unrealized depreciation consists of: |
| | | | | |
| Gross Unrealized Appreciation | | $ | 136,325 | |
| Gross Unrealized Depreciation | | | (7,923,702 | ) |
| | | | | |
| Net Unrealized Depreciation | | $ | (7,787,377 | ) |
| | | | | |
See Accompanying Notes to Financial Statements
233
PORTFOLIO OF INVESTMENTS
ING Global Bond Fund
as of October 31, 2008 (continued)
At October 31, 2008 the following forward foreign currency contracts were outstanding for the ING Global Bond Fund:
| | | | | | | | | | | | | | | | | | | | | |
| | | | | | | | | | | Unrealized
|
| | | | | Settlement
| | In Exchange
| | | | Appreciation
|
| Currency | | Buy/Sell | | Date | | For | | Value | | (Depreciation) |
| | | | | | | USD | | | | |
| AUD | | | | | | | | | | | | | | | | | | | | |
| Australian Dollar 1,903,100 | | | BUY | | | | 11/17/08 | | | | 1,332,474 | | | | 1,262,547 | | | $ | (69,927 | ) |
| AUD | | | | | | | | | | | | | | | | | | | | |
| Australian Dollar 2,032,717 | | | BUY | | | | 11/17/08 | | | | 1,390,000 | | | | 1,348,537 | | | | (41,463 | ) |
| AUD | | | | | | | | | | | | | | | | | | | | |
| Australian Dollar 1,034,982 | | | BUY | | | | 11/17/08 | | | | 715,000 | | | | 686,624 | | | | (28,376 | ) |
| AUD | | | | | | | | | | | | | | | | | | | | |
| Australian Dollar 842,121 | | | BUY | | | | 11/17/08 | | | | 567,000 | | | | 558,677 | | | | (8,323 | ) |
| AUD | | | | | | | | | | | | | | | | | | | | |
| Australian Dollar 4,966,724 | | | BUY | | | | 11/17/08 | | | | 3,321,000 | | | | 3,295,005 | | | | (25,995 | ) |
| BRL | | | | | | | | | | | | | | | | | | | | |
| Brazilian Real 1,494,250 | | | BUY | | | | 11/6/08 | | | | 695,000 | | | | 688,028 | | | | (6,972 | ) |
| CAD | | | | | | | | | | | | | | | | | | | | |
| Canadian Dollar 1,151,351 | | | BUY | | | | 11/17/08 | | | | 973,000 | | | | 955,061 | | | | (17,939 | ) |
| CAD | | | | | | | | | | | | | | | | | | | | |
| Canadian Dollar 619,848 | | | BUY | | | | 11/17/08 | | | | 509,000 | | | | 514,172 | | | | 5,172 | |
| CAD | | | | | | | | | | | | | | | | | | | | |
| Canadian Dollar 993,795 | | | BUY | | | | 11/17/08 | | | | 793,000 | | | | 824,366 | | | | 31,366 | |
| CAD | | | | | | | | | | | | | | | | | | | | |
| Canadian Dollar 970,536 | | | BUY | | | | 11/17/08 | | | | 773,000 | | | | 805,072 | | | | 32,072 | |
| CAD | | | | | | | | | | | | | | | | | | | | |
| Canadian Dollar 1,277,320 | | | BUY | | | | 11/17/08 | | | | 990,000 | | | | 1,059,553 | | | | 69,553 | |
| CHF | | | | | | | | | | | | | | | | | | | | |
| Swiss Franc 311,900 | | | BUY | | | | 11/6/08 | | | | 286,611 | | | | 268,972 | | | | (17,639 | ) |
| CHF | | | | | | | | | | | | | | | | | | | | |
| Swiss Franc 873,130 | | | BUY | | | | 11/6/08 | | | | 807,000 | | | | 752,956 | | | | (54,044 | ) |
| CHF | | | | | | | | | | | | | | | | | | | | |
| Swiss Franc 1,382,072 | | | BUY | | | | 11/6/08 | | | | 1,206,000 | | | | 1,191,851 | | | | (14,149 | ) |
| CHF | | | | | | | | | | | | | | | | | | | | |
| Swiss Franc 893,893 | | | BUY | | | | 11/6/08 | | | | 785,000 | | | | 770,862 | | | | (14,138 | ) |
| CHF | | | | | | | | | | | | | | | | | | | | |
| Swiss Franc 861,179 | | | BUY | | | | 11/6/08 | | | | 763,000 | | | | 742,651 | | | | (20,349 | ) |
| CHF | | | | | | | | | | | | | | | | | | | | |
| Swiss Franc 1,758,375 | | | BUY | | | | 11/6/08 | | | | 1,548,000 | | | | 1,516,361 | | | | (31,639 | ) |
| CHF | | | | | | | | | | | | | | | | | | | | |
| Swiss Franc 1,173,380 | | | BUY | | | | 11/6/08 | | | | 1,035,000 | | | | 1,011,881 | | | | (23,119 | ) |
| CHF | | | | | | | | | | | | | | | | | | | | |
| Swiss Franc 852,181 | | | BUY | | | | 11/6/08 | | | | 751,000 | | | | 734,891 | | | | (16,109 | ) |
| CHF | | | | | | | | | | | | | | | | | | | | |
| Swiss Franc 357,531 | | | BUY | | | | 11/6/08 | | | | 315,000 | | | | 308,322 | | | | (6,678 | ) |
| CHF | | | | | | | | | | | | | | | | | | | | |
| Swiss Franc 731,439 | | | BUY | | | | 11/6/08 | | | | 630,000 | | | | 630,767 | | | | 767 | |
| CHF | | | | | | | | | | | | | | | | | | | | |
| Swiss Franc 819,554 | | | BUY | | | | 11/6/08 | | | | 707,000 | | | | 706,755 | | | | (245 | ) |
| DKK | | | | | | | | | | | | | | | | | | | | |
| Danish Krone 2,200,000 | | | BUY | | | | 11/6/08 | | | | 431,522 | | | | 376,397 | | | | (55,125 | ) |
| EUR | | | | | | | | | | | | | | | | | | | | |
| EU Euro 3,449,500 | | | BUY | | | | 11/17/08 | | | | 4,724,090 | | | | 4,393,678 | | | | (330,412 | ) |
| EUR | | | | | | | | | | | | | | | | | | | | |
| EU Euro 1,569,540 | | | BUY | | | | 11/17/08 | | | | 2,113,000 | | | | 1,999,146 | | | | (113,854 | ) |
| EUR | | | | | | | | | | | | | | | | | | | | |
| EU Euro 1,621,536 | | | BUY | | | | 11/17/08 | | | | 2,174,000 | | | | 2,065,374 | | | | (108,626 | ) |
| EUR | | | | | | | | | | | | | | | | | | | | |
| EU Euro 903,506 | | | BUY | | | | 11/17/08 | | | | 1,179,000 | | | | 1,150,808 | | | | (28,192 | ) |
| GBP | | | | | | | | | | | | | | | | | | | | |
| British Pound 752,673 | | | BUY | | | | 11/6/08 | | | | 1,383,000 | | | | 1,210,860 | | | | (172,140 | ) |
| GBP | | | | | | | | | | | | | | | | | | | | |
| British Pound 419,299 | | | BUY | | | | 11/6/08 | | | | 760,000 | | | | 674,547 | | | | (85,453 | ) |
| GBP | | | | | | | | | | | | | | | | | | | | |
| British Pound 361,126 | | | BUY | | | | 11/6/08 | | | | 645,000 | | | | 580,961 | | | | (64,039 | ) |
| GBP | | | | | | | | | | | | | | | | | | | | |
| British Pound 458,593 | | | BUY | | | | 11/6/08 | | | | 813,000 | | | | 737,760 | | | | (75,240 | ) |
| GBP | | | | | | | | | | | | | | | | | | | | |
| British Pound 460,846 | | | BUY | | | | 11/6/08 | | | | 813,000 | | | | 741,386 | | | | (71,614 | ) |
| GBP | | | | | | | | | | | | | | | | | | | | |
| British Pound 630,549 | | | BUY | | | | 11/6/08 | | | | 1,102,000 | | | | 1,014,394 | | | | (87,606 | ) |
| GBP | | | | | | | | | | | | | | | | | | | | |
| British Pound 563,480 | | | BUY | | | | 11/6/08 | | | | 989,000 | | | | 906,497 | | | | (82,503 | ) |
| GBP | | | | | | | | | | | | | | | | | | | | |
| British Pound 309,116 | | | BUY | | | | 11/6/08 | | | | 538,000 | | | | 497,290 | | | | (40,710 | ) |
| GBP | | | | | | | | | | | | | | | | | | | | |
| British Pound 314,899 | | | BUY | | | | 11/6/08 | | | | 538,000 | | | | 506,592 | | | | (31,408 | ) |
| GBP | | | | | | | | | | | | | | | | | | | | |
| British Pound 1,980,961 | | | BUY | | | | 11/6/08 | | | | 3,439,000 | | | | 3,186,866 | | | | (252,134 | ) |
| GBP | | | | | | | | | | | | | | | | | | | | |
| British Pound 973,870 | | | BUY | | | | 11/6/08 | | | | 1,707,000 | | | | 1,566,711 | | | | (140,289 | ) |
| GBP | | | | | | | | | | | | | | | | | | | | |
| British Pound 965,336 | | | BUY | | | | 11/6/08 | | | | 1,668,000 | | | | 1,552,982 | | | | (115,018 | ) |
| GBP | | | | | | | | | | | | | | | | | | | | |
| British Pound 385,041 | | | BUY | | | | 11/6/08 | | | | 650,000 | | | | 619,434 | | | | (30,566 | ) |
| GBP | | | | | | | | | | | | | | | | | | | | |
| British Pound 372,359 | | | BUY | | | | 11/6/08 | | | | 580,000 | | | | 599,032 | | | | 19,032 | |
| GBP | | | | | | | | | | | | | | | | | | | | |
| British Pound 172,676 | | | BUY | | | | 11/6/08 | | | | 282,000 | | | | 277,791 | | | | (4,209 | ) |
| JPY | | | | | | | | | | | | | | | | | | | | |
| Japanese Yen 1,981,733,900 | | | BUY | | | | 11/17/08 | | | | 19,541,202 | | | | 20,129,288 | | | | 588,086 | |
| JPY | | | | | | | | | | | | | | | | | | | | |
| Japanese Yen 64,159,998 | | | BUY | | | | 11/17/08 | | | | 641,000 | | | | 651,700 | | | | 10,700 | |
| JPY | | | | | | | | | | | | | | | | | | | | |
| Japanese Yen 111,641,401 | | | BUY | | | | 11/17/08 | | | | 1,133,000 | | | | 1,133,988 | | | | 988 | |
| JPY | | | | | | | | | | | | | | | | | | | | |
| Japanese Yen 103,255,556 | | | BUY | | | | 11/17/08 | | | | 1,116,000 | | | | 1,048,809 | | | | (67,191 | ) |
| JPY | | | | | | | | | | | | | | | | | | | | |
| Japanese Yen 103,199,756 | | | BUY | | | | 11/17/08 | | | | 1,116,000 | | | | 1,048,242 | | | | (67,758 | ) |
| JPY | | | | | | | | | | | | | | | | | | | | |
| Japanese Yen 137,086,985 | | | BUY | | | | 11/17/08 | | | | 1,412,000 | | | | 1,392,449 | | | | (19,551 | ) |
| KRW | | | | | | | | | | | | | | | | | | | | |
| South Korean Won 1,359,700,006 | | | BUY | | | | 11/17/08 | | | | 1,075,712 | | | | 1,056,510 | | | | (19,202 | ) |
| MXN | | | | | | | | | | | | | | | | | | | | |
| Mexican Peso 3,918,600 | | | BUY | | | | 11/20/08 | | | | 317,006 | | | | 302,713 | | | | (14,293 | ) |
| MXN | | | | | | | | | | | | | | | | | | | | |
| Mexican Peso 7,604,920 | | | BUY | | | | 11/20/08 | | | | 564,000 | | | | 587,482 | | | | 23,482 | |
| NOK | | | | | | | | | | | | | | | | | | | | |
| Norwegian Krone 4,196,256 | | | BUY | | | | 11/6/08 | | | | 701,000 | | | | 622,724 | | | | (78,276 | ) |
| NOK | | | | | | | | | | | | | | | | | | | | |
| Norwegian Krone 8,537,853 | | | BUY | | | | 11/6/08 | | | | 1,385,000 | | | | 1,267,017 | | | | (117,983 | ) |
| NOK | | | | | | | | | | | | | | | | | | | | |
| Norwegian Krone 9,151,759 | | | BUY | | | | 11/6/08 | | | | 1,471,000 | | | | 1,358,120 | | | | (112,880 | ) |
| NOK | | | | | | | | | | | | | | | | | | | | |
| Norwegian Krone 4,534,336 | | | BUY | | | | 11/6/08 | | | | 695,000 | | | | 672,895 | | | | (22,105 | ) |
| NOK | | | | | | | | | | | | | | | | | | | | |
| Norwegian Krone 4,327,262 | | | BUY | | | | 11/6/08 | | | | 630,000 | | | | 642,165 | | | | 12,165 | |
| NOK | | | | | | | | | | | | | | | | | | | | |
| Norwegian Krone 4,282,351 | | | BUY | | | | 11/6/08 | | | | 628,000 | | | | 635,501 | | | | 7,501 | |
| NZD | | | | | | | | | | | | | | | | | | | | |
| New Zealand Dollar 1,657,193 | | | BUY | | | | 11/17/08 | | | | 1,035,000 | | | | 962,962 | | | | (72,038 | ) |
| NZD | | | | | | | | | | | | | | | | | | | | |
| New Zealand Dollar 1,624,198 | | | BUY | | | | 11/17/08 | | | | 1,001,000 | | | | 943,789 | | | | (57,211 | ) |
| NZD | | | | | | | | | | | | | | | | | | | | |
| New Zealand Dollar 1,479,474 | | | BUY | | | | 11/17/08 | | | | 878,000 | | | | 859,693 | | | | (18,307 | ) |
| NZD | | | | | | | | | | | | | | | | | | | | |
| New Zealand Dollar 2,406,472 | | | BUY | | | | 11/17/08 | | | | 1,432,000 | | | | 1,398,353 | | | | (33,647 | ) |
| NZD | | | | | | | | | | | | | | | | | | | | |
| New Zealand Dollar 1,447,809 | | | BUY | | | | 11/17/08 | | | | 847,000 | | | | 841,293 | | | | (5,707 | ) |
| PLN | | | | | | | | | | | | | | | | | | | | |
| Polish Zloty 1,000,000 | | | BUY | | | | 11/28/08 | | | | 391,567 | | | | 360,550 | | | | (31,017 | ) |
| SEK | | | | | | | | | | | | | | | | | | | | |
| Swedish Krona 13,975,400 | | | BUY | | | | 11/6/08 | | | | 2,110,389 | | | | 1,800,616 | | | | (309,773 | ) |
| SEK | | | | | | | | | | | | | | | | | | | | |
| Swedish Krona 3,346,927 | | | BUY | | | | 11/6/08 | | | | 477,000 | | | | 431,224 | | | | (45,776 | ) |
| SEK | | | | | | | | | | | | | | | | | | | | |
| Swedish Krona 6,027,093 | | | BUY | | | | 11/6/08 | | | | 849,000 | | | | 776,542 | | | | (72,458 | ) |
| SEK | | | | | | | | | | | | | | | | | | | | |
| Swedish Krona 4,396,916 | | | BUY | | | | 11/6/08 | | | | 573,000 | | | | 566,506 | | | | (6,494 | ) |
| SEK | | | | | | | | | | | | | | | | | | | | |
| Swedish Krona 4,485,582 | | | BUY | | | | 11/6/08 | | | | 571,000 | | | | 577,930 | | | | 6,930 | |
| TWD | | | | | | | | | | | | | | | | | | | | |
| Taiwan New Dollar 14,000,000 | | | BUY | | | | 11/28/08 | | | | 433,262 | | | | 426,096 | | | | (7,166 | ) |
| | | | | | | | | | | | | | | | | | | | | |
| | | | | | | | | | | | | | | | | | | $ | (2,657,261 | ) |
| | | | | | | | | | | | | | | | | | | | | |
| AUD | | | | | | | | | | | | | | | | | | | | |
| Australian Dollar 798,663 | | | SELL | | | | 11/17/08 | | | | 560,000 | | | | 529,846 | | | $ | 30,154 | |
| AUD | | | | | | | | | | | | | | | | | | | | |
| Australian Dollar 805,490 | | | SELL | | | | 11/17/08 | | | | 556,000 | | | | 534,375 | | | | 21,625 | |
| AUD | | | | | | | | | | | | | | | | | | | | |
| Australian Dollar 2,101,444 | | | SELL | | | | 11/17/08 | | | | 1,390,000 | | | | 1,394,132 | | | | (4,132 | ) |
| AUD | | | | | | | | | | | | | | | | | | | | |
| Australian Dollar 2,024,805 | | | SELL | | | | 11/17/08 | | | | 1,390,000 | | | | 1,343,288 | | | | 46,712 | |
| AUD | | | | | | | | | | | | | | | | | | | | |
| Australian Dollar 2,080,136 | | | SELL | | | | 11/17/08 | | | | 1,430,000 | | | | 1,379,996 | | | | 50,004 | |
| AUD | | | | | | | | | | | | | | | | | | | | |
| Australian Dollar 2,625,340 | | | SELL | | | | 11/17/08 | | | | 1,598,000 | | | | 1,741,693 | | | | (143,693 | ) |
| AUD | | | | | | | | | | | | | | | | | | | | |
| Australian Dollar 1,367,086 | | | SELL | | | | 11/17/08 | | | | 849,000 | | | | 906,947 | | | | (57,947 | ) |
| AUD | | | | | | | | | | | | | | | | | | | | |
| Australian Dollar 1,273,998 | | | SELL | | | | 11/17/08 | | | | 847,000 | | | | 845,191 | | | | 1,809 | |
See Accompanying Notes to Financial Statements
234
PORTFOLIO OF INVESTMENTS
ING Global Bond Fund
as of October 31, 2008 (continued)
| | | | | | | | | | | | | | | | | | | | | |
| | | | | | | | | | | Unrealized
|
| | | | | Settlement
| | In Exchange
| | | | Appreciation
|
| Currency | | Buy/Sell | | Date | | For | | Value | | (Depreciation) |
| | | | | | | USD | | | | |
| AUD | | | | | | | | | | | | | | | | | | | | |
| Australian Dollar 1,048,852 | | | SELL | | | | 11/17/08 | | | | 714,000 | | | | 695,826 | | | $ | 18,174 | |
| BRL | | | | | | | | | | | | | | | | | | | | |
| Brazilian Real 1,408,920 | | | SELL | | | | 11/6/08 | | | | 597,000 | | | | 648,737 | | | | (51,737 | ) |
| BRL | | | | | | | | | | | | | | | | | | | | |
| Brazilian Real 695,147 | | | SELL | | | | 11/21/08 | | | | 347,400 | | | | 318,128 | | | | 29,272 | |
| CAD | | | | | | | | | | | | | | | | | | | | |
| Canadian Dollar 2,407,665 | | | SELL | | | | 11/17/08 | | | | 2,098,000 | | | | 1,997,189 | | | | 100,811 | |
| CAD | | | | | | | | | | | | | | | | | | | | |
| Canadian Dollar 16,139,600 | | | SELL | | | | 11/17/08 | | | | 13,917,048 | | | | 13,388,008 | | | | 529,040 | |
| CAD | | | | | | | | | | | | | | | | | | | | |
| Canadian Dollar 1,517,335 | | | SELL | | | | 11/17/08 | | | | 1,192,000 | | | | 1,258,649 | | | | (66,649 | ) |
| CHF | | | | | | | | | | | | | | | | | | | | |
| Swiss Franc 823,316 | | | SELL | | | | 11/6/08 | | | | 760,000 | | | | 709,998 | | | | 50,002 | |
| CHF | | | | | | | | | | | | | | | | | | | | |
| Swiss Franc 471,094 | | | SELL | | | | 11/6/08 | | | | 421,000 | | | | 406,255 | | | | 14,745 | |
| CHF | | | | | | | | | | | | | | | | | | | | |
| Swiss Franc 597,577 | | | SELL | | | | 11/6/08 | | | | 533,000 | | | | 515,330 | | | | 17,670 | |
| CHF | | | | | | | | | | | | | | | | | | | | |
| Swiss Franc 1,114,911 | | | SELL | | | | 11/6/08 | | | | 981,000 | | | | 961,460 | | | | 19,540 | |
| CHF | | | | | | | | | | | | | | | | | | | | |
| Swiss Franc 764,001 | | | SELL | | | | 11/6/08 | | | | 673,000 | | | | 658,848 | | | | 14,152 | |
| CHF | | | | | | | | | | | | | | | | | | | | |
| Swiss Franc 449,993 | | | SELL | | | | 11/6/08 | | | | 396,000 | | | | 388,058 | | | | 7,942 | |
| CHF | | | | | | | | | | | | | | | | | | | | |
| Swiss Franc 1,597,788 | | | SELL | | | | 11/6/08 | | | | 1,415,000 | | | | 1,377,876 | | | | 37,124 | |
| CHF | | | | | | | | | | | | | | | | | | | | |
| Swiss Franc 850,239 | | | SELL | | | | 11/6/08 | | | | 751,000 | | | | 733,217 | | | | 17,783 | |
| CHF | | | | | | | | | | | | | | | | | | | | |
| Swiss Franc 1,219,169 | | | SELL | | | | 11/6/08 | | | | 1,048,000 | | | | 1,051,368 | | | | (3,368 | ) |
| CHF | | | | | | | | | | | | | | | | | | | | |
| Swiss Franc 1,070,703 | | | SELL | | | | 11/6/08 | | | | 928,000 | | | | 923,337 | | | | 4,663 | |
| CHF | | | | | | | | | | | | | | | | | | | | |
| Swiss Franc 806,166 | | | SELL | | | | 11/6/08 | | | | 712,000 | | | | 695,209 | | | | 16,791 | |
| EUR | | | | | | | | | | | | | | | | | | | | |
| EU Euro 287,179 | | | SELL | | | | 11/17/08 | | | | 392,000 | | | | 365,784 | | | | 26,216 | |
| EUR | | | | | | | | | | | | | | | | | | | | |
| EU Euro 266,553 | | | SELL | | | | 11/17/08 | | | | 344,000 | | | | 339,512 | | | | 4,488 | |
| EUR | | | | | | | | | | | | | | | | | | | | |
| EU Euro 588,346 | | | SELL | | | | 11/17/08 | | | | 743,000 | | | | 749,385 | | | | (6,385 | ) |
| EUR | | | | | | | | | | | | | | | | | | | | |
| EU Euro 793,719 | | | SELL | | | | 11/17/08 | | | | 990,000 | | | | 1,010,971 | | | | (20,971 | ) |
| EUR | | | | | | | | | | | | | | | | | | | | |
| EU Euro 873,726 | | | SELL | | | | 11/17/08 | | | | 1,130,000 | | | | 1,112,878 | | | | 17,122 | |
| EUR | | | | | | | | | | | | | | | | | | | | |
| EU Euro 663,094 | | | SELL | | | | 11/17/08 | | | | 856,000 | | | | 844,592 | | | | 11,408 | |
| GBP | | | | | | | | | | | | | | | | | | | | |
| British Pound 3,466,200 | | | SELL | | | | 11/6/08 | | | | 6,399,669 | | | | 5,576,240 | | | | 823,429 | |
| GBP | | | | | | | | | | | | | | | | | | | | |
| British Pound 376,249 | | | SELL | | | | 11/6/08 | | | | 691,000 | | | | 605,289 | | | | 85,711 | |
| GBP | | | | | | | | | | | | | | | | | | | | |
| British Pound 353,785 | | | SELL | | | | 11/6/08 | | | | 617,000 | | | | 569,151 | | | | 47,849 | |
| GBP | | | | | | | | | | | | | | | | | | | | |
| British Pound 718,989 | | | SELL | | | | 11/6/08 | | | | 1,262,000 | | | | 1,156,672 | | | | 105,328 | |
| GBP | | | | | | | | | | | | | | | | | | | | |
| British Pound 962,746 | | | SELL | | | | 11/6/08 | | | | 1,668,000 | | | | 1,548,815 | | | | 119,185 | |
| GBP | | | | | | | | | | | | | | | | | | | | |
| British Pound 1,224,647 | | | SELL | | | | 11/6/08 | | | | 2,117,000 | | | | 1,970,147 | | | | 146,853 | |
| GBP | | | | | | | | | | | | | | | | | | | | |
| British Pound 557,776 | | | SELL | | | | 11/6/08 | | | | 907,000 | | | | 897,321 | | | | 9,679 | |
| GBP | | | | | | | | | | | | | | | | | | | | |
| British Pound 637,860 | | | SELL | | | | 11/6/08 | | | | 1,031,000 | | | | 1,026,156 | | | | 4,844 | |
| GBP | | | | | | | | | | | | | | | | | | | | |
| British Pound 620,280 | | | SELL | | | | 11/6/08 | | | | 968,000 | | | | 997,874 | | | | (29,874 | ) |
| JPY | | | | | | | | | | | | | | | | | | | | |
| Japanese Yen 85,635,807 | | | SELL | | | | 11/17/08 | | | | 839,000 | | | | 869,838 | | | | (30,838 | ) |
| JPY | | | | | | | | | | | | | | | | | | | | |
| Japanese Yen 106,762,973 | | | SELL | | | | 11/17/08 | | | | 1,056,000 | | | | 1,084,436 | | | | (28,436 | ) |
| JPY | | | | | | | | | | | | | | | | | | | | |
| Japanese Yen 55,762,985 | | | SELL | | | | 11/17/08 | | | | 573,000 | | | | 566,408 | | | | 6,592 | |
| JPY | | | | | | | | | | | | | | | | | | | | |
| Japanese Yen 39,033,025 | | | SELL | | | | 11/17/08 | | | | 410,000 | | | | 396,475 | | | | 13,525 | |
| MXN | | | | | | | | | | | | | | | | | | | | |
| Mexican Peso 7,316,960 | | | SELL | | | | 11/20/08 | | | | 556,000 | | | | 565,237 | | | | (9,237 | ) |
| MXN | | | | | | | | | | | | | | | | | | | | |
| Mexican Peso 7,607,040 | | | SELL | | | | 11/20/08 | | | | 566,000 | | | | 587,646 | | | | (21,646 | ) |
| NOK | | | | | | | | | | | | | | | | | | | | |
| Norwegian Krone 856,600 | | | SELL | | | | 11/6/08 | | | | 151,442 | | | | 127,119 | | | | 24,323 | |
| NOK | | | | | | | | | | | | | | | | | | | | |
| Norwegian Krone 3,261,527 | | | SELL | | | | 11/6/08 | | | | 576,000 | | | | 484,010 | | | | 91,990 | |
| NOK | | | | | | | | | | | | | | | | | | | | |
| Norwegian Krone 3,196,410 | | | SELL | | | | 11/6/08 | | | | 563,000 | | | | 474,347 | | | | 88,653 | |
| NOK | | | | | | | | | | | | | | | | | | | | |
| Norwegian Krone 4,920,489 | | | SELL | | | | 11/6/08 | | | | 785,000 | | | | 730,200 | | | | 54,800 | |
| NOK | | | | | | | | | | | | | | | | | | | | |
| Norwegian Krone 8,669,456 | | | SELL | | | | 11/6/08 | | | | 1,402,000 | | | | 1,286,547 | | | | 115,453 | |
| NOK | | | | | | | | | | | | | | | | | | | | |
| Norwegian Krone 8,752,399 | | | SELL | | | | 11/6/08 | | | | 1,399,000 | | | | 1,298,855 | | | | 100,145 | |
| NOK | | | | | | | | | | | | | | | | | | | | |
| Norwegian Krone 5,668,489 | | | SELL | | | | 11/6/08 | | | | 858,000 | | | | 841,203 | | | | 16,797 | |
| NOK | | | | | | | | | | | | | | | | | | | | |
| Norwegian Krone 9,775,987 | | | SELL | | | | 11/6/08 | | | | 1,415,000 | | | | 1,450,757 | | | | (35,757 | ) |
| NOK | | | | | | | | | | | | | | | | | | | | |
| Norwegian Krone 3,759,763 | | | SELL | | | | 11/6/08 | | | | 565,000 | | | | 557,948 | | | | 7,052 | |
| NZD | | | | | | | | | | | | | | | | | | | | |
| New Zealand Dollar 780,600 | | | SELL | | | | 11/17/08 | | | | 483,886 | | | | 453,591 | | | | 30,295 | |
| NZD | | | | | | | | | | | | | | | | | | | | |
| New Zealand Dollar 1,905,602 | | | SELL | | | | 11/17/08 | | | | 1,140,000 | | | | 1,107,308 | | | | 32,692 | |
| NZD | | | | | | | | | | | | | | | | | | | | |
| New Zealand Dollar 2,827,880 | | | SELL | | | | 11/17/08 | | | | 1,724,000 | | | | 1,643,225 | | | | 80,775 | |
| NZD | | | | | | | | | | | | | | | | | | | | |
| New Zealand Dollar 502,229 | | | SELL | | | | 11/17/08 | | | | 304,000 | | | | 291,835 | | | | 12,165 | |
| NZD | | | | | | | | | | | | | | | | | | | | |
| New Zealand Dollar 1,336,719 | | | SELL | | | | 11/17/08 | | | | 736,000 | | | | 776,742 | | | | (40,742 | ) |
| NZD | | | | | | | | | | | | | | | | | | | | |
| New Zealand Dollar 592,047 | | | SELL | | | | 11/17/08 | | | | 325,000 | | | | 344,028 | | | | (19,028 | ) |
| RUB | | | | | | | | | | | | | | | | | | | | |
| Russian Ruble 56,940,000 | | | SELL | | | | 11/6/08 | | | | 2,261,466 | | | | 2,089,003 | | | | 172,463 | |
| SEK | | | | | | | | | | | | | | | | | | | | |
| Swedish Krona 3,818,564 | | | SELL | | | | 11/6/08 | | | | 563,000 | | | | 491,991 | | | | 71,009 | |
| SEK | | | | | | | | | | | | | | | | | | | | |
| Swedish Krona 2,931,928 | | | SELL | | | | 11/6/08 | | | | 421,000 | | | | 377,755 | | | | 43,245 | |
| SEK | | | | | | | | | | | | | | | | | | | | |
| Swedish Krona 4,784,731 | | | SELL | | | | 11/6/08 | | | | 673,000 | | | | 616,473 | | | | 56,527 | |
| SEK | | | | | | | | | | | | | | | | | | | | |
| Swedish Krona 5,015,988 | | | SELL | | | | 11/6/08 | | | | 707,000 | | | | 646,269 | | | | 60,731 | |
| SEK | | | | | | | | | | | | | | | | | | | | |
| Swedish Krona 2,016,464 | | | SELL | | | | 11/6/08 | | | | 283,000 | | | | 259,805 | | | | 23,195 | |
| SEK | | | | | | | | | | | | | | | | | | | | |
| Swedish Krona 9,975,410 | | | SELL | | | | 11/6/08 | | | | 1,399,000 | | | | 1,285,251 | | | | 113,749 | |
| SEK | | | | | | | | | | | | | | | | | | | | |
| Swedish Krona 5,673,922 | | | SELL | | | | 11/6/08 | | | | 707,000 | | | | 731,039 | | | | (24,039 | ) |
| SEK | | | | | | | | | | | | | | | | | | | | |
| Swedish Krona 4,305,926 | | | SELL | | | | 11/6/08 | | | | 565,000 | | | | 554,783 | | | | 10,217 | |
| | | | | | | | | | | | | | | | | | | | | |
| | | | | | | | | | | | | | | | | | | $ | 3,062,039 | |
| | | | | | | | | | | | | | | | | | | | | |
See Accompanying Notes to Financial Statements
235
PORTFOLIO OF INVESTMENTS
ING Global Bond Fund
as of October 31, 2008 (continued)
ING Global Bond Fund Open Futures Contracts on October 31, 2008:
| | | | | | | | | | | | | |
| | | | | | | Unrealized
|
| | | Number of
| | Expiration
| | Appreciation/
|
Contract Description | | Contracts | | Date | | (Depreciation) |
| |
Long Contracts | | | | | | | | | | | | |
90-Day Sterling | | | 100 | | | | 03/17/10 | | | $ | 384,293 | |
Australia 3-Year Bond | | | 177 | | | | 12/15/08 | | | | 282,647 | |
| Euro-Bund | | | 25 | | | | 12/08/08 | | | | 53,018 | |
| Euro-Schatz | | | 159 | | | | 12/08/08 | | | | 532,143 | |
Japan 10-Year Bond (TSE) | | | 12 | | | | 12/11/08 | | | | (80,696 | ) |
Japanese Government Bonds 10-Year Mini | | | 4 | | | | 12/10/08 | | | | 13 | |
| Long Gilt | | | 62 | | | | 12/29/08 | | | | 142,187 | |
| | | | | | | | | | | | | |
| | | | | | | | | | | $ | 1,313,605 | |
| | | | | | | | | | | | | |
Short Contracts | | | | | | | | | | | | |
90-Day Sterling | | | 100 | | | | 03/18/09 | | | $ | (472,964 | ) |
Australia 10-Year Bond | | | 40 | | | | 12/15/08 | | | | (15,021 | ) |
| U.S. Treasury Long Bond | | | 110 | | | | 12/19/08 | | | | 328,666 | |
| | | | | | | | | | | | | |
| | | | | | | | | | | $ | (159,319 | ) |
| | | | | | | | | | | | | |
ING Global Bond Fund Credit Default Swap Agreements Outstanding on October 31, 2008:
| | | | | | | | | | | | | | | | | | | | | | | | | |
| | | | | | | | | | | | | | | Unrealized
|
| | | | | Buy/Sell
| | (Pay)/Receive
| | Termination
| | | | Notional
| | Appreciation/
|
Counterparty | | Reference Entity/Obligation | | Protection(1) | | Fixed Rate (%) | | Date | | | | Amount | | (Depreciation) |
| |
| UBS AG | | Australia and New Zealand Banking Group Ltd. 4.450%, 02/05/15 | | | Buy | | | (0.350) | | | 09/20/17 | | | | USD | | | | 50,000 | | | $ | 3,130 | |
| Citibank N.A., New York | | Bank of Scotland PLC 5.125%, 12/05/13 | | | Buy | | | (0.660) | | | 09/20/17 | | | | USD | | | | 100,000 | | | | 4,787 | |
| UBS AG | | Bank of Scotland PLC 5.125%, 12/05/13 | | | Buy | | | (0.410) | | | 09/20/17 | | | | USD | | | | 50,000 | | | | 3,277 | |
| Citibank N.A., New York | | BNP Paribas 5.250%, 12/17/12 | | | Buy | | | (0.520) | | | 09/20/17 | | | | USD | | | | 100,000 | | | | 2,120 | |
| Citibank N.A., New York | | CDX.EM.9 Index | | | Buy | | | (2.650) | | | 06/20/13 | | | | USD | | | | 1,000,000 | | | | 148,711 | |
| Citibank N.A., New York | | CDX.NA.IG.10 Index | | | Sell | | | 1.550 | | | 06/20/13 | | | | USD | | | | 16,592,000 | | | | (478,410 | ) |
| UBS AG | | HSBC Bank PLC 4.250%, 03/18/16 | | | Buy | | | (0.400) | | | 09/20/17 | | | | USD | | | | 50,000 | | | | 3,013 | |
| Citibank N.A., New York | | LCDX.NA.9 Index (15-100% Tranche) | | | Buy | | | (1.080) | | | 12/20/12 | | | | USD | | | | 2,000,000 | | | | 176,818 | |
| UBS AG | | Royal Bank of Scotland PLC 6.000%, 05/10/13 | | | Buy | | | (0.400) | | | 09/20/17 | | | | USD | | | | 50,000 | | | | 3,206 | |
| Citibank N.A., New York | | Societe Generale 6.625%, 04/27/15 | | | Buy | | | (0.510) | | | 09/20/17 | | | | USD | | | | 100,000 | | | | 4,136 | |
| UBS AG | | Societe Generale 6.625%, 04/27/15 | | | Buy | | | (0.380) | | | 09/20/17 | | | | USD | | | | 50,000 | | | | 2,534 | |
| Citibank N.A., New York | | Standard Chartered Bank 3.625%, 02/03/17 | | | Buy | | | (0.670) | | | 09/20/17 | | | | USD | | | | 100,000 | | | | 13,092 | |
| UBS AG | | Standard Chartered Bank 3.625%, 02/03/17 | | | Buy | | | (0.420) | | | 09/20/17 | | | | USD | | | | 50,000 | | | | 7,376 | |
| UBS AG | | Westpac Banking Corp. 5.875%, 04/29/18 | | | Buy | | | (0.350) | | | 09/20/17 | | | | USD | | | | 50,000 | | | | 5,653 | |
| | | | | | | | | | | | | | | | | | | | | | | | | |
| | | | | | | | | | | | | | | | | | | | | | | $ | (100,557 | ) |
| | | | | | | | | | | | | | | | | | | | | | | | | |
| |
| (1) | If the Fund is a seller of protection and a credit event occurs, as defined under the terms of that particular swap agreement, the Fund must pay to the buyer of the protection the notional value of the swap contract less the value of the reference entity/obligation, and in certain instances take delivery of the reference entity/obligation. If the Fund is a buyer of protection and a credit event occurs, as defined under the terms of that particular swap agreement, the Fund will receive from the seller of protection the notional value of the swap contract less the value of the reference entity/obligation, which may have little or no value, and in certain instances deliver the reference entity/obligation to the seller. |
See Accompanying Notes to Financial Statements
236
PORTFOLIO OF INVESTMENTS
ING Global Bond Fund
as of October 31, 2008 (continued)
ING Global Bond Fund Interest Rate Swap Agreements Outstanding on October 31, 2008:
| | | | | | | | | | | | | | | |
| | | | | | | Notional
| | Unrealized
|
| | | Termination
| | | | Principal
| | Appreciation/
|
| | | Date | | | | Amount | | (Depreciation) |
| |
Receive a fixed rate equal to 3.186% and pay a floating rate based on 3-month USD-LIBOR
Counterparty: Citibank N.A., New York | | | 04/22/10 | | | USD | | | 5,477,000 | | | $ | 40,227 | |
Receive a fixed rate equal to 7.640% and pay a floating rate based on 3-month NZD-BBR-FRA
Counterparty: UBS AG, London | | | 11/02/10 | | | NZD | | | 19,300,000 | | | | 276,040 | |
Receive a fixed rate equal to 7.380% and pay a floating rate based on 3-month NZD-BBR-FRA
Counterparty: UBS AG, London | | | 01/12/11 | | | NZD | | | 11,700,000 | | | | 141,655 | |
Receive a fixed rate equal to 7.060% and pay a floating rate based on 3-month NZD-BBR-FRA
Counterparty: UBS AG, London | | | 01/28/11 | | | NZD | | | 9,290,000 | | | | 82,613 | |
Receive a fixed rate equal to 7.015% and pay a floating rate based on 3-month NZD-BBR-FRA
Counterparty: UBS AG, London | | | 02/04/11 | | | NZD | | | 4,700,000 | | | | 26,607 | |
Receive a floating rate based on 3-month NZD-BBR-FRA and pay a fixed rate equal to 7.410%
Counterparty: UBS AG, London | | | 11/02/15 | | | NZD | | | 6,530,000 | | | | (201,859 | ) |
Receive a floating rate based on 3-month NZD-BBR-FRA and pay a fixed rate equal to 7.1825%
Counterparty: UBS AG, London | | | 01/12/16 | | | NZD | | | 4,000,000 | | | | (95,219 | ) |
Receive a floating rate based on 3-month NZD-BBR-FRA and pay a fixed rate equal to 7.055%
Counterparty: UBS AG, London | | | 01/28/16 | | | NZD | | | 3,158,000 | | | | (62,794 | ) |
Receive a floating rate based on 3-month NZD-BBR-FRA and pay a fixed rate equal to 7.000%
Counterparty: UBS AG, London | | | 02/04/16 | | | NZD | | | 1,580,000 | | | | (24,352 | ) |
Receive a floating rate based on 3-month USD-LIBOR and pay a fixed rate equal to 4.270%
Counterparty: Citibank N.A., New York | | | 01/23/18 | | | USD | | | 1,280,000 | | | | (3,766 | ) |
| | | | | | | | | | | | | | | |
| | | | | | | | | | | | | $ | 179,152 | |
| | | | | | | | | | | | | | | |
See Accompanying Notes to Financial Statements
237
PORTFOLIO OF INVESTMENTS
ING Diversified International Fund
as of October 31, 2008
| | | | | | | | | | | | | | | |
| Shares | | | | | | | | Value |
| |
| |
| |
AFFILIATED INVESTMENT COMPANIES: 99.9% |
| | 684,101 | | | ING Emerging Countries Fund — Class I | | | | | | $ | 11,020,818 | |
| | 4,389,431 | | | ING Index Plus International Equity Fund — Class I | | | | | | | 28,180,124 | |
| | 7,121,168 | | | ING International Capital Appreciation Fund — Class I | | | | | | | 47,925,431 | |
| | 6,274,452 | | | ING International Equity Dividend Fund — Class I | | | | | | | 33,631,050 | |
| | 1,967,835 | | | ING International Growth Opportunities Fund — Class I | | | | | | | 11,570,843 | |
| | 2,200,546 | | | ING International Real Estate Fund — Class I | | | | | | | 15,227,777 | |
| | 879,171 | | | ING International SmallCap Fund — Class I | | | | | | | 20,089,014 | |
| | 4,374,932 | | | ING International Value Choice Fund — Class I | | | | | | | 33,118,224 | |
| | 5,626,470 | | | ING Foreign Fund — Class I | | | | | | | 67,067,383 | |
| | | | | | | | | | | | | |
| | | | | Total Investments in Securities | | | | |
| | | | | (Cost $445,557,718)* | | | 99.9 | % | | $ | 267,830,664 | |
| | | | | Other Assets and
Liabilities - Net | | | 0.1 | | | | 297,919 | |
| | | | | | | | | | | | | |
| | | | | Net Assets | | | 100.0 | % | | $ | 268,128,583 | |
| | | | | | | | | | | | | |
| | | |
| * | | Cost for federal income tax purposes is $458,575,022. |
| | | |
| | | Net unrealized depreciation consists of: |
| | | | | |
| Gross Unrealized Appreciation | | $ | — | |
| Gross Unrealized Depreciation | | | (190,744,358 | ) |
| | | | | |
| Net Unrealized Depreciation | | $ | (190,744,358 | ) |
| | | | | |
See Accompanying Notes to Financial Statements
238
SHAREHOLDER MEETING INFORMATION (Unaudited)
A special meeting of shareholders of ING Mutual Funds was held November 21, 2007, at the offices of ING Funds, 7337 East Doubletree Ranch Road, Scottsdale, AZ 85258.
A brief description of each matter voted upon as well as the results are outlined below:
Matters:
| | |
| | 1 | To approve the conversion of certain Funds’ investment objectives from fundamental to non-fundamental. |
| |
| | 2 | To approve a “Manager-of-Managers” arrangement for certain Funds to permit the Funds’ investment adviser, subject to prior approval by the Board, to enter into and materially amend agreements with unaffiliated sub-advisers without obtaining the approval of the Funds’ shareholders. |
| |
| | 3 | To approve the election of eleven nominees to the Boards of Directors/Trustees of the Funds. |
Results:
| | | | | | | | | | | | | | | | | | | | | | | | | |
| | | | | | | Shares
| | | | | | |
| | | | | | | Voted
| | | | | | |
| | | | | Shares
| | Against
| | | | | | Total
|
| | | | | Voted
| | or
| | Shares
| | Broker
| | Shares
|
| | | Proposal* | | For | | Withheld | | Abstained | | Non-Vote | | Voted |
| |
| ING Emerging Countries Fund | | | 1 | | | | 3,303,664.071 | | | | 256,758.695 | | | | 127,156.710 | | | | 1,700,808.000 | | | | 5,388,387.476 | |
| ING International SmallCap Fund | | | 1 | | | | 3,943,249.848 | | | | 4,250,437.496 | | | | 188,929.786 | | | | 2,897,071.000 | | | | 11,279,688.130 | |
| ING Russia Fund | | | 1 | | | | 4,123,725.745 | | | | 547,550.981 | | | | 150,848.838 | | | | 4,102,805.000 | | | | 8,924,930.564 | |
| ING International Growth Opportunities Fund | | | 1 | | | | 3,343,806.470 | | | | 211,331.428 | | | | 107,253.207 | | | | 2,127,408.000 | | | | 5,789,799.105 | |
| ING Global Equity Dividend Fund | | | 2 | | | | 8,801,534.302 | | | | 572,748.029 | | | | 317,208.513 | | | | 6,231,716.000 | | | | 15,923,206.844 | |
| ING Global Real Estate Fund | | | 2 | | | | 21,151,855.465 | | | | 2,519,234.577 | | | | 774,688.916 | | | | 16,023,095.000 | | | | 40,468,873.958 | |
| ING Russia Fund | | | 2 | | | | 4,164,475.651 | | | | 530,750.074 | | | | 126,899.839 | | | | 4,102,805.000 | | | | 8,924,930.564 | |
| ING International Growth Opportunities Fund | | | 2 | | | | 3,341,587.008 | | | | 207,680.830 | | | | 113,123.267 | | | | 2,127,408.000 | | | | 5,789,799.105 | |
| Colleen D. Baldwin | | | 3 | | | | 249,706,919.045 | | | | 3,027,810.174 | | | | 0.000 | | | | 0.000 | | | | 252,734,729.219 | |
| John V. Boyer | | | 3 | | | | 249,682,044.241 | | | | 3,052,684.978 | | | | 0.000 | | | | 0.000 | | | | 252,734,729.219 | |
| Patricia W. Chadwick | | | 3 | | | | 249,465,993.099 | | | | 3,268,736.120 | | | | 0.000 | | | | 0.000 | | | | 252,734,729.219 | |
| Robert W. Crispin | | | 3 | | | | 249,643,813.665 | | | | 3,090,915.554 | | | | 0.000 | | | | 0.000 | | | | 252,734,729.219 | |
| Peter S. Drotch | | | 3 | | | | 249,697,326.071 | | | | 3,037,403.148 | | | | 0.000 | | | | 0.000 | | | | 252,734,729.219 | |
| J. Michael Earley | | | 3 | | | | 249,522,554.729 | | | | 3,212,174.490 | | | | 0.000 | | | | 0.000 | | | | 252,734,729.219 | |
| Patrick W. Kenny | | | 3 | | | | 249,766,444.194 | | | | 2,968,285.025 | | | | 0.000 | | | | 0.000 | | | | 252,734,729.219 | |
| Shaun P. Mathews | | | 3 | | | | 249,749,451.981 | | | | 2,985,277.238 | | | | 0.000 | | | | 0.000 | | | | 252,734,729.219 | |
| Sheryl K. Pressler | | | 3 | | | | 249,640,102.557 | | | | 3,094,626.662 | | | | 0.000 | | | | 0.000 | | | | 252,734,729.219 | |
| David W.C. Putnam | | | 3 | | | | 249,463,578.379 | | | | 3,271,150.840 | | | | 0.000 | | | | 0.000 | | | | 252,734,729.219 | |
| Roger B. Vincent | | | 3 | | | | 249,707,425.710 | | | | 3,027,303.509 | | | | 0.000 | | | | 0.000 | | | | 252,734,729.219 | |
| |
| * | The Shareholder Meeting for Proposals 1 and 2 were adjourned to December 17, 2007. Proposal 3 passed at this meeting. |
239
SHAREHOLDER MEETING INFORMATION (Unaudited) (continued)
A special meeting of shareholders of ING Mayflower Trust was held November 21, 2007, at the offices of ING Funds, 7337 East Doubletree Ranch Road, Scottsdale, AZ 85258.
A brief description of each matter voted upon as well as the results are outlined below:
Matters:
| | |
| | 1 | To approve the conversion of ING International Value Fund’s investment objectives from fundamental to non-fundamental. |
| |
| | 2 | To approve a “Manager-of-Managers” arrangement for ING International Value Fund to permit the Fund’s investment adviser, subject to prior approval by the Board, to enter into and materially amend agreements with unaffiliated sub-advisers without obtaining the approval of the Fund’s shareholders. |
| |
| | 3 | To approve the election of eleven nominees to the Boards of Directors/Trustees of the Funds. |
Results:
| | | | | | | | | | | | | | | | | | | | | | | | | |
| | | | | | | Shares
| | | | | | |
| | | | | | | Voted
| | | | | | |
| | | | | Shares
| | Against
| | | | | | Total
|
| | | | | Voted
| | or
| | Shares
| | Broker
| | Shares
|
| | | Proposal* | | For | | Withheld | | Abstained | | Non-Vote | | Voted |
| |
| ING International Value Fund | | | 1 | | | | 53,134,727.860 | | | | 12,931,098.876 | | | | 1,846,960.854 | | | | 49,989,278.000 | | | | 117,902,065.590 | |
| ING International Value Fund | | | 2 | | | | 53,473,259.272 | | | | 12,897,305.863 | | | | 1,542,222.455 | | | | 49,989,278.000 | | | | 117,902,065.590 | |
| Colleen D. Baldwin | | | 3 | | | | 116,298,776.295 | | | | 1,603,289.295 | | | | 0.000 | | | | 0.000 | | | | 117,902,065.590 | |
| John V. Boyer | | | 3 | | | | 115,837,744.643 | | | | 2,064,320.947 | | | | 0.000 | | | | 0.000 | | | | 117,902,065.590 | |
| Patricia W. Chadwick | | | 3 | | | | 116,300,896.837 | | | | 1,601,168.753 | | | | 0.000 | | | | 0.000 | | | | 117,902,065.590 | |
| Robert W. Crispin | | | 3 | | | | 115,771,872.288 | | | | 2,130,193.302 | | | | 0.000 | | | | 0.000 | | | | 117,902,065.590 | |
| Peter S. Drotch | | | 3 | | | | 116,239,079.379 | | | | 1,662,986.211 | | | | 0.000 | | | | 0.000 | | | | 117,902,065.590 | |
| J. Michael Earley | | | 3 | | | | 115,921,536.128 | | | | 1,980,529.462 | | | | 0.000 | | | | 0.000 | | | | 117,902,065.590 | |
| Patrick W. Kenny | | | 3 | | | | 115,919,408.277 | | | | 1,982,657.313 | | | | 0.000 | | | | 0.000 | | | | 117,902,065.590 | |
| Shaun P. Mathews | | | 3 | | | | 115,849,151.042 | | | | 2,052,914.548 | | | | 0.000 | | | | 0.000 | | | | 117,902,065.590 | |
| Sheryl K. Pressler | | | 3 | | | | 115,770,736.133 | | | | 2,131,329.457 | | | | 0.000 | | | | 0.000 | | | | 117,902,065.590 | |
| David W.C. Putnam | | | 3 | | | | 116,273,111.205 | | | | 1,628,954.385 | | | | 0.000 | | | | 0.000 | | | | 117,902,065.590 | |
| Roger B. Vincent | | | 3 | | | | 116,316,328.731 | | | | 1,585,736.859 | | | | 0.000 | | | | 0.000 | | | | 117,902,065.590 | |
| |
| * | The Shareholder Meeting was adjourned to December 17, 2007. |
240
SHAREHOLDER MEETING INFORMATION (Unaudited) (continued)
A special meeting of shareholders of ING Mutual Funds was held December 17, 2007, at the offices of ING Funds, 7337 East Doubletree Ranch Road, Scottsdale, AZ 85258.
A brief description of each matter voted upon as well as the results are outlined below:
Matters:
| | |
| | 1 | To approve the conversion of certain Funds’ investment objectives from fundamental to non-fundamental. |
| |
| | 2 | To approve a “Manager-of-Managers” arrangement for certain Funds to permit the Funds’ investment adviser, subject to prior approval by the Board, to enter into and materially amend agreements with unaffiliated sub-advisers without obtaining the approval of the Funds’ shareholders. |
Results:
| | | | | | | | | | | | | | | | | | | | | | | | | |
| | | | | | | Shares
| | | | | | |
| | | | | | | Voted
| | | | | | |
| | | | | Shares
| | Against
| | | | | | Total
|
| | | | | Voted
| | or
| | Shares
| | Broker
| | Shares
|
| | | Proposal | | For | | Withheld | | Abstained | | Non-Vote | | Voted |
| |
| ING Emerging Countries Fund | | | 1 | * | | | 3,529,006.191 | | | | 280,815.324 | | | | 138,635.452 | | | | 1,569,897.000 | | | | 5,518,353.967 | |
| ING International SmallCap Fund | | | 1 | ** | | | 4,740,527.619 | | | | 4,358,399.651 | | | | 297,254.233 | | | | 2,431,217.000 | | | | 11,827,398.503 | |
| ING Russia Fund | | | 1 | ** | | | 4,579,183.510 | | | | 603,011.206 | | | | 219,936.660 | | | | 3,635,599.000 | | | | 9,037,730.376 | |
| ING International Growth Opportunities Fund | | | 1 | * | | | 4,039,312.321 | | | | 273,169.844 | | | | 170,240.604 | | | | 2,004,551.000 | | | | 6,487,273.769 | |
| ING Global Equity Dividend Fund | | | 2 | * | | | 9,832,039.528 | | | | 700,045.216 | | | | 391,917.152 | | | | 5,508,641.000 | | | | 16,432,642.896 | |
| ING Global Real Estate Fund | | | 2 | ** | | | 23,468,669.794 | | | | 2,758,822.536 | | | | 921,401.206 | | | | 14,331,317.000 | | | | 41,480,210.536 | |
| ING Russia Fund | | | 2 | ** | | | 4,620,033.621 | | | | 589,915.409 | | | | 192,182.346 | | | | 3,635,599.000 | | | | 9,037,730.376 | |
| ING International Growth Opportunities Fund | | | 2 | * | | | 4,053,822.933 | | | | 261,821.262 | | | | 167,078.574 | | | | 2,004,551.000 | | | | 6,487,273.769 | |
| |
| * | The Shareholder Meeting was adjourned to December 31, 2007. |
| |
| ** | The proposals did not pass. |
241
SHAREHOLDER MEETING INFORMATION (Unaudited) (continued)
A special meeting of shareholders of ING Mayflower Trust was held December 17, 2007, at the offices of ING Funds, 7337 East Doubletree Ranch Road, Scottsdale, AZ 85258.
A brief description of each matter voted upon as well as the results are outlined below:
Matters:
| | |
| | 1 | To approve the conversion of ING International Value Fund’s investment objectives from fundamental to non-fundamental. |
| |
| | 2 | To approve a “Manager-of-Managers” arrangement for ING International Value Fund to permit the Fund’s investment adviser, subject to prior approval by the Board, to enter into and materially amend agreements with unaffiliated sub-advisers without obtaining the approval of the Fund’s shareholders. |
| |
| | 3 | To approve the election of eleven nominees to the Boards of Directors/Trustees of the Funds. |
Results:
| | | | | | | | | | | | | | | | | | | | | | | | | |
| | | | | | | Shares
| | | | | | |
| | | | | | | Voted
| | | | | | |
| | | | | Shares
| | Against
| | | | | | Total
|
| | | | | Voted
| | or
| | Shares
| | Broker
| | Shares
|
| | | Proposal* | | For | | Withheld | | Abstained | | Non-Vote | | Voted |
| |
| ING International Value Fund | | | 1 | | | | 61,904,583.421 | | | | 13,826,523.452 | | | | 2,572,363.315 | | | | 46,288,030.000 | | | | 124,591,500.188 | |
| ING International Value Fund | | | 2 | | | | 62,501,627.034 | | | | 13,607,460.213 | | | | 2,194,382.941 | | | | 46,288,030.000 | | | | 124,591,500.188 | |
| Colleen D. Baldwin | | | 3 | | | | 121,874,494.995 | | | | 2,010,885.664 | | | | 0.000 | | | | 0.000 | | | | 123,885,380.659 | |
| John V. Boyer | | | 3 | | | | 121,411,982.213 | | | | 2,473,398.446 | | | | 0.000 | | | | 0.000 | | | | 123,885,380.659 | |
| Patricia W. Chadwick | | | 3 | | | | 121,877,660.003 | | | | 2,007,720.656 | | | | 0.000 | | | | 0.000 | | | | 123,885,380.659 | |
| Robert W. Crispin | | | 3 | | | | 121,345,455.757 | | | | 2,539,924.902 | | | | 0.000 | | | | 0.000 | | | | 123,885,380.659 | |
| Peter S. Drotch | | | 3 | | | | 121,811,215.729 | | | | 2,074,164.930 | | | | 0.000 | | | | 0.000 | | | | 123,885,380.659 | |
| J. Michael Earley | | | 3 | | | | 121,493,007.375 | | | | 2,392,373.284 | | | | 0.000 | | | | 0.000 | | | | 123,885,380.659 | |
| Patrick W. Kenny | | | 3 | | | | 121,493,565.515 | | | | 2,391,815.144 | | | | 0.000 | | | | 0.000 | | | | 123,885,380.659 | |
| Shaun P. Mathews | | | 3 | | | | 121,423,388.418 | | | | 2,461,992.241 | | | | 0.000 | | | | 0.000 | | | | 123,885,380.659 | |
| Sheryl K. Pressler | | | 3 | | | | 121,349,642.026 | | | | 2,535,738.633 | | | | 0.000 | | | | 0.000 | | | | 123,885,380.659 | |
| David W.C. Putnam | | | 3 | | | | 121,844,329.644 | | | | 2,041,051.015 | | | | 0.000 | | | | 0.000 | | | | 123,885,380.659 | |
| Roger B. Vincent | | | 3 | | | | 121,890,566.059 | | | | 1,994,814.600 | | | | 0.000 | | | | 0.000 | | | | 123,885,380.659 | |
| |
| * | Proposal 3 passed at this meeting. Proposals 1 and 2 did not pass. |
242
SHAREHOLDER MEETING INFORMATION (Unaudited) (continued)
A special meeting of shareholders of ING Mutual Funds was held December 31, 2007, at the offices of ING Funds, 7337 East Doubletree Ranch Road, Scottsdale, AZ 85258.
A brief description of each matter voted upon as well as the results are outlined below:
Matters:
| | |
| | 1 | To approve the conversion of certain Funds’ investment objectives from fundamental to non-fundamental. |
| |
| | 2 | To approve a “Manager-of-Managers” arrangement for certain Funds to permit the Funds’ investment adviser, subject to prior approval by the Board, to enter into and materially amend agreements with unaffiliated sub-advisers without obtaining the approval of the Funds’ shareholders. |
Results:
| | | | | | | | | | | | | | | | | | | | | | | | | |
| | | | | | | Shares
| | | | | | |
| | | | | | | Voted
| | | | | | |
| | | | | Shares
| | Against
| | | | | | Total
|
| | | | | Voted
| | or
| | Shares
| | Broker
| | Shares
|
| | | Proposal* | | For | | Withheld | | Abstained | | Non-Vote | | Voted |
| |
| ING Emerging Countries Fund | | | 1 | | | | 3,788,561.250 | | | | 336,812.506 | | | | 142,377.185 | | | | 1,441,855.000 | | | | 5,709,605.941 | |
| ING International Growth Opportunities Fund | | | 1 | | | | 4,598,913.597 | | | | 276,176.245 | | | | 179,179.802 | | | | 1,872,805.000 | | | | 6,927,074.644 | |
| ING Global Equity Dividend Fund | | | 2 | | | | 10,926,527.364 | | | | 719,218.216 | | | | 427,476.968 | | | | 4,798,437.000 | | | | 16,871,659.548 | |
| ING International Growth Opportunities Fund | | | 2 | | | | 4,612,833.497 | | | | 265,947.709 | | | | 175,488.438 | | | | 1,872,805.000 | | | | 6,927,074.644 | |
| |
| * | The Proposals did not pass |
A special meeting of shareholders of ING Mayflower Trust was held July 15, 2008, at the offices of ING Funds, 7337 East Doubletree Ranch Road, Scottsdale, AZ 85258.
A brief description of each matter voted upon as well as the results are outlined below:
| |
| 1 | To approve the appointment of ING Investment Management Co. (“ING IM”) as an additional sub-adviser to the Fund and the implementation of an additional sub-advisory agreement for the Fund between ING Investments, LLC, the Fund’s investment adviser, and ING IM. |
| | | | | | | | | | | | | | | | | | | | | | | | | |
| | | | | | | Shares
| | | | | | |
| | | | | | | Voted
| | | | | | |
| | | | | Shares
| | Against
| | | | | | Total
|
| | | | | Voted
| | or
| | Shares
| | Broker
| | Shares
|
| | | Proposal | | For | | Withheld | | Abstained | | Non-Vote | | Voted |
| |
| ING International Value Fund | | | 1 | * | | | 65,816,825.483 | | | | 8,384,545.398 | | | | 5,114,530.878 | | | | | | | | 79,315,901.759 | |
| |
| * | The Shareholder Meeting for ING International Value Fund was adjourned to August 15, 2008. |
A special meeting of shareholders of ING Mayflower Trust was held August 15, 2008, at the offices of ING Funds, 7337 East Doubletree Ranch Road, Scottsdale, AZ 85258.
A brief description of each matter voted upon as well as the results are outlined below:
| |
| 1 | To approve the appointment of ING Investment Management Co. (“ING IM”) as an additional sub-adviser to the Fund and the implementation of an additional sub-advisory agreement for the Fund between ING Investments, LLC, the Fund’s investment adviser, and ING IM. |
| | | | | | | | | | | | | | | | | | | | | | | | | |
| | | | | | | Shares
| | | | | | |
| | | | | | | Voted
| | | | | | |
| | | | | Shares
| | Against
| | | | | | Total
|
| | | | | Voted
| | or
| | Shares
| | Broker
| | Shares
|
| | | Proposal* | | For | | Withheld | | Abstained | | Non-Vote | | Voted |
| |
| ING International Value Fund | | | 1 | | | | 84,129,954.732 | | | | 9,099,806.359 | | | | 6,040,595.816 | | | | | | | | 99,270,356.907 | |
| |
| * | The Shareholder Meeting for ING International Value Fund was adjourned to October 17, 2008. |
243
SHAREHOLDER MEETING INFORMATION (Unaudited) (continued)
A special meeting of shareholders of ING Mutual Funds was held August 21, 2008, at the offices of ING Funds, 7337 East Doubletree Ranch Road, Scottsdale, AZ 85258.
A brief description of each matter voted upon as well as the results are outlined below:
| |
| 1 | To approve a new sub-advisory agreement for ING Emerging Countries Fund (the “Fund”) between ING Investments, LLC, the Fund’s investment adviser, and ING Investment Management Advisors B.V. (“IIMA”), under which IIMA would become the sub-adviser to the Fund. |
| | | | | | | | | | | | | | | | | | | | | | | | | |
| | | | | | | Shares
| | | | | | |
| | | | | | | Voted
| | | | | | |
| | | | | Shares
| | Against
| | | | | | Total
|
| | | | | Voted
| | or
| | Shares
| | Broker
| | Shares
|
| | | Proposal | | For | | Withheld | | Abstained | | Non-Vote | | Voted |
| |
| ING Emerging Countries Fund | | | 1 | * | | | 3,699,461.237 | | | | 135,945.150 | | | | 194,436.337 | | | | | | | | 4,029,842.724 | |
A special meeting of shareholders of ING Mayflower Trust was held October 17, 2008, at the offices of ING Funds, 7337 East Doubletree Ranch Road, Scottsdale, AZ 85258.
A brief description of each matter voted upon as well as the results are outlined below:
| |
| 1 | To approve the appointment of ING Investment Management Co. (“ING IM”) as an additional sub-adviser to the Fund and the implementation of an additional sub-advisory agreement for the Fund between ING Investments, LLC, the Fund’s investment adviser, and ING IM. |
| | | | | | | | | | | | | | | | | | | | | | | | | |
| | | | | | | Shares
| | | | | | |
| | | | | | | Voted
| | | | | | |
| | | | | Shares
| | Against
| | | | | | Total
|
| | | | | Voted
| | or
| | Shares
| | Broker
| | Shares
|
| | | Proposal | | For | | Withheld | | Abstained | | Non-vote | | Voted |
| |
| ING International Value Fund | | | 1 | * | | | 97,319,749.661 | | | | 16,519,574.440 | | | | 7,459,025.792 | | | | | | | | 121,298,349.893 | |
244
Dividends paid during the year ended October 31, 2008 were as follows:
| | | | | | | | | |
| | | | | Per Share
|
Fund Name | | Type | | Amount |
| |
| ING Global Equity Dividend Fund | | | | | | | | |
| Class A | | | NII | | | $ | 0.5408 | |
| Class B | | | NII | | | $ | 0.4371 | |
| Class C | | | NII | | | $ | 0.4385 | |
| Class I | | | NII | | | $ | 0.5946 | |
| Class O | | | NII | | | $ | 0.5492 | |
| Class W | | | NII | | | $ | 0.4610 | |
| All Classes, except Class W | | | ROC | | | $ | 0.0474 | |
| Class W | | | ROC | | | $ | 0.0371 | |
| All Classes* | | | STCG | | | $ | 0.2984 | |
| All Classes* | | | LTCG | | | $ | 0.9018 | |
| ING Global Natural Resources Fund | | | | | | | | |
| Class A | | | NII | | | $ | 0.1053 | |
| Class I | | | NII | | | $ | 0.1486 | |
| All Classes* | | | STCG | | | $ | 1.7562 | |
| All Classes* | | | LTCG | | | $ | 0.7018 | |
| ING Global Real Estate Fund | | | | | | | | |
| Class A | | | NII | | | $ | 0.7329 | |
| Class B | | | NII | | | $ | 0.6114 | |
| Class C | | | NII | | | $ | 0.6058 | |
| Class I | | | NII | | | $ | 0.8120 | |
| Class O | | | NII | | | $ | 0.7352 | |
| Class W | | | NII | | | $ | 0.3333 | |
| All Classes* | | | STCG | | | $ | 0.0147 | |
| All Classes* | | | LTCG | | | $ | 0.0564 | |
| ING Global Value Choice Fund | | | | | | | | |
| Class A | | | NII | | | $ | 0.1575 | |
| Class B | | | NII | | | $ | — | |
| Class C | | | NII | | | $ | 0.0192 | |
| Class I | | | NII | | | $ | 0.2806 | |
| Class Q | | | NII | | | $ | 0.2031 | |
| ING Asia-Pacific Real Estate Fund | | | | | | | | |
| Class A | | | NII | | | $ | 0.0995 | |
| Class B | | | NII | | | $ | 0.0623 | |
| Class C | | | NII | | | $ | 0.0631 | |
| Class I | | | NII | | | $ | 0.1172 | |
| ING Disciplined International SmallCap Fund | | | | | | | | |
| Class A | | | NII | | | $ | 0.0579 | |
| Class B | | | NII | | | $ | 0.0053 | |
| Class C | | | NII | | | $ | 0.0052 | |
| Class I | | | NII | | | $ | 0.0714 | |
| All Classes | | | STCG | | | $ | 0.1921 | |
| ING Emerging Countries Fund | | | | | | | | |
| Class A | | | NII | | | $ | 0.4549 | |
| Class B | | | NII | | | $ | 0.1444 | |
| Class C | | | NII | | | $ | 0.2125 | |
| Class I | | | NII | | | $ | 0.5739 | |
| Class Q | | | NII | | | $ | 0.4889 | |
| Class W | | | NII | | | $ | — | |
| All Classes* | | | LTCG | | | $ | 1.1113 | |
| ING European Real Estate Fund | | | | | | | | |
| Class A | | | NII | | | $ | 0.1215 | |
| Class B | | | NII | | | $ | 0.0707 | |
| Class C | | | NII | | | $ | 0.0674 | |
| Class I | | | NII | | | $ | 0.1441 | |
| ING Foreign Fund | | | | | | | | |
| All Classes* | | | STCG | | | $ | 0.1302 | |
| All Classes* | | | LTCG | | | $ | 1.2459 | |
| ING Greater China Fund | | | | | | | | |
| Class A | | | NII | | | $ | 0.0643 | |
| Class B | | | NII | | | $ | — | |
| Class C | | | NII | | | $ | — | |
| Class I | | | NII | | | $ | 0.1007 | |
| Class O** | | | NII | | | $ | — | |
| All Classes** | | | STCG | | | $ | 1.6975 | |
| All Classes** | | | LTCG | | | $ | 0.3671 | |
| ING Index Plus International Equity Fund | | | | | | | | |
| Class A | | | NII | | | $ | 0.1768 | |
| Class B | | | NII | | | $ | 0.1568 | |
| Class C | | | NII | | | $ | 0.1575 | |
| Class I | | | NII | | | $ | 0.2430 | |
| Class O | | | NII | | | $ | 0.2430 | |
| All Classes | | | STCG | | | $ | 1.0653 | |
| All Classes | | | LTCG | | | $ | 0.3012 | |
| ING International Capital Appreciation Fund | | | | | | | | |
| Class A | | | NII | | | $ | 0.1369 | |
| Class B | | | NII | | | $ | 0.1057 | |
| Class C | | | NII | | | $ | 0.1106 | |
| Class I | | | NII | | | $ | 0.1732 | |
| All Classes | | | STCG | | | $ | 0.3826 | |
| All Classes | | | LTCG | | | $ | 0.1191 | |
| ING International Equity Dividend Fund | | | | | | | | |
| Class A | | | NII | | | $ | 0.3401 | |
| Class B | | | NII | | | $ | 0.2737 | |
| Class C | | | NII | | | $ | 0.2740 | |
| Class I | | | NII | | | $ | 0.3705 | |
| Class W | | | NII | | | $ | 0.2903 | |
| All Classes, except Class W | | | ROC | | | $ | 0.0305 | |
| Class W | | | ROC | | | $ | 0.0234 | |
| All Classes* | | | STCG | | | $ | 0.0387 | |
| ING International Growth Opportunities Fund | | | | | | | | |
| Class A | | | NII | | | $ | 0.0213 | |
| Class B | | | NII | | | $ | — | |
| Class C | | | NII | | | $ | — | |
| Class I | | | NII | | | $ | 0.0526 | |
| Class Q | | | NII | | | $ | 0.0356 | |
| All Classes | | | STCG | | | $ | 1.1255 | |
| All Classes | | | LTCG | | | $ | 1.1738 | |
| ING International Real Estate Fund | | | | | | | | |
| Class A | | | NII | | | $ | 0.3552 | |
| Class B | | | NII | | | $ | 0.2662 | |
| Class C | | | NII | | | $ | 0.2671 | |
| Class I | | | NII | | | $ | 0.3918 | |
| Class W | | | NII | | | $ | 0.1046 | |
| All Classes, except Class W | | | ROC | | | $ | 0.1918 | |
| Class W | | | ROC | | | $ | 0.0470 | |
| ING International SmallCap Multi-Manager Fund | | | | | | | | |
| Class A | | | NII | | | $ | 0.3231 | |
| Class B | | | NII | | | $ | — | |
| Class C | | | NII | | | $ | — | |
| Class I | | | NII | | | $ | 0.5207 | |
| Class Q | | | NII | | | $ | 0.3692 | |
| All Classes*,** | | | STCG | | | $ | 4.1139 | |
| All Classes*,** | | | LTCG | | | $ | 3.7698 | |
| ING International Value Fund | | | | | | | | |
| Class A | | | NII | | | $ | 0.2265 | |
| Class B | | | NII | | | $ | 0.0204 | |
| Class C | | | NII | | | $ | 0.0753 | |
| Class I | | | NII | | | $ | 0.3129 | |
| Class Q | | | NII | | | $ | 0.3123 | |
| All Classes | | | STCG | | | $ | 0.5038 | |
| All Classes | | | LTCG | | | $ | 2.8486 | |
| ING International Value Choice Fund | | | | | | | | |
| Class A | | | NII | | | $ | 0.1008 | |
| Class B | | | NII | | | $ | 0.0012 | |
| Class C | | | NII | | | $ | — | |
| Class I | | | NII | | | $ | 0.1639 | |
| All Classes | | | STCG | | | $ | 0.6865 | |
| All Classes | | | LTCG | | | $ | 1.2975 | |
| ING Russia Fund | | | | | | | | |
| Class A | | | LTCG | | | $ | 11.5873 | |
| ING Emerging Markets Fixed Income Fund | | | | | | | | |
| Class A | | | NII | | | $ | 0.4510 | |
| Class B | | | NII | | | $ | 0.3782 | |
| Class C | | | NII | | | $ | 0.3793 | |
| Class I | | | NII | | | $ | 0.4813 | |
| All Classes | | | ROC | | | $ | 0.1765 | |
245
TAX INFORMATION (Unaudited) (continued)
| | | | | | | | | |
| | | | | Per Share
|
Fund Name | | Type | | Amount |
| |
| ING Global Bond Fund | | | | | | | | |
| Class A | | | NII | | | $ | 0.6235 | |
| Class B | | | NII | | | $ | 0.5290 | |
| Class C | | | NII | | | $ | 0.5356 | |
| Class I | | | NII | | | $ | 0.6708 | |
| Class O*** | | | NII | | | $ | 0.1090 | |
| All Classes** | | | STCG | | | $ | 0.1218 | |
| ING Diversified International Fund | | | | | | | | |
| Class A | | | NII | | | $ | 0.2555 | |
| Class B | | | NII | | | $ | 0.1680 | |
| Class C | | | NII | | | $ | 0.1777 | |
| Class I | | | NII | | | $ | 0.2829 | |
| Class R | | | NII | | | $ | 0.2170 | |
| Class W | | | NII | | | $ | — | |
| All Classes*,** | | | STCG | | | $ | 0.0414 | |
| All Classes*,** | | | LTCG | | | $ | 0.0456 | |
NII — Net investment income
ROC — Return of capital
STCG — Short-term capital gain
LTCG — Long-term capital gain
| |
| * | Except Class W, which launched after the Fund’s capital gain distributions were declared. |
| |
| ** | Except Class O, which launched after the Fund’s capital gain distributions were declared. |
| *** | Commenced operations June 4, 2008. |
Of the ordinary distributions made during the year ended October 31, 2008, the following percentages qualify for the dividends received deduction (DRD) available to corporate shareholders:
| | | |
| Global Equity Dividend | | 33.50% |
| Global Natural Resources | | 7.89% |
| Global Value Choice | | 81.79% |
| Disciplined International SmallCap | | 0.03% |
| Foreign | | 0.83% |
| International Growth Opportunities | | 0.82% |
| International SmallCap Multi-Manager | | 0.01% |
| International Value Choice | | 0.28% |
For the year ended October 31, 2008, the following are percentages of ordinary income dividends paid by the Funds that are designated as qualifying dividend income (QDI) subject to reduced income tax rates for individuals:
| | | |
| Global Equity Dividend | | 86.33% |
| Global Natural Resources | | 9.34% |
| Global Value Choice | | 87.60% |
| Asia-Pacific Real Estate | | 88.76% |
| Disciplined International SmallCap | | 37.73% |
| Emerging Countries | | 100.00% |
| European Real Estate | | 66.31% |
| Foreign | | 100.00% |
| Greater China | | 3.77% |
| Index Plus International Equity | | 25.44% |
| International Capital Appreciation | | 26.77% |
| International Equity Dividend | | 88.64% |
| International Growth Opportunities | | 22.36% |
| International Real Estate | | 20.23% |
| International SmallCap Multi-Manager | | 22.63% |
| International Value | | 72.22% |
| International Value Choice | | 38.93% |
| Diversified International | | 41.61% |
Pursuant to Internal Revenue Code Section 871(k)(1), the Funds designate the following percentages of net investment income distributions as interest-related dividends:
| | | |
| Global Equity Dividend | | 0.34% |
| Global Natural Resources | | 0.71% |
| Global Value Choice | | 5.47% |
| Asia-Pacific Real Estate | | 1.63% |
| Disciplined International SmallCap | | 6.10% |
| Emerging Countries | | 4.00% |
| European Real Estate | | 1.07% |
| Greater China | | 0.03% |
| Index Plus International Equity | | 0.44% |
| International Capital Appreciation | | 1.75% |
| International Equity Dividend | | 1.65% |
| International Growth Opportunities | | 1.96% |
| International Real Estate | | 1.89% |
| International SmallCap Multi-Manager | | 4.36% |
| International Value | | 4.38% |
| International Value Choice | | 10.15% |
| Emerging Markets Fixed Income | | 100.00% |
| Global Bond | | 37.24% |
246
TAX INFORMATION (Unaudited) (continued)
The following funds designate 100% of their short-term capital gain distributions as short-term capital gain dividends as defined in Internal Revenue Code Section 871(k)(2):
| | | |
| Global Equity Dividend | | |
| Global Natural Resources | | |
| Disciplined International SmallCap | | |
| Foreign | | |
| Greater China | | |
| Index Plus International Equity | | |
| International Capital Appreciation | | |
| International Equity Dividend | | |
| International Growth Opportunities | | |
| International SmallCap Multi-Manager | | |
| International Value | | |
| International Value Choice | | |
| Global Bond | | |
| Diversified International | | |
The following funds designate distributions paid upon redemptions under Section 562(b)(1)(A) as long-term:
| | | |
| Global Natural Resources | | $2,046,138 |
| Greater China | | $704,722 |
| International Value | | $122,133,081 |
| Russia | | $54,251,300 |
Pursuant to Section 853 of the Internal Revenue Code, the Funds designate the following amounts as foreign taxes paid for the year ended October 31, 2008. Foreign taxes paid for purposes of Section 853 may be less than actual foreign taxes paid for financial statement purposes.
| | | | | | | | | | | | | |
| | | | | | | Portion of
|
| | | | | | | Ordinary Income
|
| | | | | | | Distribution
|
| | | Creditable
| | | | Derived from
|
| | | Foreign
| | Per Share
| | Foreign Sourced
|
| | | Taxes Paid | | Amount | | Income* |
| |
| Global Equity Dividend | | $ | 812,300 | | | $ | 0.0476 | | | | 70.23% | |
| Asia-Pacific Real Estate | | $ | 2,672 | | | $ | 0.0017 | | | | 99.05% | |
| Disciplined International SmallCap | | $ | 833,666 | | | $ | 0.0209 | | | | 94.25% | |
| Emerging Countries | | $ | 702,197 | | | $ | 0.1086 | | | | 98.14% | |
| European Real Estate | | $ | 17,281 | | | $ | 0.0287 | | | | 99.31% | |
| Foreign | | $ | 1,561,614 | | | $ | 0.0529 | | | | 96.55% | |
| Greater China | | $ | 104,009 | | | $ | 0.0378 | | | | 99.91% | |
| Index Plus International Equity | | $ | 658,240 | | | $ | 0.0385 | | | | 98.10% | |
| International Capital Appreciation | | $ | 248,364 | | | $ | 0.0333 | | | | 91.37% | |
| International Equity Dividend | | $ | 247,755 | | | $ | 0.0368 | | | | 98.24% | |
| International Growth Opportunities | | $ | 228,405 | | | $ | 0.0210 | | | | 90.43% | |
| International Real Estate | | $ | 921,568 | | | $ | 0.0152 | | | | 99.50% | |
| International SmallCap Multi-Manager | | $ | 2,218,077 | | | $ | 0.1285 | | | | 98.06% | |
| International Value | | $ | 13,355,892 | | | $ | 0.0705 | | | | 98.30% | |
| International Value Choice | | $ | 130,712 | | | $ | 0.0197 | | | | 98.39% | |
| |
| * | None of the funds listed above derived any income from ineligible foreign sources as defined under Section 901(j) of the Internal Revenue Code. |
Foreign taxes paid or withheld should be included in taxable income with an offsetting deduction from gross income or as a credit for taxes paid to foreign governments. Shareholders are strongly advised to consult their own tax advisors regarding the appropriate treatment of foreign taxes paid.
Above figures may differ from those cited elsewhere in this report due to differences in the calculation of income and gains under U.S. generally accepted accounting principles (book) purposes and Internal Revenue Service (tax) purposes.
Shareholders are strongly advised to consult their own tax advisers with respect to the tax consequences of their investments in the Funds. In January, shareholders, excluding corporate shareholders, receive an IRS 1099-DIV regarding the federal tax status of the dividends and distributions they received in the calendar year.
247
The business and affairs of the Registrants are managed under the direction of the Board. A Trustee who is not an interested person of the Registrants, as defined in the 1940 Act, is an independent trustee (“Independent Trustee”). The Trustees and Officers of the Trusts are listed below. The Statement of Additional Information includes additional information about trustees of the Registrants and is available, without charge, upon request at (800) 992-0180.
| | | | | | | | | | | |
| | | | | | | | | Number of
| | |
| | | | | | | | | Funds in
| | |
| | | Position(s)
| | | | | | Complex(2)
| | Other Directorships/
|
| | | held with
| | Term of Office
| | | | Overseen
| | Trusteeships
|
| | | Fund/
| | and Length of
| | Principal Occupation(s)
| | by Director/
| | held by Director/
|
Name, Address and Age | | Portfolio | | Time Served(1) | | during the Past 5 Years | | Trustee | | Trustee |
| |
Colleen D. Baldwin
7337 E. Doubletree Ranch Rd.
Scottsdale, Arizona 85258
Age: 48 | | Director/
Trustee | | IMF November 2007 — Present IMT December 2007 — Present | | President, National Charity League/Canaan Parish Board (June 2008 — Present) and Consultant (January 2005 — Present) Formerly, Chief Operating Officer, Ivy Asset Management Group (April 2002 — October 2004). | | 170 | | None |
| | | | | | | | | | | |
John V. Boyer(3)
7337 E. Doubletree Ranch Rd.
Scottsdale, Arizona 85258
Age: 55 | | Director/
Trustee | | January 2005 — Present | | President, Bechtler Arts Foundation (March 2008 — Present). Formerly, Consultant (July 2007 — February 2008); President and Chief Executive Officer, Franklin and Eleanor Roosevelt Institute (March 2006 — July 2007); and Executive Director, The Mark Twain House & Museum (September 1989 — November 2005). | | 170 | | None |
| | | | | | | | | | | |
Patricia W. Chadwick
7337 E. Doubletree Ranch Rd.
Scottsdale, Arizona 85258
Age: 60 | | Director/
Trustee | | January 2006 — Present | | Consultant and President of self-owned company, Ravengate Partners LLC (January 2000 — Present). | | 170 | | Wisconsin Energy Corporation (June 2006 — Present). |
| | | | | | | | | | | |
Peter S. Drotch
7337 E. Doubletree Ranch Rd.
Scottsdale, Arizona 85258
Age: 66 | | Director/
Trustee | | IMF November 2007 — Present IMT December 2007 — Present | | Retired partner, PricewaterhouseCoopers, LLP. | | 170 | | First Marblehead Corporation (October 2003 — Present). |
| | | | | | | | | | | |
J. Michael Earley
7337 E. Doubletree Ranch Rd.
Scottsdale, Arizona 85258
Age: 63 | | Director/
Trustee | | February 2002 — Present | | President, Chief Executive Officer and Director, Bankers Trust Company, N.A., Des Moines (June 1992 — Present). | | 170 | | Midamerica Financial Corporation (December 2002 — Present). |
| | | | | | | | | | | |
Patrick W. Kenny
7337 E. Doubletree Ranch Rd.
Scottsdale, Arizona 85258
Age: 65 | | Director/
Trustee | | January 2005 — Present | | President and Chief Executive Officer, International Insurance Society (June 2001 — Present). | | 170 | | Assured Guaranty Ltd. (April 2004 — Present) and Odyssey Re Holdings Corporation (November 2006 — Present). |
| | | | | | | | | | | |
Sheryl K. Pressler
7337 E. Doubletree Ranch Rd.
Scottsdale, Arizona 85258
Age: 57 | | Director/
Trustee | | January 2006 — Present | | Consultant (May 2001 — Present). | | 170 | | Global Alternative Asset Management, Inc. (October 2007 — Present) and Stillwater Mining Company (May 2002 — Present). |
| | | | | | | | | | | |
Roger B. Vincent
7337 E. Doubletree Ranch Rd.
Scottsdale, Arizona 85258
Age: 63 | | Chairman and
Director/
Trustee | | February 2002 — Present | | President, Springwell Corporation (March 1989 — Present). | | 170 | | UGI Corporation (February 2006 — Present) and UGI Utilities, Inc. (February 2006 — Present). |
| | | | | | | | | | | |
Directors/Trustees who are
“Interested Persons” | | | | | | | | | | |
Robert W. Crispin(4)
7337 E. Doubletree Ranch Rd.
Scottsdale, Arizona 85258
Age: 61 | | Director/
Trustee | | IMF November 2007 — Present IMT December 2007 — Present | | Retired. Chairman and Chief Investment Officer, ING Investment Management Co. (June 2001 — December 2007). | | 170 | | ING Canada Inc. (December 2004 — Present) and ING Bank, fsb (June 2001 — Present). |
248
TRUSTEE AND OFFICER INFORMATION (Unaudited) (continued)
| | | | | | | | | | | |
| | | | | | | | | Number of
| | |
| | | | | | | | | Funds in
| | |
| | | Position(s)
| | | | | | Complex(2)
| | Other Directorships/
|
| | | held with
| | Term of Office
| | | | Overseen
| | Trusteeships
|
| | | Fund/
| | and Length of
| | Principal Occupation(s)
| | by Director/
| | held by Director/
|
Name, Address and Age | | Portfolio | | Time Served(1) | | during the Past 5 Years | | Trustee | | Trustee |
| |
| | | | | | | | | | | |
Shaun P. Mathews(4)
7337 E. Doubletree Ranch Rd.
Scottsdale, Arizona 85258
Age: 53 | | Director/
Trustee | | IMF November 2007 — Present IMT December 2007 — Present | | President and Chief Executive Officer, ING Investments, LLC(5) (November 2006 — Present). Formerly, President, ING Mutual Funds and Investment Products (November 2004 — November 2006); Chief Marketing Officer, ING USFS (April 2002 — October 2004); and Head of Rollover/Payout (October 2001 — December 2003). | | 208 | | ING Services Holding Company, Inc. (May 2000 — Present); Southland Life Insurance Company (June 2002 — Present); and ING Capital Corporation, LLC, ING Funds Distributor, LLC(6), ING Funds Services, LLC(7), ING Investments, LLC(5) and ING Pilgrim Funding, Inc. (December 2006 — Present). |
| | |
| (1) | | Trustees serve until their successors are duly elected and qualified. The tenure of each Trustee is subject to the Board’s retirement policy, which states that each Independent Trustee shall retire from service as a Trustee at the conclusion of the first regularly scheduled meeting of the Board that is held after (a) the Trustee reaches the age of 70, if that Trustee qualifies for a retirement benefit as discussed in the board’s retirement policy; or (b) the Trustee reaches the age of 72 or has served as a Trustee for 15 years, whichever comes first, if that Trustee does not qualify for the retirement benefit. A unanimous vote of the Board may extend the retirement date of a Trustee for up to one year. An extension may be permitted if the retirement would trigger a requirement to hold a meeting of shareholders of the Fund under applicable law, whether for purposes of appointing a successor to the Trustee or if otherwise necessary under applicable law, in which case the extension would apply until such time as the shareholder meeting can be held or is no longer needed. |
| |
| (2) | | For the purposes of this table (except for Mr. Mathews),“Fund Complex” means the following investment companies: ING Asia Pacific High Dividend Equity Income Fund, ING Equity Trust; ING Funds Trust; ING Global Equity Dividend and Premium Opportunity Fund; ING Global Advantage and Premium Opportunity Fund; ING International High Dividend Equity Income Fund; ING Investors Trust; ING Mayflower Trust; ING Mutual Funds; ING Prime Rate Trust; ING Risk Managed Natural Resources Fund; ING Senior Income Fund; ING Separate Portfolios Trust; ING Variable Insurance Trust; ING Variable Products Trust; and ING Partners, Inc. For Mr. Mathews, the Fund Complex also includes the following investment companies: ING GET Fund; ING Series Fund, Inc.; ING Strategic Allocation Portfolios, Inc.; ING Variable Funds; ING Variable Portfolios, Inc.; ING VP Balanced Portfolio, Inc.; ING VP Intermediate Bond Portfolio; and ING VP Money Market Portfolio. |
| |
| (3) | | Shaun Mathews, President, ING USFS Mutual Funds and Investment Products, has held a seat on the Board of Directors of The Mark Twain House & Museum since September 19, 2002. ING Groep N.V. makes non-material, charitable contributions to The Mark Twain House & Museum. |
| |
| (4) | | Messrs. Mathews and Crispin are deemed to be “interested persons” of the Trust as defined in the 1940 Act because of their relationship with ING Groep, the parent corporation of the Adviser, ING Investments, LLC and the Distributor, ING Funds Distributor, LLC. |
| |
| (5) | | ING Investments, LLC was previously named ING Pilgrim Investments, LLC. ING Pilgrim Investments, LLC is the successor in interest to ING Pilgrim Investments, Inc., which was previously known as Pilgrim Investments, Inc. and before that was known as Pilgrim America Investments, Inc. |
| |
| (6) | | ING Funds Distributor, LLC is the successor in interest to ING Funds Distributor, Inc., which was previously known as ING Pilgrim Securities, Inc., and before that was known as Pilgrim Securities, Inc., and before that was known as Pilgrim America Securities, Inc. |
| |
| (7) | | ING Funds Services, LLC was previously named ING Pilgrim Group, LLC. ING Pilgrim Group, LLC is the successor in interest to ING Pilgrim Group, Inc., which was previously known as Pilgrim Group, Inc. and before that was known as Pilgrim America Group, Inc. |
249
TRUSTEE AND OFFICER INFORMATION (Unaudited) (continued)
| | | | | | | |
| | | | | Term of Office
| | |
| | | Position(s) Held
| | and Length of
| | Principal Occupation(s)
|
Name, Address and Age | | with Fund | | Time Served(1) | | during the Past 5 Years |
| |
| | | | | | | |
Shaun P. Mathews
7337 East Doubletree Ranch Rd.
Scottsdale, Arizona 85258
Age: 53 | | President and Chief Executive Officer | | November 2006 — Present | | President and Chief Executive Officer, ING Investments, LLC(2) (November 2006 — Present). Formerly, President, ING Mutual Funds and Investment Products (November 2004 — November 2006); Chief Marketing Officer, ING USFS (April 2002 — October 2004); and Head of Rollover/Payout (October 2001 — December 2003) |
| | | | | | | |
Michael J. Roland
7337 East Doubletree Ranch Rd.
Scottsdale, Arizona 85258
Age: 50 | | Executive Vice President | | February 2002 — Present | | Head of Mutual Fund Platform (February 2007 — Present) and Executive Vice President, ING Investments, LLC(2) and ING Funds Services, LLC(3) (December 2001 — Present). Formerly, Executive Vice President, Head of Product Management (January 2005 — January 2007); Chief Compliance Officer, ING Investments, LLC(2) and Directed Services LLC(5) (October 2004 — December 2005); and Chief Financial Officer and Treasurer, ING Investments, LLC(2) (December 2001 — March 2005) |
| | | | | | | |
Stanley D. Vyner
230 Park Avenue
New York, New York 10169
Age: 58 | | Executive Vice President | | ING Mutual Funds
May 1999 — Present
ING Mayflower Trust
November 1999 — Present | | Executive Vice President, ING Investments, LLC(2) (July 2000 — Present) and Chief Investment Risk Officer, ING Investments, LLC(2) (January 2003 — Present) |
| | | | | | | |
Joseph M. O’Donnell
7337 East Doubletree Ranch Rd.
Scottsdale, Arizona 85258
Age: 53 | | Executive Vice President and Chief Compliance Officer | | Executive Vice President March 2006 — Present
Chief Compliance Officer November 2004 — Present | | Chief Compliance Officer of the ING Funds (November 2004 — Present) and Executive Vice President of the ING Funds (March 2006 — Present). Formerly, Chief Compliance Officer of ING Investments, LLC(2) (March 2006 — July 2008); Investment Advisor Chief Compliance Officer, Directed Services LLC(5) (March 2006 — July 2008) ING Life Insurance and Annuity Company (March 2006 — December 2006); and Vice President, Chief Legal Counsel, Chief Compliance Officer and Secretary of Atlas Securities, Inc., Atlas Advisers, Inc. and Atlas Funds (October 2001 — October 2004) |
| | | | | | | |
Todd Modic
7337 East Doubletree Ranch Rd.
Scottsdale, Arizona 85258
Age: 40 | | Senior Vice President, Chief/Principal
Financial Officer
and Assistant Secretary | | March 2005 — Present | | Senior Vice President, ING Funds Services, LLC(3) (March 2005 — Present). Formerly, Vice President, ING Funds Services, LLC(3) (September 2002 — March 2005) |
| | | | | | | |
Kimberly A. Anderson
7337 East Doubletree Ranch Rd.
Scottsdale, Arizona 85258
Age: 44 | | Senior Vice President | | November 2003 — Present | | Senior Vice President, ING Investments, LLC(2) (October 2003 — Present). Formerly, Vice President and Assistant Secretary, ING Investments, LLC(2) (January 2001 — October 2003) |
| | | | | | | |
Robert Terris
7337 East Doubletree Ranch Rd.
Scottsdale, Arizona 85258
Age: 38 | | Senior Vice President | | May 2006 — Present | | Senior Vice President, Head of Division Operations, ING Funds Services, LLC(3) (May 2006 — Present). Formerly, Vice President of Administration, ING Funds Services, LLC(3) (October 2001 — March 2006) |
250
TRUSTEE AND OFFICER INFORMATION (Unaudited) (continued)
| | | | | | | |
| | | | | Term of Office
| | |
| | | Position(s) Held
| | and Length of
| | Principal Occupation(s)
|
Name, Address and Age | | with Fund | | Time Served(1) | | during the Past 5 Years |
| |
| | | | | | | |
Ernest J. C’DeBaca
7337 East Doubletree Ranch Rd.
Scottsdale, Arizona 85258
Age: 39 | | Senior Vice President | | May 2006 — Present | | Chief Compliance Officer, ING Investments, LLC(2) (July 2008 — Present); Investment Advisor Chief Compliance Officer, Directed Services LLC(5) (July 2008 — Present); Head of Retail Compliance, ING Funds Distributor, LLC(4) and ING Funds Services, LLC(3), (July 2008 — Present); and Senior Vice President, ING Investments, LLC(2) (December 2006 — Present), ING Funds Services, LLC(3) (April 2006 — Present), ING Funds Distributor, LLC(4) (July 2008 — Present), and Directed Services LLC(5) (July 2008 — Present). Formerly, Counsel, ING Americas, U.S. Legal Services (January 2004 — March 2006) and Attorney-Adviser, U.S. Securities and Exchange Commission (May 2001 — December 2003) |
| | | | | | | |
Robyn L. Ichilov
7337 East Doubletree Ranch Rd.
Scottsdale, Arizona 85258
Age: 41 | | Vice President and Treasurer | | May 1999 — Present
IMT
November 1999 — Present | | Vice President and Treasurer, ING Funds Services, LLC(3) (November 1995 — Present) and ING Investments, LLC(2) (August 1997 — Present) |
| | | | | | | |
Lauren D. Bensinger
7337 East Doubletree Ranch Rd.
Scottsdale, Arizona 85258
Age: 54 | | Vice President | | February 2003 — Present | | Vice President and Chief Compliance Officer, ING Funds Distributor, LLC(4) (August 1995 — Present); Vice President, ING Investments, LLC(2) and ING Funds Services, LLC(3) (February 1996 — Present); and Director of Compliance, ING Investments, LLC(2) (October 2004 — Present). Formerly, Chief Compliance Officer, ING Investments, LLC(2) (October 2001 — October 2004) |
| | | | | | | |
William Evans
10 State House Square
Hartford, Ct 06103
Age: 36 | | Vice President | | September 2007 — Present | | Vice President, Head of Mutual Fund Advisory Group (April 2007 — Present). Formerly, Vice President, U.S. Mutual Funds and Investment Products (May 2005 — April 2007) and Senior Fund Analyst, U.S. Mutual Funds and Investment Products (May 2002 — May 2005) |
| | | | | | | |
Maria M. Anderson
7337 East Doubletree Ranch Rd.
Scottsdale, Arizona 85258
Age: 50 | | Vice President | | September 2004 — Present | | Vice President, ING Funds Services, LLC(3) (September 2004 — Present). Formerly, Assistant Vice President, ING Funds Services, LLC(3) (October 2001 — September 2004) |
| | | | | | | |
Denise Lewis
7337 East Doubletree Ranch Rd.
Scottsdale, Arizona 85258
Age: 45 | | Vice President | | January 2007 — Present | | Vice President, ING Funds Services, LLC(3) (December 2006 — Present). Formerly, Senior Vice President, UMB Investment Services Group, LLC (November 2003 — December 2006) |
| | | | | | | |
Kimberly K. Springer
7337 East Doubletree Ranch Rd.
Scottsdale, Arizona 85258
Age: 51 | | Vice President | | March 2006 — Present | | Vice President, ING Funds Services, LLC(3) (March 2006 — Present). Formerly, Assistant Vice President, ING Funds Services, LLC(3) (August 2004 — March 2006) and Manager, Registration Statements, ING Funds Services, LLC(3) (May 2003 — August 2004) |
251
TRUSTEE AND OFFICER INFORMATION (Unaudited) (continued)
| | | | | | | |
| | | | | Term of Office
| | |
| | | Position(s) Held
| | and Length of
| | Principal Occupation(s)
|
Name, Address and Age | | with Fund | | Time Served(1) | | during the Past 5 Years |
| |
| | | | | | | |
Susan P. Kinens
7337 East Doubletree Ranch Rd.
Scottsdale, Arizona 85258
Age: 31 | | Assistant Vice President | | February 2003 — Present | | Assistant Vice President, ING Funds Services, LLC(3) (December 2002 — Present) |
| | | | | | | |
Craig Wheeler
7337 East Doubletree Ranch Rd.
Scottsdale, Arizona 85258
Age: 39 | | Assistant Vice President | | May 2008 — Present | | Assistant Vice President — Director of Tax, ING Funds Services (March 2008 — Present). Formerly, Tax Manager, ING Funds Services (March 2005 — March 2008); Tax Senior , ING Funds Services (January 2004 — March 2005); and Tax Senior, KPMG LLP (August 2002 — December 2003) |
| | | | | | | |
Huey P. Falgout, Jr.
7337 East Doubletree Ranch Rd.
Scottsdale, Arizona 85258
Age: 44 | | Secretary | | August 2003 — Present | | Chief Counsel, ING Americas, U.S. Legal Services (September 2003 — Present). Formerly, Counsel, ING Americas, U.S. Legal Services (November 2002 — September 2003) |
| | | | | | | |
Theresa K. Kelety
7337 East Doubletree Ranch Rd.
Scottsdale, Arizona 85258
Age: 45 | | Assistant Secretary | | August 2003 — Present | | Senior Counsel, ING Americas, U.S. Legal Services (April 2008 — Present). Formerly, Counsel, ING Americas, U.S. Legal Services (April 2003 — April 2008) |
| | | | | | | |
Kathleen Nichols
7337 East Doubletree Ranch Rd.
Scottsdale, Arizona 85258
Age: 33 | | Assistant Secretary | | May 2008 — Present | | Counsel, ING Americas, U.S. Legal Services (February 2008 — Present). Formerly, Associate, Ropes & Gray LLP (September 2005 — February 2008) |
| | |
| (1) | | The officers hold office until the next annual meeting of the Trustees and until their successors shall have been elected and qualified. |
| |
| (2) | | ING Investments, LLC was previously named ING Pilgrim Investments, LLC. ING Pilgrim Investments, LLC is the sucessor in interest to ING Pilgrim Investments, Inc., which was previously known as Pilgrim Investments, Inc. and before that was known as Pilgrim America Investments, Inc. |
| |
| (3) | | ING Funds Services, LLC was previously named ING Pilgrim Group, LLC. ING Pilgrim Group, LLC is the sucessor in interest to ING Pilgrim Group, Inc., which was previously known as Pilgrim Group, Inc. and before that was known as Pilgrim America Group, Inc. |
| |
| (4) | | ING Funds Distributor, LLC is the sucessor in interest to ING Funds Distributor, Inc., which was previously known as ING Pilgrim Securities, Inc., and before that was known as Pilgrim Securities, Inc., and before that was known as Pilgrim America Securities, Inc. |
| |
| (5) | | Directed Services, LLC is the sucessor in interest to Directed Services, Inc. |
252
BOARD CONSIDERATION AND APPROVAL OF NEW SUB-ADVISORY CONTRACT
Section 15 of the Investment Company Act of 1940 Act, as amended (the “1940 Act”) mandates that, when a series of ING Mutual Funds and ING Mayflower Trust (together, the “Trusts”) enters into a new sub-advisory agreement (“Sub-Advisory Contract”), the Board of Trustees (the “Board”) of the Trusts, including a majority of Board members who have no direct or indirect interest in the Advisory and Sub-Advisory contracts, and who are not “interested persons” of the series, as such term is defined under the 1940 Act (the “Independent Trustees”), must approve the new arrangements. Discussed below are certain factors that the Board considered in determining whether to approve a new Sub-Advisory Contract for one of its series.
ING Emerging Countries Fund
ING Emerging Countries Fund has been sub-advised by Brandes Investment Partners, L.P. since March 1, 2005. At its March 27, 2008 meeting, the Board approved a new Sub-Advisory Contract with ING Investment Management Advisors B.V. (“IIM BV”) under which IIM BV would serve as Sub-Adviser to the Fund. The new Sub-Advisory Contract became effective on August 21, 2008.
In determining whether to approve the Sub-Advisory Contract with IIM BV, the Board received and evaluated such information as it deemed necessary for an informed determination of whether the Contract should be approved for the Fund. The materials provided to the Board to inform its consideration of whether to approve the Sub-Advisory Contract with IIM BV included the following: (1) IIM BV’s presentation before the International/Balanced/Fixed Income Funds Investment Review Committee at its March 26, 2008 meeting; (2) memoranda and related materials provided to the Board in advance of its March 27, 2008 meeting discussing: (a) Management’s rationale for recommending that IIM BV serve as Sub-Adviser to the Fund, (b) the performance of IIM BV in managing the IIMA Emerging Markets Strategy Composite (the “IIM BV Composite”), which is composed of accounts that are managed in an investment style that mirrors its proposed management of the Fund (with such performance being compared against relevant benchmark indices and Morningstar Category averages), and (c) the expertise of IIM BV in managing a global emerging markets strategy; (3) Fund Analysis and Comparison Tables for the Fund that provide information about the performance of the IIM BV Composite and the performance of the Fund’s proposed Selected Peer Group; (4) IIM BV’s responses to inquiries from K&L Gates LLP, counsel to the Independent Trustees; (5) supporting documentation, including a copy of the form of Sub-Advisory Contract with IIM BV; (6) an analysis regarding the effect that the proposed Sub-Adviser addition would have on the Adviser’s profitability; and (7) other information relevant to the Board’s evaluation.
In reaching its decision to engage IIM BV, as Sub-Adviser to the Fund, the Board, including a majority of the Independent Trustees, considered a number of factors, including, but not limited to, the following: (1) the Adviser’s view with respect to the reputation of IIM BV as a manager to similar funds; (2) IIM BV’s strength and reputation in the industry; (3) the nature and quality of the services to be provided by IIM BV under the proposed Sub-Advisory Contract; (4) the personnel, operations, financial condition, and investment management capabilities, methodologies and resources of IIM BV and its fit among the stable of managers in the ING Funds line-up; (5) the fairness of the compensation under the Sub-Advisory Contract in light of the services to be provided by IIM BV and the projected profitability of IIM BV as the Fund’s Sub-Adviser; (6) the costs for the services to be provided by IIM BV, including that the management fee would not change after the appointment of IIM BV; (7) the sub-advisory fee payable by the Adviser to IIM BV and the resulting decrease in the profitability of the Adviser arising out of the addition of a second sub-adviser and the higher sub-advisory fee payable by the Adviser to IIM BV; (8) IIM BV’s operations and compliance program, including its policies and procedures intended to assure compliance with the Federal securities laws; (9) the appropriateness of the selection of IIM BV in light of the Fund’s investment objective and investor base; and (10) IIM BV’s Code of Ethics, which had been previously approved by the Board, and related procedures for complying with that Code.
After its deliberation, the Board reached the following conclusions; (1) IIM BV should be appointed to serve as an additional Sub-Adviser to the Fund under the new Sub-Advisory Agreement with IIM BV; (2) the sub-advisory fee rate payable by the Adviser to IIM BV is reasonable in the context of all factors considered by the Board; and (3) IIM BV maintains an appropriate
253
ADVISORY CONTRACT APPROVAL DISCUSSION (Unaudited) (continued)
compliance program, with this conclusion based upon, among other things, a representation from the Fund’s CCO that IIM BV’s compliance policies and procedures are reasonably designed to assure compliance with the Federal securities laws. Based on these conclusions and other factors, the Board voted to approve the Sub-Advisory Contract for the Fund. During their deliberations, different Board members may have given different weight to different individual factors and related conclusions.
ING International Value Fund
ING International Value Fund has been sub-advised by Acadian Asset Management, LLC (f/k/a Acadian Asset Management, Inc.) since March 1995. At its March 27, 2008 meeting, the Board approved a new Sub-Advisory Contract with ING Investment Management Co. (“ING IM”) under which ING IM would serve as Sub-Adviser to an additional investment sleeve of the Fund. The new Sub-Advisory Contract became effective on October 27, 2008.
In determining whether to approve the Sub-Advisory Contract with ING IM, the Board received and evaluated such information as it deemed necessary for an informed determination of whether the Contract should be approved for the Fund. The materials provided to the Board to inform its consideration of whether to approve the Sub-Advisory Contract with ING IM included the following: (1) ING IM’s presentation before the International/Balanced/Fixed Income Funds Investment Review Committee at its March 26, 2008 meeting; (2) memoranda and related materials provided to the Board in advance of its March 27, 2008 meeting discussing: (a) Management’s rationale for recommending that ING IM serve as an additional Sub-Adviser to the Fund, (b) the performance of ING IM in managing the ING VP International Value Portfolio, a series of ING Variable Products Trust (the “VP International Value Portfolio”), which is managed in an investment style that mirrors its proposed management of the Fund (with such performance being compared against relevant benchmark indices and Morningstar Category averages), and (c) the expertise of ING IM in managing an international value strategy; (3) Fund Analysis and Comparison Tables for the Fund that provide information about the performance of the VP International Value Portfolio and the performance of the Fund’s proposed Selected Peer Group; (4) ING IM’s responses to inquiries from K&L Gates LLP, counsel to the Independent Trustees; (5) supporting documentation, including a copy of the form of Sub-Advisory Contract with ING IM; (6) an analysis regarding the effect that the proposed Sub-Adviser addition would have on the Adviser’s profitability; and (7) other information relevant to the Board’s evaluation.
In reaching its decision to engage ING IM as a Sub-Adviser to the Fund, the Board, including a majority of the Independent Trustees, considered a number of factors, including, but not limited to, the following: (1) the Adviser’s view with respect to the reputation of ING IM as a manager to similar funds; (2) ING IM’s strength and reputation in the industry; (3) the nature and quality of the services to be provided by ING IM under the proposed Sub-Advisory Contract; (4) the personnel, operations, financial condition, and investment management capabilities, methodologies and resources of ING IM and its fit among the stable of managers in the ING Funds line-up; (5) the fairness of the compensation under the Sub-Advisory Contract in light of the services to be provided by ING IM and the projected profitability of ING IM as one of the Fund’s Sub-Advisers; (6) the costs for the services to be provided by ING IM, including that the management fee would not change after the appointment of ING IM; (7) the sub-advisory fee payable by the Adviser to ING IM; (8) ING IM’s operations and compliance program, including its policies and procedures intended to assure compliance with the Federal securities laws; (9) the appropriateness of the selection of ING IM in light of the Fund’s investment objective and investor base; and (10) ING IM’s Code of Ethics, which had been previously approved by the Board, and related procedures for complying with that Code.
After its deliberation, the Board reached the following conclusions: (1) ING IM should be appointed to serve as an additional Sub-Adviser to the Fund under the new Sub-Advisory Agreement with ING IM; (2) the sub-advisory fee rate payable by the Adviser to ING IM is reasonable in the context of all factors considered by the Board; and (3) ING IM maintains an appropriate compliance program, with this conclusion based upon, among other things, a representation from the Fund’s CCO that ING IM’s compliance policies and procedures are reasonably designed to assure compliance with the Federal securities laws. Based on these conclusions and other factors, the Board voted to approve the Sub-Advisory Contract for the Fund. During their deliberations, different Board members may have given different weight to different individual factors and related conclusions.
254
ING Funds Distributor, LLC offers the funds listed below. Before investing in a fund, shareholders should carefully review the fund’s prospectus. Investors may obtain a copy of a prospectus of any ING Fund by calling (800) 992-0180 or by going to www.ingfunds.com.
Domestic Equity and Income Funds
ING Balanced Fund
ING Growth and Income Fund
ING Real Estate Fund
Domestic Equity Fund-of-Funds
ING Strategic Allocation Conservative Fund
ING Strategic Allocation Growth Fund
ING Strategic Allocation Moderate Fund
Domestic Equity Growth Funds
ING 130/30 Fundamental Research Fund
ING Corporate Leaders 100 Fund
ING Equity Dividend Fund
ING Fundamental Research Fund
ING LargeCap Growth Fund
ING MidCap Opportunities Fund
ING Opportunistic LargeCap Fund
ING Small Company Fund
ING SmallCap Opportunities Fund
ING Tactical Asset Allocation Fund
Domestic Equity Index Funds
ING Index Plus LargeCap Fund
ING Index Plus MidCap Fund
ING Index Plus SmallCap Fund
Domestic Equity Value Funds
ING Financial Services Fund
ING SmallCap Value Multi-Manager Fund
ING Value Choice Fund
Fixed-Income Funds
ING GNMA Income Fund
ING High Yield Bond Fund
ING Intermediate Bond Fund
Global Equity Funds
ING Global Equity Dividend Fund
ING Global Natural Resources Fund
ING Global Real Estate Fund
ING Global Science and Technology Fund
ING Global Value Choice Fund
International Equity Funds
ING Asia-Pacific Real Estate Fund
ING Disciplined International SmallCap Fund
ING Emerging Countries Fund
ING European Real Estate Fund
ING Foreign Fund
ING Greater China Fund
ING Index Plus International Equity Fund
ING International Capital Appreciation Fund
ING International Equity Dividend Fund
ING International Growth Opportunities Fund
ING International Real Estate Fund
ING International SmallCap Multi-Manager Fund
ING International Value Fund
ING International Value Choice Fund
ING Russia Fund
Global and International Fixed-Income Funds
ING Emerging Markets Fixed Income Fund
ING Global Bond Fund
International Fund-of-Funds
ING Diversified International Fund
Loan Participation Fund
ING Senior Income Fund
Money Market Funds*
ING Money Market Fund
ING Classic Money Market Fund
| |
| * | An investment in the funds are not insured or guaranteed by the Federal Deposit Insurance Corporation or any other government agency. Although the funds seek to preserve the value of your investment at $1.00 per share, it is possible to lose money by investing in the funds. |
Investment Adviser
ING Investments, LLC
7337 East Doubletree Ranch Road
Scottsdale, Arizona 85258
Administrator
ING Funds Services, LLC
7337 East Doubletree Ranch Road
Scottsdale, Arizona 85258
Distributor
ING Funds Distributor, LLC
7337 East Doubletree Ranch Road
Scottsdale, Arizona 85258
Transfer Agent
DST Systems, Inc.
P.O. Box 419368
Kansas City, Missouri 64141
Independent Registered Public
Accounting Firm
KPMG LLP
99 High Street
Boston, MA 02110
Custodian
The Bank of New York Mellon
One Wall Street
New York, New York 10286
Legal Counsel
Dechert LLP
1775 I Street, N.W.
Washington, D.C. 20006
For more complete information, or to obtain a prospectus on any ING fund, please call your Investment Professional or ING Funds Distributor, LLC at (800) 992-0180 or log on to www.ingfunds.com. The prospectus should be read carefully before investing. Consider the fund’s investment objectives, risks, charges and expenses carefully before investing. The prospectus contains this information and other information about the fund.
PRAR-UINTALL (1008-123008)
Item 2. Code of Ethics.
As of the end of the period covered by this report, Registrant had adopted a code of ethics, as defined in Item 2 of Form N-CSR, that applies to the Registrant’s principal executive officer and principal financial officer. There were no amendments to the Code during the period covered by the report. The Registrant did not grant any waivers, including implicit waivers, from any provisions of the Code during the period covered by this report. The code of ethics is filed herewith pursuant to Item 10 (a)(l), Exhibit 99.CODE ETH.
Item 3. Audit Committee Financial Expert.
The Board of Trustees has determined that J. Michael Earley is an audit committee financial expert, as defined in Item 3 of Form N-CSR. Mr. Earley is “independent” for purposes of Item 3 of Form N-CSR.
Item 4. Principal Accountant Fees and Services.
| (a) | | Audit Fees: The aggregate fees billed for each of the last two fiscal years for professional services rendered by KPMG LLP (“KPMG”), the principal accountant for the audit of the registrant’s annual financial statements, for services that are normally provided by the accountant in connection with statutory and regulatory filings or engagements for those fiscal years were $158,162 for year ended October 31, 2008 and $153,511 for year ended October 31, 2007. |
| |
| (b) | | Audit-Related Fees: The aggregate fees billed in each of the last two fiscal years for assurance and related services by KPMG that are reasonably related to the performance of the audit of the registrant’s financial statements and are not reported under paragraph (a) of this Item were $2,150 for the year ended October 31, 2008 and $235,893 for the year ended October 31, 2007. |
| |
| (c) | | Tax Fees: The aggregate fees billed in each of the last two fiscal years for professional services rendered by KPMG for tax compliance, tax advice, and tax planning were $16,067 in the year ended October 31, 2008 and $5,200 in the year ended October 31, 2007. Such services induced review of excise distribution calculations (if applicable), preparation of the Funds’ federal, state and excise tax returns, tax services related to mergers and routine consulting. |
| |
| | | None |
| |
| (d) | | All Other Fees: The aggregate fees billed in each of the last two fiscal years for products and services provided by KPMG, other than the services reported in paragraphs (a) through (c) of this Item were $7,500 for the year ended October 31, 2008 and $0 for the year ended October 31, 2007. |
| |
| (e) | | (1) Audit Committee Pre-Approval Policies and Procedures |
AUDIT AND NON-AUDIT SERVICES
PRE-APPROVAL POLICY
I. Statement of Principles
Under the Sarbanes-Oxley Act of 2002 (the “Act”), the Audit Committee of the Board of Directors or Trustees (the “Committee”) of the ING Funds (each a “Fund,” collectively, the “Funds”) set out on Exhibit A to this Audit and Non-Audit Services Pre-Approval Policy (“Policy”) is responsible for the oversight of the work of the Funds’ independent auditors. As part of its responsibilities, the Committee must pre-approve the audit and non-audit services performed by the auditors in order to assure that the provision of these services does not impair the auditors’ independence from the Funds. The Committee has adopted, and the Board has ratified, this Policy, which sets out the procedures and conditions under which the services of the independent auditors may be pre-approved.
Under Securities and Exchange Commission (“SEC”) rules promulgated in accordance with the Act, the Funds may establish two different approaches to pre-approving audit and non-audit services. The Committee may approve services without consideration of specific case-by-case services (“general pre-approval”) or it may pre-approve specific services (“specific pre-approval”). The Committee believes that the combination of these approaches contemplated in this Policy results in an effective and efficient method for pre-approving audit and non-audit services to be performed by the Funds’ independent auditors. Under this Policy, services that are not of a type that may receive general pre-approval require specific pre-approval by the Committee. Any proposed services that exceed pre-approved cost levels or budgeted amounts will also require the Committee’s specific pre-approval.
For both types of approval, the Committee considers whether the subject services are consistent with the SEC’s rules on auditor independence and that such services are compatible with maintaining the auditors independence. The Committee also considers whether a particular audit firm is in the best position to provide effective and efficient services to the Funds. Reasons that the auditors are in the best position include the auditors’ familiarity with the Funds’ business, personnel, culture, accounting systems, risk profile, and other factors, and whether the services will enhance the Funds’ ability to manage and control risk or improve audit quality. Such factors will be considered as a whole, with no one factor being determinative.
The appendices attached to this Policy describe the audit, audit-related, tax-related, and other services that have the Committee’s general pre-approval. For any service that has been approved through general pre-approval, the general pre-approval will remain in place for a period 12 months from the date of pre-approval, unless the Committee determines that a different period is appropriate. The Committee will annually review and pre-approve the services that may be provided by the independent auditors without specific pre-approval. The Committee will revise the list of services subject to general pre-approval as appropriate. This Policy does not serve as a delegation to Fund management of the Committee’s duty to pre-approve services performed by the Funds’ independent auditors.
II. Audit Services
The annual audit services engagement terms and fees are subject to the Committee’s specific pre-approval. Audit services are those services that are normally provided by auditors in connection with statutory and regulatory filings or engagements or those that generally only independent auditors can reasonably provide. They include the Funds’ annual financial statement audit and procedures that the independent auditors must perform in order to form an opinion on the Funds’ financial statements (e.g., information systems and procedural reviews and testing). The Committee will monitor the audit services engagement and approve any changes in terms, conditions or fees deemed by the Committee to be necessary or appropriate.
The Committee may grant general pre-approval to other audit services, such as statutory audits and services associated with SEC registration statements, periodic reports and other documents filed with the SEC or issued in connection with securities offerings.
The Committee has pre-approved the audit services listed on Appendix A. The Committee must specifically approve all audit services not listed on Appendix A.
III. Audit-related Services
Audit-related services are assurance and related services that are reasonably related to the performance of the audit or the review of the Funds’ financial statements or are traditionally performed by the independent auditors. The Committee believes that the provision of audit-related services will not impair the independent auditors’ independence, and therefore may grant pre-approval to audit-related services. Audit-related services include accounting consultations related to accounting, financial reporting or disclosure matters not classified as “audit services;” assistance with understanding and implementing new accounting and financial reporting guidance from rulemaking authorities; agreed-upon or expanded audit procedures relating to accounting and/or billing records required to respond to or comply with financial, accounting or regulatory reporting matters; and assistance with internal control reporting requirements under Form N-SAR or Form N-CSR.
The Committee has pre-approved the audit-related services listed on Appendix B. The Committee must specifically approve all audit-related services not listed on Appendix B.
IV. Tax Services
The Committee believes the independent auditors can provide tax services to the Funds, including tax compliance, tax planning, and tax advice, without compromising the auditors’ independence. Therefore, the Committee may grant general pre-approval with respect to tax services historically provided by the Funds’ independent auditors that do not, in the Committee’s view, impair auditor independence and that are consistent with the SEC’s rules on auditor independence.
The Committee will not grant pre-approval if the independent auditors initially recommends a transaction the sole business purpose of which is tax avoidance and the tax treatment of which may not be supported in the Internal Revenue Code and related regulations. The Committee may consult
2
outside counsel to determine that tax planning and reporting positions are consistent with this Policy.
The Committee has pre-approved the tax-related services listed on Appendix C. The Committee must specifically approve all tax-related services not listed on Appendix C.
V. Other Services
The Committee believes it may grant approval of non-audit services that are permissible services for independent auditors to a Fund. The Committee has determined to grant general pre-approval to other services that it believes are routine and recurring, do not impair auditor independence, and are consistent with SEC rules on auditor independence.
The Committee has pre-approved the non-audit services listed on Appendix D. The Committee must specifically approve all non-audit services not listed on Appendix D.
A list of the SEC’s prohibited non-audit services is attached to this Policy as Appendix E. The SEC’s rules and relevant guidance should be consulted to determine the precise definitions of these impermissible services and the applicability of exceptions to certain of the SEC’s prohibitions.
VI. Pre-approval of Fee levels and Budgeted Amounts
The Committee will annually establish pre-approval fee levels or budgeted amounts for audit, audit-related, tax and non-audit services to be provided to the Funds by the independent auditors. Any proposed services exceeding these levels or amounts require the Committee’s specific pre-approval. The Committee considers fees for audit and non-audit services when deciding whether to pre-approve services. The Committee may determine, for a pre-approval period of 12 months, the appropriate ratio between the total amount of fees for the Fund’s audit, audit-related, and tax services (including fees for services provided to Fund affiliates that are subject to pre-approval), and the total amount of fees for certain permissible non-audit services for the Fund classified as other services (including any such services provided to Fund affiliates that are subject to pre-approval).
VII. Procedures
Requests or applications for services to be provided by the independent auditors will be submitted to management. If management determines that the services do not fall within those services generally pre-approved by the Committee and set out in the appendices to these procedures, management will submit the services to the Committee or its delagee. Any such submission will include a detailed description of the services to be rendered. Notwithstanding this paragraph, the Committee will, on a quarterly basis, receive from the independent auditors a list of services provided for the previous calendar quarter on a cumulative basis by the auditors during the Pre-Approval Period.
3
VIII. Delegation
The Committee may delegate pre-approval authority to one or more of the Committee’s members. Any member or members to whom such pre-approval authority is delegated must report any pre-approval decisions, including any pre-approved services, to the Committee at its next scheduled meeting. The Committee will identify any member to whom pre-approval authority is delegated in writing. The member will retain such authority for a period of 12 months from the date of pre-approval unless the Committee determines that a different period is appropriate. The period of delegated authority may be terminated by the Committee or at the option of the member.
IX. Additional Requirements
The Committee will take any measures the Committee deems necessary or appropriate to oversee the work of the independent auditors and to assure the auditors’ independence from the Funds. This may include reviewing a formal written statement from the independent auditors delineating all relationships between the auditors and the Funds, consistent with Independence Standards Board No. 1, and discussing with the auditors their methods and procedures for ensuring independence.
Last Approved: November 29, 2007
4
Appendix A
Pre-Approved Audit Services for the Pre-Approval Period January 1, 2008 through December 31, 2008
Service
| | | | | |
| | | The Fund(s) | | Fee Range |
| Statutory audits or financial audits (including tax services associated with audit services) | | ü | | As presented to Audit Committee1 |
| | | | | |
Services associated with SEC registration statements, periodic reports and other documents filed with the SEC or other documents issued in connection with securities offerings (e.g., consents), and assistance in responding to SEC comment letters. | | ü | | Not to exceed $9,750 per filing |
| | | | | |
| Consultations by Fund management with respect to accounting or disclosure treatment of transactions or events and/or the actual or potential effect of final or proposed rules, standards or interpretations by the SEC, Financial Accounting Standards Board, or other regulatory or standard setting bodies. | | ü | | Not to exceed $8,000 during the Pre-Approval Period |
| | | | | |
| Seed capital audit and related review and issuance of consent on the N-2 registration statement | | ü | | Not to exceed $12,600 per audit |
| | |
| 1 | | For new Funds launched during the Pre-Approval Period, the fee ranges pre-approved will be the same as those for existing Funds, pro-rated in accordance with inception dates as provided in the auditors’ Proposal or any Engagement Letter covering the period at issue. Fees in the Engagement Letter will be controlling. |
5
Appendix B
Pre-Approved Audit-Related Services for the Pre-Approval Period January 1, 2008 through December 31, 2008
Service
| | | | | | | |
| | | The Fund(s) | | Fund Affiliates | | Fee Range |
| Services related to Fund mergers (Excludes tax services - - See Appendix C for tax services associated with Fund mergers) | | ü | | ü | | Not to exceed $10,000 per merger |
| | | | | | | |
Consultations by Fund management with respect to accounting or disclosure treatment of transactions or events and/or the actual or potential effect of final or proposed rules, standards or interpretations by the SEC, Financial Accounting Standards Board, or other regulatory or standard setting bodies. [Note: Under SEC rules some consultations may be “audit” services and others may be “audit-related” services.] | | ü | | | | Not to exceed $5,000 per occurrence during the Pre-Approval Period |
| | | | | | | |
| Review of the Funds’ semi-annual financial statements | | ü | | | | Not to exceed $2,200 per set of financial statements per fund |
| | | | | | | |
| Reports to regulatory or government agencies related to the annual engagement | | ü | | | | Up to $5,000 per occurrence during the Pre-Approval Period |
| | | | | | | |
| Regulatory compliance assistance | | ü | | ü | | Not to exceed $5,000 per quarter |
| | | | | | | |
| Training courses | | | | ü | | Not to exceed $2,000 per course |
| | | | | | | |
| For Prime Rate Trust, agreed upon procedures for quarterly reports to rating agencies | | ü | | | | Not to exceed $9,450 per quarter |
| | | | | | | |
| For Prime Rate Trust and Senior Income Fund, agreed upon procedures for the Revolving Credit and Security Agreement with Citigroup | | ü | | | | Not to exceed $21,000 per fund per year |
6
Appendix C
Pre-Approved Tax Services for the Pre-Approval Period January 1, 2008 through December 31, 2008
Service
| | | | | | | |
| | | | | Fund | | |
| | | The Fund(s) | | Affiliates | | Fee Range |
| Preparation of federal and state income tax returns and federal excise tax returns for the Funds including assistance and review with excise tax distributions | | ü | | | | As presented to Audit Committee2 |
| | | | | | | |
| Review of IRC Sections 851(b) and 817(h) diversification testing on a real-time basis | | ü | | | | As presented to Audit Committee2 |
| | | | | | | |
| Assistance and advice regarding year-end reporting for 1099’s | | ü | | | | As presented to Audit Committee2 |
| | | | | | | |
| Tax assistance and advice regarding statutory, regulatory or administrative developments | | ü | | ü | | Not to exceed $5,000 for the Funds or for the Funds’ investment adviser during the Pre-Approval Period |
| | |
| 2 | | For new Funds launched during the Pre-Approval Period, the fee ranges pre-approved will be the same as those for existing Funds, pro-rated in accordance with inception dates as provided in the auditors’ Proposal or any Engagement Letter covering the period at issue. Fees in the Engagement Letter will be controlling. |
7
Appendix C, continued
Service
| | | | | | | |
| | | | | Fund | | |
| | | The Fund(s) | | Affiliates | | Fee Range |
| Tax training courses | | | | ü | | Not to exceed $2,000 per course during the Pre-Approval Period |
| | | | | | | |
| Tax services associated with Fund mergers | | ü | | ü | | Not to exceed $4,000 per fund per merger during the Pre-Approval Period |
| | | | | | | |
| Other tax-related assistance and consultation, including, without limitation, assistance in evaluating derivative financial instruments and international tax issues, qualification and distribution issues, and similar routine tax consultations. | | ü | | | | Not to exceed $120,000 during the Pre-Approval Period |
8
Appendix D
Pre-Approved Other Services for the Pre-Approval Period January 1, 2008 through December 31, 2008
Service
| | | | | | | |
| | | The Fund(s) | | Fund Affiliates | | Fee Range |
| Agreed-upon procedures for Class B share 12b-1 programs | | | | ü | | Not to exceed $50,000 during the Pre-Approval Period |
| | | | | | | |
Security counts performed pursuant to Rule 17f-2 of the 1940 Act (i.e., counts for Funds holding securities with affiliated sub-custodians)
Cost to be borne 50% by the Funds and 50% by ING Investments, LLC. | | ü | | ü | | Not to exceed $5,000 per Fund during the Pre-Approval Period |
| | | | | | | |
| Agreed upon procedures for 15 (c) FACT Books | | ü | | | | Not to exceed $35,000 during the Pre-Approval Period |
9
Appendix E
Prohibited Non-Audit Services
Dated: January 1, 2008
| | • | | Bookkeeping or other services related to the accounting records or financial statements of the Funds |
| |
| | • | | Financial information systems design and implementation |
| |
| | • | | Appraisal or valuation services, fairness opinions, or contribution-in-kind reports |
| |
| | • | | Actuarial services |
| |
| | • | | Internal audit outsourcing services |
| |
| | • | | Management functions |
| |
| | • | | Human resources |
| |
| | • | | Broker-dealer, investment adviser, or investment banking services |
| |
| | • | | Legal services |
| |
| | • | | Expert services unrelated to the audit |
| |
| | • | | Any other service that the Public Company Accounting Oversight Board determines, by regulation, is impermissible |
10
EXHIBIT A
ING EQUITY TRUST
ING FUNDS TRUST
ING ASIA PACIFIC HIGH DIVIDEND EQUITY INCOME FUND
ING GLOBAL ADVANTAGE AND PREMIUM OPPORTUNITY FUND
ING GLOBAL EQUITY DIVIDEND AND PREMIUM OPPORTUNITY FUND
ING INTERNATIONAL HIGH DIVIDEND EQUITY INCOME FUND
ING RISK MANAGED NATURAL RESOURCES FUND
ING INVESTMENT FUNDS, INC.
ING INVESTORS TRUST
ING MAYFLOWER TRUST
ING MUTUAL FUNDS
ING PARTNERS, INC.
ING PRIME RATE TRUST
ING SENIOR INCOME FUND
ING SEPARATE PORTFOLIOS TRUST
ING VARIABLE INSURANCE TRUST
ING VARIABLE PRODUCTS TRUST
| | | |
| (e)(2) | | Percentage of services referred to in 4(b) — (4)(d) that were approved by the audit committee |
| | | |
| | | 100% of the services were approved by the audit committee. |
| | | |
| (f) | | Percentage of hours expended attributable to work performed by other than full time employees of KPMG if greater than 50%. |
| | | |
| | | Not applicable. |
| | | |
| (g) | | Non-Audit Fees: The non-audit fees billed by the registrant’s accountant for services rendered to the registrant, and rendered to the registrant’s investment adviser, and any entity controlling, controlled by, or under common control with the adviser that provides ongoing services to the registrant for each of the last two fiscal years of the registrant were $2,168,685 for year ended October 31, 2008 and $212,850 for year ended October 31, 2007. |
| | | |
| (h) | | Principal Accountants Independence: The Registrant’s Audit committee has considered whether the provision of non-audit services that were rendered to the registrant’s investment adviser and any entity controlling, controlled by, or under common control with the investment adviser that provides ongoing services to the registrant that were not pre-approved pursuant to Rule 2-01(c)(7)(ii) of Regulation S-X is compatible with maintaining KPMG’s independence. |
Item 5. Audit Committee of Listed Registrants.
Not applicable.
Item 6. Schedule of Investments
Schedule is included as part of the report to shareholders filed under Item 1 of this Form.
Item 7. Disclosure of Proxy Voting Policies and Procedures for Closed-End Management Investment Companies.
Not applicable.
Item 8. Portfolio Managers of Closed-End Management Investment Companies.
Not applicable.
Item 9. Purchases of Equity Securities by Closed-End Management Investment Company and Affiliated Purchasers
Not applicable.
Item 10. Submission of Matters to a Vote of Security Holders.
The Board has a Nominating Committee for the purpose of considering and presenting to the Board candidates it proposes for nomination to fill Independent Trustee vacancies on the Board. The Committee currently consists of all Independent Trustees of the Board (6 individuals). The Nominating Committee operates pursuant to a Charter approved by the Board. The primary purpose of the Nominating Committee is to consider and present to the Board the candidates it proposes for nomination to fill vacancies on the Board. In evaluating candidates, the Nominating Committee may consider a variety of factors, but it has not at this time set any specific minimum qualifications that must be met. Specific qualifications of candidates for Board membership will be based on the needs of the Board at the time of nomination.
The Nominating Committee is willing to consider nominations received from shareholders and shall assess shareholder nominees in the same manner as it reviews its own nominees. A shareholder nominee for director should be submitted in writing to the Fund’s Secretary. Any such shareholder nomination should include at a minimum the following information as to each individual proposed for nomination as trustee: such individual’s written consent to be named in the proxy statement as a nominee (if nominated) and to serve as a trustee (if elected), and all information relating to such individual that is required to be disclosed in the solicitation of proxies for election of trustees, or is otherwise required, in each case under applicable federal securities laws, rules and regulations.
The Secretary shall submit all nominations received in a timely manner to the Nominating Committee. To be timely, any such submission must be delivered to the Fund’s Secretary not earlier than the 90th day prior to such meeting and not later than the close of business on the later of the 60th day prior to such meeting or the 10th day following the day on which public announcement of the date of the meeting is first made, by either disclosure in a press release or in a document publicly filed by the Fund with the Securities and Exchange Commission.
Item 11. Controls and Procedures.
| (a) | | Based on our evaluation conducted within 90 days of the filing date, hereof, the design and operation of the registrant’s disclosure controls and procedures are effective to ensure that material information relating to the registrant is made known to the certifying officers by others within the appropriate entities, particularly during the period in which Forms N-CSR are being prepared, and the registrant’s disclosure controls and procedures allow timely preparation and review of the information for the registrant’s Form N-CSR and the officer certifications of such Form N-CSR. |
| |
| (b) | | There were no significant changes in the registrant’s internal controls that occurred during the second fiscal quarter of the period covered by this report that has materially affected, or is reasonably likely to materially affect, the registrant’s internal control over financial reporting. |
Item 12. Exhibits.
| (a)(1) | | Code of Ethics pursuant to Item 2 of Form N-CSR is filed and attached hereto as EX-99.CODE ETH. |
| |
| (a)(2) | | A separate certification for each principal executive officer and principal financial officer of the registrant as required by Rule 30a-2 under the Act (17 CFR 270.30a-2) is attached hereto as EX-99.CERT. |
| |
| (b) | | The officer certifications required by Section 906 of the Sarbanes-Oxley Act of 2002 are attached hereto as EX-99.906CERT. |
| |
| (3) | | Not applicable. |
SIGNATURES
Pursuant to the requirements of the Securities Exchange Act of 1934 and the Investment Company Act of 1940, the registrant has duly caused this report to be signed on its behalf by the undersigned, thereunto duly authorized.
(Registrant): ING Mayflower Trust
| | | | | |
| By | | /s/ Shaun P, Mathews Shaun P. Mathews | | |
| | | President and Chief Executive Officer | | |
Date: January 7, 2009
Pursuant to the requirements of the Securities Exchange Act of 1934 and the Investment Company Act of 1940, this report has been signed below by the following persons on behalf of the registrant and in the capacities and on the dates indicated.
| | | | | |
| By | | /s/ Shaun P. Mathews Shaun P. Mathews | | |
| | | President and Chief Executive Officer | | |
Date: January 7, 2009
| | | | | |
| By | | /s/ Todd Modic Todd Modic | | |
| | | Senior Vice President and Chief Financial Officer | | |
Date: January 7, 2009