OMB APPROVAL
OMB Number: 3235-0570
Expires: October 31, 2006
Estimated average burden hours per response: 19.3
UNITED STATES
SECURITIES AND EXCHANGE COMMISSION
Washington, D.C. 20549
FORM N-CSR
CERTIFIED SHAREHOLDER REPORT OF
REGISTERED MANAGEMENT INVESTMENT COMPANIES
Investment Company Act file number: 811-7978
ING Mayflower Trust
(Exact name of registrant as specified in charter)
7337 E. Doubletree Ranch Rd., Scottsdale, AZ | | 85258 |
(Address of principal executive offices) | | (Zip code) |
CT Corporation System, 101 Federal Street, Boston, MA 02110
(Name and address of agent for service)
Registrant’s telephone number, including area code: 1-800-992-0180
Date of fiscal year end: | October 31 |
| |
Date of reporting period: | November 1, 2005 to October 31, 2006 |
Item 1. Reports to Stockholders.
The following is a copy of the report transmitted to stockholders pursuant to Rule 30e-1 under the Act (17 CFR 270.30e-1):

Funds
Annual Report
October 31, 2006
Classes A, B, C, I, M, O, Q and R
Global Equity Funds
n ING Global Equity Dividend Fund
n ING Global Natural Resources Fund (formerly, ING Precious Metals Fund)
n ING Global Real Estate Fund
n ING Global Value Choice Fund
International Equity Funds
n ING Emerging Countries Fund
n ING Foreign Fund
n ING Greater China Fund
n ING Index Plus International Equity Fund
n ING International Fund
n ING International Capital Appreciation Fund
n ING International Real Estate Fund
n ING International SmallCap Fund
n ING International Value Fund
n ING International Value Choice Fund
n ING Russia Fund
Global and International Fixed-Income Funds
n ING Emerging Markets Fixed Income Fund
n ING Global Bond Fund
International Fund-of-Funds
n ING Diversified International Fund
 E-Delivery Sign-up – details inside
This report is submitted for general information to shareholders of the ING Funds. It is not authorized for distribution to prospective shareholders unless accompanied or preceded by a prospectus which includes details regarding the funds' investment objectives, risks, charges, expenses and other information. This information should be read carefully.

TABLE OF CONTENTS
| President's Letter | | | 1 | | |
|
| Market Perspective | | | 2 | | |
|
| Portfolio Managers' Reports | | | 4 | | |
|
| Shareholder Expense Examples | | | 40 | | |
|
| Report of Independent Registered Public Accounting Firm | | | 46 | | |
|
| Statements of Assets and Liabilities | | | 47 | | |
|
| Statements of Operations | | | 57 | | |
|
| Statements of Changes in Net Assets | | | 62 | | |
|
| Financial Highlights | | | 71 | | |
|
| Notes to Financial Statements | | | 103 | | |
|
| Portfolios of Investments | | | 127 | | |
|
| Tax Information | | | 176 | | |
|
| Trustee and Officer Information | | | 182 | | |
|
| Advisory Contract Approval Discussion | | | 186 | | |
|
 Go Paperless with E-Delivery!
Sign up now for on-line prospectuses, fund reports, and proxy statements. In less than five minutes, you can help reduce paper mail and lower fund costs.
Just go to www.ingfunds.com, click on the E-Delivery icon from the home page, follow the directions and complete the quick 5 Steps to Enroll.
You will be notified by e-mail when these communications become available on the internet. Documents that are not available on the internet will continue to be sent by mail.
(THIS PAGE INTENTIONALLY LEFT BLANK)
PRESIDENT'S LETTER

JAMES M. HENNESSY
Dear Shareholder,
In its recent meetings, the Federal Reserve Board (the "Fed") has ceased its two-year trend of raising interest rates. That trend – a string of 17 consecutive rate hikes — was seen by many analysts as a sign that the Fed was concerned about containing inflation.
Its latest actions, or perhaps inactions is a better word, since the Fed has neither raised nor lowered interest rates, put us in a climate that economists refer to as a "plateau." Historically, there have been six similar plateaus since 1982 and during those periods the Standard & Poors 500® Composite Stock Price Index ("S&P 500® Index") experienced significant growth in the three months following the decrease of interest rates by the Fed.
Of course, the Fed's actions have also impacted economies and market performance around the world. For instance, the current interest rate climate has been cited as one reason for a recent decline in the value of the dollar. That drop in the dollar has meant that international stocks — which deal in foreign currencies — have generally experienced strong performance in recent months as their currencies have climbed. Meanwhile other factors have triggered robust international stock performance as well: business confidence overseas is up, foreign merger and acquisition activity has been positive and Japan, England and the Eurozone have all reported impressive earnings in 2006.
Whatever the future holds — here or abroad — we at ING Funds continue to work hard to provide you, the investor, with an array of investment choices that enable you build a smart and diversified portfolio. We also continue to expand and improve our customer service department to ensure that your needs are met promptly and that we indeed continue to make attaining your future goals easier.
On behalf of everyone here at ING Funds, I thank you for your continued support.
Sincerely,

James M. Hennessy1
President
ING Funds
November 1, 2006
The views expressed in the President's Letter reflect those of the President as of the date of the letter. Any such views are subject to change at any time based upon market or other conditions and ING Funds disclaims any responsibility to update such views. These views may not be relied on as investment advice and because investment decisions for an ING Fund are based on numerous factors, may not be relied on as an indication of investment intent on behalf of any ING Fund. Reference to specific company securities should not be construed as recommendations or investment advice.
International investing does pose special risks including currency fluctuation, economic and political risks not found in investments that are solely domestic.
For more complete information, or to obtain a prospectus on any ING fund, please call your Investment Professional or ING Fund Distributor, LLC at (800) 992-0180 or log on to www.ingfunds.com. The prospectus should be read carefully before investing. Consider the fund's investment objectives, risks, charges and expenses. The prospectus contains this information and other information about the fund. Check with your Investment Professional to determine which funds are available for sale within their firm. Not all funds are available for sale at all firms.
1 Effective November 9, 2006, Mr. James M. Hennessy has retired as the president and chief executive officer to the Funds and is replaced with Mr. Shaun P. Mathews.
1
MARKET PERSPECTIVE: YEAR ENDED OCTOBER 31, 2006
In our semi-annual report we described the half-year to dream for as global equities, led by foreign markets surged 16.0%, according to the Morgan Stanley Capital International ("MSCI") World IndexSM(1) calculated in dollars, including net reinvested dividends. The dream still seemed alive into early May but then investors suddenly woke up to fears that zealous, inflation fighting central bankers would raise interest rates by more than enough to choke off global growth. After a sharp, month-long correction, recovery set in, but it was not until nearly mid-October that the May 9 high was regained. For the second six months the inde x rose a more modest 4.6%. In currencies the dollar was mixed, gaining 2.7% against the yen, losing 1.0% against the euro and 4.3% to the surprising pound sterling, which recently displaced the yen as the third most favored reserve currency.
U.S. equities in the form of the Standard & Poor's 500® Composite Stock Price Index ("S&P 500® Index")(2), returned 6.1% including dividends in the second half of our fiscal year. Stocks had actually become cheaper in the last 12 months as corporate profits had been rising faster than prices. But investors seemed only to have eyes for interest rates. Initial hopes of an imminent end to the tightening cycle after fifteen consecutive increases since June 2004 propelled the S&P 500® Index to a five-year high on May 5. But these were soon dashed by the sixteenth increase on May 10, followed by a barrage of hawkish rhetoric from the Federal Open Market Committe e ("FOMC"), even as the economy was already cooling, evidenced especially by a slumping housing market that had driven much of the consumer spending in the last few years, spending that was now also under threat from record oil prices. By June 13 the market had fallen by 7.7% from its best level. But the seventeenth interest rate increase on June 29 was accompanied by balanced language, reviving hopes that the FOMC might at last be finished raising rates. A tentative recovery was interrupted when renewed conflict in the Middle East sent the price of a barrel of oil to another all-time peak on July 14. But peace of sorts ultimately returned and as summer driving demand and the hurricane damage threat subsided, the oil price fell nearly 24% from its peak. The FOMC did indeed refrain from raising rates on August 8 and again took no action in September and October. Housing data continued to deteriorate and by the end of October, new and existing home prices were falling at the fastest rate in decades. Gross Dome stic Product ("GDP") growth was reported at just 1.6%. So in the face of this, why were stocks in a clear up-trend to a near six-year high by the last week in October? For one thing the pull back in oil prices promised to leave more money in the pockets of consumers. Interest rates were now falling fast at the long end, which made stocks look more attractive as the present value of future corporate profits improved. Speaking of which, corporate profits stood at over 12% of GDP, the highest share in 40 years, all set to register their thirteenth straight quarter of double-digit year-over-year growth. In short, for the equity investor, this was a glass that looked distinctly half-full.
In international markets the pattern of results resembled that of the U.S. The scale was larger in some cases, based on MSCI indices in local currencies including net dividends. Sustained growth and an end to inflation had pushed Japan to almost a 15-year high in April. After slipping, the market was by May 8 again approaching that peak, but over the next month stocks dropped 15.3% as U.S. interest rate fears combined with signals from the Bank of Japan, followed by the reality on July 14, that local interest rates would rise for the first time in six years. The economic data were still mostly positive, but getting past their prime. By the end of October, household spending was falling at its fastest pace in five years and second quarter GDP growth was reported at only 0.8% annualized. For the six months the market fell 3.9%. European ex UK markets were initially supported by broadly based mergers and acquisitions amid clear signs of improving growth and falling unemployment. But from their May 9 top, events in the U.S. and a 25bp increase in euro interest rates as inflation remained stubbornly above 2%, sent stocks down 6.9% over the next five weeks. From there however, markets turned around smartly, even as the European Central Bank raised rates twice more. Business confidence was strong and the evidently range-bound euro posed little threat to exports. Merger and acquisition activity rolled on, heartening investors while suggesting that stocks were not particularly expensive. For the half-year, markets ended up 5.8%, making a 51/2-year high. UK equities had been boosted in the first half by the large acquisition-prone Financial, the sizeable Energy and the vibrant Materials sectors. The reversal in the latter two sectors exacerbated the global retrenchment brought on by interest rate worries after May 9 and UK stocks were dragged down 9.3% by mid June. As in Japan and the Eurozone, the Bank of England raised rates by 1/4% as GDP growth returned to trend,
2
MARKET PERSPECTIVE: YEAR ENDED OCTOBER 31, 2006
inflation climbed above target and house prices, an important demand generator, continued their recovery. This cheered investors and led by Financials, the market reclaimed its best levels of the year and more, reaching levels near the end of October not seen in 69 months.
(1) The MSCI World IndexSM is an unmanaged index that measures the performance of over 1,400 securities listed on exchanges in the U.S., Europe, Canada, Australia, New Zealand and the Far East.
(2) The S&P 500® Index is an unmanaged index that measures the performance of securities of approximately 500 of the largest companies in the United States.
All indices are unmanaged and investors cannot invest directly in an index.
Past performance does not guarantee future results. The performance quoted represents past performance. Investment return and principal value of an investment will fluctuate, and shares, when redeemed, may be worth more or less than their original cost. The Funds' performance is subject to change since the period's end and may be lower or higher than the performance data shown. Please call (800) 992-0180 or log on to www.ingfunds.com to obtain performance data current to the most recent month end.
Market Perspective reflects the views of ING's Chief Investment Risk Officer only through the end of the period, and is subject to change based on market and other conditions.
3
ING GLOBAL EQUITY DIVIDEND FUND
PORTFOLIO MANAGERS' REPORT
The ING Global Equity Dividend Fund (the "Fund") seeks growth of capital with dividend income as a secondary consideration. The Fund is managed by Nicolas Simar, Head of Value/High Dividend and Moudy El Khodr, Senior Investment Manager Equities, ING Investment Management Advisors B.V.(1) — the Sub-Adviser.
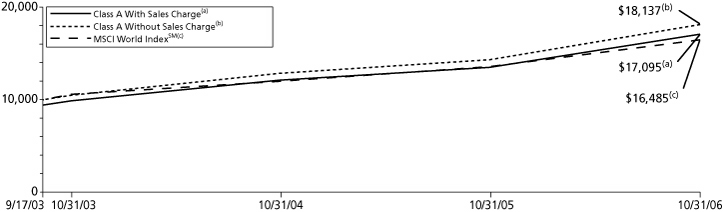
Performance: For the year ended October 31, 2006, the Fund's Class A shares, excluding sales charges, provided a total return of 26.56% compared to the Morgan Stanley Capital International World IndexSM ("MSCI World IndexSM"), which returned 21.32% for the same period.
Portfolio Specifics: Most of the market gains came during the first half of the reporting period. Regionally, Europe (up 32.3%) and emerging markets (up 35.4%) performed best, and emerging markets would have been far higher if not for the mini-market correction of May-June. Meanwhile Japan rose 16.6% and the U.S. appreciated 16.3%, both in U.S. dollar terms. On a sector basis, materials appreciated 35.9%, while utilities appreciated 31.2%, information technology 13.7%, and health care 14.0%. The first half of 2006 also witnessed substantial volatility.
During the first quarter, the markets were positive based on good earnings results and future growth prospects for the global economy. By comparison, the markets during the second quarter were crippled by inflation fears which led to the expectation that the U.S. Federal Reserve ("Fed") would raise interest rates to keep these fears in check. This reaction also stoked concerns that the Fed could overshoot by raising interest rates too much, stifling economic growth in the process.
Energy and materials performed well on the back of substantial gains during the first quarter due to higher commodity prices. Utilities companies, a defensive investment by its nature, were in favor throughout the period.
The third quarter was defined by further uncertainty surrounding the direction of the next interest rate movement by the Fed. Despite good second-quarter earnings, there were few upward earnings revisions forecasts for 2007. Several indices around the world reached record levels, stimulated by sharply falling oil prices, a low interest rate environment and stronger-than-expected U.S. consumer confidence numbers. Europe and Japan experienced economic data that pointed to an end in the acceleration of growth and that economic activity would stabilize at a high level.
During the period, the Fund benefited from an overweight position in financials, utilities, and real estate. The Fund had a large position in utilities, which generated significant cash-flows and dividend increases. Financials benefited from positive earnings and was further bolstered by increased merger and acquisition activities. One noticeable M&A transaction saw Italian banking group, UniCredito take over German banking operation Hypovereinsbank. Having zero exposure to technology helped the Fund as the sector underperformed. This was especially helpful in the May-June period.
By comparison, an underweight position in materials hurt the Fund as the sector outperformed for much of the period. However, the sector was rattled by the May-June correction, especially in emerging markets. The telecom sector also helped the Fund in the second half of the year as the sector only started to outperform after March. The sector had been stuck in limbo for some time following the large payments many European-based companies made for third-generation mobile phone licenses some years ago.
On an individual stock basis, a position in Volvo, which has historically performed well for the Fund as the company has consistently raised its dividends, helped the Fund during the period. Additionally, there was speculation that the company might be a leveraged buyout target. DSG International, a UK consumer electronics retailer, had a great run following an increase in its profits, which beat analysts' expectations on the back of strong World Cup television sales. The company also increased dividend payments throughout the year (both interim and final dividends). Reynolds American, the tobacco company, increased its quarterly profits dividend levels throughout the year. The company's share price rallied despite notable court cases pending against the tobacco industry. Scania, the Swedish truck and car company, also became a take-over candidate as MAN group, the German truck manufacturer, made an offer for the company. The Fund sold its p osition in the company as the market digested the news.
By contrast, a position in Precision Drilling, an oilfield drilling and oil and gas services company, acted as a drag as a lack of supply side shocks like Hurricane Katrina in 2005 caused gas prices to fall. Public Services Enterprise Group, a generator, transmitter and distributor of electricity in the U.S., declined after performing well for most of the year on the back of M&A bid rumors. However, talks with a potential suitor, Exelon, were abandoned in September, resulting in both parties seeing a sharp fall in their share price. Pending regulatory changes in New Zealand also hurt Telecom Corp of NZ, a domestic telecommunications operator as it was announced that the country was opening up its telecommunications market to competition. This announcement resulted in a sharp decline in the company's share price, from which it did not fully recover.
A position in Brazilian telecommunications operator Tele Norte Leste also acted as a drag as higher costs hit the operator's profits, despite a significant increase in the company's customer base. Fording Canadian Coal Trust, a Canadian coal miner, also negatively impacted the Fund as the company reported a drop in profits in both the first and second quarter as a result of higher production costs and higher-than-anticipated taxes on minerals. The higher production costs were primarily due to an increase in input costs, lower coal production, and a one-off cost related to a change in labor agreements. This led to a decline in the company's shares.
Currently there is no exposure to Japan due to the dividend yield criterion requiring that all securities in the portfolio provide a yield above 3.3%. Since Japanese companies do not have a high dividend yield (most don't pay dividends), the Japanese names are filtered out in the quantitative stages of screening.
Current Strategy and Outlook: The outlook for the Fund remains positive. We believe investments in defensive sectors including utilities, real estate, telecommunication services and consumer staples give the Fund downside protection. These sectors are relatively cheap, less dependent on the economic environment and offer stable, high-dividend yields. In our opinion, this may result in outperformance versus global equities if they fall significantly. If the equity markets move sideways, stock selection and our consistent, disciplined strategy may add value. In this scenario, dividends will provide an important part of the Fund's total return. This may result in positive absolute returns and outperformance of global equities. Only in the case of a strong rally will it be difficult for us to outperform global equities. If the rally is broadly driven, investmen ts in financials and more cyclical sectors such as industrials, consumer cyclicals and basic materials are expected to perform well. A rally driven by growth stocks (especially information technology or health care) will be the most difficult environment for the strategy. However, we do expect that returns will still be positive in that scenario. Regardless of the market scenario, our strategy continually looks for countries, sectors or individual stocks that will allow us to seek to exploit temporary undervaluations.
(1) Effective January 19, 2006, Nicolas Simar and Moudy El Khodr replaced Jorik van den Bos, Joris Fronssen, and Joost de Graaf as Portfolio Managers to the Fund.
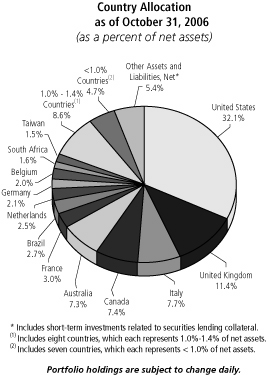
Top Ten Industries*
as of October 31, 2006
(as a percent of net assets)
| Banks | | | 22.4 | % | |
| Telecommunications | | | 13.0 | % | |
| Electric | | | 9.1 | % | |
| Oil & Gas | | | 7.0 | % | |
| Agriculture | | | 5.0 | % | |
| Pharmaceuticals | | | 3.9 | % | |
| Real Estate Investment Trust | | | 3.4 | % | |
| Pipelines | | | 2.8 | % | |
| Beverages | | | 2.5 | % | |
| Insurance | | | 2.5 | % | |
* Excludes short-term investments related to securities lending collateral.
Portfolio holdings are subject to change daily.
4
ING GLOBAL EQUITY DIVIDEND FUND
PORTFOLIO MANAGERS' REPORT
| Average Annual Total Returns for the Periods Ended October 31, 2006 | |
| | | 1 Year | | Since Inception
of Class A
September 17, 2003 | | Since Inception
of Class B
October 24, 2003 | | Since Inception
of Class C
October 29, 2003 | |
| Including Sales Charge: | |
| Class A(1) | | | 19.25 | % | | | 18.73 | % | | | — | | | | — | | |
| Class B(2) | | | 20.55 | % | | | — | | | | 19.04 | % | | | — | | |
| Class C(3) | | | 24.62 | % | | | — | | | | — | | | | 19.29 | % | |
| Excluding Sales Charge: | |
| Class A | | | 26.56 | % | | | 21.00 | % | | | — | | | | — | | |
| Class B | | | 25.55 | % | | | — | | | | 19.73 | % | | | — | | |
| Class C | | | 25.62 | % | | | — | | | | — | | | | 19.29 | % | |
| MSCI World IndexSM(4) | | | 21.32 | % | | | 17.60 | %(5) | | | 15.89 | %(6) | | | 15.89 | %(6) | |
Based on a $10,000 initial investment, the graph and table above illustrate the total return of ING Global Equity Dividend Fund against the index indicated. The index is unmanaged and has no cash in its portfolio, imposes no sales charges and incurs no operating expenses. An investor cannot invest directly in the index. The Fund's performance is shown both with and without the imposition of sales charges.
The graph and performance table do not reflect the deduction of taxes that a shareholder will pay on Fund distributions or the redemption of Fund shares.
The performance shown may include the effect of fee waivers and/or expense reimbursements by the Investment Adviser and/or other service providers, which have the effect of increasing total return. Had all fees and expenses been considered, the total returns would have been lower.
Performance data represents past performance and is no assurance of future results. Investment return and principal value of an investment in the Fund will fluctuate. Shares, when sold, may be worth more or less than their original cost. The Fund's current performance may be lower or higher than the performance data shown. Please log on to www.ingfunds.com or call (800) 992-0180 to get performance through the most recent month end.
It is important to note that the Fund has a limited operating history. Performance over a longer period of time may be more meaningful than short-term performance.
This report contains statements that may be "forward-looking" statements. Actual results may differ materially from those projected in the "forward-looking" statements.
The views expressed in this report reflect those of the portfolio managers, only through the end of the period as stated on the cover. The portfolio managers' views are subject to change at any time based on market and other conditions.
Fund holdings are subject to change daily.
(1) Reflects deduction of the maximum Class A sales charge of 5.75%.
(2) Reflects deduction of the Class B deferred sales charge of 5% and 3%, respectively, for the 1 year and since inception returns.
(3) Reflects deduction of the Class C deferred sales charge of 1% for the 1 year return.
(4) The MSCI World IndexSM is an unmanaged index that measures the performance of over 1,400 securities listed on exchanges in the U.S., Europe, Canada, Australia, New Zealand and the Far East. It includes the reinvestment of dividends net of withholding taxes, but does not reflect fees, brokerage commissions or other expenses of investing.
(5) Since inception performance for the index is shown from October 1, 2003.
(6) Since inception performance for the index is shown from November 1, 2003.
5
ING GLOBAL NATURAL RESOURCES FUND
PORTFOLIO MANAGERS' REPORT
The ING Global Natural Resources Fund (the "Fund") seeks to attain long-term capital appreciation.(1) The Fund is managed by James A. Vail, CFA, Portfolio Manager and Anthony Socci, Portfolio Manager, ING Investment Management Co. — the Sub-Adviser.
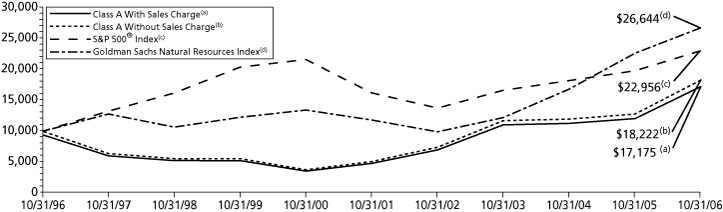
Performance: For the year ended October 31, 2006, the Fund's Class A shares, excluding sales charges, provided a total return of 42.76% compared to the Standard & Poor's 500® Composite Stock Price Index ("S&P 500® Index") and the Goldman Sachs Natural Resources Index which returned 16.34% and 18.16%, respectively, for the same period.
Portfolio Specifics: Driven by strong economic activity in much of the world, geopolitical tensions and supply disruptions, prices of most commodities from aluminum to zinc appreciated, with some reaching record highs. Prices generally peaked in the May-to-August time period, but then retreated as fears subsided that severe weather would impact energy supplies. Slower global economic growth also cooled investor speculation in many precious and base metals. By the end of the period, most commodity valuations appeared to have bottomed out, but the outlook is unclear given the uncertainty over future global economic growth.
The Fund outperformed the FTSE Gold Mines Index by a wide margin reflecting its positive stock selection in the gold sector. The Fund was also helped by its overweight position in diversified metals and mining, which is not represented in the index.
By contrast, an underweight position in precious metals and minerals was the biggest drag on performance during the period. This group includes producers of silver, platinum and other precious materials.
While many individual holdings added to the Fund's performance, Agnico-Eagle, Yamana Gold, Gammon Lake Resources, and Newmont Mining were the most notable contributors. Agnico-Eagle possesses an attractive production growth profile in addition to a polymetallic product mix. Yamana Gold has also grown rapidly, both organically and through acquisition, while Gammon Lake Resources has amended its business model from a developer to an expanding producer. Newmont Mining performed poorly during the period, but a significant underweight position helped the Fund.
By comparison, a position in Shore Gold, a misnamed Canadian diamond explorer, acted as the Fund's biggest drag during the period. However, the company possesses one of the most prolific kimberlite diamond deposits in Canada and exploration and development activity continually point to a growing resource. Despite the recent underperformance, we are confident in the potential value of the company. Our decision to not to own Zijin Mining Group detracted from performance as this company has performed extremely well during this period. We were also hurt by our underweight in Harmony Gold, a South African producer.
Current Strategy and Outlook: On October 9, 2006, this Fund changed its name from ING Precious Metals to ING Global Natural Resources Fund, and its benchmark from FTSE Gold Mines Index to the Goldman Sachs Natural Resources Index. The Fund also changed its principal investment objective and strategy and now has a focus in energy rather than materials, which was formerly the case. By investing in natural resources companies, the Fund should benefit from the current commodity cycle which we believe is still in its early stages. This cycle should be driven by consumption trends in China, India, Brazil, and Russia. In these countries populations are moving from rural areas creating the need for raw materials as new cities are built and all the associated amenities are deployed. History suggests commodity cycles can last up to 20 years, and the current one is on ly five years old. As a sector fund addressing the broad commodity universe, we believe our Fund could be a beneficiary of the ongoing global demand for all commodities.
(1) Formally known as the ING Precious Metals Fund, the Fund changed its name to ING Global Natural Resources Fund and its benchmark in October, 2006. The Fund also changed it investment objective and principal investment strategies and now has a focus in energy rather than materials, which was formerly the case.
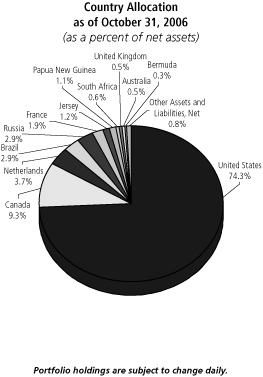
Top Five Industries
as of October 31, 2006
(as a percent of net assets)
| Oil & Gas | | | 57.2 | % | |
| Mining | | | 18.4 | % | |
| Oil & Gas Services | | | 14.5 | % | |
| Electric | | | 2.6 | % | |
| Coal | | | 1.9 | % | |
Portfolio holdings are subject to change daily.
6
ING GLOBAL NATURAL RESOURCES FUND
PORTFOLIO MANAGERS' REPORT
| Average Annual Total Returns for the Periods Ended October 31, 2006 | |
| | | 1 Year | | 5 Year | | 10 Year | |
| Including Sales Charge: | |
| Class A(1) | | | 34.51 | % | | | 27.37 | % | | | 5.56 | % | |
| Excluding Sales Charge: | |
| Class A | | | 42.76 | % | | | 28.92 | % | | | 6.19 | % | |
| S&P 500® Index(2) | | | 16.34 | % | | | 7.26 | % | | | 8.64 | % | |
| Goldman Sachs Natural Resources Index(3) | | | 18.16 | % | | | 17.69 | % | | | 10.29 | % | |
Based on a $10,000 initial investment, the graph and table above illustrate the total return of ING Global Natural Resources Fund against the indices indicated. Each index is unmanaged and has no cash in its portfolio, imposes no sales charge and incurs no operating expenses. An investor cannot invest directly in an index. The Fund's performance is shown both with and without the imposition of sales charges.
The graph and performance table do not reflect the deduction of taxes that a shareholder will pay on Fund distributions or the redemption of Fund shares.
The performance shown may include the effect of fee waivers and/or expense reimbursements by the Investment Adviser and/or other service providers, which have the effect of increasing total return. Had all fees and expenses been considered, the total returns would have been lower.
Performance data represents past performance and is no assurance of future results. Investment return and principal value of an investment in the Fund will fluctuate. Shares, when sold, may be worth more or less than their original cost. The Fund's current performance may be lower or higher than the performance data shown. Please log on to www.ingfunds.com or call (800) 992-0180 to get performance through the most recent month end.
This report contains statements that may be "forward-looking" statements. Actual results may differ materially from those projected in the "forward-looking" statements.
The views expressed in this report reflect those of the portfolio managers, only through the end of the period as stated on the cover. The portfolio managers' views are subject to change at any time based on market and other conditions.
Fund holdings are subject to change daily.
(1) Reflects deduction of the maximum Class A sales charge of 5.75%.
(2) The S&P 500® Index is an unmanaged index that measures the performance of securities of approximately 500 large-capitalization U.S. companies whose securities are traded on major U.S. stock markets.
(3) The Goldman Sachs Natural Resources Index is an unmanaged index and a market-capitalization-weighted index of 112 stocks designed to measure the performance of companies in the natural resources sector, which includes energy, precious metals, timber and other sub-sectors.
7
ING GLOBAL REAL ESTATE FUND
PORTFOLIO MANAGERS' REPORT
The ING Global Real Estate Fund (the "Fund") seeks to provide investors with high total return. The Fund is managed by T. Ritson Ferguson, Chief Investment Officer, CFA and Steven D. Burton, Managing Director, CFA, Portfolio Managers, ING Clarion Real Estate Securities L.P. — the Sub-Adviser.
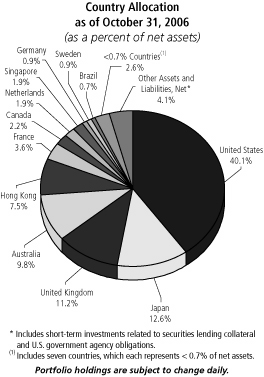
Performance: For the year ended October 31, 2006, the Fund's Class A shares, excluding sales charges, provided a total return of 41.09% compared to the Standard & Poor's/Citigroup World Property Index ("S&P/Citigroup World Property Index"), which returned 39.83% for the same period.
Portfolio Specifics: By region, Europe was the strongest performer with up 55.3% total return followed by North America up 36.7% and the Asia-Pacific region up 36.5%. Within Europe, the United Kingdom property stocks were up 67.9% versus property stocks in continental Europe which were up 45.9%. Out-performance versus the benchmark was generated primarily by stock picking in Japan, the United States, Hong Kong, Canada and Australia. In Japan, an overweight position in Tokyo-based development companies contributed to relative out-performance, including Sumitomo Realty which is primarily a developer and landlord of office and condominium properties. Tokyo office fundamentals continue to improve with rents increasing and vacancy levels below 3.0%. Top picks elsewhere included SL Green Realty Corp (a U.S. Real Estate Investment Trust ("REIT") which specializes in the mid-town Manhattan sub-market), Agile Property Holdings (a residential developer in China which is listed in Hong Kong), Centro Properties (an Australian shopping center company) and Summit REIT (a Canadian warehouse company). Global themes for the year included continued yield compression, mergers and acquisitions activity, syndicate activity (new companies being formed or existing companies raising new equity) and improving property fundamentals. By major country, the strongest performers for the year were Singapore up 80.8%, the United Kingdom up 67.9% and France up 64.4%, all of which are seeing improvements in property fundamentals, especially in the office sector which is showing a combination of higher rents and lower vacancies. Property stocks in the United Kingdom are additionally benefiting from the anticipation of the introduction of the REIT structure beginning January 1, 2007. Many of the major U.K. listed property companies have announced an intention to convert to a REIT structure next year which should generally cause dividend levels to be increased by those companies that are converting.
Current Strategy and Outlook: Global property companies continue to benefit from a combination of improving property fundamentals, yield compression and M&A activity, all of which have underpinned strong performance over the past year and which we believe should continue to serve as positive factors looking forward. Investment themes include investing in higher growth regions of the world, including the Asia-Pacific rim, and looking for opportunities in select markets which are currently under-represented in the listed markets but which show strong property fundamentals. By property type, the Fund strategy will attempt to benefit from generally improving property conditions globally, including the office sector which is generally firming in the major markets around the world. Through an average 3% - 4% dividend yield plus 6% to 9% prospective annual ear nings growth, we believe global property stocks continue to be well-positioned to conservatively deliver attractive total returns over the next several years.
Top Ten Industries*
as of October 31, 2006
(as a percent of net assets)
| Real Estate Operation/Development | | | 25.6 | % | |
| Offices | | | 11.1 | % | |
| Residential: Apartments | | | 10.0 | % | |
| Property Trust | | | 9.8 | % | |
| Diversified Property Holdings | | | 8.1 | % | |
| Real Estate Management/Services | | | 7.4 | % | |
| Retail: Shopping Centers | | | 6.8 | % | |
| Retail: Regional Malls | | | 5.3 | % | |
| Warehouse/Industrial | | | 3.3 | % | |
| Residential: Hotels | | | 2.9 | % | |
* Excludes short-term investments related to U.S. government agency obligations and securities lending collateral.
Portfolio holdings are subject to change daily.
8
ING GLOBAL REAL ESTATE FUND
PORTFOLIO MANAGERS' REPORT
| Average Annual Total Returns for the Periods Ended October 31, 2006 | |
| | | 1 Year | | Since Inception
of Class A
November 5, 2001 | | Since Inception
of Class B
March 15, 2002 | | Since Inception
of Class C
January 8, 2002 | | Since Inception
of Class I
June 3, 2005 | |
| Including Sales Charge: | |
| Class A(1) | | | 32.95 | % | | | 24.68 | % | | | — | | | | — | | | | — | | |
| Class B(2) | | | 35.04 | % | | | — | | | | 24.26 | % | | | — | | | | — | | |
| Class C(3) | | | 39.06 | % | | | — | | | | — | | | | 24.29 | % | | | — | | |
| Class I | | | 41.49 | % | | | — | | | | — | | | | — | | | | 33.41 | % | |
| Excluding Sales Charge: | |
| Class A | | | 41.09 | % | | | 26.17 | % | | | — | | | | — | | | | — | | |
| Class B | | | 40.04 | % | | | — | | | | 24.46 | % | | | — | | | | — | | |
| Class C | | | 40.06 | % | | | — | | | | — | | | | 24.29 | % | | | — | | |
| Class I | | | 41.49 | % | | | — | | | | — | | | | — | | | | 33.41 | % | |
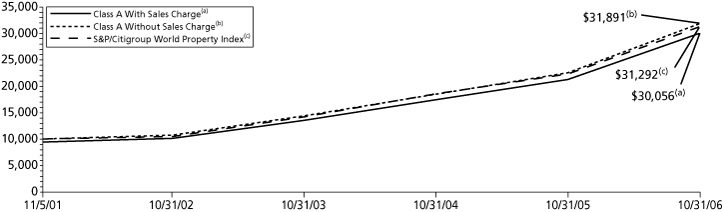
| S&P/Citigroup World Property Index(4) | | | 39.83 | % | | | 25.61 | %(5) | | | 26.13 | %(6) | | | 25.17 | %(7) | | | 32.91 | %(8) | |
Based on a $10,000 initial investment, the graph and table above illustrate the total return of ING Global Real Estate Fund against the index indicated. The index is unmanaged and has no cash in its portfolio, imposes no sales charge and incurs no operating expenses. An investor cannot invest directly in the index. The Fund's performance is shown both with and without the imposition of sales charges.
The graph and performance table do not reflect the deduction of taxes that a shareholder will pay on Fund distributions or the redemption of Fund shares.
The performance shown may include the effect of fee waivers and/or expense reimbursements by the Investment Adviser and/or other service providers, which have the effect of increasing total return. Had all fees and expenses been considered, the total returns would have been lower.
Performance data represents past performance and is no assurance of future results. Investment return and principal value of an investment in the Fund will fluctuate. Shares, when sold, may be worth more or less than their original cost. The Fund's current performance may be lower or higher than the performance data shown. Please log on to www.ingfunds.com or call (800) 992-0180 to get performance through the most recent month end.
It is important to note that the Fund has a limited operating history. Performance over a longer period of time may be more meaningful than short-term performance.
This report contains statements that may be "forward-looking" statements. Actual results may differ materially from those projected in the "forward-looking" statements.
The views expressed in this report reflect those of the portfolio managers, only through the end of the period as stated on the cover. The portfolio managers' views are subject to change at any time based on market and other conditions.
Fund holdings are subject to change daily.
(1) Reflects deduction of the maximum Class A sales charge of 5.75%.
(2) Reflects deduction of the Class B deferred sales charge of 5% and 2%, respectively, for the 1 year and since inception returns.
(3) Reflects deduction of the Class C deferred sales charge of 1% for the 1 year return.
(4) The S&P/Citigroup World Property Index is an unmanaged market-weighted total return index which consists of many companies from developed markets whose floats are larger than $100 million and derive more than half of their revenue from property-related activities.
(5) Since inception performance for index is shown from November 1, 2001.
(6) Since inception performance for index is shown from March 1, 2002.
(7) Since inception performance for index is shown from January 1, 2002.
(8) Since inception performance for index is shown from June 1, 2005.
9
ING GLOBAL VALUE CHOICE FUND
PORTFOLIO MANAGERS' REPORT
The ING Global Value Choice Fund (the "Fund") seeks long-term capital appreciation. The Fund is managed by David Iben, CFA, and Paul J. Hechmer, Portfolio Managers, Tradewinds NWQ Global Investors, LLC(1) — the Sub-Adviser.
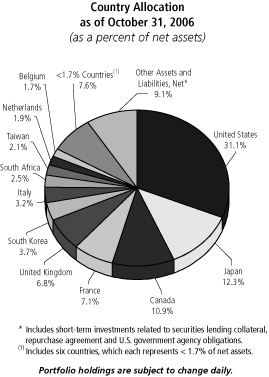
Performance: For the year ended October 31, 2006, the Fund's Class A shares, excluding sales charges, provided a total return of 20.48% compared to the Morgan Stanley Capital International World IndexSM ("MSCI World IndexSM"), which returned 21.32% for the same period.
Portfolio Specifics: In the first six months of the fiscal year, the Fund's high relative exposure to materials stocks contributed most to performance. In particular, Lonmin, a UK-listed platinum producer, was the single largest contributor to performance. Anglo American, Impala Platinum, Lihir Gold, and Placer Dome were also strong performers as gold and platinum prices rose during the period. Within the industrials sector, TNT NV, a Dutch global logistics leader, and Areva, a French multi-national nuclear power conglomerate, were also among the top 5 contributors. Dragging on performance during the first six months of the fiscal year was our significant underweight exposure to the financials sector. Additionally, our large exposure to the telecom sector hampered performance, despite the fact that we found good value in the ample cash generated by these co mpanies. In late April, the Fund reduced its allocation to financial and technology companies and increased its allocation to food, agriculture and utility companies.
Over the second half of the fiscal year, AGCO, a manufacturer and distributor of agricultural equipment, was the Fund's single largest contributor to performance as the agricultural industry started to work its way out of a cyclical bottom. Exposure in the materials sector hindered performance as gold, silver and platinum prices corrected sharply in May and June 2006. The pullback in commodity prices was not unexpected considering the huge run-up earlier in the year. Apex Silver Mines, a base metal mining company that owns the world's largest silver-zinc-lead project, located in Bolivia, was the worst individual performer.
For the entire twelve month period ended October 31, 2006, the Fund's holdings in the materials and industrials sectors were the largest contributors to performance. Despite May-June's correction, commodity prices remained significantly higher during the period; Lonmin and Anglo American were the top two individual performers. In addition, industrials holding Agco was a top performer. The Fund's consumer discretionary holdings hindered performance; Premiere AG, a German pay TV company, declined over 40% in December 2005 alone after it lost the rights to broadcast live soccer in 2006. While the Fund's financials sector weighting was significantly reduced in April, Japanese consumer finance company Takefuji was the Fund's worst individual performer for the fiscal year. The company was mired in an environment of regulatory changes and legal challenges within the country.
Current Strategy and Outlook: Looking ahead, the contrarian side of us worries that "what can't last forever — won't." Corporate profit margins in the world's largest economies are at all-time highs and economic theory dictates that they must retreat. Three years of rising federal fund rates and the current malaise in the housing market suggests that this inevitability may happen sooner rather than later.
Yet, over the longer-term, the economies of China, India, Brazil and other developing countries, should experience robust and sustainable growth, albeit with periodic downturns. We continue to find value in the securities of companies who meet the consumption needs of these growth markets. We believe the Fund is well positioned in food, agriculture, energy, commodities and materials companies worldwide and should benefit from these ongoing global developments.
(1) Effective April 24, 2006, sub-advisory responsibilities were transferred from NWQ Investment Management Company, LLC to Tradewinds NWQ Global Investors, LLC and David Iben replaced Mark A. Morris, Gregg S. Tensen as portfolio managers to the Fund.
Top Ten Industries*
as of October 31, 2006
(as a percent of net assets)
| Mining | | | 24.3 | % | |
| Telecommunications | | | 10.7 | % | |
| Food | | | 6.8 | % | |
| Machinery - Diversified | | | 4.6 | % | |
| Electric | | | 4.4 | % | |
| Oil & Gas | | | 4.3 | % | |
| Transportation | | | 4.2 | % | |
| Forest Products & Paper | | | 3.6 | % | |
| Aerospace/Defense | | | 2.4 | % | |
| Oil & Gas Services | | | 2.2 | % | |
* Excludes short-term investments related to U.S. government agency obligations and securities lending collateral.
Portfolio holdings are subject to change daily.
10
ING GLOBAL VALUE CHOICE FUND
PORTFOLIO MANAGERS' REPORT
| Average Annual Total Returns for the Periods Ended October 31, 2006 | |
| | | 1 Year | | 5 Year | | 10 Year | | Since Inception
of Class I
September 6, 2006 | |
| Including Sales Charge: | |
| Class A(1) | | | 13.54 | % | | | 5.94 | % | | | 7.87 | % | | | — | | |
| Class B(2) | | | 14.67 | % | | | 6.17 | % | | | 7.81 | % | | | — | | |
| Class C(3) | | | 18.73 | % | | | 6.50 | % | | | 7.81 | % | | | — | | |
| Class I | | | — | | | | — | | | | — | | | | 1.97 | % | |
| Class Q | | | 20.75 | % | | | 7.50 | % | | | 8.82 | % | | | — | | |
| Excluding Sales Charge: | |
| Class A | | | 20.48 | % | | | 7.20 | % | | | 8.51 | % | | | — | | |
| Class B | | | 19.67 | % | | | 6.49 | % | | | 7.81 | % | | | — | | |
| Class C | | | 19.73 | % | | | 6.50 | % | | | 7.81 | % | | | — | | |
| Class I | | | — | | | | — | | | | — | | | | 1.97 | % | |
| Class Q | | | 20.75 | % | | | 7.50 | % | | | 8.82 | % | | | — | | |
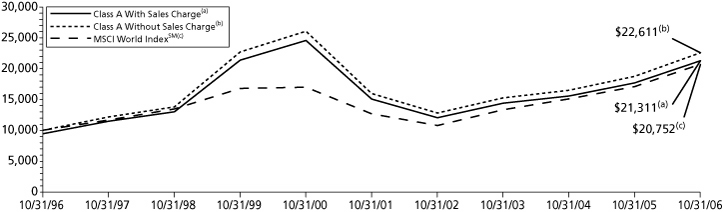
| MSCI World IndexSM(4) | | | 21.32 | % | | | 10.39 | % | | | 7.57 | % | | | 4.91 | %(5) | |
Based on a $10,000 initial investment, the graph and table above illustrate the total return of ING Global Value Choice Fund against the index indicated. The index is unmanaged and has no cash in its portfolio, imposes no sales charge and incurs no operating expenses. An investor cannot invest directly in the index. The Fund's performance is shown both with and without the imposition of sales charges.
The graph and performance table do not reflect the deduction of taxes that a shareholder will pay on Fund distributions or the redemption of Fund shares.
The performance shown may include the effect of fee waivers and/or expense reimbursements by the Investment Adviser and/or other service providers, which have the effect of increasing total return. Had all fees and expenses been considered, the total returns would have been lower.
Performance data represents past performance and is no assurance of future results. Investment return and principal value of an investment in the Fund will fluctuate. Shares, when sold, may be worth more or less than their original cost. The Fund's current performance may be lower or higher than the performance data shown. Please log on to www.ingfunds.com or call (800) 992-0180 to get performance through the most recent month end.
This report contains statements that may be "forward-looking" statements. Actual results may differ materially from those projected in the "forward-looking" statements.
The views expressed in this report reflect those of the portfolio managers, only through the end of the period as stated on the cover. The portfolio managers' views are subject to change at any time based on market and other conditions.
Fund holdings are subject to change daily.
(1) Reflects deduction of the maximum Class A sales charge of 5.75%.
(2) Reflects deduction of the Class B deferred sales charge of 5% and 2%, respectively, for the 1 year and 5 year returns.
(3) Reflects deduction of the Class C deferred sales charge of 1% for the 1 year return.
(4) The MSCI World IndexSM is an unmanaged index that measures the performance of over 1,400 securities listed on exchanges in the U.S., Europe, Canada, Australia, New Zealand and the Far East. It includes the reinvestment of dividends net of withholding taxes, but does not reflect fees, brokerage commissions or other expenses of investing.
(5) Since inception performance for the index is shown from September 1, 2006.
Prior to April 24, 2006, the Fund was advised by a different sub-adviser.
11
ING EMERGING COUNTRIES FUND
PORTFOLIOS MANAGERS' REPORT
The ING Emerging Countries Fund (the "Fund") seeks maximum long-term capital appreciation. The Fund is managed by Brandes Investment Partners, L.P. ("Brandes"), the Sub-Adviser. Brandes' Emerging Markets Committee, comprised of Alphonse H.L. Chan, Jr., CFA, Portfolio Manager, William Pickering, CFA, Director, Christopher J. Garrett, CFA, Institutional Portfolio Manager/Analyst, Gerardo Zamorano, CFA, Senior Analyst, Greg Rippel, CFA, Senior Analyst, Douglas Edman, CFA, Director, and Steven Leonard, CFA, Senior Analyst, is responsible for making the day-to-day investment decisions for the Fund.
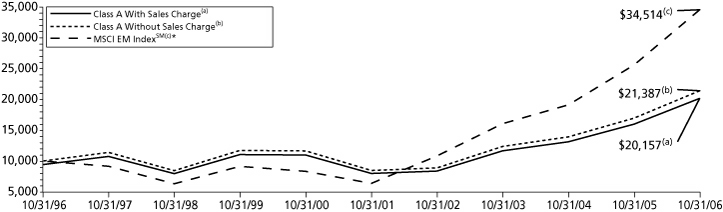
Performance: For the year ended October 31, 2006, the Fund's Class A shares, excluding sales charges, provided a total return of 26.19% compared to the Morgan Stanley Capital International Emerging Markets IndexSM ("MSCI EM IndexSM"), which returned 35.00% for the same period.
Portfolio Specifics: The Fund's positions in the diversified telecom services industry had the most positive impact on performance for the year ended October 31, 2006. Holdings in the commercial banks and wireless telecom services industries also proved favorable to returns. Top performing positions among these industries included Cia Anonima Nacional Telefonos de Venezuela ADR (Venezuela — diversified telecom services), DBS Group Holdings (Singapore — commercial banks), and Partner Communications (Israel — wireless telecom services). Outside of these industries, positions such as Cia de Saneamento Basico do Estado de Sao Paulo (Brazil — water utilities), Sinopec Yizheng Chemical Fibre (China — chemicals), and First Pacific (Hong Kong — diversified financial services) also posted notable advances during the period. Conversely, stock-specific declines, such as Proton Holdings (Malaysia — automobiles), Vivo Participacoes (Brazil — wireless telecom services), and Brasil Telecom Participacoes (Brazil — diversified telecom services), tended to detract from performance.
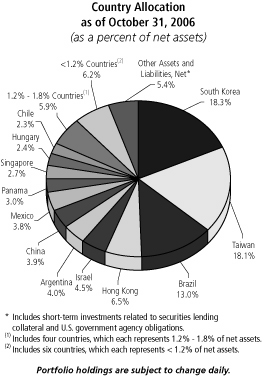
On a country level, gains for securities domiciled in South Korea and Brazil had the most substantial impact upon performance. Some of the positions from these countries experiencing the greatest share price appreciation included KT Freetel (South Korea — wireless telecom services), Lotte Chilsung Beverage (South Korea — beverages), and Embratel Participacoes (Brazil — diversified telecom services). Fund holdings based in China and Taiwan also tended to advance during the period, while select positions based in Malaysia and South Africa tended to detract from performance.
Relative to the index, the portfolio's underperformance was mostly incurred during the first half of the 12-month period. It can be attributed at the industry level to underexposure to stocks in the oil, gas, & consumable fuels and metals & mining industries, and overexposure to diversified telecom services stocks. Within industries, our holdings in commercial banking, capital markets, and semiconductors & semiconductor equipment underperformed their industries, as represented in the MSCI EM IndexSM.
During the second half of the 12-month period, the Fund slightly outperformed the index as emerging market equities generally experienced negative or nominal returns. The Fund benefited from lack of exposure to the weak energy sector, in particular the oil, gas & consumable fuels industry.
As a reminder, the Fund's industry exposure is a residual of our value-driven investment process, which focuses on company-by-company analysis to identify undervalued securities. It should not be surprising that, as dedicated value managers following a disciplined strategy, we are not finding value in many companies in these commodity-based industries. During this period we held one security in the metals & mining industry, Posco (South Korea), which returned more than 40% for the period. We sold our one holding in the oil, gas & consumable fuels industry, LUKOIL (Russia), as its price approached our estimate of intrinsic value.
Our philosophy remains the same, both during periods of relative outperformance and underperformance. We believe the best opportunities for capital appreciation come from finding securities trading at discounts to our estimate of their true values. Conversely, we firmly believe focusing on short-term relative performance can distract investors from focusing on a disciplined investment strategy.
During the period, our company-specific analysis dictated a number of changes to the Fund composition. We sold positions such as Sinopec Yizheng Chemical Fibre (China — chemicals), PT Indofood Sukses Makmur (Indonesia — food products), and Turkiye Vakiflar Bank (Turkey — commercial banks), as share price appreciation pushed their market prices toward our estimates of their fair values. We also purchased a number of new positions, including Lotte Chilsung Beverage (South Korea — beverages), Taishin Financial Holdings (Taiwan — commercial banks), and Petkim Petrokimya (Turkey — chemicals), at prices we consider attractive.
Current Strategy and Outlook: For the year ended October 31, 2006, the Fund's country and industry exposures shifted slightly due to stock-specific buying and selling as well as changes in the prices of holdings. For example, exposure to Taiwan and the industrial conglomerates industry increased, while exposure to Brazil and the commercial banks tended to decline. (Keep in mind that the Fund's weightings for industries and countries are not the product of "top-down" forecasts or opinions, but merely stem from our company-by-company search for compelling investment opportunities in markets around the world.)
Overall, while we offer no predictions regarding the short-term direction of equities in emerging markets, we believe the Fund remains well positioned to deliver favorable long-term results. We believe that all holdings remain undervalued, and we expect them to realize appreciation as the market recognizes their true worth.
Top Ten Industries*
as of October 31, 2006
(as a percent of net assets)
| Telecommunications | | | 34.5 | % | |
| Chemicals | | | 6.0 | % | |
| Banks | | | 5.6 | % | |
| Holding Companies - Diversified | | | 5.3 | % | |
| Auto Manufacturers | | | 5.0 | % | |
| Electric | | | 5.0 | % | |
| Semiconductors | | | 4.5 | % | |
| Electrical Components & Equipment | | | 3.8 | % | |
| Diversified Financial Services | | | 2.7 | % | |
| Textiles | | | 2.6 | % | |
* Excludes short-term investments related to securities lending collateral.
Portfolio holdings are subject to change daily.
12
ING EMERGING COUNTRIES FUND
PORTFOLIO MANAGERS' REPORT
| Average Annual Total Returns for the Periods Ended October 31, 2006 | |
| | | 1 Year | | 5 Year | | 10 Year | | Since Inception
of Class I
December 21, 2005 | | Since Inception
of Class M
August 5, 2002 | |
| Including Sales Charge: | |
| Class A(1) | | | 18.94 | % | | | 18.92 | % | | | 7.25 | % | | | — | | | | — | | |
| Class B(2) | | | 20.33 | % | | | 19.43 | % | | | 7.30 | % | | | — | | | | — | | |
| Class C(3) | | | 24.29 | % | | | 19.32 | % | | | 7.16 | % | | | — | | | | — | | |
| Class I | | | — | | | | — | | | | — | | | | 16.46 | % | | | — | | |
| Class M(4) | | | 21.24 | % | | | — | | | | — | | | | — | | | | 21.38 | % | |
| Class Q | | | 26.37 | % | | | 20.42 | % | | | 8.18 | % | | | — | | | | — | | |
| Excluding Sales Charge: | |
| Class A | | | 26.19 | % | | | 20.33 | % | | | 7.89 | % | | | — | | | | — | | |
| Class B | | | 25.33 | % | | | 19.62 | % | | | 7.30 | % | | | — | | | | — | | |
| Class C | | | 25.29 | % | | | 19.32 | % | | | 7.16 | % | | | — | | | | — | | |
| Class I | | | — | | | | — | | | | — | | | | 16.46 | % | | | — | | |
| Class M | | | 25.63 | % | | | — | | | | — | | | | — | | | | 22.40 | % | |
| Class Q | | | 26.37 | % | | | 20.42 | % | | | 8.18 | % | | | — | | | | — | | |
| MSCI EM IndexSM(5) | | | 35.00 | % | | | 28.11 | %(6) | | | 13.18 | % | | | 17.73 | %(7) | | | 30.26 | %(8) | |
Based on a $10,000 initial investment, the graph and table above illustrate the total return of ING Emerging Countries Fund against the index indicated. The index is unmanaged and has no cash in its portfolio, imposes no sales charge and incurs no operating expenses. An investor cannot invest directly in the index. The Fund's performance is shown both with and without the imposition of sales charges.
The graph and performance table do not reflect the deduction of taxes that a shareholder will pay on Fund distributions or the redemption of Fund shares.
The performance shown may include the effect of fee waivers and/or expense reimbursements by the Investment Adviser and/or other service providers, which have the effect of increasing total return. Had all fees and expenses been considered, the total returns would have been lower.
Performance data represents past performance and is no assurance of future results. Investment return and principal value of an investment in the Fund will fluctuate. Shares, when sold, may be worth more or less than their original cost. The Fund's current performance may be lower or higher than the performance data shown. Please log on to www.ingfunds.com or call (800) 992-0180 to get performance through the most recent month end.
This report contains statements that may be "forward-looking" statements. Actual results may differ materially from those projected in the "forward-looking" statements.
The views expressed in this report reflect those of the portfolio managers, only through the end of the period as stated on the cover. The portfolio managers' views are subject to change at any time based on market and other conditions.
Fund holdings are subject to change daily.
* Prior to October 31, 2001, the MSCI EM IndexSM did not include the deduction of withholding taxes.
(1) Reflects deduction of the maximum Class A sales charge of 5.75%.
(2) Reflects deduction of the Class B deferred sales charge of 5% and 2%, respectively, for the 1 year and 5 year returns.
(3) Reflects deduction of the Class C deferred sales charge of 1% for the 1 year return.
(4) Reflects deduction of the maximum Class M sales charge of 3.50%.
(5) The MSCI EM IndexSM is an unmanaged index that measures the performance of securities listed on exchanges in developing nations throughout the world. It includes the reinvestment of dividends and distributions net of withholding taxes, but does not reflect fees, brokerage commissions or other expenses of investing.
(6) Net return for index is shown from November 1, 2001.
(7) Since inception performance for index is shown from January 1, 2006.
(8) Since inception performance for index is shown from August 1, 2002.
Prior to March 1, 2005, the Fund was advised by a different sub-adviser.
13
ING FOREIGN FUND
PORTFOLIO MANAGERS' REPORT
The ING Foreign Fund (the "Fund") seeks long-term growth of capital. The Fund is managed by Rudolph-Riad Younes, CFA, Senior Vice President and Head of International Equity and Richard Pell, Senior Vice President and Chief Investment Officer, Julius Baer Investment Management LLC — the Sub-Adviser.
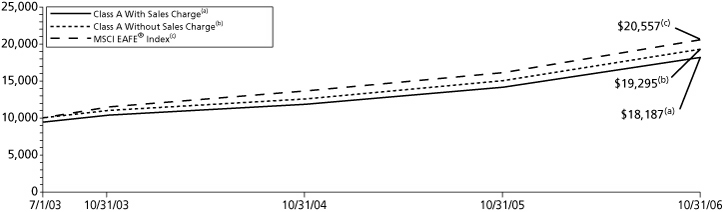
Performance: For the year ended October 31, 2006, the Fund's Class A shares, excluding sales charges, provided a total return of 28.39% compared to the Morgan Stanley Capital International — Europe, Australasia and Far East® Index ("MSCI EAFE® Index"), which returned 27.52% for the same period.
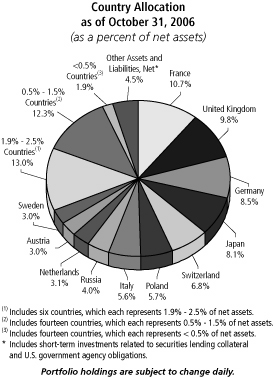
Portfolio Specifics: Positions in Russia, Poland and Turkey positively impacted performance. Within Russia, our position in the nation's largest bank, OAO Sberbank RF was a top contributor to results. Positions in OAO Gazprom and OAO LUKOIL, the country's biggest producers of natural gas and oil, were among top contributors. Additionally, our position in MMC Norilsk Nickel, the world's largest nickel and palladium producer, proved beneficial.
Powszechna Kasa Oszczednosci Bank Polski SA and Bank Pekao, the two largest lenders in Poland, exhibited strong results. Additionally, one of the banking positions held in Turkey, Akbank T.A.S. was a positive contributor. In the Czech Republic, however, shares of Komercni Banka, the third-largest Czech bank which is controlled by Societe Generale of France, underperformed the MSCI EAFE® Index. We have been optimistic about the prospects for emerging markets which have averaged between 15-20% of the strategy. In particular we have focused on the emerging markets of Eastern and Central Europe amid the drive to reunite Europe.
Our underweight to Japan, the weakest performer of the major developed markets, was supportive to results. While we were underweight in Asia overall, we were overweight within Continental Europe, which we believe offers more attractive valuations.
In the UK, stock selection had a positive impact on performance. Within Continental Europe, holdings in cement, airports and banks were positive contributors to results. Our positions in Lafarge (France) and Holcim (Switzerland), the world's #1 and #2 cement makers respectively, exhibited strong results. Our position in Fraport, the operator of the Frankfurt airport, was also a top contributor. Roche Holding (Switzerland), the world's largest maker of cancer medicines, exhibited positive performance over the period, but underperformed the benchmark. Endesa, Spain's largest power company enjoyed very strong performance over the period as a result of takeover bids for the company. Unfortunately, while we held the shares during the earlier part of the reporting period, we had sold our position in February. This negatively impacted relative results versus the benchmark. KKR Private Equity Investors LP is a publicly traded buyout fund that invest s its assets primarily in private equity investments sponsored by Kohlberg Kravis Roberts & Co. The position, which trades on the Amsterdam exchange, was purchased within the Fund in May. These shares have declined since purchase, but given the long-term nature of this investment, we have maintained this position. Also, another factor detracting from results was that the position held in cash equivalents.
Current Strategy and Outlook: Looking forward, we remain enthusiastic toward the long-term opportunities within the emerging markets of Eastern and Central Europe. We view the region as having made significant improvements on many fronts, encouraged by the prospect of European Union membership and possible inclusion into the Eurozone. India is another market which we have recently increased exposure. We see the market as offering long term growth potential, particularly within the banking sector, which should benefit from an increase in loan volumes.
We believe Continental Europe remains relatively strong and our focus continues to be on those industries most prone to a wave of restructuring, mergers and acquisitions taking place. In Germany, we have been focused on companies that will likely benefit from what we expect to be a strengthening domestic economy. We remain underweight the United Kingdom. We continue to be concerned about the UK's growth prospects and the impact this may have on the corporate sector. Much like the United States, the UK has high consumer debt and a declining savings rate which presents potential vulnerability for the UK consumer.
Japan still poses valuation concerns for us. While many companies have undergone structural changes, we've also witnessed this trend in Europe, where individual situations offer more compelling opportunities.
Top Ten Industries*
as of October 31, 2006
(as a percent of net assets)
| Banks | | | 24.5 | % | |
| Telecommunications | | | 7.6 | % | |
| Oil & Gas | | | 4.5 | % | |
| Pharmaceuticals | | | 4.3 | % | |
| Building Materials | | | 4.0 | % | |
| Food | | | 3.5 | % | |
| Mining | | | 3.5 | % | |
| Holding Companies - Diversified | | | 3.0 | % | |
| Engineering & Construction | | | 2.9 | % | |
| Retail | | | 2.6 | % | |
* Excludes short-term investments related to securities lending.
Portfolio holdings are subject to change daily.
14
ING FOREIGN FUND
PORTFOLIO MANAGERS' REPORT
| Average Annual Total Returns for the Periods Ended October 31, 2006 | |
| | | 1 Year | | Since Inception
of Class A
July 1, 2003 | | Since Inception
of Class B
July 8, 2003 | |
| Including Sales Charge: | |
| Class A(1) | | | 21.03 | % | | | 19.63 | % | | | — | | |
| Class B(2) | | | 22.40 | % | | | — | | | | 19.38 | % | |
| Class C(3) | | | 26.43 | % | | | — | | | | — | | |
| Class I | | | 28.67 | % | | | — | | | | — | | |
| Class Q | | | 28.47 | % | | | — | | | | — | | |
| Excluding Sales Charge: | |
| Class A | | | 28.39 | % | | | 21.77 | % | | | — | | |
| Class B | | | 27.40 | % | | | — | | | | 19.98 | % | |
| Class C | | | 27.43 | % | | | — | | | | — | | |
| Class I | | | 28.67 | % | | | — | | | | — | | |
| Class Q | | | 28.47 | % | | | — | | | | — | | |
| MSCI EAFE® Index(4) | | | 27.52 | % | | | 24.13 | % | | | 24.13 | %(5) | |
| Average Annual Total Returns for the Periods Ended October 31, 2006 | |
| | | Since Inception
of Class C
July 7, 2003 | | Since Inception
of Class I
September 8, 2003 | | Since Inception
of Class Q
July 10, 2003 | |
| Including Sales Charge: | |
| Class A(1) | | | — | | | | — | | | | — | | |
| Class B(2) | | | — | | | | — | | | | — | | |
| Class C(3) | | | 20.08 | % | | | — | | | | — | | |
| Class I | | | — | | | | 21.31 | % | | | — | | |
| Class Q | | | — | | | | — | | | | 21.48 | % | |
| Excluding Sales Charge: | |
| Class A | | | — | | | | — | | | | — | | |
| Class B | | | — | | | | — | | | | — | | |
| Class C | | | 20.08 | % | | | — | | | | — | | |
| Class I | | | — | | | | 21.31 | % | | | — | | |
| Class Q | | | — | | | | — | | | | 21.48 | % | |
| MSCI EAFE® Index(4) | | | 24.13 | %(5) | | | 23.67 | %(6) | | | 24.13 | %(5) | |
Based on a $10,000 initial investment, the graph and table above illustrate the total return of ING Foreign Fund against the index indicated. The index is unmanaged and has no cash in its portfolio, imposes no sales charge and incurs no operating expenses. An investor cannot invest directly in the index. The Fund's performance is shown both with and without the imposition of sales charges.
The graph and performance table do not reflect the deduction of taxes that a shareholder will pay on Fund distributions or the redemption of Fund shares.
The performance shown may include the effect of fee waivers and/or expense reimbursements by the Investment Adviser and/or other service providers, which have the effect of increasing total return. Had all fees and expenses been considered, the total returns would have been lower.
Performance data represents past performance and is no assurance of future results. Investment return and principal value of an investment in the Fund will fluctuate. Shares, when sold, may be worth more or less than their original cost. The Fund's current performance may be lower or higher than the performance data shown. Please log on to www.ingfunds.com or call (800) 992-0180 to get performance through the most recent month end.
It is important to note that the Fund has a limited operating history. Performance over a longer period of time may be more meaningful than short-term performance.
This report contains statements that may be "forward-looking" statements. Actual results may differ materially from those projected in the "forward-looking" statements.
The views expressed in this report reflect those of the portfolio managers, only through the end of the period as stated on the cover. The portfolio managers' views are subject to change at any time based on market and other conditions.
Fund holdings are subject to change daily.
(1) Reflects deduction of the maximum Class A sales charge of 5.75%.
(2) Reflects deduction of the Class B deferred sales charge of 5% and 3%, respectively, for the 1 year and since inception returns.
(3) Reflects deduction of the Class C deferred sales charge of 1% for the 1 year return.
(4) The MSCI EAFE® Index is an unmanaged index that measures the performance of securities listed on exchanges in Europe, Australasia and the Far East. It includes the reinvestment of dividends net of withholding taxes, but does not reflect fees, brokerage commissions or other expenses of investing.
(5) Since inception performance for index is shown from July 1, 2003.
(6) Since inception performance for index is shown from September 1, 2003.
15
ING GREATER CHINA FUND
PORTFOLIO MANAGERS' REPORT
The ING Greater China Fund (the "Fund") seeks long-term capital appreciation. The Fund is managed by Nick Toovey, CFA, Bratin Sanyal, Oscar Leung Kin Fai, CFA and Michael Hon Lung Chiu, CFA, ING Investment Management Asia/Pacific (Hong Kong) Limited — the Sub-Adviser.
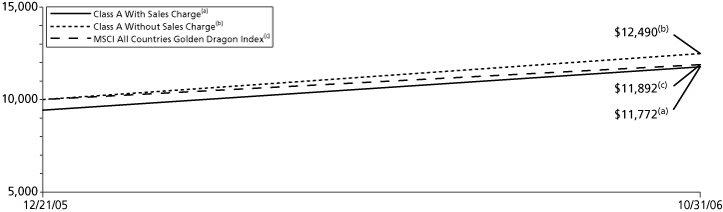
Performance: Since the Fund's inception on December 21, 2005 through October 31, 2006, the Fund's Class A shares, excluding sales charges, provided a total return of 24.90% compared to the Morgan Stanley Capital International ("MSCI") All Countries Golden Dragon Index, which returned 19.34% for the same period. The MSCI All Countries Golden Dragon Index is an aggregate of the MSCI Hong Kong Index, the MSCI China Free Index and the MSCI Taiwan Index.
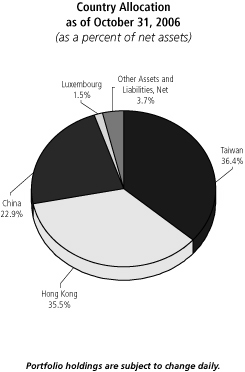
Portfolio Specifics: The Fund benefited from its overweight in China during the reporting period as China outperformed the region. China this year reported a strong set of macroeconomic figures with its gross domestic product ("GDP") growing more than 10% year over year for 3 prior quarters to September 30, 2006.
To moderate this growth, China's central bank, the People's Bank of China, raised interest rates by 0.27% in August, and also required that commercial banks increase their reserve ratio in order to dampen lending growth. As a result, economic growth in China started to moderate with money supply and fixed asset investment growth slowing down in the second half of 2006. With a rising trade surplus and a resilient export sector the Chinese government also allowed its currency, the renminbi, to appreciate more quickly against the U.S. dollar during the period.
In Hong Kong, GDP growth remained above 5% for the period. Local politics in Taiwan remained deadlocked in the second half of the year after the Pan-Blue Coalition parties failed to recall President Chen Shui-bian. Global headwinds in the technology sector also hurt the island's performance. GDP growth in Taiwan slowed from 6.4% for the year ending December 31, 2005 to 4.6% for the year ending June 30, 2006, due to a decline in consumer confidence.
An overweight position in Chinese real estate and good stock selection within the sector benefited the Fund. In particular, the overweight in China Overseas Land & Investment Ltd. was one of the major contributors to the portfolio. Likewise, an overweight in the Taiwan hardware and equipment sector helped raise the return on the Taiwan section of the portfolio. In particular, the overweight in Foxconn Technology contributed positively to performance. An overweight and good stock selection in the Hong Kong banks industry group including Bank of East Asia also generated outperformance.
The portfolio started to invest in the China A share market through warrants during the reporting period, with a net overweight position in China Merchants Bank 'A' share. The company benefited from the listing of its H share in Hong Kong and the overweight position added value to the portfolio.
By contrast, an underweight position in Chinese telecommunications acted as a drag, as the sector appreciated as companies such as China Mobile reported better-than-expected earnings. An overweight position in some personal computer related technology companies such as Lite-On Technology also hurt the Fund.
Current Strategy and Outlook: Uncertainties regarding the sustainability of China's economic growth remain, although the overall sentiment towards Chinese stocks has improved recently. Macroeconomic numbers such as fixed asset investment and industrial production growth have further moderated recently, which may ease investor's concerns about economic overheating. The continuous appreciation of the renminbi and the increase in quotas are likely to help Hong Kong-listed Chinese shares.
Export growth in both China and Hong Kong remain strong. Domestic consumption confidence in Hong Kong is steady, supported by stable asset prices and improving employment conditions. In Taiwan, the continuous political struggle between the country's President Chen and opposition parties has impacted domestic consumer sentiment. Nevertheless, we believe the long-term outlook for Taiwan is positive, especially if the current political deadlock comes to some form of resolution. We maintain a neutral outlook on Taiwan and await further clarity of the country's political environment.
Top Ten Industries
as of October 31, 2006
(as a percent of net assets)
| Real Estate | | | 15.9 | % | |
| Banks | | | 13.2 | % | |
| Semiconductors | | | 11.4 | % | |
| Diversified Financial Services | | | 7.0 | % | |
| Insurance | | | 7.0 | % | |
| Computers | | | 6.6 | % | |
| Telecommunications | | | 6.5 | % | |
| Electronics | | | 5.8 | % | |
| Oil & Gas | | | 4.5 | % | |
| Holding Companies - Diversified | | | 3.6 | % | |
Portfolio holdings are subject to change daily.
16
ING GREATER CHINA FUND
PORTFOLIO MANAGERS' REPORT
| Cumulative Total Returns for the Periods Ended October 31, 2006 | |
| | | Since Inception
of Class A
December 21, 2005 | | Since Inception
of Class B
January 6, 2006 | | Since Inception
of Class C
January 11, 2006 | | Since Inception
of Class I
May 8, 2006 | |
| Including Sales Charge: | |
| Class A(1) | | | 17.72 | % | | | — | | | | — | | | | — | | |
| Class B(2) | | | — | | | | 12.17 | % | | | — | | | | — | | |
| Class C(3) | | | — | | | | — | | | | 15.49 | % | | | — | | |
| Class I | | | — | | | | — | | | | — | | | | (2.65 | )% | |
| Excluding Sales Charge: | |
| Class A | | | 24.90 | % | | | — | | | | — | | | | — | | |
| Class B | | | — | | | | 17.17 | % | | | — | | | | — | | |
| Class C | | | — | | | | — | | | | 16.49 | % | | | — | | |
| Class I | | | — | | | | — | | | | — | | | | (2.65 | )% | |
| MSCI All Countries Golden Dragon Index(4) | | | 18.92 | %(5) | | | 18.92 | %(5) | | | 18.92 | %(5) | | | 2.07 | %(6) | |
Based on a $10,000 initial investment, the graph and table above illustrate the total return of ING Greater China Fund against the index indicated. The index is unmanaged and has no cash in its portfolio, imposes no sales charge and incurs no operating expenses. An investor cannot invest directly in the index. The Fund's performance is shown both with and without the imposition of sales charges.
The graph and performance table do not reflect the deduction of taxes that a shareholder will pay on Fund distributions or the redemption of Fund shares.
The performance shown may include the effect of fee waivers and/or expense reimbursements by the Investment Adviser and/or other service providers, which have the effect of increasing total return. Had all fees and expenses been considered, the total returns would have been lower.
Performance data represents past performance and is no assurance of future results. Investment return and principal value of an investment in the Fund will fluctuate. Shares, when sold, may be worth more or less than their original cost. The Fund's current performance may be lower or higher than the performance data shown. Please log on to www.ingfunds.com or call (800) 992-0180 to get performance through the most recent month end.
It is important to note that the Fund has a limited operating history. Performance over a longer period of time may be more meaningful than short-term performance.
This report contains statements that may be "forward-looking" statements. Actual results may differ materially from those projected in the "forward-looking" statements.
The views expressed in this report reflect those of the portfolio managers, only through the end of the period as stated on the cover. The portfolio managers' views are subject to change at any time based on market and other conditions.
Fund holdings are subject to change daily.
(1) Reflects deduction of the maximum Class A sales charge of 5.75%.
(2) Reflects deduction of the Class B deferred sales charge of 5%.
(3) Reflects deduction of the Class C deferred sales charge of 1%.
(4) The MSCI All Countries Golden Dragon Index is a broad-based, unmanaged index of common stocks traded in China, Hong Kong and Taiwan.
(5) Since inception performance for the index is shown from January 1, 2006.
(6) Since inception performance for the index is shown from May 1, 2006.
17
ING INDEX PLUS INTERNATIONAL EQUITY FUND
PORTFOLIO MANAGERS' REPORT
The ING Index Plus International Equity Fund (the "Fund") seeks to outperform the total return performance of the Morgan Stanley Capital International Europe, Australasia and Far East® Index ("MSCI EAFE®" Index) while maintaing a market level of risk. The Fund is managed by Carl Ghielen and Martin Jansen, Portfolio Managers, at ING Investment Management Advisors B.V. — the Sub-Adviser.
Performance: Since the Fund's inception on December 21, 2005 through October 31, 2006, the Fund's Class A shares, excluding sales charges, provided a total return of 16.80% compared to the MSCI EAFE® Index, which returned 19.39% for the same period.
Portfolio Specifics: The Fund's strategy is designed to add value to the MSCI EAFE® benchmark through bottom-up security selection on the basis of customized sector models, while maintaining approximate benchmark weights of countries/regions, sectors and industries represented in the benchmark. The active risk is substantially controlled by the relatively large number of securities in the portfolio (between 300 and 400). As a first step, the best ranked 200 stocks are selected for inclusion across countries, sectors and industries. To ensure that appropriate MSCI EAFE® weights and an index-like profile are maintained, an additional 140-230 of the next most attractive securities are added. The Fund is rebalanced monthly to preserve the desired tilt to stocks ranking well in the models, while maintaining benchmark-like characteri stics.
The Fund underperformed its benchmark during the period. Apart from the negative impact of residual cash in a strongly rising market, this underperformance was mostly due to security selection. The predictive power of the individual factors included in the models substantially determines stock selection in each sector and country/region. The models generally worked well in selecting stocks in Europe and Asia Pacific ex-Japan, but acted as a drag in Japan.
During the period, positions within financials had the largest negative impact, largely due to the factor measuring change in return on invested capital. Japanese consumer finance stock Aiful acted as the biggest drag. The earnings and cash flow variables used in the health care sector also hurt the Fund, as did the earnings momentum and price reversal factors in the consumer discretionary services sub-sector.
By comparison, the Fund's ranking model in materials proved especially effective as earnings, cash flow and dividend-yield factors contributed to performance. European steel producers ThyssenKrupp AG (Germany) and Arcelor (Luxembourg) were notable individual contributors. Successful selection in the utility sector was driven by the Earnings before Interest, Tax, Depreciation, and Amortisation/Enterprise Value ("EBITDA/EV") and Enterprise Value/Earnings Before Income and Tax ("EV/EBIT") factors in the model.
Current Strategy and Outlook: By design, the Fund maintains weights approximate to its benchmark and stock selection is a function of the sector/industry ranking models. Portfolio construction and risk controls are utilized to seek to ensure the Fund's characteristics are within an acceptable band around the benchmark. The Fund may have individual positions up to 1.00% greater than the benchmark, while, for risk control purposes, the maximum allowable underweight per security is 0.50%. Within this context, the Fund currently has a modest tilt towards lower-valuation and smaller-capitalization stocks and has a modest focus on stocks linked primarily to local economies. The current portfolio of stocks generated an historic earnings growth similar to the MSCI EAFE®, and carries a similar dividend yield.
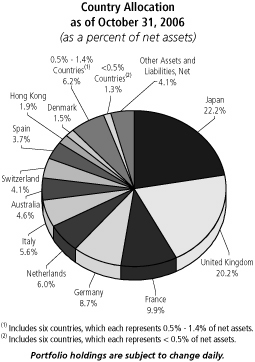
Top Ten Industries
as of October 31, 2006
(as a percent of net assets)
| Banks | | | 19.2 | % | |
| Oil & Gas | | | 6.9 | % | |
| Telecommunications | | | 6.8 | % | |
| Pharmaceuticals | | | 6.0 | % | |
| Electric | | | 4.6 | % | |
| Insurance | | | 4.6 | % | |
| Iron/Steel | | | 4.0 | % | |
| Food | | | 3.9 | % | |
| Retail | | | 3.6 | % | |
| Auto Manufacturers | | | 3.3 | % | |
Portfolio holdings are subject to change daily.
18
ING INDEX PLUS INTERNATIONAL EQUITY FUND
PORTFOLIO MANAGERS' REPORT
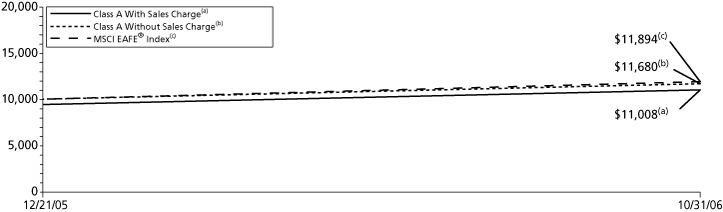
| Cumulative Total Returns for the Periods Ended October 31, 2006 | |
| | | Since Inception
of Class A & I
December 21, 2005 | | Since Inception
of Class B & C
January 12, 2006 | |
| Including Sales Charge: | |
| Class A(1) | | | 10.08 | % | | | — | | |
| Class B(2) | | | — | | | | 6.51 | % | |
| Class C(3) | | | — | | | | 10.31 | % | |
| Class I | | | 17.00 | % | | | — | | |
| Excluding Sales Charge: | |
| Class A | | | 16.80 | % | | | — | | |
| Class B | | | — | | | | 11.51 | % | |
| Class C | | | — | | | | 11.31 | % | |
| Class I | | | 17.00 | % | | | — | | |
| MSCI EAFE® Index(4) | | | 18.94 | %(5) | | | 18.94 | %(5) | |
Based on a $10,000 initial investment, the graph and table above illustrate the total return of ING Index Plus International Equity Fund against the index indicated. The index is unmanaged and has no cash in its portfolio, imposes no sales charge and incurs no operating expenses. An investor cannot invest directly in the index. The Fund's performance is shown both with and without the imposition of sales charges.
The graph and performance table do not reflect the deduction of taxes that a shareholder will pay on Fund distributions or the redemption of Fund shares.
The performance shown may include the effect of fee waivers and/or expense reimbursements by the Investment Adviser and/or other service providers, which have the effect of increasing total return. Had all fees and expenses been considered, the total returns would have been lower.
Performance data represents past performance and is no assurance of future results. Investment return and principal value of an investment in the Fund will fluctuate. Shares, when sold, may be worth more or less than their original cost. The Fund's current performance may be lower or higher than the performance data shown. Please log on to www.ingfunds.com or call (800) 992-0180 to get performance through the most recent month end.
It is important to note that the Fund has a limited operating history. Performance over a longer period of time may be more meaningful than short-term performance.
This report contains statements that may be "forward-looking" statements. Actual results may differ materially from those projected in the "forward-looking" statements.
The views expressed in this report reflect those of the portfolio managers, only through the end of the period as stated on the cover. The portfolio managers' views are subject to change at any time based on market and other conditions.
Fund holdings are subject to change daily.
(1) Reflects deduction of the maximum Class A sales charge of 5.75%.
(2) Reflects deduction of the Class B deferred sales charge of 5%.
(3) Reflects deduction of the Class C deferred sales charge of 1% for the 1 year return.
(4) The MSCI EAFE® Index is an unmanaged index that measures the performance of securities listed on exchanges in markets in Europe, Australasia and the Far East. It includes the reinvestment of dividends net of withholding taxes, but does not reflect fees, brokerage commissions or other expenses of investing.
(5) Since inception performance for the index is shown from January 1, 2006.
19
ING INTERNATIONAL FUND
PORTFOLIO MANAGERS' REPORT
The ING International Fund (the "Fund") seeks long-term growth of capital through investment in equity securities and equity equivalents of companies outside the U.S. The Fund was managed by Philip A. Schwartz, CFA and Richard T. Saler, through April 28, 2006 at which time Uri Landesman, Senior Vice President and Head of International Equity became responsible for the day-to-day management for the Fund — ING Investment Management Co. — the Sub-Adviser.
Performance: For the year ended October 31, 2006, the Fund's Class A shares, excluding sales charges, provided a total return of 22.12% compared to the Morgan Stanley Capital International — Europe, Australasia and Far East® Growth Index ("MSCI EAFE® Growth Index") and the Morgan Stanley Capital International — Europe, Australasia and Far East® Index ("MSCI EAFE® Index") which returned 24.04% and 27.52%, respectively for the same period.
Portfolio Specifics: The first half of the reporting period saw both business and investor confidence rising in Europe and Japan, resulting in improved economic prospects reflected in a strong advance of cyclically sensitive sectors. Regional positioning proved successful, with the Fund benefiting from an allocation to emerging markets stocks. A move from an underweight of Developed Asia to a modest overweight position added to performance, as did an underweight position in Europe. Stock selection was particularly beneficial within Developed Asia and Japan during the first half of the reporting period. While the sector strategy reacted negatively, the Fund was helped by successful stock selection in financials and telecom services. This result was offset, however, by an underweight position in industrials. Health care, energy and utilities acted as the bigg est drag on performance.
As of May 1, 2006, Uri Landesman began managing the portfolio. He restructured the portfolio and adopted a large-cap growth investment tilt in line with the MSCI EAFE® Growth Index. The second half of the reporting period was more volatile, with May and June experiencing a sharp sell-off in what the market perceived to be riskier assets, particularly emerging markets. However, markets seemed to stabilize after this period. Value was added in the second half of the reporting period by an underweight position in Japan, while an underweight European position hurt the Fund. Stock selection in Europe was particularly successful. This was partially offset by a negative stock selection in Japan and Developed Asia.
On a sector basis, holdings in industrials and consumer staples added significantly to the Fund's value, as did health care and materials stocks, while consumer discretionary, energy and financials stocks negatively impacted the Fund.
Sector allocation also hurt the Fund as an overweight in information technology and overweight financials position acted as a drag. By contrast, underweight positions in industrials and energy contributed positively.
On an individual security basis, Anglo American, a global natural resource company domiciled in the UK, benefited the Fund as copper and zinc prices reached record levels. Sweden's Nordea Bank also helped as the company announced higher profits and a dividend increase.
By comparison, Japanese financial company Mitsubishi UFJ Financial Group hurt the Fund in a weak Asian banking sector. Another notable negative contributor was Solomon Systech International, a Hong Kong semiconductor company, after increased competition capped its future growth prospects.
Current Strategy and Outlook: The portfolio manager utilizes two screens to rank stocks in their investable universe. One compares all the stocks in the universe on their individual merits, while the other compares stocks in each country. The fundamental research team focuses on names which we believe are appearing in the first three deciles of both screens. The portfolio maintains holdings in emerging markets, based on superior growth prospects. We maintain an overweight position in information technology and are underweight energy and utilities. While we consider the market backdrop to be positive, we do expect greater volatility in the months ahead.
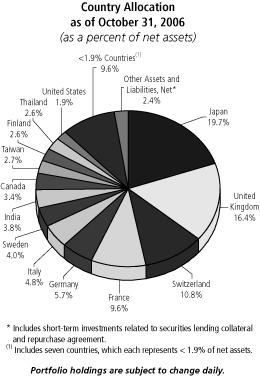
Top Ten Industries
as of October 31, 2006
(as a percent of net assets)
| Banks | | | 13.5 | % | |
| Pharmaceuticals | | | 10.3 | % | |
| Mining | | | 8.9 | % | |
| Insurance | | | 5.2 | % | |
| Real Estate | | | 4.7 | % | |
| Machinery - Diversified | | | 4.3 | % | |
| Agriculture | | | 3.9 | % | |
| Food | | | 3.8 | % | |
| Beverages | | | 3.6 | % | |
| Diversified Financial Services | | | 3.1 | % | |
Portfolio holdings are subject to change daily.
20
ING INTERNATIONAL FUND
PORTFOLIO MANAGERS' REPORT
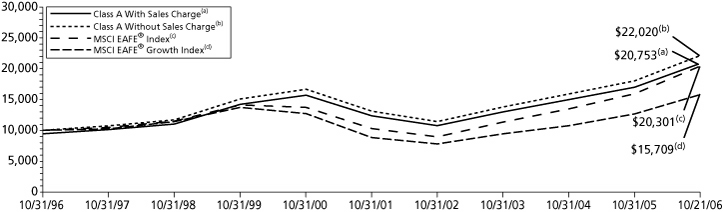
| Average Annual Total Returns for the Periods Ended October 31, 2006 | |
| | | 1 Year | | 5 Year | | 10 Year | | Since Inception
of Class B
August 22, 2000 | |
| Including Sales Charge: | |
| Class A(1) | | | 15.09 | % | | | 9.65 | % | | | 7.57 | % | | | — | | |
| Class B(2) | | | 16.23 | % | | | 9.58 | % | | | — | | | | 2.16 | % | |
| Class C(3) | | | 20.25 | % | | | 9.88 | % | | | — | | | | — | | |
| Class I | | | 22.56 | % | | | — | | | | — | | | | — | | |
| Class Q | | | 22.38 | % | | | 10.93 | % | | | — | | | | — | | |
| Excluding Sales Charge: | |
| Class A | | | 22.12 | % | | | 10.94 | % | | | 8.21 | % | | | — | | |
| Class B | | | 21.23 | % | | | 9.86 | % | | | — | | | | 2.16 | % | |
| Class C | | | 21.25 | % | | | 9.88 | % | | | — | | | | — | | |
| Class I | | | 22.56 | % | | | — | | | | — | | | | — | | |
| Class Q | | | 22.38 | % | | | 10.93 | % | | | — | | | | — | | |
| MSCI EAFE® Growth Index(4) | | | 24.04 | % | | | 12.26 | % | | | 4.62 | % | | | 1.56 | %(5) | |
| MSCI EAFE® Index(8) | | | 27.52 | % | | | 14.56 | % | | | 7.34 | % | | | 5.31 | %(5) | |
| Average Annual Total Returns for the Periods Ended October 31, 2006 | |
| | | Since Inception
of Class C
September 15, 2000 | | Since Inception
of Class Q
February 26, 2001 | | Since Inception
of Class I
January 15, 2002 | |
| Including Sales Charge: | |
| Class A(1) | | | — | | | | — | | | | — | | |
| Class B(2) | | | — | | | | — | | | | — | | |
| Class C(3) | | | 3.03 | % | | | — | | | | — | | |
| Class I | | | — | | | | — | | | | 11.25 | % | |
| Class Q | | | — | | | | 5.79 | % | | | — | | |
| Excluding Sales Charge: | |
| Class A | | | — | | | | — | | | | — | | |
| Class B | | | — | | | | — | | | | — | | |
| Class C | | | 3.03 | % | | | — | | | | — | | |
| Class I | | | — | | | | — | | | | 11.25 | % | |
| Class Q | | | — | | | | 5.79 | % | | | — | | |
| MSCI EAFE® Growth Index(4) | | | 1.56 | %(5) | | | 6.37 | %(6) | | | 11.41 | %(7) | |
| MSCI EAFE® Index(8) | | | 5.31 | %(5) | | | 8.74 | %(6) | | | 14.10 | %(7) | |
Based on a $10,000 initial investment, the graph and table above illustrate the total return of ING International Fund against the index indicated. The index is unmanaged and has no cash in its portfolio, imposes no sales charge and incurs no operating expenses. An investor cannot invest directly in the index. The Fund's performance is shown both with and without the imposition of sales charges.
The graph and performance table do not reflect the deduction of taxes that a shareholder will pay on Fund distributions or the redemption of Fund shares.
The performance shown may include the effect of fee waivers and/or expense reimbursements by the Investment Adviser and/or other service providers, which have the effect of increasing total return. Had all fees and expenses been considered, the total returns would have been lower.
Performance data represents past performance and is no assurance of future results. Investment return and principal value of an investment in the Fund will fluctuate. Shares, when sold, may be worth more or less than their original cost. The Fund's current performance may be lower or higher than the performance data shown. Please log on to www.ingfunds.com or call (800) 992-0180 to get performance through the most recent month end.
This report contains statements that may be "forward-looking" statements. Actual results may differ materially from those projected in the "forward-looking" statements.
The views expressed in this report reflect those of the portfolio managers, only through the end of the period as stated on the cover. The portfolio managers' views are subject to change at any time based on market and other conditions.
Fund holdings are subject to change daily.
(1) Reflects deduction of the maximum Class A sales charge of 5.75%.
(2) Reflects deduction of the Class B deferred sales charge of 5% and 1%, respectively, for the 1 year and since inception returns.
(3) Reflects deduction of the Class C deferred sales charge of 1% for the 1 year return.
(4) The MSCI EAFE® Growth Index is an unmanaged index that measures the performance in 20 countries within Europe, Australasia and the Far East with a greater-than-average growth orientation. The MSCI EAFE® Growth Index more closely tracks the types of securities in which the Fund invests than the MSCI EAFE® Index.
(5) Since inception performance for the index is shown from September 1, 2000.
(6) Since inception performance for the index is shown from March 1, 2001.
(7) Since inception performance for the index is shown from January 1, 2002.
(8) The MSCI EAFE® Index is an unmanaged index that measures the performance of securities listed on exchanges in markets in Europe, Australasia and the Far East. It includes the reinvestment of dividends net of withholding taxes, but does not reflect fees, brokerage commissions or other expenses of investing.
Prior to July 26, 2000, the Fund was advised by a different sub-adviser.
21
ING INTERNATIONAL CAPITAL APPRECIATION FUND
PORTFOLIO MANAGERS' REPORT
The ING International Capital Appreciation Fund (the "Fund") seeks capital appreciation. The Fund is managed by a team of investment professionals led by Thomas R.H. Tibbles, CFA, Barry A. Lockhart, CFA, Trevor Graham, CFA, and Patrick Tan, Hansberger Global Investors, Inc. — the Sub-Adviser.
The Fund invests in industry leaders that we believe have the ability to generate sustainable earnings growth. Our analytical resources are dedicated to those companies that have demonstrated sustainable competitive advantages in their industries.
Performance: Since the Fund's inception on December 21, 2005 through October 31, 2006, the Fund's Class A shares, excluding sales charges, provided a total return of 13.90% compared to the Morgan Stanley Capital International All Country World ex-U.S. Index ("MSCI ACWI ex US Index"), which returned 18.77% for the same period.
Portfolio Specifics: Since the Fund's inception in late 2005, it has been a period of positive equity performance. All regions and sectors within the MSCI ACWI ex US Index have posted positive returns, with Europe and the Pacific Ex-Japan regions being especially strong while the Japanese region has trailed. From a sector perspective, defensive areas such as utilities and consumer staples have been strong performing sectors, along with the more economically sensitive sectors such as materials.
Within the Fund itself, all sectors and major regions have posted positive returns over the period under review. On an absolute and relative basis the Pacific Ex-Japan region has been the Fund's best performing region, primarily reflective of strong security selection (e.g., Foxconn International Holdings +58.1% and Esprit +33.9%), and the Fund's overweight to this strong performing region. Though absolute performance in Europe has been strong (+21.8%), on a relative basis, it has been one of the main detractors from relative performance driven primarily from negative security selection (e.g., SES Global -2.3% and Carnival -0.2%). The Fund's underweight to Japan has also been additive to performance during the period since the region has been by far the weakest performing region, although this was mostly offset by unfavorable stock selection.
All economic sectors have provided positive absolute performance. Positive stock selection was recorded in six of the ten sectors, more than offset however by being underweight in the strong materials, telecommunications and utilities sectors and overweight in the weak technology sector. Examples of sectors with favorable stock selection were consumer staples (e.g., Tesco +36.1%), and information technology (e.g., Infosys +43.0%). Examples of sectors with adverse stock selection were healthcare (e.g., Teva approximately -24.8%) and materials (e.g., Nitto Denko approximately -23.3%). Given that the Fund was established during a period of strong equity market performance, cash contributions have had a significant negative impact on performance.
Current Strategy and Outlook: From an overall perspective, it is our opinion that the risk/return profile of equities remains positive over the foreseeable future. Our research leads us to believe that equity valuations remain compelling, given the strong recovery in global corporate profitability and modest global growth outlook combined with low inflation. According to our internal research, Europe has now overtaken the U.S. and Japan from a cyclical profitability perspective, which bodes well for the Fund's relative overweight in this region, particularly at the expense of Japan. Japan has recovered to what we consider a more "normal" economic level of corporate profitability, however the potential future risks include fiscal tightening, a rising yen and possible regional political instability. The Fund's management team has logged many flight hours in 2 006 to countries such as China, Russia, Korea, Japan, the U.K. and France in constant watch of our high quality universe of companies, in order to take advantage of opportunities to add stocks of these companies to the Fund at reasonable valuation levels.
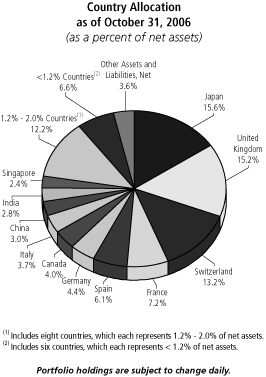
Top Ten Industries
as of October 31, 2006
(as a percent of net assets)
| Banks | | | 17.9 | % | |
| Oil & Gas | | | 6.1 | % | |
| Pharmaceuticals | | | 5.6 | % | |
| Hand/Machine Tools | | | 4.3 | % | |
| Telecommunications | | | 4.3 | % | |
| Semiconductors | | | 3.8 | % | |
| Chemicals | | | 3.7 | % | |
| Electrical Components & Equipment | | | 3.7 | % | |
| Insurance | | | 3.5 | % | |
| Auto Parts & Equipment | | | 3.1 | % | |
Portfolio holdings are subject to change daily.
22
ING INTERNATIONAL CAPITAL APPRECIATION FUND
PORTFOLIO MANAGERS' REPORT
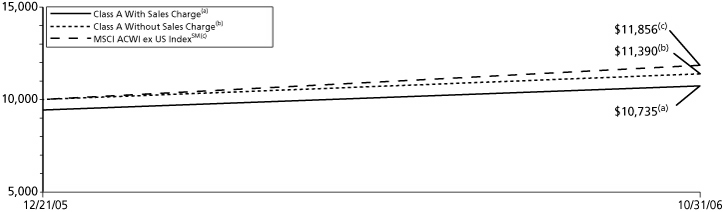
| Cumulative Total Returns for the Periods Ended October 31, 2006 | |
| | | Since Inception
of Class A & I
December 21, 2005 | | Since Inception
of Class B
January 9, 2006 | | Since Inception
of Class C
January 24, 2006 | |
| Including Sales Charge: | |
| Class A(1) | | | 7.35 | % | | | — | | | | — | | |
| Class B(2) | | | — | | | | 3.73 | % | | | — | | |
| Class C(3) | | | — | | | | — | | | | 9.31 | % | |
| Class I | | | 14.30 | % | | | — | | | | — | | |
| Excluding Sales Charge: | |
| Class A | | | 13.90 | % | | | — | | | | — | | |
| Class B | | | — | | | | 8.73 | % | | | — | | |
| Class C | | | — | | | | — | | | | 10.31 | % | |
| Class I | | | 14.30 | % | | | — | | | | — | | |
| MSCI ACWI ex US IndexSM(4) | | | 18.56 | %(5) | | | 18.56 | %(5) | | | 10.85 | %(6) | |
Based on a $10,000 initial investment, the graph and table above illustrate the total return of ING International Capital Appreciation Fund against the index indicated. The index is unmanaged and has no cash in its portfolio, imposes no sales charge and incurs no operating expenses. An investor cannot invest directly in the index. The Fund's performance is shown both with and without the imposition of sales charges.
The graph and performance table do not reflect the deduction of taxes that a shareholder will pay on Fund distributions or the redemption of Fund shares.
The performance shown may include the effect of fee waivers and/or expense reimbursements by the Investment Adviser and/or other service providers, which have the effect of increasing total return. Had all fees and expenses been considered, the total returns would have been lower.
Performance data represents past performance and is no assurance of future results. Investment return and principal value of an investment in the Fund will fluctuate. Shares, when sold, may be worth more or less than their original cost. The Fund's current performance may be lower or higher than the performance data shown. Please log on to www.ingfunds.com or call (800) 992-0180 to get performance through the most recent month end.
It is important to note that the Fund has a limited operating history. Performance over a longer period of time may be more meaningful than short-term performance.
This report contains statements that may be "forward-looking" statements. Actual results may differ materially from those projected in the "forward-looking" statements.
The views expressed in this report reflect those of the portfolio managers, only through the end of the period as stated on the cover. The portfolio managers' views are subject to change at any time based on market and other conditions.
Fund holdings are subject to change daily.
(1) Reflects deduction of the maximum Class A sales charge of 5.75%.
(2) Reflects deduction of the Class B deferred sales charge of 5%.
(3) Reflects deduction of the Class C deferred sales charge of 1% for the since inception return.
(4) The MSCI ACWI ex US IndexSM measures the returns of equities of companies which are domiciled outside the U.S. It includes the reinvestment of dividends net of withholding taxes, but does not reflect fees, brokerage commissions or other expenses of investing.
(5) Since inception performance for the index is shown from January 1, 2006.
(6) Since inception performance for the index is shown from February 1, 2006.
23
ING INTERNATIONAL REAL ESTATE FUND
PORTFOLIO MANAGERS' REPORT
The ING International Real Estate Fund (the "Fund") seeks to provide investors with high total return. The Fund is managed by T. Ritson Ferguson, Chief Investment Officer, CFA and Steven D. Burton, Managing Director, CFA, Portfolio Managers, ING Clarion Real Estate Securities L.P. — the Sub-Adviser.
Performance: For the period from February 28, 2006, the Fund's inception, through October 31, 2006, the Fund's Class A shares, excluding sales charges, provided a total return of 16.94% compared to the Standard & Poor's/Citigroup World Property Index ex-U.S. ("S&P/Citigroup World Property Index, ex US") which returned 19.69% for the same period.
Portfolio Specifics: By region, Europe was the strongest performer over this time period (inception date of the Fund through October 31, 2006) with up 28.3% total return followed by the Asia-Pacific region up 15.1%. Within Europe, the United Kingdom property stocks were up 30.6% versus property stocks in Europe which were up 26.6%. Under-performance versus the benchmark was generated primarily by cash drag and an underweight in the Spanish property companies which were up 63.1% over this time period. The Spanish property companies benefited from a wave of consolidation which saw a number of takeover announcements of existing listed companies at sharp premiums to trading prices prior to the announcements. The Fund's underweight in Spain caused relative under-performance as a result despite investment positions in some of the companies which were taken privat e, including Inmobiliaria Colonial (Barcelona-based office company) and Parquesol Inmobiliaria, a diversified company engaged in the residential, office and retail property types. Bright spots included stock picking in Japan, Hong Kong and Canada, including overweights in Tokyo-based office/condominium company Sumitomo Realty, China residential developers Guangzhou R&F Properties and Agile Property Holdings, and Summit Real Estate Invest Trust ("REIT") (a Canadian warehouse company), all of which out-performed. Global themes for the period included continued yield compression, mergers and acquisitions activity, syndicate activity (new companies being formed or existing companies raising new equity) and improving property fundamentals. The strongest performers for the period were Spain up 63.1%, Singapore up 37.2%, France up 34.8% and the U.K. up 30.6%, all of which are seeing improvements in property fundamentals, especially in the office sector which is showing a combination of higher rents and lower va cancies. Property stocks in the United Kingdom are additionally benefiting from the anticipation of the introduction of the REIT structure beginning January 1, 2007. Many of the major U.K. listed property companies have announced an intention to convert to a REIT structure next year which should generally cause dividend levels to be increased by those companies that are converting.
Current Strategy and Outlook: International property companies continue to benefit from a combination of improving property fundamentals, yield compression and M&A activity, all of which have underpinned strong performance over the past year and which we believe should continue to serve as positive factors looking forward. Investment themes include investing in higher growth regions of the world, including the Asia-Pacific rim, and looking for opportunities in select markets which are currently under-represented in the listed markets but which show strong property fundamentals. By property type, the Fund strategy will attempt to benefit from generally improving property conditions globally, including the office sector which is generally firming in major markets around the world. Through an average 2% — 3% dividend yield plus 6% to 9% prospective an nual earnings growth, we believe international property stocks continue to be well-positioned to conservatively deliver attractive total returns over the next several years.
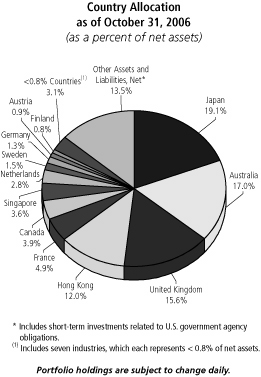
Top Five Industries*
as of October 31, 2006
(as a percent of net assets)
| Real Estate Operation/Development | | | 37.9 | % | |
| Property Trust | | | 16.1 | % | |
| Real Estate Management/Services | | | 11.5 | % | |
| REITS - Diversified | | | 9.0 | % | |
| REITS - Shopping Centers | | | 5.5 | % | |
* Excludes short-term investments related to U.S. government agency obligations.
Portfolio holdings are subject to change daily.
24
ING INTERNATIONAL REAL ESTATE FUND
PORTFOLIO MANAGERS' REPORT
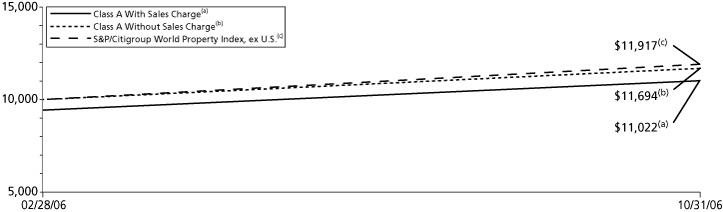
| Cumulative Total Returns for the Periods Ended October 31, 2006 | |
| | | Since Inception
of Classes, A, B, C & I
February 28, 2006 | |
| Including Sales Charge: | |
| Class A(1) | | | 10.22 | % | |
| Class B(2) | | | 11.38 | % | |
| Class C(3) | | | 15.31 | % | |
| Class I | | | 17.23 | % | |
| Excluding Sales Charge: | |
| Class A | | | 16.94 | % | |
| Class B | | | 16.38 | % | |
| Class C | | | 16.31 | % | |
| Class I | | | 17.23 | % | |
| S&P/Citigroup World Property Index, ex U.S.(4) | | | 19.17 | %(5) | |
Based on a $10,000 initial investment, the graph and table above illustrate the total return of ING International Real Estate Fund against the index indicated. The index is unmanaged and has no cash in its portfolio, imposes no sales charge and incurs no operating expenses. An investor cannot invest directly in the index. The Fund's performance is shown both with and without the imposition of sales charges.
The graph and performance table do not reflect the deduction of taxes that a shareholder will pay on Fund distributions or the redemption of Fund shares.
The performance shown may include the effect of fee waivers and/or expense reimbursements by the Investment Adviser and/or other service providers, which have the effect of increasing total return. Had all fees and expenses been considered, the total returns would have been lower.
Performance data represents past performance and is no assurance of future results. Investment return and principal value of an investment in the Fund will fluctuate. Shares, when sold, may be worth more or less than their original cost. The Fund's current performance may be lower or higher than the performance data shown. Please log on to www.ingfunds.com or call (800) 992-0180 to get performance through the most recent month end.
It is important to note that the Fund has a limited operating history. Performance over a longer period of time may be more meaningful than short-term performance.
This report contains statements that may be "forward-looking" statements. Actual results may differ materially from those projected in the "forward-looking" statements.
The views expressed in this report reflect those of the portfolio managers, only through the end of the period as stated on the cover. The portfolio managers' views are subject to change at any time based on market and other conditions.
Fund holdings are subject to change daily.
(1) Reflects deduction of the maximum Class A sales charge of 5.75%.
(2) Reflects deduction of the Class B deferred sales charge of 5% for the since inception return.
(3) Reflects deduction of the Class C deferred sales charge of 1% for the since inception return.
(4) The S&P/Citigroup World Property Index, ex U.S., is an unmanaged market-weighted total return index which consists of many companies from developed markets, excluding the United States, whose floats are larger than $100 million and derive more than half of their revenue from property-related activities.
(5) Since inception performance for the index is shown from March 1, 2006.
25
ING INTERNATIONAL SMALLCAP FUND
PORTFOLIO MANAGERS' REPORT
ING International Small Cap Fund (the "Fund") seeks maximum long-term capital appreciation. The Fund is managed by John Chisholm, CFA, Executive Vice President and Co-Chief Investment Officer and Matthew J. Cohen, CFA, Senior Vice President and Portfolio Manager, Acadian Asset Management, Inc. — the Sub-Adviser.
Performance: For the year ended October 31, 2006, the Fund's Class A shares, excluding sales charges, provided a total return of 25.91% compared to the Morgan Stanley Capital International — Europe, Australasia and Far East Small Cap Index ("MSCI EAFE® SmallCap Index"), which returned 23.41% for the same period.
Portfolio Specifics: Generally good stock selection more than offset unfavorable country positioning during the year ended October 31, 2006. In particular the following investments helped the Fund's performance.
Germany: Stock selection in this market was positive for return, driven by positions in steel producer Salzgitter and capital equipment holding SolarWorld. The overweighted country allocation also added to return, with the German market as a whole outpacing the benchmark notably as steady global demand yielded solid results for many companies.
Australia: Stock-level performance more than offset a smaller amount of value lost to an overweighted country allocation in Australia. Metals and mining firm Zinifex was the top contributor to active return, benefiting from the higher zinc prices that have resulted from continued pressure on already tight supplies.
China: The allocation to China was also a significant contributor to value added. Most successful for the Fund were positions in energy holding CNPC and Angang New Steel.
Japan: Stock selection combined successfully with an underweighted country positioning in Japan. Distributor Marubeni, electronics maker Fujikura and several holdings in the materials sector added notably to active return.
Switzerland: The Fund's Swiss stock selection also resulted in positive active return, although this was slightly offset by a small amount of value lost to underweighting the market. Driving stock-level performance was insurer Baloise, which rose notably amid acquisition speculation. Capital equipment holding Geberit was also a strong performer for the Fund.
The following investments detracted from the Fund's performance for the year ended October 31, 2006.
Sweden: An unsuccessful country underweight was costly for the Fund, as the Fund missed opportunities to add value with benchmark drivers that included materials holding Boliden and several stocks in the finance sector.
Norway: An underweighted allocation was also detrimental in Norway, with the lack of exposure to the energy sector costing the Fund notably.
United Kingdom: The Fund's underweighted position in the U.K. combined with a smaller amount of value lost to stock selection for a negative result in this market. Selections in the services sector and lack of positioning in finance were significant detractors.
Singapore: Stock-level performance in Singapore was negative for return, and combined with a smaller amount of value, lost to the market underweight.
Denmark: Stock selection was negative for return, offsetting a smaller amount of return to the overweighted market positioning. The Fund was underweighted in machinery maker NKT and trucking company DSV, which were the most costly positions for return during the period.
Current Strategy and Outlook: Country weightings are driven by bottom-up stock selection. The Fund is currently overweighted in Germany and the Netherlands and actively allocated to Canada, Turkey, Korea and China. Significant underweightings include the U.K., Sweden, Norway and Japan. Our bottom-up process has led the Fund to focus on materials, durables and energy stocks.
Looking ahead, the global equity market outlook is fairly quiet. Valuations have leveled off from a cap-weighted index perspective. Within individual markets we still are finding valuation spreads and other anomalies that support successful stock selection. Overall, however, we see global equity markets on a neutral track for the next three to six months as several key issues remain in flux, including the impact of recent interest rate increases on key economies, the housing market slowdown in the U.S. and the direction of oil prices. There may be some negative impact in the near term, but our longer-term view is that significant global economic growth will resume in late 2007 into 2008.
We are positive on many markets in Europe. Fundamentals are solid while key economies have maintained moderate growth activity. Earnings expectations in the banking, telecom and materials sectors are driving these forecasts. Our short-term forecast for Japan remains negative, but we expect to see moderate growth over the longer term. Despite volatility seen earlier this year, fundamentals and growth outlooks are favorable in many emerging markets.
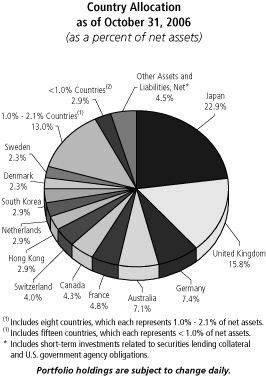
Top Ten Industries*
as of October 31, 2006
(as a percent of net assets)
| Diversified Financial Services | | | 7.6 | % | |
| Iron/Steel | | | 6.2 | % | |
| Real Estate | | | 5.0 | % | |
| Mining | | | 4.9 | % | |
| Oil & Gas | | | 4.6 | % | |
| Transportation | | | 4.5 | % | |
| Commercial Services | | | 4.4 | % | |
| Retail | | | 4.0 | % | |
| Insurance | | | 3.3 | % | |
| Semiconductors | | | 3.0 | % | |
* Excludes short-term investments related to U.S. government agency obligations and securities lending collateral.
Portfolio holdings are subject to change daily.
26
ING INTERNATIONAL SMALLCAP FUND
PORTFOLIO MANAGERS' REPORT
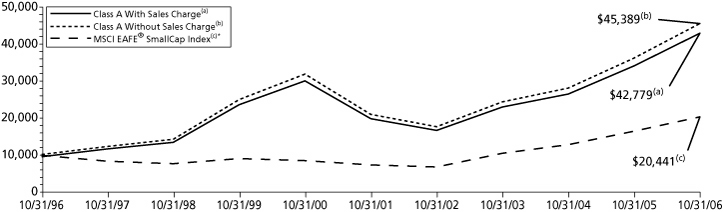
| Average Annual Total Returns for the Periods Ended October 31, 2006 | |
| | | 1 Year | | 5 Year | | 10 Year | | Since Inception
of Class I
December 21, 2005 | |
| Including Sales Charge: | |
| Class A(1) | | | 18.68 | % | | | 15.44 | % | | | 15.64 | % | | | — | | |
| Class B(2) | | | 20.10 | % | | | 15.84 | % | | | 15.62 | % | | | — | | |
| Class C(3) | | | 24.09 | % | | | 16.05 | % | | | 15.59 | % | | | — | | |
| Class I | | | — | | | | — | | | | — | | | | 16.51 | % | |
| Class Q | | | 26.14 | % | | | 17.13 | % | | | 16.63 | % | | | — | | |
| Excluding Sales Charge: | |
| Class A | | | 25.91 | % | | | 16.81 | % | | | 16.33 | % | | | — | | |
| Class B | | | 25.10 | % | | | 16.06 | % | | | 15.62 | % | | | — | | |
| Class C | | | 25.09 | % | | | 16.05 | % | | | 15.59 | % | | | — | | |
| Class I | | | — | | | | — | | | | — | | | | 16.51 | % | |
| Class Q | | | 26.14 | % | | | 17.13 | % | | | 16.63 | % | | | — | | |
| MSCI EAFE® SmallCap Index(4) | | | 23.41 | % | | | 22.45 | %(5) | | | 7.41 | % | | | 12.38 | %(6) | |
Based on a $10,000 initial investment, the graph and table above illustrate the total return of ING International SmallCap Fund against the index indicated. The index is unmanaged and has no cash in its portfolio, imposes no sales charge and incurs no operating expenses. An investor cannot invest directly in the index. The Fund's performance is shown both with and without the imposition of sales charges.
The graph and performance table do not reflect the deduction of taxes that a shareholder will pay on Fund distributions or the redemption of Fund shares.
The performance shown may include the effect of fee waivers and/or expense reimbursements by the Investment Adviser and/or other service providers, which have the effect of increasing total return. Had all fees and expenses been considered, the total returns would have been lower.
Performance data represents past performance and is no assurance of future results. Investment return and principal value of an investment in the Fund will fluctuate. Shares, when sold, may be worth more or less than their original cost. The Fund's current performance may be lower or higher than the performance data shown. Please log on to www.ingfunds.com or call (800) 992-0180 to get performance through the most recent month end.
This report contains statements that may be "forward-looking" statements. Actual results may differ materially from those projected in the "forward-looking" statements.
The views expressed in this report reflect those of the portfolio managers, only through the end of the period as stated on the cover. The portfolio managers' views are subject to change at any time based on market and other conditions.
Fund holdings are subject to change daily.
* Prior to October 31, 1998, the MSCI EAFE® SmallCap Index did not include the deduction of withholding taxes.
(1) Reflects deduction of the maximum Class A sales charge of 5.75%.
(2) Reflects deduction of the Class B deferred sales charge of 5% and 2%, respectively, for the 1 year and 5 year returns.
(3) Reflects deduction of the Class C deferred sales charge of 1% for the 1 year return.
(4) The MSCI EAFE® SmallCap Index is an unmanaged, market-weighted index that represents the smallcap segments in 21 developed equity markets outside of North America. It includes the reinvestment of dividends net of withholding taxes, but does not reflect fees, brokerage commissions or fees of investing.
(5) Net return for index is shown from November 1, 2000.
(6) Since inception performance for the index is shown from January 1, 2006.
Prior to March 1, 2005, the Fund was advised by a different sub-adviser.
27
ING INTERNATIONAL VALUE FUND
PORTFOLIO MANAGERS' REPORT
The ING International Value Fund (the "Fund") seeks maximum long-term capital appreciation. The Fund is managed by Brandes Investment Partners, L.P. ("Brandes"), the Sub-Adviser. Brandes' Large Cap Investment Committee, comprised of Glenn R. Carlson, CFA, Chief Executive Officer, Brent V. Woods, CFA, Managing Director, William Pickering, CFA, Director, Amelia Maccoun Morris, CFA, Director, Douglas C. Edman, CFA, Director — Investments W. James Brown, CFA, Directors Keith Colestock, CFA, Director and Brent Fredberg, Senior Analyst, is responsible for making the day-to-day investment decisions for the Fund.
Performance: For the year ended October 31, 2006, the Fund's Class A shares, excluding sales charges, provided a total return of 27.64% compared to the Morgan Stanley Capital International — Europe, Australasia and Far East® Index ("MSCI EAFE® Index"), which returned 27.52% for the same period.
Portfolio Specifics: Advances among the Fund's holdings in the commercial banks, food & staples retailing, and diversified telecom services industries had the most substantial impact on returns during the year ended October 31, 2006. Top-performing positions in these industries included Banca Intesa (Italy — commercial banks), WM Supermarkets (United Kingdom — food & staples retailing), and Portugal Telecom (Portugal — diversified telecom services). Other industries posting positive results included the insurance and electrical utilities industries, where positions such as Zurich Financial Services (Switzerland — insurance) and Electricite de France (France — electric utilities) experienced share price appreciation. Gains for holdings in the automobiles and multiline retail industries also contributed to positive relative p erformance.
Stock-specific declines for Fund holdings such as Nortel Networks (Canada — communications equipment) and Takefuji (Japan — consumer finance) weighed on results. Stock selection (as a result of our stock-specific investment process) and the Fund's overweighting in the diversified telecom services, communications equipment, and the electronics equipment & instruments industries relative to the MSCI EAFE® Index detracted from relative performance.
From a country perspective, gains for securities based in the United Kingdom, Japan and Germany made notable contributions to returns, including advances for Marks & Spencer (United Kingdom — multiline retail), Daiichi Sankyo (Japan — pharmaceuticals), and Volkswagen (Germany — automobiles). Holdings domiciled in the Netherlands also helped boost performance.
During the period, our company-specific research and analysis dictated a number of changes. We sold holdings as their prices climbed toward our estimates of their intrinsic values, including Mitsubishi Heavy Industries (Japan — machinery), Sumitomo Mitsui Financial Group (Japan), and Matsushita Electric Industrial (Japan — household durables).
We redeployed the proceeds from these sales into companies that we believe offer a greater margin of safety — or a larger difference between our estimate of their underlying value and their current stock price. Among the companies we purchased in the period were: United Microelectronics (Taiwan — semiconductors & semiconductor equipment), Electricite de France (France — electric utilities), and Compass Group (United Kingdom — hotels, restaurants, & leisure).
Current Strategy and Outlook: During the year ended October 31, 2006, the Fund's country and industry exposures shifted slightly due to stock-specific buying and selling, as well as changes in the prices of holdings. For example, exposure to France and the food & staples retailing industry increased, while exposure to Japan and the commercial banks tended to decline. (Keep in mind that the Fund's weightings for industries and countries are not the product of "top-down" forecasts or opinions, but merely stem from our company-by-company search for compelling investment opportunities in markets around the world.)
Overall, while we offer no predictions regarding the short-term direction of international equity markets, we believe the Fund remains well positioned to deliver favorable long-term results. We acknowledge that many of the Fund's current holdings recently have posted significant gains. However, we believe that all holdings remain undervalued, and we expect them to realize appreciation as the market recognizes their true worth.
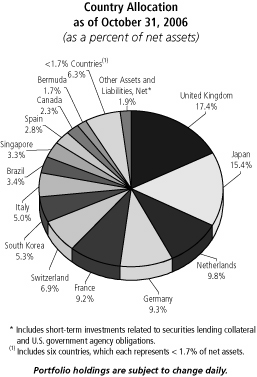
Top Ten Industries
as of October 31, 2006
(as a percent of net assets)
| Telecommunications | | | 26.1 | % | |
| Food | | | 16.0 | % | |
| Banks | | | 8.7 | % | |
| Insurance | | | 7.6 | % | |
| Pharmaceuticals | | | 7.2 | % | |
| Electric | | | 5.4 | % | |
| Auto Manufacturers | | | 4.7 | % | |
| Miscellaneous Manufacturing | | | 4.2 | % | |
| Media | | | 3.4 | % | |
| Electrical Components & Equipment | | | 2.9 | % | |
Portfolio holdings are subject to change daily.
28
ING INTERNATIONAL VALUE FUND
PORTFOLIO MANAGERS' REPORT
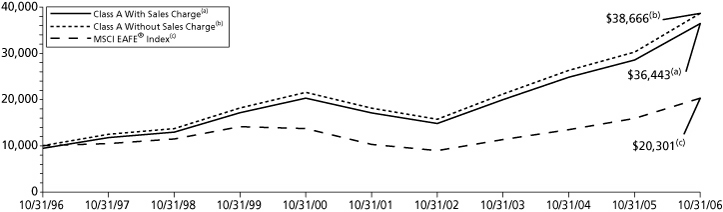
| Average Annual Total Returns for the Periods Ended October 31, 2006 | |
| | | 1 Year | | 5 Year | | 10 Year | |
| Including Sales Charge: | |
| Class A(1) | | | 20.29 | % | | | 14.99 | % | | | 13.80 | % | |
| Class B(2) | | | 21.81 | % | | | 15.33 | % | | | — | | |
| Class C(3) | | | 25.71 | % | | | 15.55 | % | | | 13.69 | % | |
| Class I | | | 28.15 | % | | | 16.83 | % | | | — | | |
| Class Q | | | 27.82 | % | | | 16.57 | % | | | — | | |
| Excluding Sales Charge: | |
| Class A | | | 27.64 | % | | | 16.35 | % | | | 14.47 | % | |
| Class B | | | 26.81 | % | | | 15.56 | % | | | — | | |
| Class C | | | 26.71 | % | | | 15.55 | % | | | 13.69 | % | |
| Class I | | | 28.15 | % | | | 16.83 | % | | | — | | |
| Class Q | | | 27.82 | % | | | 16.57 | % | | | — | | |
| MSCI EAFE® Index(4) | | | 27.52 | % | | | 14.56 | % | | | 7.34 | % | |
| Average Annual Total Returns for the Periods Ended October 31, 2006 | |
| | | Since Inception
of Class B
April 18, 1997 | | Since Inception
of Class Q
January 24, 2000 | | Since Inception
of Class I
June 18, 2001 | |
| Including Sales Charge: | |
| Class A(1) | | | — | | | | — | | | | — | | |
| Class B(2) | | | 12.81 | % | | | — | | | | — | | |
| Class C(3) | | | — | | | | — | | | | — | | |
| Class I | | | — | | | | — | | | | 13.09 | % | |
| Class Q | | | — | | | | 9.96 | % | | | — | | |
| Excluding Sales Charge: | |
| Class A | | | — | | | | — | | | | — | | |
| Class B | | | 12.81 | % | | | — | | | | — | | |
| Class C | | | — | | | | — | | | | — | | |
| Class I | | | — | | | | — | | | | 13.09 | % | |
| Class Q | | | — | | | | 9.96 | % | | | — | | |
| MSCI EAFE® Index(4) | | | 7.56 | %(5) | | | 4.68 | %(6) | | | 10.95 | %(7) | |
Based on a $10,000 initial investment, the graph and table above illustrate the total return of ING International Value Fund against the index indicated. The index is unmanaged and has no cash in its portfolio, imposes no sales charge and incurs no operating expenses. An investor cannot invest directly in the index. The Fund's performance is shown both with and without the imposition of sales charges.
The graph and performance table do not reflect the deduction of taxes that a shareholder will pay on Fund distributions or the redemption of Fund shares.
The performance shown may include the effect of fee waivers and/or expense reimbursements by the Investment Adviser and/or other service providers, which have the effect of increasing total return. Had all fees and expenses been considered, the total returns would have been lower.
Performance data represents past performance and is no assurance of future results. Investment return and principal value of an investment in the Fund will fluctuate. Shares, when sold, may be worth more or less than their original cost. The Fund's current performance may be lower or higher than the performance data shown. Please log on to www.ingfunds.com or call (800) 992-0180 to get performance through the most recent month end.
This report contains statements that may be "forward-looking" statements. Actual results may differ materially from those projected in the "forward-looking" statements.
The views expressed in this report reflect those of the portfolio managers, only through the end of the period as stated on the cover. The portfolio managers' views are subject to change at any time based on market and other conditions.
Fund holdings are subject to change daily.
(1) Reflects deduction of the maximum Class A sales charge of 5.75%.
(2) Reflects deduction of the Class B deferred sales charge of 5% and 2%, respectively, for the 1 year and 5 year returns.
(3) Reflects deduction of the Class C deferred sales charge of 1% for the 1 year return.
(4) The MSCI EAFE® Index is an unmanaged index that measures the performance of securities listed on exchanges in Europe, Australasia and the Far East. It includes the reinvestment of dividends net of withholding taxes, but does not reflect fees, brokerage commissions or fees of investing.
(5) Since inception performance for index is shown from May 1, 1997.
(6) Since inception performance for index is shown from February 1, 2000.
(7) Since inception performance for index is shown from July 1, 2001.
29
ING INTERNATIONAL VALUE CHOICE FUND
PORTFOLIO MANAGERS' REPORT
The ING International Value Choice Fund (the "Fund") seeks long-term capital appreciation. The Fund is managed by Paul J. Hechmer, Portfolio Manager, Tradewinds NWQ Global Investors, LLC(1) — the Sub-Adviser.
Performance: For the year ended October 31, 2006, the Fund's Class A shares, excluding sales charges, provided a total return of 18.82% compared to the Morgan Stanley Capital International — Europe, Australasia, Far East Index ("MSCI EAFE® Index"), which returned 27.52% for the same period.
Portfolio Specifics: For the year ended October 31, 2006, the Fund had a strong return from an absolute perspective but lagging the return of the MSCI EAFE® benchmark index. Regionally, European markets outperformed most Asian markets, the outperformance being compounded by stronger European currencies versus most Asian currencies, in particular the yen. All sectors produced double digit returns, however, some such as utilities and materials outperformed others such as telecommunications and the energy sector.
The year certainly exhibited volatility in various parts of the world and within various sectors and asset classes, however, in general the trend has been upwards. We have participated in a significant portion of that upside, however, we have also lagged somewhat through not having significant exposure to some of the better performing sectors, and by being underweight Europe relative to the benchmark MSCI EAFE® Index.
We had and continue to have low exposure to the financials sector, the largest benchmark sector and one of the better performing ones. This underweight hurt performance as did the poor performance of some of the names we held in the sector, such as Takefuji in Japan. We also suffered in the consumer discretionary sector from holding German pay TV company Premiere AG and Japanese apparel manufacturer Wacoal, and in the consumer staples sector from holding Northern Foods of the United Kingdom, a position we exited during the period. In addition, with rapidly rising markets, cash levels in the fund on a relative basis also detracted from performance.
Clearly within a diversified portfolio one would expect some areas of the portfolio to be working while others are not, and our exposure to the materials sector aided us over the period, even though we saw greatly increased volatility in the price of many commodities throughout the year. Our overweight to this sector remains, as we continue to find individual companies with significant assets trading at a discount to the realizable price of those assets. In addition, we were aided by exposure to the healthcare sector, through Daiichi Sankyo in Japan, and the strong performing utilities sector.
Current Strategy and Outlook: International markets have performed very strongly in recent years, and the last twelve months was no exception. We have been fairly conservatively positioned with exposure to what we believe are good defensive companies and those which we believe offer limited downside. We arrived at these positions by focusing on strong fundamentals and attractive absolute valuations. When markets were hitting all time highs in the late 1990s and the beginning of this decade, there was a broad discrepancy between the largest and most expensive companies and the rest of the market. This is no longer the case, with many companies looking similarly valued. In addition, in almost every global equity market corporate profits are hitting all time highs. While we do not foresee a significant pull back in equity markets across the globe and global in vesting allows us to be well diversified, we also believe that making money going forward will be harder than it has been in the past.
(1) Effective April 3, 2006, sub-advisory responsibilities were transferred from NWQ Investment Management Company, LLC to Tradewinds, NWQ Global Investors, LLC.
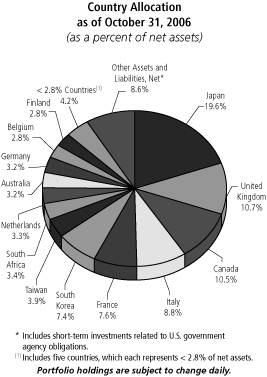
Top Ten Industries*
as of October 31, 2006
(as a percent of net assets)
| Mining | | | 19.5 | % | |
| Telecommunications | | | 19.1 | % | |
| Oil & Gas | | | 8.5 | % | |
| Electric | | | 5.7 | % | |
| Diversified Financial Services | | | 3.6 | % | |
| Media | | | 3.2 | % | |
| Auto Parts & Equipment | | | 2.8 | % | |
| Commercial Services | | | 2.8 | % | |
| Forest Products & Paper | | | 2.8 | % | |
| Miscellaneous Manufacturing | | | 2.5 | % | |
* Excludes short-term investments related to U.S. government agency obligations.
Portfolio holdings are subject to change daily.
30
ING INTERNATIONAL VALUE CHOICE FUND
PORTFOLIO MANAGERS' REPORT

| Average Annual Total Returns for the Periods Ended October 31, 2006 | |
| | | 1 Year | | Since Inception
of Classes A and B
February 1, 2005 | | Since Inception
of Class C
February 4, 2005 | | Since Inception
of Class I
December 21, 2005 | |
| Including Sales Charge: | |
| Class A(1) | | | 12.01 | % | | | 10.92 | % | | | — | | | | — | | |
| Class B(2) | | | 12.77 | % | | | 11.77 | % | | | — | | | | — | | |
| Class C(3) | | | 16.78 | % | | | — | | | | 13.93 | % | | | — | | |
| Class I | | | — | | | | — | | | | — | | | | 12.50 | % | |
| Excluding Sales Charge: | |
| Class A | | | 18.82 | % | | | 14.75 | % | | | — | | | | — | | |
| Class B | | | 17.77 | % | | | 13.86 | % | | | — | | | | — | | |
| Class C | | | 17.78 | % | | | — | | | | 13.93 | % | | | — | | |
| Class I | | | — | | | | — | | | | — | | | | 12.50 | % | |
| MSCI EAFE® Index(4) | | | 27.52 | % | | | 20.53 | %(5) | | | 20.53 | %(5) | | | 19.39 | %(6) | |
Based on a $10,000 initial investment, the graph and table above illustrate the total return of ING International Value Choice Fund against the index indicated. The index is unmanaged and has no cash in its portfolio, imposes no sales charge and incurs no operating expenses. An investor cannot invest directly in the index. The Fund's performance is shown both with and without the imposition of sales charges.
The graph and performance table do not reflect the deduction of taxes that a shareholder will pay on Fund distributions or the redemption of Fund shares.
The performance shown may include the effect of fee waivers and/or expense reimbursements by the Investment Adviser and/or other service providers, which have the effect of increasing total return. Had all fees and expenses been considered, the total returns would have been lower.
Performance data represents past performance and is no assurance of future results. Investment return and principal value of an investment in the Fund will fluctuate. Shares, when sold, may be worth more or less than their original cost. The Fund's current performance may be lower or higher than the performance data shown. Please log on to www.ingfunds.com or call (800) 992-0180 to get performance through the most recent month end.
It is important to note that the Fund has a limited operating history. Performance over a longer period of time may be more meaningful than short-term performance.
This report contains statements that may be "forward-looking" statements. Actual results may differ materially from those projected in the "forward-looking" statements.
The views expressed in this report reflect those of the portfolio managers, only through the end of the period as stated on the cover. The portfolio managers' views are subject to change at any time based on market and other conditions.
Fund holdings are subject to change daily.
(1) Reflects deduction of the maximum Class A sales charge of 5.75%.
(2) Reflects deduction of the Class B deferred sales charge of 5% and 4%, respectively for the 1 year and since inception return.
(3) Reflects deduction of the Class C deferred sales charge of 1% for the one year return.
(4) The MSCI EAFE® Index is an unmanaged index that measures the performance of securities listed on exchanges in markets in Europe, Australasia and the Far East. It includes the reinvestment of dividends net of withholding taxes, but does not reflect fees, brokerage commissions or fees of investing.
(5) Since inception performance for index is shown from February 1, 2005.
(6) Since inception performance for index is shown from January 1, 2006.
31
ING RUSSIA FUND
PORTFOLIO MANAGERS' REPORT
The ING Russia Fund (the "Fund") seeks long-term capital appreciation through investment primarily in equity securities of Russian companies. The Fund is managed by Samuel Oubadia, Bernard Mignon and Jan-Wim Derks, ING Investment Management Advisors B.V. — the Sub-Adviser.
Performance: For the year ended October 31, 2006, the Fund's Class A shares, excluding sales charges, provided a total return of 66.65% compared to the Morgan Stanley Capital International Emerging Markets IndexSM ("MSCI EM IndexSM") and the Russian Trading System ("RTS") Index, which returned 35.00% and 73.59%, respectively, for the same period.
Portfolio Specifics: The period under review was highlighted by continued strength in the price of oil and other commodities. Oil prices reached their peak in late July and early August. It has since dropped quite sharply. Nevertheless, at current levels of U.S. $55.00 - U.S. $60.00/barrel, the Russian economy continues to perform quite well. This was generally positive for the Russian equity market as it is dominated by the energy sector. The market, as represented by the RTS Index, reached an all-time high in early May and then corrected quite sharply in May and June. However, by the end of the reporting period, the Russian market was only slightly below its record high. Russia outperformed most other Emerging Markets. The MSCI EM IndexSM returned 35.0% over the same period.
The most recent period has also been marked by some important developments regarding foreign exchange legislation. On July 1, the Russian government made Russia's currency, the ruble, fully convertible. While the move is a demonstration of the government's confidence in its own currency, the move also has some practical implications. We believe it will lead to increasing amounts of foreign money, and Russian money, moving into rubles. Previously, the Russian ruble had long been convertible to U.S. dollars within Russia. But it was not until 2006 that the currency could also be converted outside of the country. This change should help facilitate international business and increase the efficiency of both international and domestic companies.
One of Russia's large capitalization stocks that performed very well over the period was Sberbank. Russia's banking sector is still quite underdeveloped. As Russia's largest retail bank, Sberbank is in an excellent position to offer its retail clients products such as consumer lending, mortgages and asset management. The bank saw its share price soar 152.8% over the past year. The Fund increased its position in Sberbank in the middle of the period, and therefore benefited from its strong performance.
Another of the market's blue-chips that performed well was Norilsk Nickel. The mining giant benefited from the huge increase in both nickel and copper prices. The company has historically traded at a substantial discount to other large mining companies. However, after Norilsk Nickel's share price gained 94.1% over the past year, this discount has narrowed somewhat. Although the Fund held a fairly large position in Norilsk Nickel, the Fund was underweight as compared to its weighting in RTS Index through most of the reporting period. This hurt the relative performance of the Fund.
One of the few steel companies that did not perform well was Mechel. The company saw its shares fall 24.2% over the year after releasing financial results that were below consensus expectations. As the Fund held a small overweight position in Mechel, this hurt its relative performance.
Current Strategy and Outlook: The Fund will maintain its high exposure to the banking sector and the mobile telecommunications sector. We believe, both should benefit from the continued strong growth in personal consumption. Furthermore, we believe both sectors should also benefit from the move to full convertibility of the ruble. In fact, two of Russia's mobile operators have already moved from dollar-based pricing to ruble-based pricing.
The main risk to the Russian market is the risk of a global economic slowdown. This would have an adverse effect on the entire emerging markets asset class. However, the Russian market could suffer more than its peers due to its dependence on the energy and materials sectors. Nevertheless, we are encouraged by the fact that the market has performed quite well in spite of a fairly large drop in oil prices in September.
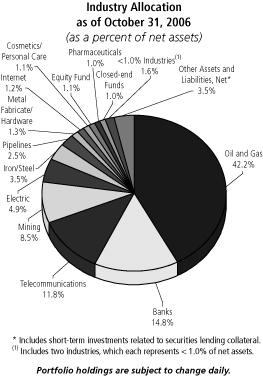
Top Ten Holdings
as of October 31, 2006
(as a percent of net assets)
| LUKOIL | | | 14.0 | % | |
| Sberbank RF | | | 12.4 | % | |
| OAO Gazprom | | | 10.3 | % | |
| MMC Norilsk Nickel | | | 5.3 | % | |
| Unified Energy System | | | 4.2 | % | |
| NovaTek OAO GDR | | | 4.0 | % | |
| Surgutneftegaz | | | 3.4 | % | |
| Polyus Gold Co ZAO | | | 3.2 | % | |
| OAO Gazprom ADR | | | 3.0 | % | |
| Mobile Telesystems Finance SA | | | 2.9 | % | |
Portfolio holdings are subject to change daily.
32
ING RUSSIA FUND
PORTFOLIO MANAGERS' REPORT
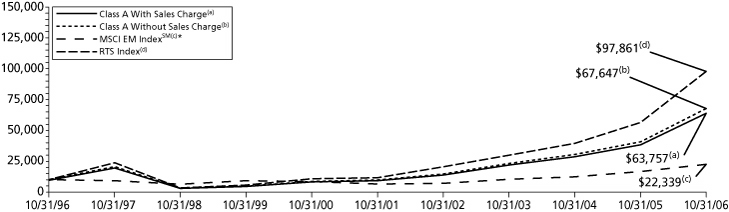
| Average Annual Total Returns for the Periods Ended October 31, 2006 | |
| | | 1 Year | | 5 Year | | 10 Years | |
| Including Sales Charge: | |
| Class A(1) | | | 57.08 | (2) | | | 45.90 | % | | | 20.35 | % | |
| Excluding Sales Charge: | |
| Class A | | | 66.65 | %(2) | | | 47.63 | % | | | 21.07 | % | |
| MSCI EM IndexSM(5) | | | 35.00 | % | | | 28.11 | %(4) | | | — | | |
| RTS Index(5) | | | 73.59 | % | | | 53.51 | % | | | 22.13 | % | |
Based on a $10,000 initial investment, the graph and table above illustrate the total return of ING Russia Fund against the indices indicated. Each index is unmanaged and has no cash in its portfolio, imposes no sales charge and incurs no operating expenses. An investor cannot invest directly in an index. The Fund's performance is shown both with and without the imposition of sales charges.
The graph and performance table do not reflect the deduction of taxes that a shareholder will pay on Fund distributions or the redemption of Fund shares.
The performance shown may include the effect of fee waivers and/or expense reimbursements by the Investment Adviser and/or other service providers, which have the effect of increasing total return. Had all fees and expenses been considered, the total returns would have been lower.
Performance data represents past performance and is no assurance of future results. Investment return and principal value of an investment in the Fund will fluctuate. Shares, when sold, may be worth more or less than their original cost. The Fund's current performance may be lower or higher than the performance data shown. Please log on to www.ingfunds.com or call (800) 992-0180 to get performance through the most recent month end.
This report contains statements that may be "forward-looking" statements. Actual results may differ materially from those projected in the "forward-looking" statements.
The views expressed in this report reflect those of the portfolio managers, only through the end of the period as stated on the cover. The portfolio managers' views are subject to change at any time based on market and other conditions.
Fund holdings are subject to change daily.
* The graph above illustrates the gross returns for the MSCI EM IndexSM for the first five years of the ten year period and net index returns for last five years of the ten year period.
(1) Reflects deduction of the maximum Class A sales charge of 5.75%.
(2) Redemptions on shares held less than 365 days are subject to a redemption fee of 2% of the redemption proceeds.
(3) The MSCI EM IndexSM is an unmanaged index that measures the performance of securities listed on exchanges in developing nations throughout the world. It includes the reinvestment of dividends net of withholding taxes, but does not reflect fees, brokerage commissions or fees of investing.
(4) Net return for index is shown from November 1, 2001.
(5) The RTS Index is a capitalization-weighted index that is calculated in U.S. dollars. The index tracks the performance of Russia's most active stocks traded on the RTS. The index is operated by the National Association of Participants in the Securities Markets, a non-profit body.
33
ING EMERGING MARKETS FIXED INCOME FUND
PORTFOLIO MANAGERS' REPORT
The ING Emerging Markets Fixed Income Fund (the "Fund") seeks to maximize total return. The Fund is managed by Rob Drijkoningen, Emerging Markets Debt Team Leader and Gorky Urquieta, Senior Investment Manager, ING Investment Management Advisors B.V. — the Sub-Adviser.
Performance: Since the Fund's inception on December 21, 2005, through October 31, 2006, the Fund's Class A shares, excluding sales charges, provided a total return of 9.28% compared to the JPMorgan Emerging Markets Bond ("EMB") Index Global Diversified, which returned 8.88% for the same period.
Portfolio Specifics: For the ten-month period ended October 31, 2006, JPMorgan EMB Index Global Diversified's spread tightened by 0.44% to 2.03% on the back of several positive factors. These included an overall supportive global backdrop for global growth and commodity prices and low interest rates. This climate has propelled improving macroeconomic data across the emerging market universe and has been reflected in strong gross domestic product ("GDP") growth rates, sound fiscal accounts, current account surpluses, reserve accumulation, lower indebtedness ratios and historically low rates of inflation. As a reflection of these improving fundamentals, during the period, ten countries in the benchmark had their credit ratings upgraded, while none were downgraded. Technical factors have also remained supportive as institutional inflows into the asset class ar e on course to exceed US$20 billion in 2006, an all time high. As investors search for yield, the asset class is continuing to prove itself as an attractive investment alternative.
Positive macroeconomics have also allowed several countries to run fiscal surpluses, effectively lowering their financing needs. Underpinning this effect, a new liability management tendency has placed an emphasis on issuing debt denominated in local currencies, decreasing the supply of new bonds in external markets in the process. Further, prepayments have also played an important role this year, as mounting reserve accumulation has prompted some countries to payoff existing debt, further shrinking the supply of bonds available to investors.
Year-to-date through October, the Fund outperformed its benchmark by 0.40%. Country and instrument selection accounted for more than two-thirds of this positive performance, as the general strategy of being overweight higher-risk countries paid off.
Positions in Argentina and Dominican Republic, Latin America, the Philippines and Malaysia all benefited the Fund during the period. A significant overweight position in Argentina paid-off nicely as our GDP warrants and provincial bonds performed well. The Dominican Republic continued to post positive macroeconomic figures as its spreads compressed 1.61% through October, making it the second-best performing Treasury in the benchmark. The Philippines was the Fund's top contributor, as its added 0.26% of relative performance during the period. Zero exposure to Malaysia and South Africa, two countries that underperformed during the period, also benefited the Fund.
An allocation to attractively priced non-sovereign credits such as Province of Buenos Aires bonds also proved positive as the excess yields that these bonds provided have attracted investor interest. A largely neutral duration position with a bias towards shorter-term instruments benefited the Fund during the period.
By contrast, an overweight position in Russia acted as a drag as the country underperformed. Russian macroeconomic figures have continued to improve, but given the country's already low spread and high rating, the room for spread compression is limited. A small overweight position in Iraq also hurt the Fund. A deterioration in the country's political and security conditions caused the country's spreads to widen by 0.40% since the bonds were issued in January.
Current Strategy and Outlook: We maintain a positive outlook for emerging market debt as the fundamental drivers are still strong. We believe technical factors will also likely remain supportive as seasonal factors work in favor of the asset class toward year-end. We believe investors that are not yet aggressively positioned will likely continue to pour funds into emerging markets. Valuations are starting to become expensive in comparison with U.S. credit spreads and may be enough to give us pause. However, we don't foresee a risk of a meaningful spread widening in the near term given that credit ratings continue to improve, corroborating our positive fundamental assessment of the asset class.

Top Five Industries
as of October 31, 2006
(as a percent of net assets)
| Foreign Government Bonds | | | 74.9 | % | |
| Oil & Gas | | | 5.0 | % | |
| Electric | | | 3.5 | % | |
| Regional (state/province) | | | 2.4 | % | |
| Diversified Financial Services | | | 1.6 | % | |
Portfolio holdings are subject to change daily.
34
ING EMERGING MARKETS FIXED INCOME FUND
PORTFOLIO MANAGERS' REPORT

| Cumulative Total Returns for the Periods Ended October 31, 2006 | |
| | | Since Inception
of Class A
December 21, 2005 | | Since Inception
of Class B
January 4, 2006 | | Since Inception
of Class C
March 1, 2006 | |
| Including Sales Charge: | |
| Class A(1) | | | 3.00 | % | | | — | | | | — | | |
| Class B(2) | | | — | | | | 1.92 | % | | | — | | |
| Class C(3) | | | — | | | | — | | | | 1.77 | % | |
| Excluding Sales Charge: | |
| Class A | | | 9.28 | % | | | — | | | | — | | |
| Class B | | | — | | | | 6.92 | % | | | — | | |
| Class C | | | — | | | | — | | | | 2.75 | % | |
| JPMorgan EMB Index Global Diversified(4) | | | 7.90 | %(5) | | | 7.90 | %(5) | | | 4.35 | % | |
Based on a $10,000 initial investment, the graph and table above illustrate the total return of ING Emerging Markets Fixed Income Fund against the index indicated. The index is unmanaged and has no cash in its portfolio, imposes no sales charge and incurs no operating expenses. An investor cannot invest directly in the index. The Fund's performance is shown both with and without the imposition of sales charges.
The graph and performance table do not reflect the deduction of taxes that a shareholder will pay on Fund distributions or the redemption of Fund shares.
The performance shown may include the effect of fee waivers and/or expense reimbursements by the Investment Adviser and/or other service providers, which have the effect of increasing total return. Had all fees and expenses been considered, the total returns would have been lower.
Performance data represents past performance and is no assurance of future results. Investment return and principal value of an investment in the Fund will fluctuate. Shares, when sold, may be worth more or less than their original cost. The Fund's current performance may be lower or higher than the performance data shown. Please log on to www.ingfunds.com or call (800) 992-0180 to get performance through the most recent month end.
It is important to note that the Fund has a limited operating history. Performance over a longer period of time may be more meaningful than short-term performance.
This report contains statements that may be "forward-looking" statements. Actual results may differ materially from those projected in the "forward-looking" statements.
The views expressed in this report reflect those of the portfolio managers, only through the end of the period as stated on the cover. The portfolio managers' views are subject to change at any time based on market and other conditions.
Fund holdings are subject to change daily.
(1) Reflects deduction of the maximum Class A sales charge of 5.75%.
(2) Reflects deduction of the Class B deferred sales charge of 5% for the since inception return.
(3) Reflects deduction of the Class C deferred sales charge of 1% for the since inception return.
(4) The JPMorgan EMB Index Global Diversified is a uniquely-weighted version of the Emerging Markets Bond Index Global. It limits the weights of those index countries with larger debt stocks by only including specified portions of these countries' eligible current face amounts of debt outstanding.
(5) Since inception performance for index is shown from January 1, 2006.
35
ING GLOBAL BOND FUND
PORTFOLIO MANAGERS' REPORT
The ING Global Bond Fund (the "Fund") seeks to maximize total return through a combination of current income and capital appreciation. The Fund is managed by James Kauffmann, ING Investment Management Co. — the Sub-Adviser.
Performance: Since the Fund's inception on June 30, 2006, through October 31, 2006, the Fund's Class A shares, excluding sales charges, provided a total return of 3.13% compared to the Lehman Brothers Global Aggregate Index, which returned 4.40% for the same period.
Portfolio Specifics: Since the Fund's launch in June, the market has continued to focus on the possibility of a softening global economy, led by the United States. Yet, some foreign central banks continued tightening monetary policy during the period. The European Central Bank increased its overnight rate by 0.50% to 3.25%, while the Bank of England ended the period with its rate at 4.75% following a 0.25% increase on August 3rd. On July 14th the Bank of Japan raised its overnight call rate 0.25%, thus ending its zero interest rate policy that had lasted six years. The U.S. and Canadian central banks left rates unchanged during the period.
Long-term interest rates declined materially over the period, primarily due to lower growth and inflation expectations in the U.S. The housing slowdown continued to be the focus of the market in the U.S. as the direct effects negatively impacted gross domestic product ("GDP"). To date, there has yet to be any major spillover effect to other areas of the economy. The belief that the U.S. Federal Reserve ("Fed") was about to stop raising its key short-term interest rate helped drive down longer-term interest rates. U.S., German, and Japanese 10 year government rates also declined. The yield curve in the U.S. and Japan was mostly unchanged. While it flattened in the eurozone, it became more inverted in the UK during the period.
The CRB Commodities Index and the West Texas Intermediate Crude Oil Index both declined, and ended the period off their mid-year highs. The plunge in energy prices lowered global headline inflation and is likely to continue to do so in the months to come.
Turning to the Fund, its modest underweight U.S. dollar position was spread equally across the yen, euro, British pound, and Canadian dollar. This detracted slightly from performance as the U.S. dollar appreciated over the period. Interest rate exposure was less than the benchmark, spread equally across countries. This hurt relative performance as interest rates declined globally. The Fund benefited from strong security selection, particularly in credit.
Current Strategy and Outlook: The Fed's decision to hold interest rates where they were in August, September and October fostered a new market consensus for the timing of future rate hikes, with many observers forecasting this pause could last for some time due to the softness in the residential real estate market and related industries. Indeed, some observers contend that the Fed's next move will be to ease rates sometime in the first quarter of 2007. At present, we disagree with that view. The swift downturn in most residential housing measures clearly has the Federal Open Market Committee concerned, and may well be the primary reason for the Fed's continuing pause. Energy and base metal prices have come off their highs, although this may have more to do with the end of the summer driving season and a decrease in commodity speculation than a barometer of economic activity.
The U.S. accounts for roughly 30% of world GDP and much of the prospects for global growth depend on the trajectory of the U.S. economy. We believe growth will reaccelerate thanks to high levels of employment, wages, and wealth. Indications are that the Japanese economy will continue to grow at a moderate pace while the outlook for the eurozone is less certain in part because of the coming large tax increase in Germany.
In an environment of continued global growth, the Fund will likely have an underweight interest rate exposure as the global tightening of monetary policy continues. This underweight will be expressed primarily in Japan as the rate normalization process is just beginning there, while areas such as the U.S. and U.K. are in the later stages of the rate cycle. As interest rate differentials narrow, support for the dollar should diminish over time. The large and increasing trade deficit should act as a long-term drag for the U.S. dollar. We remain neutral on spread product (corporate and mortgage bonds). Even though the fundamental outlook is favorable, valuations are expensive. As always, our corporate and mortgage asset specialists will search for security specific opportunities.

Top Ten Holdings*
as of October 31, 2006
(as a percent of net assets)
| U.S. Treasury Bond, 4.500%, due 09/30/11 | | | 8.1 | % | |
Bundesrepublik Deutschland, 4.000%,
due 07/04/16 | | | 6.3 | % | |
| U.S. Treasury Note, 4.625%, due 09/30/08 | | | 5.7 | % | |
| Santander BanCorp, 6.800%, due 11/21/11 | | | 4.6 | % | |
Italy Buoni Poliennali Del Tesoro, 3.750%,
due 08/01/16 | | | 4.4 | % | |
France Government Bond OAT, 3.250%,
due 04/25/16 | | | 4.4 | % | |
| Bundesobligation, 3.250%, due 04/17/09 | | | 4.4 | % | |
Federal National Mortgage Association, 5.000%,
due 11/15/34 | | | 3.6 | % | |
Federal National Mortgage Association, 0.040%,
due 11/13/33 | | | 3.3 | % | |
Japan Government Five Year Bond, 1.200%,
due 09/20/11 | | | 3.2 | % | |
* Excludes short-term investments related to repurchase agreements and ING Institutional Prime Money Market Fund.
Portfolio holdings are subject to change daily.
36
ING GLOBAL BOND FUND
PORTFOLIO MANAGERS' REPORT
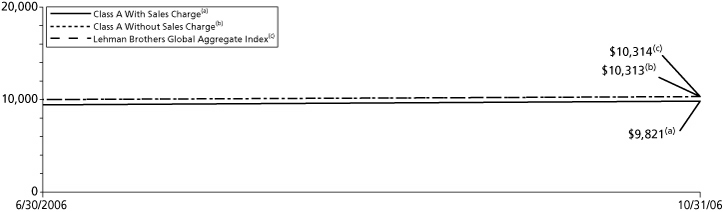
| Cumulative Total Returns for the Periods Ended October 31, 2006 | |
| | | Since Inception
of Classes, A, B, C & I
June 30, 2006 | |
| Including Sales Charge: | |
| Class A(1) | | | (1.79 | )% | |
| Class B(2) | | | (2.16 | )% | |
| Class C(3) | | | 1.82 | % | |
| Class I | | | 3.23 | % | |
| Excluding Sales Charge: | |
| Class A | | | 3.13 | % | |
| Class B | | | 2.84 | % | |
| Class C | | | 2.82 | % | |
| Class I | | | 3.23 | % | |
| Lehman Brothers Global Aggregate Index(4) | | | 3.14 | %(5) | |
Based on a $10,000 initial investment, the table and graph above illustrate the total return of ING Global Bond Fund against the index indicated. The index is unmanaged and has no cash in its portfolio, imposes no sales charge and incurs no operating expenses. An investor cannot invest directly in the index. The Fund's performance is shown both with and without the imposition of sales charges.
The graph and performance table do not reflect the deduction of taxes that a shareholder will pay on Fund distributions or the redemption of Fund shares.
The performance shown may include the effect of fee waivers and/or expense reimbursements by the Investment Adviser and/or other service providers, which have the effect of increasing total return. Had all fees and expenses been considered, the total returns would have been lower.
Performance data represents past performance and is no assurance of future results. Investment return and principal value of an investment in the Fund will fluctuate. Shares, when sold, may be worth more or less than their original cost. The Fund's current performance may be lower or higher than the performance data shown. Please log on to www.ingfunds.com or call (800) 992-0180 to get performance through the most recent month end.
It is important to note that the Fund has a limited operating history. Performance over a longer period of time may be more meaningful than short-term performance.
This report contains statements that may be "forward-looking" statements. Actual results may differ materially from those projected in the "forward-looking" statements.
The views expressed in this report reflect those of the portfolio managers, only through the end of the period as stated on the cover. The portfolio managers' views are subject to change at any time based on market and other conditions.
Fund holdings are subject to change daily.
(1) Reflects deduction of the maximum Class A sales charge of 4.75%.
(2) Reflects deduction of the Class B deferred sales charge of 5% for the since inception return.
(3) Reflects deduction of the Class C deferred sales charge of 1% for the since inception return.
(4) The Lehman Brothers Global Aggregate Index provides a broad-based measure of the global investment-grade fixed income markets. The three major components of this index are the U.S. Aggregate, the Pan-European Aggregate, and the Asian-Pacific Aggregate Indices.
(5) Since inception performance for the index is shown from July 1, 2006.
37
ING DIVERSIFIED INTERNATIONAL FUND
PORTFOLIO MANAGERS' REPORT
ING Diversified International Fund (the "Fund") seeks long term growth of capital. The Fund invests in a combination of other ING Funds ("Underlying Funds") according to target allocations determined by the Investment Adviser. The Fund is managed by ING Investments, LLC, under the guidance of an Investment Review Committee*.
Portfolio Specifics: The Fund's current approximate target investment allocations (expressed as a percentage of its net assets) among the Underlying Funds are set out below. As these are Target Allocations, the actual allocations of the Fund's assets may deviate from the percentages shown.
Assets will be allocated among the Underlying Funds and markets based on judgments made by ING Investments, LLC. The performance of the Fund reflects the performance of the Underlying Funds in which it invests.
There is a risk that the Fund may allocate assets to an Underlying Fund or market that underperforms other asset classes. For example, the Fund may be underweighted in assets or a market that is experiencing significant returns or overweighted in assets or a market with significant declines.
Performance: Since the Fund's inception on December 21, 2005 through October 31, 2006, the Fund's Class A shares, excluding sales charges, provided a total return of 16.10% compared to the 18.77% return for the Fund's benchmark, the Morgan Stanley Capital International All Country ex-U.S. Index ("MSCI ACWI ex US IndexSM") for the same period. The underperformance, during the period, was due to the relatively high proportion of small cap, and to a much lesser extent emerging markets stocks, in our strategic asset allocation compared to the benchmark. International small caps, as measured by the MSCI EAFE® SmallCap Index, have lagged international large caps, as measured by the MSCI EAFE® and MSCI ACWI ex US Indices, so far in 2006. The remaining underperformance was due to the fact that, while results varied from case to case, the underlying funds did not in the aggregate meet their benchmarks.
Current Outlook and Strategy: The spring's global slowdown was ultimately mild, and with global inflation under control as oil prices stabilize, it is our view that international growth prospects remain solid. While we expect further rate increases by central banks, we expect rates to peak below that of the U.S. Furthermore, we do not expect rate hikes to impair the outlook for stocks. To that end, we remain overweight Large Cap Equity, in Large Cap Core and Large Cap Growth with a small underweight in Large Cap Value. We still favor growth stocks in a rising rate environment, even though interest rate risk has abated enough to lessen the pressure on financial stocks, which comprise 40% of the MSCI EAFE® Value Index. We are currently underweight Small Cap and, to a smaller degree, Emerging Markets. Volatility in the emerging markets has fallen in the last couple of months, allowing us to recently trim our underweight position. We remain modestly underweight because enough uncertainty still exists about the global outlook to warrant some caution. We are neutral in International REITs. Moderate growth and still-low interest rates are favorable for REITs, and valuations are, by several measures, attractive in a number of markets.
* The members of the Investment Review Committee are: Shaun P. Mathews, Stanley D. Vyner, Laurie M. Tillinghast, and William A. Evans.
Asset Allocation as of
October 31, 2006
(as percentage of net assets)
Underlying Affiliated Funds
| ING Emerging Countries Fund - Class I | | | 7.0 | % | |
| ING Foreign Fund - Class I | | | 22.8 | % | |
ING Index Plus International
Equity Fund - Class I | | | 29.9 | % | |
ING International Capital
Appreciation Fund - Class I | | | 17.9 | % | |
| ING International SmallCap Fund - Class I | | | 5.0 | % | |
| ING International Value Choice Fund - Class I | | | 14.0 | % | |
| ING International Real Estate Fund- Class I | | | 3.0 | % | |
| Other Assets and Liabilities, Net | | | 0.4 | % | |
| Total | | | 100.0 | % | |
Portfolio holdings are subject to change daily.
Target Allocation
| International Core | | | 45 | % | |
| International Growth | | | 18 | % | |
| International Value | | | 14 | % | |
| International Small Cap | | | 5 | % | |
| Emerging Markets | | | 15 | % | |
| Real Estate | | | 3 | % | |
38
ING DIVERSIFIED INTERNATIONAL FUND
PORTFOLIO MANAGERS' REPORT
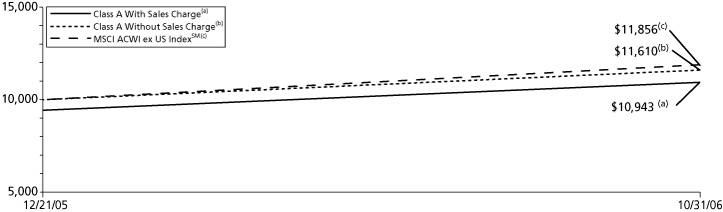
| Cumulative Total Returns for the Periods Ended October 31, 2006 | |
| | | Since Inception
of Classes A, B, C and I
December 21, 2005 | |
| Including Sales Charge: | |
| Class A(1) | | | 9.43 | % | |
| Class B(2) | | | 10.40 | % | |
| Class C(3) | | | 14.40 | % | |
| Class I | | | 16.30 | % | |
| Excluding Sales Charge: | |
| Class A | | | 16.10 | % | |
| Class B | | | 15.40 | % | |
| Class C | | | 15.40 | % | |
| Class I | | | 16.30 | % | |
| MSCI ACWI ex US IndexSM(4) | | | 18.56 | %(5) | |
Based on a $10,000 initial investment, the table and graph above illustrate the total return of ING Diversified International Fund against the index indicated. The index is unmanaged and has no cash in its portfolio, imposes no sales charge and incurs no operating expenses. An investor cannot invest directly in the index. The Fund's performance is shown both with and without the imposition of sales charges.
The graph and performance table do not reflect the deduction of taxes that a shareholder will pay on Fund distributions or the redemption of Fund Shares.
The performance shown may include the effect of the waivers and/or expense reimbursements by the Investment Adviser and/or other service providers, which have the effect of increasing total return. Had all fees and expenses been considered, the total returns would have been lower.
Performance data represents past performance and is no assurance of future results. Investment return and principal value of an investment in the Fund will fluctuate. Shares, when sold, may be worth more or less than their original cost. The Fund's current performance may be lower or higher than the performance data shown. Please log on to www.ingfunds.com or call (800) 992-0180 to get performance through the most recent month end.
It is important to note that the Fund has a limited operating history. Performance over a longer period of time may be more meaningful than short-term performance.
This report contains statements that may be "forward-looking" statements. Actual results may differ materially from those projected in the "forward-looking" statements.
The views expressed in this report reflect those of the portfolio managers, only through the end of the period as stated on the cover. The portfolio managers' views are subject to change at any time based on market and other conditions.
Fund holdings are subject to change daily.
(1) Reflects deduction of the maximum Class A sales charge of 5.75%.
(2) Reflects deduction of the Class B deferred sales charge of 5% for the since inception return.
(3) Reflects deduction of the Class C deferred sales charge of 1% for the since inception return.
(4) The MSCI ACWI ex US IndexSM measures the returns of equities of companies which are domiciled outside the U.S. It includes the reinvestment of dividends and distributions net of withholding taxes, but does not reflect fees, brokerage commissions or other expenses of investing.
(5) Since inception performance of the index is shown from January 1, 2006.
39
SHAREHOLDER EXPENSE EXAMPLES (UNAUDITED)
As a shareholder of a Fund, you incur two types of costs: (1) transaction costs, including sales charges (loads) on purchase payments; redemption fees; and exchange fees; and (2) ongoing costs, including management fees; distribution and/or service (12b–1) fees; and other Fund expenses. These Examples are intended to help you understand your ongoing costs (in dollars) of investing in a Fund and to compare these costs with the ongoing costs of investing in other mutual funds.
The Examples are based on an investment of $1,000 invested at the beginning of the period and held for the entire period from May 1, 2006 to October 31, 2006.
Actual Expenses
The first section of the table shown, "Actual Fund Return," provides information about actual account values and actual expenses. You may use the information in this section, together with the amount you invested, to estimate the expenses that you paid over the period. Simply divide your account value by $1,000 (for example, an $8,600 account value divided by $1,000 = 8.6), then multiply the result by the number in the first section under the heading entitled "Expenses Paid During Period" to estimate the expenses you paid on your account during this period.
Hypothetical Example for Comparison Purposes
The second section of the table shown, "Hypothetical 5% Return," provides information about hypothetical account values and hypothetical expenses based on the Fund's actual expense ratio and an assumed rate of return of 5% per year before expenses, which is not the Fund's actual return. The hypothetical account values and expenses may not be used to estimate the actual ending account balance or expenses you paid for the period. You may use this information to compare the ongoing costs of investing in the Fund and other funds. To do so, compare this 5% hypothetical example with the 5% hypothetical examples that appear in the shareholder reports of the other funds.
Please note that the expenses shown in the table are meant to highlight your ongoing costs only and do not reflect any transactional costs, such as sales charges (loads), redemption fees, or exchange fees. Therefore, the hypothetical lines of the table are useful in comparing ongoing costs only, and will not help you determine the relative total costs of owning different funds. In addition, if these transactional costs were included, your costs would have been higher.
| ING Global Equity Dividend Fund | | Beginning
Account
Value
May 1, 2006 | | Ending
Account
Value
October 31, 2006 | | Annualized
Expense
Ratio | | Expenses Paid
During the
Six Months Ended
October 31, 2006* | |
| Actual Fund Return | |
| Class A | | $ | 1,000.00 | | | $ | 1,069.80 | | | | 1.33 | % | | $ | 6.94 | | |
| Class B | | | 1,000.00 | | | | 1,065.30 | | | | 2.08 | | | | 10.83 | | |
| Class C | | | 1,000.00 | | | | 1,064.90 | | | | 2.08 | | | | 10.83 | | |
| Hypothetical (Excluding Expenses) | |
| Class A | | $ | 1,000.00 | | | $ | 1,018.50 | | | | 1.33 | % | | $ | 6.77 | | |
| Class B | | | 1,000.00 | | | | 1,014.72 | | | | 2.08 | | | | 10.56 | | |
| Class C | | | 1,000.00 | | | | 1,014.72 | | | | 2.08 | | | | 10.56 | | |
* Expenses are equal to each Fund's respective annualized expense ratios multiplied by the average account value over the period, multiplied by 184/365 to reflect the most recent fiscal half-year.
40
SHAREHOLDER EXPENSE EXAMPLES (UNAUDITED) (CONTINUED)
| ING Global Natural Resources Fund | | Beginning
Account
Value
May 1, 2006 | | Ending
Account
Value
October 31, 2006 | | Annualized
Expense
Ratio | | Expenses Paid
During the
Six Months Ended
October 31, 2006* | |
| Actual Fund Return | | $ | 1,000.00 | | | $ | 860.90 | | | | 1.42 | % | | $ | 6.66 | | |
| Hypothetical (Excluding Expenses) | | | 1,000.00 | | | | 1,018.05 | | | | 1.42 | | | | 7.22 | | |
| ING Global Real Estate Fund | |
| Actual Fund Return | |
| Class A | | $ | 1,000.00 | | | $ | 1,148.10 | | | | 1.39 | % | | $ | 7.53 | | |
| Class B | | | 1,000.00 | | | | 1,143.80 | | | | 2.14 | | | | 11.56 | | |
| Class C | | | 1,000.00 | | | | 1,144.30 | | | | 2.14 | | | | 11.57 | | |
| Class I | | | 1,000.00 | | | | 1,149.80 | | | | 1.06 | | | | 5.74 | | |
| Hypothetical (Excluding Expenses) | |
| Class A | | $ | 1,000.00 | | | $ | 1,018.20 | | | | 1.39 | % | | $ | 7.07 | | |
| Class B | | | 1,000.00 | | | | 1,014.42 | | | | 2.14 | | | | 10.87 | | |
| Class C | | | 1,000.00 | | | | 1,014.42 | | | | 2.14 | | | | 10.87 | | |
| Class I | | | 1,000.00 | | | | 1,019.86 | | | | 1.06 | | | | 5.40 | | |
| ING Global Value Choice Fund | |
| Actual Fund Return | |
| Class A | | $ | 1,000.00 | | | $ | 1,020.20 | | | | 1.77 | % | | $ | 9.01 | | |
| Class B | | | 1,000.00 | | | | 1,016.40 | | | | 2.42 | | | | 12.30 | | |
| Class C | | | 1,000.00 | | | | 1,017.00 | | | | 2.42 | | | | 12.30 | | |
| Class I(a) | | | 1,000.00 | | | | 1,019.70 | | | | 1.26 | | | | 1.92 | | |
| Class Q | | | 1,000.00 | | | | 1,020.90 | | | | 1.51 | | | | 7.69 | | |
| Hypothetical (Excluding Expenses) | |
| Class A | | $ | 1,000.00 | | | $ | 1,016.28 | | | | 1.77 | % | | $ | 9.00 | | |
| Class B | | | 1,000.00 | | | | 1,013.01 | | | | 2.42 | | | | 12.28 | | |
| Class C | | | 1,000.00 | | | | 1,013.01 | | | | 2.42 | | | | 12.28 | | |
| Class I | | | 1,000.00 | | | | 1,018.85 | | | | 1.26 | | | | 6.41 | | |
| Class Q | | | 1,000.00 | | | | 1,017.59 | | | | 1.51 | | | | 7.68 | | |
| ING Emerging Countries Fund | |
| Actual Fund Return | |
| Class A | | $ | 1,000.00 | | | $ | 993.60 | | | | 1.91 | % | | $ | 9.60 | | |
| Class B | | | 1,000.00 | | | | 990.10 | | | | 2.66 | | | | 13.34 | | |
| Class C | | | 1,000.00 | | | | 989.90 | | | | 2.66 | | | | 13.34 | | |
| Class I | | | 1,000.00 | | | | 995.00 | | | | 1.54 | | | | 7.74 | | |
| Class M | | | 1,000.00 | | | | 991.50 | | | | 2.41 | | | | 12.10 | | |
| Class Q | | | 1,000.00 | | | | 994.20 | | | | 1.79 | | | | 9.00 | | |
| Hypothetical (Excluding Expenses) | |
| Class A | | $ | 1,000.00 | | | $ | 1,015.58 | | | | 1.91 | % | | $ | 9.70 | | |
| Class B | | | 1,000.00 | | | | 1,011.80 | | | | 2.66 | | | | 13.49 | | |
| Class C | | | 1,000.00 | | | | 1,011.80 | | | | 2.66 | | | | 13.49 | | |
| Class I | | | 1,000.00 | | | | 1,017.44 | | | | 1.54 | | | | 7.83 | | |
| Class M | | | 1,000.00 | | | | 1,013.06 | | | | 2.41 | | | | 12.23 | | |
| Class Q | | | 1,000.00 | | | | 1,016.18 | | | | 1.79 | | | | 9.10 | | |
* Expenses are equal to each Fund's respective annualized expense ratios multiplied by the average account value over the period, multiplied by 184/365 to reflect the most recent fiscal half-year (except "Actual Fund Return" information for ING Global Value Choice Fund Class I, which reflects the 55-day period ended October 31, 2006 due to its inception date of September 6, 2006).
(a) Commencement of operations for Class I on September 6, 2006.
41
SHAREHOLDER EXPENSE EXAMPLES (UNAUDITED) (CONTINUED)
| ING Foreign Fund | | Beginning
Account
Value
May 1, 2006 | | Ending
Account
Value
October 31, 2006 | | Annualized
Expense
Ratio | | Expenses Paid
During the
Six Months Ended
October 31, 2006* | |
| Actual Fund Return | |
| Class A | | $ | 1,000.00 | | | $ | 1,012.00 | | | | 1.64 | % | | $ | 8.32 | | |
| Class B | | | 1,000.00 | | | | 1,007.80 | | | | 2.40 | | | | 12.15 | | |
| Class C | | | 1,000.00 | | | | 1,008.30 | | | | 2.40 | | | | 12.15 | | |
| Class I | | | 1,000.00 | | | | 1,012.90 | | | | 1.34 | | | | 6.80 | | |
| Class Q | | | 1,000.00 | | | | 1,012.00 | | | | 1.60 | | | | 8.11 | | |
| Hypothetical (Excluding Expenses) | |
| Class A | | $ | 1,000.00 | | | $ | 1,016.94 | | | | 1.64 | % | | $ | 8.34 | | |
| Class B | | | 1,000.00 | | | | 1,013.11 | | | | 2.40 | | | | 12.18 | | |
| Class C | | | 1,000.00 | | | | 1,013.11 | | | | 2.40 | | | | 12.18 | | |
| Class I | | | 1,000.00 | | | | 1,018.45 | | | | 1.34 | | | | 6.82 | | |
| Class Q | | | 1,000.00 | | | | 1,017.14 | | | | 1.60 | | | | 8.13 | | |
| ING Greater China Fund | |
| Actual Fund Return | |
| Class A | | $ | 1,000.00 | | | $ | 1,029.70 | | | | 2.64 | % | | $ | 13.51 | | |
| Class B | | | 1,000.00 | | | | 1,025.60 | | | | 3.39 | | | | 17.31 | | |
| Class C | | | 1,000.00 | | | | 1,025.60 | | | | 3.39 | | | | 17.31 | | |
| Class I(a) | | | 1,000.00 | | | | 973.50 | | | | 2.39 | | | | 11.37 | | |
| Hypothetical (Excluding Expenses) | |
| Class A | | $ | 1,000.00 | | | $ | 1,011.90 | | | | 2.64 | % | | $ | 13.39 | | |
| Class B | | | 1,000.00 | | | | 1,008.12 | | | | 3.39 | | | | 17.16 | | |
| Class C | | | 1,000.00 | | | | 1,008.12 | | | | 3.39 | | | | 17.16 | | |
| Class I | | | 1,000.00 | | | | 1,013.16 | | | | 2.39 | | | | 12.13 | | |
| ING Index Plus International Equity Fund | |
| Actual Fund Return | |
| Class A | | $ | 1,000.00 | | | $ | 1,041.00 | | | | 1.15 | % | | $ | 5.92 | | |
| Class B | | | 1,000.00 | | | | 1,038.40 | | | | 1.90 | | | | 9.76 | | |
| Class C | | | 1,000.00 | | | | 1,037.50 | | | | 1.90 | | | | 9.76 | | |
| Class I | | | 1,000.00 | | | | 1,042.80 | | | | 0.90 | | | | 4.63 | | |
| Hypothetical (Excluding Expenses) | |
| Class A | | $ | 1,000.00 | | | $ | 1,019.41 | | | | 1.15 | % | | $ | 5.85 | | |
| Class B | | | 1,000.00 | | | | 1,015.63 | | | | 1.90 | | | | 9.65 | | |
| Class C | | | 1,000.00 | | | | 1,015.63 | | | | 1.90 | | | | 9.65 | | |
| Class I | | | 1,000.00 | | | | 1,020.67 | | | | 0.90 | | | | 4.58 | | |
* Expenses are equal to each Fund's respective annualized expense ratios multiplied by the average account value over the period, multiplied by 184/365 to reflect the most recent fiscal half-year (except "Actual Fund Return" information for ING Greater China Fund Class I, which reflects the 176-day period ended October 31, 2006 due to its inception date of May 8, 2006).
(a) Commencement of operations for Class I on May 8, 2006.
42
SHAREHOLDER EXPENSE EXAMPLES (UNAUDITED) (CONTINUED)
| ING International Fund | | Beginning
Account
Value
May 1, 2006 | | Ending
Account
Value
October 31, 2006 | | Annualized
Expense
Ratio | | Expenses Paid
During the
Six Months Ended
October 31, 2006* | |
| Actual Fund Return | |
| Class A | | $ | 1,000.00 | | | $ | 997.00 | | | | 1.65 | % | | $ | 8.31 | | |
| Class B | | | 1,000.00 | | | | 993.70 | | | | 2.40 | | | | 12.06 | | |
| Class C | | | 1,000.00 | | | | 993.70 | | | | 2.40 | | | | 12.06 | | |
| Class I | | | 1,000.00 | | | | 999.20 | | | | 1.25 | | | | 6.30 | | |
| Class Q | | | 1,000.00 | | | | 998.50 | | | | 1.50 | | | | 7.56 | | |
| Hypothetical (Excluding Expenses) | |
| Class A | | $ | 1,000.00 | | | $ | 1,016.89 | | | | 1.65 | % | | $ | 8.39 | | |
| Class B | | | 1,000.00 | | | | 1,013.11 | | | | 2.40 | | | | 12.18 | | |
| Class C | | | 1,000.00 | | | | 1,013.11 | | | | 2.40 | | | | 12.18 | | |
| Class I | | | 1,000.00 | | | | 1,018.90 | | | | 1.25 | | | | 6.36 | | |
| Class Q | | | 1,000.00 | | | | 1,017.64 | | | | 1.50 | | | | 7.63 | | |
| ING International Capital Appreciation Fund | |
| Actual Fund Return | |
| Class A | | $ | 1,000.00 | | | $ | 1,041.10 | | | | 1.50 | % | | $ | 7.72 | | |
| Class B | | | 1,000.00 | | | | 1,038.50 | | | | 2.25 | | | | 11.56 | | |
| Class C | | | 1,000.00 | | | | 1,039.40 | | | | 2.25 | | | | 11.57 | | |
| Class I | | | 1,000.00 | | | | 1,043.80 | | | | 1.22 | | | | 6.28 | | |
| Hypothetical (Excluding Expenses) | |
| Class A | | $ | 1,000.00 | | | $ | 1,017.64 | | | | 1.50 | % | | $ | 7.63 | | |
| Class B | | | 1,000.00 | | | | 1,013.86 | | | | 2.25 | | | | 11.42 | | |
| Class C | | | 1,000.00 | | | | 1,013.86 | | | | 2.25 | | | | 11.42 | | |
| Class I | | | 1,000.00 | | | | 1,019.06 | | | | 1.22 | | | | 6.21 | | |
| ING International Real Estate Fund | |
| Actual Fund Return | |
| Class A | | $ | 1,000.00 | | | $ | 1,110.30 | | | | 1.50 | % | | $ | 7.98 | | |
| Class B | | | 1,000.00 | | | | 1,104.60 | | | | 2.25 | | | | 11.94 | | |
| Class C | | | 1,000.00 | | | | 1,105.30 | | | | 2.25 | | | | 11.94 | | |
| Class I | | | 1,000.00 | | | | 1,111.60 | | | | 1.25 | | | | 6.65 | | |
| Hypothetical (Excluding Expenses) | |
| Class A | | $ | 1,000.00 | | | $ | 1,017.64 | | | | 1.50 | % | | $ | 7.63 | | |
| Class B | | | 1,000.00 | | | | 1,013.86 | | | | 2.25 | | | | 11.42 | | |
| Class C | | | 1,000.00 | | | | 1,013.86 | | | | 2.25 | | | | 11.42 | | |
| Class I | | | 1,000.00 | | | | 1,018.90 | | | | 1.25 | | | | 6.36 | | |
* Expenses are equal to each Fund's respective annualized expense ratios multiplied by the average account value over the period, multiplied by 184/365 to reflect the most recent fiscal half-year.
43
SHAREHOLDER EXPENSE EXAMPLES (UNAUDITED) (CONTINUED)
| ING International SmallCap Fund | | Beginning
Account
Value
May 1, 2006 | | Ending
Account
Value
October 31, 2006 | | Annualized
Expense
Ratio | | Expenses Paid
During the
Six Months Ended
October 31, 2006* | |
| Actual Fund Return | |
| Class A | | $ | 1,000.00 | | | $ | 970.40 | | | | 1.66 | % | | $ | 8.24 | | |
| Class B | | | 1,000.00 | | | | 967.30 | | | | 2.31 | | | | 11.45 | | |
| Class C | | | 1,000.00 | | | | 967.10 | | | | 2.31 | | | | 11.45 | | |
| Class I | | | 1,000.00 | | | | 972.70 | | | | 1.20 | | | | 5.97 | | |
| Class Q | | | 1,000.00 | | | | 971.20 | | | | 1.45 | | | | 7.20 | | |
| Hypothetical (Excluding Expenses) | |
| Class A | | $ | 1,000.00 | | | $ | 1,016.84 | | | | 1.66 | % | | $ | 8.44 | | |
| Class B | | | 1,000.00 | | | | 1,013.56 | | | | 2.31 | | | | 11.72 | | |
| Class C | | | 1,000.00 | | | | 1,013.56 | | | | 2.31 | | | | 11.72 | | |
| Class I | | | 1,000.00 | | | | 1,019.16 | | | | 1.20 | | | | 6.11 | | |
| Class Q | | | 1,000.00 | | | | 1,017.90 | | | | 1.45 | | | | 7.37 | | |
| ING International Value Fund | |
| Actual Fund Return | |
| Class A | | $ | 1,000.00 | | | $ | 1,036.60 | | | | 1.60 | % | | $ | 8.21 | | |
| Class B | | | 1,000.00 | | | | 1,032.80 | | | | 2.30 | | | | 11.78 | | |
| Class C | | | 1,000.00 | | | | 1,032.50 | | | | 2.30 | | | | 11.78 | | |
| Class I | | | 1,000.00 | | | | 1,038.50 | | | | 1.22 | | | | 6.27 | | |
| Class Q | | | 1,000.00 | | | | 1,037.50 | | | | 1.47 | | | | 7.55 | | |
| Hypothetical (Excluding Expenses) | |
| Class A | | $ | 1,000.00 | | | $ | 1,017.14 | | | | 1.60 | % | | $ | 8.13 | | |
| Class B | | | 1,000.00 | | | | 1,013.61 | | | | 2.30 | | | | 11.67 | | |
| Class C | | | 1,000.00 | | | | 1,013.61 | | | | 2.30 | | | | 11.67 | | |
| Class I | | | 1,000.00 | | | | 1,019.06 | | | | 1.22 | | | | 6.21 | | |
| Class Q | | | 1,000.00 | | | | 1,017.80 | | | | 1.47 | | | | 7.48 | | |
| ING International Value Choice Fund | |
| Actual Fund Return | |
| Class A | | $ | 1,000.00 | | | $ | 1,002.40 | | | | 1.69 | % | | $ | 8.53 | | |
| Class B | | | 1,000.00 | | | | 999.20 | | | | 2.44 | | | | 12.30 | | |
| Class C | | | 1,000.00 | | | | 998.40 | | | | 2.44 | | | | 12.29 | | |
| Class I | | | 1,000.00 | | | | 1,003.20 | | | | 1.34 | | | | 6.77 | | |
| Hypothetical (Excluding Expenses) | |
| Class A | | $ | 1,000.00 | | | $ | 1,016.69 | | | | 1.69 | % | | $ | 8.59 | | |
| Class B | | | 1,000.00 | | | | 1,012.91 | | | | 2.44 | | | | 12.38 | | |
| Class C | | | 1,000.00 | | | | 1,012.91 | | | | 2.44 | | | | 12.38 | | |
| Class I | | | 1,000.00 | | | | 1,018.45 | | | | 1.34 | | | | 6.82 | | |
* Expenses are equal to each Fund's respective annualized expense ratios multiplied by the average account value over the period, multiplied by 184/365 to reflect the most recent fiscal half-year.
44
SHAREHOLDER EXPENSE EXAMPLES (UNAUDITED) (CONTINUED)
| ING Russia Fund | | Beginning
Account
Value
May 1, 2006 | | Ending
Account
Value
October 31, 2006 | | Annualized
Expense
Ratio | | Expenses Paid
During the
Six Months Ended
October 31, 2006* | |
| Actual Fund Return | | $ | 1,000.00 | | | $ | 1,020.50 | | | | 2.14 | % | | $ | 10.90 | | |
| Hypothetical (Excluding Expenses) | | | 1,000.00 | | | | 1,014.42 | | | | 2.14 | | | | 10.87 | | |
| ING Emerging Markets Fixed Income Fund | |
| Actual Fund Return | |
| Class A | | $ | 1,000.00 | | | $ | 1,052.10 | | | | 1.25 | % | | $ | 6.47 | | |
| Class B | | | 1,000.00 | | | | 1,048.70 | | | | 2.00 | | | | 10.33 | | |
| Class C | | | 1,000.00 | | | | 1,047.70 | | | | 2.00 | | | | 10.32 | | |
| Hypothetical (Excluding Expenses) | |
| Class A | | $ | 1,000.00 | | | $ | 1,018.90 | | | | 1.25 | % | | $ | 6.36 | | |
| Class B | | | 1,000.00 | | | | 1,015.12 | | | | 2.00 | | | | 10.16 | | |
| Class C | | | 1,000.00 | | | | 1,015.12 | | | | 2.00 | | | | 10.16 | | |
| ING Global Bond Fund(a) | |
| Actual Fund Return | |
| Class A | | $ | 1,000.00 | | | $ | 1,031.30 | | | | 0.90 | % | | $ | 3.08 | | |
| Class B | | | 1,000.00 | | | | 1,028.40 | | | | 1.65 | | | | 5.64 | | |
| Class C | | | 1,000.00 | | | | 1,028.20 | | | | 1.65 | | | | 5.64 | | |
| Class I | | | 1,000.00 | | | | 1,032.30 | | | | 0.55 | | | | 1.88 | | |
| Hypothetical (Excluding Expenses) | |
| Class A | | $ | 1,000.00 | | | $ | 1,020.67 | | | | 0.90 | % | | $ | 4.58 | | |
| Class B | | | 1,000.00 | | | | 1,016.89 | | | | 1.65 | | | | 8.39 | | |
| Class C | | | 1,000.00 | | | | 1,016.89 | | | | 1.65 | | | | 8.39 | | |
| Class I | | | 1,000.00 | | | | 1,022.43 | | | | 0.55 | | | | 2.80 | | |
| ING Diversified International Fund | |
| Actual Fund Return | |
| Class A | | $ | 1,000.00 | | | $ | 1,017.50 | | | | 0.35 | % | | $ | 1.78 | | |
| Class B | | | 1,000.00 | | | | 1,013.20 | | | | 1.10 | | | | 5.58 | | |
| Class C | | | 1,000.00 | | | | 1,013.20 | | | | 1.10 | | | | 5.58 | | |
| Class I | | | 1,000.00 | | | | 1,018.40 | | | | 0.10 | | | | 0.51 | | |
| Hypothetical (Excluding Expenses) | |
| Class A | | $ | 1,000.00 | | | $ | 1,023.44 | | | | 0.35 | % | | $ | 1.79 | | |
| Class B | | | 1,000.00 | | | | 1,019.66 | | | | 1.10 | | | | 5.60 | | |
| Class C | | | 1,000.00 | | | | 1,019.66 | | | | 1.10 | | | | 5.60 | | |
| Class I | | | 1,000.00 | | | | 1,024.70 | | | | 0.10 | | | | 0.51 | | |
* Expenses are equal to each Fund's respective annualized expense ratios multiplied by the average account value over the period, multiplied by 184/365 to reflect the most recent fiscal half-year (except for "Actual Fund Return" information for ING Global Bond Fund, which reflects the 123-day period ended October 31, 2006 due to inception date of June 30, 2006 for all classes).
(a) Commencement of operations on June 30, 2006.
45
REPORT OF INDEPENDENT REGISTERED PUBLIC ACCOUNTING FIRM
The Board of Trustees and Shareholders
of ING Mutual Funds and ING Mayflower Trust:
We have audited the accompanying statements of assets and liabilities, including the portfolios of investments, of ING Global Equity Dividend Fund, ING Natural Resources Fund (formerly ING Precious Metals Fund), ING Global Real Estate Fund, ING Global Value Choice Fund, ING Emerging Countries Fund, ING Foreign Fund, ING Greater China Fund, ING Index Plus International Equity Fund, ING International Fund, ING International Capital Appreciation Fund, ING International Real Estate Fund, ING International SmallCap Fund, ING International Value Choice Fund, ING Russia Fund, ING Emerging Markets Fixed Income Fund, ING Global Bond Fund, and ING Diversified International Fund, each a series of ING Mutual Funds, and ING International Value Fund, a series of ING Mayflower Trust, (collectively the "Funds") as of October 31, 2006, and the related statements of operations for the year or period then ended, the statements of changes in net assets for each of the years or periods in the two-year period then ended, and the financial highlights for each of the years or periods in the four-year period then ended. These financial statements and financial highlights are the responsibility of management. Our responsibility is to express an opinion on these financial statements and financial highlights based on our audits. The financial highlights for the year or period prior to November 1, 2002 were audited by other auditors whose report thereon dated December 17, 2002, expressed an unqualified opinion on those financial highlights.
We conducted our audits in accordance with the standards of the Public Company Accounting Oversight Board (United States). Those standards require that we plan and perform the audits to obtain reasonable assurance about whether the financial statements and financial highlights are free of material misstatement. An audit includes examining, on a test basis, evidence supporting the amounts and disclosures in the financial statements. Our procedures included confirmation of securities owned as of October 31, 2006 by correspondence with the custodian and brokers, or by other appropriate auditing procedures. An audit also includes assessing the accounting principles used and significant estimates made by management, as well as evaluating the overall financial statement presentation. We believe that our audits provide a reasonable basis for our opinion.
In our opinion, the financial statements and financial highlights referred to above present fairly, in all material respects, the financial position of ING Global Equity Dividend Fund, ING Natural Resources Fund, ING Global Real Estate Fund, ING Global Value Choice Fund, ING Emerging Countries Fund, ING Foreign Fund, ING Greater China Fund, ING Index Plus International Equity Fund, ING International Fund, ING International Capital Appreciation Fund, ING International Real Estate Fund, ING International SmallCap Fund, ING International Value Choice Fund, ING Russia Fund, ING Emerging Markets Fixed Income Fund, ING Global Bond Fund, ING Diversified International Fund, and ING International Value Fund as of October 31, 2006, and the results of their operations, the changes in their net assets, and the financial highlights for the periods specified in the first paragraph above, in conformity with U.S generally accepted accounting principles.

Boston, Massachusetts
December 22, 2006
46
STATEMENTS OF ASSETS AND LIABILITIES AS OF OCTOBER 31, 2006
| | | ING
Global Equity
Dividend
Fund | | ING
Global
Natural
Resources
Fund | | ING
Global
Real Estate
Fund | | ING
Global
Value Choice
Fund | |
| ASSETS: | |
| Investments in securities at value+* | | $ | 218,730,318 | | | $ | 120,194,187 | | | $ | 591,309,752 | | | $ | 96,405,259 | | |
| Investments in affiliate** | | | — | | | | — | | | | 2,956,232 | | | | — | | |
| Short-term investments at amortized cost | | | 15,854,000 | | | | — | | | | 54,341,981 | | | | 33,503,103 | | |
| Cash | | | 19,368,693 | | | | 319,798 | | | | 2,480,674 | | | | 725,242 | | |
| Foreign currencies at value*** | | | — | | | | — | | | | 20,292 | | | | 9,650 | | |
| Receivables: | |
| Investment securities sold | | | 23,097 | | | | 2,065,991 | | | | 8,974,006 | | | | 3,248,570 | | |
| Fund shares sold | | | 1,888,962 | | | | 358,612 | | | | 11,768,693 | | | | 126,330 | | |
| Dividends and interest | | | 284,809 | | | | 36,335 | | | | 631,629 | | | | 106,048 | | |
| Receivable due from affiliate | | | 108 | | | | — | | | | — | | | | — | | |
| Prepaid expenses | | | 20,683 | | | | 8,881 | | | | 45,397 | | | | 19,029 | | |
| Total assets | | | 256,170,670 | | | | 122,983,804 | | | | 672,528,656 | | | | 134,143,231 | | |
| LIABILITIES: | |
| Payable for investment securities purchased | | | 7,704,984 | | | | 1,200,499 | | | | 20,162,671 | | | | 854,407 | | |
| Payable for fund shares redeemed | | | 513,117 | | | | 429,826 | | | | 602,156 | | | | 241,744 | | |
| Payable upon receipt of securities loaned | | | 15,854,000 | | | | — | | | | 31,514,000 | | | | 26,721,000 | | |
| Payable to affiliates | | | 271,278 | | | | 119,925 | | | | 619,852 | | | | 156,117 | | |
Payable to custodian due to foreign currency
overdraft**** | | | 461,017 | | | | — | | | | — | | | | — | | |
| Payable for trustee fees | | | 1,240 | | | | 51,089 | | | | 875 | | | | 30,161 | | |
| Other accrued expenses and liabilities | | | 91,452 | | | | 70,042 | | | | 123,951 | | | | 92,045 | | |
| Total liabilities | | | 24,897,088 | | | | 1,871,381 | | | | 53,023,505 | | | | 28,095,474 | | |
| NET ASSETS | | $ | 231,273,582 | | | $ | 121,112,423 | | | $ | 619,505,151 | | | $ | 106,047,757 | | |
| NET ASSETS WERE COMPRISED OF: | |
| Paid-in capital | | $ | 194,738,845 | | | $ | 104,549,781 | | | $ | 490,722,617 | | | $ | 273,339,338 | | |
Undistributed net investment income
(accumulated net investment loss) | | | 957,740 | | | | 2,905,734 | | | | (1,380,929 | ) | | | 4,954 | | |
Accumulated net realized gain (loss) on
investments and foreign currency related
transactions | | | 10,983,029 | | | | 3,817,373 | | | | 7,215,765 | | | | (175,620,929 | ) | |
Net unrealized appreciation on
investments and foreign currency related
transactions | | | 24,593,968 | | | | 9,839,535 | | | | 122,947,698 | | | | 8,324,394 | | |
| NET ASSETS | | $ | 231,273,582 | | | $ | 121,112,423 | | | $ | 619,505,151 | | | $ | 106,047,757 | | |
| + Including securities loaned at value | | $ | 15,405,250 | | | $ | — | | | $ | 30,770,046 | | | $ | 26,108,298 | | |
| * Cost of investments in securities | | $ | 194,136,536 | | | $ | 110,354,426 | | | $ | 469,088,811 | | | $ | 88,083,835 | | |
| ** Cost of investment in affiliate | | $ | — | | | $ | — | | | $ | 2,242,416 | | | $ | — | | |
| *** Cost of foreign currencies | | $ | — | | | $ | — | | | $ | 19,005 | | | $ | 9,529 | | |
| **** Cost of foreign currency overdraft | | $ | 460,982 | | | $ | — | | | $ | — | | | $ | — | | |
See Accompanying Notes to Financial Statements
47
STATEMENTS OF ASSETS AND LIABILITIES AS OF OCTOBER 31, 2006 (CONTINUED)
| | | ING
Global Equity
Dividend
Fund | | ING
Global
Natural
Resources
Fund | | ING
Global
Real Estate
Fund | | ING
Global
Value Choice
Fund | |
| Class A: | |
| Net assets | | $ | 108,911,263 | | | $ | 121,112,423 | | | $ | 467,404,949 | | | $ | 47,304,983 | | |
| Shares authorized | | | unlimited | | | | unlimited | | | | unlimited | | | | unlimited | | |
| Par value | | $ | — | | | $ | — | | | $ | — | | | $ | — | | |
| Shares outstanding | | | 6,911,011 | | | | 11,578,244 | | | | 21,024,819 | | | | 2,177,804 | | |
| Net asset value and redemption price per share | | $ | 15.76 | | | $ | 10.46 | | | $ | 22.23 | | | $ | 21.72 | | |
| Maximum offering price per share (5.75%)(1) | | $ | 16.72 | | | $ | 11.10 | | | $ | 23.59 | | | $ | 23.05 | | |
| Class B: | |
| Net assets | | $ | 44,935,968 | | | | n/a | | | $ | 31,676,953 | | | $ | 21,364,068 | | |
| Shares authorized | | | unlimited | | | | n/a | | | | unlimited | | | | unlimited | | |
| Par value | | $ | — | | | | n/a | | | $ | — | | | $ | — | | |
| Shares outstanding | | | 2,857,757 | | | | n/a | | | | 1,649,968 | | | | 907,390 | | |
| Net asset value and redemption price per share(2) | | $ | 15.72 | | | | n/a | | | $ | 19.20 | | | $ | 23.54 | | |
| Maximum offering price per share | | $ | 15.72 | | | | n/a | | | $ | 19.20 | | | $ | 23.54 | | |
| Class C: | |
| Net assets | | $ | 77,426,351 | | | | n/a | | | $ | 109,197,407 | | | $ | 31,611,692 | | |
| Shares authorized | | | unlimited | | | | n/a | | | | unlimited | | | | unlimited | | |
| Par value | | $ | — | | | | n/a | | | $ | — | | | $ | — | | |
| Shares outstanding | | | 4,933,846 | | | | n/a | | | | 5,432,676 | | | | 1,510,661 | | |
| Net asset value and redemption price per share(2) | | $ | 15.69 | | | | n/a | | | $ | 20.10 | | | $ | 20.93 | | |
| Maximum offering price per share | | $ | 15.69 | | | | n/a | | | $ | 20.10 | | | $ | 20.93 | | |
| Class I: | |
| Net assets | | | n/a | | | | n/a | | | $ | 11,225,842 | | | $ | 3,010,107 | | |
| Shares authorized | | | n/a | | | | n/a | | | | unlimited | | | | unlimited | | |
| Par value | | | n/a | | | | n/a | | | $ | — | | | $ | — | | |
| Shares outstanding | | | n/a | | | | n/a | | | | 504,988 | | | | 138,497 | | |
| Net asset value and redemption price per share | | | n/a | | | | n/a | | | $ | 22.23 | | | $ | 21.73 | | |
| Maximum offering price per share | | | n/a | | | | n/a | | | $ | 22.23 | | | $ | 21.73 | | |
| Class O: | |
| Net assets | | $ | — | | | | n/a | | | $ | — | | | | n/a | | |
| Shares authorized | | | unlimited | | | | n/a | | | | unlimited | | | | n/a | | |
| Par value | | $ | — | | | | n/a | | | $ | — | | | | n/a | | |
| Shares outstanding | | $ | — | | | | n/a | | | $ | — | | | | n/a | | |
| Net asset value and redemption price per share | | $ | — | | | | n/a | | | $ | — | | | | n/a | | |
| Maximum offering price per share | | $ | — | | | | n/a | | | $ | — | | | | n/a | | |
| Class Q: | |
| Net assets | | | n/a | | | | n/a | | | | n/a | | | $ | 2,756,907 | | |
| Shares authorized | | | n/a | | | | n/a | | | | n/a | | | | unlimited | | |
| Par value | | | n/a | | | | n/a | | | | n/a | | | $ | — | | |
| Shares outstanding | | | n/a | | | | n/a | | | | n/a | | | | 108,367 | | |
| Net asset value and redemption price per share | | | n/a | | | | n/a | | | | n/a | | | $ | 25.44 | | |
| Maximum offering price per share | | | n/a | | | | n/a | | | | n/a | | | $ | 25.44 | | |
(1) Maximum offering price is computed at 100/94.25 of net asset value. On purchases of $50,000 or more, the offering price is reduced.
(2) Redemption price per share may be reduced for any applicable contingent deferred sales charges.
See Accompanying Notes to Financial Statements
48
STATEMENTS OF ASSETS AND LIABILITIES AS OF OCTOBER 31, 2006
| | | ING
Emerging
Countries
Fund | | ING
Foreign
Fund | | ING
Greater
China
Fund | | ING
Index Plus
International
Equity
Fund | |
| ASSETS: | |
| Investments in securities at value+* | | $ | 197,050,180 | | | $ | 453,067,887 | | | $ | 26,769,086 | | | $ | 88,087,005 | | |
| Short-term investments at amortized cost | | | 22,186,698 | | | | 13,524,963 | | | | — | | | | — | | |
| Cash | | | 8,343,196 | | | | 97,878 | | | | 905,190 | | | | 1,429,186 | | |
| Foreign currencies at value** | | | 82,460 | | | | 9,200,168 | | | | 48,666 | | | | — | | |
| Receivables: | |
| Investment securities sold | | | — | | | | 22,956,067 | | | | — | | | | 39,156,809 | | |
| Fund shares sold | | | 642,055 | | | | 2,239,944 | | | | 157,563 | | | | 1,258,525 | | |
| Dividends and interest | | | 972,898 | | | | 544,678 | | | | 9,786 | | | | 129,822 | | |
| Receivable due from affiliate | | | — | | | | — | | | | 556 | | | | — | | |
Unrealized appreciation on forward
foreign currency contracts | | | — | | | | 54,708 | | | | — | | | | — | | |
| Prepaid expenses | | | 22,796 | | | | 27,692 | | | | 18,161 | | | | 17,928 | | |
| Reimbursement due from manager | | | — | | | | — | | | | — | | | | 7,126 | | |
| Total assets | | | 229,300,283 | | | | 501,713,985 | | | | 27,909,008 | | | | 130,086,401 | | |
| LIABILITIES: | |
| Payable for investment securities purchased | | | — | | | | 11,492,229 | | | | — | | | | 38,051,717 | | |
| Payable for fund shares redeemed | | | 636,539 | | | | 822,167 | | | | 28 | | | | — | | |
| Payable upon receipt of securities loaned | | | 19,904,000 | | | | 13,242,000 | | | | — | | | | — | | |
Unrealized depreciation on forward currency
contracts | | | — | | | | 786,745 | | | | — | | | | — | | |
| Payable to affiliates | | | 297,260 | | | | 636,816 | | | | 36,569 | | | | 65,758 | | |
Payable to custodian due to foreign
currency overdraft*** | | | — | | | | — | | | | — | | | | 9,450 | | |
| Payable for trustee fees | | | 45,785 | | | | 2,160 | | | | 1,511 | | | | 1,169 | | |
| Other accrued expenses and liabilities | | | 157,409 | | | | 232,384 | | | | 59,145 | | | | 66,036 | | |
| Total liabilities | | | 21,040,993 | | | | 27,214,501 | | | | 97,253 | | | | 38,194,130 | | |
| NET ASSETS | | $ | 208,259,290 | | | $ | 474,499,484 | | | $ | 27,811,755 | | | $ | 91,892,271 | | |
| NET ASSETS WERE COMPRISED OF: | |
| Paid-in capital | | $ | 228,993,741 | | | $ | 364,433,927 | | | $ | 24,230,991 | | | $ | 83,495,669 | | |
Undistributed net investment income
(accumulated net investment loss) | | | 2,923,300 | | | | 727,435 | | | | 137,964 | | | | 888,758 | | |
Accumulated net realized gain (loss) on
investments and foreign currency related
transactions | | | (41,669,881 | ) | | | 15,374,102 | | | | (77,020 | ) | | | 1,797,283 | | |
Net unrealized appreciation on
investments and foreign currency
related transactions | | | 18,012,130 | | | | 93,964,020 | | | | 3,519,820 | | | | 5,710,561 | | |
| NET ASSETS | | $ | 208,259,290 | | | $ | 474,499,484 | | | $ | 27,811,755 | | | $ | 91,892,271 | | |
| + Including securities loaned at value | | $ | 19,011,184 | | | $ | 12,881,285 | | | $ | — | | | $ | — | | |
| * Cost of investments in securities | | $ | 179,040,263 | | | $ | 358,391,233 | | | $ | 23,249,211 | | | $ | 82,376,842 | | |
| ** Cost of foreign currencies | | $ | 82,544 | | | $ | 9,187,417 | | | $ | 48,658 | | | $ | — | | |
| *** Cost of foreign currency overdraft | | $ | — | | | $ | — | | | $ | — | | | $ | 9,384 | | |
See Accompanying Notes to Financial Statements
49
STATEMENTS OF ASSETS AND LIABILITIES AS OF OCTOBER 31, 2006 (CONTINUED)
| | | ING
Emerging
Countries
Fund | | ING
Foreign
Fund | | ING
Greater
China
Fund | | ING
Index Plus
International
Equity
Fund | |
| Class A: | |
| Net assets | | $ | 123,218,683 | | | $ | 219,818,736 | | | $ | 23,709,308 | | | $ | 12,512,996 | | |
| Shares authorized | | | unlimited | | | | unlimited | | | | unlimited | | | | unlimited | | |
| Par value | | $ | — | | | $ | — | | | $ | — | | | $ | — | | |
| Shares outstanding | | | 4,159,286 | | | | 11,846,302 | | | | 1,898,143 | | | | 1,071,061 | | |
| Net asset value and redemption price per share | | $ | 29.62 | | | $ | 18.56 | | | $ | 12.49 | | | $ | 11.68 | | |
| Maximum offering price per share (5.75%)(1) | | $ | 31.43 | | | $ | 19.69 | | | $ | 13.25 | | | $ | 12.39 | | |
| Class B: | |
| Net assets | | $ | 13,574,989 | | | $ | 38,136,188 | | | $ | 1,956,534 | | | $ | 264,322 | | |
| Shares authorized | | | unlimited | | | | unlimited | | | | unlimited | | | | unlimited | | |
| Par value | | $ | — | | | $ | — | | | $ | — | | | $ | — | | |
| Shares outstanding | | | 467,495 | | | | 2,106,133 | | | | 157,495 | | | | 22,727 | | |
| Net asset value and redemption price per share(2) | | $ | 29.04 | | | $ | 18.11 | | | $ | 12.42 | | | $ | 11.63 | | |
| Maximum offering price per share | | $ | 29.04 | | | $ | 18.11 | | | $ | 12.42 | | | $ | 11.63 | | |
| Class C: | |
| Net assets | | $ | 35,847,140 | | | $ | 154,101,227 | | | $ | 2,123,777 | | | $ | 534,007 | | |
| Shares authorized | | | unlimited | | | | unlimited | | | | unlimited | | | | unlimited | | |
| Par value | | $ | — | | | $ | — | | | $ | — | | | $ | — | | |
| Shares outstanding | | | 1,302,195 | | | | 8,497,414 | | | | 170,887 | | | | 46,006 | | |
| Net asset value and redemption price per share(2) | | $ | 27.53 | | | $ | 18.14 | | | $ | 12.43 | | | $ | 11.61 | | |
| Maximum offering price per share | | $ | 27.53 | | | $ | 18.14 | | | $ | 12.43 | | | $ | 11.61 | | |
| Class I: | |
| Net assets | | $ | 23,456,457 | | | $ | 61,247,753 | | | $ | 22,136 | | | $ | 78,580,946 | | |
| Shares authorized | | | unlimited | | | | unlimited | | | | unlimited | | | | unlimited | | |
| Par value | | $ | — | | | $ | — | | | $ | — | | | $ | — | | |
| Shares outstanding | | | 789,129 | | | | 3,261,411 | | | | 1,771 | | | | 6,716,924 | | |
| Net asset value and redemption price per share | | $ | 29.72 | | | $ | 18.78 | | | $ | 12.50 | | | $ | 11.70 | | |
| Maximum offering price per share | | $ | 29.72 | | | $ | 18.78 | | | $ | 12.50 | | | $ | 11.70 | | |
| Class M: | |
| Net assets | | $ | 1,462,150 | | | | n/a | | | | n/a | | | | n/a | | |
| Shares authorized | | | unlimited | | | | n/a | | | | n/a | | | | n/a | | |
| Par value | | $ | — | | | | n/a | | | | n/a | | | | n/a | | |
| Shares outstanding | | | 50,205 | | | | n/a | | | | n/a | | | | n/a | | |
| Net asset value and redemption price per share | | $ | 29.12 | | | | n/a | | | | n/a | | | | n/a | | |
| Maximum offering price per share (3.50%)(3) | | $ | 30.18 | | | | n/a | | | | n/a | | | | n/a | | |
| Class Q: | |
| Net assets | | $ | 10,699,871 | | | $ | 1,195,580 | | | | n/a | | | | n/a | | |
| Shares authorized | | | unlimited | | | | unlimited | | | | n/a | | | | n/a | | |
| Par value | | $ | — | | | $ | — | | | | n/a | | | | n/a | | |
| Shares outstanding | | | 349,418 | | | | 64,243 | | | | n/a | | | | n/a | | |
| Net asset value and redemption price per share | | $ | 30.62 | | | $ | 18.61 | | | | n/a | | | | n/a | | |
| Maximum offering price per share | | $ | 30.62 | | | $ | 18.61 | | | | n/a | | | | n/a | | |
(1) Maximum offering price is computed at 100/94.25 of net asset value. On purchases of $50,000 or more, the offering price is reduced.
(2) Redemption price per share may be reduced for any applicable contingent deferred sales charges.
(3) Maximum offering price is computed at 100/96.50 of net asset value. On purchases of $50,000 or more, the offering price is reduced.
See Accompanying Notes to Financial Statements
50
STATEMENTS OF ASSETS AND LIABILITIES AS OF OCTOBER 31, 2006
| | | ING
International
Fund | | ING
International
Capital
Appreciation
Fund | | ING
International
Real Estate
Fund | | ING
International
SmallCap
Fund | |
| ASSETS: | |
| Investments in securities at value+* | | $ | 128,764,703 | | | $ | 49,173,289 | | | $ | 78,536,980 | | | $ | 560,211,075 | | |
| Short-term investments at amortized cost | | | 4,054,000 | | | | — | | | | 1,941,743 | | | | 124,864,260 | | |
| Repurchase agreement | | | 3,928,000 | | | | — | | | | — | | | | — | | |
| Cash | | | 18,575 | | | | 6,869 | | | | 8,511,494 | | | | — | | |
| Foreign currencies at value** | | | 43,011 | | | | — | | | | — | | | | 2,767,905 | | |
| Receivables: | |
| Investment securities sold | | | 656,876 | | | | 10,712,512 | | | | 1,786,246 | | | | 19,548,982 | | |
| Fund shares sold | | | 221,396 | | | | 880,656 | | | | 4,066,676 | | | | 1,167,942 | | |
| Dividends and interest | | | 196,806 | | | | 67,662 | | | | 93,064 | | | | 1,089,003 | | |
| Receivable due from affiliate | | | — | | | | — | | | | 20,439 | | | | 3,686 | | |
| Prepaid expenses | | | 24,139 | | | | 16,712 | | | | 37,403 | | | | 28,151 | | |
| Reimbursement due from manager | | | — | | | | 3,793 | | | | 4,150 | | | | — | | |
| Total assets | | | 137,907,506 | | | | 60,861,493 | | | | 94,998,195 | | | | 709,681,004 | | |
| LIABILITIES: | |
| Payable for investment securities purchased | | | 1,554,081 | | | | 5,166,083 | | | | 3,853,420 | | | | 2,270,472 | | |
| Payable for fund shares redeemed | | | 112,314 | | | | 75,730 | | | | 22,556 | | | | 1,143,098 | | |
| Payable upon receipt of securities loaned | | | 4,054,000 | | | | — | | | | — | | | | 96,584,000 | | |
| Payable to affiliates | | | 168,165 | | | | 57,684 | | | | 93,160 | | | | 720,938 | | |
| Payable to custodian due to bank overdraft | | | — | | | | — | | | | — | | | | 22,267,302 | | |
Payable to custodian due to foreign currency
overdraft*** | | | — | | | | 6,882 | | | | 90,820 | | | | — | | |
| Payable for trustee fees | | | 25,946 | | | | 915 | | | | 1,594 | | | | 4,125 | | |
| Other accrued expenses and liabilities | | | 88,075 | | | | 65,639 | | | | 89,041 | | | | 238,481 | | |
| Payable for borrowings against line of credit | | | — | | | | 4,480,000 | | | | — | | | | — | | |
| Total liabilities | | | 6,002,581 | | | | 9,852,933 | | | | 4,150,591 | | | | 123,228,416 | | |
| NET ASSETS | | $ | 131,904,925 | | | $ | 51,008,560 | | | $ | 90,847,604 | | | $ | 586,452,588 | | |
| NET ASSETS WERE COMPRISED OF: | |
| Paid-in capital | | $ | 109,719,993 | | | $ | 46,316,875 | | | $ | 83,610,287 | | | $ | 512,399,327 | | |
| Undistributed net investment income | | | 1,393,902 | | | | 422,118 | | | | 2,391,308 | | | | 3,446,324 | | |
Accumulated net realized gain (loss) on
investments, foreign currency related
transactions, and options | | | 7,290,431 | | | | 775,041 | | | | (2,547,284 | ) | | | (2,222,786 | ) | |
Net unrealized appreciation on
investments, foreign currency related
transactions, and options | | | 13,500,599 | | | | 3,494,526 | | | | 7,393,293 | | | | 72,829,723 | | |
| NET ASSETS | | $ | 131,904,925 | | | $ | 51,008,560 | | | $ | 90,847,604 | | | $ | 586,452,588 | | |
| + Including securities loaned at value | | $ | 3,994,877 | | | $ | — | | | $ | — | | | $ | 91,884,127 | | |
| * Cost of investments in securities | | $ | 115,270,389 | | | $ | 45,680,266 | | | $ | 71,145,939 | | | $ | 487,390,945 | | |
| ** Cost of foreign currencies | | $ | 41,026 | | | $ | — | | | $ | — | | | $ | 2,766,828 | | |
| *** Cost of foreign currency overdraft | | $ | — | | | $ | 68 | | | $ | 95,053 | | | $ | — | | |
See Accompanying Notes to Financial Statements
51
STATEMENTS OF ASSETS AND LIABILITIES AS OF OCTOBER 31, 2006 (CONTINUED)
| | | ING
International
Fund | | ING
International
Capital
Appreciation
Fund | | ING
International
Real Estate
Fund | | ING
International
SmallCap
Fund | |
| Class A: | |
| Net assets | | $ | 58,696,949 | | | $ | 3,677,496 | | | $ | 49,798,477 | | | $ | 243,019,742 | | |
| Shares authorized | | | unlimited | | | | unlimited | | | | unlimited | | | | unlimited | | |
| Par value | | $ | — | | | $ | — | | | $ | — | | | $ | — | | |
| Shares outstanding | | | 4,445,514 | | | | 322,857 | | | | 4,283,534 | | | | 5,153,929 | | |
| Net asset value and redemption price per share | | $ | 13.20 | | | $ | 11.39 | | | $ | 11.63 | | | $ | 47.15 | | |
| Maximum offering price per share (5.75%)(1) | | $ | 14.01 | | | $ | 12.08 | | | $ | 12.34 | | | $ | 50.03 | | |
| Class B: | |
| Net assets | | $ | 16,821,978 | | | $ | 65,666 | | | $ | 1,638,626 | | | $ | 58,469,135 | | |
| Shares authorized | | | unlimited | | | | unlimited | | | | unlimited | | | | unlimited | | |
| Par value | | $ | — | | | $ | — | | | $ | — | | | $ | — | | |
| Shares outstanding | | | 1,325,586 | | | | 5,797 | | | | 141,330 | | | | 1,204,842 | | |
| Net asset value and redemption price per share(2) | | $ | 12.69 | | | $ | 11.33 | | | $ | 11.59 | | | $ | 48.53 | | |
| Maximum offering price per share | | $ | 12.69 | | | $ | 11.33 | | | $ | 11.59 | | | $ | 48.53 | | |
| Class C: | |
| Net assets | | $ | 15,918,154 | | | $ | 65,495 | | | $ | 17,074,597 | | | $ | 65,534,123 | | |
| Shares authorized | | | unlimited | | | | unlimited | | | | unlimited | | | | unlimited | | |
| Par value | | $ | — | | | $ | — | | | $ | — | | | $ | — | | |
| Shares outstanding | | | 1,253,191 | | | | 5,773 | | | | 1,473,456 | | | | 1,476,274 | | |
| Net asset value and redemption price per share(2) | | $ | 12.70 | | | $ | 11.35 | | | $ | 11.59 | | | $ | 44.39 | | |
| Maximum offering price per share | | $ | 12.70 | | | $ | 11.35 | | | $ | 11.59 | | | $ | 44.39 | | |
| Class I: | |
| Net assets | | $ | 13,354,169 | | | $ | 47,199,903 | | | $ | 22,335,904 | | | $ | 137,184,298 | | |
| Shares authorized | | | unlimited | | | | unlimited | | | | unlimited | | | | unlimited | | |
| Par value | | $ | — | | | $ | — | | | $ | — | | | $ | — | | |
| Shares outstanding | | | 1,014,389 | | | | 4,131,002 | | | | 1,919,514 | | | | 2,897,373 | | |
| Net asset value and redemption price per share | | $ | 13.16 | | | $ | 11.43 | | | $ | 11.64 | | | $ | 47.35 | | |
| Maximum offering price per share | | $ | 13.16 | | | $ | 11.43 | | | $ | 11.64 | | | $ | 47.35 | | |
| Class Q: | |
| Net assets | | $ | 27,113,675 | | | | n/a | | | | n/a | | | $ | 82,245,290 | | |
| Shares authorized | | | unlimited | | | | n/a | | | | n/a | | | | unlimited | | |
| Par value | | $ | — | | | | n/a | | | | n/a | | | $ | — | | |
| Shares outstanding | | | 2,069,976 | | | | n/a | | | | n/a | | | | 1,623,935 | | |
| Net asset value and redemption price per share | | $ | 13.10 | | | | n/a | | | | n/a | | | $ | 50.65 | | |
| Maximum offering price per share | | $ | 13.10 | | | | n/a | | | | n/a | | | $ | 50.65 | | |
(1) Maximum offering price is computed at 100/94.25 of net asset value. On purchases of $50,000 or more, the offering price is reduced.
(2) Redemption price per share may be reduced for any applicable contingent deferred sales charges.
See Accompanying Notes to Financial Statements
52
STATEMENTS OF ASSETS AND LIABILITIES AS OF OCTOBER 31, 2006
| | | ING
International
Value
Fund | | ING
International
Value Choice
Fund | | ING
Russia
Fund | | ING
Emerging
Markets
Fixed Income
Fund | |
| ASSETS: | |
| Investments in securities at value+* | | $ | 4,756,502,272 | | | $ | 57,249,044 | | | $ | 725,450,692 | | | $ | 24,132,950 | | |
| Short-term investments at amortized cost | | | 151,437,021 | | | | 3,235,572 | | | | 39,103,000 | | | | — | | |
| Cash | | | 5,232,699 | | | | 1,807,240 | | | | 24,736,423 | | | | 4,773,722 | | |
| Cash collateral for futures | | | — | | | | — | | | | — | | | | 10,800 | | |
| Foreign currencies at value** | | | 1,255 | | | | — | | | | — | | | | — | | |
| Receivables: | |
| Investment securities sold | | | — | | | | 74,958 | | | | 2,175,000 | | | | — | | |
| Fund shares sold | | | 4,816,975 | | | | 681,954 | | | | 4,109,776 | | | | 45,000 | | |
| Dividends and interest | | | 10,956,966 | | | | 53,003 | | | | 2,084,999 | | | | 445,341 | | |
| Receivable due from affiliate | | | — | | | | — | | | | — | | | | 4,206 | | |
| Prepaid expenses | | | 48,312 | | | | 11,537 | | | | 34,675 | | | | 18,137 | | |
| Reimbursement due from manager | | | — | | | | — | | | | — | | | | 4,100 | | |
| Total assets | | | 4,928,995,500 | | | | 63,113,308 | | | | 797,694,565 | | | | 29,434,256 | | |
| LIABILITIES: | |
| Payable for investment securities purchased | | | — | | | | 295,925 | | | | 2,150,729 | | | | 2,386,810 | | |
| Payable for fund shares redeemed | | | 5,035,532 | | | | 20,359 | | | | 3,416,660 | | | | — | | |
| Payable for futures variation margin | | | — | | | | — | | | | — | | | | 9,000 | | |
| Payable upon receipt of securities loaned | | | 68,412,000 | | | | — | | | | 39,103,000 | | | | — | | |
| Payable to affiliates | | | 5,899,519 | | | | 115,679 | | | | 1,002,746 | | | | 14,530 | | |
Payable to custodian due to foreign currency
overdraft*** | | | — | | | | 36,126 | | | | — | | | | 225,337 | | |
| Payable for trustee fees | | | 28,105 | | | | 1,396 | | | | 23,136 | | | | 1,655 | | |
| Other accrued expenses and liabilities | | | 1,631,232 | | | | 29,326 | | | | 51,044 | | | | 39,085 | | |
| Total liabilities | | | 81,006,388 | | | | 498,811 | | | | 45,747,315 | | | | 2,676,417 | | |
| NET ASSETS | | $ | 4,847,989,112 | | | $ | 62,614,497 | | | $ | 751,947,250 | | | $ | 26,757,839 | | |
| NET ASSETS WERE COMPRISED OF: | |
| Paid-in capital | | $ | 3,218,949,124 | | | $ | 57,792,505 | | | $ | 437,678,040 | | | $ | 26,292,531 | | |
Undistributed net investment income
(accumulated net investment loss) | | | 40,659,747 | | | | 332,255 | | | | — | | | | 113,485 | | |
Accumulated net realized gain on
investments, foreign currency related
transactions, and futures | | | 481,474,234 | | | | 1,116,008 | | | | 42,730,766 | | | | 84,369 | | |
Net unrealized appreciation on
investments, foreign currency related
transactions, and futures | | | 1,106,906,007 | | | | 3,373,729 | | | | 271,538,444 | | | | 267,454 | | |
| NET ASSETS | | $ | 4,847,989,112 | | | $ | 62,614,497 | | | $ | 751,947,250 | | | $ | 26,757,839 | | |
| + Including securities loaned at value | | $ | 61,735,704 | | | $ | — | | | $ | 38,364,134 | | | $ | — | | |
| * Cost of investments in securities | | $ | 3,649,752,054 | | | $ | 53,875,383 | | | $ | 453,912,316 | | | $ | 23,844,273 | | |
| ** Cost of foreign currencies | | $ | 1,242 | | | $ | — | | | $ | — | | | $ | — | | |
| *** Cost of foreign currency overdraft | | $ | — | | | $ | 36,121 | | | $ | — | | | $ | 224,031 | | |
See Accompanying Notes to Financial Statements
53
STATEMENTS OF ASSETS AND LIABILITIES AS OF OCTOBER 31, 2006 (CONTINUED)
| | | ING
International
Value
Fund | | ING
International
Value Choice
Fund | | ING
Russia
Fund | | ING
Emerging
Markets
Fixed Income
Fund | |
| Class A: | |
| Net assets | | $ | 1,995,026,546 | | | $ | 17,961,649 | | | $ | 751,947,250 | | | $ | 26,120,729 | | |
| Shares authorized | | | unlimited | | | | unlimited | | | | unlimited | | | | unlimited | | |
| Par value | | $ | 0.01 | | | $ | — | | | $ | — | | | $ | — | | |
| Shares outstanding | | | 92,692,533 | | | | 1,446,743 | | | | 13,473,211 | | | | 2,529,697 | | |
| Net asset value and redemption price per share | | $ | 21.52 | | | $ | 12.42 | | | $ | 55.81 | | | $ | 10.33 | | |
| Maximum offering price per share (5.75%)(1) | | $ | 22.83 | | | $ | 13.18 | | | $ | 59.22 | | | $ | 10.59 | (3) | |
| Class B: | |
| Net assets | | $ | 368,952,099 | | | $ | 3,564,884 | | | | n/a | | | $ | 292,918 | | |
| Shares authorized | | | unlimited | | | | unlimited | | | | n/a | | | | unlimited | | |
| Par value | | $ | 0.01 | | | $ | — | | | | n/a | | | $ | — | | |
| Shares outstanding | | | 17,511,860 | | | | 290,612 | | | | n/a | | | | 28,450 | | |
| Net asset value and redemption price per share(2) | | $ | 21.07 | | | $ | 12.27 | | | | n/a | | | $ | 10.30 | | |
| Maximum offering price per share | | $ | 21.07 | | | $ | 12.27 | | | | n/a | | | $ | 10.30 | | |
| Class C: | |
| Net assets | | $ | 729,067,326 | | | $ | 4,188,990 | | | | n/a | | | $ | 344,192 | | |
| Shares authorized | | | unlimited | | | | unlimited | | | | n/a | | | | unlimited | | |
| Par value | | $ | 0.01 | | | $ | — | | | | n/a | | | $ | — | | |
| Shares outstanding | | | 34,742,984 | | | | 340,760 | | | | n/a | | | | 33,435 | | |
| Net asset value and redemption price per share(2) | | $ | 20.98 | | | $ | 12.29 | | | | n/a | | | $ | 10.29 | | |
| Maximum offering price per share | | $ | 20.98 | | | $ | 12.29 | | | | n/a | | | $ | 10.29 | | |
| Class I: | |
| Net assets | | $ | 1,728,560,071 | | | $ | 36,898,974 | | | | n/a | | | | n/a | | |
| Shares authorized | | | unlimited | | | | unlimited | | | | n/a | | | | n/a | | |
| Par value | | $ | 0.01 | | | $ | — | | | | n/a | | | | n/a | | |
| Shares outstanding | | | 80,096,324 | | | | 2,969,742 | | | | n/a | | | | n/a | | |
| Net asset value and redemption price per share | | $ | 21.58 | | | $ | 12.42 | | | | n/a | | | | n/a | | |
| Maximum offering price per share | | $ | 21.58 | | | $ | 12.42 | | | | n/a | | | | n/a | | |
| Class Q: | |
| Net assets | | $ | 26,383,070 | | | | n/a | | | | n/a | | | | n/a | | |
| Shares authorized | | | unlimited | | | | n/a | | | | n/a | | | | n/a | | |
| Par value | | $ | 0.01 | | | | n/a | | | | n/a | | | | n/a | | |
| Shares outstanding | | | 1,223,288 | | | | n/a | | | | n/a | | | | n/a | | |
| Net asset value and redemption price per share | | $ | 21.57 | | | | n/a | | | | n/a | | | | n/a | | |
| Maximum offering price per share | | $ | 21.57 | | | | n/a | | | | n/a | | | | n/a | | |
(1) Maximum offering price is computed at 100/94.25 of net asset value. On purchases of $50,000 or more, the offering price is reduced.
(2) Redemption price per share may be reduced for any applicable contingent deferred sales charges.
(3) Maximum offering price per share for ING Emerging Markets Fixed Income Fund is 2.50% and is computed at 100/97.50 of net asset value. On purchases of $99,999 or more, the offering price is reduced.
See Accompanying Notes to Financial Statements
54
STATEMENTS OF ASSETS AND LIABILITIES AS OF OCTOBER 31, 2006
| | | ING
Global
Bond
Fund | | ING
Diversified
International
Fund | |
| ASSETS: | |
| Investments in securities at value* | | $ | 21,650,747 | | | $ | — | | |
| Investments in affiliates** | | | — | | | | 261,983,024 | | |
| Short-term investment in affiliate at amortized cost | | | 1,264,656 | | | | — | | |
| Repurchase agreement | | | 3,084,000 | | | | — | | |
| Cash | | | 141,331 | | | | 102,857 | | |
| Cash collateral for futures | | | 45,333 | | | | — | | |
| Foreign currencies at value*** | | | 5,639,843 | | | | — | | |
| Receivables: | |
| Investment securities sold | | | 28,964 | | | | — | | |
| Fund shares sold | | | 13,558 | | | | 4,347,120 | | |
| Dividends and interest | | | 170,297 | | | | — | | |
| Variation margin recievable | | | 5,438 | | | | — | | |
| Receivable due from affiliate | | | 47 | | | | — | | |
| Prepaid expenses | | | 76,233 | | | | 93,603 | | |
| Reimbursement due from manager | | | 7,380 | | | | 92,936 | | |
| Total assets | | | 32,127,827 | | | | 266,619,540 | | |
| LIABILITIES: | |
| Payable for investment securities purchased | | | 6,203,960 | | | | 2,992,999 | | |
| Payable for fund shares redeemed | | | — | | | | 464,044 | | |
| Payable for futures variation margin | | | 4,000 | | | | — | | |
| Income distribution payable | | | 37,115 | | | | — | | |
| Payable to affiliates | | | 16,240 | | | | 130,005 | | |
| Payable for trustee fees | | | 772 | | | | 604 | | |
| Other accrued expenses and liabilities | | | 17,543 | | | | 59,342 | | |
| Total liabilities | | | 6,279,630 | | | | 3,646,994 | | |
| NET ASSETS | | $ | 25,848,197 | | | $ | 262,972,546 | | |
| NET ASSETS WERE COMPRISED OF: | |
| Paid-in capital | | $ | 25,205,860 | | | $ | 246,437,870 | | |
| Undistributed net investment income (accumulated net investment loss) | | | (11,046 | ) | | | — | | |
Accumulated net realized gain (loss) on investments, foreign currency
related transactions, and futures | | | 424,346 | | | | (1,565,439 | ) | |
Net unrealized appreciation on investments, foreign currency related
transactions, and futures | | | 229,037 | | | | 18,100,115 | | |
| NET ASSETS | | $ | 25,848,197 | | | $ | 262,972,546 | | |
| * Cost of investments in securities | | $ | 21,366,516 | | | $ | — | | |
| ** Cost of investments in affiliate | | $ | — | | | $ | 243,882,909 | | |
| *** Cost of foreign currencies | | $ | 5,692,943 | | | $ | — | | |
See Accompanying Notes to Financial Statements
55
STATEMENTS OF ASSETS AND LIABILITIES AS OF OCTOBER 31, 2006 (CONTINUED)
| | | ING
Global
Bond
Fund | | ING
Diversified
International
Fund | |
| Class A: | |
| Net assets | | $ | 25,783,877 | | | $ | 170,108,365 | | |
| Shares authorized | | | unlimited | | | | unlimited | | |
| Par value | | $ | — | | | $ | — | | |
| Shares outstanding | | | 2,515,893 | | | | 14,649,412 | | |
| Net asset value and redemption price per share | | $ | 10.25 | | | $ | 11.61 | | |
| Maximum offering price per share (5.75%)(1) | | $ | 10.51 | (3) | | $ | 12.32 | | |
| Class B: | |
| Net assets | | $ | 27,781 | | | $ | 23,034,876 | | |
| Shares authorized | | | unlimited | | | | unlimited | | |
| Par value | | $ | — | | | $ | — | | |
| Shares outstanding | | | 2,713 | | | | 1,995,643 | | |
| Net asset value and redemption price per share(2) | | $ | 10.24 | | | $ | 11.54 | | |
| Maximum offering price per share | | $ | 10.24 | | | $ | 11.54 | | |
| Class C: | |
| Net assets | | $ | 35,504 | | | $ | 69,824,816 | | |
| Shares authorized | | | unlimited | | | | unlimited | | |
| Par value | | $ | — | | | $ | — | | |
| Shares outstanding | | | 3,467 | | | | 6,050,765 | | |
| Net asset value and redemption price per share(2) | | $ | 10.24 | | | $ | 11.54 | | |
| Maximum offering price per share | | $ | 10.24 | | | $ | 11.54 | | |
| Class I: | |
| Net assets | | $ | 1,035 | | | $ | 4,489 | | |
| Shares authorized | | | unlimited | | | | unlimited | | |
| Par value | | $ | — | | | $ | — | | |
| Shares outstanding | | | 101 | | | | 386 | | |
| Net asset value and redemption price per share | | $ | 10.25 | | | $ | 11.63 | | |
| Maximum offering price per share | | $ | 10.25 | | | $ | 11.63 | | |
| Class R: | |
| Net assets | | | n/a | | | $ | — | | |
| Shares authorized | | | n/a | | | | unlimited | | |
| Par value | | | n/a | | | $ | — | | |
| Shares outstanding | | | n/a | | | $ | — | | |
| Net asset value and redemption price per share | | | n/a | | | $ | — | | |
| Maximum offering price per share | | | n/a | | | $ | — | | |
(1) Maximum offering price is computed at 100/94.25 of net asset value. On purchases of $50,000 or more, the offering price is reduced.
(2) Redemption price per share may be reduced for any applicable contingent deferred sales charges.
(3) Maximum offering price per share for ING Global Bond Fund is 2.50% and is computed at 100/97.50 of net asset value. On purchases of $99,999 or more, the offering price is reduced.
See Accompanying Notes to Financial Statements
56
STATEMENTS OF OPERATIONS FOR THE YEAR ENDED OCTOBER 31, 2006
| | | ING
Global Equity
Dividend
Fund | | ING
Global
Natural
Resources
Fund | | ING
Global
Real Estate
Fund | | ING
Global
Value Choice
Fund | |
| INVESTMENT INCOME: | |
| Dividends, net of foreign taxes withheld*(1) | | $ | 8,989,684 | | | $ | 715,588 | | | $ | 7,337,197 | | | $ | 2,104,358 | | |
| Interest | | | 214,572 | | | | 262,496 | | | | 493,505 | | | | 156,123 | | |
| Securities lending income | | | 20,385 | | | | — | | | | 13,461 | | | | 38,684 | | |
| Total investment income | | | 9,224,641 | | | | 978,084 | | | | 7,844,163 | | | | 2,299,165 | | |
| EXPENSES: | |
| Investment management fees | | | 1,263,686 | | | | 1,027,161 | | | | 2,775,270 | | | | 1,062,122 | | |
| Distribution and service fees: | |
| Class A | | | 204,748 | | | | 300,719 | | | | 608,798 | | | | 162,200 | | |
| Class B | | | 367,116 | | | | — | | | | 191,636 | | | | 228,519 | | |
| Class C | | | 619,151 | | | | — | | | | 536,701 | | | | 318,361 | | |
| Class Q | | | — | | | | — | | | | — | | | | 11,907 | | |
| Transfer agent fees: | |
| Class A | | | 85,995 | | | | 144,490 | | | | 201,441 | | | | 81,200 | | |
| Class B | | | 38,534 | | | | — | | | | 15,897 | | | | 39,917 | | |
| Class C | | | 64,957 | | | | — | | | | 43,854 | | | | 55,903 | | |
| Class I | | | — | | | | — | | | | — | | | | 54 | | |
| Class Q | | | — | | | | — | | | | — | | | | 905 | | |
| Administrative service fees | | | 180,525 | | | | 120,287 | | | | 322,299 | | | | 106,212 | | |
| Shareholder reporting expense | | | 51,507 | | | | 39,750 | | | | 70,505 | | | | 25,016 | | |
| Registration fees | | | 53,753 | | | | 23,381 | | | | 71,805 | | | | 63,216 | | |
| Professional fees | | | 31,743 | | | | 18,505 | | | | 63,679 | | | | 22,961 | | |
| Custody and accounting expense | | | 54,784 | | | | 29,310 | | | | 85,458 | | | | 31,881 | | |
| Trustee fees | | | 4,206 | | | | 3,477 | | | | 6,036 | | | | 3,650 | | |
| Miscellaneous expense | | | 9,464 | | | | 3,323 | | | | 13,319 | | | | 11,500 | | |
| Interest expense | | | — | | | | 4,434 | | | | — | | | | 2,974 | | |
| Total expenses | | | 3,030,169 | | | | 1,714,837 | | | | 5,006,698 | | | | 2,228,498 | | |
| Net recouped fees | | | 116,579 | | | | — | | | | — | | | | — | | |
| Brokerage commission recapture | | | — | | | | — | | | | — | | | | (7,368 | ) | |
| Net expenses | | | 3,146,748 | | | | 1,714,837 | | | | 5,006,698 | | | | 2,221,130 | | |
| Net investment income (loss) | | | 6,077,893 | | | | (736,753 | ) | | | 2,837,465 | | | | 78,035 | | |
REALIZED AND UNREALIZED GAIN (LOSS) ON
INVESTMENTS, INVESTMENTS IN AFFILIATES,
FOREIGN CURRENCY RELATED TRANSACTIONS,
AND FUTURES: | |
| Net realized gain (loss) on: | |
| Investments | | | 11,966,728 | | | | 44,638,013 | | | | 13,611,070 | | | | 14,433,772 | | |
| Investments in affiliates | | | — | | | | — | | | | 39,733 | | | | — | | |
| Foreign currency related transactions | | | (210,527 | ) | | | (122,369 | ) | | | (586,608 | ) | | | (135,513 | ) | |
Net realized gain on investments, investments in
affiliates and foreign currency related transactions | | | 11,756,201 | | | | 44,515,644 | | | | 13,064,195 | | | | 14,298,259 | | |
Net change in unrealized appreciation
or depreciation on: | |
| Investments | | | 23,692,610 | | | | (6,716,861 | ) | | | 96,601,883 | | | | 4,738,096 | | |
| Foreign currency related transactions | | | 1,299 | | | | (212 | ) | | | 15,126 | | | | 5,948 | | |
Net change in unrealized appreciation or
depreciation on investments and foreign currency
related transactions | | | 23,693,909 | | | | (6,717,073 | ) | | | 96,617,009 | | | | 4,744,044 | | |
Net realized and unrealized gain on investments,
investments in affiliates and foreign currency
related transactions | | | 35,450,110 | | | | 37,798,571 | | | | 109,681,204 | | | | 19,042,303 | | |
| Increase in net assets resulting from operations | | $ | 41,528,003 | | | $ | 37,061,818 | | | $ | 112,518,669 | | | $ | 19,120,338 | | |
| * Foreign taxes withheld | | $ | 585,569 | | | $ | 15,267 | | | $ | 539,357 | | | $ | 152,356 | | |
(1) Dividends for the period ended October 31, 2006 for ING Global Real Estate Fund includes dividends from affiliate of $54,265 for ING UK Real Estate Income Trust Ltd.
See Accompanying Notes to Financial Statements
57
STATEMENTS OF OPERATIONS
| | | ING
Emerging
Countries
Fund | | ING
Foreign
Fund | | ING
Greater
China
Fund | | ING
Index Plus
International
Equity
Fund | |
| | | Year
Ended
October 31,
2006 | | Year
Ended
October 31,
2006 | | December 21,
2005(1) to
October 31,
2006 | | December 21,
2005(1) to
October 31,
2006 | |
| INVESTMENT INCOME: | |
| Dividends, net of foreign taxes withheld* | | $ | 6,306,676 | | | $ | 7,355,745 | | | $ | 559,427 | | | $ | 1,277,566 | | |
| Interest | | | 250,285 | | | | 420,141 | | | | 5,817 | | | | 25,239 | | |
| Securities lending income | | | 125,738 | | | | 78,835 | | | | — | | | | — | | |
| Total investment income | | | 6,682,699 | | | | 7,854,721 | | | | 565,244 | | | | 1,302,805 | | |
| EXPENSES: | |
| Investment management fees | | | 2,217,948 | | | | 3,679,388 | | | | 188,819 | | | | 275,125 | | |
| Distribution and service fees: | |
| Class A | | | 383,944 | | | | 450,363 | | | | 37,114 | | | | 33,910 | | |
| Class B | | | 140,633 | | | | 330,977 | | | | 7,187 | | | | 1,132 | | |
| Class C | | | 309,079 | | | | 1,273,199 | | | | 8,456 | | | | 2,795 | | |
| Class M | | | 10,509 | | | | — | | | | — | | | | — | | |
| Class Q | | | 33,516 | | | | 2,862 | | | | — | | | | — | | |
| Transfer agent fees: | |
| Class A | | | 157,213 | | | | 173,023 | | | | 15,939 | | | | 2,667 | | |
| Class B | | | 20,043 | | | | 32,211 | | | | 792 | | | | 43 | | |
| Class C | | | 44,827 | | | | 124,107 | | | | 925 | | | | 91 | | |
| Class I | | | 1,766 | | | | 12,637 | | | | 11 | | | | 5,386 | | |
| Class M | | | 2,036 | | | | — | | | | — | | | | — | | |
| Class Q | | | 2,560 | | | | 604 | | | | — | | | | — | | |
| Administrative service fees | | | 177,434 | | | | 367,935 | | | | 16,419 | | | | 50,022 | | |
| Shareholder reporting expense | | | 53,070 | | | | 80,335 | | | | 20,730 | | | | 23,470 | | |
| Registration fees | | | 63,473 | | | | 72,533 | | | | 9,472 | | | | 9,565 | | |
| Professional fees | | | 19,194 | | | | 24,189 | | | | 9,640 | | | | 7,196 | | |
| Custody and accounting expense | | | 164,347 | | | | 300,346 | | | | 37,053 | | | | 54,461 | | |
| Trustee fees | | | 5,559 | | | | 9,943 | | | | 1,816 | | | | 2,066 | | |
| Offering expense | | | — | | | | — | | | | 86,301 | | | | 86,301 | | |
| Miscellaneous expense | | | 13,412 | | | | 14,555 | | | | 4,937 | | | | 4,071 | | |
| Interest expense | | | — | | | | 709 | | | | — | | | | 1,328 | | |
| Total expenses | | | 3,820,563 | | | | 6,949,916 | | | | 445,611 | | | | 559,629 | | |
| Net recouped (waived and reimbursed) fees | | | (109,698 | ) | | | 238,176 | | | | — | | | | (72,836 | ) | |
| Brokerage commission recapture | | | (16,862 | ) | | | (11,578 | ) | | | — | | | | — | | |
| Net expenses | | | 3,694,003 | | | | 7,176,514 | | | | 445,611 | | | | 486,793 | | |
| Net investment income | | | 2,988,696 | | | | 678,207 | | | | 119,633 | | | | 816,012 | | |
REALIZED AND UNREALIZED GAIN (LOSS) ON
INVESTMENTS, FOREIGN CURRENCY RELATED
TRANSACTIONS, AND FUTURES: | |
| Net realized gain (loss) on: | |
| Investments | | | 19,240,712 | | | | 19,128,145 | | | | (77,020 | ) | | | 2,047,720 | | |
| Foreign currency related transactions | | | (63,783 | ) | | | (3,613,509 | ) | | | (22,332 | ) | | | (192,076 | ) | |
Net realized gain (loss) on investments, foreign
currency related transactions, and futures | | | 19,176,929 | | | | 15,514,636 | | | | (99,352 | ) | | | 1,855,644 | | |
Net change in unrealized appreciation or
depreciation on: | |
| Investments | | | 14,270,190 | | | | 63,398,108 | | | | 3,519,875 | | | | 5,710,163 | | |
| Foreign currency related transactions | | | (77,126 | ) | | | 519,581 | | | | (55 | ) | | | 398 | | |
Net change in unrealized appreciation or
depreciation on investments and foreign
currency related transactions | | | 14,193,064 | | | | 63,917,689 | | | | 3,519,820 | | | | 5,710,561 | | |
Net realized and unrealized gain on investments,
foreign currency related transactions, and futures | | | 33,369,993 | | | | 79,432,325 | | | | 3,420,468 | | | | 7,566,205 | | |
| Increase in net assets resulting from operations | | $ | 36,358,689 | | | $ | 80,110,532 | | | $ | 3,540,101 | | | $ | 8,382,217 | | |
| * Foreign taxes withheld | | $ | 785,374 | | | $ | 954,730 | | | $ | 71,969 | | | $ | 117,023 | | |
(1) Commencement of operations
See Accompanying Notes to Financial Statements
58
STATEMENTS OF OPERATIONS
| | | ING
International
Fund | | ING
International
Capital Appreciation
Fund | | ING
International
Real Estate
Fund | | ING
International
SmallCap
Fund | |
| | | Year
Ended
October 31,
2006 | | December 21,
2005(1) to
October 31,
2006 | | February 28,
2006(1) to
October 31,
2006 | | Year
Ended
October 31,
2006 | |
| INVESTMENT INCOME: | |
| Dividends, net of foreign taxes withheld* | | $ | 3,096,905 | | | $ | 424,116 | | | $ | 578,334 | | | $ | 9,235,472 | | |
| Interest | | | 241,888 | | | | 34,289 | | | | 71,386 | | | | 538,190 | | |
| Securities lending income | | | 11,742 | | | | — | | | | — | | | | 974,454 | | |
| Total investment income | | | 3,350,535 | | | | 458,405 | | | | 649,720 | | | | 10,748,116 | | |
| EXPENSES: | |
| Investment management fees | | | 1,280,746 | | | | 236,941 | | | | 235,365 | | | | 4,663,780 | | |
| Distribution and service fees: | |
| Class A | | | 144,163 | | | | 10,660 | | | | 38,519 | | | | 773,689 | | |
| Class B | | | 173,747 | | | | 287 | | | | 3,460 | | | | 612,707 | | |
| Class C | | | 159,921 | | | | 358 | | | | 48,951 | | | | 621,719 | | |
| Class Q | | | 57,655 | | | | — | | | | — | | | | 186,466 | | |
| Transfer agent fees: | |
| Class A | | | 89,124 | | | | 2,566 | | | | 14,174 | | | | 238,822 | | |
| Class B | | | 26,780 | | | | 17 | | | | 313 | | | | 64,694 | | |
| Class C | | | 24,669 | | | | 21 | | | | 4,548 | | | | 75,578 | | |
| Class I | | | 839 | | | | 7,716 | | | | 2,896 | | | | 250 | | |
| Class Q | | | 1,384 | | | | — | | | | — | | | | 29,822 | | |
| Administrative service fees | | | 128,073 | | | | 27,875 | | | | 23,536 | | | | 467,914 | | |
| Shareholder reporting expense | | | 19,475 | | | | 9,048 | | | | 8,710 | | | | 48,297 | | |
| Registration fees | | | 79,414 | | | | 10,879 | | | | 7,764 | | | | 74,853 | | |
| Professional fees | | | 15,516 | | | | 5,318 | | | | 5,736 | | | | 38,515 | | |
| Custody and accounting expense | | | 54,530 | | | | 43,374 | | | | 39,670 | | | | 239,074 | | |
| Trustee fees | | | 3,968 | | | | 1,370 | | | | 1,860 | | | | 12,086 | | |
| Offering expense | | | — | | | | 86,301 | | | | 67,123 | | | | — | | |
| Miscellaneous expense | | | 12,327 | | | | 3,911 | | | | 1,828 | | | | 39,149 | | |
| Interest expense | | | 1,279 | | | | 708 | | | | — | | | | 729 | | |
| Total expenses | | | 2,273,610 | | | | 447,350 | | | | 504,453 | | | | 8,188,144 | | |
| Net waived and reimbursed fees | | | — | | | | (93,974 | ) | | | (119,550 | ) | | | — | | |
| Brokerage commission recapture | | | — | | | | (716 | ) | | | — | | | | — | | |
| Net expenses | | | 2,273,610 | | | | 352,660 | | | | 384,903 | | | | 8,188,144 | | |
| Net investment income | | | 1,076,925 | | | | 105,745 | | | | 264,817 | | | | 2,559,972 | | |
REALIZED AND UNREALIZED GAIN (LOSS) ON
INVESTMENTS, FOREIGN CURRENCY RELATED
TRANSACTIONS, AND FUTURES: | |
| Net realized gain (loss) on: | |
| Investments | | | 18,819,834 | | | | 1,204,800 | | | | (145,648 | ) | | | 62,752,074 | | |
| Foreign currency related transactions | | | (215,115 | ) | | | (119,615 | ) | | | (119,860 | ) | | | 155,474 | | |
Net realized gain (loss) on investments and foreign
currency related transactions | | | 18,604,719 | | | | 1,085,185 | | | | (265,508 | ) | | | 62,907,548 | | |
Net change in unrealized appreciation or
depreciation on: | |
| Investments | | | 4,897,143 | | | | 3,493,023 | | | | 7,391,041 | | | | 32,213,864 | | |
| Foreign currency related transactions | | | 13,612 | | | | 1,503 | | | | 2,252 | | | | 17,129 | | |
Net change in unrealized appreciation or
depreciation on investments and foreign
currency related transactions | | | 4,910,755 | | | | 3,494,526 | | | | 7,393,293 | | | | 32,230,993 | | |
Net realized and unrealized gain on investments,
foreign currency related transactions, and futures | | | 23,515,474 | | | | 4,579,711 | | | | 7,127,785 | | | | 95,138,541 | | |
| Increase in net assets resulting from operations | | $ | 24,592,399 | | | $ | 4,685,456 | | | $ | 7,392,602 | | | $ | 97,698,513 | | |
| * Foreign taxes withheld | | $ | 232,380 | | | $ | 42,196 | | | $ | 69,557 | | | $ | 739,920 | | |
(1) Commencement of operations
See Accompanying Notes to Financial Statements
59
STATEMENTS OF OPERATIONS
| | | ING
International
Value
Fund | | ING
International
Value Choice
Fund | | ING
Russia
Fund | | ING
Emerging Markets
Fixed Income
Fund | |
| | | Year
Ended
October 31,
2006 | | Year
Ended
October 31,
2006 | | Year
Ended
October 31,
2006 | | December 21,
2005(1) to
October 31,
2006 | |
| INVESTMENT INCOME: | |
| Dividends, net of foreign taxes withheld* | | $ | 108,751,089 | | | $ | 875,887 | | | $ | 7,372,329 | | | $ | — | | |
| Interest | | | 2,834,117 | | | | 104,049 | | | | — | | | | 829,489 | | |
| Securities lending income | | | 447,093 | | | | — | | | | 322,234 | | | | — | | |
| Total investment income | | | 112,032,299 | | | | 979,936 | | | | 7,694,563 | | | | 829,489 | | |
| EXPENSES: | |
| Investment management fees | | | 44,969,244 | | | | 347,873 | | | | 7,198,140 | | | | 62,567 | | |
| Distribution and service fees: | |
| Class A | | | 5,691,844 | | | | 30,586 | | | | 1,439,624 | | | | 23,483 | | |
| Class B | | | 3,930,167 | | | | 29,673 | | | | — | | | | 693 | | |
| Class C | | | 7,039,087 | | | | 33,187 | | | | — | | | | 1,561 | | |
| Class Q | | | 68,974 | | | | — | | | | — | | | | — | | |
| Transfer agent fees: | |
| Class A | | | 2,175,273 | | | | 13,336 | | | | 488,095 | | | | 4,435 | | |
| Class B | | | 449,350 | | | | 3,235 | | | | — | | | | 39 | | |
| Class C | | | 806,694 | | | | 3,617 | | | | — | | | | 79 | | |
| Class I | | | 587,151 | | | | 381 | | | | — | | | | — | | |
| Class Q | | | 10,782 | | | | — | | | | — | | | | — | | |
| Administrative service fees | | | 4,496,875 | | | | 34,787 | | | | 575,845 | | | | 9,626 | | |
| Shareholder reporting expense | | | 560,600 | | | | 5,258 | | | | 121,592 | | | | 15,476 | | |
| Registration fees | | | 117,310 | | | | 36,089 | | | | 47,490 | | | | 11,494 | | |
| Professional fees | | | 319,249 | | | | 18,922 | | | | 32,610 | | | | 6,100 | | |
| Custody and accounting expense | | | 1,406,204 | | | | 20,338 | | | | 1,450,826 | | | | 5,830 | | |
| Trustee fees | | | 132,489 | | | | 1,628 | | | | 12,045 | | | | 1,835 | | |
| Offering expense | | | — | | | | 1,593 | | | | — | | | | 86,300 | | |
| Miscellaneous expense | | | 1,145,298 | | | | 4,148 | | | | 18,983 | | | | 4,054 | | |
| Interest expense | | | 12,135 | | | | — | | | | — | | | | — | | |
| Total expenses | | | 73,918,726 | | | | 584,651 | | | | 11,385,250 | | | | 233,572 | | |
| Net waived and reimbursed fees | | | — | | | | (4,469 | ) | | | — | | | | (111,594 | ) | |
| Brokerage commission recapture | | | (33,401 | ) | | | (3,723 | ) | | | — | | | | — | | |
| Net expenses | | | 73,885,325 | | | | 576,459 | | | | 11,385,250 | | | | 121,978 | | |
| Net investment income (loss) | | | 38,146,974 | | | | 403,477 | | | | (3,690,687 | ) | | | 707,511 | | |
REALIZED AND UNREALIZED GAIN (LOSS) ON
INVESTMENTS, FOREIGN CURRENCY RELATED
TRANSACTIONS, AND FUTURES: | |
| Net realized gain (loss) on: | |
| Investments | | | 493,978,456 | | | | 1,116,554 | | | | 46,310,358 | | | | 66,986 | | |
| Foreign currency related transactions | | | (1,169,752 | ) | | | (54,138 | ) | | | (53,572 | ) | | | (1,422 | ) | |
| Futures | | | — | | | | — | | | | — | | | | 17,383 | | |
Net realized gain on investments, foreign
currency related transactions, and futures | | | 492,808,704 | | | | 1,062,416 | | | | 46,256,786 | | | | 82,947 | | |
Net change in unrealized appreciation or
depreciation on: | |
| Investments | | | 552,646,873 | | | | 3,117,173 | | | | 174,358,810 | | | | 288,677 | | |
| Foreign currency related transactions | | | 250,158 | | | | (754 | ) | | | 68 | | | | (816 | ) | |
| Futures | | | — | | | | — | | | | — | | | | (20,407 | ) | |
Net change in unrealized appreciation or
depreciation on investments, foreign currency
related transactions, and futures | | | 552,897,031 | | | | 3,116,419 | | | | 174,358,878 | | | | 267,454 | | |
Net realized and unrealized gain on investments,
foreign currency related transactions, and futures | | | 1,045,705,735 | | | | 4,178,835 | | | | 220,615,664 | | | | 350,401 | | |
| Increase in net assets resulting from operations | | $ | 1,083,852,709 | | | $ | 4,582,312 | | | $ | 216,924,977 | | | $ | 1,057,912 | | |
| * Foreign taxes withheld | | $ | 13,032,787 | | | $ | 103,135 | | | $ | 1,132,285 | | | $ | 11,766 | | |
(1) Commencement of operations
See Accompanying Notes to Financial Statements
60
STATEMENTS OF OPERATIONS
| | | ING
Global
Bond
Fund | | ING
Diversified
International
Fund | |
| | | June 30,
2006(1) to
October 31,
2006 | | December 21,
2005(1) to
October 31,
2006 | |
| INVESTMENT INCOME: | |
| Dividends from underlying affiliated funds | | $ | — | | | $ | 2,947 | | |
| Interest, net of foreign taxes withheld*(2) | | | 275,794 | | | | — | | |
| Total investment income | | | 275,794 | | | | 2,947 | | |
| EXPENSES: | |
| Investment management fees | | | 33,344 | | | | — | | |
| Distribution and service fees: | |
| Class A | | | 20,820 | | | | 191,146 | | |
| Class B | | | 8 | | | | 109,807 | | |
| Class C | | | 71 | | | | 323,284 | | |
| Transfer agent fees: | |
| Class A | | | 7,094 | | | | 77,728 | | |
| Class B | | | 1 | | | | 11,163 | | |
| Class C | | | 8 | | | | 32,865 | | |
| Class I | | | — | | | | 2 | | |
| Administrative service fees | | | 8,336 | | | | 119,769 | | |
| Shareholder reporting expense | | | 2,980 | | | | 34,018 | | |
| Registration fees | | | 1,468 | | | | 19,966 | | |
| Professional fees | | | 2,461 | | | | 18,665 | | |
| Custody and accounting expense | | | 3,018 | | | | 6,546 | | |
| Trustee fees | | | 813 | | | | 2,482 | | |
| Offering expense | | | 34,176 | | | | 164,929 | | |
| Miscellaneous expense | | | 554 | | | | 3,724 | | |
| Interest expense | | | — | | | | 1,085 | | |
| Total expenses | | | 115,152 | | | | 1,117,179 | | |
| Net waived and reimbursed fees | | | (39,924 | ) | | | (372,357 | ) | |
| Net expenses | | | 75,228 | | | | 744,822 | | |
| Net investment income (loss) | | | 200,566 | | | | (741,875 | ) | |
REALIZED AND UNREALIZED GAIN (LOSS) ON INVESTMENTS,
INVESTMENTS IN UNDERLYING AFFILIATED FUNDS, FOREIGN
CURRENCY RELATED TRANSACTIONS, AND FUTURES: | |
| Net realized gain (loss) on: | |
| Investments | | | 412,735 | | | | — | | |
| Investments in underlying affiliated funds | | | — | | | | (1,565,439 | ) | |
| Foreign currency related transactions | | | (75,508 | ) | | | — | | |
| Futures | | | 11,611 | | | | — | | |
Net realized gain (loss) on investments, investments in underlying affiliated funds,
foreign currency related transactions, and futures | | | 348,838 | | | | (1,565,439 | ) | |
| Net change in unrealized appreciation or depreciation on: | |
| Investments | | | 284,231 | | | | 18,100,115 | | |
| Foreign currency related transactions | | | (52,611 | ) | | | — | | |
| Futures | | | (2,583 | ) | | | — | | |
Net change in unrealized appreciation or depreciation on investments,
foreign currency related transactions, and futures | | | 229,037 | | | | 18,100,115 | | |
Net realized and unrealized gain on investments, investments in
underlying affiliated funds, foreign currency related transactions, and futures | | | 577,875 | | | | 16,534,676 | | |
| Increase in net assets resulting from operations | | $ | 778,441 | | | $ | 15,792,801 | | |
| * Foreign taxes withheld | | $ | 597 | | | $ | — | | |
(1) Commencement of operations
(2) Interest for the period ended October 31, 2006 for ING Global Bond Fund includes interest from affiliates of $20,246 for ING Institutional Prime Money Market Fund.
See Accompanying Notes to Financial Statements
61
STATEMENTS OF CHANGES IN NET ASSETS
| | | ING Global Equity Dividend Fund | | ING Global Natural Resources Fund | |
| | | Year
Ended
October 31,
2006 | | Year
Ended
October 31,
2005 | | Year
Ended
October 31,
2006 | | Year
Ended
October 31,
2005 | |
| FROM OPERATIONS: | |
| Net investment income (loss) | | $ | 6,077,893 | | | $ | 2,915,778 | | | $ | (736,753 | ) | | $ | (645,673 | ) | |
Net realized gain on investments and foreign currency
related transactions | | | 11,756,201 | | | | 1,687,744 | | | | 44,515,644 | | | | 8,968,836 | | |
Net change in unrealized appreciation or depreciation on
investments and foreign currency related transactions | | | 23,693,909 | | | | (344,549 | ) | | | (6,717,073 | ) | | | (3,271,199 | ) | |
| Net increase in net assets resulting from operations | | | 41,528,003 | | | | 4,258,973 | | | | 37,061,818 | | | | 5,051,964 | | |
| FROM DISTRIBUTIONS TO SHAREHOLDERS: | |
| Net investment income: | |
| Class A | | | (2,877,316 | ) | | | (1,612,143 | ) | | | (180,375 | ) | | | (2,990,570 | ) | |
| Class B | | | (1,049,974 | ) | | | (464,058 | ) | | | — | | | | — | | |
| Class C | | | (1,773,737 | ) | | | (739,105 | ) | | | — | | | | — | | |
| Net realized gains: | | | | | | | | | | | | | | | | | |
| Class A | | | (1,118,180 | ) | | | (202,278 | ) | | | — | | | | — | | |
| Class B | | | (431,639 | ) | | | (68,833 | ) | | | — | | | | — | | |
| Class C | | | (736,438 | ) | | | (78,925 | ) | | | — | | | | — | | |
| Total distributions | | | (7,987,284 | ) | | | (3,165,342 | ) | | | (180,375 | ) | | | (2,990,570 | ) | |
| FROM CAPITAL SHARE TRANSACTIONS: | |
| Net proceeds from sale of shares | | | 95,777,433 | | | | 156,092,182 | | | | 22,092,980 | | | | 8,755,764 | | |
| Dividends reinvested | | | 4,690,850 | | | | 1,717,095 | | | | 161,561 | | | | 2,642,230 | | |
| | | | 100,468,283 | | | | 157,809,277 | | | | 22,254,541 | | | | 11,397,994 | | |
| Cost of shares redeemed | | | (53,698,155 | ) | | | (26,214,327 | ) | | | (25,464,330 | ) | | | (17,774,785 | ) | |
Net increase (decrease) in net assets resulting from
capital share transactions | | | 46,770,128 | | | | 131,594,950 | | | | (3,209,789 | ) | | | (6,376,791 | ) | |
| Net increase (decrease) in net assets | | | 80,310,847 | | | | 132,688,581 | | | | 33,671,654 | | | | (4,315,397 | ) | |
| NET ASSETS: | |
| Beginning of year | | | 150,962,735 | | | | 18,274,154 | | | | 87,440,769 | | | | 91,756,166 | | |
| End of year | | $ | 231,273,582 | | | $ | 150,962,735 | | | $ | 121,112,423 | | | $ | 87,440,769 | | |
| Undistributed net investment income at end of year | | $ | 957,740 | | | $ | 80,039 | | | $ | 2,905,734 | | | $ | 136,516 | | |
See Accompanying Notes to Financial Statements
62
STATEMENTS OF CHANGES IN NET ASSETS
| | | ING Global Real Estate Fund | | ING Global Value Choice Fund | |
| | | Year
Ended
October 31,
2006 | | Year
Ended
October 31,
2005 | | Year
Ended
October 31,
2006 | | Year
Ended
October 31,
2005 | |
| FROM OPERATIONS: | |
| Net investment income | | $ | 2,837,465 | | | $ | 1,966,752 | | | $ | 78,035 | | | $ | 124,251 | | |
Net realized gain on investments, investments in affiliates,
related transactions and payment by affiliate | | | 13,064,195 | | | | 12,164,023 | | | | 14,298,259 | | | | 25,142,182 | | |
Net change in unrealized appreciation or depreciation on
investments and foreign currency related transactions | | | 96,617,009 | | | | 10,845,250 | | | | 4,744,044 | | | | (11,171,818 | ) | |
| Net increase in net assets resulting from operations | | | 112,518,669 | | | | 24,976,025 | | | | 19,120,338 | | | | 14,094,615 | | |
| FROM DISTRIBUTIONS TO SHAREHOLDERS: | |
| Net investment income: | |
| Class A | | | (5,490,053 | ) | | | (3,673,599 | ) | | | (322,489 | ) | | | — | | |
| Class B | | | (386,380 | ) | | | (233,025 | ) | | | — | | | | — | | |
| Class C | | | (986,253 | ) | | | (422,111 | ) | | | (35,318 | ) | | | — | | |
| Class I | | | (149,037 | ) | | | (17,876 | ) | | | — | | | | — | | |
| Class Q | | | — | | | | — | | | | (39,663 | ) | | | — | | |
| Net realized gains: | | | | | | | | | | | | | | | | | |
| Class A | | | (8,946,554 | ) | | | (5,775,476 | ) | | | — | | | | — | | |
| Class B | | | (920,111 | ) | | | (334,884 | ) | | | — | | | | — | | |
| Class C | | | (2,017,572 | ) | | | (517,618 | ) | | | — | | | | — | | |
| Class I | | | (103,752 | ) | | | — | | | | — | | | | — | | |
| Total distributions | | | (18,999,712 | ) | | | (10,974,589 | ) | | | (397,470 | ) | | | — | | |
| FROM CAPITAL SHARE TRANSACTIONS: | |
| Net proceeds from sale of shares | | | 386,972,514 | | | | 95,904,278 | | | | 22,826,540 | | | | 15,058,733 | | |
| Dividends reinvested | | | 13,607,657 | | | | 8,286,072 | | | | 232,139 | | | | — | | |
| | | | 400,580,171 | | | | 104,190,350 | | | | 23,058,679 | | | | 15,058,733 | | |
| Cost of shares redeemed | | | (54,880,614 | ) | | | (46,019,544 | ) | | | (36,462,732 | ) | | | (43,124,283 | ) | |
Net increase (decrease) in net assets resulting from
capital share transactions | | | 345,699,557 | | | | 58,170,806 | | | | (13,404,053 | ) | | | (28,065,550 | ) | |
| Net increase (decrease) in net assets | | | 439,218,514 | | | | 72,172,242 | | | | 5,318,815 | | | | (13,970,935 | ) | |
| NET ASSETS: | |
| Beginning of year | | | 180,286,637 | | | | 108,114,395 | | | | 100,728,942 | | | | 114,699,877 | | |
| End of year | | $ | 619,505,151 | | | $ | 180,286,637 | | | $ | 106,047,757 | | | $ | 100,728,942 | | |
Undistributed net investment income (accumulated
net investment loss) at end of year | | $ | (1,380,929 | ) | | $ | (3,067,440 | ) | | $ | 4,954 | | | $ | 396,508 | | |
See Accompanying Notes to Financial Statements
63
STATEMENTS OF CHANGES IN NET ASSETS
| | | ING Emerging Countries Fund | | ING Foreign Fund | |
| | | Year
Ended
October 31,
2006 | | Year
Ended
October 31,
2005 | | Year
Ended
October 31,
2006 | | Year
Ended
October 31,
2005 | |
| FROM OPERATIONS: | |
| Net investment income | | $ | 2,988,696 | | | $ | 858,328 | | | $ | 678,207 | | | $ | 337,622 | | |
Net realized gain on investments, foreign currency
related transactions and payment by affiliate | | | 19,176,929 | | | | 46,125,240 | | | | 15,514,636 | | | | 7,668,921 | | |
Net change in unrealized appreciation or depreciation
on investments and foreign currency related
transactions | | | 14,193,064 | | | | (26,356,354 | ) | | | 63,917,689 | | | | 20,316,629 | | |
| Net increase in net assets resulting from operations | | | 36,358,689 | | | | 20,627,214 | | | | 80,110,532 | | | | 28,323,172 | | |
| FROM DISTRIBUTIONS TO SHAREHOLDERS: | |
| Net investment income: | |
| Class A | | | (521,510 | ) | | | (59,355 | ) | | | — | | | | — | | |
| Class C | | | (76,339 | ) | | | — | | | | — | | | | — | | |
| Class M | | | (1,172 | ) | | | — | | | | — | | | | — | | |
| Class Q | | | (72,796 | ) | | | (13,322 | ) | | | — | | | | — | | |
| Net realized gains: | | | | | | | | | | | | | | | | | |
| Class A | | | — | | | | — | | | | (3,149,065 | ) | | | — | | |
| Class B | | | — | | | | — | | | | (602,429 | ) | | | — | | |
| Class C | | | — | | | | — | | | | (2,293,757 | ) | | | — | | |
| Class I | | | — | | | | — | | | | (25,483 | ) | | | — | | |
| Class Q | | | — | | | | — | | | | (26,071 | ) | | | — | | |
| Total distributions | | | (671,817 | ) | | | (72,677 | ) | | | (6,096,805 | ) | | | — | | |
| FROM CAPITAL SHARE TRANSACTIONS: | |
| Net proceeds from sale of shares | | | 104,928,041 | | | | 49,570,991 | | | | 225,899,108 | | | | 130,983,247 | | |
| Dividends reinvested | | | 558,626 | | | | 65,764 | | | | 3,983,760 | | | | — | | |
| | | | 105,486,667 | | | | 49,636,755 | | | | 229,882,868 | | | | 130,983,247 | | |
| Cost of shares redeemed | | | (65,590,355 | ) | | | (37,110,260 | ) | | | (65,228,166 | ) | | | (42,711,627 | ) | |
Net increase in net assets resulting from
capital share transactions | | | 39,896,312 | | | | 12,526,495 | | | | 164,654,702 | | | | 88,271,620 | | |
| Net increase in net assets | | | 75,583,184 | | | | 33,081,032 | | | | 238,668,429 | | | | 116,594,792 | | |
| NET ASSETS: | |
| Beginning of year | | | 132,676,106 | | | | 99,595,074 | | | | 235,831,055 | | | | 119,236,263 | | |
| End of year | | $ | 208,259,290 | | | $ | 132,676,106 | | | $ | 474,499,484 | | | $ | 235,831,055 | | |
| Undistributed net investment income at end of year | | $ | 2,923,300 | | | $ | 670,204 | | | $ | 727,435 | | | $ | 1,106,905 | | |
See Accompanying Notes to Financial Statements
64
STATEMENTS OF CHANGES IN NET ASSETS
| | | ING Greater
China Fund | | ING Index Plus
International
Equity Fund | |
| | | December 21,
2005(1) to
October 31,
2006 | | December 21,
2005(1) to
October 31,
2006 | |
| FROM OPERATIONS: | |
| Net investment income | | $ | 119,633 | | | $ | 816,012 | | |
Net realized gain (loss) on investments and foreign currency related
transactions | | | (99,352 | ) | | | 1,855,644 | | |
Net change in unrealized appreciation or depreciation on
investments and foreign currency related transactions | | | 3,519,820 | | | | 5,710,561 | | |
| Net increase in net assets resulting from operations | | | 3,540,101 | | | | 8,382,217 | | |
| FROM CAPITAL SHARE TRANSACTIONS: | |
| Net proceeds from sale of shares | | | 26,394,340 | | | | 91,204,957 | | |
| Cost of shares redeemed | | | (2,122,686 | ) | | | (7,694,903 | ) | |
| Net increase in net assets resulting from capital share transactions | | | 24,271,654 | | | | 83,510,054 | | |
| Net increase in net assets | | | 27,811,755 | | | | 91,892,271 | | |
| NET ASSETS: | |
| Beginning of period | | | — | | | | — | | |
| End of period | | $ | 27,811,755 | | | $ | 91,892,271 | | |
| Undistributed net investment income at end of period | | $ | 137,964 | | | $ | 888,758 | | |
(1) Commencement of operations
See Accompanying Notes to Financial Statements
65
STATEMENTS OF CHANGES IN NET ASSETS
| | | ING International Fund | | ING
International Capital
Appreciation Fund | |
| | | Year
Ended
October 31,
2006 | | Year
Ended
October 31,
2005 | | December 21,
2005(1) to
October 31,
2006 | |
| FROM OPERATIONS: | |
| Net investment income | | $ | 1,076,925 | | | $ | 924,866 | | | $ | 105,745 | | |
Net realized gain on investments, foreign currency
related transactions and payment by affiliate | | | 18,604,719 | | | | 15,771,935 | | | | 1,085,185 | | |
Net change in unrealized appreciation or depreciation
on investments and foreign currency related transactions | | | 4,910,755 | | | | (3,071,289 | ) | | | 3,494,526 | | |
| Net increase in net assets resulting from operations | | | 24,592,399 | | | | 13,625,512 | | | | 4,685,456 | | |
| FROM DISTRIBUTIONS TO SHAREHOLDERS: | |
| Net investment income: | |
| Class A | | | (808,009 | ) | | | (500,256 | ) | | | — | | |
| Class B | | | (134,209 | ) | | | (77,407 | ) | | | — | | |
| Class C | | | (114,855 | ) | | | (70,840 | ) | | | — | | |
| Class I | | | (475,409 | ) | | | (268,842 | ) | | | — | | |
| Class Q | | | (281,619 | ) | | | (93,747 | ) | | | — | | |
| Total distributions | | | (1,814,101 | ) | | | (1,011,092 | ) | | | — | | |
| FROM CAPITAL SHARE TRANSACTIONS: | |
| Net proceeds from sale of shares | | | 40,612,022 | | | | 34,317,445 | | | | 58,564,363 | | |
| Dividends reinvested | | | 1,681,978 | | | | 927,388 | | | | — | | |
| Redemption fee proceeds | | | 257 | | | | 12,635 | | | | — | | |
| | | | 42,294,257 | | | | 35,257,468 | | | | 58,564,363 | | |
| Cost of shares redeemed | | | (53,702,310 | ) | | | (30,672,702 | ) | | | (12,241,259 | ) | |
Net increase (decrease) in net assets resulting from capital
share transactions | | | (11,408,053 | ) | | | 4,584,766 | | | | 46,323,104 | | |
| Net increase in net assets | | | 11,370,245 | | | | 17,199,186 | | | | 51,008,560 | | |
| NET ASSETS: | |
| Beginning of period | | | 120,534,680 | | | | 103,335,494 | | | | — | | |
| End of period | | $ | 131,904,925 | | | $ | 120,534,680 | | | $ | 51,008,560 | | |
| Undistributed net investment income at end of period | | $ | 1,393,902 | | | $ | 1,737,694 | | | $ | 422,118 | | |
(1) Commencement of operations
See Accompanying Notes to Financial Statements
66
STATEMENTS OF CHANGES IN NET ASSETS
| | | ING International
Real Estate Fund | | ING International SmallCap Fund | |
| | | February 28,
2006(1) to
October 31,
2006 | | Year
Ended
October 31,
2006 | | Year
Ended
October 31,
2005 | |
| FROM OPERATIONS: | |
| Net investment income | | $ | 264,817 | | | $ | 2,559,972 | | | $ | 2,689,988 | | |
Net realized gain (loss) on investments, foreign currency
related transactions and payment by affiliate | | | (265,508 | ) | | | 62,907,548 | | | | 97,859,485 | | |
Net change in unrealized appreciation or depreciation on
investments and foreign currency related transactions | | | 7,393,293 | | | | 32,230,993 | | | | (16,256,485 | ) | |
| Net increase in net assets resulting from operations | | | 7,392,602 | | | | 97,698,513 | | | | 84,292,988 | | |
| FROM DISTRIBUTIONS TO SHAREHOLDERS: | |
| Net investment income: | |
| Class A | | | (120,231 | ) | | | (1,533,625 | ) | | | — | | |
| Class B | | | (1,428 | ) | | | (57,978 | ) | | | — | | |
| Class C | | | (19,994 | ) | | | (164,327 | ) | | | — | | |
| Class I | | | (34,816 | ) | | | — | | | | — | | |
| Class Q | | | — | | | | (617,820 | ) | | | — | | |
| Total distributions | | | (176,469 | ) | | | (2,373,750 | ) | | | — | | |
| FROM CAPITAL SHARE TRANSACTIONS: | |
| Net proceeds from sale of shares | | | 92,161,082 | | | | 309,748,096 | | | | 93,365,295 | | |
| Dividends reinvested | | | 62,630 | | | | 1,879,677 | | | | — | | |
| | | | 92,223,712 | | | | 311,627,773 | | | | 93,365,295 | | |
| Cost of shares redeemed | | | (8,592,241 | ) | | | (161,509,548 | ) | | | (158,584,246 | ) | |
Net increase (decrease) in net assets resulting from capital
share transactions | | | 83,631,471 | | | | 150,118,225 | | | | (65,218,951 | ) | |
| Net increase in net assets | | | 90,847,604 | | | | 245,442,988 | | | | 19,074,037 | | |
| NET ASSETS: | |
| Beginning of period | | | — | | | | 341,009,600 | | | | 321,935,563 | | |
| End of period | | $ | 90,847,604 | | | $ | 586,452,588 | | | $ | 341,009,600 | | |
| Undistributed net investment income at end of period | | $ | 2,391,308 | | | $ | 3,446,324 | | | $ | 2,368,780 | | |
(1) Commencement of operations
See Accompanying Notes to Financial Statements
67
STATEMENTS OF CHANGES IN NET ASSETS
| | | ING International Value Fund | | ING International Value Choice Fund | |
| | | Year
Ended
October 31,
2006 | | Year
Ended
October 31,
2005 | | Year
Ended
October 31,
2006 | | February 1,
2005(1) to
October 31,
2006 | |
| FROM OPERATIONS: | |
| Net investment income | | $ | 38,146,974 | | | $ | 30,795,481 | | | $ | 403,477 | | | $ | 36,817 | | |
Net realized gain on investments, foreign currency
related transactions and payment by affiliate | | | 492,808,704 | | | | 333,307,624 | | | | 1,062,416 | | | | 159,513 | | |
Net change in unrealized appreciation or depreciation
on investments and foreign currency related
transactions | | | 552,897,031 | | | | 192,970,828 | | | | 3,116,419 | | | | 257,310 | | |
| Net increase in net assets resulting from operations | | | 1,083,852,709 | | | | 557,073,933 | | | | 4,582,312 | | | | 453,640 | | |
| FROM DISTRIBUTIONS TO SHAREHOLDERS: | |
| Net investment income: | |
| Class A | | | (14,654,043 | ) | | | (24,560,725 | ) | | | (65,003 | ) | | | — | | |
| Class B | | | (194,108 | ) | | | (2,978,147 | ) | | | (16,400 | ) | | | — | | |
| Class C | | | (1,042,925 | ) | | | (4,480,827 | ) | | | (15,496 | ) | | | — | | |
| Class I | | | (15,430,051 | ) | | | (14,637,231 | ) | | | — | | | | — | | |
| Class Q | | | (268,368 | ) | | | (416,197 | ) | | | — | | | | — | | |
| Net realized gains: | | | | | | | | | | | | | | | | | |
| Class A | | | (133,758,480 | ) | | | (88,815,999 | ) | | | (106,743 | ) | | | — | | |
| Class B | | | (30,856,576 | ) | | | (21,863,296 | ) | | | (32,501 | ) | | | — | | |
| Class C | | | (51,541,230 | ) | | | (32,628,011 | ) | | | (33,480 | ) | | | — | | |
| Class I | | | (94,544,982 | ) | | | (40,249,883 | ) | | | — | | | | — | | |
| Class Q | | | (2,101,201 | ) | | | (1,347,031 | ) | | | — | | | | — | | |
| Total distributions | | | (344,391,964 | ) | | | (231,977,347 | ) | | | (269,623 | ) | | | — | | |
| FROM CAPITAL SHARE TRANSACTIONS: | |
| Net proceeds from sale of shares | | | 828,247,984 | | | | 888,315,865 | | | | 58,821,061 | | | | 9,890,518 | | |
| Dividends reinvested | | | 245,908,881 | | | | 168,697,259 | | | | 176,320 | | | | — | | |
| | | | 1,074,156,865 | | | | 1,057,013,124 | | | | 58,997,381 | | | | 9,890,518 | | |
| Cost of shares redeemed | | | (1,022,244,408 | ) | | | (1,185,357,264 | ) | | | (10,034,154 | ) | | | (1,005,577 | ) | |
Net increase (decrease) in net assets resulting from
capital share transactions | | | 51,912,457 | | | | (128,344,140 | ) | | | 48,963,227 | | | | 8,884,941 | | |
| Net increase in net assets | | | 791,373,202 | | | | 196,752,446 | | | | 53,275,916 | | | | 9,338,581 | | |
| NET ASSETS: | |
| Beginning of period | | | 4,056,615,910 | | | | 3,859,863,464 | | | | 9,338,581 | | | | — | | |
| End of period | | $ | 4,847,989,112 | | | $ | 4,056,615,910 | | | $ | 62,614,497 | | | $ | 9,338,581 | | |
| Undistributed net investment income at end of period | | $ | 40,659,747 | | | $ | 31,576,663 | | | $ | 332,255 | | | $ | 90,092 | | |
(1) Commencement of operations
See Accompanying Notes to Financial Statements
68
STATEMENTS OF CHANGES IN NET ASSETS
| | | ING Russia Fund | | ING Emerging
Markets Fixed
Income Fund | |
| | | Year
Ended
October 31,
2006 | | Year
Ended
October 31,
2005 | | December 21,
2005(1) to
October 31,
2006 | |
| FROM OPERATIONS: | |
| Net investment income (loss) | | $ | (3,690,687 | ) | | $ | (11,304 | ) | | $ | 707,511 | | |
Net realized gain on investments, foreign currency related
transactions, and futures | | | 46,256,786 | | | | 77,079 | | | | 82,947 | | |
Net change in unrealized appreciation or depreciation on
investments, foreign currency related transactions, and futures | | | 174,358,878 | | | | 61,195,797 | | | | 267,454 | | |
| Net increase in net assets resulting from operations | | | 216,924,977 | | | | 61,261,572 | | | | 1,057,912 | | |
| FROM DISTRIBUTIONS TO SHAREHOLDERS: | |
| Net investment income | |
| Class A | | | — | | | | (111,452 | ) | | | (587,392 | ) | |
| Class B | | | — | | | | — | | | | (4,028 | ) | |
| Class C | | | — | | | | — | | | | (9,308 | ) | |
| Class I | | | — | | | | — | | | | (513 | ) | |
| Total distributions | | | — | | | | (111,452 | ) | | | (601,241 | ) | |
| FROM CAPITAL SHARE TRANSACTIONS: | |
| Net proceeds from sale of shares | | | 528,911,241 | | | | 93,862,631 | | | | 26,474,530 | | |
| Dividends reinvested | | | — | | | | 96,494 | | | | 29,467 | | |
| Redemption fee proceeds | | | 2,984,157 | | | | 850,706 | | | | — | | |
| | | | 531,895,398 | | | | 94,809,831 | | | | 26,503,997 | | |
| Cost of shares redeemed | | | (268,475,876 | ) | | | (96,537,671 | ) | | | (202,829 | ) | |
Net increase (decrease) in net assets resulting from capital
share transactions | | | 263,419,522 | | | | (1,727,840 | ) | | | 26,301,168 | | |
| Net increase in net assets | | | 480,344,499 | | | | 59,422,280 | | | | 26,757,839 | | |
| NET ASSETS: | |
| Beginning of period | | | 271,602,751 | | | | 212,180,471 | | | | — | | |
| End of period | | $ | 751,947,250 | | | $ | 271,602,751 | | | $ | 26,757,839 | | |
Undistributed net investment income (accumulated
net investment loss) at end of period | | $ | — | | | $ | — | | | $ | 113,485 | | |
(1) Commencement of operations
See Accompanying Notes to Financial Statements
69
STATEMENTS OF CHANGES IN NET ASSETS
| | | ING Global
Bond Fund | | ING Diversified
International Fund | |
| | | June 30,
2006(1) to
October 31,
2006 | | December 21,
2005(1) to
October 31,
2006 | |
| FROM OPERATIONS: | |
| Net investment income (loss) | | $ | 200,566 | | | $ | (741,875 | ) | |
Net realized gain (loss) on investments, investments in underlying
affiliated funds, foreign currency related transactions, and futures | | | 348,838 | | | | (1,565,439 | ) | |
Net change in unrealized appreciation or depreciation on investments,
foreign currency related transactions, and futures | | | 229,037 | | | | 18,100,115 | | |
| Net increase in net assets resulting from operations | | | 778,441 | | | | 15,792,801 | | |
| FROM DISTRIBUTIONS TO SHAREHOLDERS: | |
| Net investment income: | |
| Class A | | | (154,905 | ) | | | — | | |
| Class B | | | (8 | ) | | | — | | |
| Class C | | | (71 | ) | | | — | | |
| Class I | | | (7 | ) | | | — | | |
| Total distributions | | | (154,991 | ) | | | — | | |
| FROM CAPITAL SHARE TRANSACTIONS: | |
| Net proceeds from sale of shares | | | 25,224,747 | | | | 264,857,407 | | |
| Cost of shares redeemed | | | — | | | | (17,677,662 | ) | |
| Net increase in net assets resulting from capital share transactions | | | 25,224,747 | | | | 247,179,745 | | |
| Net increase in net assets | | | 25,848,197 | | | | 262,972,546 | | |
| NET ASSETS: | |
| Beginning of period | | | — | | | | — | | |
| End of period | | $ | 25,848,197 | | | $ | 262,972,546 | | |
Undistributed net investment income (accumulated net investment
loss) at end of period | | $ | (11,046 | ) | | $ | — | | |
(1) Commencement of operations
See Accompanying Notes to Financial Statements
70
ING GLOBAL EQUITY DIVIDEND FUND
FINANCIAL HIGHLIGHTS
Selected data for a share of beneficial interest outstanding throughout each period.
| | | Class A | |
| | | Year Ended October 31, | | September 17,
2003(1) to
October 31, | |
| | | 2006 | | 2005 | | 2004 | | 2003 | |
| Per Share Operating Performance: | |
| Net asset value, beginning of period | | $ | 13.07 | | | | 12.41 | | | | 10.49 | | | | 10.00 | | |
| Income from investment operations: | |
| Net investment income | | $ | 0.54 | | | | 0.47 | * | | | 0.44 | | | | 0.02 | | |
| Net realized and unrealized gain on investments | | $ | 2.85 | | | | 0.92 | | | | 1.87 | | | | 0.47 | | |
| Total from investment operations | | $ | 3.39 | | | | 1.39 | | | | 2.31 | | | | 0.49 | | |
| Less distributions from: | |
| Net investment income | | $ | 0.51 | | | | 0.54 | | | | 0.39 | | | | — | | |
| Net realized gains on investments | | $ | 0.19 | | | | 0.19 | | | | — | | | | — | | |
| Total distributions | | $ | 0.70 | | | | 0.73 | | | | 0.39 | | | | — | | |
| Net asset value, end of period | | $ | 15.76 | | | | 13.07 | | | | 12.41 | | | | 10.49 | | |
| Total Return(2) | | % | 26.56 | | | | 11.45 | | | | 22.59 | | | | 4.90 | | |
| Ratios and Supplemental Data: | |
| Net assets, end of period (000's) | | $ | 108,911 | | | | 73,186 | | | | 11,316 | | | | 4,274 | | |
| Ratios to average net assets: | |
| Net expenses after expense reimbursement/recoupment(3)(4) | | % | 1.33 | | | | 1.40 | | | | 1.40 | | | | 1.40 | | |
| Gross expenses prior to expense reimbursement/recoupment(3) | | % | 1.27 | | | | 1.28 | | | | 3.44 | | | | 7.00 | | |
| Net investment income after expense reimbursement/recoupment(3)(4) | | % | 3.76 | | | | 3.60 | | | | 4.39 | | | | 3.58 | | |
| Portfolio turnover rate | | % | 50 | | | | 57 | | | | 60 | | | | 3 | | |
| | | Class B | |
| | | Year Ended October 31, | | October 24,
2003(1) to
October 31, | |
| | | 2006 | | 2005 | | 2004 | | 2003 | |
| Per Share Operating Performance: | |
| Net asset value, beginning of period | | $ | 13.05 | | | | 12.37 | | | | 10.49 | | | | 10.31 | | |
| Income from investment operations: | |
| Net investment income | | $ | 0.43 | | | | 0.37 | * | | | 0.42 | | | | 0.00 | ** | |
| Net realized and unrealized gain on investments | | $ | 2.84 | | | | 0.92 | | | | 1.82 | | | | 0.18 | | |
| Total from investment operations | | $ | 3.27 | | | | 1.29 | | | | 2.24 | | | | 0.18 | | |
| Less distributions from: | |
| Net investment income | | $ | 0.41 | | | | 0.42 | | | | 0.36 | | | | — | | |
| Net realized gains on investments | | $ | 0.19 | | | | 0.19 | | | | — | | | | — | | |
| Total distributions | | $ | 0.60 | | | | 0.61 | | | | 0.36 | | | | — | | |
| Net asset value, end of period | | $ | 15.72 | | | | 13.05 | | | | 12.37 | | | | 10.49 | | |
| Total Return(2) | | % | 25.55 | | | | 10.65 | | | | 21.92 | | | | 1.75 | | |
| Ratios and Supplemental Data: | |
| Net assets, end of period (000's) | | $ | 44,936 | | | | 28,811 | | | | 3,303 | | | | 12 | | |
| Ratios to average net assets: | |
| Net expenses after expense reimbursement/recoupment(3)(4) | | % | 2.08 | | | | 2.15 | | | | 2.15 | | | | 2.15 | | |
| Gross expenses prior to expense reimbursement/recoupment(3) | | % | 2.02 | | | | 2.03 | | | | 4.19 | | | | 7.75 | | |
| Net investment income (loss) after expense reimbursement/recoupment(3)(4) | | % | 3.05 | | | | 2.83 | | | | 4.03 | | | | (0.67 | ) | |
| Portfolio turnover rate | | % | 50 | | | | 57 | | | | 60 | | | | 3 | | |
(1) Commencement of operations.
(2) Total return is calculated assuming reinvestment of all dividends and capital gain distributions at net asset value and excluding the deduction of sales charges. Total return for less than one year is not annualized.
(3) Annualized for periods less than one year.
(4) The Investment Adviser has agreed to limit expenses, (excluding interest, taxes, brokerage and extraordinary expenses) subject to possible recoupment by ING Investments, LLC within three years of being incurred.
* Per share data calculated using average number of shares outstanding throughout the period.
** Amount represents less than $0.005 per share.
See Accompanying Notes to Financial Statements
71
ING GLOBAL EQUITY DIVIDEND FUND (CONTINUED)
FINANCIAL HIGHLIGHTS
Selected data for a share of beneficial interest outstanding throughout each period.
| | | Class C | |
| | | Year Ended October 31, | | October 29,
2003(1) to
October 31, | |
| | | 2006 | | 2005 | | 2004 | | 2003 | |
| Per Share Operating Performance: | |
| Net asset value, beginning of period | | $ | 13.02 | | | | 12.37 | | | | 10.48 | | | | 10.44 | | |
| Income from investment operations: | |
| Net investment income | | $ | 0.43 | | | | 0.37 | * | | | 0.39 | | | | 0.00 | ** | |
| Net realized and unrealized gain on investments | | $ | 2.84 | | | | 0.90 | | | | 1.86 | | | | 0.04 | | |
| Total from investment operations | | $ | 3.27 | | | | 1.27 | | | | 2.25 | | | | 0.04 | | |
| Less distributions from: | |
| Net investment income | | $ | 0.41 | | | | 0.43 | | | | 0.36 | | | | — | | |
| Net realized gains on investments | | $ | 0.19 | | | | 0.19 | | | | — | | | | — | | |
| Total distributions | | $ | 0.60 | | | | 0.62 | | | | 0.36 | | | | — | | |
| Net asset value, end of period | | $ | 15.69 | | | | 13.02 | | | | 12.37 | | | | 10.48 | | |
| Total Return(2) | | % | 25.62 | | | | 10.51 | | | | 21.99 | | | | 0.38 | | |
| Ratios and Supplemental Data: | |
| Net assets, end of period (000's) | | $ | 77,426 | | | | 48,965 | | | | 3,655 | | | | 19 | | |
| Ratios to average net assets: | |
| Net expenses after expense reimbursement/recoupment(3)(4) | | % | 2.08 | | | | 2.15 | | | | 2.15 | | | | 2.15 | | |
| Gross expenses prior to expense reimbursement/recoupment(3) | | % | 2.02 | | | | 2.03 | | | | 4.19 | | | | 7.75 | | |
| Net investment income (loss) after expense reimbursement/recoupment(3)(4) | | % | 3.03 | | | | 2.82 | | | | 3.99 | | | | (0.88 | ) | |
| Portfolio turnover rate | | % | 50 | | | | 57 | | | | 60 | | | | 3 | | |
(1) Commencement of operations.
(2) Total return is calculated assuming reinvestment of all dividends and capital gain distributions at net asset value and excluding the deduction of sales charges. Total return for less than one year is not annualized.
(3) Annualized for periods less than one year.
(4) The Investment Adviser has agreed to limit expenses, (excluding interest, taxes, brokerage and extraordinary expenses) subject to possible recoupment by ING Investments, LLC within three years of being incurred.
* Per share data calculated using average number of shares outstanding throughout the period.
** Amount represents less than $0.005 per share.
See Accompanying Notes to Financial Statements
72
ING GLOBAL NATURAL RESOURCES FUND
FINANCIAL HIGHLIGHTS
Selected data for a share of beneficial interest outstanding throughout each period.
| | | Class A | |
| | | Year Ended October 31, | |
| | | 2006 | | 2005 | | 2004 | | 2003 | | 2002 | |
| Per Share Operating Performance: | |
| Net asset value, beginning of year | | $ | 7.34 | | | | 7.09 | | | | 6.94 | | | | 4.40 | | | | 3.05 | | |
| Income (loss) from investment operations: | |
| Net investment loss | | $ | (0.06 | ) | | | (0.06 | ) | | | (0.05 | ) | | | (0.02 | ) | | | (0.01 | ) | |
| Net realized and unrealized gain on investments | | $ | 3.20 | | | | 0.54 | | | | 0.20 | | | | 2.56 | | | | 1.38 | | |
| Total from investment operations | | $ | 3.14 | | | | 0.48 | | | | 0.15 | | | | 2.54 | | | | 1.37 | | |
| Less distributions from: | |
| Net investment income | | $ | 0.02 | | | | 0.23 | | | | — | | | | — | | | | 0.02 | | |
| Total distributions | | $ | 0.02 | | | | 0.23 | | | | — | | | | — | | | | 0.02 | | |
| Net asset value, end of year | | $ | 10.46 | | | | 7.34 | | | | 7.09 | | | | 6.94 | | | | 4.40 | | |
| Total Return(1) | | % | 42.76 | | | | 6.81 | | | | 2.16 | | | | 57.73 | | | | 45.01 | | |
| Ratios and Supplemental Data: | |
| Net assets, end of year (000's) | | $ | 121,112 | | | | 87,441 | | | | 91,756 | | | | 101,696 | | | | 72,346 | | |
| Ratios to average net assets: | |
| Expenses | | % | 1.42 | | | | 1.56 | | | | 1.44 | | | | 1.57 | | | | 1.73 | | |
| Net investment loss | | % | (0.61 | ) | | | (0.77 | ) | | | (0.69 | ) | | | (0.36 | ) | | | (0.33 | ) | |
| Portfolio turnover rate | | % | 158 | | | | 78 | | | | 77 | | | | 94 | | | | 54 | | |
(1) Total return is calculated assuming reinvestment of all dividends and capital gain distributions at net asset value and excluding the deduction of sales charges.
See Accompanying Notes to Financial Statements
73
ING GLOBAL REAL ESTATE FUND
FINANCIAL HIGHLIGHTS
Selected data for a share of beneficial interest outstanding throughout each period.
| | | Class A | |
| | | Year Ended October 31, | | November 5,
2001(1) to
October 31, | |
| | | 2006 | | 2005 | | 2004 | | 2003 | | 2002 | |
| Per Share Operating Performance: | |
| Net asset value, beginning of period | | $ | 17.14 | | | | 15.40 | | | | 13.06 | | | | 10.40 | | | | 10.01 | | |
| Income from investment operations: | |
| Net investment income | | $ | 0.20 | * | | | 0.26 | *† | | | 0.27 | | | | 0.57 | | | | 0.45 | | |
| Net realized and unrealized gain on investments | | $ | 6.41 | | | | 2.94 | † | | | 3.26 | | | | 2.79 | | | | 0.31 | | |
| Total from investment operations | | $ | 6.61 | | | | 3.20 | | | | 3.53 | | | | 3.36 | | | | 0.76 | | |
| Less distributions from: | |
| Net investment income | | $ | 0.46 | | | | 0.54 | | | | 0.43 | | | | 0.54 | | | | 0.37 | | |
| Net realized gain on investments | | $ | 1.06 | | | | 0.92 | | | | 0.76 | | | | 0.16 | | | | — | | |
| Total distributions | | $ | 1.52 | | | | 1.46 | | | | 1.19 | | | | 0.70 | | | | 0.37 | | |
| Net asset value, end of period | | $ | 22.23 | | | | 17.14 | | | | 15.40 | | | | 13.06 | | | | 10.40 | | |
| Total Return(2) | | % | 41.09 | | | | 21.95 | | | | 28.90 | | | | 33.77 | | | | 7.47 | | |
| Ratios and Supplemental Data: | |
| Net assets, end of period (000's) | | $ | 467,405 | | | | 138,314 | | | | 95,561 | | | | 41,549 | | | | 25,440 | | |
| Ratios to average net assets: | |
| Net expenses after expense reimbursement/recoupment(3)(4) | | % | 1.39 | | | | 1.59 | | | | 1.75 | | | | 1.75 | | | | 1.76 | | |
| Gross expenses prior to expense reimbursement/recoupment(3) | | % | 1.39 | | | | 1.50 | | | | 1.55 | | | | 1.95 | | | | 2.46 | | |
| Net investment income after expense reimbursement/recoupment(3)(4) | | % | 1.04 | | | | 1.58 | † | | | 2.55 | | | | 5.14 | | | | 4.12 | | |
| Portfolio turnover rate | | % | 39 | | | | 91 | | | | 129 | | | | 124 | | | | 141 | | |
| | | Class B | |
| | | Year Ended October 31, | | March 15,
2002(1) to
October 31, | |
| | | 2006 | | 2005 | | 2004 | | 2003 | | 2002 | |
| Per Share Operating Performance: | |
| Net asset value, beginning of period | | $ | 15.01 | | | | 13.67 | | | | 11.74 | | | | 9.43 | | | | 10.03 | | |
| Income (loss) from investment operations: | |
| Net investment income | | $ | 0.05 | * | | | 0.12 | *† | | | 0.14 | | | | 0.48 | | | | 0.16 | | |
| Net realized and unrealized gain (loss) on investments | | $ | 5.56 | | | | 2.59 | † | | | 2.90 | | | | 2.47 | | | | (0.58 | ) | |
| Total from investment operations | | $ | 5.61 | | | | 2.71 | | | | 3.04 | | | | 2.95 | | | | (0.42 | ) | |
| Less distributions from: | |
| Net investment income | | $ | 0.36 | | | | 0.45 | | | | 0.35 | | | | 0.48 | | | | 0.18 | | |
| Net realized gain on investments | | $ | 1.06 | | | | 0.92 | | | | 0.76 | | | | 0.16 | | | | — | | |
| Total distributions | | $ | 1.42 | | | | 1.37 | | | | 1.11 | | | | 0.64 | | | | 0.18 | | |
| Net asset value, end of period | | $ | 19.20 | | | | 15.01 | | | | 13.67 | | | | 11.74 | | | | 9.43 | | |
| Total Return(2) | | % | 40.04 | | | | 21.05 | | | | 27.89 | | | | 32.83 | | | | (4.29 | ) | |
| Ratios and Supplemental Data: | |
| Net assets, end of period (000's) | | $ | 31,677 | | | | 12,302 | | | | 4,736 | | | | 1,506 | | | | 677 | | |
| Ratios to average net assets: | |
| Net expenses after expense reimbursement/recoupment(3)(4) | | % | 2.14 | | | | 2.34 | | | | 2.50 | | | | 2.50 | | | | 2.52 | | |
| Gross expenses prior to expense reimbursement/recoupment(3) | | % | 2.14 | | | | 2.25 | | | | 2.30 | | | | 2.70 | | | | 3.19 | | |
| Net investment income after expense reimbursement/recoupment(3)(4) | | % | 0.31 | | | | 0.79 | † | | | 1.78 | | | | 4.44 | | | | 3.74 | | |
| Portfolio turnover rate | | % | 39 | | | | 91 | | | | 129 | | | | 124 | | | | 141 | | |
(1) Commencement of operations.
(2) Total return is calculated assuming reinvestment of all dividends and capital gain distributions at net asset value and excluding the deduction of sales charges. Total return for less than one year is not annualized.
(3) Annualized for periods less than one year.
(4) The Investment Adviser has agreed to limit expenses, (excluding interest, taxes, brokerage and extraordinary expenses) subject to possible recoupment by ING Investments, LLC within three years of being incurred.
* Per share data calculated using average number of shares outstanding throughout the period.
† Effective November 1, 2004, the Fund adopted a policy to reduce cost of investments for financial statement purposes by the distributions received in excess of income from Real Estate Investment Trusts. The effect of this change for the twelve months ended October 31, 2005 was to decrease the net investment income per share by $0.12 and $0.10, increase net realized and unrealized gain on investments per share by $0.12 and $0.10 and decrease the ratio of net investment income to average net assets from 2.31% to 1.58% and 1.51% to 0.79% on Class A and Class B.
See Accompanying Notes to Financial Statements
74
ING GLOBAL REAL ESTATE FUND (CONTINUED)
FINANCIAL HIGHLIGHTS
Selected data for a share of beneficial interest outstanding throughout each period.
| | | Class C | |
| | | Year Ended October 31, | | January 8,
2002(1) to
October 31, | |
| | | 2006 | | 2005 | | 2004 | | 2003 | | 2002 | |
| Per Share Operating Performance: | |
| Net asset value, beginning of period | | $ | 15.65 | | | | 14.19 | | | | 12.14 | | | | 9.70 | | | | 9.99 | | |
| Income (loss) from investment operations: | |
| Net investment income | | $ | 0.05 | * | | | 0.12 | *† | | | 0.14 | | | | 0.45 | | | | 0.19 | | |
| Net realized and unrealized gain (loss) on investments | | $ | 5.82 | | | | 2.71 | † | | | 3.02 | | | | 2.60 | | | | (0.31 | ) | |
| Total from investment operations | | $ | 5.87 | | | | 2.83 | | | | 3.16 | | | | 3.05 | | | | (0.12 | ) | |
| Less distributions from: | |
| Net investment income | | $ | 0.36 | | | | 0.45 | | | | 0.35 | | | | 0.45 | | | | 0.17 | | |
| Net realized gain on investments | | $ | 1.06 | | | | 0.92 | | | | 0.76 | | | | 0.16 | | | | — | | |
| Total distributions | | $ | 1.42 | | | | 1.37 | | | | 1.11 | | | | 0.61 | | | | 0.17 | | |
| Net asset value, end of period | | $ | 20.10 | | | | 15.65 | | | | 14.19 | | | | 12.14 | | | | 9.70 | | |
| Total Return(2) | | % | 40.06 | | | | 21.11 | | | | 27.93 | | | | 32.89 | | | | (1.24 | ) | |
| Ratios and Supplemental Data: | |
| Net assets, end of period (000's) | | $ | 109,197 | | | | 27,989 | | | | 7,817 | | | | 1,732 | | | | 2,320 | | |
| Ratios to average net assets: | |
| Net expenses after expense reimbursement/recoupment(3)(4) | | % | 2.14 | | | | 2.34 | | | | 2.50 | | | | 2.50 | | | | 2.52 | | |
| Gross expenses prior to expense reimbursement/recoupment(3) | | % | 2.14 | | | | 2.25 | | | | 2.30 | | | | 2.70 | | | | 3.19 | | |
| Net investment income after expense reimbursement/recoupment(3)(4) | | % | 0.29 | | | | 0.78 | † | | | 1.72 | | | | 4.60 | | | | 3.51 | | |
| Portfolio turnover rate | | % | 39 | | | | 91 | | | | 129 | | | | 124 | | | | 141 | | |
| | | Class I | |
| | | Year
Ended
October 31,
2006 | | June 3,
2005(1) to
October 31,
2005 | |
| Per Share Operating Performance: | |
| Net asset value, beginning of period | | $ | 17.14 | | | | 16.32 | | |
| Income from investment operations: | |
| Net investment income | | $ | 0.28 | * | | | 0.14 | *†† | |
| Net realized and unrealized gain on investments | | $ | 6.39 | | | | 0.86 | †† | |
| Total from investment operations | | $ | 6.67 | | | | 1.00 | | |
| Less distributions from: | |
| Net investment income | | $ | 0.52 | | | | 0.18 | | |
| Net realized gains on investment | | $ | 1.06 | | | | — | | |
| Total distributions | | $ | 1.58 | | | | 0.18 | | |
| Net asset value, end of period | | $ | 22.23 | | | | 17.14 | | |
| Total Return(2) | | % | 41.49 | | | | 6.14 | | |
| Ratios and Supplemental Data: | |
| Net assets, end of period (000's) | | $ | 11,226 | | | | 1,681 | | |
| Ratios to average net assets: | |
| Net expenses after expense reimbursement/recoupment(3)(4) | | % | 1.06 | | | | 1.30 | | |
| Gross expenses prior to expense reimbursement/recoupment(3) | | % | 1.06 | | | | 1.22 | | |
| Net investment income after expense reimbursement/recoupment(3)(4) | | % | 1.40 | | | | 0.85 | † | |
| Portfolio turnover rate | | % | 39 | | | | 91 | | |
(1) Commencement of operations.
(2) Total return is calculated assuming reinvestment of all dividends and capital gain distributions at net asset value and excluding the deduction of sales charges. Total return for less than one year is not annualized.
(3) Annualized for periods less than one year.
(4) The Investment Adviser has agreed to limit expenses, (excluding interest, taxes, brokerage and extraordinary expenses) subject to possible recoupment by ING Investments, LLC within three years of being incurred.
* Per share data calculated using average number of shares outstanding throughout the period.
† Effective November 1, 2004, the Fund adopted a policy to reduce cost of investments for financial statement purposes by the distributions received in excess of income from Real Estate Investment Trusts. The effect of this change for the twelve months ended October 31, 2005 was to decrease the net investment income per share by $0.11, increase net realized and unrealized gain on investments per share by $0.11 and decrease the ratio of net investment income to average net assets from 1.51% to 0.78% for Class C.
†† Effective November 1, 2004, the Fund adopted a policy to reduce cost of investments for financial statement purposes by the distributions received in excess of income from Real Estate Investment Trusts. The effect of this change for the five months ended October 31, 2005 was to decrease the net investment income per share by $0.30, increase net realized and unrealized gain on investments per share by $0.30 and decrease the ratio of net investment income to average net assets from 2.60% to 0.85% for Class I.
See Accompanying Notes to Financial Statements
75
ING GLOBAL VALUE CHOICE FUND
FINANCIAL HIGHLIGHTS
Selected data for a share of beneficial interest outstanding throughout each period.
| | | Class A | |
| | | Year Ended October 31, | |
| | | 2006 | | 2005 | | 2004 | | 2003 | | 2002 | |
| Per Share Operating Performance: | |
| Net asset value, beginning of year | | $ | 18.16 | | | | 15.96 | | | | 14.76 | | | | 12.36 | | | | 15.45 | | |
| Income (loss) from investment operations: | |
| Net investment income (loss) | | $ | 0.08 | | | | 0.09 | | | | (0.04 | ) | | | (0.06 | ) | | | (0.12 | )* | |
| Net realized and unrealized gain (loss) on investments | | $ | 3.62 | | | | 2.11 | | | | 1.24 | | | | 2.46 | | | | (2.97 | )* | |
| Total from investment operations | | $ | 3.70 | | | | 2.20 | | | | 1.20 | | | | 2.40 | | | | (3.09 | ) | |
| Less distributions from: | |
| Net investment income | | $ | 0.14 | | | | — | | | | — | | | | — | | | | — | | |
| Total distributions | | $ | 0.14 | | | | — | | | | — | | | | — | | | | — | | |
| Payment by affiliate | | $ | — | | | | 0.00 | ** | | | — | | | | — | | | | — | | |
| Net asset value, end of year | | $ | 21.72 | | | | 18.16 | | | | 15.96 | | | | 14.76 | | | | 12.36 | | |
| Total Return(1) | | % | 20.48 | | | | 13.78 | † | | | 8.13 | | | | 19.42 | | | | (20.00 | ) | |
| Ratios and Supplemental Data: | |
| Net assets, end of year (000's) | | $ | 47,305 | | | | 41,941 | | | | 46,133 | | | | 56,877 | | | | 69,478 | | |
| Ratios to average net assets: | |
Net expenses after expense reimbursement/recoupment and brokerage
commission recapture(2) | | % | 1.77 | | | | 1.85 | | | | 1.85 | | | | 1.85 | | | | 1.86 | | |
Net expenses after expense reimbursement/recoupment and prior to
brokerage commission recapture(2) | | % | 1.78 | | | | 1.85 | | | | 1.85 | | | | 1.85 | | | | 1.86 | | |
Gross expenses prior to expense reimbursement/recoupment and brokerage
commission recapture | | % | 1.78 | | | | 1.90 | | | | 1.77 | | | | 1.93 | | | | 1.96 | | |
Net investment income (loss) after expense reimbursement/recoupment and
brokerage commission recapture(2) | | % | 0.40 | | | | 0.46 | | | | (0.21 | ) | | | (0.35 | ) | | | (0.83 | ) | |
| Portfolio turnover rate | | % | 77 | | | | 129 | | | | 101 | | | | 125 | | | | 281 | | |
| | | Class B | |
| | | Year Ended October 31, | |
| | | 2006 | | 2005 | | 2004 | | 2003 | | 2002 | |
| Per Share Operating Performance: | |
| Net asset value, beginning of year | | $ | 19.67 | | | | 17.39 | | | | 16.19 | | | | 13.65 | | | | 17.19 | | |
| Income (loss) from investment operations: | |
| Net investment loss | | $ | (0.04 | ) | | | (0.04 | ) | | | (0.17 | ) | | | (0.16 | ) | | | (0.25 | )* | |
| Net realized and unrealized gain (loss) on investments | | $ | 3.91 | | | | 2.32 | | | | 1.37 | | | | 2.70 | | | | (3.29 | )* | |
| Total from investment operations | | $ | 3.87 | | | | 2.28 | | | | 1.20 | | | | 2.54 | | | | (3.54 | ) | |
| Payment by affiliate | | $ | — | | | | 0.00 | ** | | | — | | | | — | | | | — | | |
| Net asset value, end of year | | $ | 23.54 | | | | 19.67 | | | | 17.39 | | | | 16.19 | | | | 13.65 | | |
| Total Return(1) | | % | 19.67 | | | | 13.11 | † | | | 7.41 | | | | 18.61 | | | | (20.59 | ) | |
| Ratios and Supplemental Data: | |
| Net assets, end of year (000's) | | $ | 21,364 | | | | 23,483 | | | | 28,559 | | | | 35,459 | | | | 38,603 | | |
| Ratios to average net assets: | |
Net expenses after expense reimbursement/recoupment and brokerage
commission recapture(2) | | % | 2.42 | | | | 2.50 | | | | 2.50 | | | | 2.50 | | | | 2.51 | | |
Net expenses after expense reimbursement/recoupment and prior to
brokerage commission recapture(2) | | % | 2.43 | | | | 2.50 | | | | 2.50 | | | | 2.50 | | | | 2.51 | | |
Gross expenses prior to expense reimbursement/recoupment and brokerage
commission recapture | | % | 2.43 | | | | 2.55 | | | | 2.42 | | | | 2.58 | | | | 2.61 | | |
Net investment loss after expense reimbursement/recoupment and
brokerage commission recapture(2) | | % | (0.25 | ) | | | (0.19 | ) | | | (0.87 | ) | | | (1.00 | ) | | | (1.46 | ) | |
| Portfolio turnover rate | | % | 77 | | | | 129 | | | | 101 | | | | 125 | | | | 281 | | |
(1) Total return is calculated assuming reinvestment of all dividends and capital gain distributions at net asset value and excluding the deduction of sales charges.
(2) The Investment Adviser has agreed to limit expenses, (excluding interest, taxes, brokerage and extraordinary expenses) subject to possible recoupment by ING Investments, LLC within three years of being incurred.
* Per share data calculated using average number of shares outstanding throughout the period.
** Amount represents less than $0.005 per share or 0.005%.
† In 2005, there was no impact on total return due to payment by affiliate.
See Accompanying Notes to Financial Statements
76
ING GLOBAL VALUE CHOICE FUND (CONTINUED)
FINANCIAL HIGHLIGHTS
Selected data for a share of beneficial interest outstanding throughout each period.
| | | Class C | |
| | | Year Ended October 31, | |
| | | 2006 | | 2005 | | 2004 | | 2003 | | 2002 | |
| Per Share Operating Performance: | |
| Net asset value, beginning of year | | $ | 17.50 | | | | 15.48 | | | | 14.41 | | | | 12.14 | | | | 15.29 | | |
| Income (loss) from investment operations: | |
| Net investment loss | | $ | (0.05 | ) | | | (0.04 | ) | | | (0.15 | ) | | | (0.15 | ) | | | (0.22 | )* | |
| Net realized and unrealized gain (loss) on investments | | $ | 3.50 | | | | 2.06 | | | | 1.22 | | | | 2.42 | | | | (2.93 | ) | |
| Total from investment operations | | $ | 3.45 | | | | 2.02 | | | | 1.07 | | | | 2.27 | | | | (3.15 | ) | |
| Less distributions from: | |
| Net investment income | | $ | 0.02 | | | | — | | | | — | | | | — | | | | — | | |
| Total distributions | | $ | 0.02 | | | | — | | | | — | | | | — | | | | — | | |
| Payment by affiliate | | $ | — | | | | 0.00 | ** | | | — | | | | — | | | | — | | |
| Net asset value, end of year | | $ | 20.93 | | | | 17.50 | | | | 15.48 | | | | 14.41 | | | | 12.14 | | |
| Total Return(1) | | % | 19.73 | | | | 13.05 | † | | | 7.43 | | | | 18.70 | | | | (20.60 | ) | |
| Ratios and Supplemental Data: | |
| Net assets, end of year (000's) | | $ | 31,612 | | | | 30,918 | | | | 35,784 | | | | 45,476 | | | | 51,868 | | |
| Ratios to average net assets: | |
Net expenses after expense reimbursement/recoupment and brokerage
commission recapture(2) | | % | 2.42 | | | | 2.50 | | | | 2.50 | | | | 2.50 | | | | 2.51 | | |
Net expenses after expense reimbursement/recoupment and prior to
brokerage commission recapture(2) | | % | 2.43 | | | | 2.50 | | | | 2.50 | | | | 2.50 | | | | 2.51 | | |
Gross expenses prior to expense reimbursement/recoupment and brokerage
commission recapture | | % | 2.43 | | | | 2.55 | | | | 2.42 | | | | 2.58 | | | | 2.61 | | |
Net investment loss after expense reimbursement/recoupment and
brokerage commission recapture(2) | | % | (0.26 | ) | | | (0.19 | ) | | | (0.87 | ) | | | (1.01 | ) | | | (1.46 | ) | |
| Portfolio turnover rate | | % | 77 | | | | 129 | | | | 101 | | | | 125 | | | | 281 | | |
| | | Class I | |
| | | September 6,
2006(4) to
October 31,
2006 | |
| Per Share Operating Performance: | |
| Net asset value, beginning of period | | $ | 21.31 | | |
| Income from investment operations: | |
| Net investment loss | | $ | (0.11 | ) | |
| Net realized and unrealized gain on investments | | $ | 0.53 | | |
| Total from investment operations | | $ | 0.42 | | |
| Net asset value, end of period | | $ | 21.73 | | |
| Total Return(1) | | % | 1.97 | | |
| Ratios/Supplemental Data: | |
| Net assets, end of period (000's) | | $ | 3,010 | | |
| Ratio to average net assets: | | | | | |
| Net expenses after brokerage commission recapture(3) | | % | 1.26 | | |
| Gross expenses prior to brokerage commission recapture(3) | | % | 1.27 | | |
| Net investment loss after brokerage commission recapture(3) | | % | (0.69 | ) | |
| Portfolio turnover rate | | % | 77 | | |
(1) Total return is calculated assuming reinvestment of all dividends and capital gain distributions at net asset value and excluding the deduction of sales charges. Total return for less than one year is not annualized.
(2) The Investment Adviser has agreed to limit expenses, (excluding interest, taxes, brokerage and extraordinary expenses) subject to possible recoupment by ING Investments, LLC within three years of being incurred.
(3) Annualized for periods less than one year.
(4) Commencement of operations.
* Per share data calculated using average number of shares outstanding throughout the period.
** Amount represents less than $0.005 per share.
† In 2005, there was no impact on total return due to payment by affiliate.
See Accompanying Notes to Financial Statements
77
ING GLOBAL VALUE CHOICE FUND (CONTINUED)
FINANCIAL HIGHLIGHTS
Selected data for a share of beneficial interest outstanding throughout each period.
| | | Class Q | |
| | | Year Ended October 31, | |
| | | 2006 | | 2005 | | 2004 | | 2003 | | 2002 | |
| Per Share Operating Performance: | |
| Net asset value, beginning of year | | $ | 21.25 | | | | 18.61 | | | | 17.17 | | | | 14.34 | | | | 17.87 | | |
| Income (loss) from investment operations: | |
| Net investment income (loss) | | $ | 0.18 | * | | | 0.15 | | | | 0.01 | | | | (0.01 | ) | | | (0.08 | )* | |
| Net realized and unrealized gain (loss) on investments | | $ | 4.20 | | | | 2.49 | | | | 1.43 | | | | 2.84 | | | | (3.45 | )* | |
| Total from investment operations | | $ | 4.38 | | | | 2.64 | | | | 1.44 | | | | 2.83 | | | | (3.53 | ) | |
| Less distributions from: | |
| Net investment income | | $ | 0.19 | | | | — | | | | — | | | | — | | | | — | | |
| Total distributions | | $ | 0.19 | | | | — | | | | — | | | | — | | | | — | | |
| Payment by affiliate | | $ | — | | | | 0.00 | ** | | | — | | | | — | | | | — | | |
| Net asset value, end of year | | $ | 25.44 | | | | 21.25 | | | | 18.61 | | | | 17.17 | | | | 14.34 | | |
| Total Return(1) | | % | 20.75 | | | | 14.19 | † | | | 8.39 | | | | 19.74 | | | | (19.75 | ) | |
| Ratios and Supplemental Data: | |
| Net assets, end of year (000's) | | $ | 2,757 | | | | 4,387 | | | | 4,223 | | | | 6,454 | | | | 8,194 | | |
| Ratios to average net assets: | |
Net expense after reimbursement/recoupment and brokerage commission
recapture(2) | | % | 1.51 | | | | 1.55 | | | | 1.59 | | | | 1.54 | | | | 1.49 | | |
Net expenses after expense reimbursement/recoupment and prior to
brokerage commission recapture(2) | | % | 1.52 | | | | 1.55 | | | | 1.59 | | | | 1.54 | | | | 1.49 | | |
Gross expenses prior to expense reimbursement/recoupment and brokerage
commission recapture | | % | 1.52 | | | | 1.60 | | | | 1.51 | | | | 1.62 | | | | 1.59 | | |
Net investment income (loss) after expense reimbursement/recoupment and
brokerage commission recapture(2) | | % | 0.75 | | | | 0.75 | | | | 0.05 | | | | (0.04 | ) | | | (0.47 | ) | |
| Portfolio turnover rate | | % | 77 | | | | 129 | | | | 101 | | | | 125 | | | | 281 | | |
(1) Total return is calculated assuming reinvestment of all dividends and capital gain distributions at net asset value and excluding the deduction of sales charges.
(2) The Investment Adviser has agreed to limit expenses, (excluding interest, taxes, brokerage and extraordinary expenses) subject to possible recoupment by ING Investments, LLC within three years of being incurred.
* Per share data calculated using average number of shares outstanding throughout the period.
** Amount represents less than $0.005 per share.
† In 2005, there was no impact on total return due to payment by affiliate.
See Accompanying Notes to Financial Statements
78
ING EMERGING COUNTRIES FUND
FINANCIAL HIGHLIGHTS
Selected data for a share of beneficial interest outstanding throughout each period.
| | | Class A | |
| | | Year Ended October 31, | |
| | | 2006 | | 2005 | | 2004 | | 2003 | | 2002 | |
| Per Share Operating Performance: | |
| Net asset value, beginning of year | | $ | 23.60 | | | | 19.40 | | | | 17.32 | | | | 12.44 | | | | 11.87 | | |
| Income (loss) from investment operations: | |
| Net investment income (loss) | | $ | 0.48 | | | | 0.19 | | | | 0.09 | | | | 0.03 | | | | (0.10 | ) | |
| Net realized and unrealized gain on investments (net of Indian tax) | | $ | 5.68 | | | | 3.98 | | | | 2.08 | | | | 4.85 | | | | 0.67 | | |
| Total from investment operations | | $ | 6.16 | | | | 4.17 | | | | 2.17 | | | | 4.88 | | | | 0.57 | | |
| Less distributions from: | |
| Net investment income (loss) | | $ | 0.14 | | | | 0.02 | | | | 0.09 | | | | — | | | | (0.00 | )* | |
| Total distributions | | $ | 0.14 | | | | 0.02 | | | | 0.09 | | | | — | | | | — | | |
| Payment by affiliate | | $ | — | | | | 0.05 | | | | 0.00 | * | | | — | | | | — | | |
| Net asset value, end of year | | $ | 29.62 | | | | 23.60 | | | | 19.40 | | | | 17.32 | | | | 12.44 | | |
| Total Return(1) | | % | 26.19 | | | | 21.76 | †† | | | 12.58 | † | | | 39.23 | | | | 4.80 | | |
| Ratios and Supplemental Data: | |
| Net assets, end of year (000's) | | $ | 123,219 | | | | 87,143 | | | | 67,282 | | | | 71,953 | | | | 62,063 | | |
| Ratios to average net assets: | |
Net expenses after expense reimbursement/recoupment and brokerage
commission recapture(2) | | % | 1.91 | | | | 2.00 | | | | 2.20 | | | | 2.27 | | | | 2.32 | | |
Net expenses after expense reimbursement/recoupment and prior to
brokerage commission recapture(2) | | % | 1.92 | | | | 2.00 | | | | 2.20 | | | | 2.27 | | | | 2.32 | | |
Gross expenses prior to expense reimbursement/recoupment and brokerage
commission recapture | | % | 2.02 | | | | 2.09 | | | | 2.10 | | | | 2.37 | | | | 2.26 | | |
Net investment income (loss) after expense reimbursement/recoupment and
brokerage commission recapture(2) | | % | 1.80 | | | | 0.91 | | | | 0.41 | | | | 0.22 | | | | (0.56 | ) | |
| Portfolio turnover rate | | % | 35 | | | | 124 | | | | 88 | | | | 135 | | | | 124 | | |
| | | Class B | |
| | | Year Ended October 31, | |
| | | 2006 | | 2005 | | 2004 | | 2003 | | 2002 | |
| Per Share Operating Performance: | |
| Net asset value, beginning of year | | $ | 23.17 | | | | 19.17 | | | | 17.15 | | | | 12.39 | | | | 11.85 | | |
| Income (loss) from investment operations: | |
| Net investment income (loss) | | $ | 0.28 | ** | | | 0.04 | | | | (0.04 | ) | | | (0.06 | ) | | | (0.16 | ) | |
| Net realized and unrealized gain on investments (net of Indian tax) | | $ | 5.59 | | | | 3.91 | | | | 2.06 | | | | 4.82 | | | | 0.70 | | |
| Total from investment operations | | $ | 5.87 | | | | 3.95 | | | | 2.02 | | | | 4.76 | | | | 0.54 | | |
| Payment by affiliate | | $ | — | | | | 0.05 | | | | 0.00 | * | | | — | | | | — | | |
| Net asset value, end of year | | $ | 29.04 | | | | 23.17 | | | | 19.17 | | | | 17.15 | | | | 12.39 | | |
| Total Return(1) | | % | 25.33 | | | | 20.87 | †† | | | 11.78 | † | | | 38.42 | | | | 4.56 | | |
| Ratios and Supplemental Data: | |
| Net assets, end of year (000's) | | $ | 13,575 | | | | 12,562 | | | | 12,581 | | | | 16,425 | | | | 15,150 | | |
| Ratios to average net assets: | |
Net expenses after expense reimbursement/recoupment and brokerage
commission recapture(2) | | % | 2.66 | | | | 2.74 | | | | 2.85 | | | | 2.92 | | | | 2.97 | | |
Net expenses after expense reimbursement/recoupment and prior to
brokerage commission recapture(2) | | % | 2.67 | | | | 2.74 | | | | 2.85 | | | | 2.92 | | | | 2.97 | | |
Gross expenses prior to expense reimbursement/recoupment and brokerage
commission recapture | | % | 2.67 | | | | 2.74 | | | | 2.75 | | | | 3.02 | | | | 2.91 | | |
Net investment income (loss) after expense reimbursement/recoupment and
brokerage commission recapture(2) | | % | 1.06 | | | | 0.14 | | | | (0.30 | ) | | | (0.40 | ) | | | (1.23 | ) | |
| Portfolio turnover rate | | % | 35 | | | | 124 | | | | 88 | | | | 135 | | | | 124 | | |
(1) Total return is calculated assuming reinvestment of all dividends and capital gain distributions at net asset value and excluding the deduction of sales charges.
(2) The Investment Adviser has agreed to limit expenses, (excluding interest, taxes, brokerage and extraordinary expenses) subject to possible recoupment by ING Investments, LLC within three years of being incurred.
* Amount represents less than $0.005 per share.
** Per share data calculated using average number of shares outstanding throughout the period.
† In 2004, 0.06% of the total return consists of a gain on the disposition of an investment not meeting the Fund's investment restrictions. Excluding this item, total return would have been 12.52% and 11.72% for Class A and Class B, respectively.
†† In 2005, 0.26% of the total return consists of a payment by affiliate. Excluding this item, total return would have been 21.50% and 20.61% for Class A and Class B, respectively.
See Accompanying Notes to Financial Statements
79
ING EMERGING COUNTRIES FUND (CONTINUED)
FINANCIAL HIGHLIGHTS
Selected data for a share of beneficial interest outstanding throughout each period.
| | | Class C | |
| | | Year Ended October 31, | |
| | | 2006 | | 2005 | | 2004 | | 2003 | | 2002 | |
| Per Share Operating Performance: | |
| Net asset value, beginning of year | | $ | 22.04 | | | | 18.24 | | | | 16.32 | | | | 11.79 | | | | 11.41 | | |
| Income (loss) from investment operations: | |
| Net investment income (loss) | | $ | 0.25 | | | | 0.03 | | | | (0.03 | ) | | | (0.06 | ) | | | (0.25 | ) | |
| Net realized and unrealized gain on investments (net of Indian tax) | | $ | 5.31 | | | | 3.72 | | | | 1.95 | | | | 4.59 | | | | 0.63 | | |
| Total from investment operations | | $ | 5.56 | | | | 3.75 | | | | 1.92 | | | | 4.53 | | | | 0.38 | | |
| Less distributions from: | |
| Net investment income | | $ | 0.07 | | | | — | | | | — | | | | — | | | | 0.04 | | |
| Total Distributions | | $ | 0.07 | | | | — | | | | — | | | | — | | | | 0.04 | | |
| Payment by affiliate | | $ | — | | | | 0.05 | | | | 0.00 | * | | | — | | | | — | | |
| Net asset value, end of year | | $ | 27.53 | | | | 22.04 | | | | 18.24 | | | | 16.32 | | | | 11.79 | | |
| Total Return(1) | | % | 25.29 | | | | 20.83 | †† | | | 11.76 | † | | | 38.42 | | | | 3.33 | | |
| Ratios and Supplemental Data: | |
| Net assets, end of year (000's) | | $ | 35,847 | | | | 20,985 | | | | 9,680 | | | | 10,033 | | | | 9,519 | | |
| Ratios to average net assets: | |
Net expenses after expense reimbursement/recoupment and brokerage
commission recapture(2) | | % | 2.66 | | | | 2.74 | | | | 2.85 | | | | 2.92 | | | | 2.97 | | |
Net expenses after expense reimbursement/recoupment and prior to
brokerage commission recapture(2) | | % | 2.67 | | | | 2.74 | | | | 2.85 | | | | 2.92 | | | | 2.97 | | |
Gross expenses prior to expense reimbursement/recoupment and brokerage
commission recapture | | % | 2.67 | | | | 2.74 | | | | 2.75 | | | | 3.02 | | | | 2.91 | | |
Net investment income (loss) after expense reimbursement/recoupment
and brokerage commission recapture(2) | | % | 1.12 | | | | 0.25 | | | | (0.20 | ) | | | (0.40 | ) | | | (1.20 | ) | |
| Portfolio turnover rate | | % | 35 | | | | 124 | | | | 88 | | | | 135 | | | | 124 | | |
| | | Class I | |
| | | December 21,
2005(3) to
October 31,
2006 | |
| Per Share Operating Performance: | |
| Net asset value, beginning of period | | $ | 25.52 | | |
| Income from investment operations: | |
| Net investment income | | $ | 0.65 | ** | |
Net realized and unrealized gain
on investments (net of Indian tax) | | $ | 3.55 | | |
| Total from investment operations | | $ | 4.20 | | |
| Net asset value, end of period | | $ | 29.72 | | |
| Total Return(1) | | % | 16.46 | | |
| Ratios/Supplemental Data: | |
| Net assets, end of period (000's) | | $ | 23,456 | | |
| Ratio to average net assets: | |
| Net expenses after expense reimbursement/recoupment and brokerage commission recapture(2)(4) | | % | 1.54 | | |
| Net expenses after expense reimbursement/recoupment and prior to brokerage commission recapture(2)(4) | | % | 1.55 | | |
| Gross expenses prior to expense reimbursement/recoupment and brokerage commission recapture(4) | | % | 1.55 | | |
| Net investment income after expense reimbursement/recoupment and brokerage commission recapture(2)(4) | | % | 2.73 | | |
| Portfolio turnover rate | | % | 35 | | |
(1) Total return is calculated assuming reinvestment of all dividends and capital gain distributions at net asset value and excluding the deduction of sales charges. Total return for less than one year is not annualized.
(2) The Investment Adviser has agreed to limit expenses, (excluding interest, taxes, brokerage and extraordinary expenses) subject to possible recoupment by ING Investments, LLC within three years of being incurred.
(3) Commencement of operations.
(4) Annualized for periods less than one year.
* Amount represents less than $0.005 per share.
** Per share data calculated using average number of shares outstanding throughout the period.
† In 2004, 0.06% of the total return consists of a gain on an investment not meeting the Fund's investment restrictions. Excluding this item, total return would have been 11.70%.
†† In 2005, 0.27% of the total return on Class C consists of a payment by affiliate. Excluding this item, total return would have been 20.56%.
See Accompanying Notes to Financial Statements
80
ING EMERGING COUNTRIES FUND (CONTINUED)
FINANCIAL HIGHLIGHTS
Selected data for a share of beneficial interest outstanding throughout each period.
| | | Class M | |
| | | Year Ended October 31, | | August 5,
2002(1) to
October 31, | |
| | | 2006 | | 2005 | | 2004 | | 2003 | | 2002 | |
| Per Share Operating Performance: | |
| Net asset value, beginning of period | | $ | 23.20 | | | | 19.15 | | | | 17.12 | | | | 12.35 | | | | 12.39 | | |
| Income (loss) from investment operations: | |
| Net investment income (loss) | | $ | 0.35 | ** | | | 0.09 | | | | (0.00 | )* ** | | | (0.02 | ) | | | (0.03 | ) | |
| Net realized and unrealized gain (loss) on investments (net of Indian tax) | | $ | 5.59 | | | | 3.91 | | | | 2.06 | | | | 4.79 | | | | (0.01 | ) | |
| Total from investment operations | | $ | 5.94 | | | | 4.00 | | | | 2.06 | | | | 4.77 | | | | (0.04 | ) | |
| Less distributions from: | |
| Net investment income | | $ | 0.02 | | | | — | | | | 0.03 | | | | — | | | | — | | |
| Total distributions | | $ | 0.02 | | | | — | | | | 0.03 | | | | — | | | | — | | |
| Payment by affiliate | | $ | — | | | | 0.05 | | | | 0.00 | * | | | — | | | | — | | |
| Net asset value, end of period | | $ | 29.12 | | | | 23.20 | | | | 19.15 | | | | 17.12 | | | | 12.35 | | |
| Total Return(2) | | % | 25.63 | | | | 21.15 | †† | | | 12.07 | † | | | 38.62 | | | | (0.32 | ) | |
| Ratios and Supplemental Data: | |
| Net assets, end of period (000's) | | $ | 1,462 | | | | 1,210 | | | | 1,124 | | | | 1,237 | | | | 1,125 | | |
| Ratios to average net assets: | |
Net expenses after expense reimbursement/recoupment and
brokerage commission recapture(3)(4) | | % | 2.41 | | | | 2.49 | | | | 2.60 | | | | 2.67 | | | | 2.73 | | |
Net expenses after expense reimbursement/recoupment
and prior to brokerage commission recapture(3)(4) | | % | 2.42 | | | | 2.49 | | | | 2.60 | | | | 2.67 | | | | 2.73 | | |
Gross expenses prior to expense reimbursement/recoupment
and brokerage commission recapture(4) | | % | 2.42 | | | | 2.74 | | | | 2.50 | | | | 2.77 | | | | 2.73 | | |
Net investment income (loss) after expense reimbursement/
recoupment and brokerage commission recapture(3)(4) | | % | 1.29 | | | | 0.37 | | | | (0.01 | ) | | | (0.14 | ) | | | (1.32 | ) | |
| Portfolio turnover rate | | % | 35 | | | | 124 | | | | 88 | | | | 135 | | | | 124 | | |
| | | Class Q | |
| | | Year Ended October 31, | |
| | | 2006 | | 2005 | | 2004 | | 2003 | | 2002 | |
| Per Share Operating Performance: | |
| Net asset value, beginning of year | | $ | 24.38 | | | | 20.03 | | | | 17.89 | | | | 12.80 | | | | 12.26 | | |
| Income (loss) from investment operations: | |
| Net investment income (loss) | | $ | 0.59 | ** | | | 0.26 | | | | 0.09 | | | | 0.12 | | | | (0.14 | ) | |
| Net realized and unrealized gain on investments (net of Indian tax) | | $ | 5.81 | | | | 4.07 | | | | 2.17 | | | | 4.97 | | | | 0.68 | | |
| Total from investment operations | | $ | 6.40 | | | | 4.33 | | | | 2.26 | | | | 5.09 | | | | 0.54 | | |
| Less distributions from: | |
| Net investment income | | $ | 0.16 | | | | 0.03 | | | | 0.12 | | | | — | | | | 0.00 | * | |
| Total distributions | | $ | 0.16 | | | | 0.03 | | | | 0.12 | | | | — | | | | 0.00 | * | |
| Payment by affiliate | | $ | — | | | | 0.05 | | | | 0.00 | * | | | — | | | | — | | |
| Net asset value, end of year | | $ | 30.62 | | | | 24.38 | | | | 20.03 | | | | 17.89 | | | | 12.80 | | |
| Total Return(2) | | % | 26.37 | | | | 21.89 | †† | | | 12.70 | † | | | 39.77 | | | | 4.41 | | |
| Ratios and Supplemental Data: | |
| Net assets, end of year (000's) | | $ | 10,700 | | | | 10,776 | | | | 8,929 | | | | 18,168 | | | | 21,132 | | |
| Ratios to average net assets: | |
Net expenses after expense reimbursement/recoupment and brokerage
commission recapture(3) | | % | 1.79 | | | | 1.85 | | | | 2.10 | | | | 1.93 | | | | 2.00 | | |
Net expenses after expense reimbursement/recoupment and prior to
brokerage commission recapture(3) | | % | 1.80 | | | | 1.85 | | | | 2.10 | | | | 1.93 | | | | 2.00 | | |
Gross expenses prior to expense reimbursement/recoupment
and brokerage commission recapture | | % | 1.80 | | | | 1.85 | | | | 2.00 | | | | 2.03 | | | | 1.94 | | |
Net investment income (loss) after expense reimbursement/recoupment
and brokerage commission recapture(3) | | % | 2.09 | | | | 1.12 | | | | 0.36 | | | | 0.59 | | | | (0.24 | ) | |
| Portfolio turnover rate | | % | 35 | | | | 124 | | | | 88 | | | | 135 | | | | 124 | | |
(1) Commencement of operations.
(2) Total return is calculated assuming reinvestment of all dividends and capital gain distributions at net asset value. Total return for less than one year is not annualized.
(3) The Investment Adviser has agreed to limit expenses, (excluding interest, taxes, brokerage and extraordinary expenses) subject to possible recoupment by ING Investments, LLC within three years of being incurred.
(4) Annualized for periods less than one year.
* Amount represents less than $0.005 per share.
** Per share data calculated using average number of shares outstanding throughout the period.
† In 2004, 0.06% of the total return consists of a gain on an investment not meeting the Fund's investment restrictions. Excluding this item, total return would have been 12.01% and 12.64% for Class M and Class Q respectively.
†† In 2005, 0.26% and 0.25% of the total return on Class M and Class Q, respectively, consists of a payment by affiliate. Excluding this item, total return would have been 20.89% and 21.64% for Class M and Class Q respectively.
See Accompanying Notes to Financial Statements
81
ING FOREIGN FUND
FINANCIAL HIGHLIGHTS
Selected data for a share of beneficial interest outstanding throughout each period.
| | | Class A | |
| | | Year Ended October 31, | | July 1,
2003(1) to
October 31, | |
| | | 2006 | | 2005 | | 2004 | | 2003 | |
| Per Share Operating Performance: | |
| Net asset value, beginning of period | | $ | 14.79 | | | | 12.38 | | | | 11.01 | | | | 10.00 | | |
| Income (loss) from investment operations: | |
| Net investment income (loss) | | $ | 0.08 | ** | | | 0.06 | | | | 0.11 | | | | (0.00 | )* | |
| Net realized and unrealized gain on investments | | $ | 4.05 | | | | 2.35 | | | | 1.44 | | | | 1.01 | | |
| Total from investment operations | | $ | 4.13 | | | | 2.41 | | | | 1.55 | | | | 1.01 | | |
| Less distributions from: | |
| Net investment income | | $ | — | | | | — | | | | 0.04 | | | | — | | |
| Return of capital | | $ | — | | | | — | | | | 0.10 | | | | — | | |
| Net realized gain on investments | | $ | 0.36 | | | | — | | | | 0.04 | | | | — | | |
| Total distributions | | $ | 0.36 | | | | — | | | | 0.18 | | | | — | | |
| Net asset value, end of period | | $ | 18.56 | | | | 14.79 | | | | 12.38 | | | | 11.01 | | |
| Total Return(2) | | % | 28.39 | | | | 19.47 | | | | 14.25 | | | | 10.10 | | |
| Ratios and Supplemental Data: | |
| Net assets, end of period (000's) | | $ | 219,819 | | | | 122,883 | | | | 62,949 | | | | 6,598 | | |
| Ratios to average net assets: | |
Net expenses after expense reimbursement/recoupment and
brokerage commission recapture(3)(4) | | % | 1.65 | | | | 1.68 | | | | 1.70 | | | | 1.95 | | |
Net expenses after expense reimbursement/recoupment and prior to
brokerage commission recapture(3)(4) | | % | 1.65 | | | | 1.68 | | | | 1.70 | | | | 1.95 | | |
Gross expenses prior to expense reimbursement/recoupment and
brokerage commission recapture(3) | | % | 1.58 | | | | 1.66 | | | | 1.95 | | | | 6.03 | | |
| Net investment income (loss) after expense reimbursement/recoupment | | % | 0.49 | | | | 0.53 | | | | 0.37 | | | | (0.32 | ) | |
| and brokerage commission recapture(3)(4) | |
| Portfolio turnover rate | | % | 65 | | | | 81 | | | | 141 | | | | 50 | | |
| | | Class B | |
| | | Year Ended October 31, | | July 8,
2003(1) to
October 31, | |
| | | 2006 | | 2005 | | 2004 | | 2003 | |
| Per Share Operating Performance: | |
| Net asset value, beginning of period | | $ | 14.55 | | | | 12.26 | | | | 10.99 | | | | 10.29 | | |
| Income (loss) from investment operations: | |
| Net investment loss | | $ | (0.04 | )** | | | (0.03 | ) | | | (0.05 | )** | | | (0.01 | ) | |
| Net realized and unrealized gain on investments | | $ | 3.96 | | | | 2.32 | | | | 1.49 | | | | 0.71 | | |
| Total from investment operations | | $ | 3.92 | | | | 2.29 | | | | 1.44 | | | | 0.70 | | |
| Less distributions from: | |
| Net investment income | | $ | — | | | | — | | | | 0.03 | | | | — | | |
| Return of capital | | $ | — | | | | — | | | | 0.10 | | | | — | | |
| Net realized gain on investments | | $ | 0.36 | | | | — | | | | 0.04 | | | | — | | |
| Total distributions | | $ | 0.36 | | | | — | | | | 0.17 | | | | — | | |
| Net asset value, end of period | | $ | 18.11 | | | | 14.55 | | | | 12.26 | | | | 10.99 | | |
| Total Return(2) | | % | 27.40 | | | | 18.68 | | | | 13.32 | | | | 6.80 | | |
| Ratios and Supplemental Data: | |
| Net assets, end of period (000's) | | $ | 38,136 | | | | 22,944 | | | | 11,263 | | | | 1,344 | | |
| Ratios to average net assets: | |
Net expenses after expense reimbursement/recoupment and
brokerage commission recapture(3)(4) | | % | 2.40 | | | | 2.43 | | | | 2.45 | | | | 2.70 | | |
Net expenses after expense reimbursement and prior to
brokerage commission recapture(3)(4) | | % | 2.40 | | | | 2.43 | | | | 2.45 | | | | 2.70 | | |
Gross expenses prior to expense reimbursement/recoupment and
brokerage commission recapture(3) | | % | 2.33 | | | | 2.41 | | | | 2.70 | | | | 6.78 | | |
Net investment loss after expense reimbursement/recoupment
and brokerage commission recapture(3)(4) | | % | (0.24 | ) | | | (0.23 | ) | | | (0.46 | ) | | | (1.03 | ) | |
| Portfolio turnover rate | | % | 65 | | | | 81 | | | | 141 | | | | 50 | | |
(1) Commencement of operations.
(2) Total return is calculated assuming reinvestment of all dividends and capital gain distributions at net asset value and excluding the deduction of sales charges. Total return for less than one year is not annualized.
(3) Annualized for periods less than one year.
(4) The Investment Adviser has agreed to limit expenses, (excluding interest, taxes, brokerage and extraordinary expenses) subject to possible recoupment by ING Investments, LLC within three years of being incurred.
* Amount represents less than $0.005 per share.
** Per share data calculated using average number of shares outstanding throughout the period.
See Accompanying Notes to Financial Statements
82
ING FOREIGN FUND (CONTINUED)
FINANCIAL HIGHLIGHTS
Selected data for a share of beneficial interest outstanding throughout each period.
| | | Class C | |
| | | Year Ended October 31, | | July 7,
2003(1) to
October 31, | |
| | | 2006 | | 2005 | | 2004 | | 2003 | |
| Per Share Operating Performance: | |
| Net asset value, beginning of period | | $ | 14.57 | | | | 12.28 | | | | 11.01 | | | | 10.27 | | |
| Income (loss) from investment operations: | |
| Net investment loss | | $ | (0.04 | )** | | | (0.03 | ) | | | (0.04 | )** | | | (0.01 | ) | |
| Net realized and unrealized gain on investments | | $ | 3.97 | | | | 2.32 | | | | 1.48 | | | | 0.75 | | |
| Total from investment operations | | $ | 3.93 | | | | 2.29 | | | | 1.44 | | | | 0.74 | | |
| Less distributions from: | |
| Net investment income | | $ | — | | | | — | | | | 0.03 | | | | — | | |
| Return of capital | | $ | — | | | | — | | | | 0.10 | | | | — | | |
| Net realized gain on investments | | $ | 0.36 | | | | — | | | | 0.04 | | | | — | | |
| Total distributions | | $ | 0.36 | | | | — | | | | 0.17 | | | | — | | |
| Net asset value, end of period | | $ | 18.14 | | | | 14.57 | | | | 12.28 | | | | 11.01 | | |
| Total Return(2) | | % | 27.43 | | | | 18.65 | | | | 13.28 | | | | 7.21 | | |
| Ratios and Supplemental Data: | |
| Net assets, end of period (000's) | | $ | 154,101 | | | | 87,877 | | | | 41,424 | | | | 5,601 | | |
| Ratios to average net assets: | |
Net expenses after expense reimbursement/recoupment and
brokerage commission recapture(3)(4) | | % | 2.40 | | | | 2.43 | | | | 2.45 | | | | 2.70 | | |
Net expenses after expense reimbursement/recoupment and prior to
brokerage commission recapture(3)(4) | | % | 2.40 | | | | 2.43 | | | | 2.45 | | | | 2.70 | | |
Gross expenses prior to expense reimbursement/recoupment and
brokerage commission recapture(3) | | % | 2.33 | | | | 2.41 | | | | 2.70 | | | | 6.78 | | |
| Net investment loss after expense reimbursement/recoupment | |
| and brokerage commission recapture(3)(4) | | % | (0.26 | ) | | | (0.27 | ) | | | (0.41 | ) | | | (1.03 | ) | |
| Portfolio turnover rate | | % | 65 | | | | 81 | | | | 141 | | | | 50 | | |
| | | Class I | |
| | | Year Ended October 31, | | September 8,
2003(1) to
October 31, | |
| | | 2006 | | 2005 | | 2004 | | 2003 | |
| Per Share Operating Performance: | |
| Net asset value, beginning of period | | $ | 14.93 | | | | 12.45 | | | | 11.05 | | | | 10.63 | | |
| Income from investment operations: | |
| Net investment income | | $ | 0.13 | ** | | | 0.34 | | | | 0.19 | | | | 0.00 | * | |
| Net realized and unrealized gain on investments | | $ | 4.08 | | | | 2.14 | | | | 1.39 | | | | 0.42 | | |
| Total from investment operations | | $ | 4.21 | | | | 2.48 | | | | 1.58 | | | | 0.42 | | |
| Less distributions from: | |
| Net investment income | | $ | — | | | | — | | | | 0.04 | | | | — | | |
| Return of capital | | $ | — | | | | — | | | | 0.10 | | | | — | | |
| Net realized gain on investments | | $ | 0.36 | | | | — | | | | 0.04 | | | | — | | |
| Total distributions | | $ | 0.36 | | | | — | | | | 0.18 | | | | — | | |
| Net asset value, end of period | | $ | 18.78 | | | | 14.93 | | | | 12.45 | | | | 11.05 | | |
| Total Return(2) | | % | 28.67 | | | | 19.92 | | | | 14.53 | | | | 3.95 | | |
| Ratios and Supplemental Data: | |
| Net assets, end of period (000's) | | $ | 61,248 | | | | 1,049 | | | | 2,547 | | | | 188 | | |
| Ratios to average net assets: | |
Net expenses after expense reimbursement/recoupment and
brokerage commission recapture(3)(4) | | % | 1.34 | | | | 1.35 | | | | 1.25 | | | | 1.43 | | |
Net expenses after expense reimbursement/recoupment and prior to
brokerage commission recapture(3)(4) | | % | 1.35 | | | | 1.35 | | | | 1.25 | | | | 1.43 | | |
Gross expenses prior to expense reimbursement/recoupment and
brokerage commission recapture(3) | | % | 1.28 | | | | 1.34 | | | | 1.50 | | | | 5.51 | | |
| Net investment income after expense reimbursement/recoupment | |
| and brokerage commission recapture(3)(4) | | % | 0.78 | | | | 0.97 | | | | 1.58 | | | | 0.21 | | |
| Portfolio turnover rate | | % | 65 | | | | 81 | | | | 141 | | | | 50 | | |
(1) Commencement of operations.
(2) Total return is calculated assuming reinvestment of all dividends and capital gain distributions at net asset value and excluding the deduction of sales charges. Total return for less than one year is not annualized.
(3) Annualized for periods less than one year.
(4) The Investment Adviser has agreed to limit expenses, (excluding interest, taxes, brokerage and extraordinary expenses) subject to possible recoupment by ING Investments, LLC within three years of being incurred.
* Amount represents less than $0.005 per share.
** Per share data calculated using average number of shares outstanding throughout the period.
See Accompanying Notes to Financial Statements
83
ING FOREIGN FUND (CONTINUED)
FINANCIAL HIGHLIGHTS
Selected data for a share of beneficial interest outstanding throughout each period.
| | | Class Q | |
| | | Year Ended October 31, | | July 10,
2003(1) to
October 31, | |
| | | 2006 | | 2005 | | 2004 | | 2003 | |
| Per Share Operating Performance: | |
| Net asset value, beginning of period | | $ | 14.82 | | | | 12.40 | | | | 11.02 | | | | 10.13 | | |
| Income (loss) from investment operations: | |
| Net investment income (loss) | | $ | 0.07 | ** | | | 0.08 | | | | 0.09 | | | | (0.00 | )* | |
| Net realized and unrealized gain on investments | | $ | 4.08 | | | | 2.34 | | | | 1.46 | | | | 0.89 | | |
| Total from investment operations | | $ | 4.15 | | | | 2.42 | | | | 1.55 | | | | 0.89 | | |
| Less distributions from: | |
| Net investment income | | $ | — | | | | — | | | | 0.03 | | | | — | | |
| Return of capital | | $ | — | | | | — | | | | 0.10 | | | | — | | |
| Net realized gain on investments | | $ | 0.36 | | | | — | | | | 0.04 | | | | — | | |
| Total distributions | | $ | 0.36 | | | | — | | | | 0.17 | | | | — | | |
| Net asset value, end of period | | $ | 18.61 | | | | 14.82 | | | | 12.40 | | | | 11.02 | | |
| Total Return(2) | | % | 28.47 | | | | 19.52 | | | | 14.28 | | | | 8.79 | | |
| Ratios and Supplemental Data: | |
| Net assets, end of period (000's) | | $ | 1,196 | | | | 1,079 | | | | 1,054 | | | | 421 | | |
| Ratios to average net assets: | |
Net expenses after expense reimbursement/recoupment and
brokerage commission recapture(3)(4) | | % | 1.60 | | | | 1.60 | | | | 1.60 | | | | 1.85 | | |
Net expenses after expense reimbursement/recoupment and prior to
brokerage commission recapture(3)(4) | | % | 1.60 | | | | 1.60 | | | | 1.60 | | | | 1.85 | | |
Gross expenses prior to expense reimbursement/recoupment and
brokerage commission recapture(3) | | % | 1.53 | | | | 1.59 | | | | 1.85 | | | | 5.93 | | |
Net investment income (loss) after expense reimbursement/
recoupment and brokerage commission recapture(3)(4) | | % | 0.43 | | | | 0.53 | | | | 0.34 | | | | (0.17 | ) | |
| Portfolio turnover rate | | % | 65 | | | | 81 | | | | 141 | | | | 50 | | |
(1) Commencement of operations.
(2) Total return is calculated assuming reinvestment of all dividends and capital gain distributions at net asset value. Total return for less than one year is not annualized.
(3) Annualized for periods less than one year.
(4) The Investment Adviser has agreed to limit expenses, (excluding interest, taxes, brokerage and extraordinary expenses) subject to possible recoupment by ING Investments, LLC within three years of being incurred.
* Amount represents less than $0.005 per share.
** Per share data calculated using average number of shares outstanding throughout the period.
See Accompanying Notes to Financial Statements
84
ING GREATER CHINA FUND
FINANCIAL HIGHLIGHTS
Selected data for a share of beneficial interest outstanding throughout each period.
| | | Class A | | Class B | | Class C | | Class I | |
| | | December 21,
2005(1) to
October 31,
2006 | | January 6,
2006(1) to
October 31,
2006 | | January 11,
2006(1) to
October 31,
2006 | | May 8,
2006(1) to
October 31,
2006 | |
| Per Share Operating Performance: | |
| Net asset value, beginning of period | | $ | 10.00 | | | | 10.60 | | | | 10.67 | | | | 12.84 | | |
| Income (loss) from investment operations: | |
| Net investment income | | $ | 0.06 | | | | 0.05 | * | | | 0.05 | * | | | 0.08 | | |
| Net realized and unrealized gain (loss) on investments | | $ | 2.43 | | | | 1.77 | | | | 1.71 | | | | (0.42 | ) | |
| Total from investment operations | | $ | 2.49 | | | | 1.82 | | | | 1.76 | | | | (0.34 | ) | |
| Net asset value, end of period | | $ | 12.49 | | | | 12.42 | | | | 12.43 | | | | 12.50 | | |
| Total Return(2) | | % | 24.90 | | | | 17.17 | | | | 16.49 | | | | (2.65 | ) | |
| Ratios and Supplemental Data: | |
| Net assets, end of period (000's) | | $ | 23,709 | | | | 1,957 | | | | 2,124 | | | | 22 | | |
| Ratios to average net assets: | |
| Expenses(3) | | % | 2.64 | | | | 3.39 | | | | 3.39 | | | | 2.39 | | |
| Net investment income(3) | | % | 0.75 | | | | 0.47 | | | | 0.53 | | | | 1.47 | | |
| Portfolio turnover rate | | % | 108 | | | | 108 | | | | 108 | | | | 108 | | |
(1) Commencement of operations.
(2) Total return is calculated assuming reinvestment of dividends and capital gain distributions at net asset value and excluding the deduction of sales charge. Total return for less than one year is not annualized.
(3) Annualized for periods less than one year.
* Per share data calculated using average number of shares outstanding throughout the period.
See Accompanying Notes to Financial Statements
85
ING INDEX PLUS INTERNATIONAL EQUITY FUND
FINANCIAL HIGHLIGHTS
Selected data for a share of beneficial interest outstanding throughout each period.
| | | Class A | | Class B | | Class C | | Class I | |
| | | December 21,
2005(1) to
October 31,
2006 | | January 12,
2006(1) to
October 31,
2006 | | January 12,
2006(1) to
October 31,
2006 | | December 21,
2005(1) to
October 31,
2006 | |
| Per Share Operating Performance: | |
| Net asset value, beginning of period | | $ | 10.00 | | | | 10.43 | | | | 10.43 | | | | 10.00 | | |
| Income from investment operations: | |
| Net investment income | | $ | 0.14 | * | | | 0.06 | * | | | 0.08 | * | | | 0.16 | * | |
| Net realized and unrealized gain on investments | | $ | 1.54 | | | | 1.14 | | | | 1.10 | | | | 1.54 | | |
| Total from investment operations | | $ | 1.68 | | | | 1.20 | | | | 1.18 | | | | 1.70 | | |
| Net asset value, end of period | | $ | 11.68 | | | | 11.63 | | | | 11.61 | | | | 11.70 | | |
| Total Return(2) | | % | 16.80 | | | | 11.51 | | | | 11.31 | | | | 17.00 | | |
| Ratios and Supplemental Data: | |
| Net assets, end of period (000's) | | $ | 12,513 | | | | 264 | | | | 534 | | | | 78,581 | | |
| Ratios to average net assets: | |
| Net expenses after expense reimbursement(3) | | % | 1.15 | | | | 1.90 | | | | 1.90 | | | | 0.90 | | |
| Gross expenses prior to expense reimbursement(3) | | % | 1.30 | | | | 2.05 | | | | 2.05 | | | | 1.05 | | |
| Net investment income after expense reimbursement(3) | | % | 1.50 | | | | 0.64 | | | | 0.87 | | | | 1.69 | | |
| Portfolio turnover rate | | % | 188 | | | | 188 | | | | 188 | | | | 188 | | |
(1) Commencement of operations.
(2) Total return is calculated assuming reinvestment of dividends and capital gain distributions at net asset value and excluding the deduction of sales charge. Total return for less than one year is not annualized.
(3) Annualized for periods less than one year.
* Per share data calculated using average number of shares outstanding throughout the period.
See Accompanying Notes to Financial Statements
86
ING INTERNATIONAL FUND
FINANCIAL HIGHLIGHTS
Selected data for a share of beneficial interest outstanding throughout each period.
| | | Class A | |
| | | Year Ended October 31, | |
| | | 2006 | | 2005 | | 2004 | | 2003 | | 2002 | |
| Per Share Operating Performance: | |
| Net asset value, beginning of year | | $ | 10.97 | | | | 9.78 | | | | 8.48 | | | | 7.05 | | | | 8.09 | | |
| Income (loss) from investment operations: | |
| Net investment income (loss) | | $ | 0.12 | | | | 0.10 | | | | 0.09 | | | | 0.04 | | | | (0.02 | ) | |
| Net realized and unrealized gain (loss) on investments | | $ | 2.28 | | | | 1.18 | | | | 1.22 | | | | 1.37 | | | | (1.04 | ) | |
| Total from investment operations | | $ | 2.40 | | | | 1.28 | | | | 1.31 | | | | 1.41 | | | | (1.06 | ) | |
| Less distributions from: | |
| Net investment income | | $ | 0.17 | | | | 0.10 | | | | 0.01 | | | | 0.03 | | | | — | | |
| Total distributions | | $ | 0.17 | | | | 0.10 | | | | 0.01 | | | | 0.03 | | | | — | | |
| Redemption fees applied to capital | | $ | — | | | | — | | | | 0.00 | * | | | 0.05 | | | | 0.02 | | |
| Payment by affiliate | | $ | — | | | | 0.01 | | | | — | | | | — | | | | — | | |
| Net asset value, end of year | | $ | 13.20 | | | | 10.97 | | | | 9.78 | | | | 8.48 | | | | 7.05 | | |
| Total Return(1) | | % | 22.12 | | | | 13.30 | † | | | 15.49 | | | | 20.72 | | | | (12.86 | ) | |
| Ratios and Supplemental Data: | |
| Net assets, end of year (000's) | | $ | 58,697 | | | | 51,193 | | | | 47,551 | | | | 43,821 | | | | 43,314 | | |
| Ratios to average net assets: | |
| Net expenses after expense reimbursement/recoupment(2) | | % | 1.65 | | | | 1.65 | | | | 1.68 | | | | 1.85 | | | | 2.14 | | |
| Gross expenses prior to expense reimbursement/ recoupment | | % | 1.65 | | | | 1.65 | | | | 1.64 | | | | 1.87 | | | | 2.18 | | |
| Net investment income (loss) after expense reimbursement/recoupment(2) | | % | 0.96 | | | | 0.94 | | | | 0.78 | | | | 0.64 | | | | (0.32 | ) | |
| Portfolio turnover rate | | % | 173 | | | | 116 | | | | 90 | | | | 100 | | | | 126 | | |
| | | Class B | |
| | | Year Ended October 31, | |
| | | 2006 | | 2005 | | 2004 | | 2003 | | 2002 | |
| Per Share Operating Performance: | |
| Net asset value, beginning of year | | $ | 10.55 | | | | 9.43 | | | | 8.22 | | | | 6.91 | | | | 8.03 | | |
| Income (loss) from investment operations: | |
| Net investment income (loss) | | $ | 0.03 | ** | | | 0.02 | | | | (0.00 | )* | | | (0.00 | )* | | | (0.02 | ) | |
| Net realized and unrealized gain (loss) on investments | | $ | 2.20 | | | | 1.14 | | | | 1.21 | | | | 1.31 | | | | (1.10 | ) | |
| Total from investment operations | | $ | 2.23 | | | | 1.16 | | | | 1.21 | | | | 1.31 | | | | (1.12 | ) | |
| Less distributions from: | |
| Net investment income | | $ | 0.09 | | | | 0.05 | | | | — | | | | — | | | | — | | |
| Total distributions | | $ | 0.09 | | | | 0.05 | | | | — | | | | — | | | | — | | |
| Payment by affiliate | | $ | — | | | | 0.01 | | | | — | | | | — | | | | — | | |
| Net asset value, end of year | | $ | 12.69 | | | | 10.55 | | | | 9.43 | | | | 8.22 | | | | 6.91 | | |
| Total Return(1) | | % | 21.23 | | | | 12.41 | † | | | 14.72 | | | | 18.96 | | | | (13.95 | ) | |
| Ratios and Supplemental Data: | |
| Net assets, end of year (000's) | | $ | 16,822 | | | | 16,338 | | | | 15,069 | | | | 12,466 | | | | 10,246 | | |
| Ratios to average net assets: | |
| Net expenses after expense reimbursement/recoupment(2) | | % | 2.40 | | | | 2.40 | | | | 2.43 | | | | 2.60 | | | | 2.76 | | |
| Gross expenses prior to expense reimbursement/recoupment | | % | 2.40 | | | | 2.40 | | | | 2.39 | | | | 2.62 | | | | 2.83 | | |
| Net investment income (loss) after expense reimbursement/recoupment(2) | | % | 0.22 | | | | 0.19 | | | | (0.02 | ) | | | (0.05 | ) | | | (1.10 | ) | |
| Portfolio turnover rate | | % | 173 | | | | 116 | | | | 90 | | | | 100 | | | | 126 | | |
(1) Total return is calculated assuming reinvestment of all dividends and capital gain distributions at net asset value and excluding the deduction of sales charges.
(2) The Investment Adviser has agreed to limit expenses, (excluding interest, taxes, brokerage and extraordinary expenses) subject to possible recoupment by ING Investments, LLC within three years of being incurred.
* Amount represents less than $0.005 per share.
** Per share data calculated using average number of shares outstanding throughout the period.
† In 2005, 0.10% of the total return on Class A and Class B, consists of a payment by affiliate. Excluding this item, total return would have been 13.20% and 12.31% for Class A and Class B, respectively.
See Accompanying Notes to Financial Statements
87
ING INTERNATIONAL FUND (CONTINUED)
FINANCIAL HIGHLIGHTS
Selected data for a share of beneficial interest outstanding throughout each period.
| | | Class C | |
| | | Year Ended October 31, | |
| | | 2006 | | 2005 | | 2004 | | 2003 | | 2002 | |
| Per Share Operating Performance: | |
| Net asset value, beginning of year | | $ | 10.55 | | | | 9.42 | | | | 8.22 | | | | 6.91 | | | | 8.02 | | |
| Income (loss) from investment operations: | |
| Net investment income (loss) | | $ | 0.04 | | | | 0.03 | | | | (0.00 | )* | | | (0.00 | )* | | | (0.02 | ) | |
| Net realized and unrealized gain (loss) on investments | | $ | 2.19 | | | | 1.13 | | | | 1.20 | | | | 1.31 | | | | (1.09 | ) | |
| Total from investment operations | | $ | 2.23 | | | | 1.16 | | | | 1.20 | | | | 1.31 | | | | (1.11 | ) | |
| Less distributions from: | |
| Net investment income | | $ | 0.08 | | | | 0.04 | | | | — | | | | 0.00 | * | | | — | | |
| Total distributions | | $ | 0.08 | | | | 0.04 | | | | — | | | | 0.00 | * | | | — | | |
| Payment by affiliate | | $ | — | | | | 0.01 | | | | — | | | | — | | | | — | | |
| Net asset value, end of year | | $ | 12.70 | | | | 10.55 | | | | 9.42 | | | | 8.22 | | | | 6.91 | | |
| Total Return(1) | | % | 21.25 | | | | 12.46 | † | | | 14.60 | | | | 18.97 | | | | (13.84 | ) | |
| Ratios and Supplemental Data: | |
| Net assets, end of year (000's) | | $ | 15,918 | | | | 15,008 | | | | 16,230 | | | | 14,526 | | | | 12,384 | | |
| Ratios to average net assets: | |
| Net expenses after expense reimbursement/recoupment(2) | | % | 2.40 | | | | 2.40 | | | | 2.43 | | | | 2.60 | | | | 2.76 | | |
| Gross expenses prior to expense reimbursement/recoupment | | % | 2.40 | | | | 2.40 | | | | 2.39 | | | | 2.62 | | | | 2.84 | | |
| Net investment income (loss) after expense reimbursement/recoupment(2) | | % | 0.21 | | | | 0.18 | | | | (0.04 | ) | | | (0.05 | ) | | | (1.18 | ) | |
| Portfolio turnover rate | | % | 173 | | | | 116 | | | | 90 | | | | 100 | | | | 126 | | |
| | | Class I | |
| | | Year Ended October 31, | | January 15,
2002 to
October 31, | |
| | | 2006 | | 2005 | | 2004 | | 2003 | | 2002(3) | |
| Per Share Operating Performance: | |
| Net asset value, beginning of period | | $ | 10.94 | | | | 9.76 | | | | 8.45 | | | | 7.06 | | | | 8.25 | | |
| Income (loss) from investment operations: | |
| Net investment income | | $ | 0.15 | ** | | | 0.14 | | | | 0.09 | | | | 0.10 | | | | 0.05 | | |
| Net realized and unrealized gain (loss) on investments | | $ | 2.29 | | | | 1.18 | | | | 1.25 | | | | 1.34 | | | | (1.24 | ) | |
| Total from investment operations | | $ | 2.44 | | | | 1.32 | | | | 1.34 | | | | 1.44 | | | | (1.19 | ) | |
| Less distributions from: | |
| Net investment income | | $ | 0.22 | | | | 0.15 | | | | 0.03 | | | | 0.05 | | | | — | | |
| Total distributions | | $ | 0.22 | | | | 0.15 | | | | 0.03 | | | | 0.05 | | | | — | | |
| Payment by affiliate | | $ | — | | | | 0.01 | | | | — | | | | — | | | | — | | |
| Net asset value, end of period | | $ | 13.16 | | | | 10.94 | | | | 9.76 | | | | 8.45 | | | | 7.06 | | |
| Total Return(1) | | % | 22.56 | | | | 13.73 | † | | | 15.94 | | | | 20.53 | | | | (14.42 | ) | |
| Ratios and Supplemental Data: | |
| Net assets, end of period (000's) | | $ | 13,354 | | | | 23,452 | | | | 17,211 | | | | 11,582 | | | | 6,384 | | |
| Ratios to average net assets: | |
| Net expenses after expense reimbursement/recoupment(2)(4) | | % | 1.25 | | | | 1.26 | | | | 1.26 | | | | 1.33 | | | | 1.48 | | |
| Gross expenses prior to expense reimbursement/recoupment(4) | | % | 1.25 | | | | 1.26 | | | | 1.22 | | | | 1.34 | | | | 1.53 | | |
| Net investment income after expense reimbursement/recoupment(2)(4) | | % | 1.27 | | | | 1.34 | | | | 1.13 | | | | 1.29 | | | | 0.72 | | |
| Portfolio turnover rate | | % | 173 | | | | 116 | | | | 90 | | | | 100 | | | | 126 | | |
(1) Total return is calculated assuming reinvestment of all dividends and capital gain distributions at net asset value and excluding the deduction of sales charges. Total return for less than one year is not annualized.
(2) The Investment Adviser has agreed to limit expenses, (excluding interest, taxes, brokerage and extraordinary expenses) subject to possible recoupment by ING Investments, LLC within three years of being incurred.
(3) Commencement of operations.
(4) Annualized for periods less than one year.
* Amount represents less than $0.005 per share.
** Per share data calculated using average number of shares outstanding throughout the period.
† In 2005, 0.10% of the total return on Class C and Class I, consists of a payment by affiliate. Excluding this item, total return would have been 12.36% and 12.63% for Class C and Class I, respectively.
See Accompanying Notes to Financial Statements
88
ING INTERNATIONAL FUND (CONTINUED)
FINANCIAL HIGHLIGHTS
Selected data for a share of beneficial interest outstanding throughout each period.
| | | Class Q | |
| | | Year Ended October 31, | |
| | | 2006 | | 2005 | | 2004 | | 2003 | | 2002 | |
| Per Share Operating Performance: | |
| Net asset value, beginning of year | | $ | 10.89 | | | | 9.72 | | | | 8.43 | | | | 7.04 | | | | 8.10 | | |
| Income (loss) from investment operations: | |
| Net investment income (loss) | | $ | 0.14 | | | | 0.08 | | | | 0.06 | | | | 0.07 | | | | (0.03 | ) | |
| Net realized and unrealized gain (loss) on investments | | $ | 2.27 | | | | 1.20 | | | | 1.25 | | | | 1.37 | | | | (1.03 | ) | |
| Total from investment operations | | $ | 2.41 | | | | 1.28 | | | | 1.31 | | | | 1.44 | | | | (1.06 | ) | |
| Less distributions from: | |
| Net investment income | | $ | 0.20 | | | | 0.12 | | | | 0.02 | | | | 0.05 | | | | — | | |
| Total distributions | | $ | 0.20 | | | | 0.12 | | | | 0.02 | | | | 0.05 | | | | — | | |
| Payment by affiliate | | $ | — | | | | 0.01 | | | | — | | | | — | | | | — | | |
| Net asset value, end of year | | $ | 13.10 | | | | 10.89 | | | | 9.72 | | | | 8.43 | | | | 7.04 | | |
| Total Return(1) | | % | 22.38 | | | | 13.41 | † | | | 15.61 | | | | 20.51 | | | | (13.09 | ) | |
| Ratios and Supplemental Data: | |
| Net assets, end of year (000's) | | $ | 27,114 | | | | 14,544 | | | | 7,274 | | | | 14,755 | | | | 6,949 | | |
| Ratios to average net assets: | |
| Net expenses after expense reimbursement/recoupment(2) | | % | 1.50 | | | | 1.51 | | | | 1.60 | | | | 1.59 | | | | 1.61 | | |
| Gross expenses prior to expense reimbursement/recoupment | | % | 1.50 | | | | 1.51 | | | | 1.56 | | | | 1.59 | | | | 1.70 | | |
| Net investment income (loss) after expense reimbursement/ recoupment(2) | | % | 1.19 | | | | 1.00 | | | | 0.73 | | | | 0.91 | | | | (0.08 | ) | |
| Portfolio turnover rate | | % | 173 | | | | 116 | | | | 90 | | | | 100 | | | | 126 | | |
(1) Total return is calculated assuming reinvestment of all dividends and capital gain distributions at net asset value.
(2) The Investment Adviser has agreed to limit expenses, (excluding interest, taxes, brokerage and extraordinary expenses) subject to possible recoupment by ING Investments, LLC within three years of being incurred.
† In 2005, 0.10% of the total return on Class Q, consists of a payment by affiliate. Excluding this item, total return would have been 13.31% for Class Q.
See Accompanying Notes to Financial Statements
89
ING INTERNATIONAL CAPITAL APPRECIATION FUND
FINANCIAL HIGHLIGHTS
Selected data for a share of beneficial interest outstanding throughout each period.
| | | Class A | | Class B | | Class C | | Class I | |
| | | December 21,
2005(1) to
October 31,
2006 | | January 9,
2006(1) to
October 31,
2006 | | January 24,
2006(1) to
October 31,
2006 | | December 21,
2005(1) to
October 31,
2006 | |
| Per Share Operating Performance: | |
| Net asset value, beginning of period | | $ | 10.00 | | | | 10.42 | | | | 10.28 | | | | 10.00 | | |
| Income (loss) from investment operations: | |
| Net investment income (loss) | | $ | 0.04 | | | | (0.04 | )* | | | (0.03 | ) | | | 0.02 | | |
| Net realized and unrealized gain on investments | | $ | 1.35 | | | | 0.95 | | | | 1.10 | | | | 1.41 | | |
| Total from investment operations | | $ | 1.39 | | | | 0.91 | | | | 1.07 | | | | 1.43 | | |
| Net asset value, end of period | | $ | 11.39 | | | | 11.33 | | | | 11.35 | | | | 11.43 | | |
| Total Return(2) | | % | 13.90 | | | | 8.73 | | | | 10.41 | | | | 14.30 | | |
| Ratios and Supplemental Data: | |
| Net assets, end of period (000's) | | $ | 3,677 | | | | 66 | | | | 65 | | | | 47,200 | | |
| Ratios to average net assets: | |
Net expenses after expense reimbursement and brokerage
commission recapture(3)(4) | | % | 1.50 | | | | 2.25 | | | | 2.25 | | | | 1.22 | | |
Net expenses after expense reimbursement and prior
to brokerage commission recapture(3)(4) | | % | 1.50 | | | | 2.25 | | | | 2.25 | | | | 1.22 | | |
Gross expenses prior to expense reimbursement and brokerage
commission recapture(4) | | % | 1.84 | | | | 2.59 | | | | 2.59 | | | | 1.56 | | |
Net investment income (loss) after expense reimbursement and
brokerage commission recapture(3)(4) | | % | 0.32 | | | | (0.43 | ) | | | (0.50 | ) | | | 0.39 | | |
| Portfolio turnover rate | | % | 91 | | | | 91 | | | | 91 | | | | 91 | | |
(1) Commencement of operations.
(2) Total return is calculated assuming reinvestment of dividends and capital gain distributions at net asset value and excluding the deduction of sales charge. Total return for less than one year is not annualized.
(3) The Investment Adviser has agreed to limit expenses, (excluding interest, taxes, brokerage and extraordinary expenses) subject to possible recoupment by ING Investments, LLC within three years of being incurred.
(4) Annualized for periods less than one year.
* Per share data calculated using average number of shares outstanding throughout the period.
See Accompanying Notes to Financial Statements
90
ING INTERNATIONAL REAL ESTATE FUND
FINANCIAL HIGHLIGHTS
Selected data for a share of beneficial interest outstanding throughout each period.
| | | Class A | | Class B | | Class C | | Class I | |
| | | February 28,
2006(1) to
October 31,
2006 | | February 28,
2006(1) to
October 31,
2006 | | February 28,
2006(1) to
October 31,
2006 | | February 28,
2006(1) to
October 31,
2006 | |
| Per Share Operating Performance: | |
| Net asset value, beginning of period | | $ | 10.00 | | | | 10.00 | | | | 10.00 | | | | 10.00 | | |
| Income (loss) from investment operations: | |
| Net investment income | | $ | 0.09 | * | | | 0.04 | * | | | 0.04 | * | | | 0.08 | * | |
| Net realized and unrealized gain on investments | | $ | 1.60 | | | | 1.59 | | | | 1.59 | | | | 1.63 | | |
| Total from investment operations | | $ | 1.69 | | | | 1.63 | | | | 1.63 | | | | 1.71 | | |
| Less distributions from: | |
| Net investment income | | $ | 0.06 | | | | 0.04 | | | | 0.04 | | | | 0.07 | | |
| Total distributions | | $ | 0.06 | | | | 0.04 | | | | 0.04 | | | | 0.07 | | |
| Net asset value, end of period | | $ | 11.63 | | | | 11.59 | | | | 11.59 | | | | 11.64 | | |
| Total Return(2) | | % | 16.94 | | | | 16.38 | | | | 16.31 | | | | 17.23 | | |
| Ratios and Supplemental Data: | |
| Net assets, end of period (000's) | | $ | 49,798 | | | | 1,639 | | | | 17,075 | | | | 22,336 | | |
| Ratios to average net assets: | |
| Net expenses after expense reimbursement(3)(4) | | % | 1.50 | | | | 2.25 | | | | 2.25 | | | | 1.25 | | |
| Gross expenses prior to expense reimbursement(4) | | % | 2.01 | | | | 2.76 | | | | 2.76 | | | | 1.76 | | |
| Net investment income after expense reimbursement(3)(4) | | % | 1.33 | | | | 0.51 | | | | 0.54 | | | | 1.09 | | |
| Portfolio turnover rate | | % | 29 | | | | 29 | | | | 29 | | | | 29 | | |
(1) Commencement of operations.
(2) Total return is calculated assuming reinvestment of dividends and capital gain distributions at net asset value and excluding the deduction of sales charge. Total return for less than one year is not annualized.
(3) The Investment Adviser has agreed to limit expenses, (excluding interest, taxes, brokerage and extraordinary expenses) subject to possible recoupment by ING Investments, LLC within three years of being incurred.
(4) Annualized for periods less than one year.
* Per share data calculated using average number of shares outstanding throughout the period.
See Accompanying Notes to Financial Statements
91
ING INTERNATIONAL SMALLCAP FUND
FINANCIAL HIGHLIGHTS
Selected data for a share of beneficial interest outstanding throughout each period.
| | | Class A | |
| | | Year Ended October 31, | |
| | | 2006 | | 2005 | | 2004 | | 2003 | | 2002 | |
| Per Share Operating Performance: | |
| Net asset value, beginning of year | | $ | 37.75 | | | | 29.27 | | | | 25.37 | | | | 18.35 | | | | 21.85 | | |
| Income (loss) from investment operations: | |
| Net investment income (loss) | | $ | 0.29 | | | | 0.33 | ** | | | 0.02 | | | | 0.01 | | | | (0.07 | ) | |
| Net realized and unrealized gain (loss) on investments | | $ | 9.44 | | | | 8.05 | ** | | | 3.86 | | | | 7.01 | | | | (3.43 | ) | |
| Total from investment operations | | $ | 9.73 | | | | 8.38 | | | | 3.88 | | | | 7.02 | | | | (3.50 | ) | |
| Less distributions from: | |
| Net investment income | | $ | 0.33 | | | | — | | | | 0.00 | * | | | — | | | | — | | |
| Total distributions | | $ | 0.33 | | | | — | | | | 0.00 | * | | | — | | | | — | | |
| Payment by affiliate | | $ | — | | | | 0.10 | | | | 0.02 | | | | — | | | | — | | |
| Net asset value, end of year | | $ | 47.15 | | | | 37.75 | | | | 29.27 | | | | 25.37 | | | | 18.35 | | |
| Total Return(1) | | % | 25.91 | | | | 28.97 | †† | | | 15.39 | † | | | 38.26 | | | | (16.02 | ) | |
| Ratios and Supplemental Data: | |
| Net assets, end of year (000's) | | $ | 243,020 | | | | 173,612 | | | | 154,658 | | | | 150,043 | | | | 123,206 | | |
| Ratios to average net assets: | |
| Net expenses after expense reimbursement/recoupment(2) | | % | 1.66 | | | | 1.74 | | | | 1.75 | | | | 1.95 | | | | 1.95 | | |
| Gross expenses prior to expense reimbursement/recoupment | | % | 1.66 | | | | 1.74 | | | | 1.72 | | | | 1.94 | | | | 1.99 | | |
Net investment income (loss) after expense
reimbursement/recoupment(2) | | % | 0.67 | | | | 0.98 | | | | 0.07 | | | | 0.00 | | | | (0.32 | ) | |
| Portfolio turnover rate | | % | 85 | | | | 124 | | | | 106 | | | | 114 | | | | 149 | | |
| | | Class B | |
| | | Year Ended October 31, | |
| | | 2006 | | 2005 | | 2004 | | 2003 | | 2002 | |
| Per Share Operating Performance: | |
| Net asset value, beginning of year | | $ | 38.83 | | | | 30.30 | | | | 26.43 | | | | 19.25 | | | | 23.06 | | |
| Income (loss) from investment operations: | |
| Net investment income (loss) | | $ | (0.01 | )** | | | 0.10 | ** | | | (0.19 | ) | | | (0.24 | ) | | | (0.32 | ) | |
| Net realized and unrealized gain (loss) on investments | | $ | 9.75 | | | | 8.33 | ** | | | 4.04 | | | | 7.42 | | | | (3.49 | ) | |
| Total from investment operations | | $ | 9.74 | | | | 8.43 | | | | 3.85 | | | | 7.18 | | | | (3.81 | ) | |
| Less distributions from: | |
| Net investment income | | $ | 0.04 | | | | — | | | | — | | | | — | | | | — | | |
| Total distributions | | $ | 0.04 | | | | — | | | | — | | | | — | | | | — | | |
| Payment by affiliate | | $ | — | | | | 0.10 | | | | 0.02 | | | | — | | | | — | | |
| Net asset value, end of year | | $ | 48.53 | | | | 38.83 | | | | 30.30 | | | | 26.43 | | | | 19.25 | | |
| Total Return(1) | | % | 25.10 | | | | 28.15 | †† | | | 14.64 | † | | | 37.30 | | | | (16.52 | ) | |
| Ratios and Supplemental Data: | |
| Net assets, end of year (000's) | | $ | 58,469 | | | | 57,131 | | | | 58,318 | | | | 62,104 | | | | 52,661 | | |
| Ratios to average net assets: | |
| Net expenses after expense reimbursement/recoupment(2) | | % | 2.31 | | | | 2.39 | | | | 2.40 | | | | 2.60 | | | | 2.60 | | |
| Gross expenses prior to expense reimbursement/recoupment | | % | 2.31 | | | | 2.39 | | | | 2.37 | | | | 2.59 | | | | 2.63 | | |
| Net investment loss after expense reimbursement/recoupment(2) | | % | (0.03 | ) | | | 0.29 | | | | (0.60 | ) | | | (0.68 | ) | | | (0.98 | ) | |
| Portfolio turnover rate | | % | 85 | | | | 124 | | | | 106 | | | | 114 | | | | 149 | | |
(1) Total return is calculated assuming reinvestment of all dividends and capital gain distributions at net asset value and excluding the deduction of sales charges.
(2) The Investment Adviser has agreed to limit expenses, (excluding interest, taxes, brokerage and extraordinary expenses) subject to possible recoupment by ING Investments, LLC within three years of being incurred.
* Amount represents less than $0.005 per share.
** Per share data calculated using average number of shares outstanding throughout the period.
† In 2004, the Sub-Adviser fully reimbursed the Fund for a loss incurred from a transaction not meeting the Fund's investment guidelines, which otherwise would have reduced total return by 0.07%.
†† In 2005, 0.34% and 0.33% of the total return on Class A and Class B, respectively, consists of a payment by affiliate. Excluding this item, total return would have been 28.63% and 27.82% on Class A and Class B, respectively.
See Accompanying Notes to Financial Statements
92
ING INTERNATIONAL SMALLCAP FUND (CONTINUED)
FINANCIAL HIGHLIGHTS
Selected data for a share of beneficial interest outstanding throughout each period.
| | | Class C | |
| | | Year Ended October 31, | |
| | | 2006 | | 2005 | | 2004 | | 2003 | | 2002 | |
| Per Share Operating Performance: | |
| Net asset value, beginning of year | | $ | 35.59 | | | | 27.77 | | | | 24.23 | | | | 17.65 | | | | 21.14 | | |
| Income (loss) from investment operations: | |
| Net investment income (loss) | | $ | (0.00 | )** | | | 0.10 | * | | | (0.17 | ) | | | (0.29 | ) | | | (0.32 | ) | |
| Net realized and unrealized gain (loss) on investments | | $ | 8.91 | | | | 7.62 | * | | | 3.70 | | | | 6.87 | | | | (3.17 | ) | |
| Total from investment operations | | $ | 8.91 | | | | 7.72 | | | | 3.53 | | | | 6.58 | | | | (3.49 | ) | |
| Less distributions from: | |
| Net investment income | | $ | 0.11 | | | | — | | | | — | | | | — | | | | — | | |
| Total distributions | | $ | 0.11 | | | | — | | | | — | | | | — | | | | — | | |
| Payment by affiliate | | $ | — | | | | 0.10 | | | | 0.01 | | | | — | | | | — | | |
| Net asset value, end of year | | $ | 44.39 | | | | 35.59 | | | | 27.77 | | | | 24.23 | | | | 17.65 | | |
| Total Return(1) | | % | 25.09 | | | | 28.16 | †† | | | 14.61 | † | | | 37.28 | | | | (16.51 | ) | |
| Ratios and Supplemental Data: | |
| Net assets, end of year (000's) | | $ | 65,534 | | | | 52,420 | | | | 47,793 | | | | 50,227 | | | | 46,703 | | |
| Ratios to average net assets: | |
| Net expenses after expense reimbursement/recoupment(2) | | % | 2.31 | | | | 2.39 | | | | 2.40 | | | | 2.60 | | | | 2.60 | | |
| Gross expenses prior to expense reimbursement/recoupment | | % | 2.31 | | | | 2.39 | | | | 2.37 | | | | 2.59 | | | | 2.63 | | |
Net investment income (loss) after expense
reimbursement/recoupment(2) | | % | (0.01 | ) | | | 0.30 | | | | (0.60 | ) | | | (0.68 | ) | | | (0.99 | ) | |
| Portfolio turnover rate | | % | 85 | | | | 124 | | | | 106 | | | | 114 | | | | 149 | | |
| | | Class I | |
| | | December 21,
2005(1) to
October 31,
2006 | |
| Per Share Operating Performance: | |
| Net asset value, beginning of period | | $ | 40.64 | | |
| Income from investment operations: | |
| Net investment income | | $ | 0.39 | * | |
| Net realized and unrealized gain on investments | | $ | 6.32 | | |
| Total from investment operations | | $ | 6.71 | | |
| Net asset value, end of period | | $ | 47.35 | | |
| Total Return(1) | | % | 16.51 | | |
| Ratios and Supplemental Data: | |
| Net assets, end of period (000's) | | $ | 137,184 | | |
| Ratios to average net assets: | |
| Net expenses after expense reimbursement/recoupment(2)(4) | | % | 1.20 | | |
| Gross expenses prior to expense reimbursement/recoupment(4) | | % | 1.20 | | |
| Net investment income after expense reimbursement/recoupment(2)(4) | | % | 1.02 | | |
| Portfolio turnover rate | | % | 85 | | |
(1) Total return is calculated assuming reinvestment of all dividends and capital gain distributions at net asset value and excluding the deduction of sales charges. Total return for less than one year is not annualized.
(2) The Investment Adviser has agreed to limit expenses, (excluding interest, taxes, brokerage and extraordinary expenses) subject to possible recoupment by ING Investments, LLC within three years of being incurred.
(3) Commencement of operations.
(4) Annualized for periods less than one year.
* Per share data calculated using average number of shares outstanding throughout the period.
** Amount represents less than $0.005 per share.
† In 2004, the Sub-Adviser fully reimbursed the Fund for a loss incurred from a transaction not meeting the Fund's investment guidelines, which otherwise would have reduced total return by 0.07%.
†† In 2005, 0.36% of the total return consists of a payment by affiliate. Excluding this item, total return would have been 27.80%.
See Accompanying Notes to Financial Statements
93
ING INTERNATIONAL SMALLCAP FUND (CONTINUED)
FINANCIAL HIGHLIGHTS
Selected data for a share of beneficial interest outstanding throughout each period.
| | | Class Q | |
| | | Year Ended October 31, | |
| | | 2006 | | 2005 | | 2004 | | 2003 | | 2002 | |
| Per Share Operating Performance: | |
| Net asset value, beginning of year | | $ | 40.53 | | | | 31.34 | | | | 27.11 | | | | 19.54 | | | | 23.19 | | |
| Income (loss) from investment operations: | |
| Net investment income | | $ | 0.37 | | | | 0.43 | * | | | 0.10 | | | | 0.21 | | | | 0.04 | | |
| Net realized and unrealized gain (loss) on investments | | $ | 10.16 | | | | 8.66 | | | | 4.13 | | | | 7.36 | | | | (3.69 | ) | |
| Total from investment operations | | $ | 10.53 | | | | 9.09 | | | | 4.23 | | | | 7.57 | | | | (3.65 | ) | |
| Less distributions from: | |
| Net investment income | | $ | 0.41 | | | | — | | | | 0.01 | | | | — | | | | — | | |
| Total distributions | | $ | 0.41 | | | | — | | | | 0.01 | | | | — | | | | — | | |
| Payment by affiliate | | $ | — | | | | 0.10 | | | | 0.01 | | | | — | | | | — | | |
| Net asset value, end of year | | $ | 50.65 | | | | 40.53 | | | | 31.34 | | | | 27.11 | | | | 19.54 | | |
| Total Return(1) | | % | 26.14 | | | | 29.32 | †† | | | 15.66 | † | | | 38.74 | | | | (15.74 | ) | |
| Ratios and Supplemental Data: | |
| Net assets, end of year (000's) | | $ | 82,245 | | | | 57,846 | | | | 61,166 | | | | 79,140 | | | | 70,404 | | |
| Ratios to average net assets: | |
| Net expenses after expense reimbursement/recoupment(2) | | % | 1.48 | | | | 1.49 | | | | 1.50 | | | | 1.59 | | | | 1.55 | | |
| Gross expenses prior to expense reimbursement/recoupment | | % | 1.48 | | | | 1.49 | | | | 1.47 | | | | 1.58 | | | | 1.59 | | |
Net investment income after expense
reimbursement/recoupment(2) | | % | 0.83 | | | | 1.18 | | | | 0.28 | | | | 0.35 | | | | 0.07 | | |
| Portfolio turnover rate | | % | 85 | | | | 124 | | | | 106 | | | | 114 | | | | 149 | | |
(1) Total return is calculated assuming reinvestment of all dividends and capital gain distributions at net asset value and excluding the deduction of sales charges.
(2) The Investment Adviser has agreed to limit expenses, (excluding interest, taxes, brokerage and extraordinary expenses) subject to possible recoupment by ING Investments, LLC within three years of being incurred.
* Per share data calculated using average number of shares outstanding throughout the period.
† In 2004, the Sub-Adviser fully reimbursed the Fund for a loss incurred from a transaction not meeting the Fund's investment guidelines, which otherwise would have reduced total return by 0.07%.
†† In 2005, 0.36% of the total return consists of a payment by affiliate. Excluding this item, total return would have been 28.96%.
See Accompanying Notes to Financial Statements
94
ING INTERNATIONAL VALUE FUND
FINANCIAL HIGHLIGHTS
Selected data for a share of beneficial interest outstanding throughout each period.
| | | Class A | |
| | | Year Ended October 31, | |
| | | 2006 | | 2005 | | 2004 | | 2003 | | 2002 | |
| Per Share Operating Performance: | |
| Net asset value, beginning of year | | $ | 18.33 | | | | 16.90 | | | | 13.71 | | | | 10.40 | | | | 12.33 | | |
| Income (loss) from investment operations: | |
| Net investment income | | $ | 0.18 | ** | | | 0.17 | | | | 0.13 | | | | 0.08 | | | | 0.06 | | |
Net realized and unrealized gain (loss)
on investments | | $ | 4.58 | | | | 2.28 | | | | 3.15 | | | | 3.48 | | | | (1.64 | ) | |
| Total from investment operations | | $ | 4.76 | | | | 2.45 | | | | 3.28 | | | | 3.56 | | | | (1.58 | ) | |
| Less distributions from: | |
| Net investment income | | $ | 0.16 | | | | 0.22 | | | | 0.09 | | | | 0.05 | | | | 0.09 | | |
| Net realized gain on investments | | $ | 1.41 | | | | 0.80 | | | | — | | | | 0.20 | | | | 0.26 | | |
| Total distributions | | $ | 1.57 | | | | 1.02 | | | | 0.09 | | | | 0.25 | | | | 0.35 | | |
| Payment by affiliate | | $ | — | | | | 0.00 | * | | | — | | | | — | | | | — | | |
| Net asset value, end of year | | $ | 21.52 | | | | 18.33 | | | | 16.90 | | | | 13.71 | | | | 10.40 | | |
| Total Return(1) | | % | 27.64 | | | | 15.06 | † | | | 24.03 | | | | 35.11 | | | | (13.31 | ) | |
| Ratios and Supplemental Data: | |
| Net assets, end of year (000's) | | $ | 1,995,027 | | | | 1,732,332 | | | | 1,869,868 | | | | 1,641,943 | | | | 1,356,334 | | |
| Ratios to average net assets: | |
| Net expenses after brokerage commission recapture | | % | 1.60 | | | | 1.60 | | | | 1.61 | | | | 1.74 | | | | 1.76 | | |
| Gross expenses prior to brokerage commission recapture | | % | 1.60 | | | | 1.60 | | | | 1.61 | | | | 1.74 | | | | 1.76 | | |
| Net investment income after brokerage commission recapture | | % | 0.90 | | | | 0.88 | | | | 0.79 | | | | 0.66 | | | | 0.58 | | |
| Portfolio turnover rate | | % | 25 | | | | 21 | | | | 29 | | | | 9 | | | | 20 | | |
| | | Class B | |
| | | Year Ended October 31, | |
| | | 2006 | | 2005 | | 2004 | | 2003 | | 2002 | |
| Per Share Operating Performance: | |
| Net asset value, beginning of year | | $ | 17.95 | | | | 16.58 | | | | 13.45 | | | | 10.23 | | | | 12.13 | | |
| Income (loss) from investment operations: | |
| Net investment income (loss) | | $ | 0.04 | ** | | | 0.05 | | | | 0.02 | | | | (0.00 | )* | | | (0.02 | ) | |
Net realized and unrealized gain (loss)
on investments | | $ | 4.50 | | | | 2.23 | | | | 3.11 | | | | 3.42 | | | | (1.62 | ) | |
| Total from investment operations | | $ | 4.54 | | | | 2.28 | | | | 3.13 | | | | 3.42 | | | | (1.64 | ) | |
| Less distributions from: | |
| Net investment income | | $ | 0.01 | | | | 0.11 | | | | — | | | | — | | | | 0.00 | * | |
| Net realized gain on investments | | $ | 1.41 | | | | 0.80 | | | | — | | | | 0.20 | | | | 0.26 | | |
| Total distributions | | $ | 1.42 | | | | 0.91 | | | | — | | | | 0.20 | | | | 0.26 | | |
| Payment by affiliate | | $ | — | | | | 0.00 | * | | | — | | | | — | | | | — | | |
| Net asset value, end of year | | $ | 21.07 | | | | 17.95 | | | | 16.58 | | | | 13.45 | | | | 10.23 | | |
| Total Return(1) | | % | 26.81 | | | | 14.21 | † | | | 23.27 | | | | 34.11 | | | | (13.90 | ) | |
| Ratios and Supplemental Data: | |
| Net assets, end of year (000's) | | $ | 368,952 | | | | 411,071 | | | | 454,952 | | | | 420,651 | | | | 375,967 | | |
| Ratios to average net assets: | |
| Net expenses after brokerage commission recapture | | % | 2.30 | | | | 2.30 | | | | 2.31 | | | | 2.44 | | | | 2.45 | | |
| Gross expenses prior to brokerage commission recapture | | % | 2.30 | | | | 2.30 | | | | 2.31 | | | | 2.44 | | | | 2.45 | | |
| Net investment income (loss) after brokerage commission recapture | | % | 0.20 | | | | 0.17 | | | | 0.09 | | | | (0.04 | ) | | | (0.13 | ) | |
| Portfolio turnover rate | | % | 25 | | | | 21 | | | | 29 | | | | 9 | | | | 20 | | |
(1) Total return is calculated assuming reinvestment of all dividends and capital gain distributions at net asset value and excluding the deduction of sales charges.
* Amount represents less than $0.005 per share.
** Per share data calculated using average number of shares outstanding throughout the period.
† In 2005, there was no impact on total return due to payment by affiliate.
See Accompanying Notes to Financial Statements
95
ING INTERNATIONAL VALUE FUND (CONTINUED)
FINANCIAL HIGHLIGHTS
Selected data for a share of beneficial interest outstanding throughout each period.
| | | Class C | |
| | | Year Ended October 31, | |
| | | 2006 | | 2005 | | 2004 | | 2003 | | 2002 | |
| Per Share Operating Performance: | |
| Net asset value, beginning of year | | $ | 17.91 | | | | 16.54 | | | | 13.42 | | | | 10.21 | | | | 12.10 | | |
| Income (loss) from investment operations: | |
| Net investment income (loss) | | $ | 0.05 | | | | 0.04 | | | | 0.02 | | | | (0.00 | )* | | | (0.02 | ) | |
Net realized and unrealized gain (loss)
on investments | | $ | 4.46 | | | | 2.24 | | | | 3.10 | | | | 3.41 | | | | (1.61 | ) | |
| Total from investment operations | | $ | 4.51 | | | | 2.28 | | | | 3.12 | | | | 3.41 | | | | (1.63 | ) | |
| Less distributions from: | |
| Net investment income | | $ | 0.03 | | | | 0.11 | | | | — | | | | — | | | | 0.00 | * | |
| Net realized gain on investments | | $ | 1.41 | | | | 0.80 | | | | — | | | | 0.20 | | | | 0.26 | | |
| Total distributions | | $ | 1.44 | | | | 0.91 | | | | — | | | | 0.20 | | | | 0.26 | | |
| Payment by affiliate | | $ | — | | | | 0.00 | ** | | | — | | | | — | | | | — | | |
| Net asset value, end of year | | $ | 20.98 | | | | 17.91 | | | | 16.54 | | | | 13.42 | | | | 10.21 | | |
| Total Return(1) | | % | 26.71 | | | | 14.25 | † | | | 23.25 | | | | 34.08 | | | | (13.85 | ) | |
| Ratios and Supplemental Data: | |
| Net assets, end of year (000's) | | $ | 729,067 | | | | 663,626 | | | | 675,039 | | | | 628,704 | | | | 573,712 | | |
| Ratios to average net assets: | |
| Net expenses after brokerage commission recapture | | % | 2.30 | | | | 2.30 | | | | 2.31 | | | | 2.44 | | | | 2.46 | | |
| Gross expenses prior to brokerage commission recapture | | % | 2.30 | | | | 2.30 | | | | 2.31 | | | | 2.44 | | | | 2.46 | | |
| Net investment income (loss) after brokerage commission recapture(3) | | % | 0.20 | | | | 0.15 | | | | 0.09 | | | | (0.04 | ) | | | (0.13 | ) | |
| Portfolio turnover rate | | % | 25 | | | | 21 | | | | 29 | | | | 9 | | | | 20 | | |
| | | Class I | |
| | | Year Ended October 31, | |
| | | 2006 | | 2005 | | 2004 | | 2003 | | 2002 | |
| Per Share Operating Performance: | |
| Net asset value, beginning of year | | $ | 18.38 | | | | 16.96 | | | | 13.74 | | | | 10.43 | | | | 12.35 | | |
| Income (loss) from investment operations: | |
| Net investment income | | $ | 0.25 | | | | 0.20 | | | | 0.16 | | | | 0.13 | | | | 0.16 | | |
| Net realized and unrealized gain (loss) on investments | | $ | 4.60 | | | | 2.31 | | | | 3.20 | | | | 3.48 | | | | (1.68 | ) | |
| Total from investment operations | | $ | 4.85 | | | | 2.51 | | | | 3.36 | | | | 3.61 | | | | (1.52 | ) | |
| Less distributions from: | |
| Net investment income | | $ | 0.24 | | | | 0.29 | | | | 0.14 | | | | 0.10 | | | | 0.14 | | |
| Net realized gains on investments | | $ | 1.41 | | | | 0.80 | | | | — | | | | 0.20 | | | | 0.26 | | |
| Total distributions | | $ | 1.65 | | | | 1.09 | | | | 0.14 | | | | 0.30 | | | | 0.40 | | |
| Payment by affiliate | | $ | — | | | | 0.00 | ** | | | — | | | | — | | | | — | | |
| Net asset value, end of year | | $ | 21.58 | | | | 18.38 | | | | 16.96 | | | | 13.74 | | | | 10.43 | | |
| Total Return(1) | | % | 28.15 | | | | 15.42 | † | | | 24.67 | | | | 35.58 | | | | (12.89 | ) | |
| Ratios and Supplemental Data: | |
| Net assets, end of year (000's) | | $ | 1,728,560 | | | | 1,221,594 | | | | 831,142 | | | | 482,047 | | | | 372,352 | | |
| Ratios to average net assets: | |
| Net expenses after brokerage commission recapture | | % | 1.22 | | | | 1.23 | | | | 1.21 | | | | 1.29 | | | | 1.32 | | |
| Gross expenses prior to brokerage commission recapture | | % | 1.22 | | | | 1.23 | | | | 1.21 | | | | 1.29 | | | | 1.32 | | |
| Net investment income after brokerage commission recapture | | % | 1.26 | | | | 1.18 | | | | 1.18 | | | | 1.12 | | | | 1.04 | | |
| Portfolio turnover rate | | % | 25 | | | | 21 | | | | 29 | | | | 9 | | | | 20 | | |
(1) Total return is calculated assuming reinvestment of all dividends and capital gain distributions at net asset value and excluding the deduction of sales charges.
* Per share data calculated using average number of shares outstanding throughout the period.
** Amount represents less than $0.005 per share.
† In 2005, there was no impact on total return due to payment by affiliate.
See Accompanying Notes to Financial Statements
96
ING INTERNATIONAL VALUE FUND (CONTINUED)
FINANCIAL HIGHLIGHTS
Selected data for a share of beneficial interest outstanding throughout each period.
| | | Class Q | |
| | | Year Ended October 31, | |
| | | 2006 | | 2005 | | 2004 | | 2003 | | 2002 | |
| Per Share Operating Performance: | |
| Net asset value, beginning of year | | $ | 18.37 | | | | 16.94 | | | | 13.73 | | | | 10.44 | | | | 12.34 | | |
| Income (loss) from investment operations: | |
| Net investment income | | $ | 0.21 | ** | | | 0.19 | | | | 0.14 | | | | 0.10 | | | | 0.07 | | |
| Net realized and unrealized gain (loss) on investments | | $ | 4.59 | | | | 2.29 | | | | 3.17 | | | | 3.49 | | | | (1.63 | ) | |
| Total from investment operations | | $ | 4.80 | | | | 2.48 | | | | 3.31 | | | | 3.59 | | | | (1.56 | ) | |
| Less distributions from: | |
| Net investment income | | $ | 0.19 | | | | 0.25 | | | | 0.10 | | | | 0.10 | | | | 0.08 | | |
| Net realized gains on investments | | $ | 1.41 | | | | 0.80 | | | | — | | | | 0.20 | | | | 0.26 | | |
| Total distributions | | $ | 1.60 | | | | 1.05 | | | | 0.10 | | | | 0.30 | | | | 0.34 | | |
| Payment by affiliate | | $ | — | | | | 0.00 | * | | | — | | | | — | | | | — | | |
| Net asset value, end of year | | $ | 21.57 | | | | 18.37 | | | | 16.94 | | | | 13.73 | | | | 10.44 | | |
| Total Return(1) | | % | 27.82 | | | | 15.20 | † | | | 24.32 | | | | 35.37 | | | | (13.11 | ) | |
| Ratios and Supplemental Data: | |
| Net assets, end of year (000's) | | $ | 26,383 | | | | 27,993 | | | | 28,862 | | | | 29,319 | | | | 29,836 | | |
| Ratios to average net assets: | |
| Net expenses after brokerage commission recapture | | % | 1.47 | | | | 1.48 | | | | 1.46 | | | | 1.54 | | | | 1.49 | | |
| Gross expenses prior to brokerage commission recapture | | % | 1.47 | | | | 1.48 | | | | 1.46 | | | | 1.54 | | | | 1.49 | | |
| Net investment income after brokerage commission recapture | | % | 1.06 | | | | 0.99 | | | | 0.89 | | | | 0.87 | | | | 0.63 | | |
| Portfolio turnover rate | | % | 25 | | | | 21 | | | | 29 | | | | 9 | | | | 20 | | |
(1) Total return is calculated assuming reinvestment of all dividends and capital gain distributions at net asset value.
† In 2005, there was no impact on total return due to payment by affiliate.
* Amount represents less than $0.005 per share.
** Per share data calculated using average number of shares outstanding throughout the period.
See Accompanying Notes to Financial Statements
97
ING INTERNATIONAL VALUE CHOICE FUND
FINANCIAL HIGHLIGHTS
Selected data for a share of beneficial interest outstanding throughout each period.
| | | Class A | | Class B | | Class C | | Class I | |
| | | Year
Ended
October 31,
2006 | | February 1,
2005(1) to
October 31,
2005 | | Year
Ended
October 31,
2006 | | February 1,
2005(1) to
October 31,
2005 | | Year
Ended
October 31,
2006 | | February 4,
2005(1) to
October 31,
2005 | | December 21
2005(1) to
October 31,
2006 | |
| Per Share Operating Performance: | |
| Net asset value, beginning of period | | $ | 10.70 | | | | 10.00 | | | | 10.65 | | | | 10.00 | | | | 10.66 | | | | 10.01 | | | | 11.04 | | |
| Income from investment operations: | |
| Net investment income | | $ | 0.12 | * | | | 0.11 | * | | | 0.04 | * | | | 0.04 | * | | | 0.04 | * | | | 0.04 | * | | | 0.16 | * | |
Net realized and unrealized gain
on investments | | $ | 1.86 | | | | 0.59 | | | | 1.82 | | | | 0.61 | | | | 1.83 | | | | 0.61 | | | | 1.22 | | |
| Total from investment operations | | $ | 1.98 | | | | 0.70 | | | | 1.86 | | | | 0.65 | | | | 1.87 | | | | 0.65 | | | | 1.38 | | |
| Less distributions from: | |
| Net investment income | | $ | 0.10 | | | | — | | | | 0.08 | | | | — | | | | 0.08 | | | | — | | | | — | | |
| Net realized gain on investments | | $ | 0.16 | | | | — | | | | 0.16 | | | | — | | | | 0.16 | | | | — | | | | — | | |
| Total distributions | | $ | 0.26 | | | | — | | | | 0.24 | | | | — | | | | 0.24 | | | | — | | | | — | | |
| Net asset value, end of period | | $ | 12.42 | | | | 10.70 | | | | 12.27 | | | | 10.65 | | | | 12.29 | | | | 10.66 | | | | 12.42 | | |
| Total Return(2) | | % | 18.82 | | | | 7.00 | | | | 17.77 | | | | 6.50 | | | | 17.78 | | | | 6.49 | | | | 12.50 | | |
| Ratios and Supplemental Data: | |
| Net assets, end of period (000's) | | $ | 17,962 | | | | 6,115 | | | | 3,565 | | | | 1,427 | | | | 4,189 | | | | 1,796 | | | | 36,899 | | |
| Ratios to average net assets: | |
| Net expenses after expense | |
| reimbursement and brokerage | |
| commission recapture(3)(4) | | % | 1.69 | | | | 1.70 | | | | 2.44 | | | | 2.45 | | | | 2.44 | | | | 2.45 | | | | 1.34 | | |
Net expenses after expense
reimbursement and prior to brokerage
commission recapture(3)(4) | | % | 1.70 | | | | 1.70 | | | | 2.45 | | | | 2.45 | | | | 2.45 | | | | 2.45 | | | | 1.35 | | |
| Gross expenses prior to expense | |
| reimbursement and brokerage | |
| commission recapture(3) | | % | 1.71 | | | | 3.44 | | | | 2.46 | | | | 4.19 | | | | 2.46 | | | | 4.19 | | | | 1.36 | | |
Net investment income after expense
reimbursement and brokerage
commission recapture(3)(4) | | % | 1.04 | | | | 1.08 | | | | 0.35 | | | | 0.36 | | | | 0.33 | | | | 0.35 | | | | 1.56 | | |
| Portfolio turnover rate | | % | 31 | | | | 24 | | | | 31 | | | | 24 | | | | 31 | | | | 24 | | | | 31 | | |
(1) Commencement of operations.
(2) Total return is calculated assuming reinvestment of all dividends and capital gain distributions at net asset value and excluding the deduction of sales charges. Total return for less than one year is not annualized.
(3) Annualized for periods less than one year.
(4) The Investment Adviser has agreed to limit expenses, (excluding interest, taxes, brokerage and extraordinary expenses) subject to possible recoupment by ING Investments, LLC within three years of being incurred.
* Per share data calculated using average number of shares outstanding throughout the period.
See Accompanying Notes to Financial Statements
98
ING RUSSIA FUND
FINANCIAL HIGHLIGHTS
Selected data for a share of beneficial interest outstanding throughout each period.
| | | Class A | |
| | | Year Ended October 31, | |
| | | 2006 | | 2005 | | 2004 | | 2003 | | 2002 | |
| Per Share Operating Performance: | |
| Net asset value, beginning of year | | $ | 33.49 | | | | 25.01 | | | | 19.13 | | | | 12.15 | | | | 8.04 | | |
| Income (loss) from investment operations: | |
| Net investment income (loss) | | $ | (0.27 | ) | | | (0.00 | )* | | | 0.04 | | | | (0.00 | )* | | | 0.17 | | |
| Net realized and unrealized gain on investments | | $ | 22.37 | | | | 8.39 | | | | 5.69 | | | | 7.06 | | | | 3.92 | | |
| Total from investment operations | | $ | 22.10 | | | | 8.39 | | | | 5.73 | | | | 7.06 | | | | 4.09 | | |
| Less distributions from: | |
| Net investment income | | $ | — | | | | 0.01 | | | | 0.02 | | | | 0.12 | | | | — | | |
| Total distributions | | $ | — | | | | 0.01 | | | | 0.02 | | | | 0.12 | | | | — | | |
| Redemption fees applied to capital | | $ | 0.22 | | | | 0.10 | | | | 0.17 | | | | 0.04 | | | | 0.02 | | |
| Net asset value, end of year | | $ | 55.81 | | | | 33.49 | | | | 25.01 | | | | 19.13 | | | | 12.15 | | |
| Total Return(1) | | % | 66.65 | | | | 33.98 | | | | 30.88 | | | | 58.98 | | | | 51.12 | | |
| Ratios and Supplemental Data: | |
| Net assets, end of year (000's) | | $ | 751,947 | | | | 271,603 | | | | 212,180 | | | | 161,601 | | | | 85,658 | | |
| Ratios to average net assets: | |
| Net expenses after expense reimbursement(2) | | % | 1.98 | | | | 2.13 | | | | 2.01 | | | | 2.09 | | | | 1.77 | | |
| Gross expenses prior to expense reimbursement | | % | 1.98 | | | | 2.13 | | | | 2.01 | | | | 2.09 | | | | 2.20 | | |
| Net investment income (loss) after expense reimbursement(2) | | % | (0.64 | ) | | | (0.01 | ) | | | 0.15 | | | | (0.02 | ) | | | 1.33 | | |
| Portfolio turnover rate | | % | 20 | | | | 26 | | | | 54 | | | | 23 | | | | 32 | | |
(1) Total return is calculated assuming reinvestment of all dividends and capital gain distributions at net asset value and excluding the deduction of sales charges.
(2) The Investment Adviser has agreed to limit expenses, (excluding interest, taxes, brokerage and extraordinary expenses) subject to possible recoupment by ING Investments, LLC within three years of being incurred.
* Amount represents less than $0.005 per share.
See Accompanying Notes to Financial Statements
99
ING EMERGING MARKETS FIXED INCOME FUND
FINANCIAL HIGHLIGHTS
Selected data for a share of beneficial interest outstanding throughout each period.
| | | Class A | | Class B | | Class C | |
| | | December 21,
2005(1) to
October 31,
2006 | | January 4,
2006(1) to
October 31,
2006 | | March 1,
2006(1) to
October 31,
2006 | |
| Per Share Operating Performance: | |
| Net asset value, beginning of period | | $ | 10.00 | | | | 10.15 | | | | 10.43 | | |
| Income (loss) from investment operations: | |
| Net investment income | | $ | 0.64 | * | | | 0.59 | * | | | 0.61 | * | |
| Net realized and unrealized gain (loss) on investments | | $ | 0.26 | | | | 0.09 | | | | (0.34 | ) | |
| Total from investment operations | | $ | 0.90 | | | | 0.68 | | | | 0.27 | | |
| Less distributions from: | |
| Net investment income | | $ | 0.57 | | | | 0.53 | | | | 0.41 | | |
| Total distributions | | $ | 0.57 | | | | 0.53 | | | | 0.41 | | |
| Net asset value, end of period | | $ | 10.33 | | | | 10.30 | | | | 10.29 | | |
| Total Return(2) | | % | 9.28 | | | | 6.92 | | | | 2.75 | | |
| Ratios and Supplemental Data: | |
| Net assets, end of period (000's) | | $ | 26,121 | | | | 293 | | | | 344 | | |
| Ratios to average net assets: | |
| Net expenses after expense reimbursement(3)(4) | | % | 1.25 | | | | 2.00 | | | | 2.00 | | |
| Gross expenses prior to expense reimbursement(4) | | % | 2.41 | | | | 3.16 | | | | 3.16 | | |
| Net investment income after expense reimbursement(3)(4) | | % | 7.36 | | | | 6.91 | | | | 7.09 | | |
| Portfolio turnover rate | | % | 56 | | | | 56 | | | | 56 | | |
(1) Commencement of operations.
(2) Total return is calculated assuming reinvestment of dividends and capital gain distributions at net asset value and excluding the deduction of sales charge. Total return for less than one year is not annualized.
(3) The Investment Adviser has agreed to limit expenses, (excluding interest, taxes, brokerage and extraordinary expenses) subject to possible recoupment by ING Investments, LLC within three years of being incurred.
(4) Annualized for periods less than one year.
* Per share data calculated using average number of shares outstanding throughout the period.
See Accompanying Notes to Financial Statements
100
ING GLOBAL BOND FUND
FINANCIAL HIGHLIGHTS
Selected data for a share of beneficial interest outstanding throughout each period.
| | | Class A | | Class B | | Class C | | Class I | |
| | | June 30,
2006(1) to
October 31,
2006 | | June 30,
2006(1) to
October 31,
2006 | | June 30,
2006(1) to
October 31,
2006 | | June 30,
2006(1) to
October 31,
2006 | |
| Per Share Operating Performance: | |
| Net asset value, beginning of period | | $ | 10.00 | | | | 10.00 | | | | 10.00 | | | | 10.00 | | |
| Income from investment operations: | |
| Net investment income | | $ | 0.08 | * | | | 0.06 | * | | | 0.06 | * | | | 0.09 | * | |
| Net realized and unrealized gain on investments | | $ | 0.23 | | | | 0.22 | | | | 0.22 | | | | 0.23 | | |
| Total from investment operations | | $ | 0.31 | | | | 0.28 | | | | 0.28 | | | | 0.32 | | |
| Less distributions from: | |
| Net investment income | | $ | 0.06 | | | | 0.04 | | | | 0.04 | | | | 0.07 | | |
| Total distributions | | $ | 0.06 | | | | 0.04 | | | | 0.04 | | | | 0.07 | | |
| Net asset value, end of period | | $ | 10.25 | | | | 10.24 | | | | 10.24 | | | | 10.25 | | |
| Total Return(2) | | % | 3.13 | | | | 2.84 | | | | 2.82 | | | | 3.23 | | |
| Ratios and Supplemental Data: | |
| Net assets, end of period (000's) | | $ | 25,784 | | | | 28 | | | | 36 | | | | 1 | | |
| Ratios to average net assets: | |
| Net expenses after expense reimbursement(3)(4) | | % | 0.90 | | | | 1.65 | | | | 1.65 | | | | 0.55 | | |
| Gross expenses prior to expense reimbursement(4) | | % | 1.38 | | | | 2.13 | | | | 2.13 | | | | 1.03 | | |
| Net investment income after expense reimbursement(3)(4) | | % | 2.41 | | | | 2.00 | | | | 1.68 | | | | 2.68 | | |
| Portfolio turnover rate | | % | 451 | | | | 451 | | | | 451 | | | | 451 | | |
(1) Commencement of operations.
(2) Total return is calculated assuming reinvestment of dividends and capital gain distributions at net asset value and excluding the deduction of sales charge. Total return for less than one year is not annualized.
(3) The Investment Adviser has agreed to limit expenses, (excluding interest, taxes, brokerage and extraordinary expenses) subject to possible recoupment by ING Investments, LLC within three years of being incurred.
(4) Annualized for periods less than one year.
* Per share data calculated using average number of shares outstanding throughout the period.
See Accompanying Notes to Financial Statements
101
ING DIVERSIFIED INTERNATIONAL FUND
FINANCIAL HIGHLIGHTS
Selected data for a share of beneficial interest outstanding throughout each period.
| | | Class A | | Class B | | Class C | | Class I | |
| | | December 21,
2005(1) to
October 31,
2006 | | December 21,
2005(1) to
October 31,
2006 | | December 21,
2005(1) to
October 31,
2006 | | December 21,
2005(1) to
October 31,
2006 | |
| Per Share Operating Performance: | |
| Net asset value, beginning of period | | $ | 10.00 | | | | 10.00 | | | | 10.00 | | | | 10.00 | | |
| Income (loss) from investment operations: | |
| Net investment loss | | $ | (0.03 | )* | | | (0.10 | )* | | | (0.10 | )* | | | (0.01 | )* | |
| Net realized and unrealized gain on investments in affiliates | | $ | 1.64 | | | | 1.64 | | | | 1.64 | | | | 1.64 | | |
| Total from investment operations | | $ | 1.61 | | | | 1.54 | | | | 1.54 | | | | 1.63 | | |
| Net asset value, end of period | | $ | 11.61 | | | | 11.54 | | | | 11.54 | | | | 11.63 | | |
| Total Return(2) | | % | 16.10 | | | | 15.40 | | | | 15.40 | | | | 16.30 | | |
| Ratios and Supplemental Data: | |
| Net assets, end of period (000's) | | $ | 170,108 | | | | 23,035 | | | | 69,825 | | | | 4 | | |
| Ratios to average net assets: | |
| Net expenses after expense reimbursement(3)(4)(5) | | % | 0.35 | | | | 1.10 | | | | 1.10 | | | | 0.10 | | |
| Gross expenses prior to expense reimbursement(4)(5) | | % | 0.66 | | | | 1.41 | | | | 1.41 | | | | 0.45 | | |
| Net investment loss after expense reimbursement(3)(4) | | % | (0.35 | ) | | | (1.10 | ) | | | (1.10 | ) | | | (0.13 | ) | |
| Portfolio turnover rate | | % | 30 | | | | 30 | | | | 30 | | | | 30 | | |
(1) Commencement of operations.
(2) Total return is calculated assuming reinvestment of dividends and capital gain distributions at net asset value and excluding the deduction of sales charge. Total return for less than one year is not annualized.
(3) The Investment Adviser has agreed to limit expenses, (excluding interest, taxes, brokerage and extraordinary expenses) subject to possible recoupment by ING Investments, LLC within three years of being incurred.
(4) Annualized for periods less than one year.
(5) Expense ratios do not include expenses of Underlying Funds.
* Per share data calculated using average number of shares outstanding throughout the period.
See Accompanying Notes to Financial Statements
102
NOTES TO FINANCIAL STATEMENTS AS OF OCTOBER 31, 2006
NOTE 1 — ORGANIZATION
Organization. The ING Funds included in this report are comprised of ING Mutual Funds ("IMF") and ING Mayflower Trust ("IMT"); both are organized as open-end investment management companies registered under the Investment Company Act of 1940, as amended ("1940 Act").
IMF is a Delaware statutory trust organized December 18, 1992 with seventeen separate series, all of which are included in this report, (each, a "Fund" and collectively, the "Funds"): ING Global Equity Dividend Fund ("Global Equity Dividend"), ING Global Natural Resources Fund ("Global Natural Resources"), ING Global Real Estate Fund ("Global Real Estate"), ING Global Value Choice Fund ("Global Value Choice"), ING Emerging Countries Fund ("Emerging Countries"), ING Foreign Fund ("Foreign"), ING Greater China Fund ("Greater China"), ING Index Plus International Equity Fund ("Index Plus International Equity"), ING International Fund ("International"), ING International Capital Appreciation Fund ("International Capital Appreciation"), ING International Real Estate Fund ("International Real Estate"), ING International SmallCap Fund ("International SmallCap"), ING International Value Choice Fund ("International Value Choice"), ING Russia Fund ("R ussia"), ING Emerging Markets Fixed Income Fund ("Emerging Markets Fixed Income"), ING Global Bond Fund ("Global Bond") and ING Diversified International Fund ("Diversified International"). IMT is a Massachusetts business trust organized August 18, 1993 with one series, ING International Value Fund ("International Value"). The investment objective of each Fund is described in the Fund's prospectus.
Each Fund offers one or more of the following classes of shares: Class A, Class B, Class C, Class I, Class M, Class O, Class Q and Class R. The separate classes of shares differ principally in the applicable sales charges (if any), distribution fees and shareholder servicing fees and transfer agent fees. Shareholders of each class also bear certain expenses that pertain to that particular class. All shareholders bear the common expenses of the Fund and earn income and realized gains/losses from the portfolio pro rata based on the average daily net assets of each class, without distinction between share classes. Differences in per share dividend rates generally result from the differences in separate class expenses, including distribution and shareholder servicing fees. Class B shares, along with their pro rata reinvested dividend shares, automatically convert to Class A shares approximately eight years after purchase.
International Value is closed to new investments except for shares purchased (1) through the reinvestment of dividends and distributions; (2) by 401(k), 403(b) and 457 plans that have selected International Value as an investment option prior to June 28, 2002; (3) by shareholders participating in mutual fund wrap fee programs who were invested in International Value prior to June 28, 2002; (4) by new 401(k), 403(b) and 457 plans and new shareholders participating in mutual fund wrap fee programs subject to approval by the Investment Adviser and Sub-Adviser based on their assessment of the Fund's ability to invest the monies consistent with the Fund's objectives in light of market conditions, the size of the purchase, and other relevant factors relating to International Value; (5) by certain institutional and separately managed account investors that are pre-existing clients of the Sub-Adviser; and (6) by employees of the Investment Adviser o r Sub-Adviser and their affiliates. Proof of eligibility may be required. Institutional and separately managed account investors that are pre-existing clients of the Sub-Adviser and employees of the Investment Adviser or Sub-Adviser and their affiliates must identify themselves as such at the time of purchase. Failure to do so may result in a rejection of the purchase. The Fund may reopen in the future subject to the discretion of the Board of Trustees.
Effective July 31, 2006, Class B shares of Global Bond and Emerging Markets Fixed Income are closed to new investment, provided that (1) Class B shares of Global Bond and Emerging Markets Fixed Income may be purchased through the reinvestment of dividends issued by Class B shares; and (2) subject to the terms and conditions of relevant exchange privileges and as permitted under their respective prospectuses, Class B shares of Global Bond and Emerging Markets Fixed Income may be acquired through exchange of Class B shares of other funds in the ING mutual funds complex.
Effective July 31, 2006, the maximum Class A sales charge for Emerging Markets Fixed Income and Global Bond has been lowered to 2.50%. Return calculations with a starting date prior to July 31, 2006 are based on a 5.75% sales charge for Emerging Markets Fixed Income and 4.75% sales charge for Global Bond, while returns with a starting date on or after July 31, 2006 are based on a 2.50% sales charge for Emerging Markets Fixed Income and Global Bond.
Diversified International seeks to achieve its investment objective by investing in other ING Funds ("Underlying Funds") and uses asset allocation strategies to determine how much to invest in the Underlying Funds.
103
NOTES TO FINANCIAL STATEMENTS AS OF OCTOBER 31, 2006 (CONTINUED)
NOTE 2 — SIGNIFICANT ACCOUNTING POLICIES
The following significant accounting policies are consistently followed by the Funds in the preparation of their financial statements, and such policies are in conformity with U.S. generally accepted accounting principles for investment companies.
A. Security Valuation. For all Funds except Russia and Diversified International, investments in equity securities traded on a national securities exchange are valued at the last reported sale price. Securities reported by NASDAQ will be valued at the NASDAQ official closing prices. Securities traded on an exchange or NASDAQ for which there has been no sale, securities traded in the over-the-counter-market, gold and silver bullion, platinum and palladium are valued at the mean between the last reported bid and ask prices. All investments quoted in foreign currencies will be valued daily in U.S. dollars on the basis of the foreign currency exchange rates prevailing at that time. Debt securities are valued at prices obtained from independent services or from one or more dealers making markets in the securities and may be adjusted based on the Funds' valuation procedures. U.S. government obligations are valued by using market quotations or independent pricing services that use prices provided by market-makers or estimates of market values obtained from yield data relating to instruments or securities with similar characteristics.
Securities and assets for which market quotations are not readily available (which may include certain restricted securities which are subject to limitations as to their sale) are valued at their fair values as determined in good faith by or under the supervision of the Funds' Board in accordance with methods that are specifically authorized by the Board. Securities traded on exchanges, including foreign exchanges, which close earlier than the time that a Fund calculates its next net asset value ("NAV") may also be valued at their fair values as determined in good faith by or under the supervision of a Fund's Board of Trustees ("Board"), in accordance with methods that are specifically authorized by the Board. The valuation techniques applied in any specific instance are likely to vary from case to case. With respect to a restricted security, for example, consideration is generally given to the cost of the investment, the market value of any unrestricted securities of the same class at the time of valuation, the potential expiration of restrictions on the security, the existence of any registration rights, the costs to the Fund related to registration of the security, as well as factors relevant to the issuer itself. Consideration may also be given to the price and extent of any public trading in similar securities of the issuer or comparable companies' securities.
The value of a foreign security traded on an exchange outside the United States is generally based on its price on the principal foreign exchange where it trades as of the time a Fund determines its NAV or if the foreign exchange closes prior to the time the Fund determines its NAV, the most recent closing price of the foreign security on its principal exchange. Trading in certain non-U.S. securities may not take place on all days on which the New York Stock Exchange ("NYSE") is open. Further, trading takes place in various foreign markets on days on which the NYSE is not open. Consequently, the calculation of a Fund's NAV may not take place contemporaneously with the determination of the prices of securities held by the Fund in foreign securities markets. Further, the value of a Fund's assets may be significantly affected by foreign trading on days when a shareholder cannot purchase or redeem shares of the Fund. In calculating a Fund's NAV, foreign securities in foreign currency are converted to U.S. dollar equivalents.
If an event occurs after the time at which the market for foreign securities held by a Fund closes but before the time that the Fund's next NAV is calculated, such event may cause the closing price on the foreign exchange to not represent a readily available reliable market value quotation for such securities at the time the Fund determines its NAV. In such a case, a Fund will use the fair value of such securities as determined under the Funds' valuation procedures. Events after the close of trading on a foreign market that could require a Fund to fair value some or all of its foreign securities include, among others, securities trading in the U.S. and other markets, corporate announcements, natural and other disasters, and political and other events. Among other elements of analysis in the determination of a security's fair value, the Board has authorized the use of one or more independent research services to assist with such determination s. An independent research service may use statistical analyses and quantitative models to help determine fair value as of the time a Fund calculates its NAV. There can be no assurance that such models accurately reflect the behavior of the applicable markets or the effect of the behavior of such markets on the fair value of securities, or that such markets will continue to behave in a fashion that is consistent with such models. Unlike the closing price of a security on an exchange, fair value determinations employ elements of judgment. Consequently, the fair value assigned to a security may not represent the actual value that a Fund could obtain if it were to sell the security at the time of the close of the NYSE. Pursuant to procedures adopted by the
104
NOTES TO FINANCIAL STATEMENTS AS OF OCTOBER 31, 2006 (CONTINUED)
NOTE 2 — SIGNIFICANT ACCOUNTING POLICIES (continued)
Board, a Fund is not obligated to use the fair valuations suggested by any research service, and valuation recommendations provided by such research services may be overridden if other events have occurred or if other fair valuations are determined in good faith to be more accurate. Unless an event is such that it causes a Fund to determine that the closing prices for one or more securities do not represent readily available reliable market value quotations at the time the Fund determines its NAV, events that occur between the time of the close of the foreign market on which they are traded and the close of regular trading on the NYSE will not be reflected in the Fund's NAV. Investments in securities maturing in 60 days or less are valued at amortized cost, which, when combined with accrued interest approximates market value.
For the Russia Fund, the valuation procedures for Russian equity securities are to price local shares according to the most recent available bid prices. If securities are not listed on the Russian Trade System or on any other pricing service that lists available bid quotes, then the mean of at least two broker bid quotes is used. For equity securities of an issuer in Russia for which there are no readily available reliable market value quotations, the following benchmark pricing procedure shall apply on any day on which the largest securities exchange in Russia (the "RTS") declines by 21/2% or more. The price of the security shall be adj usted by the amount of the downward change in a composite of the other companies that are publicly traded in the same sector as the issuer, if ascertainable, and if not ascertainable, by the amount of downward change in the RTS.
For Diversified International, the valuation of the Fund's investments in its Underlying Funds is based on the NAVs of the Underlying Funds each business day.
B. Security Transactions and Revenue Recognition. Securities transactions are accounted for on the trade date. Realized gains and losses are reported on the basis of identified cost of securities sold. Interest income is recorded on an accrual basis. Dividend income is recorded, net of any applicable withholding tax, on the ex-dividend date, or for certain foreign securities, when the information becomes available to the Funds and Underlying Funds. Premium amortization and discount accretion are determined by the effective yield method.
Global Real Estate and International Real Estate estimate components of distributions from real estate investment trusts (REITs). Distributions received in excess of income are recorded as a reduction of cost of the related investments. If the Funds no longer own the applicable securities, any distributions received in excess of income are recorded as realized gains.
C. Foreign Currency Translation. The books and records of the Funds and Underlying Funds are maintained in U.S. dollars. Any foreign currency amounts are translated into U.S. dollars on the following basis:
(1) Market value of investment securities, other assets and liabilities — at the exchange rates prevailing at the end of the day.
(2) Purchases and sales of investment securities, income and expenses — at the rates of exchange prevailing on the respective dates of such transactions.
Although the net assets and the market values are presented at the foreign exchange rates at the end of the day, the Funds and Underlying Funds do not isolate the portion of the results of operations resulting from changes in foreign exchange rates on investments from the fluctuations arising from changes in market prices of securities held. Such fluctuations are included with the net realized and unrealized gains or losses from investments. For securities that are subject to foreign withholding tax upon disposition, liabilities are recorded on the Statements of Assets and Liabilities for the estimated tax withholding based on the securities' current market value. Upon disposition, realized gains or losses on such securities are recorded net of foreign withholding tax.
Reported net realized foreign exchange gains or losses arise from sales of foreign currencies, currency gains or losses realized between the trade and settlement dates on securities transactions, the difference between the amounts of dividends, interest, and foreign withholding taxes recorded on a Fund's or an Underlying Fund's books, and the U.S. dollar equivalent of the amounts actually received or paid. Net unrealized foreign exchange gains and losses arise from changes in the value of assets and liabilities other than investments in securities at fiscal year end, resulting from changes in the exchange rate. Foreign security and currency transactions may involve certain considerations and risks not typically associated with investing in U.S. companies and U.S. government securities. These risks include, but are not limited to revaluation of currencies and future adverse political and economic developments which could cause securities and their markets to be less liquid and prices more volatile than those of comparable U.S. companies and U.S. government securities.
105
NOTES TO FINANCIAL STATEMENTS AS OF OCTOBER 31, 2006 (CONTINUED)
NOTE 2 — SIGNIFICANT ACCOUNTING POLICIES (continued)
D. Foreign Currency Transactions and Futures Contracts. Each Fund and Underlying Fund may enter into foreign currency exchange transactions to convert to and from different foreign currencies and to and from the U.S. dollar, generally in connection with the planned purchases or sales of securities. The Funds and Underlying Funds may enter into these transactions on a spot basis at the spot rate prevailing in the foreign currency exchange market, use forward foreign currency contracts to purchase or sell foreign currencies or to help protect Fund assets against adverse changes in foreign currency exchange rates. When the contract is fulfilled or closed, gains or losses are realized. Until then, the gain or loss is included in unrealized appreciation or depreciation. Risks may arise u pon entering into forward contracts from the potential inability of counterparties to meet the terms of their forward contracts and from unanticipated movements in the value of foreign currencies relative to the U.S. dollar.
Each Fund and Underlying Fund may enter into futures contracts involving foreign currency, interest rates, securities and securities indices. Each Fund and Underlying Fund intends to limit its use of futures contracts and futures options to "bona fide Hedging" transactions, as such term is defined in applicable regulations, interpretations and practice. A futures contract obligates the seller of the contract to deliver and the purchaser of the contract to take delivery of the type of foreign currency, financial instrument or security called for in the contract at a specified future time for a specified price. Upon entering into such a contract, a Fund or an Underlying Fund is required to deposit and maintain as collateral such initial margin as required by the exchange on which the contract is traded. Pursuant to the contract, a Fund or an Underlying Fund agrees to receive from or pay to the broker an amount equal to the daily fluctuations i n the value of the contract. Such receipts or payments are known as variation margin and are recorded as unrealized gains or losses by the Fund or an Underlying Fund. When the contract is closed, the Fund or Underlying Fund records a realized gain or loss equal to the difference between the value of the contract at the time it was opened and the value at the time it was closed.
E. Distributions to Shareholders. The Funds record distributions to their shareholders on ex-dividend date. Each Fund pays dividends and capital gains, if any, annually (except, Global Equity Dividend, Global Real Estate and International Real Estate, which pay dividends, if any, quarterly and Emerging Markets Fixed Income and Global Bond, which pay dividends monthly). The Funds may make distributions on a more frequent basis to comply with the distribution requirements of the Internal Revenue Code. The characteristics of income and gains to be distributed are determined in accordance with income tax regulations, which may differ from U.S. generally accepted accounting principles for investment companies.
F. Federal Income Taxes. It is the policy of the Funds to comply with subchapter M of the Internal Revenue Code and related excise tax provisions applicable to regulated investment companies and to distribute substantially all of their net investment income and any net realized capital gains to their shareholders. Therefore, no federal income tax provision is required. No capital gain distributions shall be made until any capital loss carryforwards have been fully utilized or expire.
The Funds may utilize equalization accounting for tax purposes, whereby a portion of redemption payments are treated as distributions of income or gain.
G. Use of Estimates. The preparation of financial statements in conformity with U.S. generally accepted accounting principles requires management to make estimates and assumptions that affect the reported amounts of assets and liabilities and disclosure of contingent assets and liabilities at the date of the financial statements and the reported amounts of increases and decreases in net assets from operations during the reporting period. Actual results could differ from those estimates.
H. Organization Expenses and Offering Costs. Costs incurred with the organization of the Funds and Underlying Funds are expensed as incurred. Costs incurred with the offering of shares of the Funds and Underlying Funds are deferred and amortized over a twelve-month period on a straight-line basis.
I. Repurchase Agreements. Each Fund and Underlying Fund may invest in repurchase agreements only with government securities dealers recognized by the Board of Governors of the Federal Reserve System. Under such agreements, the seller of the security agrees to repurchase it at a mutually agreed upon time and price. The resale price is in excess of the purchase price and reflects an agreed upon interest rate for the period of time the agreement is outstanding. The period of the repurchase agreements is usually short, from overnight to one week, while the underlying securities generally have longer maturities. Each Fund and Underlying Fund will receive as collateral securities acceptable to it whose market value is equal to at least 100% of the carrying amount of the repurchase agreeme nts, plus accrued interest, being invested by the Fund or Underlying Fund. The underlying collateral is valued daily on a mark to market basis to assure that the value, including accrued interest is at least equal to the repurchase price. There would be potential loss to the Fund or Underlying Fund in the event the Fund or Underlying Fund is delayed or prevented from exercising its right to dispose of the collateral, and it might incur disposition costs in liquidating the collateral.
106
NOTES TO FINANCIAL STATEMENTS AS OF OCTOBER 31, 2006 (CONTINUED)
NOTE 2 — SIGNIFICANT ACCOUNTING POLICIES (continued)
J. Securities Lending. Each Fund and Underlying Fund has the option to temporarily loan up to 30% of its total assets to brokers, dealers or other financial institutions in exchange for a negotiated lender's fee. The borrower is required to fully collateralize the loans with cash or U.S. government securities. Generally, in the event of counterparty default, each Fund and Underlying Fund has the right to use collateral to offset losses incurred. There would be potential loss to a Fund or Underlying Fund in the event the Fund or Underlying Fund is delayed or prevented from exercising its right to dispose of the collateral. Each Fund and Underlying Fund bears the risk of loss with respect to the investment of collateral. Engaging in securities lending could have a leveraging effect, w hich may intensify the credit, market and other risks associated with investing in a Fund or Underlying Fund.
K. Options Contracts. All Funds and Underlying Funds may purchase put and call options and may write (sell) put options and covered call options. The Funds and Underlying Funds may engage in option transactions as a hedge against adverse movements in the value of portfolio holdings or to increase market exposure. Option contracts are valued daily and unrealized gains or losses are recorded based upon the last sales price on the principal exchange on which the options are traded. The Funds and Underlying Funds will realize a gain or loss upon the expiration or closing of the option contract. When an option is exercised, the proceeds on sales of the underlying security for a written call option, the purchase cost of the security for a written put option, or the cost of the security fo r a purchased put or call option is adjusted by the amount of premium received or paid. Realized and unrealized gains or losses on option contracts are reflected in the accompanying financial statements. The risk in writing a call option is that the Funds and Underlying Funds give up the opportunity for profit if the market price of the security increases and the option is exercised. The risk in writing a put option is that the Funds and Underlying Funds may incur a loss if the market price of the security decreases and the option is exercised. The risk in buying an option is that the Funds and Underlying Funds pay a premium whether or not the option is exercised. Risks may also arise from an illiquid secondary market or from the inability of counterparties to meet the terms of the contract.
L. Illiquid and Restricted Securities. Each Fund and Underlying Fund may not invest more than 15% of its net assets in illiquid securities. Illiquid securities are not readily marketable. Disposing of illiquid investments may involve time-consuming negotiation and legal expenses, and it may be difficult or impossible for the Funds and Underlying Funds to sell them promptly at an acceptable price. Each Fund and Underlying Fund may also invest in restricted securities which include those sold under Rule 144A of the Securities Act of 1933 ("1933 Act") or securities offered pursuant to Section 4(2) of the 1933 Act, and/or are subject to legal or contractual restrictions on resale and may not be publicly sold without registration under the 1933 Act. Certain restricted securities may be considered liquid pursuant to procedures adopted by the Board or may be deemed illiquid because they may not be readily marketable. Illiquid and restricted securities are valued using market quotations when readily available. In the absence of market quotations, the securities are valued based upon their fair value determined under procedures approved by the Board.
M. Delayed Delivery Transaction. The Funds and Underlying Funds may purchase or sell securities on a when-issued or forward commitment basis. The price of the securities and date when the securities will be delivered and paid for are fixed at the time the transaction is negotiated. The market value of these securities is identified in the Funds' Portfolio of Investments. Losses may arise due to changes in the market value of the securities or from the inability of counterparties to meet the terms of the contract. In connection with such purchases, the Funds and Underlying Funds are required to segregate liquid assets sufficient to cover the purchase price.
NOTE 3 — INVESTMENT TRANSACTIONS
For the year ended October 31, 2006, the cost of purchases and the proceeds from the sales of securities, excluding U.S. government and short-term securities, were as follows:
| | | Purchases | | Sales | |
| Global Equity Dividend | | $ | 123,077,888 | | | $ | 86,479,619 | | |
| Global Natural Resources | | | 183,166,960 | | | | 186,567,113 | | |
| Global Real Estate | | | 434,466,241 | | | | 125,121,892 | | |
| Global Value Choice | | | 77,825,949 | | | | 97,886,439 | | |
| Emerging Countries | | | 101,567,485 | | | | 60,395,651 | | |
| Foreign | | | 379,208,893 | | | | 226,965,540 | | |
| Greater China | | | 43,354,669 | | | | 20,028,437 | | |
| Index Plus International Equity | | | 186,954,336 | | | | 106,593,670 | | |
| International | | | 216,923,806 | | | | 227,593,770 | | |
| International Capital Appreciation | | | 72,240,055 | | | | 28,424,732 | | |
| International Real Estate | | | 81,895,081 | | | | 10,603,751 | | |
| International SmallCap | | | 518,604,802 | | | | 386,904,889 | | |
| International Value | | | 1,101,622,837 | | | | 1,412,973,670 | | |
| International Value Choice | | | 55,074,765 | | | | 9,953,022 | | |
| Russia | | | 355,302,000 | | | | 111,424,767 | | |
| Emerging Markets Fixed Income | | | 29,943,904 | | | | 6,343,560 | | |
| Global Bond | | | 56,483,793 | | | | 43,166,690 | | |
| Diversified International | | | 289,156,828 | | | | 43,712,291 | | |
Purchases and sales of long-term U.S. government securities not included above were as follows:
| | | Purchases | | Sales | |
| Global Bond | | $ | 51,845,773 | | | $ | 44,193,321 | | |
107
NOTES TO FINANCIAL STATEMENTS AS OF OCTOBER 31, 2006 (CONTINUED)
NOTE 4 — REDEMPTION FEES
A 2% redemption fee is charged on shares of Russia that are redeemed (included in connection with an exchange) within 365 days or less from their date of purchase. The redemption fee is recorded as an addition to paid-in capital. Total redemption fee proceeds for the year ended October 31, 2006 and October 31, 2005 were $2,984,157 and $850,706, respectively, and are set forth in the Statements of Changes in Net Assets.
Up through April 2, 2006, International imposed a 2% redemption fee on Class A shares redeemed (including in connection with an exchange) within 30 days or less from their date of purchase. The redemption fee is recorded as an addition to paid-in capital. Total redemption fee proceeds through April 2, 2006 and for the period ended October 31, 2005 were $257 and $12,635, respectively, and are set forth in the Statements of Changes in Net Assets. Effective April 3, 2006, International no longer charges a redemption fee.
NOTE 5 — INVESTMENT MANAGEMENT AND ADMINISTRATIVE FEES
Each of the Funds has entered into an investment management agreement ("Management Agreements") with ING Investments, LLC ("ING Investments" or "Investment Adviser"). The Management Agreements compensate the Investment Adviser with a fee, computed daily and payable monthly, based on the average daily net assets of each Fund, at the following annual rates:
| | | As a percentage of average net assets | |
| Global Equity Dividend | | 0.70% | |
| Global Natural Resources | | 1.00% on first $50 million; and 0.75%
thereafter | |
| Global Real Estate(1) | | 0.80% on the first $250 million; 0.775%
on the next $250 million; and 0.70%
thereafter | |
| Global Value Choice | | 1.00% on the first $250 million; 0.90% on
the next $250 million; 0.80% on the next
$500 million; and 0.75% thereafter | |
| Emerging Countries | | 1.25% | |
| Foreign | | 1.00% on the first $500 million; and
0.90% thereafter | |
| Greater China | | 1.15% on the first $100 million; 1.05% of
the next $150 million; and 0.95% thereafter | |
Index Plus International
Equity | | 0.55% | |
| International | | 1.00% | |
International Capital
Appreciation | | 0.85% on the first $500 million; 0.80% on
the next $500 million; and 0.75% thereafter | |
| International Real Estate | | 1.00% on the first $250 million; 0.90% on
the next $250 million; and 0.80% thereafter | |
| International SmallCap | | 1.00% on first $500 million; 0.90% on
next $500 million; and 0.85% thereafter | |
| International Value | | 1.00% | |
International Value
Choice | | 1.00% | |
| Russia | | 1.25% | |
Emerging Markets
Fixed Income | | 0.65% on the first $250 million; 0.60% on
the next $250 million; and 0.55% thereafter | |
| Global Bond | | 0.40% | |
| Diversified International | | 0.00% | |
(1) Prior to April 28, 2006, the investment management fees for Global Real Estate were 1.00% on the first $250 million; 0.90% on the next $250 million; and 0.80% thereafter.
ING Investment Management Advisors B.V. ("IIMA"), a registered investment adviser, serves as the Sub-Adviser to Global Equity Dividend, Index Plus International Equity, Russia and Emerging Markets Fixed Income pursuant to a sub-advisory agreement between the Investment Adviser and IIMA.
ING Clarion Real Estate Securities L.P. ("INGCRES") a registered investment adviser, serves as the Sub-Adviser to Global Real Estate and International Real Estate pursuant to a sub-advisory agreement between the Investment Adviser and INGCRES.
Tradewinds NWQ Global Investors, LLC ("NWQ"), a registered investment adviser, serves as the Sub-Adviser to Global Value Choice and International Value Choice pursuant to a sub-advisory agreement between the Investment Adviser and NWQ.
Brandes Investment Partners, L.P. ("Brandes"), a registered investment adviser, serves as the Sub-Adviser to Emerging Countries and International Value pursuant to a sub-advisory agreement between the Investment Adviser and Brandes.
Julius Baer Investment Management LLC ("JBIM"), a registered investment adviser wholly-owned by the Julius Baer Securities, serves as Sub-Adviser to Foreign pursuant to a sub-advisory agreement between the Investment Adviser and JBIM.
ING Investment Management Co. ("ING IM"), a registered investment adviser, serves as sub-adviser to Global Natural Resources, International, and Global Bond pursuant to a sub-advisory agreement between the Investment Adviser and ING IM.
Acadian Asset Management, Inc. ("Acadian"), a registered investment adviser, serves as the Sub-Adviser to International SmallCap pursuant to a sub-advisory agreement between the Investment Adviser and Acadian.
ING Investment Management Asia/Pacific (Hong Kong) Limited ("ING Asia"), a registered investment adviser, serves as the Sub-Adviser to Greater China pursuant to a sub-advisory agreement between the Investment Adviser and ING Asia.
Hansberger Global Investors, Inc. ("HGI"), a registered investment adviser, serves as the Sub-Adviser to International Capital Appreciation pursuant to a sub-advisory agreement between the Investment Adviser and HGI.
For Diversified International, ING Investment Management Co. (the "Consultant" or "ING IM") is a consultant to the Investment Adviser. The Consultant provides tactical allocation recommendations to the Investment Adviser. The Investment Adviser has set up an Investment Committee made up of a team of professionals to consider, review and implement the recommendations of the Consultant, and retains discretion over implementation of the Consultant's recommendations. The Consultant provides ongoing recommendations to the Investment Committee of
108
NOTES TO FINANCIAL STATEMENTS AS OF OCTOBER 31, 2006 (CONTINUED)
NOTE 5 — INVESTMENT MANAGEMENT AND ADMINISTRATIVE FEES (continued)
the Investment Adviser quarterly or as warranted by market conditions.
ING Funds Services, LLC (the "Administrator"), serves as administrator to each Fund. The Funds pay the Administrator a fee calculated at an annual rate of 0.10% of each Fund's average daily net assets.
International Value Fund also pays the Administrator an annual shareholder account-servicing fee of $5.00 for each account of beneficial owners of shares.
The Investment Adviser, ING IM, INGCRES, IIMA, ING Asia and the Administrator are indirect, wholly-owned subsidiaries of ING Groep N.V. ("ING Groep"). ING Groep is one of the largest financial services organizations in the world, and offers an array of banking, insurance and asset management services to both individual and institutional investors.
NOTE 6 — DISTRIBUTION AND SERVICE FEES
Each share class of the Funds, except Class I, has adopted a Plan pursuant to Rule 12b-1 under the 1940 Act (the "12b-1 Plans"), whereby ING Funds Distributor, LLC (the "Distributor"), an indirect, wholly-owned subsidiary of ING Groep, is reimbursed or compensated (depending on the class of shares) by the Funds for expenses incurred in the distribution of each Funds' shares ("Distribution Fees"). Pursuant to the 12b-1 Plans, the Distributor is entitled to a payment each month for expenses incurred in the distribution and promotion of each Fund's shares, including expenses incurred in printing prospectuses and reports used for sales purposes, expenses incurred in preparing and printing sales literature and other such distribution related expenses, including any distribution or shareholder servicing fees ("Service Fees") paid to securities dealers who have executed a distribution agreement with the Distributor. Under the 12b-1 Plans, each clas s of shares of a Fund pays the Distributor a Distribution and/or Service Fee based on average daily net assets at the following annual rates:
| | | Class A | | Class B | | Class C | | Class M | | Class O | | Class Q | | Class R | |
Global Equity
Dividend | | | 0.25 | % | | | 1.00 | % | | | 1.00 | % | | N/A | | | 0.25 | % | | | N/A | | | N/A | |
Global Natural
Resources | | | 0.25 | % | | | N/A | | | | N/A | | | N/A | | N/A | | | N/A | | | N/A | |
Global Real
Estate | | | 0.25 | % | | | 1.00 | % | | | 1.00 | % | | N/A | | | 0.25 | % | | | N/A | | | N/A | |
Global Value
Choice | | | 0.35 | % | | | 1.00 | % | | | 1.00 | % | | N/A | | N/A | | | 0.25 | % | | N/A | |
Emerging
Countries | | | 0.35 | %(1) | | | 1.00 | % | | | 1.00 | % | | | 0.75 | %(2) | | N/A | | | 0.25 | % | | N/A | |
| Foreign | | | 0.25 | % | | | 1.00 | % | | | 1.00 | % | | N/A | | N/A | | | 0.25 | % | | N/A | |
| Greater China | | | 0.25 | % | | | 1.00 | % | | | 1.00 | % | | N/A | | N/A | | | N/A | | | N/A | |
Index Plus
International
Equity | | | 0.25 | % | | | 1.00 | % | | | 1.00 | % | | N/A | | N/A | | | N/A | | | N/A | |
| International | | | 0.25 | % | | | 1.00 | % | | | 1.00 | % | | N/A | | N/A | | | 0.25 | % | | N/A | |
International
Capital
Appreciation | | | 0.25 | % | | | 1.00 | % | | | 1.00 | % | | N/A | | N/A | | | N/A | | | N/A | |
| | | Class A | | Class B | | Class C | | Class M | | Class O | | Class Q | | Class R | |
International
Real Estate | | | 0.25 | % | | | 1.00 | % | | | 1.00 | % | | N/A | | N/A | | N/A | | N/A | |
International
SmallCap | | | 0.35 | % | | | 1.00 | % | | | 1.00 | % | | N/A | | N/A | | | 0.25 | % | | N/A | |
International
Value | | | 0.30 | % | | | 1.00 | % | | | 1.00 | % | | N/A | | N/A | | | 0.25 | % | | N/A | |
International
Value Choice | | | 0.25 | % | | | 1.00 | % | | | 1.00 | % | | N/A | | N/A | | N/A | | N/A | |
| Russia | | | 0.25 | % | | | N/A | | | | N/A | | | N/A | | N/A | | N/A | | N/A | |
Emerging
Markets
Fixed Income | | | 0.25 | % | | | 1.00 | % | | | 1.00 | % | | N/A | | N/A | | N/A | | N/A | |
| Global Bond | | | 0.25 | % | | | 1.00 | % | | | 1.00 | % | | N/A | | N/A | | N/A | | N/A | |
Diversified
International | | | 0.25 | % | | | 1.00 | % | | | 1.00 | % | | N/A | | N/A | | N/A | | | 0.50 | % | |
(1) The Distributor has agreed to waive 0.10% of the Distribution Fee for Class A shares of Emerging Countries for the period from January 1, 2006 through December 31, 2006. Previously, the Distributor had agreed to waive 0.10% of the Distribution Fee for Class A shares of Emerging Countries for the period from January 1, 2005 through December 31, 2005.
(2) Prior to June 1, 2006, the Distributor agreed to waive 0.25% of a 1.00% Distribution Fee for Class M shares of Emerging Countries. Effective June 1, 2006, this waiver was eliminated and the 12b-1 fee was permanently reduced to 0.75%.
Fees paid to the Distributor by class during the year ended October 31, 2006 are shown in the accompanying Statements of Operations.
The Distributor also receives the proceeds of the initial sales charge paid by shareholders upon the purchase of Class A shares, and the contingent deferred sales charge paid by shareholders upon certain redemptions for Class A, Class B, Class C and Class M shares. For the year ended October 31, 2006, the Distributor retained the following amounts in sales charges for the Funds:
| | | Class A
Shares | | Class B
Shares | | Class C
Shares | | Class M
Shares | |
| Initial Sales Charges: | |
| Global Equity Dividend | | $ | 76,783 | | | | N/A | | | | N/A | | | N/A | |
| Global Natural Resources | | | 45,079 | | | | N/A | | | | N/A | | | N/A | |
| Global Real Estate | | | 280,469 | | | | N/A | | | | N/A | | | N/A | |
| Global Value Choice | | | 34,310 | | | | N/A | | | | N/A | | | N/A | |
| Emerging Countries | | | 55,357 | | | | N/A | | | | N/A | | | $ | 391 | | |
| Foreign | | | 137,906 | | | | N/A | | | | N/A | | | N/A | |
| Greater China | | | 45,391 | | | | N/A | | | | N/A | | | N/A | |
Index Plus International
Equity | | | 4,187 | | | | N/A | | | | N/A | | | N/A | |
| International | | | 10,209 | | | | N/A | | | | N/A | | | N/A | |
International Capital
Appreciation | | | 378 | | | | N/A | | | | N/A | | | N/A | |
| International Real Estate | | | 36,622 | | | | N/A | | | | N/A | | | N/A | |
| International SmallCap | | | 55,862 | | | | N/A | | | | N/A | | | N/A | |
| International Value | | | 1,918 | | | | N/A | | | | N/A | | | N/A | |
| International Value Choice | | | 13,112 | | | | N/A | | | | N/A | | | N/A | |
| Russia | | | 2,056,746 | | | | N/A | | | | N/A | | | N/A | |
Emerging Markets Fixed
Income | | | 1,668 | | | | N/A | | | | N/A | | | N/A | |
| Global Bond | | | 63 | | | | N/A | | | | N/A | | | N/A | |
| Diversified International | | | 417,126 | | | | N/A | | | | N/A | | | N/A | |
Contingent Deferred Sales
Charges: | |
| Global Equity Dividend | | $ | — | | | $ | — | | | $ | 11,421 | | | N/A | |
| Global Natural Resources | | | — | | | | — | | | | — | | | N/A | |
| Global Real Estate | | | 11,486 | | | | — | | | | 12,117 | | | N/A | |
| Global Value Choice | | | — | | | | — | | | | 1,894 | | | N/A | |
109
NOTES TO FINANCIAL STATEMENTS AS OF OCTOBER 31, 2006 (CONTINUED)
NOTE 6 — DISTRIBUTION AND SERVICE FEES (continued)
| | | Class A
Shares | | Class B
Shares | | Class C
Shares | | Class M
Shares | |
| Emerging Countries | | $ | 316 | | | $ | — | | | $ | 3,759 | | | N/A | |
| Foreign | | | 937 | | | | — | | | | 13,980 | | | N/A | |
| Greater China | | | 143 | | | | — | | | | 266 | | | N/A | |
Index Plus International
Equity | | | — | | | | — | | | | 69 | | | N/A | |
| International | | | 86 | | | | — | | | | 250 | | | N/A | |
International Capital
Appreciation | | | — | | | | — | | | | 19 | | | N/A | |
| International Real Estate | | | 4 | | | | — | | | | 259 | | | N/A | |
| International SmallCap | | | 2,638 | | | | — | | | | 2,872 | | | N/A | |
| International Value | | | 15,266 | | | | — | | | | 3,821 | | | N/A | |
| International Value Choice | | | — | | | | — | | | | 942 | | | N/A | |
| Russia | | | 937 | | | | — | | | | 13,980 | | | N/A | |
Emerging Markets
Fixed Income | | | — | | | | — | | | | — | | | N/A | |
| Global Bond | | | — | | | | — | | | | — | | | N/A | |
| Diversified International | | | 43 | | | | — | | | | 10,006 | | | N/A | |
NOTE 7 — OTHER TRANSACTIONS WITH AFFILIATES AND RELATED PARTIES
At October 31, 2006, the Funds had the following amounts recorded in payable to affiliates on the accompanying Statements of Assets and Liabilities (See Notes 5 and 6):
| | | Accrued
Investment
Management
Fees | | Accrued
Administrative
Fees | | Accrued
Shareholder
Services and
Distribution
Fees | | Accrued
Reimbursement
Expense | | Total | |
Global Equity
Dividend | | $ | 130,530 | | | $ | 18,647 | | | $ | 122,101 | | | $ | — | | | $ | 271,278 | | |
Global Natural
Resources | | | 85,145 | | | | 9,937 | | | | 24,843 | | | | — | | | | 119,925 | | |
Global Real
Estate | | | 373,019 | | | | 47,980 | | | | 198,853 | | | | — | | | | 619,852 | | |
Global Value
Choice | | | 88,497 | | | | 8,850 | | | | 58,770 | | | | — | | | | 156,117 | | |
Emerging
Countries | | | 209,829 | | | | 16,786 | | | | 70,645 | | | | — | | | | 297,260 | | |
| Foreign Fund | | | 392,220 | | | | 39,222 | | | | 205,374 | | | | — | | | | 636,816 | | |
| Greater China | | | 26,171 | | | | 2,276 | | | | 8,122 | | | | — | | | | 36,569 | | |
Index Plus
Intrenational
Equity | | | 42,211 | | | | 7,675 | | | | 3,772 | | | | 12,100 | | | | 65,758 | | |
| International | | | 111,250 | | | | 11,125 | | | | 45,790 | | | | — | | | | 168,165 | | |
International
Capital
Appreciation | | | 41,485 | | | | 4,881 | | | | 1,158 | | | | 10,160 | | | | 57,684 | | |
International
Real Estate | | | 61,869 | | | | 6,187 | | | | 22,236 | | | | 2,868 | | | | 93,160 | | |
International
Small Cap | | | 481,949 | | | | 48,831 | | | | 190,158 | | | | — | | | | 720,938 | | |
International
Value | | | 4,060,701 | | | | 406,066 | | | | 1,432,752 | | | | — | | | | 5,899,519 | | |
International
Value Choice | | | 49,158 | | | | 4,916 | | | | 10,027 | | | | 51,578 | | | | 115,679 | | |
| Russia | | | 783,396 | | | | 62,671 | | | | 156,679 | | | | — | | | | 1,002,746 | | |
Emerging
Markets
Fixed Income | | | 9,223 | | | | 1,418 | | | | 3,889 | | | | — | | | | 14,530 | | |
| Global Bond | | | 8,648 | | | | 2,162 | | | | 5,430 | | | | — | | | | 16,240 | | |
Diversified
International | | | — | | | | 21,066 | | | | 108,939 | | | | — | | | | 130,005 | | |
At October 31, 2006, the following indirect, wholly owned subsidiaries of ING Groep owned the following Funds:
ING Life Insurance and Annuity Company — Greater China (45.02%); Index Plus International Equity (12.70%); International Real Estate (8.98%); International SmallCap (5.66%); Emerging Markets Fixed Income (95.05%); and Global Bond (99.17%).
ING National Nederlanden Intervest — Global Real Estate (11.42%).
ING National Trust — International (24.13%).
Control is defined by the 1940 Act as the beneficial ownership, either directly or through one or more controlled companies, of more than 25% of the voting securities of a company. Investment activities of these shareholders could have a material impact on the Funds.
The Investment Adviser may request that the Funds' portfolio managers use their best efforts (subject to obtaining best execution of each transaction) to allocate a portfolio's equity security transactions through certain designated broker-dealers. The designated broker-dealer, in turn, will reimburse a portion of the brokerage commissions to pay certain expenses of that Fund. Any amounts credited to a Fund are reflected as a reimbursement of expenses in the Statements of Operations.
Each Fund has adopted a Retirement Policy covering all independent trustees of the Funds who will have served as an independent trustee for at least five years at the time of retirement. Benefits under this plan are based on an annual rate as defined in the plan agreement.
The following Funds placed a portion of its portfolio transactions with brokerage firms which are affiliates of the investment adviser. The commissions paid to these affiliated firms were:
| Fund | | Affiliated
Brokers | | Commissions
Received | |
| Emerging Countries | | ING Baring LLC | | $ | 6,972 | | |
| Foreign | | ING Baring LLC | | | 42,265 | | |
| | | ING Securities | | | 3,851 | | |
| Greater China | | ING Baring LLC | | | 611 | | |
| International Value | | ING Baring LLC | | | 12,415 | | |
| Russia | | ING Baring LLC | | | 11,935 | | |
| | | ING Securities | | | 11,387 | | |
The following is a summary of the transactions during the year ended October 31, 2006 in which the issuer was an affiliate of the ING Family of Funds.
| Global Real | | Sales | | Unrealized
Investment
Securities at | | Gain on
Value
at | |
| Estate | | Shares | | Cost | | 10/31/2006 | | 10/31/2006 | |
ING UK Real Estate
Income Trust Ltd. | | | 208,600 | | | $ | 369,368 | | | $ | 713,816 | | | $ | 2,956,232 | | |
For the year ended October 31, 2005, the Distributor made the following payment in settlement of an administrative proceeding as described in Note 18 and
110
NOTES TO FINANCIAL STATEMENTS AS OF OCTOBER 31, 2006 (CONTINUED)
NOTE 7 — OTHER TRANSACTIONS WITH AFFILIATES AND RELATED PARTIES (continued)
as reflected in the accompanying Statements of Changes in Net Assets for each of the following Funds:
| Global Value Choice | | $ | 8,840 | | |
| Emerging Countries | | | 266,176 | | |
| International | | | 127,510 | | |
| International SmallCap | | | 914,722 | | |
| International Value | | | 79,655 | | |
NOTE 8 — OTHER ACCRUED EXPENSES AND LIABILITIES
At October 31, 2006, the Funds had the following payables included in Other Accrued Expenses and Liabilities on the Statement of Assets and Liabilities that exceeded 5% of total liabilities:
| | | Accrued Custody Fees | |
| Greater China | | $ | 9,767 | | |
| | | Accrued Transfer Agent Fees | |
| Greater China | | $ | 6,447 | | |
| | | Accrued Postage Fees | |
| Greater China | | $ | 4,982 | | |
| | | Accrued Offering Fees | |
| Greater China | | $ | 18,011 | | |
| | | Accrued Printing Fees | |
| Greater China | | $ | 13,710 | | |
NOTE 9 — EXPENSE LIMITATIONS
The Investment Adviser has agreed to limit expenses, excluding interest, taxes, brokerage and extraordinary expenses to the levels listed below:
Maximum Operating Expense Limit (as a percentage of average net assets)
| | | Class A | | Class B | | Class C | | Class I | | Class M | | Class O | | Class Q | | Class R | |
Global Equity
Dividend | | | 1.40 | % | | | 2.15 | % | | | 2.15 | % | | | N/A | | | N/A | | | 1.40 | % | | | N/A | | | N/A | |
Global Natural
Resources | | | 2.75 | % | | | N/A | | | | N/A | | | | N/A | | | N/A | | N/A | | | N/A | | | N/A | |
Global Real
Estate | | | 1.75 | % | | | 2.50 | % | | | 2.50 | % | | | 1.50 | % | | N/A | | | 1.75 | % | | | N/A | | | N/A | |
Global Value
Choice | | | 1.85 | % | | | 2.50 | % | | | 2.50 | % | | | 1.50 | % | | N/A | | N/A | | | 1.75 | % | | N/A | |
Emerging
Countries(1) | | | 2.25 | % | | | 2.90 | % | | | 2.90 | % | | | 1.75 | % | | | 2.65 | % | | N/A | | | 2.15 | % | | N/A | |
| Foreign(2) | | | 1.95 | % | | | 2.70 | % | | | 2.70 | % | | | 1.60 | % | | N/A | | N/A | | | 1.85 | % | | N/A | |
| Greater China | | | N/A | | | | N/A | | | | N/A | | | | N/A | | | N/A | | N/A | | | N/A | | | N/A | |
Index Plus
International
Equity | | | 1.15 | % | | | 1.90 | % | | | 1.90 | % | | | 0.90 | % | | N/A | | N/A | | | N/A | | | N/A | |
| International(3) | | | 2.75 | % | | | 3.50 | % | | | 3.50 | % | | | 2.50 | % | | N/A | | N/A | | | 2.75 | % | | N/A | |
International
Capital
Appreciation | | | 1.50 | % | | | 2.25 | % | | | 2.25 | % | | | 1.25 | % | | N/A | | N/A | | | N/A | | | N/A | |
International
Real Estate | | | 1.50 | % | | | 2.25 | % | | | 2.25 | % | | | 1.25 | % | | N/A | | N/A | | | N/A | | | N/A | |
International
SmallCap | | | 1.95 | % | | | 2.60 | % | | | 2.60 | % | | | 1.40 | % | | N/A | | N/A | | | 1.85 | % | | N/A | |
International
Value | | | N/A | | | | N/A | | | | N/A | | | | N/A | | | N/A | | N/A | | | N/A | | | N/A | |
| | | Class A | | Class B | | Class C | | Class I | | Class M | | Class O | | Class Q | | Class R | |
International
Value Choice | | | 1.70 | % | | | 2.45 | % | | | 2.45 | % | | | 1.45 | % | | N/A | | N/A | | N/A | | N/A | |
| Russia | | | 3.35 | % | | | N/A | | | | N/A | | | | N/A | | | N/A | | N/A | | N/A | | N/A | |
Emerging
Markets
Fixed Income | | | 1.25 | % | | | 2.00 | % | | | 2.00 | % | | | N/A | | | N/A | | N/A | | N/A | | N/A | |
| Global Bond | | | 0.90 | % | | | 1.65 | % | | | 1.65 | % | | | 0.61 | % | | N/A | | N/A | | N/A | | N/A | |
Diversified
International | | | 0.35 | % | | | 1.10 | % | | | 1.10 | % | | | 0.10 | % | | N/A | | N/A | | N/A | | | 0.60 | % | |
(1) Effective January 1, 2006, pursuant to a side agreement, ING Investments has lowered the expense limits for Emerging Countries through at least December 31, 2006. The expense limits for Emerging Countries are 2.10%, 2.85%, 2.85%, 2.60% and 2.10% for Class A, B, C, M and Q shares, respectively. If, after December 31, 2006, ING Investments elects not to renew the side agreement, the expense limits will revert to the limits listed in the table above. There is no guarantee that this side agreement will continue after that date. The side agreement will only renew if ING Investments elects to renew it. Any fees waived pursuant to the side agreement shall not be eligible for recoupment.
(2) Pursuant to a side agreement dated March 1, 2006, ING Investments has lowered the expense limits for Foreign through at least March 1, 2007. The expense limits for the Foreign are 1.70%, 2.45%, 2.45%, 1.35% and 1.60% for Class A, B, C, I and Q, respectively. If, after March 1, 2007, ING Investments elects not to renew the side agreement, the expense limits will revert to the limits listed in the table above. There is no guarantee that this side agreement will continue after that date. The side agreement will only renew if ING Investments elects to renew it.
(3) Pursuant to a side agreement dated March 1, 2006, ING Investments has lowered the expense limits for International through at least March 1, 2007. The expense limits for the International are 1.95%, 2.70%, 2.70%, 1.60% and 1.85% for Class A, B, C, I and Q, respectively. If, after March 1, 2007, ING Investments elects not to renew the side agreement, the expense limits will revert to the limits listed in the table above. There is no guarantee that this side agreement will continue after that date. The side agreement will only renew if ING Investments elects to renew it.
The Investment Adviser may at a later date recoup from a Fund management fees waived and other expenses assumed by the Investment Adviser during the previous 36 months, but only if, after such recoupment, a Fund's expense ratio does not exceed the percentage described above. Waived and reimbursed fees net of any recoupment by the Investment Adviser of such waived and reimbursed fees are reflected on the accompanying Statement of Operations for each Fund. Amounts payable by the Investment Adviser are reflected on the accompanying Statement of Assets and Liabilities for each Fund.
As of October 31, 2006, the amounts of waived or reimbursed fees that are subject to possible recoupment by the Investment Adviser, and the related expiration dates, are as follows:
| | | October 31, | | | |
| | | 2007 | | 2008 | | 2009 | | Total | |
| Global Value Choice | | $ | — | | | $ | 62,559 | | | $ | — | | | $ | 62,559 | | |
Index Plus
International Equity | | | — | | | | — | | | | 72,836 | | | | 72,836 | | |
International Capital
Appreciation | | | — | | | | — | | | | 93,974 | | | | 93,974 | | |
International
Real Estate | | | — | | | | — | | | | 119,550 | | | | 119,550 | | |
111
NOTES TO FINANCIAL STATEMENTS AS OF OCTOBER 31, 2006 (CONTINUED)
NOTE 9 — EXPENSE LIMITATIONS (continued)
| | | October 31, | | | |
| | | 2007 | | 2008 | | 2009 | | Total | |
International Value
Choice | | $ | — | | | $ | 74,545 | | | $ | 4,469 | | | $ | 79,014 | | |
Emerging Markets
Fixed Income | | | — | | | | — | | | | 111,594 | | | | 111,594 | | |
| Global Bond | | | — | | | | — | | | | 39,924 | | | | 39,924 | | |
Diversified
International | | | — | | | | — | | | | 372,357 | | | | 372,357 | | |
The expense limitation agreements are contractual and shall renew automatically for one-year terms unless ING Investments provides written notice of the termination of the expense limitation agreement within 90 days of the end of the then current term.
NOTE 10 — LINE OF CREDIT
All of the Funds included in this report, in addition to certain other funds managed by the Investment Adviser, have entered into an unsecured committed revolving line of credit agreement (the "Credit Agreement") with The Bank of New York for an aggregate amount of $125,000,000. The proceeds may be used only to: (1) temporarily finance the purchase and sale of securities; (2) finance the redemption of shares of an investor in the Funds; and (3) enable the Funds to meet other emergency expenses as defined in the Credit Agreement. The Funds to which the line of credit is available pay a commitment fee equal to 0.09% per annum on the daily unused portion of the committed line amount payable quarterly in arrears.
The following Funds utilized the line of credit during the year ended October 31, 2006:
| Fund | | Days
Utilized | | Approximate
Average Daily
Balance For
Days Utilized | | Approximate
Weighted
Average
Interest Rate
For Days
Utilized | |
| Global Natural Resources | | | 6 | | | $ | 4,711,667 | | | | 5.72 | % | |
| Global Value Choice | | | 14 | | | | 1,363,571 | | | | 5.69 | | |
| Foreign | | | 8 | | | | 681,250 | | | | 4.75 | | |
Index Plus International
Equity | | | 9 | | | | 980,000 | | | | 5.50 | | |
| International | | | 5 | | | | 1,740,000 | | | | 5.37 | | |
International Capital
Appreciation(1) | | | 1 | | | | 4,480,000 | | | | 5.77 | | |
| International SmallCap | | | 1 | | | | 5,590,000 | | | | 4.76 | | |
| International Value | | | 4 | | | | 22,755,000 | | | | 4.87 | | |
| Diversified International | | | 7 | | | | 1,128,571 | | | | 5.01 | | |
(1) At October 31, 2006, International Capital Appreciation had an outstanding balance of $4,480,000.
NOTE 11 — CAPITAL SHARES
| | | Class A | | Class B | | Class C | |
| | | Year
Ended
October 31,
2006 | | Year
Ended
October 31,
2005 | | Year
Ended
October 31,
2006 | | Year
Ended
October 31,
2005 | | Year
Ended
October 31,
2006 | | Year
Ended
October 31,
2005 | |
| Global Equity Dividend (Number of Shares) | |
| Shares sold | | | 3,804,463 | | | | 6,261,568 | | | | 980,380 | | | | 2,059,087 | | | | 1,792,162 | | | | 3,638,370 | | |
| Dividends reinvested | | | 163,319 | | | | 73,143 | | | | 68,137 | | | | 25,087 | | | | 96,575 | | | | 34,087 | | |
| Shares redeemed | | | (2,656,504 | ) | | | (1,646,562 | ) | | | (399,091 | ) | | | (142,758 | ) | | | (714,422 | ) | | | (208,449 | ) | |
| Net increase in shares outstanding | | | 1,311,278 | | | | 4,688,149 | | | | 649,426 | | | | 1,941,416 | | | | 1,174,315 | | | | 3,464,008 | | |
| Global Equity Dividend ($) | |
| Shares sold | | $ | 55,618,277 | | | $ | 81,890,229 | | | $ | 14,217,375 | | | $ | 26,849,839 | | | $ | 25,941,781 | | | $ | 47,352,114 | | |
| Dividends reinvested | | | 2,341,599 | | | | 950,413 | | | | 973,435 | | | | 325,721 | | | | 1,375,816 | | | | 440,961 | | |
| Shares redeemed | | | (37,587,681 | ) | | | (21,584,892 | ) | | | (5,809,722 | ) | | | (1,878,685 | ) | | | (10,300,752 | ) | | | (2,750,750 | ) | |
| Net increase | | $ | 20,372,195 | | | $ | 61,255,750 | | | $ | 9,381,088 | | | $ | 25,296,875 | | | $ | 17,016,845 | | | $ | 45,042,325 | | |
| | | Class A | | | | | |
| | | Year
Ended
October 31,
2006 | | Year
Ended
October 31,
2005 | | | | | | | | | |
| Global Natural Resources (Number of Shares) | |
| Shares sold | | | 2,142,869 | | | | 1,303,928 | | | | | | | | | | | | | | | | | | |
| Dividends reinvested | | | 18,990 | | | | 368,023 | | | | | | | | | | | | | | | | | | |
| Shares redeemed | | | (2,493,021 | ) | | | (2,702,207 | ) | | | | | | | | | | | | | | | | | |
| Net decrease in shares outstanding | | | (331,162 | ) | | | (1,030,256 | ) | | | | | | | | | | | | | | | | | |
| Global Natural Resources ($) | |
| Shares sold | | $ | 22,092,980 | | | $ | 8,755,764 | | | | | | | | | | | | | | | | | | |
| Dividends reinvested | | | 161,561 | | | | 2,642,230 | | | | | | | | | | | | | | | | | | |
| Shares redeemed | | | (25,464,330 | ) | | | (17,774,785 | ) | | | | | | | | | | | | | | | | | |
| Net decrease | | $ | (3,209,789 | ) | | $ | (6,376,791 | ) | | | | | | | | | | | | | | | | | |
112
NOTES TO FINANCIAL STATEMENTS AS OF OCTOBER 31, 2006 (CONTINUED)
NOTE 11 — CAPITAL SHARES (continued)
| | | Class A | | Class B | | Class C | |
| | | Year
Ended
October 31,
2006 | | Year
Ended
October 31,
2005 | | Year
Ended
October 31,
2006 | | Year
Ended
October 31,
2005 | | Year
Ended
October 31,
2006 | | Year
Ended
October 31,
2005 | |
| Global Real Estate (Number of Shares) | |
| Shares sold | | | 14,446,150 | | | | 3,934,092 | | | | 958,288 | | | | 555,131 | | | | 4,044,423 | | | | 1,428,969 | | |
| Dividends reinvested | | | 599,957 | | | | 464,771 | | | | 63,626 | | | | 31,215 | | | | 112,442 | | | | 41,618 | | |
| Shares redeemed | | | (2,090,498 | ) | | | (2,535,905 | ) | | | (191,662 | ) | | | (113,195 | ) | | | (512,505 | ) | | | (232,975 | ) | |
| Net increase in shares outstanding | | | 12,955,609 | | | | 1,862,958 | | | | 830,252 | | | | 473,151 | | | | 3,644,360 | | | | 1,237,612 | | |
| Global Real Estate ($) | |
| Shares sold | | $ | 287,936,127 | | | $ | 64,903,422 | | | $ | 16,479,220 | | | $ | 7,963,178 | | | $ | 72,912,712 | | | $ | 21,436,748 | | |
| Dividends reinvested | | | 10,752,914 | | | | 7,259,137 | | | | 973,780 | | | | 429,581 | | | | 1,815,573 | | | | 597,354 | | |
| Shares redeemed | | | (40,748,408 | ) | | | (40,814,853 | ) | | | (3,240,748 | ) | | | (1,640,044 | ) | | | (8,989,662 | ) | | | (3,564,647 | ) | |
| Net increase | | $ | 257,940,633 | | | $ | 31,347,706 | | | $ | 14,212,252 | | | $ | 6,752,715 | | | $ | 65,738,623 | | | $ | 18,469,455 | | |
| | | Class I | | | | | |
| | | Year
Ended
October 31,
2006 | | Year
Ended
October 31,
2005 | | | | | | | | | |
| Global Real Estate (Number of Shares) | |
| Shares sold | | | 503,082 | | | | 98,101 | | | | | | | | | | | | | | | | | | |
| Dividends reinvested | | | 3,220 | | | | — | | | | | | | | | | | | | | | | | | |
| Shares redeemed | | | (99,415 | ) | | | — | | | | | | | | | | | | | | | | | | |
| Net increase in shares outstanding | | | 406,887 | | | | 98,101 | | | | | | | | | | | | | | | | | | |
| Global Real Estate ($) | |
| Shares sold | | $ | 9,644,455 | | | $ | 1,600,930 | | | | | | | | | | | | | | | | | | |
| Dividends reinvested | | | 65,390 | | | | — | | | | | | | | | | | | | | | | | | |
| Shares redeemed | | | (1,901,796 | ) | | | — | | | | | | | | | | | | | | | | | | |
| Net increase | | $ | 7,808,049 | | | $ | 1,600,930 | | | | | | | | | | | | | | | | | | |
| | | Class A | | Class B | | Class C | |
| | | Year
Ended
October 31,
2006 | | Year
Ended
October 31,
2005 | | Year
Ended
October 31,
2006 | | Year
Ended
October 31,
2005 | | Year
Ended
October 31,
2006 | | Year
Ended
October 31,
2005 | |
| Global Value Choice (Number of Shares) | |
| Shares sold | | | 681,706 | | | | 516,545 | | | | 92,289 | | | | 101,943 | | | | 133,353 | | | | 150,930 | | |
| Dividends reinvested | | | 9,174 | | | | — | | | | — | | | | — | | | | 901 | | | | — | | |
| Shares redeemed | | | (822,178 | ) | | | (1,098,757 | ) | | | (378,702 | ) | | | (550,241 | ) | | | (390,058 | ) | | | (696,774 | ) | |
| Net decrease in shares outstanding | | | (131,298 | ) | | | (582,212 | ) | | | (286,413 | ) | | | (448,298 | ) | | | (255,804 | ) | | | (545,844 | ) | |
| Global Value Choice ($) | |
| Shares sold | | $ | 13,807,227 | | | $ | 8,997,761 | | | $ | 2,050,988 | | | $ | 1,939,488 | | | $ | 2,605,554 | | | $ | 2,547,625 | | |
| Dividends reinvested | | | 177,004 | | | | — | | | | — | | | | — | | | | 16,685 | | | | — | | |
| Shares redeemed | | | (16,601,505 | ) | | | (19,124,741 | ) | | | (8,338,011 | ) | | | (10,345,519 | ) | | | (7,611,834 | ) | | | (11,682,829 | ) | |
| Net decrease | | $ | (2,617,274 | ) | | $ | (10,126,980 | ) | | $ | (6,287,023 | ) | | $ | (8,406,031 | ) | | $ | (4,989,595 | ) | | $ | (9,135,204 | ) | |
| | | Class I | | Class Q | |
| | | September 6,
2006(1) to
October 31,
2006 | | Year
Ended
October 31,
2006 | | Year
Ended
October 31,
2005 | |
| Global Value Choice (Number of Shares) | |
| Shares sold | | | 139,822 | | | | 58,539 | | | | 78,062 | | |
| Dividends reinvested | | | — | | | | 1,706 | | | | — | | |
| Shares redeemed | | | (1,325 | ) | | | (158,326 | ) | | | (98,578 | ) | |
| Net increase (decrease) in shares outstanding | | | 138,497 | | | | (98,081 | ) | | | (20,516 | ) | |
| Global Value Choice ($) | |
| Shares sold | | $ | 2,977,626 | | | $ | 1,385,145 | | | $ | 1,573,859 | | |
| Dividends reinvested | | | — | | | | 38,450 | | | | — | | |
| Shares redeemed | | | (27,524 | ) | | | (3,883,858 | ) | | | (1,971,194 | ) | |
| Net increase (decrease) | | $ | 2,950,102 | | | $ | (2,460,263 | ) | | $ | (397,335 | ) | |
(1) Commencement of operations.
113
NOTES TO FINANCIAL STATEMENTS AS OF OCTOBER 31, 2006 (CONTINUED)
NOTE 11 — CAPITAL SHARES (continued)
| | | Class A | | Class B | | Class C | |
| | | Year
Ended
October 31,
2006 | | Year
Ended
October 31,
2005 | | Year
Ended
October 31,
2006 | | Year
Ended
October 31,
2005 | | Year
Ended
October 31,
2006 | | Year
Ended
October 31,
2005 | |
| Emerging Countries (Number of Shares) | |
| Shares sold | | | 1,554,745 | | | | 1,264,116 | | | | 158,904 | | | | 171,033 | | | | 650,919 | | | | 575,933 | | |
| Dividends reinvested | | | 17,399 | | | | 2,583 | | | | — | | | | — | | | | 2,002 | | | | — | | |
| Shares redeemed | | | (1,105,391 | ) | | | (1,042,704 | ) | | | (233,526 | ) | | | (285,210 | ) | | | (302,871 | ) | | | (154,421 | ) | |
| Net increase (decrease) in shares outstanding | | | 466,753 | | | | 223,995 | | | | (74,622 | ) | | | (114,177 | ) | | | 350,050 | | | | 421,512 | | |
| Emerging Countries ($) | |
| Shares sold | | $ | 42,544,352 | | | $ | 28,706,819 | | | $ | 4,284,432 | | | $ | 3,787,933 | | | $ | 16,487,366 | | | $ | 12,439,033 | | |
| Dividends reinvested | | | 440,876 | | | | 53,415 | | | | — | | | | — | | | | 47,440 | | | | — | | |
| Shares redeemed | | | (30,177,710 | ) | | | (22,759,798 | ) | | | (6,263,528 | ) | | | (6,281,049 | ) | | | (7,797,300 | ) | | | (3,238,715 | ) | |
| Net increase (decrease) | | $ | 12,807,518 | | | $ | 6,000,436 | | | $ | (1,979,096 | ) | | $ | (2,493,116 | ) | | $ | 8,737,506 | | | $ | 9,200,318 | | |
| | | Class I | | Class M | | Class Q | |
| | | December 21,
2005(1) to
October 31,
2006 | | Year
Ended
October 31,
2006 | | Year
Ended
October 31,
2005 | | Year
Ended
October 31,
2006 | | Year
Ended
October 31,
2005 | |
| Emerging Countries (Number of Shares) | |
| Shares sold | | | 1,259,659 | | | | 2,691 | | | | 3,080 | | | | 203,459 | | | | 197,600 | | |
| Dividends reinvested | | | — | | | | 46 | | | | — | | | | 2,644 | | | | 579 | | |
| Shares redeemed | | | (470,530 | ) | | | (4,694 | ) | | | (9,604 | ) | | | (298,675 | ) | | | (202,059 | ) | |
| Net increase (decrease) in shares outstanding | | | 789,129 | | | | (1,957 | ) | | | (6,524 | ) | | | (92,572 | ) | | | (3,880 | ) | |
| Emerging Countries ($) | |
| Shares sold | | $ | 35,774,589 | | | $ | 75,928 | | | $ | 67,841 | | | $ | 5,761,374 | | | $ | 4,569,365 | | |
| Dividends reinvested | | | — | | | | 1,146 | | | | — | | | | 69,164 | | | | 12,349 | | |
| Shares redeemed | | | (12,692,384 | ) | | | (130,478 | ) | | | (209,918 | ) | | | (8,528,955 | ) | | | (4,620,780 | ) | |
| Net increase (decrease) | | $ | 23,082,205 | | | $ | (53,404 | ) | | $ | (142,077 | ) | | $ | (2,698,417 | ) | | $ | (39,066 | ) | |
| | | Class A | | Class B | | Class C | |
| | | Year
Ended
October 31,
2006 | | Year
Ended
October 31,
2005 | | Year
Ended
October 31,
2006 | | Year
Ended
October 31,
2005 | | Year
Ended
October 31,
2006 | | Year
Ended
October 31,
2005 | |
| Foreign (Number of Shares) | |
| Shares sold | | | 5,804,035 | | | | 5,350,389 | | | | 859,893 | | | | 864,486 | | | | 3,422,194 | | | | 3,258,501 | | |
| Dividends reinvested | | | 134,508 | | | | — | | | | 27,967 | | | | — | | | | 93,622 | | | | — | | |
| Shares redeemed | | | (2,401,362 | ) | | | (2,127,775 | ) | | | (359,114 | ) | | | (205,551 | ) | | | (1,050,690 | ) | | | (598,703 | ) | |
| Net increase in shares outstanding | | | 3,537,181 | | | | 3,222,614 | | | | 528,746 | | | | 658,935 | | | | 2,465,126 | | | | 2,659,798 | | |
| Foreign ($) | |
| Shares sold | | $ | 98,299,748 | | | $ | 74,069,872 | | | $ | 14,233,385 | | | $ | 11,879,135 | | | $ | 56,926,173 | | | $ | 44,999,926 | | |
| Dividends reinvested | | | 2,082,190 | | | | — | | | | 425,093 | | | | — | | | | 1,424,923 | | | | — | | |
| Shares redeemed | | | (40,561,430 | ) | | | (29,478,835 | ) | | | (6,018,453 | ) | | | (2,815,133 | ) | | | (17,589,538 | ) | | | (8,239,806 | ) | |
| Net increase | | $ | 59,820,508 | | | $ | 44,591,037 | | | $ | 8,640,025 | | | $ | 9,064,002 | | | $ | 40,761,558 | | | $ | 36,760,120 | | |
(1) Commencement of operations.
114
NOTES TO FINANCIAL STATEMENTS AS OF OCTOBER 31, 2006 (CONTINUED)
NOTE 11 — CAPITAL SHARES (continued)
| | | Class I | | Class Q | |
| | | Year
Ended
October 31,
2006 | | Year
Ended
October 31,
2005 | | Year
Ended
October 31,
2006 | | Year
Ended
October 31,
2005 | |
| Foreign (Number of Shares) | |
| Shares sold | | | 3,238,230 | | | | 1,482 | | | | — | | | | 1,009 | | |
| Dividends reinvested | | | 1,630 | | | | — | | | | 1,680 | | | | — | | |
| Shares redeemed | | | (48,706 | ) | | | (135,704 | ) | | | (10,236 | ) | | | (13,187 | ) | |
| Net increase (decrease) in shares outstanding | | | 3,191,154 | | | | (134,222 | ) | | | (8,556 | ) | | | (12,178 | ) | |
| Foreign ($) | |
| Shares sold | | $ | 56,439,802 | | | $ | 20,576 | | | $ | — | | | $ | 13,738 | | |
| Dividends reinvested | | | 25,483 | | | | — | | | | 26,071 | | | | — | | |
| Shares redeemed | | | (883,854 | ) | | | (1,983,638 | ) | | | (174,891 | ) | | | (194,215 | ) | |
| Net increase (decrease) | | $ | 55,581,431 | | | $ | (1,963,062 | ) | | $ | (148,820 | ) | | $ | (180,477 | ) | |
| | | Class A | | Class B | | Class C | | Class I | |
| | | December 21,
2005(1) to
October 31,
2006 | | January 6,
2006(1) to
October 31,
2006 | | January 11,
2006(1) to
October 31,
2006 | | May 8,
2006(1) to
October 31,
2006 | |
| Greater China (Number of Shares) | |
| Shares sold | | | 2,060,629 | | | | 173,344 | | | | 175,293 | | | | 1,771 | | |
| Shares redeemed | | | (162,486 | ) | | | (15,849 | ) | | | (4,406 | ) | | | — | | |
| Net increase in shares outstanding | | | 1,898,143 | | | | 157,495 | | | | 170,887 | | | | 1,771 | | |
| Greater China ($) | |
| Shares sold | | $ | 22,315,810 | | | $ | 2,005,078 | | | $ | 2,052,770 | | | $ | 20,682 | | |
| Shares redeemed | | | (1,889,215 | ) | | | (183,820 | ) | | | (49,651 | ) | | | — | | |
| Net increase | | $ | 20,426,595 | | | $ | 1,821,258 | | | $ | 2,003,119 | | | $ | 20,682 | | |
| | | Class A | | Class B | | Class C | | Class I | |
| | | December 21,
2005(1) to
October 31,
2006 | | January 12,
2006(1) to
October 31,
2006 | | January 12,
2006(1) to
October 31,
2006 | | December 21,
2005(1) to
October 31,
2006 | |
Index Plus International Equity
(Number of Shares) | |
| Shares sold | | | 1,593,260 | | | | 23,222 | | | | 47,884 | | | | 6,879,841 | | |
| Shares redeemed | | | (522,199 | ) | | | (495 | ) | | | (1,878 | ) | | | (162,917 | ) | |
| Net increase in shares outstanding | | | 1,071,061 | | | | 22,727 | | | | 46,006 | | | | 6,716,924 | | |
| Index Plus International Equity ($) | |
| Shares sold | | $ | 16,004,839 | | | $ | 250,885 | | | $ | 512,540 | | | $ | 74,436,693 | | |
| Shares redeemed | | | (5,896,965 | ) | | | (5,729 | ) | | | (21,900 | ) | | | (1,770,309 | ) | |
| Net increase | | $ | 10,107,874 | | | $ | 245,156 | | | $ | 490,640 | | | $ | 72,666,384 | | |
(1) Commencement of operations.
115
NOTES TO FINANCIAL STATEMENTS AS OF OCTOBER 31, 2006 (CONTINUED)
NOTE 11 — CAPITAL SHARES (continued)
| | | Class A | | Class B | | Class C | |
| | | Year
Ended
October 31,
2006 | | Year
Ended
October 31,
2005 | | Year
Ended
October 31,
2006 | | Year
Ended
October 31,
2005 | | Year
Ended
October 31,
2006 | | Year
Ended
October 31,
2005 | |
| International (Number of Shares) | |
| Shares sold | | | 1,130,290 | | | | 1,286,982 | | | | 222,011 | | | | 398,615 | | | | 125,967 | | | | 158,046 | | |
| Dividends reinvested | | | 65,163 | | | | 45,507 | | | | 9,571 | | �� | | 6,257 | | | | 5,646 | | | | 3,911 | | |
| Shares redeemed | | | (1,417,023 | ) | | | (1,528,096 | ) | | | (454,724 | ) | | | (454,549 | ) | | | (300,691 | ) | | | (461,767 | ) | |
| Net decrease in shares outstanding | | | (221,570 | ) | | | (195,607 | ) | | | (223,142 | ) | | | (49,677 | ) | | | (169,078 | ) | | | (299,810 | ) | |
| International ($) | |
| Shares sold | | $ | 13,974,139 | | | $ | 13,471,465 | | | $ | 2,619,810 | | | $ | 4,018,737 | | | $ | 1,518,241 | | | $ | 1,592,528 | | |
| Dividends reinvested | | | 754,581 | | | | 464,320 | | | | 107,204 | | | | 61,882 | | | | 63,297 | | | | 38,715 | | |
| Redemption fee proceeds | | | 257 | | | | 12,635 | | | | — | | | | — | | | | — | | | | — | | |
| Shares redeemed | | | (17,628,847 | ) | | | (15,999,726 | ) | | | (5,368,489 | ) | | | (4,604,837 | ) | | | (3,586,904 | ) | | | (4,666,612 | ) | |
| Net decrease | | $ | (2,899,870 | ) | | $ | (2,051,306 | ) | | $ | (2,641,475 | ) | | $ | (524,218 | ) | | $ | (2,005,366 | ) | | $ | (3,035,369 | ) | |
| | | Class I | | Class Q | |
| | | Year
Ended
October 31,
2006 | | Year
Ended
October 31,
2005 | | Year
Ended
October 31,
2006 | | Year
Ended
October 31,
2005 | |
| International (Number of Shares) | |
| Shares sold | | | 413,947 | | | | 618,736 | | | | 1,426,062 | | | | 832,726 | | |
| Dividends reinvested | | | 41,301 | | | | 26,513 | | | | 24,539 | | | | 9,243 | | |
| Shares redeemed | | | (1,585,422 | ) | | | (264,569 | ) | | | (716,043 | ) | | | (255,015 | ) | |
| Net increase (decrease) in shares outstanding | | | (1,130,174 | ) | | | 380,680 | | | | 734,558 | | | | 586,954 | | |
| International ($) | |
| Shares sold | | $ | 5,055,453 | | | $ | 6,503,305 | | | $ | 17,444,379 | | | $ | 8,731,410 | | |
| Dividends reinvested | | | 475,409 | | | | 268,842 | | | | 281,487 | | | | 93,629 | | |
| Shares redeemed | | | (18,368,063 | ) | | | (2,749,364 | ) | | | (8,750,007 | ) | | | (2,652,163 | ) | |
| Net increase (decrease) | | $ | (12,837,201 | ) | | $ | 4,022,783 | | | $ | 8,975,859 | | | $ | 6,172,876 | | |
| | | Class A | | Class B | | Class C | | Class I | |
| | | December 21,
2005(1) to
October 31,
2006 | | January 9,
2006(1) to
October 31,
2006 | | January 24,
2006(1) to
October 31,
2006 | | December 21,
2005(1) to
October 31,
2006 | |
International Capital Appreciation
(Number of Shares) | |
| Shares sold | | | 635,018 | | | | 6,175 | | | | 12,621 | | | | 4,893,411 | | |
| Shares redeemed | | | (312,161 | ) | | | (378 | ) | | | (6,848 | ) | | | (762,409 | ) | |
| Net increase in shares outstanding | | | 322,857 | | | | 5,797 | | | | 5,773 | | | | 4,131,002 | | |
| International Capital Appreciation ($) | |
| Shares sold | | $ | 6,494,040 | | | $ | 65,827 | | | $ | 136,078 | | | $ | 51,868,418 | | |
| Shares redeemed | | | (3,430,448 | ) | | | (3,952 | ) | | | (77,684 | ) | | | (8,729,175 | ) | |
| Net increase | | $ | 3,063,592 | | | $ | 61,875 | | | $ | 58,394 | | | $ | 43,139,243 | | |
(1) Commencement of operations.
116
NOTES TO FINANCIAL STATEMENTS AS OF OCTOBER 31, 2006 (CONTINUED)
NOTE 11 — CAPITAL SHARES (continued)
| | | Class A | | Class B | | Class C | | Class I | |
| | | February 28,
2006(1) to
October 31,
2006 | | February 28,
2006(1) to
October 31,
2006 | | February 28,
2006(1) to
October 31,
2006 | | February 28,
2006(1) to
October 31,
2006 | |
| International Real Estate (Number of Shares) | |
| Shares sold | | | 4,696,588 | | | | 142,380 | | | | 1,486,965 | | | | 2,253,191 | | |
| Dividends reinvested | | | 2,698 | | | | 65 | | | | 697 | | | | 2,409 | | |
| Shares redeemed | | | (415,752 | ) | | | (1,115 | ) | | | (14,206 | ) | | | (336,086 | ) | |
| Net increase in shares outstanding | | | 4,283,534 | | | | 141,330 | | | | 1,473,456 | | | | 1,919,514 | | |
| International Real Estate ($) | |
| Shares sold | | $ | 50,099,143 | | | $ | 1,531,684 | | | $ | 15,819,755 | | | $ | 24,710,500 | | |
| Dividends reinvested | | | 28,565 | | | | 667 | | | | 7,117 | | | | 26,281 | | |
| Shares redeemed | | | (4,560,851 | ) | | | (11,288 | ) | | | (149,297 | ) | | | (3,870,805 | ) | |
| Net increase | | $ | 45,566,857 | | | $ | 1,521,063 | | | $ | 15,677,575 | | | $ | 20,865,976 | | |
| | | Class A | | Class B | | Class C | |
| | | Year
Ended
October 31,
2006 | | Year
Ended
October 31,
2005 | | Year
Ended
October 31,
2006 | | Year
Ended
October 31,
2005 | | Year
Ended
October 31,
2006 | | Year
Ended
October 31,
2005 | |
| International Small Cap (Number of Shares) | |
| Shares sold | | | 2,618,183 | | | | 2,004,704 | | | | 153,065 | | | | 224,730 | | | | 305,463 | | | | 190,803 | | |
| Dividends reinvested | | | 28,203 | | | | — | | | | 1,067 | | | | — | | | | 3,317 | | | | — | | |
| Shares redeemed | | | (2,091,324 | ) | | | (2,690,302 | ) | | | (420,654 | ) | | | (678,220 | ) | | | (305,228 | ) | | | (438,858 | ) | |
| Net increase (decrease) in shares outstanding | | | 555,062 | | | | (685,598 | ) | | | (266,522 | ) | | | (453,490 | ) | | | 3,552 | | | | (248,055 | ) | |
| International Small Cap ($) | |
| Shares sold | | $ | 115,137,984 | | | $ | 69,514,851 | | | $ | 6,805,314 | | | $ | 7,909,327 | | | $ | 12,733,141 | | | $ | 6,229,347 | | |
| Dividends reinvested | | | 1,143,069 | | | | — | | | | 44,742 | | | | — | | | | 127,269 | | | | — | | |
| Shares redeemed | | | (91,030,509 | ) | | | (92,289,760 | ) | | | (19,055,708 | ) | | | (23,667,520 | ) | | | (12,614,364 | ) | | | (14,015,886 | ) | |
| Net increase (decrease) | | $ | 25,250,544 | | | $ | (22,774,909 | ) | | $ | (12,205,652 | ) | | $ | (15,758,193 | ) | | $ | 246,046 | | | $ | (7,786,539 | ) | |
| | | Class I | | Class Q | |
| | | December 21,
2005(1) to
October 31,
2006 | | Year
Ended
October 31,
2006 | | Year
Ended
October 31,
2005 | |
| International Small Cap (Number of Shares) | |
| Shares sold | | | 3,311,088 | | | | 618,175 | | | | 268,648 | | |
| Dividends reinvested | | | — | | | | 12,988 | | | | — | | |
| Shares redeemed | | | (413,715 | ) | | | (434,452 | ) | | | (793,003 | ) | |
| Net increase (decrease) in shares outstanding | | | 2,897,373 | | | | 196,711 | | | | (524,355 | ) | |
| International Small Cap ($) | |
| Shares sold | | $ | 146,345,932 | | | $ | 28,725,725 | | | $ | 9,711,770 | | |
| Dividends reinvested | | | — | | | | 564,597 | | | | — | | |
| Shares redeemed | | | (18,478,631 | ) | | | (20,330,336 | ) | | | (28,611,080 | ) | |
| Net increase (decrease) | | $ | 127,867,301 | | | $ | 8,959,986 | | | $ | (18,899,310 | ) | |
(1) Commencement of operations.
117
NOTES TO FINANCIAL STATEMENTS AS OF OCTOBER 31, 2006 (CONTINUED)
NOTE 11 — CAPITAL SHARES (continued)
| | | Class A | | Class B | | Class C | |
| | | Year
Ended
October 31,
2006 | | Year
Ended
October 31,
2005 | | Year
Ended
October 31,
2006 | | Year
Ended
October 31,
2005 | | Year
Ended
October 31,
2006 | | Year
Ended
October 31,
2005 | |
| International Value (Number of Shares) | |
| Shares sold | | | 17,704,351 | | | | 22,440,717 | | | | 723,662 | | | | 733,853 | | | | 696,527 | | | | 579,699 | | |
| Dividends reinvested | | | 6,154,438 | | | | 4,658,879 | | | | 1,288,590 | | | | 1,078,233 | | | | 2,160,993 | | | | 1,619,582 | | |
| Shares redeemed | | | (25,674,523 | ) | | | (43,203,094 | ) | | | (7,398,801 | ) | | | (6,355,256 | ) | | | (5,174,229 | ) | | | (5,949,587 | ) | |
| Net decrease in shares outstanding | | | (1,815,734 | ) | | | (16,103,498 | ) | | | (5,386,549 | ) | | | (4,543,170 | ) | | | (2,316,709 | ) | | | (3,750,306 | ) | |
| International Value ($) | |
| Shares sold | | $ | 345,076,004 | | | $ | 389,616,539 | | | $ | 13,483,084 | | | $ | 12,423,736 | | | $ | 12,393,004 | | | $ | 9,661,315 | | |
| Dividends reinvested | | | 110,779,870 | | | | 78,640,245 | | | | 22,846,698 | | | | 17,941,796 | | | | 38,163,141 | | | | 26,885,154 | | |
| Shares redeemed | | | (504,762,828 | ) | | | (748,947,369 | ) | | | (142,311,210 | ) | | | (109,082,787 | ) | | | (98,746,989 | ) | | | (101,804,139 | ) | |
| Net decrease | | $ | (48,906,954 | ) | | $ | (280,690,585 | ) | | $ | (105,981,428 | ) | | $ | (78,717,255 | ) | | $ | (48,190,844 | ) | | $ | (65,257,670 | ) | |
| | | Class I | | Class Q | |
| | | Year
Ended
October 31,
2006 | | Year
Ended
October 31,
2005 | | Year
Ended
October 31,
2006 | | Year
Ended
October 31,
2005 | |
| International Value (Number of Shares) | |
| Shares sold | | | 23,235,247 | | | | 27,489,973 | | | | 22,383 | | | | 27,155 | | |
| Dividends reinvested | | | 4,027,145 | | | | 2,611,199 | | | | 92,721 | | | | 69,842 | | |
| Shares redeemed | | | (13,614,582 | ) | | | (12,662,805 | ) | | | (415,890 | ) | | | (276,510 | ) | |
| Net increase (decrease) in shares outstanding | | | 13,647,810 | | | | 17,438,367 | | | | (300,786 | ) | | | (179,513 | ) | |
| International Value ($) | |
| Shares sold | | $ | 456,863,861 | | | $ | 476,140,222 | | | $ | 432,031 | | | $ | 474,053 | | |
| Dividends reinvested | | | 72,448,346 | | | | 44,050,433 | | | | 1,670,826 | | | | 1,179,631 | | |
| Shares redeemed | | | (268,395,382 | ) | | | (220,723,705 | ) | | | (8,027,999 | ) | | | (4,799,264 | ) | |
| Net increase (decrease) | | $ | 260,916,825 | | | $ | 299,466,950 | | | $ | (5,925,142 | ) | | $ | (3,145,580 | ) | |
| | | Class A | | Class B | |
| | | Year
Ended
October 31,
2006 | | February 1,
2005(1) to
October 31,
2005 | | Year
Ended
October 31,
2006 | | February 1,
2005(1) to
October 31,
2005 | |
| International Value Choice (Number of Shares) | |
| Shares sold | | | 1,260,518 | | | | 651,176 | | | | 204,077 | | | | 143,012 | | |
| Dividends reinvested | | | 9,873 | | | | — | | | | 2,909 | | | | — | | |
| Shares redeemed | | | (394,876 | ) | | | (79,948 | ) | | | (50,448 | ) | | | (8,938 | ) | |
| Net increase in shares outstanding | | | 875,515 | | | | 571,228 | | | | 156,538 | | | | 134,074 | | |
| International Value Choice ($) | |
| Shares sold | | $ | 14,712,291 | | | $ | 6,637,390 | | | $ | 2,359,933 | | | $ | 1,456,873 | | |
| Dividends reinvested | | | 109,590 | | | | — | | | | 32,117 | | | | — | | |
| Shares redeemed | | | (4,737,083 | ) | | | (845,622 | ) | | | (590,545 | ) | | | (90,130 | ) | |
| Net increase | | $ | 10,084,798 | | | $ | 5,791,768 | | | $ | 1,801,505 | | | $ | 1,366,743 | | |
(1) Commencement of operations.
118
NOTES TO FINANCIAL STATEMENTS AS OF OCTOBER 31, 2006 (CONTINUED)
NOTE 11 — CAPITAL SHARES (continued)
| | | Class C | | Class I | |
| | | Year
Ended
October 31,
2006 | | February 4,
2005(1) to
October 31,
2005 | | December 21,
2005(1) to
October 31,
2006 | |
| International Value Choice (Number of Shares) | |
| Shares sold | | | 216,216 | | | | 175,350 | | | | 3,307,214 | | |
| Dividends reinvested | | | 3,130 | | | | — | | | | — | | |
| Shares redeemed | | | (47,102 | ) | | | (6,834 | ) | | | (337,472 | ) | |
| Net increase in shares outstanding | | | 172,244 | | | | 168,516 | | | | 2,969,742 | | |
| International Value Choice ($) | |
| Shares sold | | $ | 2,519,790 | | | $ | 1,796,255 | | | $ | 39,229,047 | | |
| Dividends reinvested | | | 34,613 | | | | — | | | | — | | |
| Shares redeemed | | | (550,017 | ) | | | (69,825 | ) | | | (4,156,509 | ) | |
| Net increase | | $ | 2,004,386 | | | $ | 1,726,430 | | | $ | 35,072,538 | | |
| | | Class A | |
| | | Year
Ended
October 31,
2006 | | Year
Ended
October 31,
2005 | |
| Russia (Number of Shares) | |
| Shares sold | | | 10,885,015 | | | | 3,240,434 | | |
| Dividends reinvested | | | — | | | | 3,801 | | |
| Shares redeemed | | | (5,521,528 | ) | | | (3,616,898 | ) | |
| Net increase (decrease) in shares outstanding | | | 5,363,487 | | | | (372,663 | ) | |
| Russia ($) | |
| Shares sold | | $ | 528,911,241 | | | $ | 93,862,631 | | |
| Dividends reinvested | | | — | | | | 96,494 | | |
| Redemption fee proceeds | | | 2,984,157 | | | | 850,706 | | |
| Shares redeemed | | | (268,475,876 | ) | | | (96,537,671 | ) | |
| Net increase (decrease) | | $ | 263,419,522 | | | $ | (1,727,840 | ) | |
| | | Class A | | Class B | | Class C | | Class I | |
| | | December 21,
2005(1) to
October 31,
2006 | | January 4,
2006(1) to
October 31,
2006 | | March 1,
2006(1) to
October 31,
2006 | | February 7,
2006(1) to
October 31,
2006 | |
| Emerging Markets Fixed (Number of Shares) | |
| Shares sold | | | 2,546,831 | | | | 28,060 | | | | 32,643 | | | | 1,225 | | |
| Dividends reinvested | | | 1,763 | | | | 356 | | | | 792 | | | | 51 | | |
| Shares redeemed | | | (18,897 | ) | | | 34 | | | | — | | | | (1,276 | ) | |
| Net increase in shares outstanding | | | 2,529,697 | | | | 28,450 | | | | 33,435 | | | | — | | |
| Emerging Markets Fixed ($) | |
| Shares sold | | $ | 25,848,505 | | | $ | 284,262 | | | $ | 329,390 | | | $ | 12,373 | | |
| Dividends reinvested | | | 17,545 | | | | 3,546 | | | | 7,863 | | | | 513 | | |
| Shares redeemed | | | (190,292 | ) | | | 349 | | | | — | | | | (12,886 | ) | |
| Net increase | | $ | 25,675,758 | | | $ | 288,157 | | | $ | 337,253 | | | $ | — | | |
| | | Class A | | Class B | | Class C | | Class I | |
| | | June 30,
2006(1) to
October 31,
2006 | | June 30,
2006(1) to
October 31,
2006 | | June 30,
2006(1) to
October 31,
2006 | | June 30,
2006(1) to
October 31,
2006 | |
| Global Bond (Number of Shares) | |
| Shares sold | | | 2,515,893 | | | | 2,713 | | | | 3,467 | | | | 101 | | |
| Net increase in shares outstanding | | | 2,515,893 | | | | 2,713 | | | | 3,467 | | | | 101 | | |
| Global Bond ($) | |
| Shares sold | | $ | 25,161,326 | | | $ | 27,335 | | | $ | 35,076 | | | $ | 1,010 | | |
| Net increase | | $ | 25,161,326 | | | $ | 27,335 | | | $ | 35,076 | | | $ | 1,010 | | |
(1) Commencement of operations.
119
NOTES TO FINANCIAL STATEMENTS AS OF OCTOBER 31, 2006 (CONTINUED)
NOTE 11 — CAPITAL SHARES (continued)
| | | Class A | | Class B | | Class C | | Class I | |
| | | December 21,
2005(1) to
October 31,
2006 | | December 21,
2005(1) to
October 31,
2006 | | December 21,
2005(1) to
October 31,
2006 | | December 21,
2005(1) to
October 31,
2006 | |
| Diversified International (Number of Shares) | |
| Shares sold | | | 15,920,455 | | | | 2,066,270 | | | | 6,338,569 | | | | 486 | | |
| Shares redeemed | | | (1,271,043 | ) | | | (70,627 | ) | | | (287,804 | ) | | | (100 | ) | |
| Net increase in shares outstanding | | | 14,649,412 | | | | 1,995,643 | | | | 6,050,765 | | | | 386 | | |
| Diversified International ($) | |
| Shares sold | | $ | 173,676,549 | | | $ | 22,435,250 | | | $ | 68,740,074 | | | $ | 5,534 | | |
| Shares redeemed | | | (13,776,784 | ) | | | (779,687 | ) | | | (3,120,028 | ) | | | (1,163 | ) | |
| Net increase | | $ | 159,899,765 | | | $ | 21,655,563 | | | $ | 65,620,046 | | | $ | 4,371 | | |
(1) Commencement of operations.
NOTE 12 — ILLIQUID SECURITIES
Pursuant to guidelines adopted by the Funds' Board, the following securities have been deemed to be illiquid. The Funds currently limit investments in illiquid securities to 15% of a Fund's net assets, at market value, at time of purchase.
| Fund | | Security | | Shares | | Initial
Acquisition
Date | | Cost | | Value | | Percent
of Net
Assets | |
Global Natural
Resources | | Arena Resources, Inc. | | | 40,953 | | | 10/09/06 | | $ | 1,399,559 | | | $ | 1,462,841 | | | | 1.2 | % | |
| | | PetroHawk Energy Corp. | | | 53,598 | | | 10/09/06 | | | 564,174 | | | | 607,265 | | | | 0.5 | % | |
| | | | | | | | | | | $ | 1,963,733 | | | $ | 2,070,106 | | | | 1.7 | % | |
| Foreign | | Bulgaria Compensation Notes | | | 60,720 | | | 04/06/05 | | $ | 27,710 | | | $ | 24,607 | | | | 0.0 | % | |
| | | Bulgaria Housing Compensation Notes | | | 25,950 | | | 04/06/05 | | | 12,145 | | | | 10,669 | | | | 0.0 | % | |
| | | Bulgaria Registered Comp Vouchers | | | 117,641 | | | 04/05/05 | | | 53,276 | | | | 47,291 | | | | 0.0 | % | |
| | | Centerenergo ADR | | | 1,530 | | | 12/17/03 | | | 3,623 | | | | 17,226 | | | | 0.0 | % | |
| | | RenShares Utilities Ltd. | | | 104,109 | | | 02/22/06 | | | 165,580 | | | | 212,382 | | | | 0.1 | % | |
| | | Ukrnafta Oil Co. ADR | | | 87 | | | 12/28/04 | | | 10,005 | | | | 30,494 | | | | 0.0 | % | |
| | | | | | | | | | | $ | 272,339 | | | $ | 342,669 | | | | 0.1 | % | |
Emerging Markets
Fixed Income | | Central Bank of Nigeria, 5.092%, due 01/05/10 | | | 500,000 | | | 02/21/06 | | $ | 133,139 | | | $ | 116,875 | | | | 0.4 | % | |
| | | Cia de Transporte de Energia Electrica de Alta
Tension SA, 3.000%, due 12/15/16 | | | 18,763 | | | 05/16/06 | | | 15,383 | | | | 15,627 | | | | 0.1 | % | |
| | | Cia de Transporte de Energia Electrica de Alta
Tension SA, 9.000%, due 12/15/15 | | | 66,163 | | | 05/16/06 | | | 66,198 | | | | 66,328 | | | | 0.3 | % | |
| | | Ivory Coast Government International Bond,
2.000%, due 03/30/18 | | | 400,000 | | | 12/21/05 | | | 87,400 | | | | 96,000 | | | | 0.4 | % | |
| | | | | | | | | | | $ | 302,120 | | | $ | 294,830 | | | | 1.2 | % | |
NOTE 13 — CONCENTRATION OF RISKS
Foreign Securities (All Funds). Investments in foreign securities may entail risks not present in domestic investments. Since securities in which the Funds and Underlying Funds may invest are denominated in foreign currencies, changes in the relationship of these foreign currencies to the U.S. dollar can significantly affect the value of the investments and earnings of the Funds and Underlying Funds. Foreign investments may also subject the Funds and Underlying Funds to foreign government exchange restrictions, expropriation, taxation or other political, social or economic developments, as well as changes vis-a-vis the U.S. dollar from movements in currency, and changes in security value and interest rate, all of which could affect the market and/or credit risk of the Funds' and Underlying Fun ds' investments.
Emerging Markets Investments (All Funds except Index Plus International Equity). Because of less developed markets and economies and, in some countries, less mature governments and governmental institutions, the risks of investing in foreign securities can be intensified in the case of investments in issuers domiciled or doing substantial business in emerging market countries.
120
NOTES TO FINANCIAL STATEMENTS AS OF OCTOBER 31, 2006 (CONTINUED)
NOTE 13 — CONCENTRATION OF RISKS (continued)
Industry Concentration (Global Natural Resources, Global Real Estate, and International Real Estate). As a result of the Funds' and Underlying Funds' concentrating their assets in securities related to a particular industry, each Fund or Underlying Fund may be subject to greater market fluctuation than a fund that invests in securities representing a broader range of investment alternatives.
Geographic Concentration (Greater China and Russia). As a result of the Funds' concentrating their assets in a single region of the world, the Fund's performance may be more volatile than that of a fund that invests globally. If securities in the region that each Fund is concentrated fall out of favor, it may cause a Fund to underperform in relation to funds that focus on other types of stocks.
Non-Diversified (Global Natural Resources, Global Real Estate, Greater China, International Real Estate, Russia, Emerging Markets Fixed Income and Global Bond). The Funds and Underlying Funds are each classified as non-diversified investment companies under the 1940 Act, which means that each Fund or Underlying Fund is not limited by the 1940 Act in the proportion of assets that they may invest in the obligations of a single issuer. Declines in the value of that single company can significantly impact the value of a Fund or Underlying Fund. The investment of a large percentage of a Fund's or Underlying Fund's assets in the securities of a small number of issuers may cause the Funds' share price to fluctuate more than that of a diversified investment company. Conversely, even though classified as non-diversified, a Fund or Underlying Fund may actually maintain a po rtfolio that is diversified with a large number of issuers. In such an event, a Fund or Underlying Fund would benefit less from appreciation in a single corporate issuer than if it had greater exposure to that issuer.
Restricted and Illiquid Securities (Greater China and Emerging Markets Fixed Income). If a security is illiquid, a Fund may not be able to sell the security at a time when the Investment Adviser or a Sub-Adviser might wish to sell, and the security could have the effect of decreasing the overall level of a Fund's liquidity. Further, the lack of an established secondary market may make it more difficult to value illiquid securities, which could vary from the amount a Fund could realize upon disposition. Restricted securities, i.e., securities subject to legal or contractual restrictions on resale, may be illiquid. However, some restricted securit ies may be treated as liquid, although they may be less liquid than registered securities traded on established secondary markets.
Rule 144A Securities (Greater China). Rule 144A securities are securities that are not registered, but which are bought and sold solely by institutional investors. The Fund generally considers Rule 144A securities to be "liquid" although the market for such securities typically is less active than public securities markets and may lead to less ability to sell these securities.
NOTE 14 — SECURITIES LENDING
Under an agreement with The Bank of New York ("BNY"), the Funds can lend their securities to approved brokers, dealers and other financial institutions. Loans are collateralized by cash and U.S. government securities. The collateral must be in an amount equal to at least 105% of the market value of non-U.S. securities loaned and 102% of the market value of U.S. securities loaned. The cash collateral received is invested in approved investments as defined in the Securities Lending Agreement with BNY (the "Agreement"). The securities purchased with cash collateral received are reflected in the Portfolio of Investments. Generally, in the event of counterparty default, the Funds have the right to use the collateral to offset losses incurred. The Agreement contains certain guarantees by BNY in the event of counterparty default and/or a borrower's failure to return a loaned security, however there would be a potential loss to the Funds in the even t the Funds are delayed or prevented from exercising their right to dispose of the collateral. The Funds bear the risk of loss with respect to the investment of collateral. Engaging in securities lending could have a leveraging effect, which may intensify the credit, market and other risks associated with investing in a Fund. At October 31, 2006, the following Funds had securities on loan with the following market values:
| Fund | | Value of
Securities
Loaned | | Value of
Collateral | |
| Global Equity Dividend | | $ | 15,405,250 | | | $ | 15,854,000 | | |
| Global Real Estate | | | 30,770,046 | | | | 31,514,000 | | |
| Global Value Choice | | | 26,108,298 | | | | 26,721,000 | | |
| Emerging Countries | | | 19,011,184 | | | | 19,904,000 | | |
| Foreign | | | 12,881,285 | | | | 13,242,000 | | |
| International | | | 3,994,877 | | | | 4,054,000 | | |
| International Small Cap | | | 91,884,127 | | | | 96,584,000 | | |
| International Value | | | 61,735,704 | | | | 68,412,000 | | |
| Russia | | | 38,364,134 | | | | 39,103,000 | | |
121
NOTES TO FINANCIAL STATEMENTS AS OF OCTOBER 31, 2006 (CONTINUED)
NOTE 15 — FEDERAL INCOME TAXES
The amount of distributions from net investment income and net realized capital gains are determined in accordance with federal income tax regulations, which may differ from U.S. generally accepted accounting principles for investment companies. These book/tax differences may be either temporary or permanent. Permanent differences are reclassified within the capital accounts based on their federal tax-basis treatment; temporary differences are not reclassified. Key differences include the treatment of short-term capital gains, foreign currency transactions, and wash sale deferrals. Distributions in excess of net investment income and/or net realized capital gains for tax purposes are reported as distributions of paid-in capital.
The following permanent tax differences have been reclassified as of October 31, 2006:
| | | Paid-in
Capital | | Undistributed
Net Investment
Income On
Investments | | Accumulated
Net Realized
Gains/
(Losses) | |
| Global Equity Dividend | | $ | — | | | $ | 500,835 | | | $ | (500,835 | ) | |
| Global Natural Resources | | | — | | | | 3,686,346 | | | | (3,686,346 | ) | |
| Global Real Estate(1) | | | — | | | | 5,860,769 | | | | (5,860,769 | ) | |
| Global Value Choice | | | (63,394 | ) | | | (72,119 | ) | | | 135,513 | | |
| Emerging Countries | | | — | | | | (63,783 | ) | | | 63,783 | | |
| Foreign | | | — | | | | (1,057,677 | ) | | | 1,057,677 | | |
| Greater China | | | (40,663 | ) | | | 18,331 | | | | 22,332 | | |
Index Plus International
Equity | | | (14,385 | ) | | | 72,746 | | | | (58,361 | ) | |
| International | | | — | | | | 393,384 | | | | (393,384 | ) | |
International Capital
Appreciation | | | (6,229 | ) | | | 316,373 | | | | (310,144 | ) | |
| International Real Estate | | | (21,184 | ) | | | 2,302,960 | | | | (2,281,776 | ) | |
| International SmallCap | | | — | | | | 891,322 | | | | (891,322 | ) | |
| International Value | | | — | | | | 2,525,605 | | | | (2,525,605 | ) | |
| International Value Choice | | | (1,274 | ) | | | (64,415 | ) | | | 65,689 | | |
| Russia | | | (3,744,259 | ) | | | 3,690,687 | | | | 53,572 | | |
Emerging Markets
Fixed Income | | | (8,637 | ) | | | 7,215 | | | | 1,422 | | |
| Global Bond | | | (18,887 | ) | | | (56,621 | ) | | | 75,508 | | |
| Diversified International | | | (741,875 | ) | | | 741,875 | | | | — | | |
(1) As of the Fund's tax year ended December 31, 2005.
Dividends paid by the Funds from net investment income and distributions of net realized short-term capital gains are, for federal income tax purposes, taxable as ordinary income to shareholders.
The tax composition of dividends and distributions to shareholders was as follows:
| | | Year Ended October 31, 2006 | | Year Ended October 31, 2005 | |
| | | Ordinary
Income | | Long-Term
Capital Gains | | Ordinary
Income | | Long-Term
Capital Gains | |
| Global Equity Dividend | | $ | 7,159,143 | | | $ | 828,141 | | | $ | 3,156,591 | | | $ | 8,751 | | |
| Global Natural Resources | | | 180,375 | | | | — | | | | 2,990,570 | | | | — | | |
| Global Real Estate(1) | | | 14,209,504 | | | | 4,790,208 | | | | 9,149,441 | | | | 1,825,148 | | |
| Global Value Choice | | | 397,470 | | | | — | | | | — | | | | — | | |
| Emerging Countries | | | 671,817 | | | | — | | | | 72,677 | | | | — | | |
| Foreign | | | — | | | | 6,096,805 | | | | — | | | | — | | |
| International | | | 1,814,101 | | | | — | | | | 1,011,092 | | | | — | | |
| International Real Estate | | | 176,469 | | | | — | | | | — | | | | — | | |
| International SmallCap | | | 2,373,750 | | | | — | | | | — | | | | — | | |
| International Value | | | 49,299,049 | | | | 295,092,915 | | | | 47,073,127 | | | | 184,904,220 | | |
| International Value Choice | | | 269,623 | | | | — | | | | — | | | | — | | |
| Russia | | | — | | | | — | | | | 111,452 | | | | — | | |
| Emerging Markets Fixed Income | | | 601,241 | | | | — | | | | — | | | | — | | |
| Global Bond | | | 154,991 | | | | — | | | | — | | | | — | | |
(1) Composition of dividends and distributions presented herein is based on the Fund's tax year-end of December 31, 2005.
The tax-basis components of distributable earnings and the expiration dates of the capital loss carryforwards which may be used to offset future realized capital gains for federal income tax purposes as of October 31, 2006 were:
| | | Undistributed
Ordinary
Income | | Undistributed
Long Term
Capital Gains | | Unrealized
Appreciation/
Depreciation | | Post-October
Currency
Losses
Deferred | | Capital
Loss
Carryforwards | | Expiration
Dates | |
| Global Equity Dividend | | $ | 9,076,395 | | | $ | 3,813,556 | | | $ | 23,645,122 | | | $ | — | | | $ | — | | | | — | | |
| Global Natural Resources | | | 2,905,734 | | | | 3,999,425 | | | | 9,657,483 | | | | — | | | | — | | | | — | | |
| Global Real Estate(1) | | | 550,631 | | | | 302,897 | | | | 103,992,810 | | | | (81,995 | ) | | | — | | | | — | | |
| Global Value Choice | | | — | | | | — | | | | 8,215,415 | | | | — | | | $ | (87,543,966 | ) | | | 2009 | | |
| | | | | | | | | | | | | | | | | | | | (81,779,077 | ) | | | 2010 | | |
| | | | | | | | | | | | | | | | | | | | (6,183,953 | ) | | | 2011 | | |
| | | | | | | | | | | | | | | | | | | $ | (175,506,996 | ) | | | | | |
122
NOTES TO FINANCIAL STATEMENTS AS OF OCTOBER 31, 2006 (CONTINUED)
NOTE 15 — FEDERAL INCOME TAXES (continued)
| | | Undistributed
Ordinary
Income | | Undistributed
Long Term
Capital Gains | | Unrealized
Appreciation/
Depreciation | | Post-October
Currency
Losses
Deferred | | Capital
Loss
Carryforwards | | Expiration
Dates | |
| Emerging Countries | | $ | 2,922,994 | | | $ | — | | | $ | 17,887,431 | | | $ | — | | | $ | (177,555 | ) | | | 2007 | | |
| | | | | | | | | | | | | | | | | | | | (6,643,620 | ) | | | 2008 | | |
| | | | | | | | | | | | | | | | | | | | (16,457,274 | ) | | | 2009 | | |
| | | | | | | | | | | | | | | | | | | | (18,266,429 | ) | | | 2010 | | |
| | | | | | | | | | | | | | | | | | | $ | (41,544,878 | )* | | | | | |
| Foreign | | | 5,015,491 | | | | 12,874,403 | | | | 92,175,663 | | | | — | | | | — | | | | — | | |
| Greater China | | | 138,040 | | | | — | | | | 3,442,724 | | | | — | | | | — | | | | — | | |
| Index Plus International Equity | | | 3,147,511 | | | | — | | | | 5,249,091 | | | | — | | | | — | | | | — | | |
| International | | | 3,140,604 | | | | 9,768,824 | | | | 13,093,588 | | | | — | | | $ | (756,192 | ) | | | 2007 | | |
| | | | | | | | | | | | | | | | | | | | (3,061,891 | ) | | | 2008 | | |
| | | | | | | | | | | | | | | | | | | $ | (3,818,083 | )* | | | | | |
| International Capital Appreciation | | | 1,639,181 | | | | — | | | | 3,052,504 | | | | — | | | | — | | | | — | | |
| International Real Estate | | | 2,395,596 | | | | — | | | | 4,868,033 | | | | — | | | $ | (26,312 | ) | | | 2014 | | |
| International SmallCap | | | 3,446,225 | | | | — | | | | 71,319,803 | | | | — | | | $ | (712,769 | ) | | | 2010 | | |
| International Value | | | 119,317,732 | | | | 402,816,251 | | | | 1,106,906,005 | | | | — | | | | — | | | | — | | |
| International Value Choice | | | 1,070,581 | | | | 379,357 | | | | 3,372,054 | | | | — | | | | — | | | | — | | |
| Russia | | | — | | | | 43,574,849 | | | | 270,694,361 | | | | — | | | | — | | | | — | | |
| Emerging Markets Fixed Income | | | 186,408 | | | | — | | | | 278,900 | | | | — | | | | — | | | | — | | |
| Global Bond | | | 462,599 | | | | 8,000 | | | | 208,853 | | | | — | | | | — | | | | — | | |
| Diversified International | | | — | | | | — | | | | 17,236,137 | | | | — | | | $ | (701,461 | ) | | | 2014 | | |
* Utilization of these capital losses is subject to annual limitations under Section 382 of the Internal Revenue Code.
(1) As of the Fund's tax year ended December 31, 2005.
NOTE 16 — OTHER ACCOUNTING PRONOUNCEMENTS
In June 2006, the Financial Accounting Standards Board ("FASB") issued FASB Interpretation 48 ("FIN 48"), "Accounting for Uncertainty in Income Taxes." This standard defines the threshold for recognizing the benefits of tax-return positions in the financial statements as "more-likely-than-not" to be sustained upon challenge by the taxing authority and requires measurement of a tax position meeting the more-likely-than-not criterion, based on the largest benefit that is more than 50 percent likely to be realized. FIN 48 is effective as of the beginning of the first fiscal year beginning after December 15, 2006, with early application permitted if no interim financial statements have been issued. At adoption, companies must adjust their financial statements to reflect only those tax positions that are more likely-than-not to be sustained as of the adoption date. Management of the Funds has assessed the impact of adopting FIN 48, and currently does not believe that there will be a material impact to the Funds.
On September 15, 2006, the FASB issued Statement of Financial Accounting Standard No. 157 ("SFAS No. 157"), Fair Value Measurements. The new accounting statement defines fair value, establishes a framework for measuring fair value in generally accepted accounting principles (GAAP), and expands disclosures about fair value measurements. SFAS No. 157 defines fair value as the price that would be received upon sale of an asset or paid to transfer a liability in an orderly transaction between market participants at the measurement date (an exit price). SFAS No. 157 also stipulates that, as a market-based measurement, fair value measurement should be determined based on the assumptions that market participants would use in pricing the asset or liability, and establishes a fair value hierarchy that distinguishes between (a) market participant assumptions developed based on mar ket data obtained from sources independent of the reporting entity (observable inputs) and (b) the reporting entity's own assumptions about market participant assumptions developed based on the best information available in the circumstances (unobservable inputs). SFAS No. 157 is effective for financial statements issued for fiscal years beginning after November 15, 2007. As of October 2006, the Funds are assessing the impact, if any, that will result from adopting SFAS No. 157.
123
NOTES TO FINANCIAL STATEMENTS AS OF OCTOBER 31, 2006 (CONTINUED)
NOTE 17 — SUBSEQUENT EVENTS
Dividends. Subsequent to October 31, 2006, the following Funds declared dividends and distributions of:
| | | Per Share
Amounts | | | | | |
| | | Net Investment
Income | | Payable Date | | Record Date | |
Emerging Markets
Fixed Income | |
| Class A | | $ | 0.0400 | | | November 3, 2006 | | October 31, 2006 | |
| Class B | | $ | 0.0342 | | | November 3, 2006 | | October 31, 2006 | |
| Class C | | $ | 0.0329 | | | November 3, 2006 | | October 31, 2006 | |
| Class I | | $ | — | | | November 3, 2006 | | October 31, 2006 | |
| Class A | | $ | 0.0600 | | | December 5, 2006 | | November 30, 2006 | |
| Class B | | $ | 0.0537 | | | December 5, 2006 | | November 30, 2006 | |
| Class C | | $ | 0.0534 | | | December 5, 2006 | | November 30, 2006 | |
| Class I | | $ | 0.0631 | | | December 5, 2006 | | November 30, 2006 | |
| Global Bond | |
| Class A | | $ | 0.0313 | | | December 1, 2006 | | Daily | |
| Class B | | $ | 0.0361 | | | December 1, 2006 | | Daily | |
| Class C | | $ | 0.0183 | | | December 1, 2006 | | Daily | |
| Class I | | $ | 0.0331 | | | December 1, 2006 | | Daily | |
Effective November 1, 2006, the Board of IMF approved the addition of Batterymarch Financial Management, Inc. as a second sub-adviser to International SmallCap and subsequent changes to International SmallCap's principal investment strategies and a change in International SmallCap's primary benchmark.
On November 9, 2006, the Board approved the conversion of current Class M shares to Class A shares of Emerging Countries. Effective January 2, 2007, Class M shareholders will be converted to Class A shares of Emerging Countries. In addition, the Board has approved a waiver of the Class A sales charge (load) on additional Class A share purchases of the Emerging Countries by its former Class M shareholders.
NOTE 18 — INFORMATION REGARDING TRADING OF ING'S U.S. MUTUAL FUNDS
ING Investments reported to the Boards of Directors/Trustees (the "Boards") of the ING Funds that, like many U.S. financial services companies, ING Investments and certain of its U.S. affiliates have received informal and formal requests for information since September 2003 from various governmental and self-regulatory agencies in connection with investigations related to mutual funds and variable insurance products. ING Investments has advised the Boards that it and its affiliates have cooperated fully with each request.
In addition to responding to regulatory and governmental requests, ING Investments reported that management of U.S. affiliates of ING Groep including ING Investments (collectively, "ING"), on their own initiative, have conducted, through independent special counsel and a national accounting firm, an extensive internal review of trading in ING insurance, retirement, and mutual fund products. The goal of this review was to identify any instances of inappropriate trading in those products by third parties or by ING investment professionals and other ING personnel. ING's internal review related to mutual fund trading is now substantially completed. ING has reported that, of the millions of customer relationships that ING maintains, the internal review identified several isolated arrangements allowing third parties to engage in frequent trading of mutual funds within ING's va riable insurance and mutual fund products, and identified other circumstances where frequent trading occurred, despite measures taken by ING intended to combat market timing. ING further reported that each of these arrangements has been terminated and fully disclosed to regulators. The results of the internal review were also reported to the independent members of the Boards.
ING Investments has advised the Boards that most of the identified arrangements were initiated prior to ING's acquisition of the businesses in question in the U.S. ING Investments further reported that the companies in question did not receive special benefits in return for any of these arrangements, which have all been terminated.
Based on the internal review, ING Investments has advised the Boards that the identified arrangements do not represent a systemic problem in any of the companies that were involved.
In September 2005, ING Funds Distributor, LLC ("IFD"), the distributor of certain ING Funds, settled an administrative proceeding with the NASD regarding three arrangements, dating from 1995, 1996 and 1998, under which the administrator to the then-Pilgrim Funds, which subsequently became part of the ING Funds, entered into formal and informal arrangements that permitted frequent trading. Under the terms of the Letter of Acceptance, Waiver and Consent ("AWC") with the NASD, under which IFD neither admitted nor denied the allegations or findings, IFD consented to the following sanctions: (i) a censure; (ii) a fine of $1.5 million; (iii) restitution of approximately $1.44 million to certain ING Funds for losses attributable to excessive trading described in the AWC; and (iv) agreement to make certification to NASD regarding the review and establishment of certain procedures.
In addition to the arrangements discussed above, ING Investments reported to the Boards that, at this time,
124
NOTES TO FINANCIAL STATEMENTS AS OF OCTOBER 31, 2006 (CONTINUED)
NOTE 18 — INFORMATION REGARDING TRADING OF ING'S U.S. MUTUAL FUNDS (continued)
these instances include the following, in addition to the arrangements subject to the AWC discussed above:
• Aeltus Investment Management, Inc. (a predecessor entity to ING Investment Management Co.) identified two investment professionals who engaged in extensive frequent trading in certain ING Funds. One was subsequently terminated for cause and incurred substantial financial penalties in connection with this conduct and the second has been disciplined.
• ReliaStar Life Insurance Company ("ReliaStar") entered into agreements seven years ago permitting the owner of policies issued by the insurer to engage in frequent trading and to submit orders until 4pm Central Time. In 2001 ReliaStar also entered into a selling agreement with a broker-dealer that engaged in frequent trading. Employees of ING affiliates were terminated and/or disciplined in connection with these matters.
• In 1998, Golden American Life Insurance Company entered into arrangements permitting a broker-dealer to frequently trade up to certain specific limits in a fund available in an ING variable annuity product. No employee responsible for this arrangement remains at the company.
For additional information regarding these matters, you may consult the Form 8-K and Form 8-K/A for each of four life insurance companies, ING USA Annuity and Life Insurance Company, ING Life Insurance and Annuity Company, ING Insurance Company of America, and ReliaStar Life Insurance Company of New York, each filed with the Securities and Exchange Commission (the "SEC") on October 29, 2004 and September 8, 2004. These Forms 8-K and Forms 8-K/A can be accessed through the SEC's Web site at http://www.sec.gov. Despite the extensive internal review conducted through independent special counsel and a national accounting firm, there can be no assurance that the instances of inappropriate trading reported to the Boards are the only instances of such trading respecting the ING Funds.
ING Investments reported to the Boards that ING is committed to conducting its business with the highest standards of ethical conduct with zero tolerance for noncompliance. Accordingly, ING Investments advised the Boards that ING management was disappointed that its voluntary internal review identified these situations. Viewed in the context of the breadth and magnitude of its U.S. business as a whole, ING management does not believe that ING's acquired companies had systemic ethical or compliance issues in these areas. Nonetheless, ING Investments reported that given ING's refusal to tolerate any lapses, it has taken the steps noted below, and will continue to seek opportunities to further strengthen the internal controls of its affiliates.
• ING has agreed with the ING Funds to indemnify and hold harmless the ING Funds from all damages resulting from wrongful conduct by ING or its employees or from ING's internal investigation, any investigations conducted by any governmental or self-regulatory agencies, litigation or other formal proceedings, including any proceedings by the SEC. ING Investments reported to the Board that ING management believes that the total amount of any indemnification obligations will not be material to ING or its U.S. business.
• ING updated its Code of Conduct for employees reinforcing its employees' obligation to conduct personal trading activity consistent with the law, disclosed limits, and other requirements.
• The ING Funds, upon a recommendation from ING, updated their respective Codes of Ethics applicable to investment professionals with ING entities and certain other fund personnel, requiring such personnel to pre-clear any purchases or sales of ING Funds that are not systematic in nature (i.e., dividend reinvestment), and imposing minimum holding periods for shares of ING Funds.
• ING instituted excessive trading policies for all customers in its variable insurance and retirement products and for shareholders of the ING Funds sold to the public through financial intermediaries. ING does not make exceptions to these policies.
• ING reorganized and expanded its U.S. Compliance Department, and created an Enterprise Compliance team to enhance controls and consistency in regulatory compliance.
Other Regulatory Matters
The New York Attorney General (the "NYAG") and other federal and state regulators are also conducting broad inquiries and investigations involving the insurance industry. These initiatives currently focus on, among other things, compensation and other sales incentives; potential conflicts of interest; potential anti-competitive activity; reinsurance; marketing practices (including suitability); specific product types
125
NOTES TO FINANCIAL STATEMENTS AS OF OCTOBER 31, 2006 (CONTINUED)
NOTE 18 — INFORMATION REGARDING TRADING OF ING'S U.S. MUTUAL FUNDS (continued)
(including group annuities and indexed annuities); fund selection for investment products and brokerage sales; and disclosure. It is likely that the scope of these industry investigations will further broaden before they conclude. ING has received formal and informal requests in connection with such investigations, and is cooperating fully with each request. In connection with one such investigation, affiliates of ING Investments were named in a petition for relief and cease and desist order filed by the New Hampshire Bureau of Securities Regulation (the "NH Bureau") concerning their administration of the New Hampshire state employees deferred compensation plan.
On October 10, 2006, an affiliate of ING Investments entered into an assurance of discontinuance with the NYAG (the "NYAG Agreement") regarding the endorsement of its products by the New York State United Teachers Union Member Benefits Trust ("NYSUT") and the sale of their products to NYSUT members. Under the terms of the NYAG Agreement, the affiliate of ING Investments, without admitting or denying the NYAG's findings, will distribute $30 million to NYSUT members, and/or former NYSUT members, who participated in the NYSUT-endorsed products at any point between January 1, 2001 and June 30, 2006. The affiliate also agreed with the NYAG's office to develop a one-page disclosure that will further improve transparency and disclosure regarding retirement product fees (the "One-Page Disclosure"). Pursuant to the terms of the NYAG Agreement, the affiliate has agreed for a five year period to provide its retirement product customers with the One-Pag e Disclosure.
In addition, on the same date, these affiliates of ING Investments entered into a consent agreement with the NH Bureau (the "NH Agreement") to resolve this petition for relief and cease and desist order. Under the terms of the NH Agreement, these affiliates of ING Investments, without admitting or denying the NH Bureau's claims, have agreed to pay $3 million to resolve the matter, and for a five year period to provide their retirement product customers with the One-Page Disclosure described above.
Other federal and state regulators could initiate similar actions in this or other areas of ING's businesses.
These regulatory initiatives may result in new legislation and regulation that could significantly affect the financial services industry, including businesses in which ING is engaged.
In light of these and other developments, ING continuously reviews whether modifications to its business practices are appropriate.
At this time, in light of the current regulatory factors, ING U.S. is actively engaged in reviewing whether any modifications in our practices are appropriate for the future.
There can be no assurance that these matters, or the adverse publicity associated with them, will not result in increased fund redemptions, reduced sale of fund shares, or other adverse consequences to ING Funds.
NOTE 19 — PROXY VOTING INFORMATION
A description of the policies and procedures that the Funds use to determine how to vote proxies related to portfolio securities is available (1) without charge, upon request, by calling Shareholder Services toll-free at 1-800-992-0180; (2) on the Funds' website at www.ingfunds.com and (3) on the SEC's website at www.sec.gov. Information regarding how the Funds voted proxies related to portfolio securities during the most recent 12-month period ended June 30 is available without charge on the Funds' website at www.ingfunds.com and on the SEC's website at www.sec.gov.
NOTE 20 — QUARTERLY PORTFOLIO HOLDINGS
The Funds file their complete schedule of portfolio holdings with the SEC for the first and third quarters of each fiscal year on Form N-Q. The Funds' Forms N-Q are available on the SEC's website at www.sec.gov. The Funds' Forms N-Q may be reviewed and copied at the SEC's Public Reference Room in Washington, DC, and information on the operation of the Public Reference Room may be obtained by calling 1-800-SEC-0330; and is available upon request from the Funds by calling Shareholder Services toll-free at 1-800-992-0180.
126
PORTFOLIO OF INVESTMENTS
ING GLOBAL EQUITY DIVIDEND FUND AS OF OCTOBER 31, 2006
| Shares | | | | Value | |
| COMMON STOCK: 93.1% | | | |
| | | | | Australia: 7.3% | |
| | 103,160 | | | | | Australia & New Zealand
Banking Group Ltd. | | $ | 2,310,492 | | |
| | 213,981 | | | | | Coca-Cola Amatil Ltd. | | | 1,151,622 | | |
| | 455,788 | | | | | Foster's Group Ltd. | | | 2,276,594 | | |
| | 75,414 | | | | | Publishing & Broadcasting Ltd. | | | 1,131,665 | | |
| | 85,944 | | | | | St. George Bank Ltd. | | | 2,152,438 | | |
| | 177,544 | | | | | Stockland | | | 1,041,386 | | |
| | 90,696 | | | | | Suncorp-Metway Ltd. | | | 1,459,812 | | |
| | 89,213 | | | | | TABCORP Holdings Ltd. | | | 1,139,302 | | |
| | 80,672 | | | | | Wesfarmers Ltd. | | | 2,154,932 | | |
| | 147,732 | | | | | Westfield Group | | | 2,130,650 | | |
| | | | 16,948,893 | | |
| | | | | Belgium: 2.0% | |
| | 57,843 | | | | | Belgacom SA | | | 2,363,270 | | |
| | 56,170 | | | | | Fortis | | | 2,355,360 | | |
| | | | 4,718,630 | | |
| | | | | Brazil: 2.7% | |
| | 36,931 | | | | | Cia Siderurgica
Nacional SA ADR | | | 1,150,847 | | |
| | 30,348 | | | | | Petroleo Brasileiro SA ADR | | | 2,455,672 | | |
| | 177,614 | | | | | Tele Norte Leste
Participacoes SA ADR | | | 2,570,484 | | |
| | | | 6,177,003 | | |
| | | | | Canada: 7.4% | |
| | 124,133 | | | | | BCE, Inc. | | | 3,503,216 | | |
| | 37,597 | | | | | Bell Aliant Regional
Communications Income Fund | | | 1,137,704 | | |
| | 43,980 | | | | | Canadian Imperial Bank
of Commerce | | | 3,431,076 | | |
| | 26,586 | | | | | Enerplus Resources Fund | | | 1,443,235 | | |
| | 72,277 | | | | | Fording Canadian Coal Trust | | | 1,837,629 | | |
| | 102,665 | | | | | Precision Drilling Trust | | | 2,919,715 | | |
| | 88,370 | | | | | TransCanada Corp. | | | 2,859,888 | | |
| | | | 17,132,463 | | |
| | | | | China: 1.0% | |
| | 2,014,000 | | | | | PetroChina Co., Ltd. | | | 2,222,564 | | |
| | | | 2,222,564 | | |
| | | | | Denmark: 0.9% | |
| | 50,619 | | | | | Danske Bank A/S | | | 2,119,969 | | |
| | | | 2,119,969 | | |
| | | | | France: 3.0% | |
| | 91,063 | | | | | France Telecom SA | | | 2,371,460 | | |
| | 13,312 | | | | | Societe Generale | | | 2,209,985 | | |
| | 62,552 | | | | | Vivendi | | | 2,369,923 | | |
| | | | 6,951,368 | | |
| | | | | Germany: 2.1% | |
| | 142,187 | | | | | Deutsche Telekom AG | | | 2,472,439 | | |
| | 19,158 | | | | | EON AG | | | 2,298,767 | | |
| | | | 4,771,206 | | |
| | | | | Greece: 1.0% | |
| | 63,136 | | | | | OPAP SA | | | 2,249,540 | | |
| | | | 2,249,540 | | |
| Shares | | | | Value | |
| | | | | Hong Kong: 1.0% | |
| | 357,000 | | | | | Citic Pacific Ltd. | | $ | 1,095,799 | | |
| | 178,500 | | | | | CLP Holdings Ltd. | | | 1,133,733 | | |
| | | | 2,229,532 | | |
| | | | | Hungary: 0.6% | |
| | 55,805 | | | @ | | Matav Magyar
Tavkozlesi Rt ADR | | | 1,293,002 | | |
| | | | 1,293,002 | | |
| | | | | Ireland: 1.0% | |
| | 86,038 | | | | | Allied Irish Banks PLC | | | 2,338,059 | | |
| | | | 2,338,059 | | |
| | | | | Israel: 0.6% | |
| | 292,914 | | | | | Bank Hapoalim BM | | | 1,462,721 | | |
| | | | 1,462,721 | | |
| | | | | Italy: 7.7% | |
| | 336,806 | | | | | Banca Intesa S.p.A. | | | 2,300,787 | | |
| | 300,978 | | | | | Enel S.p.A. | | | 2,882,574 | | |
| | 115,595 | | | | | ENI S.p.A. | | | 3,496,727 | | |
| | 195,809 | | | | | Mediaset S.p.A. | | | 2,194,817 | | |
| | 465,044 | | | | | Snam Rete Gas S.p.A. | | | 2,368,179 | | |
| | 938,615 | | | | | Telecom Italia S.p.A. | | | 2,370,869 | | |
| | 276,164 | | | | | UniCredito Italiano S.p.A. | | | 2,288,518 | | |
| | | | 17,902,471 | | |
| | | | | Netherlands: 2.5% | |
| | 78,766 | | | | | ABN Amro Holding NV | | | 2,295,117 | | |
| | 9,407 | | | | | Rodamco Europe NV | | | 1,088,241 | | |
| | 69,382 | | | | | Royal Dutch Shell PLC | | | 2,414,246 | | |
| | | | 5,797,604 | | |
| | | | | New Zealand: 0.5% | |
| | 394,844 | | | | | Telecom Corp. of
New Zealand Ltd. | | | 1,226,241 | | |
| | | | 1,226,241 | | |
| | | | | Norway: 1.0% | |
| | 171,793 | | | | | DNB NOR ASA | | | 2,249,568 | | |
| | | | 2,249,568 | | |
| | | | | Poland: 1.1% | |
| | 339,314 | | | | | Telekomunikacja Polska SA | | | 2,499,358 | | |
| | | | 2,499,358 | | |
| | | | | Portugal: 0.5% | |
| | 100,892 | | | L | | Brisa-Auto Estradas de
Portugal SA | | | 1,117,381 | | |
| | | | 1,117,381 | | |
| | | | | Singapore: 0.9% | |
| | 192,000 | | | | | United Overseas Bank Ltd. | | | 2,180,801 | | |
| | | | 2,180,801 | | |
| | | | | South Africa: 1.6% | |
| | 171,163 | | | | | Edgars Consolidated Stores Ltd. | | | 853,132 | | |
| | 101,196 | | | | | Standard Bank Group Ltd. | | | 1,189,107 | | |
| | 84,296 | | | | | Telkom SA Ltd. | | | 1,560,506 | | |
| | | | 3,602,745 | | |
See Accompanying Notes to Financial Statements
127
PORTFOLIO OF INVESTMENTS
ING GLOBAL EQUITY DIVIDEND FUND AS OF OCTOBER 31, 2006 (CONTINUED)
| Shares | | | | Value | |
| | | | | South Korea: 1.1% | |
| | 110 | | | | | KT Corp. | | $ | 4,993 | | |
| | 53,492 | | | | | KT Corp. ADR | | | 1,197,407 | | |
| | 19,419 | | | | | S-Oil Corp. | | | 1,323,648 | | |
| | | | 2,526,048 | | |
| | | | | Sweden: 1.4% | |
| | 48,404 | | | | | Svenska Cellulosa AB | | | 2,217,107 | | |
| | 18,465 | | | | | Volvo AB | | | 1,150,968 | | |
| | | | 3,368,075 | | |
| | | | | Thailand: 0.7% | |
| | 338,500 | | | | | Advanced Info Service PCL | | | 829,988 | | |
| | 117,700 | | | | | Siam Cement PCL | | | 851,939 | | |
| | | | 1,681,927 | | |
| | | | | United Kingdom: 11.4% | |
| | 154,965 | | | | | Aviva PLC | | | 2,289,034 | | |
| | 171,068 | | | | | Barclays PLC | | | 2,304,913 | | |
| | 193,750 | | | | | BBA Group PLC | | | 986,055 | | |
| | 40,273 | | | @ | | Biffa PLC | | | 204,734 | | |
| | 127,142 | | | | | Diageo PLC | | | 2,350,873 | | |
| | 555,584 | | | | | DSG International PLC | | | 2,304,737 | | |
| | 79,670 | | | | | GlaxoSmithKline PLC | | | 2,123,253 | | |
| | 66,776 | | | | | Imperial Tobacco Group PLC | | | 2,365,294 | | |
| | 850,369 | | | | | Legal & General Group PLC | | | 2,344,547 | | |
| | 218,088 | | | | | Lloyds TSB Group PLC | | | 2,329,497 | | |
| | 86,782 | | | | | Provident Financial PLC | | | 1,022,712 | | |
| | 95,229 | | | | | Royal Bank of
Scotland Group PLC | | | 3,389,977 | | |
| | 84,584 | | | | | Severn Trent PLC | | | 2,251,351 | | |
| | | | 26,266,977 | | |
| | | | | United States: 32.1% | |
| | 30,401 | | | | | AGL Resources, Inc. | | | 1,140,063 | | |
| | 42,985 | | | | | Altria Group, Inc. | | | 3,496,572 | | |
| | 41,968 | | | L | | Ameren Corp. | | | 2,270,933 | | |
| | 58,172 | | | L | | American Capital Strategies Ltd. | | | 2,510,909 | | |
| | 39,387 | | | | | Arthur J Gallagher & Co. | | | 1,096,922 | | |
| | 72,665 | | | | | AT&T, Inc. | | | 2,488,172 | | |
| | 63,868 | | | | | Bank of America Corp. | | | 3,441,244 | | |
| | 88,855 | | | | | Bristol-Myers Squibb Co. | | | 2,199,115 | | |
| | 68,616 | | | | | Citigroup, Inc. | | | 3,442,386 | | |
| | 153,076 | | | L | | Citizens Communications Co. | | | 2,244,530 | | |
| | 47,673 | | | | | Consolidated Edison, Inc. | | | 2,305,188 | | |
| | 19,574 | | | L | | Developers Diversified
Realty Corp. | | | 1,191,910 | | |
| | 71,592 | | | | | Duke Energy Corp. | | | 2,265,188 | | |
| | 23,476 | | | | | Duke Realty Corp. | | | 940,211 | | |
| | 50,768 | | | | | EI DuPont de Nemours & Co. | | | 2,324,711 | | |
| | 46,085 | | | | | Energy East Corp. | | | 1,120,173 | | |
| | 59,285 | | | L | | First Horizon National Corp. | | | 2,331,371 | | |
| | 19,201 | | | | | Hospitality Properties Trust | | | 930,450 | | |
| | 19,823 | | | | | iStar Financial, Inc. | | | 918,367 | | |
| | 61,061 | | | L | | Keycorp | | | 2,268,186 | | |
| | 30,199 | | | | | Kinder Morgan Energy
Partners LP | | | 1,346,703 | | |
| | 21,540 | | | | | Kinder Morgan, Inc. | | | 2,263,877 | | |
| | 18,744 | | | L | | Liberty Property Trust | | | 903,289 | | |
| | 52,800 | | | | | Merck & Co., Inc. | | | 2,398,148 | | |
| | 100,407 | | | | | NiSource, Inc. | | | 2,336,036 | | |
| | 40,433 | | | | | Oneok, Inc. | | | 1,683,342 | | |
| | 84,091 | | | | | Pfizer, Inc. | | | 2,240,705 | | |
| Shares | | | | Value | |
| | 37,371 | | | | | Public Service Enterprise
Group, Inc. | | $ | 2,281,441 | | |
| | 28,804 | | | | | Rayonier, Inc. | | | 1,180,497 | | |
| | 35,285 | | | L | | Reynolds American, Inc. | | | 2,229,031 | | |
| | 60,833 | | | | | Southern Co. | | | 2,214,599 | | |
| | 44,871 | | | | | Thornburg Mortgage, Inc. | | | 1,152,554 | | |
| | 33,011 | | | | | United Dominion Realty
Trust, Inc. | | | 1,068,582 | | |
| | 68,294 | | | | | US Bancorp. | | | 2,311,415 | | |
| | 64,415 | | | L | | UST, Inc. | | | 3,448,205 | | |
| | 22,829 | | | | | Ventas, Inc. | | | 889,890 | | |
| | 80,466 | | | | | Washington Mutual, Inc. | | | 3,403,640 | | |
| | | | 74,278,555 | | |
Total Common Stock
(Cost $190,677,752) | | | 215,312,701 | | |
| EQUITY-LINKED SECURITIES: 1.5% | | | |
| | | | | Taiwan: 1.5% | |
| | 753,596 | | | | | Formosa Chemicals &
Fibre Corp.
(Counterparty: Merrill) | | | 1,145,466 | | |
| | 942,935 | | | | | Lite-On Technology Corp.
(Counterparty: Citigroup) | | | 1,140,951 | | |
| | 1,616,000 | | | # | | Mega Financial
Holdings Co., Ltd.
(Counterparty: Morgan
Stanley) | | | 1,131,200 | | |
Total Equity-Linked Securities
(Cost $3,458,784) | | | 3,417,617 | | |
Total Long-Term Investments
(Cost $194,136,536) | | | 218,730,318 | | |
Principal
Amount | | | | Value | |
| SHORT-TERM INVESTMENTS: 6.8% | |
| | | Securities Lending Collateralcc: 6.8% | |
| $ | 15,854,000 | | | The Bank of New York
Institutional Cash
Reserves Fund | | $ | 15,854,000 | | |
Total Short-Term Investments
(Cost $15,854,000) | | | 15,854,000 | | |
Total Investments in
Securities
(Cost $209,990,536)* | | | 101.4 | % | | $ | 234,584,318 | | |
Other Assets and
Liabilities - Net | | | (1.4 | ) | | | (3,310,736 | ) | |
| Net Assets | | | 100.0 | % | | $ | 231,273,582 | | |
Securities may have been fair valued in accordance with procedures approved by the Board of Directors/Trustees (Note 2A).
@ Non-income producing security
ADR American Depositary Receipt
# Securities with purchases pursuant to Rule 144A, under the Securities Act of 1933 and may not be resold subject to that rule except to qualified institutional buyers. These securities have been determined to be liquid under the guidelines established by the Funds' Board of Directors/Trustees.
cc Securities purchased with cash collateral for securities loaned.
L Loaned security, a portion or all of the security is on loan at October 31, 2006.
See Accompanying Notes to Financial Statements
128
PORTFOLIO OF INVESTMENTS
ING GLOBAL EQUITY DIVIDEND FUND AS OF OCTOBER 31, 2006 (CONTINUED)
* Cost for federal income tax purposes is $210,939,398.
Net unrealized appreciation consists of:
| Gross Unrealized Appreciation | | $ | 26,077,341 | | |
| Gross Unrealized Depreciation | | | (2,432,421 | ) | |
| Net Unrealized Appreciation | | $ | 23,644,920 | | |
| Industry | | Percentage of
Net Assets | |
| Agriculture | | | 5.0 | % | |
| Auto Manufacturers | | | 0.5 | | |
| Banks | | | 22.4 | | |
| Beverages | | | 2.5 | | |
| Building Materials | | | 0.4 | | |
| Chemicals | | | 1.5 | | |
| Coal | | | 0.8 | | |
| Commercial Services | | | 0.5 | | |
| Computers | | | 0.5 | | |
| Diversified Financial Services | | | 2.4 | | |
| Electric | | | 9.1 | | |
| Entertainment | | | 1.5 | | |
| Environmental Control | | | 0.1 | | |
| Forest Products & Paper | | | 1.5 | | |
| Gas | | | 2.2 | | |
| Holding Companies - Diversified | | | 0.5 | | |
| Insurance | | | 2.5 | | |
| Iron/Steel | | | 0.5 | | |
| Media | | | 2.4 | | |
| Miscellaneous Manufacturing | | | 1.3 | | |
| Oil & Gas | | | 7.0 | | |
| Pharmaceuticals | | | 3.9 | | |
| Pipelines | | | 2.8 | | |
| Real Estate | | | 1.4 | | |
| Real Estate Investment Trust | | | 3.4 | | |
| Retail | | | 1.4 | | |
| Savings & Loans | | | 1.5 | | |
| Telecommunications | | | 13.0 | | |
| Water | | | 1.0 | | |
| Other Long-Term Investments | | | 1.1 | | |
| Short-Term Investments | | | 6.8 | | |
| Other Assets and Liabilities - Net | | | (1.4 | ) | |
| Net Assets | | | 100.0 | % | |
See Accompanying Notes to Financial Statements
129
PORTFOLIO OF INVESTMENTS
ING GLOBAL NATURAL RESOURCES FUND AS OF OCTOBER 31, 2006
| Shares | | | | Value | |
| COMMON STOCK: 99.2% | | | |
| | | | | Australia: 0.5% | |
| | 14,200 | | | | | BHP Billiton Ltd. ADR | | $ | 604,494 | | |
| | | | 604,494 | | |
| | | | | Bermuda: 0.3% | |
| | 86,100 | | | @ | | Energy XXI Acquisition Corp.
Bermuda Ltd. | | | 430,500 | | |
| | | | 430,500 | | |
| | | | | Brazil: 2.9% | |
| | 36,700 | | | | | Cia Vale do Rio Doce ADR | | | 933,648 | | |
| | 119,300 | | | | | Petroleo Brasileiro SA | | | 2,640,588 | | |
| | | | 3,574,236 | | |
| | | | | Canada: 9.3% | |
| | 27,300 | | | | | Agnico-Eagle Mines Ltd. | | | 1,009,281 | | |
| | 22,900 | | | | | Alcan, Inc. | | | 1,078,819 | | |
| | 38,900 | | | | | Cameco Corp. | | | 1,368,316 | | |
| | 220,250 | | | @ | | Eldorado Gold Corp. | | | 935,565 | | |
| | 17,600 | | | # | | First Quantum Minerals Ltd. | | | 1,005,423 | | |
| | 32,100 | | | @ | | Glamis Gold Ltd. | | | 1,413,263 | | |
| | 1 | | | | | Iamgold Corp. | | | 8 | | |
| | 49,100 | | | @ | | Kinross Gold Corp. | | | 648,120 | | |
| | 75,500 | | | @ | | Major Drilling
Group International | | | 1,502,672 | | |
| | 195,900 | | | @ | | Shore Gold, Inc. | | | 933,314 | | |
| | 18,100 | | | # | | Teck Cominco Ltd. | | | 1,332,335 | | |
| | | | 11,227,116 | | |
| | | | | France: 1.9% | |
| | 753 | | | @ | | Arkema ADR | | | 36,762 | | |
| | 33,400 | | | | | Total SA ADR | | | 2,275,876 | | |
| | | | 2,312,638 | | |
| | | | | Jersey: 1.2% | |
| | 62,500 | | | @ | | Randgold Resources Ltd. ADR | | | 1,416,875 | | |
| | | | 1,416,875 | | |
| | | | | Netherlands: 3.7% | |
| | 17,800 | | | | | Mittal Steel Co. NV | | | 760,950 | | |
| | 54,200 | | | | | Royal Dutch Shell PLC ADR | | | 3,773,404 | | |
| | | | 4,534,354 | | |
| | | | | Papua New Guinea: 1.1% | |
| | 606,000 | | | | | Lihir Gold Ltd. | | | 1,303,903 | | |
| | | | 1,303,903 | | |
| | | | | Russia: 2.9% | |
| | 18,900 | | | | | Lukoil ADR | | | 1,540,153 | | |
| | 45,400 | | | | | OAO Gazprom ADR | | | 1,926,656 | | |
| | | | 3,466,809 | | |
| | | | | South Africa: 0.6% | |
| | 41,100 | | | | | Gold Fields Ltd. | | | 682,937 | | |
| | | | 682,937 | | |
| | | | | United Kingdom: 0.5% | |
| | 2,900 | | | | | Rio Tinto PLC ADR | | | 642,031 | | |
| | | | 642,031 | | |
| | | | | United States: 74.3% | |
| | 100,235 | | | @ | | Allis-Chalmers Energy, Inc. | | | 1,510,541 | | |
| | 12,200 | | | | | Anadarko Petroleum Corp. | | | 566,324 | | |
| Shares | | | | Value | |
| | 49,600 | | | | | Arch Coal, Inc. | | $ | 1,717,648 | | |
| | 40,953 | | | @,I | | Arena Resources, Inc. | | | 1,462,841 | | |
| | 42,800 | | | | | Cabot Oil & Gas Corp. | | | 2,264,548 | | |
| | 253,771 | | | @ | | Cano Petroleum, Inc. | | | 1,319,609 | | |
| | 36,900 | | | | | Chevron Corp. | | | 2,479,680 | | |
| | 11,100 | | | | | Cleveland-Cliffs, Inc. | | | 469,419 | | |
| | 24,100 | | | | | ConocoPhillips | | | 1,451,784 | | |
| | 65,528 | | | @ | | Delta Petroleum Corp. | | | 1,684,070 | | |
| | 40,500 | | | @ | | Denbury Resources, Inc. | | | 1,163,970 | | |
| | 7,300 | | | | | Devon Energy Corp. | | | 487,932 | | |
| | 45,700 | | | | | ENSCO International, Inc. | | | 2,237,929 | | |
| | 21,500 | | | | | EOG Resources, Inc. | | | 1,430,395 | | |
| | 142,500 | | | @ | | Evergreen Energy, Inc. | | | 1,831,125 | | |
| | 106,732 | | | @ | | EXCO Resources, Inc. | | | 1,545,479 | | |
| | 139,600 | | | | | ExxonMobil Corp. | | | 9,970,232 | | |
| | 32,700 | | | @ | | FMC Technologies, Inc. | | | 1,976,715 | | |
| | 40,500 | | | | | Freeport-McMoRan Copper &
Gold, Inc. | | | 2,449,440 | | |
| | 76,741 | | | @ | | GeoMet, Inc. | | | 861,801 | | |
| | 22,900 | | | @ | | GlobalSantaFe Corp. | | | 1,188,510 | | |
| | 35,765 | | | @ | | Goodrich Petroleum Corp. | | | 1,223,521 | | |
| | 89,100 | | | @ | | Hecla Mining Co. | | | 580,041 | | |
| | 43,184 | | | @ | | Hercules Offshore, Inc. | | | 1,538,214 | | |
| | 60,400 | | | | | Hess Corp. | | | 2,560,960 | | |
| | 24,433 | | | | | Hiland Holdings GP LP | | | 586,148 | | |
| | 132,500 | | | @ | | Key Energy Services, Inc. | | | 1,855,000 | | |
| | 9,900 | | | | | Marathon Oil Corp. | | | 855,360 | | |
| | 24,600 | | | @ | | McDermott International, Inc. | | | 1,099,620 | | |
| | 108,156 | | | @ | | Mirant Corp. | | | 3,198,173 | | |
| | 16,100 | | | @ | | National Oilwell Varco, Inc. | | | 972,440 | | |
| | 92,000 | | | @ | | Newfield Exploration Co. | | | 3,752,680 | | |
| | 78,000 | | | | | Occidental Petroleum Corp. | | | 3,661,320 | | |
| | 73,191 | | | @ | | Parallel Petroleum Corp. | | | 1,482,118 | | |
| | 12,800 | | | | | Peabody Energy Corp. | | | 537,216 | | |
| | 53,598 | | | @,I | | PetroHawk Energy Corp. | | | 607,265 | | |
| | 24,000 | | | | | Phelps Dodge Corp. | | | 2,409,120 | | |
| | 67,100 | | | @ | | Plains Exploration &
Production Co. | | | 2,837,659 | | |
| | 43,600 | | | @ | | Pride International, Inc. | | | 1,203,796 | | |
| | 66,600 | | | | | Rowan Cos., Inc. | | | 2,223,108 | | |
| | 79,600 | | | | | Schlumberger Ltd. | | | 5,021,169 | | |
| | 90,400 | | | @ | | Southwestern Energy Co. | | | 3,216,432 | | |
| | 75,600 | | | @ | | Superior Energy Services | | | 2,366,280 | | |
| | 14,700 | | | | | United States Steel Corp. | | | 993,720 | | |
| | 56,800 | | | @ | | Weatherford International Ltd. | | | 2,333,344 | | |
| | 60,300 | | | | | XTO Energy, Inc. | | | 2,813,598 | | |
| | | | 89,998,294 | | |
Total Investments in
Securities
(Cost $110,354,426)* | | | 99.2 | % | | $ | 120,194,187 | | |
Other Assets and
Liabilities - Net | | | 0.8 | | | | 918,236 | | |
| Net Assets | | | 100.0 | % | | $ | 121,112,423 | | |
See Accompanying Notes to Financial Statements
130
PORTFOLIO OF INVESTMENTS
ING GLOBAL NATURAL RESOURCES FUND AS OF OCTOBER 31, 2006 (CONTINUED)
Securities may have been fair valued in accordance with procedures approved by the Board of Directors/Trustees (Note 2A).
@ Non-income producing security
ADR American Depositary Receipt
# Securities with purchases pursuant to Rule 144A, under the Securities Act of 1933 and may not be resold subject to that rule except to qualified institutional buyers. These securities have been determined to be liquid under the guidelines established by the Funds' Board of Directors/Trustees.
I Illiquid security
* Cost for federal income tax purposes is $110,536,478.
| Net unrealized appreciation consists of: | |
| Gross Unrealized Appreciation | | $ | 10,324,327 | | |
| Gross Unrealized Depreciation | | | (666,618 | ) | |
| Net Unrealized Appreciation | | $ | 9,657,709 | | |
| Industry | | Percentage of
Net Assets | |
| Chemicals | | | 0.0 | % | |
| Coal | | | 1.9 | | |
| Electric | | | 2.6 | | |
| Energy - Alternate Sources | | | 1.5 | | |
| Engineering & Construction | | | 0.9 | | |
| Iron/Steel | | | 1.8 | | |
| Mining | | | 18.4 | | |
| Oil & Gas | | | 57.2 | | |
| Oil & Gas Services | | | 14.5 | | |
| Other Long-Term Investments | | | 0.4 | | |
| Other Assets and Liabilities - Net | | | 0.8 | | |
| Net Assets | | | 100.0 | % | |
See Accompanying Notes to Financial Statements
131
PORTFOLIO OF INVESTMENTS
ING GLOBAL REAL ESTATE FUND AS OF OCTOBER 31, 2006
| Shares | | | | Value | |
| COMMON STOCK: 95.2% | | | |
| | | | | Australia: 9.8% | |
| | 806,499 | | | | | Centro Properties Group | | $ | 4,821,506 | | |
| | 1,737,400 | | | | | DB Rreef Trust | | | 2,219,049 | | |
| | 2,724,900 | | | | | GPT Group | | | 9,959,523 | | |
| | 2,807,100 | | | | | Investa Property Group | | | 5,214,058 | | |
| | 1,955,600 | | | | | Macquarie CountryWide Trust | | | 2,990,597 | | |
| | 1,652,400 | | | | | Macquarie Goodman Group | | | 8,474,187 | | |
| | 593,000 | | | | | Mirvac Group | | | 2,246,554 | | |
| | 584,000 | | | | | Stockland | | | 3,425,458 | | |
| | 1,486,078 | | | | | Westfield Group | | | 21,432,813 | | |
| | | | 60,783,745 | | |
| | | | | Austria: 0.6% | |
| | 180,800 | | | @ | | Conwert Immobilien Invest AG | | | 3,790,559 | | |
| | | | 3,790,559 | | |
| | | | | Canada: 2.2% | |
| | 51,000 | | | | | Calloway Real Estate
Investment Trust | | | 1,295,267 | | |
| | 64,000 | | | @,# | | Calloway Real Estate
Investment Trust | | | 1,625,433 | | |
| | 70,300 | | | | | Dundee Real Estate
Investment Trust | | | 2,190,478 | | |
| | 270,600 | | | | | RioCan Real Estate
Investment Trust | | | 5,908,644 | | |
| | 253,700 | | | @ | | Sunrise Senior Living, Inc. | | | 2,451,262 | | |
| | | | 13,471,084 | | |
| | | | | China: 0.5% | |
| | 1,892,500 | | | | | Guangzhou R&F
Properties Co., Ltd. | | | 3,082,379 | | |
| | | | 3,082,379 | | |
| | | | | Finland: 0.5% | |
| | 248,600 | | | | | Sponda OYJ | | | 3,099,723 | | |
| | | | 3,099,723 | | |
| | | | | France: 3.6% | |
| | 57,200 | | | | | Klepierre | | | 8,625,157 | | |
| | 30,400 | | | | | Societe de la Tour Eiffel | | | 4,694,771 | | |
| | 42,500 | | | | | Unibail | | | 9,248,693 | | |
| | | | 22,568,621 | | |
| | | | | Germany: 0.9% | |
| | 39,855 | | | | | Deutsche Wohnen AG | | | 2,568,796 | | |
| | 8,000 | | | | | Deutsche Wohnen AG -
Registered Shares | | | 500,535 | | |
| | 28,100 | | | | | IVG Immobilien AG | | | 1,020,120 | | |
| | 57,300 | | | @ | | Patrizia Immobilien AG | | | 1,463,690 | | |
| | | | 5,553,141 | | |
| | | | | Guernsey: 0.3% | |
| | 1,375,500 | | | @ | | Develica Deutschland Ltd. | | | 1,725,893 | | |
| | | | 1,725,893 | | |
| | | | | Hong Kong: 7.5% | |
| | 5,083,950 | | | @ | | Champion Real Estate
Investment Trust | | | 2,520,802 | | |
| | 639,900 | | | | | Cheung Kong Holdings Ltd. | | | 6,953,060 | | |
| | 678,500 | | | | | Hang Lung Properties Ltd. | | | 1,730,646 | | |
| | 2,333,000 | | | | | Hongkong Land Holdings Ltd. | | | 8,772,080 | | |
| | 1,267,000 | | | | | Kerry Properties Ltd. | | | 4,664,593 | | |
| Shares | | | | Value | |
| | 1,618,700 | | | | | Link Real Estate
Investment Trust | | $ | 3,325,081 | | |
| | 3,788,800 | | | @ | | Shui On Land Ltd. | | | 2,923,006 | | |
| | 1,433,200 | | | | | Sun Hung Kai Properties Ltd. | | | 15,651,297 | | |
| | | | 46,540,565 | | |
| | | | | Italy: 0.2% | |
| | 950,000 | | | | | Beni Stabili S.p.A. | | | 1,077,913 | | |
| | | | 1,077,913 | | |
| | | | | Japan: 12.6% | |
| | 322 | | | | | Japan Logistics Fund, Inc. | | | 2,397,662 | | |
| | 365 | | | | | Japan Retail Fund
Investment Corp. | | | 2,824,248 | | |
| | 326 | | | | | Kenedix Realty Investment Corp. | | | 1,749,489 | | |
| | 76,900 | | | | | Leopalace21 Corp. | | | 2,887,798 | | |
| | 1,110,800 | | | | | Mitsubishi Estate Co., Ltd. | | | 26,566,814 | | |
| | 954,400 | | | | | Mitsui Fudosan Co., Ltd. | | | 23,480,120 | | |
| | 461 | | | | | Nippon Building Fund, Inc. | | | 4,965,245 | | |
| | 395,300 | | | | | Sumitomo Realty &
Development Co., Ltd. | | | 13,096,652 | | |
| | | | 77,968,028 | | |
| | | | | Luxembourg: 0.5% | |
| | 168,600 | | | | | Prologis European Properties | | | 3,184,746 | | |
| | | | 3,184,746 | | |
| | | | | Netherlands: 1.9% | |
| | 1,085 | | | | | Eurocommercial Properties NV | | | 53,960 | | |
| | 78,700 | | | | | Rodamco Europe NV | | | 9,104,348 | | |
| | 33,700 | | | | | Vastned Retail NV | | | 2,939,299 | | |
| | | | 12,097,607 | | |
| | | | | Singapore: 1.9% | |
| | 1,732,800 | | | | | CapitaLand Ltd. | | | 6,067,704 | | |
| | 1,736,000 | | | L | | CapitaMall Trust | | | 2,889,623 | | |
| | 371,000 | | | | | City Developments Ltd. | | | 2,619,112 | | |
| | | | 11,576,439 | | |
| | | | | South Korea: 0.0% | |
| | 20,000 | | | @,#,L | | Lotte Shopping Co. GDR | | | 374,120 | | |
| | | | 374,120 | | |
| | | | | Sweden: 0.9% | |
| | 446,800 | | | | | Castellum AB | | | 5,342,377 | | |
| | | | 5,342,377 | | |
| | | | | United Kingdom: 11.2% | |
| | 196,300 | | | | | Atlas Estates Ltd. | | | 1,139,421 | | |
| | 583,700 | | | | | British Land Co. PLC | | | 16,644,678 | | |
| | 149,215 | | | | | Capital & Regional PLC | | | 3,650,136 | | |
| | 147,300 | | | | | Derwent Valley Holdings PLC | | | 5,572,453 | | |
| | 532,000 | | | | | Great Portland Estates PLC | | | 6,090,492 | | |
| | 357,100 | | | | | Hammerson PLC | | | 9,175,366 | | |
| | 1,266,400 | | | ** | | ING UK Real Estate
Income Trust Ltd. | | | 2,956,232 | | |
| | 463,350 | | | | | Land Securities Group PLC | | | 18,530,233 | | |
| | 21,600 | | | | | Mapeley Ltd. | | | 1,438,834 | | |
| | 316,700 | | | | | Slough Estates PLC | | | 4,138,469 | | |
| | | | 69,336,314 | | |
See Accompanying Notes to Financial Statements
132
PORTFOLIO OF INVESTMENTS
ING GLOBAL REAL ESTATE FUND AS OF OCTOBER 31, 2006 (CONTINUED)
| Shares | | | | Value | |
| | | | | United States: 40.1% | |
| | 97,400 | | | L | | AMB Property Corp. | | $ | 5,689,134 | | |
| | 208,400 | | | | | Archstone-Smith Trust | | | 12,547,764 | | |
| | 82,500 | | | L | | AvalonBay Communities, Inc. | | | 10,812,450 | | |
| | 89,900 | | | | | BioMed Realty Trust, Inc. | | | 2,897,477 | | |
| | 119,200 | | | L | | Boston Properties, Inc. | | | 12,734,136 | | |
| | 102,300 | | | L | | BRE Properties, Inc. | | | 6,782,490 | | |
| | 63,300 | | | | | Camden Property Trust | | | 5,109,576 | | |
| | 97,000 | | | L | | Corporate Office Properties
Trust SBI MD | | | 4,635,630 | | |
| | 96,400 | | | L | | Developers Diversified
Realty Corp. | | | 5,870,760 | | |
| | 147,900 | | | @ | | Douglas Emmett, Inc. | | | 3,527,415 | | |
| | 276,100 | | | | | Equity Office Properties Trust | | | 11,734,250 | | |
| | 241,300 | | | L | | Equity Residential | | | 13,177,393 | | |
| | 115,100 | | | | | Extra Space Storage, Inc. | | | 2,122,444 | | |
| | 94,200 | | | L | | Federal Realty Investment Trust | | | 7,550,130 | | |
| | 58,000 | | | | | FelCor Lodging Trust, Inc. | | | 1,204,080 | | |
| | 95,400 | | | | | General Growth Properties, Inc. | | | 4,951,260 | | |
| | 114,500 | | | | | Highwoods Properties, Inc. | | | 4,373,900 | | |
| | 449,010 | | | L | | Host Hotels & Resorts, Inc. | | | 10,354,171 | | |
| | 69,200 | | | L | | Kilroy Realty Corp. | | | 5,212,836 | | |
| | 52,665 | | | L | | Kimco Realty Corp. | | | 2,339,906 | | |
| | 90,700 | | | | | Liberty Property Trust | | | 4,371,740 | | |
| | 101,100 | | | | | Macerich Co. | | | 8,123,385 | | |
| | 119,100 | | | L | | Maguire Properties, Inc. | | | 5,092,716 | | |
| | 76,200 | | | | | Nationwide Health
Properties, Inc. | | | 2,189,988 | | |
| | 202,300 | | | | | Omega Healthcare
Investors, Inc. | | | 3,414,824 | | |
| | 97,700 | | | | | Post Properties, Inc. | | | 4,785,346 | | |
| | 198,100 | | | L | | Prologis | | | 12,533,787 | | |
| | 111,554 | | | L | | Public Storage, Inc. | | | 10,007,509 | | |
| | 78,700 | | | L | | Regency Centers Corp. | | | 5,678,992 | | |
| | 175,500 | | | | | Simon Property Group, Inc. | | | 17,041,050 | | |
| | 74,600 | | | L | | SL Green Realty Corp. | | | 9,030,330 | | |
| | 177,000 | | | L | | Strategic Hotel Capital, Inc. | | | 3,764,790 | | |
| | 86,200 | | | L | | Sunstone Hotel Investors, Inc. | | | 2,539,452 | | |
| | 57,200 | | | | | Taubman Centers, Inc. | | | 2,682,680 | | |
| | 134,500 | | | L | | United Dominion Realty
Trust, Inc. | | | 4,353,765 | | |
| | 129,500 | | | | | Ventas, Inc. | | | 5,047,910 | | |
| | 92,000 | | | | | Vornado Realty Trust | | | 10,971,000 | | |
| | 78,100 | | | L | | Washington Real Estate
Investment Trust | | | 3,291,915 | | |
| | | | 248,548,381 | | |
Total Common Stock
(Cost $467,449,372) | | | 590,121,635 | | |
| POSITIONS IN PURCHASED OPTIONS: 0.7% | | | |
| | | | | Brazil: 0.7% | |
| | 517,500 | | | | | American Style Call Option OTC
Brascan Residential
Properties SA Zero Strike
Option Exp 10/22/07 | | | 4,144,349 | | |
Total Options Purchased
(Cost $3,881,855) | | | 4,144,349 | | |
Total Long-Term Investments
(Cost $471,331,227) | | | 594,265,984 | | |
Principal
Amount | | | | Value | |
| SHORT-TERM INVESTMENTS: 8.8% | |
| | | U.S. Government Agency Obligations: 3.7% | |
| $ | 22,831,000 | | | Federal Home Loan Bank,
4.760%, due 11/01/06 | | $ | 22,827,981 | | |
Total U.S. Government Agency
Obligations
(Cost $22,827,981) | | | 22,827,981 | | |
| | | Securities Lending Collateralcc: 5.1% | |
| | 31,514,000 | | | The Bank of New York
Institutional Cash
Reserves Fund | | | 31,514,000 | | |
Total Securities Lending
Collateral
(Cost $31,514,000) | | | 31,514,000 | | |
Total Short-Term Investments
(Cost $54,341,981) | | | 54,341,981 | | |
Total Investments in
Securities
(Cost $525,673,208)* | | | 104.7 | % | | $ | 648,607,965 | | |
Other Assets and
Liabilities - Net | | | (4.7 | ) | | | (29,102,814 | ) | |
| Net Assets | | | 100.0 | % | | $ | 619,505,151 | | |
Securities may have been fair valued in accordance with procedures approved by the Board of Directors/Trustees (Note 2A).
@ Non-income producing security
** Investment in affiliate
GDR Global Depositary Receipt
# Securities with purchases pursuant to Rule 144A, under the Securities Act of 1933 and may not be resold subject to that rule except to qualified institutional buyers. These securities have been determined to be liquid under the guidelines established by the Funds' Board of Directors/Trustees.
cc Securities purchased with cash collateral for securities loaned.
L Loaned security, a portion or all of the security is on loan at October 31, 2006.
* Cost for federal income tax purposes is $543,850,780.
Net unrealized appreciation consists of:
| Gross Unrealized Appreciation | | $ | 104,952,446 | | |
| Gross Unrealized Depreciation | | | (195,261 | ) | |
| Net Unrealized Appreciation | | $ | 104,757,185 | | |
| Industry | | Percentage of
Net Assets | |
| Distribution/Wholesale | | | 0.1 | % | |
| Diversified Property Holdings | | | 8.1 | | |
| Healthcare | | | 1.7 | | |
| Offices | | | 11.1 | | |
| Property Trust | | | 9.8 | | |
| Real Estate Management/Services | | | 7.4 | | |
| Real Estate Operation/Development | | | 25.6 | | |
| Residential: Apartments | | | 10.0 | | |
| Residential: Hotels | | | 2.9 | | |
| Retail: Regional Malls | | | 5.3 | | |
| Retail: Shopping Centers | | | 6.8 | | |
| Retirement/Aged Care | | | 0.4 | | |
| Storage | | | 1.9 | | |
| Warehouse/Industrial | | | 3.3 | | |
| Other Long-Term Investments | | | 1.5 | | |
| Short-Term Investments | | | 8.8 | | |
| Other Assets and Liabilities - Net | | | (4.7 | ) | |
| Net Assets | | | 100.0 | % | |
See Accompanying Notes to Financial Statements
133
PORTFOLIO OF INVESTMENTS
ING GLOBAL VALUE CHOICE FUND AS OF OCTOBER 31, 2006
| Shares | | | | Value | |
| COMMON STOCK: 90.9% | | | |
| | | | | Australia: 1.1% | |
| | 215,560 | | | | | Alumina Ltd. | | $ | 1,129,215 | | |
| | | | 1,129,215 | | |
| | | | | Belgium: 1.7% | |
| | 44,842 | | | | | Belgacom SA | | | 1,832,093 | | |
| | | | 1,832,093 | | |
| | | | | Canada: 10.9% | |
| | 139,059 | | | L | | Barrick Gold Corp. | | | 4,310,829 | | |
| | 488,800 | | | @,L | | Bema Gold Corp. | | | 2,116,504 | | |
| | 325,300 | | | @,L | | Domtar, Inc. | | | 2,130,715 | | |
| | 119,200 | | | @,L | | Ivanhoe Mines Ltd. | | | 1,257,560 | | |
| | 23,800 | | | L | | Magna International, Inc. | | | 1,780,240 | | |
| | | | 11,595,848 | | |
| | | | | Finland: 1.6% | |
| | 105,000 | | | | | Stora Enso OYJ | | | 1,696,825 | | |
| | | | 1,696,825 | | |
| | | | | France: 7.1% | |
| | 2,500 | | | | | Areva SA | | | 1,583,761 | | |
| | 38,700 | | | | | Technip SA ADR | | | 2,343,285 | | |
| | 54,300 | | | | | Thales SA | | | 2,509,480 | | |
| | 16,800 | | | | | Total SA | | | 1,136,450 | | |
| | | | 7,572,976 | | |
| | | | | Germany: 1.6% | |
| | 110,000 | | | @,L | | Premiere AG | | | 1,667,856 | | |
| | | | 1,667,856 | | |
| | | | | Italy: 3.2% | |
| | 46,144 | | | | | ENI S.p.A. | | | 1,395,847 | | |
| | 811,926 | | | | | Telecom Italia S.p.A. | | | 2,050,863 | | |
| | | | 3,446,710 | | |
| | | | | Japan: 12.3% | |
| | 51,800 | | | | | Fuji Photo Film Co., Ltd. | | | 1,924,610 | | |
| | 8,100 | | | | | Kao Corp. ADR | | | 2,122,573 | | |
| | 86,000 | | | | | Kirin Brewery Co., Ltd. | | | 1,143,770 | | |
| | 3,500 | | | | | Mabuchi Motor Co., Ltd. | | | 203,998 | | |
| | 31,000 | | | @,L | | NEC Electronics Corp. | | | 989,147 | | |
| | 42,000 | | | | | Nippon Telegraph &
Telephone Corp. ADR | | | 1,055,460 | | |
| | 84,000 | | | | | Sekisui House Ltd. | | | 1,327,454 | | |
| | 46,000 | | | | | Takefuji Corp. | | | 1,667,439 | | |
| | 29,300 | | | | | Toppan Printing Co., Ltd. ADR | | | 1,603,114 | | |
| | 81,000 | | | | | Wacoal Holdings Corp. | | | 978,979 | | |
| | | | 13,016,544 | | |
| | | | | Netherlands: 1.9% | |
| | 27,583 | | | | | Royal Dutch Shell PLC ADR | | | 1,985,976 | | |
| | | | 1,985,976 | | |
| | | | | Papua New Guinea: 1.2% | |
| | 603,204 | | | @ | | Lihir Gold Ltd. | | | 1,297,887 | | |
| | | | 1,297,887 | | |
| | | | | Portugal: 1.3% | |
| | 297,602 | | | | | Electricidade de Portugal SA | | | 1,338,409 | | |
| | | | 1,338,409 | | |
| Shares | | | | Value | |
| | | | | South Africa: 2.5% | |
| | 49,600 | | | L | | Anglogold Ashanti Ltd. ADR | | $ | 2,111,472 | | |
| | 3,000 | | | | | Impala Platinum Holdings Ltd. | | | 526,901 | | |
| | | | 2,638,373 | | |
| | | | | South Korea: 3.7% | |
| | 64,550 | | | L | | Korea Electric Power Corp. ADR | | | 1,276,799 | | |
| | 77,700 | | | | | KT Corp. ADR | | | 1,738,926 | | |
| | 20,000 | | | | | Samsung SDI Co., Ltd. | | | 924,646 | | |
| | | | 3,940,371 | | |
| | | | | Switzerland: 0.8% | |
| | 20,780 | | | | | Xstrata PLC | | | 884,813 | | |
| | | | 884,813 | | |
| | | | | Taiwan: 2.1% | |
| | 118,932 | | | | | Chunghwa Telecom Co.,
Ltd. ADR | | | 2,175,266 | | |
| | | | 2,175,266 | | |
| | | | | United Kingdom: 6.8% | |
| | 58,300 | | | | | Anglo American PLC | | | 2,638,631 | | |
| | 23,492 | | | | | Lonmin PLC | | | 1,296,863 | | |
| | 38,900 | | | L | | Stolt-Nielsen SA ADR | | | 1,116,041 | | |
| | 78,549 | | | | | United Utilities PLC | | | 1,069,152 | | |
| | 437,500 | | | | | Vodafone Group PLC | | | 1,127,330 | | |
| | | | 7,248,017 | | |
| | | | | United States: 31.1% | |
| | 180,500 | | | @,L | | AGCO Corp. | | | 4,828,375 | | |
| | 102,500 | | | | | Alcoa, Inc. | | | 2,963,275 | | |
| | 31,700 | | | @,L | | Allied Waste Industries, Inc. | | | 385,155 | | |
| | 218,900 | | | @,L | | Apex Silver Mines Ltd. | | | 3,458,620 | | |
| | 74,800 | | | | | Microsoft Corp. | | | 2,147,508 | | |
| | 111,300 | | | @,L | | Mosaic Co. | | | 2,083,536 | | |
| | 40,000 | | | | | Newmont Mining Corp. | | | 1,810,800 | | |
| | 29,000 | | | | | Peabody Energy Corp. | | | 1,217,130 | | |
| | 74,500 | | | | | PNM Resources, Inc. | | | 2,097,920 | | |
| | 101,300 | | | @ | | Smithfield Foods, Inc. | | | 2,722,944 | | |
| | 72,200 | | | | | Sprint Nextel Corp. | | | 1,349,418 | | |
| | 310,300 | | | L | | Tyson Foods, Inc. | | | 4,483,835 | | |
| | 37,400 | | | | | Union Pacific Corp. | | | 3,389,564 | | |
| | | | 32,938,080 | | |
Total Common Stock
(Cost $88,083,835) | | | 96,405,259 | | |
Principal
Amount | | | | Value | |
| SHORT-TERM INVESTMENTS: 31.6% | |
| | | U.S. Government Agency Obligations: 6.4% | |
| $ | 6,783,000 | | | Federal Home Loan Bank,
4.760%, due 11/01/06 | | $ | 6,782,103 | | |
Total U.S. Government Agency
Obligations
(Cost $6,782,103) | | | 6,782,103 | | |
See Accompanying Notes to Financial Statements
134
PORTFOLIO OF INVESTMENTS
ING GLOBAL VALUE CHOICE FUND AS OF OCTOBER 31, 2006 (CONTINUED)
Principal
Amount | | | | Value | |
| | | Securities Lending Collateralcc: 25.2% | |
| $ | 26,721,000 | | | The Bank of New York
Institutional Cash
Reserves Fund | | $ | 26,721,000 | | |
Total Securities Lending
Collateral
(Cost $26,721,000) | | | 26,721,000 | | |
Total Short-Term Investments
(Cost $33,503,103) | | | 33,503,103 | | |
Total Investments in
Securities
(Cost $121,586,938)* | | | 122.5 | % | | $ | 129,908,362 | | |
Other Assets and
Liabilities - Net | | | (22.5 | ) | | | (23,860,605 | ) | |
| Net Assets | | | 100.0 | % | | $ | 106,047,757 | | |
Securities may have been fair valued in accordance with procedures approved by the Board of Directors/Trustees (Note 2A).
@ Non-income producing security
ADR American Depositary Receipt
cc Securities purchased with cash collateral for securities loaned.
L Loaned security, a portion or all of the security is on loan at October 31, 2006.
* Cost for federal income tax purposes is $121,700,871.
Net Unrealized appreciation consists of:
| Gross Unrealized Appreciation | | $ | 11,724,987 | | |
| Gross Unrealized Depreciation | | | (3,517,496 | ) | |
| Net Unrealized Appreciation | | $ | 8,207,491 | | |
| Industry | | Percentage of
Net Assets | |
| Aerospace/Defense | | | 2.4 | % | |
| Apparel | | | 0.9 | | |
| Auto Parts & Equipment | | | 1.7 | | |
| Beverages | | | 1.1 | | |
| Chemicals | | | 2.0 | | |
| Coal | | | 1.1 | | |
| Commercial Services | | | 1.5 | | |
| Cosmetics/Personal Care | | | 2.0 | | |
| Diversified Financial Services | | | 1.6 | | |
| Electric | | | 4.4 | | |
| Electronics | | | 1.1 | | |
| Energy - Alternate Sources | | | 1.5 | | |
| Environmental Control | | | 0.4 | | |
| Food | | | 6.8 | | |
| Forest Products & Paper | | | 3.6 | | |
| Home Builders | | | 1.2 | | |
| Machinery - Diversified | | | 4.6 | | |
| Media | | | 1.6 | | |
| Mining | | | 24.3 | | |
| Miscellaneous Manufacturing | | | 1.8 | | |
| Oil & Gas | | | 4.3 | | |
| Oil & Gas Services | | | 2.2 | | |
| Semiconductors | | | 0.9 | | |
| Software | | | 2.0 | | |
| Telecommunications | | | 10.7 | | |
| Transportation | | | 4.2 | | |
| Water | | | 1.0 | | |
| Short-Term Investments | | | 31.6 | | |
| Other Assets and Liabilities - Net | | | (22.5 | ) | |
| Net Assets | | | 100.0 | % | |
See Accompanying Notes to Financial Statements
135
PORTFOLIO OF INVESTMENTS
ING EMERGING COUNTRIES FUND AS OF OCTOBER 31, 2006
| Shares | | | | Value | |
| COMMON STOCK: 93.1% | | | |
| | | | | Argentina: 4.0% | |
| | 707,964 | | | @,L | | Grupo Financiero Galicia
SA ADR | | $ | 5,522,119 | | |
| | 178,070 | | | @ | | Telecom Argentina SA ADR | | | 2,688,857 | | |
| | | | 8,210,976 | | |
| | | | | Brazil: 13.0% | |
| | 105,898,352 | | | | | AES Tiete SA | | | 2,680,220 | | |
| | 127,000 | | | L | | Brasil Telecom Participacoes
SA ADR | | | 4,250,690 | | |
| | 179,200 | | | | | Centrais Eletricas Brasileiras
SA ADR | | | 1,890,058 | | |
| | 44,145,500 | | | @ | | Cia de Saneamento Basico do
Estado de Sao Paulo | | | 5,308,179 | | |
| | 3,004,200 | | | | | Contax Participacoes SA | | | 2,426,928 | | |
| | 64,500 | | | L | | Contax Participacoes SA ADR | | | 52,193 | | |
| | 149,190 | | | | | Tele Norte Leste Participacoes
SA ADR | | | 2,158,779 | | |
| | 99,900 | | | L | | Tim Participacoes SA ADR | | | 3,356,640 | | |
| | 1,416,788 | | | @,L | | Vivo Participacoes SA ADR | | | 4,944,590 | | |
| | | | 27,068,277 | | |
| | | | | Chile: 2.3% | |
| | 188,720 | | | | | AFP Provida SA ADR | | | 4,806,698 | | |
| | | | 4,806,698 | | |
| | | | | China: 3.9% | |
| | 3,472,000 | | | | | People's Food Holdings Ltd. | | | 2,621,193 | | |
| | 3,922,000 | | | | | Weiqiao Textile Co. | | | 5,375,448 | | |
| | | | 7,996,641 | | |
| | | | | Czech Republic: 0.9% | |
| | 91,548 | | | | | Telefonica O2 Czech Republic AS | | | 1,922,619 | | |
| | | | 1,922,619 | | |
| | | | | Estonia: 1.1% | |
| | 77,771 | | | | | Eesti Telekom GDR | | | 2,292,985 | | |
| | | | 2,292,985 | | |
| | | | | Greece: 1.4% | |
| | 225,400 | | | @ | | Hellenic Telecommunications
Organization SA ADR | | | 2,898,644 | | |
| | | | 2,898,644 | | |
| | | | | Hong Kong: 6.5% | |
| | 28,414,000 | | | @,L | | Brilliance China Automotive
Holdings Ltd. | | | 4,398,080 | | |
| | 12,162,000 | | | | | First Pacific Co. | | | 6,110,546 | | |
| | 4,882,000 | | | | | SCMP Group Ltd. | | | 1,763,928 | | |
| | 1,395,000 | | | | | SmarTone Telecommunications
Holding Ltd. | | | 1,335,513 | | |
| | | | 13,608,067 | | |
| | | | | Hungary: 2.4% | |
| | 1,088,359 | | | @ | | Magyar Telekom
Telecommunications PLC | | | 5,063,706 | | |
| | | | 5,063,706 | | |
| | | | | Indonesia: 1.1% | |
| | 2,178,000 | | | | | Gudang Garam Tbk PT | | | 2,347,969 | | |
| | | | 2,347,969 | | |
| Shares | | | | Value | |
| | | | | Israel: 4.5% | |
| | 2,336,530 | | | | | Bezeq Israeli Telecommunication
Corp., Ltd. | | $ | 3,185,399 | | |
| | 579,979 | | | | | Partner Communications | | | 6,207,607 | | |
| | | | 9,393,006 | | |
| | | | | Malaysia: 1.2% | |
| | 1,903,014 | | | | | Proton Holdings Bhd | | | 2,480,040 | | |
| | | | 2,480,040 | | |
| | | | | Mexico: 3.8% | |
| | 889,480 | | | | | Alfa SA de CV | | | 4,945,737 | | |
| | 109,800 | | | | | Telefonos de Mexico SA de
CV ADR | | | 2,897,622 | | |
| | | | 7,843,359 | | |
| | | | | Panama: 3.0% | |
| | 380,070 | | | | | Banco Latinoamericano de
Exportaciones SA | | | 6,210,344 | | |
| | | | 6,210,344 | | |
| | | | | Philippines: 1.1% | |
| | 3,652,100 | | | @ | | Manila Electric Co. | | | 2,305,971 | | |
| | | | 2,305,971 | | |
| | | | | Singapore: 2.7% | |
| | 304,000 | | | | | DBS Group Holdings Ltd. | | | 3,974,824 | | |
| | 1,355,000 | | | | | MobileOne Ltd. | | | 1,723,581 | | |
| | | | 5,698,405 | | |
| | | | | South Korea: 18.3% | |
| | 159,200 | | | | | Daeduck Electronics Co. | | | 1,384,554 | | |
| | 89,960 | | | | | Korea Electric Power Corp. | | | 3,467,659 | | |
| | 32,100 | | | | | KT Corp. | | | 1,457,104 | | |
| | 82,050 | | | L | | KT Freetel Co., Ltd. | | | 2,514,328 | | |
| | 142,470 | | | L | | Kumho Industrial Co., Ltd. | | | 3,405,881 | | |
| | 251,160 | | | | | Kumho Tire Co., Inc. | | | 3,035,750 | | |
| | 160,970 | | | | | LG Chem Ltd. | | | 6,551,565 | | |
| | 47,710 | | | | | LG Electronics, Inc. | | | 2,882,335 | | |
| | 2,047 | | | | | Lotte Chilsung Beverage
Co., Ltd. | | | 2,580,507 | | |
| | 7,316 | | | | | Posco | | | 2,046,011 | | |
| | 5,125 | | | | | Samsung Electronics Co., Ltd. | | | 3,318,603 | | |
| | 228,710 | | | L | | SK Telecom Co., Ltd. ADR | | | 5,507,337 | | |
| | | | 38,151,634 | | |
| | | | | Taiwan: 18.1% | |
| | 4,152,500 | | | | | China Motor Corp. | | | 3,556,355 | | |
| | 194,820 | | | | | Chunghwa Telecom Co., Ltd. | | | 333,330 | | |
| | 219,320 | | | L | | Chunghwa Telecom Co.,
Ltd. ADR | | | 4,011,370 | | |
| | 3,198,000 | | | | | Far EasTone Telecommunications
Co., Ltd. | | | 3,653,970 | | |
| | 3,114,000 | | | | | Fu Sheng Industrial Co., Ltd. | | | 2,619,449 | | |
| | 6,654,000 | | | | | Oriental Union Chemical Corp. | | | 3,957,883 | | |
| | 2,822,000 | | | @ | | Taishin Financial Holdings
Co., Ltd. | | | 1,444,369 | | |
| | 2,487,182 | | | | | United Microelectronics Corp. | | | 1,379,139 | | |
| | 810,474 | | | L | | United Microelectronics
Corp. ADR | | | 2,455,736 | | |
| | 10,322,000 | | | @ | | Walsin Lihwa Corp. | | | 4,977,591 | | |
| | 6,561,500 | | | | | Wan Hai Lines Ltd. | | | 3,608,228 | | |
| | 7,243,000 | | | @ | | Winbond Electronics Corp. | | | 2,195,779 | | |
| | 1,899,718 | | | @,L | | Yageo Corp. GDR | | | 3,484,083 | | |
| | | | 37,677,282 | | |
See Accompanying Notes to Financial Statements
136
PORTFOLIO OF INVESTMENTS
ING EMERGING COUNTRIES FUND AS OF OCTOBER 31, 2006 (CONTINUED)
| Shares | | | | Value | |
| | | | | Thailand: 1.0% | |
| | 969,200 | | | | | Siam Makro PLC | | $ | 2,075,668 | | |
| | | | 2,075,668 | | |
| | | | | Turkey: 1.0% | |
| | 547,810 | | | @ | | Petkim Petrokimya Holding | | | 2,093,471 | | |
| | | | 2,093,471 | | |
| | | | | Venezuela: 1.8% | |
| | 191,910 | | | | | Cia Anonima Nacional
Telefonos de Venezuela ADR | | | 3,724,974 | | |
| | | | 3,724,974 | | |
Total Common Stock
(Cost $177,322,482) | | | 193,870,736 | | |
| PREFERRED STOCK: 1.5% | | | |
| | | | | Brazil: 1.5% | |
| | 975,469,880 | | | | | Embratel Participacoes SA | | | 3,179,444 | | |
Total Preferred Stock
(Cost $1,717,781) | | | 3,179,444 | | |
Total Long-Term Investments
(Cost $179,040,263) | | | 197,050,180 | | |
Principal
Amount | | | | Value | |
| SHORT-TERM INVESTMENTS: 10.7% | |
| | | U.S. Government Agency Obligations: 1.1% | |
| $ | 2,283,000 | | | Federal Home Loan Bank,
4.760%, due 11/01/06 | | $ | 2,282,698 | | |
Total U.S. Government Agency
Obligations
(Cost $2,282,698) | | | 2,282,698 | | |
| | | Securities Lending Collateralcc: 9.6% | |
| | 19,904,000 | | | The Bank of New York
Institutional Cash
Reserves Fund | | | 19,904,000 | | |
Total Securities Lending
Collateral
(Cost $19,904,000) | | | 19,904,000 | | |
Total Short-Term Investments
(Cost $22,186,698) | | | 22,186,698 | | |
Total Investments in
Securities
(Cost $201,226,961)* | | | 105.3 | % | | $ | 219,236,878 | | |
Other Assets and
Liabilities - Net | | | (5.3 | ) | | | (10,977,588 | ) | |
| Net Assets | | | 100.0 | % | | $ | 208,259,290 | | |
Securities may have been fair valued in accordance with procedures approved by the Board of Directors/Trustees (Note 2A).
@ Non-income producing security
ADR American Depositary Receipt
GDR Global Depositary Receipt
cc Securities purchased with cash collateral for securities loaned.
L Loaned security, a portion or all of the security is on loan at October 31, 2006.
* Cost for federal income tax purposes is $201,351,965.
Net unrealized appreciation consists of:
| Gross Unrealized Appreciation | | $ | 27,576,941 | | |
| Gross Unrealized Depreciation | | | (9,692,028 | ) | |
| Net Unrealized Appreciation | | $ | 17,884,913 | | |
| Industry | | Percentage of
Net Assets | |
| Agriculture | | | 1.1 | % | |
| Auto Manufacturers | | | 5.0 | | |
| Auto Parts & Equipment | | | 1.5 | | |
| Banks | | | 5.6 | | |
| Beverages | | | 1.2 | | |
| Chemicals | | | 6.0 | | |
| Diversified Financial Services | | | 2.7 | | |
| Electric | | | 5.0 | | |
| Electrical Components & Equipment | | | 3.8 | | |
| Electronics | | | 2.3 | | |
| Engineering & Construction | | | 1.6 | | |
| Food | | | 1.3 | | |
| Holding Companies - Diversified | | | 5.3 | | |
| Iron/Steel | | | 1.0 | | |
| Leisure Time | | | 1.3 | | |
| Media | | | 0.8 | | |
| Retail | | | 1.0 | | |
| Semiconductors | | | 4.5 | | |
| Telecommunications | | | 34.5 | | |
| Textiles | | | 2.6 | | |
| Transportation | | | 1.7 | | |
| Water | | | 2.5 | | |
| Other Long-Term Investments | | | 2.3 | | |
| Short-Term Investments | | | 10.7 | | |
| Other Assets and Liabilities - Net | | | (5.3 | ) | |
| Net Assets | | | 100.0 | % | |
See Accompanying Notes to Financial Statements
137
PORTFOLIO OF INVESTMENTS
ING FOREIGN FUND AS OF OCTOBER 31, 2006
| Shares | | | | Value | |
| COMMON STOCK: 92.8% | | | |
| | | | | Australia: 2.1% | |
| | 49,049 | | | | | BHP Billiton Ltd. | | $ | 1,044,008 | | |
| | 44,490 | | | | | Brambles Industries Ltd. | | | 430,307 | | |
| | 16,332 | | | | | CSL Ltd. | | | 708,383 | | |
| | 87,067 | | | | | John Fairfax Holdings Ltd. | | | 327,770 | | |
| | 1,033,829 | | | | | Macquarie Airports
Management Ltd. | | | 2,570,522 | | |
| | 201,367 | | | | | Newcrest Mining Ltd. | | | 3,745,814 | | |
| | 22,034 | | | | | Publishing & Broadcasting Ltd. | | | 330,643 | | |
| | 15,966 | | | | | Rio Tinto Ltd. | | | 970,782 | | |
| | | | 10,128,229 | | |
| | | | | Austria: 3.0% | |
| | 41,072 | | | | | Erste Bank der Oesterreichischen
Sparkassen AG | | | 2,794,053 | | |
| | 4,643 | | | | | Flughafen Wien AG | | | 416,087 | | |
| | 204,097 | | | @ | | IMMOFINANZ Immobilien
Anlagen AG | | | 2,473,289 | | |
| | 44,974 | | | | | OMV AG | | | 2,443,224 | | |
| | 20,473 | | | | | Raiffeisen International Bank
Holding AG | | | 2,340,495 | | |
| | 64,306 | | | | | Telekom Austria AG | | | 1,603,589 | | |
| | 12,824 | | | | | Wiener Staedtische Allgemeine
Versicherung AG | | | 824,774 | | |
| | 23,800 | | | | | Wienerberger AG | | | 1,235,911 | | |
| | | | 14,131,422 | | |
| | | | | Belgium: 2.1% | |
| | 17,470 | | | | | Almancora Comm Va | | | 2,300,870 | | |
| | 68,874 | | | | | Fortis | | | 2,888,073 | | |
| | 44,045 | | | | | KBC Groep NV | | | 4,809,533 | | |
| | | | 9,998,476 | | |
| | | | | Bermuda: 0.2% | |
| | 9,863 | | | @ | | Central European Media
Enterprises Ltd. | | | 728,087 | | |
| | | | 728,087 | | |
| | | | | Brazil: 0.1% | |
| | 25,396 | | | L | | Votorantim Celulose e Papel
SA ADR | | | 463,477 | | |
| | | | 463,477 | | |
| | | | | Bulgaria: 0.0% | |
| | 60,720 | | | @,I | | Bulgaria Compensation Notes | | | 24,607 | | |
| | 25,950 | | | @,I | | Bulgaria Housing
Compensation Notes | | | 10,669 | | |
| | 117,641 | | | @,I | | Bulgaria Registered
Comp Vouchers | | | 47,291 | | |
| | | | 82,567 | | |
| | | | | Canada: 0.9% | |
| | 55,092 | | | @ | | Bema Gold Corp. | | | 236,470 | | |
| | 2,487 | | | @,# | | Centerra Gold, Inc. | | | 24,694 | | |
| | 44,793 | | | @ | | Eldorado Gold Corp. | | | 190,269 | | |
| | 147,667 | | | @ | | Ivanhoe Mines Ltd. | | | 1,538,540 | | |
| | 17,493 | | | | | Potash Corp. of Saskatchewan | | | 2,191,318 | | |
| | | | 4,181,291 | | |
| | | | | China: 0.4% | |
| | 950,445 | | | | | Beijing Capital International
Airport Co., Ltd. | | | 608,780 | | |
| | 269,270 | | | | | China Life Insurance Co., Ltd. | | | 567,847 | | |
| Shares | | | | Value | |
| | 45,630 | | | | | Shenzhen Chiwan Wharf
Holdings Ltd. | | $ | 74,454 | | |
| | 244,498 | | | | | Weiqiao Textile Co. | | | 335,106 | | |
| | 337,572 | | | | | Wumart Stores, Inc. | | | 314,689 | | |
| | | | 1,900,876 | | |
| | | | | Cyprus: 0.8% | |
| | 317,372 | | | | | Bank of Cyprus Public Co., Ltd. | | | 3,588,672 | | |
| | | | 3,588,672 | | |
| | | | | Czech Republic: 1.5% | |
| | 42,010 | | | | | Komercni Banka AS | | | 6,532,521 | | |
| | 23,119 | | | | | Telefonica O2 Czech Republic AS | | | 485,527 | | |
| | | | 7,018,048 | | |
| | | | | Denmark: 0.4% | |
| | 1,975 | | | @ | | ALK-Abello A/S | | | 302,249 | | |
| | 15,583 | | | | | Novo-Nordisk A/S | | | 1,173,709 | | |
| | 2,025 | | | | | Royal Unibrew A/S | | | 233,614 | | |
| | 7,429 | | | @ | | Vestas Wind Systems A/S | | | 208,432 | | |
| | | | 1,918,004 | | |
| | | | | Egypt: 0.0% | |
| | 3,892 | | | | | Orascom Telecom Holding
SAE GDR | | | 220,483 | | |
| | | | 220,483 | | |
| | | | | Eurozone: 0.9% | |
| | 82,283 | | | | | iShares DJ Euro STOXX 50 | | | 4,200,738 | | |
| | | | 4,200,738 | | |
| | | | | Finland: 1.9% | |
| | 3,298 | | | | | Elisa OYJ | | | 83,314 | | |
| | 108,575 | | | | | Fortum OYJ | | | 2,997,493 | | |
| | 120,103 | | | S | | Nokia OYJ | | | 2,387,275 | | |
| | 29,510 | | | | | Sampo OYJ | | | 639,247 | | |
| | 16,617 | | | | | Sanoma-WSOY OYJ | | | 428,892 | | |
| | 5,350 | | | | | Stockmann OYJ Abp | | | 224,059 | | |
| | 4,192 | | | | | Wartsila OYJ | | | 192,508 | | |
| | 74,004 | | | | | YIT OYJ | | | 1,839,273 | | |
| | | | 8,792,061 | | |
| | | | | France: 10.7% | |
| | 2,906 | | | | | Accor SA | | | 201,577 | | |
| | 18,107 | | | | | Air Liquide | | | 3,848,522 | | |
| | 5,343 | | | @,# | | Atos Origin | | | 304,531 | | |
| | 25,912 | | | | | BNP Paribas | | | 2,845,845 | | |
| | 38,256 | | | | | Bouygues | | | 2,230,202 | | |
| | 15,648 | | | | | Cie de Saint-Gobain | | | 1,153,033 | | |
| | 35,799 | | | | | Electricite de France | | | 2,163,747 | | |
| | 3,619 | | | | | Eurazeo | | | 461,998 | | |
| | 99,886 | | | | | France Telecom SA | | | 2,601,228 | | |
| | 5,985 | | | L | | Gaz de France | | | 240,605 | | |
| | 6,116 | | | | | Generale de Sante | | | 220,131 | | |
| | 2,466 | | | | | Hermes International | | | 267,478 | | |
| | 17,075 | | | L | | JC Decaux SA | | | 435,623 | | |
| | 38,578 | | | | | Lafarge SA | | | 5,171,686 | | |
| | 5,490 | | | | | Lagardere SCA | | | 394,983 | | |
| | 47,412 | | | | | LVMH Moet Hennessy Louis
Vuitton SA | | | 4,938,245 | | |
| | 8,072 | | | @ | | Neuf Cegetel | | | 243,651 | | |
| | 12,216 | | | | | Pernod-Ricard SA | | | 2,445,504 | | |
| | 22,761 | | | | | PPR | | | 3,394,241 | | |
| | 9,774 | | | | | Publicis Groupe | | | 377,499 | | |
See Accompanying Notes to Financial Statements
138
PORTFOLIO OF INVESTMENTS
ING FOREIGN FUND AS OF OCTOBER 31, 2006 (CONTINUED)
| Shares | | | | Value | |
| | | | | France (continued) | |
| | 5,694 | | | | | Renault SA | | $ | 665,278 | | |
| | 37,111 | | | | | Sanofi-Aventis | | | 3,160,062 | | |
| | 5,664 | | | | | Societe Generale | | | 940,306 | | |
| | 38,846 | | | | | Societe Television Francaise 1 | | | 1,317,897 | | |
| | 25,546 | | | | | Suez SA | | | 1,144,243 | | |
| | 102,425 | | | S | | Total SA | | | 6,928,622 | | |
| | 11,391 | | | | | Veolia Environnement | | | 697,084 | | |
| | 7,418 | | | | | Vinci SA | | | 835,697 | | |
| | 30,779 | | | | | Vivendi | | | 1,166,132 | | |
| | | | 50,795,650 | | |
| | | | | Germany: 8.1% | |
| | 8,604 | | | | | Adidas AG | | | 431,328 | | |
| | 100,603 | | | | | Commerzbank AG | | | 3,568,174 | | |
| | 2,748 | | | | | Continental AG | | | 307,751 | | |
| | 25,456 | | | | | Deutsche Bank AG | | | 3,212,704 | | |
| | 14,066 | | | | | Deutsche Boerse AG | | | 2,265,208 | | |
| | 171,228 | | | | | Deutsche Post AG | | | 4,738,973 | | |
| | 7,348 | | | | | Deutsche Postbank AG | | | 546,766 | | |
| | 11,164 | | | | | EON AG | | | 1,339,567 | | |
| | 84,718 | | | L | | Fraport AG Frankfurt Airport
Services Worldwide | | | 5,828,734 | | |
| | 15,487 | | | | | Fresenius AG | | | 2,810,830 | | |
| | 17,060 | | | | | Fresenius Medical Care AG &
Co. KGaA | | | 2,271,557 | | |
| | 14,511 | | | | | Henkel KGaA | | | 1,740,644 | | |
| | 797 | | | | | Henkel KGaA | | | 106,792 | | |
| | 17,811 | | | | | Hypo Real Estate Holding AG | | | 1,122,188 | | |
| | 77,550 | | | | | IVG Immobilien AG | | | 2,815,313 | | |
| | 13,343 | | | @ | | KarstadtQuelle AG | | | 311,709 | | |
| | 30,952 | | | @ | | Landesbank Berlin Holding AG | | | 236,550 | | |
| | 5,232 | | | | | MAN AG | | | 464,914 | | |
| | 4,104 | | | | | Merck KGaA | | | 433,538 | | |
| | 296 | | | | | Puma AG Rudolf Dassler Sport | | | 105,295 | | |
| | 3,954 | | | | | SAP AG | | | 785,263 | | |
| | 26,291 | | | | | Siemens AG | | | 2,361,945 | | |
| | 3,787 | | | | | Solarworld AG | | | 204,849 | | |
| | 16,172 | | | | | UkrTelecom GDR | | | 126,281 | | |
| | 1,413 | | | @ | | Wacker Chemie AG | | | 168,460 | | |
| | | | 38,305,333 | | |
| | | | | Greece: 0.5% | |
| | 23,438 | | | | | Alpha Bank AE | | | 681,105 | | |
| | 66,119 | | | @ | | Hellenic Telecommunications
Organization SA | | | 1,711,550 | | |
| | | | 2,392,655 | | |
| | | | | Guernsey: 1.5% | |
| | 322,190 | | | @ | | KKR Private Equity Investors LP | | | 7,007,633 | | |
| | | | 7,007,633 | | |
| | | | | Hong Kong: 2.2% | |
| | 798,880 | | | | | China Merchants Holdings
International Co., Ltd. | | | 2,330,579 | | |
| | 129,000 | | | | | Clear Media Ltd. | | | 180,798 | | |
| | 1,029,499 | | | @ | | Galaxy Entertainment Group Ltd. | | | 955,258 | | |
| | 448,124 | | | @ | | Hutchison Telecommunications
International Ltd. | | | 862,122 | | |
| | 1,462,840 | | | | | Melco International
Development | | | 3,577,234 | | |
| | 1,969,178 | | | | | Shun Tak Holdings Ltd. | | | 2,598,084 | | |
| | 186,000 | | | | | Texwinca Holdings Ltd. | | | 121,665 | | |
| | | | 10,625,740 | | |
| Shares | | | | Value | |
| | | | | Hungary: 2.2% | |
| | 2,147 | | | | | Egis PLC | | $ | 280,191 | | |
| | 723,501 | | | @ | | Magyar Telekom
Telecommunications PLC | | | 3,366,165 | | |
| | 186,293 | | | | | OTP Bank Nyrt | | | 6,529,276 | | |
| | 2,324 | | | | | Richter Gedeon Nyrt | | | 486,034 | | |
| | | | 10,661,666 | | |
| | | | | India: 0.2% | |
| | 11,848 | | | | | State Bank of India Ltd. GDR | | | 746,424 | | |
| | | | 746,424 | | |
| | | | | Indonesia: 0.1% | |
| | 546,500 | | | | | Indofood Sukses Makmur Tbk PT | | | 79,478 | | |
| | 84,757 | | | | | Semen Gresik Persero Tbk PT | | | 269,825 | | |
| | | | 349,303 | | |
| | | | | Ireland: 0.1% | |
| | 210,989 | | | @ | | Dragon Oil PLC | | | 634,135 | | |
| | | | 634,135 | | |
| | | | | Italy: 5.6% | |
| | 35,385 | | | | | Assicurazioni Generali S.p.A. | | | 1,403,281 | | |
| | 435,019 | | | | | Banca CR Firenze | | | 1,454,654 | | |
| | 134,755 | | | | | Banca Intesa S.p.A. | | | 920,538 | | |
| | 408,969 | | | | | Banca Intesa S.p.A. - RNC | | | 2,709,588 | | |
| | 15,669 | | | | | Banca Italease S.p.A. | | | 873,357 | | |
| | 13,980 | | | L | | Banca Popolare dell'Emilia
Romagna SCRL | | | 330,432 | | |
| | 162,838 | | | | | Banca Popolare di Milano SCRL | | | 2,409,075 | | |
| | 15,985 | | | | | Banca Popolare di Sondrio SCARL | | | 281,691 | | |
| | 183,551 | | | @ | | Banca Popolare Italiana SCRL | | | 2,432,494 | | |
| | 25,733 | | | | | Banche Popolare Unite SCPA | | | 706,433 | | |
| | 26,330 | | | | | Banco Popolare di Verona e
Novara SCRL | | | 708,391 | | |
| | 124,078 | | | | | Beni Stabili S.p.A. | | | 140,785 | | |
| | 13,711 | | | | | Bulgari S.p.A. | | | 191,492 | | |
| | 94,919 | | | | | Buzzi Unicem S.p.A. | | | 2,500,722 | | |
| | 279,635 | | | | | Capitalia S.p.A. | | | 2,470,666 | | |
| | 93,168 | | | | | Credito Emiliano S.p.A. | | | 1,333,668 | | |
| | 19,540 | | | | | Finmeccanica S.p.A. | | | 468,781 | | |
| | 39,959 | | | | | Geox S.p.A. | | | 528,270 | | |
| | 10,965 | | | | | Luxottica Group S.p.A. | | | 338,863 | | |
| | 77,920 | | | @ | | Parmalat S.p.A. | | | 277,733 | | |
| | 158,822 | | | | | Telecom Italia S.p.A. | | | 481,074 | | |
| | 107,300 | | | @ | | UniCredito Italiano S.p.A. | | | 892,223 | | |
| | 349,039 | | | | | UniCredito Italiano S.p.A. | | | 2,892,420 | | |
| | | | 26,746,631 | | |
| | | | | Japan: 8.1% | |
| | 2,030 | | | | | Acom Co., Ltd. | | | 78,070 | | |
| | 6,625 | | | | | Aeon Credit Service Co., Ltd. | | | 148,230 | | |
| | 2,650 | | | | | Aiful Corp. | | | 91,346 | | |
| | 6,601 | | | | | Aisin Seiki Co., Ltd. | | | 202,827 | | |
| | 30,000 | | | | | Bank of Fukuoka Ltd. | | | 238,778 | | |
| | 16,114 | | | | | Bank of Kyoto Ltd. | | | 165,300 | | |
| | 45,993 | | | | | Bank of Yokohama Ltd. | | | 354,367 | | |
| | 27,005 | | | S | | Canon, Inc. | | | 1,442,237 | | |
| | 27,000 | | | | | Chiba Bank Ltd. | | | 241,626 | | |
| | 5,859 | | | | | Credit Saison Co., Ltd. | | | 211,858 | | |
| | 25,000 | | | | | Daihatsu Motor Co., Ltd. | | | 251,820 | | |
| | 14,500 | | | | | Daikin Industries Ltd. | | | 408,790 | | |
| | 14,608 | | | | | Daiwa Securities Group, Inc. | | | 165,166 | | |
| | 12,588 | | | | | Denso Corp. | | | 479,901 | | |
See Accompanying Notes to Financial Statements
139
PORTFOLIO OF INVESTMENTS
ING FOREIGN FUND AS OF OCTOBER 31, 2006 (CONTINUED)
| Shares | | | | Value | |
| | | | | Japan (continued) | |
| | 126 | | | | | Dentsu, Inc. | | $ | 346,972 | | |
| | 87 | | | | | East Japan Railway Co. | | | 608,072 | | |
| | 6,200 | | | | | Eisai Co., Ltd. | | | 317,135 | | |
| | 2,800 | | | | | Exedy Corp. | | | 81,994 | | |
| | 3,900 | | | | | Fanuc Ltd. | | | 338,336 | | |
| | 91 | | | | | Fuji Television Network, Inc. | | | 189,640 | | |
| | 27,000 | | | | | Fujitsu Ltd. | | | 219,963 | | |
| | 17,000 | | | | | Gunma Bank Ltd. | | | 118,626 | | |
| | 38,328 | | | S | | Honda Motor Co., Ltd. | | | 1,352,819 | | |
| | 17,600 | | | | | Hoya Corp. | | | 680,046 | | |
| | 4,300 | | | | | Ibiden Co., Ltd. | | | 224,849 | | |
| | 25,000 | | | | | Itochu Corp. | | | 198,932 | | |
| | 212 | | | | | Japan Tobacco, Inc. | | | 922,721 | | |
| | 9,989 | | | | | JS Group Corp. | | | 204,789 | | |
| | 6,548 | | | | | JSR Corp. | | | 164,442 | | |
| | 1,060 | | | | | Keyence Corp. | | | 234,382 | | |
| | 19,126 | | | | | Koito Manufacturing Co., Ltd. | | | 270,339 | | |
| | 43,319 | | | | | Kubota Corp. | | | 377,955 | | |
| | 4,400 | | | | | Kyocera Corp. | | | 394,300 | | |
| | 5,993 | | | | | Makita Corp. | | | 177,817 | | |
| | 121,484 | | | | | Matsushita Electric Industrial
Co., Ltd. | | | 2,532,415 | | |
| | 23,000 | | | | | Mitsubishi Electric Corp. | | | 200,263 | | |
| | 204 | | | | | Mitsubishi UFJ Financial
Group, Inc. | | | 2,587,571 | | |
| | 17,000 | | | S | | Mitsubishi UFJ Securities Co. | | | 207,552 | | |
| | 19,723 | | | | | Mitsui Fudosan Co., Ltd. | | | 485,225 | | |
| | 29,077 | | | | | Mitsui Mining & Smelting
Co., Ltd. | | | 140,557 | | |
| | 294 | | | S | | Mizuho Financial Group, Inc. | | | 2,285,249 | | |
| | 30,000 | | | | | NGK Spark Plug Co., Ltd. | | | 631,001 | | |
| | 15,333 | | | | | NHK Spring Co., Ltd. | | | 169,215 | | |
| | 1,601 | | | | | Nintendo Co., Ltd. | | | 327,196 | | |
| | 8,000 | | | | | Nippon Electric Glass Co., Ltd. | | | 171,884 | | |
| | 82 | | | | | Nippon Telegraph &
Telephone Corp. | | | 411,920 | | |
| | 10,000 | | | | | Nissan Chemical Industries Ltd. | | | 128,209 | | |
| | 16,307 | | | | | Nissan Motor Co., Ltd. | | | 194,925 | | |
| | 13,002 | | | | | Nitto Denko Corp. | | | 739,869 | | |
| | 12,900 | | | | | NOK Corp. | | | 338,281 | | |
| | 22,455 | | | | | Nomura Holdings, Inc. | | | 394,812 | | |
| | 30,000 | | | | | NSK Ltd. | | | 251,102 | | |
| | 380 | | | | | NTT DoCoMo, Inc. | | | 579,488 | | |
| | 1,840 | | | | | ORIX Corp. | | | 517,471 | | |
| | 3,792 | | | | | Promise Co., Ltd. | | | 136,999 | | |
| | 52 | | | | | Resona Holdings, Inc. | | | 157,829 | | |
| | 43,000 | | | | | Ricoh Co., Ltd. | | | 848,364 | | |
| | 14 | | | | | Sapporo Hokuyo Holdings, Inc. | | | 140,325 | | |
| | 11,000 | | | | | Sega Sammy Holdings, Inc. | | | 276,011 | | |
| | 8,486 | | | | | Seven & I Holdings Co., Ltd. | | | 272,246 | | |
| | 26,000 | | | | | Sharp Corp. | | | 462,803 | | |
| | 19,035 | | | | | Shizuoka Bank Ltd. | | | 203,265 | | |
| | 19,333 | | | | | Sony Corp. | | | 790,143 | | |
| | 19,099 | | | | | Stanley Electric Co., Ltd. | | | 378,262 | | |
| | 46,000 | | | | | Sumitomo Chemical Co., Ltd. | | | 327,388 | | |
| | 16,192 | | | | | Sumitomo Corp. | | | 212,766 | | |
| | 16,500 | | | | | Sumitomo Electric Industries Ltd. | | | 233,234 | | |
| | 29,145 | | | | | Sumitomo Metal Industries Ltd. | | | 109,535 | | |
| | 173 | | | S | | Sumitomo Mitsui Financial
Group, Inc. | | | 1,890,593 | | |
| | 41,830 | | | | | Sumitomo Trust & Banking
Co., Ltd. | | | 448,740 | | |
| | 13,000 | | | | | Suruga Bank Ltd. | | | 161,728 | | |
| Shares | | | | Value | |
| | 45,700 | | | | | Suzuki Motor Corp. | | $ | 1,294,759 | | |
| | 8,600 | | | | | Takeda Pharmaceutical Co., Ltd. | | | 552,132 | | |
| | 3,600 | | | | | Takefuji Corp. | | | 130,495 | | |
| | 24,000 | | | | | Teijin Ltd. | | | 133,840 | | |
| | 13,000 | | | | | Toppan Printing Co., Ltd. | | | 142,311 | | |
| | 30,000 | | | | | Toray Industries, Inc. | | | 215,978 | | |
| | 44,700 | | | S | | Toyota Motor Corp. | | | 2,639,333 | | |
| | 5,440 | | | | | Yamada Denki Co., Ltd. | | | 540,492 | | |
| | 15,901 | | | | | Yamaha Motor Co., Ltd. | | | 434,529 | | |
| | 4,846 | | | | | Yamato Holdings Co., Ltd. | | | 75,556 | | |
| | 7,901 | | | | | Yokogawa Electric Corp. | | | 108,260 | | |
| | | | 38,516,566 | | |
| | | | | Luxembourg: 0.5% | |
| | 16,885 | | | @ | | GAGFAH SA | | | 488,118 | | |
| | 21,541 | | | @,L | | Millicom International
Cellular SA | | | 1,074,465 | | |
| | 36,754 | | | | | Prologis European Properties | | | 694,259 | | |
| | | | 2,256,842 | | |
| | | | | Mexico: 1.0% | |
| | 22,236 | | | @ | | Cemex SA de CV ADR | | | 683,535 | | |
| | 11,808 | | | | | Consorcio ARA SA de CV | | | 67,028 | | |
| | 7,157 | | | | | Fomento Economico Mexicano
SA de CV ADR | | | 692,010 | | |
| | 317,429 | | | | | Grupo Financiero Banorte SA
de CV | | | 1,151,078 | | |
| | 91,500 | | | L | | Grupo Televisa SA ADR | | | 2,258,220 | | |
| | 44,880 | | | @ | | Urbi Desarrollos Urbanos SA
de CV | | | 136,916 | | |
| | | | 4,988,787 | | |
| | | | | Netherlands: 3.1% | |
| | 17,597 | | | | | Euronext NV | | | 1,757,143 | | |
| | 23,886 | | | | | Heineken NV | | | 1,081,754 | | |
| | 97,148 | | | | | Koninklijke Philips
Electronics NV | | | 3,383,937 | | |
| | 82,781 | | | | | Royal KPN NV | | | 1,106,759 | | |
| | 28,453 | | | | | Royal Numico NV | | | 1,270,959 | | |
| | 91,119 | | | | | TNT NV | | | 3,500,683 | | |
| | 84,259 | | | | | Unilever NV | | | 2,077,822 | | |
| | 31,440 | | | | | Vedior NV | | | 575,013 | | |
| | | | 14,754,070 | | |
| | | | | New Zealand: 0.0% | |
| | 160,764 | | | | | Auckland International
Airport Ltd. | | | 219,557 | | |
| | | | 219,557 | | |
| | | | | Norway: 1.3% | |
| | 83,277 | | | | | DNB NOR ASA | | | 1,090,482 | | |
| | 34,828 | | | | | Norsk Hydro ASA | | | 805,866 | | |
| | 18,817 | | | | | Orkla ASA | | | 964,514 | | |
| | 1,376,997 | | | @ | | PAN Fish ASA | | | 1,078,464 | | |
| | 44,474 | | | | | Statoil ASA | | | 1,129,296 | | |
| | 68,165 | | | | | Telenor ASA | | | 1,078,276 | | |
| | | | 6,146,898 | | |
| | | | | Philippines: 0.5% | |
| | 108,593 | | | | | Ayala Corp. | | | 1,066,424 | | |
| | 2,468,326 | | | | | Ayala Land, Inc. | | | 754,135 | | |
| | 11,379 | | | L | | Philippine Long Distance
Telephone ADR | | | 541,754 | | |
| | | | 2,362,313 | | |
See Accompanying Notes to Financial Statements
140
PORTFOLIO OF INVESTMENTS
ING FOREIGN FUND AS OF OCTOBER 31, 2006 (CONTINUED)
| Shares | | | | Value | |
| | | | | Poland: 5.7% | |
| | 14,828 | | | | | Agora SA | | $ | 139,762 | | |
| | 9,045 | | | | | Bank BPH | | | 2,596,386 | | |
| | 39,848 | | | | | Bank Handlowy w
Warszawie SA | | | 1,007,744 | | |
| | 106,876 | | | | | Bank Pekao SA | | | 7,226,439 | | |
| | 36,210 | | | | | Bank Zachodni WBK SA | | | 2,468,208 | | |
| | 4,132 | | | @ | | BRE Bank SA | | | 395,387 | | |
| | 15,273 | | | @ | | Budimex SA | | | 367,700 | | |
| | 13,619 | | | | | CCC SA | | | 200,487 | | |
| | 57,550 | | | @ | | Cersanit Krasnystaw SA | | | 763,523 | | |
| | 60,799 | | | @ | | Globe Trade Centre SA | | | 669,122 | | |
| | 4,572 | | | | | Grupa Kety SA | | | 297,600 | | |
| | 5,162 | | | @ | | Inter Cars SA | | | 65,553 | | |
| | 4,510 | | | | | Polska Graupa Framaceutycz SA | | | 111,922 | | |
| | 41,024 | | | @ | | Polski Koncern Miesny Duda SA | | | 218,138 | | |
| | 552,860 | | | S | | Powszechna Kasa Oszczednosci
Bank Polski SA | | | 6,985,959 | | |
| | 10,496 | | | | | Sniezka SA | | | 126,563 | | |
| | 1,308 | | | | | Stomil Sanok | | | 72,078 | | |
| | 450,110 | | | S | | Telekomunikacja Polska SA | | | 3,316,151 | | |
| | | | 27,028,722 | | |
| | | | | Portugal: 0.2% | |
| | 83,610 | | | | | Electricidade de Portugal SA | | | 376,020 | | |
| | 6,004 | | | | | Jeronimo Martins | | | 114,865 | | |
| | 39,794 | | | | | Portugal Telecom SGPS SA | | | 496,531 | | |
| | | | 987,416 | | |
| | | | | Romania: 0.2% | |
| | 1,124,037 | | | @ | | Impact | | | 234,377 | | |
| | 154,500 | | | | | SIF 1 Banat Crisana Arad | | | 153,115 | | |
| | 167,500 | | | | | SIF 2 Moldova Bacau | | | 183,024 | | |
| | 127,000 | | | | | SIF 3 Transilvania Brasov | | | 118,946 | | |
| | 232,500 | | | | | SIF 4 Muntenia Bucuresti | | | 147,702 | | |
| | 147,500 | | | | | SIF 5 Oltenia Craiova | | | 175,627 | | |
| | 319,915 | | | | | SNP Petrom SA | | | 72,989 | | |
| | 585,000 | | | | | Socep Constanta | | | 53,055 | | |
| | | | 1,138,835 | | |
| | | | | Russia: 4.0% | |
| | 30,695 | | | @,L | | CTC Media, Inc. | | | 744,968 | | |
| | 22,724 | | | L | | LUKOIL ADR | | | 1,851,769 | | |
| | 16,120 | | | L | | MMC Norilsk Nickel ADR | | | 2,381,730 | | |
| | 175,709 | | | X | | NovaTek OAO | | | 1,022,626 | | |
| | 65,043 | | | | | OAO Gazprom ADR | | | 2,760,254 | | |
| | 14,462 | | | | | OAO Rosneft Oil Co. | | | 123,939 | | |
| | 316,728 | | | @ | | OAO Rosneft Oil Co. GDR | | | 2,723,861 | | |
| | 18,360 | | | @ | | Polyus Gold Co. ZAO ADR | | | 866,592 | | |
| | 5,804 | | | @,S | | Polyus Gold Co. ZAO | | | 273,949 | | |
| | 104,109 | | | I | | RenShares Utilities Ltd. | | | 212,382 | | |
| | 1,382 | | | | | Sberbank RF | | | 3,103,463 | | |
| | 66,538 | | | @ | | TMK OAO | | | 415,863 | | |
| | 144,138 | | | | | TNK-BP Holding | | | 330,076 | | |
| | 25,000 | | | | | Unified Energy System GDR | | | 1,881,250 | | |
| | 63,135 | | | | | Uralkaliy | | | 94,680 | | |
| | | | 18,787,402 | | |
| | | | | South Korea: 0.6% | |
| | 4,926 | | | | | Hyundai Motor Co. | | | 399,769 | | |
| | 2,510 | | | @ | | NHN Corp. | | | 248,604 | | |
| | 3,066 | | | | | Samsung Electronics Co., Ltd. | | | 1,985,334 | | |
| | | | 2,633,707 | | |
| Shares | | | | Value | |
| | | | | Spain: 0.9% | |
| | 235,725 | | | | | Corp Mapfre SA | | $ | 1,043,976 | | |
| | 9,980 | | | | | Grupo Empresarial Ence SA | | | 493,302 | | |
| | 19,990 | | | | | Inditex SA | | | 955,078 | | |
| | 88,028 | | | | | Telefonica SA | | | 1,694,712 | | |
| | | | 4,187,068 | | |
| | | | | Sweden: 3.0% | |
| | 4,331 | | | | | Autoliv, Inc. | | | 246,008 | | |
| | 110,601 | | | | | ForeningsSparbanken AB | | | 3,617,787 | | |
| | 43,407 | | | | | Getinge AB | | | 767,364 | | |
| | 10,896 | | | | | Hennes & Mauritz AB | | | 469,238 | | |
| | 25,400 | | | @ | | Modern Times Group AB | | | 1,457,003 | | |
| | 176,018 | | | | | Nordea Bank AB | | | 2,420,932 | | |
| | 8,425 | | | | | Securitas AB | | | 110,820 | | |
| | 8,425 | | | @ | | Securitas Direct AB | | | 25,663 | | |
| | 8,425 | | | @ | | Securitas Systems AB | | | 28,113 | | |
| | 110,169 | | | | | Skandinaviska Enskilda
Banken AB | | | 3,074,474 | | |
| | 40,558 | | | | | Skanska AB | | | 722,102 | | |
| | 155,170 | | | | | Telefonaktiebolaget LM Ericsson | | | 586,520 | | |
| | 100,296 | | | | | TeliaSonera AB | | | 730,167 | | |
| | | | 14,256,191 | | |
| | | | | Switzerland: 6.8% | |
| | 30,868 | | | | | Adecco SA | | | 1,903,549 | | |
| | 2,031 | | | | | BKW FMB Energie AG | | | 196,523 | | |
| | 48,428 | | | | | Compagnie Financiere
Richemont AG | | | 2,394,969 | | |
| | 38,372 | | | | | Credit Suisse Group | | | 2,313,101 | | |
| | 394 | | | | | Flughafen Zuerich AG | | | 107,741 | | |
| | 267 | | | | | Givaudan | | | 221,170 | | |
| | 64,799 | | | S | | Holcim Ltd. | | | 5,579,909 | | |
| | 17,203 | | | S | | Nestle SA | | | 5,878,526 | | |
| | 74,129 | | | | | Novartis AG | | | 4,499,688 | | |
| | 20,586 | | | S | | Roche Holding AG | | | 3,604,380 | | |
| | 925 | | | | | SGS SA | | | 981,512 | | |
| | 16,402 | | | | | Swatch Group AG | | | 3,236,405 | | |
| | 8,292 | | | @ | | Syngenta AG | | | 1,338,016 | | |
| | | | 32,255,489 | | |
| | | | | Thailand: 0.2% | |
| | 17,573 | | | | | Bangkok Bank PCL | | | 57,432 | | |
| | 153,634 | | | | | Bangkok Bank PCL - NVDR | | | 480,511 | | |
| | 1,164,428 | | | | | Krung Thai Bank PCL | | | 411,867 | | |
| | | | 949,810 | | |
| | | | | Turkey: 0.9% | |
| | 344,444 | | | | | Dogan Sriketler Grubu Holdings | | | 1,458,067 | | |
| | 148,094 | | | | | Haci Omer Sabanci Holding AS | | | 619,447 | | |
| | 409,628 | | | | | Turkiye Garanti Bankasi AS | | | 1,487,702 | | |
| | 105,612 | | | | | Turkiye Is Bankasi | | | 677,536 | | |
| | | | 4,242,752 | | |
| | | | | Ukraine: 0.0% | |
| | 1,530 | | | @,I,X | | Centrenergo ADR | | | 17,226 | | |
| | 87 | | | @,I,X | | Ukrnafta Oil Co. ADR | | | 30,494 | | |
| | | | 47,720 | | |
| | | | | United Kingdom: 9.8% | |
| | 177,509 | | | | | Aegis Group PLC | | | 451,131 | | |
| | 74,980 | | | | | Anglo American PLC | | | 3,393,560 | | |
| | 70,255 | | | | | BAE Systems PLC | | | 561,723 | | |
| | 26,996 | | | | | Balfour Beatty PLC | | | 208,120 | | |
See Accompanying Notes to Financial Statements
141
PORTFOLIO OF INVESTMENTS
ING FOREIGN FUND AS OF OCTOBER 31, 2006 (CONTINUED)
| Shares | | | | Value | |
| | | | | United Kingdom (continued) | |
| | 12,157 | | | | | BHP Billiton PLC | | $ | 234,093 | | |
| | 40,869 | | | | | BP PLC | | | 456,885 | | |
| | 83,150 | | | | | Burberry Group PLC | | | 885,025 | | |
| | 388,163 | | | | | Compass Group PLC | | | 2,074,142 | | |
| | 230,767 | | | | | Diageo PLC | | | 4,266,913 | | |
| | 23,969 | | | | | Firstgroup PLC | | | 244,742 | | |
| | 173,078 | | | | | GlaxoSmithKline PLC | | | 4,612,633 | | |
| | 28,861 | | | | | Imperial Tobacco Group PLC | | | 1,022,295 | | |
| | 13,057 | | | | | National Express Group PLC | | | 242,084 | | |
| | 25,534 | | | @ | | Peter Hambro Mining PLC | | | 579,357 | | |
| | 85,728 | | | | | Prudential PLC | | | 1,050,230 | | |
| | 61,007 | | | | | Reckitt Benckiser PLC | | | 2,652,179 | | |
| | 102,909 | | | | | Rentokil Initial PLC | | | 297,118 | | |
| | 13,309 | | | | | Rio Tinto PLC | | | 736,387 | | |
| | 346,210 | | | @ | | Rolls-Royce Group PLC | | | 3,098,897 | | |
| | 12,705,907 | | | @ | | Rolls-Royce Group PLC - Class B | | | 24,237 | | |
| | 16,422 | | | | | SABMiller PLC | | | 317,591 | | |
| | 41,841 | | | | | Scottish & Newcastle PLC | | | 449,956 | | |
| | 361,815 | | | | | Smith & Nephew PLC | | | 3,534,008 | | |
| | 22,316 | | | | | Smiths Group PLC | | | 402,421 | | |
| | 94,244 | | | | | Stagecoach Group PLC | | | 249,775 | | |
| | 626,455 | | | | | Tesco PLC | | | 4,699,827 | | |
| | 2,327,494 | | | | | Vodafone Group PLC | | | 5,997,381 | | |
| | 79,337 | | | | | William Hill PLC | | | 983,022 | | |
| | 17,139 | | | | | Wolseley PLC | | | 404,091 | | |
| | 171,175 | | | | | WPP Group PLC | | | 2,192,623 | | |
| | | | 46,322,446 | | |
| | | | | United States: 0.5% | |
| | 111,505 | | | L | | News Corp., Inc. | | | 2,424,119 | | |
| | | | 2,424,119 | | |
| | | | | Venezuela: 0.0% | |
| | 10,148 | | | | | Cia Anonima Nacional
Telefonos de Venezuela -
CANTV ADR | | | 196,979 | | |
| | | | 196,979 | | |
Total Common Stock
(Cost $348,129,999) | | | 440,321,290 | | |
| PREFERRED STOCK: 0.4% | | | |
| | | | | Germany: 0.4% | |
| | 65,392 | | | | | ProSieben SAT.1 Media AG | | | 1,887,259 | | |
Total Preferred Stock
(Cost $1,411,173) | | | 1,887,259 | | |
| RIGHTS: 0.0% | | | |
| | | | | Italy: 0.0% | |
| | 13,980 | | | | | Banca Popolare dell'Emilia
Romagna SCRL | | | 5,174 | | |
Total Rights
(Cost $–) | | | 5,174 | | |
| EQUITY-LINKED SECURITIES: 2.3% | | | |
| | | | | India: 2.3% | |
| | 147,895 | | | | | Banking Index Benchmark
Exchange Traded Scheme -
Bank BeES (Counterparty:
Citigroup) | | | 1,846,469 | | |
| | 329,534 | | | X | | Bharti Airtel Ltd.
(Counterparty: CLSA) | | | 3,878,615 | | |
| | 154,976 | | | X | | State Bank of India Ltd.
(Counterparty: CLSA) | | | 3,770,566 | | |
| Shares | | | | Value | |
| | 55,837 | | | X | | State Bank of India Ltd. -
Indian Participation
Certificate | | $ | 1,358,514 | | |
Total Equity-Linked Securities
(Cost $8,850,061) | | | 10,854,164 | | |
Total Long-Term Investments
(Cost $358,391,233) | | | 453,067,887 | | |
Principal
Amount | | | | Value | |
| SHORT-TERM INVESTMENTS: 2.8% | |
| | | U.S. Government Agency Obligations: 0.0% | |
| $ | 283,000 | | | Federal Home Loan Bank,
4.760%, due 11/01/06 | | $ | 282,963 | | |
Total U.S. Government Agency
Obligations
(Cost $282,963) | | | 282,963 | | |
| | | Securities Lending Collateralcc: 2.8% | |
| | 13,242,000 | | | The Bank of New York
Institutional Cash
Reserves Fund | | | 13,242,000 | | |
Total Securities Lending
Collateral
(Cost $13,242,000) | | | 13,242,000 | | |
Total Short-Term Investments
(Cost $13,524,963) | | | 13,524,963 | | |
Total Investments in
Securities
(Cost $371,916,196)* | | | 98.3 | % | | $ | 466,592,850 | | |
Other Assets and
Liabilities - Net | | | 1.7 | | | | 7,906,634 | | |
| Net Assets | | | 100.0 | % | | $ | 474,499,484 | | |
Securities may have been fair valued in accordance with procedures approved by the Board of Directors/Trustees (Note 2A).
@ Non-income producing security
ADR American Depositary Receipt
GDR Global Depositary Receipt
NVDR Non-Voting Depository Receipt
SIF Societati de Investitii Financeiare
# Securities with purchases pursuant to Rule 144A, under the Securities Act of 1933 and may not be resold subject to that rule except to qualified institutional buyers. These securities have been determined to be liquid under the guidelines established by the Funds' Board of Directors/Trustees.
cc Securities purchased with cash collateral for securities loaned.
S Segregated securities for certain derivatives, when-issued or delayed delivery securities and forward currency exchange contracts.
I Illiquid securities.
L Loaned security, a portion or all of the security is on loan at October 31, 2006.
X Fair value determined by ING Funds Valuation Committee appointed by the Funds' Board of Directors/Trustees.
* Cost for federal income tax purposes is $374,431,988.
Net unrealized appreciation consists of:
| Gross Unrealized Appreciation | | $ | 94,874,116 | | |
| Gross Unrealized Depreciation | | | (2,713,254 | ) | |
| Net Unrealized Appreciation | | $ | 92,160,862 | | |
See Accompanying Notes to Financial Statements
142
PORTFOLIO OF INVESTMENTS
ING FOREIGN FUND AS OF OCTOBER 31, 2006 (CONTINUED)
| Industry | | Percentage of
Net Assets | |
| Advertising | | | 0.8 | % | |
| Aerospace/Defense | | | 0.9 | | |
| Agriculture | | | 0.4 | | |
| Apparel | | | 0.5 | | |
| Auto Manufacturers | | | 1.4 | | |
| Auto Parts & Equipment | | | 0.6 | | |
| Banks | | | 24.5 | | |
| Beverages | | | 2.0 | | |
| Building Materials | | | 4.0 | | |
| Chemicals | | | 2.0 | | |
| Commercial Services | | | 1.0 | | |
| Computers | | | 0.1 | | |
| Distribution/Wholesale | | | 0.2 | | |
| Diversified Financial Services | | | 2.3 | | |
| Electric | | | 2.1 | | |
| Electrical Components & Equipment | | | 0.3 | | |
| Electronics | | | 1.2 | | |
| Energy - Alternate Sources | | | 0.0 | | |
| Engineering & Construction | | | 2.9 | | |
| Entertainment | | | 0.2 | | |
| Food | | | 3.5 | | |
| Food Service | | | 0.4 | | |
| Foreign Government Bonds | | | 0.0 | | |
| Forest Products & Paper | | | 0.2 | | |
| Gas | | | 0.1 | | |
| Hand/Machine Tools | | | 0.0 | | |
| Healthcare - Products | | | 1.0 | | |
| Healthcare - Services | | | 1.1 | | |
| Holding Companies - Diversified | | | 3.0 | | |
| Industry | | Percentage of
Net Assets | |
| Home Builders | | | 0.0 | % | |
| Home Furnishings | | | 0.7 | | |
| Household Products/Wares | | | 1.0 | | |
| Insurance | | | 1.0 | | |
| Internet | | | 0.1 | | |
| Iron/Steel | | | 0.0 | | |
| Leisure Time | | | 0.2 | | |
| Lodging | | | 0.0 | | |
| Machinery - Diversified | | | 0.2 | | |
| Media | | | 2.9 | | |
| Metal Fabricate/Hardware | | | 0.1 | | |
| Mining | | | 3.5 | | |
| Miscellaneous Manufacturing | | | 0.6 | | |
| Office/Business Equipment | | | 0.5 | | |
| Oil & Gas | | | 4.5 | | |
| Pharmaceuticals | | | 4.3 | | |
| Real Estate | | | 2.2 | | |
| Retail | | | 2.6 | | |
| Semiconductors | | | 0.4 | | |
| Software | | | 0.2 | | |
| Telecommunications | | | 7.6 | | |
| Textiles | | | 0.2 | | |
| Toys/Games/Hobbies | | | 0.1 | | |
| Transportation | | | 2.0 | | |
| Water | | | 0.1 | | |
| Other Long-Term Investments | | | 3.8 | | |
| Short-Term Investments | | | 2.8 | | |
| Other Assets and Liabilities - Net | | | 1.7 | | |
| Net Assets | | | 100.0 | % | |
ING Foreign Fund Forward Foreign Currency Contracts as of October 31, 2006:
| Currency Sold | | Currency
Amount Sold | | Currency
Bought | | Currency
Amount Bought | | Settle Date | | Market Value | | Unrealized
Appreciation/
(Depreciation) | |
| CZK | | | | | 49,017,610 | | | USD | | | 2,212,186 | | | 12/27/06 | | $ | 2,234,269 | | | $ | (22,083 | ) | |
| EUR | | | | | 6,585,553 | | | USD | | | 8,426,811 | | | 01/31/07 | | | 8,444,352 | | | | (17,541 | ) | |
| HUF | | | | | 714,938,625 | | | USD | | | 3,277,881 | | | 11/22/06 | | | 3,495,742 | | | | (217,861 | ) | |
| TRY | | | | | 1,841,136 | | | USD | | | 1,231,858 | | | 12/26/06 | | | 1,235,921 | | | | (4,063 | ) | |
| USD | | | | | 2,165,544 | | | GBP | | | 1,139,113 | | | 12/27/06 | | | 2,173,879 | | | | 8,335 | | |
| USD | | | | | 1,185,815 | | | GBP | | | 622,279 | | | 12/27/06 | | | 1,187,556 | | | | 1,741 | | |
| USD | | | | | 18,067,531 | | | JPY | | | 2,052,471,569 | | | 11/08/06 | | | 17,569,830 | | | | (497,701 | ) | |
| USD | | | | | 2,265,217 | | | JPY | | | 261,405,989 | | | 11/08/06 | | | 2,237,721 | | | | (27,496 | ) | |
| USD | | | | | 11,564,345 | | | JPY | | | 1,340,510,000 | | | 01/31/07 | | | 11,608,977 | | | | 44,632 | | |
| | | | | $ | 50,188,247 | | | $ | (732,037 | ) | |
See Accompanying Notes to Financial Statements
143
PORTFOLIO OF INVESTMENTS
ING GREATER CHINA FUND AS OF OCTOBER 31, 2006
| Shares | | | | | | Value | |
| COMMON STOCK: 92.5% | | | |
| | | | | China: 20.8% | |
| | 1,193,000 | | | # | | China Construction Bank | | $ | 535,563 | | |
| | 658,000 | | | | | China Life Insurance Co., Ltd. | | | 1,387,617 | | |
| | 159,000 | | | @ | | China Merchants Bank Co., Ltd. | | | 248,195 | | |
| | 726,000 | | | | | China Shipping Development
Co., Ltd. | | | 788,218 | | |
| | 1,284,000 | | | @ | | China Southern Airlines Co., Ltd. | | | 422,931 | | |
| | 91,000 | | | @ | | Foxconn International
Holdings Ltd. | | | 301,737 | | |
| | 357,600 | | | | | Guangzhou R&F Properties
Co., Ltd. | | | 582,435 | | |
| | 384,000 | | | @ | | Industrial & Commercial Bank
of China | | | 171,825 | | |
| | 13,100 | | | @ | | Mindray Medical International
Ltd. ADR | | | 237,110 | | |
| | 856,000 | | | | | PetroChina Co., Ltd. | | | 944,645 | | |
| | 224,000 | | | @ | | SPG Land Holdings Ltd. | | | 159,276 | | |
| | | | 5,779,552 | | |
| | | | | Hong Kong: 35.3% | |
| | 214,200 | | | | | Bank of East Asia Ltd. | | | 1,022,175 | | |
| | 319,000 | | | | | BOC Hong Kong Holdings Ltd. | | | 712,808 | | |
| | 107,000 | | | | | Cheung Kong Holdings Ltd. | | | 1,162,646 | | |
| | 183,500 | | | | | China Mobile Ltd. | | | 1,490,749 | | |
| | 1,244,000 | | | | | China Overseas Land &
Investment Ltd. | | | 1,130,930 | | |
| | 210,000 | | | | | China Resources Enterprise | | | 485,814 | | |
| | 352,000 | | | | | CNOOC Ltd. | | | 295,478 | | |
| | 51,500 | | | | | Esprit Holdings Ltd. | | | 498,267 | | |
| | 219,000 | | | | | Hang Lung Properties Ltd. | | | 558,602 | | |
| | 145,500 | | | | | Hong Kong Exchanges and
Clearing Ltd. | | | 1,149,279 | | |
| | 103,000 | | | | | Li & Fung Ltd. | | | 268,878 | | |
| | 49,000 | | | | | Sun Hung Kai Properties Ltd. | | | 535,106 | | |
| | 49,000 | | | | | Swire Pacific Ltd. | | | 517,288 | | |
| | | | 9,828,020 | | |
| | | | | Taiwan: 36.4% | |
| | 205,000 | | | | | AU Optronics Corp. | | | 276,264 | | |
| | 15,000 | | | | | Catcher Technology Co., Ltd. | | | 129,276 | | |
| | 295,245 | | | | | Cathay Financial Holding Co., Ltd. | | | 572,271 | | |
| | 491,000 | | | | | Chung Hsin Electric & Machinery Manufacturing Corp. | | | 272,836 | | |
| | 1,200 | | | | | Chunghwa Telecom Co., Ltd. | | | 2,053 | | |
| | 174,000 | | | | | E.Sun Financial Holding Co., Ltd. | | | 109,495 | | |
| | 489,460 | | | | | Far Eastern Textile Co., Ltd. | | | 370,445 | | |
| | 80,500 | | | | | Foxconn Technology Co., Ltd. | | | 784,127 | | |
| | 749,700 | | | | | Goldsun Development &
Construction Co., Ltd. | | | 319,799 | | |
| | 865,000 | | | @ | | HannStar Display Corp. | | | 129,139 | | |
| | 13,200 | | | | | High Tech Computer Corp. | | | 326,766 | | |
| | 185,200 | | | | | HON HAI Precision Industry
Co., Ltd | | | 1,197,881 | | |
| | 122,000 | | | | | Huaku Construction Corp. | | | 247,648 | | |
| | 997 | | | | | Lite-On Technology Corp. | | | 1,204 | | |
| | 82,200 | | | | | MediaTek, Inc. | | | 800,191 | | |
| | 327,000 | | | | | Mega Financial Holdings Co., Ltd. | | | 230,814 | | |
| | 444,400 | | | | | Nan Ya Plastics Corp. | | | 640,955 | | |
| | 313,000 | | | | | Quanta Computer, Inc. | | | 463,421 | | |
| | 210,000 | | | | | Quanta Storage, Inc. | | | 271,267 | | |
| | 503,303 | | | | | Shin Kong Financial Holding
Co., Ltd. | | | 444,636 | | |
| | 224,425 | | | | | Sinkong Spinning | | | 167,713 | | |
| Shares | | | | | | Value | |
| | 1,030,193 | | | | | Taiwan Semiconductor
Manufacturing Co., Ltd. | | $ | 1,884,635 | | |
| | 858,388 | | | | | United Microelectronics Corp. | | | 475,974 | | |
| | | | 10,118,810 | | |
Total Common Stock
(Cost $22,481,477) | | | 25,726,382 | | |
| WARRANTS: 3.8% | | | |
| | | | | China: 2.1% | |
| | 441,984 | | | X | | China Merchants Bank Co., Ltd. | | | 583,419 | | |
| | | | 583,419 | | |
| | | | | Hong Kong: 0.2% | |
| | 155,500 | | | | | China Overseas Land &
Investment Ltd. | | | 52,185 | | |
| | | | 52,185 | | |
| | | | | Luxembourg: 1.5% | |
| | 230,000 | | | X | | Shanghai Pudong Devel
Bank - LEPO | | | 407,100 | | |
| | | | 407,100 | | |
Total Warrants
(Cost $767,734) | | | 1,042,704 | | |
Total Investments in
Securities
(Cost $23,249,211)* | | | 96.3 | % | | $ | 26,769,086 | | |
Other Assets and
Liabilities - Net | | | 3.7 | | | | 1,042,669 | | |
| Net Assets | | | 100.0 | % | | $ | 27,811,755 | | |
Securities may have been fair valued in accordance with procedures approved by the Board of Directors/Trustees (Note 2A).
@ Non-income producing security
ADR American Depositary Receipt
LEPO Low Exercise Price Warrant
# Securities with purchases pursuant to Rule 144A, under the Securities Act of 1933 and may not be resold subject to that rule except to qualified institutional buyers. These securities have been determined to be liquid under the guidelines established by the Funds' Board of Directors/Trustees.
X Fair value determined by ING Funds Valuation Committee appointed by the Funds' Board of Directors/Trustees.
* Cost for federal income tax purposes is $23,326,307.
Net unrealized appreciation consists of:
| Gross Unrealized Appreciation | | $ | 3,693,659 | | |
| Gross Unrealized Depreciation | | | (250,880 | ) | |
| Net Unrealized Appreciation | | $ | 3,442,779 | | |
See Accompanying Notes to Financial Statements
144
PORTFOLIO OF INVESTMENTS
ING GREATER CHINA FUND AS OF OCTOBER 31, 2006 (CONTINUED)
| Industry | | Percentage of
Net Assets | |
| Airlines | | | 1.5 | % | |
| Banks | | | 13.2 | | |
| Building Materials | | | 1.1 | | |
| Chemicals | | | 2.3 | | |
| Computers | | | 6.6 | | |
| Distribution/Wholesale | | | 2.8 | | |
| Diversified Financial Services | | | 7.0 | | |
| Electronics | | | 5.8 | | |
| Healthcare - Products | | | 0.9 | | |
| Holding Companies - Diversified | | | 3.6 | | |
| Insurance | | | 7.0 | | |
| Machinery - Diversified | | | 1.0 | | |
| Metal Fabricate/Hardware | | | 0.5 | | |
| Oil & Gas | | | 4.5 | | |
| Real Estate | | | 15.9 | | |
| Semiconductors | | | 11.4 | | |
| Telecommunications | | | 6.5 | | |
| Textiles | | | 1.9 | | |
| Transportation | | | 2.8 | | |
| Other Assets and Liabilities - Net | | | 3.7 | | |
| Net Assets | | | 100.0 | % | |
See Accompanying Notes to Financial Statements
145
PORTFOLIO OF INVESTMENTS
ING INDEX PLUS INTERNATIONAL EQUITY FUND AS OF OCTOBER 31, 2006
| Shares | | | | | | Value | |
| COMMON STOCK: 94.2% | | | |
| | | | | Australia: 4.6% | |
| | 37,556 | | | | | Amcor Ltd. | | $ | 200,883 | | |
| | 7,253 | | | | | APN News & Media Ltd. | | | 34,379 | | |
| | 4,791 | | | | | BHP Billiton Ltd. | | | 101,976 | | |
| | 84,226 | | | | | BlueScope Steel Ltd. | | | 472,216 | | |
| | 7,815 | | | | | Boral Ltd. | | | 43,996 | | |
| | 7,749 | | | | | Brambles Industries Ltd. | | | 74,948 | | |
| | 81,513 | | | | | Centro Properties Group | | | 487,310 | | |
| | 14,544 | | | | | Coca-Cola Amatil Ltd. | | | 78,274 | | |
| | 1,135 | | | | | Cochlear Ltd. | | | 48,951 | | |
| | 20,944 | | | | | Coles Myer Ltd. | | | 220,178 | | |
| | 1,526 | | | | | CSL Ltd. | | | 66,189 | | |
| | 20,363 | | | | | CSR Ltd. | | | 51,083 | | |
| | 10,320 | | | | | Foster's Group Ltd. | | | 51,547 | | |
| | 6,315 | | | | | Insurance Australia Group Ltd. | | | 27,113 | | |
| | 9,712 | | | | | John Fairfax Holdings Ltd. | | | 36,562 | | |
| | 14,234 | | | | | Macquarie Airports
Management Ltd. | | | 35,392 | | |
| | 22,917 | | | | | Macquarie Office Trust | | | 26,533 | | |
| | 9,266 | | | | | OneSteel Ltd. | | | 30,175 | | |
| | 29,446 | | | | | Pacific Brands Ltd. | | | 60,467 | | |
| | 31,320 | | | | | Qantas Airways Ltd. | | | 102,642 | | |
| | 850 | | | | | Rio Tinto Ltd. | | | 51,683 | | |
| | 22,350 | | | | | Santos Ltd. | | | 183,433 | | |
| | 59,976 | | | | | Suncorp-Metway Ltd. | | | 965,353 | | |
| | 16,388 | | | | | Symbion Health Ltd. | | | 41,535 | | |
| | 7,623 | | | | | Tabcorp Holdings Ltd. | | | 97,350 | | |
| | 8,192 | | | | | Tattersall's Ltd. | | | 23,071 | | |
| | 12,440 | | | | | Telstra Corp., Ltd. | | | 38,205 | | |
| | 951 | | | | | Wesfarmers Ltd. | | | 25,403 | | |
| | 28,469 | | | | | Westpac Banking Corp. | | | 527,733 | | |
| | | | 4,204,580 | | |
| | | | | Austria: 0.4% | |
| | 849 | | | | | Boehler-Uddeholm AG | | | 52,517 | | |
| | 1,282 | | | @ | | bwin Interactive Entertainment | | | 26,100 | | |
| | 8,112 | | | @ | | IMMOFINANZ Immobilien
Anlagen AG | | | 98,303 | | |
| | 1,074 | | | | | OMV AG | | | 58,345 | | |
| | 2,380 | | | | | Telekom Austria AG | | | 59,350 | | |
| | 836 | | | | | Voestalpine AG | | | 39,309 | | |
| | 741 | | | | | Wienerberger AG | | | 38,479 | | |
| | | | 372,403 | | |
| | | | | Belgium: 1.4% | |
| | 163 | | | | | D'ieteren SA | | | 55,179 | | |
| | 530 | | | | | Delhaize Group | | | 42,849 | | |
| | 23,346 | | | | | Fortis | | | 978,961 | | |
| | 476 | | | | | InBev NV | | | 26,799 | | |
| | 1,595 | | | | | KBC Groep NV | | | 174,167 | | |
| | 205 | | | | | Solvay SA | | | 26,553 | | |
| | | | 1,304,508 | | |
| | | | | Bermuda: 0.0% | |
| | 750 | | | | | Frontline Ltd. | | | 28,456 | | |
| | | | 28,456 | | |
| | | | | China: 0.1% | |
| | 20,000 | | | @ | | Foxconn International
Holdings Ltd. | | | 66,316 | | |
| | | | 66,316 | | |
| Shares | | | | | | Value | |
| | | | | Denmark: 1.5% | |
| | 36 | | | | | AP Moller - Maersk A/S | | $ | 325,191 | | |
| | 775 | | | | | East Asiatic Co., Ltd. A/S | | | 38,971 | | |
| | 13,000 | | | | | Novo-Nordisk A/S | | | 979,158 | | |
| | 550 | | | | | TrygVesta A/S | | | 35,463 | | |
| | 300 | | | @ | | William Demant Holding | | | 24,830 | | |
| | | | 1,403,613 | | |
| | | | | Finland: 1.2% | |
| | 1,111 | | | | | Cargotec Corp. | | | 50,536 | | |
| | 1,914 | | | | | Kesko OYJ | | | 90,379 | | |
| | 35,562 | | | | | Nokia OYJ | | | 706,862 | | |
| | 6,426 | | | | | Rautaruukki OYJ | | | 212,462 | | |
| | | | 1,060,239 | | |
| | | | | France: 9.9% | |
| | 1,887 | | | | | Accor SA | | | 130,893 | | |
| | 912 | | | | | Air France-KLM | | | 32,483 | | |
| | 65,335 | | | | | Alcatel SA | | | 829,400 | | |
| | 1,375 | | | @,# | | Atos Origin | | | 78,370 | | |
| | 11,953 | | | | | AXA SA | | | 454,730 | | |
| | 2,090 | | | | | BNP Paribas | | | 229,539 | | |
| | 6,368 | | | | | Bouygues | | | 371,234 | | |
| | 761 | | | @ | | Business Objects SA | | | 28,061 | | |
| | 839 | | | | | Capgemini SA | | | 47,592 | | |
| | 3,750 | | | | | Cie de Saint-Gobain | | | 276,321 | | |
| | 2,590 | | | | | Compagnie Generale des
Etablissements Michelin | | | 211,110 | | |
| | 25,139 | | | | | Credit Agricole SA | | | 1,068,023 | | |
| | 2,103 | | | | | France Telecom SA | | | 54,766 | | |
| | 2,097 | | | | | Gaz de France | | | 84,302 | | |
| | 6,774 | | | | | Groupe Danone | | | 991,757 | | |
| | 946 | | | | | Lafarge SA | | | 126,819 | | |
| | 277 | | | | | LVMH Moet Hennessy Louis
Vuitton SA | | | 28,851 | | |
| | 219 | | | | | Neopost SA | | | 26,736 | | |
| | 2,732 | | | | | Sanofi-Aventis | | | 232,634 | | |
| | 7,992 | | | | | Societe Generale | | | 1,326,788 | | |
| | 6,315 | | | | | Suez SA | | | 282,858 | | |
| | 5,931 | | | | | Technip SA | | | 357,903 | | |
| | 625 | | | | | Thales SA | | | 28,884 | | |
| | 10,147 | | | | | Total SA | | | 686,402 | | |
| | 551 | | | | | Unibail | | | 119,907 | | |
| | 1,198 | | | | | Veolia Environnement | | | 73,313 | | |
| | 23,649 | | | | | Vivendi | | | 895,996 | | |
| | | | 9,075,672 | | |
| | | | | Germany: 7.0% | |
| | 1,344 | | | | | Adidas AG | | | 67,376 | | |
| | 6,308 | | | | | Allianz AG | | | 1,168,300 | | |
| | 610 | | | | | BASF AG | | | 53,660 | | |
| | 801 | | | | | Beiersdorf AG | | | 45,495 | | |
| | 5,592 | | | | | Deutsche Bank AG | | | 705,745 | | |
| | 29,392 | | | | | Deutsche Lufthansa AG | | | 678,113 | | |
| | 948 | | | | | Deutsche Post AG | | | 26,237 | | |
| | 18,791 | | | | | Deutsche Telekom AG | | | 326,750 | | |
| | 1,069 | | | | | EON AG | | | 128,269 | | |
| | 4,467 | | | | | Fresenius Medical Care AG &
Co. KGaA | | | 594,786 | | |
| | 669 | | | | | Heidelberger Druckmaschinen | | | 30,557 | | |
| | 769 | | | | | Henkel KGaA | | | 103,040 | | |
| | 9,809 | | | | | Hochtief AG | | | 639,895 | | |
| | 1,295 | | | @ | | KarstadtQuelle AG | | | 30,253 | | |
| | 2,010 | | | | | Merck KGaA | | | 212,332 | | |
See Accompanying Notes to Financial Statements
146
PORTFOLIO OF INVESTMENTS
ING INDEX PLUS INTERNATIONAL EQUITY FUND AS OF OCTOBER 31, 2006 (CONTINUED)
| Shares | | | | | | Value | |
| | | | | Germany (continued) | |
| | 2,750 | | | | | Muenchener
Rueckversicherungs AG | | $ | 445,825 | | |
| | 417 | | | | | Rheinmetall AG | | | 30,136 | | |
| | 4,472 | | | | | Salzgitter AG | | | 479,964 | | |
| | 1,285 | | | | | Siemens AG | | | 115,443 | | |
| | 8,362 | | | | | ThyssenKrupp AG | | | 310,873 | | |
| | 1,088 | | | | | TUI AG | | | 23,773 | | |
| | 2,270 | | | | | Volkswagen AG | | | 222,993 | | |
| | | | 6,439,815 | | |
| | | | | Greece: 0.3% | |
| | 7,122 | | | | | Coca-Cola Hellenic Bottling Co. SA | | | 233,002 | | |
| | 4,273 | | | | | Hellenic Petroleum SA | | | 54,824 | | |
| | 586 | | | | | National Bank of Greece SA | | | 26,563 | | |
| | | | 314,389 | | |
| | | | | Hong Kong: 1.9% | |
| | 15,287 | | | | | Cathay Pacific Airways Ltd. | | | 33,375 | | |
| | 32,300 | | | | | CLP Holdings Ltd. | | | 205,152 | | |
| | 8,930 | | | | | Esprit Holdings Ltd. | | | 86,399 | | |
| | 9,500 | | | | | HongKong Electric Holdings | | | 44,683 | | |
| | 8,000 | | | | | Kingboard Chemicals Holdings | | | 28,389 | | |
| | 18,000 | | | | | New World Development Ltd. | | | 30,759 | | |
| | 40,000 | | | | | Noble Group Ltd. | | | 29,820 | | |
| | 33,000 | | | | | Orient Overseas International Ltd. | | | 143,717 | | |
| | 50,000 | | | | | PCCW Ltd. | | | 30,674 | | |
| | 89,000 | | | | | Swire Pacific Ltd. | | | 939,564 | | |
| | 8,000 | | | | | Television Broadcasts Ltd. | | | 45,838 | | |
| | 76,000 | | | | | Texwinca Holdings Ltd. | | | 49,713 | | |
| | 24,523 | | | | | Wharf Holdings Ltd. | | | 83,116 | | |
| | | | 1,751,199 | | |
| | | | | Ireland: 0.5% | |
| | 1,659 | | | | | C&C Group PLC | | | 27,560 | | |
| | 24,539 | | | | | Depfa Bank PLC | | | 412,689 | | |
| | 3,380 | | | @ | | Elan Corp. PLC | | | 48,829 | | |
| | | | 489,078 | | |
| | | | | Italy: 5.6% | |
| | 41,728 | | | | | Autogrill S.p.A. | | | 716,718 | | |
| | 90,078 | | | | | Banca Intesa S.p.A. | | | 615,340 | | |
| | 2,607 | | | | | Banche Popolari Unite Scpa | | | 71,568 | | |
| | 118,303 | | | | | Capitalia S.p.A. | | | 1,045,245 | | |
| | 9,292 | | | | | Enel S.p.A. | | | 88,993 | | |
| | 17,273 | | | | | ENI S.p.A. | | | 522,505 | | |
| | 21,567 | | | @ | | Fiat S.p.A. | | | 379,791 | | |
| | 7,394 | | | | | Fondiaria-Sai S.p.A. | | | 328,939 | | |
| | 1,797 | | | | | Italcementi S.p.A. | | | 47,561 | | |
| | 60,629 | | | | | Pirelli & C S.p.A. | | | 55,337 | | |
| | 14,743 | | | | | Telecom Italia RNC | | | 37,240 | | |
| | 378,290 | | | | | Telecom Italia S.p.A. | | | 1,145,846 | | |
| | 5,866 | | | | | UniCredito Italiano S.p.A. | | | 48,610 | | |
| | | | 5,103,693 | | |
| | | | | Japan: 22.2% | |
| | 1,200 | | | | | Aeon Co., Ltd. | | | 28,219 | | |
| | 700 | | | | | Alfresa Holdings Corp. | | | 41,015 | | |
| | 4,100 | | | | | Alps Electric Co., Ltd. | | | 41,003 | | |
| | 3,000 | | | | | Amada Co., Ltd. | | | 29,749 | | |
| | 2,000 | | | | | Amano Corp. | | | 26,897 | | |
| | 16,000 | | | | | Arrk Corp. | | | 213,732 | | |
| | 600 | | | | | Autobacs Seven Co., Ltd. | | | 21,725 | | |
| | 500 | | | | | Canon, Inc. | | | 26,703 | | |
| Shares | | | | | | Value | |
| | 1,500 | | | | | Circle K Sunkus Co., Ltd. | | $ | 28,609 | | |
| | 3,000 | | | | | COMSYS Holdings Corp. | | | 31,722 | | |
| | 900 | | | | | Daiichi Sankyo Co., Ltd. | | | 26,744 | | |
| | 45,000 | | | | | Daiwa Securities Group, Inc. | | | 508,795 | | |
| | 10 | | | | | East Japan Railway Co. | | | 69,893 | | |
| | 900 | | | | | FamilyMart Co., Ltd. | | | 24,376 | | |
| | 45,000 | | | | | Fujitsu Ltd. | | | 366,604 | | |
| | 45,000 | | | @ | | Haseko Corp. | | | 154,498 | | |
| | 26 | | | @ | | Inpex Holdings, Inc. | | | 212,639 | | |
| | 1,500 | | | | | Isetan Co., Ltd. | | | 26,395 | | |
| | 41,000 | | | | | Itochu Corp. | | | 326,248 | | |
| | 13,300 | | | | | JFE Holdings, Inc. | | | 534,074 | | |
| | 15,500 | | | | | Kansai Electric Power Co., Inc. | | | 365,702 | | |
| | 17,000 | | | | | Kawasaki Kisen Kaisha Ltd. | | | 120,728 | | |
| | 2,000 | | | | | Kikkoman Corp. | | | 22,566 | | |
| | 20,000 | | | | | Kobe Steel Ltd. | | | 61,128 | | |
| | 35,000 | | | | | Komatsu Ltd. | | | 629,773 | | |
| | 2,000 | | | @ | | Konica Minolta Holdings, Inc. | | | 26,617 | | |
| | 12,000 | | | | | Kubota Corp. | | | 104,699 | | |
| | 3,000 | | | | | Kyowa Hakko Kogyo Co., Ltd. | | | 23,086 | | |
| | 800 | | | | | Lawson, Inc. | | | 27,153 | | |
| | 50,000 | | | | | Matsushita Electric Industrial
Co., Ltd. | | | 1,042,283 | | |
| | 1,200 | | | | | Mitsubishi Corp. | | | 23,167 | | |
| | 11,000 | | | | | Mitsubishi Materials Corp. | | | 43,303 | | |
| | 33 | | | | | Mitsubishi UFJ Financial Group, Inc. | | | 418,578 | | |
| | 5,000 | | | | | Mitsui Mining & Smelting Co., Ltd. | | | 24,170 | | |
| | 61,000 | | | | | Mitsui OSK Lines Ltd. | | | 507,971 | | |
| | 55,000 | | | | | Mitsui Trust Holdings, Inc. | | | 645,236 | | |
| | 27,000 | | | | | Mitsukoshi Ltd. | | | 138,449 | | |
| | 1,800 | | | | | Mitsumi Electric Co., Ltd. | | | 26,362 | | |
| | 15 | | | | | Mizuho Financial Group, Inc. | | | 116,594 | | |
| | 23,000 | | | | | NGK Spark Plug Co., Ltd. | | | 483,767 | | |
| | 1,000 | | | | | Nippon Electric Glass Co., Ltd. | | | 21,485 | | |
| | 18,500 | | | | | Nippon Mining Holdings, Inc. | | | 138,992 | | |
| | 49,000 | | | | | Nippon Oil Corp. | | | 366,083 | | |
| | 6,000 | | | | | Nippon Steel Corp. | | | 24,385 | | |
| | 184 | | | | | Nippon Telegraph &
Telephone Corp. | | | 924,308 | | |
| | 13,000 | | | | | Nippon Yusen KK | | | 84,268 | | |
| | 7,900 | | | | | Nissan Motor Co., Ltd. | | | 94,433 | | |
| | 57,000 | | | | | Nisshin Steel Co., Ltd. | | | 176,232 | | |
| | 900 | | | | | NOK Corp. | | | 23,601 | | |
| | 2,000 | | | | | Olympus Corp. | | | 63,511 | | |
| | 1,910 | | | | | ORIX Corp. | | | 537,157 | | |
| | 95,000 | | | | | Osaka Gas Co., Ltd. | | | 342,395 | | |
| | 306 | | | | | Resona Holdings, Inc. | | | 928,766 | | |
| | 800 | | | | | Sega Sammy Holdings, Inc. | | | 20,074 | | |
| | 18,900 | | | | | Seven & I Holdings Co., Ltd. | | | 606,346 | | |
| | 50,000 | | | | | Shimizu Corp. | | | 296,152 | | |
| | 274 | | | | | Softbank Investment Corp. | | | 99,858 | | |
| | 45,800 | | | @ | | Sojitz Corp. | | | 151,700 | | |
| | 8,800 | | | | | Sony Corp. | | | 359,658 | | |
| | 11,400 | | | | | Stanley Electric Co., Ltd. | | | 225,781 | | |
| | 800 | | | | | Sumco Corp. | | | 56,777 | | |
| | 2,200 | | | | | Sumitomo Corp. | | | 28,908 | | |
| | 3,600 | | | | | Sumitomo Electric Industries Ltd. | | | 50,888 | | |
| | 15,000 | | | | | Sumitomo Metal Industries Ltd. | | | 56,374 | | |
| | 10,000 | | | | | Sumitomo Metal Mining Co., Ltd. | | | 131,524 | | |
| | 116 | | | | | Sumitomo Mitsui Financial
Group, Inc. | | | 1,267,681 | | |
| | 3,000 | | | | | Suzuken Co., Ltd. | | | 105,094 | | |
| | 173,000 | | | | | Taisei Corp. | | | 588,185 | | |
| | 14,000 | | | | | Taiyo Yuden Co., Ltd. | | | 215,572 | | |
See Accompanying Notes to Financial Statements
147
PORTFOLIO OF INVESTMENTS
ING INDEX PLUS INTERNATIONAL EQUITY FUND AS OF OCTOBER 31, 2006 (CONTINUED)
| Shares | | | | | | Value | |
| | | | | Japan (continued) | |
| | 13,500 | | | | | Takeda Pharmaceutical Co., Ltd. | | $ | 866,719 | | |
| | 2,000 | | | | | Tanabe Seiyaku Co., Ltd. | | | 24,646 | | |
| | 700 | | | | | THK Co., Ltd. | | | 17,765 | | |
| | 5,400 | | | | | Tokyo Electric Power Co., Inc. | | | 156,949 | | |
| | 12,600 | | | | | Tokyo Electron Ltd. | | | 939,803 | | |
| | 1,700 | | | | | Tokyo Steel Manufacturing Co., Ltd. | | | 25,992 | | |
| | 2,000 | | | | | Toppan Printing Co., Ltd. | | | 21,894 | | |
| | 45,000 | | | | | Toshiba Corp. | | | 283,993 | | |
| | 59,000 | | | | | Tosoh Corp. | | | 248,661 | | |
| | 1,400 | | | | | Toyo Seikan Kaisha Ltd. | | | 27,173 | | |
| | 51,000 | | | | | Toyobo Co., Ltd. | | | 134,619 | | |
| | 1,100 | | | | | Toyoda Gosei Co., Ltd. | | | 25,479 | | |
| | 13,700 | | | | | Toyota Motor Corp. | | | 808,923 | | |
| | 23,000 | | | | | UNY Co., Ltd. | | | 288,659 | | |
| | 11 | | | | | West Japan Railway Co. | | | 46,972 | | |
| | 22,900 | | | | | Yamaha Motor Co., Ltd. | | | 625,791 | | |
| | 24,000 | | | | | Yaskawa Electric Corp. | | | 255,739 | | |
| | | | 20,376,937 | | |
| | | | | Netherlands: 6.0% | |
| | 16,989 | | | | | Aegon NV | | | 312,171 | | |
| | 4,086 | | | @ | | ASML Holding NV | | | 93,236 | | |
| | 18,988 | | | | | European Aeronautic Defence
and Space Co. NV | | | 514,264 | | |
| | 17,149 | | | @ | | Koninklijke Ahold NV | | | 180,647 | | |
| | 630 | | | | | Koninklijke DSM NV | | | 28,722 | | |
| | 20,144 | | | | | Mittal Steel Co. NV | | | 862,885 | | |
| | 265 | | | | | Rodamco Europe NV | | | 30,656 | | |
| | 39,217 | | | | | Royal Dutch Shell PLC - Class A | | | 1,364,026 | | |
| | 31,646 | | | | | Royal Dutch Shell PLC - Class B | | | 1,137,100 | | |
| | 2,180 | | | | | Royal KPN NV | | | 29,146 | | |
| | 3,073 | | | | | SBM Offshore NV | | | 91,087 | | |
| | 669 | | | | | TNT NV | | | 25,702 | | |
| | 35,472 | | | | | Unilever NV | | | 874,738 | | |
| | | | 5,544,380 | | |
| | | | | New Zealand: 0.3% | |
| | 5,562 | | | @ | | Contact Energy Ltd. | | | 27,757 | | |
| | 25,935 | | | | | Fletcher Building Ltd. | | | 164,941 | | |
| | 7,784 | | | | | Sky City Entertainment Group Ltd. | | | 26,853 | | |
| | 24,442 | | | | | Telecom Corp. of New Zealand Ltd. | | | 75,908 | | |
| | | | 295,459 | | |
| | | | | Norway: 0.9% | |
| | 5,000 | | | @ | | Acergy SA | | | 90,983 | | |
| | 580 | | | | | Aker Kvaerner ASA | | | 60,687 | | |
| | 11,300 | | | | | DNB NOR ASA | | | 147,969 | | |
| | 7,050 | | | | | Norsk Hydro ASA | | | 163,126 | | |
| | 900 | | | | | Orkla ASA | | | 46,132 | | |
| | 64,000 | | | @ | | PAN Fish ASA | | | 50,125 | | |
| | 2,780 | | | @ | | Petroleum Geo-Services ASA | | | 162,408 | | |
| | 1,200 | | | | | Statoil ASA | | | 30,471 | | |
| | 2,200 | | | | | Telenor ASA | | | 34,801 | | |
| | 1,600 | | | | | Yara International ASA | | | 28,021 | | |
| | | | 814,723 | | |
| | | | | Portugal: 0.2% | |
| | 20,732 | | | | | Banco Comercial Portugues SA | | | 67,523 | | |
| | 1,950 | | | | | Banco Espirito Santo SA | | | 30,911 | | |
| | 14,647 | | | | | Electricidade de Portugal SA | | | 65,872 | | |
| | 15,459 | | | | | Sonae SGPS SA | | | 29,410 | | |
| | | | 193,716 | | |
| Shares | | | | | | Value | |
| | | | | Singapore: 0.9% | |
| | 22,000 | | | | | CapitaLand Ltd. | | $ | 77,037 | | |
| | 49,000 | | | | | ComfortDelgro Corp., Ltd. | | | 51,343 | | |
| | 38,000 | | | | | Fraser and Neave Ltd. | | | 108,341 | | |
| | 79,000 | | | | | Neptune Orient Lines Ltd. | | | 103,263 | | |
| | 4,000 | | | | | Singapore Airlines Ltd. | | | 38,974 | | |
| | 11,000 | | | | | Singapore Petroleum Co., Ltd. | | | 32,088 | | |
| | 42,850 | | | | | Singapore Telecommunications Ltd. | | | 72,992 | | |
| | 46,000 | | | @ | | STATS ChipPAC Ltd. | | | 29,187 | | |
| | 25,000 | | | | | United Overseas Bank Ltd. | | | 283,959 | | |
| | 11,000 | | | | | Want Want Holdings Ltd. | | | 19,622 | | |
| | 20,000 | | | @ | | Wing Tai Holdings Ltd. | | | 26,336 | | |
| | | | 843,142 | | |
| | | | | Spain: 3.7% | |
| | 555 | | | | | Altadis SA | | | 26,543 | | |
| | 6,380 | | | | | Banco Bilbao Vizcaya
Argentaria SA | | | 153,987 | | |
| | 75,266 | | | | | Banco Santander Central
Hispano SA | | | 1,302,609 | | |
| | 27,423 | | | | | Endesa SA | | | 1,203,150 | | |
| | 1,057 | | | | | Inditex SA | | | 50,501 | | |
| | 7,139 | | | | | Repsol YPF SA | | | 237,329 | | |
| | 22,054 | | | | | Telefonica SA | | | 424,583 | | |
| | | | 3,398,702 | | |
| | | | | Sweden: 1.3% | |
| | 4,302 | | | | | Atlas Copco AB | | | 122,398 | | |
| | 1,800 | | | | | Getinge AB | | | 31,821 | | |
| | 3,600 | | | | | Kungsleden AB | | | 45,439 | | |
| | 750 | | | | | Nobia AB | | | 26,595 | | |
| | 2,300 | | | | | Scania AB | | | 157,375 | | |
| | 1,682 | | | | | Securitas AB | | | 22,125 | | |
| | 4,800 | | | | | Ssab Svenskt Stal AB | | | 101,725 | | |
| | 1,600 | | | | | Svenska Handelsbanken AB | | | 41,382 | | |
| | 7,073 | | | | | Telefonaktiebolaget LM Ericsson | | | 26,735 | | |
| | 1,600 | | | | | Trelleborg AB | | | 33,631 | | |
| | 9,062 | | | | | Volvo AB | | | 564,856 | | |
| | | | 1,174,082 | | |
| | | | | Switzerland: 4.1% | |
| | 4,774 | | | | | Credit Suisse Group | | | 287,781 | | |
| | 3,615 | | | | | Holcim Ltd. | | | 311,291 | | |
| | 1,670 | | | | | Nestle SA | | | 570,664 | | |
| | 9,718 | | | | | Novartis AG | | | 589,890 | | |
| | 1,613 | | | | | Phonak Holding AG | | | 102,864 | | |
| | 2,569 | | | | | Roche Holding AG | | | 449,803 | | |
| | 4,325 | | | | | Schindler Holding AG | | | 248,127 | | |
| | 3,830 | | | | | Swatch Group AG | | | 152,975 | | |
| | 7,978 | | | | | UBS AG | | | 476,386 | | |
| | 424 | | | @ | | Unaxis Holding AG | | | 160,951 | | |
| | 1,552 | | | | | Zurich Financial Services AG | | | 383,421 | | |
| | | | 3,734,153 | | |
| | | | | United Kingdom: 20.2% | |
| | 15,712 | | | | | 3i Group PLC | | | 287,732 | | |
| | 36,994 | | | | | Amvescap PLC | | | 422,680 | | |
| | 2,361 | | | | | Anglo American PLC | | | 106,858 | | |
| | 18,081 | | | | | AstraZeneca PLC | | | 1,065,559 | | |
| | 8,191 | | | | | Aviva PLC | | | 120,992 | | |
| | 26,991 | | | | | Barclays PLC | | | 363,668 | | |
| | 1,343 | | | | | Barratt Developments PLC | | | 27,703 | | |
| | 982 | | | @ | | Berkeley Group Holdings PLC | | | 26,886 | | |
| | 32,624 | | | | | BHP Billiton PLC | | | 628,203 | | |
See Accompanying Notes to Financial Statements
148
PORTFOLIO OF INVESTMENTS
ING INDEX PLUS INTERNATIONAL EQUITY FUND AS OF OCTOBER 31, 2006 (CONTINUED)
| Shares | | | | | | Value | |
| | | | | United Kingdom (continued) | |
| | 12,552 | | | | | Boots Group PLC | | $ | 193,895 | | |
| | 107,095 | | | | | BP PLC | | | 1,197,242 | | |
| | 7,382 | | | | | Brambles Industries PLC | | | 69,273 | | |
| | 39,229 | | | @ | | British Airways PLC | | | 343,130 | | |
| | 13,125 | | | | | British American Tobacco PLC | | | 357,457 | | |
| | 25,384 | | | | | Brixton PLC | | | 260,000 | | |
| | 155,046 | | | | | BT Group PLC | | | 824,173 | | |
| | 4,652 | | | | | Cadbury Schweppes PLC | | | 46,832 | | |
| | 3,712 | | | | | Carnival PLC | | | 180,658 | | |
| | 7,091 | | | | | Collins Stewart Tullett PLC | | | 116,072 | | |
| | 22,999 | | | | | Corus Group PLC | | | 204,797 | | |
| | 17,921 | | | | | Davis Service Group PLC | | | 167,590 | | |
| | 11,297 | | | | | First Choice Holidays PLC | | | 48,522 | | |
| | 4,134 | | | | | Firstgroup PLC | | | 42,211 | | |
| | 15,120 | | | | | FKI PLC | | | 27,602 | | |
| | 5,399 | | | | | George Wimpey PLC | | | 53,973 | | |
| | 27,705 | | | | | GlaxoSmithKline PLC | | | 738,355 | | |
| | 46,369 | | | | | HBOS PLC | | | 960,624 | | |
| | 60,352 | | | | | HSBC Holdings PLC | | | 1,145,217 | | |
| | 1,575 | | | | | Intercontinental Hotels Group PLC | | | 30,303 | | |
| | 75,523 | | | | | International Power PLC | | | 482,111 | | |
| | 7,161 | | | | | Ladbrokes PLC | | | 55,777 | | |
| | 83,561 | | | | | Legal & General Group PLC | | | 230,385 | | |
| | 19,762 | | | | | LogicaCMG PLC | | | 62,223 | | |
| | 56,903 | | | | | Marks & Spencer Group PLC | | | 711,821 | | |
| | 14,132 | | | | | Misys PLC | | | 54,866 | | |
| | 35,146 | | | | | National Grid PLC | | | 448,154 | | |
| | 14,974 | | | | | Old Mutual PLC | | | 48,467 | | |
| | 7,453 | | | | | Premier Farnell PLC | | | 26,478 | | |
| | 3,832 | | | | | Reckitt Benckiser PLC | | | 166,590 | | |
| | 7,565 | | | | | Resolution PLC | | | 89,584 | | |
| | 54,238 | | | | | Rexam PLC | | | 610,259 | | |
| | 2,864 | | | | | Rio Tinto PLC | | | 158,465 | | |
| | 199,169 | | | | | Royal & Sun Alliance
Insurance Group | | | 560,192 | | |
| | 36,448 | | | | | Royal Bank of Scotland Group PLC | | | 1,297,482 | | |
| | 80,757 | | | | | Scottish & Newcastle PLC | | | 868,456 | | |
| | 2,285 | | | | | Scottish Power PLC | | | 28,481 | | |
| | 4,124 | | | | | SSL International PLC | | | 26,411 | | |
| | 20,220 | | | | | Stagecoach Group PLC | | | 53,589 | | |
| | 17,555 | | | | | Taylor Woodrow PLC | | | 121,476 | | |
| | 118,469 | | | | | Tomkins PLC | | | 548,412 | | |
| | 24,140 | | | | | Unilever PLC | | | 599,466 | | |
| | 56,772 | | | | | United Business Media PLC | | | 749,891 | | |
| | 205,721 | | | | | Vodafone Group PLC | | | 530,095 | | |
| | | | 18,587,338 | | |
Total Common Stock
(Cost $81,134,098) | | | 86,576,593 | | |
| PREFERRED STOCK: 1.7% | | | |
| | | | | Germany: 1.7% | |
| | 8,221 | | | | | RWE AG | | | 728,514 | | |
| | 12,285 | | | | | Volkswagen AG | | | 781,898 | | |
| | | | 1,510,412 | | |
Total Preferred Stock
(Cost $1,242,744) | | | 1,510,412 | | |
| Shares | | | | | | Value | |
| RIGHTS: 0.0% | |
| | | | | Australia: 0.0% | |
| | 5,949 | | | | | Telstra Corp Ltd. | | $ | — | | |
Total Rights
(Cost $—) | | | — | | |
Total Investments in
Securities
(Cost $82,376,842)* | | | 95.9 | % | | $ | 88,087,005 | | |
Other Assets and
Liabilities - Net | | | 4.1 | | | | 3,805,266 | | |
| Net Assets | | | 100.0 | % | | $ | 91,892,271 | | |
Securities may have been fair valued in accordance with procedures approved by the Board of Directors/Trustees (Note 2A).
@ Non-income producing security
# Securities with purchases pursuant to Rule 144A, under the Securities Act of 1933 and may not be resold subject to that rule except to qualified institutional buyers. These securities have been determined to be liquid under the guidelines established by the Funds' Board of Directors/Trustees.
* Cost for federal income tax purposes is $82,843,444.
Net unrealized appreciation consists of:
| Gross Unrealized Appreciation | | $ | 6,185,662 | | |
| Gross Unrealized Depreciation | | | (942,101 | ) | |
| Net Unrealized Appreciation | | $ | 5,243,561 | | |
See Accompanying Notes to Financial Statements
149
PORTFOLIO OF INVESTMENTS
ING INDEX PLUS INTERNATIONAL EQUITY FUND AS OF OCTOBER 31, 2006 (CONTINUED)
| Industry | | Percentage of
Net Assets | |
| Aerospace/Defense | | | 0.6 | % | |
| Agriculture | | | 0.4 | | |
| Airlines | | | 1.3 | | |
| Apparel | | | 0.1 | | |
| Auto Manufacturers | | | 3.3 | | |
| Auto Parts & Equipment | | | 0.9 | | |
| Banks | | | 19.2 | | |
| Beverages | | | 1.5 | | |
| Building Materials | | | 1.2 | | |
| Chemicals | | | 0.4 | | |
| Commercial Services | | | 0.4 | | |
| Computers | | | 0.6 | | |
| Cosmetics/Personal Care | | | 0.0 | | |
| Distribution/Wholesale | | | 0.7 | | |
| Diversified Financial Services | | | 2.2 | | |
| Electric | | | 4.6 | | |
| Electrical Components & Equipment | | | 0.6 | | |
| Electronics | | | 0.6 | | |
| Engineering & Construction | | | 2.2 | | |
| Entertainment | | | 0.2 | | |
| Food | | | 3.9 | | |
| Gas | | | 0.5 | | |
| Hand/Machine Tools | | | 0.3 | | |
| Healthcare - Products | | | 0.3 | | |
| Healthcare - Services | | | 0.6 | | |
| Holding Companies - Diversified | | | 1.8 | | |
| Home Builders | | | 0.4 | | |
| Home Furnishings | | | 1.6 | | |
| Household Products/Wares | | | 0.4 | | |
| Insurance | | | 4.6 | | |
| Internet | | | 0.1 | | |
| Iron/Steel | | | 4.0 | | |
| Leisure Time | | | 1.0 | | |
| Lodging | | | 0.2 | | |
| Machinery - Construction & Mining | | | 0.8 | | |
| Machinery - Diversified | | | 0.2 | | |
| Media | | | 1.9 | | |
| Mining | | | 1.4 | | |
| Miscellaneous Manufacturing | | | 0.6 | | |
| Office/Business Equipment | | | 0.1 | | |
| Oil & Gas | | | 6.9 | | |
| Oil & Gas Services | | | 0.8 | | |
| Packaging & Containers | | | 0.9 | | |
| Pharmaceuticals | | | 6.0 | | |
| Real Estate | | | 1.1 | | |
| Real Estate Investment Trust | | | 0.2 | | |
| Retail | | | 3.6 | | |
| Semiconductors | | | 1.4 | | |
| Software | | | 0.1 | | |
| Telecommunications | | | 6.8 | | |
| Textiles | | | 0.2 | | |
| Transportation | | | 1.8 | | |
| Venture Capital | | | 0.3 | | |
| Water | | | 0.1 | | |
| Other Long-Term Investments | | | 0.0 | | |
| Other Assets and Liabilities - Net | | | 4.1 | | |
| Net Assets | | | 100.0 | % | |
See Accompanying Notes to Financial Statements
150
PORTFOLIO OF INVESTMENTS
ING INTERNATIONAL FUND AS OF OCTOBER 31, 2006
| Shares | | | | | | Value | |
| COMMON STOCK: 97.6% | | | |
| | | | | Belgium: 1.6% | |
| | 38,672 | | | | | InBev NV | | $ | 2,177,236 | | |
| | | | 2,177,236 | | |
| | | | | Brazil: 1.4% | |
| | 23,362 | | | L | | Uniao de Bancos Brasileiros
SA ADR | | | 1,839,758 | | |
| | | | 1,839,758 | | |
| | | | | Canada: 3.4% | |
| | 65,100 | | | L | | Agnico-Eagle Mines Ltd. | | | 2,406,747 | | |
| | 183,825 | | | @,L | | Silver Wheaton Corp. | | | 2,022,075 | | |
| | | | 4,428,822 | | |
| | | | | China: 1.5% | |
| | 1,191,800 | | | | | Guangzhou R&F Properties
Co., Ltd. | | | 1,941,125 | | |
| | | | 1,941,125 | | |
| | | | | Finland: 2.6% | |
| | 171,222 | | | | | Nokia OYJ | | | 3,403,362 | | |
| | | | 3,403,362 | | |
| | | | | France: 9.6% | |
| | 21,310 | | | @ | | Alstom | | | 1,962,111 | | |
| | 35,500 | | | | | Carrefour SA | | | 2,162,280 | | |
| | 19,200 | | | | | Groupe Danone | | | 2,811,002 | | |
| | 21,123 | | | | | LVMH Moet Hennessy Louis
Vuitton SA | | | 2,200,088 | | |
| | 12,044 | | | | | PPR | | | 1,796,065 | | |
| | 10,478 | | | | | Societe Generale | | | 1,739,500 | | |
| | | | 12,671,046 | | |
| | | | | Germany: 5.7% | |
| | 10,107 | | | | | Allianz AG | | | 1,871,910 | | |
| | 93,771 | | | | | Deutsche Lufthansa AG | | | 2,163,422 | | |
| | 19,212 | | | | | MAN AG | | | 1,707,174 | | |
| | 12,400 | | | | | Wincor Nixdorf AG | | | 1,720,887 | | |
| | | | 7,463,393 | | |
| | | | | Greece: 1.4% | |
| | 64,971 | | | | | Alpha Bank AE | | | 1,888,048 | | |
| | | | 1,888,048 | | |
| | | | | India: 3.8% | |
| | 26,308 | | | | | Bajaj Auto Ltd. | | | 1,602,014 | | |
| | 288,930 | | | | | Cipla Ltd. | | | 1,677,630 | | |
| | 193,585 | | | | | Patni Computer Systems Ltd. | | | 1,785,390 | | |
| | | | 5,065,034 | | |
| | | | | Italy: 4.8% | |
| | 64,000 | | | | | Banco Popolare di Verona e
Novara SCRL | | | 1,721,878 | | |
| | 80,898 | | | | | Finmeccanica S.p.A. | | | 1,940,810 | | |
| | 322,500 | | | | | UniCredito Italiano S.p.A. | | | 2,672,496 | | |
| | | | 6,335,184 | | |
| | | | | Japan: 19.7% | |
| | 33,700 | | | | | Aeon Mall Co., Ltd. | | | 1,779,170 | | |
| | 102,800 | | | | | Chugai Pharmaceutical Co., Ltd. | | | 2,108,199 | | |
| | 226,000 | | | | | Kubota Corp. | | | 1,971,833 | | |
| | 103,000 | | | | | Mitsubishi Estate Co., Ltd. | | | 2,463,433 | | |
| Shares | | | | | | Value | |
| | 350 | | | | | Mitsubishi UFJ Financial
Group, Inc. | | $ | 4,439,460 | | |
| | 104,500 | | | | | Nomura Holdings, Inc. | | | 1,837,359 | | |
| | 7,900 | | | | | ORIX Corp. | | | 2,221,751 | | |
| | 105,225 | | | | | Ricoh Co., Ltd. | | | 2,076,025 | | |
| | 105,000 | | | | | Sekisui House Ltd. | | | 1,659,318 | | |
| | 25,600 | | | | | Tokyo Electron Ltd. | | | 1,909,442 | | |
| | 4,396 | | | | | Yahoo! Japan Corp. | | | 1,707,245 | | |
| | 18,200 | | | | | Yamada Denki Co., Ltd. | | | 1,808,265 | | |
| | | | 25,981,500 | | |
| | | | | Russia: 1.0% | |
| | 609,051 | | | | | TNK-BP Holding | | | 1,321,641 | | |
| | | | 1,321,641 | | |
| | | | | Singapore: 1.3% | |
| | 146,200 | | | @ | | Flextronics International Ltd. | | | 1,695,920 | | |
| | | | 1,695,920 | | |
| | | | | Sweden: 4.0% | |
| | 92,532 | | | | | Assa Abloy AB | | | 1,778,121 | | |
| | 132,500 | | | | | Nordea Bank AB | | | 1,822,390 | | |
| | 136,300 | | | | | Sandvik AB | | | 1,662,778 | | |
| | | | 5,263,289 | | |
| | | | | Switzerland: 10.8% | |
| | 183,094 | | | | | ABB Ltd. | | | 2,723,112 | | |
| | 87,588 | | | | | Novartis AG | | | 5,316,659 | | |
| | 25,760 | | | | | Roche Holding AG | | | 4,510,290 | | |
| | 6,970 | | | | | Zurich Financial Services AG | | | 1,721,937 | | |
| | | | 14,271,998 | | |
| | | | | Taiwan: 2.7% | |
| | 284,400 | | | | | HON HAI Precision Industry
Co., Ltd. | | | 1,839,511 | | |
| | 2,225,226 | | | | | Taiwan Cement Corp. | | | 1,754,875 | | |
| | | | 3,594,386 | | |
| | | | | Thailand: 2.6% | |
| | 521,800 | | | | | Bangkok Bank PLC | | | 1,705,332 | | |
| | 231,600 | | | | | Siam Cement PLC | | | 1,676,372 | | |
| | | | 3,381,704 | | |
| | | | | Turkey: 1.4% | |
| | 488,000 | | | @ | | Turk Sise Ve Cam Fabrikalari | | | 1,870,972 | | |
| | | | 1,870,972 | | |
| | | | | United Kingdom: 16.4% | |
| | 83,800 | | | | | Anglo American PLC | | | 3,792,749 | | |
| | 219,361 | | | | | Capita Group PLC | | | 2,252,878 | | |
| | 104,535 | | | @ | | CSR PLC | | | 1,508,934 | | |
| | 138,400 | | | | | Diageo PLC | | | 2,559,035 | | |
| | 72,401 | | | | | Imperial Tobacco Group PLC | | | 2,564,539 | | |
| | 642,100 | | | | | Legal & General Group PLC | | | 1,770,330 | | |
| | 467,100 | | | | | Old Mutual PLC | | | 1,511,889 | | |
| | 63,577 | | | | | Rio Tinto PLC | | | 3,517,717 | | |
| | 165,397 | | | | | WPP Group PLC | | | 2,118,611 | | |
| | | | 21,596,682 | | |
| | | | | United States: 1.9% | |
| | 58,200 | | | | | Monsanto Co. | | | 2,573,603 | | |
| | | | 2,573,603 | | |
Total Common Stock
(Cost $115,270,389) | | | 128,764,703 | | |
See Accompanying Notes to Financial Statements
151
PORTFOLIO OF INVESTMENTS
ING INTERNATIONAL FUND AS OF OCTOBER 31, 2006 (CONTINUED)
Principal
Amount | | | | Value | |
| SHORT-TERM INVESTMENTS: 6.1% | |
| | | Repurchase Agreement: 3.0% | |
| $ | 3,928,000 | | | Morgan Stanley Repurchase
Agreement dated 10/31/06, 5.290%,
due 11/01/06, $3,928,577
to be received upon repurchase
(Collateralized by $4,015,000
Federal Credit Savings Bureau,
5.700%, Market Value
plus accrued interest $4,009,600,
due 06/04/12). | | $ | 3,928,000 | | |
Total Repurchase Agreement
(Cost $3,928,000) | | | 3,928,000 | | |
| | | Securities Lending Collateralcc: 3.1% | |
| | 4,054,000 | | | The Bank of New York
Institutional Cash
Reserves Fund | | | 4,054,000 | | |
Total Securities Lending Collateral
(Cost $4,054,000) | | | 4,054,000 | | |
Total Short-Term Investments
(Cost $7,982,000) | | | 7,982,000 | | |
Total Investments in
Securities
(Cost $123,252,389)* | | | 103.7 | % | | $ | 136,746,703 | | |
Other Assets and
Liabilities - Net | | | (3.7 | ) | | | (4,841,778 | ) | |
| Net Assets | | | 100.0 | % | | $ | 131,904,925 | | |
Securities may have been fair valued in accordance with procedures approved by the Board of Directors/Trustees (Note 2A).
@ Non-income producing security
ADR American Depositary Receipt
cc Securities purchased with cash collateral for securities loaned.
L Loaned security, a portion or all of the security is on loan at October 31, 2006.
* Cost for federal income tax purposes is $123,659,469.
Net unrealized appreciation consists of:
| Gross Unrealized Appreciation | | $ | 15,394,088 | | |
| Gross Unrealized Depreciation | | | (2,306,854 | ) | |
| Net Unrealized Appreciation | | $ | 13,087,234 | | |
| Industry | | Percentage of
Net Assets | |
| Advertising | | | 1.6 | % | |
| Aerospace/Defense | | | 1.5 | | |
| Agriculture | | | 3.9 | | |
| Airlines | | | 1.6 | | |
| Banks | | | 13.5 | | |
| Beverages | | | 3.6 | | |
| Building Materials | | | 2.6 | | |
| Commercial Services | | | 1.7 | | |
| Computers | | | 1.3 | | |
| Diversified Financial Services | | | 3.1 | | |
| Electronics | | | 2.7 | | |
| Engineering & Construction | | | 2.1 | | |
| Food | | | 3.8 | | |
| Hand/Machine Tools | | | 1.3 | | |
| Holding Companies - Diversified | | | 1.7 | | |
| Home Builders | | | 1.2 | | |
| Housewares | | | 1.4 | | |
| Insurance | | | 5.2 | | |
| Internet | | | 1.3 | | |
| Leisure Time | | | 1.2 | | |
| Machinery - Diversified | | | 4.3 | | |
| Metal Fabricate/Hardware | | | 1.3 | | |
| Mining | | | 8.9 | | |
| Office/Business Equipment | | | 1.6 | | |
| Oil & Gas | | | 1.0 | | |
| Pharmaceuticals | | | 10.3 | | |
| Real Estate | | | 4.7 | | |
| Retail | | | 2.7 | | |
| Semiconductors | | | 2.6 | | |
| Software | | | 1.3 | | |
| Telecommunications | | | 2.6 | | |
| Short-Term Investments | | | 6.1 | | |
| Other Assets and Liabilities - Net | | | (3.7 | ) | |
| Net Assets | | | 100.0 | % | |
See Accompanying Notes to Financial Statements
152
PORTFOLIO OF INVESTMENTS
ING INTERNATIONAL CAPITAL APPRECIATION FUND AS OF OCTOBER 31, 2006
| Shares | | | | | | Value | |
| COMMON STOCK: 96.4% | | | |
| | | | | Australia: 1.8% | |
| | 33,781 | | | | | Computershare Ltd. | | $ | 201,138 | | |
| | 25,313 | | | | | Woodside Petroleum Ltd. | | | 743,533 | | |
| | | | 944,671 | | |
| | | | | Austria: 1.3% | |
| | 9,747 | | | | | Erste Bank der Oesterreichischen
Sparkassen AG | | | 663,070 | | |
| | | | 663,070 | | |
| | | | | Belgium: 1.1% | |
| | 10,240 | | | | | InBev NV | | | 576,513 | | |
| | | | 576,513 | | |
| | | | | Brazil: 1.1% | |
| | 9,900 | | | | | Aracruz Celulose SA ADR | | | 544,698 | | |
| | | | 544,698 | | |
| | | | | Canada: 4.0% | |
| | 14,736 | | | | | Cameco Corp. | | | 517,676 | | |
| | 27,300 | | | | | Manulife Financial Corp. | | | 885,339 | | |
| | 8,272 | | | | | Suncor Energy, Inc. | | | 634,049 | | |
| | | | 2,037,064 | | |
| | | | | China: 3.0% | |
| | 1,064,000 | | | | | China Petroleum &
Chemical Corp. | | | 737,914 | | |
| | 236,000 | | | @ | | Foxconn International
Holdings Ltd. | | | 782,527 | | |
| | | | 1,520,441 | | |
| | | | | Denmark: 1.4% | |
| | 25,200 | | | @ | | Vestas Wind Systems A/S | | | 707,025 | | |
| | | | 707,025 | | |
| | | | | Finland: 1.1% | |
| | 28,830 | | | | | Nokian Renkaat OYJ | | | 552,742 | | |
| | | | 552,742 | | |
| | | | | France: 7.2% | |
| | 4,722 | | | # | | Cie Generale D'Optique Essilor
International SA | | | 494,921 | | |
| | 8,736 | | | | | Electricite de France | | | 528,017 | | |
| | 6,632 | | | | | Iliad SA | | | 564,536 | | |
| | 4,802 | | | | | LVMH Moet Hennessy Louis
Vuitton SA | | | 500,157 | | |
| | 5,515 | | | | | Schneider Electric SA | | | 572,825 | | |
| | 14,640 | | | | | Total SA ADR | | | 997,570 | | |
| | | | 3,658,026 | | |
| | | | | Germany: 4.4% | |
| | 11,911 | | | | | Adidas AG | | | 597,112 | | |
| | 6,096 | | | | | RWE AG | | | 602,133 | | |
| | 10,600 | | | | | SAP AG ADR | | | 526,184 | | |
| | 4,420 | | | @ | | Wacker Chemie AG | | | 526,958 | | |
| | | | 2,252,387 | | |
| | | | | Greece: 1.1% | |
| | 11,992 | | | | | National Bank of Greece SA | | | 543,593 | | |
| | | | 543,593 | | |
| Shares | | | | | | Value | |
| | | | | Hong Kong: 2.0% | |
| | 106,000 | | | | | Esprit Holdings Ltd. | | $ | 1,025,559 | | |
| | | | 1,025,559 | | |
| | | | | India: 2.8% | |
| | 8,906 | | | | | HDFC Bank Ltd. ADR | | | 616,830 | | |
| | 15,200 | | | | | Infosys Technologies Ltd. ADR | | | 791,920 | | |
| | | | 1,408,750 | | |
| | | | | Ireland: 1.1% | |
| | 31,897 | | | | | Anglo Irish Bank Corp. PLC | | | 569,252 | | |
| | | | 569,252 | | |
| | | | | Israel: 1.2% | |
| | 18,200 | | | | | Teva Pharmaceutical Industries
Ltd. ADR | | | 600,054 | | |
| | | | 600,054 | | |
| | | | | Italy: 3.7% | |
| | 33,401 | | | | | Saipem S.p.A. | | | 786,781 | | |
| | 136,065 | | | | | UniCredito Italiano S.p.A. | | | 1,127,544 | | |
| | | | 1,914,325 | | |
| | | | | Japan: 15.6% | |
| | 26,400 | | | | | Denso Corp. | | | 1,006,465 | | |
| | 14,300 | | | | | Ibiden Co., Ltd. | | | 747,753 | | |
| | 9,900 | | | | | Nidec Corp. | | | 757,235 | | |
| | 9,300 | | | | | Nitto Denko Corp. | | | 529,210 | | |
| | 3,520 | | | | | ORIX Corp. | | | 989,945 | | |
| | 33,000 | | | | | Sharp Corp. | | | 587,404 | | |
| | 5,200 | | | | | SMC Corp. | | | 709,378 | | |
| | 74 | | | | | Sumitomo Mitsui Financial
Group, Inc. | | | 808,693 | | |
| | 29,300 | | | | | THK Co., Ltd. | | | 743,575 | | |
| | 9,100 | | | | | Toyota Motor Corp. | | | 537,314 | | |
| | 5,500 | | | | | Yamada Denki Co., Ltd. | | | 546,454 | | |
| | | | 7,963,426 | | |
| | | | | Mexico: 1.1% | |
| | 15,966 | | | | | Wal-Mart de Mexico SA de
CV ADR | | | 554,879 | | |
| | | | 554,879 | | |
| | | | | Netherlands: 1.3% | |
| | 17,200 | | | | | Koninklijke Philips Electronics NV | | | 599,076 | | |
| | 1,175 | | | | | Koninklijke Philips Electronics
NV - NY Shares | | | 40,929 | | |
| | | | 640,005 | | |
| | | | | Singapore: 2.4% | |
| | 41,000 | | | | | DBS Group Holdings Ltd. | | | 536,078 | | |
| | 68,000 | | | | | Keppel Corp., Ltd. | | | 690,517 | | |
| | | | 1,226,595 | | |
| | | | | South Korea: 2.0% | |
| | 6,100 | | | | | Kookmin Bank ADR | | | 484,096 | | |
| | 1,735 | | | # | | Samsung Electronics Co.,
Ltd. GDR | | | 562,558 | | |
| | | | 1,046,654 | | |
See Accompanying Notes to Financial Statements
153
PORTFOLIO OF INVESTMENTS
ING INTERNATIONAL CAPITAL APPRECIATION FUND AS OF OCTOBER 31, 2006 (CONTINUED)
| Shares | | | | | | Value | |
| | | | | Spain: 6.1% | |
| | 45,798 | | | | | Banco Bilbao Vizcaya
Argentaria SA | | $ | 1,105,374 | | |
| | 33,536 | | | | | Banco Santander Central
Hispano SA | | | 580,399 | | |
| | 73,563 | | | | | Telefonica SA | | | 1,416,232 | | |
| | | | 3,102,005 | | |
| | | | | Switzerland: 13.2% | |
| | 43,650 | | | | | ABB Ltd. | | | 649,196 | | |
| | 8,624 | | | | | Credit Suisse Group | | | 519,863 | | |
| | 9,000 | | | | | Holcim Ltd. | | | 774,999 | | |
| | 1,944 | | | | | Nestle SA | | | 664,294 | | |
| | 21,450 | | | | | Novartis AG | | | 1,302,032 | | |
| | 5,544 | | | | | Roche Holding AG | | | 970,693 | | |
| | 5,112 | | | @ | | Syngenta AG | | | 824,884 | | |
| | 4,659 | | | | | Synthes, Inc. | | | 528,232 | | |
| | 8,570 | | | @ | | UBS AG | | | 511,736 | | |
| | | | 6,745,929 | | |
| | | | | Taiwan: 1.2% | |
| | 64,722 | | | | | Taiwan Semiconductor
Manufacturing Co., Ltd. ADR | | | 627,803 | | |
| | | | 627,803 | | |
| | | | | United Kingdom: 15.2% | |
| | 329,711 | | | | | ARM Holdings PLC | | | 739,339 | | |
| | 68,556 | | | | | Barclays PLC | | | 923,701 | | |
| | 35,000 | | | | | BHP Billiton PLC | | | 673,955 | | |
| | 81,242 | | | | | British Sky Broadcasting PLC | | | 842,356 | | |
| | 12,796 | | | | | Carnival PLC | | | 622,763 | | |
| | 30,606 | | | | | HBOS PLC | | | 634,063 | | |
| | 84,800 | | | | | Michael Page International PLC | | | 652,783 | | |
| | 71,828 | | | | | Prudential PLC | | | 879,945 | | |
| | 12,777 | | | | | Reckitt Benckiser PLC | | | 555,459 | | |
| | 58,946 | | | | | Smith & Nephew PLC | | | 575,752 | | |
| | 86,335 | | | | | Tesco PLC | | | 647,707 | | |
| | | | 7,747,823 | | |
Total Common Stock
(Cost $45,680,266) | | | 49,173,289 | | |
Total Investments in
Securities
(Cost $45,680,266)* | | | 96.4 | % | | $ | 49,173,289 | | |
Other Assets and
Liabilities - Net | | | 3.6 | | | | 1,835,271 | | |
| Net Assets | | | 100.0 | % | | $ | 51,008,560 | | |
Securities may have been fair valued in accordance with procedures approved by the Board of Directors/Trustees (Note 2A).
@ Non-income producing security
ADR American Depositary Receipt
GDR Global Depositary Receipt
# Securities with purchases pursuant to Rule 144A, under the Securities Act of 1933 and may not be resold subject to that rule except to qualified institutional buyers. These securities have been determined to be liquid under the guidelines established by the Funds' Board of Directors/Trustees.
* Cost for federal income tax purposes is $46,142,300.
Net unrealized appreciation consists of:
| Gross Unrealized Appreciation | | $ | 3,552,642 | | |
| Gross Unrealized Depreciation | | | (521,653 | ) | |
| Net Unrealized Appreciation | | $ | 3,030,989 | | |
| Industry | | Percentage of
Net Assets | |
| Apparel | | | 1.2 | % | |
| Auto Manufacturers | | | 1.1 | | |
| Auto Parts & Equipment | | | 3.1 | | |
| Banks | | | 17.9 | | |
| Beverages | | | 1.1 | | |
| Building Materials | | | 1.5 | | |
| Chemicals | | | 3.7 | | |
| Commercial Services | | | 1.3 | | |
| Computers | | | 0.4 | | |
| Distribution/Wholesale | | | 2.0 | | |
| Diversified Financial Services | | | 2.9 | | |
| Electric | | | 2.2 | | |
| Electrical Components & Equipment | | | 3.7 | | |
| Electronics | | | 2.7 | | |
| Engineering & Construction | | | 1.3 | | |
| Food | | | 2.6 | | |
| Forest Products & Paper | | | 1.1 | | |
| Hand/Machine Tools | | | 4.3 | | |
| Healthcare - Products | | | 3.1 | | |
| Holding Companies - Diversified | | | 2.3 | | |
| Household Products/Wares | | | 1.1 | | |
| Insurance | | | 3.5 | | |
| Internet | | | 1.1 | | |
| Leisure Time | | | 1.2 | | |
| Media | | | 1.6 | | |
| Mining | | | 2.3 | | |
| Oil & Gas | | | 6.1 | | |
| Oil & Gas Services | | | 1.5 | | |
| Pharmaceuticals | | | 5.6 | | |
| Retail | | | 2.2 | | |
| Semiconductors | | | 3.8 | | |
| Software | | | 2.6 | | |
| Telecommunications | | | 4.3 | | |
| Other Assets and Liabilities - Net | | | 3.6 | | |
| Net Assets | | | 100.0 | % | |
See Accompanying Notes to Financial Statements
154
PORTFOLIO OF INVESTMENTS
ING INTERNATIONAL REAL ESTATE FUND AS OF OCTOBER 31, 2006
| Shares | | | | | | Value | |
| COMMON STOCK: 85.9% | | | |
| | | | | Australia: 17.0% | |
| | 192,265 | | | | | Centro Properties Group | | $ | 1,149,421 | | |
| | 320,200 | | | | | Commonwealth Property
Office Fund | | | 352,368 | | |
| | 531,200 | | | | | DB Rreef Trust | | | 678,461 | | |
| | 549,100 | | | | | GPT Group | | | 2,006,963 | | |
| | 573,800 | | | | | Investa Property Group | | | 1,065,807 | | |
| | 60,500 | | | | | Lend Lease Corp., Ltd. | | | 789,565 | | |
| | 349,300 | | | | | Macquarie CountryWide Trust | | | 534,166 | | |
| | 303,000 | | | | | Macquarie Goodman Group | | | 1,553,909 | | |
| | 301,600 | | | | | Macquarie Office Trust | | | 349,187 | | |
| | 111,000 | | | | | Mirvac Group | | | 420,519 | | |
| | 201,900 | | | | | Stockland | | | 1,184,247 | | |
| | 286,600 | | | | | Valad Property Group | | | 354,679 | | |
| | 345,800 | | | | | Westfield Group | | | 4,987,266 | | |
| | | | 15,426,558 | | |
| | | | | Austria: 0.9% | |
| | 38,400 | | | @ | | Conwert Immobilien Invest AG | | | 805,074 | | |
| | | | 805,074 | | |
| | | | | Canada: 3.9% | |
| | 23,000 | | | | | Calloway Real Estate
Investment Trust | | | 584,140 | | |
| | 6,600 | | | @, # | | Calloway Real Estate
Investment Trust | | | 167,623 | | |
| | 41,800 | | | | | Cominar Real Estate
Investment Trust | | | 769,780 | | |
| | 10,600 | | | | | Dundee Real Estate
Investment Trust | | | 330,285 | | |
| | 64,800 | | | | | RioCan Real Estate
Investment Trust | | | 1,414,930 | | |
| | 26,200 | | | @ | | Sunrise Senior Living, Inc. | | | 253,146 | | |
| | | | 3,519,904 | | |
| | | | | China: 0.6% | |
| | 360,600 | | | | | Guangzhou R&F Properties
Co. Ltd. | | | 587,321 | | |
| | | | 587,321 | | |
| | | | | Finland: 0.8% | |
| | 56,750 | | | | | Sponda OYJ | | | 707,600 | | |
| | | | 707,600 | | |
| | | | | France: 4.9% | |
| | 12,000 | | | | | Klepierre | | | 1,809,474 | | |
| | 3,400 | | | | | Societe de la Tour Eiffel | | | 525,073 | | |
| | 9,700 | | | | | Unibail | | | 2,110,878 | | |
| | | | 4,445,425 | | |
| | | | | Germany: 1.3% | |
| | 6,000 | | | | | Deutsche Wohnen AG | | | 386,721 | | |
| | 10,300 | | | | | DIC Asset AG | | | 362,107 | | |
| | 7,200 | | | | | IVG Immobilien AG | | | 261,383 | | |
| | 8,300 | | | @ | | Patrizia Immobilien AG | | | 212,018 | | |
| | | | 1,222,229 | | |
| | | | | Guernsey: 0.1% | |
| | 70,400 | | | @ | | Develica Deutschland Ltd. | | | 88,334 | | |
| | | | 88,334 | | |
| Shares | | | | | | Value | |
| | | | | Hong Kong: 12.0% | |
| | 1,498,850 | | | @ | | Champion Real Estate
Investment Trust | | $ | 743,183 | | |
| | 181,200 | | | | | Cheung Kong Holdings Ltd. | | | 1,968,893 | | |
| | 307,000 | | | | | Hang Lung Properties Ltd. | | | 783,063 | | |
| | 457,300 | | | | | Hongkong Land Holdings Ltd. | | | 1,719,448 | | |
| | 337,000 | | | | | Kerry Properties Ltd. | | | 1,240,701 | | |
| | 387,500 | | | | | Link Real Estate Investment Trust | | | 795,990 | | |
| | 493,700 | | | @ | | Shui On Land Ltd. | | | 380,883 | | |
| | 301,600 | | | | | Sun Hung Kai Properties Ltd. | | | 3,293,630 | | |
| | | | 10,925,791 | | |
| | | | | Italy: 0.4% | |
| | 297,300 | | | | | Beni Stabili S.p.A. | | | 337,330 | | |
| | | | 337,330 | | |
| | | | | Japan: 19.1% | |
| | 132 | | | | | Japan Hotel and Resort, Inc. | | | 674,367 | | |
| | 84 | | | | | Japan Logistics Fund, Inc. | | | 625,477 | | |
| | 38 | | | | | Japan Real Estate
Investment Corp. | | | 347,720 | | |
| | 52 | | | | | Japan Retail Fund
Investment Corp. | | | 402,359 | | |
| | 9,700 | | | | | Leopalace21 Corp. | | | 364,261 | | |
| | 215,400 | | | | | Mitsubishi Estate Co., Ltd. | | | 5,151,685 | | |
| | 205,600 | | | | | Mitsui Fudosan Co., Ltd. | | | 5,058,165 | | |
| | 41 | | | @ | | Nippon Accommodations
Fund, Inc. | | | 245,043 | | |
| | 136 | | | | | Nippon Building Fund, Inc. | | | 1,464,801 | | |
| | 44 | | | | | NTT Urban Development Corp. | | | 379,937 | | |
| | 62,100 | | | | | Sumitomo Realty & Development
Co., Ltd. | | | 2,057,430 | | |
| | 74 | | | | | Tokyu Real Estate Investment
Trust, Inc. | | | 597,058 | | |
| | | | 17,368,303 | | |
| | | | | Luxembourg: 0.6% | |
| | 27,500 | | | | | Prologis European Properties | | | 519,457 | | |
| | | | 519,457 | | |
| | | | | Netherlands: 2.8% | |
| | 10,400 | | | | | Rodamco Europe NV | | | 1,203,116 | | |
| | 6,200 | | | | | Vastned Retail NV | | | 540,761 | | |
| | 6,600 | | | | | Wereldhave NV | | | 757,946 | | |
| | | | 2,501,823 | | |
| | | | | Philippines: 0.4% | |
| | 1,274,000 | | | | | Ayala Land, Inc. | | | 389,238 | | |
| | | | 389,238 | | |
| | | | | Singapore: 3.6% | |
| | 268,000 | | | | | Ascendas Real Estate
Investment Trust | | | 374,173 | | |
| | 267,300 | | | | | CapitaCommercial Trust | | | 371,346 | | |
| | 297,200 | | | | | CapitaLand Ltd. | | | 1,040,698 | | |
| | 241,200 | | | | | CapitaMall Trust | | | 401,484 | | |
| | 50,900 | | | | | City Developments Ltd. | | | 359,334 | | |
| | 1,131,800 | | | | | Macquarie MEAG Prime
Real Estate Investment Trust | | | 708,829 | | |
| | | | 3,255,864 | | |
| | | | | Sweden: 1.5% | |
| | 112,400 | | | | | Castellum AB | | | 1,343,964 | | |
| | | | 1,343,964 | | |
See Accompanying Notes to Financial Statements
155
PORTFOLIO OF INVESTMENTS
ING INTERNATIONAL REAL ESTATE FUND AS OF OCTOBER 31, 2006 (CONTINUED)
| Shares | | | | | | Value | |
| | | | | Thailand: 0.4% | |
| | 617,000 | | | | | Central Pattana PLC | | $ | 367,856 | | |
| | | | 367,856 | | |
| | | | | United Kingdom: 15.6% | |
| | 114,300 | | | | | British Land Co. PLC | | | 3,259,357 | | |
| | 32,300 | | | | | Capital & Regional PLC | | | 790,131 | | |
| | 38,200 | | | | | Derwent Valley Holdings PLC | | | 1,445,130 | | |
| | 65,400 | | | | | Great Portland Estates PLC | | | 748,718 | | |
| | 77,900 | | | | | Hammerson PLC | | | 2,001,571 | | |
| | 93,200 | | | | | Land Securities Group PLC | | | 3,727,245 | | |
| | 66,900 | | | | | Shaftesbury PLC | | | 799,807 | | |
| | 107,900 | | | | | Slough Estates PLC | | | 1,409,980 | | |
| | | | 14,181,939 | | |
Total Common Stock
(Cost $70,637,360) | | | 77,994,010 | | |
| POSITIONS IN PURCHASED OPTIONS: 0.6% | | | |
| | | | | Brazil: 0.6% | |
| | 67,800 | | | | | American Style Call Option OTC
Brascan Residential
Properties SA Zero Strike
Option Exp 10/22/07 | | | 542,970 | | |
Total Options Purchased
(Cost $508,579) | | | 542,970 | | |
Total Long-Term Investments
(Cost $71,145,939) | | | 78,536,980 | | |
Principal
Amount | | | | Value | |
| SHORT-TERM INVESTMENTS: 2.1% | |
| | | U.S. Government Agency Obligations: 2.1% | |
| $ | 1,942,000 | | | Federal Home Loan Bank,
4.750%, due 11/01/06 | | $ | 1,941,743 | | |
Total Short-Term Investments
(Cost $1,941,743) | | | 1,941,743 | | |
Total Investments in
Securities
(Cost $73,087,682)* | | | 88.6 | % | | $ | 80,478,723 | | |
Other Assets and
Liabilities - Net | | | 11.4 | | | | 10,368,881 | | |
| Net Assets | | | 100.0 | % | | $ | 90,847,604 | | |
Securities may have been fair valued in accordance with procedures approved by the Board of Directors/Trustees (Note 2A).
@ Non-income producing security
# Securities with purchases pursuant to Rule 144A, under the Securities Act of 1933 and may not be resold subject to that rule except to qualified institutional buyers. These securities have been determined to be liquid under the guidelines established by the Funds' Board of Directors/Trustees.
* Cost for federal income tax purposes is $75,608,654.
Net unrealized appreciation consists of:
| Gross Unrealized Appreciation | | $ | 4,924,621 | | |
| Gross Unrealized Depreciation | | | (54,552 | ) | |
| Net Unrealized Appreciation | | $ | 4,870,069 | | |
| Industry | | Percentage of
Net Assets | |
| Property Trust | | | 16.1 | % | |
| Real Estate Management/Services | | | 11.5 | | |
| Real Estate Operation/Development | | | 37.9 | | |
| REITS - Apartments | | | 0.9 | | |
| REITS - Diversified | | | 9.0 | | |
| REITS - Hotels | | | 0.7 | | |
| REITS - Office Property | | | 3.2 | | |
| REITS - Shopping Centers | | | 5.5 | | |
| REITS - Warehouse/Industrial | | | 0.7 | | |
| Retirement/Aged Care | | | 0.3 | | |
| Other Long-Term Investments | | | 2.8 | | |
| Other Assets and Liabilities - Net | | | 11.4 | | |
| Net Assets | | | 100.0 | % | |
See Accompanying Notes to Financial Statements
156
PORTFOLIO OF INVESTMENTS
ING INTERNATIONAL SMALLCAP FUND AS OF OCTOBER 31, 2006
| Shares | | | | | | Value | |
| COMMON STOCK: 94.0% | | | |
| | | | | Australia: 7.1% | |
| | 155,552 | | | L | | Adelaide Bank Ltd. | | $ | 1,634,528 | | |
| | 43,833 | | | L | | Alesco Corp., Ltd. | | | 332,438 | | |
| | 36,234 | | | | | Amcor Ltd. | | | 193,811 | | |
| | 254,067 | | | @ | | ARC Energy Ltd. | | | 293,013 | | |
| | 202,758 | | | L | | Australian Stock Exchange Ltd. | | | 5,560,849 | | |
| | 14,791 | | | | | Bank of Queensland Ltd. | | | 187,455 | | |
| | 133,221 | | | L | | Baycorp Advantage Ltd. | | | 276,497 | | |
| | 649,808 | | | L | | Beach Petroleum Ltd. | | | 701,913 | | |
| | 47,388 | | | | | Bradken Ltd. | | | 224,097 | | |
| | 30,799 | | | | | Centro Properties Group | | | 184,126 | | |
| | 152,539 | | | | | Challenger Financial Services
Group Ltd. | | | 405,148 | | |
| | 263,067 | | | | | Coates Hire Ltd. | | | 1,215,884 | | |
| | 128,464 | | | | | Corporate Express Australia Ltd. | | | 533,735 | | |
| | 1,288,687 | | | | | CSR Ltd. | | | 3,232,846 | | |
| | 458,949 | | | L | | David Jones Ltd. | | | 1,287,469 | | |
| | 248,421 | | | | | Galileo Shopping America Trust | | | 233,771 | | |
| | 172,938 | | | | | Harvey Norman Holdings Ltd. | | | 484,395 | | |
| | 66,129 | | | | | Incitec Pivot Ltd. | | | 1,260,989 | | |
| | 309,406 | | | | | Investa Property Group | | | 574,707 | | |
| | 13,716 | | | | | Iress Market Technology Ltd. | | | 71,384 | | |
| | 254,456 | | | L | | Jubilee Mines NL | | | 2,567,198 | | |
| | 409,579 | | | | | Just Group Ltd. | | | 1,245,038 | | |
| | 138,137 | | | @ | | Kagara Zinc Ltd. | | | 796,410 | | |
| | 52,624 | | | L | | MacArthur Coal Ltd. | | | 184,818 | | |
| | 356,443 | | | | | Macquarie DDR Trust | | | 336,733 | | |
| | 557,516 | | | | | Macquarie Office Trust | | | 645,483 | | |
| | 310,057 | | | | | Macquarie ProLogis Trust | | | 291,512 | | |
| | 190,145 | | | L | | MFS Ltd. | | | 604,447 | | |
| | 64,869 | | | @ | | Miller's Retail Ltd. | | | 95,254 | | |
| | 604,392 | | | | | Minara Resources Ltd. | | | 2,530,956 | | |
| | 518,301 | | | | | Mincor Resources NL | | | 740,100 | | |
| | 21,841 | | | | | Origin Energy Ltd. | | | 121,255 | | |
| | 1,105,242 | | | | | Oxiana Ltd. | | | 2,860,899 | | |
| | 196,590 | | | L | | Perilya Ltd. | | | 666,663 | | |
| | 195,610 | | | @ | | PMP Ltd. | | | 271,986 | | |
| | 34,544 | | | | | Ramsay Health Care Ltd. | | | 287,664 | | |
| | 641,897 | | | L | | Seek Ltd. | | | 2,645,470 | | |
| | 37,620 | | | | | Seven Network Ltd. | | | 268,005 | | |
| | 21,296 | | | L | | Spotless Group Ltd. | | | 74,327 | | |
| | 478,015 | | | @ | | Tap Oil Ltd. | | | 589,222 | | |
| | 288,842 | | | L | | Timbercorp Ltd. | | | 652,693 | | |
| | 279,665 | | | | | Tishman Speyer Office Fund | | | 528,456 | | |
| | 45,799 | | | | | Transfield Services Ltd. | | | 312,284 | | |
| | 61,947 | | | L | | Transpacific Industries
Group Ltd. | | | 388,227 | | |
| | 68,344 | | | | | United Group Ltd. | | | 772,598 | | |
| | 197,188 | | | | | Zinifex Ltd. | | | 2,334,638 | | |
| | | | 41,701,391 | | |
| | | | | Austria: 0.5% | |
| | 9,592 | | | | | Andritz AG | | | 1,733,509 | | |
| | 18,364 | | | @ | | Austrian Airlines | | | 167,516 | | |
| | 13,141 | | | @ | | Oesterreichische Post AG | | | 589,214 | | |
| | 10,120 | | | @ | | Zumtobel AG | | | 255,006 | | |
| | | | 2,745,245 | | |
| | | | | Belgium: 0.7% | |
| | 10,488 | | | | | Bekaert SA | | | 1,118,659 | | |
| | 1,535 | | | | | Cofinimmo | | | 290,912 | | |
| | 45,542 | | | | | Compagnie Maritime Belge SA | | | 1,676,987 | | |
| Shares | | | | | | Value | |
| | 11,154 | | | | | Cumerio | | $ | 250,412 | | |
| | 9,804 | | | | | Euronav NV | | | 302,051 | | |
| | 5,538 | | | | | EVS Broadcast Equipment SA | | | 300,306 | | |
| | | | 3,939,327 | | |
| | | | | Bermuda: 0.1% | |
| | 60,019 | | | | | Catlin Group Ltd. | | | 572,089 | | |
| | | | 572,089 | | |
| | | | | Brazil: 0.1% | |
| | 48,300 | | | | | Cia Brasileira de
Petroleo Ipiranga | | | 428,531 | | |
| | 15,250 | | | | | Metalurgica Gerdau SA | | | 275,590 | | |
| | | | 704,121 | | |
| | | | | British Virgin Islands: 0.0% | |
| | 69,618 | | | | | Empire Online Ltd. | | | 59,760 | | |
| | | | 59,760 | | |
| | | | | Canada: 4.3% | |
| | 121,600 | | | @ | | Algoma Steel, Inc. | | | 3,654,660 | | |
| | 283,000 | | | | | AUR Resources, Inc. | | | 5,478,801 | | |
| | 142,100 | | | @ | | Breakwater Resources Ltd. | | | 198,670 | | |
| | 7,900 | | | | | Cinram International
Income Fund | | | 155,897 | | |
| | 8,600 | | | | | Crescent Point Energy Trust | | | 154,853 | | |
| | 10,500 | | | | | Focus Energy Trust | | | 219,453 | | |
| | 8,900 | | | | | Harvest Energy Trust | | | 261,147 | | |
| | 920 | | | @ | | Horizon North Logistics, Inc. | | | 3,031 | | |
| | 21,000 | | | | | Inmet Mining Corp. | | | 1,046,307 | | |
| | 83,900 | | | | | IPSCO, Inc. | | | 7,708,983 | | |
| | 5,200 | | | | | Laurentian Bank Of Canada | | | 134,521 | | |
| | 136,600 | | | @ | | Lionore Mining Intl. Ltd. | | | 1,151,968 | | |
| | 67,154 | | | @ | | Lundin Mining Corp. | | | 2,407,010 | | |
| | 34,700 | | | L | | Methanex Corp. | | | 785,806 | | |
| | 6,700 | | | | | Mosaid Technologies, Inc. | | | 166,165 | | |
| | 14,400 | | | | | Northbridge Financial Corp. | | | 397,524 | | |
| | 125,200 | | | @ | | Northgate Minerals Corp. | | | 402,486 | | |
| | 7,400 | | | @,L | | Novatel, Inc. | | | 276,094 | | |
| | 3,200 | | | | | Rothmans, Inc. | | | 57,705 | | |
| | 10,400 | | | | | Vermilion Energy Trust | | | 340,817 | | |
| | | | 25,001,898 | | |
| | | | | China: 2.1% | |
| | 3,002,000 | | | L | | Angang New Steel Co., Ltd. | | | 3,057,758 | | |
| | 536,000 | | | | | Anhui Expressway Co. | | | 364,017 | | |
| | 785,000 | | | @,L | | Celestial Nutrifoods Ltd. | | | 862,190 | | |
| | 324,000 | | | | | Dongfang Electrical Machinery
Co., Ltd. | | | 623,155 | | |
| | 104,000 | | | | | Hengan International Group
Co., Ltd. | | | 249,895 | | |
| | 4,006,074 | | | L | | Jiangxi Copper Co., Ltd. | | | 4,331,204 | | |
| | 3,633,000 | | | @ | | Synear Food Holdings Ltd. | | | 2,730,351 | | |
| | | | 12,218,570 | | |
| | | | | Denmark: 2.3% | |
| | 1,900 | | | | | Amagerbanken A/S | | | 122,858 | | |
| | 9,400 | | | L | | Auriga Industries | | | 261,034 | | |
| | 130 | | | | | D/S Norden | | | 81,649 | | |
| | 61,700 | | | L | | D/S Torm A/S | | | 3,337,632 | | |
| | 5,725 | | | | | East Asiatic Co., Ltd. A/S | | | 287,883 | | |
| | 8,600 | | | @ | | Genmab A/S | | | 383,865 | | |
| | 15,150 | | | @,L | | Jyske Bank | | | 901,992 | | |
See Accompanying Notes to Financial Statements
157
PORTFOLIO OF INVESTMENTS
ING INTERNATIONAL SMALLCAP FUND AS OF OCTOBER 31, 2006 (CONTINUED)
| Shares | | | | | | Value | |
| | | | | Denmark (continued) | |
| | 875 | | | | | Sjaelso Gruppen | | $ | 252,485 | | |
| | 94,710 | | | | | Sydbank A/S | | | 3,739,605 | | |
| | 28,500 | | | @ | | Topdanmark A/S | | | 4,025,847 | | |
| | | | 13,394,850 | | |
| | | | | Finland: 1.0% | |
| | 41,060 | | | | | Cargotec Corp. | | | 1,867,702 | | |
| | 12,200 | | | | | Finnair OYJ | | | 191,179 | | |
| | 40,800 | | | | | KCI Konecranes OYJ | | | 879,404 | | |
| | 8,673 | | | | | Kesko OYJ | | | 409,537 | | |
| | 9,050 | | | | | Nokian Renkaat OYJ | | | 173,511 | | |
| | 29,100 | | | @,L | | Oriola-KD OYJ | | | 103,994 | | |
| | 15,200 | | | | | Ramirent OYJ | | | 694,886 | | |
| | 52,050 | | | | | Rautaruukki OYJ | | | 1,720,923 | | |
| | | | 6,041,136 | | |
| | | | | France: 4.8% | |
| | 6,205 | | | | | BioMerieux | | | 387,129 | | |
| | 10,024 | | | | | CFF Recycling | | | 353,290 | | |
| | 1,109 | | | | | CNP Assurances | | | 116,516 | | |
| | 6,234 | | | @,L | | Compagnie Generale de
Geophysique SA | | | 1,062,003 | | |
| | 105,618 | | | L | | Etablissements Maurel et Prom | | | 2,410,184 | | |
| | 12,432 | | | | | Haulotte Group | | | 315,021 | | |
| | 26,428 | | | L | | Kaufman & Broad SA | | | 1,521,235 | | |
| | 52,406 | | | | | Neopost SA | | | 6,397,793 | | |
| | 41,400 | | | | | Nexans SA | | | 3,715,542 | | |
| | 120,346 | | | | | Nexity | | | 8,287,186 | | |
| | 1,569 | | | | | Pierre & Vacances | | | 180,032 | | |
| | 3,697 | | | L | | Rallye SA | | | 176,915 | | |
| | 953 | | | | | Societe Fonciere Financiere et
de Participations FFP | | | 208,148 | | |
| | 44,421 | | | @,L | | Ubisoft Entertainment | | | 2,738,857 | | |
| | | | 27,869,851 | | |
| | | | | Germany: 6.3% | |
| | 22,672 | | | @ | | Air Berlin PLC | | | 434,070 | | |
| | 15,544 | | | L | | Balda AG | | | 103,559 | | |
| | 9,518 | | | | | Continental AG | | | 1,065,930 | | |
| | 3,302 | | | | | CTS Eventim AG | | | 113,907 | | |
| | 5,783 | | | @ | | Demag Cranes AG | | | 208,879 | | |
| | 212,193 | | | @ | | Deutz AG | | | 2,144,917 | | |
| | 25,025 | | | @ | | EM.TV AG | | | 104,840 | | |
| | 107,910 | | | @ | | EpCos. AG | | | 1,739,208 | | |
| | 11,748 | | | | | Gildemeister AG | | | 117,171 | | |
| | 4,846 | | | @ | | Hannover Rueckversicherung AG | | | 205,651 | | |
| | 11,055 | | | @ | | Jenoptik AG | | | 101,045 | | |
| | 3,627 | | | @ | | Lanxess | | | 166,052 | | |
| | 34,198 | | | | | Leoni AG | | | 1,302,848 | | |
| | 8,213 | | | | | Linde AG | | | 814,197 | | |
| | 10,565 | | | | | MPC Muenchmeyer Petersen
Capital AG | | | 933,209 | | |
| | 167,042 | | | | | MTU Aero Engines Holding AG | | | 6,852,047 | | |
| | 8,386 | | | | | Pfeiffer Vacuum Technology AG | | | 564,587 | | |
| | 89,464 | | | | | Praktiker Bau-und
Heimwerkermaerkte AG | | | 2,847,492 | | |
| | 37,691 | | | | | Salzgitter AG | | | 4,045,238 | | |
| | 204,846 | | | @ | | SGL Carbon AG | | | 4,515,622 | | |
| | 81,767 | | | @ | | Vivacon AG | | | 2,021,533 | | |
| | 5,866 | | | | | Vossloh AG | | | 365,944 | | |
| | 42,652 | | | | | Wincor Nixdorf AG | | | 5,919,295 | | |
| | 34,913 | | | @ | | Wirecard AG | | | 297,229 | | |
| | | | 36,984,470 | | |
| Shares | | | | | | Value | |
| | | | | Greece: 0.7% | |
| | 68,564 | | | @ | | Aegek SA | | $ | 76,798 | | |
| | 95,217 | | | L | | Tsakos Energy Navigation Ltd. | | | 4,221,922 | | |
| | | | 4,298,720 | | |
| | | | | Hong Kong: 2.9% | |
| | 152,000 | | | @ | | AAC Acoustic Technology
Holdings, Inc. | | | 176,159 | | |
| | 373,000 | | | L | | ASM Pacific Technology | | | 1,931,493 | | |
| | 2,630,000 | | | | | Cnpc Hong Kong Ltd. | | | 1,315,782 | | |
| | 676,000 | | | | | Cosco International
Holdings Ltd. | | | 246,446 | | |
| | 1,408,000 | | | | | Emperor International Holdings | | | 329,297 | | |
| | 1,108,500 | | | L | | Jinhui Shipping &
Transportation Ltd. | | | 4,288,353 | | |
| | 434,000 | | | L | | Midland Holdings Ltd. | | | 214,857 | | |
| | 249,000 | | | | | Pacific Andes Holdings Ltd. | | | 105,451 | | |
| | 1,659,000 | | | L | | Pacific Basin Shipping Ltd. | | | 1,066,230 | | |
| | 972,000 | | | | | Skyworth Digital Holdings Ltd. | | | 109,804 | | |
| | 6,794,000 | | | | | Solomon Systech
International Ltd. | | | 1,186,544 | | |
| | 197,000 | | | | | Television Broadcasts Ltd. | | | 1,128,762 | | |
| | 8,040,000 | | | | | Titan Petrochemicals Group Ltd. | | | 557,234 | | |
| | 100,194 | | | | | Vtech Holdings Ltd. | | | 502,766 | | |
| | 371,500 | | | | | Wing Hang Bank Ltd. | | | 3,611,665 | | |
| | | | 16,770,843 | | |
| | | | | Indonesia: 0.0% | |
| | 41,000 | | | | | International Nickel
Indonesia Tbk PT | | | 117,983 | | |
| | | | 117,983 | | |
| | | | | Ireland: 0.1% | |
| | 44,400 | | | | | C&C Group PLC | | | 737,588 | | |
| | 2,100 | | | | | FBD Holdings PLC | | | 106,149 | | |
| | | | 843,737 | | |
| | | | | Israel: 0.1% | |
| | 9,449 | | | | | Elbit Systems Ltd. | | | 297,948 | | |
| | | | 297,948 | | |
| | | | | Italy: 1.6% | |
| | 29,455 | | | | | ASM | | | 139,601 | | |
| | 35,706 | | | L | | Autostrada Torino-Milano S.p.A. | | | 758,345 | | |
| | 69,262 | | | | | Azimut Holding S.p.A. | | | 783,086 | | |
| | 220,621 | | | | | Banca Finnat Euramerica S.p.A. | | | 292,849 | | |
| | 22,867 | | | | | Banca Popolare di Milano SCRL | | | 338,301 | | |
| | 9,431 | | | | | Banche Popolari Unite SCPA | | | 258,904 | | |
| | 10,725 | | | | | Banco di Desio e della
Brianza S.p.A. | | | 100,825 | | |
| | 44,618 | | | | | Benetton Group S.p.A. | | | 843,979 | | |
| | 10,209 | | | | | Biesse S.p.A. | | | 168,290 | | |
| | 78,629 | | | @ | | Buongiorno S.p.A. | | | 416,617 | | |
| | 194,213 | | | | | Cremonini S.p.A. | | | 562,067 | | |
| | 2,907 | | | | | Fondiaria-Sai S.p.A. | | | 129,325 | | |
| | 42,453 | | | | | Marzotto S.p.A. | | | 187,895 | | |
| | 57,656 | | | | | Milano Assicurazioni S.p.A. | | | 447,749 | | |
| | 35,248 | | | | | Premafin Finanziaria S.p.A. | | | 103,247 | | |
| | 121,194 | | | | | Recordati S.p.A. | | | 931,613 | | |
| | 41,115 | | | | | Sogefi S.p.A. | | | 281,237 | | |
| | 1,851 | | | | | Tod's S.p.A. | | | 160,561 | | |
| | 593,284 | | | | | Unipol S.p.A. | | | 2,048,995 | | |
| | 17,404 | | | | | Valentino Fashion Group S.p.A. | | | 623,474 | | |
| | | | 9,576,960 | | |
See Accompanying Notes to Financial Statements
158
PORTFOLIO OF INVESTMENTS
ING INTERNATIONAL SMALLCAP FUND AS OF OCTOBER 31, 2006 (CONTINUED)
| Shares | | | | | | Value | |
| | | | | Japan: 22.9% | |
| | 109,100 | | | L | | Abilit Corp. | | $ | 438,717 | | |
| | 9,000 | | | | | Aeon Fantasy Co., Ltd. | | | 320,159 | | |
| | 42,400 | | | L | | Aichi Corp. | | | 443,964 | | |
| | 26,000 | | | | | Air Water, Inc. | | | 248,864 | | |
| | 280,700 | | | | | AOC Holdings, Inc. | | | 5,134,584 | | |
| | 132,000 | | | L | | Asahi Soft Drinks Co., Ltd. | | | 1,925,705 | | |
| | 10,000 | | | | | Asia Securities Printing Co., Ltd. | | | 87,265 | | |
| | 356,000 | | | | | Atsugi Co., Ltd. | | | 525,962 | | |
| | 12,000 | | | | | Awa Bank Ltd. | | | 68,204 | | |
| | 24 | | | | | Axell Corp. | | | 75,846 | | |
| | 4,400 | | | @ | | Bank of the Ryukyus Ltd. | | | 83,594 | | |
| | 27,000 | | | | | BMB Corp. | | | 82,631 | | |
| | 12,400 | | | | | BML, Inc. | | | 256,029 | | |
| | 110,601 | | | L | | Bosch Corp. | | | 624,182 | | |
| | 233,700 | | | L | | Capcom Co., Ltd. | | | 4,284,670 | | |
| | 92,800 | | | | | Century Leasing System, Inc. | | | 1,268,935 | | |
| | 17,300 | | | @ | | Chiba Kogyo Bank Ltd. | | | 271,629 | | |
| | 1,008,000 | | | @,L | | Chori Co., Ltd. | | | 1,714,007 | | |
| | 33,800 | | | | | Chubu Steel Plate Co., Ltd. | | | 333,760 | | |
| | 828,000 | | | | | Daiichi Chuo Kisen Kaisha | | | 1,745,537 | | |
| | 57,000 | | | | | Daiichi Jitsugyo Co., Ltd. | | | 272,208 | | |
| | 19,000 | | | | | Daimei Telecom
Engineering Corp. | | | 165,116 | | |
| | 7,900 | | | | | Daiseki Co., Ltd. | | | 190,365 | | |
| | 44,000 | | | | | Daito Bank Ltd. | | | 63,804 | | |
| | 265,000 | | | L | | Daiwa Industries Ltd. | | | 1,669,355 | | |
| | 6,500 | | | | | Daiwabo Information System
Co., Ltd. | | | 81,497 | | |
| | 193,500 | | | @,L | | DIA Kensetsu Co., Ltd. | | | 323,379 | | |
| | 119,900 | | | L | | Diamond Lease Co., Ltd. | | | 6,045,012 | | |
| | 23,400 | | | | | Disco Corp. | | | 1,388,453 | | |
| | 11 | | | @ | | e-machitown Co., Ltd. | | | 93,154 | | |
| | 20,900 | | | | | Eizo Nanao Corp. | | | 513,731 | | |
| | 12,000 | | | | | Excel Co., Ltd. | | | 219,445 | | |
| | 10,000 | | | | | Ezaki Glico Co., Ltd. | | | 95,946 | | |
| | 12,900 | | | L | | Foster Electric Co., Ltd. | | | 153,485 | | |
| | 374,000 | | | @,L | | Fuji Kosan Co., Ltd. | | | 493,303 | | |
| | 53,700 | | | | | Fuji Machine Manufacturing
Co., Ltd. | | | 1,063,010 | | |
| | 116,000 | | | | | Fujikura Ltd. | | | 1,236,744 | | |
| | 53,300 | | | | | Fujitsu Frontech Ltd. | | | 450,764 | | |
| | 195,000 | | | @,L | | Fujitsu General Ltd. | | | 454,950 | | |
| | 574 | | | L | | Geo Co., Ltd. | | | 1,200,992 | | |
| | 2 | | | | | GMO Payment Gateway, Inc. | | | 3,961 | | |
| | 5,010 | | | L | | Gulliver International Co., Ltd. | | | 431,259 | | |
| | 4,000 | | | | | Hakudo Co., Ltd. | | | 78,981 | | |
| | 6,300 | | | | | Happinet Corp. | | | 114,236 | | |
| | 198,000 | | | @,L | | Haseko Corp. | | | 679,790 | | |
| | 6,000 | | | | | Hirano Tecseed Co., Ltd. | | | 74,149 | | |
| | 111,000 | | | | | Hitachi Cable Ltd. | | | 567,115 | | |
| | 25,800 | | | | | Hosiden Corp. | | | 285,267 | | |
| | 15,000 | | | | | Hyakugo Bank Ltd. | | | 95,577 | | |
| | 79,000 | | | | | IBJ Leasing Co., Ltd. | | | 1,975,348 | | |
| | 151,300 | | | L | | Iino Kaiun Kaisha Ltd. | | | 1,314,401 | | |
| | 46,000 | | | | | Inabata & Co., Ltd. | | | 345,901 | | |
| | 41,200 | | | L | | Izumi Co., Ltd. | | | 1,531,023 | | |
| | 38,900 | | | | | Japan Airport Terminal Co., Ltd. | | | 458,990 | | |
| | 667,000 | | | | | JFE Shoji Holdings, Inc. | | | 2,782,853 | | |
| | 69,000 | | | | | Jidosha Buhin Kogyo Co., Ltd. | | | 237,414 | | |
| | 38,000 | | | L | | Joshin Denki Co., Ltd. | | | 215,018 | | |
| | 135,000 | | | | | Juki Corp. | | | 750,611 | | |
| | 16,000 | | | | | Juroku Bank Ltd. | | | 90,477 | | |
| | 25,000 | | | L | | Kanamoto Co., Ltd. | | | 180,884 | | |
| Shares | | | | | | Value | |
| | 33,000 | | | | | Kandenko Co., Ltd. | | $ | 199,683 | | |
| | 59,900 | | | | | Kanto Auto Works Ltd. | | | 762,925 | | |
| | 49,200 | | | @,L | | Kanto Tsukuba Bank Ltd. | | | 542,425 | | |
| | 209,000 | | | @,L | | Kawai Musical Instruments
Manufacturing Co., Ltd. | | | 372,592 | | |
| | 118,100 | | | | | Keihin Corp. | | | 2,820,566 | | |
| | 20,000 | | | | | Keiyo Bank Ltd. | | | 114,670 | | |
| | 1,703,000 | | | | | Kenwood Corp. | | | 3,282,989 | | |
| | 11,200 | | | | | Komatsu Electronic Metals
Co., Ltd. | | | 447,825 | | |
| | 33,900 | | | | | Kyoden Co., Ltd. | | | 151,580 | | |
| | 474,324 | | | L | | Kyoei Tanker Co., Ltd. | | | 1,313,725 | | |
| | 129,000 | | | @ | | Kyushu-Shinwa Holdings, Inc. | | | 156,074 | | |
| | 44,000 | | | | | Maeda Road Construction
Co., Ltd. | | | 303,817 | | |
| | 13,000 | | | | | Mie Bank Ltd. | | | 69,865 | | |
| | 468,000 | | | @,L | | Mitsubishi Paper Mills Ltd. | | | 852,007 | | |
| | 64,000 | | | L | | Mitsubishi Steel Manufacturing
Co., Ltd. | | | 295,920 | | |
| | 70,000 | | | | | Mitsui Home Co., Ltd. | | | 517,292 | | |
| | 86,200 | | | L | | Mitsumi Electric Co., Ltd. | | | 1,262,459 | | |
| | 250,900 | | | L | | Mori Seiki Co., Ltd. | | | 5,234,649 | | |
| | 11,700 | | | | | Moshi Moshi Hotline, Inc. | | | 403,750 | | |
| | 4,000 | | | | | Nadex Co., Ltd. | | | 36,971 | | |
| | 8,000 | | | | | Nagase & Co., Ltd. | | | 97,408 | | |
| | 328,000 | | | L | | Nakayama Steel Works Ltd. | | | 1,086,463 | | |
| | 28,700 | | | | | NEC Fielding Ltd. | | | 396,857 | | |
| | 11,400 | | | | | NEC Leasing Ltd. | | | 238,698 | | |
| | 240,000 | | | | | Nichirei Corp. | | | 1,282,394 | | |
| | 10,300 | | | | | Nifco, Inc. | | | 211,229 | | |
| | 10,500 | | | L | | Nihon Dempa Kogyo Co., Ltd. | | | 430,186 | | |
| | 11,000 | | | | | Nippei Toyama Corp. | | | 75,692 | | |
| | 27,000 | | | | | Nippo Corp. | | | 202,893 | | |
| | 14,000 | | | | | Nippon Konpo Unyu Soko
Co., Ltd. | | | 171,402 | | |
| | 9,000 | | | | | Nippon Seiki Co., Ltd. | | | 214,555 | | |
| | 31,000 | | | | | Nippon Thompson Co., Ltd. | | | 292,993 | | |
| | 829,500 | | | L | | Nippon Yakin Kogyo Co., Ltd. | | | 4,148,111 | | |
| | 21,000 | | | | | Nippon Yusoki Co., Ltd. | | | 91,634 | | |
| | 3,800 | | | | | Nishio Rent All Co., Ltd. | | | 64,854 | | |
| | 628,000 | | | L | | Nissan Diesel Motor Co., Ltd. | | | 1,966,918 | | |
| | 201,100 | | | | | Nissin Kogyo Co., Ltd. | | | 4,808,640 | | |
| | 62,000 | | | | | Nittetsu Mining Co., Ltd. | | | 488,342 | | |
| | 4,300 | | | | | Optex Co., Ltd. | | | 120,100 | | |
| | 12,800 | | | L | | Osaka Steel Co., Ltd. | | | 220,164 | | |
| | 68,000 | | | | | Pacific Industrial Co., Ltd. | | | 392,830 | | |
| | 374,000 | | | | | Pacific Metals Co., Ltd. | | | 3,208,615 | | |
| | 30,100 | | | | | Parco Co., Ltd. | | | 361,223 | | |
| | 136,000 | | | | | Press Kogyo Co., Ltd. | | | 590,241 | | |
| | 44,800 | | | | | Ricoh Leasing Co., Ltd. | | | 1,101,226 | | |
| | 10,800 | | | L | | Ryoyo Electro Corp. | | | 152,267 | | |
| | 15,000 | | | | | San-Ai Oil Co., Ltd. | | | 57,049 | | |
| | 97,700 | | | | | Santen Pharmaceutical Co., Ltd. | | | 2,548,895 | | |
| | 63,400 | | | L | | Sanyo Electric Credit Co., Ltd. | | | 1,072,803 | | |
| | 7,500 | | | | | Satori Electric Co., Ltd. | | | 111,517 | | |
| | 101 | | | | | Secured Capital Japan Co., Ltd. | | | 315,477 | | |
| | 24,700 | | | | | Shinki Co., Ltd. | | | 119,788 | | |
| | 203,000 | | | | | Shinko Plantech Co., Ltd. | | | 1,525,683 | | |
| | 20,000 | | | | | Shinmaywa Industries Ltd. | | | 98,409 | | |
| | 496,000 | | | | | Shinwa Kaiun Kaisha Ltd. | | | 1,682,545 | | |
| | 80,000 | | | | | Shizuoka Gas Co., Ltd. | | | 583,510 | | |
| | 229 | | | | | Starbucks Coffee Japan Ltd. | | | 99,061 | | |
| | 13,400 | | | L | | STB Leasing Co., Ltd. | | | 233,867 | | |
See Accompanying Notes to Financial Statements
159
PORTFOLIO OF INVESTMENTS
ING INTERNATIONAL SMALLCAP FUND AS OF OCTOBER 31, 2006 (CONTINUED)
| Shares | | | | | | Value | |
| | | | | Japan (continued) | |
| | 399,000 | | | | | Sumikin Bussan Corp. | | $ | 1,452,495 | | |
| | 144,800 | | | | | Sumisho Lease Co., Ltd. | | | 8,612,283 | | |
| | 33,200 | | | L | | Tachi-S Co., Ltd. | | | 251,942 | | |
| | 109,000 | | | | | Taihei Kogyo Co., Ltd. | | | 347,206 | | |
| | 75,000 | | | | | Takagi Securities Co., Ltd. | | | 328,667 | | |
| | 48,000 | | | | | Takisawa Machine Tool Co., Ltd. | | | 118,798 | | |
| | 87,000 | | | | | TBK Co., Ltd. | | | 414,925 | | |
| | 36,000 | | | | | TCM Corp. | | | 102,798 | | |
| | 122 | | | | | Tempstaff Co., Ltd. | | | 190,493 | | |
| | 96,000 | | | | | Toa Corp. | | | 110,681 | | |
| | 130,000 | | | | | Toagosei Co., Ltd. | | | 498,775 | | |
| | 29,000 | | | | | Toei Co., Ltd. | | | 193,965 | | |
| | 21,800 | | | L | | Tokyo Leasing Co., Ltd. | | | 286,722 | | |
| | 92,000 | | | | | Tokyo Tekko Co., Ltd. | | | 734,633 | | |
| | 2,700 | | | | | Tokyu Community Corp. | | | 82,464 | | |
| | 10,000 | | | L | | Tokyu Livable, Inc. | | | 831,504 | | |
| | 3,000 | | | | | Tomen Electronics Corp. | | | 57,307 | | |
| | 333,000 | | | L | | Tonichi Carlife Group, Inc. | | | 852,785 | | |
| | 215,000 | | | | | Toshiba Ceramics Co., Ltd. | | | 1,095,149 | | |
| | 363,000 | | | @,L | | Towa Real Estate Development
Co., Ltd. | | | 2,149,048 | | |
| | 46,000 | | | | | Toyo Suisan Kaisha Ltd. | | | 672,103 | | |
| | 115,000 | | | | | Toyo Tire & Rubber Co., Ltd. | | | 516,175 | | |
| | 10,900 | | | | | Toyota Auto Body Co., Ltd. | | | 189,139 | | |
| | 18,000 | | | | | Trusco Nakayama Corp. | | | 335,232 | | |
| | 71,000 | | | L | | UFJ Central Leasing Co., Ltd. | | | 3,538,932 | | |
| | 57 | | | | | Wowow, Inc. | | | 146,500 | | |
| | 16,830 | | | @ | | Yamaguchi Financial Group, Inc. | | | 210,672 | | |
| | 11,000 | | | | | Yamanashi Chuo Bank Ltd. | | | 74,955 | | |
| | 290,500 | | | | | Yamato Kogyo Co., Ltd. | | | 6,394,761 | | |
| | 242,000 | | | | | Yamazen Corp. | | | 1,591,790 | | |
| | 130,000 | | | L | | Yaskawa Electric Corp. | | | 1,385,254 | | |
| | 20,000 | | | | | Yokogawa Bridge Corp. | | | 88,229 | | |
| | 25,500 | | | | | Yonekyu Corp. | | | 256,041 | | |
| | 972,000 | | | @,L | | Yuasa Trading Co., Ltd. | | | 1,741,536 | | |
| | 15,000 | | | | | Yusen Air & Sea Service Co., Ltd. | | | 345,833 | | |
| | | | 134,528,327 | | |
| | | | | Liechtenstein: 0.1% | |
| | 2,110 | | | | | Verwalt & Privat-Bank AG | | | 531,611 | | |
| | | | 531,611 | | |
| | | | | Malaysia: 0.2% | |
| | 341,500 | | | | | Digi.Com Bhd | | | 1,112,186 | | |
| | 677,700 | | | | | Lion Industries Corp. Bhd | | | 158,340 | | |
| | | | 1,270,526 | | |
| | | | | Netherlands: 2.9% | |
| | 65,190 | | | | | Aalberts Industries NV | | | 5,114,756 | | |
| | 6,864 | | | | | Arcadis NV | | | 335,324 | | |
| | 13,848 | | | | | Beter BED Holdings NV | | | 309,238 | | |
| | 46,436 | | | | | Binck NV | | | 738,352 | | |
| | 7,451 | | | | | Boskalis Westminster | | | 543,416 | | |
| | 30,956 | | | | | Endemol NV | | | 591,338 | | |
| | 1,400 | | | | | Exact Holding NV | | | 41,877 | | |
| | 1,969 | | | | | Hunter Douglas NV | | | 151,537 | | |
| | 6,667 | | | | | Imtech NV | | | 370,609 | | |
| | 4,214 | | | | | Koninklijke DSM NV | | | 192,121 | | |
| | 13,903 | | | | | Macintosh Retail Group NV | | | 454,263 | | |
| | 44,287 | | | | | Nutreco Holding NV | | | 2,639,098 | | |
| | 33,400 | | | L | | OCE NV | | | 509,322 | | |
| | 1,137 | | | | | OPG Groep NV | | | 116,624 | | |
| Shares | | | | | | Value | |
| | 4,551 | | | | | Sligro Food Group NV | | $ | 269,930 | | |
| | 23,720 | | | | | Univar NV | | | 1,188,094 | | |
| | 84,866 | | | | | USG People NV | | | 3,464,236 | | |
| | | | 17,030,135 | | |
| | | | | New Zealand: 0.1% | |
| | 36,567 | | | | | Contact Energy Ltd. | | | 182,484 | | |
| | 45,042 | | | | | Fletcher Building Ltd. | | | 286,458 | | |
| | | | 468,942 | | |
| | | | | Norway: 1.0% | |
| | 417,000 | | | | | Acta Holding ASA | | | 1,931,208 | | |
| | 98,500 | | | | | Cermaq ASA | | | 1,214,147 | | |
| | 19,100 | | | | | Leroy Seafood Group ASA | | | 301,091 | | |
| | 130,600 | | | | | Tandberg ASA | | | 1,506,968 | | |
| | 60,640 | | | @ | | TGS Nopec Geophysical Co. ASA | | | 1,084,237 | | |
| | | | 6,037,651 | | |
| | | | | Portugal: 0.0% | |
| | 10,300 | | | @ | | Impresa SGPS | | | 57,598 | | |
| | 8,465 | | | | | Jeronimo Martins | | | 161,948 | | |
| | | | 219,546 | | |
| | | | | Singapore: 1.6% | |
| | 125,400 | | | | | Jurong Technologies Industrial
Corp., Ltd. | | | 89,431 | | |
| | 407,000 | | | | | Labroy Marine Ltd. | | | 487,746 | | |
| | 196,000 | | | | | MFS Technology Ltd. | | | 113,548 | | |
| | 2,091,000 | | | | | MMI Holding Ltd. | | | 1,341,254 | | |
| | 216,000 | | | | | Neptune Orient Lines Ltd. | | | 282,339 | | |
| | 335,000 | | | | | Singapore Exchange Ltd. | | | 966,346 | | |
| | 257,000 | | | L | | Singapore Petroleum Co., Ltd. | | | 749,681 | | |
| | 2,172,000 | | | @,L | | STATS ChipPAC Ltd. | | | 1,378,157 | | |
| | 196,000 | | | | | United Overseas Land Ltd. | | | 503,571 | | |
| | 7,193,000 | | | @,L | | United Test and Assembly
Center Ltd. | | | 3,367,810 | | |
| | | | 9,279,883 | | |
| | | | | South Korea: 2.9% | |
| | 299 | | | @ | | Amorepacific Corp. | | | 154,855 | | |
| | 13,600 | | | | | Daeduck GDS Co., Ltd. | | | 142,332 | | |
| | 5,750 | | | | | Daewoong Pharmaceutical
Co., Ltd. | | | 310,962 | | |
| | 27,450 | | | | | Dongbu Insurance Co., Ltd. | | | 653,393 | | |
| | 18,450 | | | | | Dongkuk Steel Mill Co., Ltd. | | | 348,130 | | |
| | 143,450 | | | L | | Dongyang Mechatronics Corp. | | | 593,437 | | |
| | 1,607 | | | | | GS Home Shopping, Inc. | | | 132,218 | | |
| | 18,900 | | | | | Halla Engineering &
Construction Corp. | | | 436,755 | | |
| | 17,450 | | | | | Hanshin Construction | | | 329,306 | | |
| | 23,050 | | | @ | | Hyosung Corp. | | | 487,259 | | |
| | 2,271 | | | | | Hyundai Mipo Dockyard
Co., Ltd. | | | 301,011 | | |
| | 23,310 | | | | | INI Steel Co. | | | 826,598 | | |
| | 3,900 | | | | | Korea Gas Corp. | | | 152,658 | | |
| | 9,114 | | | | | Korea Zinc Co., Ltd. | | | 1,004,673 | | |
| | 26,960 | | | | | Korean Petrochemical
Industrial Co. | | | 841,204 | | |
| | 10,256 | | | | | Kyeryong Construction
Industrial Co., Ltd. | | | 419,711 | | |
| | 12,690 | | | | | LG Chem Ltd. | | | 516,490 | | |
| | 46,510 | | | | | LG Petrochemical Co., Ltd. | | | 1,107,687 | | |
| | 121 | | | | | Lotte Chilsung Beverage
Co., Ltd. | | | 152,536 | | |
See Accompanying Notes to Financial Statements
160
PORTFOLIO OF INVESTMENTS
ING INTERNATIONAL SMALLCAP FUND AS OF OCTOBER 31, 2006 (CONTINUED)
| Shares | | | | | | Value | |
| | | | | South Korea (continued) | |
| | 12,320 | | | @ | | Lotte Tour Development
Co., Ltd. | | $ | 235,352 | | |
| | 20,580 | | | | | LS Cable Ltd. | | | 864,135 | | |
| | 89,020 | | | | | Meritz Fire & Marine Insurance
Co., Ltd. | | | 557,545 | | |
| | 575 | | | | | Nong Shim Co., Ltd. | | | 156,144 | | |
| | 1,575 | | | | | Pacific Corp. | | | 218,971 | | |
| | 44,384 | | | | | People &
Telecommunication, Inc. | | | 531,600 | | |
| | 9,830 | | | | | Poongsan Corp. | | | 216,474 | | |
| | 219,842 | | | | | S&T Dynamics Co., Ltd. | | | 1,422,195 | | |
| | 28,830 | | | | | SeAH Steel Corp. | | | 955,322 | | |
| | 39,460 | | | | | SFA Engineering Corp. | | | 1,234,049 | | |
| | 7,770 | | | | | SK Chemicals Co., Ltd. | | | 343,233 | | |
| | 30,100 | | | | | SKC Co., Ltd. | | | 726,495 | | |
| | 36,190 | | | | | Woori Investment & Securities
Co., Ltd. | | | 720,151 | | |
| | | | 17,092,881 | | |
| | | | | Spain: 1.8% | |
| | 557,046 | | | @,L | | Avanzit SA | | | 2,983,020 | | |
| | 1,148 | | | | | Cementos Portland
Valderrivas SA | | | 130,455 | | |
| | 1,377 | | | | | Fomento de Construcciones y
Contratas SA | | | 119,920 | | |
| | 50,321 | | | @ | | Grifols SA | | | 526,980 | | |
| | 1,231,170 | | | | | Iberia Lineas Aereas de Espana | | | 3,863,994 | | |
| | 42,330 | | | @ | | La Seda de Barcelona SA | | | 117,161 | | |
| | 7,107 | | | | | Mecalux SA | | | 273,355 | | |
| | 46,271 | | | | | Obrascon Huarte Lain SA | | | 1,174,948 | | |
| | 192,354 | | | L | | Uralita SA | | | 1,226,207 | | |
| | | | 10,416,040 | | |
| | | | | Sweden: 2.3% | |
| | 16,000 | | | | | Avanza AB | | | 255,922 | | |
| | 170,700 | | | | | D Carnegie AB | | | 3,255,238 | | |
| | 32,500 | | | | | Fabege AB | | | 756,915 | | |
| | 13,400 | | | | | Intrum Justitia AB | | | 138,728 | | |
| | 282,800 | | | | | JM AB | | | 5,565,680 | | |
| | 159,600 | | | L | | Lindex AB | | | 2,122,200 | | |
| | 13,000 | | | @ | | Micronic Laser Systems AB | | | 116,919 | | |
| | 16,300 | | | | | Nobia AB | | | 578,006 | | |
| | 14,700 | | | | | Saab AB | | | 414,266 | | |
| | 20,000 | | | | | Trelleborg AB | | | 420,382 | | |
| | | | 13,624,256 | | |
| | | | | Switzerland: 4.0% | |
| | 35,056 | | | @ | | Actelion NV | | | 5,887,552 | | |
| | 1,339 | | | | | AFG Arbonia-Forster Holding | | | 469,893 | | |
| | 21,762 | | | | | Baloise Holding AG | | | 2,079,513 | | |
| | 1,295 | | | @ | | Barry Callebaut AG | | | 626,037 | | |
| | 4,540 | | | | | Bucher Industries AG | | | 459,258 | | |
| | 9,597 | | | @ | | Charles Voegele Holding AG | | | 756,298 | | |
| | 202,074 | | | | | Converium Holding AG | | | 2,581,648 | | |
| | 2,153 | | | | | Geberit AG | | | 2,802,781 | | |
| | 3,989 | | | @ | | Georg Fischer AG | | | 2,039,784 | | |
| | 3,016 | | | | | Helvetia Patria Holding | | | 953,065 | | |
| | 80 | | | | | Hiestand Holding AG | | | 87,438 | | |
| | 125,100 | | | L | | Kudelski SA | | | 3,858,974 | | |
| | 4,596 | | | @ | | Partners Group | | | 442,440 | | |
| | 995 | | | | | Rieter Holding AG | | | 471,771 | | |
| | | | 23,516,452 | | |
| Shares | | | | | | Value | |
| | | | | Taiwan: 1.6% | |
| | 19,561 | | | | | AV Tech Corp. | | $ | 84,565 | | |
| | 441,000 | | | @ | | Chunghwa Picture Tubes Ltd. | | | 84,094 | | |
| | 552,000 | | | @ | | Compeq Manufacturing Co. | | | 236,150 | | |
| | 223,022 | | | | | Coretronic Corp. | | | 270,754 | | |
| | 188,700 | | | | | Everlight Electronics Co., Ltd. | | | 495,849 | | |
| | 1,884,158 | | | | | Micro-Star International Co., Ltd. | | | 1,011,207 | | |
| | 4,167,227 | | | | | Nanya Technology Corp. | | | 2,940,136 | | |
| | 68,851 | | | | | Phison Electronics Corp. | | | 355,540 | | |
| | 86,097 | | | | | POU Chen Corp. | | | 73,736 | | |
| | 302,000 | | | | | Powertech Technology, Inc. | | | 867,423 | | |
| | 464,450 | | | | | Quanta Storage, Inc. | | | 599,951 | | |
| | 365,000 | | | | | Sanyang Industrial Co., Ltd. | | | 195,116 | | |
| | 56,000 | | | | | Syntech Information Co., Ltd. | | | 78,072 | | |
| | 29,000 | | | | | Tung Ho Steel Enterprise Corp. | | | 23,959 | | |
| | 740,000 | | | | | U-Ming Marine Transport Corp. | | | 866,541 | | |
| | 385,220 | | | | | Unimicron Technology Corp. | | | 436,288 | | |
| | 410,052 | | | | | Vanguard International
Semiconductor Corp. | | | 274,407 | | |
| | 327,000 | | | @ | | Walsin Lihwa Corp. | | | 157,690 | | |
| | 171,229 | | | | | Wistron Corp. | | | 197,891 | | |
| | | | 9,249,369 | | |
| | | | | Thailand: 0.1% | |
| | 361,500 | | | | | Aromatics Thailand PCL | | | 344,429 | | |
| | 457,300 | | | | | Thoresen Thai Agencies PCL | | | 330,181 | | |
| | | | 674,610 | | |
| | | | | Turkey: 1.9% | |
| | 51,189 | | | | | Akcansa Cimento AS | | | 274,752 | | |
| | 92,010 | | | @ | | Aksa Akrilik Kimya Sanayii | | | 971,444 | | |
| | 117,470 | | | | | Aksigorta | | | 486,501 | | |
| | 181,497 | | | @ | | Ayen Enerji | | | 299,404 | | |
| | 213,824 | | | | | Bolu Cimento Sanayii | | | 455,573 | | |
| | 276,305 | | | | | Bossa Ticaret Sanayi Isletme | | | 305,302 | | |
| | 310,212 | | | | | Doktas Dokumculuk Ticaret | | | 924,724 | | |
| | 86,391 | | | | | Eregli Demir ve Celik
Fabrikalari TAS | | | 495,047 | | |
| | 47,774 | | | | | Ford Otomotiv Sanayi AS | | | 334,876 | | |
| | 28,916 | | | @ | | Goodyear Lastikleri TAS | | | 469,006 | | |
| | 746,616 | | | @ | | Ihlas Holding | | | 294,528 | | |
| | 134,441 | | | | | Is Gayrimenkul Yatirim Or | | | 264,380 | | |
| | 75,798 | | | | | Mardin Cimento Sanayii | | | 452,896 | | |
| | 44,544 | | | @ | | Migros Turk TAS | | | 509,398 | | |
| | 264,065 | | | @ | | Park Elektrik Madencilik Sanayi
Ve Ticaret AS | | | 1,424,781 | | |
| | 1 | | | | | Petrol Ofisi | | | 2 | | |
| | 172,470 | | | @ | | TAT Konserve | | | 262,506 | | |
| | 64,932 | | | | | Trakya Cam Sanyii AS | | | 180,356 | | |
| | 180,073 | | | | | Turcas Petrolculuk AS | | | 568,905 | | |
| | 183,222 | | | @ | | Turk Hava Yollari | | | 822,049 | | |
| | 116,807 | | | @ | | Turk Sise Ve Cam Fabrikalari | | | 447,833 | | |
| | 38,838 | | | | | Turk Traktor ve Ziraat
Makineleri AS | | | 399,176 | | |
| | 238,887 | | | @ | | Vestel Elektronik Sanayi | | | 628,028 | | |
| | | | 11,271,467 | | |
| | | | | United Kingdom: 15.8% | |
| | 121,316 | | | | | Admiral Group PLC | | | 2,146,986 | | |
| | 170,706 | | | | | Aegis Group PLC | | | 433,842 | | |
| | 18,619 | | | | | Aga Foodservice Group PLC | | | 144,003 | | |
| | 207,118 | | | | | Aggreko PLC | | | 1,394,842 | | |
| | 676,993 | | | | | Ashtead Group PLC | | | 1,842,987 | | |
| | 5,234 | | | | | Atkins WS PLC | | | 87,145 | | |
See Accompanying Notes to Financial Statements
161
PORTFOLIO OF INVESTMENTS
ING INTERNATIONAL SMALLCAP FUND AS OF OCTOBER 31, 2006 (CONTINUED)
| Shares | | | | | | Value | |
| | | | | United Kingdom (continued) | |
| | 28,537 | | | | | Babcock International Group | | $ | 203,504 | | |
| | 13,103 | | | | | Bellway PLC | | | 336,036 | | |
| | 165,188 | | | | | Brit Insurance Holdings PLC | | | 1,020,083 | | |
| | 86,491 | | | | | Britvic PLC | | | 393,828 | | |
| | 226,323 | | | | | Burren Energy PLC | | | 3,588,323 | | |
| | 22,732 | | | | | Carillion PLC | | | 166,538 | | |
| | 405,617 | | | @ | | Charter PLC | | | 7,129,373 | | |
| | 7,366 | | | | | Chemring Group PLC | | | 222,429 | | |
| | 166,447 | | | | | Cookson Group PLC | | | 1,838,699 | | |
| | 1,055,311 | | | | | Countrywide PLC | | | 10,359,537 | | |
| | 21,962 | | | | | Cranswick PLC | | | 316,554 | | |
| | 109,217 | | | @ | | CSR PLC | | | 1,576,517 | | |
| | 74,349 | | | | | Dairy Crest Group PLC | | | 866,034 | | |
| | 438,243 | | | @ | | Dana Petroleum PLC | | | 10,050,148 | | |
| | 26,163 | | | | | De La Rue PLC | | | 309,366 | | |
| | 89,235 | | | @ | | easyJet PLC | | | 893,632 | | |
| | 96,214 | | | | | Enodis PLC | | | 340,210 | | |
| | 278,107 | | | | | First Choice Holidays PLC | | | 1,194,513 | | |
| | 203,510 | | | | | Greene King PLC | | | 3,711,348 | | |
| | 18,971 | | | @ | | Gyrus Group PLC | | | 131,107 | | |
| | 40,727 | | | | | Hiscox PLC | | | 205,849 | | |
| | 5,026 | | | | | Homeserve PLC | | | 170,373 | | |
| | 51,706 | | | | | IG Group Holdings PLC | | | 250,465 | | |
| | 239,442 | | | | | Inchcape PLC | | | 2,358,503 | | |
| | 40,098 | | | | | Intermediate Capital Group PLC | | | 1,116,885 | | |
| | 43,900 | | | | | Intertek Group PLC | | | 687,884 | | |
| | 39,366 | | | | | Keller Group PLC | | | 567,328 | | |
| | 61,542 | | | | | Matalan PLC | | | 231,277 | | |
| | 148,148 | | | | | Mcbride PLC | | | 498,085 | | |
| | 1,537,531 | | | | | Michael Page International PLC | | | 11,835,774 | | |
| | 56,010 | | | @ | | NETeller PLC | | | 153,938 | | |
| | 8,024 | | | | | Next PLC | | | 287,577 | | |
| | 98,920 | | | | | Northern Foods PLC | | | 167,312 | | |
| | 5,729 | | | | | Northern Rock PLC | | | 130,813 | | |
| | 28,216 | | | | | Northgate PLC | | | 587,224 | | |
| | 122,823 | | | | | Paragon Group of Cos., LLC | | | 1,571,451 | | |
| | 686,950 | | | | | Pendragon PLC | | | 6,923,306 | | |
| | 101,392 | | | | | Photo-Me International PLC | | | 189,276 | | |
| | 1,093,545 | | | @ | | Pipex Communications PLC | | | 245,105 | | |
| | 52,026 | | | | | Redrow PLC | | | 607,853 | | |
| | 111,478 | | | @ | | Regus Group PLC | | | 226,709 | | |
| | 22,330 | | | | | Rotork PLC | | | 333,922 | | |
| | 23,683 | | | | | Savills PLC | | | 272,367 | | |
| | 221,716 | | | | | SIG PLC | | | 4,217,216 | | |
| | 6,689 | | | | | Speedy Hire PLC | | | 131,880 | | |
| | 609,480 | | | | | Sportingbet PLC | | | 566,964 | | |
| | 45,317 | | | | | St. James's Place PLC | | | 331,552 | | |
| | 98,044 | | | | | Stagecoach Group PLC | | | 259,846 | | |
| | 39,404 | | | | | Sthree PLC | | | 274,323 | | |
| | 110,030 | | | | | Telent PLC | | | 1,038,517 | | |
| | 57,039 | | | | | TT electronics PLC | | | 241,934 | | |
| | 26,075 | | | | | Ultra Electronics Holdings | | | 554,981 | | |
| | 14,728 | | | @ | | Venture Production PLC | | | 224,680 | | |
| | 164,386 | | | | | VT Group PLC | | | 1,504,987 | | |
| | 31,059 | | | | | Wetherspoon (J.D.) PLC | | | 331,407 | | |
| | 9,919 | | | | | Wilson Bowden PLC | | | 329,677 | | |
| | 287,630 | | | @ | | Wolfson Microelectronics PLC | | | 1,578,708 | | |
| | 1,152,729 | | | | | Woolworths Group PLC | | | 806,763 | | |
| | | | 92,710,295 | | |
| Shares | | | | | | Value | |
| | | | | United States: 0.1% | |
| | 34,069 | | | @,L | | GigaMedia Ltd. | | $ | 329,447 | | |
| | | | 329,447 | | |
Total Common Stock
(Cost $480,167,318) | | | 551,390,337 | | |
| PREFERRED STOCK: 1.5% | | | |
| | | | | Germany: 1.1% | |
| | 29,532 | | | | | Hugo Boss AG | | | 1,375,257 | | |
| | 185,092 | | | | | ProSieben SAT.1 Media AG | | | 5,341,885 | | |
| | | | 6,717,142 | | |
| | | | | Italy: 0.4% | |
| | 77,281 | | | | | Instituto Finanziario
Industriale S.p.A. | | | 2,103,596 | | |
| | | | 2,103,596 | | |
Total Preferred Stock
(Cost $7,223,627) | | | 8,820,738 | | |
Total Long-Term Investments
(Cost $487,390,945) | | | 560,211,075 | | |
Principal
Amount | | | | Value | |
| SHORT-TERM INVESTMENTS: 21.3% | |
| | | U.S. Government Agency Obligations: 4.8% | |
| $ | 28,284,000 | | | Federal Home Loan Bank,
4.760%, due 11/01/06 | | $ | 28,280,260 | | |
Total U.S. Government Agency
Obligations
(Cost $28,280,260) | | | 28,280,260 | | |
| | | Securities Lending Collateralcc: 16.5% | |
| | 96,584,000 | | | The Bank of New York Institutional
Cash Reserves Fund | | | 96,584,000 | | |
Total Securities Lending Collateral
(Cost $96,584,000) | | | 96,584,000 | | |
Total Short-Term Investments
(Cost $124,864,260) | | | 124,864,260 | | |
Total Investments in
Securities
(Cost $612,255,205)* | | | 116.8 | % | | $ | 685,075,335 | | |
Other Assets and
Liabilities - Net | | | (16.8 | ) | | | (98,622,747 | ) | |
| Net Assets | | | 100.0 | % | | $ | 586,452,588 | | |
Securities may have been fair valued in accordance with procedures approved by the Board of Directors/Trustees (Note 2A).
@ Non-income producing security
cc Securities purchased with cash collateral for securities loaned.
L Loaned security, a portion or all of the security is on loan at October 31, 2006.
* Cost for federal income tax purposes is $613,765,222.
| Net unrealized appreciation consists of: | |
| Gross Unrealized Appreciation | | $ | 97,460,435 | | |
| Gross Unrealized Depreciation | | | (26,150,322 | ) | |
| Net Unrealized Appreciation | | $ | 71,310,113 | | |
See Accompanying Notes to Financial Statements
162
PORTFOLIO OF INVESTMENTS
ING INTERNATIONAL SMALLCAP FUND AS OF OCTOBER 31, 2006 (CONTINUED)
| Industry | | Percentage of
Net Assets | |
| Advertising | | | 0.1 | % | |
| Aerospace/Defense | | | 1.3 | | |
| Agriculture | | | 0.0 | | |
| Airlines | | | 1.1 | | |
| Apparel | | | 0.6 | | |
| Auto Manufacturers | | | 0.6 | | |
| Auto Parts & Equipment | | | 2.9 | | |
| Banks | | | 2.4 | | |
| Beverages | | | 1.2 | | |
| Biotechnology | | | 0.1 | | |
| Building Materials | | | 2.2 | | |
| Chemicals | | | 2.1 | | |
| Coal | | | 0.0 | | |
| Commercial Services | | | 4.4 | | |
| Computers | | | 1.3 | | |
| Cosmetics/Personal Care | | | 0.1 | | |
| Distribution/Wholesale | | | 2.3 | | |
| Diversified Financial Services | | | 7.6 | | |
| Electric | | | 0.3 | | |
| Electrical Components & Equipment | | | 1.8 | | |
| Electronics | | | 1.9 | | |
| Engineering & Construction | | | 2.6 | | |
| Entertainment | | | 0.2 | | |
| Environmental Control | | | 0.1 | | |
| Food | | | 2.5 | | |
| Forest Products & Paper | | | 0.1 | | |
| Gas | | | 0.1 | | |
| Hand/Machine Tools | | | 1.3 | | |
| Healthcare - Products | | | 0.1 | | |
| Healthcare - Services | | | 0.2 | | |
| Holding Companies - Diversified | | | 0.5 | | |
| Home Builders | | | 0.7 | | |
| Home Furnishings | | | 1.4 | | |
| Household Products/Wares | | | 0.2 | | |
| Housewares | | | 0.1 | | |
| Insurance | | | 3.3 | | |
| Internet | | | 0.6 | | |
| Iron/Steel | | | 6.2 | | |
| Leisure Time | | | 0.3 | | |
| Machinery - Construction & Mining | | | 0.1 | | |
| Machinery - Diversified | | | 1.8 | | |
| Media | | | 1.4 | | |
| Metal Fabricate/Hardware | | | 1.3 | | |
| Mining | | | 4.9 | | |
| Miscellaneous Manufacturing | | | 2.8 | | |
| Office/Business Equipment | | | 1.2 | | |
| Oil & Gas | | | 4.6 | | |
| Oil & Gas Services | | | 0.5 | | |
| Packaging & Containers | | | 0.0 | | |
| Pharmaceuticals | | | 1.8 | | |
| Real Estate | | | 5.0 | | |
| REITS | | | 0.1 | | |
| Retail | | | 4.0 | | |
| Semiconductors | | | 3.0 | | |
| Shipbuilding | | | 0.3 | | |
| Software | | | 1.2 | | |
| Telecommunications | | | 2.0 | | |
| Textiles | | | 0.1 | | |
| Transportation | | | 4.5 | | |
| Trucking & Leasing | | | 0.0 | | |
| Other Long-Term Investments | | | 0.1 | | |
| Short-Term Investments | | | 21.3 | | |
| Other Assets and Liabilities - Net | | | (16.8 | ) | |
| Net Assets | | | 100.0 | % | |
See Accompanying Notes to Financial Statements
163
PORTFOLIO OF INVESTMENTS
ING INTERNATIONAL VALUE FUND AS OF OCTOBER 31, 2006
| Shares | | | | | | Value | |
| COMMON STOCK: 98.1% | | | |
| | | | | | | Bermuda: 1.7% | | | | | |
| | 2,739,691 | | | | | Tyco International Ltd. | | $ | 80,629,106 | | |
| | | | 80,629,106 | | |
| | | | | Brazil: 3.4% | |
| | 7,745,531 | | | | | Centrais Eletricas Brasileiras
SA ADR | | | 81,693,665 | | |
| | 3,741,386 | | | L | | Contax Participacoes
SA ADR | | | 3,027,530 | | |
| | 241,720 | | | L | | Embratel Participacoes
SA ADR | | | 3,935,202 | | |
| | 2,532,786 | | | | | Tele Norte Leste Participacoes
SA ADR | | | 36,649,413 | | |
| | 1,208,600 | | | | | Telecomunicacoes Brasileiras
SA ADR | | | 33,562,822 | | |
| | 111,928 | | | L | | Tim Participacoes SA ADR | | | 3,760,781 | | |
| | 776,726 | | | @,L | | Vivo Participacoes SA ADR | | | 2,710,774 | | |
| | | | 165,340,187 | | |
| | | | | Canada: 2.3% | |
| | 12,138,000 | | | @ | | Bombardier, Inc. | | | 41,830,945 | | |
| | 31,533,700 | | | @ | | Nortel Networks Corp. | | | 70,320,151 | | |
| | | | 112,151,096 | | |
| | | | | France: 9.2% | |
| | 9,548,000 | | | | | Alcatel SA | | | 121,207,821 | | |
| | 1,054,190 | | | | | Carrefour SA | | | 64,209,965 | | |
| | 1,164,147 | | | | | Electricite de France | | | 70,362,839 | | |
| | 3,936,200 | | | | | France Telecom SA | | | 102,506,408 | | |
| | 1,030,550 | | | | | Sanofi-Aventis | | | 87,752,998 | | |
| | | | 446,040,031 | | |
| | | | | Germany: 9.3% | |
| | 2,268,600 | | | | | DaimlerChrysler AG | | | 129,094,192 | | |
| | 9,731,119 | | | | | Deutsche Telekom AG | | | 169,210,946 | | |
| | 411,200 | | | | | Hypo Real Estate Holding AG | | | 25,907,798 | | |
| | 2,158,500 | | | @ | | Infineon Technologies AG | | | 26,234,498 | | |
| | 1,023,817 | | | | | Volkswagen AG | | | 100,574,589 | | |
| | | | 451,022,023 | | |
| | | | | Hong Kong: 0.7% | |
| | 1,624,636 | | | | | Jardine Matheson
Holdings Ltd. | | | 32,492,720 | | |
| | | | 32,492,720 | | |
| | | | | Italy: 5.0% | |
| | 10,705,782 | | | | | Banca Intesa S.p.A. | | | 73,133,276 | | |
| | 10,329,085 | | | | | Telecom Italia S.p.A. | | | 31,286,946 | | |
| | 23,951,100 | | | | | Telecom Italia S.p.A. - RNC | | | 60,498,637 | | |
| | 9,564,300 | | | @ | | UniCredito Italiano S.p.A. | | | 79,529,210 | | |
| | | | 244,448,069 | | |
| | | | | Japan: 15.4% | |
| | 812,400 | | | | | Aiful Corp. | | | 28,003,700 | | |
| | 1,153,800 | | | | | Astellas Pharma, Inc. | | | 51,965,759 | | |
| | 2,427,336 | | | | | Daiichi Sankyo Co., Ltd. | | | 72,129,290 | | |
| | 960,000 | | | | | Fuji Photo Film Co., Ltd. | | | 35,668,442 | | |
| | 16,660,700 | | | | | Hitachi Ltd. | | | 95,254,065 | | |
| | 2,272,500 | | | | | Millea Holdings, Inc. | | | 85,569,791 | | |
| | 4,566 | | | | | Mitsubishi UFJ Financial
Group, Inc. | | | 57,915,932 | | |
| | 7,099,000 | | | | | Mitsui Sumitomo Insurance
Co., Ltd. | | | 87,988,785 | | |
| Shares | | | | | | Value | |
| | 13,125 | | | | | Nippon Telegraph &
Telephone Corp. | | $ | 65,932,313 | | |
| | 1,174,000 | | | | | Ono Pharmaceutical Co., Ltd. | | | 57,356,676 | | |
| | 921,800 | | | | | Sony Corp. | | | 37,674,124 | | |
| | 918,800 | | | | | Takefuji Corp. | | | 33,305,288 | | |
| | 509,000 | | | | | TDK Corp. | | | 39,711,066 | | |
| | | | 748,475,231 | | |
| | | | | Mexico: 1.6% | |
| | 2,942,320 | | | L | | Telefonos de Mexico SA de
CV ADR | | | 77,647,825 | | |
| | | | 77,647,825 | | |
| | | | | Netherlands: 9.8% | |
| | 1,007,589 | | | | | ABN Amro Holding NV | | | 29,359,555 | | |
| | 3,916,088 | | | | | Aegon NV | | | 71,957,716 | | |
| | 1,737,200 | | | | | Akzo Nobel NV | | | 97,418,239 | | |
| | 11,760,841 | | | @ | | Koninklijke Ahold NV | | | 123,888,139 | | |
| | 3,566,100 | | | | | Unilever NV | | | 87,939,823 | | |
| | 2,365,432 | | | | | Wolters Kluwer NV | | | 65,005,287 | | |
| | | | 475,568,759 | | |
| | | | | New Zealand: 0.8% | |
| | 13,335,944 | | | | | Telecom Corp. of
New Zealand Ltd. | | | 41,416,572 | | |
| | | | 41,416,572 | | |
| | | | | Portugal: 1.5% | |
| | 5,774,576 | | | | | Portugal Telecom SGPS SA | | | 72,052,449 | | |
| | | | 72,052,449 | | |
| | | | | Singapore: 3.3% | |
| | 1,805,191 | | | | | DBS Group Holdings Ltd. | | | 23,603,013 | | |
| | 6,060,800 | | | # | | DBS Group Holdings
Ltd. ADR | | | 79,401,935 | | |
| | 12,232,800 | | | | | Oversea-Chinese
Banking Corp. | | | 54,940,068 | | |
| | | | 157,945,016 | | |
| | | | | South Korea: 5.3% | |
| | 1,463,610 | | | | | Korea Electric Power Corp. | | | 56,417,293 | | |
| | 2,745,880 | | | L | | Korea Electric Power
Corp. ADR | | | 54,313,506 | | |
| | 183,200 | | | | | KT Corp. | | | 8,315,930 | | |
| | 2,192,310 | | | L | | KT Corp. ADR | | | 49,063,898 | | |
| | 721,800 | | | | | LG Electronics, Inc. | | | 43,606,571 | | |
| | 202,885 | | | | | SK Telecom Co., Ltd. | | | 43,939,259 | | |
| | | | 255,656,457 | | |
| | | | | Spain: 2.8% | |
| | 7,078,302 | | | | | Telefonica SA | | | 136,271,212 | | |
| | | | 136,271,212 | | |
| | | | | Switzerland: 6.9% | |
| | 491,890 | | | | | Nestle SA | | | 168,086,274 | | |
| | 2,954,300 | | | | | STMicroelectronics NV | | | 51,113,021 | | |
| | 91,700 | | | L | | Swisscom AG | | | 32,058,930 | | |
| | 328,715 | | | | | Zurich Financial Services AG | | | 81,208,962 | | |
| | | | 332,467,187 | | |
| | | | | Taiwan: 1.2% | |
| | 103,807,949 | | | | | United Microelectronics Corp. | | | 57,561,348 | | |
| | | | 57,561,348 | | |
See Accompanying Notes to Financial Statements
164
PORTFOLIO OF INVESTMENTS
ING INTERNATIONAL VALUE FUND AS OF OCTOBER 31, 2006 (CONTINUED)
| Shares | | | | | | Value | |
| | | | | United Kingdom: 17.4% | |
| | 2,964,800 | | | | | British Sky Broadcasting PLC | | $ | 30,740,457 | | |
| | 14,823,681 | | | | | BT Group PLC | | | 78,797,720 | | |
| | 11,619,100 | | | | | Compass Group PLC | | | 62,086,461 | | |
| | 3,066,000 | | | | | GlaxoSmithKline PLC | | | 81,710,745 | | |
| | 10,956,576 | | | @ | | Invensys PLC | | | 47,619,524 | | |
| | 33,530,226 | | | | | ITV PLC | | | 67,458,097 | | |
| | 8,159,200 | | | | | J Sainsbury PLC | | | 60,955,292 | | |
| | 8,372,051 | | | | | Marks & Spencer Group PLC | | | 104,729,147 | | |
| | 7,908,400 | | | @ | | Standard Life PLC | | | 42,918,944 | | |
| | 4,458,965 | | | | | Unilever PLC | | | 110,728,920 | | |
| | 32,163,031 | | | | | WM Morrison
Supermarkets PLC | | | 157,953,162 | | |
| | | | 845,698,469 | | |
| | | | | Venezuela: 0.5% | |
| | 1,216,822 | | | | | Cia Anonima Nacional
Telefonos de
Venezuela ADR | | | 23,618,515 | | |
| | | | 23,618,515 | | |
Total Common Stock
(Cost $3,649,752,054) | | | 4,756,502,272 | | |
Principal
Amount | | | | Value | |
| SHORT-TERM INVESTMENTS: 3.1% | |
| | | U.S. Government Agency Obligations: 1.7% | |
| $ | 83,036,000 | | | Federal Home Loan Bank,
4.750%, due 11/01/06 | | $ | 83,025,021 | | |
Total U.S. Government Agency
Obligations
(Cost $83,025,021) | | | 83,025,021 | | |
| | | Securities Lending Collateralcc: 1.4% | |
| | 68,412,000 | | | The Bank of New York Institutional
Cash Reserves Fund | | | 68,412,000 | | |
Total Securities Lending Collateral
(Cost $68,412,000) | | | 68,412,000 | | |
Total Short-Term Investments
(Cost $151,437,021) | | | 151,437,021 | | |
Total Investments in
Securities
(Cost $3,801,189,075)* | | | 101.2 | % | | $ | 4,907,939,293 | | |
Other Assets and
Liabilities - Net | | | (1.2 | ) | | | (59,950,181 | ) | |
| Net Assets | | | 100.0 | % | | $ | 4,847,989,112 | | |
Securities may have been fair valued in accordance with procedures approved by the Board of Directors/Trustees (Note 2A).
@ Non-income producing security
ADR American Depositary Receipt
# Securities with purchases pursuant to Rule 144A, under the Securities Act of 1933 and may not be resold subject to that rule except to qualified institutional buyers. These securities have been determined to be liquid under the guidelines established by the Funds' Board of Directors/Trustees.
cc Securities purchased with cash collateral for securities loaned.
L Loaned security, a portion or all of the security is on loan at October 31, 2006.
* Cost for federal income tax purposes is $3,801,189,077.
| Net unrealized appreciation consists of: | |
| Gross Unrealized Appreciation | | $ | 1,228,941,820 | | |
| Gross Unrealized Depreciation | | | (122,191,604 | ) | |
| Net Unrealized Appreciation | | $ | 1,106,750,216 | | |
| Industry | | Percentage of
Net Assets | |
| Auto Manufacturers | | | 4.7 | % | |
| Banks | | | 8.7 | | |
| Chemicals | | | 2.0 | | |
| Computers | | | 0.8 | | |
| Diversified Financial Services | | | 1.3 | | |
| Electric | | | 5.4 | | |
| Electrical Components & Equipment | | | 2.9 | | |
| Food | | | 16.0 | | |
| Food Service | | | 1.3 | | |
| Holding Companies - Diversified | | | 0.7 | | |
| Home Furnishings | | | 0.8 | | |
| Insurance | | | 7.6 | | |
| Media | | | 3.4 | | |
| Miscellaneous Manufacturing | | | 4.2 | | |
| Pharmaceuticals | | | 7.2 | | |
| Retail | | | 2.2 | | |
| Semiconductors | | | 2.8 | | |
| Telecommunications | | | 26.1 | | |
| Short-Term Investments | | | 3.1 | | |
| Other Assets and Liabilities - Net | | | (1.2 | ) | |
| Net Assets | | | 100.0 | % | |
See Accompanying Notes to Financial Statements
165
PORTFOLIO OF INVESTMENTS
ING INTERNATIONAL VALUE CHOICE FUND AS OF OCTOBER 31, 2006
| Shares | | | | | | Value | |
| COMMON STOCK: 91.4% | | | |
| | | | | Australia: 3.2% | |
| | 254,156 | | | | | Alumina Ltd. | | $ | 1,331,401 | | |
| | 36,300 | | | | | Newcrest Mining Ltd. | | | 675,250 | | |
| | | | 2,006,651 | | |
| | | | | Belgium: 2.8% | |
| | 42,950 | | | | | Belgacom SA | | | 1,754,792 | | |
| | | | 1,754,792 | | |
| | | | | Brazil: 0.8% | |
| | 52,500 | | | | | Centrais Eletricas Brasileiras
SA ADR | | | 526,717 | | |
| | | | 526,717 | | |
| | | | | Canada: 10.5% | |
| | 89,444 | | | | | Barrick Gold Corp. | | | 2,772,764 | | |
| | 86,000 | | | @ | | Ivanhoe Mines Ltd. | | | 907,300 | | |
| | 23,150 | | | | | Magna International, Inc. | | | 1,731,621 | | |
| | 8,000 | | | | | Opti Canada, Inc. | | | 124,351 | | |
| | 13,230 | | | | | Suncor Energy, Inc. | | | 1,014,080 | | |
| | | | 6,550,116 | | |
| | | | | Finland: 2.8% | |
| | 110,000 | | | | | Stora Enso OYJ | | | 1,777,626 | | |
| | | | 1,777,626 | | |
| | | | | France: 7.6% | |
| | 1,420 | | | | | Areva SA | | | 899,577 | | |
| | 26,800 | | | @ | | Gemalto Holding NV | | | 599,987 | | |
| | 15,150 | | | | | Technip SA | | | 914,218 | | |
| | 25,130 | | | | | Thales SA | | | 1,161,385 | | |
| | 17,400 | | | | | Total SA | | | 1,177,037 | | |
| | | | 4,752,204 | | |
| | | | | Germany: 3.2% | |
| | 133,480 | | | @ | | Premiere AG | | | 2,023,868 | | |
| | | | 2,023,868 | | |
| | | | | Italy: 8.8% | |
| | 192,300 | | | | | Enel S.p.A. | | | 1,841,726 | | |
| | 39,180 | | | | | ENI S.p.A. | | | 1,185,187 | | |
| | 980,240 | | | | | Telecom Italia S.p.A. | | | 2,476,011 | | |
| | | | 5,502,924 | | |
| | | | | Japan: 19.6% | |
| | 120,000 | | | | | Dai Nippon Printing Co., Ltd. | | | 1,785,510 | | |
| | 40,490 | | | | | Daiichi Sankyo Co., Ltd. | | | 1,203,177 | | |
| | 41,600 | | | | | Fuji Photo Film Co., Ltd. | | | 1,545,632 | | |
| | 87,000 | | | | | Kirin Brewery Co., Ltd. | | | 1,157,070 | | |
| | 33,600 | | | @ | | NEC Electronics Corp. | | | 1,072,108 | | |
| | 44,930 | | | | | Nippon Telegraph & Telephone
Corp. ADR | | | 1,129,091 | | |
| | 16,850 | | | | | Promise Co., Ltd. | | | 608,766 | | |
| | 27,000 | | | | | Sekisui House Ltd. | | | 426,682 | | |
| | 57,000 | | | | | Shiseido Co., Ltd. | | | 1,109,629 | | |
| | 44,870 | | | | | Takefuji Corp. | | | 1,626,478 | | |
| | 49,000 | | | | | Wacoal Holdings Corp. | | | 592,222 | | |
| | | | 12,256,365 | | |
| | | | | Mexico: 0.3% | |
| | 35,580 | | | | | Alfa SA de CV | | | 197,834 | | |
| | | | 197,834 | | |
| Shares | | | | | | Value | |
| | | | | Netherlands: 3.3% | |
| | 12,186 | | | | | Aegon NV | | $ | 223,917 | | |
| | 25,732 | | | | | Royal Dutch Shell PLC ADR | | | 1,852,704 | | |
| | | | 2,076,621 | | |
| | | | | Papua New Guinea: 0.9% | |
| | 248,900 | | | | | Lihir Gold Ltd. | | | 535,547 | | |
| | | | 535,547 | | |
| | | | | South Africa: 3.4% | |
| | 36,320 | | | | | Anglogold Ashanti Ltd. ADR | | | 1,546,142 | | |
| | 3,450 | | | | | Impala Platinum Holdings Ltd. | | | 605,937 | | |
| | | | 2,152,079 | | |
| | | | | South Korea: 7.4% | |
| | 60,130 | | | | | Korea Electric Power Corp. ADR | | | 1,189,371 | | |
| | 98,760 | | | | | KT Corp. ADR | | | 2,210,249 | | |
| | 27,200 | | | | | Samsung SDI Co., Ltd. | | | 1,257,518 | | |
| | | | 4,657,138 | | |
| | | | | Switzerland: 0.8% | |
| | 12,270 | | | | | Xstrata PLC | | | 522,457 | | |
| | | | 522,457 | | |
| | | | | Taiwan: 3.9% | |
| | 131,989 | | | | | Chunghwa Telecom Co., Ltd. ADR | | | 2,414,082 | | |
| | | | 2,414,082 | | |
| | | | | United Kingdom: 10.7% | |
| | 24,300 | | | | | Anglo American PLC | | | 1,099,807 | | |
| | 2,200 | | | | | Anglo American PLC ADR | | | 49,896 | | |
| | 120,510 | | | | | J Sainsbury PLC | | | 900,299 | | |
| | 23,140 | | | | | Lonmin PLC | | | 1,277,431 | | |
| | 54,000 | | | | | Tomkins PLC | | | 249,975 | | |
| | 82,500 | | | | | United Utilities PLC | | | 1,122,930 | | |
| | 769,862 | | | | | Vodafone Group PLC | | | 1,983,745 | | |
| | | | 6,684,083 | | |
| | | | | United States: 1.4% | |
| | 54,300 | | | @ | | Apex Silver Mines Ltd. | | | 857,940 | | |
| | | | 857,940 | | |
Total Common Stock
(Cost $53,875,383) | | | 57,249,044 | | |
Principal
Amount | | | | Value | |
| SHORT-TERM INVESTMENTS: 5.2% | |
| | | U.S. Government Agency
Obligations: 5.2% | |
| $ | 3,236,000 | | | Federal Home Loan Bank,
4.760%, due 11/01/06 | | $ | 3,235,572 | | |
Total Short-Term Investments
(Cost $3,235,572) | | | 3,235,572 | | |
Total Investments in
Securities
(Cost $57,110,955)* | | | 96.6 | % | | $ | 60,484,616 | | |
Other Assets and
Liabilities - Net | | | 3.4 | | | | 2,129,881 | | |
| Net Assets | | | 100.0 | % | | $ | 62,614,497 | | |
See Accompanying Notes to Financial Statements
166
PORTFOLIO OF INVESTMENTS
ING INTERNATIONAL VALUE CHOICE FUND AS OF OCTOBER 31, 2006 (CONTINUED)
Securities may have been fair valued in accordance with procedures approved by the Board of Directors/Trustees (Note 2A).
@ Non-income producing security
ADR American Depositary Receipt
* Cost for federal income tax purposes is $57,112,630.
| Net unrealized appreciation consists of: | |
| Gross Unrealized Appreciation | | $ | 5,038,764 | | |
| Gross Unrealized Depreciation | | | (1,666,778 | ) | |
| Net Unrealized Appreciation | | $ | 3,371,986 | | |
| Industry | | Percentage of
Net Assets | |
| Aerospace/Defense | | | 1.9 | % | |
| Apparel | | | 0.9 | | |
| Auto Parts & Equipment | | | 2.8 | | |
| Beverages | | | 1.8 | | |
| Commercial Services | | | 2.8 | | |
| Computers | | | 1.0 | | |
| Cosmetics/Personal Care | | | 1.8 | | |
| Diversified Financial Services | | | 3.6 | | |
| Electric | | | 5.7 | | |
| Electronics | | | 2.0 | | |
| Energy - Alternate Sources | | | 1.4 | | |
| Food | | | 1.4 | | |
| Forest Products & Paper | | | 2.8 | | |
| Holding Companies - Diversified | | | 0.7 | | |
| Home Builders | | | 0.7 | | |
| Insurance | | | 0.4 | | |
| Media | | | 3.2 | | |
| Mining | | | 19.5 | | |
| Miscellaneous Manufacturing | | | 2.5 | | |
| Oil & Gas | | | 8.5 | | |
| Oil & Gas Services | | | 1.5 | | |
| Pharmaceuticals | | | 1.9 | | |
| Semiconductors | | | 1.7 | | |
| Telecommunications | | | 19.1 | | |
| Water | | | 1.8 | | |
| Short-Term Investments | | | 5.2 | | |
| Other Assets and Liabilities - Net | | | 3.4 | | |
| Net Assets | | | 100.0 | % | |
See Accompanying Notes to Financial Statements
167
PORTFOLIO OF INVESTMENTS
ING RUSSIA FUND AS OF OCTOBER 31, 2006
| Shares | | | | | | Value | |
| COMMON STOCK: 94.6% | | | |
| | | | | Banks: 14.8% | |
| | 4,965,000 | | | | | Promstroibank St. Petersburg | | $ | 7,050,300 | | |
| | 100,000 | | | | | Raiffeisen International Bank
Holding AG | | | 11,442,100 | | |
| | 41,500 | | | | | Sberbank RF | | | 93,043,000 | | |
| | | | 111,535,400 | | |
| | | | | Beverages: 0.8% | |
| | 138,000 | | | @ | | Efes Breweries International
NV GDR | | | 4,209,000 | | |
| | 56,800 | | | @,# | | Efes Breweries International
NV GDR - Series 144A | | | 1,732,400 | | |
| | | | 5,941,400 | | |
| | | | | Closed-end Funds: 1.0% | |
| | 3,500,000 | | | | | RenShares Utilities Ltd. | | | 7,140,000 | | |
| | | | 7,140,000 | | |
| | | | | Cosmetics/Personal Care: 1.1% | |
| | 189,500 | | | | | Kalina | | | 8,148,500 | | |
| | | | 8,148,500 | | |
| | | | | Electric: 4.9% | |
| | 54,700,000 | | | | | OGK-5 OJSC | | | 5,032,400 | | |
| | 42,000,000 | | | | | Unified Energy System | | | 31,668,000 | | |
| | | | 36,700,400 | | |
| | | | | Internet: 1.2% | |
| | 880,000 | | | @ | | RBC Information Systems | | | 9,345,600 | | |
| | | | 9,345,600 | | |
| | | | | Iron/Steel: 3.5% | |
| | 410,000 | | | L | | Mechel OAO ADR | | | 9,102,000 | | |
| | 3,495,000 | | | | | Novolipetsk Steel | | | 7,059,900 | | |
| | 200,000 | | | | | Novolipetsk Steel GDR | | | 4,200,000 | | |
| | 500,000 | | | | | Severstal JSC | | | 6,325,000 | | |
| | | | 26,686,900 | | |
| | | | | Metal Fabricate/Hardware: 1.3% | |
| | 54,293 | | | @,# | | TMK OAO GDR | | | 1,370,898 | | |
| | 36,500 | | | | | Vsmpo-Avisma Corp. | | | 8,066,500 | | |
| | | | 9,437,398 | | |
| | | | | Mining: 8.5% | |
| | 270,000 | | | | | MMC Norilsk Nickel ADR | | | 39,892,500 | | |
| | 500,000 | | | @,L | | Polyus Gold Co ZAO ADR | | | 23,750,000 | | |
| | | | 63,642,500 | | |
| | | | | Oil & Gas: 42.2% | |
| | 1,305,000 | | | | | LUKOIL ADR | | | 105,444,000 | | |
| | 515,000 | | | | | NovaTek OAO GDR | | | 29,973,000 | | |
| | 7,400,000 | | | | | OAO Gazprom | | | 77,700,000 | | |
| | 525,013 | | | | | OAO Gazprom ADR | | | 22,365,554 | | |
| | 2,500,000 | | | @ | | OAO Rosneft Oil Co. GDR | | | 21,500,000 | | |
| | 400,000 | | | | | Surgutneftegaz ADR | | | 25,320,000 | | |
| | 105,000 | | | | | Surgutneftegaz OJSC ADR | | | 9,345,000 | | |
| | 200,000 | | | L | | Tatneft ADR | | | 18,400,000 | | |
| | 3,200,000 | | | | | TNK-BP Holding | | | 7,328,000 | | |
| | | | 317,375,554 | | |
| | | | | Pharmaceuticals: 1.0% | |
| | 35,000 | | | L | | Richter Gedeon Nyrt GDR | | | 7,288,750 | | |
| | | | 7,288,750 | | |
| Shares | | | | | | Value | |
| | | | | Pipelines: 2.5% | |
| | 9,000 | | | | | Transneft | | $ | 18,909,000 | | |
| | | | 18,909,000 | | |
| | | | | Telecommunications: 11.8% | |
| | 500,000 | | | | | Mobile Telesystems Finance
SA ADR | | | 22,040,000 | | |
| | 139,000 | | | @ | | Moscow City Telephone | | | 2,641,000 | | |
| | 1,337,000 | | | | | Rostelecom | | | 6,711,740 | | |
| | 111,500,000 | | | | | Sibirtelecom | | | 9,366,000 | | |
| | 580,000 | | | @ | | Sistema JSFC GDR | | | 15,370,000 | | |
| | 111,500,000 | | | | | Uralsvyazinform | | | 4,270,450 | | |
| | 290,000 | | | @ | | Vimpel-Communications
OAO ADR | | | 19,137,100 | | |
| | 2,500,000 | | | | | VolgaTelecom | | | 9,500,000 | | |
| | | | 89,036,290 | | |
Total Common Stock
(Cost $444,511,613) | | | 711,187,692 | | |
| PREFERRED STOCK: 0.8% | | | |
| | | | | Machinery - Diversified: 0.8% | |
| | 45,100,000 | | | | | Achinsk Refinery | | | 5,863,000 | | |
Total Preferred Stock
(Cost $3,164,703) | | | 5,863,000 | | |
| EQUITY-LINKED SECURITIES: 1.1% | | | |
| | | | | Equity Fund: 1.1% | |
| | 500 | | | # | | Baskets - Russian Exchange
(Counterparty: UBS) | | | 8,400,000 | | |
Total Equity-Linked Securities
(Cost $6,236,000) | | | 8,400,000 | | |
Total Long-Term Investments
(Cost $453,912,316) | | | 725,450,692 | | |
Principal
Amount | | | | Value | |
| SHORT-TERM INVESTMENTS: 5.2% | |
| | | Securities Lending Collateralcc: 5.2% | |
| $ | 39,103,000 | | | The Bank of New York Institutional
Cash Reserves Fund | | $ | 39,103,000 | | |
Total Short-Term Investments
(Cost $39,103,000) | | | 39,103,000 | | |
Total Investments in
Securities
(Cost $493,015,316)* | | | 101.7 | % | | $ | 764,553,692 | | |
Other Assets and
Liabilities - Net | | | (1.7 | ) | | | (12,606,442 | ) | |
| Net Assets | | | 100.0 | % | | $ | 751,947,250 | | |
See Accompanying Notes to Financial Statements
168
PORTFOLIO OF INVESTMENTS
ING RUSSIA FUND AS OF OCTOBER 31, 2006 (CONTINUED)
Securities may have been fair valued in accordance with procedures approved by the Board of Directors/Trustees (Note 2A).
@ Non-income producing security
ADR American Depositary Receipt
GDR Global Depositary Receipt
# Securities with purchases pursuant to Rule 144A, under the Securities Act of 1933 and may not be resold subject to that rule except to qualified institutional buyers. These securities have been determined to be liquid under the guidelines established by the Funds' Board of Directors/Trustees.
cc Securities purchased with cash collateral for securities loaned.
L Loaned security, a portion or all of the security is on loan at October 31, 2006.
* Cost for federal income tax purposes is $493,859,399.
| Net unrealized appreciation consists of: | |
| Gross Unrealized Appreciation | | $ | 273,800,983 | | |
| Gross Unrealized Depreciation | | | (3,106,690 | ) | |
| Net Unrealized Appreciation | | $ | 270,694,293 | | |
See Accompanying Notes to Financial Statements
169
PORTFOLIO OF INVESTMENTS
ING EMERGING MARKETS FIXED INCOME FUND AS OF OCTOBER 31, 2006
Principal
Amount | | | | | | Value | |
| CORPORATE BONDS/NOTES: 16.1% | | | |
| | | | | Argentina: 0.6% | |
| $ | 18,763 | | | | +, | I | | Cia de Transporte de Energia
Electrica de Alta Tension SA,
3.000%, due 12/15/16 | | $ | 15,627 | | |
| | 66,163 | | | | +, | I | | Cia de Transporte de Energia
Electrica de Alta Tension SA,
9.000%, due 12/15/15 | | | 66,328 | | |
| | 94,558 | | | | | | | Province of Mendoza, 5.500%,
due 09/04/18 | | | 78,010 | | |
| | | | 159,965 | | |
| | | | | Czech Republic: 0.1% | |
| | 25,500 | | | | | | | Transgas Co., 6.5000%,
due 12/31/12 | | | 24,193 | | |
| | | | 24,193 | | |
| | | | | Germany: 1.8% | |
| | 400,000 | | | | | | | Morgan Stanley Bank AG for OAO
Gazprom, 9.625%, due 03/01/13 | | | 476,240 | | |
| | | | 476,240 | | |
| | | | | Indonesia: 1.1% | |
| | 100,000 | | | | #,C | | | Excelcomindo Finance Co. BV,
7.125%, due 01/18/13 | | | 100,250 | | |
| | 100,000 | | | | C | | | Indosat Finance Co. BV, 7.125%,
due 06/22/12 | | | 100,936 | | |
| | 100,000 | | | | # | | | Majapahit Holding BV, 7.750%,
due 10/17/16 | | | 103,000 | | |
| | | | 304,186 | | |
| | | | | Ireland: 0.3% | |
| EUR | 2,000,000 | | | | | | | Dal Capital for Vneshtorgbank,
7.000%, due 04/13/09 | | | 75,882 | | |
| | | | 75,882 | | |
| | | | | Luxembourg: 1.6% | |
| $ | 250,000 | | | | | | | Gaz Capital for Gazprom, 8.625%,
due 04/28/34 | | | 317,350 | | |
| | 100,000 | | | | +, | C | | Kuznetski Capital for Bank of
Moscow, 7.500%, due 11/25/15 | | | 102,665 | | |
| | | | 420,015 | | |
| | | | | Mexico: 5.8% | |
| | 650,000 | | | | S | | | Mexico Government International
Bond, 11.500%, due 05/15/26 | | | 1,044,875 | | |
| | 420,000 | | | | S | | | Pemex Project Funding Master
Trust, 8.625%, due 02/01/22 | | | 513,450 | | |
| | | | 1,558,325 | | |
| | | | | Philippines: 3.5% | |
| | 305,000 | | | | # | | | National Power Corp., 6.875%,
due 11/02/16 | | | 305,000 | | |
| | 450,000 | | | | | | | National Power Corp., 9.625%,
due 05/15/28 | | | 544,173 | | |
| | 60,000 | | | | | | | Philippine Government
International Bond, 10.625%,
due 03/16/25 | | | 83,775 | | |
| | | | 932,948 | | |
| | | | | United States: 1.3% | |
| | 252,290 | | | | # | | | Citigroup Funding, Inc., 6.000%,
due 08/17/10 | | | 259,849 | | |
Principal
Amount | | | | | | Value | |
| $ | 100,000 | | | | | Pakistan Government
International Bond, 7.125%,
due 03/31/16 | | $ | 100,564 | | |
| | | | 360,413 | | |
Total Corporate Bonds/Notes
(Cost $4,223,719) | | | 4,312,167 | | |
| OTHER BONDS: 74.1% | | | |
| | | | | Argentina: 6.8% | |
| ARS | 1,000,000 | | | | | Argentina Bonos, 2.000%,
due 09/30/14 | | | 335,114 | | |
| $ | 735,000 | | | | | Argentina Government
International Bond, 0.000%,
due 12/15/35 | | | 79,468 | | |
| ARS | 200,000 | | | | | Argentina Government
International Bond, 5.830%,
due 12/31/33 | | | 83,134 | | |
| $ | 611,873 | | | | | Argentina Government
International Bond, 8.280%,
due 12/31/33 | | | 617,686 | | |
| | 1,200,000 | | | + | | Province of Buenos Aires
Argentina, 2.000%,
due 05/15/35 | | | 576,600 | | |
| | 130,000 | | | # | | Province of Buenos Aires
Argentina, 9.375%,
due 09/14/18 | | | 126,642 | | |
| | | | 1,818,644 | | |
| | | | | Bosnia and Herzegovina: 1.1% | |
| EUR | 750,000 | | | | | Bosnia & Herzegovina
Government International
Bond, 10.730%, due 12/11/17 | | | 308,330 | | |
| | | | 308,330 | | |
| | | | | Brazil: 9.1% | |
| $ | 150,000 | | | | | Brazil Government Bond, 8.250%,
due 01/20/34 | | | 175,725 | | |
| | 480,000 | | | | | Brazil Government Bond, 8.750%,
due 02/04/25 | | | 582,000 | | |
| | 50,000 | | | | | Brazil Government Bond, 8.875%,
due 10/14/19 | | | 60,575 | | |
| | 400,000 | | | C,S | | Brazil Government Bond, 11.000%,
due 08/17/40 | | | 527,300 | | |
| | 600,000 | | | | | Brazilian Government
International Bond, 10.125%,
due 05/15/27 | | | 818,130 | | |
| BRL | 550,000 | | | | | Federative Republic of Brazil,
12.500%, due 01/05/22 | | | 259,694 | | |
| | | | 2,423,424 | | |
| | | | | Colombia: 3.7% | |
| $ | 100,000 | | | | | Colombia Government Bond,
8.125%, due 05/21/24 | | | 113,050 | | |
| | 50,000 | | | | | Colombia Government Bond,
10.000%, due 01/23/12 | | | 58,900 | | |
| | 58,000 | | | | | Colombia Government Bond,
11.750%, due 02/25/20 | | | 83,085 | | |
| | 370,000 | | | | | Republic of Colombia, 7.375%,
due 01/27/17 | | | 393,495 | | |
| | 320,000 | | | | | Republic of Colombia, 7.375%,
due 09/18/37 | | | 331,680 | | |
| | | | 980,210 | | |
See Accompanying Notes to Financial Statements
170
PORTFOLIO OF INVESTMENTS
ING EMERGING MARKETS FIXED INCOME FUND AS OF OCTOBER 31, 2006 (CONTINUED)
Principal
Amount | | | | | | Value | |
| | | | | Dominican Republic: 0.6% | |
| $ | 100,000 | | | # | | Dominican Republic International
Bond, 8.625%, due 04/20/27 | | $ | 111,350 | | |
| | 54,649 | | | | | Dominican Republic International
Bond, 9.040%, due 01/23/18 | | | 62,709 | | |
| | | | 174,059 | | |
| | | | | Ecuador: 1.8% | |
| | 100,000 | | | | | Ecuador Government
International Bond, 9.375%,
due 12/15/15 | | | 107,950 | | |
| | 375,000 | | | | +, | C | | Ecuador Government
International Bond, 10.000%,
due 08/15/30 | | | 376,313 | | |
| | | | 484,263 | | |
| | | | | El Salvador: 2.4% | |
| | 200,000 | | | # | | El Salvador Government
International Bond, 7.650%,
due 06/15/35 | | | 219,600 | | |
| | 360,000 | | | | | El Salvador Government
International Bond, 8.250%,
due 04/10/32 | | | 423,540 | | |
| | | | 643,140 | | |
| | | | | Indonesia: 3.2% | |
| | 370,000 | | | | | Indonesia Government
International Bond, 7.250%,
due 04/20/15 | | | 390,277 | | |
| | 400,000 | | | | | Indonesia Government
International Bond, 8.500%,
due 10/12/35 | | | 475,694 | | |
| | | | 865,971 | | |
| | | | | Iraq: 2.0% | |
| | 800,000 | | | C | | Republic of Iraq, 5.800%,
due 01/15/28 | | | 540,000 | | |
| | | | 540,000 | | |
| | | | | Ivory Coast: 0.4% | |
| | 400,000 | | | I | | Ivory Coast Government
International Bond, 2.000%,
due 03/30/18 | | | 96,000 | | |
| | | | 96,000 | | |
| | | | | Mexico: 0.4% | |
| | 75,000 | | | | | Mexico Government Bond,
8.300%, due 08/15/31 | | | 95,550 | | |
| | | | 95,550 | | |
| | | | | Nigeria: 0.4% | |
| | 500,000 | | | I | | Central Bank of Nigeria, 5.092%,
due 01/05/10 | | | 116,875 | | |
| | | | 116,875 | | |
| | | | | Pakistan: 0.4% | |
| | 110,000 | | | | | Pakistan Government
International Bond, 7.875%,
due 03/31/36 | | | 111,317 | | |
| | | | 111,317 | | |
| | | | | Panama: 1.0% | |
| | 130,000 | | | | | Panama Government Bond,
9.375%, due 04/01/29 | | | 169,325 | | |
Principal
Amount | | | | | | Value | |
| $ | 95,000 | | | | | Panama Government
International Bond, 7.125%,
due 01/29/26 | | $ | 101,080 | | |
| | | | 270,405 | | |
| | | | | Peru: 2.9% | |
| | 120,000 | | | | | Peru Government Bond, 7.350%,
due 07/21/25 | | | 131,700 | | |
| | 200,000 | | | | | Peru Government Bond, 9.875%,
due 02/06/15 | | | 252,000 | | |
| | 300,000 | | | | | Peru Government International
Bond, 8.750%, due 11/21/33 | | | 381,750 | | |
| | | | 765,450 | | |
| | | | | Philippines: 3.8% | |
| | 630,000 | | | | | Philippine Government
International Bond, 7.750%,
due 01/14/31 | | | 691,425 | | |
| | 50,000 | | | | | Philippine Government
International Bond, 9.375%,
due 01/18/17 | | | 60,688 | | |
| | 200,000 | | | | | Philippine Government
International Bond, 9.875%,
due 01/15/19 | | | 255,500 | | |
| | | | 1,007,613 | | |
| | | | | Russia: 6.1% | |
| | 490,000 | | | + | | Russia Government International
Bond, 5.000%, due 03/31/30 | | | 550,028 | | |
| | 600,000 | | | S | | Russia Government International
Bond, 12.750%, due 06/24/28 | | | 1,082,567 | | |
| | | | 1,632,595 | | |
| | | | | Supranational: 0.8% | |
| TRY | 400,000 | | | | | European Investment Bank,
10.000%, due 01/28/11 | | | 217,475 | | |
| | | | 217,475 | | |
| | | | | Turkey: 7.6% | |
| $ | 450,000 | | | | | Republic of Turkey, 7.000%,
due 09/26/16 | | | 452,223 | | |
| | 170,000 | | | | | Turkey Government International
Bond, 7.250%, due 03/15/15 | | | 175,100 | | |
| | 650,000 | | | | | Turkey Government International
Bond, 7.375%, due 02/05/25 | | | 655,564 | | |
| | 370,000 | | | | | Turkey Government International
Bond, 8.000%, due 02/14/34 | | | 395,900 | | |
| | 300,000 | | | | | Turkey Government International
Bond, 9.500%, due 01/15/14 | | | 346,875 | | |
| | | | 2,025,662 | | |
| | | | | Ukraine: 4.7% | |
| | 150,000 | | | | | Credit Suisse First Boston
International for City of Kiev
Ukraine, 8.000%, due 11/06/15 | | | 153,908 | | |
| | 1,030,000 | | | | | Ukraine Government
International Bond, 7.650%,
due 06/11/13 | | | 1,105,499 | | |
| | | | 1,259,407 | | |
| | | | | Uruguay: 4.3% | |
| | 250,000 | | | | | Oriental Republic of Uruguay,
7.625%, due 03/21/36 | | | 258,500 | | |
See Accompanying Notes to Financial Statements
171
PORTFOLIO OF INVESTMENTS
ING EMERGING MARKETS FIXED INCOME FUND AS OF OCTOBER 31, 2006 (CONTINUED)
Principal
Amount | | | | | | Value | |
| | | | | Uruguay (continued) | |
| $ | 400,000 | | | | | Uruguay Government
International Bond, 8.000%,
due 11/18/22 | | $ | 435,000 | | |
| | 380,000 | | | | | Uruguay Government
International Bond, 9.250%,
due 05/17/17 | | | 454,100 | | |
| | | | 1,147,600 | | |
| | | | | Venezuela: 10.6% | |
| | 1,500,000 | | | | | Venezuela Government
International Bond, 5.750%,
due 02/26/16 | | | 1,395,975 | | |
| | 300,000 | | | S | | Venezuela Government
International Bond, 8.500%,
due 10/08/14 | �� | | 334,050 | | |
| | 480,000 | | | S | | Venezuela Government
International Bond, 9.250%,
due 09/15/27 | | | 595,918 | | |
| | 340,000 | | | | | Venezuela Government
International Bond, 13.625%,
due 08/15/18 | | | 510,850 | | |
| | | | 2,836,793 | | |
Total Other Bonds
(Cost $19,620,554) | | | 19,820,783 | | |
Total Investments in
Securities
(Cost $23,844,273)* | | | 90.2 | % | | $ | 24,132,950 | | |
Other Assets and
Liabilities - Net | | | 9.8 | | | | 2,624,889 | | |
| Net Assets | | | 100.0 | % | | $ | 26,757,839 | | |
Securities may have been fair valued in accordance with procedures approved by the Board of Directors/Trustees (Note 2A).
+ Step-up basis bonds. Interest rates shown reflect current coupon rates.
# Securities with purchases pursuant to Rule 144A, under the Securities Act of 1933 and may not be resold subject to that rule except to qualified institutional buyers. These securities have been determined to be liquid under the guidelines established by the Funds' Board of Directors/Trustees.
C Bond may be called prior to maturity date.
S Segregated securities for certain derivatives, when-issued or delayed delivery securities and forward currency exchange contracts.
I Illiquid security
Non-U.S. currency symbols utilized in the above portfolio are defined as follows:
ARS Argentine Peso
BRL Brazilian Real
EUR Euro
TRY Turkish New Lira
* Cost for federal income tax purposes is $23,853,234.
Net unrealized appreciation consists of:
| Gross Unrealized Appreciation | | $ | 504,119 | | |
| Gross Unrealized Depreciation | | | (224,403 | ) | |
| Net Unrealized Appreciation | | $ | 279,716 | | |
| Industry | | Percentage of
Net Assets | |
| Banks | | | 0.7 | % | |
| Diversified Financial Services | | | 1.6 | | |
| Electric | | | 3.5 | | |
| Foreign Government Bonds | | | 74.9 | | |
| Multi-National | | | 0.8 | | |
| Municipal | | | 0.6 | | |
| Oil & Gas | | | 5.0 | | |
| Regional (state/province) | | | 2.4 | | |
| Telecommunications | | | 0.7 | | |
| Other Assets and Liabilities - Net | | | 9.8 | | |
| Net Assets | | | 100.0 | % | |
ING Emerging Markets Fixed Income Fund Futures Contracts as of October 31, 2006:
Contract
Description | | Number
of
Contracts | | Notional
Market Value | | Expiration
Date | | Unrealized
Appreciation/
(Depreciation) | |
Short Contracts
U.S. Treasury
Long Bond | | | 12 | | | | (1,351,875 | ) | | | 12/19/06 | | | $ | (20,407 | ) | |
| | | | | | | | | | | | | | | $ | (20,407 | ) | |
See Accompanying Notes to Financial Statements
172
PORTFOLIO OF INVESTMENTS
ING GLOBAL BOND FUND AS OF OCTOBER 31, 2006
| Shares | | | | | | Value | |
| PREFERRED STOCK: 7.6% | | | |
| | | | | Banks: 7.6% | |
| | 30,000 | | | C | | Bank of America Corp. | | $ | 759,378 | | |
| | 48,000 | | | # | | Santander Bancorp. | | | 1,200,000 | | |
Total Preferred Stock
(Cost $1,950,000) | | | 1,959,378 | | |
Principal
Amount | | | | | | Value | |
| U.S. GOVERNMENT AGENCY OBLIGATIONS: 13.1% | | | |
| | | | | Federal National Mortgage
Association: 13.1% | | | | | | | |
| $ | 234,000 | | | W | | 4.500%, due 11/15/18 | | $ | 226,395 | | |
| | 267,000 | | | W | | 5.000%, due 11/15/20 | | | 262,995 | | |
| | 977,000 | | | W | | 5.000%, due 11/15/34 | | | 943,416 | | |
| | 221,000 | | | W | | 5.500%, due 11/15/18 | | | 221,276 | | |
| | 857,000 | | | W | | 5.500%, due 11/13/33 | | | 847,091 | | |
| | 441,000 | | | W | | 6.000%, due 11/15/34 | | | 443,756 | | |
| | 432,000 | | | W | | 6.500%, due 11/13/36 | | | 440,370 | | |
Total U.S. Government
Agency Obligations
(Cost $3,375,128) | | | 3,385,299 | | |
| U.S. TREASURY OBLIGATIONS: 19.1% | | | |
| | | | | U.S. Treasury Bonds: 10.7% | |
| | 2,106,000 | | | | | 4.500%, due 09/30/11 | | | 2,099,337 | | |
| | 383,000 | | | | | 4.500%, due 02/15/36 | | | 369,775 | | |
| | 292,000 | | | | | 4.875%, due 08/15/16 | | | 298,159 | | |
| | | | 2,767,271 | | |
| | | | | U.S. Treasury Notes: 8.4% | |
| | 1,480,000 | | | | | 4.625%, due 09/30/08 | | | 1,478,092 | | |
| | 290,000 | | | | | 4.625%, due 10/31/11 | | | 290,725 | | |
| | 400,000 | | | | | 4.875%, due 08/15/09 | | | 402,656 | | |
| | | | 2,171,473 | | |
Total U.S. Treasury Obligations
(Cost $4,916,503) | | | 4,938,744 | | |
| ASSET-BACKED SECURITIES: 2.7% | | | |
| | | | | Automobile Asset-Backed
Securities: 2.7% | | | | | | | |
| | 254,000 | | | C,S | | AmeriCredit Automobile
Receivables Trust, 4.220%,
due 07/06/09 | | | 251,427 | | |
| | 228,204 | | | C,S | | Chase Manhattan Auto Owner
Trust, 2.780%, due 06/15/10 | | | 224,698 | | |
| | 232,608 | | | C,S | | Morgan Stanley Auto Loan Trust,
3.240%, due 03/15/12 | | | 228,571 | | |
Total Asset-Backed Securities
(Cost $702,055) | | | 704,696 | | |
| OTHER BONDS: 41.3% | | | |
| | | | | Foreign Government
Bonds: 41.3% | | | | | | | |
| ARS | 409,500 | | | | | Argentina Bonos, 2.000%,
due 09/30/14 | | | 138,516 | | |
| EUR | 900,000 | | | | | Bundesobligation, 3.250%,
due 04/17/09 | | | 1,138,046 | | |
| EUR | 1,250,000 | | | | | Bundesrepublik Deutschland,
4.000%, due 07/04/16 | | | 1,629,502 | | |
| EUR | 620,000 | | | | | Bundesrepublik Deutschland,
4.000%, due 01/04/37 | | | 814,435 | | |
Principal
Amount | | | | | | Value | |
| EUR | 170,000 | | | | | Bundesschatzanweisungen,
3.250%, due 06/13/08 | | $ | 215,522 | | |
| CAD | 845,000 | | | | | Canadian Government Bond,
3.750%, due 06/01/08 | | | 749,442 | | |
| EUR | 930,000 | | | | | France Government Bond OAT,
3.250%, due 04/25/16 | | | 1,140,263 | | |
| EUR | 915,000 | | | | | Italy Buoni Poliennali Del Tesoro,
3.750%, due 08/01/16 | | | 1,149,156 | | |
| JPY | 97,000,000 | | | | | Japan Government Five Year
Bond, 1.200%, due 09/20/11 | | | 830,153 | | |
| JPY | 63,000,000 | | | | | Japan Government Thirty Year
Bond, 2.500%, due 06/20/36 | | | 544,939 | | |
| TRY | 506,000 | | | | | Turkey Government Bond,
21.330%, due 08/13/08 | | | 245,970 | | |
| GBP | 273,000 | | | | | United Kingdom Gilt, 4.000%,
due 03/07/09 | | | 510,109 | | |
| GBP | 430,000 | | | | | United Kingdom Gilt, 4.000%,
due 09/07/16 | | | 787,911 | | |
| GBP | 273,000 | | | | | United Kingdom Gilt, 4.250%,
due 03/07/11 | | | 509,602 | | |
| GBP | 130,000 | | | | | United Kingdom Gilt, 4.250%,
due 03/07/36 | | | 259,064 | | |
Total Other Bonds
(Cost $10,422,830) | | | 10,662,630 | | |
Total Long-Term Investments
(Cost $21,366,516) | | | 21,650,747 | | |
| SHORT-TERM INVESTMENTS: 16.8% | | | |
| | | Mutual Fund: 4.9% | |
| $1,264,656** | | ING Institutional Prime Money
Market Fund | | 1,264,656 | |
Total Mutual Fund
(Cost $1,264,656) | | | 1,264,656 | | |
| | | Repurchase Agreements: 11.9% | |
| | | | | | 3,084,000 | | | Deutsche Bank Repurchase
Agreement dated 10/31/06,
5.290%, due 11/01/06, $3,084,453
to be received upon repurchase
(Collateralized by $3,132,000
Federal National Mortgage
Association 5.800%, Market Value
plus accrued interest $3,145,972,
due 02/09/26). | | | 3,084,000 | | |
Total Repurchase Agreement
(Cost $3,084,000) | | | 3,084,000 | | |
Total Short-Term Investments
(Cost $4,348,656) | | | 4,348,656 | | |
Total Investments in
Securities
(Cost $25,715,172)* | | | 100.6 | % | | $ | 25,999,403 | | |
Other Assets and
Liabilities - Net | | | (0.6 | ) | | | (151,206 | ) | |
| Net Assets | | | 100.0 | % | | $ | 25,848,197 | | |
Securities may have been fair valued in accordance with procedures approved by the Board of Directors/Trustees (Note 2A).
** Investment in affiliate
# Securities with purchases pursuant to Rule 144A, under the Securities Act of 1933 and may not be resold subject to that
See Accompanying Notes to Financial Statements
173
PORTFOLIO OF INVESTMENTS
ING GLOBAL BOND FUND AS OF OCTOBER 31, 2006 (CONTINUED)
rule except to qualified institutional buyers. These securities have been determined to be liquid under the guidelines established by the Funds' Board of Directors/Trustees.
C Bond may be called prior to maturity date.
W When-issued or delayed delivery security.
S Segregated securities for certain derivatives, when-issued or delayed delivery securities and forward currency exchange contracts.
Non-U.S. currency symbols utilized in the above portfolio are defined as follows:
ARS Argentine Peso
CAD Canadian Dollar
EUR Euro
JPY Japanese Yen
TRY Turkish New Lira
* Cost for federal income tax purposes is $25,733,634.
Net unrealized appreciation consists of:
| Gross Unrealized Appreciation | | $ | 294,651 | | |
| Gross Unrealized Depreciation | | | (28,882 | ) | |
| Net Unrealized Appreciation | | $ | 265,769 | | |
ING Global Bond Fund Futures Contracts as of October 31, 2006:
Contract
Description | | Number
of
Contracts | | Notional
Market Value | | Expiration
Date | | Unrealized
Appreciation/
(Depreciation) | |
| Long Contracts | |
90-Day
Eurodollar | | | 25 | | | | 5,914,688 | | | 12/18/06 | | $ | 1,013 | | |
U.S. Treasury
2-Year Note | | | 6 | | | | 1,226,438 | | | 12/29/06 | | | 1,564 | | |
U.S. Treasury
5-Year Note | | | 2 | | | | 211,125 | | | 12/29/06 | | | (41 | ) | |
U.S. Treasury
10-Year Note | | | 6 | | | | 649,313 | | | 12/19/06 | | | 3,626 | | |
| | | | | | | | | | | | | $ | 6,162 | | |
| Short Contracts | |
90-Day
Eurodollar | | | 25 | | | | (5,923,750 | ) | | 3/19/07 | | $ | (4,954 | ) | |
U.S. Treasury
Long Bond | | | 2 | | | | (225,313 | ) | | 12/19/06 | | | (3,791 | ) | |
| | | | | | | | | | | | | $ | (8,745 | ) | |
ING Global Bond Fund Foreign Currency Holdings as of October 31, 2006:
| Currency | | Description | | Market Value | | Cost | |
| EUR | | Euro | | $ | 1,895,253 | | | $ | 1,890,235 | | |
| JPY | | Japanese Yen | | | 3,744,834 | | | | 3,802,948 | | |
| GBP | | Pound Sterling | | | (244 | ) | | | (240 | ) | |
| | | | | $ | 5,639,843 | | | $ | 5,692,943 | | |
See Accompanying Notes to Financial Statements
174
PORTFOLIO OF INVESTMENTS
ING DIVERSIFIED INTERNATIONAL FUND AS OF OCTOBER 31, 2006
| Shares | | | | Value | |
| AFFILIATED INVESTMENT COMPANIES: 99.6% | | | |
| | 616,241 | | | ING Emerging Countries
Fund - Class I | | $ | 18,314,694 | | |
| | 3,188,871 | | | ING Foreign Fund - Class I | | | 59,886,994 | | |
| | 6,716,629 | | | ING Index Plus International
Equity Fund - Class I | | | 78,584,562 | | |
| | 4,131,001 | | | ING International Capital
Appreciation Fund - Class I | | | 47,217,338 | | |
| | 676,765 | | | ING International Real Estate
Fund - Class I | | | 7,877,542 | | |
| | 279,794 | | | ING International SmallCap
Fund - Class I | | | 13,248,243 | | |
| | 2,969,674 | | | ING International Value Choice
Fund - Class I | | | 36,853,651 | | |
| | | | 261,983,024 | | |
Total Investments in
Securities
(Cost $243,882,909) | | | 99.6 | % | | $ | 261,983,024 | | |
Other Assets and
Liabilities - Net | | | 0.4 | | | | 989,522 | | |
| Net Assets | | | 100.0 | % | | $ | 262,972,546 | | |
* Cost for federal income tax purposes is $244,746,887.
Net unrealized appreciation consists of:
| Gross Unrealized Appreciation | | $ | 17,236,137 | | |
| Gross Unrealized Depreciation | | | — | | |
| Net Unrealized Appreciation | | $ | 17,236,137 | | |
See Accompanying Notes to Financial Statements
175
TAX INFORMATION (UNAUDITED)
Dividends paid during the year ended October 31, 2006 were as follows:
| Fund Name | | Type | | Per Share Amount | |
| ING Global Equity Dividend Fund | |
| Class A | | NII | | $ | 0.5078 | | |
| Class B | | NII | | $ | 0.4056 | | |
| Class C | | NII | | $ | 0.4065 | | |
| All Classes | | STCG | | $ | 0.1192 | | |
| All Classes | | LTCG | | $ | 0.0677 | | |
| ING Global Natural Resources Fund | |
| Class A | | NII | | $ | 0.0150 | | |
| ING Global Real Estate Fund | |
| Class A | | NII | | $ | 0.4643 | | |
| Class B | | NII | | $ | 0.3574 | | |
| Class C | | NII | | $ | 0.3582 | | |
| Class I | | NII | | $ | 0.5196 | | |
| All Classes | | STCG | | $ | 0.6350 | | |
| All Classes | | LTCG | | $ | 0.4226 | | |
| ING Global Value Choice Fund | |
| Class A | | NII | | $ | 0.1411 | | |
| Class B | | NII | | $ | — | | |
| Class C | | NII | | $ | 0.0205 | | |
| Class Q | | NII | | $ | 0.1940 | | |
| ING Emerging Countries Fund | |
| Class A | | NII | | $ | 0.1383 | | |
| Class B | | NII | | $ | — | | |
| Class C | | NII | | $ | 0.0726 | | |
| Class M | | NII | | $ | 0.0224 | | |
| Class Q | | NII | | $ | 0.1623 | | |
| ING Foreign Fund | |
| All Classes | | LTCG | | $ | 0.3583 | | |
| ING International Fund | |
| Class A | | NII | | $ | 0.1724 | | |
| Class B | | NII | | $ | 0.0881 | | |
| Class C | | NII | | $ | 0.0815 | | |
| Class I | | NII | | $ | 0.2166 | | |
| Class Q | | NII | | $ | 0.1987 | | |
| Fund Name | | Type | | Per Share Amount | |
| ING International Real Estate Fund | |
| Class A | | NII | | $ | 0.0579 | | |
| Class B | | NII | | $ | 0.0423 | | |
| Class C | | NII | | $ | 0.0368 | | |
| Class I | | NII | | $ | 0.0745 | | |
| ING International SmallCap Fund | |
| Class A | | NII | | $ | 0.3272 | | |
| Class B | | NII | | $ | 0.0397 | | |
| Class C | | NII | | $ | 0.1123 | | |
| Class Q | | NII | | $ | 0.4086 | | |
| ING International Value Fund | |
| Class A | | NII | | $ | 0.1550 | | |
| Class B | | NII | | $ | 0.0089 | | |
| Class C | | NII | | $ | 0.0286 | | |
| Class I | | NII | | $ | 0.2309 | | |
| Class Q | | NII | | $ | 0.1807 | | |
| All Classes | | STCG | | $ | 0.0801 | | |
| All Classes | | LTCG | | $ | 1.3347 | | |
| ING International Value Choice Fund | |
| Class A | | NII | | $ | 0.0992 | | |
| Class B | | NII | | $ | 0.0822 | | |
| Class C | | NII | | $ | 0.0754 | | |
| All Classes | | STCG | | $ | 0.1629 | | |
| ING Emerging Markets Fixed Income Fund | |
| Class A | | NII | | $ | 0.5677 | | |
| Class B | | NII | | $ | 0.5260 | | |
| Class C | | NII | | $ | 0.4060 | | |
| ING Global Bond Fund | |
| Class A | | NII | | $ | 0.0619 | | |
| Class B | | NII | | $ | 0.0436 | | |
| Class C | | NII | | $ | 0.0419 | | |
| Class I | | NII | | $ | 0.0718 | | |
NII — Net investment income
STCG — Short-term capital gain
LTCG — Long-term capital gain
Of the ordinary distributions made during the year ended October 31, 2006, the following percentages qualify for the dividends received deduction (DRD) available to corporate shareholders:
| Global Equity Dividend | | | 17.72 | % | |
| Global Natural Resources | | | 79.69 | % | |
| Global Value Choice | | | 99.74 | % | |
| International | | | 0.71 | % | |
For the year ended October 31, 2006, the following are percentages of net investment income dividends paid by the Funds that are designated as qualifying dividend income (QDI) subject to reduced income tax rates for individuals:
| Global Equity Dividend | | | 29.36 | % | |
| Global Natural Resources | | | 81.39 | % | |
| Global Value Choice | | | 100.00 | % | |
| Emerging Countries | | | 75.97 | % | |
| International | | | 86.27 | % | |
| International Real Estate | | | 10.85 | % | |
| International SmallCap | | | 100.00 | % | |
| International Value | | | 96.31 | % | |
| International Value Choice | | | 51.55 | % | |
Pursuant to Internal Revenue Code Section 871(k), the Funds designate the following percentages of net investment income distributions as interest-related dividends:
| Global Equity Dividend | | | 0.89 | % | |
| Global Natural Resources | | | 1.31 | % | |
| Emerging Countries | | | 1.55 | % | |
| International | | | 0.12 | % | |
| International Real Estate | | | 2.36 | % | |
176
TAX INFORMATION (UNAUDITED) (CONTINUED)
| International SmallCap | | | 0.01 | % | |
| International Value Choice | | | 0.24 | % | |
| Emerging Markets Fixed Income | | | 90.64 | % | |
| Global Bond | | | 33.97 | % | |
Pursuant to Section 853 of the Internal Revenue Code, the Funds designate the following amounts as foreign taxes paid for the year ended October 31, 2006:
| | | Foreign Taxes
Paid | | Per Share
Amount | |
| Global Equity Dividend | | $ | 526,949 | | | $ | 0.0359 | | |
| Emerging Countries | | $ | 646,698 | | | $ | 0.0031 | | |
| Greater China | | $ | 61,628 | | | $ | 0.0277 | | |
| Index Plus International Equity | | $ | 98,720 | | | $ | 0.0126 | | |
| International | | $ | 207,394 | | | $ | 0.0205 | | |
| International Capital Appreciation | | $ | 36,507 | | | $ | 0.0082 | | |
| International Real Estate | | $ | 25,614 | | | $ | 0.0033 | | |
| International SmallCap | | $ | 722,873 | | | $ | 0.0585 | | |
| International Value | | $ | 11,807,474 | | | $ | 0.0522 | | |
| International Value Choice | | $ | 101,173 | | | $ | 0.0201 | | |
Listed below are the gross income earned and foreign taxes paid by country for each fund shown above.
Foreign taxes paid for purposes of Section 853 may be less than actual foreign taxes paid for financial statement purposes.
Global Equity Dividend
| Country | | Gross Income
Earned | | Foreign
Tax Withheld | |
| Netherlands Antilles | | $ | 29,817 | | | $ | — | | |
| Australia | | | 663,772 | | | | — | | |
| Belgium | | | 180,727 | | | | 23,292 | | |
| Brazil | | | 264,489 | | | | — | | |
| Canada | | | 1,176,557 | | | | 102,800 | | |
| China | | | 80,189 | | | | — | | |
| Denmark | | | 77,901 | | | | 11,685 | | |
| France | | | 227,934 | | | | 34,190 | | |
| Germany | | | 233,829 | | | | 35,074 | | |
| Greece | | | 69,671 | | | | — | | |
| Hong Kong | | | 93,751 | | | | — | | |
| Ireland | | | 63,183 | | | | — | | |
| Israel | | | 74,783 | | | | 14,650 | | |
| Italy | | | 990,700 | | | | 144,763 | | |
| Luxembourg | | | 80,319 | | | | — | | |
| Mexico | | | 41,224 | | | | — | | |
| Netherlands | | | 221,214 | | | | 25,781 | | |
| New Zealand | | | 140,608 | | | | 21,091 | | |
| Norway | | | 76,149 | | | | 11,422 | | |
| Panama | | | 67,143 | | | | — | | |
| Portugal | | | 118,078 | | | | 16,267 | | |
| Singapore | | | 74,706 | | | | — | | |
| South Africa | | | 185,185 | | | | — | | |
| South Korea | | | 138,238 | | | | 22,741 | | |
| Spain | | | 38,608 | | | | 5,791 | | |
| Sweden | | | 198,040 | | | | 29,706 | | |
| Taiwan | | | 92,806 | | | | 18,561 | | |
| Thailand | | | 91,336 | | | | 9,134 | | |
| United Kingdom | | | 1,098,186 | | | | — | | |
| Subtotal | | | 6,889,142 | | | | 526,949 | | |
| United States | | | 2,914,542 | | | | — | | |
| Total | | $ | 9,803,685 | | | $ | 526,949 | | |
Emerging Countries
| Country | | Gross Income
Earned | | Foreign
Tax Withheld | |
| Bermuda | | $ | 234,984 | | | $ | — | | |
| Brazil | | | 1,459,722 | | | | — | | |
| Chile | | | 441,937 | | | | 100,150 | | |
| China | | | 97,321 | | | | — | | |
| Czech Republic | | | 185,194 | | | | 27,779 | | |
| Estonia | | | 168,723 | | | | 38,806 | | |
| India | | | 4,189 | | | | — | | |
177
TAX INFORMATION (UNAUDITED) (CONTINUED)
| Country | | Gross Income
Earned | | Foreign
Tax Withheld | |
| Indonesia | | $ | 111,200 | | | $ | 16,680 | | |
| Israel | | | 466,276 | | | | 93,255 | | |
| Luxembourg | | | 37,388 | | | | 1,278 | | |
| Malaysia | | | 25,895 | | | | — | | |
| Mexico | | | 78,728 | | | | — | | |
| Panama | | | 505,442 | | | | — | | |
| Phillippines | | | 26,079 | | | | 6,520 | | |
| Singapore | | | 417,110 | | | | — | | |
| South Africa | | | 37,120 | | | | — | | |
| South Korea | | | 629,717 | | | | 83,183 | | |
| Taiwan | | | 1,197,424 | | | | 239,481 | | |
| Thailand | | | 402,559 | | | | 39,565 | | |
| Venezuela | | | 661,554 | | | | — | | |
| Subtotal | | | 7,188,563 | | | | 646,698 | | |
| United States | | | 139,921 | | | | — | | |
| Total | | $ | 7,328,484 | | | $ | 646,698 | | |
Greater China
| Country | | Gross Income
Earned | | Foreign
Tax Withheld | |
| Bermuda | | $ | 2,447 | | | $ | — | | |
| Cayman Islands | | | 17,349 | | | | — | | |
| China | | | 81,267 | | | | — | | |
| Hong Kong | | | 174,047 | | | | — | | |
| Luxembourg | | | 9,973 | | | | — | | |
| Taiwan | | | 324,365 | | | | 61,628 | | |
| United Kingdom | | | 16,996 | | | | — | | |
| Subtotal | | | 626,444 | | | | 61,628 | | |
| United States | | | 10,597 | | | | — | | |
| Total | | $ | 637,041 | | | $ | 61,628 | | |
Index Plus International
Equity
| Country | | Gross Income
Earned | | Foreign
Tax Withheld | |
| Australia | | $ | 104,758 | | | $ | — | | |
| Austria | | | 7,819 | | | | 1,173 | | |
| Belgium | | | 26,862 | | | | 4,029 | | |
| Bermuda | | | 232 | | | | — | | |
| Denmark | | | 4,320 | | | | 648 | | |
| Finland | | | 15,785 | | | | 2,368 | | |
| France | | | 129,671 | | | | 18,879 | | |
| Germany | | | 99,285 | | | | 14,735 | | |
| Greece | | | 8,579 | | | | — | | |
| Hong Kong | | | 25,341 | | | | — | | |
| Ireland | | | 9,674 | | | | — | | |
| Italy | | | 92,611 | | | | 11,417 | | |
| Japan | | | 138,072 | | | | 9,671 | | |
| Luxembourg | | | 23,071 | | | | 3,461 | | |
| Netherlands | | | 43,222 | | | | 6,419 | | |
| New Zealand | | | 7,868 | | | | 1,180 | | |
| Norway | | | 12,730 | | | | 827 | | |
| Portugal | | | 4,459 | | | | 621 | | |
| Singapore | | | 17,284 | | | | — | | |
| Spain | | | 71,846 | | | | 10,698 | | |
| Sweden | | | 30,151 | | | | 4,365 | | |
| Switzerland | | | 56,246 | | | | 8,229 | | |
| United Kingdom | | | 471,689 | | | | — | | |
| Subtotal | | | 1,401,573 | | | | 98,720 | | |
| United States | | | 20,076 | | | | — | | |
| Total | | $ | 1,421,649 | | | $ | 98,720 | | |
178
TAX INFORMATION (UNAUDITED) (CONTINUED)
International
| Country | | Gross Income
Earned | | Foreign
Tax Withheld | |
| Australia | | $ | 102,132 | | | $ | — | | |
| Belgium | | | 34,095 | | | | 5,114 | | |
| Brazil | | | 38,533 | | | | — | | |
| Canada | | | 13,141 | | | | 1,971 | | |
| Cayman Islands | | | 41,551 | | | | — | | |
| China | | | 14,923 | | | | — | | |
| Finland | | | 63,457 | | | | 9,519 | | |
| France | | | 257,090 | | | | 35,176 | | |
| Germany | | | 405,634 | | | | 59,944 | | |
| Greece | | | 36,706 | | | | — | | |
| Hong Kong | | | 60,304 | | | | — | | |
| India | | | 23,518 | | | | — | | |
| Israel | | | 3,151 | | | | 504 | | |
| Italy | | | 57,409 | | | | 8,611 | | |
| Japan | | | 254,934 | | | | 17,720 | | |
| Malaysia | | | 15,304 | | | | — | | |
| Mexico | | | 33,737 | | | | — | | |
| Netherlands | | | 37,135 | | | | 4,522 | | |
| South Africa | | | 59,701 | | | | — | | |
| South Korea | | | 8,385 | | | | 1,384 | | |
| Sweden | | | 105,942 | | | | 15,891 | | |
| Switzerland | | | 148,955 | | | | 16,080 | | |
| Taiwan | | | 115,466 | | | | 23,093 | | |
| Thailand | | | 78,648 | | | | 7,865 | | |
| United Kingdom | | | 1,187,914 | | | | — | | |
| Subtotal | | | 3,197,766 | | | | 207,394 | | |
| United States | | | 390,664 | | | | — | | |
| Total | | $ | 3,588,430 | | | $ | 207,394 | | |
International Capital
Appreciation
| Country | | Gross Income
Earned | | Foreign
Tax Withheld | |
| Australia | | $ | 16,641 | | | $ | — | | |
| Austria | | | 4,058 | | | | 609 | | |
| Belgium | | | 3,464 | | | | 520 | | |
| Bermuda | | | 4,822 | | | | — | | |
| Brazil | | | 15,506 | | | | — | | |
| Canada | | | 8,341 | | | | 1,239 | | |
| Finland | | | 3,274 | | | | 491 | | |
| France | | | 44,404 | | | | 5,707 | | |
| Germany | | | 20,453 | | | | 3,068 | | |
| Hong Kong | | | 13,582 | | | | — | | |
| India | | | 7,796 | | | | — | | |
| Israel | | | 2,146 | | | | 343 | | |
| Italy | | | 29,658 | | | | 4,449 | | |
| Japan | | | 34,373 | | | | 2,406 | | |
| Korea | | | 1,103 | | | | 182 | | |
| Luxembourg | | | 6,973 | | | | 1,046 | | |
| Mexico | | | 1,187 | | | | — | | |
| Singapore | | | 15,117 | | | | — | | |
| South Korea | | | 557 | | | | 92 | | |
| Spain | | | 51,480 | | | | 7,722 | | |
| Switzerland | | | 35,939 | | | | 5,303 | | |
| Taiwan | | | 16,653 | | | | 3,331 | | |
| United Kingdom | | | 130,582 | | | | — | | |
| Subtotal | | | 468,109 | | | | 36,507 | | |
| United States | | | 31,970 | | | | — | | |
| Total | | $ | 500,080 | | | $ | 36,507 | | |
179
TAX INFORMATION (UNAUDITED) (CONTINUED)
International Real Estate
| Country | | Gross Income
Earned | | Foreign
Tax Withheld | |
| Australia | | $ | 258,557 | | | $ | — | | |
| Bermuda | | | 1,779 | | | | — | | |
| Canada | | | 70,206 | | | | 9,794 | | |
| China | | | 10,816 | | | | — | | |
| Finland | | | 5,403 | | | | 810 | | |
| France | | | 45,432 | | | | 6,016 | | |
| Geurnsey Channel Islands | | | 1,211 | | | | — | | |
| Germany | | | 2,130 | | | | 319 | | |
| Hong Kong | | | 46,966 | | | | — | | |
| Italy | | | 4,100 | | | | 615 | | |
| Japan | | | 41,432 | | | | 2,900 | | |
| Netherlands | | | 30,793 | | | | 3,514 | | |
| Philippines | | | 235 | | | | 59 | | |
| Singapore | | | 48,068 | | | | — | | |
| Spain | | | 5,052 | | | | 758 | | |
| Sweden | | | 5,519 | | | | 828 | | |
| Thailand | | | 1,835 | | | | — | | |
| United Kingdom | | | 70,393 | | | | — | | |
| Subtotal | | | 649,927 | | | | 25,614 | | |
| United States | | | 9,890 | | | | — | | |
| Total | | $ | 659,817 | | | $ | 25,614 | | |
International SmallCap
| Country | | Gross Income
Earned | | Foreign
Tax Withheld | |
| Australia | | $ | 1,214,170 | | | $ | — | | |
| Austria | | | 13,185 | | | | 1,978 | | |
| Belgium | | | 161,913 | | | | 24,287 | | |
| Bermuda | | | 249,361 | | | | — | | |
| Brazil | | | 12,168 | | | | — | | |
| Canada | | | 181,927 | | | | 27,289 | | |
| Cayman Islands | | | 292,876 | | | | — | | |
| China | | | 238,726 | | | | — | | |
| Denmark | | | 688,459 | | | | 99,812 | | |
| Finland | | | 125,444 | | | | 18,817 | | |
| France | | | 368,829 | | | | 55,284 | | |
| Germany | | | 519,684 | | | | 77,953 | | |
| Greece | | | 2,197 | | | | — | | |
| Hong Kong | | | 206,379 | | | | — | | |
| Ireland | | | 17,324 | | | | — | | |
| Italy | | | 232,600 | | | | 34,890 | | |
| Japan | | | 1,713,333 | | | | 119,964 | | |
| Liechtenstein | | | 8,045 | | | | — | | |
| Luxembourg | | | 39,130 | | | | 178 | | |
| Malaysia | | | 108,647 | | | | — | | |
| Netherlands | | | 908,045 | | | | 108,636 | | |
| New Zealand | | | 7,897 | | | | 1,067 | | |
| Norway | | | 322,922 | | | | 8,376 | | |
| Singapore | | | 96,526 | | | | — | | |
| South Korea | | | 236,102 | | | | 38,630 | | |
| Spain | | | 30,427 | | | | 4,412 | | |
| Sweden | | | 137,986 | | | | 20,698 | | |
| Switzerland | | | 224,495 | | | | 31,263 | | |
| Taiwan | | | 250,685 | | | | 49,340 | | |
| Thailand | | | 10,439 | | | | — | | |
| Turkey | | | 222,005 | | | | — | | |
| United Kingdom | | | 1,197,280 | | | | — | | |
| Venezuela | | | 49,290 | | | | — | | |
| Virgin Islands | | | 5,923 | | | | — | | |
| Subtotal | | | 10,094,419 | | | | 722,873 | | |
| United States | | | 997,542 | | | | — | | |
| Total | | $ | 11,091,961 | | | $ | 722,873 | | |
180
TAX INFORMATION (UNAUDITED) (CONTINUED)
International Value
| Country | | Gross Income
Earned | | Foreign
Tax Withheld | |
| Bermuda | | $ | 1,521,784 | | | $ | — | | |
| Brazil | | | 5,145,298 | | | | — | | |
| France | | | 11,040,934 | | | | 1,609,018 | | |
| Germany | | | 16,209,198 | | | | 2,431,380 | | |
| Italy | | | 11,849,896 | | | | 1,670,011 | | |
| Japan | | | 8,754,199 | | | | 612,794 | | |
| Mexico | | | 2,109,670 | | | | — | | |
| Netherlands | | | 10,179,631 | | | | 1,183,185 | | |
| New Zealand | | | 4,702,644 | | | | 705,397 | | |
| Portugal | | | 3,524,245 | | | | 528,637 | | |
| Russia | | | (48,781 | ) | | | — | | |
| Singapore | | | 4,542,655 | | | | — | | |
| South Korea | | | 7,852,448 | | | | 1,295,654 | | |
| Spain | | | 4,194,369 | | | | 629,155 | | |
| Switzerland | | | 5,951,556 | | | | 892,641 | | |
| Taiwan | | | 1,248,010 | | | | 249,602 | | |
| United Kingdom | | | 20,229,418 | | | | — | | |
| Venezuela | | | 2,776,703 | | | | — | | |
| Subtotal | | | 121,783,877 | | | | 11,807,474 | | |
| United States | | | 820,126 | | | | — | | |
| Total | | $ | 122,604,002 | | | $ | 11,807,474 | | |
International Value Choice
| Country | | Gross Income
Earned | | Foreign
Tax Withheld | |
| Australia | | $ | 20,134 | | | $ | — | | |
| Belgium | | | 56,848 | | | | 8,527 | | |
| Canada | | | 27,266 | | | | 4,088 | | |
| Finland | | | 27,795 | | | | 4,169 | | |
| France | | | 42,749 | | | | 6,412 | | |
| Italy | | | 254,735 | | | | 35,176 | | |
| Japan | | | 99,339 | | | | 6,939 | | |
| Netherlands | | | 13,778 | | | | 1,666 | | |
| Portugal | | | 15,597 | | | | 754 | | |
| South Africa | | | 28,075 | | | | — | | |
| South Korea | | | 29,490 | | | | 4,866 | | |
| Taiwan | | | 142,877 | | | | 28,575 | | |
| United Kingdom | | | 220,337 | | | | — | | |
| Subtotal | | | 979,021 | | | | 101,173 | | |
| United States | | | 10,212 | | | | — | | |
| Total | | $ | 989,234 | | | $ | 101,173 | | |
Foreign taxes paid or withheld should be included in taxable income with an offsetting deduction from gross income or as a credit for taxes paid to foreign governments. Shareholders are strongly advised to consult their own tax advisors regarding the appropriate treatment of foreign taxes paid.
Above figures may differ from those cited elsewhere in this report due to differences in the calculation of income and gains under U.S. generally accepted accounting principles (book) purposes and Internal Revenue Service (tax) purposes.
Shareholders are strongly advised to consult their own tax advisers with respect to the tax consequences of their investments in the Funds. In January, shareholders, excluding corporate shareholders, receive an IRS 1099-DIV regarding the federal tax status of the dividends and distributions they received in the calendar year.
181
TRUSTEE AND OFFICER INFORMATION (UNAUDITED)
The business and affairs of IMF and IMT are managed under the direction of the Board. A Trustee who is not an interested person of the Trust, as defined in the 1940 Act, is an independent Trustee ("Independent Trustee"). The Trustees and Officers of IMF and IMT are listed below. The Statement of Additional Information includes additional information about Trustees of each registrant and is available, without charge, upon request at 1-800-992-0180.
Name, Address
and Age | | Position(s)
held with each
Trust | | Term of
Office and
Length of
Time
Served(1) | | Principal
Occupation(s)
during the
Past Five Years | | Number of
Funds in
Fund Complex
Overseen
by Trustee | | Other
Directorships
held by
Trustee | |
John V. Boyer
7337 E. Doubletree Ranch Rd.
Scottsdale, Arizona 85258
Age: 53 | | Trustee | | January 2005 -Present | | President and Chief Executive Officer, Franklin and Eleanor Roosevelt Institute (March 2006 - Present). Formerly, Executive Director, The Mark Twain House & Museum(2) (September 1989 - November 2005). | | | 180 | | | None. | |
|
Patricia W. Chadwick
7337 E. Doubletree Ranch Rd.
Scottsdale, Arizona 85258
Age: 58 | | Trustee | | January 2006 - Present | | Consultant and President of self-owned company, Ravengate Partners LLC (January 2000 - Present). | | | 180 | | | None. | |
|
J. Michael Earley
7337 E. Doubletree Ranch Rd.
Scottsdale, Arizona 85258
Age: 61 | | Trustee | | February 2002 - Present (IMT)
February 2001 - Present (IMF) | | President and Chief Executive Officer, Bankers Trust Company, N.A. (June 1992 - Present). | | | 180 | | | None. | |
|
R. Barbara Gitenstein
7337 E. Doubletree Ranch Rd.
Scottsdale, Arizona 85258
Age: 58 | | Trustee | | February 2002 - Present | | President, College of New Jersey (January 1999 - Present). | | | 180 | | | None. | |
|
Patrick W. Kenny
7337 E. Doubletree Ranch Rd.
Scottsdale, Arizona 85258
Age: 63 | | Trustee | | January 2005 - Present | | President and Chief Executive Officer, International Insurance Society (June 2001 - Present). | | | 180 | | | Assured Guaranty Ltd. (April 2004 - Present). | |
|
Walter H. May
7337 E. Doubletree Ranch Rd.
Scottsdale, Arizona 85258
Age: 69 | | Trustee | | October 1999 - Present | | Retired. | | | 180 | | | None. | |
|
Jock Patton
7337 E. Doubletree Ranch Rd.
Scottsdale, Arizona 85258
Age: 60 | | Chairperson and Trustee | | October 1999 - Present (IMT)
May 1999 - Present (IMF) | | Private Investor (June 1997 - Present). Formerly, Director and Chief Executive Officer, Rainbow Multimedia Group, Inc. (January 1999 - December 2001). | | | 180 | | | JDA Software Group, Inc. (January 1999 -Present); and Swift Transportation Co. (March 2004 - Present). | |
|
Sheryl K. Pressler
7337 E. Doubletree Ranch Rd.
Scottsdale, Arizona 85258
Age: 55 | | Trustee | | January 2006 - Present | | Consultant (May 2001 - Present). Formerly, Chief Executive Officer, Lend Lease Real Estate Investments, Inc. (March 2000 - April 2001). | | | 180 | | | Stillwater Mining Company (May 2002 - Present); California HealthCare Foundation (June 1999 - Present); and Romanian-American Enterprise Fund (February 2004 - Present). | |
|
182
TRUSTEE AND OFFICER INFORMATION (UNAUDITED) (CONTINUED)
Name, Address
and Age | | Position(s)
held with each
Trust | | Term of
Office and
Length of
Time
Served(1) | | Principal
Occupation(s)
during the
Past Five Years | | Number of
Funds in
Fund Complex
Overseen
by Trustee | | Other
Directorships
held by
Trustee | |
David W.C. Putnam
7337 E. Doubletree Ranch Rd.
Scottsdale, Arizona 85258
Age: 67 | | Trustee | | October 1999 - Present | | President and Director, F.L. Putnam Securities Company, Inc. (June 1978 - Present). | | | 180 | | | Principled Equity Market Trust (December 1996 - Present); and Asian American Bank and Trust Company. (June 1993 - Present). | |
|
Roger B. Vincent
7337 E. Doubletree Ranch Rd.
Scottsdale, Arizona 85258
Age: 61 | | Trustee | | February 2002 - Present (IMF)
February 2001 - Present (IMT) | | President, Springwell Corporation (March 1989 - Present). | | | 180 | | | AmeriGas Propane, Inc. (January 1998 - Present); and UGI Corporation (February 2006 - Present). | |
|
Trustees who is ''Interested
Person'': | |
|
| | | | | | | | | | | | | | |
|
John G. Turner(3)
7337 E. Doubletree Ranch Rd.
Scottsdale, Arizona 85258
Age: 67 | | Trustee | | October 1999 - Present | | Retired. Formerly, Vice Chairman of ING Americas (September 2000 - January 2002); Director of ReliaStar Life Insurance Company of New York (April 1975 - December 2001); and Chairman and Trustee of the Northstar affiliated investment companies (May 1993 - December 2001). | | | 180 | | | Hormel Foods Corporation (March 2000 - Present); and Conseco, Inc. (September 2003 - Present). | |
|
(1) Trustees serve until their successors are duly elected and qualified, subject to the Board's retirement policy.
(2) Shaun Mathews, President, ING USFS Mutual Funds and Investment Products, has held a seat on the Board of Directors of The Mark Twain House & Museum since September 19, 2002. ING Groep N.V. makes non-material, charitable contributions to The Mark Twain House & Museum.
(3) Mr. Turner is an ''interested person,'' as defined under the 1940 Act, because of his affiliation with ING Groep N.V., the parent corporation of the Investment Adviser, ING Investments, LLC and the Distributor, ING Funds Distributor, LLC.
183
TRUSTEE AND OFFICER INFORMATION (UNAUDITED) (CONTINUED)
Name, Address
and Age | | Position(s)
Held with the Trust | | Term of Office and
Length of Time Served(1) | | Principal Occupation(s) during the
Past Five Years | |
| Officers: | |
|
James M. Hennessy(2)
7337 E. Doubletree Ranch Rd.
Scottsdale, AZ 85258
Age: 57 | | President and Chief Executive Officer | | February 2001 - November 2006 | | President and Chief Executive Officer, ING Investments, LLC(3) (December 2000 - November 2006). Formerly, Chief Operating Officer, ING Investments, LLC(3) (December 2000 - March 2006). | |
|
Michael J. Roland
7337 E. Doubletree Ranch Rd.
Scottsdale, AZ 85258
Age: 48 | | Executive Vice President | | February 2002 - Present | | Executive Vice President, ING Investments, LLC(3) (December 2001 - Present). Formerly, Chief Compliance Officer, ING Investments, LLC(3), ING Life Insurance and Annuity Company and Directed Services, Inc. (October 2004 - December 2005); Chief Financial Officer and Treasurer, ING Investments, LLC(3) (December 2001 - March 2005); and Senior Vice President, ING Investments, LLC(3) (June 1998 - December 2001). | |
|
Stanley D. Vyner
7337 E. Doubletree Ranch Rd.
Scottsdale, AZ 85258
Age: 56 | | Executive Vice President | | May 1999 - Present (IMF)
November 1999 - Present (IMT) | | Executive Vice President, ING Investments, LLC(3) (July 2000 - Present); and Chief Investment Risk Officer, ING Investments, LLC(3) (January 2003 - Present). Formerly, Chief Investment Officer of the International Portfolios, ING Investments, LLC(3) (August 2000 - January 2003). | |
|
Robert S. Naka
7337 E. Doubletree Ranch Rd.
Scottsdale, AZ 85258
Age: 43 | | Executive Vice President and Chief Operating Officer
Assistant Secretary | | March 2006 - Present
May 1999 - Present (IMF)
November 1999 - Present (IMT) | | Executive Vice President and Chief Operating Officer, ING Funds Services, LLC(3) and ING Investments, LLC(3) (March 2006 - Present); and Assistant Secretary, ING Funds Services, LLC(4) (October 2001 - Present). Formerly, Senior Vice President, ING Investments, LLC(3) (August 1999 - March 2006). | |
|
Joseph M. O'Donnell
7337 E. Doubletree Ranch Rd.
Scottsdale, AZ 85258
Age: 51 | | Executive Vice President
Chief Compliance Officer | | March 2006 - Present
November 2004 - Present | | Chief Compliance Officer of the ING Funds (November 2004 - Present) and ING Investments, LLC(3), ING Life Insurance and Annuity Company and Directed Services, Inc. (March 2006 - Present) and Executive Vice President of the ING Funds (March 2006 - Present). Formerly, Vice President, Chief Legal Counsel, Chief Compliance Officer and Secretary of Atlas Securities, Inc., Atlas Advisers, Inc. and Atlas Funds (October 2001 - October 2004); and Chief Operating Officer and General Counsel of Matthews International Capital Management LLC and Vice President and Secretary of Matthews International Funds (August 1999 - May 2001). | |
|
Todd Modic
7337 E. Doubletree Ranch Rd.
Scottsdale, Arizona 85258
Age: 38 | | Senior Vice President, Chief/Principal Financial Officer and Assistant Secretary | | March 2005 - Present | | Senior Vice President, ING Funds Services, LLC(3) (April 2005 - Present). Formerly, Vice President, ING Funds Services, LLC(4) (September 2002 - March 2005); and Director, Financial Reporting, ING Investments, LLC(3) (March 2001 - September 2002). | |
|
Kimberly A. Anderson
7337 E. Doubletree Ranch Rd.
Scottsdale, AZ 85258
Age: 42 | | Senior Vice President | | November 2003 - Present | | Senior Vice President, ING Investments, LLC(3) (October 2003 - Present). Formerly, Vice President and Assistant Secretary, ING Investments, LLC(3) (January 2001 - October 2003). | |
|
Ernest J. C'DeBaca
7337 E. Doubletree Ranch Rd.
Scottsdale, Arizona 85258
Age: 37 | | Senior Vice President | | May 2006 - Present | | Senior Vice President, ING Funds Services, LLC(4) (April 2006 - Present); Counsel, ING Americas U.S. Legal Services (January 2004 - March 2006); Attorney-Adviser, U.S. Securities and Exchange Commission (May 2001 - December 2003). | |
|
Robert Terris
7337 E. Doubletree Ranch Rd.
Scottsdale, Arizona 85258
Age: 36 | | Senior Vice President | | May 2006 - Present | | Senior Vice President of Operations, ING Funds Services, LLC(4) (May 2006 - Present). Formerly, Vice President of Administration, ING Funds Services, LLC(4) (September 2001 - May 2006). | |
|
184
TRUSTEE AND OFFICER INFORMATION (UNAUDITED) (CONTINUED)
Name, Address
and Age | | Position(s)
Held with the Trust | | Term of Office and
Length of Time Served(1) | | Principal Occupation(s) during the
Past Five Years | |
Robyn L. Ichilov
7337 E. Doubletree Ranch Rd.
Scottsdale, AZ 85258
Age: 39 | | Vice President and Treasurer | | November 1999 - Present (IMT)
May 1999 - Present (IMF) | | Vice President and Treasurer, ING Funds Services, LLC(4) (October 2001 - Present) and ING Investments, LLC(3) (August 1997 - Present). | |
|
Lauren D. Bensinger
7337 E. Doubletree Ranch Rd.
Scottsdale, Arizona 85258
Age: 52 | | Vice President | | February 2003 - Present | | Vice President and Chief Compliance Officer, ING Funds Distributor, LLC(5) (July 1995 - Present); and Vice President (February 1996 - Present) and Director of Compliance (October 2004 - Present), ING Investments, LLC.(3) Formerly, Chief Compliance Officer, ING Investments, LLC(3) (October 2001 - October 2004). | |
|
Maria M. Anderson
7337 E. Doubletree Ranch Rd.
Scottsdale, AZ 85258
Age: 48 | | Vice President | | September 2004 - Present | | Vice President, ING Funds Services, LLC(4) (September 2004 - Present). Formerly, Assistant Vice President, ING Funds Services,(4) LLC (October 2001 - September 2004); and Manager Fund Accounting and Fund Compliance, ING Investments, LLC(3) (September 1999 - October 2001). | |
|
Mary A. Gaston
7337 E. Doubletree Ranch Rd.
Scottsdale, AZ 85258
Age: 40 | | Vice President | | March 2005 - Present | | Vice President, ING Funds Services, LLC(4) (April 2005 - Present). Formerly, Assistant Vice President, Financial Reporting, ING Funds Services, LLC(4) (April 2004 - April 2005); Manager, Financial Reporting, ING Funds Services, LLC(4) (August 2002 - April 2004); and Controller Z Seven Fund, Inc. and Ziskin Asset Management, Inc. (January 2000 - March 2002). | |
|
Kimberly K. Palmer
7337 E. Doubletree Ranch Rd.
Scottsdale, AZ 85258
Age: 49 | | Vice President | | March 2006 - Present | | Vice President, ING Funds Services, LLC(4) (March 2006 - Present). Formerly, Assistant Vice President, ING Funds Services, LLC(4) (August 2004 - March 2006). Formerly, Manager, Registration Statements, ING Funds Services, LLC(4) (May 2003 - August 2004); Associate Partner, AMVESCAP PLC (October 2000 - May 2003); and Director of Federal Filings and Blue Sky Filings, INVESCO Funds Group, Inc. (March 1994 - May 2003). | |
|
Susan P. Kinens
7337 E. Doubletree Ranch Rd.
Scottsdale, AZ 85258
Age: 29 | | Assistant Vice President | | February 2003 - Present | | Assistant Vice President, ING Funds Services, LLC(4) (December 2002 - Present); and has held various other positions with ING Funds Services, LLC(4) for more than the last five years. | |
|
Huey P. Falgout, Jr.
7337 E. Doubletree Ranch Rd.
Scottsdale, AZ 85258
Age: 42 | | Secretary | | August 2003 - Present | | Chief Counsel, ING Americas, U.S. Legal Services (September 2003 - Present). Formerly, Counsel, ING Americas, U.S. Legal Services (November 2002 - September 2003); and Associate General Counsel of AIG American General (January 1999 - November 2002). | |
|
Theresa K. Kelety
7337 E. Doubletree Ranch Rd.
Scottsdale, AZ 85258
Age: 43 | | Assistant Secretary | | August 2003 - Present | | Counsel, ING Americas, U.S. Legal Services (April 2003 - Present). Formerly, Senior Associate with Shearman & Sterling (February 2000 - April 2003). | |
|
Healy A. Webb
7337 E. Doubletree Ranch Rd.
Scottsdale, Arizona 85258
Age: 37 | | Assistant Secretary | | June 2006 - December 2006 | | Managing Paralegal, ING Funds Services, LLC(4) (May 2006 - December 2006) Formerly, Supervisor, ING Funds Services, LLC(4) (August 2005 - May 2006); Project Manager, ING Funds Services, LLC(4) (February 2002 - August 2005); and Fund Administration and Compliance Associate, Capital Research and Management Company (August 1998 - January 2002). | |
|
(1) The Officers hold office until the next annual meeting of the Trustees and until their successors have been elected and qualified.
(2) Effective November 9, 2006, Mr. James M. Hennessy retired from the Board and was replaced by Mr. Shaun P. Mathews.
(3) ING Investments, LLC was previously named ING Pilgrim Investments, LLC. ING Pilgrim Investments, LLC is the sucessor in interest to ING Pilgrim Investments, Inc., which was previously known as Pilgrim Investments, Inc. and before that was known as Pilgrim America Investments, Inc.
(4) ING Funds Services, LLC was previously named ING Pilgrim Group, LLC. ING Pilgrim Group, LLC is the sucessor in interest to ING Pilgrim Group, Inc., which was previously known as Pilgrim Group, Inc. and before that was known as Pilgrim America Group, Inc.
(5) ING Funds Distributor, LLC is the sucessor in interest to ING Funds Distributor, Inc., which was previously known as ING Pilgrim Securities, Inc., and before that was known as Pilgrim Securities, Inc., and before that was known as Pilgrim America Securities, Inc.
185
ADVISORY CONTRACT APPROVAL DISCUSSION (UNAUDITED)
Section 15(c) of the 1940 Act provides that, after an initial period, the Funds' existing investment advisory and sub-advisory contracts remain in effect only if the Boards of Trustees (the "Board") of ING Mutual Funds and ING Mayflower Trust, including a majority of the Trustees who have no direct or indirect interest in the advisory and sub-advisory contracts, and who are not "interested persons" of the Funds, as such term is defined under the 1940 Act (the "Independent Trustees"), annually review and renew them. In this regard, at a meeting held on November 10, 2005 the Board, including a majority of the Independent Trustees, considered whether to renew the investment advisory contracts (the "Advisory Contracts") between ING Investments, LLC (the "Adviser") and the Funds and the sub-advisory contracts ("Sub-Advisory Contracts") with the respective sub-advisers to the Funds (each, a "Sub-Adviser," and collectively, the "Sub-Advisers").
The Independent Trustees also held separate meetings on October 11 and November 8, 2005 to consider renewals of the Advisory Contracts and Sub-Advisory Contracts. Thus, references herein to factors considered and determinations made by the Independent Trustees include, as applicable, factors considered and determinations made on those earlier dates.
At the November 10, 2005 meeting, the Board voted to renew the Advisory and Sub-Advisory Contracts for the Funds. In reaching these decisions, the Board took into account information furnished throughout the year at regular Board meetings, as well as information prepared specifically in connection with the annual review process. The Board's determination took into account a number of factors that its members believed, in light of the legal advice furnished to them by Kirkpatrick & Lockhart Nicholson Graham LLP ("K&LNG"), their independent legal counsel, and their own business judgment, to be relevant. Further, while the Advisory Contracts and Sub-Advisory Contracts for all the Funds were considered at the same Board meeting, the Trustees considered each Fund's advisory and sub-advisory relationships separately.
Provided below is an overview of the Board's contract approval process in general, as well as a discussion of certain of the specific factors the Board considered at the November 10, 2005 meeting. While the Board gave its attention to the information furnished, at its request, that was most relevant to its consideration, discussed below are a number of the primary factors relevant to the Board's consideration as to whether to renew the Advisory and Sub-Advisory Contracts for the year ending November 30, 2006. Each Trustee may have accorded different weight to the various factors in reaching his or her conclusions with respect to the Funds' advisory and sub-advisory arrangements.
Overview of the Contract Approval Process
In 2003, the Board determined to undertake steps to further enhance the process under which the Board determines whether to renew existing Advisory and Sub-Advisory Contracts and to approve new advisory arrangements. Among the measures the Board implemented was to retain the services of an independent consultant with experience in the mutual fund industry to assist the Independent Trustees of the Board in working with the personnel employed by the Funds' Adviser or its affiliates who administer the Funds ("Management") to identify the types of information presented to the Trustees to inform their deliberations with respect to advisory and sub-advisory relationships; establish the format in which the information requested by the Board is provided to the Board; and determine the process for reviewing such information in connection with the Advisory and Sub-Advisory Contract renewal process. The end result was the implementation of the current process relied upon by the Board to review and analyze information in connection with the annual renewal of the Funds' Advisory and Sub-Advisory Contracts, as well as its review and approval of new advisory relationships.
Since this process was implemented, the Board has continuously reviewed and refined the process. In addition, the Board established a Contracts Committee and two Investment Review Committees, including the International Equity and Fixed Income Funds Investment Review Committee (the "IE&FI IRC"). The type and format of the information provided to the Board or its counsel to inform its annual review and renewal process has been codified in the Funds' 15(c) Methodology Guide (the "Methodology Guide"). The Methodology Guide was developed under the direction of the Board, and sets out a written blueprint under which the Board requests certain information necessary to facilitate a thorough and informed review in connection with the annual Advisory and Sub-Advisory Contract renewal process. Management provides Fund-specific information to the Board based on the Methodology Guide through "Fund Analysis and Comparison Tables" or "FACT" sheets pri or to the Board's review of Advisory and Sub-Advisory Contracts. Certain of this information for a representative sample of Funds in the ING Funds complex was verified, at the Board's request, by an independent firm to test its accuracy.
186
ADVISORY CONTRACT APPROVAL DISCUSSION (UNAUDITED) (CONTINUED)
On its own and as part of a regular on-going process, the Board's Contracts Committee recommends or considers recommendations from Management for refinements and other changes to the Methodology Guide and other aspects of the review process, and the Board's Investment Review Committees, including the IE&FI IRC, review benchmarks used to assess the performance of each Fund. The IE&FI IRC also meets regularly with the Adviser and periodically with the Funds' Sub-Advisers. The IE&FI IRC may apply a heightened level of scrutiny in cases where performance has lagged a benchmark and/or peer group.
The Board employed its process for reviewing contracts when considering the renewals of the Advisory and Sub-Advisory Contracts that would be effective through November 30, 2006. A number of the Board's primary considerations and conclusions resulting from this process are discussed below.
Nature, Extent and Quality of Service
In determining whether to approve the Advisory Contracts and Sub-Advisory Contracts for the Funds for the year ending November 30, 2006, the Board received and evaluated such information as it deemed necessary regarding the nature, extent and quality of services provided to the Funds by the Adviser and Sub-Advisers. This included information about the Adviser and Sub-Advisers to the Funds provided throughout the year at regular Board meetings, as well as information furnished for the November 10, 2005 Board meeting, which was held to specifically consider renewal for the period ending November 30, 2006. In addition, the Board's Independent Trustees also held meetings on October 11th and November 8th, prior to the November 10, 2005 meeting of the full Board, to consider the annual renewal of the Advisory and Sub-Advisory Contracts.
The materials requested by and provided to the Board prior to the November 2005 Board meeting included the following items: (1) FACT sheets for each Fund that provide information about the performance and expenses of the Fund and other, similarly managed funds in a selected peer group ("Selected Peer Group"), as well as information about the Fund's investment portfolio, objectives and strategies; (2) the Methodology Guide, which describes how the FACT sheets were prepared, including the manner in which benchmarks and Selected Peer Groups were selected and how profitability was determined; (3) responses to a detailed series of questions from K&LNG, legal counsel to the Independent Trustees; (4) copies of each form of Advisory Contract and Sub-Advisory Contract; (5) copies of the Forms ADV for the Adviser and each Sub-Adviser to the Funds; (6) financial statements for the Adviser and each Sub-Adviser; (7) drafts of narrative summaries addr essing key factors the Board customarily considers in evaluating the renewals of Advisory Contracts and Sub-Advisory Contracts, including a written analysis for each Fund of how performance and fees compare to its Selected Peer Group and/or designated benchmarks; and (8) other information relevant to the Board's evaluations.
For each Fund, its Class A shares were used for purposes of certain comparisons to the funds in the Selected Peer Group. Class A shares were selected, as general matter, so that the Fund class with the longest performance history was compared to the analogous class of shares for each fund in the Selected Peer Group. The mutual funds chosen for inclusion in a Fund's Selected Peer group were selected based upon criteria designed to mirror the Fund class being compared to the Selected Peer Group.
In arriving at its conclusions with respect to the advisory arrangements with the Adviser, the Board was mindful of the "manager-of-managers" platform of the ING Funds. The Board considered the techniques that the Adviser developed, in response to the direction of the Board, to screen and perform due diligence on Sub-Advisers that are recommended to the Board to manage the Funds. The Board also noted the resources that the Adviser has committed to the Board and its Investment Review Committees to assist the Board and Committee members with their assessment of the investment performance of the Funds. This includes the appointment of a Chief Investment Risk Officer and his staff, who report directly to the Board, and who have developed attribution analyses and other metrics used by the Investment Review Committees to analyze the key factors underlying investment performance for the Funds.
The Board also noted the techniques used by the Adviser to monitor the performance of the Sub-Advisers, and took note of the pro-active approach that the Adviser, working in cooperation with the IE&FI IRC, has taken to advocate or recommend, when it believed appropriate, changes intended to assist performance of the Funds. These changes have historically included changes in the Sub-Adviser to a Fund.
187
ADVISORY CONTRACT APPROVAL DISCUSSION (UNAUDITED) (CONTINUED)
In considering the Funds' Advisory Contracts, the Board also considered the extent of benefits provided to the Funds' shareholders, beyond advisory services, from being part of the ING family of Funds. This includes, in most cases, the right to exchange or transfer investments between the same class of shares of such Funds, without a sales charge, or among Funds available in a product platform, and the wide variety in the types of Funds available for exchange or transfer. The Board also took into account the Adviser's extensive efforts in recent years to reduce the expenses of the Funds through re-negotiated arrangements with the Funds' service providers.
Further, the Board received periodic reports showing that the investment policies and restrictions for each Fund were consistently complied with and other periodic reports covering matters such as compliance by Adviser and Sub-Adviser personnel with codes of ethics. The Board evaluated the Adviser's and Sub-Advisers' regulatory compliance systems and procedures reasonably designed to assure compliance with the federal securities laws, including those related to late trading and market timing, best execution, fair value pricing, proxy voting procedures, and trade allocation, among others. The Board considered the implementation by the Adviser and certain Sub-Advisers of enhanced compliance policies and procedures in response to SEC rule changes and other regulatory initiatives. The Board also took into account the reports of the Chief Compliance Officer and his recommendations. In this regard, the Board also considered the policies and proced ures developed by the Chief Compliance Officer in consultation with the Board's Compliance Committee that guide the Chief Compliance Officer's compliance oversight function.
The Board reviewed the level of staffing, quality and experience of each Fund's portfolio management team. The Board took into account the respective resources and reputations of the Adviser and the Sub-Advisers, and evaluated the ability of the Adviser and the Sub-Advisers to attract and retain qualified investment advisory personnel. For larger Funds, the Board also considered the adequacy of the resources committed to the Funds by the Adviser and the Sub-Advisers, and whether those resources are commensurate with the needs of larger Funds and are appropriate to attempt to sustain expected levels of performance, compliance, and other needs.
Based on their deliberations and the materials presented to them, the Board concluded that the advisory and related services provided by the Adviser and Sub-Advisers are appropriate in light of the Funds' operations, the competitive landscape of the investment company business, and investor needs, and that the nature and quality of the overall services provided by the Adviser and Sub-Advisers were appropriate.
Fund Performance
In assessing advisory and sub-advisory relationships, the Board placed emphasis on the investment performance of each Fund, taking into account the importance of such performance to Fund shareholders. While the Board considered the performance reports and discussions with portfolio managers at Board and Committee meetings during the year, particular attention in assessing performance was given to the Fund FACT sheets furnished in advance of the November meeting of the Independent Trustees. The FACT sheet prepared for each Fund included its investment performance compared to the Morningstar category median, Lipper category median, Selected Peer Group and Fund's primary benchmark. The Board's findings specific to each Fund's performance are discussed under "Fund-by-Fund Analysis," below.
Economies of Scale
In considering the reasonableness of advisory fees, the Board also considered whether economies of scale will be realized by the Adviser as a Fund grows larger and the extent to which this is reflected in the level of management fee rates charged. In this regard, the Board noted any breakpoints in advisory fee schedules that resulted in a lower advisory fee because a Fund achieved sufficient asset levels to receive a breakpoint discount. In the case of sub-advisory fees, the Board considered that breakpoints would inure to the benefit of the Adviser, except to the extent that these savings are passed through in the form of breakpoints on advisory fees that resulted in savings to the Funds. For Funds that did not have breakpoint discounts on advisory fees, but did benefit from waivers to or reimbursements of advisory or other fees, the Board also considered the extent to which economies of scale could effectively be realized through such waiv ers, reimbursements, or expense reductions.
188
ADVISORY CONTRACT APPROVAL DISCUSSION (UNAUDITED) (CONTINUED)
Information about Services to Other Clients
The Board requested, and in many instances received and, if so, considered, information about the nature of services and fee rates offered by the Adviser and the Sub-Advisers to other clients, including other registered investment companies. When rates offered to other clients differed materially from those charged to the Funds, the Board considered the underlying rationale provided by the Adviser and Sub-Advisers for these differences. For the unaffiliated Sub-Advisers, the Board did not view this information as imperative to its deliberations because of the arms-length nature of the negotiations between the Adviser and unaffiliated Sub-Advisers with respect to sub-advisory fees.
Fee Rates and Profitability
The Board reviewed and considered each contractual investment advisory fee rate, combined with the administrative fee rate, payable by each Fund to the Adviser. The Board also considered the contractual sub-advisory fee rates payable by the Adviser to each Sub-Adviser for sub-advisory services. In addition, the Board reviewed and took into account existing and proposed fee waivers and expense limitations applicable to the fees payable by the Funds.
The Board considered the fee structures of the Funds as they relate to the services provided under the Contracts, and the potential fall-out benefits to the Adviser and Sub-Advisers, and their respective affiliates, from their association with the Funds. For each Fund, the Board determined that the fees payable to the Adviser and Sub-Advisers are reasonable for the services that each performs, which were considered in light of the nature and quality of the services that each has performed and is expected to perform through the year ending November 30, 2006.
For each Fund, the Board considered information on revenues, costs and profits realized by the Adviser, which was prepared by Management in accordance with the allocation methodology (including assumptions) specified in the Methodology Guide. In analyzing the profitability of the Adviser in connection with its services to a Fund, the Board took into account the sub-advisory fee rate payable by the Adviser to the Sub-Adviser to that Fund. The Board also considered information that it requested and was provided by Management with respect to the profitability of service providers affiliated with the Adviser, as well as information provided by certain Sub-Advisers with respect to their profitability. In the case of non-affiliated Sub-Advisers, the Board gave less weight to profitability considerations, or did not view this data as imperative to its deliberations, given the arms-length nature of the relationship between the Adviser and these Sub- Advisers with respect to the negotiation of sub-advisory fees.
The Board determined that it had requested and received sufficient information to gain a reasonable understanding regarding the Adviser's and affiliated Sub-Advisers' profitability. The Board also recognized that profitability analysis is not an exact science and there is no uniform methodology for determining profitability for this purpose. In this context, the Board realized that Management's calculations regarding its costs incurred in establishing the infrastructure necessary for the Funds' operations may not be fully reflected in the expenses allocated to each Fund in determining profitability, and that the information presented may not portray all of the costs borne by Management nor capture Management's entrepreneurial risk associated with offering and managing a mutual fund complex in today's regulatory environment.
In their examination of advisory fees, the Independent Trustees have, from time to time, requested the Adviser, and the Adviser has agreed, to implement remedial actions for certain Funds. These remedial actions have included, among others, reductions in fees payable by a Fund and changes to the Sub-Adviser managing a Fund. The Independent Trustees requested these adjustments largely on the basis of: (a) a Fund's performance, as compared to its Selected Peer Group; (b) the performance of a Fund, as compared to its benchmarks; or (c) a Fund's expenses in relation to its Selected Peer Group.
Based on the information on revenues, costs, and profitability considered by the Board, after considering the factors described in this section, as well as any remedial actions requested by the Independent Trustees and agreed to by the Adviser, the Board concluded that the profits, if any, realized by the Adviser and Sub-Advisers were not excessive. In making its determinations, the Board considered that the Adviser had incentive to negotiate the most favorable fees from unaffiliated Sub-Advisers, and it based its conclusions on the reasonableness of the sub-advisory fees of the Sub-Advisers primarily on the factors described for each Fund below and, in the case of
189
ADVISORY CONTRACT APPROVAL DISCUSSION (UNAUDITED) (CONTINUED)
non-affiliated Sub-Advisers, in reliance on the arms-length nature of the negotiations between the Adviser and Sub-Advisers with respect to sub-advisory fees.
Fund-by-Fund Analysis
The following paragraphs outline certain of the specific factors that the Board considered, and the conclusions reached, at its November 2005 meeting in relation to renewing each Fund's current Advisory Contract and its Sub-Advisory Contract for the year ending November 30, 2006. These specific factors are in addition to those considerations discussed above. In each case, the Fund's performance was compared to its Morningstar category median and its primary benchmark, a broad-based securities market index that appears in the Fund's prospectus. Each Fund's management fee and expense ratio were compared to the fees and expense ratios of the funds in its Selected Peer Group.
ING Global Equity Dividend Fund
In considering whether to approve the renewal of the Advisory and Sub-Advisory Contracts for ING Global Equity Dividend Fund, the Board considered that, based on performance data for the periods ended June 30, 2005: (1) the Fund outperformed its Morningstar category median and its primary benchmark for all periods presented, except it underperformed its Morningstar category median for the year-to-date period; and (2) the Fund is ranked in the third quintile for the most recent calendar quarter and the year-to-date period, and is ranked in the first (highest) quintile for the one-year period.
In considering the fees payable under the Advisory and Sub-Advisory Contracts for the Fund, the Board took into account the factors described above and also considered: (1) the fairness of the compensation under an Advisory Contract with level fees that does not include breakpoints; (2) the pricing structure (including the expense ratio to be borne by shareholders) of the Fund, as compared to its Selected Peer Group, including that: (a) the management fee (inclusive of the advisory fee and a 0.10% administration fee) for the Fund is below the median and the average management fees of the funds in its Selected Peer Group; and (b) the expense ratio for the Fund is below the median and the average expense ratios of the funds in the Selected Peer Group.
After its deliberation, the Board reached the following conclusions: (1) the Fund's management fee rate is reasonable in the context of all factors considered by the Board; (2) the Fund's expense ratio is reasonable in the context of all factors considered by the Board; (3) the Fund was launched in July 2003, and it is reasonable to permit the Sub-Adviser to continue to manage the Fund to evaluate its performance; and (4) the sub-advisory fee rate payable by the Adviser to the Sub-Adviser is reasonable in the context of all factors considered by the Board. Based on these conclusions and other factors, the Board voted to renew the Advisory and Sub-Advisory Contracts for the Fund for the year ending November 30, 2006. During this renewal process, different Board members may have given different weight to different individual factors and related conclusions.
ING Global Natural Resources Fund (formerly, ING Precious Metals Fund)
In considering whether to approve the renewal of the Advisory and Sub-Advisory Contracts for ING Global Natural Resources Fund (formerly, ING Precious Metals Fund), the Board considered that, based on performance data for the periods ended June 30, 2005: (1) the Fund underperformed its Morningstar category median for the year-to-date, one-, three- and five-year periods, but outperformed for the most recent calendar quarter; (2) the Fund underperformed its broad-based, primary benchmark for the one-year period but outperformed for the most recent calendar quarter, three- and five-year periods; (3) the Fund outperformed its style-specific benchmark for the year-to-date, three-, five- and ten-year periods; and (4) the Fund is ranked in the fourth quintile for the one- and three-year periods and in the third quintile for all other periods presented. In analyzing this performance data, the Board took into account: (1) Management's analysis regard ing the Sub-Adviser's rationale for underperformance in certain periods; and (2) actions that the Fund's Sub-Adviser had taken to improve the Fund's performance.
In considering the fees payable under the Advisory and Sub-Advisory Contracts for ING Precious Metals Fund, the Board took into account the factors described above and also considered: (1) the economies of scale benefits to the Fund and its shareholders from breakpoint discounts applicable to the Fund's advisory fee, which result in lower fees at higher asset levels; and (2) the pricing structure (including the expense ratio to be borne by shareholders) of ING Global Natural Resources Fund (formerly, ING Precious Metals Fund), as compared to its
190
ADVISORY CONTRACT APPROVAL DISCUSSION (UNAUDITED) (CONTINUED)
Selected Peer Group, including that: (a) the management fee (inclusive of the advisory fee and a 0.10% administration fee) for the Fund is above the median and the average management fees of the funds in its Selected Peer Group; and (b) the expense ratio for the Fund is below the median and the average expense ratios of the funds in its Selected Peer Group.
After its deliberation, the Board reached the following conclusions: (1) the Fund's management fee rate is reasonable in the context of all factors considered by the Board; (2) the Fund's expense ratio is reasonable in the context of all factors considered by the Board; (3) the Sub-Adviser recently made internal changes to address the Fund's relative underperformance, and the Sub-Adviser should be allowed a reasonable period of time to manage the Fund in order to properly evaluate performance to assess whether it improves as a result of the changes that have been implemented; and (4) the sub-advisory fee rate payable by the Adviser to the Sub-Adviser is reasonable in the context of all factors considered by the Board. Based on these conclusions and other factors, the Board voted to renew the Advisory and Sub-Advisory Contracts for the Fund for the year ending November 30, 2006. During this renewal process, different Board members may have gi ven different weight to different individual factors and related conclusions.
ING Global Real Estate Fund
In considering whether to approve the renewal of the Advisory and Sub-Advisory Contracts for ING Global Real Estate Fund, the Board considered that, based on performance data for the periods ended June 30, 2005: (1) the Fund underperformed its Morningstar category median for all periods except the three-year period; (2) the Fund underperformed its primary benchmark for the year-to-date and one-year periods, but outperformed for the most recent calendar quarter and the three-year period; and (3) the Fund is ranked in the fifth (lowest) quintile for the most recent calendar quarter and year-to-date period, in the fourth quintile for the one-year period, and in the first (highest) quintile for the three-year period.
In considering the fees payable under the Advisory and Sub-Advisory Contracts for ING Global Real Estate Fund, the Board took into account the factors described above and also considered: (1) the fairness of the compensation under an Advisory Contract with a breakpoint fee schedule where the asset level necessary to achieve a breakpoint discount had not been reached by the Fund; and (2) the pricing structure (including the expense ratio to be borne by shareholders) of ING Global Real Estate Fund, as compared to its Selected Peer Group, including that: (a) the management fee (inclusive of the advisory fee and a 0.10% administration fee) for the Fund is above the median and the average management fees of the funds in its Selected Peer Group; and (b) the expense ratio for the Fund is above the median and the average expense ratios of the funds in its Selected Peer Group.
After its deliberation, the Board reached the following conclusions: (1) the Fund's management fee rate is reasonable in the context of all factors considered by the Board; (2) the Fund's expense ratio is reasonable in the context of all factors considered by the Board; (3) the Fund's performance is reasonable in the context of all factors considered by the Board; and (4) the sub-advisory fee rate payable by the Adviser to the Sub-Adviser is reasonable in the context of all factors considered by the Board. Based on these conclusions and other factors, the Board voted to renew the Advisory and Sub-Advisory Contracts for the Fund for the year ending November 30, 2006. During this renewal process, different Board members may have given different weight to different individual factors and related conclusions.
ING Global Value Choice Fund
Annual Renewal of Advisory and Sub-Advisory Contracts
In considering whether to approve the renewal of the Advisory and Sub-Advisory Contracts for ING Global Value Choice Fund, the Board considered that, based on performance data for the periods ended June 30, 2005: (1) the Fund outperformed its Morningstar category median and its primary benchmark for the most recent calendar quarter; (2) the Fund underperformed the Morningstar category median and primary benchmark for the one-, three-, and five-year periods; and (3) the Fund was ranked in the second quintile for the most recent calendar quarter and year-to-date periods, the fourth quintile for the one-year period and the fifth (lowest) quintile for the three, and five-year periods ended June 30, 2005.
191
ADVISORY CONTRACT APPROVAL DISCUSSION (UNAUDITED) (CONTINUED)
In analyzing this performance data, the Board took into account that, to address concerns about long-term performance, in February 2005 NWQ Investment Management ("NWQ") assumed responsibility for the day-to-day management of the Fund, replacing another firm, and that, since the change in Sub-Adviser, the Fund has outperformed its primary benchmark and Morningstar category median.
In considering the fees payable under the Advisory and Sub-Advisory Contracts for ING Global Value Choice Fund, the Board took into account the factors described above and also considered: (1) the fairness of the compensation under an Advisory Contract with a breakpoint fee schedule where the asset level necessary to achieve a breakpoint discount had not been reached by the Fund; (2) the pricing structure (including the expense ratio to be borne by shareholders) of ING Global Value Choice Fund, as compared to its Selected Peer Group, including that: (a) the management fee (inclusive of the advisory fee and a 0.10% administration fee) for the Fund is above the median and the average management fees of the funds in its Selected Peer Group; (b) the expense ratio for the Fund is above the median and the average expense ratios of the funds in its Selected Peer Group; and (3) a sub-advisory fee rate that was sufficient to engage NWQ, a firm that w as recommended by the Adviser for its expertise in global investment management.
After its deliberation, the Board reached the following conclusions: (1) the Fund's management fee rate is reasonable in the context of all factors considered by the Board; (2) the Fund's expense ratio is reasonable in the context of all factors considered by the Board; (3) NWQ, which became the Fund's Sub-Adviser in February 2005, should be allowed a reasonable period of time to manage the Fund to assess the Fund's performance; and (4) the sub-advisory fee rate payable by the Adviser to the Sub-Adviser is reasonable in the context of all factors considered by the Board. Based on these conclusions and other factors, the Board voted to renew the Advisory and Sub-Advisory Contracts for the Fund for the year ending November 30, 2006. During this renewal process, different Board members may have given different weight to different individual factors and related conclusions.
Sub-Advisory Agreement with Tradewinds NWQ Global Investors, LLC
As discussed above, in November 2005 the Board approved renewal of the Sub-Advisory Agreement with NWQ under which it served as Sub-Adviser to ING Global Value Choice Fund. In 2006 NWQ transferred its global advisory operations (including certain personnel and assets), as well as its rights and duties to the Fund under NWQ's sub-advisory agreement with the Adviser, to NWQ's affiliate, Tradewinds NWQ Global Investors, LLC ("Tradewinds"), as part of an internal reorganization of the operations of NWQ and its affiliates (the "Transaction"). Tradewinds became the Sub-Adviser to ING Global Value Choice Fund, effective May 25, 2006.
At meetings held on March 16, 2006 and May 25, 2006, the Board considered whether to approve, on behalf of ING Global Value Choice Fund, a new sub-advisory agreement with Tradewinds (the "New Sub-Advisory Agreement"). The Board, including a majority of the Independent Trustees, determined to appoint Tradewinds as Sub-Adviser to the Fund under the New Sub-Advisory Agreement.
In determining whether to approve the New Sub-Advisory Agreement for ING Global Value Choice Fund, the Board received and evaluated such information as it deemed necessary for an informed determination of whether the Agreement should be approved for the Fund. The materials provided to the Board in support of the sub-advisory arrangement with Tradewinds included the following: (1) Management's presentation to the Board at its March 16, 2006 meeting regarding the internal reorganization transactions under which the sub-advisory duties and obligations of NWQ were transferred to Tradewinds; (2) memoranda and related materials provided to the Board in advance of its March 16, 2006 and May 25, 2006 meetings that discuss the Transaction and Management's rationale for recommending that Tradewinds serve as Sub-Adviser to the Fund; (3) responses from Tradewinds to questions posed by K&LNG, independent legal counsel, on behalf of the Independent Tr ustees; (4) supporting documentation, including a copy of the proposed New Sub-Advisory Agreement with Tradewinds on behalf of the Fund; and (5) other information relevant to the Board's evaluation. In addition, the Board considered the information provided periodically throughout the year in presentations to the Board by the Adviser and by NWQ, as predecessor to Tradewinds, in connection with their management of Funds in the ING Funds complex, including the Fund. This information includes, among other things, detailed analysis of the Fund's performance, including attribution analysis, provided at regular Board meetings. The Board also received and evaluated the report of the IE&FI IRC, which had met with the one of the portfolio managers to the Fund on May 24, 2006, noting that this portfolio manager had provided an overview of the portfolio management resources that continue to be
192
ADVISORY CONTRACT APPROVAL DISCUSSION (UNAUDITED) (CONTINUED)
available to the Fund after the Transaction, and a new portfolio manager that was added to the Fund's investment management team.
The Board's consideration of whether to approve the New Sub-Advisory Agreement with Tradewinds took into account several factors including, but not limited to, the following: (1) the Adviser's view with respect to Tradewinds' management of the Fund, including the performance of one of the portfolio managers who historically managed the Fund as an employee of NWQ and who would continue to manage as an employee of Tradewinds; (2) the personnel, operations and investment management capabilities of Tradewinds after the completion of the Transaction; (3) Tradewinds' representations that the Transaction would not adversely affect the nature and quality of services provided to the Fund and that the Transaction was not expected to have a materially adverse effect on the ability of Tradewinds to provide those services; (4) in its capacity as successor to NWQ in the global value arena, Tradewinds' strength and reputation in the industry in managing in the global value style; (5) the nature and quality of the services to be provided by Tradewinds under the proposed New Sub-Advisory Agreement; (6) the fairness of the compensation under the proposed New Sub-Advisory Agreement in light of the services to be provided by Tradewinds as the Fund's Sub-Adviser; (7) the costs for the services to be provided by Tradewinds, taking into account that neither the sub-advisory fee payable by the Adviser to Tradewinds, nor the advisory fee payable to the Adviser by the Fund, changed as a result of the Transaction; (8) Tradewinds' operations and compliance program, including its policies and procedures intended to assure compliance with the Federal securities laws, noting that these policies and procedures were the same as those that had been in place for NWQ prior to the Transaction; (9) Tradewinds' financial condition; (10) the appropriateness of the selection of Tradewinds in light of the Fund's investment objective and investor base; and (11) Tradewinds' Code of Ethic s, presented to the Board at the May 25, 2006 meeting, and related procedures for complying with that Code.
After its deliberation, the Board reached the following conclusions: (1) Tradewinds should serve as Sub-Adviser to the Fund under the New Sub-Advisory Agreement; and (2) the sub-advisory fee rate payable by the Adviser to Tradewinds is reasonable in the context of all factors considered by the Board. Based on these conclusions and other factors, the Board voted to approve the New Sub-Advisory Agreement for ING Global Value Choice Fund. During its deliberations, different Board members may have given different weight to different individual factors and related conclusions.
ING Emerging Countries Fund
In considering whether to approve the renewal of the Advisory and Sub-Advisory Contracts for ING Emerging Countries Fund, the Board considered that, based on performance data for the periods ended June 30, 2005: (1) the Fund underperformed its Morningstar category median and its primary benchmark for all periods presented; and (2) the Fund is ranked in the fourth quintile for the one-year period and the fifth (lowest) quintile for the most recent calendar quarter, year-to-date-, three- and five-year periods. In analyzing this performance data, the Board took into account that, to address concerns about long-term performance, in March 2005, Brandes Investment Partners, L.P. ("Brandes") assumed responsibility for the day-to-day management of the Fund.
In considering the fees payable under the Advisory and Sub-Advisory Contracts for ING Emerging Countries Fund, the Board took into account the factors described above and also considered: (1) the fairness of the compensation under an Advisory Contract with level fees that does not include breakpoints; and (2) the pricing structure (including the expense ratio to be borne by shareholders) of ING Emerging Countries Fund, as compared to its Selected Peer Group, including that: (a) the management fee (inclusive of the advisory fee and a 0.10% administration fee) for the Fund is above the median and the average management fees of the funds in its Selected Peer Group; and (b) the expense ratio for the Fund is below the median and the average expense ratios of the funds in its Selected Peer Group.
After its deliberation, the Board reached the following conclusions: (1) the Fund's management fee rate is reasonable in the context of all factors considered by the Board; (2) the Fund's expense ratio is reasonable in the context of all factors considered by the Board; (3) Brandes, which became the Fund's new Sub-Adviser in March 2005, should be allowed a reasonable period of time to manage the Fund to assess the Fund's performance; and (4) the sub-advisory fee rate payable by the Adviser to the Sub-Adviser is reasonable in the context of all factors considered by the Board. Based on these conclusions and other factors, the Board voted to renew the
193
ADVISORY CONTRACT APPROVAL DISCUSSION (UNAUDITED) (CONTINUED)
Advisory and Sub-Advisory Contracts for the Fund for the year ending November 30, 2006. During this renewal process, different Board members may have given different weight to different individual factors and related conclusions.
ING Foreign Fund
In considering whether to approve the renewal of the Advisory and Sub-Advisory Contracts for ING Foreign Fund, the Board considered that, based on performance data for the periods ended June 30, 2005: (1) the Fund underperformed its Morningstar category median and its primary benchmark for the most recent calendar quarter and year-to-date period, but outperformed for the one-year period; and (2) the Fund is ranked in the first (highest) quintile for the one-year period.
In considering the fees payable under the Advisory and Sub-Advisory Contracts for the Fund, the Board took into account the factors described above and also considered: (1) the fairness of the compensation under an Advisory Contract with a breakpoint fee schedule where the asset level necessary to achieve a breakpoint discount had not been reached by the Fund; (2) the pricing structure (including the expense ratio to be borne by shareholders) of the Fund, as compared to its Selected Peer Group, including that: (a) the management fee (inclusive of the advisory fee and a 0.10% administration fee) for the Fund is above the median and above the average management fees of the funds in its Selected Peer Group; and (b) the expense ratio for the Fund is below the median and the average expense ratios of the funds in the Selected Peer Group.
After its deliberation, the Board reached the following conclusions: (1) the Fund's management fee rate is reasonable in the context of all factors considered by the Board; (2) the Fund's expense ratio is reasonable in the context of all factors considered by the Board; (3) the Fund was launched in September 2003, and it is reasonable to permit the Sub-Adviser to continue to manage the Fund to evaluate its performance; and (4) the sub-advisory fee rate payable by the Adviser to the Sub-Adviser is reasonable in the context of all factors considered by the Board. Based on these conclusions and other factors, the Board voted to renew the Advisory and Sub-Advisory Contracts for the Fund for the year ending November 30, 2006. During this renewal process, different Board members may have given different weight to different individual factors and related conclusions.
ING International Fund
In considering whether to approve the renewal of the Advisory and Sub-Advisory Contracts for ING International Fund, the Board considered that, based on performance data for the periods ended June 30, 2005: (1) the Fund underperformed its Morningstar category median and its primary benchmark for all periods presented, except it and outperformed its category median for the five-year period; and (2) the Fund is ranked in the fifth (lowest) quintile for the most recent calendar quarter, year-to-date, and one-year period, in the fourth quintile for the three-year period, and in the third quintile for the five-year period.
In analyzing this performance data, the Board took into account: (1) Management's analysis regarding the Sub-Adviser's rationale for underperformance in certain periods, including its analysis of the negative effect of stock selection on the Fund's more recent performance; and (2) the actions that the Fund's Sub-Adviser had taken to improve the Fund's performance, including: (a) upgrades in the quantitative screens and ranking models the Sub-Adviser employs in managing ING International Fund; (b) the addition to the portfolio management team of a senior Japan/Asia analyst in July 2005; and (c) access to certain global research capabilities of affiliates of the Sub-Adviser that are intended to enhance fundamental analysis relevant to the Fund.
In considering the fees payable under the Advisory and Sub-Advisory Contracts for ING International Fund, the Board took into account the factors described above and also considered: (1) the fairness of the compensation under an Advisory Contract with level fees that does not include breakpoints; and (2) the pricing structure (including the expense ratio to be borne by shareholders) of ING International Fund, as compared to its Selected Peer Group, including that: (a) the management fee (inclusive of the advisory fee and a 0.10% administration fee) for the Fund is above the median and the average management fees of the funds in its Selected Peer Group; and (b) the expense ratio for the Fund is below the median and the average expense ratios of the funds in its Selected Peer Group.
194
ADVISORY CONTRACT APPROVAL DISCUSSION (UNAUDITED) (CONTINUED)
After its deliberation, the Board reached the following conclusions: (1) the Fund's management fee is reasonable in the context of all factors considered by the Board; (2) the Fund's expense ratio is reasonable in the context of all factors considered by the Board; (3) it is reasonable to permit the Sub-Adviser to continue to manage the Fund to meet Management's expectation of more favorable longer-term performance; and (4) the sub-advisory fee rate payable by the Adviser to the Sub-Adviser is reasonable in the context of all factors considered by the Board. Based on these conclusions and other factors, the Board voted to renew the Advisory and Sub-Advisory Contracts for the Fund for the year ending November 30, 2006. During this renewal process, different Board members may have given different weight to different individual factors and related conclusions.
ING International SmallCap Fund
In considering whether to approve the renewal of the Advisory and Sub-Advisory Contracts for ING International SmallCap Fund, the Board considered that, based on performance data for the periods ended June 30, 2005: (1) the Fund outperformed its Morningstar category median and its primary benchmark for the most recent calendar quarter and ten-year periods, but underperformed for all other periods presented; and (2) the Fund is ranked in the fifth (lowest) quintile for the three- and five-year periods, in the third quintile for the year-to-date and one-year periods, in the second quintile for the most recent calendar quarter, and in the first (highest) quintile for the ten-year period. In analyzing this performance data, the Board took into account that, to address concerns about longer-term performance, in February 2005, Acadian Asset Management, Inc. ("Acadian") assumed responsibility for the day-to-day management of the Fund.
In considering the fees payable under the Advisory and Sub-Advisory Contracts for ING International SmallCap Fund, the Board took into account the factors described above and also considered: (1) the fairness of the compensation under an Advisory Contract with a breakpoint fee schedule where the asset level necessary to achieve a breakpoint discount had not been reached by the Fund; and (2) the pricing structure (including the expense ratio to be borne by shareholders) of ING International SmallCap Fund, as compared to its Selected Peer Group, including that: (a) the management fee (inclusive of the advisory fee and a 0.10% administration fee) for the Fund is above the median and the average management fees of the funds in its Selected Peer Group; and (b) the expense ratio for the Fund is equal to the median and above the average expense ratios of the funds in its Selected Peer Group.
After its deliberation, the Board reached the following conclusions: (1) the Fund's management fee rate is reasonable in the context of all factors considered by the Board; (2) the Fund's expense ratio is reasonable in the context of all factors considered by the Board; (3) Acadian, which became the Fund's new portfolio manager in March 2005, should be allowed a reasonable period of time to manage the Fund for the Board to assess Fund performance; and (4) the sub-advisory fee rate payable by the Adviser to the Sub-Adviser is reasonable in the context of all factors considered by the Board. Based on these conclusions and other factors, the Board voted to renew the Advisory and Sub-Advisory Contracts for the Fund for the year ending November 30, 2006. During this renewal process, different Board members may have given different weight to different individual factors and related conclusions.
ING International Value Fund
In considering whether to approve the renewal of the Advisory and Sub-Advisory Contracts for ING International Value Fund, the Board considered that, based on performance data for the periods ended June 30, 2005: (1) the Fund underperformed its primary benchmark for the most recent calendar quarter, year-to-date and one-year periods, but outperformed for the three- and five-year periods; (2) the Fund underperformed its Morningstar category median for the most recent calendar quarter, year-to-date, one- and five-year periods, but outperformed for the three-year period; and (3) the Fund is ranked in the third quintile for the three- and five-year periods, and in the fifth (lowest) quintile for the most recent calendar quarter, year-to-date and one-year periods.
In analyzing this performance data, the Board took into account: (1) Management's analysis regarding the Sub-Adviser's rationale for underperformance in certain periods, including its analysis of the negative effect of sector weightings on the Fund's more recent performance; (2) Management's representations that the Sub-Adviser's investment philosophy, applied over longer, 3 to 5 year periods, had historically resulted in reasonable performance, particularly when the market favors the under-valued securities in which the Fund invests; and
195
ADVISORY CONTRACT APPROVAL DISCUSSION (UNAUDITED) (CONTINUED)
(3) Management's view that the Sub-Adviser is a well-recognized and reputable manager that has remained true to the investment philosophy and style for which it was hired, and Management's expectation that the Sub-Adviser will deliver reasonable longer-term performance.
In considering the fees payable under the Advisory and Sub-Advisory Contracts for ING International Value Fund, the Board took into account the factors described above and also considered: (1) the fairness of the compensation under an Advisory Contract with level fees that does not include breakpoints; (2) the pricing structure (including the expense ratio to be borne by shareholders) of ING International Value Fund, as compared to its Selected Peer Group, including that: (a) the management fee (inclusive of the advisory fee and a 0.10% administration fee) for the Fund is above the median and the average management fees of the funds in its Selected Peer Group; and (b) the expense ratio for the Fund is above the median and the average expense ratios of the funds in its Selected Peer Group.
After its deliberation, the Board reached the following conclusions: (1) the Fund's management fee is reasonable in the context of all factors considered by the Board; (2) the Fund's expense ratio is reasonable in the context of all factors considered by the Board; (3) the Sub-Adviser should be allowed to continue to manage the Fund to meet Management's expectation of more favorable longer-term performance; and (4) the sub-advisory fee rate payable by the Adviser to the Sub-Adviser is reasonable in the context of all factors considered by the Board. Based on these conclusions and other factors, the Board voted to renew the Advisory and Sub-Advisory Contracts for the Fund for the year ending November 30, 2006. During this renewal process, different Board members may have given different weight to different individual factors and related conclusions.
ING Russia Fund
In considering whether to approve the renewal of the Advisory and Sub-Advisory Contracts for ING Russia Fund, the Board considered that, based on performance data for the periods ended June 30, 2005: (1) the Fund outperformed its Morningstar category median for all periods presented; (2) the Fund underperformed its primary benchmark for the most recent calendar quarter and one-year period, but outperformed for the year-to-date, three- and five-year periods; and (3) the Fund is ranked in the third quintile for the one-year period and in the first (highest) quintile for all remaining periods.
In considering the fees payable under the Advisory and Sub-Advisory Contracts for the Fund, the Board took into account the factors described above and also considered: (1) the fairness of the compensation under an Advisory Contract with level fees that does not include breakpoints; (2) the pricing structure (including the expense ratio to be borne by shareholders) of the Fund, as compared to its Selected Peer Group, including that: (a) the management fee (inclusive of the advisory fee and a 0.10% administration fee) for the Fund is above the median and the average management fees of the funds in its Selected Peer Group; and (b) the expense ratio for the Fund is below the median and the average expense ratios of the funds in its Selected Peer Group.
After its deliberation, the Board reached the following conclusions: (1) the Fund's management fee rate is reasonable in the context of all factors considered by the Board; (2) the Fund's expense ratio is reasonable in the context of all factors considered by the Board; (3) the Fund's performance is reasonable in the context of all factors considered by the Board; and (4) the sub-advisory fee rate payable by the Adviser to the Sub-Adviser is reasonable in the context of all factors considered by the Board. Based on these conclusions and other factors, the Board voted to renew the Advisory and Sub-Advisory Contracts for the Fund for the year ending November 30, 2006. During this renewal process, different Board members may have given different weight to different individual factors and related conclusions.
196
(THIS PAGE INTENTIONALLY LEFT BLANK)
(THIS PAGE INTENTIONALLY LEFT BLANK)
ING Funds Distributor, LLC offers the funds listed below. Before investing in a fund, shareholders should carefully review the fund's prospectus. Investors may obtain a copy of a prospectus of any ING Fund by calling (800) 992-0180 or by going to www.ingfunds.com.
Domestic Equity and Income Funds
ING Balanced Fund
ING Growth and Income Fund
ING Real Estate Fund
Domestic Equity Growth Funds
ING 130/30 Fundamental Research Fund
ING Disciplined LargeCap Fund
ING Fundamental Research Fund
ING Growth Fund
ING LargeCap Growth Fund
ING MidCap Opportunities Fund
ING Opportunistic LargeCap Fund
ING SmallCap Opportunities Fund
ING Small Company Fund
Domestic Equity Index Funds
ING Index Plus LargeCap Fund
ING Index Plus MidCap Fund
ING Index Plus SmallCap Fund
Domestic Equity Value Funds
ING Financial Services Fund
ING LargeCap Value Fund
ING MagnaCap Fund
ING MidCap Value Fund
ING SmallCap Value Fund
ING SmallCap Value Choice Fund
ING Value Choice Fund
Fixed Income Funds
ING GNMA Income Fund
ING High Yield Bond Fund
ING Intermediate Bond Fund
ING National Tax-Exempt Bond Fund
Global Equity Funds
ING Global Equity Dividend Fund
ING Global Natural Resources Fund
ING Global Real Estate Fund
ING Global Science and Technology Fund
ING Global Value Choice Fund
International Equity Funds
ING Emerging Countries Fund
ING Foreign Fund
ING Greater China Fund
ING Index Plus International Equity Fund
ING International Fund
ING International Capital Appreciation Fund
ING International Growth Fund
ING International Real Estate
ING International SmallCap Fund
ING International Value Fund
ING International Value Choice Fund
ING Russia Fund
Global and International Fixed-Income Funds
ING Emerging Markets Fixed Income Fund
ING Global Bond Fund
International Fund-of-Funds
ING Diversified International Fund
Loan Participation Fund
ING Senior Income Fund
Money Market Funds*
ING Aeltus Money Market Fund
ING Classic Money Market Fund
Strategic Allocation Funds
ING Strategic Allocation Conservative Fund
ING Strategic Allocation Growth Fund
ING Strategic Allocation Moderate Fund
* An investment in the Funds are not insured or guaranteed by the Federal Deposit Insurance Corporation or any other government agency. Although the Funds seek to preserve the value of your investment at $1.00 per share, it is possible to lose money by investing in the Funds.
Investment Adviser
ING Investments, LLC
7337 East Doubletree Ranch Road
Scottsdale, Arizona 85258
Administrator
ING Funds Services, LLC
7337 East Doubletree Ranch Road
Scottsdale, Arizona 85258
Distributor
ING Funds Distributor, LLC
7337 East Doubletree Ranch Road
Scottsdale, Arizona 85258
1-800-334-3444
Transfer Agent
DST Systems, Inc.
P.O. Box 419368
Kansas City, Missouri 64141
Independent Registered Public
Accounting Firm
KPMG LLP
99 High Street
Boston, Massachusetts 02110
Custodian
The Bank of New York
One Wall Street
New York, New York 10286
Legal Counsel
Dechert
1775 I Street, N.W.
Washington, D.C. 20006
For more complete information, or to obtain a prospectus on any ING fund, please call your Investment Professional or ING Funds Distributor, LLC at (800) 992-0180 or log on to www.ingfunds.com. The prospectus should be read carefully before investing. Consider the fund's investment objectives, risks, charges and expenses carefully before investing. The prospectus contains this information and other information about the fund.

PRAR-UINTABCIMQ (1006-122706)
Item 2. Code of Ethics.
As of the end of the period covered by this report, Registrant had adopted a code of ethics, as defined in Item 2 of Form N-CSR, that applies to the Registrant’s principal executive officer and principal financial officer. There were no amendments to the Code during the period covered by the report. The Registrant did not grant any waivers, including implicit waivers, from any provisions of the Code during the period covered by this report. The code of ethics is filed herewith pursuant to Item 10(a)(1), Exhibit 99.CODE ETH.
Item 3. Audit Committee Financial Expert.
The Board of Trustees has determined that Patrick W. Kenny is an audit committee financial expert, as defined in Item 3 of Form N-CSR. Mr. Kenny is “independent” for purposes of Item 3 of Form N-CSR.
Item 4. Principal Accountant Fees and Services.
(a) Audit Fees: The aggregate fees billed for each of the last two fiscal years for professional services rendered by KPMG LLP (“KPMG”), the principal accountant for the audit of the registrant’s annual financial statements, for services that are normally provided by the accountant in connection with statutory and regulatory filings or engagements for those fiscal years were $201,711 for year ended October 31, 2006 and $125,478 for year ended October 31, 2005.
(b) Audit-Related Fees: The aggregate fees billed in each of the last two fiscal years for assurance and related services by KPMG that are reasonably related to the performance of the audit of the registrant’s financial statements and are not reported under paragraph (a) of this Item.
None
(c) Tax Fees: The aggregate fees billed in each of the last two fiscal years for professional services rendered by KPMG for tax compliance, tax advice, and tax planning were $5,010 in the year ended October 31, 2006 and $882 in the year ended October 31, 2005. Such services included review of excise distribution calculations (if applicable), preparation of the Funds’ federal, state and excise tax returns, tax services related to mergers and routine consulting.
None
(d) All Other Fees: The aggregate fees billed in each of the last two fiscal years for products and services provided by KPMG, other than the services reported in paragraphs (a) through (c) of this Item.
None
(e) (1) Audit Committee Pre-Approval Policies and Procedures
2
FORM OF
AUDIT AND NON-AUDIT SERVICES
PRE-APPROVAL POLICY
I. Statement of Principles
Under the Sarbanes-Oxley Act of 2002 (the “Act”), the Audit Committee of the Board of Directors or Trustees (the “Committee”) of the ING Funds (each a “Fund,” collectively, the “Funds”) set out on Exhibit A to this Audit and Non-Audit Services Pre-Approval Policy (“Policy”) is responsible for the oversight of the work of the Funds’ independent auditors. As part of its responsibilities, the Committee must pre-approve the audit and non-audit services performed by the auditors in order to assure that the provision of these services does not impair the auditors’ independence from the Funds. The Committee has adopted, and the Board has ratified, this Policy, which sets out the procedures and conditions under which the services of the independent auditors may be pre-approved.
Under Securities and Exchange Commission (“SEC”) rules promulgated in accordance with the Act, the Funds may establish two different approaches to pre-approving audit and non-audit services. The Committee may approve services without consideration of specific case-by-case services (“general pre-approval”) or it may pre-approve specific services (“specific pre-approval”). The Committee believes that the combination of these approaches contemplated in this Policy results in an effective and efficient method for pre-approving audit and non-audit services to be performed by the Funds’ independent auditors. Under this Policy, services that are not of a type that may receive general pre-approval require specific pre-approval by the Committee. Any proposed services that exceed pre-approved cost levels or budgeted amounts will also require the Committee’s specific pre-approval.
For both types of approval, the Committee considers whether the subject services are consistent with the SEC’s rules on auditor independence and that such services are compatible with maintaining the auditors independence. The Committee also considers whether a particular audit firm is in the best position to provide effective and efficient services to the Funds. Reasons that the auditors are in the best position include the auditors’ familiarity with the Funds’ business, personnel, culture, accounting systems, risk profile, and other factors, and whether the services will enhance the Funds’ ability to manage and control risk or improve audit quality. Such factors will be considered as a whole, with no one factor being determinative.
The appendices attached to this Policy describe the audit, audit-related, tax-related, and other services that have the Committee’s general pre-approval. For any service that has been approved through general pre-approval, the general pre-approval will remain in place for a period 12 months from the date of pre-approval, unless the Committee determines that a different period is appropriate. The Committee will annually review and pre-approve the services that may be provided by the independent auditors without specific pre-approval. The Committee will revise the list of services subject to general pre-approval as appropriate. This Policy does not serve as a delegation to Fund management of the Committee’s duty to pre-approve services performed by the Funds’ independent auditors.
II. Audit Services
The annual audit services engagement terms and fees are subject to the Committee’s specific pre-approval. Audit services are those services that are normally provided by auditors in connection with statutory and regulatory filings or engagements or those that generally only independent auditors can reasonably provide. They include the Funds’ annual financial statement audit and procedures that the independent auditors must perform in order to form an opinion on the Funds’ financial statements (e.g., information systems and procedural reviews and testing). The Committee will monitor the audit services engagement and approve any changes in terms, conditions or fees deemed by the Committee to be necessary or appropriate.
The Committee may grant general pre-approval to other audit services, such as statutory audits and services associated with SEC registration statements, periodic reports and other documents filed with the SEC or issued in connection with securities offerings.
The Committee has pre-approved the audit services listed on Appendix A. The Committee must specifically approve all audit services not listed on Appendix A.
III. Audit-related Services
Audit-related services are assurance and related services that are reasonably related to the performance of the audit or the review of the Funds’ financial statements or are traditionally performed by the independent auditors. The Committee believes that the provision of audit-related services will not impair the independent auditors’ independence, and therefore may grant pre-approval to audit-related services. Audit-related services include accounting consultations related to accounting, financial reporting or disclosure matters not classified as “audit services;” assistance with understanding and implementing new accounting and financial reporting guidance from rulemaking authorities; agreed-upon or expanded audit procedures relating to accounting and/or billing records required to respond to or comply with financial, accounting or regulatory reporting matters; and assistance with internal control reporting requirements under Form N-SAR or Form N-CSR.
The Committee has pre-approved the audit-related services listed on Appendix B. The Committee must specifically approve all audit-related services not listed on Appendix B.
IV. Tax Services
The Committee believes the independent auditors can provide tax services to the Funds, including tax compliance, tax planning, and tax advice, without compromising the auditors’ independence. Therefore, the Committee may grant general pre-approval with respect to tax services historically provided by the Funds’ independent auditors that do not, in the Committee’s view, impair auditor independence and that are consistent with the SEC’s rules on auditor independence.
The Committee will not grant pre-approval if the independent auditors initially recommends a transaction the sole business purpose of which is tax avoidance and the tax treatment of which may not be supported in the Internal Revenue Code and related regulations. The Committee may consult
2
outside counsel to determine that tax planning and reporting positions are consistent with this Policy.
The Committee has pre-approved the tax-related services listed on Appendix C. The Committee must specifically approve all tax-related services not listed on Appendix C.
V. Other Services
The Committee believes it may grant approval of non-audit services that are permissible services for independent auditors to a Fund. The Committee has determined to grant general pre-approval to other services that it believes are routine and recurring, do not impair auditor independence, and are consistent with SEC rules on auditor independence.
The Committee has pre-approved the non-audit services listed on Appendix D. The Committee must specifically approve all non-audit services not listed on Appendix D.
A list of the SEC’s prohibited non-audit services is attached to this Policy as Appendix E. The SEC’s rules and relevant guidance should be consulted to determine the precise definitions of these impermissible services and the applicability of exceptions to certain of the SEC’s prohibitions.
VI. Pre-approval of Fee levels and Budgeted Amounts
The Committee will annually establish pre-approval fee levels or budgeted amounts for audit, audit-related, tax and non-audit services to be provided to the Funds by the independent auditors. Any proposed services exceeding these levels or amounts require the Committee’s specific pre-approval. The Committee considers fees for audit and non-audit services when deciding whether to pre-approve services. The Committee may determine, for a pre-approval period of 12 months, the appropriate ratio between the total amount of fees for the Fund’s audit, audit-related, and tax services (including fees for services provided to Fund affiliates that are subject to pre-approval), and the total amount of fees for certain permissible non-audit services for the Fund classified as other services (including any such services provided to Fund affiliates that are subject to pre-approval).
VII. Procedures
Requests or applications for services to be provided by the independent auditors will be submitted to management. If management determines that the services do not fall within those services generally pre-approved by the Committee and set out in the appendices to these procedures, management will submit the services to the Committee or its delagee. Any such submission will include a detailed description of the services to be rendered. Notwithstanding this paragraph, the Committee will, on a quarterly basis, receive from the independent auditors a list of services provided for the previous calendar quarter on a cumulative basis by the auditors during the
Pre-Approval Period.
3
VIII. Delegation
The Committee may delegate pre-approval authority to one or more of the Committee’s members. Any member or members to whom such pre-approval authority is delegated must report any pre-approval decisions, including any pre-approved services, to the Committee at its next scheduled meeting. The Committee will identify any member to whom pre-approval authority is delegated in writing. The member will retain such authority for a period of 12 months from the date of pre-approval unless the Committee determines that a different period is appropriate. The period of delegated authority may be terminated by the Committee or at the option of the member.
IX. Additional Requirements
The Committee will take any measures the Committee deems necessary or appropriate to oversee the work of the independent auditors and to assure the auditors’ independence from the Funds. This may include reviewing a formal written statement from the independent auditors delineating all relationships between the auditors and the Funds, consistent with Independence Standards Board No. 1, and discussing with the auditors their methods and procedures for ensuring independence.
Amended: November 9, 2005
4
Appendix A
Pre-Approved Audit Services for the Pre-Approval Period January 1, 2006 through December 31, 2006
Service
| | The Fund(s) | | Fee Range |
| | | | |
Statutory audits or financial audits (including tax services associated with audit services) | | x | | As presented to Audit Committee(1) |
| | | | |
Services associated with SEC registration statements, periodic reports and other documents filed with the SEC or other documents issued in connection with securities offerings (e.g., consents), and assistance in responding to SEC comment letters. | | x | | Not to exceed $9,300 per filing |
| | | | |
Consultations by Fund management with respect to accounting or disclosure treatment of transactions or events and/or the actual or potential effect of final or proposed rules, standards or interpretations by the SEC, Financial Accounting Standards Board, or other regulatory or standard setting bodies. | | x | | Not to exceed $8,000 during the Pre-Approval Period |
| | | | |
Seed capital audit and related review and issuance of consent on the N-2 registration statement | | x | | Not to exceed $12,000 per audit |
(1) For new Funds launched during the Pre-Approval Period, the fee ranges pre-approved will be the same as those for existing Funds, pro-rated in accordance with inception dates as provided in the auditors’ Proposal or any Engagement Letter covering the period at issue. Fees in the Engagement Letter will be controlling.
5
Appendix B
Pre-Approved Audit-Related Services for the Pre-Approval Period January 1, 2006 through December 31, 2006
Service
| | The Fund(s) | | Fund Affiliates | | Fee Range |
| | | | | | |
Services related to Fund mergers (Excludes tax services - See Appendix C for tax services associated with Fund mergers) | | x | | x | | Not to exceed $10,000 per merger |
| | | | | | |
Consultations by Fund management with respect to accounting or disclosure treatment of transactions or events and/or the actual or potential effect of final or proposed rules, standards or interpretations by the SEC, Financial Accounting Standards Board, or other regulatory or standard setting bodies. [Note: Under SEC rules some consultations may be “audit” services and others may be “audit-related” services.] | | x | | | | Not to exceed $5,000 per occurrence during the Pre-Approval Period |
| | | | | | |
Review of the Funds’ semi-annual financial statements | | x | | | | Not to exceed $2,100 per set of financial statements per fund |
| | | | | | |
Reports to regulatory or government agencies related to the annual engagement | | x | | | | Up to $5,000 per occurrence during the Pre-Approval Period |
| | | | | | |
Regulatory compliance assistance | | x | | x | | Not to exceed $5,000 per quarter |
| | | | | | |
Training courses | | x | | x | | Not to exceed $2,000 per course |
| | | | | | |
For Prime Rate Trust, agreed upon procedures for quarterly reports to rating agencies | | x | | | | Not to exceed $9,000 per quarter |
| | | | | | |
For Prime Rate Trust and Senior Income Fund, agreed upon procedures for the Revolving Credit and Security Agreement with Citigroup | | x | | | | Not to exceed $20,000 per fund per year |
6
Appendix C
Pre-Approved Tax Services for the Pre-Approval Period January 1, 2006 through December 31, 2006
Service
| | The Fund(s) | | Fund
Affiliates | | Fee Range |
| | | | | | |
Preparation of federal and state income tax returns and federal excise tax returns for the Funds including assistance and review with excise tax distributions | | x | | | | As presented to Audit Committee(2) |
| | | | | | |
Review of IRC Sections 851(b) and 817(h) diversification testing on a real-time basis | | x | | | | As presented to Audit Committee(2) |
| | | | | | |
Assistance and advice regarding year-end reporting for 1099’s | | x | | | | As presented to Audit Committee(2) |
| | | | | | |
Tax assistance and advice regarding statutory, regulatory or administrative developments | | x | | x | | Not to exceed $5,000 for the Funds or for the Funds’ investment adviser during the Pre-Approval Period |
(2) For new Funds launched during the Pre-Approval Period, the fee ranges pre-approved will be the same as those for existing Funds, pro-rated in accordance with inception dates as provided in the auditors’ Proposal or any Engagement Letter covering the period at issue. Fees in the Engagement Letter will be controlling.
7
Service
| | The Fund(s) | | Fund
Affiliates | | Fee Range |
| | | | | | |
Tax training courses | | x | | x | | Not to exceed $2,000 per course during the Pre-Approval Period |
| | | | | | |
Tax services associated with Fund mergers | | x | | x | | Not to exceed $4,000 per fund per merger during the Pre-Approval Period |
| | | | | | |
Loan Staff Services | | | | x | | Not to exceed $15,000 during the Pre-Approval Period |
| | | | | | |
Other tax-related assistance and consultation, including, without limitation, assistance in evaluating derivative financial instruments and international tax issues, qualification and distribution issues, and similar routine tax consultations. | | x | | | | Not to exceed $120,000 during the Pre-Approval Period |
8
Appendix D
Pre-Approved Other Services for the Pre-Approval Period January 1, 2006 through December 31, 2006
Service
| | The Fund(s) | | Fund Affiliates | | Fee Range |
| | | | | | |
Agreed-upon procedures for Class B share 12b-1 programs | | | | x | | Not to exceed $50,000 during the Pre-Approval Period |
| | | | | | |
Security counts performed pursuant to Rule 17f-2 of the 1940 Act (i.e., counts for Funds holding securities with affiliated sub-custodians) | | x | | | | Not to exceed $5,000 per Fund during the Pre-Approval Period |
| | | | | | |
Agreed upon procedures for 15 (c) FACT Books | | x | | | | Not to exceed $35,000 during the Pre-Approval Period |
9
Appendix E
Prohibited Non-Audit Services
Dated: January 1, 2006
• Bookkeeping or other services related to the accounting records or financial statements of the Funds
• Financial information systems design and implementation
• Appraisal or valuation services, fairness opinions, or contribution-in-kind reports
• Actuarial services
• Internal audit outsourcing services
• Management functions
• Human resources
• Broker-dealer, investment adviser, or investment banking services
• Legal services
• Expert services unrelated to the audit
• Any other service that the Public Company Accounting Oversight Board determines, by regulation, is impermissible
10
EXHIBIT A
ING EQUITY TRUST
ING FUNDS TRUST
ING GLOBAL ADVANTAGE AND PREMIUM OPPORTUNITY FUND
ING GLOBAL EQUITY DIVIDEND AND PREMIUM OPPORTUNITY FUND
ING RISK MANAGED NATURAL RESOURCES FUND
ING INVESTMENT FUNDS, INC.
ING INVESTORS TRUST
ING MAYFLOWER TRUST
ING MUTUAL FUNDS
ING PARTNERS, INC.
ING PRIME RATE TRUST
ING SENIOR INCOME FUND
ING VARIABLE INSURANCE TRUST
ING VARIABLE PRODUCTS TRUST
ING VP NATURAL RESOURCES TRUST
(e) (2) Percentage of services referred to in 4(b) — (4)(d) that were approved by the audit committee
100% of the services were approved by the audit committee.
(f) Percentage of hours expended attributable to work performed by other than full time employees of KPMG if greater than 50%.
Not applicable.
(g) Non-Audit Fees: The non-audit fees billed by the registrant’s accountant for services rendered to the registrant, and rendered to the registrant’s investment adviser, and any entity controlling, controlled by, or under common control with the adviser that provides ongoing services to the registrant for each of the last two fiscal years of the registrant were $115,487 for year ended October 31, 2006 and $136,483 for year ended October 31, 2005.
(h) Principal Accountants Independence: The Registrant’s Audit committee has considered whether the provision of non-audit services that were rendered to the registrant’s investment adviser and any entity controlling, controlled by, or under common control with the investment adviser that provides ongoing services to the registrant that were not pre-approved pursuant to Rule 2-01(c)(7)(ii) of Regulation S-X is compatible with maintaining KPMG’s independence.
3
Item 5. Audit Committee of Listed Registrants.
Not applicable.
Item 6. Schedule of Investments
Schedule is included as part of the report to shareholders filed under Item 1 of this Form.
Item 7. Disclosure of Proxy Voting Policies and Procedures for Closed-End Management Investment Companies.
Not applicable.
Item 8. Portfolio Managers of Closed-End Management Investment Companies.
Not applicable.
Item 9. Purchases of Equity Securities by Closed-End Management Investment Company and Affiliated Purchasers
Not applicable.
Item 10. Submission of Matters to a Vote of Security Holders.
The Board has a Nominating Committee for the purpose of considering and presenting to the Board candidates it proposes for nomination to fill Independent Trustee vacancies on the Board. The Committee currently consists of all Independent Trustees of the Board (6 individuals). The Nominating Committee operates pursuant to a Charter approved by the Board. The primary purpose of the Nominating Committee is to consider and present to the Board the candidates it proposes for nomination to fill vacancies on the Board. In evaluating candidates, the Nominating Committee may consider a variety of factors, but it has not at this time set any specific minimum qualifications that must be met. Specific qualifications of candidates for Board membership will be based on the needs of the Board at the time of nomination.
The Nominating Committee is willing to consider nominations received from shareholders and shall assess shareholder nominees in the same manner as it reviews its own nominees. A shareholder nominee for director should be submitted in writing to the Fund’s Secretary. Any such shareholder nomination should include at a minimum the following information as to each individual proposed for nomination as trustee: such individual’s written consent to be named in the proxy statement as a nominee (if nominated) and to serve as a trustee (if elected), and all information relating to such individual that is required to be disclosed in the solicitation of proxies for election of trustees, or is otherwise required, in each case under applicable federal securities laws, rules and regulations.
The Secretary shall submit all nominations received in a timely manner to the Nominating Committee. To be timely, any such submission must be delivered to the Fund’s Secretary not earlier than the 90th day prior to such meeting and not later than the close of business on the later of the 60th day prior to such meeting or the 10th day following the day on which public announcement of the date of the meeting is first made, by either disclosure in a press release or in a document publicly filed by the Fund with the Securities and Exchange Commission.
Item 11. Controls and Procedures.
(a) Based on our evaluation conducted within 90 days of the filing date, hereof, the design and operation of the registrant’s disclosure controls and procedures are effective to ensure that material information relating to the registrant is made known to the certifying officers by others within the appropriate entities, particularly during the period in which Forms N-CSR are being prepared, and the registrant’s disclosure controls and procedures allow timely preparation and review of the information for the registrant’s Form N-CSR and the officer certifications of such Form N-CSR.
(b) There were no significant changes in the registrant’s internal controls that occurred during the second fiscal quarter of the period covered by this report that has materially affected, or is reasonably likely to materially affect, the registrant’s internal control over financial reporting.
Item 12. Exhibits.
(a)(1) Code of Ethics pursuant to Item 2 of Form N-CSR is filed and attached hereto as EX-99.CODE ETH.
(a)(2) A separate certification for each principal executive officer and principal financial officer of the registrant as required by Rule 30a-2 under the Act (17 CFR 270.30a-2) is attached hereto as EX-99.CERT.
(b) The officer certifications required by Section 906 of the Sarbanes-Oxley Act of 2002 are attached hereto as EX-99.906CERT.
(3) Not applicable.
4
SIGNATURES
Pursuant to the requirements of the Securities Exchange Act of 1934 and the Investment Company Act of 1940, the registrant has duly caused this report to be signed on its behalf by the undersigned, thereunto duly authorized.
(Registrant): ING Mayflower Trust
By | /s/ Shaun P. Mathews |
| Shaun P. Mathews |
| President and Chief Executive Officer |
Date: January 5, 2007
Pursuant to the requirements of the Securities Exchange Act of 1934 and the Investment Company Act of 1940, this report has been signed below by the following persons on behalf of the registrant and in the capacities and on the dates indicated.
By | /s/ Shaun P. Mathews |
| Shaun P. Mathews |
| President and Chief Executive Officer |
Date: January 5, 2007
By | /s/ Todd Modic |
| Todd Modic |
| Senior Vice President and Chief Financial Officer |
Date: January 5, 2007
5