OMB APPROVAL
OMB Number: 3235-0570
Expires: October 31, 2006
Estimated average burden hours per response: 19.3
UNITED STATES
SECURITIES AND EXCHANGE COMMISSION
Washington, D.C. 20549
FORM N-CSR
CERTIFIED SHAREHOLDER REPORT OF
REGISTERED MANAGEMENT INVESTMENT COMPANIES
Investment Company Act file number: 811-7978
ING Mayflower Trust
(Exact name of registrant as specified in charter)
7337 E. Doubletree Ranch Rd., Scottsdale, AZ | | 85258 |
(Address of principal executive offices) | | (Zip code) |
CT Corporation System, 101 Federal Street, Boston, MA 02110
(Name and address of agent for service)
Registrant’s telephone number, including area code: 1-800-992-0180
Date of fiscal year end: | October 31 |
| |
Date of reporting period: | November 1, 2004 to October 31, 2005 |
Item 1. Reports to Stockholders.
The following is a copy of the report transmitted to stockholders pursuant to Rule 30e-1 under the Act (17 CFR 270.30e-1):

| Funds |
| Annual Report |
| |
| October 31, 2005 |
| |
| Classes A, B, C and M |
| |
| |
| Global Equity Funds |
| |
| § ING Global Equity Dividend Fund |
| § ING Global Real Estate Fund |
| § ING Global Value Choice Fund |
| |
| International Equity Funds |
| |
| § ING Emerging Countries Fund |
| § ING Foreign Fund |
| § ING International Fund |
| § ING International SmallCap Fund |
| § ING International Value Fund |
| § ING International Value Choice Fund |
| § ING Precious Metals Fund |
| § ING Russia Fund |
 E-Delivery Sign-up – details inside E-Delivery Sign-up – details inside
|
This report is submitted for general information to shareholders of the ING Funds. It is not authorized for distribution to prospective shareholders unless accompanied or preceded by a prospectus which includes details regarding the funds’ investment objectives, risks, charges, expenses and other information. This information should be read carefully. | 
|
TABLE OF CONTENTS
| President’s Letter | 1 | |
| | | |
| Market Perspective | 2 | |
| | | |
| Portfolio Managers’ Reports | 4 | |
| | | |
| Shareholder Expense Examples | 26 | |
| | | |
| Report of Independent Registered Public Accounting Firm | 30 | |
| | | |
| Statements of Assets and Liabilities | 31 | |
| | | |
| Statements of Operations | 37 | |
| | | |
| Statements of Changes in Net Assets | 40 | |
| | | |
| Financial Highlights | 45 | |
| | | |
| Notes to Financial Statements | 61 | |
| | | |
| Portfolios of Investments | 79 | |
| | | |
| Shareholder Meeting Information | 108 | |
| | | |
| Tax Information | 110 | |
| | | |
| Trustee and Officer Information | 111 | |
| | | |
| Advisory Contract Approval Discussion | 115 | |
| | | | | | |
| |
| Go Paperless with E-Delivery! |
| | |
| | Sign up now for on-line prospectuses, fund reports, and proxy statements. In less than five minutes, you can help reduce paper mail and lower fund costs. | | |
| | | | |
| | Just go to www.ingfunds.com, click on the E-Delivery icon from the home page, follow the directions and complete the quick 5 Steps to Enroll. | | |
| | | | |
| | You will be notified by e-mail when these communications become available on the internet. Documents that are not available on the internet will continue to be sent by mail. | | |
| | | | | | |
(THIS PAGE INTENTIONALLY LEFT BLANK)

| Dear Shareholder, |
|
We are in the midst of an exciting time here at ING Funds. We began the year by introducing the ING Global Equity Dividend and Premium Opportunity Fund that gave investors an opportunity to invest in global companies with a history of attractive dividend yields. |
|
When the Fund’s initial offering period closed, it proved to be one of the five largest unleveraged closed-end funds in history. |
|
The success of the Fund offering illustrates what ING Funds is really all about: fresh thinking in financial services. The Fund’s offering success also confirmed something else that we have long believed; namely, that investors are excited about opportunities beyond our shores. |
|
As globalization grows, investment opportunities grow as well. In 1970, only about one-third of equity market capitalization was located abroad; by 2004, that number had jumped to 50 percent(1). It is often said that the world is becoming ever more complicated. This is undoubtedly true in the world of investments where the range of asset classes and investment techniques has never been wider. To take advantage of the opportunities that are now available, it is essential to seek investment partners who have the required breadth and depth of experience — on a global basis. |
|
Our goal at ING Funds is to deliver innovative investment products that help you, the investor, to achieve your financial dreams. We have also long been committed to uncovering opportunities worldwide. |
|
We will continue to bring you opportunities — wherever they occur. With access to more than 700 ING investment management professionals who are located around the world and who, in our consideration, deliver exceptional insight into markets in Europe, the Americas and the Asia-Pacific region, we believe we are in a unique position to help you take advantage of the opportunities that the world has to offer. |
|
On behalf of everyone here at ING Funds, I thank you for your continued support and loyalty. We look forward to serving you in the future. |
Sincerely,

James M. Hennessy
President
ING Funds
December 5, 2005
The views expressed in the President’s Letter reflect those of the President as of the date of the letter. Any such views are subject to change at any time based upon market or other conditions and ING Funds disclaims any responsibility to update such views. These views may not be relied on as investment advice and because investment decisions for an ING Fund are based on numerous factors, may not be relied on as an indication of investment intent on behalf of any ING Fund. Reference to specific company securities should not be construed as recommendations or investment advice.
International investing does pose special risks including currency fluctuation, economic and political risks not found in investments that are solely domestic.
(1) Morgan Stanley Capital International
1
MARKET PERSPECTIVE: YEAR ENDED OCTOBER 31, 2005
Investors in global equities gained 7.2% in the second half of our 12-month review period (13.3% for the twelve months as a whole), after 5.7% in the first half, according to the Morgan Stanley Capital International (“MSCI”) World Index(1) in dollars, including net reinvested dividends. Little of the 7.2% however, was made after July 2005, with July 2005 being the best month since 2003. In currencies, the dollar built on early strength in 2004, reflecting faster U.S. growth and rising short-term interest rates. The euro was further buffeted by the defeat of a proposal for a European constitution, acrimonious stalemate on a European budget and German electoral indecision. For the second six months the U.S. dollar rose 7.4% (6.7% for the twelve months as a whole), against the euro 7.8% (3.8% for the twelve months as a whole), against the pound and 11.1% (10.0% for the twelve months as a whole), against the oil price sensitive yen.
Trends in investment grade U.S. fixed income securities had been dominated since the middle of 2004 by the flattening of the U.S. Treasury yield curve as ten-year U.S. Treasury yields fell, even as the Federal Open Market Committee (“FOMC”) raised short-term interest rates seven times to the end of March 2005. The curve-flattening trend was further sustained by three more increases in May 2005, June 2005 and August 2005. August 2005 ended with second quarter gross domestic product (“GDP”) growth being revised down and a final new record oil price of almost $70 a barrel as Hurricane Katrina’s devastation became known. But any hopes that the FOMC might now relent vanished in September 2005 when factory prices were reported to have risen by the most in decades. The FOMC duly struck for the 11th time. Inflationary clouds continued to gather in October 2005, pulling both short- and long-term rates higher. For the half-year, the yield on the ten-year U.S. Treasury Note rose by 36 basis points to 4.56% (53 basis points for the twelve months as a whole), while that on 13-week U.S Treasury Bills rose 99 basis points, to 3.88% (198 basis points for the twelve months as a whole). The return on the broader Lehman Aggregate Bond Index(2) was 0.15% for the six months.
The U.S. equities market in the form of the Standard & Poor’s 500 Composite Stock Price (“S&P 500”) Index(3), gained 5.00%, including dividends in the six months through October 2005 (8.72% for the twelve months as a whole). Investors warily watched interest rates as they ultimately rose at the long end as well as the short. Falling mortgage interest rates have encouraged refinancing on a massive scale and the funds raised have tended not to stay long in the wallets of American consumers, keeping expansion strong. Still, stocks benefited from July 2005’s positive economic data, especially robust second quarter company earnings figures. The S&P 500 Index reached its best level, a four-year high on August 3, 2005, but then fell back. Little headway was made after Hurricane Katrina and Hurricane Rita. High prices at the gas pump were already here and an expensive winter for heating fuel was expected. Continual and pervasive reports of sharply rising prices persisted through October, and with consumer confidence slumping, stocks pulled back. However, in the last two days of October 2005, stocks slashed their losses amid reports that evidenced recovery from the Hurricanes. Perhaps we could look forward to a year-end rally after all.
Japan equities soared 16.6%, based on the MSCI Japan Index(4) (“Index”) in dollars plus net dividends, for the six months ended October 31, 2005 (22.3% for the twelve months as a whole). The Index actually rose a remarkable 29.3% in yen, which weakened as money increasingly abandoned low yielding yen-denominated securities in favor of ever-higher dollar interest rates. The market did little until August 2005, but thereafter, a new sense of optimism took hold, based on an encouraging improvement in domestic demand suggesting a return to a balanced economy after years of export dependency. In addition, it was the prospect of a new reformist beginning under Prime Minister Koizumi, who won a landslide election victory in support of his proposal to privatize Japan Post, the savings vehicle of choice among the Japanese public and, improbably, the world’s largest financial institution. By October 31, 2005, the Bank of Japan was even predicting a swift end to deflation, propelling local currency indices toward five-year records.
European ex UK markets added 7.5% in the six months ended October 31, 2005, according to the MSCI Europe ex UK Index(5) including net dividends (17.40% for the twelve months as a whole). Such bullish performance belied bearish economic conditions. High unemployment and restrictive employment practices continued to depress domestic demand, while European ministerial bickering and political deadlock in Germany disappointed reformers, which resulted in the depressing of the euro. Stock markets cheered the weaker currency and corporate profits held up, allowing stocks to advance in the face of record low bond yields. Markets drifted down 3.2% in October 2005 however, despite improved business
2
MARKET PERSPECTIVE: YEAR ENDED OCTOBER 31, 2005
confidence and strong purchasing managers’ reports. The loss would have been worse had a surge of merger and acquisition activity on the last day not lifted markets by approximately 2%. The problem was the combination of the highest inflation in over four years: 2.6% and increasingly tough talk from the European Central Bank, which seemed to be preparing markets for an unwelcome rate increase.
The UK market gained 3.6% in dollars in the second six months, based on the MSCI UK Index(6) including net dividends (14.2% for the twelve months as a whole). The UK’s interest rate cycle is ahead of those in other economies. The tightening to restrain over-stretched consumers and soaring real estate prices is long since complete and has taken effect. GDP growth is set to fall in 2005 to about 11/2%, the lowest since 1992. Manufacturing is in decline. The Bank of England has even started to reverse the process with one rate reduction. Nonetheless, company earnings held up and despite terrorist attacks, investors supported an inexpensive market that paid over 3% in dividends. As in Europe, UK equities slumped 3.1% in October 2005, again relieved from an even bigger loss by the late merger and acquisition action. The scope for further rate reductions seemed to evaporate as consumer price inflation was reported at a multi-year high.
(1) The MSCI World Index is an unmanaged index that measures the performance of over 1,400 securities listed on exchanges in the U.S., Europe, Canada, Australia, New Zealand and the Far East.
(2) The Lehman Brothers Aggregate Bond Index is a widely recognized, unmanaged index of publicly issued investment grade U.S. Government, mortgage-backed, asset-backed and corporate debt securities.
(3) The Standard & Poor’s 500 Composite Stock Price Index is an unmanaged index that measures the performance of securities of approximately 500 of the largest companies in the United States.
(4) The MSCI Japan Index is a free float-adjusted market capitalization index that is designed to measure developed market equity performance in Japan.
(5) The MSCI Europe ex UK Index is a free float-adjusted market capitalization index that is designed to measure developed market equity performance in Europe, excluding the UK.
(6) The MSCI UK Index is a free float-adjusted market capitalization index that is designed to measure developed market equity performance in the UK.
All indices are unmanaged and investors cannot invest directly in an index.
Past performance does not guarantee future results. The performance quoted represents past performance. Investment return and principal value of an investment will fluctuate, and shares, when redeemed, may be worth more or less than their original cost. The Funds’ performance is subject to change since the period’s end and may be lower or higher than the performance data shown. Please call (800) 992-0180 or log on to www.ingfunds.com to obtain performance data current to the most recent month end.
Market Perspective reflects the views of the Chief Investment Risk Officer only through the end of the period, and is subject to change based on market and other conditions.
3
ING Global Equity Dividend Fund | | PORTFOLIO MANAGERS’ REPORT |
The ING Global Equity Dividend Fund (the “Fund”) seeks growth of capital with dividend income as a secondary consideration through investment primarily in equity securities of dividend paying companies. The Portfolio is managed by Jorik van den Bos, Director, Global Equities, Joris Franssen and Joost de Graaf, Portfolio Managers, ING Investment Management Advisors B.V. — the Sub-Adviser.
Performance: For the year ended October 31, 2005, the Fund’s Class A shares, excluding sales charge, provided a total return of 11.45% compared to the MSCI World Index, which returned 13.82% for the same period.
Portfolio Specifics: The world financial markets have struggled to keep pace with last year’s strong performance. Markets have continued to face pressures on account of further increases in oil prices, inflation fears and a continued increase of Federal Fund rates. On the other hand, markets have been supported by lower long- term yields, low inflation, positive economic data from the U.S. and Europe and restructuring in Japan, strengthening U.S. dollar and positive earnings surprises.
Backed by rising oil prices, the energy and utilities sectors outperformed the market. The low interest rate environment continued to support the real estate sector. Cyclical sectors, such as industrials lagged as they were impacted by rising input costs. Materials performed strongly as demand and economic data out of China were strong and commodity prices have seen further increases this year. Telecoms underperformed the market on the back of concerns on growth prospects. Regionally, emerging markets performed best. Japan also outperformed as investors were positive on the country’s restructuring prospects. Europe slightly outperformed the world markets and the U.S. lagged.
The Fund benefited from its overweight positions in utilities, real estate and energy as these sectors performed strongly. The Fund also has exposure to the materials sector. The overweight position in the high dividend sectors of banks and telecoms was a drag on the performance. Banks lagged as there were concerns on margin compression as the yield curve flattened. Telecoms lagged on the lack luster prospects of future growth for the sector. However, the two sectors had very strong cash generation and dividend pay outs. The Fund’s regional allocation worked positively in our overweight positions of Emerging Markets and Europe and underweight position in the U.S. The Fund was negatively affected by the strong performance of the Japanese market, as the Fund did not have any exposure to Japan attributable to no Japanese companies satisfying the Fund’s dividend yield criteria of 3%.
Petroleo Brasilero and Altria Group were among the top performers. Petroleo Brasilero, the Brazilian oil company, performed strongly amidst rising oil prices and strong performance from emerging markets. Altria Group, the parent company of Kraft Foods and Philip Morris, performed strongly as it entered the last phase of the legal procedures that would allow the company to split its organization structure, if needed. The bottom performer was Sara Lee Corporation, a U.S. based consumer products (food, clothing and hosiery) manufacturer. Sara Lee underperformed on low growth prospects and an announcement that it would restructure its operations. The market is skeptical on the success of the Sara Lee restructuring.
Current Strategy and Outlook: We expect the global equity dividend strategy to remain successful. Investments in defensive sectors like utilities, telecommunication services, real estate and consumer staples should give the strategy downside protection. We believe these sectors are relatively inexpensive, less dependent on the economic environment and offer stable, high dividend yields. If markets fall significantly, we think that defensive sectors are likely to outperform.
If the equity markets move sideways, stock selection and the consistent, disciplined strategy are expected to add value. In this scenario, we believe that dividends will make up for an important part of the total return. In the case of a strong rally, we believe the strategy is expected to generate an absolute positive return, but less than the benchmark due to its defensive positioning.
Top Ten Industries
as of October 31, 2005
(as a percent of net assets)
Banks | | 20.6 | % |
| | | |
Telecommunications | | 9.5 | % |
| | | |
Oil and Gas | | 7.1 | % |
| | | |
Electric | | 7.4 | % |
| | | |
Agriculture | | 5.5 | % |
| | | |
Real Estate Investment Trusts | | 5.1 | % |
| | | |
Pharmaceuticals | | 3.9 | % |
| | | |
Chemicals | | 3.6 | % |
| | | |
Diversified Financial Services | | 2.6 | % |
| | | |
Gas | | 2.4 | % |
Portfolio holdings are subject to change daily.
4
Portfolio Managers’ Report | | ING Global Equity Dividend Fund |
| | |
| Average Annual Total Returns for the Periods Ended October 31, 2005 | |
| | | | | | | | | | |
| | | | | Since Inception | | Since Inception | | Since Inception | |
| | | | | of Class A | | of Class B | | of Class C | |
| | | | 1 Year | | | September 17, 2003 | | October 24, 2003 | | October 29, 2003 | |
| | | | | | | | | | |
| Including Sales Charge: | | | | | | | | | |
| Class A(1) | | 5.04 | % | | 15.22 | % | | — | | | — | | |
| Class B(2) | | 5.65 | % | | — | | | 15.68 | % | | — | | |
| Class C(3) | | 9.51 | % | | — | | | — | | | 16.26 | % | |
| Excluding Sales Charge: | | | | | | | | | | | | | |
| Class A | | 11.45 | % | | 18.47 | % | | — | | | — | | |
| Class B | | 10.65 | % | | — | | | 16.95 | % | | — | | |
| Class C | | 10.51 | % | | — | | | — | | | 16.26 | % | |
| MSCI World Index(4) | | 13.82 | % | | 16.39 | %(5) | | 16.05 | %(6) | | 16.05 | %(6) | |
| | | | | | | | | | | | | |
| | | | | | | | | | | | | | | | |
Based on a $10,000 initial investment, the graph and table above illustrate the total return of ING Global Equity Dividend Fund against the index indicated. An Index is unmanaged and has no cash in its portfolio, imposes no sales charges and incurs no operating expenses. An investor cannot invest directly in an index. The Fund’s performance is shown both with and without the imposition of sales charges.
The performance graph and table do not reflect the deduction of taxes that a shareholder will pay on Fund distributions or the redemption of Fund shares.
The performance shown may include the effect of fee waivers and/or expense reimbursements by the Investment Manager and/or other service providers, which have the effect of increasing total return. Had all fees and expenses been considered, the total returns would have been lower.
Performance data represents past performance and is no assurance of future results. Investment return and principal value of an investment in the Fund will fluctuate. Shares, when sold, may be worth more or less than their original cost. The Fund’s current performance may be lower or higher than the performance data shown. Please log on to www.ingfunds.com or call (800) 992-0180 to get performance through the most recent month end.
It is important to note that the Fund has a limited operating history. Performance over a longer period of time may be more meaningful than short-term performance.
This report contains statements that may be “forward-looking” statements. Actual results may differ materially from those projected in the “forward-looking” statements.
The views expressed in this report reflect those of the portfolio managers, only through the end of the period as stated on the cover. The portfolio managers’ views are subject to change at any time based on market and other conditions.
Fund holdings are subject to change daily.
(1) Reflects deduction of the maximum Class A sales charge of 5.75%.
(2) Reflects deduction of the Class B deferred sales charge of 5% and 3%, respectively, for the 1 year and since inception returns.
(3) Reflects deduction of the Class C deferred sales charge of 1% for the 1 year return.
(4) The MSCI World Index is an unmanaged index that measures the performance of over 1,400 securities listed on exchanges in the U.S., Europe, Canada, Australia, New Zealand and the Far East.
(5) Since inception performance for the index is shown from October 1, 2003.
(6) Since inception performance for the index is shown from November 1, 2003.
5
ING GLOBAL REAL ESTATE FUND | | Portfolio Managers’ Report |
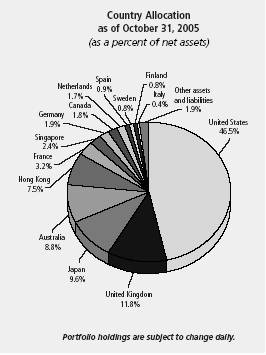
The ING Global Real Estate Fund seeks to provide investors with high total return. The Fund is managed by a team led by T. Ritson Ferguson, Chief Investment Officer, ING Clarion Real Estate Securities L.P. — the Sub-Adviser.
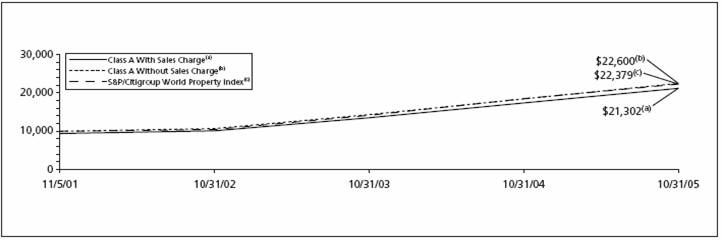
Performance: For the year ended October 31, 2005, the Fund’s Class A shares, excluding sales charge, provided a total return of 21.95% compared to the Standard and Poor’s (“S&P”)/Citigroup World Property Index, which returned 20.39% for the same period.
Portfolio Specifics: Property stocks around the world have benefited from strong performance relative to other equities over the past several years as a result of the desire for predictable cash flows as generated by real estate. Investment characteristics include high free cash flow from long lease terms, dividend yield, stable earnings growth, and low to moderate correlation to broad equities. The Fund, while maintaining a core of higher dividend yielding, defensively positioned stocks, has shifted over the past several months into higher growth sectors which will likely respond better to economic recovery (for example the office, industrial and lodging sectors, and the Asia-Pacific ex-Australia region).
Global property stocks were up 20.4% (S&P/Citigroup World Property Index) for the year ended October 31, 2005, propelled by strong returns in all major regions of the world. By region, continental Europe (up 30.0%) was the strongest performer followed by the Asia-Pacific region (+22.2%) and North America (up 18.3%).
Performance for the Fund over the twelve months was 21.95% which outperformed the benchmark return by 156 basis points driven exclusively by stock selection. Two-thirds of the superior stock selection was generated within the U.S., including a number of office and apartment companies. Approximately one-quarter of the stock selection outperformance was from continental Europe, driven by selections in France, including Nexity a homebuilder with a focus on the provinces. Global themes for the year included continued yield compression, mergers and acquisitions activity, the prospect of rising interest rates, syndicate activity (companies raising new equity) and, more recently, increasing evidence of a sustained economic recovery in Japan.
The strongest performer for the year among major countries was Japan (up 34.4%) where property stocks continue to climb on increasing evidence that an economic recovery in Japan is underway. This evidence has been seen in the property markets via many data points, including the September report by the Japan Land Ministry reported that land prices in Tokyo (23 wards) increased for both residential and commercial properties for the first time in 15 years (for the year ended July 1, 2005). Residential prices were up 50 basis points, commercial up 60 basis points. Land prices have decreased, until recently, every year since 1991.
The U.S. dollar generally continued to strengthen during the year versus other major currencies, particularly versus the Japanese yen, increasing by 10.1%. The U.S. dollar also strengthened by 6.1% versus the Euro, 3.5% versus the British pound and 3.1% versus the Canadian dollar.
Current Strategy and Outlook: Global property companies have provided strong absolute and relative returns when compared to broad equities over the past several years. Valuation disparities continue to provide investment opportunities to an investor with a global scope. Through an average 3%-4% dividend yield plus 5%-8% prospective annual earnings growth, we believe global property stocks continue to be well-positioned to conservatively deliver attractive total returns over the next several years.
Top Ten Industries
as of October 31, 2005
(as a percent of net assets)
Office Buildings | 29.1 | % |
| | |
Diversified Property Holdings | 15.5 | % |
| | |
Retail: Enclosed Malls | 13.7 | % |
| | |
Retail: Shopping Center | 10.4 | % |
| | |
Residential Apartments | 8.9 | % |
| | |
Industrial Properties | 6.3 | % |
| | |
Residential: Hotels | 3.0 | % |
| | |
Real Estate Services | 2.7 | % |
| | |
Self Storage Property | 2.5 | % |
| | |
Closed End Investment Companies | 1.5 | % |
Portfolio holdings are subject to change daily.
6
Portfolio Managers’ Report | | Ing Global Real Estate Fund |
| | |
| Average Annual Total Returns for the Periods Ended October 31, 2005 | |
| | | | | | | | | | |
| | | | | Since Inception | | Since Inception | | Since Inception | |
| | | | | of Class A | | of Class B | | of Class C | |
| | | | 1 Year | | | November 5, 2001 | | March 15, 2002 | | January 8, 2002 | |
| | | | | | | | | | |
| Including Sales Charge: | | | | | | | | | |
| Class A(1) | | 14.94 | % | | 20.87 | % | | — | | | — | | |
| Class B(2) | | 16.05 | % | | — | | | 19.98 | % | | — | | |
| Class C(3) | | 20.11 | % | | — | | | — | | | 20.46 | % | |
| Excluding Sales Charge: | | | | | | | | | | | | | |
| Class A | | 21.95 | % | | 22.68 | % | | — | | | — | | |
| Class B | | 21.05 | % | | — | | | 20.49 | % | | — | | |
| Class C | | 21.11 | % | | — | | | — | | | 20.46 | % | |
| S&P/Citigroup World Property Index(4) | | 20.39 | % | | 22.31 | %(5) | | 22.65 | %(6) | | 21.62 | %(7) | |
| | | | | | | | | | |
| | | | | | | | | | | | | | | | |
Based on a $10,000 initial investment, the graph and table above illustrate the total return of ING Global Real Estate Fund against the index indicated. An Index is unmanaged and has no cash in its portfolio, imposes no sales charge and incurs no operating expenses. An investor cannot invest directly in an index. The Fund’s performance is shown both with and without the imposition of sales charges.
The performance graph and table do not reflect the deduction of taxes that a shareholder will pay on Fund distributions or the redemption of Fund shares.
The performance shown may include the effect of fee waivers and/or expense reimbursements by the Investment Manager and/or other service providers, which have the effect of increasing total return. Had all fees and expenses been considered, the total returns would have been lower.
Performance data represents past performance and is no assurance of future results. Investment return and principal value of an investment in the Fund will fluctuate. Shares, when sold, may be worth more or less than their original cost. The Fund’s current performance may be lower or higher than the performance data shown. Please log on to www.ingfunds.com or call (800) 992-0180 to get performance through the most recent month end.
It is important to note that the Fund has a limited operating history. Performance over a longer period of time may be more meaningful than short-term performance.
This report contains statements that may be “forward-looking” statements. Actual results may differ materially from those projected in the “forward-looking” statements.
The views expressed in this report reflect those of the portfolio managers, only through the end of the period as stated on the cover. The portfolio managers’ views are subject to change at any time based on market and other conditions.
Fund holdings are subject to change daily.
(1) Reflects deduction of the maximum Class A sales charge of 5.75%.
(2) Reflects deduction of the Class B deferred sales charge of 5% and 3%, respectively, for the 1 year and since inception returns.
(3) Reflects deduction of the Class C deferred sales charge of 1% for the 1 year return.
(4) The S&P/Citigroup World Property Index is an unmanaged market-weighted total return index which consists of many companies from developed markets whose floats are larger than $100 million and derive more than half of their revenue from property-related activities.
(5) Since inception performance for index is shown from November 1, 2001.
(6) Since inception performance for index is shown from March 1, 2002.
(7) Since inception performance for index is shown from January 1, 2002.
7
ING GLOBAL VALUE CHOICE FUND | | Portfolio Managers’ Report |
The ING Global Value Choice Fund (the “Fund”) seeks long-term capital appreciation. The Fund is managed by Paul Hechmer, Gregg Tenser, CFA, Mark Morris, CFA and Jon Bosse, CFA, Portfolio Managers, NWQ Investment Management Company, LLC — the Sub-Adviser.
Performance: For the year ended October 31, 2005, the Fund’s Class A shares, excluding sales charge, provided a total return of 13.78% compared to the Morgan Stanley Capital International (“MSCI”) World Index 13.82% for the same period.
Portfolio Specifics: Since assuming sub-advisory management of the Fund, the ING Global Value Choice Fund has outperformed the benchmark, the MSCI World Index. From an absolute return perspective, the Fund generated positive returns in both the U.S. and in the rest of the world, although returns from overseas were mitigated somewhat by a stronger U.S. dollar. With that being said, the non-U.S. portion of the Fund outperformed the U.S. portion, as international markets continued their strong run, which started in 2003.
On both an absolute and relative basis, companies within the energy sector contributed most to performance as the oil price reached close to $70 a barrel. Individual names, including Suncor Energy, the Canadian oil sands company, and Noble Energy and Kerr McGee in the U.S., performed well. Exposure to the materials sector and exposure to select companies in the industrials sector, including Metso Corp. in Finland, also aided returns. On the negative side, overweight exposure to the telecommunications sector, primarily through international companies including Chunghwa Telecom and Belgacom, detracted from returns, with both weaker currencies and negative absolute company performance hurting Fund returns. However, we continue to believe that the telecommunications sector continues to offer dominant companies with very attractive valuation characteristics. Holdings in the financials sector, including Federal National Mortgage Association (“Fannie Mae”) and Countrywide Financial, also hurt performance.
Current Strategy and Outlook: Value opportunities continue to be found in global markets and those opportunities are finely balanced between both U.S. and international companies. In the U.S., corporate earnings and cash flows have been growing at a double-digit pace for the last several years, with many companies experiencing record profit margins and profitability. This has resulted in corporations having record amounts of cash on their balance sheets, which they are increasingly using for acquisitions and share repurchases, and has provided strong support for equity markets. While stock market valuations appear reasonable on current record profits, it is unclear the impact that anticipated Federal Reserve rate hikes, aimed to deflate inflation pressures, will have on the economy and the outlook for corporate profits.
In the rest of the world, markets have rallied strongly now since March 2003, and as a result, value opportunities in the international space are proving harder to find. However, on a relative basis, overseas markets continue to trade at lower multiples than the U.S., and as bottom-up value managers on an opportunistic basis, we continue to find selective opportunities. Regionally, we maintain a modest underweight to the U.S. and outside of the U.S., we continue to find more opportunities in Japan and Asia ex Japan rather than Europe. From a sector perspective we continue to find more value in the basic materials and telecommunications sectors.
Top Ten Industries
as of October 31, 2005
(as a percent of net assets)
Mining | | 10.4 | % |
| | | |
Oil and Gas | | 10.2 | % |
| | | |
Telecommunications | | 10.2 | % |
| | | |
Diversified Financial Services | | 8.8 | % |
| | | |
Aeorspace/Defense | | 5.2 | % |
| | | |
Software | | 4.9 | % |
| | | |
Insurance | | 3.4 | % |
| | | |
Media | | 3.4 | % |
| | | |
Agriculture | | 3.0 | % |
| | | |
Electric | | 2.7 | % |
Portfolio holdings are subject to change daily.
Effective February 1, 2005 NWQ Investment Management Company, LLC became Sub-Adviser to ING Global Value Choice Fund. Prior to February 1, 2005, the Fund was sub-advised by ING Investment Management Co. (formerly, Aeltus Investment Management, Inc.)
8
PORTFOLIO MANAGERS’ REPORT | | ING GLOBAL VALUE CHOICE FUND |
| Average Annual Total Returns for the Periods Ended October 31, 2005 | |
| | | | | | | | |
| | | | 1 Year | | | | 5 Year | | | | 10 Year | | |
| Including Sales Charge: | | | | | | | |
| Class A(1) | | 7.24 | % | | (7.47 | )% | | 7.33 | % | |
| Class B(2) | | 8.11 | % | | (7.36 | )% | | 7.29 | % | |
| Class C(3) | | 12.05 | % | | (6.99 | )% | | 7.28 | % | |
| Excluding Sales Charge: | | | | | | | | | | |
| Class A | | 13.78 | % | | (6.37 | )% | | 7.97 | % | |
| Class B | | 13.11 | % | | (7.00 | )% | | 7.29 | % | |
| Class C | | 13.05 | % | | (6.99 | )% | | 7.28 | % | |
| MSCI World Index(4) | | 13.82 | % | | 0.57 | % | | 7.56 | % | |
| | | | | | | | | |
| | | | | | | | | | | | | | | | | |
Based on a $10,000 initial investment, the graph and table above illustrate the total return of ING Global Value Choice Fund against the index indicated. An Index is unmanaged and has no cash in its portfolio, imposes no sales charge and incurs no operating expenses. An investor cannot invest directly in an index. The Fund’s performance is shown both with and without the imposition of sales charges.
The performance table does not reflect the deduction of taxes that a shareholder will pay on Fund distributions or the redemption of Fund shares.
The performance shown may include the effect of fee waivers and/or expense reimbursements by the Investment Manager and/or other service providers, which have the effect of increasing total return. Had all fees and expenses been considered, the total returns would have been lower.
Performance data represents past performance and is no assurance of future results. Investment return and principal value of an investment in the Fund will fluctuate. Shares, when sold, may be worth more or less than their original cost. The Fund’s current performance may be lower or higher than the performance data shown. Please log on to www.ingfunds.com or call (800) 992-0180 to get performance through the most recent month end.
This report contains statements that may be “forward-looking” statements. Actual results may differ materially from those projected in the “forward-looking” statements.
The views expressed in this report reflect those of the portfolio managers, only through the end of the period as stated on the cover. The portfolio managers’ views are subject to change at any time based on market and other conditions.
Fund holdings are subject to change daily.
(1) Reflects deduction of the maximum Class A sales charge of 5.75%.
(2) Reflects deduction of the Class B deferred sales charge of 5% and 2%, respectively, for the 1 year and 5 year returns.
(3) Reflects deduction of the Class C deferred sales charge of 1% for the 1 year return.
(4) The MSCI World Index is an unmanaged index that measures the performance of over 1,400 securities listed on exchanges in the U.S., Europe, Canada, Australia, New Zealand and the Far East.
Prior to February 1, 2005, the Fund was advised by a different sub-adviser.
9
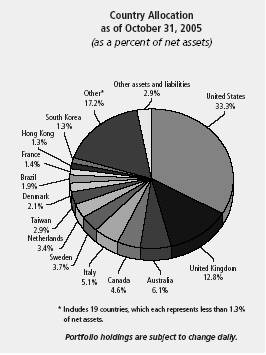
Ing Emerging Countries Fund | | Portfolio Managers’ Report |
The ING Emerging Countries Fund (the “Fund”) seeks maximum long-term capital appreciation. The Fund is managed by Brandes Investment Partners, L.P. — the Sub-Adviser.* Brandes’ Emerging Markets Investment Committee is responsible for making the day-to-day investment decisions for the Fund.
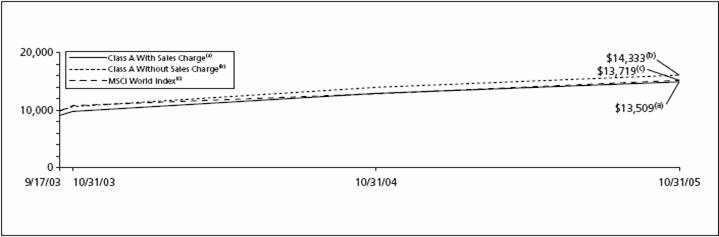
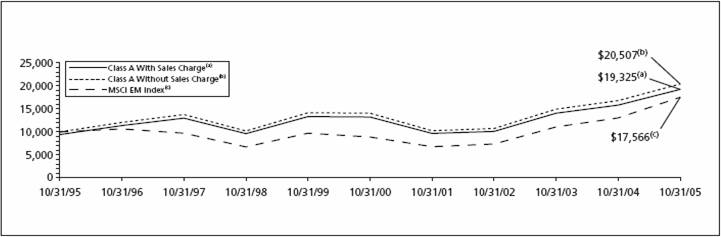
Performance: For the year ended October 31, 2005, the Fund’s Class A shares, excluding sales charge, provided a total return of 21.76% compared to the Morgan Stanley Capital International (“MSCI”) Emerging Markets (“EM”) Index, which returned 34.34% for the same period.
Portfolio Specifics: During the first four months of the reporting period, the Fund slightly underperformed its benchmark (22.5% versus 24.8%). The main elements of underperformance over the four-month period were stock selection among financials and in Turkish stocks, as well as the opportunity loss from maintaining a cash balance in a strong market.
From March 1, 2005 through October 31, 2005, on a country and industry level, advances for holdings in Brazil and South Korea contributed to the Fund’s performance. Such holdings included Uniao de Bancos Brasil (Brazil — commercial banking), CIA Paranaense de Energia (Brazil — utilities), and Korea Electric Power (South Korea — electric utilities). Other positions posting gains included Lukoil (Russia — oil, gas & consumable fuels) and Quilmes (Argentina beverages).
The Fund’s holdings in China and Indonesia tended to weigh on performance. Positions in these countries declining in the period included PT Gudang Garam (Indonesia — tobacco), Brilliance Auto Holdings (China — automobiles), and Sinopec Yizheng Chemical Fibres (China — chemicals).
From an industry perspective, gains for holdings in beverages, oil, gas & consumable fuels, and commercial banking made the most substantial contribution to performance. Top performers in these industries included Quilmes (Argentina — beverages), Lukoil (Russia — oil, gas & consumable fuels), and Uniao de Bancos Brasil (Brazil — commercial banking). Positions in the wireless telecom services industry, such as Telesp Celular Participacoes (Brazil) and Telecentro Oeste Celular (Brazil), tended to decline.
The main reasons for the underperformance against the benchmark in the eight-month period ended October 31, 2005, were stock selection, especially in the wireless telecommunications industry, and an underweighting in the top performing oil, gas & consumable fuels industry. The Fund’s industry exposure is a residual of our investment process, which focuses on company-by-company analysis to identify undervalued securities.
After the Fund’s portfolio management change on March 1, 2005, we established a wide range of positions at prices that we considered attractive. During the subsequent period, the Fund sold positions such as Hite Brewing (South Korea — beverages), and Fraser & Neave Limited (Singapore — beverages) as appreciation pushed their market prices toward our estimates of their long-term values.
Current Strategy and Outlook: For the four months ended March 1, 2005, India, Turkey and Brazil were the largest overweight countries in their respective regions (Asia, EMEA and Latin America). The Fund was also underweight in China, South Korea, Hungary and Chile, which were among the strongest performing countries. In terms of sectors, the Fund was overweight financials and telecommunications, and underweight consumer staples and industrials.
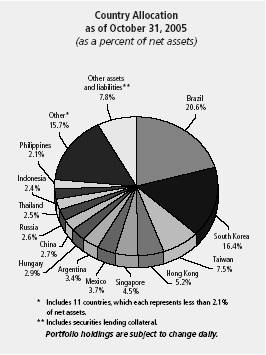
During the eight-month period from March 1, 2005 through October 31, 2005, the Fund’s country and industry exposures shifted slightly due to stock-specific buying and selling as well as changes in the prices of holdings. For example, exposure to Brazil increased, while exposure to South Korea and the commercial banking industry tended to decline. The Fund’s weightings for industries and countries are not the product of “top-down” forecasts or opinions, but merely stem from our company-by-company search for compelling investment opportunities in markets around the world. As of October 31, 2005, the Fund’s largest positions were in Brazil and South Korea, and in the diversified telecom services and commercial banking industries.
Keep in mind that the Fund’s weightings for industries and countries are not the product of “top-down” forecasts or opinions, but merely stem from our company-by-company search for compelling investment opportunities in markets around the world.
Overall, while we offer no predictions regarding the short-term direction of equities in emerging markets, we believe the Fund remains well positioned to deliver favorable long-term results. We believe that all holdings remain undervalued, and we expect to realize significant profit as the market recognizes their true worth.
Top Ten Industries
as of October 31, 2005
(as a percent of net assets)
Telecommunications | | 31.2 | % |
| | | |
Banks | | 10.7 | % |
| | | |
Electric | | 10.6 | % |
| | | |
Chemicals | | 4.6 | % |
| | | |
Semiconductors | | 3.8 | % |
| | | |
Auto Manufacturers | | 3.1 | % |
| | | |
Food | | 3.0 | % |
| | | |
Electrical Components and Equipment | | 2.6 | % |
| | | |
Oil and Gas | | 2.6 | % |
| | | |
Retail | | 2.6 | % |
Portfolio holdings are subject to change daily.
* Effective March 1, 2005 Brandes Investment Partners L.P. became sub-adviser to ING Emerging Countries Fund. Prior to March 1, 2005, the Fund was sub-advised by ING Investment Management B.V.
10
Portfolio Managers’ Report | | Ing Emerging Countries Fund |
| | | | | | | | | | |
| Average Annual Total Returns for the Periods Ended October 31, 2005 | |
| | | | | | | | | | |
| | | | | | | | | Since Inception | |
| | | | | | | | | of Class M | |
| | | 1 Year | | 5 Year | | 10 Year | | August 5, 2002 | |
| | | | | | | | | | |
| Including Sales Charge: | | | | | | | | | |
| Class A(1) | | 14.75 | % | | 6.52 | % | | 6.81 | % | | — | | |
| Class B(2) | | 15.87 | % | | 6.85 | % | | 6.86 | % | | — | | |
| Class C(3) | | 19.83 | % | | 6.88 | % | | 6.72 | % | | — | | |
| Class M(4) | | 16.91 | % | | — | | | — | | | 20.10 | % | |
| | | | | | | | | | | | | | |
| Excluding Sales Charge: | | | | | | | | | | | | | |
| Class A | | 21.76 | % | | 7.79 | % | | 7.44 | % | | — | | |
| Class B | | 20.87 | % | | 7.15 | % | | 6.86 | % | | — | | |
| Class C | | 20.83 | % | | 6.88 | % | | 6.72 | % | | — | | |
| Class M | | 21.15 | % | | — | | | — | | | 21.42 | % | |
| MSCI EM Index(5) | | 34.34 | % | | 14.64 | % | | 5.80 | % | | 29.24 | %(6) | |
| | | | | | | | | | | | | | |
Based on a $10,000 initial investment, the graph and table above illustrate the total return of ING Emerging Countries Fund against the index indicated. An Index is unmanaged and has no cash in its portfolio, imposes no sales charge and incurs no operating expenses. An investor cannot invest directly in an index. The Fund’s performance is shown both with and without the imposition of sales charges.
The performance graph and table do not reflect the deduction of taxes that a shareholder will pay on Fund distributions or the redemption of Fund shares.
The performance shown may include the effect of fee waivers and/or expense reimbursements by the Investment Manager and/or other service providers, which have the effect of increasing total return. Had all fees and expenses been considered, the total returns would have been lower.
Performance data represents past performance and is no assurance of future results. Investment return and principal value of an investment in the Fund will fluctuate. Shares, when sold, may be worth more or less than their original cost. The Fund’s current performance may be lower or higher than the performance data shown. Please log on to www.ingfunds.com or call (800) 992-0180 to get performance through the most recent month end.
This report contains statements that may be “forward-looking” statements. Actual results may differ materially from those projected in the “forward-looking” statements.
The views expressed in this report reflect those of the portfolio managers, only through the end of the period as stated on the cover. The portfolio managers’ views are subject to change at any time based on market and other conditions.
Fund holdings are subject to change daily.
(1) Reflects deduction of the maximum Class A sales charge of 5.75%.
(2) Reflects deduction of the Class B deferred sales charge of 5% and 2%, respectively, for the 1 year and 5 year returns.
(3) Reflects deduction of the Class C deferred sales charge of 1% for the 1 year return.
(4) Reflects deduction of the maximum Class M sales charge of 3.50%.
(5) The MSCI EM Index is an unmanaged index that measures the performance of securities listed on exchanges in developing nations throughout the world.
(6) Since inception performance for index is shown from August 1, 2002.
Prior to March 1, 2005, the Fund was advised by a different sub-adviser.
11
Ing Foreign Fund | | Portfolio Managers’ Report |
The ING Foreign Fund (the “Fund”) seeks long-term growth of capital. The Fund is managed by Rudolph-Riad Younes, CFA, Senior Vice President and Head of International Equity and Richard Pell, Senior Vice President and Chief Investment Officer, Julius Baer Investment Management, LLC — the Sub-Adviser.
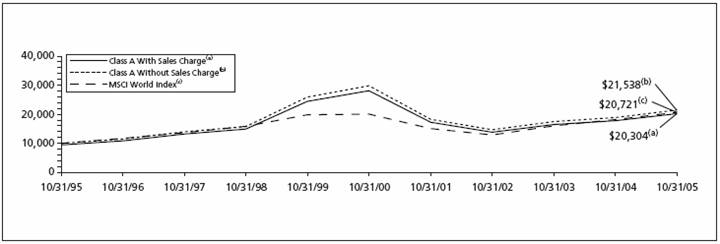
Performance: For the year ended October 31, 2005, the Fund’s Class A shares, excluding sales charges, provided a total return of 19.47% compared to the Morgan Stanley Capital International Europe, Austrasia and Far East (“MSCI EAFE”) Index, which returned 18.59% for the same period.
Portfolio Specifics: Over the period ended October 31, 2005, international equities provided strong returns for investors, and the Fund outperformed the Index due to several factors. Within Europe, the overweight position to Austria was a positive contributor. Many Austrian holdings, including Bank Austria Creditanstalt AG, benefited from the strong Eastern European market. The underweight position to the United Kingdom, an underperforming market over the period, also supported results.
The allocation to Eastern and Central Europe proved favorable as positions in Russia, Turkey, Hungary and Poland outperformed the Index by a wide margin. The Fund held many banks in the region that posted strong returns including Sberbank (Russia), Turkiye Garanti Bankasi A.S., Turkiye Is Bankasi A.S. and Akbank T.A.S. (Turkey). Elsewhere in emerging markets, holdings in Grupo Financiero Banorte S.A. (Mexico) helped performance while CANTV (Venezuela) detracted. Within China, a market we have largely avoided, shares of Weiqiao Textile Co. underperformed.
The underweight position to Japanese equities, as well as individual stock selection, were a drag on results. Shares of Uni-Charm Corp, a producer of personal hygiene products, underperformed over the period ended October 31, 2005. The Fund’s cash equivalents position also had a negative impact due to the strong environment for equities.
Both stock selection and an overweight position to the energy sector were also important contributors to performance. Companies such as Lukoil and Gazprom (Russia), OMV AG (Austria), EnCana and Canadian Natural Resources (Canada), Statoil (Norway) and Dragon Oil (Ireland) were particularly strong. Stock selection in the telecommunications and health care sectors also supported results. In the materials sector, the underweight position as well as stock selection, including companies such as LaFarge (France) the world’s largest cement producer, negatively impacted performance. Finally, stock selection in the industrials sector detracted from performance.
Current Strategy and Outlook: During the month of October 2005, equity markets fell amid concerns over rising inflation and slower global growth. Early in October 2005’s retrenchment, we took profits and reduced exposure to certain sectors, including energy, which had exhibited solid performance for the Fund. At the end of October 2005, we were underweight the energy sector relative to the Index and holdings were more defensively positioned. We believe energy stocks are likely to be negatively impacted by any global slowdown. We believe that signs of demand destruction, rather than the commodity price itself will hold the key to sector performance.
October 2005 also witnessed a rollback in returns in many emerging markets, but we took profits from select holdings. Emerging markets are susceptible to a slowdown in global growth, and in the current climate, volatility is likely to remain high. However, we believe that emerging markets will reassert themselves based on their strong fundamentals and attractive risk/reward opportunities, particularly Eastern and Central Europe.
Since Japan’s September 2005 elections, the Fund’s exposure to the country has increased through more domestically-focused companies such as regional banks. While we are still concerned about the state of national reforms, hence our overall underweight position to Japan, we see many individual companies showing a greater interest in enhancing shareholder value. Japan does remain vulnerable to any slowdown in Chinese growth and to a certain extent growth in the U.S.; therefore we believe this domestic focus is warranted.
Top Ten Industries
as of October 31, 2005
(as a percent of net assets)
Banks | | 22.7 | % |
| | | |
Investment Companies | | 7.5 | % |
| | | |
Pharmaceuticals | | 6.5 | % |
| | | |
Oil and Gas | | 5.8 | % |
| | | |
Telecommunications | | 5.7 | % |
| | | |
Food | | 4.1 | % |
| | | |
Engineering and Construction | | 3.6 | % |
| | | |
Beverages | | 2.8 | % |
| | | |
Building Materials | | 2.2 | % |
| | | |
Holding Companies - Diversified | | 2.2 | % |
Portfolio holdings are subject to change daily.
12
Portfolio Managers’ Report | | Ing Foreign Fund |

| | | | | | | | | | |
| Average Annual Total Returns for the Periods Ended October 31, 2005 | |
| | | | | | | | | | |
| | | | | Since Inception | | Since Inception | | Since Inception | |
| | | | | of Class A | | of Class B | | of Class C | |
| | | 1 Year | | July 1, 2003 | | July 8, 2003 | | July 7, 2003 | |
| | | | | | | | | | |
| Including Sales Charge: | | | | | | | | | |
| Class A(1) | | 12.60 | % | | 16.06 | % | | — | | | — | | |
| Class B(2) | | 13.68 | % | | — | | | 15.85 | % | | — | | |
| Class C(3) | | 17.65 | % | | — | | | — | | | 17.05 | % | |
| | | | | | | | | | | | | | |
| Excluding Sales Charge: | | | | | | | | | | | | | |
| Class A | | 19.47 | % | | 19.04 | % | | — | | | — | | |
| Class B | | 18.68 | % | | — | | | 16.91 | % | | — | | |
| Class C | | 18.65 | % | | — | | | — | | | 17.05 | % | |
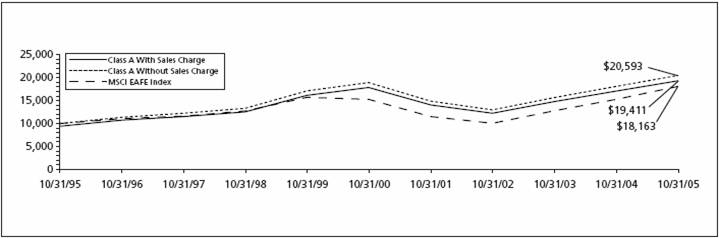
| MSCI EAFE Index(4) | | 18.59 | % | | 23.15 | %(5) | | 23.15 | %(5) | | 23.15 | %(5) | |
| | | | | | | | | | | | | | |
Based on a $10,000 initial investment, the graph and table above illustrate the total return of ING Foreign Fund against the index indicated. An Index is unmanaged and has no cash in its portfolio, imposes no sales charge and incurs no operating expenses. An investor cannot invest directly in an index. The Fund’s performance is shown both with and without the imposition of sales charges.
The performance graph and table do not reflect the deduction of taxes that a shareholder will pay on Fund distributions or the redemption of Fund shares.
The performance shown may include the effect of fee waivers and/or expense reimbursements by the Investment Manager and/or other service providers, which have the effect of increasing total return. Had all fees and expenses been considered, the total returns would have been lower.
Performance data represents past performance and is no assurance of future results. Investment return and principal value of an investment in the Fund will fluctuate. Shares, when sold, may be worth more or less than their original cost. The Fund’s current performance may be lower or higher than the performance data shown. Please log on to www.ingfunds.com or call (800) 992-0180 to get performance through the most recent month end.
It is important to note that the Fund has a limited operating history. Performance over a longer period of time may be more meaningful than short-term performance.
This report contains statements that may be “forward-looking” statements. Actual results may differ materially from those projected in the “forward-looking” statements.
The views expressed in this report reflect those of the portfolio managers, only through the end of the period as stated on the cover. The portfolio managers’ views are subject to change at any time based on market and other conditions.
Fund holdings are subject to change daily.
(1) Reflects deduction of the maximum Class A sales charge of 5.75%.
(2) Reflects deduction of the Class B deferred sales charge of 5% and 3%, respectively, for the 1 year and since inception returns.
(3) Reflects deduction of the Class C deferred sales charge of 1% for the 1 year return.
(4) The MSCI EAFE Index is an unmanaged index that measures the performance of securities listed on exchanges in Europe, Australasia and the Far East.
(5) Since inception performance for index is shown from July 1, 2003.
13
Ing International Fund | | Portfolio Managers’ Report |
The ING International Fund (the “Fund”) seeks long-term growth of capital through investment in equity securities and equity equivalents of companies outside the United States. The Fund is a managed by a team of investment professionals led by Richard T. Saler and Philip A. Schwartz, CFA, each a Senior Vice President and Director of International Investment Strategy, ING Investment Manager Co. — the Sub-Adviser.
Performance: For the year ended October 31, 2005, the Fund’s Class A shares, excluding sales charges, provided a total return of 13.30% compared to the Morgan Stanley Capital International Europe, Austrasia and Far East (“MSCI EAFE”) Index, which returned 18.59% for the same period.
Portfolio Specifics: The Fund’s defensive positioning in the earlier part of the year ended October 2005 at first proved disappointing. Later in the 2005 year, however, many defensive names regained strength as the market grew concerned about high energy prices and economic growth. Newer positions in a broader array of sectors also helped performance. Much of the first half’s losses of 2005 were made up in the second half of the 2005 year.
Overall, stock selection was positive in Europe and developed Asia-ex Japan, while our holdings in Japan were disappointing. Our underweight of the U.K., which had relatively weak performance in the second half of the fiscal year ended October 2005 proved beneficial, but was not enough to make up for weak stock selection. emerging market stocks detracted from relative return. On a sector basis, our underweight positions in consumer discretionary and information technology stocks added to performance. This result was partially offset by a negative selection outcome in the financials and materials sectors. Energy and telecom stock selection added materially to results.
On an individual stock level, significant value was added by TDC A/S, the main Danish telecom services provider, after it increased on reports of takeover bids. Amano Corp., a Japanese industrial firm, added materially to performance during the second half of the fiscal year due to high product demand and the resulting higher price targets by analysts. A material positive contribution was made by our holding of SolarWorld AG, a German energy company, mainly due to an increase in capacity and expanded production, higher demand, and a secure supply base. The largest detractor was Canadian gold producer Placer Dome in a weak gold market; most of the loss occurred during the first half of the reporting 2005 period. Other negative contributors included Barco N.V, a Belgian maker of electronic visual displays, which fell after a lower profit forecast due to the decline in the dollar, and Tenaga Nasional Bhd, a Malaysian electric utility, which declined following decreased profits.
Current Strategy and Outlook: Despite signs that economic growth may be slowing and some nagging inflation concerns, our models continue to point towards a variety of solid investment opportunities. Japan’s election results were encouraging and appear to promise more financial reform. China’s growth continues to offer opportunity among global commodities companies, including oil. We have increased the Fund’s weightings in financial stocks since valuations appear attractive, and a peak in bond yields is likely in the year ahead. The Fund is maintaining an overweight position in energy stocks due to their strong cash generation and positive outlook. The Fund is underweight Europe and the U.K., and maintaining a modest exposure to emerging market stocks. At the sector level, the Fund continues to be underweight in the consumer discretionary and industrial sectors, and overweight positions on consumer staples, health care and utility stocks.
Top Ten Industries
as of October 31, 2005
(as a percent of net assets)
Banks | | 19.2 | % |
| | | |
Oil and Gas | | 10.2 | % |
| | | |
Pharmaceuticals | | 8.4 | % |
| | | |
Food | | 8.1 | % |
| | | |
Telecommunications | | 7.9 | % |
| | | |
Diversified Financial Services | | 5.3 | % |
| | | |
Insurance | | 4.6 | % |
| | | |
Mining | | 3.5 | % |
| | | |
Electric | | 3.3 | % |
| | | |
Agriculture | | 3.1 | % |
Portfolio holdings are subject to change daily.
14
Portfolio Managers’ Report | | Ing International Fund |
| | |
| Average Annual Total Returns for the Periods Ended October 31, 2005 | |
| | | | | | | | | | | | |
| | | | | | | | | Since Inception | | Since Inception | |
| | | | | | | | | of Class B | | of Class C | |
| | | 1 Year | | 5 Year | | 10 Year | | August 22, 2000 | | September 15, 2000 | |
| | | | | | | | | | | | |
| Including Sales Charge: | | | | | | | | | | | |
| Class A(1) | | 6.79 | % | | 0.40 | % | | 6.85 | % | | — | | | — | | |
| Class B(2) | | 7.41 | % | | 0.28 | % | | — | | | (1.33 | )% | | — | | |
| Class C(3) | | 11.46 | % | | 0.61 | % | | — | | | — | | | (0.19 | )% | |
| | | | | | | | | | | | | | | | | |
| Excluding Sales Charge: | | | | | | | | | | | | | | | | |
| Class A | | 13.30 | % | | 1.59 | % | | 7.48 | % | | — | | | — | | |
| Class B | | 12.41 | % | | 0.65 | % | | — | | | (1.16 | )% | | — | | |
| Class C | | 12.46 | % | | 0.61 | % | | — | | | — | | | (0.19 | )% | |
| MSCI EAFE Index(4) | | 18.59 | % | | 3.42 | % | | 6.15 | % | | 1.85 | %(5) | | 1.85 | %(5) | |
| | | | | | | | | | | | |
Based on a $10,000 initial investment, the graph and table above illustrate the total return of ING International Fund against the index indicated. An Index is unmanaged and has no cash in its portfolio, imposes no sales charge and incurs no operating expenses. An investor cannot invest directly in an index. The Fund’s performance is shown both with and without the imposition of sales charges.
The performance graph and table do not reflect the deduction of taxes that a shareholder will pay on Fund distributions or the redemption of Fund shares.
The performance shown may include the effect of fee waivers and/or expense reimbursements by the Investment Manager and/or other service providers, which have the effect of increasing total return. Had all fees and expenses been considered, the total returns would have been lower.
Performance data represents past performance and is no assurance of future results. Investment return and principal value of an investment in the Fund will fluctuate. Shares, when sold, may be worth more or less than their original cost. The Fund’s current performance may be lower or higher than the performance data shown. Please log on to www.ingfunds.com or call (800) 992-0180 to get performance through the most recent month end.
This report contains statements that may be “forward-looking” statements. Actual results may differ materially from those projected in the “forward-looking” statements.
The views expressed in this report reflect those of the portfolio managers, only through the end of the period as stated on the cover. The portfolio managers’ views are subject to change at any time based on market and other conditions.
Fund holdings are subject to change daily.
(1) Reflects deduction of the maximum Class A sales charge of 5.75%.
(2) Reflects deduction of the Class B deferred sales charge of 5% and 1%, respectively, for the 1 year and since inception returns.
(3) Reflects deduction of the Class C deferred sales charge of 1% for the 1 year return.
(4) The MSCI EAFE Index is an unmanaged index that measures the performance of securities listed on exchanges in markets in Europe, Australasia and the Far East.
(5) Since inception performance for the index is shown from September 1, 2000.
Effective November 1, 2001, Class A shares liquidated within 30 days of purchase are subject to a 2% redemption fee.
Prior to July 26, 2000, the Fund was advised by a different sub-adviser.
15
Ing International Smallcap Fund | | Portfolio Managers’ Report |
The ING International SmallCap Fund (the “Fund”) seeks maximum long-term capital appreciation. The Fund is managed by John Chisholm, CFA, Executive Vice President and Matthew J. Cohen, CFA, Senior Vice President, Acadian Asset Management, Inc. — the Sub-Adviser.
Performance: For the year ended October 31, 2005, the Fund’s Class A shares, excluding sales charges, provided a total return of 28.97% compared to the Morgan Stanley Capital International Europe, Austrasia and Far East (“MSCI EAFE”) SmallCap Index and the Standard & Poor’s/Citigroup Europe, Pacific, Asia Composite/Extended Market Index (“S&P/Citigroup EPAC/EMI”) which returned 29.05% and 25.41%, respectively, for the same period.
Portfolio Specifics: The MSCI EAFE SmallCap Index posted solid gains in the four months ended February 28, 2005, up 20.2%. International equity markets extended November’s gains into December and capped 2004 with robust performance across the board, despite an uncertain environment characterized by rising interest rates, higher oil prices and the ongoing war in Iraq. In the final weeks of 2004, trading volume was thin as investors geared up for the holidays, but the markets reacted favorably to easing oil prices, increased merger activity and rosy outlooks from such industry leaders as Intel Corp. and General Electric Co. The Fund benefited from overweightings in Europe and Canada, but an overweighting in Korea detracted from performance. Stock selection was strong in Europe, but was weak in the UK and Japan. For the period from March 1, 2005, through April 30, 2005, the Fund underperformed the MSCI EAFE SmallCap Index by approximately 2.6%. This was mostly the result of country allocations, though stock selection also detracted slightly from return.
The following investments helped the Fund’s performance for the subsequent eight months ended October 31, 2005. In Australia, stock-level performance, particularly in the materials sector, more than offset value lost to an overweighted country allocation. Energy sector holding Oil Search was also a significant contributor to active return. Strong global demand and elevated commodity prices over the period helped holdings in these sectors. In Spain, successful stock selection combined with an overweighting to deliver value added in this market. Homebuilder Fadesa Inmobiliar led the Fund’s Spanish holdings as construction activity was strong. In the United Kingdom, an underweighted allocation, which showed lackluster growth over the eight months ended October 31, 2005, helped return. Also contributing to active return was stock-level performance in the U.K., particularly in the capital equipment sector. Defense holding Cobham and building materials manufacturer BPB were the top performers among the Fund’s U.K. holdings. In Germany, stock selection generated additional active return. Selections in the materials sector were especially successful. Specifically, a position in German steel producer Salzgitter was a key driver of value added. In France, stock selection combined with the country overweighting to contribute excess return. A position in technology firm Neopost was the top contributor to active return among the Fund’s French holdings.
The following investments have detracted from the Fund’s inception performance for the eight months ended October, 31, 2005. In Japan, stock selection, combined with an underweighting, detracted from the Fund’s active return, as this market has had a particularly robust year, up approximately 11% over the eight month period ended October 31, 2005. Holdings that detracted from performance included services stocks Kyoei Tanker and Tonichi Carlife. In Greece, stock selection and an overweighted allocation, resulted in a negative impact to the Fund’s return. Specifically, an overweighting to the Greek services sector detracted from return. In emerging markets, stock selection in China offset value added from overweighting in this market, as selections in the materials and services sectors trailed the index. The active allocations to Turkey and Taiwan also lost value.
Current Strategy and Outlook: Country weightings are driven by bottom-up stock selection. The Fund is currently overweighted in Spain and France and actively allocated to Canada, Korea and Turkey. Significant underweightings include Japan and the U.K. Our bottom-up process led the Fund to focus on materials, energy and durables stocks.
The outlooks for Spain and France are positive based on our forecast factors. There are signs of particular strength in the banking and energy sectors, which are also expected to outperform in Canada, where the local currency remains quite strong. Turkey is the highest-ranked country in our emerging markets framework, driven primarily by longer-term cash flow factors and perceived lower risk as the country continues to bring its economic policy in line with that of the European Union.
Our forecast for Japan continues to show it as one of our lowest-ranked markets. This short-term outlook is based on the fact that the economic rehabilitation is still in the early stages, relative valuations are still high and deflation remains in place. We are most negative on technology and staples, though even within a sector that we view negatively overall, we often find individual holdings that are highly attractive. We are long-term positive on Japan given Koizumi’s reform-minded economic policy, strong and improving economic fundamentals and the expectation that earnings will catch up with valuations.
Top Ten Industries
as of October 31, 2005
(as a percent of net assets)
Iron/Steel | | 7.7 | % |
| | | |
Diversified Financial Services | | 6.9 | % |
| | | |
Transportation | | 6.7 | % |
| | | |
Retail | | 6.6 | % |
| | | |
Oil and Gas | | 5.0 | % |
| | | |
Food | | 4.5 | % |
| | | |
Distribution/Wholesale | | 4.1 | % |
| | | |
Real Estate | | 3.9 | % |
| | | |
Insurance | | 3.5 | % |
| | | |
Building Materials | | 3.4 | % |
Portfolio holdings are subject to change daily.
Effective March 1, 2005 Acadian Asset Management became sub-adviser to ING International SmallCap Fund. Prior to March 1, 2005, the Fund was sub-advised by Nicholas-Applegate Capital Management. The views expressed are those of the specific sub-adviser with respect to the period of time discussed.
16
Portfolio Managers’ Report | | Ing International Smallcap Fund |
| | | | | | | | |
| Average Annual Total Returns for the Periods Ended October 31, 2005 | |
| | | | | | | | |
| | | | 1 Year | | | | 5 Year | | | | 10 Year | | |
| | | | | | | | |
| Including Sales Charge: | | | | | | | |
| Class A(1) | | 21.56 | % | | 1.37 | % | | 14.74 | % | |
| Class B(2) | | 23.15 | % | | 1.58 | % | | 14.72 | % | |
| Class C(3) | | 27.16 | % | | 1.94 | % | | 14.70 | % | |
| | | | | | | | | | | |
| Excluding Sales Charge: | | | | | | | | | | |
| Class A | | 28.97 | % | | 2.58 | % | | 15.42 | % | |
| Class B | | 28.15 | % | | 1.95 | % | | 14.72 | % | |
| Class C | | 28.16 | % | | 1.94 | % | | 14.70 | % | |
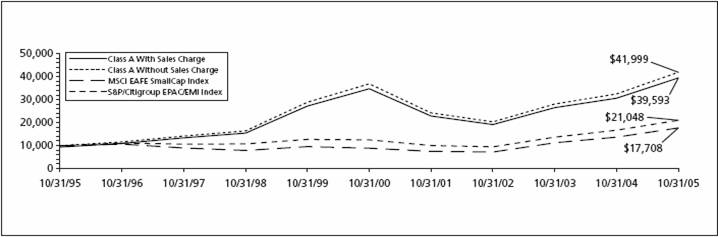
| MSCI EAFE SmallCap Index(4) | | 29.05 | % | | 15.10 | % | | 6.00 | % | |
| S&P/Citigroup EPAC/EMI Index(5) | | 25.41 | % | | 11.01 | % | | 7.73 | % | |
| | | | | | | | | | | |
| | | | | | | | | | | | | | | | | |
Based on a $10,000 initial investment, the graph and table above illustrate the total return of ING International SmallCap Fund against the Indicies indicated. An Index is unmanaged and has no cash in its portfolio, imposes no sales charge and incurs no operating expenses. An investor cannot invest directly in an index. The Fund’s performance is shown both with and without the imposition of sales charges.
The performance graph and table do not reflect the deduction of taxes that a shareholder will pay on Fund distributions or the redemption of Fund shares.
The performance shown may include the effect of fee waivers and/or expense reimbursements by the Investment Manager and/or other service providers, which have the effect of increasing total return. Had all fees and expenses been considered, the total returns would have been lower.
Performance data represents past performance and is no assurance of future results. Investment return and principal value of an investment in the Fund will fluctuate. Shares, when sold, may be worth more or less than their original cost. The Fund’s current performance may be lower or higher than the performance data shown. Please log on to www.ingfunds.com or call (800) 992-0180 to get performance through the most recent month end.
This report contains statements that may be “forward-looking” statements. Actual results may differ materially from those projected in the “forward-looking” statements.
The views expressed in this report reflect those of the portfolio managers, only through the end of the period as stated on the cover. The portfolio managers’ views are subject to change at any time based on market and other conditions.
Fund holdings are subject to change daily.
(1) Reflects deduction of the maximum Class A sales charge of 5.75%.
(2) Reflects deduction of the Class B deferred sales charge of 5% and 2%, respectively, for the 1 year and 5 year returns.
(3) Reflects deduction of the Class C deferred sales charge of 1% for the 1 year return.
(4) The MSCI EAFE SmallCap Index is an unmanaged, market-weighted index that represents the smallcap segments in 21 developed equity markets outside of North America, which more closely tracks the types of securities in which the Fund invests than the S&P/Citigroup EPAC/EMI Index.
(5) The S&P/Citigroup EPAC/EMI Index is an unmanaged index that measures the performance of securities of smaller-capitalization companies in 22 countries excluding the U.S. and Canada.
Prior to March 1, 2005, the Fund was advised by a different sub-adviser.
17
Ing International Value Fund | | Portfolio Managers’ Report |
The ING International Value Fund (the “Fund”) seeks long-term capital appreciation. The Fund is managed by Brandes Investment Partners, L.P. — the Sub-Adviser. Brandes’ Large Cap Investment Committee is responsible for making the day-to-day investment decisions for the Fund.
Performance: For the year ended October 31, 2005, the Fund’s Class A shares, excluding sales charges, provided a total return of 15.06% compared to the Morgan Stanley Capital International Europe, Australasia and Far East (“MSCI EAFE”) Index, which returned 18.59% for the same period.
Portfolio Specifics: The Fund’s advance during the fiscal year of 2005 was broad based, with positions in a wide range of countries and industries registering gains. On a country basis, advances for holdings in Japan made the most substantial contribution to returns. Top Japan-based performers included Japan Tobacco (tobacco), Mitsubishi Tokyo Financial (commercial banking), and Sumitomo Mitsui Financial Group (commercial banking)
In addition, advances for holdings in the United Kingdom and Germany also contributed to favorable absolute performance. Top performers in these countries included Volkswagen (Germany — automobiles) and Imperial Chemical (United Kingdom — chemicals).
From an industry perspective, advances for holdings in commercial banking and insurance helped drive performance. Among the stronger-performing holdings in these industries were Commerzbank (Germany — Commercial Banks) and Millea Holdings Inc. Tokyo (Japan — insurance). Gains for positions in the food products and the tobacco industries also tended to advance.
The main reason for the underperformance against the benchmark during the year was an overweight position in the diversified telecommunications industry, one of the weakest industry performers. The Fund was also underweight in the metals & mining and in the oil, gas, & consumable fuels industries, two of the strongest performing industries. The Fund’s industry exposure is a residual of our investment process, which focuses on company-by-company analysis to identify undervalued securities.
During the period, we sold positions such as BAE Systems (United Kingdom — aerospace & defense), Lukoil (Russia — oil gas & consumable fuels), and E.ON AG (Germany — electric utilities) as appreciation pushed their market prices toward our estimates of their long-term values. We also sold portions of other holdings to reduce their Fund weightings and to pursue other investment opportunities.
New purchases for the year included DaimlerChrysler (Germany — automobiles), Aegon (Netherlands — insurance), and Fuji Photo Film (Japan — leisure equipment & products), among others. We also added to select existing holdings at prices that we consider attractive.
Current Strategy and Outlook: During the year ended October 31, 2005, the Fund’s country and industry exposures shifted slightly due to stock-specific buying and selling, as well as changes in the prices of holdings. For example, exposure to the Netherlands and the insurance industry increased, while exposure to the United Kingdom and the oil, gas & consumable fuels industry declined. The Fund’s weightings for industries and countries are not the product of “top-down” forecasts or opinions, but merely stem from our company-by-company search for compelling investment opportunities in markets around the world.
Overall, while we offer no predictions regarding the short-term direction of international equity markets, we believe the Fund remains well positioned to deliver favorable long-term results. We acknowledge that many of the Fund’s current holdings recently have posted significant gains. However, we believe that all holdings remain undervalued, and we expect to realize solid appreciation as the market recognizes their true worth
Top Ten Industries
as of October 31, 2005
(as a percent of net assets)
Telecommunications | | 21.9 | % |
| | | |
Banks | | 14.4 | % |
| | | |
Food | | 13.9 | % |
| | | |
Insurance | | 10.1 | % |
| | | |
Pharmaceuticals | | 7.8 | % |
| | | |
Electric | | 4.3 | % |
| | | |
Home Furnishings | | 4.3 | % |
| | | |
Auto Manufacturers | | 4.1 | % |
| | | |
Miscellaneous Manufacturing | | 4.0 | % |
| | | |
Chemicals | | 2.6 | % |
Portfolio holdings are subject to change daily.
18
Portfolio Managers’ Report | | Ing International Value Fund |
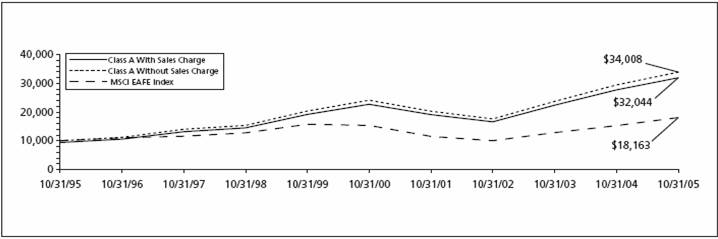
| | | | | | | | | | |
| Average Annual Total Returns for the Periods Ended October 31, 2005 | |
| | | | | | | | | | |
| | | | | | | | | Since Inception | |
| | | | | | | | | of Class B | |
| | | | 1 Year | | | | 5 Year | | | | 10 Year | | | April 18, 1997 | |
| | | | | | | | | | |
| Including Sales Charge: | | | | | | | | | |
| Class A(1) | | 8.45 | % | | 5.79 | % | | 12.35 | % | | — | | |
| Class B(2) | | 9.21 | % | | 5.99 | % | | — | | | 11.28 | % | |
| Class C(3) | | 13.25 | % | | 6.31 | % | | 12.25 | % | | — | | |
| | | | | | | | | | | | | | |
| Excluding Sales Charge: | | | | | | | | | | | | | |
| Class A | | 15.06 | % | | 7.05 | % | | 13.02 | % | | — | | |
| Class B | | 14.21 | % | | 6.31 | % | | — | | | 11.28 | % | |
| Class C | | 14.25 | % | | 6.31 | % | | 12.25 | % | | — | | |
| MSCI EAFE Index(4) | | 18.59 | % | | 3.42 | % | | 6.15 | % | | 5.77 | %(5) | |
| | | | | | | | | | | | | | |
| | | | | | | | | | | | | | | | | | | | |
Based on a $10,000 initial investment, the graph and table above illustrate the total return of ING International Value Fund against the index indicated. An Index is unmanaged and has no cash in its portfolio, imposes no sales charge and incurs no operating expenses. An investor cannot invest directly in an index. The Fund’s performance is shown both with and without the imposition of sales charges.
The performance graph and table do not reflect the deduction of taxes that a shareholder will pay on Fund distributions or the redemption of Fund shares.
The performance shown may include the effect of fee waivers and/or expense reimbursements by the Investment Manager and/or other service providers, which have the effect of increasing total return. Had all fees and expenses been considered, the total returns would have been lower.
Performance data represents past performance and is no assurance of future results. Investment return and principal value of an investment in the Fund will fluctuate. Shares, when sold, may be worth more or less than their original cost. The Fund’s current performance may be lower or higher than the performance data shown. Please log on to www.ingfunds.com or call (800) 992-0180 to get performance through the most recent month end.
This report contains statements that may be “forward-looking” statements. Actual results may differ materially from those projected in the “forward-looking” statements.
The views expressed in this report reflect those of the portfolio managers, only through the end of the period as stated on the cover. The portfolio managers’ views are subject to change at any time based on market and other conditions.
Fund holdings are subject to change daily.
(1) Reflects deduction of the maximum Class A sales charge of 5.75%.
(2) Reflects deduction of the Class B deferred sales charge of 5% and 2%, respectively, for the 1 year and 5 year returns.
(3) Reflects deduction of the Class C deferred sales charge of 1% for the 1 year return.
(4) The MSCI EAFE Index is an unmanaged index that measures the performance of securities listed on exchanges in markets in Europe, Australasia and the Far East.
(5) Since inception performance for index is shown from May 1, 1997.
Effective September 2, 2003, the Fund was closed to new investments. See Note 1 for additional information.
19
Ing International Value Choice Fund | | Portfolio Managers’ Report |
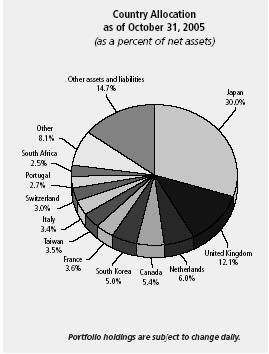
The ING International Value Choice Fund (the “Fund”) seeks long-term capital appreciation. The Fund is managed by Paul Hechmer, Managing Director and Portfolio Manager, NWQ Investment Management Company, LLC — the Sub-Adviser.
Performance: From February 1, 2005, the inception of the Fund, to October 31, 2005, the Fund’s Class A shares, excluding sales charges, provided a total return of 7.00% compared to the Morgan Stanley Capital International Europe, Australasia and Far East (“MSCI EAFE”) Index, which returned 8.29% for the same period.
Portfolio Specifics: The ING International Value Choice Fund has, since inception, posted strong returns, however, post-expense performance has modestly trailed the MSCI EAFE Index benchmark return of approximately 8%. While most of the period international market performance had been lackluster in U.S. dollar terms due to dollar strength, in the last few months of the year international markets rallied while the dollar’s gains were somewhat subdued, leading to positive absolute performance. Many major events have occurred this year such as general elections in Japan and Germany, the price of oil approaching $70 a barrel and gold hitting a 17 year high. The Fund was positioned with an overweight to the energy sector which performed very well in both absolute and relative terms. In particular, exposure to Suncor Energy, the Canadian oil sands company, aided returns in the sector. The Fund was also aided by high exposure to the materials sector, where many names in the gold, platinum and steel sectors performed well for us. Other names which performed well were Metso, a Finnish Industrials company and Areva, a French nuclear energy company.
During the period, the telecommunications sector in particular detracted from returns. Many of the names the Fund held in the sector underperformed the broader market as the markets focused on the negative aspects of the sector, such as fears of a shrinking telecommunications market, rather than the positive aspects such as high free cash flows and dividends. Fund performance was negatively affected by our underexposure to the healthcare sector, where we fail to find opportunities which fit our criteria, and in consumer staples where J Sainsbury, a U.K. grocer, hurt our performance.
Regionally, the Fund’s overweight to Japan, while aiding absolute returns, detracted from performance on a relative perspective as our holdings in Japan lagged the market. The Fund’s exposure to Taiwan, made up of the aforementioned poorly performing telecommunications companies, also detracted from performance.
Current Strategy and Outlook: International markets have rallied strongly now since March 2003, with the MSCI EAFE Index in U.S. dollar terms up over 70% since the end of 2002. As a result, value opportunities in the international space are proving harder to find. However, on a relative basis, overseas markets continue to trade at lower multiples than the U.S. and as bottom-up value managers on an opportunistic basis we continue to find selective opportunities. From a regional perspective we continue to find more opportunities in Japan and Asia ex Japan rather than Europe. From a sector perspective we continue to find more value in the basic materials and telecommunications sectors, while finding it harder to find many absolute value opportunities in the financials sector.
We would note that all international investments are made up of a stock and currency component. The U.S. dollar moved very little one way or the other in the later part of the year, following dollar strength in the first half of the year. While we do not forecast exchange rates, the U.S. continues to run significant current account and budget deficits and, an elastic band can only be stretched so far before it snaps or springs back.
Top Ten Industries
as of October 31, 2005
(as a percent of net assets)
Telecommunications | | 13.6 | % |
| | | |
Mining | | 13.4 | % |
| | | |
Oil and Gas | | 6.5 | % |
| | | |
Transportation | | 4.5 | % |
| | | |
Electric | | 4.4 | % |
| | | |
Food | | 4.2 | % |
| | | |
Cosmetics/Personal Care | | 2.8 | % |
| | | |
Home Builders | | 2.8 | % |
| | | |
Water | | 2.7 | % |
| | | |
Commercial Services | | 2.6 | % |
Portfolio holdings are subject to change daily.
20
Portfolio Managers’ Report | | Ing International Value Choice Fund |
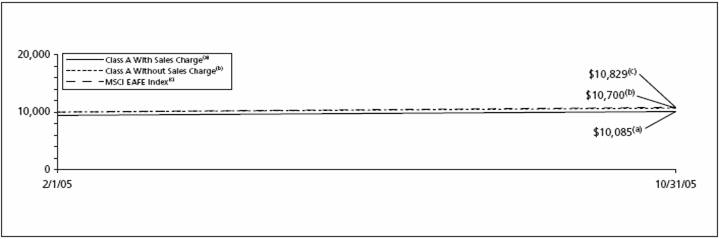
| | | | | | |
| Cumulative Total Returns for the Periods Ended October 31, 2005 | |
| | | | | | |
| | | Since Inception | | Since Inception | |
| | | of Classes A and B | | of Class C | |
| | | February 1, 2005 | | February 4, 2005 | |
| | | | | | |
| Including Sales Charge: | | | | | |
| Class A(1) | | 0.85 | % | | — | | |
| Class B(2) | | 1.50 | % | | — | | |
| Class C(3) | | — | | | 5.49 | % | |
| | | | | | | | |
| Excluding Sales Charge: | | | | | | | |
| Class A | | 7.00 | % | | — | | |
| Class B | | 6.50 | % | | — | | |
| Class C | | — | | | 6.49 | % | |
| MSCI EAFE Index(4) | | 8.29 | %(5) | | 8.29 | %(5) | |
| | | | | | | | |
Based on a $10,000 initial investment, the graph and table above illustrate the total return of ING International Value Choice Fund against the index indicated. An Index is unmanaged and has no cash in its portfolio, imposes no sales charge and incurs no operating expenses. An investor cannot invest directly in an index. The Fund’s performance is shown both with and without the imposition of sales charges.
The performance table does not reflect the deduction of taxes that a shareholder will pay on Fund distributions or the redemption of Fund shares.
The performance shown may include the effect of fee waivers and/or expense reimbursements by the Investment Manager and/or other service providers, which have the effect of increasing total return. Had all fees and expenses been considered, the total returns would have been lower.
Performance data represents past performance and is no assurance of future results. Investment return and principal value of an investment in the Fund will fluctuate. Shares, when sold, may be worth more or less than their original cost. The Fund’s current performance may be lower or higher than the performance data shown. Please log on to www.ingfunds.com or call (800) 992-0180 to get performance through the most recent month end.
This report contains statements that may be “forward-looking” statements. Actual results may differ materially from those projected in the “forward-looking” statements.
The views expressed in this report reflect those of the portfolio managers, only through the end of the period as stated on the cover. The portfolio managers’ views are subject to change at any time based on market and other conditions.
Fund holdings are subject to change daily.
(1) Reflects deduction of the maximum Class A sales charge of 5.75%.
(2) Reflects deduction of the Class B deferred sales charge of 5% for the since inception return.
(3) Reflects deduction of the Class C deferred sales charge of 1% for the since inception return.
(4) The MSCI EAFE Index is an unmanaged index that measures the performance of securities listed on exchanges in markets in Europe, Australasia and the Far East.
(5) Since inception performance for index is shown from February 1, 2005.
21
Ing Precious Metals Fund | PORTFOLIO MANAGERS’ REPORT |

The ING Precious Metals Fund (the “Fund”) seeks to attain capital appreciation and hedge against the loss of buying power of the U.S. dollar as may be obtained through investment in gold and securities of companies engaged in mining or processing gold throughout the world. The Fund is managed by a team of investment professionals led by James A. Vail, CFA, Senior Vice President and Portfolio Manager, ING Investment Management Co. — the Sub-Adviser.
Performance: For the year ended October 31, 2005, the Fund’s Class A shares, excluding sales charges, provided a total return of 6.81% compared to the Standard & Poor’s (“S&P”) 500 Composite Stock Price Index, and the Financial Times (“FT”) Gold Mines Index, which returned 8.72% and 1.18%, respectively, for the same period. Gold Bullion returned 10.56% for the period.
Portfolio Specifics: The past twelve months have seen a significant change in investors’ attitude toward the gold sector. In October 2005, bullion prices reached a 17-year high due to global inflation fears driven by higher energy prices and commodity prices in general. The fundamentals for gold investments have improved significantly as mine production peaked in 2003 and 2004 in the face of renewed demand from jewelry manufacturers and exchange traded funds. New gold reserves are limited and given the long lead times necessary to bring on new production, we believe the reduced inventory will keep prices at higher levels than in the immediate past.
Another favorable trend in the sector is the apparent beginning of industry consolidation. As the senior producers find it difficult to replace production from existing known deposits, they may turn to intermediate and junior producers with attractive reserves and resources. On the last day of October 2005, Barrick announced a hostile bid for Placer Dome, which if successful would create the world’s largest gold producer. In our opinion, other senior gold companies will watch this transaction closely to chart their own future direction.
Finally, the strength in bullion was not limited to the U.S. dollar. Gold bullion reached new highs in several currencies, including the euro, Swiss franc and Japanese yen. This suggests to us that fears of inflationary pressures on paper currencies should keep gold prices high.
The Fund outperformed its benchmark, FT Gold Mines Index, by continuing to underweight the senior producers and concentrating on the intermediate and junior producers and exploration companies. Examples of the former were our underweight of Barrick and Newmont Mining. An example of the latter is Gammon Lake Resources; an emerging Mexican producer with new production scheduled for the first half of 2006. In the precious materials sector, the Fund benefited from its holdings in Shore Gold, a Canadian developer of diamonds. Shore possesses an attractive deposit of high quality stones, at a time when industry observers are forecasting a shortage of gemstones after 2006. Performance was held back by holdings in Rio Narcea Gold and Hecla Mining. Rio Narcea faced delays in new mine production and fears of expropriation hurt Hecla.
Current Strategy and Outlook: As with several other commodities, the gold sector was starved for new investment during the “dot com” mania. This lack of investment resulted in falling mine supply, but also engineering talent lured toward the Silicon Valley dream. As a result the sector is scrambling to find the skills necessary for developing new sources of supply. In our view, given the long lead times, commodity prices in general and gold in particular should enjoy higher price levels for the near term.
Demand for jewelry in Asia, with special emphasis on China, is expected to continue to grow as consumers experience growth in disposable income. In the past, Japan was a significant consumer of gold and with the improved economic outlook in that country, consumption should resume.
The Fund plans to continue its past strategy of concentrating on intermediate and junior producers who possess attractive growth profiles in gold production. This dampens the impact of fluctuating gold prices and makes these companies attractive acquisition targets by larger companies seeking to replace reserves and increase production. We are encouraged by the strengthening fundamentals in the gold sector and believe the Fund is well positioned to benefit from these positive trends.
Top Five Industries |
As of October 31, 2005 |
(as a percent of net assets) |
| | | |
Gold Mining | | 69.7 | % |
| | | |
Metal - Diversified | | 7.8 | % |
| | | |
Diamonds/Precious Stones | | 5.6 | % |
| | | |
Precious Metals | | 5.6 | % |
| | | |
Diversified Minerals | | 4.1 | % |
Portfolio holdings are subject to change daily.
22
PORTFOLIO MANAGERS’ REPORT | | Ing Precious Metals Fund |

| | | | | | | | |
| Average Annual Total Returns for the Periods Ended October 31, 2005 | |
| | | | | | | | |
| | | 1 Year | | 5 Year | | 10 Year | |
| Including Sales Charge: | | | | | | | |
| Class A(1) | | 0.67 | % | | 25.90 | % | | 3.85 | % | |
| Excluding Sales Charge: | | | | | | | | | | |
| Class A | | 6.81 | % | | 27.40 | % | | 4.46 | % | |
| S&P 500 Composite Stock Price Index(2) | | 8.72 | % | | (1.74 | )% | | 9.34 | % | |
| FT Gold Mines Index(3) | | 1.18 | % | | 24.81 | % | | 0.41 | % | |
| Gold Bullion Commodity(4) | | 10.56 | % | | 12.21 | % | | 2.09 | % | |
| | | | | | | | |
Based on a $10,000 initial investment, the graph and table above illustrate the total return of ING Precious Metals Fund against the Indices indicated. An Index is unmanaged and has no cash in its portfolio, imposes no sales charge and incurs no operating expenses. An investor cannot invest directly in an index. The Fund’s performance is shown both with and without the imposition of sales charges.
The performance graph and table do not reflect the deduction of taxes that a shareholder will pay on Fund distributions or the redemption of Fund shares.
The performance shown may include the effect of fee waivers and/or expense reimbursements by the Investment Manager and/or other service providers, which have the effect of increasing total return. Had all fees and expenses been considered, the total returns would have been lower.
Performance data represents past performance and is no assurance of future results. Investment return and principal value of an investment in the Fund will fluctuate. Shares, when sold, may be worth more or less than their original cost. The Fund’s current performance may be lower or higher than the performance data shown. Please log on to www.ingfunds.com or call (800) 992-0180 to get performance through the most recent month end.
This report contains statements that may be “forward-looking” statements. Actual results may differ materially from those projected in the “forward-looking” statements.
The views expressed in this report reflect those of the portfolio managers, only through the end of the period as stated on the cover. The portfolio managers’ views are subject to change at any time based on market and other conditions.
Fund holdings are subject to change daily.
(1) Reflects deduction of the maximum Class A sales charge of 5.75%.
(2) The S&P 500 Composite Stock Price Index is an unmanaged index that measures the performance of securities of approximately 500 large-capitalization U.S. companies whose securities are traded on major U.S. stock markets.
(3) The FT Gold Mines Index® is an unmanaged cap weighted index that is designed to reflect the performance of the worldwide market in the shares of companies whose principal activity is the mining of gold.
(4) GOLD BULLION IS NOT AN INDEX. It is a commodity.
23
Ing Russia Fund | PORTFOLIO MANAGERS’ REPORT |
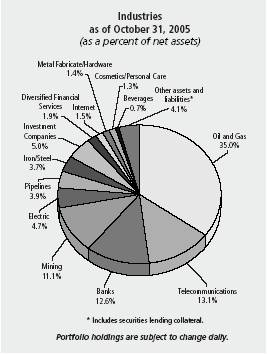
The ING Russia Fund (the “Fund”) seeks long-term capital appreciation through investment primarily in equity securities of Russian companies. The Fund is managed by Samuel Oubadia, Senior Portfolio Manager, Bernard Mignon, Senior Investment Manager, Emerging Market Equities, and Jan-Wim Derks, Director of Global Emerging Markets Equities, ING Investment Management Advisors B.V. — the Sub-Adviser.
Performance: For the year ended October 31, 2005, the Fund’s Class A shares, excluding sales charges, provided a total return of 33.98% compared to the Morgan Stanley Capital International Emerging Markets (“MSCI EM”) Index, the Russian Trading System (“RTS”) Index and the Moscow Times (“MTI”) Index, which returned 34.34% and 43.28% and 40.50%, respectively, for the same period.
Portfolio Specifics: At the start of the period under review, the Russian market was still coming to grips with the repercussions of the Yukos affair. These concerns preoccupied the market well into the start of 2005. About half-way through the current reporting period, the market was essentially flat. Then, in mid-May 2005, Russian equities began to take-off. The rally coincided with a large increase in the oil price, which saw Brent crude oil prices go from $45.00/barrel to about $68.00/barrel in mid-August 2005. While the oil price has since fallen off its highs, it remains well above its historical average. As such, it is not at all surprising that Russia’s oil stocks led the rally. Although the Fund had considerable exposure to the oil sector, (it was the Fund’s most heavily weighted sector) the Fund was underweight relative to the RTS Index.
Russia’s largest oil company, Lukoil, was also one of the market’s better performers. Lukoil’s strategic partner, Conoco-Philips (CP) of the US, has increased its stake in Lukoil to just under 15.0%. CP intends to raise its stake to 20.0%. Lukoil shares gained 76.8% during the period under review. The Fund was underweight in Lukoil for most of this period due to the fact that the stock had made up about 30.0% of the index. However, after a rebalancing of the RTS Index in July, leading to a sharp decrease in the weight of Lukoil in the index, the Fund moved to an overweight position in Lukoil.
Another of the Fund’s holdings in the oil sector was Tyumen Oil Company (TNK). TNK is close to completing its share swap that will allow current shareholders to swap their shares for a stake in TNK’s joint venture with BP. In light of the share swap, and the rally in the oil price, TNK shares gained more than 100.0% over the reporting period. The Fund held an overweight position in TNK throughout this period.
Outside of the oil sector, investors also looked for ways to gain exposure to Russia’s boom in personal consumption. Sberbank is Russia’s largest commercial bank and also boasts the country’s largest retail network. The bank recently released financial results which revealed a 47.0% increase in total loans. This, in part, led to a 91.8% in Sberbank’s share price in the reporting period. The Fund held a large position in the bank. However, after the RTS rebalancing, which resulted in an index weight of about 15.0%, the Fund was underweight in Sberbank. This hurt the performance of the fund relative to the benchmark.
Finally, the Fund held an overweight position in both of Russia’s listed mobile telecommunications operators, MTS and Vimpelcom. Although the number of subscribers continued to grow for both companies, earnings growth was not as strong as in previous periods. This was due to the higher marketing costs, and the lower average revenue per user (ARPU) associated with these new subscribers. MTS and Vimpelcom gained 2.0% and 5.0% respectively, thus holding back the Fund’s performance relative to the RTS Index.
Current Strategy and Outlook: With renewed fears of rising inflation and (further) interest rate hikes in the United States, Russian equities, along with many other emerging markets, suffered a sharp correction in the month of October 2005. By mid-October 2005 the Russian market has actually plunged almost 16.0% from its peak. The market later recovered some of those losses. The move served as reminder of how the performance of the Russian market is often vulnerable to external factors. Any further discussion suggesting that U.S. interest rates will rise by more than what is currently anticipated, may lead to more ‘dips’.
As mentioned, the most recent economic data in Russia point to strong growth in personal consumption and consumer spending. In light of these developments, the Fund will likely increase its weighting in stocks which are linked to domestic growth. There are now several retailers and consumer stocks, which provide investors with exposure to this surge in personal consumption. Another way of playing this theme is through the banking sector. Although there are currently limited ways of gaining exposure to this sector, the Fund may invest in banks that operate across the region, but have a strong presence in Russia.
Top Ten Holdings |
as of October 31, 2005 |
(as a percent of net assets) |
| | | |
LUKOIL | | 18.0 | % |
| | | |
MMC Norilsk Nickel | | 10.8 | % |
| | | |
Sberbank RF | | 10.5 | % |
| | | |
Surgutneftegaz | | 7.3 | % |
| | | |
Tatneft | | 4.2 | % |
| | | |
Transneft | | 3.9 | % |
| | | |
Unified Energy System | | 3.7 | % |
| | | |
Tyumen Oil Co. | | 2.8 | % |
| | | |
VolgaTelecom | | 2.5 | % |
| | | |
Mobile Telesystems OJSC | | 2.5 | % |
Portfolio holdings are subject to change daily.
24
PORTFOLIO MANAGERS’ REPORT | | Ing Russia Fund |
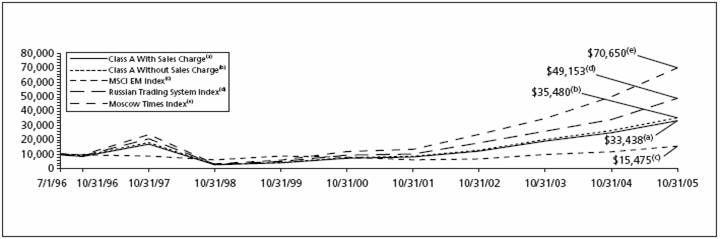
| | | | | | | | |
| Average Annual Total Returns for the Periods Ended October 31, 2005 | |
| | | | | | | | |
| | | | | | | Since Inception | |
| | | 1 Year | | 5 Year | | July 3, 1996 | |
| Including Sales Charge: | | | | | | | |
| Class A(1) | | 26.27 | % | | 34.86 | % | | 13.81 | % | |
| Excluding Sales Charge: | | | | | | | | | | |
| Class A | | 33.98 | % | | 36.47 | % | | 14.53 | % | |
| MSCI EM Index(2) | | 34.34 | % | | 14.64 | % | | 4.79 | %(3) | |
| Russian Trading System Index(4) | | 43.28 | % | | 37.66 | % | | 17.69 | %(3) | |
| Moscow Times Index(5) | | 40.50 | % | | 43.35 | % | | 22.56 | %(3) | |
| | | | | | | | |
| | | | | | | | | | | | | |
Based on a $10,000 initial investment, the graph and table above illustrate the total return of ING Russia Fund against the Indices indicated. An Index is unmanaged and has no cash in its portfolio, imposes no sales charge and incurs no operating expenses. An investor cannot invest directly in an index. The Fund’s performance is shown both with and without the imposition of sales charges.
The performance graph and table do not reflect the deduction of taxes that a shareholder will pay on Fund distributions or the redemption of Fund shares.
The performance shown may include the effect of fee waivers and/or expense reimbursements by the Investment Manager and/or other service providers, which have the effect of increasing total return. Had all fees and expenses been considered, the total returns would have been lower.
Performance data represents past performance and is no assurance of future results. Investment return and principal value of an investment in the Fund will fluctuate. Shares, when sold, may be worth more or less than their original cost. The Fund’s current performance may be lower or higher than the performance data shown. Please log on to www.ingfunds.com or call (800) 992-0180 to get performance through the most recent month end.
This report contains statements that may be “forward-looking” statements. Actual results may differ materially from those projected in the “forward-looking” statements.
The views expressed in this report reflect those of the portfolio managers, only through the end of the period as stated on the cover. The portfolio managers’ views are subject to change at any time based on market and other conditions.
Fund holdings are subject to change daily.
(1) Reflects deduction of the maximum Class A sales charge of 5.75%.
(2) The MSCI EM Index is an unmanaged index that measures the performance of securities listed on exchanges in developing nations throughout the world. The MSCI EM Index more closely tracks the types of securities in which the Fund invests than the Moscow Times Index and the Russian Trading System Index.
(3) Since inception performance for index is shown from July 1, 1996.
(4) The Russian Trading System Index is a capitalization-weighted index that is calculated in U.S. dollars. The index tracks the performance of Russia’s most active stocks traded on the Russian Trading System. The index is operated by the National Association of Participants in the Securities Markets, a non-profit body.
(5) The Moscow Times Index is an unmanaged index that measures the performance of 50 Russian stocks considered to represent the most liquid and most highly capitalized Russian stocks.
Redemptions on shares held less than 365 days are subject to a redemption fee of 2% of the redemption proceeds.
25
SHAREHOLDER EXPENSE EXAMPLES (UNAUDITED)
As a shareholder of a Fund, you incur two types of costs: (1) transaction costs, including sales charges (loads) on purchase payments; redemption fees; and exchange fees; and (2) ongoing costs, including management fees; distribution [and/or service] (12b—1) fees; and other Fund expenses. These Examples are intended to help you understand your ongoing costs (in dollars) of investing in a Fund and to compare these costs with the ongoing costs of investing in other mutual funds.
The Examples are based on an investment of $1,000 invested at the beginning of the period and held for the entire period from May 1, 2005 to October 31, 2005.
Actual Expenses
The first section of the table shown, “Actual Fund Return,” provides information about actual account values and actual expenses. You may use the information in this section, together with the amount you invested, to estimate the expenses that you paid over the period. Simply divide your account value by $1,000 (for example, an $8,600 account value divided by $1,000 = 8.6), then multiply the result by the number in the first section under the heading entitled “Expenses Paid During Period” to estimate the expenses you paid on your account during this period.
Hypothetical Example for Comparison Purposes
The second section of the table shown, “Hypothetical 5% Return,” provides information about hypothetical account values and hypothetical expenses based on the Fund’s actual expense ratio and an assumed rate of return of 5% per year before expenses, which is not the Fund’s actual return. The hypothetical account values and expenses may not be used to estimate the actual ending account balance or expenses you paid for the period. You may use this information to compare the ongoing costs of investing in the Fund and other funds. To do so, compare this 5% hypothetical example with the 5% hypothetical examples that appear in the shareholder reports of the other funds.
Please note that the expenses shown in the table are meant to highlight your ongoing costs only and do not reflect any transactional costs, such as sales charges (loads), redemption fees, or exchange fees. Therefore, the hypothetical lines of the table are useful in comparing ongoing costs only, and will not help you determine the relative total costs of owning different funds. In addition, if these transactional costs were included, your costs would have been higher.
| | | | | | | | | | |
| | | Beginning | | Ending | | | | Expenses Paid | |
| | | Account | | Account | | Annualized | | During the Six | |
| | | Value | | Value | | Expense | | Months Ended | |
| ING Global Equity Dividend Fund | | | May 1, 2005 | | | | October 31, 2005 | | | | Ratio | | | | October 31, 2005* | | |
| | | | | | | | | | |
| Actual Fund Return | | | | | | | | | |
| Class A | | $1,000.00 | | | $1,033.70 | | | 1.40 | % | | $ 7.18 | | |
| Class B | | 1,000.00 | | | 1,030.30 | | | 2.15 | | | 11.00 | | |
| Class C | | 1,000.00 | | | 1,029.70 | | | 2.15 | | | 11.00 | | |
| Hypothetical (Excluding Expenses) | | | | | | | | | | | | | |
| Class A | | $1,000.00 | | | $1,018.15 | | | 1.40 | % | | $ 7.12 | | |
| Class B | | 1,000.00 | | | 1,014.37 | | | 2.15 | | | 10.92 | | |
| Class C | | 1,000.00 | | | 1,014.37 | | | 2.15 | | | 10.92 | | |
| | | | | | | | | | | |
| | | | | | | | | | | | | | | | | | | | | | |
* Expenses are equal to each Fund’s respective annualized expense ratios multiplied by the average account value over the period, multiplied by 184/365 to reflect the most recent fiscal half-year.
26
SHAREHOLDER EXPENSE EXAMPLES (UNAUDITED) (CONTINUED)
| | | | | | | | | | |
| | | Beginning | | Ending | | | | Expenses Paid | |
| | | Account | | Account | | Annualized | | During the Six | |
| | | Value | | Value | | Expense | | Months Ended | |
| ING Global Real Estate Fund | | | May 1, 2005 | | | | October 31, 2005 | | | | Ratio | | | | October 31, 2005* | | |
| | | | | | | | | | |
| Actual Fund Return | | | | | | | | | |
| Class A | | $1,000.00 | | | $1,082.60 | | | 1.59 | % | | $ 8.35 | | |
| Class B | | 1,000.00 | | | 1,078.60 | | | 2.34 | | | 12.26 | | |
| Class C | | 1,000.00 | | | 1,078.00 | | | 2.34 | | | 12.26 | | |
| Hypothetical (Excluding Expenses) | | | | | | | | | | | | | |
| Class A | | $1,000.00 | | | $1,017.19 | | | 1.59 | % | | $ 8.08 | | |
| Class B | | 1,000.00 | | | 1,013.41 | | | 2.34 | | | 11.88 | | |
| Class C | | 1,000.00 | | | 1,013.41 | | | 2.34 | | | 11.88 | | |
| | | | | | | | | | | | | | |
| ING Global Value Choice Fund | | | | | | | | | | | | | |
| Actual Fund Return | | | | | | | | | | | | | |
| Class A | | $1,000.00 | | | $1,087.40 | | | 1.85 | % | | $ 9.73 | | |
| Class B | | 1,000.00 | | | 1,084.30 | | | 2.50 | | | 13.13 | | |
| Class C | | 1,000.00 | | | 1,084.30 | | | 2.50 | | | 13.13 | | |
| Hypothetical (Excluding Expenses) | | | | | | | | | | | | | |
| Class A | | $1,000.00 | | | $1,015.88 | | | 1.85 | % | | $ 9.40 | | |
| Class B | | 1,000.00 | | | 1,012.60 | | | 2.50 | | | 12.68 | | |
| Class C | | 1,000.00 | | | 1,012.60 | | | 2.50 | | | 12.68 | | |
| | | | | | | | | | | | | | |
| ING Emerging Countries Fund | | | | | | | | | | | | | |
| Actual Fund Return | | | | | | | | | | | | | |
| Class A | | $1,000.00 | | | $1,093.10 | | | 2.00 | % | | $10.55 | | |
| Class B | | 1,000.00 | | | 1,088.80 | | | 2.74 | | | 14.43 | | |
| Class C | | 1,000.00 | | | 1,088.90 | | | 2.74 | | | 14.43 | | |
| Class M | | 1,000.00 | | | 1,090.20 | | | 2.49 | | | 13.12 | | |
| Hypothetical (Excluding Expenses) | | | | | | | | | | | | | |
| Class A | | $1,000.00 | | | $1,015.12 | | | 2.00 | % | | $10.16 | | |
| Class B | | 1,000.00 | | | 1,011.39 | | | 2.74 | | | 13.89 | | |
| Class C | | 1,000.00 | | | 1,011.39 | | | 2.74 | | | 13.89 | | |
| Class M | | 1,000.00 | | | 1,012.65 | | | 2.49 | | | 12.63 | | |
| | | | | | | | | | | | | | |
| | | | | | | | | | | | | | | | | | | | | | |
* Expenses are equal to each Fund’s respective annualized expense ratios multiplied by the average account value over the period, multiplied by 184/365 to reflect the most recent fiscal half-year.
27
SHAREHOLDER EXPENSE EXAMPLES (UNAUDITED) (CONTINUED)
| | | | | | | | | | |
| | | Beginning | | Ending | | | | Expenses Paid | |
| | | Account | | Account | | Annualized | | During the Six | |
| | | Value | | Value | | Expense | | Months Ended | |
| ING Global Real Estate Fund | | | May 1, 2005 | | | | October 31, 2005 | | | | Ratio | | | | October 31, 2005* | | |
| | | | | | | | | | |
| Actual Fund Return | | | | | | | | | |
| Class A | | $1,000.00 | | | $1,110.40 | | | 1.68 | % | | $ 8.94 | | |
| Class B | | 1,000.00 | | | 1,106.50 | | | 2.43 | | | 12.90 | | |
| Class C | | 1,000.00 | | | 1,106.30 | | | 2.43 | | | 12.90 | | |
| Hypothetical (Excluding Expenses) | | | | | | | | | | | | | |
| Class A | | $1,000.00 | | | $1,016.74 | | | 1.68 | % | | $ 8.54 | | |
| Class B | | 1,000.00 | | | 1,012.96 | | | 2.43 | | | 12.33 | | |
| Class C | | 1,000.00 | | | 1,012.96 | | | 2.43 | | | 12.33 | | |
| | | | | | | | | | | | | | |
| ING International Fund | | | | | | | | | | | | | |
| Actual Fund Return | | | | | | | | | | | | | |
| Class A | | $1,000.00 | | | $1,075.50 | | | 1.65 | % | | $ 8.63 | | |
| Class B | | 1,000.00 | | | 1,071.10 | | | 2.40 | | | 12.53 | | |
| Class C | | 1,000.00 | | | 1,070.00 | | | 2.40 | | | 12.52 | | |
| Hypothetical (Excluding Expenses) | | | | | | | | | | | | | |
| Class A | | $1,000.00 | | | $1,016.89 | | | 1.65 | % | | $ 8.39 | | |
| Class B | | 1,000.00 | | | 1,013.11 | | | 2.40 | | | 12.18 | | |
| Class C | | 1,000.00 | | | 1,013.11 | | | 2.40 | | | 12.18 | | |
| | | | | | | | | | | | | | |
| ING International SmallCap Fund | | | | | | | | | | | | | |
| Actual Fund Return | | | | | | | | | | | | | |
| Class A | | $1,000.00 | | | $1,154.80 | | | 1.74 | % | | $ 9.45 | | |
| Class B | | 1,000.00 | | | 1,151.20 | | | 2.39 | | | 12.96 | | |
| Class C | | 1,000.00 | | | 1,151.00 | | | 2.39 | | | 12.96 | | |
| Hypothetical (Excluding Expenses) | | | | | | | | | | | | | |
| Class A | | $1,000.00 | | | $1,016.43 | | | 1.74 | % | | $ 8.84 | | |
| Class B | | 1,000.00 | | | 1,013.16 | | | 2.39 | | | 12.13 | | |
| Class C | | 1,000.00 | | | 1,013.16 | | | 2.39 | | | 12.13 | | |
| | | | | | | | | | | | | | |
| | | | | | | | | | | | | | | | | | | | | | |
* Expenses are equal to each Fund’s respective annualized expense ratios multiplied by the average account value over the period, multiplied by 184/365 to reflect the most recent fiscal half-year.
28
SHAREHOLDER EXPENSE EXAMPLES (UNAUDITED) (CONTINUED)
| | | | | | | | | | |
| | | Beginning | | Ending | | | | Expenses Paid | |
| | | Account | | Account | | Annualized | | During the Six | |
| | | Value | | Value | | Expense | | Months Ended | |
| ING Global Real Estate Fund | | | May 1, 2005 | | | | October 31, 2005 | | | | Ratio | | | | October 31, 2005* | | |
| | | | | | | | | | |
| Actual Fund Return | | | | | | | | | |
| Class A | | $1,000.00 | | | $1,087.80 | | | 1.60 | % | | $ 8.42 | | |
| Class B | | 1,000.00 | | | 1,083.90 | | | 2.30 | | | 12.08 | | |
| Class C | | 1,000.00 | | | 1,084.10 | | | 2.30 | | | 12.08 | | |
| Hypothetical (Excluding Expenses) | | | | | | | | | | | | | |
| Class A | | $1,000.00 | | | $1,017.14 | | | 1.60 | % | | $ 8.13 | | |
| Class B | | 1,000.00 | | | 1,013.61 | | | 2.30 | | | 11.67 | | |
| Class C | | 1,000.00 | | | 1,013.61 | | | 2.30 | | | 11.67 | | |
| | | | | | | | | | | | | | |
| ING International Value Choice Fund | | | | | | | | | | | | |
| Actual Fund Return | | | | | | | | | | | | | |
| Class A | | $1,000.00 | | | $1,100.80 | | | 1.70 | % | | $ 9.00 | | |
| Class B | | 1,000.00 | | | 1,096.80 | | | 2.45 | | | 12.95 | | |
| Class C | | 1,000.00 | | | 1,096.70 | | | 2.45 | | | 12.95 | | |
| Hypothetical (Excluding Expenses) | | | | | | | | | | | | | |
| Class A | | $1,000.00 | | | $1,016.64 | | | 1.70 | % | | $ 8.64 | | |
| Class B | | 1,000.00 | | | 1,012.85 | | | 2.45 | | | 12.43 | | |
| Class C | | 1,000.00 | | | 1,012.85 | | | 2.45 | | | 12.43 | | |
| | | | | | | | | | | | | | |
| ING Precious Metals Fund | | | | | | | | | | | | | |
| Actual Fund Return | | $1,000.00 | | | $1,274.30 | | | 1.56 | % | | $ 8.94 | | |
| Hypothetical (Excluding Expenses) | | $1,000.00 | | | $1,017.34 | | | 1.56 | % | | $ 7.93 | | |
| | | | | | | | | | | | | | |
| ING Russia Fund | | | | | | | | | | | | | |
| Actual Fund Return | | $1,000.00 | | | $1,350.40 | | | 2.13 | % | | $12.62 | | |
| Hypothetical (Excluding Expenses) | | $1,000.00 | | | $1,014.47 | | | 2.13 | % | | $10.82 | | |
| | | | | | | | | | | | | | |
| | | | | | | | | | | | | | | | | | | | | | |
* Expenses are equal to each Fund’s respective annualized expense ratios multiplied by the average account value over the period, multiplied by 184/365 to reflect the most recent fiscal half-year.
29
REPORT OF INDEPENDENT REGISTERED PUBLIC ACCOUNTING FIRM
The Board of Trustees and Shareholders
ING Mutual Funds and ING Mayflower Trust
We have audited the accompanying statements of assets and liabilities, including the portfolios of investments, of ING Global Equity Dividend Fund, ING Global Real Estate Fund, ING Global Value Choice Fund (formerly ING Worldwide Growth Fund), ING Emerging Countries Fund, ING Foreign Fund, ING International Fund, ING International SmallCap Fund (formerly ING International SmallCap Growth Fund), ING International Value Choice Fund, ING Precious Metals Fund, and ING Russia Fund, each a series of ING Mutual Funds, and ING International Value Fund, a series of ING Mayflower Trust, as of October 31, 2005, and the related statements of operations for the year or period then ended, the statements of changes in net assets for each of the years or periods in the two-year period then ended, and the financial highlights for each of the years or periods in the three-year period then ended. These financial statements and financial highlights are the responsibility of management. Our responsibility is to express an opinion on these financial statements and financial highlights based on our audits. The financial highlights for each of the years or periods prior to November 1, 2002 were audited by other auditors whose report thereon, dated December 17, 2002, expressed an unqualified opinion on those financial highlights.
We conducted our audits in accordance with the standards of the Public Company Accounting Oversight Board (United States). Those standards require that we plan and perform the audits to obtain reasonable assurance about whether the financial statements and financial highlights are free of material misstatement. An audit includes examining, on a test basis, evidence supporting the amounts and disclosures in the financial statements. Our procedures included confirmation of securities owned as of October 31, 2005 by correspondence with the custodian and brokers, or by other appropriate auditing procedures. An audit also includes assessing the accounting principles used and significant estimates made by management, as well as evaluating the overall financial statement presentation. We believe that our audits provide a reasonable basis for our opinion.
In our opinion, the financial statements and financial highlights referred to above present fairly, in all material respects, the financial position of ING Global Equity Dividend Fund, ING Global Real Estate Fund, ING Global Value Choice Fund, ING Emerging Countries Fund, ING Foreign Fund, ING International Fund, ING International SmallCap Fund, ING International Value Choice Fund, ING Precious Metals Fund, ING Russia Fund and ING International Value Fund as of October 31, 2005, and the results of their operations, the changes in their net assets, and their financial highlights for the periods specified in the first paragraph above, in conformity with U.S. generally accepted accounting principles.

Boston, Massachusets
December 22, 2005
30
STATEMENTS OF ASSETS AND LIABILITIES AS OF OCTOBER 31, 2005
| | ING | | ING | | ING | | ING | |
| | Global Equity | | Global | | Global | | Emerging | |
| | Dividend | | Real Estate | | Value Choice | | Countries | |
| | Fund | | Fund | | Fund | | Fund | |
ASSETS: | | | | | | | | | | | | | |
Investments in securities at value+* | | $ | 146,587,299 | | $ | 174,200,130 | | $ | 97,494,287 | | $ | 122,362,835 | |
Investment in affiliate** | | — | | 2,663,341 | | — | | — | |
Short-term investments at amortized cost | | — | | — | | 6,636,000 | | 19,481,000 | |
Cash | | 2,732,866 | | 4,002,656 | | 3,268,679 | | 4,983,923 | |
Foreign currencies at value*** | | 114,373 | | 453,952 | | 23,995 | | 4,722,120 | |
Receivables: | | | | | | | | | |
Investment securities sold | | 1,448,576 | | — | | 608,894 | | — | |
Fund shares sold | | 1,317,834 | | 952,275 | | 33,898 | | 600,195 | |
Dividends and interest | | 168,886 | | 370,365 | | 221,028 | | 604,342 | |
Prepaid expenses | | 24,957 | | 27,397 | | 16,056 | | 23,678 | |
Total assets | | 152,394,791 | | 182,670,116 | | 108,302,837 | | 152,778,093 | |
LIABILITIES: | | | | | | | | | |
Payable for investment securities purchased | | 770,231 | | 1,832,055 | | 248,722 | | — | |
Payable for fund shares redeemed | | 360,120 | | 251,344 | | 362,726 | | 193,817 | |
Payable upon receipt of securities loaned | | — | | — | | 6,636,000 | | 19,481,000 | |
Payable to affiliates | | 212,222 | | 227,077 | | 161,127 | | 201,706 | |
Payable for trustee fees | | 1,889 | | 2,140 | | 38,040 | | 71,305 | |
Other accrued expenses and liabilities | | 87,594 | | 70,863 | | 127,280 | | 154,159 | |
Total liabilities | | 1,432,056 | | 2,383,479 | | 7,573,895 | | 20,101,987 | |
NET ASSETS | | $ | 150,962,735 | | $ | 180,286,637 | | $ | 100,728,942 | | $ | 132,676,106 | |
NET ASSETS WERE COMPRISED OF: | | | | | | | | | |
Paid-in capital | | $ | 147,968,717 | | $ | 145,023,060 | | $ | 286,806,785 | | $ | 189,097,429 | |
Undistributed net investment income
(accumulated net investment loss) | | 80,039 | | (3,067,440 | ) | 396,508 | | 670,204 | |
Accumulated net realized gain (loss) on investments
and foreign currency related transactions | | 2,013,920 | | 12,000,328 | | (190,054,701 | ) | (60,910,593 | ) |
Net unrealized appreciation on investments and
foreign currency related transactions | | 900,059 | | 26,330,689 | | 3,580,350 | | 3,819,066 | |
NET ASSETS | | $ | 150,962,735 | | $ | 180,286,637 | | $ | 100,728,942 | | $ | 132,676,106 | |
+ | | Including securities loaned at value | | $ | — | | $ | — | | $ | 6,412,204 | | $ | 18,758,086 | |
* | | Cost of investments in securities | | $ | 145,686,127 | | $ | 147,918,813 | | $ | 93,910,959 | | $ | 118,623,108 | |
** | | Cost of investment in affiliate | | $ | — | | $ | 2,611,784 | | $ | — | | $ | — | |
*** | | Cost of foreign currencies | | $ | 114,898 | | $ | 454,090 | | $ | 24,069 | | $ | 4,639,658 | |
See Accompanying Notes to Financial Statements
31
STATEMENTS OF ASSETS AND LIABILITIES AS OF OCTOBER 31, 2005 (CONTINUED)
| | ING | | ING | | ING | | ING | |
| | Global Equity | | Global | | Global | | Emerging | |
| | Dividend | | Real Estate | | Value Choice | | Countries | |
| | Fund | | Fund | | Fund | | Fund | |
Class A: | | | | | | | | | |
Net Assets | | $ | 73,186,239 | | $ | 138,313,993 | | $ | 41,940,766 | | $ | 87,142,666 | |
Shares authorized | | unlimited | | unlimited | | unlimited | | unlimited | |
Par value | | $ | 0.00 | | $ | 0.00 | | $ | 0.00 | | $ | 0.00 | |
Shares outstanding | | 5,599,733 | | 8,069,210 | | 2,309,102 | | 3,692,533 | |
Net asset value and redemption price per share | | $ | 13.07 | | $ | 17.14 | | $ | 18.16 | | $ | 23.60 | |
Maximum offering price per share (5.75%)(1) | | $ | 13.87 | | $ | 18.19 | | $ | 19.27 | | $ | 25.04 | |
| | | | | | | | | |
Class B: | | | | | | | | | |
Net Assets | | $ | 28,811,430 | | $ | 12,302,242 | | $ | 23,483,290 | | $ | 12,562,235 | |
Shares authorized | | unlimited | | unlimited | | unlimited | | unlimited | |
Par value | | $ | 0.00 | | $ | 0.00 | | $ | 0.00 | | $ | 0.00 | |
Shares outstanding | | 2,208,331 | | 819,716 | | 1,193,803 | | 542,117 | |
Net asset value and redemption price per share(2) | | $ | 13.05 | | $ | 15.01 | | $ | 19.67 | | $ | 23.17 | |
Maximum offering price per share | | $ | 13.05 | | $ | 15.01 | | $ | 19.67 | | $ | 23.17 | |
| | | | | | | | | |
Class C: | | | | | | | | | |
Net Assets | | $ | 48,965,066 | | $ | 27,989,250 | | $ | 30,918,348 | | $ | 20,985,203 | |
Shares authorized | | unlimited | | unlimited | | unlimited | | unlimited | |
Par value | | $ | 0.00 | | $ | 0.00 | | $ | 0.00 | | $ | 0.00 | |
Shares outstanding | | 3,759,531 | | 1,788,316 | | 1,766,465 | | 952,145 | |
Net asset value and redemption price per share(2) | | $ | 13.02 | | $ | 15.65 | | $ | 17.50 | | $ | 22.04 | |
Maximum offering price per share | | $ | 13.02 | | $ | 15.65 | | $ | 17.50 | | $ | 22.04 | |
| | | | | | | | | |
Class M: | | | | | | | | | |
Net Assets | | n/a | | n/a | | n/a | | $ | 1,210,374 | |
Shares authorized | | n/a | | n/a | | n/a | | unlimited | |
Par value | | n/a | | n/a | | n/a | | $ | 0.00 | |
Shares outstanding | | n/a | | n/a | | n/a | | 52,162 | |
Net asset value and redemption price per share | | n/a | | n/a | | n/a | | $ | 23.20 | |
Maximum offering price per share (3.50%)(3) | | n/a | | n/a | | n/a | | $ | 24.04 | |
| | | | | | | | | |
Class I: | | | | | | | | | |
Net Assets | | n/a | | $ | 1,681,152 | | n/a | | n/a | |
Shares authorized | | n/a | | unlimited | | n/a | | n/a | |
Par value | | n/a | | $ | 0.00 | | n/a | | n/a | |
Shares outstanding | | n/a | | 98,101 | | n/a | | n/a | |
Net asset value and redemption price per share | | n/a | | $ | 17.14 | | n/a | | n/a | |
Maximum offering price per share | | n/a | | $ | 17.14 | | n/a | | n/a | |
| | | | | | | | | |
Class Q: | | | | | | | | | |
Net Assets | | n/a | | n/a | | $ | 4,386,538 | | $ | 10,775,628 | |
Shares authorized | | n/a | | n/a | | unlimited | | unlimited | |
Par value | | n/a | | n/a | | $ | 0.00 | | $ | 0.00 | |
Shares outstanding | | n/a | | n/a | | 206,448 | | 441,990 | |
Net asset value and redemption price per share | | n/a | | n/a | | $ | 21.25 | | $ | 24.38 | |
Maximum offering price per share | | n/a | | n/a | | $ | 21.25 | | $ | 24.38 | |
(1) | Maximum offering price is computed at 100/94.25 of net asset value. On purchases of $50,000 or more, the offering price is reduced. |
(2) | Redemption price per share may be reduced for any applicable contingent deferred sales charges. |
(3) | Maximum offering price is comuted at 100/96.50 of net asset value. On purchases of $50,000 or more, the offering price is reduced. |
See Accompanying Notes to Financial Statements
32
STATEMENTS OF ASSETS AND LIABILITIES AS OF OCTOBER 31, 2005 (CONTINUED)
| | | | | | ING | | ING | |
| | ING | | ING | | International | | International | |
| | Foreign | | International | | SmallCap | | Value | |
| | Fund | | Fund | | Fund | | Fund | |
ASSETS: | | | | | | | | | |
Investments in securities at value+* | | $ | 217,260,206 | | $ | 115,751,131 | | $ | 333,759,396 | | $ | 4,021,654,583 | |
Short-term investments at amortized cost | | 4,949,000 | | 4,871,000 | | 57,748,000 | | 104,511,000 | |
Repurchase agreement | | — | | 4,462,000 | | — | | — | |
Cash | | 9,317,785 | | 108 | | 6,352,256 | | 38,602,717 | |
Foreign currencies at value** | | 10,559,977 | | 2,931 | | 47,913 | | — | |
Receivables: | | | | | | | | | |
Investment securities sold | | 2,400,054 | | 126,892 | | 49,768 | | — | |
Fund shares sold | | 1,801,941 | | 218,438 | | 880,104 | | 3,453,548 | |
Dividends and interest | | 251,763 | | 371,101 | | 1,480,731 | | 8,560,301 | |
Unrealized appreciation on forward foreign currency contracts | | 283,814 | | — | | — | | — | |
Prepaid expenses | | 24,493 | | 22,922 | | 27,342 | | 56,495 | |
Total assets | | 246,849,033 | | 125,826,523 | | 400,345,510 | | 4,176,838,644 | |
| | | | | | | | | |
LIABILITIES: | | | | | | | | | |
Payable for investment securities purchased | | 3,895,017 | | — | | — | | — | |
Payable for fund shares redeemed | | 173,135 | | 124,263 | | 782,941 | | 8,311,190 | |
Payable upon receipt of securities loaned | | 4,949,000 | | 4,871,000 | | 57,748,000 | | 104,511,000 | |
Unrealized depreciation on forward foreign currency contracts | | 1,435,470 | | — | | — | | — | |
Payable to affiliates | | 340,831 | | 152,918 | | 476,128 | | 5,202,694 | |
Payable to custodian due to foreign currency overdraft*** | | — | | — | | — | | 491 | |
Payable for trustee fees | | 1,531 | | 37,081 | | 6,548 | | 27,134 | |
Other accrued expenses and liabilities | | 222,994 | | 106,581 | | 322,293 | | 2,170,225 | |
Total liabilities | | 11,017,978 | | 5,291,843 | | 59,335,910 | | 120,222,734 | |
NET ASSETS | | $ | 235,831,055 | | $ | 120,534,680 | | $ | 341,009,600 | | $ | 4,056,615,910 | |
| | | | | | | | | |
NET ASSETS WERE COMPRISED OF: | | | | | | | | | |
Paid-in capital | | $ | 199,779,225 | | $ | 121,128,046 | | $ | 362,281,102 | | $ | 3,167,036,667 | |
Undistributed net investment income | | 1,106,905 | | 1,737,694 | | 2,368,780 | | 31,576,663 | |
Accumulated net realized gain (loss) on investments and foreign currency related transactions | | 4,898,594 | | (10,920,904 | ) | (64,239,012 | ) | 303,993,604 | |
Net unrealized appreciation on investments and foreign currency related transactions | | 30,046,331 | | 8,589,844 | | 40,598,730 | | 554,008,976 | |
NET ASSETS | | $ | 235,831,055 | | $ | 120,534,680 | | $ | 341,009,600 | | $ | 4,056,615,910 | |
+ | | Including securities loaned at value | | $ | 4,912,810 | | $ | 4,778,120 | | $ | 54,813,594 | | $ | 98,489,416 | |
* | | Cost of investments in securities | | $ | 185,981,660 | | $ | 107,153,960 | | $ | 293,153,130 | | $ | 3,467,551,238 | |
** | | Cost of foreign currencies | | $ | 10,611,329 | | $ | 2,965 | | $ | 47,974 | | $ | — | |
*** | | Cost of foreign currencies overdraft | | $ | — | | $ | — | | $ | — | | $ | (1,570 | ) |
See Accompanying Notes to Financial Statements
33
STATEMENTS OF ASSETS AND LIABILITIES AS OF OCTOBER 31, 2005 (CONTINUED)
| | | | | | ING | | ING | |
| | ING | | ING | | International | | International | |
| | Foreign | | International | | SmallCap | | Value | |
| | Fund | | Fund | | Fund | | Fund | |
Class A: | | | | | | | | | |
Net Assets | | $ | 122,882,860 | | $ | 51,192,568 | | $ | 173,612,100 | | $ | 1,732,331,829 | |
Shares authorized | | unlimited | | unlimited | | unlimited | | unlimited | |
Par value | | $ | 0.00 | | $ | 0.00 | | $ | 0.00 | | $ | 0.01 | |
Shares outstanding | | 8,309,121 | | 4,667,084 | | 4,598,867 | | 94,508,267 | |
Net asset value and redemption price per share | | $ | 14.79 | | $ | 10.97 | | $ | 37.75 | | $ | 18.33 | |
Maximum offering price per share (5.75%)(1) | | $ | 15.69 | | $ | 11.64 | | $ | 40.05 | | $ | 19.45 | |
| | | | | | | | | |
Class B: | | | | | | | | | |
Net Assets | | $ | 22,943,553 | | $ | 16,338,052 | | $ | 57,130,991 | | $ | 411,070,804 | |
Shares authorized | | unlimited | | unlimited | | unlimited | | unlimited | |
Par value | | $ | 0.00 | | $ | 0.00 | | $ | 0.00 | | $ | 0.01 | |
Shares outstanding | | 1,577,387 | | 1,548,728 | | 1,471,364 | | 22,898,409 | |
Net asset value and redemption price per share(2) | | $ | 14.55 | | $ | 10.55 | | $ | 38.83 | | $ | 17.95 | |
Maximum offering price per share | | $ | 14.55 | | $ | 10.55 | | $ | 38.83 | | $ | 17.95 | |
| | | | | | | | | |
Class C: | | | | | | | | | |
Net Assets | | $ | 87,876,761 | | $ | 15,008,117 | | $ | 52,420,317 | | $ | 663,625,648 | |
Shares authorized | | unlimited | | unlimited | | unlimited | | unlimited | |
Par value | | $ | 0.00 | | $ | 0.00 | | $ | 0.00 | | $ | 0.01 | |
Shares outstanding | | 6,032,288 | | 1,422,269 | | 1,472,722 | | 37,059,693 | |
Net asset value and redemption price per share(2) | | $ | 14.57 | | $ | 10.55 | | $ | 35.59 | | $ | 17.91 | |
Maximum offering price per share | | $ | 14.57 | | $ | 10.55 | | $ | 35.59 | | $ | 17.91 | |
| | | | | | | | | |
Class I: | | | | | | | | | |
Net Assets | | $ | 1,048,708 | | $ | 23,452,303 | | n/a | | $ | 1,221,594,290 | |
Shares authorized | | unlimited | | unlimited | | n/a | | unlimited | |
Par value | | $ | 0.00 | | $ | 0.00 | | n/a | | $ | 0.01 | |
Shares outstanding | | 70,257 | | 2,144,563 | | n/a | | 66,448,514 | |
Net asset value and redemption price per share | | $ | 14.93 | | $ | 10.94 | | n/a | | $ | 18.38 | |
Maximum offering price per share | | $ | 14.93 | | $ | 10.94 | | n/a | | $ | 18.38 | |
| | | | | | | | | |
Class Q: | | | | | | | | | |
Net Assets | | $ | 1,079,173 | | $ | 14,543,640 | | $ | 57,846,192 | | $ | 27,993,339 | |
Shares authorized | | unlimited | | unlimited | | unlimited | | unlimited | |
Par value | | $ | 0.00 | | $ | 0.00 | | $ | 0.00 | | $ | 0.01 | |
Shares outstanding | | 72,799 | | 1,335,418 | | 1,427,224 | | 1,524,074 | |
Net asset value and redemption price per share | | $ | 14.82 | | $ | 10.89 | | $ | 40.53 | | $ | 18.37 | |
Maximum offering price per share | | $ | 14.82 | | $ | 10.89 | | $ | 40.53 | | $ | 18.37 | |
(1) | Maximum offering price is computed at 100/94.25 of net asset value. On purchases of $50,000 or more, the offering price is reduced. |
(2) | Redemption price per share may be reduced for any applicable contingent deferred sales charges. |
See Accompanying Notes to Financial Statements
34
STATEMENTS OF ASSETS AND LIABILITIES AS OF OCTOBER 31, 2005 (CONTINUED)
| | ING | | ING | | | |
| | International | | Precious | | ING | |
| | Value Choice | | Metals | | Russia | |
| | Fund | | Fund | | Fund | |
ASSETS: | | | | | | | |
Investments in securities at value+* | | $ | 7,968,103 | | $ | 85,673,188 | | $ | 260,567,790 | |
Short-term investments at amortized cost | | — | | — | | 29,251,000 | |
Repurchase agreement | | — | | 1,881,000 | | — | |
Cash | | 799,022 | | 1,611 | | 9,460,390 | |
Foreign currencies at value** | | — | | 1,957 | | — | |
Receivables: | | | | | | | |
Investment securities sold | | 573 | | — | | 336,500 | |
Fund shares sold | | 907,272 | | 119,406 | | 1,670,566 | |
Dividends and interest | | 13,433 | | 24,259 | | 1,195,778 | |
Prepaid expenses | | 54,651 | | 6,545 | | 10,705 | |
Reimbursement due from manager | | 3,657 | | — | | — | |
Total assets | | 9,746,711 | | 87,707,966 | | 302,492,729 | |
| | | | | | | |
LIABILITIES: | | | | | | | |
Payable for investment securities purchased | | 167,957 | | — | | — | |
Payable for fund shares redeemed | | — | | 24,883 | | 682,403 | |
Payable upon receipt of securities loaned | | — | | — | | 29,251,000 | |
Payable to affiliates | | 17,828 | | 93,494 | | 376,710 | |
Payable to custodian due to bank overdraft*** | | 160,690 | | — | | — | |
Payable for trustee fees | | 459 | | 71,179 | | 35,822 | |
Other accrued expenses and liabilities | | 61,196 | | 77,641 | | 544,043 | |
Total liabilities | | 408,130 | | 267,197 | | 30,889,978 | |
NET ASSETS | | $ | 9,338,581 | | $ | 87,440,769 | | $ | 271,602,751 | |
| | | | | | | |
NET ASSETS WERE COMPRISED OF: | | | | | | | |
Paid-in capital | | $ | 8,830,552 | | $ | 107,759,570 | | $ | 178,002,777 | |
Undistributed net investment income (accumulated net investment loss) | | 90,092 | | 136,516 | | — | |
Accumulated net realized gain (loss) on investments and foreign currency related transactions | | 160,627 | | (37,011,925 | ) | (3,579,592 | ) |
Net unrealized appreciation on investments and foreign currency related transactions | | 257,310 | | 16,556,608 | | 97,179,566 | |
NET ASSETS | | $ | 9,338,581 | | $ | 87,440,769 | | $ | 271,602,751 | |
+ | | Includes securities loaned at value | | $ | — | | $ | — | | $ | 29,101,252 | |
* | | Cost of investments in securities | | $ | 7,711,615 | | $ | 69,116,566 | | $ | 163,388,224 | |
** | | Cost of foreign currencies | | $ | — | | $ | 1,971 | | $ | — | |
*** | | Cost of foreign currencies overdraft | | $ | (160,690 | ) | $ | — | | $ | — | |
See Accompanying Notes to Financial Statements
35
STATEMENTS OF ASSETS AND LIABILITIES AS OF OCTOBER 31, 2005 (CONTINUED)
| | ING | | ING | | | |
| | International | | Precious | | ING | |
| | Value Choice | | Metals | | Russia | |
| | Fund | | Fund | | Fund | |
Class A: | | | | | | | |
Net Assets | | $ | 6,114,897 | | $ | 87,440,769 | | $ | 271,602,751 | |
Shares authorized | | unlimited | | unlimited | | unlimited | |
Par value | | $ | 0.00 | | $ | 0.00 | | $ | 0.00 | |
Shares outstanding | | 571,228 | | 11,909,406 | | 8,109,724 | |
Net asset value and redemption price per share | | $ | 10.70 | | $ | 7.34 | | $ | 33.49 | |
Maximum offering price per share (5.75%)(1) | | $ | 11.35 | | $ | 7.79 | | $ | 35.53 | |
| | | | | | | |
Class B: | | | | | | | |
Net Assets | | $ | 1,427,381 | | n/a | | n/a | |
Shares authorized | | unlimited | | n/a | | n/a | |
Par value | | $ | 0.00 | | n/a | | n/a | |
Shares outstanding | | 134,074 | | n/a | | n/a | |
Net asset value and redemption price per share(2) | | $ | 10.65 | | n/a | | n/a | |
Maximum offering price per share | | $ | 10.65 | | n/a | | n/a | |
| | | | | | | |
Class C: | | | | | | | |
Net Assets | | $ | 1,796,303 | | n/a | | n/a | |
Shares authorized | | unlimited | | n/a | | n/a | |
Par value | | $ | 0.00 | | n/a | | n/a | |
Shares outstanding | | 168,516 | | n/a | | n/a | |
Net asset value and redemption price per share(2) | | $ | 10.66 | | n/a | | n/a | |
Maximum offering price per share | | $ | 10.66 | | n/a | | n/a | |
(1) | Maximum offering price is computed at 100/94.25 of net asset value. On purchases of $50,000 or more, the offering price is reduced. |
(2) | Redemption price per share may be reduced for any applicable contingent deferred sales charges. |
See Accompanying Notes to Financial Statements
36
STATEMENTS OF OPERATIONS FOR THE YEAR ENDED OCTOBER 31, 2005
| | ING | | ING | | ING | | ING | |
| | Global Equity | | Global | | Global | | Emerging | |
| | Dividend | | Real Estate | | Value Choice | | Countries | |
| | Fund | | Fund | | Fund | | Fund | |
INVESTMENT INCOME: | | | | | | | | |
Dividends, net of foreign taxes withheld* | | $ | 4,094,979 | | $ | 4,228,882 | | $ | 2,379,392 | | $ | 2,865,702 | |
Interest | | 430,524 | | 116,406 | | 132,408 | | 420,236 | |
Securities lending income | | — | | — | | 10,253 | | 40,595 | |
Total investment income | | 4,525,503 | | 4,345,288 | | 2,522,053 | | 3,326,533 | |
| | | | | | | | | |
EXPENSES: | | | | | | | | | |
Investment management fees | | 635,302 | | 1,375,038 | | 1,091,559 | | 1,424,134 | |
Distribution and service fees: | | | | | | | | | |
Class A | | 113,984 | | 275,873 | | 157,468 | | 265,309 | |
Class B | | 174,679 | | 86,945 | | 262,084 | | 132,025 | |
Class C | | 276,959 | | 177,802 | | 337,539 | | 135,235 | |
Class M | | — | | — | | — | | 12,092 | |
Class Q | | — | | — | | 10,505 | | 25,481 | |
Transfer agent fees: | | | | | | | | | |
Class A | | 53,204 | | 52,910 | | 99,749 | | 135,735 | |
Class B | | 20,387 | | 4,167 | | 58,079 | | 23,617 | |
Class C | | 32,342 | | 8,512 | | 75,142 | | 24,266 | |
Class M | | — | | — | | — | | 2,208 | |
Class I | | — | | 84 | | — | | — | |
Class Q | | — | | — | | 1,088 | | 4,203 | |
Administrative service fees | | 90,757 | | 137,502 | | 109,155 | | 113,930 | |
Shareholder reporting expense | | 9,417 | | 32,065 | | 102,819 | | 44,387 | |
Registration fees | | 51,639 | | 58,324 | | 53,010 | | 64,535 | |
Professional fees | | 7,039 | | 20,675 | | 20,232 | | 18,150 | |
Custody and accounting expense | | 33,643 | | 22,235 | | 47,840 | | 90,429 | |
Trustee fees | | 456 | | 3,953 | | 5,247 | | 4,056 | |
Insurance expense | | 259 | | 1,697 | | 1,851 | | 1,598 | |
Miscellaneous expense | | 3,580 | | 7,825 | | 12,650 | | 14,311 | |
Total expenses | | 1,503,647 | | 2,265,607 | | 2,446,017 | | 2,535,701 | |
Net recouped (waived and reimbursed) fees | | 106,078 | | 112,929 | | (48,215 | ) | (67,496 | ) |
Net expenses | | 1,609,725 | | 2,378,536 | | 2,397,802 | | 2,468,205 | |
Net investment income | | 2,915,778 | | 1,966,752 | | 124,251 | | 858,328 | |
| | | | | | | | | |
REALIZED AND UNREALIZED GAIN (LOSS) | | | | | | | | | |
ON INVESTMENTS AND FOREIGN
CURRENCY RELATED TRANSACTIONS: | | | | | | | | | |
Net realized gain (loss) on: | | | | | | | | | |
Investments | | 2,056,907 | | 12,517,088 | | 25,260,163 | | 46,026,281 | |
Foreign currency related transactions | | (369,163 | ) | (353,065 | ) | (126,821 | ) | (167,217 | ) |
Payment by affiliate | | — | | — | | 8,840 | | 266,176 | |
Net realized gain on investments, foreign currency related transactions and payment by affiliate | | 1,687,744 | | 12,164,023 | | 25,142,182 | | 46,125,240 | |
Net change in unrealized appreciation or depreciation on: | | | | | | | | | |
Investments | | (344,958 | ) | 10,843,158 | | (11,141,392 | ) | (26,295,657 | ) |
Foreign currency related transactions | | 409 | | 2,092 | | (30,426 | ) | (60,697 | ) |
Net change in unrealized appreciation or depreciation on investments and foreign currency related transactions | | (344,549 | ) | 10,845,250 | | (11,171,818 | ) | (26,356,354 | ) |
Net realized and unrealized gain on investments, foreign currency related transactions and payment by affiliate | | 1,343,195 | | 23,009,273 | | 13,970,364 | | 19,768,886 | |
Increase in net assets resulting from operations | | $ | 4,258,973 | | $ | 24,976,025 | | $ | 14,094,615 | | $ | 20,627,214 | |
| | | | | | | | | | | | | | |
*Foreign taxes withheld | | $ | 331,482 | | $ | 256,645 | | $ | 130,683 | | $ | 385,691 | |
See Accompanying Notes to Financial Statements
37
STATEMENTS OF OPERATIONS FOR THE YEAR ENDED OCTOBER 31, 2005
| | | | | | ING | | ING | |
| | ING | | ING | | International | | International | |
| | Foreign | | International | | SmallCap | | Value | |
| | Fund | | Fund | | Fund | | Fund | |
| | | | | | | | | |
INVESTMENT INCOME: | | | | | | | | | |
Dividends, net of foreign taxes withheld* | | $ | 3,739,100 | | $ | 2,670,663 | | $ | 7,967,211 | | $ | 89,590,031 | |
Interest | | 316,283 | | 285,638 | | 758,864 | | 10,347,072 | |
Securities lending income | | 24,892 | | 10,470 | | 424,970 | | 299,769 | |
Total investment income | | 4,080,275 | | 2,966,771 | | 9,151,045 | | 100,236,872 | |
EXPENSES: | | | | | | | | | |
Investment management fees | | 1,863,015 | | 1,147,953 | | 3,390,664 | | 40,730,906 | |
Distribution and service fees: | | | | | | | | | |
Class A | | 248,013 | | 128,704 | | 591,465 | | 5,654,943 | |
Class B | | 178,519 | | 165,308 | | 593,084 | | 4,475,532 | |
Class C | | 656,185 | | 160,979 | | 503,204 | | 6,830,989 | |
Class Q | | 2,852 | | 24,243 | | 151,115 | | 71,976 | |
Transfer agent fees: | | | | | | | | | |
Class A | | 111,997 | | 74,741 | | 274,880 | | 2,177,078 | |
Class B | | 20,165 | | 23,985 | | 96,312 | | 516,961 | |
Class C | | 74,134 | | 23,374 | | 81,816 | | 790,777 | |
Class I | | 914 | | 2,257 | | — | | 464,180 | |
Class Q | | 548 | | 1,021 | | 5,310 | | 12,812 | |
Administrative service fees | | 186,299 | | 114,794 | | 339,063 | | 4,073,046 | |
Shareholder reporting expense | | 31,995 | | 37,528 | | 137,044 | | 617,995 | |
Registration fees | | 69,795 | | 49,308 | | 58,612 | | 82,848 | |
Professional fees | | 17,107 | | 12,693 | | 29,140 | | 244,065 | |
Custody and accounting expense | | 239,518 | | 59,340 | | 163,516 | | 1,220,150 | |
Trustee fees | | 4,474 | | 4,638 | | 13,513 | | 147,714 | |
Insurance expense | | 1,822 | | 1,649 | | 5,172 | | 60,810 | |
Miscellaneous expense | | 9,442 | | 9,390 | | 27,147 | | 1,268,609 | |
Total expenses | | 3,716,794 | | 2,041,905 | | 6,461,057 | | 69,441,391 | |
Net recouped fees | | 25,859 | | — | | — | | — | |
Net expenses | | 3,742,653 | | 2,041,905 | | 6,461,057 | | 69,441,391 | |
Net investment income | | 337,622 | | 924,866 | | 2,689,988 | | 30,795,481 | |
REALIZED AND UNREALIZED GAIN (LOSS) | | | | | | | | | |
ON INVESTMENTS AND FOREIGN CURRENCY RELATED TRANSACTIONS: | | | | | | | | | |
Net realized gain (loss) on: | | | | | | | | | |
Investments | | 9,502,106 | | 15,808,237 | | 98,030,683 | | 334,541,367 | |
Foreign currency related transactions | | (1,833,185 | ) | (163,812 | ) | (1,085,920 | ) | (1,313,398 | ) |
Payment by affiliate | | — | | 127,510 | | 914,722 | | 79,655 | |
Net realized gain on investments, foreign currency related transactions and payment by affiliate | | 7,668,921 | | 15,771,935 | | 97,859,485 | | 333,307,624 | |
Net change in unrealized appreciation or depreciation on: | | | | | | | | | |
Investments | | 21,552,282 | | (3,056,148 | ) | (16,250,317 | ) | 193,480,616 | |
Foreign currency related transactions | | (1,235,653 | ) | (15,141 | ) | (6,168 | ) | (509,788 | ) |
Net change in unrealized appreciation or depreciation on investments and foreign currency related transactions | | 20,316,629 | | (3,071,289 | ) | (16,256,485 | ) | 192,970,828 | |
Net realized and unrealized gain on investments, foreign currency related transactions and payment by affiliate | | 27,985,550 | | 12,700,646 | | 81,603,000 | | 526,278,452 | |
Increase in net assets resulting from operations | | $ | 28,323,172 | | $ | 13,625,512 | | $ | 84,292,988 | | $ | 557,073,933 | |
*Foreign taxes withheld | | $ | 547,196 | | $ | 278,925 | | $ | 727,389 | | $ | 11,540,682 | |
See Accompanying Notes to Financial Statements
38
STATEMENTS OF OPERATIONS FOR THE PERIODS ENDED OCTOBER 31, 2005
| | ING | | ING | | | |
| | International | | Precious | | ING | |
| | Value Choice | | Metals | | Russia | |
| | Fund | | Fund | | Fund | |
| | February 1, 2005(1) | | Year Ended | | Year Ended | |
| | to October 31, | | October 31, | | October 31, | |
| | 2005 | | 2005 | | 2005 | |
| | | | | | | |
INVESTMENT INCOME: | | | | | | | | | |
Dividends, net of foreign taxes withheld* | | | $ | 108,395 | | | $ | 427,199 | | $ | 4,398,811 | |
Interest | | | 12,092 | | | 238,499 | | — | |
Securities lending income | | | — | | | — | | 31,020 | |
Total investment income | | | 120,487 | | | 665,698 | | 4,429,831 | |
EXPENSES: | | | | | | | | | |
Investment management fees | | | 43,216 | | | 753,527 | | 2,607,017 | |
Distribution and service fees: | | | | | | | | | |
Class A | | | 7,396 | | | 209,508 | | 521,402 | |
Class B | | | 6,107 | | | — | | — | |
Class C | | | 7,524 | | | — | | — | |
Transfer agent fees: | | | | | | | | | |
Class A | | | 4,282 | | | 157,198 | | 224,403 | |
Class B | | | 864 | | | — | | — | |
Class C | | | 1,064 | | | — | | — | |
Administrative service fees | | | 4,322 | | | 83,803 | | 208,559 | |
Shareholder reporting expense | | | 1,934 | | | 38,397 | | 105,114 | |
Registration fees | | | 7,588 | | | 20,189 | | 34,260 | |
Professional fees | | | 11,023 | | | 12,761 | | 21,555 | |
Custody and accounting expense | | | 9,729 | | | 20,781 | | 693,185 | |
Trustee fees | | | 529 | | | 6,811 | | 6,393 | |
Offering expense | | | 50,928 | | | — | | — | |
Insurance expense | | | — | | | 1,465 | | 3,372 | |
Miscellaneous expense | | | 1,709 | | | 6,931 | | 15,875 | |
Total expenses | | | 158,215 | | | 1,311,371 | | 4,441,135 | |
Net waived and reimbursed fees | | | (74,545 | ) | | — | | — | |
Net expenses | | | 83,670 | | | 1,311,371 | | 4,441,135 | |
Net investment income (loss) | | | 36,817 | | | (645,673 | ) | (11,304 | ) |
REALIZED AND UNREALIZED GAIN (LOSS) | | | | | | | | | |
ON INVESTMENTS AND FOREIGN CURRENCY | | | | | | | | | |
RELATED TRANSACTIONS: | | | | | | | | | |
Net realized gain (loss) on: | | | | | | | | | |
Investments | | | 173,313 | | | 9,031,490 | | 87,447 | |
Foreign currency related transactions | | | (13,800 | ) | | (62,654 | ) | (10,368 | ) |
Net realized gain on investments and foreign currency related transactions | | | 159,513 | | | 8,968,836 | | 77,079 | |
Net change in unrealized appreciation or depreciation on: | | | | | | | | | |
Investments | | | 256,488 | | | (3,272,165 | ) | 61,195,797 | |
Foreign currency related transactions | | | 822 | | | 966 | | — | |
Net change in unrealized appreciation or depreciation on investments and foreign currency related transactions | | | 257,310 | | | (3,271,199 | ) | 61,195,797 | |
Net realized and unrealized gain on investments and foreign currency related transactions | | | 416,823 | | | 5,697,637 | | 61,272,876 | |
Increase in net assets resulting from operations | | | $ | 453,640 | | | $ | 5,051,964 | | $ | 61,261,572 | |
* | | Foreign taxes withheld | | | $ | 13,107 | | | $ | 28,091 | | $ | 723,301 | |
(1) | | Commencement of operations. | | | | | | | | | | | | |
See Accompanying Notes to Financial Statements
39
STATEMENTS OF CHANGES IN NET ASSETS
| | ING Global Equity Dividend Fund | | ING Global Real Estate Fund | |
| | Year | | Year | | Year | | Year | |
| | Ended | | Ended | | Ended | | Ended | |
| | October 31, | | October 31, | | October 31, | | October 31, | |
| | 2005 | | 2004 | | 2005 | | 2004 | |
| | | | | | | | | |
FROM OPERATIONS: | | | | | | | | | |
Net investment income | | $ | 2,915,778 | | $ | 406,630 | | $ | 1,966,752 | | $ | 1,820,887 | |
Net realized gain on investments and foreign currency related transactions | | 1,687,744 | | 335,349 | | 12,164,023 | | 6,506,097 | |
Net change in unrealized appreciation or depreciation on investments and foreign currency related transactions | | (344,549 | ) | 1,066,068 | | 10,845,250 | | 9,630,317 | |
Net increase in net assets resulting from operations | | 4,258,973 | | 1,808,047 | | 24,976,025 | | 17,957,301 | |
FROM DISTRIBUTIONS TO SHAREHOLDERS: | | | | | | | | | |
Net investment income: | | | | | | | | | |
Class A | | (1,612,143 | ) | (196,130 | ) | (3,673,599 | ) | (2,020,848 | ) |
Class B | | (464,058 | ) | (23,192 | ) | (233,025 | ) | (92,026 | ) |
Class C | | (739,105 | ) | (20,430 | ) | (422,111 | ) | (115,157 | ) |
Class I | | — | | — | | (17,876 | ) | — | |
Net realized gains: | | | | | | | | | |
Class A | | (202,278 | ) | — | | (5,775,476 | ) | (2,440,018 | ) |
Class B | | (68,833 | ) | — | | (334,884 | ) | (103,979 | ) |
Class C | | (78,925 | ) | — | | (517,618 | ) | (110,735 | ) |
Total distributions | | (3,165,342 | ) | (239,752 | ) | (10,974,589 | ) | (4,882,763 | ) |
FROM CAPITAL SHARE TRANSACTIONS: | | | | | | | | | |
Net proceeds from sale of shares | | 156,092,182 | | 13,334,002 | | 95,904,278 | | 56,992,662 | |
Dividends reinvested | | 1,717,095 | | 61,619 | | 8,286,072 | | 3,845,479 | |
| | 157,809,277 | | 13,395,621 | | 104,190,350 | | 60,838,141 | |
Cost of shares redeemed | | (26,214,327 | ) | (994,020 | ) | (46,019,544 | ) | (10,585,102 | ) |
Net increase in net assets resulting from capital share transactions | | 131,594,950 | | 12,401,601 | | 58,170,806 | | 50,253,039 | |
Net increase in net assets | | 132,688,581 | | 13,969,896 | | 72,172,242 | | 63,327,577 | |
| | | | | | | | | |
NET ASSETS: | | | | | | | | | |
Beginning of year | | 18,274,154 | | 4,304,258 | | 108,114,395 | | 44,786,818 | |
End of year | | $ | 150,962,735 | | $ | 18,274,154 | | $ | 180,286,637 | | $ | 108,114,395 | |
| | | | | | | | | | | | | |
Undistributed net investment income (accumulated net investment loss) at end of year | | $ | 80,039 | | $ | 317,908 | | $ | (3,067,440 | ) | $ | (778,529 | ) |
| | | | | | | | | | | | | | |
See Accompanying Notes to Financial Statements
40
STATEMENTS OF CHANGES IN NET ASSETS
| | ING Global Value Choice Fund | | ING Emerging Countries Fund | |
| | Year | | Year | | Year | | Year | |
| | Ended | | Ended | | Ended | | Ended | |
| | October 31, | | October 31, | | October 31, | | October 31, | |
| | 2005 | | 2004 | | 2005 | | 2004 | |
| | | | | | | | | |
FROM OPERATIONS: | | | | | | | | | |
Net investment income (loss) | | $ | 124,251 | | $ | (748,568 | ) | $ | 858,328 | | $ | 276,515 | |
Net realized gain on investments, foreign currency related transactions and payment by affiliate | | 25,142,182 | | 21,327,711 | | 46,125,240 | | 17,726,017 | |
Net change in unrealized depreciation on investments and foreign currency related transactions | | (11,171,818 | ) | (10,025,365 | ) | (26,356,354 | ) | (5,624,977 | ) |
Net increase in net assets resulting from operations | | 14,094,615 | | 10,553,778 | | 20,627,214 | | 12,377,555 | |
FROM DISTRIBUTIONS TO SHAREHOLDERS: | | | | | | | | | |
Net investment income: | | | | | | | | | |
Class A | | — | | — | | (59,355 | ) | (341,859 | ) |
Class M | | — | | — | | — | | (2,321 | ) |
Class Q | | — | | — | | (13,322 | ) | (96,899 | ) |
Total distributions | | — | | — | | (72,677 | ) | (441,079 | ) |
| | | | | | | | | |
FROM CAPITAL SHARE TRANSACTIONS: | | | | | | | | | |
Net proceeds from sale of shares | | 15,058,733 | | 13,920,775 | | 49,570,991 | | 63,742,660 | |
Dividends reinvested | | — | | — | | 65,764 | | 387,844 | |
| | 15,058,733 | | 13,920,775 | | 49,636,755 | | 64,130,504 | |
Cost of shares redeemed | | (43,124,283 | ) | (54,040,277 | ) | (37,110,260 | ) | (94,288,735 | ) |
Net increase (decrease) in net assets resulting from capital share transactions | | (28,065,550 | ) | (40,119,502 | ) | 12,526,495 | | (30,158,231 | ) |
Net increase (decrease) in net assets | | (13,970,935 | ) | (29,565,724 | ) | 33,081,032 | | (18,221,755 | ) |
| | | | | | | | | |
NET ASSETS: | | | | | | | | | |
Beginning of year | | 114,699,877 | | 144,265,601 | | 99,595,074 | | 117,816,829 | |
End of year | | $ | 100,728,942 | | $ | 114,699,877 | | $ | 132,676,106 | | $ | 99,595,074 | |
Undistributed net investment income at end of year | | $ | 396,508 | | $ | 947 | | $ | 670,204 | | $ | 53,249 | |
See Accompanying Notes to Financial Statements
41
STATEMENTS OF CHANGES IN NET ASSETS
| | ING Foreign Fund | | ING International Fund | |
| | Year | | Year | | Year | | Year | |
| | Ended | | Ended | | Ended | | Ended | |
| | October 31, | | October 31, | | October 31, | | October 31, | |
| | 2005 | | 2004 | | 2005 | | 2004 | |
| | | | | | | | | |
FROM OPERATIONS: | | | | | | | | | |
Net investment income | | $ | 337,622 | | $ | 22,738 | | $ | 924,866 | | $ | 627,166 | |
Net realized gain (loss) on investments, foreign currency related transactions and payment by affiliate | | 7,668,921 | | (2,094,226 | ) | 15,771,935 | | 12,363,164 | |
Net change in unrealized appreciation or depreciation on investments and foreign currency related transactions | | 20,316,629 | | 9,255,618 | | (3,071,289 | ) | 1,122,418 | |
Net increase in net assets resulting from operations | | 28,323,172 | | 7,184,130 | | 13,625,512 | | 14,112,748 | |
| | | | | | | | | |
FROM DISTRIBUTIONS TO SHAREHOLDERS: | | | | | | | | | |
Net investment income: | | | | | | | | | |
Class A | | — | | (31,426 | ) | (500,256 | ) | (65,485 | ) |
Class B | | — | | (6,143 | ) | (77,407 | ) | — | |
Class C | | — | | (20,429 | ) | (70,840 | ) | — | |
Class I | | — | | (964 | ) | (268,842 | ) | (43,979 | ) |
Class Q | | — | | (1,175 | ) | (93,747 | ) | (38,000 | ) |
Net realized gains: | | | | | | | | | |
Class A | | — | | (33,310 | ) | — | | — | |
Class B | | — | | (7,332 | ) | — | | — | |
Class C | | — | | (26,225 | ) | — | | — | |
Class I | | — | | (920 | ) | — | | — | |
Class Q | | — | | (1,471 | ) | — | | — | |
Return of capital: | | | | | | | | | |
Class A | | — | | (86,197 | ) | — | | — | |
Class B | | — | | (19,071 | ) | — | | — | |
Class C | | — | | (68,664 | ) | — | | — | |
Class I | | — | | (2,392 | ) | — | | — | |
Class Q | | — | | (3,826 | ) | — | | — | |
Total distributions | | — | | (309,545 | ) | (1,011,092 | ) | (147,464 | ) |
| | | | | | | | | |
FROM CAPITAL SHARE TRANSACTIONS: | | | | | | | | | |
Net proceeds from sale of shares | | 130,983,247 | | 117,807,728 | | 34,317,445 | | 59,336,093 | |
Dividends reinvested | | — | | 195,834 | | 927,388 | | 123,195 | |
Redemption fee proceeds | | — | | — | | 12,635 | | 9,571 | |
| | 130,983,247 | | 118,003,562 | | 35,257,468 | | 59,468,859 | |
Cost of shares redeemed | | (42,711,627 | ) | (19,794,538 | ) | (30,672,702 | ) | (67,247,422 | ) |
Net increase (decrease) in net assets resulting from capital share transactions | | 88,271,620 | | 98,209,024 | | 4,584,766 | | (7,778,563 | ) |
Net increase in net assets | | 116,594,792 | | 105,083,609 | | 17,199,186 | | 6,186,721 | |
| | | | | | | | | |
NET ASSETS: | | | | | | | | | |
Beginning of year | | 119,236,263 | | 14,152,654 | | 103,335,494 | | 97,148,773 | |
End of year | | $ | 235,831,055 | | $ | 119,236,263 | | $ | 120,534,680 | | $ | 103,335,494 | |
Undistributed net investment income at end of year | | $ | 1,106,905 | | $ | 4,284 | | $ | 1,737,694 | | $ | 1,011,247 | |
See Accompanying Notes to Financial Statements
42
STATEMENTS OF CHANGES IN NET ASSETS
| | | | | | | | | | ING International | |
| | ING International SmallCap Fund | | ING International Value Fund | | Value Choice Fund | |
| | Year | | Year | | Year | | Year | | February 1(1), | |
| | Ended | | Ended | | Ended | | Ended | | 2005 | |
| | October 31, | | October 31, | | October 31, | | October 31, | | to October 31, | |
| | 2005 | | 2004 | | 2005 | | 2004 | | 2005 | |
| | | | | | | | | | | |
FROM OPERATIONS: | | | | | | | | | | | |
Net investment income (loss) | | $ | 2,689,988 | | $ | (358,177 | ) | $ | 30,795,481 | | $ | 22,990,839 | | $ | 36,817 | |
Net realized gain on investments, foreign currency related transactions and payment by affiliate | | 97,859,485 | | 75,495,671 | | 333,307,624 | | 282,586,322 | | 159,513 | |
Net change in unrealized appreciation or depreciation on investments and foreign currency related transactions | | (16,256,485 | ) | (27,136,347 | ) | 192,970,828 | | 450,122,588 | | 257,310 | |
Net increase in net assets resulting from operations | | 84,292,988 | | 48,001,147 | | 557,073,933 | | 755,699,749 | | 453,640 | |
| | | | | | | | | | | |
FROM DISTRIBUTIONS TO SHAREHOLDERS: | | | | | | | | | | | |
Net investment income: | | | | | | | | | | | |
Class A | | — | | (28,389 | ) | (24,560,725 | ) | (10,230,529 | ) | — | |
Class B | | — | | — | | (2,978,147 | ) | (4,813,131 | ) | — | |
Class C | | — | | — | | (4,480,827 | ) | (221,805 | ) | — | |
Class I | | — | | — | | (14,637,231 | ) | — | | — | |
Class Q | | — | | (35,174 | ) | (416,197 | ) | — | | — | |
Net realized gains: | | | | | | | | | | | |
Class A | | — | | — | | (88,815,999 | ) | — | | — | |
Class B | | — | | — | | (21,863,296 | ) | — | | — | |
Class C | | — | | — | | (32,628,011 | ) | — | | — | |
Class I | | — | | — | | (40,249,883 | ) | — | | — | |
Class Q | | — | | — | | (1,347,031 | ) | — | | — | |
Total distributions | | — | | (63,563 | ) | (231,977,347 | ) | (15,265,465 | ) | — | |
| | | | | | | | | | | |
FROM CAPITAL SHARE TRANSACTIONS: | | | | | | | | | | | |
Net proceeds from sale of shares | | 93,365,295 | | 102,648,725 | | 888,315,865 | | 760,539,725 | | 9,890,518 | |
Dividends reinvested | | — | | 53,883 | | 168,697,259 | | 11,832,249 | | — | |
| | 93,365,295 | | 102,702,608 | | 1,057,013,124 | | 772,371,974 | | 9,890,518 | |
Cost of shares redeemed | | (158,584,246 | ) | (170,219,420 | ) | (1,185,357,264 | ) | (855,607,324 | ) | (1,005,577 | ) |
Net increase (decrease) in net assets resulting from capital share transactions | | (65,218,951 | ) | (67,516,812 | ) | (128,344,140 | ) | (83,235,350 | ) | 8,884,941 | |
Net increase (decrease) in net assets | | 19,074,037 | | (19,579,228 | ) | 196,752,446 | | 657,198,934 | | 9,338,581 | |
| | | | | | | | | | | |
NET ASSETS: | | | | | | | | | | | |
Beginning of year | | 321,935,563 | | 341,514,791 | | 3,859,863,464 | | 3,202,664,530 | | — | |
End of year | | $ | 341,009,600 | | $ | 321,935,563 | | $ | 4,056,615,910 | | $ | 3,859,863,464 | | $ | 9,338,581 | |
Undistributed net investment income at end of year | | $ | 2,368,780 | | $ | 36,528 | | $ | 31,576,663 | | $ | 46,064,519 | | $ | 90,092 | |
| | | | | | | | | | | | | | | | | | |
(1) Commencement of operations
See Accompanying Notes to Financial Statements
43
STATEMENTS OF CHANGES IN NET ASSETS
| | ING Precious Metals Fund | | ING Russia Fund | |
| | Year | | Year | | Year | | Year | |
| | Ended | | Ended | | Ended | | Ended | |
| | October 31, | | October 31, | | October 31, | | October 31, | |
| | 2005 | | 2004 | | 2005 | | 2004 | |
FROM OPERATIONS: | | | | | | | | | |
Net investment income (loss) | | $ | (645,673 | ) | $ | (643,094 | ) | $ | (11,304 | ) | $ | 321,241 | |
Net realized gain on investments and foreign currency related transactions | | 8,968,836 | | 15,823,998 | | 77,079 | | 47,457,393 | |
Net change in unrealized appreciation or depreciation on investments and foreign currency related transactions | | (3,271,199 | ) | (13,509,349 | ) | 61,195,797 | | (9,081,553 | ) |
Net increase in net assets resulting from operations | | 5,051,964 | | 1,671,555 | | 61,261,572 | | 38,697,081 | |
FROM DISTRIBUTIONS TO SHAREHOLDERS: | | | | | | | | | |
Net investment income: | | | | | | | | | |
Class A | | (2,990,570 | ) | — | | (111,452 | ) | (207,493 | ) |
Total distributions | | (2,990,570 | ) | — | | (111,452 | ) | (207,493 | ) |
| | | | | | | | | |
FROM CAPITAL SHARE TRANSACTIONS: | | | | | | | | | |
Net proceeds from sale of shares | | 8,755,764 | | 15,000,362 | | 93,862,631 | | 135,313,377 | |
Dividends reinvested | | 2,642,230 | | — | | 96,494 | | 153,665 | |
Redemption fee proceeds | | — | | — | | 850,706 | | 1,459,066 | |
| | 11,397,994 | | 15,000,362 | | 94,809,831 | | 136,926,108 | |
Cost of shares redeemed | | (17,774,785 | ) | (26,611,993 | ) | (96,537,671 | ) | (124,835,873 | ) |
Net increase (decrease) in net assets resulting from capital share transactions | | (6,376,791 | ) | (11,611,631 | ) | (1,727,840 | ) | 12,090,235 | |
Net increase (decrease) in net assets | | (4,315,397 | ) | (9,940,076 | ) | 59,422,280 | | 50,579,823 | |
| | | | | | | | | |
NET ASSETS: | | | | | | | | | |
Beginning of year | | 91,756,166 | | 101,696,242 | | 212,180,471 | | 161,600,648 | |
End of year | | $ | 87,440,769 | | $ | 91,756,166 | | $ | 271,602,751 | | $ | 212,180,471 | |
Undistributed net investment income at end of year | | $ | 136,516 | | $ | 2,989,240 | | $ | — | | $ | 110,090 | |
See Accompanying Notes to Financial Statements
44
ING GLOBAL EQUITY DIVIDEND FUND | | FINANCIAL HIGHLIGHTS |
Selected data for a share of beneficial interest outstanding throughout each period.
| | | Class A | | Class B | |
| | | | | | | September 17, | | | | | | October 24, | |
| | | | | | | 2003(1) to | | | | | | 2003(1) to | |
| | | Year Ended October 31, | | October 31, | | Year Ended October 31, | | October 31, | |
| | | 2005 | | 2004 | | 2003 | | 2005 | | 2004 | | 2003 | |
Per Share Operating Performance: | | | | | | | | | | | |
Net asset value, beginning of period | | $ | 12.41 | | 10.49 | | 10.00 | | | 12.37 | | 10.49 | | 10.31 | | |
Income from investment operations: | | | | | | | | | | | | | | | | |
Net investment income | | $ | 0.47 | * | 0.44 | | 0.02 | | | 0.37 | * | 0.42 | | 0.00 | ** | |
Net realized and unrealized gain | | | | | | | | | | | | | | | | |
on investments | | $ | 0.92 | | 1.87 | | 0.47 | | | 0.92 | | 1.82 | | 0.18 | | |
Total from investment operations | | $ | 1.39 | | 2.31 | | 0.49 | | | 1.29 | | 2.24 | | 0.18 | | |
Less distributions from: | | | | | | | | | | | | | | | | |
Net investment income | | $ | 0.54 | | 0.39 | | — | | | 0.42 | | 0.36 | | — | | |
Net realized gains on investments | | $ | 0.19 | | — | | — | | | 0.19 | | — | | — | | |
Total distributions | | $ | 0.73 | | 0.39 | | — | | | 0.61 | | 0.36 | | — | | |
Net asset value, end of period | | $ | 13.07 | | 12.41 | | 10.49 | | | 13.05 | | 12.37 | | 10.49 | | |
Total Return(2) | | % | 11.45 | | 22.59 | | 4.90 | | | 10.65 | | 21.92 | | 1.75 | | |
| | | | | | | | | | | | | | | | |
Ratios and Supplemental Data: | | | | | | | | | | | | | | | | |
Net assets, end of period (000’s) | | $ | 73,186 | | 11,316 | | 4,274 | | | 28,811 | | 3,303 | | 12 | | |
Ratios to average net assets: | | | | | | | | | | | | | | | | |
Net expenses after expense | | | | | | | | | | | | | | | | |
reimbursement/recoupment(3)(4) | | % | 1.40 | | 1.40 | | 1.40 | | | 2.15 | | 2.15 | | 2.15 | | |
Gross expenses prior to expense | | | | | | | | | | | | | | | | |
reimbursement/recoupment(3) | | % | 1.28 | | 3.44 | | 7.00 | | | 2.03 | | 4.19 | | 7.75 | | |
Net investment income (loss) after expense | | | | | | | | | | | | | | | | |
reimbursement/recoupment(3)(4) | | % | 3.60 | | 4.39 | | 3.58 | | | 2.83 | | 4.03 | | (0.67 | ) | |
Portfolio turnover rate | | % | 57 | | 60 | | 3 | | | 57 | | 60 | | 3 | | |
| | | | | | | | | | | | | | | | | | | | |
| | Class C | |
| | | | | | October 29, | |
| | | | | | 2003(1) to | |
| | Year Ended October 31, | | October 31, | |
| | 2005 | | 2004 | | 2003 | |
Per Share Operating Performance: | | | | | | | | |
Net asset value, beginning of period | | | $ | | 12.37 | | 10.48 | | 10.44 | | |
Income from investment operations: | | | | | | | | | | | |
Net investment income | | | $ | | 0.37 | * | 0.39 | | 0.00 | ** | |
Net realized and unrealized gain on investments | | | $ | | 0.90 | | 1.86 | | 0.04 | | |
Total from investment operations | | | $ | | 1.27 | | 2.25 | | 0.04 | | |
Less distributions from: | | | | | | | | | | | |
Net investment income | | | $ | | 0.43 | | 0.36 | | — | | |
Net realized gains on investments | | | $ | | 0.19 | | — | | — | | |
Total distributions | | | $ | | 0.62 | | 0.36 | | — | | |
Net asset value, end of period | | | $ | | 13.02 | | 12.37 | | 10.48 | | |
Total Return(2) | | | % | | 10.51 | | 21.99 | | 0.38 | | |
| | | | | | | | | | | |
Ratios and Supplemental Data: | | | | | | | | | | | |
Net assets, end of period (000’s) | | | $ | | 48,965 | | 3,655 | | 19 | | |
Ratios to average net assets: | | | | | | | | | | | |
Net expenses after expense reimbursement/recoupment(3)(4) | | | % | | 2.15 | | 2.15 | | 2.15 | | |
Gross expenses prior to expense reimbursement/recoupment(3) | | | % | | 2.03 | | 4.19 | | 7.75 | | |
Net investment income (loss) after expense reimbursement/recoupment(3)(4) | | | % | | 2.82 | | 3.99 | | (0.88 | ) | |
Portfolio turnover rate | | | % | | 57 | | 60 | | 3 | | |
| | | | | | | | | | | | | |
(1) Commencement of operations.
(2) Total return is calculated assuming reinvestment of all dividends and capital gain distributions at net asset value and excluding the deduction of sales charges. Total return for less than one year is not annualized.
(3) Annualized for periods less than one year.
(4) The Investment Manager has agreed to limit expenses, (excluding interest, taxes, brokerage and extraordinary expenses) subject to possible recoupment by ING Investments, LLC within three years of being incurred.
* Per share data calculated using average number of shares outstanding throughout the period.
** Amount represents less than $0.005 per share
See Accompanying Notes to Financial Statements
45
ING GLOBAL REAL ESTATE FUND | | FINANCIAL HIGHLIGHTS |
Selected data for a share of beneficial interest outstanding throughout each period.
| | | Class A | | Class B | |
| | | | | | | | | November 5, | | | | | | | | March 15, | |
| | | | | | | | | 2001(1) to | | | | | | | | 2002(1) to | |
| | | Year Ended October 31, | | October 31, | | Year Ended October 31, | | October 31, | |
| | | 2005 | | 2004 | | 2003 | | 2002 | | 2005 | | 2004 | | 2003 | | 2002 | |
Per Share Operating Performance: | | | | | | | | | | | | | |
Net asset value, beginning of period | $ | | 15.40 | | | 13.06 | | 10.40 | | 10.01 | | | 13.67 | | 11.74 | | 9.43 | | 10.03 | | |
Income (loss) from investment operations: | | | | | | | | | | | | | | | | | | | | | |
Net investment income | $ | | 0.26 | | *† | 0.27 | | 0.57 | | 0.45 | | | 0.12 | *† | 0.14 | | 0.48 | | 0.16 | | |
Net realized and unrealized gain (loss) | | | | | | | | | | | | | | | | | | | | | |
on investments | $ | | 2.94 | | † | 3.26 | | 2.79 | | 0.31 | | | 2.59 | † | 2.90 | | 2.47 | | (0.58 | ) | |
Total from investment operations | $ | | 3.20 | | | 3.53 | | 3.36 | | 0.76 | | | 2.71 | | 3.04 | | 2.95 | | (0.42 | ) | |
Less distributions from: | | | | | | | | | | | | | | | | | | | | | |
Net investment income | $ | | 0.54 | | | 0.43 | | 0.54 | | 0.37 | | | 0.45 | | 0.35 | | 0.48 | | 0.18 | | |
Net realized gain on investments | $ | | 0.92 | | | 0.76 | | 0.16 | | — | | | 0.92 | | 0.76 | | 0.16 | | — | | |
Total distributions | $ | | 1.46 | | | 1.19 | | 0.70 | | 0.37 | | | 1.37 | | 1.11 | | 0.64 | | 0.18 | | |
Net asset value, end of period | $ | | 17.14 | | | 15.40 | | 13.06 | | 10.40 | | | 15.01 | | 13.67 | | 11.74 | | 9.43 | | |
Total Return(2) | % | | 21.95 | | | 28.90 | | 33.77 | | 7.47 | | | 21.05 | | 27.89 | | 32.83 | | (4.29 | ) | |
| | | | | | | | | | | | | | | | | | | | | |
Ratios and Supplemental Data: | | | | | | | | | | | | | | | | | | | | | |
Net assets, end of period (000’s) | $ | | 138,314 | | | 95,561 | | 41,549 | | 25,440 | | | 12,302 | | 4,736 | | 1,506 | | 677 | | |
Ratios to average net assets: | | | | | | | | | | | | | | | | | | | | | |
Net expenses after expense reimbursement/ | | | | | | | | | | | | | | | | | | | | | |
recoupment(3)(4) | % | | 1.59 | | | 1.75 | | 1.75 | | 1.76 | | | 2.34 | | 2.50 | | 2.50 | | 2.52 | | |
Gross expenses prior to expense | | | | | | | | | | | | | | | | | | | | | |
reimbursement/recoupment(3) | % | | 1.50 | | | 1.55 | | 1.95 | | 2.46 | | | 2.25 | | 2.30 | | 2.70 | | 3.19 | | |
Net investment income after expense | | | | | | | | | | | | | | | | | | | | | |
reimbursement/recoupment(3)(4) | % | | 1.58 | | † | 2.55 | | 5.14 | | 4.12 | | | 0.79 | † | 1.78 | | 4.44 | | 3.74 | | |
Portfolio turnover rate | % | | 91 | | | 129 | | 124 | | 141 | | | 91 | | 129 | | 124 | | 141 | | |
| | | | | | | | | | | | | | | | | | | | | | | | | | |
| | | | Class C | |
| | | | | | | | | | January 8, | |
| | | | | | | | | | 2002(1) to | |
| | | | Year Ended October 31, | | October 31, | |
| | | | 2005 | | 2004 | | 2003 | | 2002 | |
Per Share Operating Performance: | | | | | | | | | | | |
Net asset value, beginning of period | | $ | | 14.19 | | | 12.14 | | | 9.70 | | | 9.99 | | |
Income (loss) from investment operations: | | | | | | | | | | | | | | | |
Net investment income | | $ | | 0.12 | *† | | 0.14 | | | 0.45 | | | 0.19 | | |
Net realized and unrealized gain (loss) | | | | | | | | | | | | | | | |
on investments | | $ | | 2.71 | † | | 3.02 | | | 2.60 | | | (0.31 | ) | |
Total from investment operations | | $ | | 2.83 | | | 3.16 | | | 3.05 | | | (0.12 | ) | |
Less distributions from: | | | | | | | | | | | | | | | |
Net investment income | | $ | | 0.45 | | | 0.35 | | | 0.45 | | | 0.17 | | |
Net realized gain on investments | | $ | | 0.92 | | | 0.76 | | | 0.16 | | | — | | |
Total distributions | | $ | | 1.37 | | | 1.11 | | | 0.61 | | | 0.17 | | |
Net asset value, end of period | | $ | | 15.65 | | | 14.19 | | | 12.14 | | | 9.70 | | |
Total Return(2) | | % | | 21.11 | | | 27.93 | | | 32.89 | | | (1.24 | ) | |
| | | | | | | | | | | | | | | |
Ratios and Supplemental Data: | | | | | | | | | | | | | | | |
Net assets, end of period (000’s) | | $ | | 27,989 | | | 7,817 | | | 1,732 | | | 2,320 | | |
Ratios to average net assets: | | | | | | | | | | | | | | | |
Net expenses after expense reimbursement/recoupment(3)(4) | | % | | 2.34 | | | 2.50 | | | 2.50 | | | 2.52 | | |
Gross expenses prior to expense | | | | | | | | | | | | | | | |
reimbursement/recoupment(3) | | % | | 2.25 | | | 2.30 | | | 2.70 | | | 3.19 | | |
Net investment income after expense | | | | | | | | | | | | | | | |
reimbursement/recoupment(3)(4) | | % | | 0.78 | † | | 1.72 | | | 4.60 | | | 3.51 | | |
Portfolio turnover rate | | % | | 91 | | | 129 | | | 124 | | | 141 | | |
(1) Commencement of operations.
(2) Total return is calculated assuming reinvestment of all dividends and capital gain distributions at net asset value and excluding the deduction of sales charges. Total return for less than one year is not annualized.
(3) Annualized for periods less than one year.
(4) The Investment Manager has agreed to limit expenses, (excluding interest, taxes, brokerage and extraordinary expenses) subject to possible recoupment by ING Investments, LLC within three years of being incurred.
* Per share data calculated using average number of shares outstanding throughout the period.
† Effective November 1, 2004, the Fund adopted a policy to reduce cost of investments for financial statement purposes by the distributions received in excess of income from Real Estate Investment Trusts. The effect of this change for the twelve months ended October 31, 2005 was to decrease the net investment income per share by $0.12, $0.10 and $0.11, increase net realized and unrealized gain on investments per share by $0.12, $0.10 and $0.11 and decrease the ratio of net investment income to average net assets from 2.31% to 1.58%, 1.51% to 0.79% and 1.51% to 0.78% on Class A, Class B and Class C, respectively.
See Accompanying Notes to Financial Statements
46
ING GLOBAL VALUE CHOICE FUND | | FINANCIAL HIGHLIGHTS |
Selected data for a share of beneficial interest outstanding throughout each period.
| | | | Class A | |
| | | | Year Ended October 31, | |
| | | | 2005 | | 2004 | | 2003 | | 2002 | | 2001 | |
Per Share Operating Performance: | | | | | | | | | | | | | |
Net asset value, beginning of period | | $ | | 15.96 | | | 14.76 | | | 12.36 | | | 15.45 | | | 26.36 | | |
Income (loss) from investment operations: | | | | | | | | | | | | | | | | | | |
Net investment income (loss) | | $ | | 0.09 | | | (0.04 | ) | | (0.06 | ) | | (0.12 | )* | | (0.11 | ) | |
Net realized and unrealized gain (loss) on investments | | $ | | 2.11 | | | 1.24 | | | 2.46 | | | (2.97 | )* | | (9.73 | ) | |
Total from investment operations | | $ | | 2..20 | | | 1.20 | | | 2.40 | | | (3.09 | ) | | (9.84 | ) | |
Less distributions from: | | | | | | | | | | | | | | | | | | |
Net realized gain on investments | | $ | | — | | | — | | | — | | | — | | | 0.77 | | |
Tax return of capital | | $ | | — | | | — | | | — | | | — | | | 0.30 | | |
Total distributions | | $ | | — | | | — | | | — | | | — | | | 1.07 | | |
Payment by affiliate | | $ | | 0.00 | ** | | — | | | — | | | — | | | — | | |
Net asset value, end of period | | $ | | 18.16 | | | 15.96 | | | 14.76 | | | 12.36 | | | 15.45 | | |
Total Return(1) | | % | | 13.78 | † | | 8.13 | | | 19.42 | | | (20.00 | ) | | (38.80 | ) | |
| | | | | | | | | | | | | | | | | | |
Ratios and Supplemental Data: | | | | | | | | | | | | | | | | | | |
Net assets, end of period (000’s) | | $ | | 41,941 | | | 46,133 | | | 56,877 | | | 69,478 | | | 134,152 | | |
Ratios to average net assets: | | | | | | | | | | | | | | | | | | |
Net expenses after expense reimbursement/recoupment and | | | | | | | | | | | | | | | | | | |
brokerage commission recapture | | % | | 1.85 | | | 1.85 | | | 1.85 | | | 1.86 | | | 1.85 | | |
Net expenses after expense reimbursement/recoupment and | | | | | | | | | | | | | | | | | | |
prior to brokerage commission recapture(2) | | % | | 1.85 | | | 1.85 | | | 1.85 | | | 1.86 | | | 1.85 | | |
Gross expenses prior to expense reimbursement/recoupment and | | | | | | | | | | | | | | | | | | |
brokerage commission recapture | | % | | 1.90 | | | 1.77 | | | 1.93 | | | 1.96 | | | 1.95 | | |
Net investment income (loss) after expense reimbursement/ | | | | | | | | | | | | | | | | | | |
recoupment and brokerage commission recapture(2) | | % | | 0.46 | | | (0.21 | ) | | (0.35 | ) | | (0.83 | ) | | (0.65 | ) | |
Portfolio turnover rate | | % | | 129 | | | 101 | | | 125 | | | 281 | | | 302 | | |
| | | | Class B | |
| | | | Year Ended October 31, | |
| | | | 2005 | | 2004 | | 2003 | | 2002 | | 2001 | |
Per Share Operating Performance: | | | | | | | | | | | | | |
Net asset value, beginning of period | | $ | | 17.39 | | | 16.19 | | | 13.65 | | | 17.19 | | | 29.52 | | |
Income (loss) from investment operations: | | | | | | | | | | | | | | | | | | |
Net investment loss | | $ | | (0.04 | ) | | (0.17 | ) | | (0.16 | ) | | (0.25 | )* | | (0.31 | ) | |
Net realized and unrealized gain (loss) on investments | | $ | | 2.32 | | | 1.37 | | | 2.70 | | | (3.29 | )* | | (10.82 | ) | |
Total from investment operations | | $ | | 2.28 | | | 1.20 | | | 2.54 | | | (3.54 | ) | | (11.13 | ) | |
Less distributions from: | | | | | | | | | | | | | | | | | | |
Net realized gain on investments | | $ | | — | | | — | | | — | | | — | | | 0.86 | | |
Tax return of capital | | $ | | — | | | — | | | — | | | — | | | 0.34 | | |
Total distributions | | $ | | — | | | — | | | — | | | — | | | 1.20 | | |
Payment by affiliate | | $ | | 0.00 | ** | | — | | | — | | | — | | | — | | |
Net asset value, end of period | | $ | | 19.67 | | | 17.39 | | | 16.19 | | | 13.65 | | | 17.19 | | |
Total Return(1) | | % | | 13.11 | † | | 7.41 | | | 18.61 | | | (20.59 | ) | | (39.19 | ) | |
| | | | | | | | | | | | | | | | | | |
Ratios and Supplemental Data: | | | | | | | | | | | | | | | | | | |
Net assets, end of period (000’s) | | $ | | 23,483 | | | 28,559 | | | 35,459 | | | 38,603 | | | 71,943 | | |
Ratios to average net assets: | | | | | | | | | | | | | | | | | | |
Net expenses after expense reimbursement/recoupment and | | | | | | | | | | | | | | | | | | |
brokerage commission recapture | | % | | 2.50 | | | 2.50 | | | 2.50 | | | 2.51 | | | 2.51 | | |
Net expenses after expense reimbursement/recoupment and | | | | | | | | | | | | | | | | | | |
prior to brokerage commission recapture(2) | | % | | 2.50 | | | 2.50 | | | 2.50 | | | 2.51 | | | 2.51 | | |
Gross expenses prior to expense reimbursement/recoupment and | | | | | | | | | | | | | | | | | | |
brokerage commission recapture | | % | | 2.55 | | | 2.42 | | | 2.58 | | | 2.61 | | | 2.61 | | |
Net investment loss after expense reimbursement/ | | | | | | | | | | | | | | | | | | |
recoupment and brokerage commission recapture(2) | | % | | (0.19 | ) | | (0.87 | ) | | (1.00 | ) | | (1.46 | ) | | (1.31 | ) | |
Portfolio turnover rate | | % | | 129 | | | 101 | | | 125 | | | 281 | | | 302 | | |
(1) Total return is calculated assuming reinvestment of all dividends and capital gain distributions at net asset value and excluding the deduction of sales charges. Total return for less than one year is not annualized.
(2) The Investment Manager has agreed to limit expenses, (excluding interest, taxes, brokerage and extraordinary expenses) subject to possible recoupment by ING Investments, LLC within three years of being incurred.
* Per share data calculated using average number of shares outstanding throughout the period.
** Amount represents less than $0.005 per share.
† In 2005, there was no impact on total return due to payment by affiliate.
See Accompanying Notes to Financial Statements
47
ING GLOBAL VALUE CHOICE FUND (CONTINUED) | | FINANCIAL HIGHLIGHTS |
Selected data for a share of beneficial interest outstanding throughout each period.
| | | Class C | |
| | | Year Ended October 31, | |
| | | 2005 | | 2004 | | 2003 | | 2002 | | 2001 | |
Per Share Operating Performance: | | | | | | | | | | | |
Net asset value, beginning of period | | $ | 15.48 | | | 14.41 | | | 12.14 | | | 15.29 | | | 26.26 | | |
Income (loss) from investment operations: | | | | | | | | | | | | | | | | | |
Net investment loss | | $ | (0.04 | ) | | (0.15 | ) | | (0.15 | ) | | (0.22 | )* | | (0.40 | ) | |
Net realized and unrealized gain (loss) on investments | | $ | 2.06 | | | 1.22 | | | 2.42 | | | (2.93 | )* | | (9.50 | ) | |
Total from investment operations | | $ | 2.02 | | | 1.07 | | | 2.27 | | | (3.15 | ) | | (9.90 | ) | |
Less distributions from: | | | | | | | | | | | | | | | | | |
Net realized gain on investments | | $ | — | | | — | | | — | | | — | | | 0.77 | | |
Tax return of capital | | $ | — | | | — | | | — | | | — | | | 0.30 | | |
Total distributions | | $ | — | | | — | | | — | | | — | | | 1.07 | | |
Payment by affiliate | | $ | 0.00 | ** | | — | | | — | | | — | | | — | | |
Net asset value, end of period | | $ | 17.50 | | | 15.48 | | | 14.41 | | | 12.14 | | | 15.29 | | |
Total Return(1) | | % | 13.05 | † | | 7.43 | | | 18.70 | | | (20.60 | ) | | (39.20 | ) | |
| | | | | | | | | | | | | | | | | |
Ratios and Supplemental Data: | | | | | | | | | | | | | | | | | |
Net assets, end of period (000’s) | | $ | 30,918 | | | 35,784 | | | 45,476 | | | 51,868 | | | 102,919 | | |
Ratios to average net assets: | | | | | | | | | | | | | | | | | |
Net expenses after expense reimbursement/recoupment and brokerage commission recapture | | % | 2.50 | | | 2.50 | | | 2.50 | | | 2.51 | | | 2.51 | | |
Net expenses after expense reimbursement/recoupment and
prior to brokerage commission recapture(2) | | % | 2.50 | | | 2.50 | | | 2.50 | | | 2.51 | | | 2.51 | | |
Gross expenses prior to expense reimbursement/recoupment and brokerage commission recapture | | % | 2.55 | | | 2.42 | | | 2.58 | | | 2.61 | | | 2.60 | | |
Net investment loss after expense reimbursement/recoupment and brokerage commission recapture(2) | | % | (0.19 | ) | | (0.87 | ) | | (1.01 | ) | | (1.46 | ) | | (1.30 | ) | |
Portfolio turnover rate | | % | 129 | | | 101 | | | 125 | | | 281 | | | 302 | | |
| | | | | | | | | | | | | | | | | | | |
(1) Total return is calculated assuming reinvestment of all dividends and capital gain distributions at net asset value and excluding the deduction of sales charges. Total return for less than one year is not annualized.
(2) The Investment Manager has agreed to limit expenses, (excluding interest, taxes, brokerage and extraordinary expenses) subject to possible recoupment by ING Investments, LLC within three years of being incurred.
* Per share data calculated using average number of shares outstanding throughout the period.
** Amount represents less than $0.005 per share.
† In 2005, there was no impact on total return due to payment by affiliate.
See Accompanying Notes to Financial Statements
48
ING EMERGING COUNTRIES FUND | | FINANCIAL HIGHLIGHTS |
Selected data for a share of beneficial interest outstanding throughout each period.
| | | Class A | |
| | | Year Ended October 31, | |
| | | 2005 | | 2004 | | 2003 | | 2002 | | 2001 | |
Per Share Operating Performance: | | | | | | | | | | | |
Net asset value, beginning of period | | $ | 19.40 | | | 17.32 | | | 12.44 | | | 11.87 | | | 16.33 | | |
Income (loss) from investment operations: | | | | | | | | | | | | | | | | | |
Net investment income (loss) | | $ | 0.19 | | | 0.09 | | | 0.03 | | | (0.10 | ) | | (0.02 | ) | |
Net realized and unrealized gain (loss) on investments | | | | | | | | | | | | | | | | | |
(net of Indian tax) | | $ | 3.98 | | | 2.08 | | | 4.85 | | | 0.67 | | | (4.44 | ) | |
Total from investment operations | | $ | 4.17 | | | 2.17 | | | 4.88 | | | 0.57 | | | (4.46 | ) | |
Less distributions from: | | | | | | | | | | | | | | | | | |
Net investment income (loss) | | $ | 0.02 | | | 0.09 | | | — | | | (0.00 | )* | | — | | |
Total distributions | | $ | 0.02 | | | 0.09 | | | — | | | — | | | — | | |
Payment by affiliate | | $ | 0.05 | | | 0.00 | * | | — | | | — | | | — | | |
Net asset value, end of period | | $ | 23.60 | | | 19.40 | | | 17.32 | | | 12.44 | | | 11.87 | | |
Total Return(1) | | % | 21.76 | †† | | 12.58 | † | | 39.23 | | | 4.80 | | | (27.31 | ) | |
| | | | | | | | | | | | | | | | | |
Ratios and Supplemental Data: | | | | | | | | | | | | | | | | | |
Net assets, end of period (000’s) | | $ | 87,143 | | | 67,282 | | | 71,953 | | | 62,063 | | | 67,247 | | |
Ratios to average net assets: | | | | | | | | | | | | | | | | | |
Net expenses after expense reimbursement/recoupment(2) | | % | 2.00 | | | 2.20 | | | 2.27 | | | 2.32 | | | 2.32 | | |
Gross expenses prior to expense reimbursement/recoupment | | % | 2.09 | | | 2.10 | | | 2.37 | | | 2.26 | | | 2.33 | | |
Net investment income (loss) after expense reimbursement/ | | | | | | | | | | | | | | | | | |
Recoupment(2) | | % | 0.91 | | | 0.41 | | | 0.22 | | | (0.56 | ) | | (0.16 | ) | |
Portfolio turnover rate | | % | 124 | | | 88 | | | 135 | | | 124 | | | 74 | | |
| | | Class B | |
| | | Year Ended October 31, | |
| | | 2005 | | 2004 | | 2003 | | 2002 | | 2001 | |
Per Share Operating Performance: | | | | | | | | | | | |
Net asset value, beginning of period | | $ | 19.17 | | | 17.15 | | | 12.39 | | | 11.85 | | | 16.41 | | |
Income (loss) from investment operations: | | | | | | | | | | | | | | | | | |
Net investment income (loss) | | $ | 0.04 | | | (0.04 | ) | | (0.06 | ) | | (0.16 | ) | | (0.11 | ) | |
Net realized and unrealized gain (loss) on investments | | | | | | | | | | | | | | | | | |
(net of Indian tax) | | $ | 3.91 | | | 2.06 | | | 4.82 | | | 0.70 | | | (4.45 | ) | |
Total from investment operations | | $ | 3.95 | | | 2.02 | | | 4.76 | | | 0.54 | | | (4.56 | ) | |
Payment by affiliate | | $ | 0.05 | | | 0.00 | * | | — | | | — | | | — | | |
Net asset value, end of period | | $ | 23.17 | | | 19.17 | | | 17.15 | | | 12.39 | | | 11.85 | | |
Total Return(1) | | % | 20.87 | †† | | 11.78 | † | | 38.42 | | | 4.56 | | | (27.79 | ) | |
| | | | | | | | | | | | | | | | | |
Ratios and Supplemental Data: | | | | | | | | | | | | | | | | | |
Net assets, end of period (000’s) | | $ | 12,562 | | | 12,581 | | | 16,425 | | | 15,150 | | | 14,637 | | |
Ratios to average net assets: | | | | | | | | | | | | | | | | | |
Net expenses after expense reimbursement/recoupment(2) | | % | 2.74 | | | 2.85 | | | 2.92 | | | 2.97 | | | 2.99 | | |
Gross expenses prior to expense reimbursement/recoupment(4) | | % | 2.74 | | | 2.75 | | | 3.02 | | | 2.91 | | | 3.00 | | |
Net investment income (loss) after expense | | | | | | | | | | | | | | | | | |
reimbursement/recoupment(4)(5) | | % | 0.14 | | | (0.30 | ) | | (0.40 | ) | | (1.23 | ) | | (0.72 | ) | |
Portfolio turnover rate | | % | 124 | | | 88 | | | 135 | | | 124 | | | 74 | | |
| | | | | | | | | | | | | | | | | | | | |
(1) Total return is calculated assuming reinvestment of all dividends and capital gain distributions at net asset value and excluding the deduction of sales charges. Total return for less than one year is not annualized.
(2) The Investment Manager has agreed to limit expenses, (excluding interest, taxes, brokerage and extraordinary expenses) subject to possible recoupment by ING Investments, LLC within three years of being incurred.
* Amount represents less than $0.005 per share.
† In 2004, 0.06% of the total return consists of a gain on the disposition of an investment not meeting the Fund’s investment restrictions. Excluding this item, total return would have been 12.52% and 11.72% for Class A and Class B, respectively. There was no impact on total return due to the payment by affiliate.
†† In 2005, 0.26% of the total return consists of a payment by affiliate. Excluding this item, total return would have been 21.50% and 20.61% for Class A and Class B, respectively.
See Accompanying Notes to Financial Statements
49
ING EMERGING COUNTRIES FUND (CONTINUED) | | FINANCIAL HIGHLIGHTS |
Selected data for a share of beneficial interest outstanding throughout each period.
| | | Class C | |
| | | Year Ended October 31, | |
| | | 2005 | | 2004 | | 2003 | | 2002 | | 2001 | |
Per Share Operating Performance: | | | | | | | | | | | |
Net asset value, beginning of period | | $ | 18.24 | | | 16.32 | | | 11.79 | | | 11.41 | | | 15.81 | | |
Income (loss) from investment operations: | | | | | | | | | | | | | | | | | |
Net investment income (loss) | | $ | 0.03 | | | (0.03 | ) | | (0.06 | ) | | (0.25 | ) | | (0.12 | ) | |
Net realized and unrealized gain (loss) on investments | | | | | | | | | | | | | | | | | |
(net of Indian tax) | | $ | 3.72 | | | 1.95 | | | 4.59 | | | 0.63 | | | (4.28 | ) | |
Total from investment operations | | $ | 3.75 | | | 1.92 | | | 4.53 | | | 0.38 | | | (4.40 | ) | |
Payment by affiliate | | $ | 0.05 | | | 0.00 | * | | — | | | — | | | — | | |
Net asset value, end of period | | $ | 22.04 | | | 18.24 | | | 16.32 | | | 11.79 | | | 11.41 | | |
Total Return(1) | | % | 20.83 | †† | | 11.76 | † | | 38.42 | | | 3.33 | | | (27.83 | ) | |
| | | | | | | | | | | | | | | | | |
Ratios and Supplemental Data: | | | | | | | | | | | | | | | | | |
Net assets, end of period (000’s) | | $ | 20,985 | | | 9,680 | | | 10,033 | | | 9,519 | | | 12,746 | | |
Ratios to average net assets: | | | | | | | | | | | | | | | | | |
Net expenses after expense reimbursement/recoupment(3) | | % | 2.74 | | | 2.85 | | | 2.92 | | | 2.97 | | | 2.99 | | |
Gross expenses prior to expense reimbursement/recoupment | | % | 2.74 | | | 2.75 | | | 3.02 | | | 2.91 | | | 3.00 | | |
Net investment income (loss) after expense reimbursement/recoupment(3) | | % | 0.25 | | | (0.20 | ) | | (0.40 | ) | | (1.20 | ) | | (0.73 | ) | |
Portfolio turnover rate | | % | 124 | | | 88 | | | 135 | | | 124 | | | 74 | | |
| | | | | | | | | | | | | | | | | | |
| | | Class M | |
| | | | | | | | | August 5, | |
| | | | | | | | | 2002(4) to | |
| | | Year Ended October 31, | | October 31, | |
| | | 2005 | | 2004 | | 2003 | | 2002 | |
Per Share Operating Performance: | | | | | | | | | |
Net asset value, beginning of period | | $ | 19.15 | | | 17.12 | | | 12.35 | | | 12.39 | | |
Income (loss) from investment operations: | | | | | | | | | | | | | | |
Net investment income (loss) | | $ | 0.09 | | | (0.00 | )* ** | | (0.02 | ) | | (0.03 | ) | |
Net realized and unrealized gain (loss) | | | | | | | | | | | | | | |
on investments (net of Indian tax) | | $ | 3.91 | | | 2.06 | | | 4.79 | | | (0.01 | ) | |
Total from investment operations | | $ | 4.00 | | | 2.06 | | | 4.77 | | | (0.04 | ) | |
Less distributions from: | | | | | | | | | | | | | | |
Net investment income | | $ | — | | | 0.03 | | | — | | | — | | |
Total distributions | | $ | — | | | 0.03 | | | — | | | — | | |
Payment by affiliate | | $ | 0.05 | | | 0.00 | * | | — | | | — | | |
Net asset value, end of period | | $ | 23.20 | | | 19.15 | | | 17.12 | | | 12.35 | | |
Total Return(1) | | % | 21.15 | †† | | 12.07 | † | | 38.62 | | | (0.32 | ) | |
| | | | | | | | | | | | | | |
Ratios and Supplemental Data: | | | | | | | | | | | | | | |
Net assets, end of period (000’s) | | $ | 1,210 | | | 1,124 | | | 1,237 | | | 1,125 | | |
Ratios to average net assets: | | | | | | | | | | | | | | |
Net expenses after expense reimbursement(2)(3) | | % | 2.49 | | | 2.60 | | | 2.67 | | | 2.73 | | |
Gross expenses prior to expense | | | | | | | | | | | | | | |
reimbursement/recoupment(2) | | % | 2.74 | | | 2.50 | | | 2.77 | | | 2.73 | | |
Net investment income (loss) after expense | | | | | | | | | | | | | | |
reimbursement/recoupment/recoupment(2)(3) | | % | 0.37 | | | (0.01 | ) | | (0.14 | ) | | (1.32 | ) | |
Portfolio turnover rate | | % | 124 | | | 88 | | | 135 | | | 124 | | |
| | | | | | | | | | | | | | | |
(1) Total return is calculated assuming reinvestment of all dividends and capital gain distributions at net asset value and excluding the deduction of sales charges. Total return for less than one year is not annualized.
(2) Annualized for periods less than one year.
(3) The Investment Manager has agreed to limit expenses, (excluding interest, taxes, brokerage and extraordinary expenses) subject to possible recoupment by ING Investments, LLC within three years of being incurred.
(4) Commencement of operations.
* Amount represents less than $0.005 per share.
** Per share data calculated using average number of shares outstanding throughout the period.
† In 2004, 0.06% of the total return consists of a gain on the disposition of an investment not meeting the Fund’s investment restrictions. Excluding this item, total return would have been 11.70% and 12.01% for Class C and Class M, respectively. There was no impact on total return due to the payment by affiliate.
†† In 2005, 0.27% and 0.26% of the total return on Class C and Class M, respectively, consists of a payment by affiliate. Excluding this item, total return would have been 20.56% and 20.89% for Class C and Class M, respectively.
See Accompanying Notes to Financial Statements
50
ING FOREIGN FUND | | FINANCIAL HIGHLIGHTS |
Selected data for a share of beneficial interest outstanding throughout each period.
| | | Class A | | Class B | |
| | | | | | | July 1, | | | | | | July 8, | |
| | | | | | | 2003(1) to | | | | | | 2003(1) to | |
| | | Year Ended October 31, | | October 31, | | Year Ended October 31, | | October 31, | |
| | | 2005 | | 2004 | | 2003 | | 2005 | | 2004 | | 2003 | |
Per Share Operating Performance: | | | | | | | | | | | | | |
Net asset value, beginning of period | | $ | 12.38 | | | 11.01 | | | 10.00 | | | 12.26 | | | 10.99 | | | 10.29 | | |
Income (loss) from investment operations: | | | | | | | | | | | | | | | | | | | | |
Net investment income (loss) | | $ | 0.06 | | | 0.11 | | | (0.00 | )* | | (0.03 | ) | | (0.05 | )** | | (0.01 | ) | |
Net realized and unrealized gain | | | | | | | | | | | | | | | | | | | | |
on investments | | $ | 2.35 | | | 1.44 | | | 1.01 | | | 2.32 | | | 1.49 | | | 0.71 | | |
Total from investment operations | | $ | 2.41 | | | 1.55 | | | 1.01 | | | 2.29 | | | 1.44 | | | 0.70 | | |
Less distributions from: | | | | | | | | | | | | | | | | | | | | |
Net investment income | | $ | — | | | 0.04 | | | — | | | — | | | 0.03 | | | — | | |
Return of capital | | $ | — | | | 0.10 | | | — | | | — | | | 0.10 | | | — | | |
Net realized gain on investments | | $ | — | | | 0.04 | | | — | | | — | | | 0.04 | | | — | | |
Total distributions | | $ | — | | | 0.18 | | | — | | | — | | | 0.17 | | | — | | |
Net asset value, end of period | | $ | 14.79 | | | 12.38 | | | 11.01 | | | 14.55 | | | 12.26 | | | 10.99 | | |
Total Return(2) | | % | 19.47 | | | 14.25 | | | 10.10 | | | 18.68 | | | 13.32 | | | 6.80 | | |
| | | | | | | | | | | | | | | | | | | | |
Ratios and Supplemental Data: | | | | | | | | | | | | | | | | | | | | |
Net assets, end of period (000’s) | | $ | 122,883 | | | 62,949 | | | 6,598 | | | 22,944 | | | 11,263 | | | 1,344 | | |
Ratios to average net assets: | | | | | | | | | | | | | | | | | | | | |
Net expenses after expense | | | | | | | | | | | | | | | | | | | | |
reimbursement/recoupment(3)(4) | | % | 1.68 | | | 1.70 | | | 1.95 | | | 2.43 | | | 2.45 | | | 2.70 | | |
Gross expenses prior to expense | | | | | | | | | | | | | | | | | | | | |
reimbursement/recoupment(3) | | % | 1.66 | | | 1.95 | | | 6.03 | | | 2.41 | | | 2.70 | | | 6.78 | | |
Net investment income (loss) after | | | | | | | | | | | | | | | | | | | | |
expense reimbursement/recoupment(3)(4) | | % | 0.53 | | | 0.37 | | | (0.32 | ) | | (0.23 | ) | | (0.46 | ) | | (1.03 | ) | |
Portfolio turnover rate | | % | 81 | | | 141 | | | 50 | | | 81 | | | 141 | | | 50 | | |
| | | | | | | | | | | | | | | | | | | | | |
| | | Class C | |
| | | | | | | July 7, | |
| | | | | | | 2003(1) to | |
| | | Year Ended October 31, | | October 31, | |
| | | 2005 | | 2004 | | 2003 | |
Per Share Operating Performance: | | | | | | | | |
Net asset value, beginning of period | | $ | 12.28 | | | 11.01 | | | 10.27 | | |
Income (loss) from investment operations: | | | | | | | | | | | |
Net investment loss | | $ | (0.03 | ) | | (0.04 | )** | | (0.01 | ) | |
Net realized and unrealized gain on investments | | $ | 2.32 | | | 1.48 | | | 0.75 | | |
Total from investment operations | | $ | 2.29 | | | 1.44 | | | 0.74 | | |
Less distributions from: | | | | | | | | | | | |
Net investment income | | $ | — | | | 0.03 | | | — | | |
Return of capital | | $ | — | | | 0.10 | | | — | | |
Net realized gain on investments | | $ | — | | | 0.04 | | | — | | |
Total distributions | | $ | — | | | 0.17 | | | — | | |
Net asset value, end of period | | $ | 14.57 | | | 12.28 | | | 11.01 | | |
Total Return(2) | | % | 18.65 | | | 13.28 | | | 7.21 | | |
| | | | | | | | | | | |
Ratios and Supplemental Data: | | | | | | | | | | | |
Net assets, end of period (000’s) | | $ | 87,877 | | | 41,424 | | | 5,601 | | |
Ratios to average net assets: | | | | | | | | | | | |
Net expenses after expense reimbursement/recoupment(3)(4) | | % | 2.43 | | | 2.45 | | | 2.70 | | |
Gross expenses prior to expense reimbursement/recoupment(3) | | % | 2.41 | | | 2.70 | | | 6.78 | | |
Net investment loss after expense reimbursement/recoupment(3)(4) | | % | (0.27 | ) | | (0.41 | ) | | (1.03 | ) | |
Portfolio turnover rate | | % | 81 | | | 141 | | | 50 | | |
(1) Commencement of operations.
(2) Total return is calculated assuming reinvestment of all dividends and capital gain distributions at net asset value and excluding the deduction of sales charges. Total return for less than one year is not annualized.
(3) Annualized for periods less than one year.
(4) The Investment Manager has agreed to limit expenses, (excluding interest, taxes, brokerage and extraordinary expenses) subject to possible recoupment by ING Investments, LLC within three years of being incurred.
* Amount represents less than $0.005 per share.
** Per share data calculated using average number of shares outstanding throughout the period.
See Accompanying Notes to Financial Statements
51
ING INTERNATIONAL FUND | | FINANCIAL HIGHLIGHTS |
Selected data for a share of beneficial interest outstanding throughout each period.
| | | Class A | |
| | | Year Ended October 31, | |
| | | 2005 | | 2004 | | 2003 | | 2002 | | 2001 | |
Per Share Operating Performance: | | | | | | | | | | | |
Net asset value, beginning of period | | $ | 9.78 | | | 8.48 | | | 7.05 | | | 8.09 | | | 11.22 | | |
Income (loss) from investment operations: | | | | | | | | | | | | | | | | | |
Net investment income (loss) | | $ | 0.10 | | | 0.09 | | | 0.04 | | | (0.02 | ) | | (0.05 | ) | |
Net realized and unrealized gain (loss) on investments | | $ | 1.18 | | | 1.22 | | | 1.37 | | | (1.04 | ) | | (2.14 | ) | |
Total from investment operations | | $ | 1.28 | | | 1.31 | | | 1.41 | | | (1.06 | ) | | (2.19 | ) | |
Less distributions from: | | | | | | | | | | | | | | | | | |
Net investment income | | $ | 0.10 | | | 0.01 | | | 0.03 | | | — | | | — | | |
Net realized gain on investments | | $ | — | | | — | | | — | | | — | | | 0.94 | | |
Total distributions | | $ | 0.10 | | | 0.01 | | | 0.03 | | | — | | | 0.94 | | |
Redemption fees applied to capital | | $ | — | | | 0.00 | * | | 0.05 | | | 0.02 | | | — | | |
Payment by affiliate | | $ | 0.01 | | | — | | | — | | | — | | | — | | |
Net asset value, end of period | | $ | 10.97 | | | 9.78 | | | 8.48 | | | 7.05 | | | 8.09 | | |
Total Return(1) | | % | 13.30 | † | | 15.49 | | | 20.72 | | | (12.86 | ) | | (21.38 | ) | |
| | | | | | | | | | | | | | | | | |
Ratios and Supplemental Data: | | | | | | | | | | | | | | | | | |
Net assets, end of period (000’s) | | $ | 51,193 | | | 47,551 | | | 43,821 | | | 43,314 | | | 37,489 | | |
Ratios to average net assets: | | | | | | | | | | | | | | | | | |
Net expenses after expense reimbursement/ | | | | | | | | | | | | | | | | | |
recoupment and brokerage commission recapture | | % | 1.65 | | | 1.68 | | | 1.85 | | | 2.14 | | | 2.51 | | |
Net expenses after expense reimbursement | | | | | | | | | | | | | | | | | |
and prior to brokerage commission recapture(2) | | % | 1.65 | | | 1.68 | | | 1.85 | | | 2.14 | | | 2.51 | | |
Gross expenses prior to expense reimbursement/recoupment and | | | | | | | | | | | | | | | | | |
brokerage commission recapture | | % | 1.65 | | | 1.64 | | | 1.87 | | | 2.18 | | | 2.51 | | |
Net investment income (loss) after expense reimbursement/ | | | | | | | | | | | | | | | | | |
recoupment and brokerage commission recapture(2) | | % | 0.94 | | | 0.78 | | | 0.64 | | | (0.32 | ) | | (0.74 | ) | |
Portfolio turnover rate | | % | 116 | | | 90 | | | 100 | | | 126 | | | 169 | | |
| | | | | | | | | | | | | | | | | | |
| | | | Class B | |
| | | | Year Ended October 31, | |
| | | | 2005 | | 2004 | | 2003 | | 2002 | | 2001 | |
Per Share Operating Performance: | | | | | | | | | | | | | | | | |
Net asset value, beginning of period | | $ | 9.43 | | | 8.22 | | | 6.91 | | | 8.03 | | | 11.19 | | |
Income (loss) from investment operations: | | | | | | | | | | | | | | | | | |
Net investment income (loss) | | $ | 0.02 | | | (0.00 | )* | | (0.00 | )* | | (0.02 | ) | | (0.62 | ) | |
Net realized and unrealized gain (loss) on investments | | $ | 1.14 | | | 1.21 | | | 1.31 | | | (1.10 | ) | | (1.60 | ) | |
Total from investment operations | | $ | 1.16 | | | 1.21 | | | 1.31 | | | (1.12 | ) | | (2.22 | ) | |
Net investment income | | $ | 0.05 | | | — | | | — | | | — | | | — | | |
Less distributions from: | | | | | | | | | | | | | | | | | |
Net realized gain on investments | | $ | — | | | — | | | — | | | — | | | 0.94 | | |
Total distributions | | $ | 0.05 | | | — | | | — | | | — | | | 0.94 | | |
Payment by affiliate | | $ | 0.01 | | | — | | | — | | | — | | | — | | |
Net asset value, end of period | | $ | 10.55 | | | 9.43 | | | 8.22 | | | 6.91 | | | 8.03 | | |
Total Return(1) | | % | 12.41 | † | | 14.72 | | | 18.96 | | | (13.95 | ) | | (21.74 | ) | |
| | | | | | | | | | | | | | | | | |
Ratios and Supplemental Data: | | | | | | | | | | | | | | | | | |
Net assets, end of period (000’s) | | $ | 16,338 | | | 15,069 | | | 12,466 | | | 10,246 | | | 1,961 | | |
Ratios to average net assets: | | | | | | | | | | | | | | | | | |
Net expenses after expense reimbursement/recoupment and | | | | | | | | | | | | | | | | | |
brokerage commission recapture | | % | 2.40 | | | 2.43 | | | 2.60 | | | 2.76 | | | 3.32 | | |
Net expenses after expense reimbursement and prior to | | | | | | | | | | | | | | | | | |
brokerage commission recapture(2) | | % | 2.40 | | | 2.43 | | | 2.60 | | | 2.76 | | | 3.32 | | |
Gross expenses prior to expense reimbursement/ | | | | | | | | | | | | | | | | | |
recoupment and brokerage commission recapture | | % | 2.40 | | | 2.39 | | | 2.62 | | | 2.83 | | | 3.32 | | |
Net investment income (loss) after expense reimbursement/ | | | | | | | | | | | | | | | | | |
recoupment and brokerage commission recapture(2) | | % | 0.19 | | | (0.02 | ) | | (0.05 | ) | | (1.10 | ) | | (1.40 | ) | |
Portfolio turnover rate | | % | 116 | | | 90 | | | 100 | | | 126 | | | 169 | | |
| | | | | | | | | | | | | | | | | | |
(1) Total return is calculated assuming reinvestment of all dividends and capital gain distributions at net asset value and excluding the deduction of sales charges. Total return for less than one year is not annualized.
(2) The Investment Manager has agreed to limit expenses, (excluding interest, taxes, brokerage and extraordinary expenses) subject to possible recoupment by ING Investments, LLC within three years of being incurred.
* Amount represents less than $0.005 per share.
† In 2005, 0.10% of the total return on Class A and Class B, consists of a payment by affiliate. Excluding this item, total return would have been 13.20% and 12.31% for Class A and Class B, respectively.
See Accompanying Notes to Financial Statements
52
ING INTERNATIONAL FUND (CONTINUED) | | FINANCIAL HIGHLIGHTS |
Selected data for a share of beneficial interest outstanding throughout each period.
| | | Class C | |
| | | Year Ended October 31, | |
| | | 2005 | | 2004 | | 2003 | | 2002 | | 2001 | |
Per Share Operating Performance: | | | | | | | | | | | |
| | | | | | | | | | | |
Income (loss) from investment operations: | | | | | | | | | | | | | | | | | |
Net investment income (loss) | | $ | 0.03 | | | (0.00 | )* | | (0.00 | )* | | (0.02 | ) | | (0.62 | ) | |
Net realized and unrealized gain (loss) on investments | | $ | 1.13 | | | 1.20 | | | 1.31 | | | (1.09 | ) | | (1.63 | ) | |
Total from investment operations | | $ | 1.16 | | | 1.20 | | | 1.31 | | | (1.11 | ) | | (2.25 | ) | |
Less distributions from: | | | | | | | | | | | | | | | | | |
Net investment income | | $ | 0.04 | | | — | | | 0.00 | * | | — | | | — | | |
Net realized gain on investments | | $ | — | | | — | | | — | | | — | | | 0.94 | | |
Total distributions | | $ | 0.04 | | | — | | | 0.00 | * | | — | | | 0.94 | | |
Payment by affiliate | | $ | 0.01 | | | — | | | — | | | — | | | — | | |
Net asset value, end of period | | $ | 10.55 | | | 9.42 | | | 8.22 | | | 6.91 | | | 8.02 | | |
Total Return(1) | | % | 12.46 | † | | 14.60 | | | 18.97 | | | (13.84 | ) | | (21.98 | ) | |
| | | | | | | | | | | | | | | | | |
Ratios and Supplemental Data: | | | | | | | | | | | | | | | | | |
Net assets, end of period (000’s) | | $ | 15,008 | | | 16,230 | | | 14,526 | | | 12,384 | | | 1,514 | | |
Ratios to average net assets: | | | | | | | | | | | | | | | | | |
Net expenses after expense reimbursement/recoupment and | | | | | | | | | | | | | | | | | |
brokerage commission recapture | | % | 2.40 | | | 2.43 | | | 2.60 | | | 2.76 | | | 3.31 | | |
Net expenses after expense reimbursement and prior to | | | | | | | | | | | | | | | | | |
brokerage commission recapture(2) | | % | 2.40 | | | 2.43 | | | 2.60 | | | 2.76 | | | 3.31 | | |
Gross expenses prior to expense reimbursement/ | | | | | | | | | | | | | | | | | |
recoupment and brokerage commission recapture | | % | 2.40 | | | 2.39 | | | 2.62 | | | 2.84 | | | 3.31 | | |
Net investment income (loss) after expense reimbursement/ | | | | | | | | | | | | | | | | | |
recoupment and brokerage commission recapture(2) | | % | 0.18 | | | (0.04 | ) | | (0.05 | ) | | (1.18 | ) | | (1.46 | ) | |
Portfolio turnover rate | | % | 116 | | | 90 | | | 100 | | | 126 | | | 169 | | |
| | | | | | | | | | | | | | | | | | |
(1) Total return is calculated assuming reinvestment of all dividends and capital gain distributions at net asset value and excluding the deduction of sales charges. Total return for less than one year is not annualized.
(2) The Investment Manager has agreed to limit expenses, (excluding interest, taxes, brokerage and extraordinary expenses) subject to possible recoupment by ING Investments, LLC within three years of being incurred.
* Amount represents less than $0.005 per share.
† In 2005, 0.10% of the total return on Class C consists of a payment by affiliate. Excluding this item, total return would have been 12.36%.
See Accompanying Notes to Financial Statements
53
ING INTERNATIONAL SMALLCAP FUND | | FINANCIAL HIGHLIGHTS |
Selected data for a share of beneficial interest outstanding throughout each period.
| | | Class A | |
| | | Year Ended October 31, | |
| | | 2005 | | 2004 | | 2003 | | 2002 | | 2001 | |
Per Share Operating Performance: | | | | | | | | | | | |
Net asset value, beginning of period | | $ | 29.27 | | | 25.37 | | | 18.35 | | | 21.85 | | | 36.08 | | |
Income (loss) from investment operations: | | | | | | | | | | | | | | | | | |
Net investment income (loss) | | $ | 0.33 | ** | | 0.02 | | | 0.01 | | | (0.07 | ) | | (0.11 | ) | |
Net realized and unrealized gain (loss) on investments | | $ | 8.05 | ** | | 3.86 | | | 7.01 | | | (3.43 | ) | | (11.39 | ) | |
Total from investment operations | | $ | 8.38 | | | 3.88 | | | 7.02 | | | (3.50 | ) | | (11.50 | ) | |
Less distributions from: | | | | | | | | | | | | | | | | | |
Net investment income | | $ | — | | | 0.00 | * | | — | | | — | | | 0.24 | | |
Net realized gain on investments | | $ | — | | | — | | | — | | | — | | | 2.49 | | |
Total distributions | | $ | — | | | 0.00 | * | | — | | | — | | | 2.73 | | |
Payment by affiliate | | $ | 0.10 | | | 0.02 | | | — | | | — | | | — | | |
Net asset value, end of period | | $ | 37.75 | | | 29.27 | | | 25.37 | | | 18.35 | | | 21.85 | | |
Total Return(1) | | % | 28.97 | †† | | 15.39 | † | | 38.26 | | | (16.02 | ) | | (34.30 | ) | |
| | | | | | | | | | | | | | | | | |
Ratios and Supplemental Data: | | | | | | | | | | | | | | | | | |
Net assets, end of period (000’s) | | $ | 173,612 | | | 154,658 | | | 150,043 | | | 123,206 | | | 153,804 | | |
Ratios to average net assets: | | | | | | | | | | | | | | | | | |
Net expenses after expense reimbursement/recoupment(2) | | % | 1.74 | | | 1.75 | | | 1.95 | | | 1.95 | | | 1.83 | | |
Gross expenses prior to expense reimbursement/recoupment | | % | 1.74 | | | 1.72 | | | 1.94 | | | 1.99 | | | 1.83 | | |
Net investment income (loss) after expense | | | | | | | | | | | | | | | | | |
reimbursement/recoupment(2) | | % | 0.98 | | | 0.07 | | | 0.00 | | | (0.32 | ) | | (0.33 | ) | |
Portfolio turnover rate | | % | 124 | | | 106 | | | 114 | | | 149 | | | 143 | | |
| | | | | | | | | | | | | | | | | | |
| | | Class B | |
| | | Year Ended October 31, | |
| | | 2005 | | 2004 | | 2003 | | 2002 | | 2001 | |
Per Share Operating Performance: | | | | | | | | | | | |
Net asset value, beginning of period | | $ | 30.30 | | | 26.43 | | | 19.25 | | | 23.06 | | | 38.05 | | |
Income (loss) from investment operations: | | | | | | | | | | | | | | | | | |
Net investment income (loss) | | $ | 0.10 | ** | | (0.19 | ) | | (0.24 | ) | | (0.32 | ) | | (0.32 | ) | |
Net realized and unrealized gain (loss) on investments | | $ | 8.33 | ** | | 4.04 | | | 7.42 | | | (3.49 | ) | | (11.98 | ) | |
Total from investment operations | | $ | 8.43 | | | 3.85 | | | 7.18 | | | (3.81 | ) | | (12.30 | ) | |
Less distributions from: | | | | | | | | | | | | | | | | | |
Net investment income | | $ | — | | | — | | | — | | | — | | | 0.07 | | |
Net realized gain on investments | | $ | — | | | — | | | — | | | — | | | 2.62 | | |
Total distributions | | $ | — | | | — | | | — | | | — | | | 2.69 | | |
Payment by affiliate | | $ | 0.10 | | | 0.02 | | | — | | | — | | | — | | |
Net asset value, end of period | | $ | 38.83 | | | 30.30 | | | 26.43 | | | 19.25 | | | 23.06 | | |
Total Return(1) | | % | 28.15 | †† | | 14.64 | † | | 37.30 | | | (16.52 | ) | | (34.59 | ) | |
| | | | | | | | | | | | | | | | | |
Ratios and Supplemental Data: | | | | | | | | | | | | | | | | | |
Net assets, end of period (000’s) | | $ | 57,131 | | | 58,318 | | | 62,104 | | | 52,661 | | | 74,541 | | |
Ratios to average net assets: | | | | | | | | | | | | | | | | | |
Net expenses after expense reimbursement/recoupment(2) | | % | 2.39 | | | 2.40 | | | 2.60 | | | 2.60 | | | 2.48 | | |
Gross expenses prior to expense reimbursement/recoupment | | % | 2.39 | | | 2.37 | | | 2.59 | | | 2.63 | | | 2.48 | | |
Net investment income (loss) after expense | | | | | | | | | | | | | | | | | |
reimbursement/recoupment(2) | | % | 0.29 | | | (0.60 | ) | | (0.68 | ) | | (0.98 | ) | | (0.98 | ) | |
Portfolio turnover rate | | % | 124 | | | 106 | | | 114 | | | 149 | | | 143 | | |
| | | | | | | | | | | | | | | | | | |
(1) Total return is calculated assuming reinvestment of all dividends and capital gain distributions at net asset value and excluding the deduction of sales charges. Total return for less than one year is not annualized.
(2) The Investment Manager has agreed to limit expenses, (excluding interest, taxes, brokerage and extraordinary expenses) subject to possible recoupment by ING Investments, LLC within three years of being incurred.
* Amount represents less than $0.005 per share.
** Per share data calculated using average number of shares outstanding throughout the period.
† In 2004, the Sub-Adviser fully reimbursed the Fund for a loss incurred from a transaction not meeting the Fund’s investment guidelines, which otherwise would have reduced total return by 0.07%.
†† In 2005, 0.34% and 0.33% of the total return on Class A and Class B, respectively, consists of a payment by affiliate. Excluding this item, total return would have been 28.63% and 27.82% on Class A and Class B, respectively.
See Accompanying Notes to Financial Statements
54
ING INTERNATIONAL SMALLCAP FUND (CONTINUED) | | FINANCIAL HIGHLIGHTS |
Selected data for a share of beneficial interest outstanding throughout each period.
| | | Class C | |
| | | Year Ended October 31, | |
| | | 2005 | | 2004 | | 2003 | | 2002 | | 2001 | |
Per Share Operating Performance: | | | | | | | | | | | | |
Net asset value, beginning of period | | $ | 27.77 | | | 24.23 | | | 17.65 | | | 21.14 | | | 34.93 | | |
Income (loss) from investment operations: | | | | | | | | | | | | | | | | | |
Net investment income (loss) | | $ | 0.10 | * | | (0.17 | ) | | (0.29 | ) | | (0.32 | ) | | (0.38 | ) | |
Net realized and unrealized gain (loss) on investments | | $ | 7.62 | * | | 3.70 | | | 6.87 | | | (3.17 | ) | | (10.91 | ) | |
Total from investment operations | | $ | 7.72 | | | 3.53 | | | 6.58 | | | (3.49 | ) | | (11.29 | ) | |
Less distributions from: | | | | | | | | | | | | | | | | | |
Net investment income | | $ | — | | | — | | | — | | | — | | | 0.09 | | |
Net realized gain on investments | | $ | — | | | — | | | — | | | — | | | 2.41 | | |
Total distributions | | $ | — | | | — | | | — | | | — | | | 2.50 | | |
Payment by affiliate | | $ | 0.10 | | | 0.01 | | | — | | | — | | | — | | |
Net asset value, end of period | | $ | 35.59 | | | 27.77 | | | 24.23 | | | 17.65 | | | 21.14 | | |
Total Return(1) | | % | 28.16 | †† | | 14.61 | † | | 37.28 | | | (16.51 | ) | | (34.62 | ) | |
| | | | | | | | | | | | | | | | | |
Ratios and Supplemental Data: | | | | | | | | | | | | | | | | | |
Net assets, end of period (000’s) | | $ | 52,420 | | | 47,793 | | | 50,227 | | | 46,703 | | | 69,320 | | |
Ratios to average net assets: | | | | | | | | | | | | | | | | | |
Net expenses after expense reimbursement/recoupment(2) | | % | 2.39 | | | 2.40 | | | 2.60 | | | 2.60 | | | 2.48 | | |
Gross expenses prior to expense reimbursement/recoupment | | % | 2.39 | | | 2.37 | | | 2.59 | | | 2.63 | | | 2.48 | | |
Net investment income (loss) after expense | | | | | | | | | | | | | | | | | |
reimbursement/recoupment(2) | | % | 0.30 | | | (0.60 | ) | | (0.68 | ) | | (0.99 | ) | | (0.98 | ) | |
Portfolio turnover rate | | % | 124 | | | 106 | | | 114 | | | 149 | | | 143 | | |
(1) Total return is calculated assuming reinvestment of all dividends and capital gain distributions at net asset value and excluding the deduction of sales charges. Total return for less than one year is not annualized.
(2) The Investment Manager has agreed to limit expenses, (excluding interest, taxes, brokerage and extraordinary expenses) subject to possible recoupment by ING Investments, LLC within three years of being incurred.
* Per share data calculated using average number of shares outstanding throughout the period.
† In 2004, the Sub-Adviser fully reimbursed the Fund for a loss incurred from a transaction not meeting the Fund’s investment guidelines, which otherwise would have reduced total return by 0.04%.
†† In 2005, 0.36% of the total return consists of a payment by affiliate. Excluding this item, total return would have been 27.80%.
See Accompanying Notes to Financial Statements
55
ING INTERNATIONAL VALUE FUND | | FINANCIAL HIGHLIGHTS |
Selected data for a share of beneficial interest outstanding throughout each period.
| | | Class A | |
| | | Year Ended October 31, | |
| | | 2005 | | 2004 | | 2003 | | 2002 | | 2001 | |
Per Share Operating Performance: | | | | | | | | | | | | |
Net asset value, beginning of period | | $ | 16.90 | | | 13.71 | | | 10.40 | | | 12.33 | | | 16.68 | | |
Income (loss) from investment operations: | | | | | | | | | | | | | | | | | |
Net investment income | | $ | 0.17 | | | 0.13 | | | 0.08 | | | 0.06 | | | 0.11 | | |
Net realized and unrealized gain (loss) | | | | | | | | | | | | | | | | | |
on investments | | $ | 2.28 | | | 3.15 | | | 3.48 | | | (1.64 | ) | | (2.44 | ) | |
Total from investment operations | | $ | 2.45 | | | 3.28 | | | 3.56 | | | (1.58 | ) | | (2.33 | ) | |
Less distributions from: | | | | | | | | | | | | | | | | | |
Net investment income | | $ | 0.22 | | | 0.09 | | | 0.05 | | | 0.09 | | | 0.14 | | |
Net realized gain on investments | | $ | 0.80 | | | — | | | 0.20 | | | 0.26 | | | 1.88 | | |
Total distributions | | $ | 1.02 | | | 0.09 | | | 0.25 | | | 0.35 | | | 2.02 | | |
Payment by affiliate | | $ | 0.00 | * | | — | | | — | | | — | | | — | | |
Net asset value, end of period | | $ | 18.33 | | | 16.90 | | | 13.71 | | | 10.40 | | | 12.33 | | |
Total Return(1) | | % | 15.06 | † | | 24.03 | | | 35.11 | | | (13.31 | ) | | (15.89 | ) | |
| | | | | | | | | | | | | | | | | |
Ratios and Supplemental Data: | | | | | | | | | | | | | | | | | |
Net assets, end of period (000’s) | | $ | 1,732,332 | | | 1,869,868 | | | 1,641,943 | | | 1,356,334 | | | 920,591 | | |
Ratios to average net assets: | | | | | | | | | | | | | | | | | |
Expenses | | % | 1.60 | | | 1.61 | | | 1.74 | | | 1.76 | | | 1.67 | | |
Net investment income | | % | 0.88 | | | 0.79 | | | 0.66 | | | 0.58 | | | 0.88 | | |
Portfolio turnover rate | | % | 21 | | | 29 | | | 9 | | | 20 | | | 15 | | |
| | | | | | | | | | | | | | | | | | | |
| | | Class B | |
| | | Year Ended October 31, | |
| | | 2005 | | 2004 | | 2003 | | 2002 | | 2001 | |
Per Share Operating Performance: | | | | | | | | | | | | | |
Net asset value, beginning of period | | $ | 16.58 | | | 13.45 | | | 10.23 | | | 12.13 | | | 16.43 | | |
Income (loss) from investment operations: | | | | | | | | | | | | | | | | | |
Net investment income (loss) | | $ | 0.05 | | | 0.02 | | | (0.00 | )* | | (0.02 | ) | | 0.02 | | |
Net realized and unrealized gain (loss) | | | | | | | | | | | | | | | | | |
on investments | | $ | 2.23 | | | 3.11 | | | 3.42 | | | (1.62 | ) | | (2.41 | ) | |
Total from investment operations | | $ | 2.28 | | | 3.13 | | | 3.42 | | | (1.64 | ) | | (2.39 | ) | |
Less distributions from: | | | | | | | | | | | | | | | | | |
Net investment income | | $ | 0.11 | | | — | | | — | | | 0.00 | * | | 0.03 | | |
Net realized gain on investments | | $ | 0.80 | | | — | | | 0.20 | | | 0.26 | | | 1.88 | | |
Total distributions | | $ | 0.91 | | | — | | | 0.20 | | | 0.26 | | | 1.91 | | |
Payment by affiliate | | $ | 0.00 | * | | — | | | — | | | — | | | — | | |
Net asset value, end of period | | $ | 17.95 | | | 16.58 | | | 13.45 | | | 10.23 | | | 12.13 | | |
Total Return(1) | | % | 14.21 | † | | 23.27 | | | 34.11 | | | (13.90 | ) | | (16.48 | ) | |
| | | | | | | | | | | | | | | | | |
Ratios and Supplemental Data: | | | | | | | | | | | | | | | | | |
Net assets, end of period (000’s) | | $ | 411,071 | | | 454,952 | | | 420,651 | | | 375,967 | | | 421,884 | | |
Ratios to average net assets: | | | | | | | | | | | | | | | | | |
Expenses | | % | 2.30 | | | 2.31 | | | 2.44 | | | 2.45 | | | 2.37 | | |
Net investment income (loss) | | % | 0.17 | | | 0.09 | | | (0.04 | ) | | (0.13 | ) | | 0.16 | | |
Portfolio turnover rate | | % | 21 | | | 29 | | | 9 | | | 20 | | | 15 | | |
| | | | | | | | | | | | | | | | | | |
(1) Total return is calculated assuming reinvestment of all dividends and capital gain distributions at net asset value and excluding the deduction of sales charges. Total return for less than one year is not annualized.
* Amount represents less than $0.005 per share.
† In 2005, there was no impact on total return due to payment by affiliate.
See Accompanying Notes to Financial Statements
56
ING INTERNATIONAL VALUE FUND (CONTINUED) | | FINANCIAL HIGHLIGHTS |
Selected data for a share of beneficial interest outstanding throughout each period.
| | | Class C | |
| | | Year Ended October 31, | |
| | | 2005 | | 2004 | | 2003 | | 2002 | | 2001 | |
Per Share Operating Performance: | | | | | | | | | | | | |
Net asset value, beginning of period | | $ | 16.54 | | | 13.42 | | | 10.21 | | | 12.10 | | | 16.41 | | |
Income (loss) from investment operations: | | | | | | | | | | | | | | | | | |
Net investment income (loss) | | $ | 0.04 | | | 0.02 | | | (0.00 | )* | | (0.02 | ) | | 0.02 | | |
Net realized and unrealized gain (loss) | | | | | | | | | | | | | | | | | |
on investments | | $ | 2.24 | | | 3.10 | | | 3.41 | | | (1.61 | ) | | (2.41 | ) | |
Total from investment operations | | $ | 2.28 | | | 3.12 | | | 3.41 | | | (1.63 | ) | | (2.39 | ) | |
Less distributions from: | | | | | | | | | | | | | | | | | |
Net investment income | | $ | 0.11 | | | — | | | — | | | 0.00 | * | | 0.04 | | |
Net realized gain on investments | | $ | 0.80 | | | — | | | 0.20 | | | 0.26 | | | 1.88 | | |
Total distributions | | $ | 0.91 | | | — | | | 0.20 | | | 0.26 | | | 1.92 | | |
Payment by affiliate | | $ | 0.00 | * | | — | | | — | | | — | | | — | | |
Net asset value, end of period | | $ | 17.91 | | | 16.54 | | | 13.42 | | | 10.21 | | | 12.10 | | |
Total Return(1) | | % | 14.25 | † | | 23.25 | | | 34.08 | | | (13.85 | ) | | (16.52 | ) | |
| | | | | | | | | | | | | | | | | |
Ratios and Supplemental Data: | | | | | | | | | | | | | | | | | |
Net assets, end of period (000’s) | | $ | 663,626 | | | 675,039 | | | 628,704 | | | 573,712 | | | 603,229 | | |
Ratios to average net assets: | | | | | | | | | | | | | | | | | |
Expenses | | % | 2.30 | | | 2.31 | | | 2.44 | | | 2.46 | | | 2.37 | | |
Net investment income (loss) | | % | 0.15 | | | 0.09 | | | (0.04 | ) | | (0.13 | ) | | 0.16 | | |
Portfolio turnover rate | | % | 21 | | | 29 | | | 9 | | | 20 | | | 15 | | |
| | | | | | | | | | | | | | | | | | |
(1) Total return is calculated assuming reinvestment of all dividends and capital gain distributions at net asset value and excluding the deduction of sales charges. Total return for less than one year is not annualized.
* Amount represents less than $0.005 per share.
† In 2005, there was no impact on total return due to payment by affiliate.
See Accompanying Notes to Financial Statements
57
ING INTERNATIONAL VALUE CHOICE FUND | | FINANCIAL HIGHLIGHTS |
Selected data for a share of beneficial interest outstanding throughout each period.
| | | Class A | | | Class B | | | Class C | |
| | | February 1, | | | February 1, | | | February 4, | |
| | | 2005(1) to | | | 2005(1) to | | | 2005(1) to | |
| | | October 31, | | | October 31, | | | October 31, | |
| | | 2005 | | | 2005 | | | 2005 | |
Per Share Operating Performance: | | | | | | | | | | |
Net asset value, beginning of period | | $ | 10.00 | | | | 10.00 | | | | 10.01 | | |
Income (loss) from investment operations: | | | | | | | | | | | | | |
Net investment income | | $ | 0.11 | * | | | 0.04 | * | | | 0.04 | * | |
Net realized and unrealized gain (loss) on investments | | $ | 0.59 | * | | | 0.61 | * | | | 0.61 | * | |
Total from investment operations | | $ | 0.70 | | | | 0.65 | | | | 0.65 | | |
Net asset value, end of period | | $ | 10.70 | | | | 10.65 | | | | 10.66 | | |
Total Return(2) | | % | 7.00 | | | | 6.50 | | | | 6.49 | | |
| | | | | | | | | | | | | |
Ratios and Supplemental Data: | | | | | | | | | | | | | |
Net assets, end of period (000’s) | | $ | 6,115 | | | | 1,427 | | | | 1,796 | | |
Ratios to average net assets: | | | | | | | | | | | | | |
Net expenses after expense reimbursement(3)(4) | | % | 1.70 | | | | 2.45 | | | | 2.45 | | |
Gross expenses prior to expense reimbursement(3) | | % | 3.44 | | | | 4.19 | | | | 4.19 | | |
Net investment income(3)(4) | | % | 1.08 | | | | 0.36 | | | | 0.35 | | |
Portfolio turnover rate | | % | 24 | | | | 24 | | | | 24 | | |
| | | | | | | | | | | | | | | | |
(1) Commencement of operations.
(2) Total return is calculated assuming reinvestment of all dividends and capital gain distributions at net asset value and excluding the deduction of sales charges. Total return for less than one year is not annualized.
(3) Annualized for periods less than one year.
(4) The Investment Manager has agreed to limit expenses, (excluding interest, taxes, brokerage and extraordinary expenses) subject to possible recoupment by ING Investments, LLC within three years of being incurred.
* Per share data calculated using average number of shares outstanding throughout the period.
See Accompanying Notes to Financial Statements
58
ING PRECIOUS METALS FUND | | FINANCIAL HIGHLIGHTS |
Selected data for a share of beneficial interest outstanding throughout each period.
| | | Class A | |
| | | Year Ended October 31, | |
| | | 2005 | | 2004 | | 2003 | | 2002 | | 2001 | |
Per Share Operating Performance: | | | | | | | | | | | | |
Net asset value, beginning of period | | $ | 7.09 | | | 6.94 | | | 4.40 | | | 3.05 | | | 2.27 | | |
Income (loss) from investment operations: | | | | | | | | | | | | | | | | | |
Net investment income (loss) | | $ | (0.06 | ) | | (0.05 | ) | | (0.02 | ) | | (0.01 | ) | | 0.02 | | |
Net realized and unrealized gain on investments | | $ | 0.54 | | | 0.20 | | | 2.56 | | | 1.38 | | | 0.76 | | |
Total from investment operations | | $ | 0.48 | | | 0.15 | | | 2.54 | | | 1.37 | | | 0.78 | | |
Less distributions from: | | | | | | | | | | | | | | | | | |
Net investment income | | $ | 0.23 | | | — | | | — | | | 0.02 | | | 0.00 | * | |
Total distributions | | $ | 0.23 | | | — | | | — | | | 0.02 | | | 0.00 | * | |
Net asset value, end of period | | $ | 7.34 | | | 7.09 | | | 6.94 | | | 4.40 | | | 3.05 | | |
Total Return(1) | | % | 6.81 | | | 2.16 | | | 57.73 | | | 45.01 | | | 34.56 | | |
| | | | | | | | | | | | | | | | | |
Ratios and Supplemental Data: | | | | | | | | | | | | | | | | | |
Net assets, end of period (000’s) | | $ | 87,441 | | | 91,756 | | | 101,696 | | | 72,346 | | | 60,563 | | |
Ratios to average net assets: | | | | | | | | | | | | | | | | | |
Expenses | | % | 1.56 | | | 1.44 | | | 1.57 | | | 1.73 | | | 1.96 | | |
Net investment income (loss) | | % | (0.77 | ) | | (0.69 | ) | | (0.36 | ) | | (0.33 | ) | | 0.67 | | |
Portfolio turnover rate | | % | 78 | | | 77 | | | 94 | | | 54 | | | 83 | | |
(1) Total return is calculated assuming reinvestment of all dividends and capital gain distributions at net asset value and excluding the deduction of sales charges. Total return for less than one year is not annualized.
* Amount represents less than $0.005 per share
See Accompanying Notes to Financial Statements
59
ING RUSSIA FUND | | FINANCIAL HIGHLIGHTS |
Selected data for a share of beneficial interest outstanding throughout each period.
| | | Class A | |
| | | Year Ended October 31, | |
| | | 2005 | | 2004 | | 2003 | | 2002 | | 2001 | |
Per Share Operating Performance: | | | | | | | | | | | | |
Net asset value, beginning of period | | $ | 25.01 | | | 19.13 | | | 12.15 | | | 8.04 | | | 7.15 | | |
Income (loss) from investment operations: | | | | | | | | | | | | | | | | | |
Net investment income (loss) | | $ | (0.00 | )* | | 0.04 | | | (0.00 | )* | | 0.17 | | | (0.04 | ) | |
Net realized and unrealized gain on investments | | $ | 8.39 | | | 5.69 | | | 7.06 | | | 3.92 | | | 0.93 | | |
Total from investment operations | | $ | 8.39 | | | 5.73 | | | 7.06 | | | 4.09 | | | 0.89 | | |
Less distributions from: | | | | | | | | | | | | | | | | | |
Net investment income | | $ | 0.01 | | | 0.02 | | | 0.12 | | | — | | | — | | |
Total distributions | | $ | 0.01 | | | 0.02 | | | 0.12 | | | — | | | — | | |
Redemption fees applied to capital | | $ | 0.10 | | | 0.17 | | | 0.04 | | | 0.02 | | | — | | |
Net asset value, end of period | | $ | 33.49 | | | 25.01 | | | 19.13 | | | 12.15 | | | 8.04 | | |
Total Return(1) | | % | 33.98 | | | 30.88 | | | 58.98 | | | 51.12 | | | 12.45 | | |
| | | | | | | | | | | | | | | | | |
Ratios and Supplemental Data: | | | | | | | | | | | | | | | | | |
Net assets, end of period (000’s) | | $ | 271,603 | | | 212,180 | | | 161,601 | | | 85,658 | | | 49,019 | | |
Ratios to average net assets: | | | | | | | | | | | | | | | | | |
Net expenses after expense reimbursement(2) | | % | 2.13 | | | 2.01 | | | 2.09 | | | 1.77 | | | 2.23 | | |
Gross expenses prior to expense reimbursement | | % | 2.13 | | | 2.01 | | | 2.09 | | | 2.20 | | | 2.77 | | |
Net investment income (loss) expense reimbursement(2) | | % | (0.01 | ) | | 0.15 | | | (0.02 | ) | | 1.33 | | | (0.56 | ) | |
Portfolio turnover rate | | % | 26 | | | 54 | | | 23 | | | 32 | | | 28 | | |
(1) Total return is calculated assuming reinvestment of all dividends and capital gain distributions at net asset value and excluding the deduction of sales charges. Total return for less than one year is not annualized.
(2) The Investment Manager has agreed to limit expenses, (excluding interest, taxes, brokerage and extraordinary expenses) subject to possible recoupment by ING Investments, LLC within three years of being incurred.
* Amount is less than $0.005 per share.
See Accompanying Notes to Financial Statements
60
NOTES TO FINANCIAL STATEMENTS AS OF OCTOBER 31, 2005
NOTE 1 — ORGANIZATION
Organization. The ING Funds included in this report are comprised of ING Mutual Funds (“IMF”) and ING Mayflower Trust (“IMT”); both are organized as open-end investment management companies registered under the Investment Company Act of 1940, as amended.
IMF is a Delaware statutory trust organized in 1992 with ten separate series (“Funds”): ING Global Equity Dividend Fund (“Global Equity Dividend”), ING Global Real Estate Fund (“Global Real Estate”), ING Global Value Choice Fund (“Global Value Choice”), ING Emerging Countries Fund (“Emerging Countries”), ING Foreign Fund (“Foreign”), ING International Fund (“International”), ING International SmallCap Fund (“International SmallCap”), ING International Value Choice Fund (“International Value Choice”), ING Precious Metals Fund (“Precious Metals”) and ING Russia Fund (“Russia”). IMT is a Massachusetts business trust organized in 1993 with one series (Fund), ING International Value Fund (“International Value”). The investment objective of each Fund is described in each Fund’s prospectus.
Each Fund offers one or more of the following classes of shares: Class A, Class B, Class C, Class I, Class M and Class Q (Class I and Class Q are presented in a separate annual report). The separate classes of shares differ principally in the applicable sales charges (if any), distribution fees and shareholder servicing fees and transfer agent fees. Shareholders of each class also bear certain expenses that pertain to that particular class. All shareholders bear the common expenses of the Fund and earn income and realized gains/losses from the portfolio pro rata based on the average daily net assets of each class, without distinction between share classes. Differences in per share dividend rates generally result from the differences in separate class expenses, including distribution and shareholder servicing fees. Class B shares, along with their pro rata reinvested dividend shares, automatically convert to Class A shares approximately eight years after purchase.
Effective September 2, 2003, International Value was closed to new investments except for shares purchased (1) through the reinvestment of dividends and distributions; (2) by 401(k), 403(b) and 457 plans that have selected International Value as an investment option prior to June 28, 2002; (3) by shareholders participating in mutual fund wrap fee programs who were invested in International Value prior to June 28, 2002; (4) by new 401(k), 403(b) and 457 plans and new shareholders participating in mutual fund wrap fee programs subject to approval by the Investment Manager and Sub-Adviser based on their assessment of the Fund’s ability to invest the monies consistent with the Fund’s objectives in light of market conditions, the size of the purchase, and other relevant factors relating to International Value, or (5) by employees of the Investment Manager or Sub-Adviser and their affiliates. Proof of eligibility may be required. Employees of the Investment Manager or Sub-Adviser and their affiliates must identify themselves as such at the time of purchase. Failure to do so may result in a rejection of the purchase.
NOTE 2 — SIGNIFICANT ACCOUNTING POLICIES
The following significant accounting policies are consistently followed by the Funds in the preparation of their financial statements, and such policies are in conformity with accounting principles generally accepted in the United States of America for investment companies.
A. Security Valuation. For all Funds except Russia, investments in equity securities traded on a national securities exchange are valued at the last reported sale price. Securities reported by NASDAQ will be valued at the NASDAQ official closing prices. Securities traded on an exchange or NASDAQ for which there has been no sale, securities traded in the over-the-counter-market, gold and silver bullion, platinum and palladium are valued at the mean between the last reported bid and ask prices. All investments quoted in foreign currencies will be valued daily in U.S. dollars on the basis of the foreign currency exchange rates prevailing at that time. Debt securities are valued at prices obtained from independent services or from one or more dealers making markets in the securities and may be adjusted based on the Fund’s valuation procedures. U.S. Government obligations are valued by using market quotations or independent pricing services that use prices provided by market-makers or estimates of market values obtained from yield data relating to instruments or securities with similar characteristics.
Securities and assets for which market quotations are not readily available (which may include certain restricted securities which are subject to limitations as to their sale) are valued at their fair values as determined in good faith by or under the supervision of the Fund’s Board in accordance with methods that are specifically authorized by the Board. Securities traded on exchanges, including foreign exchanges, which close earlier than the
61
NOTES TO FINANCIAL STATEMENTS AS OF OCTOBER 31, 2005 (CONTINUED)
NOTE 2 — SIGNIFICANT ACCOUNTING POLICIES (continued)
time that a Fund calculates its next net asset value may also be valued at their fair values as determined in good faith by or under the supervision of a Fund’s Board, in accordance with methods that are specifically authorized by the Board. The valuation techniques applied in any specific instance are likely to vary from case to case. With respect to a restricted security, for example, consideration is generally given to the cost of the investment, the market value of any unrestricted securities of the same class at the time of valuation, the potential expiration of restrictions on the security, the existence of any registration rights, the costs to the Fund related to registration of the security, as well as factors relevant to the issuer itself. Consideration may also be given to the price and extent of any public trading in similar securities of the issuer or comparable companies’ securities.
The value of a foreign security traded on an exchange outside the United States is generally based on its price on the principal foreign exchange where it trades as of the time the Fund determines its NAV or if the foreign exchange closes prior to the time the Fund determines its NAV, the most recent closing price of the foreign security on its principal exchange. Trading in certain non-U.S. securities may not take place on all days on which the NYSE is open. Further, trading takes place in various foreign markets on days on which the NYSE is not open. Consequently, the calculation of the Fund’s NAV may not take place contemporaneously with the determination of the prices of securities held by the Fund in foreign securities markets. Further, the value of a Fund’s assets may be significantly affected by foreign trading on days when a shareholder cannot purchase or redeem shares of the Fund. In calculating a Fund’s NAV, foreign securities in foreign currency are converted to U.S. dollar equivalents.
If an event occurs after the time at which the market for foreign securities held by the Fund closes but before the time that the Fund’s next NAV is calculated, such event may cause the closing price on the foreign exchange to not represent a readily available reliable market value quotation for such securities at the time the Fund determines its NAV. In such a case, the Fund will use the fair value of such securities as determined under the Fund’s valuation procedures. Events after the close of trading on a foreign market that could require the Fund to fair value some or all of its foreign securities include, among others, securities trading in the U.S. and other markets, corporate announcements, natural and other disasters, and political and other events. Among other elements of analysis in the determination of a security’s fair value, the Board has authorized the use of one or more independent research services to assist with such determinations. An independent research service may use statistical analyses and quantitative models to help determine fair value as of the time a Fund calculates its NAV. There can be no assurance that such models accurately reflect the behavior of the applicable markets or the effect of the behavior of such markets on the fair value of securities, or that such markets will continue to behave in a fashion that is consistent with such models. Unlike the closing price of a security on an exchange, fair value determinations employ elements of judgment. Consequently, the fair value assigned to a security may not represent the actual value that the Fund could obtain if it were to sell the security at the time of the close of the NYSE. Pursuant to procedures adopted by the Board, the Fund is not obligated to use the fair valuations suggested by any research service, and valuation recommendations provided by such research services may be overridden if other events have occurred or if other fair valuations are determined in good faith to be more accurate. Unless an event is such that it causes the Fund to determine that the closing prices for one or more securities do not represent readily available reliable market value quotations at the time the Fund determines its NAV, events that occur between the time of the close of the foreign market on which they are traded and the close of regular trading on the NYSE will not be reflected in the Fund’s NAV. Investments in securities maturing in 60 days or less are valued at amortized cost, which, when combined with accrued interest approximates market value.
For the Russia Fund, the valuation procedures for Russian equity securities are to price local shares according to the most recent available bid prices. If securities are not listed on the Russian Trade System or on any other pricing service that lists available bid quotes, then the mean of at least two broker bid quotes is used. For equity securities of an issuer in Russia for which there are no readily available reliable market value quotations, the following benchmark pricing procedure shall apply on any day on which the largest securities exchange in Russia (the “RTS”) declines by 21/2% or more. The price of the security shall be adjusted by the amount of the downward change in a composite of the other companies that are publicly traded in the same sector as the issuer, if ascertainable, and if not ascertainable, by the amount of downward change in the RTS.
62
NOTES TO FINANCIAL STATEMENTS AS OF OCTOBER 31, 2005 (CONTINUED)
NOTE 2 — SIGNIFICANT ACCOUNTING POLICIES (continued)
B. Security Transactions and Revenue Recognition. Securities transactions are accounted for on the trade date. Realized gains and losses are reported on the basis of identified cost of securities sold. Interest income is recorded on an accrual basis. Dividend income is recorded, net of any applicable withholding tax, on the ex-dividend date, or for certain foreign securities, when the information becomes available to the Funds. Premium amortization and discount accretion are determined by the effective yield method.
The Fund estimates components of distributions from real estate investment trust (REITs). Distributions received in excess of income are recorded as a reduction of cost of the related investments. If the Funds no longer own the applicable securities, any distributions received in excess of income are recorded as realized gains.
C. Foreign Currency Translation. The books and records of the Funds are maintained in U.S. dollars. Any foreign currency amounts are translated into U.S. dollars on the following basis:
(1) Market value of investment securities, other assets and liabilities — at the exchange rates prevailing at the end of the day.
(2) Purchases and sales of investment securities, income and expenses — at the rates of exchange prevailing on the respective dates of such transactions.
Although the net assets and the market values are presented at the foreign exchange rates at the end of the day, the Funds do not isolate the portion of the results of operations resulting from changes in foreign exchange rates on investments from the fluctuations arising from changes in market prices of securities held. Such fluctuations are included with the net realized and unrealized gains or losses from investments. For securities that are subject to foreign withholding tax upon disposition, liabilities are recorded on the Statements of Assets and Liabilities for the estimated tax withholding based on the securities’ current market value. Upon disposition, realized gains or losses on such securities are recorded net of foreign withholding tax.
Reported net realized foreign exchange gains or losses arise from sales of foreign currencies, currency gains or losses realized between the trade and settlement dates on securities transactions, the difference between the amounts of dividends, interest, and foreign withholding taxes recorded on the Fund’s books, and the U.S. dollar equivalent of the amounts actually received or paid. Net unrealized foreign exchange gains and losses arise from changes in the value of assets and liabilities other than investments in securities at fiscal year end, resulting from changes in the exchange rate. Foreign security and currency transactions may involve certain considerations and risks not typically associated with investing in U.S. companies and U.S. Government securities. These risks include, but are not limited to revaluation of currencies and future adverse political and economic developments which could cause securities and their markets to be less liquid and prices more volatile than those of comparable U.S. companies and U.S. Government securities.
D. Foreign Currency Transactions and Futures Contracts. Each Fund may enter into foreign currency exchange transactions to convert to and from different foreign currencies and to and from the U.S. dollar generally in connection with the planned purchases or sales of securities. The Funds either enter into these transactions on a spot basis at the spot rate prevailing in the foreign currency exchange market or uses forward foreign currency contracts to purchase or sell foreign currencies. When the contract is fulfilled or closed, gains or losses are realized. Until then, the gain or loss is included in unrealized appreciation or depreciation. Risks may arise upon entering into forward contracts from the potential inability of counterparties to meet the terms of their forward contracts and from unanticipated movements in the value of foreign currencies relative to the U.S. dollar.
Each Fund may enter into futures contracts involving foreign currency, interest rates, securities and securities indices. A futures contract obligates the seller of the contract to deliver and the purchaser of the contract to take delivery of the type of foreign currency, financial instrument or security called for in the contract at a specified future time for a specified price. Upon entering into such a contract, a Fund is required to deposit and maintain as collateral such initial margin as required by the exchange on which the contract is traded. Pursuant to the contract, a Fund agrees to receive from or pay to the broker an amount equal to the daily fluctuations in the value of the contract. Such receipts or payments are known as variation margin and are recorded as unrealized gains or losses by the Fund. When the contract is closed, the Fund records a realized gain or loss equal to the difference between the value of the contract at the time it was opened and the value at the time it was closed.
E. Distributions to Shareholders. The Funds record distributions to their shareholders on ex-dividend date. Each Fund pays dividends and capital gains, if any, annually (except Global Equity Dividend and
63
NOTES TO FINANCIAL STATEMENTS AS OF OCTOBER 31, 2005 (CONTINUED)
NOTE 2 — SIGNIFICANT ACCOUNTING POLICIES (continued)
Global Real Estate, which pay dividends, if any, quarterly). The Funds may make distributions on a more frequent basis to comply with the distribution requirements of the Internal Revenue Code. The characteristics of income and gains to be distributed are determined in accordance with income tax regulations, which may differ from accounting principles generally accepted in the United States of America for investment companies.
F. Federal Income Taxes. It is the policy of the Funds to comply with subchapter M of the Internal Revenue Code and related excise tax provisions applicable to regulated investment companies and to distribute substantially all of their net investment income and any net realized capital gains to their shareholders. Therefore, no federal income tax provision is required. No capital gain distributions shall be made until any capital loss carryforwards have been fully utilized or expired.
The Funds may utilize equalization accounting for tax purposes, where by a portion of redemption payments are treated as distributions of income or gain.
G. Use of Estimates. Management of the Funds has made certain estimates and assumptions relating to the reporting of assets, liabilities, income, and expenses to prepare these financial statements in conformity with accounting principles generally accepted in the United States of America for investment companies. Actual results could differ from these estimates.
H. Organization Expenses and Offering Costs. Costs incurred with the organization of the Funds were expensed as incurred. Costs incurred with the offering of shares of the Funds are deferred and amortized over a twelve-month period on a straight-line basis.
I. Repurchase Agreements. Each Fund may invest in repurchase agreements only with government securities dealers recognized by the Board of Governors of the Federal Reserve System. Under such agreements, the seller of the security agrees to repurchase it at a mutually agreed upon time and price. The resale price is in excess of the purchase price and reflects an agreed upon interest rate for the period of time the agreement is outstanding. The period of the repurchase agreements is usually short, from overnight to one week, while the underlying securities generally have longer maturities. Each Fund will receive as collateral securities acceptable to it whose market value is equal to at least 100% of the carrying amount of the repurchase agreements, plus accrued interest, being invested by the Fund. The underlying collateral is valued daily on a mark to market basis to assure that the value, including accrued interest is at least equal to the repurchase price. There would be potential loss to the Fund in the event the Fund is delayed or prevented from exercising its right to dispose of the collateral, and it might incur disposition costs in liquidating the collateral.
J. Securities Lending. Each Fund has the option to temporarily loan up to 30% of its total assets to brokers, dealers or other financial institutions in exchange for a negotiated lender’s fee. The borrower is required to fully collateralize the loans with cash or U.S. Government securities. Generally, in the event of counterparty default, the Fund has the right to use collateral to offset losses incurred. There would be potential loss to the Fund in the event the Fund is delayed or prevented from exercising its right to dispose of the collateral. The Fund bears the risk of loss with respect to the investment of collateral. Engaging in securities lending could have a leveraging effect, which may intensify the credit, market and other risks associated with investing in a Fund.
K. Options Contracts. All Funds may purchase put and call options and may write (sell) put options and covered call options. The Funds may engage in option transactions as a hedge against adverse movements in the value of portfolio holdings or to increase market exposure. Option contracts are valued daily and unrealized gains or losses are recorded based upon the last sales price on the principal exchange on which the options are traded. The Funds will realize a gain or loss upon the expiration or closing of the option contract. When an option is exercised, the proceeds on sales of the underlying security for a written call option, the purchase cost of the security for a written put option, or the cost of the security for a purchased put or call option is adjusted by the amount of premium received or paid. Realized and unrealized gains or losses on option contracts are reflected in the accompanying financial statements. The risk in writing a call option is that the Funds give up the opportunity for profit if the market price of the security increases and the option is exercised. The risk in writing a put option is that the Funds may incur a loss if the market price of the security decreases and the option is exercised. The risk in buying an option is that the Funds pay a premium whether or not the option is exercised. Risks may also arise from an illiquid secondary market or from the inability of counterparties to meet the terms of the contract.
64
NOTES TO FINANCIAL STATEMENTS AS OF OCTOBER 31, 2005 (CONTINUED)
NOTE 2 — SIGNIFICANT ACCOUNTING POLICIES (continued)
L. Illiquid and Restricted Securities. Each Fund may not invest more than 15% of its net assets in illiquid securities. Illiquid securities are not readily marketable. Disposing of illiquid investments may involve time-consuming negotiation and legal expenses, and it may be difficult or impossible for the Funds to sell them promptly at an acceptable price. Each Fund may also invest in restricted securities which include those sold under Rule 144A of the Securities Act of 1933 (“1933 Act”) or securities offered pursuant to Section 4(2) of the 1933 Act, and/or are subject to legal or contractual restrictions on resale and may not be publicly sold without registration under the 1933 Act. Certain restricted securities may be considered liquid pursuant to procedures adopted by the Board or may be deemed illiquid because they may not be readily marketable. Illiquid and restricted securities are valued using market quotations when readily available. In the absence of market quotations, the securities are valued based upon their fair value determined under procedures approved by the Board.
M. Delayed Delivery Transaction. The Funds may purchase or sell securities on a when-issued or forward commitment basis. The price of the underlying securities and date when the securities will be delivered and paid for are fixed at the time the transaction is negotiated. The market value of these securities is identified in the Funds’ Portfolio of Investments. Losses may arise due to changes in the market value of the securities or from the inability of counterparties to meet the terms of the contract. In connection with such purchases, the Funds are required to segregate liquid assets sufficient to cover the purchase price.
NOTE 3 — INVESTMENT TRANSACTIONS
For the year ended October 31, 2005, the cost of purchases and proceeds from the sales of securities, excluding short-term securities, were as follows:
| | Purchases | | Sales | |
Global Equity Dividend | | $176,093,946 | | $ 49,073,807 | |
Global Real Estate | | 173,370,841 | | 123,334,533 | |
Global Value Choice | | 138,155,489 | | 167,790,207 | |
Emerging Countries | | 142,492,694 | | 135,260,926 | |
Foreign | | 218,049,170 | | 145,008,809 | |
International | | 133,965,201 | | 128,793,613 | |
International SmallCap | | 413,148,346 | | 475,065,711 | |
International Value | | 825,373,772 | | 1,108,212,398 | |
International Value Choice | | 8,914,946 | | 1,376,646 | |
Precious Metals | | 60,983,436 | | 62,658,284 | |
Russia | | 52,885,398 | | 54,458,313 | |
NOTE 4 — REDEMPTION FEES
A 2% redemption fee is charged on shares of Russia that are redeemed (included in connection with an exchange) within 365 days or less from their date of purchase. The redemption fee is recorded as an addition to paid-in capital. Total redemption fee proceeds for the years ended October 31, 2005 and 2004 were $850,706 and $1,459,066, respectively, and are set forth in the Statements of Changes in Net Assets.
International imposes a 2% redemption fee on Class A shares redeemed (including in connection with an exchange) within 30 days or less from their date of purchase. The redemption fee is recorded as an addition to paid-in capital. Total redemption fee proceeds for the years ended October 31, 2005 and 2004 were $12,635 and $9,571, respectively, and are set forth in the Statements of Changes in Net Assets.
NOTE 5 — INVESTMENT MANAGEMENT AND ADMINISTRATIVE FEES
Each of the Funds has entered into an Investment Management Agreement with ING Investments, LLC (the “Investment Manager”). The Investment Management Agreements compensate the Investment Manager with a fee, computed daily and payable monthly, based on the average daily net assets of each Fund, at the following annual rates:
| | As a percentage of average net assets |
| | |
Global Equity Dividend | | 0.70% |
Global Real Estate | | 1.00% on the first $250 million; 0.90% on the next $250 million; and 0.80% thereafter |
Global Value Choice | | 1.00% on the first $250 million; 0.90% on the next $250 million; 0.80% on the next $500 million; and 0.75% thereafter |
Emerging Countries | | 1.25% |
Foreign | | 1.00% on the first $500 million; and 0.90% thereafter |
International | | 1.00% |
International SmallCap | | 1.00% on first $500 million; 0.90% on next $500 million; and 0.85% thereafter |
International Value | | 1.00% |
International Value Choice | | 1.00% |
Precious Metals | | 1.00% on first $50 million; and 0.75% thereafter |
Russia | | 1.25% |
ING Investment Management Advisors B.V. (“IIMA”), a registered investment adviser, serves as Sub-Adviser to Russia and Global Equity Dividend pursuant to a Sub-Advisory Agreement between the Investment Manager and IIMA.
ING Clarion Real Estate Securities L.P. (“ING Clarion”) a registered investment adviser, serves as a Sub-Adviser to Global Real Estate pursuant to a Sub-Advisory Agreement between the Investment Manager and ING Clarion.
65
NOTES TO FINANCIAL STATEMENTS AS OF OCTOBER 31, 2005 (CONTINUED)
NOTE 5 — INVESTMENT MANAGEMENT AND ADMINISTRATIVE FEES (continued)
NWQ Investment Management Company (“NWQ”), a registered investment adviser, serves as a Sub-Adviser to Global Value Choice and International Value Choice pursuant to a Sub-Advisory Agreement between the Investment Manager and NWQ.
Brandes Investment Partners, L.P. (“Brandes”), a registered investment adviser, serves as a Sub-Adviser to Emerging Countries and International Value pursuant to a Sub-Advisory Agreement between the Investment Manager and Brandes.
Julius Baer Investment Management, LLC (“JBIM”), a registered investment adviser wholly-owned by the Julius Baer Group, serves as Sub-Adviser to Foreign pursuant to a Sub-Advisory Agreement between the Investment Manager and JBIM.
ING Investment Management Co. (“ING IM”), a registered investment adviser serves as Sub-Adviser to International and Precious Metals pursuant to a Sub-Advisory Agreement between the Investment Manager and ING IM.
Acadian Asset Management (“Acadian”), a registered investment adviser, serves as a Sub-Adviser to International SmallCap pursuant to a Sub-Advisory Agreement between the Investment Manager and Acadian.
ING Funds Services, LLC (the “Administrator”), serves as administrator to each Fund. The Funds pay the Administrator a fee calculated at an annual rate of 0.10% of each Fund’s average daily net assets.
International Value Fund also pays the Administrator an annual shareholder account-servicing fee of $5.00 for each account of beneficial owners of shares.
The Investment Manager, ING IM, ING Clarion, IIMA and the Administrator are indirect, wholly-owned subsidiaries of ING Groep N.V. (“ING Groep”). ING Groep is one of the largest financial services organizations in the world, and offers an array of banking, insurance and asset management services to both individual and institutional investors.
NOTE 6 — DISTRIBUTION AND SERVICE FEES
Each share class of the Funds, except Class I, has adopted a Plan pursuant to Rule 12b-1 under the 1940 Act (the “12b-1 Plans”), whereby ING Funds Distributor, LLC (the “Distributor”), an indirect, wholly-owned subsidiary of ING Groep, is reimbursed or compensated (depending on the class of shares) by the Funds for expenses incurred in the distribution of each Funds’ shares (“Distribution Fees”). Pursuant to the 12b-1 Plans, the Distributor is entitled to a payment each month for expenses incurred in the distribution and promotion of each Fund’s shares, including expenses incurred in printing prospectuses and reports used for sales purposes, expenses incurred in preparing and printing sales literature and other such distribution related expenses, including any distribution or shareholder servicing fees (“Service Fees”) paid to securities dealers who have executed a distribution agreement with the Distributor. Under the 12b-1 Plans, each class of shares of the Fund pays the Distributor a Distribution and/or Service Fee based on average daily net assets at the following annual rates:
| | Class A | | Class B | | Class C | | Class M | | Class Q | |
Global Equity Dividend | | 0.25 | % | | 1.00 | % | | 1.00 | % | | N/A | | | N/A | | |
Global Real Estate | | 0.25 | % | | 1.00 | % | | 1.00 | % | | N/A | | | N/A | | |
Global Value Choice | | 0.35 | % | | 1.00 | % | | 1.00 | % | | N/A | | | 0.25 | % | |
Emerging Countries | | 0.35 | %(1) | | 1.00 | % | | 1.00 | % | | 1.00 | %(2) | | 0.25 | % | |
Foreign | | 0.25 | % | | 1.00 | % | | 1.00 | % | | N/A | | | 0.25 | % | |
International | | 0.25 | % | | 1.00 | % | | 1.00 | % | | N/A | | | 0.25 | % | |
International SmallCap | | 0.35 | % | | 1.00 | % | | 1.00 | % | | N/A | | | 0.25 | % | |
International Value | | 0.30 | % | | 1.00 | % | | 1.00 | % | | N/A | | | 0.25 | % | |
International Value Choice | | 0.25 | % | | 1.00 | % | | 1.00 | % | | N/A | | | N/A | | |
Precious Metals | | 0.25 | % | | N/A | | | N/A | | | N/A | | | N/A | | |
Russia | | 0.25 | % | | N/A | | | N/A | | | N/A | | | N/A | | |
(1) ING Funds Distributor, LLC has agreed to waive 0.10% of the Distribution Fee for Class A shares of Emerging Countries for the period from January 1, 2005 through December 31, 2005.
(2) ING Funds Distributor, LLC has agreed to waive 0.25% of the Distribution Fee for Class M shares of Emerging Countries.
Fees paid to the Distributor by class during the year ended October 31, 2005 are shown in the accompanying Statements of Operations.
The Distributor also receives the proceeds of the initial sales charge paid by shareholders upon the purchase of Class A shares, and the contingent deferred sales charge paid by shareholders upon certain redemptions for Class A, Class B, Class C and Class M shares. For the year ended October 31, 2005, the Distributor retained the following amounts in sales charges for the Funds:
| | Class A | | Class B | | Class C | | Class M | |
Initial Sales Charges | | | | | | | | | |
Global Equity Dividend | | $ | 115,391 | | N/A | | N/A | | N/A | |
Global Real Estate | | 76,837 | | N/A | | N/A | | N/A | |
Global Value Choice | | 6,567 | | N/A | | N/A | | N/A | |
Emerging Countries | | 30,457 | | N/A | | N/A | | $ | 146 | |
Foreign | | 76,564 | | N/A | | N/A | | N/A | |
International | | 11,394 | | N/A | | N/A | | N/A | |
International SmallCap | | $ | 20,479 | | N/A | | N/A | | N/A | |
International Value | | 2,469 | | N/A | | N/A | | N/A | |
International Value Choice | | 7,489 | | N/A | | N/A | | N/A | |
Precious Metals | | 13,434 | | N/A | | N/A | | N/A | |
Russia | | 248,873 | | N/A | | N/A | | N/A | |
| | | | | | | | | |
Contingent Deferred Sales Charges | | | | | | | | | |
Global Equity Dividend | | 66 | | $ | 33,192 | | $ | 1,342 | | N/A | |
Global Real Estate | | 29 | | 32,065 | | 5,284 | | N/A | |
Global Value Choice | | 365 | | 89,918 | | 415 | | N/A | |
Emerging Countries | | 18,250 | | 29,798 | | 16 | | N/A | |
Foreign | | 21 | | 56,426 | | 2,704 | | N/A | |
International | | 49 | | 40,192 | | 1,316 | | N/A | |
International SmallCap | | 78,165 | | 153,738 | | 2,317 | | N/A | |
International Value | | 7,534 | | 593,800 | | 7,385 | | N/A | |
International Value Choice | | — | | 1,380 | | — | | N/A | |
Precious Metals | | 60 | | — | | — | | N/A | |
Russia | | 10 | | — | | — | | N/A | |
| | | | | | | | | | | | | |
66
NOTES TO FINANCIAL STATEMENTS AS OF OCTOBER 31, 2005 (CONTINUED)
NOTE 7 — OTHER TRANSACTIONS WITH AFFILIATES AND RELATED PARTIES
At October 31, 2005, the Funds had the following amounts recorded in payable to affiliates on the accompanying Statements of Assets and Liabilities (See Notes 5 and 6):
| | Accrued
Investment
Management
Fees | | Accrued
Administrative
Fees | | Accrued
Shareholder
Services and
Distribution
Fees | | Recoupment | | Total | |
Global Equity Dividend | | $ | 88,441 | | $ | 12,634 | | $ | 80,107 | | $ | 31,040 | | $ | 212,222 | |
Global Real Estate | | 149,876 | | 14,987 | | 62,214 | | — | | 227,077 | |
Global Value Choice | | 86,204 | | 8,620 | | 60,210 | | 6,093 | | 161,127 | |
Emerging Countries | | 140,723 | | 11,258 | | 57,150 | | (7,425 | ) | 201,706 | |
Foreign Fund | | 196,652 | | 19,665 | | 118,439 | | 6,075 | | 340,831 | |
International | | 102,024 | | 10,202 | | 40,692 | | — | | 152,918 | |
International SmallCap | | 290,128 | | 29,012 | | 156,988 | | — | | 476,128 | |
International Value | | 3,477,242 | | 347,720 | | 1,377,732 | | — | | 5,202,694 | |
International Value Choice | | 7,139 | | 714 | | 3,759 | | — | | 11,612 | |
Precious Metals | | 67,124 | | 7,534 | | 18,836 | | — | | 93,494 | |
Russia | | 294,305 | | 23,544 | | 58,861 | | — | | 376,710 | |
| | | | | | | | | | | | | | | | |
ING Funds Distributor, LLC made the following payments in settlement of an administrative proceeding as described in Note 16 and as reflected in the accompanying Statement of Operations for each Fund.
Global Value Choice | | $ 8,840 | |
Emerging Countries | | 266,176 | |
International | | 127,510 | |
International SmallCap | | 914,722 | |
International Value | | 79,655 | |
At October 31, 2005, the following indirect wholly-owned subsidiaries of ING Groep owned shares of the following Funds:
ING Life Insurance and Annuity Company — International Value Choice (11.63%).
ING National Nederlanden Intervest — Global Real Estate (27.97%).
ING National Trust — International (24.94%).
Control is defined by the Investment Company Act of 1940 (“1940 Act”) as the beneficial ownership, either directly or through one or more controlled companies, of more than 25% of the voting securities of a company. Investment activities of these shareholders could have a material impact on the Funds.
The Investment Manager may direct the Fund’s portfolio managers to use their best efforts (subject to obtaining best execution of each transaction) to allocate a Portfolio’s equity security transactions through certain designated broker-dealers. The designated broker-dealer, in turn, will reimburse a portion of the brokerage commissions to pay certain expenses of that Fund. Any amounts credited to a Fund are reflected as a reimbursement of expenses in the Statements of Operations.
Each Fund has adopted a Retirement Policy covering all independent trustees of the Fund who will have served as an independent trustee for at least five years at the time of retirement. Benefits under this plan are based on an annual rate as defined in the plan agreement.
The following is a summary of the transaction during the year ended October 31, 2005 in which the issuer was an affiliate of the ING Family of Funds.
ING Global Real | | Purchases | | Unrealized
gain on
investment | | Value
at | |
Estate Fund | | Shares | | Cost | | securities | | 10/31/2005 | |
ING UK Real Estate Income Trust Ltd. | | 1,475,000 | | $2,611,784 | | $51,557 | | $2,663,341 | |
NOTE 8 — OTHER ACCRUED EXPENSES AND LIABILITIES
At October 31, 2005, the funds had the following payables included in Other Accrued Expenses and Liabilities on the Statement of Assets and Liabilities that exceeded 5% of total liabilities:
| | Custody Fees | |
Russia | | $ | 403,040 | | |
| | | | |
| | Transfer Agent Fees | |
Precious Metals | | $ | 30,617 | | |
International Value | | 1,008,825 | | |
| | | | |
| | Postage Fees | |
Precious Metals | | $ | 17,262 | | |
| | | | |
| | Accrued Offering Fees | |
International Value Choice | | $ | 49,611 | | |
67
NOTES TO FINANCIAL STATEMENTS AS OF OCTOBER 31, 2005 (CONTINUED)
NOTE 9 — EXPENSE LIMITATIONS
The Investment Manager has agreed to limit expenses, excluding interest, taxes, brokerage and extraordinary expenses to the levels listed below:
Maximum Operating Expense Limit (as a percentage of average net assets)
| | Class A | | Class B | | Class C | | Class I | | Class M | | Class Q | |
Global Equity Dividend | | 1.40 | % | | 2.15 | % | | 2.15 | % | | N/A | | | N/A | | | N/A | | |
Global Real Estate | | 1.75 | % | | 2.50 | % | | 2.50 | % | | 1.50 | % | | N/A | | | N/A | | |
Global Value Choice | | 1.85 | % | | 2.50 | % | | 2.50 | % | | N/A | | | N/A | | | 1.75 | % | |
Emerging Countries(1) | | 2.25 | % | | 2.90 | % | | 2.90 | % | | N/A | | | 2.65 | % | | 2.15 | % | |
Foreign(2) | | 1.95 | % | | 2.70 | % | | 2.70 | % | | 1.60 | % | | N/A | | | 1.85 | % | |
International(3) | | 2.75 | % | | 3.50 | % | | 3.50 | % | | 2.50 | % | | N/A | | | 2.75 | % | |
International SmallCap | | 1.95 | % | | 2.60 | % | | 2.60 | % | | N/A | | | N/A | | | 1.85 | % | |
International Value | | N/A | | | N/A | | | N/A | | | N/A | | | N/A | | | N/A | | |
International Value Choice | | 1.70 | % | | 2.45 | % | | 2.45 | % | | 1.45 | % | | N/A | | | N/A | | |
Precious Metals | | 2.75 | % | | N/A | | | N/A | | | N/A | | | N/A | | | N/A | | |
Russia | | 3.35 | % | | N/A | | | N/A | | | N/A | | | N/A | | | N/A | | |
(1) Effective January 1, 2005, pursuant to a side agreement, ING Investments has lowered the expense limits for Emerging Countries through at least December 31, 2005. The expense limits for Emerging Countries are 2.10%, 2.85%, 2.85%, 2.60% and 2.10% for Class A, B, C, M and Q shares, respectively. If, after December 31, 2005, ING Investments elects not to renew the side agreement, the expense limits will revert to the limits listed in the table above. There is no guarantee that this side agreement will continue after that date. The side agreement will only renew if ING Investments elects to renew it. Any fees waived pursuant to the side agreement shall not be eligible for recoupment.
(2) Pursuant to a side agreement dated February 1, 2005, ING Investments has lowered the expense limits for Foreign through at least March 1, 2006. The expense limits for the Foreign are 1.70%, 2.45%, 2.45%, 1.35% and 1.60% for Class A, B, C, I and Q, respectively. If, after March 1, 2006, ING Investments elects not to renew the side agreement, the expense limits will revert to the limits listed in the table above. There is no guarantee that this side agreement will continue after that date. The side agreement will only renew if ING Investments, LLC elects to renew it.
(3) Pursuant to a side agreement dated February 1, 2005, ING Investments has lowered the expense limits for International through at least March 1, 2006. The expense limits for the International are 1.95%, 2.70%, 2.70%, 1.60% and 1.85% for Class A, B, C, I and Q, respectively. If, after March 1, 2006, ING Investments elects not to renew the side agreement, the expense limits will revert to the limits listed in the table above. There is no guarantee that this side agreement will continue after that date. The side agreement will only renew if ING Investments, LLC elects to renew it.
The Investment Manager may at a later date recoup from a fund management fees waived and other expenses assumed by the Investment Manager during the previous 36 months, but only if, after such recoupment, a fund’s expense ratio does not exceed the percentage described above. Waived and reimbursed fees net of any recoupment by the Investment Manager of such waived and reimbursed fees are reflected on the accompanying Statements of Operations for each fund. Amounts payable by the Investment Manager are reflected on the accompanying Statements of Assets and Liabilities for each fund.
As of October 31, 2005, the amounts of waived or reimbursed fees that are subject to possible recoupment by the Investment Manager, and the related expiration dates are as follows:
| | October 31, | | | |
| | 2006 | | 2007 | | 2008 | | Total | |
| | | | | | | | | |
Global Equity Dividend | | $ | — | | $ | 116,578 | | $ | — | | $ | 116,678 | |
Global Value Choice | | 122,064 | | — | | 62,559 | | 184,623 | |
Foreign | | 36,612 | | 193,424 | | 8,141 | | 238,177 | |
International Value Choice | | — | | — | | 74,545 | | 74,545 | |
| | | | | | | | | | | | | |
The Expense Limitation Agreements are contractual and shall renew automatically for one-year terms unless ING Investments provides written notice of the termination of the Expense Limitation Agreement within 90 days of the end of the then current term.
NOTE 10 — LINE OF CREDIT
All of the Funds included in this report, in addition to certain other funds managed by the Investment Manager, have entered into an unsecured committed revolving line of credit agreement (the “Credit Agreement”) with The Bank of New York for an aggregate amount of $125,000,000. The proceeds may be used only to: (1) temporarily finance the purchase and sale of securities; (2) finance the redemption of shares of an investor in the Funds; and (3) enable the Funds to meet other emergency expenses as defined in the Credit Agreement. The Funds to which the line of credit is available pay a commitment fee equal to 0.09% per annum on the daily unused portion of the committed line amount payable quarterly in arrears. The following Funds utilized the line of credit during the year ended October 31, 2005:
| | Days
Utilized | | Approximate
Average Daily
Balance | | Approximate
Weighted
Average
Interest Rate | |
Global Equity Dividend | | 6 | | $ 435,000 | | 3.03 | % | |
Global Value Choice | | 1 | | 610,000 | | 2.74 | % | |
Emerging Countries | | 42 | | 1,188,690 | | 2.65 | % | |
International | | 3 | | 1,453,333 | | 3.91 | % | |
International SmallCap | | 26 | | 3,137,692 | | 3.46 | % | |
International Value | | 2 | | 1,945,000 | | 3.98 | % | |
Precious Metals | | 3 | | 960,000 | | 3.76 | % | |
68
NOTES TO FINANCIAL STATEMENTS AS OF OCTOBER 31, 2005 (CONTINUED)
NOTE 11 — CAPITAL SHARES
Transactions in capital shares and dollars were as follows:
| | Class A Shares | | Class B Shares | | Class C Shares | |
| | Year
Ended
October 31,
2005 | | Year
Ended
October 31,
2004 | | Year
Ended
October 31,
2005 | | Year
Ended
October 31,
2004 | | Year
Ended
October 31,
2005 | | Year
Ended
October 31,
2004 | |
Global Equity Dividend (Number of Shares) | | | | | | | | | | | | | |
Shares sold | | 6,261,568 | | 535,158 | | 2,059,087 | | 295,767 | | 3,638,370 | | 313,849 | |
Dividends reinvested | | 73,143 | | 2,687 | | 25,087 | | 1,132 | | 34,087 | | 1,645 | |
Shares redeemed | | (1,646,562 | ) | (33,794 | ) | (142,758 | ) | (31,091 | ) | (208,449 | ) | (21,744 | ) |
Net increase in shares outstanding | | 4,688,149 | | 504,051 | | 1,941,416 | | 265,808 | | 3,464,008 | | 293,750 | |
| | | | | | | | | | | | | |
Global Equity Dividend ($) | | | | | | | | | | | | | |
Shares sold | | $ | 81,890,229 | | $ | 6,282,638 | | $ | 26,849,839 | | $ | 3,410,427 | | $ | 47,352,114 | | $ | 3,640,937 | |
Dividends reinvested | | 950,413 | | 30,212 | | 325,721 | | 12,760 | | 440,961 | | 18,647 | |
Shares redeemed | | (21,584,892 | ) | (384,401 | ) | (1,878,685 | ) | (360,624 | ) | (2,750,750 | ) | (248,995 | ) |
Net increase | | $ | 61,255,750 | | $ | 5,928,449 | | $ | 25,296,875 | | $ | 3,062,563 | | $ | 45,042,325 | | $ | 3,410,589 | |
| | Class A Shares | | Class B Shares | | Class C Shares | |
| | Year
Ended
October 31,
2005 | | Year
Ended
October 31,
2004 | | Year
Ended
October 31,
2005 | | Year
Ended
October 31,
2004 | | Year
Ended
October 31,
2005 | | Year
Ended
October 31,
2004 | |
Global Real Estate (Number of Shares) | | | | | | | | | | | | | |
Shares sold | | 3,934,092 | | 3,404,489 | | 555,131 | | 270,873 | | 1,428,969 | | 455,181 | |
Dividends reinvested | | 464,771 | | 264,415 | | 31,215 | | 12,799 | | 41,618 | | 15,520 | |
Shares redeemed | | (2,535,905 | ) | (643,917 | ) | (113,195 | ) | (65,421 | ) | (232,975 | ) | (62,590 | ) |
Net increase in shares outstanding | | 1,862,958 | | 3,024,987 | | 473,151 | | 218,251 | | 1,237,612 | | 408,111 | |
| | | | | | | | | | | | | |
Global Real Estate ($) | | | | | | | | | | | | | |
Shares sold | | $ | 64,903,422 | | $ | 47,609,673 | | $ | 7,963,178 | | $ | 3,405,207 | | $ | 21,436,748 | | $ | 5,977,782 | |
Dividends reinvested | | 7,259,137 | | 3,502,989 | | 429,581 | | 151,651 | | 597,354 | | 190,839 | |
Shares redeemed | | (40,814,853 | ) | (8,952,960 | ) | (1,640,044 | ) | (814,481 | ) | (3,564,647 | ) | (817,661 | ) |
Net increase | | $ | 31,347,706 | | $ | 42,159,702 | | $ | 6,752,715 | | $ | 2,742,377 | | $ | 18,469,455 | | $ | 5,350,960 | |
| | Class I Shares | | | | | | | | | |
| | Year
Ended
October 31,
2005 | | Year
Ended
October 31,
2004 | | | | | | | | | |
Global Real Estate (Number of Shares) | | | | | | | | | | | | | |
Shares sold | | 98,101 | | — | | | | | | | | | |
Net increase in shares outstanding | | 98,101 | | — | | | | | | | | | |
| | | | | | | | | | | | | |
Global Real Estate ($) | | | | | | | | | | | | | |
Shares sold | | $ | 1,600,930 | | $ | — | | | | | | | | | |
Net increase | | $ | 1,600,930 | | $ | — | | | | | | | | | |
| | Class A Shares | | Class B Shares | | Class C Shares | |
| | Year
Ended
October 31,
2005 | | Year
Ended
October 31,
2004 | | Year
Ended
October 31,
2005 | | Year
Ended
October 31,
2004 | | Year
Ended
October 31,
2005 | | Year
Ended
October 31,
2004 | |
| | | | | | | | | | | | | |
Global Value Choice (Number of Shares) | | | | | | | | | | | | | |
Shares sold | | 516,545 | | 389,201 | | 101,943 | | 73,694 | | 150,930 | | 36,931 | |
Shares redeemed | | (1,098,757 | ) | (1,352,279 | ) | (550,241 | ) | (621,523 | ) | (696,774 | ) | (881,072 | ) |
Net decrease in shares outstanding | | (582,212 | ) | (963,078 | ) | (448,298 | ) | (547,829 | ) | (545,844 | ) | (844,141 | ) |
| | | | | | | | | | | | | |
Global Value Choice ($) | | | | | | | | | | | | | |
Shares sold | | $ | 8,997,761 | | $ | 6,113,303 | | $ | 1,939,488 | | $ | 1,315,415 | | $ | 2,547,625 | | $ | 593,544 | |
Shares redeemed | | (19,124,741 | ) | (21,218,533 | ) | (10,345,519 | ) | (10,710,909 | ) | (11,682,829 | ) | (13,463,169 | ) |
Net decrease | | $ | (10,126,980 | ) | $ | (15,105,230 | ) | $ | (8,406,031 | ) | $ | (9,395,494 | ) | $ | (9,135,204 | ) | $ | (12,869,625 | ) |
69
NOTES TO FINANCIAL STATEMENTS AS OF OCTOBER 31, 2005 (CONTINUED)
NOTE 11 — CAPITAL SHARES (continued)
| | Class Q Shares | | | | | | | | | |
| | Year
Ended
October 31,
2005 | | Year
Ended
October 31,
2004 | | | | | | | | | |
| | | | | | | | | | | | | |
Global Value Choice (Number of Shares) | | | | | | | | | | | | | |
Shares sold | | 78,062 | | 322,006 | | | | | | | | | |
Shares redeemed | | (98,578 | ) | (471,023 | ) | | | | | | | | |
Net decrease in shares outstanding | | (20,516 | ) | (149,017 | ) | | | | | | | | |
| | | | | | | | | | | | | |
Global Value Choice ($) | | | | | | | | | | | | | |
Shares sold | | $ | 1,573,859 | | $ | 5,898,513 | | | | | | | | | |
Shares redeemed | | (1,971,194 | ) | (8,647,666 | ) | | | | | | | | |
Net decrease | | $ | (397,335 | ) | $ | (2,749,153 | ) | | | | | | | | |
| | Class A Shares | | Class B Shares | | Class C Shares | |
| | Year
Ended
October 31,
2005 | | Year
Ended
October 31,
2004 | | Year
Ended
October 31,
2005 | | Year
Ended
October 31,
2004 | | Year
Ended
October 31,
2005 | | Year
Ended
October 31,
2004 | |
| | | | | | | | | | | | | |
Emerging Countries (Number of Shares) | | | | | | | | | | | | | |
Shares sold | | 1,264,116 | | 2,481,332 | | 171,033 | | 170,377 | | 575,933 | | 110,041 | |
Dividends reinvested | | 2,583 | | 17,566 | | — | | — | | — | | — | |
Shares redeemed | | (1,042,704 | ) | (3,183,675 | ) | (285,210 | ) | (471,944 | ) | (154,421 | ) | (194,329 | ) |
Net increase (decrease) in shares outstanding | | 223,995 | | (684,777 | ) | (114,177 | ) | (301,567 | ) | 421,512 | | (84,288 | ) |
| | | | | | | | | | | | | |
Emerging Countries ($) | | | | | | | | | | | | | |
Shares sold | | $ | 28,706,819 | | $ | 44,674,187 | | $ | 3,787,933 | | $ | 3,235,271 | | $ | 12,439,033 | | $ | 2,025,487 | |
Dividends reinvested | | 53,415 | | 299,006 | | — | | — | | — | | — | |
Shares redeemed | | (22,759,798 | ) | (57,391,860 | ) | (6,281,049 | ) | (8,665,978 | ) | (3,238,715 | ) | (3,381,445 | ) |
Net increase (decrease) | | $ | 6,000,436 | | $ | (12,418,667 | ) | $ | (2,493,116 | ) | $ | (5,430,707 | ) | $ | 9,200,318 | | $ | (1,355,958 | ) |
| | Class M Shares | | Class Q Shares | | | | | |
| | Year
Ended
October 31,
2005 | | Year
Ended
October 31,
2004 | | Year
Ended
October 31,
2005 | | Year
Ended
October 31,
2004 | | | | | |
| | | | | | | | | | | | | |
Emerging Countries (Number of Shares) | | | | | | | | | | | | | |
Shares sold | | 3,080 | | 8,597 | | 197,600 | | 725,259 | | | | | |
Dividends reinvested | | — | | 136 | | 579 | | 4,931 | | | | | |
Shares redeemed | | (9,604 | ) | (22,317 | ) | (202,059 | ) | (1,300,028 | ) | | | | |
Net increase (decrease) in shares outstanding | | (6,524 | ) | (13,584 | ) | (3,880 | ) | (569,838 | ) | | | | |
| | | | | | | | | | | | | |
Emerging Countries ($) | | | | | | | | | | | | | |
Shares sold | | $ | 67,841 | | $ | 165,338 | | $ | 4,569,365 | | $ | 13,642,377 | | | | | |
Dividends reinvested | | — | | 2,297 | | 12,349 | | 86,541 | | | | | |
Shares redeemed | | (209,918 | ) | (415,172 | ) | (4,620,780 | ) | (24,434,280 | ) | | | | |
Net increase (decrease) | | $ | (142,077 | ) | $ | (247,537 | ) | $ | (39,066 | ) | $ | (10,705,362 | ) | | | | |
| | Class A Shares | | Class B Shares | | Class C Shares | |
| | Year
Ended
October 31,
2005 | | Year
Ended
October 31,
2004 | | Year
Ended
October 31,
2005 | | Year
Ended
October 31,
2004 | | Year
Ended
October 31,
2005 | | Year
Ended
October 31,
2004 | |
| | | | | | | | | | | | | |
Foreign (Number of Shares) | | | | | | | | | | | | | |
Shares sold | | 5,350,389 | | 5,895,029 | | 864,486 | | 895,922 | | 3,258,501 | | 3,047,613 | |
Dividends reinvested | | — | | 8,613 | | — | | 2,178 | | — | | 6,274 | |
Shares redeemed | | (2,127,775 | ) | (1,416,210 | ) | (205,551 | ) | (101,946 | ) | (598,703 | ) | (190,098 | ) |
Net increase in shares outstanding | | 3,222,614 | | 4,487,432 | | 658,935 | | 796,154 | | 2,659,798 | | 2,863,789 | |
| | | | | | | | | | | | | |
Foreign ($) | | | | | | | | | | | | | |
Shares sold | | $ | 74,069,872 | | $ | 68,898,162 | | $ | 11,879,135 | | $ | 10,448,476 | | $ | 44,999,926 | | $ | 35,702,440 | |
Dividends reinvested | | — | | 93,658 | | — | | 23,547 | | — | | 67,948 | |
Shares redeemed | | (29,478,835 | ) | (16,353,436 | ) | (2,815,133 | ) | (1,180,328 | ) | (8,239,806 | ) | (2,198,012 | ) |
Net increase | | $ | 44,591,037 | | $ | (52,638,384 | ) | $ | 9,064,002 | | $ | 9,291,695 | | $ | 36,760,120 | | $ | 33,572,376 | |
70
NOTES TO FINANCIAL STATEMENTS AS OF OCTOBER 31, 2005 (CONTINUED)
NOTE 11 — CAPITAL SHARES (continued)
| | Class I Shares | | Class Q Shares | | | | | |
| | Year
Ended
October 31,
2005 | | Year
Ended
October 31,
2004 | | Year
Ended
October 31,
2005 | | Year
Ended
October 31,
2004 | | | | | |
| | | | | | | | | | | | | |
Foreign (Number of Shares) | | | | | | | | | | | | | |
Shares sold | | 1,482 | | 187,096 | | 1,009 | | 51,642 | | | | | |
Dividends reinvested | | — | | 387 | | — | | 597 | | | | | |
Shares redeemed | | (135,704 | ) | (1 | ) | (13,187 | ) | (5,471 | ) | | | | |
Net increase (decrease) in shares outstanding | | (134,222 | ) | 187,482 | | (12,178 | ) | 46,768 | | | | | |
| | | | | | | | | | | | | |
Foreign ($) | | | | | | | | | | | | | |
Shares sold | | $ | 20,576 | | $ | 2,149,750 | | $ | 13,738 | | $ | 608,900 | | | | | |
Dividends reinvested | | — | | 4,209 | | — | | 6,472 | | | | | |
Shares redeemed | | (1,983,638 | ) | (12 | ) | (194,215 | ) | (62,750 | ) | | | | |
Net increase (decrease) | | $ | (1,963,062 | ) | $ | 2,153,947 | | $ | (180,477 | ) | $ | 552,622 | | | | | |
| | Class A Shares | | Class B Shares | | Class C Shares | |
| | Year
Ended
October 31,
2005 | | Year
Ended
October 31,
2004 | | Year
Ended
October 31,
2005 | | Year
Ended
October 31,
2004 | | Year
Ended
October 31,
2005 | | Year
Ended
October 31,
2004 | |
| | | | | | | | | | | | | |
International (Number of Shares) | | | | | | | | | | | | | |
Shares sold | | 1,286,982 | | 3,451,836 | | 398,615 | | 505,076 | | 158,046 | | 393,597 | |
Dividends reinvested | | 45,507 | | 4,890 | | 6,257 | | — | | 3,911 | | — | |
Shares redeemed | | (1,528,096 | ) | (3,759,822 | ) | (454,549 | ) | (422,474 | ) | (461,767 | ) | (437,630 | ) |
Net increase (decrease) in shares outstanding | | (195,607 | ) | (303,096 | ) | (49,677 | ) | 82,602 | | (299,810 | ) | (44,033 | ) |
| | | | | | | | | | | | | |
International ($) | | | | | | | | | | | | | |
Shares sold | | $ | 13,471,465 | | $ | 31,757,670 | | $ | 4,018,737 | | $ | 4,510,934 | | $ | 1,592,528 | | $ | 3,490,125 | |
Dividends reinvested | | 464,320 | | 41,300 | | 61,882 | | — | | 38,715 | | — | |
Redemption fee proceeds | | 12,635 | | 9,571 | | — | | — | | — | | — | |
Shares redeemed | | (15,999,726 | ) | (35,163,553 | ) | (4,604,837 | ) | (3,794,744 | ) | (4,666,612 | ) | (3,937,183 | ) |
Net increase (decrease) | | $ | (2,051,306 | ) | $ | (3,355,012 | ) | $ | (524,218 | ) | $ | 716,190 | | $ | (3,035,369 | ) | $ | (447,058 | ) |
| | Class I Shares | | Class Q Shares | | | | | |
| | Year
Ended
October 31,
2005 | | Year
Ended
October 31,
2004 | | Year
Ended
October 31,
2005 | | Year
Ended
October 31,
2004 | | | | | |
| | | | | | | | | | | | | |
International (Number of Shares) | | | | | | | | | | | | | |
Shares sold | | 618,736 | | 1,345,222 | | 832,726 | | 818,308 | | | | | |
Dividends reinvested | | 26,513 | | 5,236 | | 9,243 | | 4,519 | | | | | |
Shares redeemed | | (264,569 | ) | (957,334 | ) | (255,015 | ) | (1,824,099 | ) | | | | |
Net increase (decrease) in shares outstanding | | 380,680 | | 393,124 | | 586,954 | | (1,001,272 | ) | | | | |
| | | | | | | | | | | | | |
International ($) | | | | | | | | | | | | | |
Shares sold | | $ | 6,503,305 | | $ | 12,342,742 | | $ | 8,731,410 | | $ | 7,234,622 | | | | | |
Dividends reinvested | | 268,842 | | 43,979 | | 93,629 | | 37,916 | | | | | |
Shares redeemed | | (2,749,364 | ) | (8,621,051 | ) | (2,652,163 | ) | (15,730,891 | ) | | | | |
Net increase (decrease) | | $ | 4,022,783 | | $ | 3,765,670 | | $ | 6,172,876 | | $ | (8,458,353 | ) | | | | |
71
NOTES TO FINANCIAL STATEMENTS AS OF OCTOBER 31, 2005 (CONTINUED)
NOTE 11 — CAPITAL SHARES (continued)
| | Class A Shares | | Class B Shares | | Class C Shares | |
| | Year
Ended
October 31,
2005 | | Year
Ended
October 31,
2004 | | Year
Ended
October 31,
2005 | | Year
Ended
October 31,
2004 | | Year
Ended
October 31,
2005 | | Year
Ended
October 31,
2004 | |
| | | | | | | | | | | | | |
International SmallCap (Number of Shares) | | | | | | | | | | | | | |
Shares sold | | 2,004,704 | | 2,416,993 | | 224,730 | | 215,764 | | 190,803 | | 139,627 | |
Dividends reinvested | | — | | 864 | | — | | — | | — | | — | |
Shares redeemed | | (2,690,302 | ) | (3,047,832 | ) | (678,220 | ) | (640,673 | ) | (438,858 | ) | (491,748 | ) |
Net decrease in shares outstanding | | (685,598 | ) | (629,975 | ) | (453,490 | ) | (424,909 | ) | (248,055 | ) | (352,121 | ) |
| | | | | | | | | | | | | |
International SmallCap ($) | | | | | | | | | | | | | |
Shares sold | | $ | 69,514,851 | | $ | 67,323,822 | | $ | 7,909,327 | | $ | 6,380,056 | | $ | 6,229,347 | | $ | 3,856,477 | |
Dividends reinvested | | — | | 21,615 | | — | | — | | — | | — | |
Shares redeemed | | (92,289,760 | ) | (84,650,202 | ) | (23,667,520 | ) | (18,689,602 | ) | (14,015,886 | ) | (13,154,747 | ) |
Net decrease | | $ | (22,774,909 | ) | $ | (17,304,765 | ) | $ | (15,758,193 | ) | $ | (12,309,546 | ) | $ | (7,786,539 | ) | $ | (9,298,270 | ) |
| | Class Q Shares | | | | | | | | | |
| | Year
Ended
October 31,
2005 | | Year
Ended
October 31,
2004 | | | | | | | | | |
| | | | | | | | | | | | | |
International SmallCap (Number of Shares) | | | | | | | | | | | | | |
Shares sold | | 268,648 | | 882,652 | | | | | | | | | |
Dividends reinvested | | — | | 1,207 | | | | | | | | | |
Shares redeemed | | (793,003 | ) | (1,851,928 | ) | | | | | | | | |
Net decrease in shares outstanding | | (524,355 | ) | (968,069 | ) | | | | | | | | |
| | | | | | | | | | | | | |
International SmallCap ($) | | | | | | | | | | | | | |
Shares sold | | $ | 9,711,770 | | $ | 25,088,370 | | | | | | | | | |
Dividends reinvested | | — | | 32,268 | | | | | | | | | |
Shares redeemed | | (28,611,080 | ) | (53,724,869 | ) | | | | | | | | |
Net decrease | | $ | (18,899,310 | ) | $ | (28,604,231 | ) | | | | | | | | |
| | Class A Shares | | Class B Shares | | Class C Shares | |
| | Year
Ended
October 31,
2005 | | Year
Ended
October 31,
2004 | | Year
Ended
October 31,
2005 | | Year
Ended
October 31,
2004 | | Year
Ended
October 31,
2005 | | Year
Ended
October 31,
2004 | |
| | | | | | | | | | | | | |
International Value (Number of Shares) | | | | | | | | | | | | | |
Shares sold | | 22,440,717 | | 27,310,058 | | 733,853 | | 679,383 | | 579,699 | | 167,511 | |
Dividends reinvested | | 4,658,879 | | 521,473 | | 1,078,233 | | — | | 1,619,582 | | — | |
Shares redeemed | | (43,203,094 | ) | (37,013,357 | ) | (6,355,256 | ) | (4,509,591 | ) | (5,949,587 | ) | (6,201,914 | ) |
Net decrease in shares outstanding | | (16,103,498 | ) | (9,181,826 | ) | (4,543,170 | ) | (3,830,208 | ) | (3,750,306 | ) | (6,034,403 | ) |
| | | | | | | | | | | | | |
International Value ($) | | | | | | | | | | | | | |
Shares sold | | $ | 389,616,539 | | $ | 426,282,785 | | $ | 12,423,736 | | $ | 10,492,016 | | $ | 9,661,315 | | $ | 2,545,765 | |
Dividends reinvested | | 78,640,245 | | 7,159,457 | | 17,941,796 | | — | | 26,885,154 | | — | |
Shares redeemed | | (748,947,369 | ) | (582,960,037 | ) | (109,082,787 | ) | (69,353,813 | ) | (101,804,139 | ) | (95,278,538 | ) |
Net decrease | | $ | (280,690,585 | ) | $ | (149,517,795 | ) | $ | (78,717,255 | ) | $ | (58,861,797 | ) | $ | (65,257,670 | ) | $ | (92,732,773 | ) |
72
NOTES TO FINANCIAL STATEMENTS AS OF OCTOBER 31, 2005 (CONTINUED)
NOTE 11 — CAPITAL SHARES (continued)
| | Class I Shares | | Class Q Shares | | | | | |
| | Year
Ended
October 31,
2005 | | Year
Ended
October 31,
2004 | | Year
Ended
October 31,
2005 | | Year
Ended
October 31,
2004 | | | | | |
| | | | | | | | | | | | | |
International Value (Number of Shares) | | | | | | | | | | | | | |
Shares sold | | 27,489,973 | | 20,029,766 | | 27,155 | | 44,672 | | | | | |
Dividends reinvested | | 2,611,199 | | 334,126 | | 69,842 | | 6,447 | | | | | |
Shares redeemed | | (12,662,805 | ) | (6,425,560 | ) | (276,510 | ) | (482,259 | ) | | | | |
Net increase (decrease) in shares outstanding | | 17,438,367 | | 13,938,332 | | (179,513 | ) | (431,140 | ) | | | | |
| | | | | | | | | | | | | |
International Value ($) | | | | | | | | | | | | | |
Shares sold | | $ 476,140,222 | | $ 320,534,434 | | $ | 474,053 | | $ | 684,725 | | | | | |
Dividends reinvested | | 44,050,433 | | 4,584,206 | | 1,179,631 | | 88,586 | | | | | |
Shares redeemed | | (220,723,705 | ) | (100,439,982 | ) | (4,799,264 | ) | (7,574,954 | ) | | | | |
Net increase (decrease) | | $ 299,466,950 | | $ 224,678,658 | | $ | (3,145,580 | ) | $ | (6,801,643 | ) | | | | |
| | Class A
Shares | | Class B
Shares | | Class C
Shares | | | | | | | |
| | February 1,
2005(1) to
October 31,
2005 | | February 1,
2005(1) to
October 31,
2005 | | February 4,
2005(1) to
October 31,
2005 | | | | | | | |
| | | | | | | | | | | | | |
International Value Choice (Number of Shares) | | | | | | | | | | | | | |
Shares sold | | 651,176 | | 143,012 | | 175,350 | | | | | | | |
Shares redeemed | | (79,948 | ) | (8,938 | ) | (6,834 | ) | | | | | | |
Net increase in shares outstanding | | 571,228 | | 134,074 | | 168,516 | | | | | | | |
| | | | | | | | | | | | | |
International Value Choice ($) | | | | | | | | | | | | | |
Shares sold | | $ | 6,637,390 | | $ | 1,456,873 | | $ | 1,796,255 | | | | | | | |
Shares redeemed | | (845,622 | ) | (90,130 | ) | (69,825 | ) | | | | | | |
Net increase | | $ | 5,791,768 | | $ | 1,366,743 | | $ | 1,726,430 | | | | | | | |
(1) Commencement of operations
| | Class A Shares | | | | | | | | | |
| | Year
Ended
October 31,
2005 | | Year
Ended
October 31,
2004 | | | | | | | | | |
| | | | | | | | | | | | | |
Precious Metals (Number of Shares) | | | | | | | | | | | | | |
Shares sold | | 1,303,928 | | 2,114,180 | | | | | | | | | |
Dividends reinvested | | 368,023 | | — | | | | | | | | | |
Shares redeemed | | (2,702,207 | ) | (3,820,805 | ) | | | | | | | | |
Net decrease in shares outstanding | | (1,030,256 | ) | (1,706,625 | ) | | | | | | | | |
| | | | | | | | | | | | | |
Precious Metals ($) | | | | | | | | | | | | | |
Shares sold | | $ | 8,755,764 | | $ | 15,000,362 | | | | | | | | | |
Dividends reinvested | | 2,642,230 | | — | | | | | | | | | |
Shares redeemed | | (17,774,785 | ) | (26,611,993 | ) | | | | | | | | |
Net decrease | | $ | (6,376,791 | ) | $ | (11,611,631 | ) | | | | | | | | |
73
NOTES TO FINANCIAL STATEMENTS AS OF OCTOBER 31, 2005 (CONTINUED)
NOTE 11 — CAPITAL SHARES (continued)
| | Class A Shares | | | | | | | | | |
| | Year
Ended
October 31,
2005 | | Year
Ended
October 31,
2004 | | | | | | | | | |
| | | | | | | | | | | | | |
Russia (Number of Shares) | | | | | | | | | | | | | |
Shares sold | | 3,240,434 | | 5,565,130 | | | | | | | | | |
Dividends reinvested | | 3,801 | | 7,087 | | | | | | | | | |
Shares redeemed | | (3,616,898 | ) | (5,538,941 | ) | | | | | | | | |
Net increase (decrease) in shares outstanding | | (372,663 | ) | 33,276 | | | | | | | | | |
| | | | | | | | | | | | | |
Russia ($) | | | | | | | | | | | | | |
Shares sold | | $ | 93,862,631 | | $ | 135,313,377 | | | | | | | | | |
Dividends reinvested | | 96,494 | | 153,665 | | | | | | | | | |
Redemption fee proceeds | | 850,706 | | 1,459,066 | | | | | | | | | |
Shares redeemed | | (96,537,671 | ) | (124,835,873 | ) | | | | | | | | |
Net increase (decrease) | | $ | (1,727,840 | ) | $ | 12,090,235 | | | | | | | | | |
NOTE 12 — ILLIQUID SECURITIES
Pursuant to guidelines adopted by the Fund’s Board, the following securities have been deemed to be illiquid. The Funds currently limit investments in illiquid securities to 15% of the Fund’s net assets, at market value, at time of purchase.
Fund | | Security | | Shares | | Initial
Acquisition
Date | | Cost | | Value | | Percent
of Net
Assets | |
Global Equity Dividend | | Novatek Microelectronics Corp. Ltd. | | 257,000 | | 10/14/05 | | $ | 1,182,818 | | $ | 1,271,419 | | 0.8 | % |
Emerging Countries | | Siam Makro PCL | | 1,506,200 | | 03/29/05 | | $ | 2,231,811 | | $ | 2,030,666 | | 1.5 | % |
Foreign | | Centrenergo ADR | | 1,530 | | 12/17/03 | | $ | 3,623 | | $ | 9,104 | | — | |
Russia | | Konakovskaya Gres | | 2,842,200 | | 10/06/03 | | $ | 1,539,366 | | $ | 2,501,136 | | 0.9 | % |
| | Novy Neft Ltd. | | 142,452 | | 11/14/03 | | 1,964,885 | | 4,497,922 | | 1.7 | % |
| | Novy Neft Ltd. II | | 240,219 | | 02/23/04 | | 2,516,576 | | 5,409,131 | | 2.0 | % |
| | UBS Russia Small Cap Basket | | 390 | | 07/29/05 | | 4,179,000 | | 5,027,685 | | 1.9 | % |
| | | | | | | | $ | 10,199,827 | | $ | 17,435,874 | | 6.5 | % |
74
NOTES TO FINANCIAL STATEMENTS AS OF OCTOBER 31, 2005 (CONTINUED)
NOTE 13 — CONCENTRATION OF RISKS
Foreign Securities (All Funds). Investments in foreign securities may entail risks not present in domestic investments. Since investments of securities are denominated in foreign currencies, changes in the relationship of these foreign currencies to the U.S. dollar can significantly affect the value of the investments and earnings of the Funds. Foreign investments may also subject the Funds to foreign government exchange restrictions, expropriation, taxation or other political, social or economic developments, as well as from movements in currency, security value and interest rate, all of which could affect the market and/or credit risk of the investments.
Emerging Markets Investments (All Funds). Because of less developed markets and economies and, in some countries, less mature governments and governmental institutions, the risks of investing in foreign securities can be intensified in the case of investments in issuers domiciled or doing substantial business in emerging market countries.
Industry Concentration (Global Real Estate and Precious Metals). As a result of the Fund concentrating its assets in securities related to a particular industry, the Fund may be subject to greater market fluctuation than a fund which has securities representing a broader range of investment alternatives.
Region Concentration (Russia). As a result of the Fund concentrating its assets in a single region of the world, the Fund’s performance may be more volatile than that of a fund that invests globally. If securities in the region that the Fund is concentrated fall out of favor, it may cause the Fund to underperform in relation to funds that focus on other types of stocks.
Non-Diversified (Global Real Estate, Precious Metals and Russia). There is additional risk associated with being non-diversified, since the Fund is not limited in the proportion of its assets in a single issuer. The investment of a large percentage of a Fund’s assets in the securities of a small number of issuers may cause that Fund’s share price to fluctuate more than that of a diversified fund.
NOTE 14 — SECURITIES LENDING
Under an agreement with The Bank of New York (“BNY”), the Funds can lend their securities to approved brokers, dealers and other financial institutions. Loans are collateralized by cash and U.S. Government securities. The collateral must be in an amount equal to at least 105% of the market value of non-U.S. securities loaned and 102% of the market value of U.S. securities loaned. The cash collateral received is invested in approved investments as defined in the Securities Lending Agreement with BNY (the “Agreement”). The securities purchased with cash collateral received are reflected in the Portfolio of Investments. Generally, in the event of counterparty default, the Funds have the right to use the collateral to offset losses incurred. The Agreement contains certain guarantees by BNY in the event of counterparty default and/or a borrower’s failure to return a loaned security, however there would be a potential loss to the Funds in the event the Funds are delayed or prevented from exercising their right to dispose of the collateral. The Funds bear the risk of loss with respect to the investment of collateral. Engaging in securities lending could have a leveraging effect, which may intensify the credit, market and other risks associated with investing in a Fund. At October 31, 2005, the following Funds had securities on loan with the following market values:
Fund | | Value of
Securities
Loaned | | Value of
Collateral | |
Global Value Choice | | $ | 6,412,204 | | $ | 6,636,000 | |
Emerging Countries | | 18,758,086 | | 19,481,000 | |
Foreign | | 4,912,810 | | 4,949,000 | |
International | | 4,778,120 | | 4,871,000 | |
International SmallCap | | 54,813,594 | | 57,748,000 | |
International Value | | 98,489,416 | | 104,511,000 | |
Russia | | 29,101,252 | | 29,251,000 | |
| | | | | | | |
NOTE 15 — FEDERAL INCOME TAXES
The amount of distributions from net investment income and net realized capital gains are determined in accordance with federal income tax regulations, which may differ from accounting principles generally accepted in the United States of America for investment companies. These book/tax differences may be either temporary or permanent. Permanent differences are reclassified within the capital accounts based on their federal tax-basis treatment; temporary differences are not reclassified. Key differences include the treatment of short-term capital gains, foreign currency transactions, and wash sale deferrals. Distributions in excess of net investment income and/or net realized capital gains for tax purposes are reported as distributions of paid-in capital.
75
NOTES TO FINANCIAL STATEMENTS AS OF OCTOBER 31, 2005 (CONTINUED)
NOTE 15 — FEDERAL INCOME TAXES (continued)
The following permanent tax differences have been reclassified as of October 31, 2005:
| | Paid-in
Capital | | | Undistributed
Net Investment
Income On
Investments | | Accumulated
Net Realized
Gains/
(Losses) | |
Global Equity Dividend | | | $ | — | | | | $ | (338,341 | ) | | | $ | 338,341 | | |
Global Real Estate(1) | | | — | | | | 90,948 | | | | (90,948 | ) | |
Global Value Choice | | | 82,505 | | | | 271,310 | | | | (353,815 | ) | |
Emerging Countries | | | — | | | | (168,696 | ) | | | 168,696 | | |
Foreign | | | (42,139 | ) | | | 764,999 | | | | (722,860 | ) | |
International | | | — | | | | 812,673 | | | | (812,673 | ) | |
International SmallCap | | | — | | | | (357,736 | ) | | | 357,736 | | |
International Value | | | — | | | | 1,789,790 | | | | (1,789,790 | ) | |
International Value Choice | | | (54,389 | ) | | | 53,275 | | | | 1,114 | | |
Precious Metals | | | — | | | | 783,519 | | | | (783,519 | ) | |
Russia | | | (23,034 | ) | | | 12,666 | | | | 10,368 | | |
| | | | | | | | | | | | | | | | |
(1) As of the Fund’s tax year-end of December 31, 2004.
Dividends paid by the Fund from net investment income and distributions of net realized short-term capital gains are, for federal income tax purposes, taxable as ordinary income to shareholders.
The tax composition of dividends and distributions to shareholders was as follows:
| | Year Ended October 31, 2005 | | Year Ended October 31, 2004 | |
| | Ordinary
Income | | Long-Term
Capital Gains | | Ordinary
Income | | Long-Term
Capital Gains | | Return
of Capital | |
Global Equity Dividend | | $ | 3,156,591 | | $ | 8,751 | | $ | 239,752 | | | $ | — | | | | $ | — | | |
Global Real Estate(1) | | 9,149,441 | | 1,825,148 | | 3,775,116 | | | 1,107,647 | | | | — | | |
Emerging Countries | | 72,677 | | — | | 441,079 | | | — | | | | — | | |
Foreign | | — | | — | | 214,879 | | | — | | | | 94,666 | | |
International | | 1,011,092 | | — | | 147,464 | | | — | | | | — | | |
International SmallCap | | — | | — | | 63,563 | | | — | | | | — | | |
International Value | | 47,073,127 | | 184,904,220 | | 15,265,465 | | | — | | | | — | | |
Precious Metals | | 2,990,570 | | — | | — | | | — | | | | — | | |
Russia | | 111,452 | | — | | 207,493 | | | — | | | | — | | |
| | | | | | | | | | | | | | | | | | | | |
(1) Composition of dividends and distributions presented herein differ from final amounts based on the Fund’s tax year-end of December 31, 2004.
The tax-basis components of distributable earnings and the expiration dates of the capital loss carryforwards which may be used to offset future realized capital gains for federal income tax purposes as of October 31, 2005 were:
| | Undistributed
Ordinary
Income | | Undistributed
Long Term
Capital Gains | | Unrealized
Appreciation/
Depreciation | | Post-
October
Currency
Losses
Deferred | | Capital
Loss
Carryforwards | | Expiration
Dates | |
Global Equity Dividend | | $ 1,498,273 | | $ 827,494 | | $ | 668,755 | | $ | — | | $ | — | | — | | |
Global Real Estate(1) | | 4,020,925 | | 1,259,587 | | 21,712,266 | | (105,095 | ) | — | | — | | |
Global Value Choice | | 396,434 | | — | | 3,490,697 | | — | | $ | (102,001,944 | ) | 2009 | | |
| | | | | | | | | | (81,779,077 | ) | 2010 | | |
| | | | | | | | | | (6,183,953 | ) | 2011 | | |
| | | | | | | | | | $ | (189,964,974 | ) | | | |
Emerging Countries | | 670,276 | | — | | 3,670,186 | | — | | $ | (710,694 | ) | 2007 | | |
| | | | | | | | | | (10,231,430 | ) | 2008 | | |
| | | | | | | | | | (31,553,234 | ) | 2009 | | |
| | | | | | | | | | (18,266,429 | ) | 2010 | | |
| | | | | | | | | | $ | (60,761,787 | )* | | | |
Foreign | | — | | 6,094,388 | | 29,965,937 | | — | | — | | — | | |
International | | 1,737,951 | | — | | 8,440,406 | | — | | $ | (2,735,596 | ) | 2007 | | |
| | | | | | | | | | (3,061,891 | ) | 2008 | | |
| | | | | | | | | | (2,802,182 | ) | 2010 | | |
| | | | | | | | | | (2,172,053 | ) | 2011 | | |
| | | | | | | | | | $ | (10,771,722 | ) | | | |
International SmallCap | | 2,368,870 | | — | | 40,093,875 | | — | | $ | (6,087,776 | ) | 2009 | | |
| | | | | | | | | | (57,646,473 | ) | 2010 | | |
| | | | | | | | | | $ | (63,734,249 | ) | | | |
International Value | | 49,269,447 | | 295,069,722 | | 545,240,077 | | — | | — | | — | | |
International Value Choice | | 262,270 | | — | | 245,759 | | — | | — | | — | | |
Precious Metals | | 136,502 | | — | | 14,921,684 | | — | | $ | (10,079,564 | ) | 2007 | | |
| | | | | | | | | | (14,912,400 | ) | 2008 | | |
| | | | | | | | | | (10,385,023 | ) | 2009 | | |
| | | | | | | | | | $ | (35,376,987 | ) | | | |
Russia | | — | | — | | 96,587,012 | | — | | $ | (2,987,038 | ) | 2009 | | |
| | | | | | | | | | | | | | | | | |
* Utilization of these capital losses is subject to annual limitations under Section 382 of the Internal Revenue Code.
(1) As of the Fund’s tax year-end of December 31, 2004.
76
NOTES TO FINANCIAL STATEMENTS AS OF OCTOBER 31, 2005 (CONTINUED)
NOTE 16 — INFORMATION REGARDING TRADING OF ING’S U.S. MUTUAL FUNDS
ING Investments has reported to the Boards of Directors/Trustees (the “Boards”) of the ING Funds that, like many U.S. financial services companies, ING Investments and certain of its U.S. affiliates have received informal and formal requests for information since September 2003 from various governmental and self-regulatory agencies in connection with investigations related to mutual funds and variable insurance products. ING Investments has advised the Boards that it and its affiliates have cooperated fully with each request.
In addition to responding to regulatory and governmental requests, ING Investments reported that management of U.S. affiliates of ING Groep N.V., including ING Investments (collectively, “ING”), on their own initiative, have conducted, through independent special counsel and a national accounting firm, an extensive internal review of trading in ING insurance, retirement, and mutual fund products. The goal of this review was to identify any instances of inappropriate trading in those products by third parties or by ING investment professionals and other ING personnel. ING’s internal review related to mutual fund trading is now substantially completed. ING has reported that, of the millions of customer relationships that ING maintains, the internal review identified several isolated arrangements allowing third parties to engage in frequent trading of mutual funds within ING’s variable insurance and mutual fund products, and identified other circumstances where frequent trading occurred, despite measures taken by ING intended to combat market timing. ING further reported that each of these arrangements has been terminated and fully disclosed to regulators. The results of the internal review were also reported to the independent members of the Board.
ING Investments has advised the Board that most of the identified arrangements were initiated prior to ING’s acquisition of the businesses in question in the U.S. ING Investments further reported that the companies in question did not receive special benefits in return for any of these arrangements, which have all been terminated.
Based on the internal review, ING Investments has advised the Board that the identified arrangements do not represent a systemic problem in any of the companies that were involved.
In September 2005, ING Funds Distributor, LLC (“IFD”), the distributor of certain ING Funds, settled an administrative proceeding with the NASD regarding three arrangements, dating from 1995, 1996 and 1998, under which the administrator to the then-Pilgrim Funds, which subsequently became part of the ING Funds, entered into formal and informal arrangements that permitted frequent trading. Under the terms of the Letter of Acceptance, Waiver and Consent (“AWC”) with the NASD, under which IFD neither admitted nor denied the allegations or findings, IFD consented to the following sanctions: (i) a censure; (ii) a fine of $1.5 million; (iii) restitution of approximately $1.44 million to certain ING Funds for losses attributable to excessive trading described in the AWC; and (iv) agreement to make certification to NASD regarding the review and establishment of certain procedures.
In addition to the arrangements discussed above, ING Investments reported to the Board that, at this time, these instances include the following, in addition to the arrangements subject to the AWC discussed above:
• Aeltus Investment Management, Inc. (a predecessor entity to ING Investment Management Co.) has identified two investment professionals who engaged in extensive frequent trading in certain ING Funds. One was subsequently terminated for cause and incurred substantial financial penalties in connection with this conduct and the second has been disciplined.
• ReliaStar Life Insurance Company (“ReliaStar”) entered into agreements seven years ago permitting the owner of policies issued by the insurer to engage in frequent trading and to submit orders until 4pm Central Time. In 2001 ReliaStar also entered into a selling agreement with a broker-dealer that engaged in frequent trading. Employees of ING affiliates were terminated and/or disciplined in connection with these matters.
• In 1998, Golden American Life Insurance Company entered into arrangements permitting a broker-dealer to frequently trade up to certain specific limits in a fund available in an ING variable annuity product. No employee responsible for this arrangement remains at the company.
For additional information regarding these matters, you may consult the Form 8-K and Form 8-K/A for each of four life insurance companies, ING USA Annuity and Life Insurance Company, ING Life Insurance and
77
NOTES TO FINANCIAL STATEMENTS AS OF OCTOBER 31, 2005 (CONTINUED)
NOTE 16 — INFORMATION REGARDING TRADING OF ING’S U.S. MUTUAL FUNDS (continued)
Annuity Company, ING Insurance Company of America, and ReliaStar Life Insurance Company of New York, each filed with the Securities and Exchange Commission (the “SEC”) on October 29, 2004 and September 8, 2004. These Forms 8-K and Forms 8-K/A can be accessed through the SEC’s Web site at http://www.sec.gov. Despite the extensive internal review conducted through independent special counsel and a national accounting firm, there can be no assurance that the instances of inappropriate trading reported to the Board are the only instances of such trading respecting the ING Funds.
ING Investments reported to the Board that ING is committed to conducting its business with the highest standards of ethical conduct with zero tolerance for noncompliance. Accordingly, ING Investments advised the Board that ING management was disappointed that its voluntary internal review identified these situations. Viewed in the context of the breadth and magnitude of its U.S. business as a whole, ING management does not believe that ING’s acquired companies had systemic ethical or compliance issues in these areas. Nonetheless, Investments reported that given ING’s refusal to tolerate any lapses, it has taken the steps noted below, and will continue to seek opportunities to further strengthen the internal controls of its affiliates.
• ING has agreed with the ING Funds to indemnify and hold harmless the ING Funds from all damages resulting from wrongful conduct by ING or its employees or from ING’s internal investigation, any investigations conducted by any governmental or self-regulatory agencies, litigation or other formal proceedings, including any proceedings by the Securities and Exchange Commission. ING Investments reported to the Board that ING management believes that the total amount of any indemnification obligations will not be material to ING or its U.S. business.
• ING updated its Code of Conduct for employees reinforcing its employees’ obligation to conduct personal trading activity consistent with the law, disclosed limits, and other requirements.
• The ING Funds, upon a recommendation from ING, updated their respective Codes of Ethics applicable to investment professionals with ING entities and certain other fund personnel, requiring such personnel to pre-clear any purchases or sales of ING Funds that are not systematic in nature (i.e., dividend reinvestment), and imposing minimum holding periods for shares of ING Funds.
• ING instituted excessive trading policies for all customers in its variable insurance and retirement products and for shareholders of the ING Funds sold to the public through financial intermediaries. ING does not make exceptions to these policies.
• ING reorganized and expanded its U.S. Compliance Department, and created an Enterprise Compliance team to enhance controls and consistency in regulatory compliance.
As has been widely reported in the media, the New York Attorney General’s office (“NYAG”) is conducting broad investigations regarding insurance quoting and brokerage practices. ING U.S. has been subpoenaed in this regard, and is cooperating fully with these NYAG requests for information.
ING U.S. believes that its practices are consistent with our business principles and our commitment to our customers.
At this time, in light of the current regulatory factors, ING U.S. is actively engaged in reviewing whether any modifications in our practices are appropriate for the future.
There can be no assurance that these matters, or the adverse publicity associated with them, will not result in increased fund redemptions, reduced sale of fund shares, or other adverse consequences to ING Funds.
78
| PORTFOLIO OF INVESTMENTS |
ING GLOBAL EQUITY DIVIDEND FUND | AS OF OCTOBER 31, 2005 |
Shares | | | | Value | |
COMMON STOCK: 93.4% | | | |
| | Australia: 6.1% | | | |
79,354 | | Australia & New Zealand
Banking Group Ltd. | | $ | 1,399,848 | |
125,091 | | Coca-Cola Amatil Ltd. | | 713,767 | |
54,913 | | Publishing & Broadcasting Ltd. | | 664,031 | |
94,449 | | Santos Ltd. | | 774,291 | |
52,294 | | St. George Bank Ltd. | | 1,065,949 | |
147,659 | | Stockland | | 675,646 | |
49,897 | | SunCorp.-Metway Ltd. | | 719,902 | |
63,329 | | TABCorp. Holdings Ltd. | | 759,335 | |
29,953 | | Wesfarmers Ltd. | | 801,046 | |
131,590 | | Westfield Group | | 1,636,331 | |
| | | | 9,210,146 | |
| | Belgium: 1.0% | | | |
51,806 | | Fortis | | 1,473,774 | |
| | | | 1,473,774 | |
| | Brazil: 1.9% | | | |
33,165 | | Cia Siderurgica Nacional SA ADR | | 636,768 | |
25,600 | | Petroleo Brasileiro SA ADR | | 1,468,672 | |
45,000 | | Tele Norte Leste
Participacoes SA ADR | | 796,500 | |
| | | | 2,901,940 | |
| | Canada: 4.6% | | | |
59,000 | | BCE Inc. | | 1,458,556 | |
23,900 | | Canadian Imperial Bank of
Commerce | | 1,462,914 | |
16,462 | | Enerplus Resources Fund | | 691,404 | |
24,000 | | Fording Canadian Coal Trust | | 812,640 | |
30,300 | @ | Precision Drilling Corp. | | 1,394,845 | |
39,264 | | TransCanada Corp. | | 1,167,385 | |
| | | | 6,987,744 | |
| | China: 0.9% | | | |
1,848,000 | | PetroChina Co., Ltd. | | 1,417,159 | |
| | | | 1,417,159 | |
| | Denmark: 2.1% | | | |
48,300 | | Danske Bank A/S | | 1,514,053 | |
29,100 | | TDC A/S | | 1,629,842 | |
| | | | 3,143,895 | |
| | Finland: 1.1% | | | |
83,000 | | UPM-Kymmene Oyj | | 1,603,503 | |
| | | | 1,603,503 | |
| | France: 1.4% | | | |
25,551 | | PagesJaunes SA | | 658,120 | |
13,303 | | Societe Generale | | 1,518,578 | |
| | | | 2,176,698 | |
| | Germany: 1.0% | | | |
82,835 | | Deutsche Telekom AG | | 1,464,101 | |
| | | | 1,464,101 | |
| | Greece: 0.9% | | | |
24,150 | | OPAP SA | | 698,661 | |
32,100 | | Public Power Corp. | | 679,205 | |
| | | | 1,377,866 | |
| | Hong Kong: 1.3% | | | |
215,000 | | Citic Pacific Ltd. | | $ | 557,783 | |
112,000 | | CLP Holdings Ltd. | | 642,996 | |
218,000 | | Hong Kong Exchanges and Clearing Ltd. | | 730,969 | |
| | | | 1,931,748 | |
| | Indonesia: 0.4% | | | |
4,600,500 | | Bank Mandiri Persero TBK PT | | 601,281 | |
| | | | 601,281 | |
| | Ireland: 0.9% | | | |
69,101 | | Allied Irish Banks PLC | | 1,449,334 | |
| | | | 1,449,334 | |
| | Israel: 0.5% | | | |
184,126 | | Bank Hapoalim Ltd. | | 704,747 | |
| | | | 704,747 | |
| | Italy: 5.1% | | | |
228,226 | | Enel S.p.A. | | 1,837,191 | |
66,458 | | ENI-Ente Nazionale
Idrocarburi S.p.A. | | 1,777,926 | |
243,715 | | Snam Rete Gas S.p.A. | | 1,337,424 | |
551,371 | | Telecom Italia S.p.A. | | 1,332,639 | |
263,381 | | UniCredito Italiano S.p.A. | | 1,469,956 | |
| | | | 7,755,136 | |
| | Mexico: 0.8% | | | |
15,800 | | Grupo Televisa SA ADR | | 1,154,980 | |
| | | | 1,154,980 | |
| | Netherlands: 3.4% | | | |
62,429 | | ABN Amro Holding NV | | 1,475,826 | |
34,819 | | Akzo Nobel NV | | 1,504,219 | |
7,778 | | Rodamco Europe NV | | 618,956 | |
51,478 | | Royal Dutch Petroleum Co. | | 1,586,454 | |
| | | | 5,185,455 | |
| | New Zealand: 1.0% | | | |
360,364 | | Telecom Corp. of New Zealand Ltd. | | 1,472,971 | |
| | | | 1,472,971 | |
| | Norway: 1.0% | | | |
144,200 | | DNB Holding ASA | | 1,474,676 | |
| | | | 1,474,676 | |
| | Panama: 0.6% | | | |
50,200 | | Banco Latino Americano | | 853,902 | |
| | | | 853,902 | |
| | Portugal: 1.0% | | | |
172,259 | | Portugal Telecom SGPS SA | | 1,556,677 | |
| | | | 1,556,677 | |
| | Singapore: 1.1% | | | |
197,000 | | United Overseas Bank Ltd. | | 1,606,608 | |
| | | | 1,606,608 | |
| | South Africa: 0.9% | | | |
288,883 | | FirstRand Ltd. | | 680,871 | |
38,325 | | Telkom SA Ltd. | | 723,902 | |
| | | | 1,404,773 | |
See Accompanying Notes to Financial Statements
79
| PORTFOLIO OF INVESTMENTS |
ING GLOBAL EQUITY DIVIDEND FUND | AS OF OCTOBER 31, 2005 (CONTINUED) |
Shares | | | | Value | |
| | South Korea: 1.3% | | | |
110 | | KT Corp. | | $ | 4,456 | |
25,500 | | KT Corp. ADR | | 549,525 | |
17,400 | | KT&G Corp. | | 715,145 | |
8,540 | | S-Oil Corp. | | 641,758 | |
| | | | 1,910,884 | |
| | Spain: 1.0% | | | |
58,602 | | Endesa SA | | 1,454,232 | |
| | | | 1,454,232 | |
| | Sweden: 3.7% | | | |
62,700 | | ForeningsSparbanken AB | | 1,547,140 | |
29,252 | | Sandvik AB | | 1,407,483 | |
63,200 | | Skanska AB | | 885,027 | |
41,700 | | Volvo AB | | 1,714,863 | |
| | | | 5,554,513 | |
| | Taiwan: 1.5% | | | |
275,365 | | Taiwan Semiconductor
Manufacturing Co., Ltd. ADR | | 2,224,949 | |
| | | | 2,224,949 | |
| | Thailand: 0.8% | | | |
253,800 | | Advanced Info Service PLC | | 624,647 | |
112,400 | | Siam Cement PCL | | 635,705 | |
| | | | 1,260,352 | |
| | United Kingdom: 12.8% | | | |
148,388 | | Barclays PLC | | 1,470,763 | |
93,520 | | Barratt Developments PLC | | 1,252,761 | |
73,675 | | BOC Group Plc | | 1,452,676 | |
381,997 | | Centrica Plc | | 1,614,910 | |
102,411 | | Diageo PLC | | 1,512,911 | |
555,418 | | Dixons Group PLC | | 1,416,150 | |
96,823 | | Gallaher Group PLC | | 1,504,709 | |
88,102 | | GlaxoSmithKline PLC | | 2,291,829 | |
97,665 | | GUS PLC | | 1,457,841 | |
101,793 | | Persimmon PLC | | 1,553,864 | |
66,787 | | Provident Financial PLC | | 709,570 | |
52,189 | | Royal Bank of Scotland
Group PLC | | 1,445,425 | |
101,243 | | Severn Trent PLC | | 1,715,513 | |
| | | | 19,398,922 | |
| | United States: 33.3% | | | |
30,586 | | Altria Group, Inc. | | 2,295,479 | |
28,165 | | Ameren Corp. | | 1,481,479 | |
40,700 | | American Capital Strategies Ltd. | | 1,528,692 | |
23,977 | | Arthur J Gallagher & Co. | | 705,403 | |
47,144 | | Bank of America Corp. | | 2,062,079 | |
61,612 | | Bristol-Myers Squibb Co. | | 1,304,326 | |
39,650 | | Citigroup, Inc. | | 1,815,177 | |
89,874 | | Citizens Communications Co. | | 1,100,058 | |
64,161 | | ConAgra Foods, Inc. | | 1,493,026 | |
13,211 | | Deluxe Corp. | | 440,323 | |
16,600 | | Developers Diversified
Realty Corp. | | 725,088 | |
58,914 | | Duke Energy Corp. | | 1,560,043 | |
20,800 | | Duke Realty Corp. | | 709,280 | |
38,384 | | EI Du Pont de Nemours & Co. | | 1,600,229 | |
41,109 | | First Horizon National Corp. | | 1,590,096 | |
25,700 | | Health Care Property
Investors, Inc. | | 654,065 | |
17,700 | | Hospitality Properties Trust | | $ | 702,690 | |
18,418 | | iStar Financial, Inc. | | 679,072 | |
52,830 | | Keycorp | | 1,703,239 | |
12,900 | | Kinder Morgan Energy
Partners LP | | 672,090 | |
17,790 | | Kinder Morgan, Inc. | | 1,617,111 | |
17,800 | | Liberty Property Trust | | 742,082 | |
80,782 | | Merck & Co., Inc. | | 2,279,668 | |
45,025 | | New York Community
Bancorp, Inc. | | 728,054 | |
22,851 | | Oneok, Inc. | | 656,738 | |
38,563 | | Packaging Corp. of America | | 782,443 | |
34,590 | | Public Service Enterprise
Group, Inc. | | 2,175,365 | |
23,355 | | Rayonier, Inc. | | 892,862 | |
51,416 | | Regal Entertainment Group | | 947,597 | |
22,099 | | Reynolds America, Inc. | | 1,878,415 | |
84,356 | | Sara Lee Corp. | | 1,505,755 | |
70,855 | @ | SBC Communications, Inc. | | 1,689,892 | |
20,700 | | Simon Property Group LP | | 1,482,534 | |
39,725 | | Southern Co. | | 1,389,978 | |
29,511 | | Thornburg Mortgage, Inc. | | 748,104 | |
28,800 | | United Dominion Realty
Trust, Inc. | | 637,344 | |
58,264 | | US BanCorp. | | 1,723,449 | |
45,688 | | UST, Inc. | | 1,891,026 | |
41,922 | | Washington Mutual, Inc. | | 1,660,111 | |
| | | | 50,250,462 | |
| | Total Common Stock
(Cost $139,685,819) | | 140,963,428 | |
| | | | | |
EQUITY-LINKED SECURITIES: 3.7% | | | |
| | India: 1.1% | | | |
97,704 | @ | Hindustan Petroleum Corp. | | 643,869 | |
47,395 | @ | Oil & Natural Gas Corp., Ltd. | | 975,863 | |
| | | | 1,619,732 | |
| | Luxembourg: 1.2% | | | |
257,000 | I,@ | Novatek Microelectronics
Corp., Ltd. | | 1,271,419 | |
949,000 | @,# | Mega Financial Holdings Co., Ltd. | | 616,850 | |
| | | | 1,888,269 | |
| | Taiwan: 1.4% | | | |
1,545,730 | @ | China Steel Corp. | | 1,316,046 | |
499,890 | @ | Formosa Chemicals & Fibre Corp. | | 799,824 | |
| | | | 2,115,870 | |
| | Total Equity-Linked Securities
(Cost $6,000,308) | | 5,623,871 | |
| | | | | |
| | Total Investments in Securities
(Cost $145,686,127)* | | 97.1 | % | | $ | 146,587,299 | |
| | Other Assets and Liabilities-Net | | 2.9 | | | 4,375,436 | |
| | Net Assets | | 100.0 | % | | $ | 150,962,735 | |
See Accompanying Notes to Financial Statements
80
| PORTFOLIO OF INVESTMENTS |
ING GLOBAL EQUITY DIVIDEND FUND | AS OF OCTOBER 31, 2005 (CONTINUED) |
| Securities may have been fair valued in accordance with procedures approved by the Board of Directors/Trustees (Note 2A). |
@ | Non-income producing security |
ADR | American Depositary Receipt |
I | Illiquid security |
# | Securities with purchases pursuant to Rule 144A, under the Securities Act of 1933 and may not be resold subject to that rule except to qualified institutional buyers. These securities have been determined to be liquid under the guidelines established by the Funds’ Board of Directors/Trustees. |
* | Cost for federal income tax purposes is $145,917,949. Net unrealized appreciation consists of: |
Gross Unrealized Appreciation | | $ | 6,176,004 | |
Gross Unrealized Depreciation | | (5,506,654 | ) |
Net Unrealized Appreciation | | $ | 669,350 | |
Industry | | Percentage of
Net Assets | |
Advertising | | 0.4 | % | |
Agriculture | | 5.5 | | |
Auto Manufacturers | | 1.1 | | |
Banks | | 20.6 | | |
Beverages | | 1.5 | | |
Building Materials | | 0.4 | | |
Chemicals | | 3.6 | | |
Coal | | 0.5 | | |
Commercial Services | | 0.3 | | |
Diversified Financial Services | | 2.6 | | |
Electric | | 7.4 | | |
Electronics | | 0.8 | | |
Engineering and Construction | | 0.6 | | |
Entertainment | | 1.6 | | |
Food | | 2.0 | | |
Forest Products and Paper | | 1.7 | | |
Gas | | 2.4 | | |
Hand/Machine Tools | | 0.9 | | |
Holding Companies - Diversified | | 0.4 | | |
Home Builders | | 1.9 | | |
Insurance | | 0.5 | | |
Investment Companies | | 1.0 | | |
Iron/Steel | | 1.3 | | |
Media | | 1.2 | | |
Miscellaneous Manufacturing | | 0.5 | | |
Oil and Gas | | 7.1 | | |
Oil and Gas Services | | 0.4 | | |
Packaging and Containers | | 0.5 | | |
Pharmaceuticals | | 3.9 | | |
Pipelines | | 2.3 | | |
Real Estate | | 1.5 | | |
Real Estate Investment Trusts | | 5.1 | | |
Retail | | 1.9 | | |
Savings and Loans | | 1.6 | | |
Semiconductors | | 1.5 | | |
Telecommunications | | 9.5 | | |
Water | | 1.1 | | |
Other Assets and Liabilities, Net | | | 2.9 | | |
Total Net Assets | | | 100.0 | % | |
See Accompanying Notes to Financial Statements
81
| PORTFOLIO OF INVESTMENTS |
ING GLOBAL REAL ESTATE FUND | AS OF OCTOBER 31, 2005 |
Shares | | | | Value | |
COMMON STOCK: 98.1% | | | |
| | Australia: 8.8% | | | |
1,710,900 | | DB RREEF Trust | | $ | 1,708,033 | |
572,200 | | GPT Group | | 1,644,250 | |
1,114,900 | | Macquarie CountryWide Trust | | 1,603,530 | |
550,100 | | Macquarie Goodman Group | | 1,663,356 | |
557,100 | | Mirvac Group | | 1,591,909 | |
400,300 | | Prime Retail Group | | 1,783,767 | |
476,778 | | Westfield Group | | 5,928,768 | |
| | | | 15,923,613 | |
| | Canada: 1.8% | | | |
192,600 | | RioCan Real Estate Investment | | | |
| | Trust | | 3,298,309 | |
| | | | 3,298,309 | |
| | Finland: 0.8% | | | |
142,700 | | Sponda OYJ | | 1,375,897 | |
| �� | | | 1,375,897 | |
| | France: 3.2% | | | |
9,200 | | Klepierre | | 861,844 | |
19,400 | | Nexity | | 884,200 | |
21,200 | | Societe de la Tour Eiffel | | 2,182,213 | |
13,400 | | Unibail | | 1,768,988 | |
| | | | 5,697,245 | |
| | Germany: 1.9% | | | |
6,000 | | Deutsche Wohnen AG | | 1,354,655 | |
105,400 | | IVG Immobilien AG | | 2,026,197 | |
| | | | 3,380,852 | |
| | Hong Kong: 7.5% | | | |
301,100 | | Cheung Kong Holdings Ltd. | | 3,145,103 | |
601,000 | | Great Eagle Holdg. Co. | | 1,434,642 | |
816,000 | | Hang Lung Properties Ltd. | | 1,507,827 | |
742,000 | | Hysan Development Co., Ltd. | | 1,616,754 | |
631,000 | | New World Development Ltd | | 780,931 | |
361,300 | | Sun Hung Kai Properties Ltd. | | 3,429,001 | |
453,000 | | Wharf Holdings Ltd. | | 1,551,821 | |
| | | | 13,466,079 | |
| | Italy: 0.4% | | | |
753,800 | | Beni Stabili S.p.A. | | 722,387 | |
| | | | 722,387 | |
| | Japan: 9.6% | | | |
111 | | Japan Retail Fund Investment | | | |
| | Corp. | | 803,267 | |
367,100 | | Mitsubishi Estate Co., Ltd. | | 5,426,940 | |
340,300 | | Mitsui Fudosan Co., Ltd. | | 5,570,991 | |
180 | | Nippon Building Fund, Inc. | | 1,430,683 | |
249,800 | | Sumitomo Realty & | | | |
| | Development Co., Ltd. | | 4,041,230 | |
| | | | 17,273,111 | |
| | Netherlands: 1.7% | | | |
45,600 | | AM NV | | 535,327 | |
21,700 | | Eurocommercial Properties NV | | 802,366 | |
22,400 | | Rodamco Europe NV | | 1,782,542 | |
| | | | 3,120,235 | |
| | Singapore: 2.4% | | | |
592,200 | | Ascendas Real Estate | | | |
| | Investment Trust | | $ | 702,071 | |
1,065,000 | | CapitaLand Ltd. | | 2,002,288 | |
546,300 | | CapitaMall Trust | | 745,795 | |
173,000 | | City Developments Ltd. | | 900,990 | |
| | | | 4,351,144 | |
| | Spain: 0.9% | | | |
28,900 | | Inmobiliaria Colonial | | 1,678,381 | |
| | | | 1,678,381 | |
| | Sweden: 0.8% | | | |
43,000 | | Castellum AB | | 1,490,599 | |
| | | | 1,490,599 | |
| | United Kingdom: 11.8% | | | |
161,500 | | British Land Co. PLC | | 2,545,273 | |
185,815 | | Capital & Regional PLC | | 2,458,588 | |
77,400 | | Derwent Valley Holdings PLC | | 1,794,177 | |
54,300 | | Hammerson PLC | | 857,860 | |
1,475,000 | **,@ | ING UK Real Estate Income | | | |
| | Trust Ltd. | | 2,663,341 | |
243,150 | | Land Securities Group PLC | | 5,981,434 | |
48,000 | | Liberty Intl. PLC | | 790,882 | |
34,300 | | Mapeley Ltd. | | 1,587,817 | |
187,700 | | Slough Estates PLC | | 1,685,312 | |
145,600 | | Unite Group PLC | | 834,935 | |
| | | | 21,199,619 | |
| | United States: 46.5% | | | |
77,200 | | AMB Property Corp. | | 3,410,696 | |
40,400 | | Archstone-Smith Trust | | 1,639,028 | |
84,600 | | Arden Realty, Inc. | | 3,818,844 | |
35,100 | | AvalonBay Communities, Inc. | | 3,027,375 | |
32,800 | | BioMed Realty Trust, Inc. | | 820,328 | |
52,900 | | Boston Properties, Inc. | | 3,661,738 | |
20,600 | | BRE Properties | | 908,666 | |
38,000 | | Camden Property Trust | | 2,141,300 | |
26,200 | | Corporate Office Properties Trust | | 910,712 | |
56,400 | | Developers Diversified | | | |
| | Realty Corp. | | 2,463,552 | |
77,300 | | Equity Office Properties Trust | | 2,380,840 | |
71,400 | | Equity Residential | | 2,802,450 | |
86,100 | | General Growth Properties, Inc. | | 3,657,528 | |
43,600 | | Highwoods Properties, Inc. | | 1,229,956 | |
110,800 | | Host Marriott Corp. | | 1,860,332 | |
52,800 | | Liberty Property Trust | | 2,201,232 | |
38,300 | | Macerich Co. | | 2,461,541 | |
54,800 | | Maguire Properties, Inc. | | 1,644,000 | |
45,200 | | Mills Corp. | | 2,418,200 | |
41,100 | | New Plan Excel Realty Trust | | 944,889 | |
116,200 | | Omega Healthcare Investors, Inc. | | 1,428,098 | |
39,500 | | Pan Pacific Retail Properties, Inc. | | 2,508,250 | |
57,000 | | Post Properties, Inc. | | 2,325,600 | |
92,900 | | ProLogis | | 3,994,700 | |
46,200 | | Public Storage, Inc. | | 3,058,440 | |
71,500 | | Reckson Associates Realty Corp. | | 2,509,650 | |
38,400 | | Regency Centers Corp. | | 2,137,728 | |
9,700 | | Shurgard Storage Centers, Inc. | | 547,371 | |
71,600 | | Simon Property Group, Inc. | | 5,127,992 | |
41,800 | | SL Green Realty Corp. | | 2,843,654 | |
44,600 | | Starwood Hotels & Resorts | | | |
| | Worldwide, Inc. | | 2,605,978 | |
See Accompanying Notes to Financial Statements
82
| PORTFOLIO OF INVESTMENTS |
ING GLOBAL REAL ESTATE FUND | AS OF OCTOBER 31, 2005 (CONTINUED) |
Shares | | | | Value | |
| | United States (continued) | | | |
39,200 | | Sunstone Hotel Investors, Inc. | | $ | 878,080 | |
142,500 | | Trizec Properties, Inc. | | 3,170,625 | |
44,100 | | U-Store-It Trust | | 919,926 | |
60,300 | | United Dominion Realty | | | |
| | Trust, Inc. | | 1,334,437 | |
22,800 | | Ventas, Inc. | | 698,364 | |
41,900 | | Vornado Realty Trust | | 3,393,900 | |
| | | | 83,886,000 | |
| | Total Common Stock | | | |
| | (Cost $150,530,597) | | 176,863,471 | |
| | Total Investments In | | | |
| | Securities (Cost | | | |
| | $150,530,597)* | 98.1 | % | | $ | 176,863,471 | |
| | Other Assets and | | | | | |
| | Liabilities-Net | 1.9 | | | 3,423,166 | |
| | Net Assets | 100.0 | % | | $ | 180,286,637 | |
Securities may have been fair valued in accordance with procedures approved by the Board of Directors/Trustees (Note 2A).
@ Non-income producing security
** Investment in affiliate
* Cost for federal income tax purposes is $154,834,318. Net unrealized appreciation consists of:
| Gross Unrealized Appreciation | | | | $ | 23,121,875 | |
| Gross Unrealized Depreciation | | | | | (1,092,722 | ) |
| Net Unrealized Appreciation | | | | $ | 22,029,153 | |
Industry | | Percentage of
Net Assets | |
Closed End Investment Companies | | 1.5 | % | |
Diversified Property Holdings | | 15.5 | % | |
Healthcare | | 1.2 | % | |
Industrial Properties | | 6.3 | % | |
Industrial/Office Mix | | 1.2 | % | |
Mixed Use Properties | | 1.3 | % | |
Office Buildings | | 29.1 | % | |
Real Estate Services | | 2.7 | % | |
Residential Apartments | | 8.9 | % | |
Residential: Manufactured Home Comm. | | 0.8 | % | |
Residential: Hotels | | 3.0 | % | |
Retail: Enclosed Malls | | 13.7 | % | |
Retail: Shopping Center | | 10.4 | % | |
Self Storage Property | | 2.5 | % | |
Other Assets & Liabilities - Net | | | 1.9 | % | |
Net Assets | | | 100.0 | % | |
See Accompanying Notes to Financial Statements
83
| PORTFOLIO OF INVESTMENTS |
ING GLOBAL VALUE CHOICE FUND | AS OF OCTOBER 31, 2005 |
Shares | | | | Value | |
COMMON STOCK: 96.8% | | | |
| | Australia: 1.2% | | | |
270,560 | | Alumina Ltd. | | $ | 1,170,230 | |
| | | | 1,170,230 | |
| | Belgium: 0.9% | | | |
27,442 | | Belgacom SA | | 919,217 | |
| | | | 919,217 | |
| | Bermuda: 0.9% | | | |
36,150 | L | Tyco Intl. Ltd. | | 953,999 | |
| | | | 953,999 | |
| | Canada: 4.3% | | | |
72,400 | L | Barrick Gold Corp. | | 1,828,100 | |
55,000 | L | Placer Dome, Inc. | | 1,097,250 | |
25,850 | | Suncor Energy, Inc. | | 1,386,336 | |
| | | | 4,311,686 | |
| | Finland: 1.0% | | | |
77,000 | | Stora Enso OYJ | | 984,492 | |
| | | | 984,492 | |
| | France: 2.0% | | | |
4,500 | | Areva | | 2,037,682 | |
| | | | 2,037,682 | |
| | Germany: 0.3% | | | |
8,800 | @ | Premiere AG | | 253,703 | |
| | | | 253,703 | |
| | Italy: 2.1% | | | |
46,144 | | ENI S.p.A. | | 1,234,473 | |
353,926 | | Telecom Italia S.p.A. | | 855,424 | |
| | | | 2,089,897 | |
| | Japan: 16.3% | | | |
106,000 | | Dai Nippon Printing Co., Ltd. | | 1,734,687 | |
74,900 | | Daiichi Sankyo Co., Ltd. | | 1,357,665 | |
45,800 | | Fuji Photo Film Co., Ltd. | | 1,457,376 | |
95,000 | | Kirin Brewery Co., Ltd. | | 1,056,742 | |
26,000 | | Makita Corp. | | 603,563 | |
92,000 | | Matsushita Electric | | | |
| | Industrial Co., Ltd. | | 1,686,014 | |
31,000 | | NEC Electronics Corp. | | 831,749 | |
14,900 | | Nintendo Co., Ltd. | | 1,670,890 | |
160,000 | | Sekisui House Ltd. | | 1,992,614 | |
107,000 | | Shiseido Co., Ltd. | | 1,716,476 | |
14,000 | | Takefuji Corp. | | 979,831 | |
96,000 | L | Wacoal Corp. | | 1,360,635 | |
| | | | 16,448,242 | |
| | Netherlands: 3.3% | | | |
27,583 | | Royal Dutch Shell PLC ADR | | 1,804,204 | |
66,000 | | TPG NV | | 1,555,527 | |
| | | | 3,359,731 | |
| | Papua New Guinea: 1.3% | | | |
1,008,204 | @ | Lihir Gold Ltd. | | 1,303,860 | |
| | | | 1,303,860 | |
| | Portugal: 1.6% | | | |
572,602 | | Electricidade de Portugal SA | | 1,619,285 | |
| | | | 1,619,285 | |
| | South Africa: 1.9% | | | |
34,600 | L | AngloGold Ashanti Ltd. ADR | | $ | 1,352,860 | |
4,800 | | Impala Platinum Holdings Ltd. | | 526,448 | |
| | | | 1,879,308 | |
| | South Korea: 2.7% | | | |
64,550 | | Korea Electric Power Corp. ADR | | 1,054,102 | |
77,700 | | KT Corp. ADR | | 1,674,435 | |
| | | | 2,728,537 | |
| | Switzerland: 2.1% | | | |
4,421 | | Swisscom AG | | 1,452,272 | |
31,080 | | Xstrata PLC | | 712,155 | |
| | | | 2,164,427 | |
| | Taiwan: 2.0% | | | |
116,600 | L | Chunghwa Telecom Co., | | | |
| | Ltd. ADR | | 2,019,512 | |
| | | | 2,019,512 | |
| | United Kingdom: 6.5% | | | |
34,000 | | Anglo American PLC | | 1,006,538 | |
314,891 | | J Sainsbury PLC | | 1,555,786 | |
61,792 | | Lonmin PLC | | 1,429,007 | |
273,977 | | Misys PLC | | 994,953 | |
141,249 | | United Utilities PLC | | 1,559,789 | |
| | | | 6,546,073 | |
| | United States: 46.4% | | | |
20,800 | | Aetna, Inc. | | 1,842,048 | |
48,050 | @ | Agilent Technologies, Inc. | | 1,538,081 | |
20,650 | L | Albertson’s, Inc. | | 518,522 | |
39,700 | L | Altria Group, Inc. | | 2,979,485 | |
46,100 | | Citigroup, Inc. | | 2,110,458 | |
101,000 | L | Computer Associates Intl., Inc. | | 2,824,970 | |
55,500 | | Countrywide Financial Corp. | | 1,763,235 | |
43,500 | | Fannie Mae | | 2,067,120 | |
19,500 | | Hartford Financial Services | | | |
| | Group, Inc. | | 1,555,125 | |
42,400 | | International Paper Co. | | 1,237,232 | |
52,700 | | JPMorgan Chase & Co. | | 1,929,874 | |
32,767 | L | Kerr-McGee Corp. | | 2,786,506 | |
25,700 | | Kimberly-Clark Corp. | | 1,460,788 | |
133,700 | @ | Liberty Media Corp. | | 1,065,589 | |
34,600 | | Lockheed Martin Corp. | | 2,095,376 | |
13,300 | | MGIC Investment Corp. | | 787,892 | |
42,300 | | Microsoft Corp. | | 1,087,110 | |
75,800 | | Motorola, Inc. | | 1,679,728 | |
76,400 | | Noble Energy, Inc. | | 3,059,820 | |
37,500 | | Northrop Grumman Corp. | | 2,011,875 | |
31,700 | | Pitney Bowes, Inc. | | 1,333,936 | |
20,400 | L | Radian Group, Inc. | | 1,062,840 | |
30,100 | | Raytheon Co. | | 1,112,195 | |
72,200 | | Sprint Corp. | | 1,682,982 | |
14,800 | | Union Pacific Corp. | | 1,023,864 | |
69,400 | | Viacom, Inc. | | 2,149,318 | |
32,200 | | Wells Fargo & Co. | | 1,938,437 | |
| | | | 46,704,406 | |
| | Total Common Stock | | | |
| | (Cost $93,910,959) | | 97,494,287 | |
See Accompanying Notes to Financial Statements
84
| PORTFOLIO OF INVESTMENTS |
ING GLOBAL VALUE CHOICE FUND | AS OF OCTOBER 31, 2005 (CONTINUED) |
Principal
Amount | | | | Value | |
SHORT-TERM INVESTMENTS: 6.6% | | | |
| | | Securities Lending CollateralCC: 6.6% | | | |
$ | 6,636,000 | | The Bank of New York Institutional | | | |
| | | Cash Reserves Fund | | $ | 6,636,000 | |
| | | Total Short-Term Investments | | | |
| | | (Cost $6,636,000) | | 6,636,000 | |
| | | Total Investments In | | | |
| | | Securities (Cost | | | |
| | | $100,546,959)* | 103.4 | % | | $ | 104,130,287 | |
| | | Other Assets and | | | | | |
| | | Liabilities-Net | (3.4 | ) | | (3,401,345 | ) |
| | | Net Assets | 100.0 | % | | $ | 100,728,942 | |
Securities may have been fair valued in accordance with procedures approved by the Board of Directors/Trustees (Note 2A).
@ Non-income producing security
ADR American Depositary Receipt
cc Securities purchased with cash collateral for securities loaned
L Loaned security, a portion or all of the security is on loan at October 31, 2005.
* Cost for federal income tax purposes is $100,636,686. Net unrealized appreciation consists of:
| Gross Unrealized Appreciation | | | | $ | 8,794,634 | |
| Gross Unrealized Depreciation | | | | | (5,301,033 | ) |
| Net Unrealized Appreciation | | | | $ | 3,493,601 | |
Industry | | Percentage of
Net Assets | |
Aeorspace/Defense | | 5.2 | % | |
Agriculture | | 3.0 | | |
Apparel | | 1.4 | | |
Banks | | 1.9 | | |
Beverages | | 1.0 | | |
Commercial Services | | 1.7 | | |
Cosmetics/Personal Care | | 1.7 | | |
Diversified Financial Services | | 8.8 | | |
Electric | | 2.7 | | |
Electronics | | 1.5 | | |
Energy - Alternate Sources | | 2.0 | | |
Food | | 2.1 | | |
Forest Products and Paper | | 2.2 | | |
Hand/Machine Tools | | 0.6 | | |
Healthcare - Services | | 1.8 | | |
Home Builders | | 2.0 | | |
Home Furnishings | | 1.7 | | |
Household Products/Wares | | 1.4 | | |
Insurance | | 3.4 | | |
Media | | 3.4 | | |
Mining | | 10.4 | | |
Miscellaneous Manufacturing | | 2.4 | | |
Office/Business Equipment | | 1.3 | | |
Oil and Gas | | 10.2 | | |
Pharmaceuticals | | 1.3 | | |
Semiconductors | | 0.8 | | |
Software | | 4.9 | | |
Telecommunications | | 10.2 | | |
Toys/Games/Hobbies | | 1.7 | | |
Transportation | | 2.6 | | |
Water | | 1.5 | | |
Securities Lending Collateral | | 6.6 | | |
Other Assets and Liabilities, Net | | | (3.4 | ) | |
Net Assets | | | 100.0 | % | |
See Accompanying Notes to Financial Statements
85
| PORTFOLIO OF INVESTMENTS |
ING EMERGING COUNTRIES FUND | AS OF OCTOBER 31, 2005 |
Shares | | | | Value | |
COMMON STOCK: 90.4% | | | |
| | Argentina: 3.4% | | | |
273,000 | @,L | Grupo Financiero | | | |
| | Galicia SA ADR | | $ | 2,107,560 | |
178,070 | | Telecom Argentina SA ADR | | 2,343,401 | |
| | | | 4,450,961 | |
| | Brazil: 18.8% | | | |
105,898,352 | | AES Tiete SA | | 2,068,832 | |
79,700 | | Brasil Telecom Participacoes | | | |
| | SA ADR | | 3,316,317 | |
233,000 | L | Centrais Eletricas Brasileiras | | | |
| | SA ADR | | 2,038,004 | |
40,000 | | Cia de Saneamento Basico do | | | |
| | Estado de Sao Paulo | | 2,555,667 | |
467,910 | | Cia Paranaense de Energia ADR | | 3,453,176 | |
64,500 | | Contax Participacoes SA ADR | | 48,685 | |
123,000 | | Souza Cruz SA | | 1,458,142 | |
166,120 | L | Tele Centro Oeste Celular | | | |
| | Participacoes SA ADR | | 1,503,386 | |
83,290 | L | Tele Norte Leste Participacoes | | | |
| | SA ADR | | 1,474,233 | |
527,060 | @,L | Telesp Celular Participacoes | | | |
| | SA ADR | | 1,923,769 | |
99,900 | | Tim Participacoes SA ADR | | 2,024,973 | |
58,480 | L | Unibanco - Uniao de Bancos | | | |
| | Brasileiros SA GDR | | 3,058,504 | |
| | | | 24,923,688 | |
| | Chile: 1.8% | | | |
82,800 | | AFP Provida SA ADR | | 2,375,532 | |
| | | | 2,375,532 | |
| | China: 2.7% | | | |
1,758,000 | | People’s Food Holdings Ltd. | | 893,214 | |
18,032,000 | | Sinopec Yizheng Chemical | | | |
| | Fibre Co., Ltd. | | 2,721,425 | |
| | | | 3,614,639 | |
| | Croatia: 1.1% | | | |
108,670 | | Pliva DD GDR | | 1,437,704 | |
| | | | 1,437,704 | |
| | Czech Republic: 1.4% | | | |
91,548 | | Cesky Telecom AS | | 1,866,262 | |
| | | | 1,866,262 | |
| | Estonia: 0.7% | | | |
34,821 | | Eesti Telekom GDR | | 927,140 | |
| | | | 927,140 | |
| | Greece: 1.7% | | | |
225,400 | @ | Hellenic Telecommunications | | | |
| | Organization SA ADR | | 2,301,334 | |
| | | | 2,301,334 | |
| | Hong Kong: 5.2% | | | |
12,678,000 | L | Brilliance China Automotive | | | |
| | Holdings Ltd. | | 1,665,623 | |
7,670,000 | | First Pacific Co. | | 2,504,906 | |
3,556,000 | | SCMP Group Ltd. | | 1,322,763 | |
1,395,000 | | SmarTone Telecommunications | | | |
| | Holding Ltd. | | 1,421,569 | |
| | | | 6,914,861 | |
| | Hungary: 2.9% | | | |
803,229 | | Matav Magyar Tavkozlesi Rt | | $ | 3,806,788 | |
| | | | 3,806,788 | |
| | Indonesia: 2.4% | | | |
1,360,500 | | Gudang Garam Tbk PT | | 1,378,093 | |
21,484,500 | | Indofood Sukses Makmur | | | |
| | Tbk PT | | 1,748,172 | |
| | | | 3,126,265 | |
| | Israel: 1.8% | | | |
890,850 | @ | Bezeq Israeli | | | |
| | Telecommunication Corp., Ltd. | | 1,206,574 | |
150,000 | @ | Partner Communications | | 1,232,487 | |
| | | | 2,439,061 | |
| | Luxembourg: 1.9% | | | |
81,400 | | Quilmes Industrial SA ADR | | 2,536,424 | |
| | | | 2,536,424 | |
| | Malaysia: 1.2% | | | |
812,400 | | Proton Holdings Bhd | | 1,657,081 | |
| | | | 1,657,081 | |
| | Mexico: 3.7% | | | |
913,110 | | Controladora Comercial | | | |
| | Mexicana SA de CV | | 1,369,454 | |
510,400 | | Gruma SA de CV | | 1,324,345 | |
109,800 | L | Telefonos de Mexico SA de | | | |
| | CV ADR | | 2,215,764 | |
| | | | 4,909,563 | |
| | Panama: 2.0% | | | |
159,610 | | Banco Latino Americano | | 2,714,966 | |
| | | | 2,714,966 | |
| | Philippines: 2.1% | | | |
1,535,900 | | Bank of the Philippine Islands | | 1,460,567 | |
3,652,100 | @ | Manila Electric Co. | | 1,347,454 | |
| | | | 2,808,021 | |
| | Russia: 2.6% | | | |
62,000 | | Lukoil ADR | | 3,416,760 | |
| | | | 3,416,760 | |
| | Singapore: 4.5% | | | |
294,000 | | DBS Group Holdings Ltd. | | 2,658,755 | |
1,355,000 | | MobileOne Ltd. | | 1,600,434 | |
463,200 | | Oversea-Chinese Banking Corp. | | 1,722,699 | |
| | | | 5,981,888 | |
| | South Africa: 0.9% | | | |
123,290 | | Sappi Ltd. | | 1,196,342 | |
| | | | 1,196,342 | |
| | South Korea: 16.4% | | | |
46,570 | | Kookmin Bank | | 2,659,248 | |
117,860 | | Korea Electric Power Corp. | | 3,855,483 | |
17,200 | | KT Corp. | | 696,691 | |
90,790 | | KT Freetel Co., Ltd. | | 1,963,200 | |
76,970 | | LG Chem Ltd. | | 3,397,874 | |
23,370 | | LG Electronics, Inc. | | 1,529,497 | |
7,316 | | POSCO | | 1,503,445 | |
5,125 | | Samsung Electronics Co., Ltd. | | 2,738,653 | |
166,150 | | SK Telecom Co., Ltd. ADR | | 3,357,892 | |
| | | | 21,701,983 | |
See Accompanying Notes to Financial Statements
86
| PORTFOLIO OF INVESTMENTS |
ING EMERGING COUNTRIES FUND | AS OF OCTOBER 31, 2005 (CONTINUED) |
Shares | | | | Value | |
| | Taiwan: 7.5% | | | |
825,000 | | China Motor Corp. | | $ | 773,681 | |
124,890 | | Chunghwa Telecom Co., | | | |
| | Ltd. ADR | | 2,163,095 | |
802,268 | @,L | United Microelectronics | | | |
| | Corp. ADR | | 2,342,623 | |
6,357,000 | | Walsin Lihwa Corp. | | 1,869,636 | |
441,000 | @,L | Yageo Corp. GDR | | 670,364 | |
1,458,718 | @ | Yageo Corp. GDR | | 2,085,967 | |
| | | | 9,905,366 | |
| | Thailand: 2.5% | | | |
2,466,600 | | Glow Energy PCL | | 1,314,439 | |
1,506,200 | I | Siam Makro PCL | | 2,030,666 | |
| | | | 3,345,105 | |
| | Venezuela: 1.2% | | | |
128,500 | | Cia Anonima Nacional | | | |
| | Telefonos de Venezuela ADR | | 1,657,650 | |
| | | | 1,657,650 | |
| | Total Common Stock | | | |
| | (Cost $116,905,327) | | 120,015,384 | |
| | | |
PREFERRED STOCK: 1.8% | | | |
| | Brazil: 1.8% | | | |
975,469,880 | | Embratel Participacoes SA | | 2,347,451 | |
| | Total Preferred Stock | | | |
| | (Cost $1,717,781) | | 2,347,451 | |
| | Total Long-Term Investments | | | |
| | (Cost $118,623,108) | | 122,362,835 | |
| | | | | | |
Principal
Amount | | | | Value | |
| | | | |
SHORT-TERM INVESTMENTS: 14.7% | | | |
| | | Securities Lending CollateralCC: 14.7% | | | |
$ | 19,481,000 | | The Bank of New York Insitutional | | | |
| | Cash Reserves Fund | | 19,481,000 | |
| | Total Short-Term Investments: | | | |
| | (Cost $19,481,000) | | 19,481,000 | |
| | Total Investments In | | | |
| | Securities (Cost | | | |
| | $138,104,108)* | 106.9 | % | | $ | 141,843,835 | |
| | Other Assets and | | | | | |
| | Liabilities-Net | (6.9 | ) | | (9,167,729 | ) |
| | Net Assets | 100.0 | % | | $ | 132,676,106 | |
Securities may have been fair valued in accordance with procedures approved by the Board of Directors/Trustees (Note 2A).
@ Non-income producing security
ADR American Depositary Receipt
GDR Global Depositary Receipt
cc Securities purchased with cash collateral for securities loaned.
I Illiquid security
L Loaned security, a portion or all of the security is on loan at October 31, 2005.
* Cost for federal income tax purposes is $138,252,915. Net unrealized appreciation consists of:
| Gross Unrealized Appreciation | | | | $ | 15,587,716 | |
| Gross Unrealized Depreciation | | | | | (11,996,796 | ) |
| Net Unrealized Appreciation | | | | $ | 3,590,920 | |
Industry | | Percentage of
Net Assets | |
Agriculture | | 2.1 | % | |
Auto Manufacturers | | 3.1 | | |
Banks | | 10.7 | | |
Beverages | | 1.9 | | |
Chemicals | | 4.6 | | |
Diversified Financial Services | | 1.6 | | |
Electric | | 10.6 | | |
Electrical Components and Equipment | | 2.6 | | |
Electronics | | 2.1 | | |
Food | | 3.0 | | |
Forest Products and Paper | | 0.9 | | |
Holding Companies - Diversified | | 1.9 | | |
Investment Companies | | 1.8 | | |
Iron/Steel | | 1.1 | | |
Media | | 1.0 | | |
Oil and Gas | | 2.6 | | |
Pharmaceuticals | | 1.1 | | |
Retail | | 2.6 | | |
Semiconductors | | 3.8 | | |
Telecommunications | | 31.2 | | |
Water | | 1.9 | | |
Security Lending Collateral | | 14.7 | | |
Other Assets and Liabilities, Net | | | (6.9 | ) | |
Net Assets | | | 100.0 | % | |
See Accompanying Notes to Financial Statements
87
| PORTFOLIO OF INVESTMENTS |
ING FOREIGN FUND | AS OF OCTOBER 31, 2005 |
Shares | | | | Value | |
COMMON STOCK: 89.7% | | | |
| | Australia: 1.6% | | | |
78,943 | | BHP Billiton Ltd. | | $ | 1,223,471 | |
22,530 | | Brambles Industries Ltd. | | 142,790 | |
12,800 | | CSL Ltd. | | 359,856 | |
103,400 | | Macquarie Airports | | 232,682 | |
85,522 | | Newcrest Mining Ltd. | | 1,163,147 | |
54,492 | | Patrick Corp., Ltd. | | 278,936 | |
5,557 | | Rio Tinto Ltd. | | 234,802 | |
14,418 | | Transurban Group | | 69,145 | |
| | | | 3,704,829 | |
| | Austria: 2.7% | | | |
18,829 | | Bank Austria Creditanstalt AG | | 2,069,287 | |
4,643 | | Flughafen Wien AG | | 300,316 | |
47,297 | @ | IMMOFINANZ Immobilien | | | |
| | Anlagen AG | | 457,242 | |
28,591 | | OMV AG | | 1,541,749 | |
17,936 | @ | Raiffeisen Intl. Bank Holding AG | | 1,128,780 | |
26,795 | | Telekom Austria AG | | 554,263 | |
9,356 | | Wienerberger AG | | 361,515 | |
| | | | 6,413,152 | |
| | Belgium: 1.2% | | | |
3,906 | | Almancora Comm Va | | 378,639 | |
21,544 | | Fortis | | 612,882 | |
5,359 | | Interbrew | | 213,958 | |
21,052 | | KBC Bancassurance Holding | | 1,714,820 | |
| | | | 2,920,299 | |
| | Brazil: 0.1% | | | |
5,809 | L | Aracruz Celulose SA ADR | | 222,485 | |
| | | | 222,485 | |
| | Bulgaria: 0.0% | | | |
60,720 | @ | Bulgarian Compensation Notes | | 25,768 | |
25,950 | @ | Bulgarian Housing | | | |
| | Compensation Notes | | 10,965 | |
117,641 | @ | Bulgarian Registered | | | |
| | Comp Vouchers | | 49,888 | |
| | | | 86,621 | |
| | Canada: 0.1% | | | |
55,092 | @ | Bema Gold Corp. | | 138,717 | |
829 | @ | Centerra Gold, Inc. | | 15,919 | |
44,793 | @ | Eldorado Gold Corp. | | 137,088 | |
3,787 | @ | Ivanhoe Mines Ltd. | | 28,445 | |
| | | | 320,169 | |
| | China: 0.3% | | | |
296,000 | | Beijing Capital Intl. Airport | | | |
| | Co., Ltd. | | 119,925 | |
45,630 | | Shenzhen Chiwan Wharf | | | |
| | Holdings Ltd. | | 64,569 | |
244,498 | | Weiqiao Textile Co. | | 297,159 | |
84,393 | | Wumart Stores, Inc. | | 174,178 | |
| | | | 655,831 | |
| | Cyprus: 0.0% | | | |
20,870 | | Bank of Cyprus Ltd. | | 106,182 | |
| | | | 106,182 | |
| | Czech Republic: 1.6% | | | |
16,602 | @ | Cesky Telecom AS | | 338,442 | |
7,064 | | CEZ | | $ | 185,244 | |
22,540 | | Komercni Banka AS | | 3,169,137 | |
| | | | 3,692,823 | |
| | Denmark: 0.9% | | | |
2,025 | | Bryggerigruppen AS | | 157,038 | |
1,975 | | Chr. Hansen Holding A/S | | 185,049 | |
20,113 | | Danske Bank A/S | | 630,479 | |
1,950 | | Kobenhavns Lufthavne | | 617,568 | |
21,143 | @ | Vestas Wind Systems A/S | | 457,367 | |
| | | | 2,047,501 | |
| | Finland: 0.7% | | | |
31,708 | | Fortum Oyj | | 560,887 | |
55,443 | S | Nokia Oyj | | 928,494 | |
5,350 | | Stockmann Oyj Abp | | 190,657 | |
| | | | 1,680,038 | |
| | France: 9.4% | | | |
1,956 | | Accor | | 97,647 | |
4,510 | | Air Liquide | | 819,793 | |
62,965 | @ | Alcatel SA | | 739,524 | |
2,592 | @ | Alstom RGPT | | 124,152 | |
2,740 | @ | Atos Origin | | 188,178 | |
8,061 | | Autoroutes du Sud de la France | | 449,903 | |
10,065 | | BNP Paribas | | 762,954 | |
18,689 | | Bouygues | | 921,878 | |
7,151 | | Carrefour SA | | 317,857 | |
10,184 | | Cie de Saint-Gobain | | 557,608 | |
3,086 | | Compagnie Generale des | | | |
| | Etablissements Michelin | | 166,442 | |
2,189 | | Eurazeo | | 212,704 | |
57,618 | | France Telecom SA | | 1,497,091 | |
6,116 | | Generale de Sante | | 211,676 | |
7,878 | @ | JC Decaux SA | | 160,982 | |
23,927 | | Lafarge SA | | 1,963,496 | |
23,782 | | LVMH Moet Hennessy Louis | | | |
| | Vuitton SA | | 1,925,082 | |
10,766 | | Pernod-Ricard | | 1,882,387 | |
7,398 | | PPR SA | | 777,099 | |
6,342 | | Publicis Groupe | | 209,626 | |
2,551 | | Renault SA | | 220,807 | |
32,264 | | Sanofi-Aventis SA | | 2,583,396 | |
5,315 | | Schneider Electric SA | | 436,543 | |
18,357 | | Societe Television Francaise 1 | | 470,669 | |
27,901 | | Suez SA | | 755,534 | |
7,946 | S | Total SA | | 1,998,532 | |
4,580 | | Unibail | | 604,624 | |
8,390 | | Veolia Environnement | | 348,953 | |
9,763 | | Vinci SA | | 762,938 | |
| | | | 22,168,075 | |
| | Germany: 8.4% | | | |
4,058 | | Adidas-Salomon AG | | 680,513 | |
2,619 | | Allianz AG | | 369,096 | |
6,230 | | BASF AG | | 448,210 | |
18,485 | | Commerzbank AG | | 482,804 | |
2,520 | | Continental AG | | 192,495 | |
9,003 | | DaimlerChrysler AG | | 449,830 | |
8,913 | | Deutsche Bank AG | | 833,453 | |
3,650 | | Deutsche Boerse AG | | 343,273 | |
35,529 | | Deutsche Post AG | | 793,660 | |
4,309 | | Deutsche Postbank AG | | 237,411 | |
70,677 | | Deutsche Telekom AG | | 1,249,209 | |
14,313 | | E.ON AG | | 1,296,199 | |
See Accompanying Notes to Financial Statements
88
| PORTFOLIO OF INVESTMENTS |
ING FOREIGN FUND | AS OF OCTOBER 31, 2005 (CONTINUED) |
Shares | | | | Value | |
| | Germany (continued) | | | |
35,138 | | Fraport AG Frankfurt Airport | | | |
| | Services Worldwide | | $ | 1,759,217 | |
1,461 | | Freenet.de AG | | 33,824 | |
2,270 | | Fresenius AG | | 293,640 | |
11,372 | L | Fresenius Medical Care AG | | 1,026,163 | |
4,725 | | Henkel KGaA - Common | | 378,897 | |
797 | | Henkel KGaA - Preffered | | 68,352 | |
8,111 | | Hypo Real Estate Holding | | 391,066 | |
79,326 | | INDEXCHANGE - DAXEX | | 4,513,103 | |
7,208 | | IVG Immobilien AG | | 138,566 | |
16,450 | @,L | KarstadtQuelle AG | | 194,074 | |
6,350 | | Linde AG | | 452,926 | |
2,553 | | MAN AG | | 118,330 | |
10,054 | | Metro AG | | 454,882 | |
1,899 | | Muenchener | | | |
| | Rueckversicherungs AG | | 222,822 | |
10,434 | | RWE AG | | 663,747 | |
3,826 | | Schering AG | | 235,772 | |
19,630 | | Siemens AG | | 1,458,517 | |
| | | | 19,780,051 | |
| | Greece: 0.5% | | | |
10,806 | | Alpha Bank AE | | 310,134 | |
23,994 | @ | Hellenic Telecommunications | | | |
| | Organization SA | | 494,897 | |
11,171 | | National Bank of Greece | | 435,651 | |
| | | | 1,240,682 | |
| | Hong Kong: 0.1% | | | |
54,000 | | China Merchants Holdings Intl. | | | |
| | Co., Ltd. | | 105,275 | |
129,000 | @ | Clear Media Ltd. | | 108,161 | |
186,000 | | Texwinca Holdings Ltd. | | 125,962 | |
| | | | 339,398 | |
| | Hungary: 0.9% | | | |
2,861 | | Egis Rt | | 244,764 | |
139,567 | | Matav Magyar Tavkozlesi Rt | | 661,458 | |
33,707 | S | OTP Bank Rt | | 1,219,279 | |
| | | | 2,125,501 | |
| | Indonesia: 0.3% | | | |
838,993 | | Bank Mandiri Persero Tbk PT | | 109,656 | |
546,500 | | Indofood Sukses Makmur Tbk PT | | 44,468 | |
84,757 | | Semen Gresik Persero Tbk PT | | 156,844 | |
533,204 | | Telekomunikasi Indonesia Tbk PT | | 267,815 | |
| | | | 578,783 | |
| | Ireland: 1.5% | | | |
18,807 | @ | Celtic Resources Holdings PLC | | 69,508 | |
3,554 | | Depfa Bank PLC | | 55,404 | |
210,989 | @ | Dragon Oil PLC | | 567,219 | |
68,739 | | EURO STOXX 50-NAV | | 2,735,073 | |
| | | | 3,427,204 | |
| | Italy: 3.2% | | | |
33,774 | | Assicurazioni Generali S.p.A. | | 1,003,827 | |
3,345 | | Autostrada Torino-Milano S.p.A. | | 63,571 | |
144,358 | | Banca Intesa S.p.A. - RNC | | 624,947 | |
152,358 | | Banca Intesa S.p.A. | | 711,233 | |
3,543 | | Banca Popolare dell’Emilia | | | |
| | Romagna SCRL | | 186,823 | |
71,564 | | Banca Popolare di Milano SCRL | | 681,657 | |
10,870 | | Banca Popolare di Sondrio SCRL | | 159,477 | |
19,590 | | Banche Popolari Unite SCRL | | $ | 414,373 | |
23,252 | | Banco Popolare di Verona e | | | |
| | Novara SCRL | | 428,939 | |
124,078 | | Beni Stabili S.p.A. | | 118,907 | |
24,978 | | Buzzi Unicem S.p.A. | | 350,508 | |
71,866 | | Capitalia S.p.A. | | 374,834 | |
218,738 | | Cassa di Risparmio di | | | |
| | Firenze S.p.A. | | 652,051 | |
48,755 | | Credito Emiliano S.p.A. | | 514,150 | |
9,120 | | Luxottica Group S.p.A. | | 219,967 | |
102,590 | @ | Parmalat S.p.A. | | 298,284 | |
5,806 | | Societa Iniziative Autostradali e | | | |
| | Servizi S.p.A. | | 67,281 | |
107,300 | | UniCredito Italiano S.p.A. | | 594,880 | |
| | | | 7,465,709 | |
| | Japan: 14.4% | | | |
930 | | Acom Co., Ltd. | | 60,443 | |
5,175 | | Aeon Credit Service Co., Ltd. | | 406,508 | |
2,950 | | Aiful Corp. | | 220,663 | |
5,900 | | Aisin Seiki Co., Ltd | | 177,588 | |
11,000 | | Bank of Fukuoka Ltd. | | 85,487 | |
65,000 | | Bank of Yokohama Ltd. | | 529,251 | |
12,000 | | Bridgestone Corp. | | 245,118 | |
22,637 | S | Canon, Inc. | | 1,198,209 | |
10,000 | | Chiba Bank Ltd. | | 89,017 | |
21,558 | | Credit Saison Co., Ltd. | | 978,142 | |
5,000 | | Dai Nippon Printing Co., Ltd. | | 81,825 | |
6,000 | | Daihatsu Motor Co., Ltd. | | 57,127 | |
15,587 | | Denso Corp. | | 443,762 | |
42 | | East Japan Railway Co. | | 249,552 | |
2,800 | | Exedy Corp. | | 64,526 | |
1,100 | | Fanuc Ltd. | | 86,689 | |
9,800 | | Fuji Photo Film Co., Ltd. | | 311,840 | |
190 | S | Fuji Television Network, Inc. | | 421,958 | |
17,000 | | Gunma Bank Ltd. | | 121,118 | |
8,400 | | Hitachi Capital Corp. | | 178,651 | |
21,063 | S | Honda Motor Co., Ltd. | | 1,171,475 | |
7,700 | | Ibiden Co., Ltd. | | 312,010 | |
122 | | Japan Tobacco, Inc. | | 1,928,803 | |
14,000 | | Joyo Bank Ltd. | | 93,592 | |
19,126 | | Koito Manufacturing Co., Ltd. | | 257,187 | |
101,471 | | Matsushita Electric Industrial | | | |
| | Co., Ltd. | | 1,859,582 | |
328 | S | Mitsubishi Tokyo Financial | | | |
| | Group, Inc. | | 4,120,918 | |
374 | S | Mizuho Financial Group, Inc. | | 2,496,842 | |
8,000 | | NGK Spark Plug Co., Ltd. | | 128,550 | |
1,300 | @ | Nidec Corp. | | 72,033 | |
15,290 | | Nikko Cordial Corp. | | 185,623 | |
42,906 | | Nissan Motor Co., Ltd. | | 449,831 | |
7,700 | | Nitto Denko Corp. | | 466,234 | |
15,230 | | Nomura ETF - Nikkei 225 | | | |
| | Exchange Traded Fund | | 1,792,457 | |
45,953 | | Nomura Holdings, Inc. | | 708,933 | |
248,400 | | Nomura TOPIX Exchange | | | |
| | Traded Fund | | 3,113,402 | |
500 | | ORIX Corp. | | 93,758 | |
8,000 | | Ricoh Co., Ltd. | | 127,134 | |
3,500 | | Secom Co., Ltd. | | 174,640 | |
5,586 | @ | Seven & I Holdings Co., Ltd. | | 182,353 | |
1,102 | | SMC Corp. | | 146,658 | |
13,433 | | Sony Corp. | | 438,873 | |
273 | S | Sumitomo Mitsui Financial | | | |
| | Group, Inc. | | 2,521,385 | |
See Accompanying Notes to Financial Statements
89
| PORTFOLIO OF INVESTMENTS |
ING FOREIGN FUND | AS OF OCTOBER 31, 2005 (CONTINUED) |
Shares | | | | Value | |
| | Japan (continued) | | | |
43,830 | | Sumitomo Trust & Banking | | | |
| | Co., Ltd. | | $ | 373,155 | |
6,100 | | Takeda Chemical Industries Ltd. | | 334,374 | |
4,570 | | Takefuji Corp. | | 319,845 | |
46,100 | S | Tokyo Broadcasting System, Inc. | | 1,303,205 | |
16,000 | | Toppan Printing Co., Ltd. | | 154,383 | |
51,000 | | Toshiba Corp. | | 236,758 | |
45,800 | S | Toyota Motor Corp. | | 2,123,859 | |
11,100 | | Yamaha Motor Co., Ltd. | | 238,418 | |
3,092 | | Yamanouchi Pharmaceutical | | | |
| | Co., Ltd. | | 110,449 | |
| | | | 34,044,193 | |
| | Luxembourg: 0.1% | | | |
6,516 | @,L | Millicom Intl. Cellular SA | | 123,999 | |
4,058 | @ | SBS Broadcasting SA | | 216,089 | |
| | | | 340,088 | |
| | Mexico: 0.6% | | | |
13,433 | | Consorcio ARA SA | | 49,538 | |
57,758 | | Fomento Economico Mexicano | | | |
| | SA de CV | | 391,652 | |
6,640 | | Fomento Economico Mexicano | | | |
| | SA de CV ADR | | 451,454 | |
56,610 | | Grupo Financiero Banorte | | | |
| | SA de CV | | 482,194 | |
14,960 | @ | Urbi Desarrollos Urbanos | | | |
| | SA de CV | | 94,319 | |
| | | | 1,469,157 | |
| | Netherlands: 2.0% | | | |
14,959 | | ABN Amro Holding NV | | 353,632 | |
15,219 | | Aegon NV | | 229,381 | |
4,661 | | Euronext NV | | 195,514 | |
6,468 | | European Aeronautic Defense | | | |
| | and Space Co. | | 223,981 | |
17,793 | | Heineken NV | | 563,601 | |
43,920 | | Koninklijke Philips Electronics NV | | 1,147,919 | |
31,610 | | Royal KPN NV | | 300,183 | |
6,239 | @ | Royal Numico NV | | 252,552 | |
23,062 | | TPG NV | | 543,539 | |
8,607 | | Unilever NV | | 605,282 | |
5,657 | | VNU NV | | 179,917 | |
| | | | 4,595,501 | |
| | New Zealand: 0.1% | | | |
160,764 | | Auckland Intl. Airport Ltd. | | 221,065 | |
| | | | 221,065 | |
| | Norway: 2.0% | | | |
45,000 | | Acta Holding ASA | | 105,924 | |
14,526 | | DNB Holding ASA | | 148,552 | |
18,610 | S | Norsk Hydro ASA | | 1,848,372 | |
8,500 | | Orkla ASA | | 298,322 | |
84,415 | | Statoil ASA | | 1,875,328 | |
24,394 | | Telenor ASA | | 238,036 | |
27,400 | | Tomra Systems ASA | | 187,407 | |
| | | | 4,701,941 | |
| | Philippines: 0.1% | | | |
7,480 | | Ayala Corp. | | 39,523 | |
48,400 | | Bank of the Philippine Islands | | 46,026 | |
2,346 | | Globe Telecom, Inc. | | 30,196 | |
6,100 | L | Philippine Long Distance | | | |
| | Telephone ADR | | $ | 183,915 | |
| | | | 299,660 | |
| | Poland: 3.8% | | | |
14,828 | | Agora SA | | 281,349 | |
3,721 | | Bank BPH SA | | 708,459 | |
10,111 | | Bank Handlowy w Warszawie | | 179,534 | |
57,150 | | Bank Millennium SA | | 79,774 | |
47,950 | | Bank Pekao SA | | 2,275,882 | |
15,562 | @ | Bank Zachodni WBK SA | | 524,281 | |
15,273 | @ | Budimex SA | | 177,501 | |
13,619 | @ | CCC SA | | 96,280 | |
5,755 | @ | Cersanit-Krsnystaw SA | | 209,866 | |
4,572 | | Grupa Kety SA | | 181,475 | |
5,162 | | Inter Cars SA | | 38,650 | |
1,975 | @ | Inter Groclin Auto SA | | 53,005 | |
8,149 | | Orbis SA | | 73,811 | |
4,510 | | Polska Grupa Framaceutycz SA | | 70,789 | |
78,920 | @ | Polski Koncernmiesny Duda SA | | 241,410 | |
353,180 | S | Pows Zechna Kasa Oszczednosci | | | |
| | Bank Polski | | 2,966,230 | |
10,496 | | Sniezka SA | | 72,883 | |
1,308 | @ | Stomil Sanok | | 44,258 | |
97,140 | S | Telekomunikacja Polska SA | | 698,665 | |
| | | | 8,974,102 | |
| | Portugal: 0.1% | | | |
91,438 | | Banco Comercial Portugues SA | | 231,176 | |
6,004 | | Jeronimo Martins | | 86,473 | |
| | | | 317,649 | |
| | Romania: 1.0% | | | |
895,328 | | Impact | | 124,249 | |
1,069,500 | @ | Rolast AG | | 26,254 | |
149,561 | | Romanian Bank for | | | |
| | Development SA | | 631,472 | |
154,500 | | SIF 1 Banat Crisana Arad | | 91,022 | |
167,500 | | SIF 2 Moldova Bacau | | 101,422 | |
127,000 | | SIF 3 Transilvania Brasov | | 73,574 | |
232,500 | | SIF 4 Muntenia Bucuresti | | 96,644 | |
147,500 | | SIF 5 Oltenia Craiova | | 103,795 | |
8,537,510 | @ | SNP Petrom SA | | 1,128,908 | |
585,000 | @ | Socep Constanta | | 52,654 | |
| | | | 2,429,994 | |
| | Russia: 4.2% | | | |
34,300 | L | Lukoil ADR | | 1,890,240 | |
15,950 | L | MMC Norilsk Nickel ADR | | 1,172,325 | |
5,547 | | Moscow City Telephone ADR | | 91,526 | |
170 | | NovaTek OAO | | 374,289 | |
534 | # | NovaTek OAO GDR | | 11,748 | |
33,267 | L | OAO Gazprom GDR | | 1,967,080 | |
3,677 | | Sberbank RF | | 3,270,609 | |
2,289 | | Sibirtelecom ADR | | 114,084 | |
43,845 | | Tyumen Oil Co. | | 271,839 | |
7,255 | L | Unified Energy System GDR | | 256,102 | |
25,037 | L | Uralsvyazinform ADR | | 174,758 | |
30,398 | | VolgaTelecom ADR | | 220,689 | |
| | | | 9,815,289 | |
| | Singapore: 0.1% | | | |
124,000 | | Singapore | | | |
| | Telecommunications Ltd. | | 170,663 | |
| | | | 170,663 | |
See Accompanying Notes to Financial Statements
90
| PORTFOLIO OF INVESTMENTS |
ING FOREIGN FUND | AS OF OCTOBER 31, 2005 (CONTINUED) |
Shares | | | | Value | |
| | South Korea: 1.0% | | | |
4,350 | | Samsung Electronics Co., Ltd. | | $ | 2,324,515 | |
| | | | 2,324,515 | |
| | Spain: 1.4% | | | |
10,492 | | ACS Actividades de Construccion | | | |
| | y Servicios SA | | 299,625 | |
12,435 | | Cintra Concesiones DE Infrae | | 147,400 | |
12,286 | | Corp Mapfre SA | | 215,031 | |
23,123 | | Endesa SA | | 573,806 | |
7,311 | | Fadesa SA | | 245,677 | |
7,485 | | Grupo Empresarial Ence SA | | 237,024 | |
9,310 | | Grupo Ferrovial | | 687,459 | |
16,152 | | Inditex SA | | 477,946 | |
12,995 | | Promotora de Informaciones SA | | 238,192 | |
14,605 | | Telefonica SA | | 232,994 | |
| | | | 3,355,154 | |
| | Sweden: 3.1% | | | |
6,426 | | Autoliv, Inc. | | 276,061 | |
38,200 | | ForeningsSparbanken AB | | 942,596 | |
30,514 | | Getinge AB | | 381,378 | |
5,350 | | Hennes & Mauritz AB | | 173,600 | |
12,650 | @ | Modern Times Group AB | | 484,678 | |
174,000 | | Nordea AB | | 1,704,494 | |
78,600 | | Skandinaviska Enskilda Banken AB | | 1,466,024 | |
65,263 | | Skanska AB | | 913,916 | |
37,195 | | Svenska Handelsbanken AB | | 847,785 | |
45,563 | | Telefonaktiebolaget LM Ericsson | | 149,281 | |
10,500 | | TeliaSonera AB | | 51,346 | |
| | | | 7,391,159 | |
| | Switzerland: 7.2% | | | |
1,140 | | BKW FMB Energie AG | | 76,564 | |
17,644 | | Compagnie Financiere | | | |
| | Richemont AG | | 670,317 | |
26,906 | | Holcim Ltd. | | 1,672,976 | |
15,917 | S | Nestle SA | | 4,732,981 | |
965 | | Nobel Biocare Holding AG | | 222,166 | |
56,609 | | Novartis AG | | 3,040,537 | |
31,694 | S | Roche Holding AG | | 4,728,787 | |
126 | | SGS SA | | 92,727 | |
9,984 | | Swatch Group AG | | 1,383,087 | |
3,238 | | Synthes, Inc. | | 342,414 | |
394 | @ | Unique Zurich Airport | | 65,313 | |
| | | | 17,027,869 | |
| | Turkey: 3.9% | | | |
368,306 | S | Akbank TAS | | 2,307,481 | |
19,487 | | Cimsa Cimento Sanayi VE Tica | | 113,977 | |
346,008 | @ | Dogan Sriketler Grubu Holdings | | 871,499 | |
301,833 | | HACI Omer Sabanci Holding | | 1,420,565 | |
30,295 | | Hurriyet Gazetecilik Ve Matb | | 85,965 | |
114,898 | | KOC Holding AS | | 430,400 | |
6,793 | | Tupras Turkiye Petrol Rafine | | 116,731 | |
473,123 | @ | Turkiye Garanti Bankasi | | 1,414,285 | |
359,281 | | Turkiye Is Bank ASI - C | | 2,506,110 | |
| | | | 9,267,013 | |
| | Ukraine: 0.1% | | | |
1,530 | @,I | Centrenergo ADR | | 9,104 | |
87 | | Ukrnafta Open JT STK ADR | | 18,287 | |
16,172 | | UkrTelecom ADR | | 106,535 | |
| | | | 133,926 | |
| | United Kingdom: 10.7% | | | |
37,667 | | Associated British Ports | | | |
| | Holdings PLC | | $ | 365,382 | |
106,953 | | BAA PLC | | 1,162,152 | |
55,127 | | BAE Systems PLC | | 322,624 | |
59,393 | | Barclays PLC | | 588,680 | |
13,743 | | BG Group PLC | | 120,921 | |
7,840 | | British Land Co. PLC | | 123,560 | |
21,225 | | British Sky Broadcasting PLC | | 191,613 | |
103,406 | | Burberry Group PLC | | 702,506 | |
19,459 | | Cadbury Schweppes PLC | | 191,787 | |
117,853 | | Compass Group PLC | | 396,681 | |
182,479 | S | Diageo PLC | | 2,695,750 | |
11,193 | | Exel PLC | | 239,114 | |
141,784 | | GlaxoSmithKline PLC | | 3,688,279 | |
34,701 | | Highland Gold Mining Ltd. | | 137,602 | |
265,523 | | Hilton Group PLC | | 1,595,969 | |
23,528 | | Imperial Tobacco Group PLC | | 674,354 | |
11,664 | @ | Kazakhmys PLC | | 111,500 | |
16,730 | | National Grid PLC | | 153,045 | |
31,156 | | Pearson PLC | | 346,539 | |
86,000 | | Peninsular and Oriental Steam | | | |
| | Navigation Co. | | 615,335 | |
22,050 | @ | Peter Hambro Mining PLC | | 304,387 | |
51,835 | | Prudential PLC | | 434,958 | |
31,082 | | Reckitt Benckiser PLC | | 939,320 | |
35,515 | @ | Rolls-Royce Group PLC | | 229,586 | |
1,186,201 | @ | Rolls-Royce Group PLC - Class B | | 2,100 | |
13,625 | | Royal Bank of Scotland Group PLC | | 377,357 | |
2,366 | | SABMiller PLC | | 44,646 | |
21,234 | | Scottish & Newcastle PLC | | 175,774 | |
46,824 | | Scottish Power PLC | | 458,334 | |
33,655 | | Smith & Nephew PLC | | 284,737 | |
12,254 | | Smiths Group PLC | | 198,007 | |
9,256 | @ | Telewest Global, Inc. | | 211,129 | |
363,794 | | Tesco PLC | | 1,937,450 | |
1,354,984 | S | Vodafone Group PLC | | 3,558,033 | |
14,546 | | Whitbread PLC | | 242,150 | |
41,723 | | William Hill PLC | | 394,898 | |
15,576 | | Wolseley PLC | | 316,919 | |
72,977 | | WPP Group PLC | | 716,991 | |
| | | | 25,250,169 | |
| | United States: 0.2% | | | |
19,086 | L | News Corp., Inc. | | 287,435 | |
2,231 | | Southern Copper Corp. | | 123,017 | |
| | | | 410,452 | |
| | Venezuela: 0.1% | | | |
10,148 | | Cia Anonima Nacional Telefonos | | | |
| | de Venezuela ADR | | 130,909 | |
| | | | 130,909 | |
| | Total Common Stock | | | |
| | (Cost $180,694,082) | | 211,643,701 | |
PREFERRED STOCK: 0.2% | | | |
| | Germany: 0.2% | | | |
18,350 | | ProSieben SAT.1 Media AG | | 315,695 | |
3,215 | | Volkswagen AG | | 130,387 | |
| | Total Preferred Stock | | | |
| | (Cost $398,415) | | 446,082 | |
See Accompanying Notes to Financial Statements
91
| PORTFOLIO OF INVESTMENTS |
ING FOREIGN FUND | AS OF OCTOBER 31, 2005 (CONTINUED) |
Shares | | | | Value | |
RIGHTS: 0.0% | | | |
| | Cyprus: 0.0% | | | |
7,554 | @ | Bank of Cyprus | | $ | 7,554 | |
| | Total Rights | | | |
| | (Cost $-) | | 7,554 | |
EQUITY-LINKED SECURITIES: 2.1.% | | | |
| | India: 0.5% | | | |
150,817 | @,# | Bharti Televentures | | 1,078,342 | |
| | | | 1,078,342 | |
| | Japan: 1.1% | | | |
21,404 | @ | NIKKEI | | 2,519,091 | |
| | | | 2,519,091 | |
| | United Kingdom: 0.5% | | | |
103,758 | @ | Velvet Hill Fund Ltd. | | 1,300,485 | |
| | | | 1,300,485 | |
| | Total Equity Linked Securities | | | |
| | (Cost $4,604,532) | | 4,897,918 | |
WARRANTS: 0.1% | | | |
| | India: 0.1% | | | |
14,147 | @,# | State Bank of India Ltd. | | 262,851 | |
| | Total Warrants | | | |
| | (Cost $284,631) | | 262,851 | |
| | Total Long-Term Investments | | | |
| | (Cost $185,981,660) | | 217,260,206 | |
| | | | | | |
Principal
Amount | | | | Value | |
SHORT-TERM INVESTMENTS: 2.1% | | | |
| | | | | |
| | Securities Lending CollateralCC: 2.1% | | | |
$ | 4,949,000 | | The Bank of New York Institutional | | | |
| | Cash Reserves Fund | | $ | 4,949,000 | |
| | Total Short-Term Investments | | | |
| | (Cost $4,949,000) | | 4,949,000 | |
| | Total Investments In | | | |
| | Securities (Cost | | | |
| | $190,930,660)* | 94.2 | % | | $ | 222,209,206 | |
| | Other Assets and | | | | | |
| | Liabilities-Net | 5.8 | | | 13,621,849 | |
| | Net Assets | 100.0 | % | | $ | 235,831,055 | |
| | | | | | | | | |
Securities may have been fair valued in accordance with procedures approved by the Board of Directors/Trustees (Note 2A).
Equity Linked Securities (ELKS) are short-term investments that offer current income as well as limited protection against the decline in the price of the stock on which it is based.
@ Non-income producing security
ADR American Depositary Receipt
GDR Global Depositary Receipt
SIF Societati de Investitii Financiare
# Securities with purchases pursuant to Rule 144A, under the Securities Act of 1933 and may not be resold subject to that rule except to qualified institutional buyers. These securities have been determined to be liquid under the guidelines established by the Funds’ Board of Directors/Trustees.
cc Securities purchased with cash collateral for securities loaned.
S Segregated securities for certain derivatives, when-issued or delayed delivery securities and forward currency exchange contracts.
I Illiquid security
L Loaned security, a portion or all of the security is on loan at October 31, 2005.
* Cost for federal income tax purposes is $192,117,959.
Net unrealized appreciation consists of:
| Gross Unrealized Appreciation | | | | $ | 32,910,510 | |
| Gross Unrealized Depreciation | | | | | (2,819,263 | ) |
| Net Unrealized Appreciation | | | | $ | 30,091,247 | |
At October 31, 2005 the following forward foreign currency contracts were outstanding for the ING Foreign Fund:
| | | | | | In | | | | Unrealized | |
| | | | Settlement | | Exchange | | | | Appreciation | |
Currency | | | Buy/Sell | | Date | | For | | Value | | (Depreciation) | |
British Pound Sterling | | | | | | USD | | | | | |
GBP 1,027,150 | | Buy | | 11/30/05 | | 1,851,951 | | 1,817,687 | | | $ | (34,264 | ) |
Japanese Yen | | | | | | USD | | | | | | |
JPY 252,060,900 | | Buy | | 12/01/05 | | 2,525,028 | | 2,173,006 | | | (352,022 | ) |
Japanese Yen | | | | | | USD | | | | | | |
JPY 686,426,691 | | Buy | | 12/09/05 | | 6,540,200 | | 5,923,820 | | | (616,380 | ) |
Japanese Yen | | | | | | USD | | | | | | |
JPY 125,785,500 | | Buy | | 12/01/05 | | 1,260,755 | | 1,084,392 | | | (176,363 | ) |
Japanese Yen | | | | | | USD | | | | | | |
JPY 194,222,019 | | Buy | | 11/08/05 | | 1,757,665 | | 1,670,011 | | | (87,654 | ) |
Japanese Yen | | | | | | USD | | | | | | |
JPY 153,706,900 | | Buy | | 12/21/05 | | 1,400,072 | | 1,328,550 | | | (71,522 | ) |
Turkish New Lira | | | | | | USD | | | | | | |
TRY 1,625,419 | | Buy | | 11/28/05 | | 1,146,276 | | 1,193,024 | | | 46,748 | |
| | | | | | | | | | | $ | (1,291,457 | ) |
| | | | | | | | | | | | | | |
See Accompanying Notes to Financial Statements
92
| PORTFOLIO OF INVESTMENTS |
ING FOREIGN FUND | AS OF OCTOBER 31, 2005 (CONTINUED) |
| | | | | | In | | | | Unrealized | |
| | | | Settlement | | Exchange | | | | Appreciation | |
Currency | | | Buy/Sell | | Date | | For | | Value | | (Depreciation) | |
British Pound Sterling | | | | | | USD | | | | | |
GBP 168,600 | | Sell | | 11/30/05 | | 308,912 | | 298,362 | | $ | 10,550 | |
Czech Republic, Koruna | | | | | | USD | | | | | |
CZK 15,501,996 | | Sell | | 11/30/05 | | 641,400 | | 627,265 | | 14,135 | |
Czech Republic, Koruna | | | | | | USD | | | | | |
CZK 12,001,391 | | Sell | | 12/27/05 | | 493,641 | | 486,433 | | 7,208 | |
Czech Republic, Koruna | | | | | | USD | | | | | |
CZK 17,206,100 | | Sell | | 12/29/05 | | 704,002 | | 697,474 | | 6,528 | |
Czech Republic Koruna | | | | | | USD | | | | | |
CZK 2,567,850 | | Sell | | 12/29/05 | | 105,473 | | 103,732 | | 1,741 | |
Czech Republic, Koruna | | | | | | USD | | | | | |
CZK 19,081,262 | | Sell | | 01/23/06 | | 770,649 | | 774,486 | | (3,837 | ) |
Hungarian Forint | | | | | | USD | | | | | |
HUF 97,214,072 | | Sell | | 12/29/05 | | 469,611 | | 464,116 | | 5,495 | |
Japanese Yen | | | | | | USD | | | | | |
JPY 686,426,691 | | Sell | | 12/09/05 | | 6,100,161 | | 5,923,820 | | 176,341 | |
Polish Zloty | | | | | | USD | | | | | |
PLN 3,515,901 | | Sell | | 01/23/06 | | 1,076,088 | | 1,061,020 | | 15,068 | |
Turkish New Lira | | | | | | USD | | | | | |
TRY 1,625,419 | | Sell | | 11/28/05 | | 1,104,000 | | 1,193,022 | | (89,022 | ) |
Turkish New Lira | | | | | | USD | | | | | |
TRY 960,885 | | Sell | | 12/27/05 | | 694,934 | | 699,340 | | (4,406 | ) |
| | | | | | | | | | $ | 139,801 | |
| | | | | | | | | | | | | |
Industry | | Percentage of
Net Assets | |
Advertising | | 0.5 | % | |
Aeorspace/Defense | | 0.3 | | |
Agriculture | | 1.1 | | |
Apparel | | 0.6 | | |
Auto Manufacturers | | 2.0 | | |
Auto Parts and Equipment | | 0.9 | | |
Banks | | 22.7 | | |
Beverages | | 2.8 | | |
Building Materials | | 2.2 | | |
Chemicals | | 0.8 | | |
Commercial Services | | 0.6 | | |
Computers | | 0.1 | | |
Cosmetics/Personal Care | | 0.0 | | |
Distribution/Wholesale | | 0.2 | | |
Diversified Financial Services | | 2.0 | | |
Electric | | 2.1 | | |
Electrical Components and Equipment | | 0.5 | | |
Electronics | | 0.7 | | |
Engineering and Construction | | 3.6 | | |
Entertainment | | 0.8 | | |
Environment Control | | 0.1 | | |
Food | | 4.1 | | |
Food Service | | 0.2 | | |
Forest Products and Paper | | 0.2 | | |
Hand/Machine Tools | | 0.1 | | |
Healthcare - Products | | 0.6 | | |
Healthcare - Services | | 0.6 | | |
Holding Companies - Diversified | | 2.2 | | |
Home Furnishings | | 1.0 | % | |
Household Products/Wares | | 0.6 | | |
Insurance | | 1.1 | | |
Internet | | 0.0 | | |
Investment Companies | | 7.5 | | |
Leisure Time | | 0.1 | | |
Lodging | | 0.1 | | |
Machinery - Diversified | | 0.1 | | |
Media | | 2.0 | | |
Mining | | 2.1 | | |
Miscellaneous Manufacturing | | 0.9 | | |
Mutual Funds | | 0.2 | | |
Office/Business Equipment | | 0.6 | | |
Oil and Gas | | 5.8 | | |
Pharmaceuticals | | 6.5 | | |
Real Estate | | 0.5 | | |
Real Estate Investment Trusts | | 0.3 | | |
Retail | | 1.9 | | |
Semiconductors | | 1.0 | | |
Sovereign | | 0.0 | | |
Telecommunications | | 5.7 | | |
Textiles | | 0.2 | | |
Transportation | | 1.2 | | |
Water | | 0.1 | | |
Securities Lending Collateral | | 2.1 | | |
Other Assets and Liabilities, net | | | 5.8 | | |
Net Assets | | | 100.0 | % | |
| | | | | | |
See Accompanying Notes to Financial Statements
93
| PORTFOLIO OF INVESTMENTS |
ING INTERNATIONAL FUND | AS OF OCTOBER 31, 2005 |
Shares | | | | Value | |
COMMON STOCK: 96.0% | | | |
| | Australia: 1.2% | | | |
95,500 | | BHP Billiton Ltd. | | $ | 1,480,074 | |
| | | | 1,480,074 | |
| | Belgium: 1.9% | | | |
14,400 | | Belgacom SA | | 482,353 | |
61,500 | | Fortis | | 1,749,548 | |
| | | | 2,231,901 | |
| | Brazil: 0.7% | | | |
10,000 | #,L | Cyrela Brazil Realty SA GDR | | 785,881 | |
| | | | 785,881 | |
| | Canada: 1.7% | | | |
43,406 | | EnCana Corp. | | 1,987,134 | |
| | | | 1,987,134 | |
| | Denmark: 1.0% | | | |
22,100 | | TDC A/S | | 1,237,784 | |
| | | | 1,237,784 | |
| | Finland: 0.6% | | | |
38,800 | | UPM-Kymmene OYJ | | 749,589 | |
| | | | 749,589 | |
| | France: 7.3% | | | |
43,500 | @,L | Business Objects SA | | 1,489,658 | |
54,589 | | France Telecom SA | | 1,418,388 | |
18,621 | | Sanofi-Synthelabo SA | | 1,490,994 | |
18,578 | | Societe Generale | | 2,120,735 | |
5,339 | | Total SA | | 1,342,834 | |
7,400 | L | Total SA ADR | | 932,548 | |
| | | | 8,795,157 | |
| | Germany: 9.5% | | | |
20,007 | | Allianz AG | | 2,819,586 | |
39,700 | | Deutsche Bank AG | | 3,712,340 | |
9,600 | | Henkel KGaA | | 823,314 | |
30,250 | | Schering AG | | 1,864,117 | |
13,974 | | Siemens AG | | 1,038,274 | |
9,200 | | Solarworld AG | | 1,248,874 | |
| | | | 11,506,505 | |
| | Greece: 0.9% | | | |
35,688 | | Alpha Bank AE | | 1,024,250 | |
| | | | 1,024,250 | |
| | Hong Kong: 3.5% | | | |
63,000 | L | China Mobile Hong Kong | | | |
| | Ltd. ADR | | 1,414,350 | |
312,000 | | Hong Kong Exchanges and | | | |
| | Clearing Ltd. | | 1,046,157 | |
382,500 | | HongKong Electric Holdings | | 1,808,942 | |
| | | | 4,269,449 | |
| | Japan: 21.2% | | | |
30,690 | | Acom Co., Ltd. | | 1,994,604 | |
191,000 | | Amada Co., Ltd. | | 1,459,240 | |
166,000 | | Bank of Kyoto Ltd. | | 1,834,988 | |
67,000 | | Komatsu Ltd. | | 892,793 | |
14,400 | | Kyocera Corp. | | 933,974 | |
101 | | Mitsubishi Tokyo Financial | | | |
| | Group, Inc. | | 1,269,468 | |
8,110 | | Nippon Television Network Corp. | | $ | 1,313,019 | |
10,500 | | ORIX Corp. | | 1,968,917 | |
22,000 | | Promise Co., Ltd. | | 1,390,170 | |
341 | @ | Resona Holdings, Inc. | | 988,691 | |
37,200 | | Sankyo Co., Ltd. | | 1,967,160 | |
105,000 | | Sekisui House Ltd. | | 1,307,653 | |
72,000 | | Sharp Corp. | | 988,701 | |
119,000 | | Sumitomo Electric Industries Ltd. | | 1,565,974 | |
59,100 | | Takeda Chemical Industries Ltd. | | 3,239,593 | |
118,000 | | Tokuyama Corp. | | 1,172,282 | |
26,500 | | Toyota Motor Corp. | | 1,228,870 | |
| | | | 25,516,097 | |
| | Malaysia: 1.8% | | | |
811,500 | | Tenaga Nasional BHD | | 2,149,669 | |
| | | | 2,149,669 | |
| | Netherlands: 8.4% | | | |
99,919 | | Aegon NV | | 1,505,983 | |
18,229 | | European Aeronautic Defense | | | |
| | and Space Co. | | 631,254 | |
67,533 | | Heineken NV | | 2,139,136 | |
112,823 | | Royal Dutch Shell PLC | | 3,476,990 | |
34,000 | | Unilever NV | | 2,391,027 | |
| | | | 10,144,390 | |
| | Singapore: 1.0% | | | |
912,000 | @ | Singapore | | | |
| | Telecommunications Ltd. | | 1,255,196 | |
| | | | 1,255,196 | |
| | South Africa: 0.7% | | | |
76,900 | | JD Group Ltd. | | 824,239 | |
| | | | 824,239 | |
| | South Korea: 1.4% | | | |
14,830 | | Kookmin Bank | | 846,825 | |
5,350 | @ | NHN Corp. | | 898,043 | |
| | | | 1,744,868 | |
| | Spain: 1.2% | | | |
49,400 | | Repsol YPF SA | | 1,470,633 | |
| | | | 1,470,633 | |
| | Sweden: 1.3% | | | |
158,000 | | Nordea AB | | 1,547,759 | |
| | | | 1,547,759 | |
| | Switzerland: 11.0% | | | |
6,666 | @ | Barry Callebaut AG | | 1,864,617 | |
39,928 | | Credit Suisse Group | | 1,763,678 | |
12,810 | | Nestle SA | | 3,809,103 | |
29,438 | | Novartis AG | | 1,581,150 | |
19,280 | | Novartis AG ADR | | 1,037,650 | |
35,600 | | STMicroelectronics NV | | 585,976 | |
14,086 | | UBS AG | | 1,199,268 | |
59,815 | | Xstrata PLC | | 1,370,578 | |
| | | | 13,212,020 | |
| | United Kingdom: 18.6% | | | |
19,218 | | AstraZeneca PLC | | 859,846 | |
145,900 | | Barclays PLC | | 1,446,103 | |
278,000 | | BP PLC | | 3,080,080 | |
178,600 | | Cadbury Schweppes PLC | | 1,760,269 | |
See Accompanying Notes to Financial Statements
94
| PORTFOLIO OF INVESTMENTS |
ING INTERNATIONAL FUND | AS OF OCTOBER 31, 2005 (CONTINUED) |
Shares | | | | Value | |
| | United Kingdom (continued) | | | |
161,261 | | Capita Group PLC | | $ | 1,113,518 | |
159,669 | | Gallaher Group PLC | | 2,481,388 | |
159,890 | | HBOS PLC | | 2,362,298 | |
88,000 | | HSBC Holdings PLC | | 1,382,869 | |
43,200 | | Imperial Tobacco Group PLC | | 1,238,188 | |
642,100 | | Legal & General Group PLC | | 1,219,770 | |
87,953 | | Reed Elsevier PLC | | 803,529 | |
61,000 | | Severn Trent PLC | | 1,033,615 | |
1,395,849 | | Vodafone Group PLC | | 3,665,343 | |
| | | | 22,446,816 | |
| | United States: 1.1% | | | |
32,200 | L | Newmont Mining Corp. | | 1,371,720 | |
| | | | 1,371,720 | |
| | Total Common Stock | | | |
| | (Cost $107,153,960) | | 115,751,131 | |
| | | | | | |
Principal
Amount | | | | Value | |
| | | | |
SHORT-TERM INVESTMENTS: 7.8% | | | |
| | Repurchase Agreement: 3.7% | | | |
$ | 4,462,000 | | Deutsche Bank Repurchase Agreement dated 10/31/05, 4.000%, due 11/01/05, $4,462,496 to be received upon repurchase (Collateralized by $4,623,000 Various U.S. Agency Obligations, 5.300%-6.250%, Market Value plus accrued interest $4,551,358, due 08/11/15-10/27/25) | | 4,462,000 | |
| | | | | |
| | Total Repurchase Agreement | | | |
| | (Cost $4,462,000) | | 4,462,000 | |
| | Securities Lending CollateralCC 4.1% | | | |
4,871,000 | | The Bank of New York Institutional | | | |
| | Cash Reserves Fund | | 4,871,000 | |
| | Total Securities Lending Collateral | | | |
| | (Cost $4,871,000) | | 4,871,000 | |
| | Total Short-Term Investment | | | |
| | (Cost $9,333,000) | | 9,333,000 | |
| | Total Investments In | | | |
| | Securities (Cost | | | |
| | $116,486,960)* | 103.8 | % | | $ | 125,084,131 | |
| | Other Assets and | | | | | |
| | Liabilities-Net | (3.8) | | | (4,549,451 | ) |
| | Net Assets | 100.0 | % | | $ | 120,534,680 | |
| | | | | | | | | |
Securities may have been fair valued in accordance with procedures approved by the Board of Directors/Trustees (Note 2A).
@ Non-income producing security
ADR American Depositary Receipt
GDR Global Depositary Receipt
cc Securities purchased with cash collateral for securities loaned.
# Securities with purchases pursuant to Rule 144A, under the Securities Act of 1933 and may not be resold subject to that rule except to qualified institutional buyers. These securities have been determined to be liquid under the guidelines established by the Funds’ Board of Directors/Trustees.
L Loaned security, a portion or all of the security is on loan at October 31, 2005.
* Cost for federal income tax purposes is $116,636,141. Net unrealized appreciation consists of:
| Gross Unrealized Appreciation | | | | $ | 11,196,043 | |
| Gross Unrealized Depreciation | | | | | (2,748,053 | ) |
| Net Unrealized Appreciation | | | | $ | 8,447,990 | |
Industry | | Percentage of
Net Assets | |
Aerospace/Defense | | 0.5 | % | |
Agriculture | | 3.1 | | |
Auto Manufacturers | | 1.0 | | |
Banks | | 19.2 | | |
Beverages | | 1.8 | | |
Chemicals | | 1.0 | | |
Commercial Services | | 0.9 | | |
Diversified Financial Services | | 5.3 | | |
Electric | | 3.3 | | |
Electrical Components and Equipment | | 2.1 | | |
Electronics | | 0.8 | | |
Energy - Alternate Sources | | 1.0 | | |
Food | | 8.1 | | |
Forest Products and Paper | | 0.6 | | |
Home Builders | | 1.1 | | |
Household Products/Wares | | 0.7 | | |
Insurance | | 4.6 | | |
Internet | | 0.7 | | |
Leisure Time | | 1.6 | | |
Machinery - Diversified | | 1.9 | | |
Media | | 1.8 | | |
Mining | | 3.5 | | |
Miscellaneous Manufacturing | | 0.9 | | |
Oil and Gas | | 10.2 | | |
Pharmaceuticals | | 8.4 | | |
Real Estate | | 0.7 | | |
Retail | | 0.7 | | |
Semiconductors | | 0.5 | | |
Software | | 1.2 | | |
Telecommunications | | 7.9 | | |
Water | | 0.9 | | |
Repurchase Agreement | | 3.7 | | |
Securities Lending Collateral | | 4.1 | | |
Other Assets and Liabilities, Net | | | (3.8 | ) | |
Net Assets | | | 100.0 | % | |
See Accompanying Notes to Financial Statements
95
| PORTFOLIO OF INVESTMENTS |
ING INTERNATIONAL SMALLCAP FUND | AS OF OCTOBER 31, 2005 |
Shares | | | | Value | |
COMMON STOCK: 97.7% | | | |
| | Australia: 8.7% | | | |
108,418 | | Adelaide Bank Ltd. | | $ | 1,011,994 | |
194,824 | | Adelaide Brighton Ltd. | | 308,845 | |
27,801 | | Alesco Corp., Ltd. | | 176,792 | |
48,326 | | Alinta Ltd. | | 390,614 | |
19,419 | | Ansell Ltd. | | 153,274 | |
57,400 | @ | ARC Energy Ltd. | | 80,904 | |
107,566 | | Australian Stock Exchange Ltd. | | 2,317,204 | |
259,801 | L | Babcock & Brown Ltd. | | 3,250,276 | |
14,791 | | Bank of Queensland Ltd. | | 154,510 | |
133,221 | @ | Baycorp Advantage Ltd. | | 321,084 | |
53,297 | | Billabong International Ltd. | | 517,057 | |
1,388,024 | @ | Burns Philp & Co., Ltd. | | 1,184,592 | |
3,572 | | Cochlear Ltd. | | 101,698 | |
128,464 | | Corporate Express Australia Ltd. | | 577,724 | |
396,314 | | DB Rreef Trust | | 395,650 | |
146,417 | | Downer EDI Ltd. | | 667,713 | |
148,417 | | Excel Coal Ltd. | | 748,999 | |
248,421 | | Galileo Shopping America Trust | | 211,789 | |
28,900 | | Healthscope Ltd. | | 123,541 | |
28,463 | | Leighton Holdings Ltd. | | 325,512 | |
133,219 | L | MacArthur Coal Ltd. | | 584,251 | |
946,283 | L | Metcash Ltd. | | 2,876,809 | |
216,079 | | Multiplex Group | | 536,001 | |
243,097 | | OneSteel Ltd. | | 642,925 | |
91,084 | | Pacific Brands Ltd. | | 186,431 | |
195,610 | @ | PMP Ltd. | | 231,345 | |
21,461 | | Ramsay Health Care Ltd. | | 141,330 | |
131,233 | L | Record Investments Ltd. | | 753,667 | |
40,447 | | SFE Corp., Ltd. | | 377,221 | |
373,166 | | Smorgon Steel Group Ltd. | | 412,834 | |
21,296 | | Spotless Group Ltd. | | 79,584 | |
153,917 | @ | Tap Oil Ltd. | | 280,642 | |
20,343 | | UNiTAB Ltd. | | 193,898 | |
85,688 | | United Group Ltd. | | 673,821 | |
60,147 | | WorleyParsons Ltd. | | 441,418 | |
2,226,896 | L | Zinifex Ltd. | | 8,134,163 | |
| | | | 29,566,112 | |
| | Austria: 0.2% | �� | | |
5,442 | | Andritz AG | | 494,135 | |
867 | | Boehler-Uddeholm AG | | 131,422 | |
| | | | 625,557 | |
| | Belgium: 1.1% | | | |
12,633 | | Colruyt SA | | 1,635,460 | |
35,201 | | Compagnie Maritime Belge SA | | 1,171,652 | |
6,088 | | Euronav NV | | 187,393 | |
2,970 | | Omega Pharma SA | | 153,320 | |
3,000 | | Oriflame Cosmetics SA | | 77,398 | |
4,348 | | Umicore | | 434,905 | |
| | | | 3,660,128 | |
| | Canada: 4.0% | | | |
107,900 | | Algoma Steel, Inc. | | 2,113,086 | |
10,500 | | Focus Energy Trust | | 189,606 | |
119,400 | | IPSCO, Inc. | | 8,518,082 | |
5,200 | | Laurentian Bank Of Canada | | 133,797 | |
14,400 | | Northbridge Financial Corp. | | 392,122 | |
7,400 | @,L | Novatel, Inc. | | 211,196 | |
107,000 | @,# | Rona, Inc. | | 1,990,234 | |
3,200 | | Rothmans, Inc. | | 65,435 | |
2,000 | | Vermilion Energy Trust | | 44,322 | |
| | | | 13,657,880 | |
| | China: 0.5% | | | |
1,958,000 | L | Angang New Steel Co., Ltd. | | $ | 1,065,990 | |
218,000 | | Anhui Expressway Co. | | 110,575 | |
300,000 | | Dongfang Electrical Machinery | | | |
| | Co., Ltd. | | 234,722 | |
82,000 | | FU JI Food and Catering | | | |
| | Services Holdings Ltd. | | 93,501 | |
280,000 | | Tingyi Cayman Islands | | | |
| | Holding Corp. | | 95,713 | |
294,000 | | Travelsky Technology Ltd. | | 253,184 | |
| | | | 1,853,685 | |
| | Denmark: 3.8% | | | |
9,400 | | Auriga Industries | | 252,391 | |
130 | | D/S Norden | | 58,492 | |
53,250 | L | D/S Torm A/S | | 2,837,302 | |
13,500 | | DSV A/S | | 1,315,289 | |
304,400 | | GN Store Nord | | 3,667,504 | |
67,400 | @ | Jyske Bank | | 3,383,957 | |
4,450 | | NKT Holding A/S | | 174,336 | |
440 | | Sjaelso Gruppen | | 95,349 | |
10,810 | | Sydbank A/S | | 249,861 | |
11,450 | @ | Topdanmark A/S | | 873,000 | |
| | | | 12,907,481 | |
| | Finland: 0.5% | | | |
12,200 | | Finnair OYJ | | 151,428 | |
95,500 | | Raisio Group PLC | | 244,773 | |
64,400 | | Rautaruukki OYJ | | 1,313,764 | |
| | | | 1,709,965 | |
| | France: 6.5% | | | |
12,955 | @ | Alten | | 376,989 | |
8,745 | | Bourbon SA | | 706,622 | |
19,122 | | CFF Recycling | | 512,795 | |
301,937 | | Elior | | 3,934,976 | |
825 | | Eramet SLN | | 81,769 | |
6,922 | | Etablissements Maurel et Prom | | 127,844 | |
15,742 | @ | GameLoft | | 104,121 | |
7,244 | | Generale de Sante | | 250,716 | |
6,447 | | Iliad SA | | 343,819 | |
3,280 | | Kaufman & Broad SA | | 243,663 | |
82,583 | | Neopost SA | | 7,962,749 | |
12,798 | | Nexans SA | | 601,540 | |
12,050 | | Nexity | | 549,207 | |
36,340 | @ | Oberthur Card Systems SA | | 319,168 | |
5,447 | | Pinguely-Haulotte | | 98,385 | |
4,982 | | Trigano SA | | 210,478 | |
47,034 | @ | UBISOFT Entertainment | | 2,167,769 | |
7,935 | L | Vallourec | | 3,565,335 | |
| | | | 22,157,945 | |
| | Germany: 2.9% | | | |
7,475 | | AWD Holding AG | | 200,401 | |
24,228 | | Balda AG | | 276,885 | |
2,043 | | Deutsche Wohnen AG | | 461,260 | |
25,025 | @ | EM.TV AG | | 141,662 | |
20,201 | @ | Lanxess | | 586,989 | |
2,915 | | Leoni AG | | 91,092 | |
8,321 | | MPC Muenchmeyer Petersen | | | |
| | Capital AG | | 588,702 | |
51,923 | | Salzgitter AG | | 2,286,076 | |
1,948 | | Solarworld AG | | 264,436 | |
34,486 | @ | Techem AG | | 1,371,646 | |
See Accompanying Notes to Financial Statements
96
| PORTFOLIO OF INVESTMENTS |
ING INTERNATIONAL SMALL CAP FUND | AS OF OCTOBER 31, 2005 (CONTINUED) |
Shares | | | | Value | |
| | Germany (continued) | | | |
5,000 | | United Internet AG | | $ | 160,642 | |
39,387 | | Wincor Nixdorf AG | | 3,450,463 | |
| | | | 9,880,254 | |
| | Greece: 1.9% | | | |
110,240 | | Germanos SA | | 1,640,227 | |
9,340 | | Motor Oil Hellas Corinth | | | |
| | Refineries SA | | 201,809 | |
134,600 | | Tsakos Energy Navigation Ltd. | | 4,620,818 | |
| | | | 6,462,854 | |
| | Hong Kong: 4.0% | | | |
128,000 | L | ASM Pacific Technology | | 594,250 | |
5,480,000 | | Cnpc Hong Kong Ltd. | | 1,070,233 | |
1,408,000 | | Emperor International Holdings | | 312,390 | |
194,000 | | Galaxy Entertainment Group Ltd. | | 106,540 | |
202,000 | L | Jinhui Shipping & | | | |
| | Transportation Ltd. | | 708,874 | |
434,000 | | Midland Realty Holdings | | 211,370 | |
878,000 | | New World Development Ltd. | | 1,086,621 | |
777,200 | L | Orient Overseas | | | |
| | International Ltd. | | 2,479,113 | |
1,659,000 | L | Pacific Basin Shipping Ltd. | | 766,969 | |
6,794,000 | | Solomon Systech | | | |
| | International Ltd. | | 2,506,110 | |
38,000 | | Television Broadcasts Ltd. | | | |
8,040,000 | @,L | Titan Petrochemicals Group Ltd. | | 603,700 | |
85,000 | L | Vtech Holdings Ltd. | | 361,826 | |
371,500 | | Wing Hang Bank Ltd. | | 2,542,863 | |
| | | | 13,562,341 | |
| | Ireland: 0.1% | | | |
44,400 | | C&C Group PLC | | 273,978 | |
2,100 | | FBD Holdings PLC | | 77,251 | |
| | | | 351,229 | |
| | Italy: 1.5% | | | |
80,569 | | Aedes S.p.A | | 533,760 | |
82,586 | | Astaldi S.p.A. | | 518,044 | |
220,621 | | Banca Finnat Euramerica S.p.A. | | 325,474 | |
13,172 | | Benetton Group S.p.A. | | 139,061 | |
88,052 | | CIR-Compagnie Industriali | | | |
| | Riunite S.p.A. | | 249,199 | |
194,213 | | Cremonini S.p.A. | | 501,662 | |
24,995 | | Davide Campari-Milano S.p.A. | | 169,500 | |
105,140 | L | Esprinet S.p.A. | | 895,240 | |
42,453 | | Marzotto S.p.A. | | 190,048 | |
119,087 | | Milano Assicurazioni S.p.A. | | 744,469 | |
5,018 | | Pirelli & C Real Estate S.p.A. | | 274,720 | |
41,115 | | Sogefi S.p.A. | | 232,541 | |
1,851 | | Tod’s S.p.A. | | 105,803 | |
35,937 | L | Unipol S.p.A. | | 91,821 | |
4,212 | @ | Valentino Fashion Group S.p.A. | | 98,527 | |
| | | | 5,069,869 | |
| | Japan: 31.2% | | | |
8,900 | L | ABILIT Corp. | | 276,573 | |
7,500 | | Aeon Fantasy Co., Ltd. | | 185,529 | |
42,400 | | Aichi Corp. | | 278,050 | |
26,000 | | Air Water, Inc. | | 237,776 | |
357,600 | | AOC Holdings, Inc. | | 6,616,781 | |
87,000 | L | Asahi Soft Drinks Co., Ltd. | | 967,770 | |
62,000 | | Asics Corp. | | 533,941 | |
24 | | Axell Corp. | | $ | 89,789 | |
95,601 | | Bosch Corp. | | 507,115 | |
15,000 | | Canon Finetech, Inc. | | 301,797 | |
23,000 | | Canon Sales Co., Inc. | | 502,630 | |
24,300 | | Century Leasing System, Inc. | | 325,532 | |
3,000 | @ | Chiba Kogyo Bank Ltd. | | 64,581 | |
961,000 | @ | Chori Co., Ltd. | | 2,244,664 | |
47,000 | L | Cosmo Oil Co., Ltd. | | 228,702 | |
11 | @ | Crayfish Co., Ltd. | | 194,760 | |
711,000 | L | Daiichi Chuo Kisen Kaisha | | 1,571,154 | |
504,200 | @ | DIA Kensetsu Co., Ltd. | | 975,180 | |
59,000 | L | Diamond Lease Co., Ltd. | | 2,739,535 | |
35,800 | L | Eizo Nanao Corp. | | 1,310,469 | |
573 | L | en-japan, Inc. | | 2,440,705 | |
7,700 | | Excel Co., Ltd. | | 171,258 | |
12,400 | | FamilyMart Co., Ltd. | | 368,923 | |
7,500 | | FANCL Corp. | | 366,908 | |
541,000 | | Fuji Fire & Marine Insurance | | | |
| | Co., Ltd. | | 2,147,584 | |
17,700 | | Fuji Machine Manufacturing | | | |
| | Co., Ltd. | | 215,596 | |
209,000 | | Fujikura Ltd. | | 1,352,992 | |
97,500 | | Fujitsu Frontech Ltd. | | 993,310 | |
89,000 | @,L | Fujitsu General Ltd. | | 275,749 | |
222,900 | | Glory Ltd. | | 4,349,516 | |
1,662,500 | @,L | Haseko Corp. | | 5,786,324 | |
12,500 | | Hitachi High-Technologies Corp. | | 290,303 | |
119,000 | | Hodogaya Chemical Co., Ltd. | | 692,569 | |
23,300 | | Hosiden Corp. | | 225,305 | |
3,400 | | HS Securities Co., Ltd. | | 92,036 | |
20,900 | | IBJ Leasing Co., Ltd. | | 407,142 | |
50,000 | @ | Ichiyoshi Securities Co., Ltd | | 536,820 | |
95,000 | L | Iino Kaiun Kaisha Ltd. | | 930,477 | |
38,000 | | Inabata & Co., Ltd. | | 337,794 | |
141,900 | L | Japan General Estate Co., Ltd. | | 2,017,626 | |
69,000 | | Jidosha Buhin Kogyo Co., Ltd | | 424,695 | |
14,900 | | Kanto Auto Works Ltd. | | 217,534 | |
15,200 | | Keihin Corp. | | 338,150 | |
292,000 | | Kenwood Corp. | | 545,410 | |
156,000 | @,L | Kumagai Gumi Co., Ltd. | | 713,062 | |
791,000 | L | Kyoei Tanker Co., Ltd. | | 2,780,467 | |
41,700 | | Makita Corp. | | 968,023 | |
15,100 | L | Mars Engineering Corp. | | 464,153 | |
1,223,000 | | Marubeni Corp. | | 5,732,107 | |
46,000 | | Mitsui-Soko Co., Ltd. | | 256,148 | |
3,900 | | Moshi Moshi Hotline, Inc. | | 369,433 | |
66,000 | | Nabtesco Corp. | | 553,498 | |
231,000 | | Nakayama Steel Works Ltd. | | 1,140,336 | |
11,400 | | NEC Leasing Ltd. | | 229,408 | |
506,000 | L | Nippon Metal Industry Co., Ltd. | | 1,073,424 | |
152,000 | | Nippon Suisan Kaisha Ltd. | | 609,106 | |
367,000 | L | Nippon Yakin Kogyo Co., Ltd. | | 1,372,853 | |
1,004,000 | L | Nissan Diesel Motor Co., Ltd. | | 5,435,411 | |
42,000 | | Nissan Shatai Co., Ltd. | | 293,298 | |
504,000 | | Nisshin Steel Co., Ltd. | | 1,599,985 | |
30,500 | | Nissin Kogyo Co., Ltd. | | 1,363,219 | |
11,900 | | Nitta Corp. | | 160,181 | |
150,000 | | Okuma Corp. | | 1,286,660 | |
374,000 | L | Pacific Metals Co., Ltd. | | 1,629,589 | |
5,900 | | Plenus Co., Ltd. | | 176,190 | |
25,500 | | Point, Inc. | | 1,583,735 | |
38,100 | | Ricoh Leasing Co., Ltd. | | 1,015,224 | |
28 | L | Round One Corp. | | 110,867 | |
25,700 | | Ryohin Keikaku Co., Ltd. | | 1,713,687 | |
See Accompanying Notes to Financial Statements
97
| PORTFOLIO OF INVESTMENTS |
ING INTERNATIONAL SMALLCAP FUND | AS OF OCTOBER 31, 2005 (CONTINUED) |
Shares | | | | Value | |
| | Japan (continued) | | | |
15,000 | | San-Ai Oil Co., Ltd. | | $ | 75,174 | |
79,200 | | Santen Pharmaceutical Co., Ltd. | | 2,021,996 | |
6,000 | | Sanyo Electric Credit Co., Ltd. | | 113,365 | |
9,400 | | Sanyo Shinpan Finance Co., Ltd. | | 684,014 | |
4,100 | | Seijo Corp. | | 112,088 | |
8,600 | | Shinki Co., Ltd. | | 101,436 | |
31,800 | | Shinko Electric Industries | | 1,980,928 | |
396,000 | L | Shinwa Kaiun Kaisha Ltd. | | 1,204,053 | |
46,000 | @ | Sodick Co., Ltd. | | 531,141 | |
13,400 | | STB Leasing Co., Ltd. | | 263,319 | |
22,600 | | Sumisho Lease Co., Ltd. | | 1,074,297 | |
12,000 | | Sumitomo Heavy Industries | | 84,031 | |
16,900 | | Sundrug Co., Ltd. | | 953,937 | |
24,200 | L | Tachi-S Co., Ltd. | | 262,443 | |
58,000 | | Takagi Securities Co., Ltd. | | 239,237 | |
35,400 | L | Tamron Co., Ltd. | | 485,900 | |
87,000 | | TBK Co., Ltd. | | 495,343 | |
96,000 | | Toa Corp. | | 201,570 | |
130,000 | | Toagosei Co., Ltd. | | 659,881 | |
4,900 | | Tocalo Co., Ltd. | | 126,539 | |
47,000 | | Toho Gas Co., Ltd. | | 202,385 | |
26,500 | | Tokyo Leasing Co., Ltd. | | 482,195 | |
3,000 | | Tomen Electronics Corp. | | 73,683 | |
19,000 | @,L | Tomy Co., Ltd. | | 161,850 | |
523,000 | | Tonichi Carlife Group, Inc. | | 3,160,870 | |
191,000 | @,L | Towa Real Estate Development | | | |
| | Co., Ltd. | | 975,389 | |
198,000 | | Toyo Suisan Kaisha Ltd. | | 3,433,584 | |
8,500 | | Trusco Nakayama Corp. | | 194,755 | |
28,000 | | UFJ Central Leasing Co., Ltd. | | 1,550,256 | |
10,100 | | United Arrows Ltd. | | 538,490 | |
158,000 | | Yamato Kogyo Co., Ltd. | | 2,345,515 | |
88,000 | | Yamazen Corp. | | 540,457 | |
20,000 | | Yokogawa Bridge Corp. | | 116,582 | |
25,500 | | Yonekyu Corp. | | 290,348 | |
569,000 | @ | Yuasa Trading Co., Ltd. | | 1,320,930 | |
17,700 | | Yusen Air & Sea Service Co., Ltd. | | 675,048 | |
123 | | Zephyr Co., Ltd. | | 407,148 | |
| | | | 106,447,295 | |
| | Liechtenstein: 0.0% | | | |
1,170 | | Verwalt & Privat-Bank AG | | 184,354 | |
| | | | 184,354 | |
| | Malaysia: 0.2% | | | |
120,400 | @ | Digi.Com BHD | | 222,142 | |
86,300 | | Golden Hope Plantations Bhd | | 95,101 | |
698,600 | | Lion Industries Corp. Bhd | | 150,824 | |
24,700 | @ | Shell Refining Co. | | 68,731 | |
| | | | 536,798 | |
| | Netherlands: 3.6% | | | |
56,678 | | Aalberts Industries NV | | 2,755,483 | |
2,900 | | Athlon Holding NV | | 76,311 | |
52,499 | @ | Axalto Holding NV | | 1,428,504 | |
8,449 | | Boskalis Westminster | | 419,615 | |
7,683 | | Exact Holding NV | | 224,444 | |
25,514 | | Koninklijke BAM Groep NV | | 2,070,584 | |
56,822 | | Nutreco Holding NV | | 2,286,656 | |
65,700 | | Stork NV | | 2,441,438 | |
9,628 | | United Services Group NV | | 310,441 | |
6,212 | | Univar NV | | 249,250 | |
| | | | 12,262,726 | |
| | New Zealand: 0.2% | | | |
126,091 | | Fletcher Building Ltd. | | $ | 693,804 | |
| | | | 693,804 | |
| | Norway: 0.0% | | | |
80,000 | | Acta Holding ASA | | 188,310 | |
| | | | 188,310 | |
| | Papua New Guinea: 1.4% | | | |
1,983,587 | | Oil Search Ltd. | | 4,905,554 | |
| | | | 4,905,554 | |
| | Portugal: 0.1% | | | |
10,300 | @ | Impresa SGPS | | 57,291 | |
15,805 | | Jeronimo Martins | | 227,633 | |
| | | | 284,924 | |
| | Singapore: 0.7% | | | |
1,516,000 | | Hi-P Intl. Ltd. | | 1,254,416 | |
114,000 | | Jurong Technologies Industrial | | | |
| | Corp., Ltd. | | 131,467 | |
322,000 | @ | SembCorp Industries Ltd. | | 512,600 | |
133,000 | L | Singapore Petroleum Co., Ltd. | | 378,280 | |
| | | | 2,276,763 | |
| | South Korea: 3.1% | | | |
805,810 | @ | Curitel Communications, Inc. | | 1,402,653 | |
51,850 | | Dongbu Insurance Co., Ltd. | | 654,745 | |
143,450 | | Dongyang Mechatronics Corp. | | 604,449 | |
18,900 | | Halla Engineering & | | | |
| | Construction Corp. | | 511,593 | |
17,450 | | Hanshin Construction Ltd. | | 256,667 | |
34,870 | L | INI Steel Co. | | 783,613 | |
26,960 | | Korean Petrochemical | | | |
| | Industrial Co. | | 797,238 | |
224,050 | @ | KP Chemical Corp. | | 1,202,154 | |
11,030 | | Kyeryong Construction | | | |
| | Industrial Co., Ltd. | | 273,694 | |
44,384 | | People & Telecommunication | | 382,075 | |
1,099,210 | | S&T Dynamics Co., Ltd. | | 1,537,985 | |
28,830 | | SeAH Steel Corp. | | 1,046,922 | |
35,771 | | SFA Engineering Corp. | | 862,212 | |
439,000 | @ | STX Pan Ocean Co., Ltd. | | 231,727 | |
| | | | 10,547,727 | |
| | Spain: 2.2% | | | |
4,336 | | Abengoa SA | | 71,060 | |
964 | | Cementos Portland | | | |
| | Valderrivas SA | | 73,766 | |
159,555 | L | Fadesa SA | | 5,361,642 | |
8,130 | L | Grupo Empresarial Ence SA | | 257,449 | |
7,442 | | Obrascon Huarte Lain SA | | 104,405 | |
311,074 | @ | Tubacex SA | | 1,304,652 | |
88,700 | L | Uralita SA | | 403,983 | |
| | | | 7,576,957 | |
| | Sweden: 0.9% | | | |
172,800 | L | Eniro AB | | 1,889,611 | |
15,500 | | JM AB | | 644,145 | |
29,400 | @ | Lundin Petroleum AB | | 296,847 | |
20,000 | | Trelleborg AB | | 306,775 | |
| | | | 3,137,378 | |
See Accompanying Notes to Financial Statements
98
| PORTFOLIO OF INVESTMENTS |
ING INTERNATIONAL SMALLCAP FUND | AS OF OCTOBER 31, 2005 (CONTINUED) |
Shares | | | | Value | |
| | Switzerland: 3.4% | | | |
1,490 | @ | Actelion NV | | $ | 167,349 | |
1,339 | | AFG Arbonia-Forster Holding | | 363,399 | |
109,974 | | Baloise Holding Ltd. | | 5,596,095 | |
1,295 | @ | Barry Callebaut AG | | 362,238 | |
4,540 | | Bucher Industries AG | | 362,182 | |
9,597 | | Charles Voegele Holding AG | | 700,112 | |
3,448 | | Geberit AG | | 2,385,861 | |
80 | | Hiestand Holding AG | | 61,785 | |
16,911 | | Phonak Holding AG | | 704,220 | |
815 | | SGS SA | | 599,784 | |
7,707 | | Vontobel Holding AG | | 216,081 | |
| | | | 11,519,106 | |
| | Taiwan: 0.6% | | | |
1,697,440 | | Micro-Star International Co., Ltd. | | 863,993 | |
310,000 | | ProMOS Technologies, Inc. | | 81,610 | |
289,000 | | Quanta Storage, Inc. | | 387,144 | |
656,000 | | U-Ming Marine Transport Corp. | | 649,241 | |
277,000 | | Vanguard International | | | |
| | Semiconductor Corp. | | 180,579 | |
| | | | 2,162,567 | |
| | Thailand: 0.1% | | | |
3,071,600 | | Charoen Pokphand Foods PCL | | 395,644 | |
| | | | 395,644 | |
| | Turkey: 2.9% | | | |
55,760 | | Aksa Akrilik Kimya Sanayii | | 485,033 | |
15,000 | | Anadolu Efes Biracilik Ve Malt | | | |
| | Sanayii AS | | 367,792 | |
181,497 | @ | Ayen Enerji | | 290,724 | |
297,293 | @ | Beko Elektronik | | 484,880 | |
186,274 | | Bolu Cimento Sanayii | | 347,062 | |
276,306 | | Bossa Ticaret Sanayi Isletme | | 231,762 | |
203,000 | @ | Dogan Sriketler Grubu Holdings | | 511,301 | |
310,212 | | Doktas Dokumculuk Ticaret | | 377,783 | |
34,270 | @ | Efes Sinai Yatirim Holding AS | | 347,523 | |
84,919 | | Eregli Demir ve Celik | | | |
| | Fabrikalari TAS | | 459,172 | |
28,916 | @ | Goodyear Lastikleri TAS | | 282,469 | |
746,616 | | Ihlas Holding | | 439,626 | |
64,236 | | Mardin Cimento Sanayii | | 289,192 | |
264,065 | @ | Park Elektrik Madencilik | | | |
| | Sanayi Ve Ticaret AS | | 970,736 | |
443,805 | @ | Petrol Ofisi | | 1,541,582 | |
172,470 | @ | TAT Konserve | | 252,330 | |
32,350 | @ | Turcas Petrolculuk AS | | 202,740 | |
61,364 | | Turk Ekonomi Bankasi AS | | 739,947 | |
274,917 | | Turk Sise Ve Cam Fabrikalari | | 797,080 | |
126,602 | @ | Vestel Elektronik Sanayi | | 443,377 | |
| | | | 9,862,111 | |
| | United Kingdom: 11.3% | | | |
52,740 | | Admiral Group PLC | | 408,132 | |
35,723 | | Aggreko PLC | | 151,261 | |
211,837 | | Amlin PLC | | 832,969 | |
257,529 | @ | Ashtead Group PLC | | 642,837 | |
61,968 | | Body Shop International PLC | | 230,356 | |
33,832 | | Bodycote International | | 135,709 | |
348,206 | | BPB PLC | | 4,504,112 | |
30,287 | | Britannic Group PLC | | 317,500 | |
85,799 | | Burren Energy PLC | | 1,216,282 | |
21,962 | | Cranswick PLC | | 235,102 | |
41,100 | | Dairy Crest Group PLC | | $ | 327,905 | |
93,479 | @ | Dana Petroleum PLC | | 1,365,645 | |
88,334 | | De Vere Group PLC | | 935,994 | |
125,613 | | First Choice Holidays PLC | | 434,383 | |
34,500 | @ | Gyrus Group PLC | | 195,198 | |
919,865 | | HMV Group PLC | | 3,065,301 | |
47,900 | | Inchcape PLC | | 1,748,659 | |
43,900 | | Intertek Group PLC | | 553,956 | |
976,048 | @,L | Jazztel PLC | | 1,135,061 | |
53,697 | | London Stock Exchange PLC | | 538,568 | |
133,703 | | Man Group PLC | | 3,647,127 | |
176,367 | | Mcbride PLC | | 474,769 | |
71,677 | | Michael Page International PLC | | 293,180 | |
56,010 | @ | NETeller PLC | | 683,799 | |
22,041 | | Northgate PLC | | 390,282 | |
110,623 | | Paragon Group of | | | |
| | Companies LLC | | 997,880 | |
686,950 | | Pendragon PLC | | 4,649,938 | |
203,829 | | SIG PLC | | 2,455,451 | |
217,200 | | Somerfield PLC | | 749,077 | |
249,600 | | Sportingbet PLC | | 1,326,037 | |
48,586 | | Stanley Leisure PLC | | 522,338 | |
14,550 | | Stolt-Nielsen SA | | 519,041 | |
399,772 | | Taylor Woodrow PLC | | 2,216,705 | |
57,039 | | TT electronics PLC | | 148,303 | |
20,988 | | Ultra Electronics Holdings | | 327,073 | |
| | | | 38,375,930 | |
| | Venezuela: 0.1% | | | |
21,600 | | Cia Anonima Nacional | | | |
| | Telefonos de Venezuela ADR | | 278,640 | |
| | | | 278,640 | |
| | Total Common Stock | | | |
| | (Cost $292,540,849) | | 333,101,888 | |
PREFERRED STOCK: 0.2% | | | |
| | Italy: 0.2% | | | |
41,454 | | Instituto Finanziario Industriale | | | |
| | S.p.A. | | 655,884 | |
| | | | 655,884 | |
| | Total Preferred Stock | | | |
| | (Cost $612,281) | | 655,884 | |
RIGHTS: 0.0% | | | |
| | Australia: 0.0% | | | |
3,612 | | Healthscope Ltd. | | 1,619 | |
| | | | 1,619 | |
| | Total Rights (Cost $-) | | 1,619 | |
| | Total Long-Term Investments | | | |
| | (Cost $293,153,130) | | 333,759,396 | |
See Accompanying Notes to Financial Statements
99
| PORTFOLIO OF INVESTMENTS |
ING INTERNATIONAL SMALLCAP FUND | AS OF OCTOBER 31, 2005 (CONTINUED) |
Shares | | | | Value | |
SHORT-TERM INVESTMENTS: 16.9% | | | |
| | Securities Lending CollateralCC 16.9% | | | |
$ | 57,748,000 | | The Bank of New York Institutional | | | |
| | Cash Reserves Fund | | $ | 57,748,000 | |
| | Total Short-Term Investments | | | |
| | (Cost $57,748,000) | | 57,748,000 | |
| | Total Investments In | | | |
| | Securities (Cost | | | |
| | $350,901,130)* | 114.8 | % | | $ | 391,507,396 | |
| | Other Assets and | | | | | |
| | Liabilities-Net | (14.8 | ) | | (50,497,796 | ) |
| | Net Assets | 100.0 | % | | $ | 341,009,600 | |
| | | | | | | | | |
Securities may have been fair valued in accordance with procedures approved by the Board of Directors/Trustees (Note 2A).
@ Non-income producing security
ADR American Depositary Receipt
cc Securities purchased with cash collateral for securities loaned.
# Securities with purchases pursuant to Rule 144A, under the Securities Act of 1933 and may not be resold subject to that rule except to qualified institutional buyers. These securities have been determined to be liquid under the guidelines established by the Funds’ Board of Directors/Trustees.
L Loaned security, a portion or all of the security is on loan at October 31, 2005.
* Cost for federal income tax purposes is $351,405,893. Net unrealized appreciation consists of:
| Gross Unrealized Appreciation | | | | $ | 56,506,417 | |
| Gross Unrealized Depreciation | | | | | (16,404,914 | ) |
| Net Unrealized Appreciation | | | | $ | 40,101,503 | |
Industry | | Percentage of
Net Assets | |
Advertising | | 0.1 | % | |
Agriculture | | 0.2 | | |
Airlines | | 0.0 | | |
Apparel | | 0.4 | | |
Auto Manufacturers | | 1.7 | | |
Auto Parts and Equipment | | 1.8 | | |
Banks | | 2.6 | | |
Beverages | | 0.6 | | |
Building Materials | | 3.4 | | |
Chemicals | | 1.6 | | |
Coal | | 0.4 | | |
Commercial Services | | 1.1 | | |
Computers | | 2.0 | | |
Cosmetics/Personal Care | | 0.2 | | |
Distribution/Wholesale | | 4.1 | | |
Diversified Financial Services | | 6.9 | | |
Electric | | 0.4 | | |
Electrical Components and Equipment | | 0.8 | | |
Electronics | | 1.5 | | |
Energy - Alternate Sources | | 0.1 | | |
Engineering and Construction | | 2.6 | | |
Entertainment | | 0.6 | | |
Food | | 4.5 | | |
Food Service | | 1.2 | | |
Forest Products and Paper | | 0.1 | | |
Gas | | 0.2 | | |
Hand Machines/Tools | | 0.3 | | |
Healthcare - Products | | 0.3 | | |
Healthcare - Services | | 0.1 | % | |
Holding Companies - Diversification | | 0.5 | | |
Home Builders | | 2.5 | | |
Home Furnishings | | 0.5 | | |
Housewares | | 0.6 | | |
Insurance | | 3.5 | | |
Internet | | 0.9 | | |
Iron/Steel | | 7.6 | | |
Leisure Time | | 0.4 | | |
Lodging | | 0.3 | | |
Machinery - Construction and Mining | | 0.1 | | |
Machinery - Diversified | | 1.9 | | |
Media | | 0.8 | | |
Metal Fabricate/Hardware | | 2.1 | | |
Mining | | 2.9 | | |
Miscellaneous Manufacturing | | 3.0 | | |
Office/Business Equipment | | 2.4 | | |
Oil and Gas | | 5.0 | | |
Oil and Gas Services | | 0.4 | | |
Pharmaceuticals | | 0.7 | | |
Real Estate | | 3.9 | | |
Retail | | 6.6 | | |
Semiconductors | | 1.6 | | |
Software | | 0.8 | | |
Storage/Warehousing | | 0.1 | | |
Telecommunications | | 2.2 | | |
Textiles | | 0.1 | | |
Toys/Games/Hobbies | | 0.0 | | |
Transportation | | 6.7 | | |
Securities Lending Collateral | | 16.9 | | |
Other Assets and Liabilities, Net | | | (14.8 | ) | |
Net Assets | | | 100.0 | % | |
See Accompanying Notes to Financial Statements
100
| | PORTFOLIO OF INVESTMENTS |
ING INTERNATIONAL VALUE FUND | | AS OF OCTOBER 31, 2005 |
Shares | | | | Value | |
COMMON STOCK: 99.0% | | | |
| | Belgium: 0.9% | | | |
959,210 | | Interbrew | | $ | 38,296,431 | |
| | | | 38,296,431 | |
| | Brazil: 4.3% | | | |
9,510,883 | | Centrais Eletricas | | | |
| | Brasileiras SA ADR | | 83,189,790 | |
3,741,386 | @,L | Contax Participacoes SA ADR | | 2,823,998 | |
179,388 | L | Tele Centro Oeste Celular | | | |
| | Participacoes SA ADR | | 1,623,461 | |
13,898 | L | Tele Leste Celular | | | |
| | Participacoes SA ADR | | 85,056 | |
2,532,786 | L | Tele Norte Leste | | | |
| | Participacoes SA ADR | | 44,830,312 | |
1,208,600 | L | Telecomunicacoes | | | |
| | Brasileiras SA ADR | | 40,270,552 | |
169,474 | @,L | Telesp Celular | | | |
| | Participacoes SA ADR | | 618,580 | |
111,928 | L | Tim Participacoes SA ADR | | 2,268,781 | |
| | | | 175,710,530 | |
| | Canada: 0.6% | | | |
12,138,000 | | Bombardier, Inc. | | 25,623,009 | |
| | | | 25,623,009 | |
| | France: 5.1% | | | |
7,228,100 | @ | Alcatel SA | | 84,894,071 | |
610,400 | | Carrefour SA | | 27,131,872 | |
2,404,100 | | France Telecom SA | | 62,465,838 | |
422,650 | | Sanofi-Synthelabo SA | | 33,841,817 | |
| | | | 208,333,598 | |
| | Germany: 11.4% | | | |
2,160,893 | | Commerzbank AG | | 56,439,691 | |
2,268,600 | | DaimlerChrysler AG | | 113,349,315 | |
6,906,200 | | Deutsche Telekom AG | | 122,066,408 | |
1,150,000 | | Heidelberger Druckmaschinen | | 36,514,810 | |
411,200 | | Hypo Real Estate Holding | | 19,825,718 | |
326,500 | | Muenchener | | | |
| | Rueckversicherungs AG | | 38,310,355 | |
359,298 | | Schering AG | | 22,141,269 | |
981,217 | L | Volkswagen AG | | 53,554,334 | |
| | | | 462,201,900 | |
| | Hong Kong: 0.6% | | | |
1,624,636 | | Jardine Matheson | | | |
| | Holdings Ltd. | | 25,701,314 | |
| | | | 25,701,314 | |
| | Italy: 3.5% | | | |
10,705,782 | | Banca Intesa S.p.A. | | 49,976,404 | |
10,329,085 | | Telecom Italia S.p.A. | | 29,876,874 | |
11,513,600 | | UniCredito Italiano S.p.A. | | 63,832,363 | |
| | | | 143,685,641 | |
| | Japan: 26.2% | | | |
3,873,136 | | Daiichi Sankyo Co., Ltd. | | 70,205,893 | |
517,800 | | Fuji Photo Film Co., Ltd. | | 16,476,619 | |
12,859,700 | | Hitachi Ltd. | | 79,190,162 | |
4,749 | | Japan Tobacco, Inc. | | 75,081,036 | |
4,914,000 | | Matsushita Electric | | | |
| | Industrial Co., Ltd. | | 90,055,162 | |
5,925 | | Millea Holdings, Inc. | | 107,195,573 | |
26,907,000 | | Mitsubishi Heavy | | | |
| | Industries Ltd. | | 101,677,662 | |
8,334 | | Mitsubishi Tokyo Financial | | | |
| | Group, Inc. | | $ | 104,749,968 | |
4,932,000 | | Mitsui Sumitomo | | | |
| | Insurance Co., Ltd. | | 63,156,323 | |
13,125 | | Nippon Telegraph & | | | |
| | Telephone Corp. | | 62,740,348 | |
1,049,000 | | Ono Pharmaceutical Co., Ltd. | | 46,696,989 | |
2,592,400 | | Sony Corp. | | 84,696,904 | |
9,029 | | Sumitomo Mitsui Financial | | | |
| | Group, Inc. | | 83,390,412 | |
509,000 | | TDK Corp. | | 34,321,149 | |
1,153,800 | | Yamanouchi | | | |
| | Pharmaceutical Co., Ltd. | | 41,214,893 | |
| | | | 1,060,849,093 | |
| | Mexico: 1.5% | | | |
2,942,320 | L | Telefonos de Mexico SA de | | | |
| | CV ADR | | 59,376,018 | |
| | | | 59,376,018 | |
| | Netherlands: 8.8% | | | |
5,693,688 | | Aegon NV | | 85,815,472 | |
1,737,200 | | Akzo Nobel NV | | 75,048,930 | |
9,907,141 | @ | Koninklijke Ahold NV | | 69,090,899 | |
1,188,700 | | Unilever NV | | 83,594,530 | |
2,303,184 | | Wolters Kluwer NV | | 42,707,127 | |
| | | | 356,256,958 | |
| | New Zealand: 1.4% | | | |
13,335,944 | | Telecom Corp. of | | | |
| | New Zealand Ltd. | | 54,510,038 | |
| | | | 54,510,038 | |
| | Portugal: 1.5% | | | |
6,709,676 | | Portugal Telecom SGPS SA | | 60,634,279 | |
| | | | 60,634,279 | |
| | Singapore: 3.3% | | | |
3,652,191 | | DBS Group Holdings Ltd. | | 33,028,164 | |
6,060,800 | # | DBS Group Holdings Ltd. ADR | | 54,690,235 | |
12,232,800 | | Oversea-Chinese Banking Corp. | | 45,495,324 | |
| | | | 133,213,723 | |
| | South Korea: 3.6% | | | |
1,463,610 | | Korea Electric Power Corp. | | 47,878,231 | |
2,745,880 | | Korea Electric Power | | | |
| | Corp. ADR | | 44,840,220 | |
183,200 | | KT Corp. | | 7,420,570 | |
2,192,310 | | KT Corp. ADR | | 47,244,281 | |
| | | | 147,383,302 | |
| | Spain: 4.6% | | | |
1,816,233 | | Banco Bilbao Vizcaya | | | |
| | Argentaria SA | | 32,009,277 | |
3,107,600 | | Banco Santander Central | | | |
| | Hispano SA | | 39,549,526 | |
7,078,302 | | Telefonica SA | | 112,920,298 | |
| | | | 184,479,101 | |
| | Switzerland: 6.3% | | | |
568,600 | | Nestle SA | | 169,075,402 | |
91,700 | | Swisscom AG | | 30,122,902 | |
328,715 | @ | Zurich Financial Services AG | | 55,975,744 | |
| | | | 255,174,048 | |
See Accompanying Notes to Financial Statements
101
| | PORTFOLIO OF INVESTMENTS |
ING INTERNATIONAL VALUE FUND | | AS OF OCTOBER 31, 2005 (CONTINUED) |
Shares | | | | Value | |
| | United Kingdom: 15.1% | | | |
12,269,781 | | BT Group PLC | | $ | 46,195,543 | |
48,322,582 | | Corus Group PLC | | 40,940,474 | |
3,882,800 | | GlaxoSmithKline PLC | | 101,004,681 | |
6,054,090 | | Imperial Chemical | | | |
| | Industries PLC | | 30,835,153 | |
78,261,262 | @ | Invensys PLC | | 18,005,194 | |
10,163,000 | | ITV PLC | | 18,720,353 | |
8,159,200 | | J Sainsbury Plc | | 40,312,262 | |
11,046,451 | | Marks & Spencer Group PLC | | 81,675,631 | |
32,163,031 | | Morrison WM Supermarkets | | 93,136,495 | |
35,348,000 | | Royal & Sun Alliance | | | |
| | Insurance Group | | 60,185,375 | |
8,253,700 | | Unilever PLC | | 83,517,435 | |
| | | | 614,528,596 | |
| | Venezuela: 0.4% | | | |
1,216,822 | | Cia Anonima Nacional | | | |
| | Telefonos de Venezuela ADR | | 15,697,004 | |
| | | | 15,697,004 | |
| | Total Common Stock | | | |
| | (Cost $3,467,551,238) | | 4,021,654,583 | |
| | | | | | |
Principal
Amount | | | | Value | |
| | | | |
SHORT-TERM INVESTMENTS: 2.6% | | | |
| | | |
| Securities Lending CollateralCC 2.6% | | | |
$ | 104,511,000 | The Bank of New York Institutional | | | |
| Cash Reserves Fund | | 104,511,000 | |
| Total Short-Term Investments | | | |
| (Cost $104,511,000) | | 104,511,000 | |
| | | | |
| Total Investments In | | | | | |
| Securities (Cost | | | | | |
| $3,572,062,238)* | 101.7 | % | | $ | 4,126,165,583 | |
| Other Assets and | | | | | |
| Liabilities-Net | (1.7 | ) | | (69,549,673 | ) |
| Net Assets | 100.0 | % | | $ | 4,056,615,910 | |
| | | | | | | | | |
Securities may have been fair valued in accordance with procedures approved by the Board of Directors/Trustees (Note 2A).
@ Non-income producing security
ADR American Depositary Receipt
cc Securities purchased with cash collateral for securities loaned.
# Securities with purchases pursuant to Rule 144A, under the Securities Act of 1933 and may not be resold subject to that rule except to qualified institutional buyers. These securities have been determined to be liquid under the guidelines established by the Funds’ Board of Directors/Trustees.
L Loaned security, a portion or all of the security is on loan at October 31, 2005.
* Cost for federal income tax purposes is $3,580,831,246. Net unrealized appreciation consists of:
| Gross Unrealized Appreciation | | | | $ | 793,022,459 | |
| Gross Unrealized Depreciation | | | | (247,688,122 | ) |
| Net Unrealized Appreciation | | | | $ | 545,334,337 | |
| | Percentage of | |
Industry | | Net Assets | |
Agriculture | | 1.9% | |
Auto Manufacturers | | 4.1 | |
Banks | | 14.4 | |
Beverages | | 0.9 | |
Chemicals | | 2.6 | |
Computers | | 0.9 | |
Electric | | 4.3 | |
Electrical Components and Equipment | | 2.0 | |
Food | | 13.9 | |
Holding Companies - Diversified | | 0.6 | |
Home Furnishings | | 4.3 | |
Insurance | | 10.1 | |
Iron/Steel | | 1.0 | |
Machinery - Diversified | | 0.9 | |
Media | | 1.5 | |
Miscellaneous Manufacturing | | 4.0 | |
Pharmaceuticals | | 7.8 | |
Retail | | 2.0 | |
Telecommunications | | 21.9 | |
Securities Lending Collateral | | 2.6 | |
Other Assets and Liabilities, Net | | (1.7) | |
Net Assets | | 100.0% | |
See Accompanying Notes to Financial Statements
102
| | PORTFOLIO OF INVESTMENTS |
ING INTERNATIONAL VALUE CHOICE FUND | | AS OF OCTOBER 31, 2005 |
Shares | | | | Value | |
COMMON STOCK: 85.3% | | | |
| | Australia: 1.8% | | | |
38,550 | | Alumina Ltd. | | $ | 166,737 | |
| | | | 166,737 | |
| | Belgium: 1.7% | | | |
4,850 | | Belgacom SA | | 162,459 | |
| | | | 162,459 | |
| | Canada: 5.4% | | | |
8,700 | @ | Barrick Gold Corp. | | 219,675 | |
2,500 | @ | OPTI Canada, Inc. | | 77,720 | |
4,300 | | Placer Dome, Inc. | | 85,785 | |
2,250 | | Suncor Energy, Inc. | | 120,668 | |
| | | | 503,848 | |
| | Finland: 1.7% | | | |
12,600 | | Stora Enso OYJ | | 161,099 | |
| | | | 161,099 | |
| | France: 3.6% | | | |
430 | | Areva | | 194,712 | |
3,330 | | Thales SA | | 143,372 | |
| | | | 338,084 | |
| | Germany: 1.8% | | | |
5,900 | @ | Premiere AG | | 170,096 | |
| | | | 170,096 | |
| | Italy: 3.4% | | | |
6,050 | | ENI-Ente Nazionale Idrocarburi S.p.A. | | 161,853 | |
64,800 | | Telecom Italia S.p.A. | | 156,619 | |
| | | | 318,472 | |
| | Japan: 30.0% | | | |
30 | | Central Japan Railway Co. | | 255,149 | |
15,000 | | Dai Nippon Printing Co., Ltd. | | 245,475 | |
12,990 | | Daiichi Sankyo Co., Ltd. | | 235,462 | |
6,600 | | Fuji Photo Film Co., Ltd. | | 210,015 | |
14,000 | | Kirin Brewery Co., Ltd. | | 155,730 | |
6,600 | | Makita Corp. | | 153,212 | |
9,000 | | Matsushita Electric Industrial Co., Ltd. | | 164,936 | |
3,700 | | NEC Electronics Corp. | | 99,273 | |
2,000 | | Nintendo Co., Ltd. | | 224,281 | |
6,050 | | Nippon Telegraph & | | | |
| | Telephone Corp. ADR | | 144,656 | |
21,000 | | Sekisui House Ltd. | | 261,531 | |
16,000 | | Shiseido Co., Ltd. | | 256,669 | |
3,250 | | Takefuji Corp. | | 227,460 | |
11,000 | | Wacoal Corp. | | 155,906 | |
| | | | 2,789,755 | |
| | Netherlands: 6.0% | | | |
9,486 | | Aegon NV | | 142,973 | |
3,832 | | Royal Dutch Shell PLC ADR | | 250,651 | |
6,900 | | TPG NV | | 162,623 | |
| | | | 556,247 | |
| | Papua New Guinea: 1.1% | | | |
79,400 | | Lihir Gold Ltd. | | 102,684 | |
| | | | 102,684 | |
| | Portugal: 2.7% | | | |
90,340 | | Electricidade de Portugal SA | | $ | 255,476 | |
| | | | 255,476 | |
| | South Africa: 2.5% | | | |
3,920 | | Anglogold Ashanti Ltd. ADR | | 153,272 | |
750 | | Impala Platinum Holdings Ltd. | | 82,258 | |
| | | | 235,530 | |
| | South Korea: 5.0% | | | |
9,400 | | Korea Electric Power Corp. ADR | | 153,502 | |
14,380 | | KT Corp. ADR | | 309,889 | |
| | | | 463,391 | |
| | Switzerland: 3.0% | | | |
510 | | Swisscom AG | | 167,532 | |
4,920 | | Xstrata PLC | | 112,735 | |
| | | | 280,267 | |
| | Taiwan: 3.5% | | | |
19,050 | | Chunghwa Telecom Co., Ltd. ADR | | 329,946 | |
| | | | 329,946 | |
| | United Kingdom: 12.1% | | | |
5,500 | | Anglo American PLC | | 162,822 | |
47,820 | | J Sainsbury PLC | | 236,265 | |
7,040 | | Lonmin PLC | | 162,808 | |
44,800 | | Misys PLC | | 162,692 | |
58,950 | | Northern Foods PLC | | 157,096 | |
22,850 | | United Utilities PLC | | 252,329 | |
| | | | 1,134,012 | |
| | Total Common Stock | | | |
| | (Cost $7,711,615) | | 7,968,103 | |
| | Total Investments In | | | | | |
| | Securities (Cost | | | | | |
| | $7,711,615)* | 85.3 | % | | $ | 7,968,103 | |
| | Other Assets and | | | | | |
| | Liabilities-Net | 14.7 | | | 1,370,478 | |
| | Net Assets | 100.0 | % | | $ | 9,338,581 | |
Securities may have been fair valued in accordance with procedures approved by the Board of Directors/Trustees (Note 2A).
@ Non-income producing security
ADR American Depositary Receipt
* Cost for federal income tax purposes is $7,723,166. Net unrealized appreciation consists of:
| | Gross Unrealized Appreciation | | | | $ | 531,079 | |
| | Gross Unrealized Depreciation | | | | (286,142 | ) |
| | Net Unrealized Appreciation | | | | $ | 244,937 | |
See Accompanying Notes to Financial Statements
103
| | PORTFOLIO OF INVESTMENTS |
ING INTERNATIONAL VALUE CHOICE FUND | | AS OF OCTOBER 31, 2005 (CONTINUED) |
Industry | | Percentage of
Net Assets | |
Aerospace/Defense | | 1.5 | % | |
Apparel | | 1.7 | | |
Beverages | | 1.7 | | |
Commercial Services | | 2.6 | | |
Cosmetics/Personal Care | | 2.8 | | |
Diversified Financial Services | | 2.4 | | |
Electric | | 4.4 | | |
Energy - Alternate Sources | | 2.1 | | |
Food | | 4.2 | | |
Forest Products and Paper | | 1.7 | | |
Hand/Machine Tools | | 1.6 | | |
Home Builders | | 2.8 | | |
Home Furnishings | | 1.8 | | |
Insurance | | 1.5 | | |
Media | | 1.8 | | |
Mining | | 13.4 | | |
Miscellaneous Manufacturing | | 2.3 | | |
Oil and Gas | | 6.5 | | |
Pharmaceuticals | | 2.5 | | |
Semiconductors | | 1.1 | | |
Software | | 1.7 | | |
Telecommunications | | 13.6 | | |
Toys/Games/Hobbies | | 2.4 | | |
Transportation | | 4.5 | | |
Water | | 2.7 | | |
Other Assets and Liabilities, Net | | 14.7 | | |
Net Assets | | 100.0 | % | |
See Accompanying Notes to Financial Statements
104
| | PORTFOLIO OF INVESTMENTS |
ING PRECIOUS METALS FUND | | AS OF OCTOBER 31, 2005 |
Shares | | | | Value | |
COMMON STOCK: 98.0% | | | |
| | | | | |
| | Australia: 3.2% | | | |
2,000,000 | @ | Ballarat Goldfields NL | | $ | 462,374 | |
95,000 | | Kingsgate Consolidated Ltd. | | 290,743 | |
152,800 | | Newcrest Mining Ltd. | | 2,078,166 | |
| | | | 2,831,283 | |
| | Canada: 67.2% | | | |
276,900 | | Agnico-Eagle Mines Ltd. | | 3,782,454 | |
350,000 | @ | Alamos Gold, Inc. | | 1,353,058 | |
91,600 | | Barrick Gold Corp. | | 2,312,900 | |
454,200 | @ | Bema Gold Corp. | | 1,139,605 | |
118,100 | @,# | Centerra Gold, Inc. | | 2,267,785 | |
482,550 | @ | Eldorado Gold Corp. | | 1,476,839 | |
448,600 | @ | Gabriel Resources Ltd. | | 893,739 | |
512,200 | @ | Gammon Lake Resources, Inc. | | 3,986,263 | |
207,300 | @ | Glamis Gold Ltd. | | 4,398,906 | |
209,725 | | GoldCorp, Inc. | | 4,204,956 | |
500,000 | @ | Guinor Gold Corp. | | 589,208 | |
279,800 | | Iamgold Corp. | | 2,001,158 | |
220,000 | @ | Ivanhoe Mines Ltd./CA | | 1,647,800 | |
935,000 | @ | Kensington Resources Ltd. | | 3,622,526 | |
495,200 | @ | Kinross Gold Corp. | | 3,456,496 | |
17,500 | @ | Major Drilling Group Intl. | | 247,467 | |
167,600 | @ | Meridian Gold, Inc. | | 3,147,251 | |
127,300 | @ | North Atlantic Resources Ltd. | | 404,709 | |
152,800 | @ | PAN American Silver Corp. | | 2,427,992 | |
237,900 | | Placer Dome, Inc. | | 4,746,105 | |
4,075,300 | @ | Queenstake Resources Ltd | | 760,092 | |
1,155,400 | @ | RIO Narcea Gold Mines Ltd. | | 1,390,927 | |
363,600 | @ | SEMAFO, Inc. | | 462,380 | |
800,000 | @ | Shore Gold, Inc. | | 4,869,654 | |
130,700 | @ | Virginia Gold Mines, Inc. | | 712,476 | |
650,000 | @ | Yamana Gold, Inc. | | 2,424,653 | |
| | | | 58,727,399 | |
| | Jersey: 3.8% | | | |
242,800 | @ | Randgold Resources Ltd. ADR | | 3,306,936 | |
| | | | 3,306,936 | |
| | Papua New Guinea: 3.5% | | | |
2,373,200 | @ | Lihir Gold Ltd. | | 3,069,140 | |
| | | | 3,069,140 | |
| | Peru: 3.5% | | | |
119,700 | | Cia de Minas Buenaventura | | | |
| | SA ADR | | 3,084,669 | |
| | | | 3,084,669 | |
| | South Africa: 3.4% | | | |
29,100 | | Anglogold Ashanti Ltd. ADR | | 1,137,810 | |
66,100 | | Gold Fields Ltd. ADR | | 872,520 | |
87,500 | @ | Harmony Gold Mining Co. Ltd. ADR | | 914,375 | |
| | | | 2,924,705 | |
| | United Kingdom: 2.4% | | | |
310,430 | | Highland Gold Mining Ltd. | | 1,230,967 | |
19,440 | | Lonmin PLC | | 449,571 | |
2,900 | | Rio Tinto PLC ADR | | 442,598 | |
| | | | 2,123,136 | |
| | United States: 11.0% | | | |
96,200 | | Freeport-McMoRan Copper & | | | |
| | Gold, Inc. | | $ | 4,754,204 | |
82,500 | | Newmont Mining Corp. | | 3,514,500 | |
11,100 | | Phelps Dodge Corp. | | 1,337,216 | |
| | | | 9,605,920 | |
| | Total Common Stock | | | |
| | (Cost $69,116,566) | | 85,673,188 | |
Principal
Amount | | | | Value | |
| | | | |
SHORT-TERM INVESTMENTS: 2.1% | | | |
| | | |
| Repurchase Agreement: 2.1% | | | |
$ | 1,881,000 | Morgan Stanley Repurchase | | | |
| Agreement dated 10/31/05, 4.000%, | | | |
| due 11/01/05, $1,881,209 to be | | | |
| received upon repurchase | | | |
| (Collateralized by $1,925,000 | | | |
| Federal Home Loan Mortgage | | | |
| Corporation, 4.500%, Market Value | | | |
| plus accrued Interest $1,927,612, | | | |
| due 05/21/07) | | 1,881,000 | |
| Total Short-Term Investments: | | | |
| (Cost $1,881,000) | | 1,881,000 | |
| Total Investments in | | | |
| Securities (Cost | | | |
| $70,997,566)* | 100.1 | % | | $ | 87,554,188 | |
| Other Assets and | | | | | |
| Liabilities-Net | (0.1 | ) | | (113,419 | ) |
| Net Assets | 100.0 | % | | $ | 87,440,769 | |
| | | | | | | | | |
Securities may be fair valued in accordance with procedures approved by the Board of Directors/Trustees (Note 2A).
@ Non-income producing security
ADR American Depositary Receipt
# Securities with purchases pursuant to Rule 144A, under the Securities Act of 1933 and may not be resold subject to that rule except to qualified institutional buyers. These securities have been determined to be liquid under the guidelines established by the Funds’ Board of Directors/Trustees.
* Cost for federal income tax purposes is $72,632,504. Net unrealized appreciation consists of:
| | Gross Unrealized Appreciation | | | | $ | 17,700,851 | |
| | Gross Unrealized Depreciation | | | | (2,779,167 | ) |
| | Net Unrealized Appreciation | | | | $ | 14,921,684 | |
| | Percentage of | |
Industry | | Net Assets | |
Diamonds/Precious Stones | | 5.6% | |
Diversified Minerals | | 4.1 | |
Gold Mining | | 69.7 | |
Metal - Copper | | 1.5 | |
Metal - Diversified | | 7.8 | |
Mining Services | | 0.3 | |
Platinum | | 0.5 | |
Precious Metals | | 5.6 | |
Repurchase Agreement | | 2.2 | |
Silver Mining | | 2.8 | |
Other Assets and Liabilities, Net | | (0.1) | |
Net Assets | | 100.0% | |
See Accompanying Notes to Financial Statements
105
| | PORTFOLIO OF INVESTMENTS |
ING RUSSIA FUND | | AS OF OCTOBER 31, 2005 |
Shares | | | | Value | |
COMMON STOCK: 84.9% | | | |
| | Banks: 12.6% | | | |
36,000 | L | OTP Bank Rt. GDR | | $ | 2,576,275 | |
3,000,000 | @ | Promstroibank St. Petersburg | | 3,300,000 | |
32,200 | | Sberbank RF | | 28,497,000 | |
| | | | 34,373,275 | |
| | Beverages: 0.7% | | | |
56,800 | @,# | Efes Breweries Intl. NV GDR | | 1,796,584 | |
| | | | 1,796,584 | |
| | Cosmetics/Personal Care: 1.3% | | | |
106,900 | | Kalina | | 3,474,250 | |
| | | | 3,474,250 | |
| | Electric: 4.0% | | | |
2,842,200 | I | Konakovskaya Gres | | 2,501,136 | |
23,685,200 | | Unified Energy System | | 8,360,876 | |
| | | | 10,862,012 | |
| | Internet: 1.5% | | | |
748,500 | @ | RBC Information Systems | | 4,041,900 | |
| | | | 4,041,900 | |
| | Investment Companies: 5.0% | | | |
240,219 | @,I | Novy Neft II Ltd. | | 5,409,131 | |
142,452 | @,I | Novy Neft Ltd. | | 4,497,922 | |
2,959,700 | @ | RenShares Utilites Ltd. - | | | |
| | RenGen class | | 3,758,819 | |
| | | | 13,665,872 | |
| | Iron/Steel: 3.7% | | | |
369,500 | | Cherepovets MK Severstal | | 3,233,125 | |
142,100 | L | Mechel Steel Group OAO ADR | | 4,162,109 | |
1,894,800 | | Novolipetsk Steel Corp. | | 2,548,506 | |
| | | | 9,943,740 | |
| | Metal Fabricate/Hardware: 1.4% | | | |
26,000 | F | Verkhnaya Salda Metallurgical | | | |
| | Production Association | | 3,865,680 | |
| | | | 3,865,680 | |
| | Mining: 11.1% | | | |
217,900 | @ | Celtic Resources Holdings PLC | | 805,227 | |
397,900 | L | MMC Norilsk Nickel ADR | | 29,245,650 | |
| | | | 30,050,877 | |
| | Oil and Gas: 31.6% | | | |
890,600 | | LUKOIL ADR | | 48,983,000 | |
1,700,000 | | Sibneft | | 6,052,000 | |
260,500 | L | Surgutneftegaz ADR | | 12,243,500 | |
180,000 | L | Tatneft ADR | | 11,439,000 | |
1,231,600 | @ | Tyumen Oil Co. | | 7,512,760 | |
| | | | 86,230,260 | |
| | Telecommunications: 12.0% | | | |
7,342,400 | | Central Telecommunications Co. | | 2,900,248 | |
183,900 | L | Mobile Telesystems OJSC ADR | | 6,802,461 | |
127,900 | | Moscow City Telephone Network | | 2,110,350 | |
947,400 | | Rostelecom | | 1,975,329 | |
66,318,600 | | Sibirtelecom | | 4,125,017 | |
90,003,700 | | Uralsvyazinform | | $ | 3,132,129 | |
154,200 | @ | Vimpel-Communications ADR | | 6,168,000 | |
1,477,800 | | VolgaTelecom | | 5,349,636 | |
| | | | 32,563,170 | |
| | Total Common Stock | | | |
| | (Cost $145,831,897) | | 230,867,620 | |
| | | | | |
PREFERRED STOCK: 9.1% | | | |
| | Electric: 0.7% | | | |
5,684,500 | | Unified Energy System | | 1,779,249 | |
| | | | 1,779,249 | |
| | Oil and Gas: 3.4% | | | |
28,327,500 | @ | Achinsk Refinery | | 1,742,141 | |
100,800 | | Surgutneftegaz ADR - Preferred | | 7,484,400 | |
| | | | 9,226,541 | |
| | Pipelines: 3.9% | | | |
6,800 | | Transneft | | 10,543,499 | |
| | | | 10,543,499 | |
| | Telecommunications: 1.1% | | | |
67,344,114 | | Uralsvyazinform | | 1,690,338 | |
528,730 | | VolgaTelecom | | 1,432,858 | |
| | | | 3,123,196 | |
| | Total Preferred Stock | | | |
| | (Cost $13,377,327) | | 24,672,485 | |
| | | | | |
WARRANTS: 1.9% | | | |
| | Diversified Financial Services: 1.9% | | | |
390 | @,#,I | UBA AG - Russian Small | | | |
| | Cap Basket | | 5,027,685 | |
| | Total Warrants (Cost $4,179,000) | | 5,027,685 | |
| | Total Long-Term Investments | | | |
| | (Cost $163,388,224) | | 260,567,790 | |
See Accompanying Notes to Financial Statements
106
| | PORTFOLIO OF INVESTMENTS |
ING RUSSIA FUND | | AS OF OCTOBER 31, 2005 (CONTINUED) |
Principal
Amount | | | | Value | |
| | | | |
SHORT-TERM INVESTMENTS: 10.8% | | | |
| | | |
| | Securities Lending CollateralCC: 10.8% | | | |
$ | 29,251,000 | The Bank of New York Institutional | | | |
| Cash Reserves Fund | | $ | 29,251,000 | |
| Total Short-Term Investments | | | |
| (Cost $29,251,000) | | 29,251,000 | |
| Total Investments In | | | | | |
| Securities (Cost | | | | | |
| $192,639,224)* | 106.7 | % | | $ | 289,818,790 | |
| Other Assets and | | | | | |
| Liabilities-Net | (6.7 | ) | | (18,216,039 | ) |
| Net Assets | 100.0 | % | | $ | 271,602,751 | |
| | | | | | | | | |
F Foreign security fair valued in accordance with procedures approved by Board of Directors/Trustees.
@ Non-income producing security
ADR American Depositary Receipt
GDR Global Depositary Receipt
# Securities with purchases pursuant to Rule 144A, under the Securities
cc Securities purchased with cash collateral for securities loaned.
I Illiquid security
L Loaned security, a portion or all of the security is on loan at October 31, 2005.
* Cost for federal income tax purposes is $193,231,778. Net unrealized appreciation consists of:
| | Gross Unrealized Appreciation | | | | $ | 97,547,157 | |
| | Gross Unrealized Depreciation | | | | (960,145 | ) |
| | Net Unrealized Appreciation | | | | $ | 96,587,012 | |
See Accompanying Notes to Financial Statements
107
SHAREHOLDER MEETING INFORMATION (UNAUDITED)
A special meeting of shareholders of the ING Mutual Funds was held January 25, 2005, at the offices of ING Funds, 7337 East Doubletree Ranch Road, Scottsdale, AZ 85258.
A brief description of each matter voted upon as well as the results are outlined below:
Matters:
1 To approve a new Sub-Advisory Agreement for the Fund between ING Investments, LLC, the Fund’s investment adviser, and NWQ Investment Management Company, LLC, with no change in the Adviser or the overall management fee paid by the Fund;
2 To approve a change in the Fund’s fundamental investment objective of “maximum long-term capital appreciation” to a non-fundamental investment objective of “long-term capital appreciation”;
3 To approve a “Manager-of-Managers” arrangement for the Fund to permit ING Investments, LLC, in its capacity as the Fund’s investment adviser, subject to approval by the Board of Trustees of the Trust, to enter into and materially amend agreements with sub-advisers without obtaining the approval of the Fund’s shareholders; and
4 To transact such other business, not currently contemplated, that may properly come before the Special Meeting or any adjournment(s) or postponement(s) thereof in the discretion of the proxies or their substitutes.
Results:
| | Proposal | | Shares voted for | | Shares voted
against or
withheld | | Shares
abstained | | Broker
non-vote | | Total shares
voted | |
| | | | | | | | | | | | | |
Global Value Choice | | 1 | | 3,683,424 | | 82,286 | | 86,342 | | — | | 3,852,052 | |
| | 2 | | 2,417,535 | | 131,702 | | 87,599 | | 1,215,216 | | 3,852,052 | |
| | 3 | | 2,349,159 | | 199,679 | | 87,998 | | 1,215,216 | | 3,852,052 | |
| | 4 | | 3,607,720 | | 131,362 | | 112,970 | | — | | 3,852,052 | |
* Proposals 1 and 4 passed at this meeting. The Shareholder Meeting was adjourned to January 27th for Proposals 2 and 3.
A special meeting of shareholders of the ING Mutual Funds was held January 27, 2005, at the offices of ING Funds, 7337 East Doubletree Ranch Road, Scottsdale, AZ 85258.
A brief description of each matter voted upon as well as the results are outlined below:
Matters:
1 To approve a new Sub-Advisory Agreement for the Fund between ING Investments, LLC, the Fund’s investment adviser, and NWQ Investment Management Company, LLC, with no change in the Adviser or the overall management fee paid by the Fund;
2 To approve a change in the Fund’s fundamental investment objective of “maximum long-term capital appreciation” to a non-fundamental investment objective of “long-term capital appreciation”;
3 To approve a “Manager-of-Managers” arrangement for the Fund to permit ING Investments, LLC, in its capacity as the Fund’s investment adviser, subject to approval by the Board of Trustees of the Trust, to enter into and materially amend agreements with sub-advisers without obtaining the approval of the Fund’s shareholders; and
4 To transact such other business, not currently contemplated, that may properly come before the Special Meeting or any adjournment(s) or postponement(s) thereof in the discretion of the proxies or their substitutes.
108
SHAREHOLDER MEETING INFORMATION (UNAUDITED)(CONTINUED)
Results:
| | Proposal | | Shares voted for | | Shares voted
against or
withheld | | Shares
abstained | | Broker
non-vote | | Total shares
voted | |
| | | | | | | | | | | | | |
Global Value Choice | | 1 | | 3,494,048 | | 88,104 | | 88,313 | | — | | 3,670,465 | |
| | 2 | | 2,549,805 | | 139,949 | | 88,619 | | 892,092 | | 3,670,465 | |
| | 3 | | 2,478,227 | | 211,288 | | 88,858 | | 892,092 | | 3,670,465 | |
| | 4 | | 3,416,414 | | 139,062 | | 114,989 | | — | | 3,670,465 | |
A special meeting of shareholders of the ING Mutual Funds was held February 15, 2005, at the offices of ING Funds, 7337 East Doubletree Ranch Road, Scottsdale, AZ 85258.
A brief description of each matter voted upon as well as the results are outlined below:
Matters:
1 To approve a new Sub-Advisory Agreement for the Fund between ING Investments, LLC, the Fund’s investment adviser, and Brandes Investment Partners, L.P., with no change in the Adviser or the overall management fee paid by the Fund;
2 To approve a new Sub-Advisory Agreement for the Fund between ING Investments, LLC, the Fund’s investment adviser, and Acadian Asset Management, Inc., with no change in the Adviser or the overall management fee paid by the Fund;
3 To approve a “Manager-of-Managers” arrangement for the Fund to permit ING Investments, LLC, in its capacity as the Fund’s investment adviser, subject to approval by the Board of Trustees of the Trust, to enter into and materially amend agreements with sub-advisers without obtaining the approval of the Fund’s shareholders; and
4 To transact such other business, not currently contemplated, that may properly come before the Special Meeting or any adjournment(s) or postponement(s) thereof in the discretion of the proxies or their substitutes.
Results:
| | Proposal | | Shares voted for | | Shares voted
against or
withheld | | Shares
abstained | | Broker
non-vote | | Total shares
voted | |
| | | | | | | | | | | | | |
Emerging Countries Fund | | 1 | | 2,736,451 | | 72,825 | | 68,949 | | — | | 2,878,225 | |
| | 3 | | 1,966,239 | | 219,234 | | 77,598 | | 615,154 | | 2,878,225 | |
| | 4 | | 2,663,854 | | 117,793 | | 96,578 | | — | | 2,878,225 | |
International SmallCap | | 2 | | 5,613,886 | | 134,447 | | 113,433 | | — | | 5,861,767 | |
| | 3 | | 4,099,257 | | 335,066 | | 142,665 | | 1,284,779 | | 5,861,767 | |
| | 4 | | 5,474,858 | | 225,517 | | 161,391 | | — | | 5,861,767 | |
109
TAX INFORMATION (UNAUDITED)
Dividends paid during the year ended October 31, 2005 were as follows:
Fund Name | | | Type | | Per Share Amount | |
ING Global Equity Dividend Fund | | | | | |
Class A | | NII | | $ | 0.5388 | |
Class B | | NII | | $ | 0.4216 | |
Class C | | NII | | $ | 0.4340 | |
All Classes | | STCG | | $ | 0.1872 | |
All Classes | | LTCG | | $ | 0.0048 | |
| | | | | | |
ING Global Real Estate Fund | | | | | |
Class A | | NII | | $ | 0.5377 | |
Class B | | NII | | $ | 0.4483 | |
Class C | | NII | | $ | 0.4464 | |
Class I | | NII | | $ | 0.2816 | |
Class Q | | NII | | $ | 0.5818 | |
All Classes | | STCG | | $ | 0.6655 | |
All Classes | | LTCG | | $ | 0.2529 | |
ING Emerging Countries Fund | | | | | |
Class A | | NII | | $ | 0.0181 | |
Class Q | | NII | | $ | 0.0308 | |
Fund Name | | | Type | | Per Share Amount | |
ING International Fund | | | | | |
Class A | | NII | | $ | 0.1031 | |
Class B | | NII | | $ | 0.0475 | |
Class C | | NII | | $ | 0.0413 | |
Class I | | NII | | $ | 0.1486 | |
Class Q | | NII | | $ | 0.1244 | |
| | | | | | |
ING International Value Fund | | | | | |
Class A | | NII | | $ | 0.2225 | |
Class B | | NII | | $ | 0.1096 | |
Class C | | NII | | $ | 0.1105 | |
Class I | | NII | | $ | 0.2926 | |
Class Q | | NII | | $ | 0.2486 | |
All Classes | | LTCG | | $ | 0.8046 | |
| | | | | | |
ING Precious Metals Fund | | | | | |
Class A | | NII | | $ | 0.2279 | |
| | | | | | |
ING Russia Fund | | | | | |
Class A | | NII | | $ | 0.0131 | |
NII — Net investment income
STCG — Short-term capital gain
LTCG — Long-term capital gain
Of the ordinary distributions made during the year ended October 31, 2005, the following percentages qualify for the dividends received deduction available to corporate shareholders:
Global Equity Dividend | | 24.59 | % |
International | | 1.16 | % |
International Value | | 2.68 | % |
Precious Metals | | 5.04 | % |
For the year ended October 31, 2005, the following are percentages of net investment income dividends paid by the Funds that are designated as qualifying dividend income (QDI) subject to reduced income tax rates for individuals:
Global Equity Dividend | | 84.14 | % |
Emerging Countries | | 100.00 | % |
International | | 100.00 | % |
International Value | | 100.00 | % |
Precious Metals | | 21.98 | % |
Russia | | 100.00 | % |
Pursuant to Section 853 of the Internal Revenue Code, the Funds designate the following amounts as foreign taxes paid for the year ended October 31, 2005:
| | Foreign Taxes
Paid | | Per Share
Amount | |
Global Equity Dividend | | $ | 253,774 | | | $ | 0.0220 | | |
Emerging Countries | | $ | 214,119 | | | $ | 0.0378 | | |
International | | $ | 247,515 | | | $ | 0.0223 | | |
International Small Cap | | $ | 576,111 | | | $ | 0.0643 | | |
International Value | | $ | 8,724,737 | | | $ | 0.0392 | | |
International Value Choice | | $ | 12,104 | | | $ | 0.0140 | | |
Precious Metals | | $ | 27,642 | | | $ | 0.0023 | | |
Above figures may differ from those cited elsewhere in this report due to differences in the calculation of income and gains under accounting principles generally accepted in the United States of America (book) purposes and Internal Revenue Service (tax) purposes.
Shareholders are strongly advised to consult their own tax advisers with respect to the tax consequences of their investments in the Funds. In January, shareholders, excluding corporate shareholders, receive an IRS 1099-DIV regarding the federal tax status of the dividends and distributions they received in the calendar year.
110
TRUSTEE AND OFFICER INFORMATION (UNAUDITED)
The business and affairs of the Funds are managed under the direction of the Funds’ Board of Trustees. A Trustee who is not an interested person of the Trusts, as defined in the 1940 Act, is an independent trustee (“Independent Trustee”). The Trustees and Officers of the Funds are listed below. The Statement of Additional Information includes additional information about trustees of the Registrant and is available, without charge, upon request at 1-800-992-0180.
Name, Address
and Age | | Position(s)
Held with
Trust | | Term of
Office and
Length of
Time
Served(1) | | Principal
Occupation(s)
During the
Past Five Years | | Number of
Portfolios in
Fund Complex
Overseen
by Trustee | | Other
Directorships
Held by
Trustee |
| | | | | | | | | | |
Independent Trustees: | | | | | | | | | | |
| | | | | | | | | | |
John V. Boyer(3)
7337 E. Doubletree Ranch Rd.
Scottsdale, Arizona 85258
Age: 52 | | Trustee | | January 2005 - Present | | Executive Director, The Mark Twain House & Museum(2) (September 1989 - Present). | | 162 | | None |
| | | | | | | | | | |
J. Michael Earley(4)
7337 E. Doubletree Ranch Rd.
Scottsdale, Arizona 85258
Age : 60 | | Trustee | | February 2001 - Present | | President and Chief Executive Officer, Bankers Trust Company, N.A. (June 1992 - Present). | | 162 | | None |
| | | | | | | | | | |
R. Barbara Gitenstein(3)
7337 E. Doubletree Ranch Rd.
Scottsdale, Arizona 85258
Age : 57 | | Trustee | | February 2002 - Present | | President, College of New Jersey (January 1999 - Present). | | 162 | | None |
| | | | | | | | | | |
Patrick W. Kenny(4)
7337 E. Doubletree Ranch Rd.
Scottsdale, Arizona 85258
Age : 62 | | Trustee | | January 2005 - Present | | President and Chief Executive Officer International Insurance Society (June 2001 - Present). Formerly, Executive Vice President, Frontier Insurance Group, Inc. (September 1998 - March 2001). | | 162 | | Assured Guaranty Ltd. (November 2003 - Present). |
| | | | | | | | | | |
Walter H. May(3)
7337 E. Doubletree Ranch Rd.
Scottsdale, Arizona 85258
Age : 68 | | Trustee | | October 1999 - Present | | Retired. | | 162 | | BestPrep (September 1991 - Present). |
| | | | | | | | | | |
Jock Patton(3)
7337 E. Doubletree Ranch Rd.
Scottsdale, Arizona 85258
Age : 59 | | Chairman and Trustee | | May 1999 - Present | | Private Investor (June 1997 - Present). Formerly, Director and Chief Executive Officer, Rainbow Multimedia Group, Inc. (January 1999 - December 2001). | | 162 | | JDA Software Group, Inc. (January 1999 - Present); Swift Transportation Co. (March 2004 - Present). |
| | | | | | | | | | |
David W.C. Putnam(4)
7337 E. Doubletree Ranch Rd.
Scottsdale, Arizona 85258
Age : 66 | | Trustee | | October 1999 - Present | | President and Director, F.L. Putnam Securities Company, Inc. (June 1978 - Present). | | 162 | | Progressive Capital Accumulation Trust (August 1998 - Present); Principled Equity Market Trust (November 1996 - Present); Mercy Endowment Foundation (September 1995 - Present); Asian American Bank and Trust Company (June 1992 - Present); and Notre Dame Health Care Center (July 1991 - Present). |
| | | | | | | | | | |
Roger B. Vincent(4)
7337 E. Doubletree Ranch Rd.
Scottsdale, Arizona 85258
Age : 60 | | Trustee | | February 2002 - Present | | President, Springwell Corporation (March 1989 - Present). | | 162 | | AmeriGas Propane, Inc. (January 1998 - Present). |
111
TRUSTEE AND OFFICER INFORMATION (UNAUDITED) (CONTINUED)
Name, Address
and Age | | Position(s)
Held with
Trust | | Term of
Office and
Length of
Time
Served(1) | | Principal
Occupation(s)
During the
Past Five Years | | Number of
Portfolios in
Fund Complex
Overseen
by Trustee | | Other
Directorships
Held by
Trustee |
Richard A. Wedemeyer(3)
7337 E. Doubletree Ranch Rd.
Scottsdale, Arizona 85258
Age : 69 | | Trustee | | February 2001 - Present | | Retired. Formerly, Vice President - Finance and Administration, The Channel Corporation (June 1996 - April 2002). Formerly, Trustee, First Choice Funds (February 1997 - April 2001). | | 162 | | Touchstone Consulting Group (June 1997 - Present) and Jim Henson Legacy (April 1994 - Present). |
| | | | | | | | | | |
Trustees who are “Interested Persons”: | | | | | | | | |
| | | | | | | | | | |
Thomas J. McInerney(5)
7337 E. Doubletree Ranch Rd.
Scottsdale, Arizona 85258
Age : 49 | | Trustee | | February 2001 - Present | | Chief Executive Officer, ING U.S. Financial Services (January 2005 - Present); General Manager and Chief Executive Officer, U.S. Financial Services (December 2003 - December 2004); Chief Executive Officer, ING U.S. Financial Services (September 2001 - December 2003); and General Manager and Chief Executive Officer, U.S. Worksite Financial Services (December 2000 - September 2001). | | 205 | | Equitable Life Insurance Co., Golden American Life Insurance Co., Life Insurance Company of Georgia, Midwestern United Life Insurance Co., ReliaStar Life Insurance Co., Security Life of Denver, Security Connecticut Life Insurance Co., Southland Life Insurance Co., USG Annuity and Life Company, and United Life and Annuity Insurance Co. Inc.; Ameribest Life Insurance Co.; First Columbine Life Insurance Co.; and Metro Atlanta Chamber of Commerce (January 2003 - Present). |
| | | | | | | | | | |
John G. Turner(6)
7337 E. Doubletree Ranch Rd.
Scottsdale, Arizona 85258
Age : 66 | | Trustee | | October 1999 - Present | | Retired. Formerly, Vice Chairman of ING Americas (September 2000 - January 2002); Director of ReliaStar Life Insurance Company of New York (April 1975 - December 2001); and Chairman and Trustee of the Northstar affiliated investment companies (May 1993 - December 2001). | | 162 | | Hormel Foods Corporation (March 2000 - Present); ShopKo Stores, Inc. (August 1999 - Present); and Conseco, Inc. (September 2003 - Present). |
(1) Trustees serve until their successors are duly elected and qualified, subject to the Board’s retirement policy.
(2) Shaun Mathews, Senior Vice President of ING Life Insurance and Annuity Company, has held a seat on the board of directors of The Mark Twain House & Museum since September 19, 2002. ING Groep N.V. makes non-material, charitable contributions to The Mark Twain House & Museum.
(3) Valuation, Proxy and Brokerage Committee member.
(4) Audit Committee member.
(5) Mr. McInerney is an “interested person,” as defined under the 1940 Act, because of his affiliation with ING Groep N.V., the parent corporation of the Investment Manager, ING Investments, LLC and the Distributor, ING Funds Distributor, LLC.
(6) Mr. Turner is an “interested person,” as defined under the 1940 Act, because of his affiliation with ING Groep N.V., the parent corporation of the Investment Manager, ING Investments, LLC and the Distributor, ING Funds Distributor, LLC.
112
TRUSTEE AND OFFICER INFORMATION (UNAUDITED) (CONTINUED)
Name, Address
and Age | | Position(s)
Held with the Trust | | Term of Office and
Length of Time Served(1) | | Principal Occupation(s) during the
Past Five Years |
Officers: | | | | | | |
| | | | | | |
James M. Hennessy
7337 E. Doubletree Ranch Rd.
Scottsdale, Arizona 85258
Age : 56 | | President and Chief Executive Officer
Chief Operating Officer | | February 2001 - Present
July 2000 - Present | | President, Chief Executive Officer and Chief Operating Officer, ING Investments, LLC (December 2000 - Present). Formerly, Senior Executive Vice President and Chief Operating Officer, ING Investments, LLC (April 1995 - December 2000). |
| | | | | | |
Michael J. Roland
7337 E. Doubletree Ranch Rd.
Scottsdale, Arizona 85258
Age : 47 | | Executive Vice President | | February 2002 - Present | | Executive Vice President (December 2001 - Present) and Chief Compliance Officer (October 2004 - Present), ING Investments, LLC. Formerly, Chief Financial Officer and Treasurer, ING Investments, LLC (December 2001 - March 2005); Senior Vice President, ING Investments, LLC (June 1998 - December 2001). |
| | | | | | |
Stanley D. Vyner
7337 E. Doubletree Ranch Rd.
Scottsdale, Arizona 85258
Age : 55 | | Executive Vice President | | May 1999 - Present | | Executive Vice President, ING Investments, LLC (July 2000 - Present) and Chief Investment Risk Officer (January 2003 - Present). Formerly, Chief Investment Officer of the International Portfolios, ING Investments, LLC (August 2000 - January 2003). |
| | | | | | |
Joseph M. O’Donnell
7337 E. Doubletree Ranch Rd.
Scottsdale, Arizona 85258
Age : 50 | | Chief Compliance Officer | | November 2004 - Present | | Chief Compliance Officer of the ING Funds (November 2004 - Present). Formerly, Vice President, Chief Legal Counsel, Chief Compliance Officer and Secretary of Atlas Securities, Inc., Atlas Advisers, Inc. and Atlas Funds (October 2001 - October 2004); and Chief Operating Officer and General Counsel of Matthews International Capital Management LLC and Vice President and Secretary of Matthews International Funds (August 1999 - May 2001). |
| | | | | | |
Todd Modic
7337 E. Doubletree Ranch Rd.
Scottsdale, Arizona 85258
Age : 37 | | Senior Vice President, Chief Financial Officer and Assistant Secretary | | March 2005 - Present | | Senior Vice President, ING Funds Services, LLC (April 2005 - Present). Formerly, Vice President, ING Funds Services, LLC (September 2002 - March 2005); Director, Financial Reporting, ING Investments, LLC (March 2001 - September 2002); Director of Financial Reporting, Axient Communications, Inc. (May 2000 - January 2001). |
| | | | | | |
Robert S. Naka
7337 E. Doubletree Ranch Rd.
Scottsdale, Arizona 85258
Age : 42 | | Senior Vice President Assistant Secretary | | November 1999 - Present May 1999 - Present | | Senior Vice President (August 1999 - Present) and Assistant Secretary (October 2001 - Present), ING Funds Services, LLC. |
| | | | | | |
Kimberly A. Anderson
7337 E. Doubletree Ranch Rd.
Scottsdale, Arizona 85258
Age : 41 | | Senior Vice President | | November 2003 - Present | | Senior Vice President, ING Investments, LLC (October 2003 - Present). Formerly, Vice President and Assistant Secretary, ING Investments, LLC (January 2001 - October 2003); and Assistant Vice President, ING Funds Services, LLC (November 1999 - January 2001). |
| | | | | | |
Robyn L. Ichilov
7337 E. Doubletree Ranch Rd.
Scottsdale, Arizona 85258
Age : 38 | | Vice President and Treasurer | | May 1999 - Present | | Vice President and Treasurer, ING Funds Services, LLC (October 2001 - Present) and ING Investments, LLC (August 1997 - Present). |
| | | | | | |
Lauren D. Bensinger
7337 E. Doubletree Ranch Rd.
Scottsdale, Arizona 85258
Age : 51 | | Vice President | | February 2003 - Present | | Vice President and Chief Compliance Officer, ING Funds Distributor, LLC (July 1995 - Present); and Vice President, ING Investments, LLC (February 2003 - Present). Formerly, Chief Compliance Officer, ING Investments, LLC (October 2001 - October 2004). |
113
TRUSTEE AND OFFICER INFORMATION (UNAUDITED) (CONTINUED)
Name, Address
and Age | | Position(s)
Held with the Trust | | Term of Office and
Length of Time Served(1) | | Principal Occupation(s) during the
Past Five Years |
Maria M. Anderson
7337 E. Doubletree Ranch Rd.
Scottsdale, Arizona 85258
Age : 47 | | Vice President | | September 2004 - Present | | Vice President, ING Funds Services, LLC (September 2004 - Present). Formerly, Assistant Vice President, ING Funds Services, LLC (October 2001 - September 2004); and Manager Fund Accounting and Fund Compliance, ING Investments, LLC (September 1999 - October 2001). |
| | | | | | |
Mary A. Gaston
7337 E. Doubletree Ranch Rd
Scottsdale, Arizona 85258
Age : 39 | | Vice President | | March 2005 - Present | | Vice President, ING Fund Services, LLC (April 2005 - Present). Formerly, Assistant Vice President, Financial Reporting, ING Investments, LLC (April 2004 - April 2005); Manager, Financial Reporting, ING Investments, LLC (August 2002 - April 2004); and Controller Z Seven Fund, Inc. and Ziskin Asset Management, Inc. (January 2000 - March 2002). |
| | | | | | |
Susan P. Kinens
7337 E. Doubletree Ranch Rd.
Scottsdale, Arizona 85258
Age : 28 | | Assistant Vice President | | February 2003 - Present | | Assistant Vice President, ING Funds Services, LLC (December 2002 - Present); and has held various other positions with ING Funds Services, LLC for more than the last five years. |
| | | | | | |
Kimberly K. Palmer
7337 E. Doubletree Rand Rd.
Scottsdale, Arizona 85258
Age : 48 | | Assistant Vice President | | September 2004 - Present | | Assistant Vice President, ING Funds Services, LLC (August 2004 - Present). Formerly, Manager, Registration Statements, ING Funds Services, LLC (May 2003 - August 2004); Associate Partner, AMVESCAP PLC (October 2000 - May 2003); Director of Federal Filings and Blue Sky Filings, INVESCO Funds Group, Inc. (March 1994 - May 2003). |
| | | | | | |
Huey P. Falgout, Jr.
7337 E. Doubletree Ranch Rd.
Scottsdale, Arizona 85258
Age : 41 | | Secretary | | August 2003 - Present | | Chief Counsel, ING Americas, U.S. Legal Services (September 2003 - Present). Formerly, Counsel, ING Americas, U.S. Legal Services (November 2002 - September 2003); and Associate General Counsel of AIG American General (January 1999 - November 2002). |
| | | | | | |
Theresa K. Kelety
7337 E. Doubletree Ranch Rd.
Scottsdale, Arizona 85258
Age : 42 | | Assistant Secretary | | August 2003 - Present | | Counsel, ING Americas, U.S. Legal Services (April 2003 - Present). Formerly, Senior Associate with Shearman & Sterling (February 2000 - April 2003). |
| | | | | | |
Robin R. Nesbitt
7337 E. Doubletree Rand Rd.
Scottsdale, Arizona 85258
Age : 32 | | Assistant Secretary | | September 2004 - Present | | Supervisor, Board Operations, ING Funds Services, LLC (August 2003 - Present). Formerly, Senior Legal Analyst, ING Funds Services, LLC (August 2002 - August 2003); Associate, PricewaterhouseCoopers (January 2001 - August 2001); and Paralegal, McManis, Faulkner & Morgan (May 2000 - December 2000). |
(1) The officers hold office until the next annual meeting of the Trustees and until their successors have been elected and qualified.
114
ADVISORY CONTRACT APPROVAL DISCUSSION (UNAUDITED)
Consideration of Annual Renewals
Under Section 15(c) of the Investment Company Act of 1940 (the “1940 Act”), after an initial period, the Funds’ existing investment advisory and sub-advisory contracts remain in effect only if the Boards of Trustees (the “Board”) of ING Mutual Funds and ING Mayflower Trust, including a majority of the Trustees who have no direct or indirect interest in the advisory and sub-advisory contracts, and who are not “interest persons” of the Funds, as such term is defined under the 1940 Act (the “Independent Trustees”), annually review and renew them.
In this regard, at a meeting held on August 31, 2004 the Board, including a majority of the Independent Trustees, voted to renew the investment advisory contracts (the “Advisory Contracts”) between ING Investments, LLC (the “Adviser”) and the Funds and the sub-advisory contracts (“Sub-Advisory Contracts”) with the Funds’ respective sub-advisers (each, a “Sub-Adviser,” and collectively, the “Sub-Advisers”), for the period September 1, 2004 through August 31, 2005. Subsequently, at its meeting held on July 21, 2005, the Board voted to renew the terms of the Advisory and certain Sub-Advisory Contracts for an “interim” period commencing on September 1, 2005 and ending on November 30, 2005. The interim approval was necessary to align the Funds’ annual renewal periods with those of other Funds in the ING Funds complex. In reaching these decisions, the Board took into account a number of factors its members believed, in light of the legal advice furnished to the Board by Kirkpatrick & Lockhart Nicholson Graham LLP (“K&LNG”), legal counsel to the Independent Trustees, and their own business judgment, to be relevant.
In connection with their deliberations on August 31, 2004 relating to the renewal of each Fund’s current Advisory Contract and Sub-Advisory Contract, the Board, including the Independent Trustees, considered information that had been provided by the Adviser and the Sub-Advisers throughout the year at regular Board Meetings, as well as information furnished in advance of the August 31, 2004 Board meeting, which was held to specifically consider such renewals for purposes of annual renewal. This information included the following items: (1) FACT sheets for each Fund that provide information about the performance and expenses of the Fund and its respective peer group, as well as information about the Fund’s investment portfolio, objective and strategies; (2) the 15(c) Methodology Guide that describes how the FACT sheets were prepared, including how benchmarks and peer groups were selected and how profitability was determined; (3) responses to questions from K&LNG, legal counsel to the Independent Trustees; (4) copies of each form of Advisory and Sub-Advisory Contract; (5) copies of the Form ADV for the Adviser and the Sub-Advisers; (6) financial statements for the Adviser and Sub-Advisers; and (7) other information relevant to their evaluations.
In connection with their deliberations on July 21, 2005 relating to each Fund’s current Advisory Contract and, in certain cases, Sub-Advisory Contract, the Board, including the Independent Trustees, considered information that had been provided by the Adviser and the Sub-Advisers throughout the year at regular Board and Committee Meetings, beginning in August 2004 in anticipation of the August contract renewal and continuing at periodic meetings thereafter. Such information included, among other things, detailed analysis of Fund performance, including attribution analysis, provided at all regular Board meetings.
The Board also considered information furnished in advance of the July 21, 2005 Board meeting, which was held to, among other things, specifically consider Advisory and Sub-Advisory Contract renewals for the interim period ending November 30, 2005. This information included the following items: (1) updated performance information through May 31, 2005 with respect to the Funds; (2) responses to questions from K&LNG, legal counsel to the Independent Trustees; (3) copies of each form of Advisory and Sub-Advisory Contract; (4) representations that there were no material changes in the management fees and expense ratios borne by the Funds since the August 2004 approval; and (5) other information relevant to their evaluations. In determining that this information was sufficient to support the interim renewal, the Board took into consideration that it would meet again, at an in-person meeting to be held in November 2005, to consider whether to approve the Advisory and Sub-Advisory Contracts for the Funds for a 12-month period beginning on December 1, 2005 and ending November 30, 2006. The interim and subsequent November renewals would place the Funds on a December 1 renewal cycle, and result in all of the mutual funds in the ING mutual funds complex under the purview of the Board being placed on the same annual renewal cycle on a going-forward basis.
The Board was also provided, in August 2004 and July 2005, with narrative summaries addressing key factors the Board customarily considers in evaluating the renewal of Advisory and Sub-Advisory Contracts,
115
ADVISORY CONTRACT APPROVAL DISCUSSION (UNAUDITED) (CONTINUED)
including an analysis for each Fund of how performance and fees compare to its comparable universe of funds (“Selected Peer Group”) and/or designated benchmarks.
In arriving at its conclusions with respect to the advisory arrangements with the Adviser, the Board was mindful of the “manager-of-managers” platform of the ING Funds. The Board also noted the resources that the Adviser has committed to the Board and its International Equity and Fixed Income Investment Review Committee (the “Investment Review Committee”) to assist the Board and Investment Review Committee members with their assessment of the investment performance of the Funds. This includes the appointment of a Chief Investment Risk Officer and his staff, who report directly to the Board, and who have developed attribution analyses and other metrics used by the Investment Review Committee to analyze the key factors underlying investment performance for the Funds. The Board also noted the techniques used by the Adviser to monitor the performance of the Sub-Advisers, and took note of the pro-active approach that the Adviser, working in cooperation with the Investment Review Committee, has taken to advocate or recommend, when it believed appropriate, changes intended to assist performance of the Funds.
Consideration of New Sub-Advisory Arrangements
Section 15 of the 1940 mandates that, when a Fund enters into a new advisory or sub-advisory arrangement, the Trustees, including a majority of the Independent Trustees, must approve the new Sub-Advisory Contract with respect to the Fund. The Board approved, in November 2004, the following new advisory arrangements: (1) the engagement of Brandes Investment Partners, L.P. (“Brandes”) as the new Sub-Adviser to ING Emerging Countries Fund, effective March 1, 2005, replacing ING Investment Management Advisors B.V.; (2) replacing ING Investment Management Co. with NWQ Investment Management Company, LLC (“NWQ”) as Sub-Adviser to ING Global Value Choice Fund (formerly, ING Worldwide Growth Fund), effective February 1, 2005; and (3) appointing Acadian Asset Management, Inc. (“Acadian”) as Sub-Adviser to ING International SmallCap Growth Fund, replacing Nicholas-Applegate Capital Management, effective March 1, 2005. Further, in November 2004 the Board approved the launch of ING International Value Fund, a new Fund managed by NWQ. The Board’s consideration of these new sub-advisory arrangements is discussed under the fund-by-fund analysis, below.
Fund-by-Fund Analysis
The following paragraphs outline certain of the specific factors that the Board considered, and the conclusions reached, at its August 2004 and July 2005 meetings in relation to renewing the Funds’ current Advisory Contracts and Sub-Advisory Contracts for the year ended August 31, 2005 and the interim period ended November 30, 2005. Also discussed below are the Board’s considerations at its November 2004 meeting when it determined to vote to approve new sub-advisory arrangements for certain Funds.
ING Global Equity Dividend Fund
In its renewal deliberations for ING Global Equity Dividend Fund in August 2004, the Board considered that: (1) the management fee for the Fund is below the median and the average management fees of the funds in its Selected Peer Group; (2) the expense ratio for the Fund is below the median and average expense ratios of the funds in its Selected Peer Group; and (3) the Fund underperformed its primary benchmark index for the periods presented. In analyzing this performance data, the Board noted that the Fund commenced operations in September 2003, and therefore there was only one year of performance data available for purposes of analysis.
In considering whether to approve the Fund’s interim period renewal, in July 2005 the Board further considered that, based on performance data for the period ended May 31, 2005: (1) the Fund outperformed its primary benchmark index, the Lipper Category Median, and the Morningstar Category Average for the one-year period ended May 31, 2005; (2) the Fund outperformed its Lipper Category median for the three-month period ended May 31, 2005, and outperformed its Morningstar Category Average for the year-to-date and three-month periods ended May 31, 2005; and (3) the Fund underperformed its primary benchmark index for all other periods considered, underperformed its Lipper Category Median for the year-to-date and one-month period ended May 31, 2005, and underperformed its Morningstar Category Average for the one-month period ended May 31 2005.
After its deliberation, the Board reached the following conclusions: (1) the Fund’s management fee rate is reasonable in the context of all factors considered by the Board; (2) the Fund’s expense ratio is reasonable in the context of all factors considered by the Board; (3) the Fund had been launched in September 2003 and one-year performance for the
116
ADVISORY CONTRACT APPROVAL DISCUSSION (UNAUDITED) (CONTINUED)
period ended May 31, 2005 had been positive, and it was reasonable to permit the Sub-Adviser to continue to manage the Fund in order to demonstrate the more favorable longer-term performance anticipated by management; and (4) the sub-advisory fee rate payable by the Adviser to the Sub-Adviser is reasonable in the context of all factors considered by the Board. The Board also noted that there would be further opportunity for review of more recent performance and other relevant factors in the course of deliberations for the next annual renewal in November 2005.
Based on these conclusions and other factors, the Board voted to renew the Advisory and Sub-Advisory Contracts for the Fund for the year ended August 31, 2005 and the interim period ended November 30, 2005. During this renewal process, different Board members may have given different weight to different individual factors and related conclusions.
ING Global Real Estate Fund
In its renewal deliberations for ING Global Real Estate Fund in August 2004, the Board considered that: (1) the management fee for the Fund is above the median and average management fees of the funds in Selected Peer Group; (2) the expense ratio for the Fund is above the median and the average expense ratios of the funds in its Selected Peer Group; and (3) the Fund outperformed its primary benchmark index and Selected Peer Group for the periods reviewed by the Board.
In considering whether to approve the Fund’s interim period renewal, in July 2005 the Board further considered that: (1) the Fund outperformed its primary benchmark index, the Lipper Category Median, and the Morningstar Category Average for the three-year period ended May 31, 2005; and (2) the Fund underperformed its primary benchmark index, the Lipper Category Median, and the Morningstar Category Average for the year-to-date, one-month, three-month and one-year periods ended May 31 2005. In analyzing this performance data, the Board took into account that the Adviser had agreed to add breakpoint discounts to its management fee, which can be expected to benefit the Fund through lower fees when higher asset levels are reached. The Board further considered that, at its July meeting, the Board approved Class O shares for the Fund, which can be expected to result in increased asset levels and economies of scale benefiting the Fund and its shareholders.
After its deliberation, the Board reached the following conclusions: (1) the Fund’s management fee rate is reasonable in the context of all factors considered by the Board; (2) the Fund’s expense ratio is reasonable in the context of all factors considered by the Board; (3) the Fund’s performance is reasonable in the context of all factors considered by the Board; and (4) the sub-advisory fee rate payable by the Adviser to the Sub-Adviser is reasonable in the context of all factors considered by the Board. The Board also noted that there would be further opportunity for review of more recent performance and other relevant factors in the course of deliberations for the next annual renewal in November 2005.
Based on these conclusions and other factors, the Board voted to renew the Advisory and Sub-Advisory Contracts for the Fund for the year ended August 31, 2005 and the interim period ended November 30, 2005. During this renewal process, different Board members may have given different weight to different individual factors and related conclusions.
ING Global Value Choice Fund
In its renewal deliberations for ING Global Value Choice Fund (formerly, ING Worldwide Growth Fund), the Board considered that: (1) the management fee for the Fund is above the median and the average management fees of the funds in its Selected Peer Group; (2) the expense ratio for the Fund is above the median and the average expense ratios of the funds in its Selected Peer Group; and (3) the Fund underperformed its primary benchmark index for the periods presented to the Board. In analyzing this performance data, the Board considered actions taken to address the Board’s concerns about the Fund’s performance.
After deliberations based on the above-listed factors, in August 2004 the Board renewed the Advisory Contract and Sub-Advisory Contract for the Fund for the year ended August 31, 2005 because, among other considerations: (1) the Fund’s management fee rate is competitive with those of the funds in its Selected Peer Group; (2) the expense ratio for the Fund is competitive with those of the funds in its Selected Peer Group, and (3) action has been taken to improve Fund performance and the Adviser committed to further address performance concerns. During this renewal process, different Board members may have given different weight to different individual factors and related conclusions.
117
ADVISORY CONTRACT APPROVAL DISCUSSION (UNAUDITED) (CONTINUED)
The Adviser further addressed the Board’s concerns by recommending the engagement of NWQ as the Fund’s Sub-Adviser, replacing ING Investment Management Co. (“ING IM”), the Fund’s then-current Sub-Adviser. On November 10, 2004, in reaching a decision to engage NWQ as the Fund���s Sub-Adviser, the Board, including a majority of the Independent Trustees, considered the performance of the Fund for the latest one-, three-, and five-year periods. The Board also considered the composite performance of portfolios managed by NWQ with similar investment styles to that of the Fund. In addition to these considerations, the Board evaluated and discussed other factors, including, but not limited to, the following: (1) the process employed by NWQ in managing international equities, the consistency of that process over time, and measures used to address the risks of international equities; (2) the Adviser’s view of the reputation of NWQ; (3) NWQ’s experience and skill in managing large cap value and international accounts; (4) the nature and quality of the services to be provided by NWQ; (5) the addition of an exclusivity provision in the proposed Sub-Advisory Contract; (6) the fairness of the compensation under the proposed Sub-Advisory Contract in light of the services to be provided by NWQ; (7) NWQ’s track record in managing the risks and volatility inherent in global funds; (8) the qualifications of NWQ’s personnel, portfolio management capabilities and investment methodologies; (9) NWQ’s operations, compliance program, and policies with respect to trade allocation and brokerage practices; (10) NWQ’s financial condition; (11) the costs for the services to be provided by NWQ and the fact that these costs will be paid by the Adviser and not directly by the Fund; (12) the consistency in investment style and portfolio turnover rates experienced over time by other international and domestic equity portfolios managed by NWQ; (13) the appropriateness of the selection of NWQ and the employment of the proposed investment strategy in light of the Fund’s investment objective and its current and prospective investor base; and (14) NWQ’s Code of Ethics and related procedures for complying with the Code. The Board also considered the advisory fee to be retained by the Adviser for its oversight and monitoring services to be provided to the Fund.
During the course of its deliberation, the Board reached the following conclusions regarding NWQ and the proposed Sub-Advisory Contract, among others: (1) NWQ is qualified to manage the Fund’s assets in accordance with the revised investment objective and the proposed investment strategy; (2) the proposed investment strategy is appropriate for pursuing long-term capital appreciation through a Fund that can invest throughout the world and is consistent with the interests of current and prospective investors in the Fund; (3) the proposed investment strategy would not materially affect the current risk profile of the Fund; (4) NWQ is expected to execute the proposed investment strategy consistently over time; (5) based upon the financial statements of both NWQ and its parent company, Nuveen Investments, NWQ has sufficient financial resources available to it to fulfill its commitments to the Fund under the proposed Sub-Advisory Contract; (6) the exclusivity provisions included in the proposed Sub-Advisory Contract with respect to the management of other mutual funds with similar investment objectives, policies and restrictions are likely to provide the Fund with the opportunity to realize asset growth during the exclusivity period; (7) NWQ is likely to manage the assets with a portfolio turnover rate that is relatively low for a global fund; and (8) taking into account the complexity and quality of the investment management services utilized by the Fund, the compensation to be paid by the Adviser to NWQ under the proposed Sub-Advisory Contract is fair and reasonable in relation to the services to be provided by NWQ, the compensation paid to the current Sub-Adviser, ING IM, and various industry averages for similar funds. Based upon these and other relevant conclusions, the Board determined to approve the Sub-Advisory Contract with NWQ for the Fund, with an initial two-year period that commenced on February 1, 2005
In considering whether to approve the renewal of ING Global Value Choice Fund���s Advisory Contract for the interim period, in July 2005 the Board further considered that: (1) the Fund underperformed its primary benchmark index, the Lipper Category Median and the Morningstar Category Average for the one-year, three-year and five-year periods ended May 31 2005; (2) the Fund outperformed its primary benchmark index, the Lipper Category Median and the Morningstar Category Average for the one-month, three-month and year-to-date periods ended May 31, 2005; and (3) short-term performance had improved under the management of NWQ, and longer-term underperformance could be attributed to ING IM, the Fund’s former Sub-Adviser.
After its deliberation, the Board reached the following conclusions: (1) the Fund’s management fee rate is reasonable in the context of all factors considered by the Board; (2) the Fund’s expense ratio
118
ADVISORY CONTRACT APPROVAL DISCUSSION (UNAUDITED) (CONTINUED)
is reasonable in the context of all factors considered by the Board; and (3) management had taken action to address Board concerns about the Fund’s performance, and short-term performance, based upon periods ended May 31, 2005, showed improvement. The Board also noted that there would be further opportunity for review of more recent performance and other relevant factors in the course of deliberations for the next annual renewal in November 2005.
Based on these conclusions and other factors, the Board voted to renew the Advisory Contract for the Fund for the interim period ended November 30, 2005. During this renewal process, different Board members may have given different weight to different individual factors and related conclusions.
ING Emerging Countries Fund
In its renewal deliberations for ING Emerging Countries Fund, the Board considered that: (1) the management fee for the Fund is above the median and the average management fees of the funds in its Selected Peer Group; (2) the expense ratio for the Fund is above the median and the average expense ratios of the funds in its Selected Peer Group; and (3) the Fund underperformed its primary benchmark index and Selected Peer Group median for the periods reviewed by the Board. In analyzing this performance data, the Board took into account the actions taken by the Adviser to address the Board’s concerns about the Fund’s performance. The Board further noted that, in response to direction from the Board, the Adviser agreed to a lower expense limit for the Fund through a waiver of 0.10% of the 12b-1 fee for the Fund’s Class A shares.
After deliberations based on the above-listed factors, in August 2004 the Board renewed the Advisory Contract and Sub-Advisory Contract for the Fund for the year ended August 31, 2005 because, among other considerations: (1) the management fee is competitive with those of the funds in its Selected Peer Group; (2) the new expense limit is below the median and average expense ratios of the funds in its Selected Peer Group; and (3) action has been taken to improve Fund performance and the Adviser committed to further address performance concerns. During this renewal process, different Board members may have given different weight to different individual factors and related conclusions.
The Adviser further addressed the Board’s concerns by recommending the engagement of Brandes as the Fund’s Sub-Adviser, replacing ING Investment Management Advisors B.V. (“IIMA”), the then-current Sub-Adviser to the Fund. On November 10, 2004, in reaching a decision to engage Brandes as the Fund’s Sub-Adviser, the Board, including a majority of the Independent Trustees, considered the performance of the Fund for the latest one-, three-, and five-year periods, as compared to the performance of a peer group of other international accounts with strategies comparable to the proposed investment strategy of the Fund. In addition to these considerations, the Board evaluated and discussed other factors, including, but not limited to, the following: (1) the process employed by Brandes in managing emerging market equities, the consistency of that process over time, and measures Brandes uses to address the risks of emerging market equities; (2) the nature and quality of the services to be provided by Brandes; (3) the relationship the Adviser has established with Brandes with regard to four different retail funds over the prior nine years; (4) the addition of an exclusivity provision in the proposed Sub-Advisory Contract; (5) the fairness of the compensation under the proposed Sub-Advisory Contract in light of the services to be provided by Brandes; (6) Brandes’ positive track record in managing the risks and volatility inherent in emerging markets funds; (7) the qualifications of Brandes’ personnel, portfolio management capabilities and investment methodologies; (8) Brandes’ operations, compliance program, and policies with respect to trade allocation and brokerage practices; (9) Brandes’ financial condition; (10) the costs for the services to be provided by Brandes and the fact that these costs will be paid by the Adviser and not directly by the Fund; (11) the consistency in investment style and portfolio turnover rates experienced over time by other emerging markets and international equity portfolios managed by Brandes; (12) the appropriateness of the selection of Brandes and the employment of the proposed investment strategy in light of the Fund’s investment objective and its current and prospective investor base; and (13) Brandes’ Code of Ethics, which has previously been approved for other ING Funds, and related procedures for complying with that Code. The Board also considered the advisory fee to be retained by the Adviser for its oversight and monitoring services to be provided to the Fund.
During the course of its deliberation as to whether to approve Brandes as Sub-Adviser to the Fund, the Board reached the following conclusions regarding Brandes and the proposed Sub-Advisory Contract, among others: (1) Brandes is qualified to manage the
119
ADVISORY CONTRACT APPROVAL DISCUSSION (UNAUDITED) (CONTINUED)
Fund’s assets in accordance with the proposed investment strategy, based in part on Brandes’ superior performance with other ING accounts currently managed by Brandes; (2) the proposed investment strategy is appropriate for pursuing long-term capital appreciation through a Fund that can invest throughout the world and is consistent with the interests of current and prospective investors in the Fund; (3) the proposed investment strategy would not materially affect the current risk profile of the Fund; (4) Brandes is expected to execute the proposed investment strategy consistently over time; (5) based on the financial statements of Brandes, Brandes has sufficient financial resources available to it to fulfill its commitments to the Fund under the proposed Sub-Advisory Contract; (6) the exclusivity provisions included in the proposed Sub-Advisory Contract with respect to the management of other mutual funds with similar investment objectives, policies and restrictions are likely to provide the Fund with the opportunity to realize asset growth during the exclusivity period; (7) Brandes is likely to manage the assets with a portfolio turnover rate that is relatively low for an international fund; and (8) the compensation to be paid by the Adviser to Brandes under the proposed Sub-Advisory Contract is fair in relation to the services to be provided by Brandes, the compensation paid to IIMA, the previous Sub-Adviser, and various industry averages for similar funds. Based upon these and other relevant conclusions, the Board determined to approve the Sub-Advisory Contract with Brandes for the Fund, with an initial two-year term that commenced on March 1, 2005.
In considering whether to approve the renewal of ING Emerging Countries Fund’s Advisory Contract for the interim period, in July 2005 the Board further considered that: (1) the Fund underperformed its primary benchmark index, the Lipper Category Median and the Morningstar Category Average for the year-to-date, one-year, three-year and five-year periods ended May 31 2005; and (2) the Fund outperformed its primary benchmark index, the Lipper Category Median and the Morningstar Category Average for the one- and three-month periods ended May 31, 2005. In considering this performance data, the Board considered that short-term performance had improved under Brandes, and longer-term performance could be attributed to IIMA, the Fund’s former Sub-Adviser.
After its deliberation, the Board reached the following conclusions: (1) the Fund’s management fee rate is reasonable in the context of all factors considered by the Board; (2) the Fund’s expense ratio is reasonable in the context of all factors considered by the Board; and (3) Brandes had been appointed as Sub-Adviser, effective March 1, 2005, and short-term performance, based upon periods ended May 31, 2005, showed improvement. The Board also noted that there would be further opportunity for review of more recent performance and other relevant factors in the course of deliberations for the next annual renewal in November 2005.
Based on these conclusions and other factors, the Board voted to renew the Advisory Contract for the Fund for the interim period ended November 30, 2005. During this renewal process, different Board members may have given different weight to different individual factors and related conclusions.
ING Foreign Fund
In its renewal deliberations for ING Foreign Fund in August 2004, the Board considered that: (1) the management fee for the Fund is above the median and the average management fees of the funds in its Selected Peer Group; (2) the expense ratio for the Fund is below the median and the average expense ratios of the funds in its Selected Peer Group; and (3) the Fund underperformed its primary benchmark index and Selected Peer Group for the periods presented. In analyzing this performance data, the Board considered that the Fund had commenced operations in July 2003, and therefore there had been only one year of prior performance available for analysis. The Board also noted that short-term performance was showing positive results.
In considering whether to approve the Fund’s interim period renewal, in July 2005 the Board further considered that, based on performance data for the period ended May 31, 2005: (1) the Fund outperformed its primary benchmark index, the Lipper Category Median, and the Morningstar Category Average for the one-month and one-year periods ended May 31, 2005; and (2) the Fund underperformed its primary benchmark index, the Lipper Category Median, and the Morningstar Category Average for the year-to-date and three-month period ended May 31 2005.
After its deliberation, the Board reached the following conclusions: (1) the Fund’s management fee rate is reasonable in the context of all factors considered by the Board; (2) the Fund’s expense ratio is reasonable in the context of all factors considered by the Board; (3) the Fund had been launched in July 2003 and more recent performance had been positive, and it was reasonable to permit the
120
ADVISORY CONTRACT APPROVAL DISCUSSION (UNAUDITED) (CONTINUED)
Sub-Adviser to continue to manage the Fund in order to demonstrate the more favorable longer-term performance anticipated by management; and (4) the sub-advisory fee rate payable by the Adviser to the Sub-Adviser is reasonable in the context of all factors considered by the Board. The Board also noted that there would be further opportunity for review of more recent performance and other relevant factors in the course of deliberations for the next annual renewal in November 2005.
Based on these conclusions and other factors, the Board voted to renew the Advisory and Sub-Advisory Contracts for the Fund for the year ended August 31, 2005 and the interim period ended November 30, 2005. During this renewal process, different Board members may have given different weight to different individual factors and related conclusions.
ING International Fund
In its renewal deliberations for ING International Fund in August 2004, the Board considered that: (1) the management fee for the Fund is above the median and the average management fees of the funds in its Selected Peer Group; (2) the expense ratio for the Fund is above the median and the average expense ratios of its Selected Peer Group; and (3) the Fund underperformed its benchmark index for the most recent calendar quarter, one-, two-, and three-year periods, but outperformed its Selected Peer Group median for the three-, five-, and ten-year periods.
In considering whether to approve the Fund’s interim period renewal, in July 2005 the Board further considered that, based on performance data for the period ended May 31, 2005, the Fund underperformed its primary benchmark index, the Lipper Category Median, and the Morningstar Category Average for all periods considered, except that it outperformed its Morningstar Category Average for the five-year period. In analyzing this performance data, the Board took into account management’s discussions regarding the performance of the Fund at periodic meetings. The Board also considered the report from the Investment Review Committee regarding discussions with management, at the Committee’s meeting on July 20, 2005, regarding recent underperformance and the measures undertaken by the Sub-Adviser to the Fund to address this underperformance, including affording portfolio managers access to additional research and enhancements to the Sub-Adviser’s stock selection process.
After its deliberation, the Board reached the following conclusions: (1) the Fund’s management fee rate is reasonable in the context of all factors considered by the Board; (2) the expense ratio for the Fund is reasonable in the context of all factors considered by the Board; (3) the portfolio managers have been consistent in their investment approach of focusing on higher quality international securities and the Adviser was working with the Sub-Adviser to improve the Fund’s performance, and it was reasonable to permit the Sub-Adviser to continue to manage the Fund in order to demonstrate the more favorable longer-term performance anticipated by management; and (4) the sub-advisory fee rate payable by the Adviser to the Sub-Adviser is reasonable in the context of all factors considered by the Board. The Board also noted that there would be further opportunity for review of recent performance and other relevant factors in the course of deliberations for the next annual renewal in November 2005.
Based on these conclusions and other factors, the Board voted to renew the Advisory and Sub-Advisory Contracts for the Fund for the year ended August 31, 2005 and the interim period ended November 30, 2005. During this renewal process, different Board members may have given different weight to different individual factors and related conclusions.
ING International SmallCap Fund
In its renewal deliberations for the Fund in August 2005, the Board considered that: (1) the management fee for the Fund is below the median and the average management fees of the funds in its Selected Peer Group; (2) the expense ratio for the Fund is below the median and the average expense ratios of the funds in its Selected Peer Group; (3) the Fund underperformed its benchmark index for all periods reviewed by the Board and its Selected Peer Group median for the one-, two-, and three-year periods, but outperformed its Selected Peer Group for the last calendar quarter. In analyzing this performance data, the Board considered the actions taken to address the Board’s concerns about the Fund’s performance.
After deliberations based on the above-listed factors, the Board renewed the Advisory Contract and Sub-Advisory Contract for the Fund for the year ended August 31, 2005 because, among other considerations: (1) the management fee for the Fund is competitive with that of its Selected Peer Group; (2) the expense
121
ADVISORY CONTRACT APPROVAL DISCUSSION (UNAUDITED) (CONTINUED)
ratio for the Fund is competitive with that of its Selected Peer Group; (3) the Fund’s performance has recently improved; and (4) action has been taken to improve Fund performance by implementing a change in portfolio management and the Adviser committed to further address performance concerns. During this renewal process, different Board members may have given different weight to different individual factors and related conclusions.
The Adviser further addressed the Board’s concerns by recommending the engagement of Acadian as the Fund’s Sub-Adviser, replacing Nicholas-Applegate Capital Management (“Nicholas-Applegate”), the then-current Sub-Adviser to the Fund. On November 10, 2004, in reaching a decision to engage Acadian as the Fund’s Sub-Adviser, the Board, including a majority of the Independent Trustees, considered the performance of the Fund for the latest one-, three-, and five-year periods. The Board considered the performance of a peer group of other international accounts with strategies comparable to the proposed investment strategy. In addition to these considerations, the Board evaluated and discussed other factors, including, but not limited to, the following: (1) the process employed by NWQ in managing international equities, the consistency of that process over time, and measures used to address the risks of international equities; (2) the nature and quality of the services to be provided by Acadian, including Acadian’s extensive research capabilities, disciplined and quantitative investment techniques and sophisticated analytical models; (3) the fairness of the compensation under the proposed Sub-Advisory Contract in light of the services to be provided and various industry averages for similar funds; (4) Acadian’s positive track record in managing the risks and volatility inherent in international portfolios; (5) the strong experience of Acadian’s personnel, portfolio management capabilities and investment methodologies; (6) Acadian’s operations, compliance program, and policies with respect to trade allocation and brokerage practices; (7) Acadian’s financial condition; (8) the costs for the services to be provided by Acadian and the fact that these costs will be paid by the Adviser and not directly by the Fund; (9) the consistency in investment style and portfolio turnover rates experienced over time by other international portfolios managed by Acadian; (10) the appropriateness of the selection of Acadian and the employment of the proposed investment strategy in light of the Fund’s investment objective and its current and prospective investor base; and (11) Acadian’s Code of Ethics and related procedures for complying with the Code. The Board also considered the advisory fee to be retained by the Adviser for its oversight and monitoring services to be provided to the Fund, the compensation paid to the current Sub-Adviser and various industry averages for similar funds.
During the course of its deliberation, the Board reached the following conclusions regarding Acadian and the proposed Sub-Advisory Contract, among others: (1) based, among other considerations, on its review of the Acadian International Small-Cap Composite as of September 30, 2004, which has outperformed its benchmark and the Lipper and Morningstar category averages on the year-to-date, one-, three- and five-year periods, Acadian is qualified to manage the Fund’s assets in accordance with its investment objective and the proposed investment strategy; (2) the proposed investment strategy is appropriate for pursuing maximum long-term capital appreciation through a Fund that can invest throughout the world and is consistent with the interests of current and prospective investors in the Fund; (3) the proposed investment strategy would not materially affect the current risk profile of the Fund; (4) Acadian is expected to execute the proposed investment strategy consistently over time; (5) based upon the financial statements of Acadian, Acadian has sufficient financial resources available to it to fulfill its commitments to the Fund under the proposed Sub-Advisory Contract; (6) Acadian is likely to manage the assets with a portfolio turnover rate that is relatively low for an international fund; and (7) the compensation to be paid by the Adviser to Acadian under the proposed Sub-Advisory Contract is fair in relation to the services to be provided by Acadian. Based upon these and other relevant conclusions, the Board determined to approve the Sub-Advisory Contract with Acadian for the Fund, with an initial two-year period that commenced on March 1, 2005.
In considering whether to approve the renewal of ING International Small Cap Fund’s Advisory Contract for the interim period, in July 2005 the Board further considered that: (1) the Fund outperformed its primary benchmark index, the Lipper Category Median and the Morningstar Category Average for the one-month period ended May 31, 2005; (2) the Fund outperformed the Lipper Category Median for the year-to-date and three-month periods ended May 31, 2005; and (3) the Fund underperformed for all other periods considered by the Board. In analyzing this performance data, the Board considered that short-term performance had improved under the
122
ADVISORY CONTRACT APPROVAL DISCUSSION (UNAUDITED) (CONTINUED)
management of Acadian, and longer-term underperformance could be attributed to the Fund’s former Sub-Adviser, Nicholas-Applegate.
After its deliberation, the Board reached the following conclusions: (1) the Fund’s management fee rate is reasonable in the context of all factors considered by the Board; (2) the Fund’s expense ratio is reasonable in the context of all factors considered by the Board; and (3) management had taken action to address Board concerns about the Fund’s performance, and short-term performance, based upon periods ended May 31, 2005, showed improvement. The Board also noted that there would be further opportunity for review of more recent performance and other relevant factors in the course of deliberations for the next annual renewal in November 2005.
Based on these conclusions and other factors, the Board voted to renew the Advisory Contract for the Fund for the interim period ended November 30, 2005. During this renewal process, different Board members may have given different weight to different individual factors and related conclusions.
ING International Value Fund
In its renewal deliberations for ING International Value Fund in August 2004, the Board considered that: (1) the management fee for ING International Value Fund is above the median and the average management fees of the funds in its Selected Peer Group, (2) the expense ratio for the Fund is above the median and the average expense ratios of the funds in its Selected Peer Group; and (3) the Fund outperformed its benchmark index and Selected Peer Group median for all periods reviewed by the Board.
In considering whether to approve the Fund’s interim period renewal, in July 2005 the Board further considered that, based on performance data for the period ended May 31, 2005: (1) the Fund outperformed its primary benchmark index, the Lipper Category Median, and the Morningstar Category Average for the five years ended May 31, 2005; (2) the Fund outperformed its primary benchmark index for the three-year period ended May 31, 2005 and outperformed its Lipper Category Median for the year-to-date period ended May 31, 2005; and (3) the Fund underperformed these performance measures for all other periods considered. In analyzing this performance data, the Board took into account management’s discussions regarding the performance of the Fund at periodic meetings. The Board also considered the report from the Investment Review Committee regarding discussions with management, at the Committee’s meeting on July 20, 2005, regarding recent underperformance and the measures undertaken by the Sub-Adviser to the Fund to address this underperformance, including affording portfolio managers access to additional research and enhancements to the Sub-Adviser’s stock selection process.
After its deliberation, the Board reached the following conclusions: (1) the Fund’s management fee rate is reasonable in the context of all factors considered by the Board; (2) the Fund’s expense ratio is reasonable in the context of all factors considered by the Board; (3) the Fund’s performance is reasonable in the context of all factors considered by the Board; and (4) the sub-advisory fee rate payable by the Adviser to the Sub-Adviser is reasonable in the context of all factors considered by the Board. The Board also noted that there would be further opportunity for review of recent performance and other relevant factors in the course of deliberations for the next annual renewal in November 2005.
Based on these conclusions and other factors, the Board voted to renew the Advisory and Sub-Advisory Contracts for the Fund for the year ended August 31, 2005 and the interim period ended November 30, 2005. During this renewal process, different Board members may have given different weight to different individual factors and related conclusions.
ING International Value Choice Fund
On November 10, 2004, the Board determined to engage NWQ as Sub-Adviser to ING International Value Choice Fund, a new series managed by NWQ. The Board considered, among other things, the composite performance of portfolios managed by NWQ with similar investment styles to that of the Fund. In addition to these considerations, the Board evaluated and discussed other factors, including, but not limited to, the following: (1) the process employed by NWQ in managing international equities, the consistency of that process over time, and measures used to address the risks of international equities; (2) the Adviser’s view of the reputation of NWQ; (3) NWQ’s experience and skill in managing large cap value and international accounts, including NWQ’s performance track record with other comparable accounts; (4) the nature and quality of the services to
123
ADVISORY CONTRACT APPROVAL DISCUSSION (UNAUDITED) (CONTINUED)
be provided by NWQ; (5) the addition of an exclusivity provision in the proposed Sub-Advisory Contract; (6) the fairness of the compensation under the proposed Sub-Advisory Contract in light of the services to be provided; (7) NWQ’s track record in managing the risks and volatility inherent in international and global funds; (8) the qualifications of NWQ’s personnel, portfolio management capabilities and investment methodologies; (9) NWQ’s operations, compliance program, and policies with respect to trade allocation and brokerage practices and proxy voting policies and procedures; (10) NWQ’s financial condition; (11) the costs for the services to be provided by NWQ and the fact that these costs will be paid by the Adviser and not directly by the Fund; (12) the consistency in investment style and portfolio turnover rates experienced over time by other international and domestic equity portfolios managed by NWQ; (13) the appropriateness of the selection of NWQ and the employment of the proposed investment strategy in light of the Fund’s proposed investment objective and prospective investor base; and (14) NWQ’s Code of Ethics and related procedures for complying with the Code. The Board also considered the advisory fee to be retained by the Adviser for its oversight and monitoring services to be provided to the Fund.
During the course of its deliberation, the Board reached the following conclusions regarding NWQ and the proposed Sub-Advisory Contract, among others: (1) NWQ is qualified to manage the Fund’s assets in accordance with the Fund’s proposed investment objective and investment strategies; (2) the proposed investment strategies are appropriate for pursuing long-term capital appreciation through a Fund that can invest throughout the world and is consistent with the interests of prospective investors in the Fund; (3) the proposed investment strategy would not materially affect the risk profile of the Fund; (4) NWQ is expected to execute the proposed investment strategies consistently over time; (5) based upon the financial statements of both NWQ and its parent company, Nuveen Investments, NWQ has sufficient financial resources available to it to fulfill its commitments to the Fund under the proposed Sub-Advisory Contract; (6) the exclusivity provisions included in the proposed Sub-Advisory Contract with respect to the management of other mutual funds with similar investment objectives, policies and restrictions are likely to provide the Fund with the opportunity to realize asset growth during the exclusivity period; (7) NWQ is likely to manage the assets with a portfolio turnover rate that is relatively low for international and global funds; and (8) taking into account the complexity and quality of the investment management services to be utilized by the Fund, the compensation to be paid by the Adviser under the proposed Sub-Advisory Contract is fair and reasonable in relation to the services to be provided by NWQ and various industry averages for similar funds. Based upon these and other relevant conclusions, the Board determined to approve the Sub-Advisory Contract with NWQ for the new Fund, with an initial two-year period that commenced on February 1, 2005, and to engage the Adviser to provide advisory services to the Fund. During this approval process, different Board members may have given different weight to different individual factors and related conclusions.
In considering whether to approve the renewal of ING International Value Choice Fund’s Advisory Contract for the interim period, in July 2005 the Board further considered that the Fund had outperformed its primary benchmark index, the Lipper Category Median and the Morningstar Category average for the one-month period ended May 1, 2005, and underperformed these performance measures for the three-month period ended May 1, 2005. In analyzing this performance data, the Board considered that the Fund commenced operations only in March 2005.
After its deliberation, the Board reached the following conclusions: (1) the Fund’s management fee rate is reasonable in the context of all factors considered by the Board; (2) the Fund’s expense ratio is reasonable in the context of all factors considered by the Board; and (3) the Fund’s performance is reasonable in the context of all factors considered by the Board. The Board also noted that there would be further opportunity for review of more recent performance and other relevant factors in the course of deliberations for the next annual renewal in November 2005.
Based on these conclusions and other factors, the Board voted to renew the Advisory Contract for the Fund for the interim period ended November 30, 2005. During this renewal process, different Board members may have given different weight to different individual factors and related conclusions.
ING Precious Metals Fund
In its renewal deliberations for ING Precious Metals Fund in August 2005, the Board considered that: (1) the management fee for the Fund is above the
124
ADVISORY CONTRACT APPROVAL DISCUSSION (UNAUDITED) (CONTINUED)
median and average management fees of the funds in its Selected Peer Group; (2) the expense ratio for the Fund is below the median and average expense ratios of the funds its Selected Peer Group; and (3) the Fund outperformed is style specific benchmark index for the one-, two-, three-, five-, and ten-year periods, but has underperformed its Selected Peer Group for all periods presented except the five-year period. In analyzing this data, the Board took into account that the Sub-Adviser was taking actions to improve the Fund’s performance.
In considering whether to approve the Fund’s interim period renewal, in July 2005 the Board further considered that the Fund outperformed its primary benchmark index for the five-year period ended May 31, 2005, but underperformed the primary benchmark index, the Lipper Category Median, and the Morningstar Category Average for all other periods ended May 31, 2005 that the Board considered. In analyzing this performance data, the Board considered the actions taken by management to improve the performance of the Fund.
After its deliberation, the Board reached the following conclusions: (1) the Fund’s management fee rate is reasonable in the context of all factors considered by the Board; (2) the Fund’s expense ratio is reasonable in the context of all factors considered by the Board; (3) in view of Adviser’s and Sub-Adviser’s efforts to implement alternatives to improve the Fund’s performance, it is reasonable to permit the Sub-Adviser to continue to manage the Fund to demonstrate the more favorable longer-term performance anticipated by management; and (4) the sub-advisory fee rate payable by the Adviser to the Sub-Adviser is reasonable in the context of all factors considered by the Board. The Board also noted that there would be further opportunity for review of more recent performance and other relevant factors in the course of deliberations for the next annual renewal in November 2005.
Based on these conclusions and other factors, the Board voted to renew the Advisory and Sub-Advisory Contracts for the Fund for the year ended August 31, 2005 and the interim period ended November 30, 2005. During this renewal process, different Board members may have given different weight to different individual factors and related conclusions.
ING Russia Fund
In its renewal deliberations for ING Russia Fund, the Board considered that: (1) the management fee for the Fund is above the median and the average management fees of the funds in its Selected Peer Group; (2) the expense ratio for the Fund is above the median and the average expense ratios of the funds in its Selected Peer Group; and (3) the Fund outperformed its country specific benchmark index for one- and two-year periods and most recent calendar quarter and its Selected Peer Group median for the two-, three-, and five-year periods.
In considering whether to approve the Fund’s interim period renewal, in July 2005 the Board further considered that, based on performance data for the period ended May 31, 2005: (1) the Fund outperformed its primary benchmark index and the Lipper Category Median for the five-year and year-to-date periods ended May 31, 2005, but underperformed the benchmark and the Lipper Category Median for all other periods considered; and (2) the Fund outperformed the Morningstar Category Average for the five-year, one-year, year-to-date and one-month periods ended May 31, 2005, but underperformed the Morningstar Category Average for all other periods considered.
After its deliberation, the Board reached the following conclusions: (1) the Fund’s management fee rate is reasonable in the context of all factors considered by the Board; (2) the Fund’s expense ratio is reasonable in the context of all factors considered by the Board; (3) the Fund’s performance is reasonable in the context of all factors considered by the Board; and (4) the sub-advisory fee rate payable by the Adviser to the Sub-Adviser is reasonable in the context of all factors considered by the Board. The Board also noted that there would be further opportunity for review of more recent performance and other relevant factors in the course of deliberations for the next annual renewal in November 2005.
Based on these conclusions and other factors, the Board voted to renew the Advisory and Sub-Advisory Contracts for the Fund for the year ended August 31, 2005 and the interim period ended November 30, 2005. During this renewal process, different Board members may have given different weight to different individual factors and related conclusions.
125
(THIS PAGE INTENTIONALLY LEFT BLANK)
ING Funds Distributor, LLC offers the funds listed below. Before investing in a fund, shareholders should carefully review the fund’s prospectus. Investors may obtain a copy of a prospectus of any ING Fund by calling (800) 992-0180 or by going to www.ingfunds.com.
Domestic Equity and Income Funds
ING Balanced Fund
ING Convertible Fund
ING Equity and Bond Fund
ING Equity Income Fund
ING Real Estate Fund
Domestic Equity Growth Funds
ING Disciplined LargeCap Fund
ING Growth Fund
ING LargeCap Growth Fund
ING MidCap Opportunities Fund
ING SmallCap Opportunities Fund
ING Small Company Fund
Domestic Equity Index Funds
ING Index Plus LargeCap Fund
ING Index Plus MidCap Fund
ING Index Plus SmallCap Fund
Domestic Equity Value Funds
ING Financial Services Fund
ING LargeCap Value Fund
ING MagnaCap Fund
ING MidCap Value Fund
ING MidCap Value Choice Fund
ING SmallCap Value Fund
ING SmallCap Value Choice Fund
ING Value Opportunity Fund
Fixed Income Funds
ING GNMA Income Fund
ING Government Fund
ING High Yield Bond Fund
ING Intermediate Bond Fund
ING National Tax-Exempt Bond Fund
Global Equity Funds
ING Global Equity Dividend Fund
ING Global Real Estate Fund
ING Global Science and Technology Fund
ING Global Value Choice Fund
International Equity Funds
ING Emerging Countries Fund
ING Foreign Fund
ING International Fund
ING International Growth Fund
ING International SmallCap Fund
ING International Value Fund
ING International Value Choice Fund
ING Precious Metals Fund
ING Russia Fund
Loan Participation Fund
ING Senior Income Fund
Money Market Funds*
ING Aeltus Money Market Fund
ING Classic Money Market Fund
ING Institutional Prime Money Market Fund
Strategic Allocation Funds
ING Strategic Allocation Balanced Fund
ING Strategic Allocation Growth Fund
ING Strategic Allocation Income Fund
* An investment in the Fund is not insured or guaranteed by the Federal Deposit Insurance Corporation or any other government agency. Although the Fund seeks to preserve the value of your investment at $1.00 per share, it is possible to lose money by investing in the Fund.
PROXY VOTING INFORMATION
A description of the policies and procedures that the Registrant uses to determine how to vote proxies related to portfolio securities is available (1) without charge, upon request, by calling Shareholder Services toll-free at 800-992-0180; (2) on the Registrant’s website at www.ingfunds.com and (3) on the Securities and Exchange Commission’s (“SEC”) website at www.sec.gov. Information regarding how the Registrant voted proxies related to portfolio securities during the most recent 12-month period ended June 30 is available without charge on the Registrant’s website at www.ingfunds.com and on the SEC’s website at www.sec.gov.
QUARTERLY PORTFOLIO HOLDINGS
The Registrant files its complete schedule of portfolio holdings with the SEC for the first and third quarters of each fiscal year on Form N-Q. The Registrant’s Forms N-Q are available on the SEC’s website at www.sec.gov. The Registrant’s Forms N-Q may be reviewed and copied at the SEC’s Public Reference Room in Washington, DC, and information on the operation of the Public Reference Room may be obtained by calling 1-800-SEC-0330; and is available upon request from the Registrant by calling Shareholder Services toll-free at 800-992-0180.
Investment Manager
ING Investments, LLC
7337 E. Doubletree Ranch Road
Scottsdale, Arizona 85258
Administrator
ING Funds Services, LLC
7337 E. Doubletree Ranch Road
Scottsdale, Arizona 85258
Distributor
ING Funds Distributor, LLC
7337 E. Doubletree Ranch Road
Scottsdale, Arizona 85258
1-800-334-3444
Transfer Agent
DST Systems, Inc.
P.O. Box 419368
Kansas City, Missouri 64141
Custodian
The Bank of New York
100 Colonial Center Parkway, Suite 300
Lake Mary, Florida 32746
Legal Counsel
Dechert
1775 I Street, N.W.
Washington, D.C. 20006
Independent Registered Public Accounting Firm
KPMG LLP
99 High Street
Boston, Massachussetts 02110
For more complete information, or to obtain a prospectus on any ING fund, please call your Investment Professional or ING Funds Distributor, LLC at (800) 992-0180 or log on to www.ingfunds.com. The prospectus should be read carefully before investing. Consider the fund’s investment objectives, risks, charges and expenses carefully before investing. The prospectus contains this information and other information about the fund.

| PRAR-UINTLABCM | (1005-122905) |

|
Funds
|
| Annual Report |
| |
| October 31, 2005 |
| |
| Classes I and Q |
| |
| |
| Global Equity Funds |
| |
| § ING Global Real Estate Fund |
| § ING Global Value Choice Fund |
| |
| International Equity Funds |
| |
| § ING Emerging Countries Fund |
| § ING Foreign Fund |
| § ING International Fund |
| § ING International SmallCap Fund |
| § ING International Value Fund |
 E-Delivery Sign-up – details inside E-Delivery Sign-up – details inside
|
This report is submitted for general information to shareholders of the ING Funds. It is not authorized for distribution to prospective shareholders unless accompanied or preceded by a prospectus which includes details regarding the funds’ investment objectives, risks, charges, expenses and other information. This information should be read carefully. | 
|
| | | | | | |
| |
| Go Paperless with E-Delivery! |
| | |
| | Sign up now for on-line prospectuses, fund reports, and proxy statements. In less than five minutes, you can help reduce paper mail and lower fund costs. | | |
| | | | |
| | Just go to www.ingfunds.com, click on the E-Delivery icon from the home page, follow the directions and complete the quick 5 Steps to Enroll. | | |
| | | | |
| | You will be notified by e-mail when these communications become available on the internet. Documents that are not available on the internet will continue to be sent by mail. | | |
| | | | | | |
(THIS PAGE INTENTIONALLY LEFT BLANK)
| |

| Dear Shareholder, |
|
We are in the midst of an exciting time here at ING Funds. We began the year by introducing the ING Global Equity Dividend and Premium Opportunity Fund that gave investors an opportunity to invest in global companies with a history of attractive dividend yields. |
|
When the Fund’s initial offering period closed, it proved to be one of the five largest unleveraged closed-end funds in history. |
|
The success of the Fund offering illustrates what ING Funds is really all about: fresh thinking in financial services. The Fund’s offering success also confirmed something else that we have long believed; namely, that investors are excited about opportunities beyond our shores. |
|
As globalization grows, investment opportunities grow as well. In 1970, only about one-third of equity market capitalization was located abroad; by 2004, that number had jumped to 50 percent1. It is often said that the world is becoming ever more complicated. This is undoubtedly true in the world of |
investments where the range of asset classes and investment techniques has never been wider. To take advantage of the opportunities that are now available, it is essential to seek investment partners who have the required breadth and depth of experience — on a global basis. |
|
Our goal at ING Funds is to deliver innovative investment products that help you, the investor, to achieve your financial dreams. We have also long been committed to uncovering opportunities worldwide. |
|
We will continue to bring you opportunities — wherever they occur. With access to more than 700 ING investment management professionals who are located around the world and who, in our consideration, deliver exceptional insight into markets in Europe, the Americas and the Asia-Pacific region, we believe we are in a unique position to help you take advantage of the opportunities that the world has to offer. |
|
On behalf of everyone here at ING Funds, I thank you for your continued support and loyalty. We look forward to serving you in the future. |
|
Sincerely, |

James M. Hennessy
President
ING Funds
December 5, 2005
The views expressed in the President’s Letter reflect those of the President as of the date of the letter. Any such views are subject to change at any time based upon market or other conditions and ING Funds disclaims any responsibility to update such views. These views may not be relied on as investment advice and because investment decisions for an ING Fund are based on numerous factors, may not be relied on as an indication of investment intent on behalf of any ING Fund. Reference to specific company securities should not be construed as recommendations or investment advice.
International investing does pose special risks including currency fluctuation, economic and political risks not found in investments that are solely domestic.
1 Morgan Stanley Capital International
1
MARKET PERSPECTIVE: YEAR ENDED OCTOBER 31, 2005
Investors in global equities gained 7.2% in the second half of our 12-month review period (13.3% for the twelve months as a whole), after 5.7% in the first half, according to the Morgan Stanley Capital International (“MSCI”) World Index(1) in dollars, including net reinvested dividends. Little of the 7.2% however, was made after July 2005, with July 2005 being the best month since 2003. In currencies, the dollar built on early strength in 2004, reflecting faster U.S. growth and rising short-term interest rates. The euro was further buffeted by the defeat of a proposal for a European constitution, acrimonious stalemate on a European budget and German electoral indecision. For the second six months the U.S. dollar rose 7.4% (6.7% for the twelve months as a whole), against the euro 7.8% (3.8% for the twelve months as a whole), against the pound and 11.1% (10.0% for the twelve months as a whole), against the oil price sensitive yen.
Trends in investment grade U.S. fixed income securities had been dominated since the middle of 2004 by the flattening of the U.S. Treasury yield curve as ten-year U.S. Treasury yields fell, even as the Federal Open Market Committee (“FOMC”) raised short-term interest rates seven times to the end of March 2005. The curve-flattening trend was further sustained by three more increases in May 2005, June 2005 and August 2005. August 2005 ended with second quarter gross domestic product (“GDP”) growth being revised down and a final new record oil price of almost $70 a barrel as Hurricane Katrina’s devastation became known. But any hopes that the FOMC might now relent vanished in September 2005 when factory prices were reported to have risen by the most in decades. The FOMC duly struck for the 11th time. Inflationary clouds continued to gather in October 2005, pulling both short- and long-term rates higher. For the half-year, the yield on the ten-year U.S. Treasury Note rose by 36 basis points to 4.56% (53 basis points for the twelve months as a whole), while that on 13-week U.S Treasury Bills rose 99 basis points, to 3.88% (198 basis points for the twelve months as a whole). The return on the broader Lehman Aggregate Bond Index(2) was 0.15% for the six months.
The U.S. equities market in the form of the Standard & Poor’s 500 Composite Stock Price (“S&P 500”) Index(3), gained 5.00%, including dividends in the six months through October 2005 (8.72% for the twelve months as a whole). Investors warily watched interest rates as they ultimately rose at the long end as well as the short. Falling mortgage interest rates have encouraged refinancing on a massive scale and the funds raised have tended not to stay long in the wallets of American consumers, keeping expansion strong. Still, stocks benefited from July 2005’s positive economic data, especially robust second quarter company earnings figures. The S&P 500 Index reached its best level, a four-year high on August 3, 2005, but then fell back. Little headway was made after Hurricane Katrina and Hurricane Rita. High prices at the gas pump were already here and an expensive winter for heating fuel was expected. Continual and pervasive reports of sharply rising prices persisted through October, and with consumer confidence slumping, stocks pulled back. However, in the last two days of October 2005, stocks slashed their losses amid reports that evidenced recovery from the Hurricanes. Perhaps we could look forward to a year-end rally after all.
Japan equities soared 16.6%, based on the MSCI Japan Index(4) (“Index”) in dollars plus net dividends, for the six months ended October 31, 2005 (22.3% for the twelve months as a whole). The Index actually rose a remarkable 29.3% in yen, which weakened as money increasingly abandoned low yielding yen-denominated securities in favor of ever-higher dollar interest rates. The market did little until August 2005, but thereafter, a new sense of optimism took hold, based on an encouraging improvement in domestic demand suggesting a return to a balanced economy after years of export dependency. In addition, it was the prospect of a new reformist beginning under Prime Minister Koizumi, who won a landslide election victory in support of his proposal to privatize Japan Post, the savings vehicle of choice among the Japanese public and, improbably, the world’s largest financial institution. By October 31, 2005, the Bank of Japan was even predicting a swift end to deflation, propelling local currency indices toward five-year records.
European ex UK markets added 7.5% in the six months ended October 31, 2005, according to the MSCI Europe ex UK Index(5) including net dividends (17.40% for the twelve months as a whole). Such bullish performance belied bearish economic conditions. High unemployment and restrictive employment practices continued to depress domestic demand, while European ministerial bickering and political deadlock in Germany disappointed reformers, which resulted in the depressing of the euro. Stock markets cheered the weaker currency and corporate profits held up, allowing stocks to advance in the face of record low bond yields. Markets drifted down 3.2% in October 2005 however, despite improved business
2
MARKET PERSPECTIVE: YEAR ENDED OCTOBER 31, 2005
confidence and strong purchasing managers’ reports. The loss would have been worse had a surge of merger and acquisition activity on the last day not lifted markets by approximately 2%. The problem was the combination of the highest inflation in over four years: 2.6% and increasingly tough talk from the European Central Bank, which seemed to be preparing markets for an unwelcome rate increase.
The UK market gained 3.6% in dollars in the second six months, based on the MSCI UK Index(6) including net dividends (14.2% for the twelve months as a whole). The UK’s interest rate cycle is ahead of those in other economies. The tightening to restrain over-stretched consumers and soaring real estate prices is long since complete and has taken effect. GDP growth is set to fall in 2005 to about 11/2%, the lowest since 1992. Manufacturing is in decline. The Bank of England has even started to reverse the process with one rate reduction. Nonetheless, company earnings held up and despite terrorist attacks, investors supported an inexpensive market that paid over 3% in dividends. As in Europe, UK equities slumped 3.1% in October 2005, again relieved from an even bigger loss by the late merger and acquisition action. The scope for further rate reductions seemed to evaporate as consumer price inflation was reported at a multi-year high.
(1) The MSCI World Index is an unmanaged index that measures the performance of over 1,400 securities listed on exchanges in the U.S., Europe, Canada, Australia, New Zealand and the Far East.
(2) The Lehman Brothers Aggregate Bond Index is a widely recognized, unmanaged index of publicly issued investment grade U.S. Government, mortgage-backed, asset-backed and corporate debt securities.
(3) The Standard & Poor’s 500 Composite Stock Price Index is an unmanaged index that measures the performance of securities of approximately 500 of the largest companies in the United States.
(4) The MSCI Japan Index is a free float-adjusted market capitalization index that is designed to measure developed market equity performance in Japan.
(5) The MSCI Europe ex UK Index is a free float-adjusted market capitalization index that is designed to measure developed market equity performance in Europe, excluding the UK.
(6) The MSCI UK Index is a free float-adjusted market capitalization index that is designed to measure developed market equity performance in the UK.
All indices are unmanaged and investors cannot invest directly in an index.
Past performance does not guarantee future results. The performance quoted represents past performance. Investment return and principal value of an investment will fluctuate, and shares, when redeemed, may be worth more or less than their original cost. The Funds’ performance is subject to change since the period’s end and may be lower or higher than the performance data shown. Please call (800) 992-0180 or log on to www.ingfunds.com to obtain performance data current to the most recent month end.
Market Perspective reflects the views of the Chief Investment Risk Officer only through the end of the period, and is subject to change based on market and other conditions.
3
ING GLOBAL REAL ESTATE FUND | PORTFOLIO MANAGERS’ REPORT |
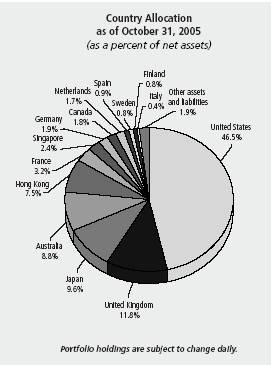
The ING Global Real Estate Fund seeks to provide investors with high total return. The Fund is managed by a team led by T. Ritson Ferguson, Chief Investment Officer, ING Clarion Real Estate Securities L.P. — the Sub-Adviser.
Performance: From June 3, 2005, the inception date of Class I, to October 31, 2005, the Fund’s Class I shares provided a total return of 6.14% compared to the Standard and Poor’s (“S&P”)/Citigroup World Property Index, which returned 7.09% for the same period.
Portfolio Specifics: Property stocks around the world have benefited from strong performance relative to other equities over the past several years as a result of the desire for predictable cash flows as generated by real estate. Investment characteristics include high free cash flow from long lease terms, dividend yield, stable earnings growth, and low to moderate correlation to broad equities. The Fund, while maintaining a core of higher dividend yielding, defensively positioned stocks, has shifted over the past several months into higher growth sectors which will likely respond better to economic recovery (for example the office, industrial and lodging sectors, and the Asia-Pacific ex-Australia region).
Global property stocks were up 20.4% (S&P/Citigroup World Property Index) for the year ended October 31, 2005, propelled by strong returns in all major regions of the world. By region, continental Europe (up 30.0%) was the strongest performer followed by the Asia-Pacific region (+22.2%) and North America (up 18.3%).
Performance for the Fund over the twelve months was 21.95% which outperformed the benchmark return by 156 basis points driven exclusively by stock selection. Two-thirds of the superior stock selection was generated within the U.S., including a number of office and apartment companies. Approximately one-quarter of the stock selection outperformance was from continental Europe, driven by selections in France, including Nexity a homebuilder with a focus on the provinces. Global themes for the year included continued yield compression, mergers and acquisitions activity, the prospect of rising interest rates, syndicate activity (companies raising new equity) and, more recently, increasing evidence of a sustained economic recovery in Japan.
The strongest performer for the year among major countries was Japan (up 34.4%) where property stocks continue to climb on increasing evidence that an economic recovery in Japan is underway. This evidence has been seen in the property markets via many data points, including the September report by the Japan Land Ministry reported that land prices in Tokyo (23 wards) increased for both residential and commercial properties for the first time in 15 years (for the year ended July 1, 2005). Residential prices were up 50 basis points, commercial up 60 basis points. Land prices have decreased, until recently, every year since 1991.
The U.S. dollar generally continued to strengthen during the year versus other major currencies, particularly versus the Japanese yen, increasing by 10.1%. The U.S. dollar also strengthened by 6.1% versus the Euro, 3.5% versus the British pound and 3.1% versus the Canadian dollar.
Current Strategy and Outlook: Global property companies have provided strong absolute and relative returns when compared to broad equities over the past several years. Valuation disparities continue to provide investment opportunities to an investor with a global scope. Through an average 3%-4% dividend yield plus 5%-8% prospective annual earnings growth, we believe global property stocks continue to be well-positioned to conservatively deliver attractive total returns over the next several years.
Top Ten Industries
as of October 31, 2005
(as a percent of net assets) |
| | | |
Office Buildings | | 29.1 | % |
| | | |
Diversified Property Holdings | | 15.5 | % |
| | | |
Retail: Enclosed Malls | | 13.7 | % |
| | | |
Retail: Shopping Center | | 10.4 | % |
| | | |
Residential Apartments | | 8.9 | % |
| | | |
Industrial Properties | | 6.3 | % |
| | | |
Residential: Hotels | | 3.0 | % |
| | | |
Real Estate Services | | 2.7 | % |
| | | |
Self Storage Property | | 2.5 | % |
| | | |
Closed End Investment Companies | | 1.5 | % |
Portfolio holdings are subject to change daily.
4
PORTFOLIO MANAGERS’ REPORT | ING GLOBAL REAL ESTATE FUND |
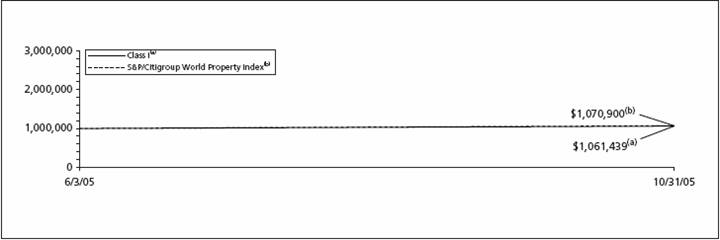
| | | | |
| Cumulative Total Returns for the Periods Ended October 31, 2005 | |
| | | | |
| | | Since Inception | |
| | | of Class I | |
| | | June 3, 2005 | |
| Class I | | 6.14 | % | |
| S&P/Citigroup World Property Index(1) | | 7.09 | %(2) | |
| | | | |
Based on a $1,000,000 initial investment, the graph and table above illustrate the total return of ING Global Real Estate Fund against the index indicated. An Index is unmanaged and has no cash in its portfolio, imposes no sales charge and incurs no operating expenses. An investor cannot invest directly in an index. The Fund’s performance is shown both with and without the imposition of sales charges.
The performance graph and table do not reflect the deduction of taxes that a shareholder will pay on Fund distributions or the redemption of Fund shares.
The performance shown may include the effect of fee waivers and/or expense reimbursements by the Investment Manager and/or other service providers, which have the effect of increasing total return. Had all fees and expenses been considered, the total returns would have been lower.
Performance data represents past performance and is no assurance of future results. Investment return and principal value of an investment in the Fund will fluctuate. Shares, when sold, may be worth more or less than their original cost. The Fund’s current performance may be lower or higher than the performance data shown. Please log on to www.ingfunds.com or call (800) 992-0180 to get performance through the most recent month end.
It is important to note that the Fund has a limited operating history. Performance over a longer period of time may be more meaningful than short-term performance.
This report contains statements that may be “forward-looking” statements. Actual results may differ materially from those projected in the “forward-looking” statements.
The views expressed in this report reflect those of the portfolio managers, only through the end of the period as stated on the cover. The portfolio managers’ views are subject to change at any time based on market and other conditions.
Fund holdings are subject to change daily.
(1) The S&P/Citigroup World Property Index is an unmanaged market-weighted total return index which consists of many companies from developed markets whose floats are larger than $100 million and derive more than half of their revenue from property-related activities.
(2) Since inception performance for index is shown from June 1, 2005.
5
ING GLOBAL VALUE CHOICE FUND | PORTFOLIO MANAGERS’ REPORT |

The ING Global Value Choice Fund (the “Fund”) seeks long-term capital appreciation. The Fund is managed by Paul Hechmer, Gregg Tenser, CFA, Mark Morris, CFA and Jon Bosse, CFA, Portfolio Managers, NWQ Investment Management Company, LLC — the Sub-Adviser.
Performance: For the year ended October 31, 2005, the Fund’s Class Q shares provided a total return of 14.19% compared to the Morgan Stanley Capital International (“MSCI”) World Index 13.82% for the same period.
Portfolio Specifics: Since assuming sub-advisory management of the Fund, the ING Global Value Choice Fund has outperformed the benchmark, the MSCI World Index. From an absolute return perspective, the Fund generated positive returns in both the U.S. and in the rest of the world, although returns from overseas were mitigated somewhat by a stronger U.S. dollar. With that being said, the non-U.S. portion of the Fund outperformed the U.S. portion, as international markets continued their strong run, which started in 2003.
On both an absolute and relative basis, companies within the energy sector contributed most to performance as the oil price reached close to $70 a barrel. Individual names, including Suncor Energy, the Canadian oil sands company, and Noble Energy and Kerr McGee in the U.S., performed well. Exposure to the materials sector and exposure to select companies in the industrials sector, including Metso Corp. in Finland, also aided returns. On the negative side, overweight exposure to the telecommunications sector, primarily through international companies including Chunghwa Telecom and Belgacom, detracted from returns, with both weaker currencies and negative absolute company performance hurting Fund returns. However, we continue to believe that the telecommunications sector continues to offer dominant companies with very attractive valuation characteristics. Holdings in the financials sector, including Federal National Mortgage Association (“Fannie Mae”) and Countrywide Financial, also hurt performance.
Current Strategy and Outlook: Value opportunities continue to be found in global markets and those opportunities are finely balanced between both U.S. and international companies. In the U.S., corporate earnings and cash flows have been growing at a double-digit pace for the last several years, with many companies experiencing record profit margins and profitability. This has resulted in corporations having record amounts of cash on their balance sheets, which they are increasingly using for acquisitions and share repurchases, and has provided strong support for equity markets. While stock market valuations appear reasonable on current record profits, it is unclear the impact that anticipated Federal Reserve rate hikes, aimed to deflate inflation pressures, will have on the economy and the outlook for corporate profits.
In the rest of the world, markets have rallied strongly now since March 2003, and as a result, value opportunities in the international space are proving harder to find. However, on a relative basis, overseas markets continue to trade at lower multiples than the U.S., and as bottom-up value managers on an opportunistic basis, we continue to find selective opportunities. Regionally, we maintain a modest underweight to the U.S. and outside of the U.S., we continue to find more opportunities in Japan and Asia ex Japan rather than Europe. From a sector perspective we continue to find more value in the basic materials and telecommunications sectors.
Top Ten Industries
as of October 31, 2005
(as a percent of net assets) |
| | | |
Mining | | 10.4 | % |
| | | |
Oil and Gas | | 10.2 | % |
| | | |
Telecommunications | | 10.2 | % |
| | | |
Diversified Financial Services | | 8.8 | % |
| | | |
Aeorspace/Defense | | 5.2 | % |
| | | |
Software | | 4.9 | % |
| | | |
Insurance | | 3.4 | % |
| | | |
Media | | 3.4 | % |
| | | |
Agriculture | | 3.0 | % |
| | | |
Electric | | 2.7 | % |
Portfolio holdings are subject to change daily.
Effective February 1, 2005 NWQ Investment Management Company, LLC became Sub-Adviser to ING Global Value Choice Fund. Prior to February 1, 2005, the Fund was sub-advised by ING Investment Management Co. (formerly, Aeltus Investment Management, Inc.)
6
PORTFOLIO MANAGERS’ REPORT | | ING GLOBAL VALUE CHOICE FUND |
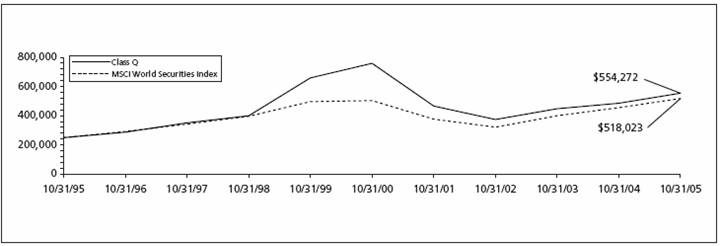
| | | | | | | | |
| Average Annual Total Returns for the Periods Ended October 31, 2005 | |
| | | | | | | | |
| | | 1 Year | | 5 Year | | 10 Year | |
| Class Q | | 14.19 | % | | (6.09 | )% | | 8.28 | % | |
| MSCI World Index(1) | | 13.82 | % | | 0.57 | % | | 7.56 | % | |
| | | | | | | | |
Based on a $250,000 initial investment, the graph and table above illustrate the total return of ING Global Value Choice Fund against the Index or Indices indicated. An Index is unmanaged and has no cash in its portfolio, imposes no sales charges and incurs no operating expenses. An investor cannot invest directly in an index. The Fund’s performance is shown both with and without the imposition of sales charges.
The performance table does not reflect the deduction of taxes that a shareholder will pay on Fund distributions or the redemption of Fund shares.
Total returns reflect that the Investment Manager may have waived or recouped fees and expenses otherwise payable by the Fund.
Performance data represents past performance and is no assurance of future results. Investment return and principal value of an investment in the Fund will fluctuate. Shares, when sold, may be worth more or less than their original cost. The Fund’s current performance may be lower or higher than the performance data shown. Please log on to www.ingfunds.com or call (800) 992-0180 to get performance through the most recent month end.
This report contains statements that may be “forward-looking” statements. Actual results may differ materially from those projected in the “forward-looking” statements.
The views expressed in this report reflect those of the portfolio managers, only through the end of the period as stated on the cover. The portfolio managers’ views are subject to change at any time based on market and other conditions.
Fund holdings are subject to change daily.
(1) The MSCI World Index is an unmanaged index that measures the performance of over 1,400 securities listed on exchanges in the U.S., Europe, Canada, Australia, New Zealand and the Far East.
7
ING EMERGING COUNTRIES FUND | PORTFOLIO MANAGERS’ REPORT |
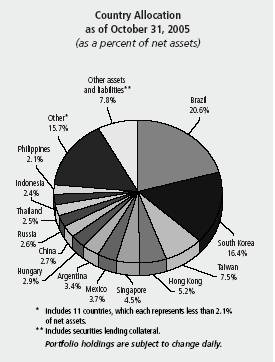
The ING Emerging Countries Fund (the “Fund”) seeks maximum long-term capital appreciation. The Fund is managed by Brandes Investment Partners, L.P. — the Sub-Adviser.* Brandes’ Emerging Markets Investment Committee is responsible for making the day-to-day investment decisions for the Fund.
Performance: For the year ended October 31, 2005, the Fund’s Class Q shares provided a total return of 21.89% compared to the Morgan Stanley Capital International (“MSCI”) Emerging Markets (“EM”) Index, which returned 34.34% for the same period.
Portfolio Specifics: During the first four months of the reporting period, the Fund slightly underperformed its benchmark (22.5% versus 24.8%). The main elements of underperformance over the four-month period were stock selection among financials and in Turkish stocks, as well as the opportunity loss from maintaining a cash balance in a strong market.
From March 1, 2005 through October 31, 2005, on a country and industry level, advances for holdings in Brazil and South Korea contributed to the Fund’s performance. Such holdings included Uniao de Bancos Brasil (Brazil — commercial banking), CIA Paranaense de Energia (Brazil — utilities), and Korea Electric Power (South Korea — electric utilities). Other positions posting gains included Lukoil (Russia — oil, gas & consumable fuels) and Quilmes (Argentina — beverages).
The Fund’s holdings in China and Indonesia tended to weigh on performance. Positions in these countries declining in the period included PT Gudang Garam (Indonesia — tobacco), Brilliance Auto Holdings (China — automobiles), and Sinopec Yizheng Chemical Fibres (China — chemicals).
From an industry perspective, gains for holdings in beverages, oil, gas & consumable fuels, and commercial banking made the most substantial contribution to performance. Top performers in these industries included Quilmes (Argentina — beverages), Lukoil (Russia — oil, gas & consumable fuels), and Uniao de Bancos Brasil (Brazil — commercial banking). Positions in the wireless telecom services industry, such as Telesp Celular Participacoes (Brazil) and Telecentro Oeste Celular (Brazil), tended to decline.
The main reasons for the underperformance against the benchmark in the eight-month period ended October 31, 2005, were stock selection, especially in the wireless telecommunications industry, and an underweighting in the top performing oil, gas & consumable fuels industry. The Fund’s industry exposure is a residual of our investment process, which focuses on company-by-company analysis to identify undervalued securities.
After the Fund’s portfolio management change on March 1, 2005, we established a wide range of positions at prices that we considered attractive. During the subsequent period, the Fund sold positions such as Hite Brewing (South Korea — beverages), and Fraser & Neave Limited (Singapore — beverages) as appreciation pushed their market prices toward our estimates of their long-term values.
Current Strategy and Outlook: For the four months ended March 1, 2005, India, Turkey and Brazil were the largest overweight countries in their respective regions (Asia, EMEA and Latin America). The Fund was also underweight in China, South Korea, Hungary and Chile, which were among the strongest performing countries. In terms of sectors, the Fund was overweight financials and telecommunications, and underweight consumer staples and industrials.
During the eight-month period from March 1, 2005 through October 31, 2005, the Fund’s country and industry exposures shifted slightly due to stock-specific buying and selling as well as changes in the prices of holdings. For example, exposure to Brazil increased, while exposure to South Korea and the commercial banking industry tended to decline. The Fund’s weightings for industries and countries are not the product of “top-down” forecasts or opinions, but merely stem from our company-by-company search for compelling investment opportunities in markets around the world. As of October 31, 2005, the Fund’s largest positions were in Brazil and South Korea, and in the diversified telecom services and commercial banking industries.
The Fund’s weightings for industries and countries are not the product of “top-down” forecasts or opinions, but merely stem from our company-by-company search for compelling investment opportunities in markets around the world.
Overall, while we offer no predictions regarding the short-term direction of equities in emerging markets, we believe the Fund remains well positioned to deliver favorable long-term results. We believe that all holdings remain undervalued, and we expect to realize significant profit as the market recognizes their true worth.
Top Ten Industries
as of October 31, 2005
(as a percent of net assets) |
| | | |
Telecommunications | | 31.2 | % |
| | | |
Banks | | 10.7 | % |
| | | |
Electric | | 10.6 | % |
| | | |
Chemicals | | 4.6 | % |
| | | |
Semiconductors | | 3.8 | % |
| | | |
Auto Manufacturers | | 3.1 | % |
| | | |
Food | | 3.0 | % |
| | | |
Electrical Components and Equipment | | 2.6 | % |
| | | |
Oil and Gas | | 2.6 | % |
| | | |
Retail | | 2.6 | % |
Portfolio holdings are subject to change daily.
* Effective March 1, 2005 Brandes Investment Partners L.P. became sub-adviser to ING Emerging Countries Fund. Prior to March 1, 2005, the Fund was sub-advised by ING Investment Management B.V.
8
PORTFOLIO MANAGERS’ REPORT | | ING EMERGING COUNTRIES FUND |
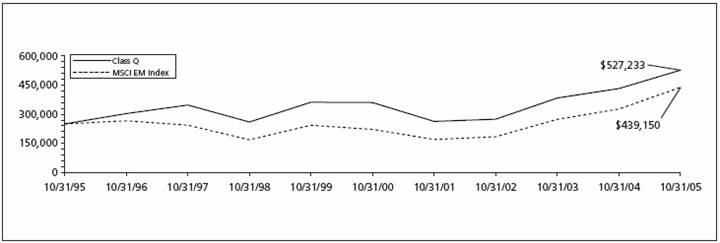
| | | | | | | | |
| Average Annual Total Returns for the Periods Ended October 31, 2005 | |
| | | | | | | | |
| | | 1 Year | | 5 Year | | 10 Year | |
| Class Q | | 21.89 | % | | 7.91 | % | | 7.74 | % | |
| MSCI EM Index(1) | | 34.34 | % | | 14.64 | % | | 5.80 | % | |
| | | | | | | | |
Based on a $250,000 initial investment, the graph and table above illustrate the total return of ING Emerging Countries Fund against the Index or Indices indicated. An Index is unmanaged and has no cash in its portfolio, imposes no sales charges and incurs no operating expenses. An investor cannot invest directly in an index. The Fund’s performance is shown both with and without the imposition of sales charges.
The performance graph and table do not reflect the deduction of taxes that a shareholder will pay on Fund distributions or the redemption of Fund shares.
Total returns reflect that the Investment Manager may have waived or recouped fees and expenses otherwise payable by the Fund.
Performance data represents past performance and is no assurance of future results. Investment return and principal value of an investment in the Fund will fluctuate. Shares, when sold, may be worth more or less than their original cost. The Fund’s current performance may be lower or higher than the performance data shown. Please log on to www.ingfunds.com or call (800) 992-0180 to get performance through the most recent month end.
This report contains statements that may be “forward-looking” statements. Actual results may differ materially from those projected in the “forward-looking” statements.
The views expressed in this report reflect those of the portfolio managers, only through the end of the period as stated on the cover. The portfolio managers’ views are subject to change at any time based on market and other conditions.
Fund holdings are subject to change daily.
(1) The MSCI EM Index is an unmanaged index that measures the performance of securities listed on exchanges in developing nations throughout the world.
9
ING FOREIGN FUND | PORTFOLIO MANAGERS’ REPORT |
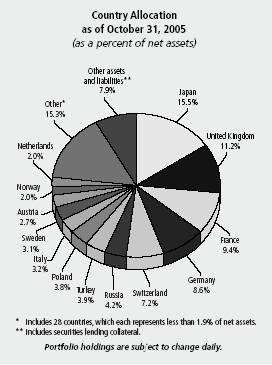
The ING Foreign Fund (the “Fund”) seeks long-term growth of capital. The Fund is managed by Rudolph-Riad Younes, CFA, Senior Vice President and Head of International Equity and Richard Pell, Senior Vice President and Chief Investment Officer, Julius Baer Investment Management, LLC — the Sub-Adviser.
Performance: For the year ended October 31, 2005, the Fund’s Class Q shares provided a total return of 19.52% compared to the Morgan Stanley Capital International Europe, Austrasia and Far East (“MSCI EAFE”) Index, which returned 18.59% for the same period.
Portfolio Specifics: Over the period ended October 31, 2005, international equities provided strong returns for investors, and the Fund outperformed the Index due to several factors. Within Europe, the overweight position to Austria was a positive contributor. Many Austrian holdings, including Bank Austria Creditanstalt AG, benefited from the strong Eastern European market. The underweight position to the United Kingdom, an underperforming market over the period, also supported results.
The allocation to Eastern and Central Europe proved favorable as positions in Russia, Turkey, Hungary and Poland outperformed the Index by a wide margin. The Fund held many banks in the region that posted strong returns including Sberbank (Russia), Turkiye Garanti Bankasi A.S., Turkiye Is Bankasi A.S. and Akbank T.A.S. (Turkey). Elsewhere in emerging markets, holdings in Grupo Financiero Banorte S.A. (Mexico) helped performance while CANTV (Venezuela) detracted. Within China, a market we have largely avoided, shares of Weiqiao Textile Co. underperformed.
The underweight position to Japanese equities, as well as individual stock selection, were a drag on results. Shares of Uni-Charm Corp, a producer of personal hygiene products, underperformed over the period ended October 31, 2005. The Fund’s cash equivalents position also had a negative impact due to the strong environment for equities.
Both stock selection and an overweight position to the energy sector were also important contributors to performance. Companies such as Lukoil and Gazprom (Russia), OMV AG (Austria), EnCana and Canadian Natural Resources (Canada), Statoil (Norway) and Dragon Oil (Ireland) were particularly strong. Stock selection in the telecommunications and health care sectors also supported results. In the materials sector, the underweight position as well as stock selection, including companies such as LaFarge (France) the world’s largest cement producer, negatively impacted performance. Finally, stock selection in the industrials sector detracted from performance.
Current Strategy and Outlook: During the month of October 2005, equity markets fell amid concerns over rising inflation and slower global growth. Early in October 2005’s retrenchment, we took profits and reduced exposure to certain sectors, including energy, which had exhibited solid performance for the Fund. At the end of October 2005, we were underweight the energy sector relative to the Index and holdings were more defensively positioned. We believe energy stocks are likely to be negatively impacted by any global slowdown. We believe that signs of demand destruction, rather than the commodity price itself will hold the key to sector performance.
October 2005 also witnessed a rollback in returns in many Emerging Markets, but we took profits from select holdings. emerging markets are susceptible to a slowdown in global growth, and in the current climate, volatility is likely to remain high. However, we believe that emerging markets will reassert themselves based on their strong fundamentals and attractive risk/reward opportunities, particularly Eastern and Central Europe.
Since Japan’s September 2005 elections, the Fund’s exposure to the country has increased through more domestically-focused companies such as regional banks. While we are still concerned about the state of national reforms, hence our overall underweight position to Japan, we see many individual companies showing a greater interest in enhancing shareholder value. Japan does remain vulnerable to any slowdown in Chinese growth and to a certain extent growth in the U.S.; therefore we believe this domestic focus is warranted.
Top Ten Industries
as of October 31, 2005
(as a percent of net assets) |
| | | |
Banks | | 22.7 | % |
| | | |
Investment Companies | | 7.5 | % |
| | | |
Pharmaceuticals | | 6.5 | % |
| | | |
Oil and Gas | | 5.8 | % |
| | | |
Telecommunications | | 5.7 | % |
| | | |
Food | | 4.1 | % |
| | | |
Engineering and Construction | | 3.6 | % |
| | | |
Beverages | | 2.8 | % |
| | | |
Building Materials | | 2.2 | % |
| | | |
Holding Companies - Diversified | | 2.2 | % |
Portfolio holdings are subject to change daily.
10
PORTFOLIO MANAGERS’ REPORT | ING FOREIGN FUND |
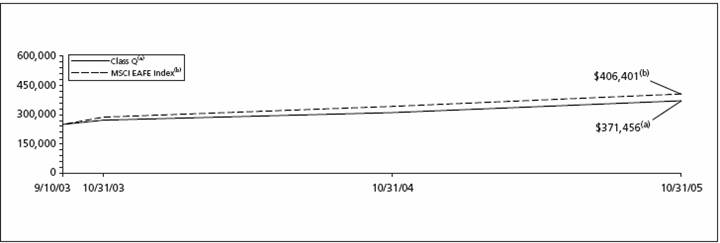
| | | | | | | | |
| Average Annual Total Returns for the Periods Ended October 31, 2005 | |
| | | | | | | | |
| | | | | Since Inception | | Since Inception | |
| | | | | of Class I | | of Class Q | |
| | | 1 Year | | September 10, 2003 | | July 11, 2003 | |
| Class I | | 19.92 | % | | 18.03 | % | | — | | |
| Class Q | | 19.52 | % | | — | | | 18.58 | % | |
| MSCI EAFE Index(1) | | 18.59 | % | | 22.39 | %(2) | | 23.15 | %(3) | |
| | | | | | | | |
| | | | | | | | | | | | | | | | | | |
Based on a $250,000 initial investment, the graph and table above illustrate the total return of ING Foreign Fund against the Index or Indices indicated. An Index is unmanaged and has no cash in its portfolio, imposes no sales charges and incurs no operating expenses. An investor cannot invest directly in an index. The Fund’s performance is shown both with and without the imposition of sales charges.
The performance graph and table do not reflect the deduction of taxes that a shareholder will pay on Fund distributions or the redemption of Fund shares.
Total returns reflect that the Investment Manager may have waived or recouped fees and expenses otherwise payable by the Fund.
Performance data represents past performance and is no assurance of future results. Investment return and principal value of an investment in the Fund will fluctuate. Shares, when sold, may be worth more or less than their original cost. The Fund’s current performance may be lower or higher than the performance data shown. Please log on to www.ingfunds.com or call (800) 992-0180 to get performance through the most recent month end.
This report contains statements that may be “forward-looking” statements. Actual results may differ materially from those projected in the “forward-looking” statements.
The views expressed in this report reflect those of the portfolio managers, only through the end of the period as stated on the cover. The portfolio managers’ views are subject to change at any time based on market and other conditions.
Fund holdings are subject to change daily.
(1) The MSCI EAFE Index is an unmanaged index that measures the performance of securities listed on exchanges in Europe, Australasia and the Far East.
(2) Since inception performance for index is shown from September 1, 2003.
(3) Since inception performance for index is shown from July 1, 2003.
11
ING INTERNATIONAL FUND | PORTFOLIO MANAGERS’ REPORT |
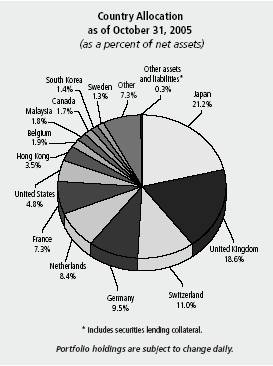
The ING International Fund (the “Fund”) seeks long-term growth of capital through investment in equity securities and equity equivalents of companies outside the United States. The Fund is a managed by a team of investment professionals led by Richard T. Saler and Philip A. Schwartz, CFA, each a Senior Vice President and Director of International Investment Strategy, ING Investment Manager Co. — the Sub-Adviser.
Performance: For the year ended October 31, 2005, the Fund’s Class Q shares provided a total return of 13.41% compared to the Morgan Stanley Capital International Europe, Austrasia and Far East (“MSCI EAFE”) Index, which returned 18.59% for the same period.
Portfolio Specifics: The Fund’s defensive positioning in the earlier part of the year ended October 2005 at first proved disappointing. Later in the 2005 year, however, many defensive names regained strength as the market grew concerned about high energy prices and economic growth. Newer positions in a broader array of sectors also helped performance. Much of the first half’s losses of 2005 were made up in the second half of the 2005 year.
Overall, stock selection was positive in Europe and developed Asia-ex Japan, while our holdings in Japan were disappointing. Our underweight of the U.K., which had relatively weak performance in the second half of the fiscal year ended October 2005 proved beneficial, but was not enough to make up for weak stock selection. emerging market stocks detracted from relative return. On a sector basis, our underweight positions in consumer discretionary and information technology stocks added to performance. This result was partially offset by a negative selection outcome in the financials and materials sectors. Energy and telecom stock selection added materially to results.
On an individual stock level, significant value was added by TDC A/S, the main Danish telecom services provider, after it increased on reports of takeover bids. Amano Corp., a Japanese industrial firm, added materially to performance during the second half of the fiscal year due to high product demand and the resulting higher price targets by analysts. A material positive contribution was made by our holding of SolarWorld AG, a German energy company, mainly due to an increase in capacity and expanded production, higher demand, and a secure supply base. The largest detractor was Canadian gold producer Placer Dome in a weak gold market; most of the loss occurred during the first half of the reporting 2005 period. Other negative contributors included Barco N.V, a Belgian maker of electronic visual displays, which fell after a lower profit forecast due to the decline in the dollar, and Tenaga Nasional Bhd, a Malaysian electric utility, which declined following decreased profits.
Current Strategy and Outlook: Despite signs that economic growth may be slowing and some nagging inflation concerns, our models continue to point towards a variety of solid investment opportunities. Japan’s election results were encouraging and appear to promise more financial reform. China’s growth continues to offer opportunity among global commodities companies, including oil. We have increased the Fund’s weightings in financial stocks since valuations appear attractive, and a peak in bond yields is likely in the year ahead. The Fund is maintaining an overweight position in energy stocks due to their strong cash generation and positive outlook. The Fund is underweight Europe and the U.K., and maintaining a modest exposure to emerging market stocks. At the sector level, the Fund continues to be underweight in the consumer discretionary and industrial sectors, and overweight positions on consumer staples, health care and utility stocks.
Top Ten Industries
as of October 31, 2005
(as a percent of net assets) |
| | | |
Banks | | 19.2 | % |
| | | |
Oil and Gas | | 10.2 | % |
| | | |
Pharmaceuticals | | 8.4 | % |
| | | |
Food | | 8.1 | % |
| | | |
Telecommunications | | 7.9 | % |
| | | |
Diversified Financial Services | | 5.3 | % |
| | | |
Insurance | | 4.6 | % |
| | | |
Mining | | 3.5 | % |
| | | |
Electric | | 3.3 | % |
| | | |
Agriculture | | 3.1 | % |
Portfolio holdings are subject to change daily.
12
PORTFOLIO MANAGERS’ REPORT | ING INTERNATIONAL FUND |
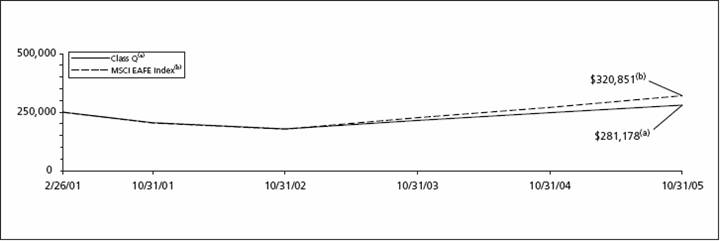
| | | | | | | | |
| Average Annual Total Returns for the Periods Ended October 31, 2005 | |
| | | | | | | | |
| | | | | Since Inception | | Since Inception | |
| | | | | of Class I | | of Class Q | |
| | | 1 Year | | January 15, 2002 | | February 26, 2001 | |
| Class I | | 13.73 | % | | 8.44 | % | | — | | |
| Class Q | | 13.41 | % | | — | | | 2.54 | % | |
| MSCI EAFE Index(1) | | 18.59 | % | | 11.27 | %(2) | | 5.49 | %(3) | |
| | | | | | | | |
| | | | | | | | | | | | | | | | | | |
Based on a $250,000 initial investment, the graph and table above illustrate the total return of ING International Fund against the Index or Indices indicated. An Index is unmanaged and has no cash in its portfolio, imposes no sales charges and incurs no operating expenses. An investor cannot invest directly in an index. The Fund’s performance is shown both with and without the imposition of sales charges.
The performance graph and table do not reflect the deduction of taxes that a shareholder will pay on Fund distributions or the redemption of Fund shares.
Total returns reflect that the Investment Manager may have waived or recouped fees and expenses otherwise payable by the Fund.
Performance data represents past performance and is no assurance of future results. Investment return and principal value of an investment in the Fund will fluctuate. Shares, when sold, may be worth more or less than their original cost. The Fund’s current performance may be lower or higher than the performance data shown. Please log on to www.ingfunds.com or call (800) 992-0180 to get performance through the most recent month end.
This report contains statements that may be “forward-looking” statements. Actual results may differ materially from those projected in the “forward-looking” statements.
The views expressed in this report reflect those of the portfolio managers, only through the end of the period as stated on the cover. The portfolio managers’ views are subject to change at any time based on market and other conditions.
Fund holdings are subject to change daily.
(1) The MSCI EAFE Index is an unmanaged index that measures the performance of securities listed on exchanges in markets in Europe, Australasia and the Far East.
(2) Since inception performance for the index is shown from January 1, 2002.
(3) Since inception performance for the index is shown from March 1, 2001.
13
ING INTERNATIONAL SMALLCAP FUND | PORTFOLIO MANAGERS’ REPORT |
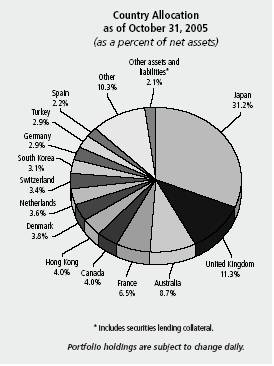
The ING International SmallCap Fund (the “Fund”) seeks maximum long-term capital appreciation. The Fund is managed by John Chisholm, CFA, Executive Vice President and Matthew Cohen, CFA, Senior Vice President, Acadian Asset Management, Inc. — the Sub-Adviser.
Performance: For the year ended October 31, 2005, the Fund’s Class Q shares provided a total return of 29.32% compared to the Morgan Stanley Capital International Europe, Austrasia and Far East (“MSCI EAFE”) SmallCap Index and the Standard & Poor’s/Citigroup Europe, Pacific, Asia Composite/Extended Market Index (“S&P/Citigroup EPAC/EMI”) which returned 29.05% and 25.41%, respectively, for the same period.
Portfolio Specifics: The MSCI EAFE SmallCap Index posted solid gains in the four months ended February 28, 2005, up 20.2%. International equity markets extended November’s gains into December and capped 2004 with robust performance across the board, despite an uncertain environment characterized by rising interest rates, higher oil prices and the ongoing war in Iraq. In the final weeks of 2004, trading volume was thin as investors geared up for the holidays, but the markets reacted favorably to easing oil prices, increased merger activity and rosy outlooks from such industry leaders as Intel Corp. and General Electric Co. The Fund benefited from overweightings in Europe and Canada, but an overweighting in Korea detracted from performance. Stock selection was strong in Europe, but was weak in the UK and Japan. For the period from March 1, 2005, through April 30, 2005, the Fund underperformed the MSCI EAFE SmallCap Index by approximately 2.6%. This was mostly the result of country allocations, though stock selection also detracted slightly from return.
The following investments helped the Fund’s performance for the subsequent eight months ended October 31, 2005. In Australia, stock-level performance, particularly in the materials sector, more than offset value lost to an overweighted country allocation. Energy sector holding Oil Search was also a significant contributor to active return. Strong global demand and elevated commodity prices over the period helped holdings in these sectors. In Spain, successful stock selection combined with an overweighting to deliver value added in this market. Homebuilder Fadesa Inmobiliar led the Fund’s Spanish holdings as construction activity was strong. In the United Kingdom, an underweighted allocation, which showed lackluster growth over the eight months ended October 31, 2005, helped return. Also contributing to active return was stock-level performance in the U.K., particularly in the capital equipment sector. Defense holding Cobham and building materials manufacturer BPB were the top performers among the Fund’s U.K. holdings. In Germany, stock selection generated additional active return. Selections in the materials sector were especially successful. Specifically, a position in German steel producer Salzgitter was a key driver of value added. In France, stock selection combined with the country overweighting to contribute excess return. A position in technology firm Neopost was the top contributor to active return among the Fund’s French holdings.
The following investments have detracted from the Fund’s inception performance for the eight months ended October, 31, 2005. In Japan, stock selection, combined with an underweighting, detracted from the Fund’s active return, as this market has had a particularly robust year, up approximately 11% over the eight month period ended October 31, 2005. Holdings that detracted from performance included services stocks Kyoei Tanker and Tonichi Carlife. In Greece, stock selection and an overweighted allocation, resulted in a negative impact to the Fund’s return. Specifically, an overweighting to the Greek services sector detracted from return. In emerging markets, stock selection in China offset value added from overweighting in this market, as selections in the materials and services sectors trailed the index. The active allocations to Turkey and Taiwan also lost value.
Current Strategy and Outlook: Country weightings are driven by bottom-up stock selection. The Fund is currently overweighted in Spain and France and actively allocated to Canada, Korea and Turkey. Significant underweightings include Japan and the U.K. Our bottom-up process led the Fund to focus on materials, energy and durables stocks.
The outlooks for Spain and France are positive based on our forecast factors. There are signs of particular strength in the banking and energy sectors, which are also expected to outperform in Canada, where the local currency remains quite strong. Turkey is the highest-ranked country in our emerging markets framework, driven primarily by longer-term cash flow factors and perceived lower risk as the country continues to bring its economic policy in line with that of the European Union.
Our forecast for Japan continues to show it as one of our lowest-ranked markets. This short-term outlook is based on the fact that the economic rehabilitation is still in the early stages, relative valuations are still high and deflation remains in place. We are most negative on technology and staples, though even within a sector that we view negatively overall, we often find individual holdings that are highly attractive. We are long-term positive on Japan given Koizumi’s reform-minded economic policy, strong and improving economic fundamentals and the expectation that earnings will catch up with valuations.
Top Ten Industries
as of October 31, 2005
(as a percent of net assets) |
| | | |
Iron/Steel | | 7.7 | % |
| | | |
Diversified Financial Services | | 6.9 | % |
| | | |
Transportation | | 6.7 | % |
| | | |
Retail | | 6.6 | % |
| | | |
Oil and Gas | | 5.0 | % |
| | | |
Food | | 4.5 | % |
| | | |
Distribution/Wholesale | | 4.1 | % |
| | | |
Real Estate | | 3.9 | % |
| | | |
Insurance | | 3.5 | % |
| | | |
Building Materials | | 3.4 | % |
Portfolio holdings are subject to change daily.
Effective March 1, 2005 Acadian Asset Management became sub-adviser to ING International SmallCap Fund. Prior to March 1, 2005, the Fund was sub-advised by Nicholas-Applegate Capital Management. The views expressed are those of the specific sub-adviser with respect to the period of time discussed.
14
PORTFOLIO MANAGERS’ REPORT | ING INTERNATIONAL SMALLCAP FUND |
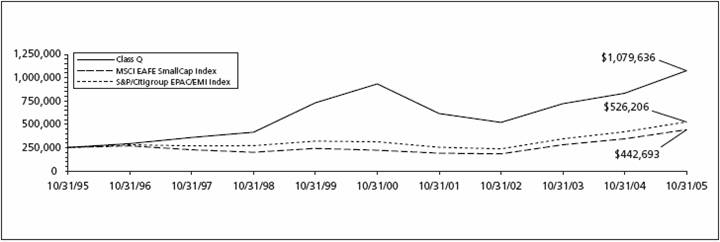
| | | | | | | | | | | | | | | | | |
| Average Annual Total Returns for the Periods Ended October 31, 2005 | |
| | | | | | | | | | | | | | | | | |
| | | | | | | | | | | | 1 Year | | 5 Year | | 10 Year | |
| Class Q | | | | | | | | | | | 29.32 | % | | 2.87 | % | | 15.74 | % | |
| MSCI EAFE SmallCap Index(1) | | | | | | | | | | | 29.05 | % | | 15.10 | % | | 6.00 | % | |
| S&P/Citigroup EPAC/EMI(2) | | | | | | | | | | | 25.41 | % | | 11.01 | % | | 7.73 | % | |
| | | | | | | | | | | | | | | | | | | | |
| | | | | | | | | | | | | | | | | | | | | | |
Based on a $250,000 initial investment, the graph and table above illustrate the total return of ING Internationaml SmallCap Fund against the Index or Indices indicated. An Index is unmanaged and has no cash in its portfolio, imposes no sales charges and incurs no operating expenses. An investor cannot invest directly in an index. The Fund’s performance is shown both with and without the imposition of sales charges.
The performance graph and table do not reflect the deduction of taxes that a shareholder will pay on Fund distributions or the redemption of Fund shares.
Total returns reflect that the Investment Manager may have waived or recouped fees and expenses otherwise payable by the Fund. Total returns would have been lower had there been no waiver to the Fund.
Performance data represents past performance and is no assurance of future results. Investment return and principal value of an investment in the Fund will fluctuate. Shares, when sold, may be worth more or less than their original cost. The Fund’s current performance may be lower or higher than the performance data shown. Please log on to www.ingfunds.com or call (800) 992-0180 to get performance through the most recent month end.
This report contains statements that may be “forward-looking” statements. Actual results may differ materially from those projected in the “forward-looking” statements.
The views expressed in this report reflect those of the portfolio managers, only through the end of the period as stated on the cover. The portfolio managers’ views are subject to change at any time based on market and other conditions.
Fund holdings are subject to change daily.
(1) The MSCI EAFE SmallCap Index is an unmanaged, market-weighted index that represents the smallcap segments in 21 developed equity markets outside of North America, which more closely tracks the types of securities in which the Fund invests than the S&P/Citigroup EPAC/EMI Index.
(2) The S&P/Citigroup EPAC/EMI is an unmanaged index that measures the performance of securities of smaller-capitalization companies in 22 countries excluding the U.S. and Canada.
15
ING INTERNATIONAL VALUE FUND | PORTFOLIO MANAGERS’ REPORT |
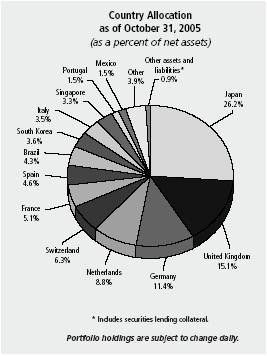
The ING International Value Fund (the “Fund”) seeks long-term capital appreciation. The Fund is managed by Brandes Investment Partners, L.P. — the Sub-Adviser. Brandes’ Large Cap Investment Committee is responsible for making the day-to-day investment decisions for the Fund.
Performance: For the year ended October 31, 2005, the Fund’s Class Q shares provided a total return of 15.20% compared to the Morgan Stanley Capital International Europe, Australasia and Far East (“MSCI EAFE”) Index, which returned 18.59% for the same period.
Portfolio Specifics: The Fund’s advance during the fiscal year of 2005 was broad based, with positions in a wide range of countries and industries registering gains. On a country basis, advances for holdings in Japan made the most substantial contribution to returns. Top Japan-based performers included Japan Tobacco (tobacco), Mitsubishi Tokyo Financial (commercial banking), and Sumitomo Mitsui Financial Group (commercial banking)
In addition, advances for holdings in the United Kingdom and Germany also contributed to favorable absolute performance. Top performers in these countries included Volkswagen (Germany — automobiles) and Imperial Chemical (United Kingdom — chemicals).
From an industry perspective, advances for holdings in commercial banking and insurance helped drive performance. Among the stronger-performing holdings in these industries were Commerzbank (Germany — Commercial Banks) and Millea Holdings Inc. Tokyo (Japan — insurance). Gains for positions in the food products and the tobacco industries also tended to advance.
The main reason for the underperformance against the benchmark during the year was an overweight position in the diversified telecommunications industry, one of the weakest industry performers. The Fund was also underweight in the metals & mining and in the oil, gas, & consumable fuels industries, two of the strongest performing industries. The Fund’s industry exposure is a residual of our investment process, which focuses on company-by-company analysis to identify undervalued securities.
During the period, we sold positions such as BAE Systems (United Kingdom — aerospace & defense), Lukoil (Russia — oil gas & consumable fuels), and E.ON AG (Germany — electric utilities) as appreciation pushed their market prices toward our estimates of their long-term values. We also sold portions of other holdings to reduce their Fund weightings and to pursue other investment opportunities.
New purchases for the year included DaimlerChrysler (Germany — automobiles), Aegon (Netherlands — insurance), and Fuji Photo Film (Japan — leisure equipment & products), among others. We also added to select existing holdings at prices that we consider attractive.
Current Strategy and Outlook: During the year ended October 31, 2005, the Fund’s country and industry exposures shifted slightly due to stock-specific buying and selling, as well as changes in the prices of holdings. For example, exposure to the Netherlands and the insurance industry increased, while exposure to the United Kingdom and the oil, gas & consumable fuels industry declined. The Fund’s weightings for industries and countries are not the product of “top-down” forecasts or opinions, but merely stem from our company-by-company search for compelling investment opportunities in markets around the world.
Overall, while we offer no predictions regarding the short-term direction of international equity markets, we believe the Fund remains well positioned to deliver favorable long-term results. We acknowledge that many of the Fund’s current holdings recently have posted significant gains. However, we believe that all holdings remain undervalued, and we expect to realize solid appreciation as the market recognizes their true worth.
Top Ten Industries
as of October 31, 2005
(as a percent of net assets) |
| | | |
Telecommunications | | 21.9 | % |
Banks | | 14.4 | % |
Food | | 13.9 | % |
Insurance | | 10.1 | % |
Pharmaceuticals | | 7.8 | % |
Electric | | 4.3 | % |
Home Furnishings | | 4.3 | % |
Auto Manufacturers | | 4.1 | % |
Miscellaneous Manufacturing | | 4.0 | % |
Chemicals | | 2.6 | % |
Portfolio holdings are subject to change daily.
16
PORTFOLIO MANAGERS’ REPORT | ING INTERNATIONAL VALUE FUND |
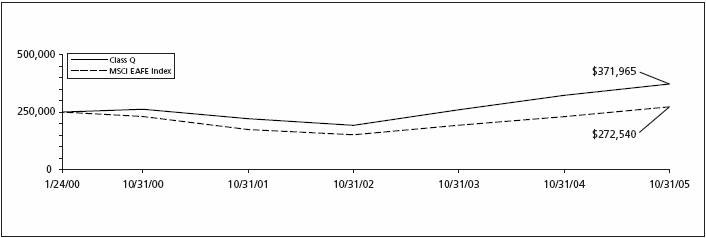
| | | | | | | | | | | |
| Average Annual Total Returns for the Periods Ended October 31, 2005 | |
| | | | | | | | | | | |
| | | | | | | | Since Inception | | Since Inception | |
| | | | | | | | of Class I | | of Class Q | |
| | 1 Year | | 5 Year | | June 18, 2001 | | January 24, 2000 | |
| Class I | 15.42 | % | | — | | | 9.90 | % | | — | | |
| Class Q | 15.20 | % | | 7.23 | % | | — | | | 7.13 | % | |
| MSCI EAFE Index(1) | 18.59 | % | | 3.42 | % | | 7.83 | %(2) | | 1.51 | %(3) | |
| | | | | | | | | | | | | |
| | | | | | | | | | | | | | | | | | | | | | | | | | | |
Based on a $250,000 initial investment, the graph and table above illustrate the total return of ING International Value Fund against the Index or Indices indicated. An Index is unmanaged and has no cash in its portfolio, imposes no sales charges and incurs no operating expenses. An investor cannot invest directly in an index. The Fund’s performance is shown both with and without the imposition of sales charges.
The performance graph and table do not reflect the deduction of taxes that a shareholder will pay on Fund distributions or the redemption of Fund shares.
Total returns reflect that the Investment Manager may have waived or recouped fees and expenses otherwise payable by the Fund.
Performance data represents past performance and is no assurance of future results. Investment return and principal value of an investment in the Fund will fluctuate. Shares, when sold, may be worth more or less than their original cost. The Fund’s current performance may be lower or higher than the performance data shown. Please log on to www.ingfunds.com or call (800) 992-0180 to get performance through the most recent month end.
This report contains statements that may be “forward-looking” statements. Actual results may differ materially from those projected in the “forward-looking” statements.
The views expressed in this report reflect those of the portfolio managers, only through the end of the period as stated on the cover. The portfolio managers’ views are subject to change at any time based on market and other conditions.
Fund holdings are subject to change daily.
(1) The MSCI EAFE Index is an unmanaged index that measures the performance of securities listed on exchanges in markets in Europe, Australasia and the Far East.
(2) Since inception performance for index is shown from July 1, 2001.
(3) Since inception performance for index is shown from February 1, 2000.
17
SHAREHOLDER EXPENSE EXAMPLES (UNAUDITED) |
As a shareholder of a Fund, you incur two types of costs: (1) transaction costs, including sales charges (loads) on purchase payments; redemption fees; and exchange fees; and (2) ongoing costs, including management fees; distribution [and/or service] (12b-1) fees; and other Fund expenses. These Examples are intended to help you understand your ongoing costs (in dollars) of investing in a Fund and to compare these costs with the ongoing costs of investing in other mutual funds.
The Examples are based on an investment of $1,000 invested at the beginning of the period and held for the entire period from May 1, 2005 to October 31, 2005.
Actual Expenses
The first section of the table shown, “Actual Fund Return,” provides information about actual account values and actual expenses. You may use the information in this section, together with the amount you invested, to estimate the expenses that you paid over the period. Simply divide your account value by $1,000 (for example, an $8,600 account value divided by $1,000 = 8.6), then multiply the result by the number in the first section under the heading entitled “Expenses Paid During Period” to estimate the expenses you paid on your account during this period.
Hypothetical Example for Comparison Purposes
The second section of the table shown, “Hypothetical 5% Return,” provides information about hypothetical account values and hypothetical expenses based on the Fund’s actual expense ratio and an assumed rate of return of 5% per year before expenses, which is not the Fund’s actual return. The hypothetical account values and expenses may not be used to estimate the actual ending account balance or expenses you paid for the period. You may use this information to compare the ongoing costs of investing in the Fund and other funds. To do so, compare this 5% hypothetical example with the 5% hypothetical examples that appear in the shareholder reports of the other funds.
Please note that the expenses shown in the table are meant to highlight your ongoing costs only and do not reflect any transactional costs, such as sales charges (loads), redemption fees, or exchange fees. Therefore, the hypothetical lines of the table are useful in comparing ongoing costs only, and will not help you determine the relative total costs of owning different funds. In addition, if these transactional costs were included, your costs would have been higher.
| | | | | | | | | | |
| | | Beginning | | Ending | | | | Expenses Paid | |
| | | Account | | Account | | Annualized | | During the Six | |
| | | Value | | Value | | Expense | | Months Ended | |
| | | May 1, 2005 | | October 31, 2005 | | Ratio | | October 31, 2005* | |
| | | | | | | | | | |
| ING Global Real Estate Fund | | | | | | | | | |
| Actual Fund Return | | | | | | | | | |
| Class I(a) | | $1,000.00 | | $1,061.40 | | 1.30% | | $ 5.51 | |
| Hypothetical (Excluding Expenses) | | | | | | | | | |
| Class I | | $1,000.00 | | $1,015.21 | | 1.30% | | $ 5.38 | |
| | | | | | | | | | |
| ING Global Value Choice Fund | | | | | | | | | |
| Actual Fund Return | | | | | | | | | |
| Class Q | | $1,000.00 | | $1,089.70 | | 1.55% | | $ 8.16 | |
| Hypothetical (Excluding Expenses) | | | | | | | | | |
| Class Q | | $1,000.00 | | $1,017.39 | | 1.55% | | $ 7.88 | |
* Expenses are equal to each Fund’s respective annualized expense ratios multiplied by the average account value over the period, multiplied by 184/365 to reflect the most recent fiscal half-year (except for ING Global Real Estate Fund, Class I “Actual Fund return” information which reflects the 150 day period ended October 31, 2005 due to its inception date of June 3, 2005.)
(a) Commenced operations June 3, 2005.
18
SHAREHOLDER EXPENSE EXAMPLES (UNAUDITED) (CONTINUED) |
| | | | | | | | | | |
| | | Beginning | | Ending | | | | Expenses Paid | |
| | | Account | | Account | | Annualized | | During the Six | |
| | | Value | | Value | | Expense | | Months Ended | |
| | | May 1, 2005 | | October 31, 2005 | | Ratio | | October 31, 2005* | |
| | | | | | | | | | |
| ING Emerging Countries Fund | | | | | | | | | |
| Actual Fund Return | | | | | | | | | | | | |
| Class Q | | $1,000.00 | | $1,093.80 | | | 1.85% | | | $ 9.76 | | |
| Hypothetical (5% return before expenses) | | | | | | | | | | | | |
| Class Q | | $1,000.00 | | $1,015.88 | | | 1.85% | | | $ 9.40 | | |
| | | | | | | | | | | | | |
| ING Foreign Fund | | | | | | | | | | | | |
| Actual Fund Return | | | | | | | | | | | | |
| Class I | | $1,000.00 | | $1,111.70 | | | 1.35% | | | $ 7.19 | | |
| Class Q | | 1,000.00 | | 1,110.10 | | | 1.60% | | | 8.51 | | |
| Hypothetical (5% return before expenses) | | | | | | | | | | | | |
| Class I | | $1,000.00 | | $1,018.40 | | | 1.35% | | | $ 6.87 | | |
| Class Q | | 1,000.00 | | 1,017.14 | | | 1.60% | | | 8.13 | | |
| | | | | | | | | | | | | |
| ING International Fund | | | | | | | | | | | | |
| Actual Fund Return | | | | | | | | | | | | |
| Class I | | $1,000.00 | | $1,076.80 | | | 1.26% | | | $ 6.60 | | |
| Class Q | | 1,000.00 | | 1,075.00 | | | 1.51% | | | 7.90 | | |
| Hypothetical (5% return before expenses)
Class I | | $1,000.00 | | $1,018.85 | | | 1.26% | | | $ 6.41 | | |
| Class Q | | 1,000.00 | | 1,017.59 | | | 1.51% | | | 7.68 | | |
| | | | | | | | | | | | | |
| ING International SmallCap Fund | | | | | | | | | | | | |
| Actual Fund Return | | | | | | | | | | | | |
| Class Q | | $1,000.00 | | $1,156.30 | | | 1.49% | | | $ 8.10 | | |
| Hypothetical (5% return before expenses) | | | | | | | | | | | | |
| Class Q | | $1,000.00 | | $1,017.69 | | | 1.49% | | | $ 7.58 | | |
| | | | | | | | | | | | | |
| ING International Value Fund | | | | | | | | | | | | |
| Actual Fund Return | | | | | | | | | | | | |
| Class I | | $1,000.00 | | $1,089.50 | | | 1.23% | | | $ 6.48 | | |
| Class Q | | 1,000.00 | | 1,088.90 | | | 1.48% | | | 7.79 | | |
| Hypothetical (5% return before expenses) | | | | | | | | | | | | |
| Class I | | $1,000.00 | | $1,019.00 | | | 1.23% | | | $ 6.26 | | |
| Class Q | | 1,000.00 | | 1,017.74 | | | 1.48% | | | 7.53 | | |
| | | | | | | | | | | | | |
* Expenses are equal to each Fund’s respective annualized expense ratios multiplied by the average account value over the period, multiplied by 184/365 to reflect the most recent fiscal half-year.
19
REPORT OF INDEPENDENT REGISTERED PUBLIC ACCOUNTING FIRM |
The Board of Trustees and Shareholders
ING Mutual Funds and ING Mayflower Trust
We have audited the accompanying statements of assets and liabilities, including the portfolios of investments, of ING Global Real Estate Fund, ING Global Value Choice Fund (formerly ING Worldwide Growth Fund), ING Emerging Countries Fund, ING Foreign Fund, ING International Fund, and ING International SmallCap Fund (formerly ING International SmallCap Growth Fund), each a series of ING Mutual Funds, and ING International Value Fund, a series of ING Mayflower Trust, as of October 31, 2005, and the related statements of operations for the year or period then ended, the statements of changes in net assets for each of the years or periods in the two-year period then ended, and the financial highlights for each of the years or periods in the three-year period then ended. These financial statements and financial highlights are the responsibility of management. Our responsibility is to express an opinion on these financial statements and financial highlights based on our audits. The financial highlights for each of the years or periods prior to November 1, 2002 were audited by other auditors whose report thereon, dated December 17, 2002, expressed an unqualified opinion on those financial highlights.
We conducted our audits in accordance with the standards of the Public Company Accounting Oversight Board (United States). Those standards require that we plan and perform the audits to obtain reasonable assurance about whether the financial statements and financial highlights are free of material misstatement. An audit includes examining, on a test basis, evidence supporting the amounts and disclosures in the financial statements. Our procedures included confirmation of securities owned as of October 31, 2005 by correspondence with the custodian and brokers, or by other appropriate auditing procedures. An audit also includes assessing the accounting principles used and significant estimates made by management, as well as evaluating the overall financial statement presentation. We believe that our audits provide a reasonable basis for our opinion.
In our opinion, the financial statements and financial highlights referred to above present fairly, in all material respects, the financial position of ING Global Real Estate Fund, ING Global Value Choice Fund, ING Emerging Countries Fund, ING Foreign Fund, ING International Fund, ING International SmallCap Fund, and ING International Value Fund as of October 31, 2005, and the results of their operations, the changes in their net assets, and their financial highlights for the periods specified in the first paragraph above, in conformity with U.S. generally accepted accounting principles.

Boston, Massachusetts
December 22, 2005
20
STATEMENTS OF ASSETS AND LIABILITIES AS OF OCTOBER 31, 2005
| | ING | | ING | | ING | |
| | Global | | Global | | Emerging | |
| | Real Estate | | Value Choice | | Countries | |
| | Fund | | Fund | | Fund | |
| | | | | | | |
ASSETS: | | | | | | | |
Investments in securities at value+* | | $ | 174,200,130 | | $ | 97,494,287 | | $ | 122,362,835 | |
Investment in affiliate** | | 2,663,341 | | — | | — | |
Short-term investments at amortized cost | | — | | 6,636,000 | | 19,481,000 | |
Cash | | 4,002,656 | | 3,268,679 | | 4,983,923 | |
Foreign currencies at value*** | | 453,952 | | 23,995 | | 4,722,120 | |
Receivables: | | | | | | | |
Investment securities sold | | — | | 608,894 | | — | |
Fund shares sold | | 952,275 | | 33,898 | | 600,195 | |
Dividends and interest | | 370,365 | | 221,028 | | 604,342 | |
Prepaid expenses | | 27,397 | | 16,056 | | 23,678 | |
Total assets | | 182,670,116 | | 108,302,837 | | 152,778,093 | |
| | | | | | | |
LIABILITIES: | | | | | | | |
Payable for investment securities purchased | | 1,832,055 | | 248,722 | | — | |
Payable for fund shares redeemed | | 251,344 | | 362,726 | | 193,817 | |
Payable upon receipt of securities loaned | | — | | 6,636,000 | | 19,481,000 | |
Payable to affiliates | | 227,077 | | 161,127 | | 201,706 | |
Payable for trustee fees | | 2,140 | | 38,040 | | 71,305 | |
Other accrued expenses and liabilities | | 70,863 | | 127,280 | | 154,159 | |
Total liabilities | | 2,383,479 | | 7,573,895 | | 20,101,987 | |
NET ASSETS | | $ | 180,286,637 | | $ | 100,728,942 | | $ | 132,676,106 | |
| | | | | | | |
NET ASSETS WERE COMPRISED OF: | | | | | | | |
Paid-in capital | | $ | 145,023,060 | | $ | 286,806,785 | | $ | 189,097,429 | |
Undistributed net investment income | | | | | | | |
(accumulated net investment loss) | | (3,067,440 | ) | 396,508 | | 670,204 | |
Accumulated net realized gain (loss) on investments | | | | | | | |
and foreign currency related transactions | | 12,000,328 | | (190,054,701 | ) | (60,910,593 | ) |
Net unrealized appreciation on investments and | | | | | | | |
foreign currency related transactions | | 26,330,689 | | 3,580,350 | | 3,819,066 | |
NET ASSETS | | $ | 180,286,637 | | $ | 100,728,942 | | $ | 132,676,106 | |
+ | | Including securities loaned at value | | $ | — | | $ | 6,412,204 | | $ | 18,758,086 | |
* | | Cost of investments in securities | | $ | 147,918,813 | | $ | 93,910,959 | | $ | 118,623,108 | |
** | | Cost of investment in affiliate | | $ | 2,611,784 | | $ | — | | $ | — | |
*** | | Cost of foreign currencies | | $ | 454,090 | | $ | 24,069 | | $ | 4,639,658 | |
See Accompanying Notes to Financial Statements
21
STATEMENTS OF ASSETS AND LIABILITIES AS OF OCTOBER 31, 2005 (CONTINUED)
| | ING | | ING | | ING | |
| | Global | | Global | | Emerging | |
| | Real Estate | | Value Choice | | Countries | |
| | Fund | | Fund | | Fund | |
| | | | | | | |
Class A: | | | | | | | |
Net Assets | | $ | 138,313,993 | | $ | 41,940,766 | | $ | 87,142,666 | |
Shares authorized | | unlimited | | unlimited | | unlimited | |
Par value | | $ | 0.00 | | $ | 0.00 | | $ | 0.00 | |
Shares outstanding | | 8,069,210 | | 2,309,102 | | 3,692,533 | |
Net asset value and redemption price per share | | $ | 17.14 | | $ | 18.16 | | $ | 23.60 | |
Maximum offering price per share (5.75%)(1) | | $ | 18.19 | | $ | 19.27 | | $ | 25.04 | |
| | | | | | | |
Class B: | | | | | | | |
Net Assets | | $ | 12,302,242 | | $ | 23,483,290 | | $ | 12,562,235 | |
Shares authorized | | unlimited | | unlimited | | unlimited | |
Par value | | $ | 0.00 | | $ | 0.00 | | $ | 0.00 | |
Shares outstanding | | 819,716 | | 1,193,803 | | 542,117 | |
Net asset value and redemption price per share(2) | | $ | 15.01 | | $ | 19.67 | | $ | 23.17 | |
Maximum offering price per share | | $ | 15.01 | | $ | 19.67 | | $ | 23.17 | |
| | | | | | | |
Class C: | | | | | | | |
Net Assets | | $ | 27,989,250 | | $ | 30,918,348 | | $ | 20,985,203 | |
Shares authorized | | unlimited | | unlimited | | unlimited | |
Par value | | $ | 0.00 | | $ | 0.00 | | $ | 0.00 | |
Shares outstanding | | 1,788,316 | | 1,766,465 | | 952,145 | |
Net asset value and redemption price per share(2) | | $ | 15.65 | | $ | 17.50 | | $ | 22.04 | |
Maximum offering price per share | | $ | 15.65 | | $ | 17.50 | | $ | 22.04 | |
| | | | | | | |
Class M: | | | | | | | |
Net Assets | | n/a | | n/a | | $ | 1,210,374 | |
Shares authorized | | n/a | | n/a | | unlimited | |
Par value | | n/a | | n/a | | $ | 0.00 | |
Shares outstanding | | n/a | | n/a | | 52,162 | |
Net asset value and redemption price per share | | n/a | | n/a | | $ | 23.20 | |
Maximum offering price per share (3.50%)(3) | | n/a | | n/a | | $ | 24.04 | |
| | | | | | | |
Class I: | | | | | | | |
Net Assets | | $ | 1,681,152 | | n/a | | n/a | |
Shares authorized | | unlimited | | n/a | | n/a | |
Par value | | $ | 0.00 | | n/a | | n/a | |
Shares outstanding | | 98,101 | | n/a | | n/a | |
Net asset value and redemption price per share | | $ | 17.14 | | n/a | | n/a | |
Maximum offering price per share | | $ | 17.14 | | n/a | | n/a | |
| | | | | | | |
Class Q: | | | | | | | |
Net Assets | | n/a | | $ | 4,386,538 | | $ | 10,775,628 | |
Shares authorized | | n/a | | unlimited | | unlimited | |
Par value | | n/a | | $ | 0.00 | | $ | 0.00 | |
Shares outstanding | | n/a | | 206,448 | | 441,990 | |
Net asset value and redemption price per share | | n/a | | $ | 21.25 | | $ | 24.38 | |
Maximum offering price per share | | n/a | | $ | 21.25 | | $ | 24.38 | |
(1) | | Maximum offering price is computed at 100/94.25 of net asset value. On purchases of $50,000 or more, the offering price is reduced. |
(2) | | Redemption price per share may be reduced for any applicable contingent deferred sales charges. |
(3) | | Maximum offering price is comuted at 100/96.50 of net asset value. On purchases of $50,000 or more, the offering price is reduced. |
See Accompanying Notes to Financial Statements
22
STATEMENTS OF ASSETS AND LIABILITIES AS OF OCTOBER 31, 2005 (CONTINUED)
| | | | | | ING | | ING | |
| | ING | | ING | | International | | International | |
| | Foreign | | International | | SmallCap | | Value | |
| | Fund | | Fund | | Fund | | Fund | |
| | | | | | | | | |
ASSETS: | | | | | | | | | |
Investments in securities at value+* | | $ | 217,260,206 | | $ | 115,751,131 | | $ | 333,759,396 | | $ | 4,021,654,583 | |
Short-term investments at amortized cost | | 4,949,000 | | 4,871,000 | | 57,748,000 | | 104,511,000 | |
Repurchase agreement | | — | | 4,462,000 | | — | | — | |
Cash | | 9,317,785 | | 108 | | 6,352,256 | | 38,602,717 | |
Foreign currencies at value** | | 10,559,977 | | 2,931 | | 47,913 | | — | |
Receivables: | | | | | | | | | |
Investment securities sold | | 2,400,054 | | 126,892 | | 49,768 | | — | |
Fund shares sold | | 1,801,941 | | 218,438 | | 880,104 | | 3,453,548 | |
Dividends and interest | | 251,763 | | 371,101 | | 1,480,731 | | 8,560,301 | |
Unrealized appreciation on forward foreign | | | | | | | | | |
currency contracts | | 283,814 | | — | | — | | — | |
Prepaid expenses | | 24,493 | | 22,922 | | 27,342 | | 56,495 | |
Total assets | | 246,849,033 | | 125,826,523 | | 400,345,510 | | 4,176,838,644 | |
| | | | | | | | | |
LIABILITIES: | | | | | | | | | |
Payable for investment securities purchased | | 3,895,017 | | — | | — | | — | |
Payable for fund shares redeemed | | 173,135 | | 124,263 | | 782,941 | | 8,311,190 | |
Payable upon receipt of securities loaned | | 4,949,000 | | 4,871,000 | | 57,748,000 | | 104,511,000 | |
Unrealized depreciation on forward | | | | | | | | | |
currency contracts | | 1,435,470 | | — | | — | | — | |
Payable to affiliates | | 340,831 | | 152,918 | | 476,128 | | 5,202,694 | |
Payable to custodian due to foreign currency | | | | | | | | | |
overdraft*** | | — | | — | | — | | 491 | |
Payable for trustee fees | | 1,531 | | 37,081 | | 6,548 | | 27,134 | |
Other accrued expenses and liabilities | | 222,994 | | 106,581 | | 322,293 | | 2,170,225 | |
Total liabilities | | 11,017,978 | | 5,291,843 | | 59,335,910 | | 120,222,734 | |
NET ASSETS | | $ | 235,831,055 | | $ | 120,534,680 | | $ | 341,009,600 | | $ | 4,056,615,910 | |
| | | | | | | | | |
NET ASSETS WERE COMPRISED OF: | | | | | | | | | |
Paid-in capital | | $ | 199,779,225 | | $ | 121,128,046 | | $ | 362,281,102 | | $ | 3,167,036,667 | |
Undistributed net investment income | | 1,106,905 | | 1,737,694 | | 2,368,780 | | 31,576,663 | |
Accumulated net realized gain (loss) on | | | | | | | | | |
investments and foreign currency | | | | | | | | | |
related transactions | | 4,898,594 | | (10,920,904 | ) | (64,239,012 | ) | 303,993,604 | |
Net unrealized appreciation on investments | | | | | | | | | |
and foreign currency related transactions | | 30,046,331 | | 8,589,844 | | 40,598,730 | | 554,008,976 | |
NET ASSETS | | $ | 235,831,055 | | $ | 120,534,680 | | $ | 341,009,600 | | $ | 4,056,615,910 | |
+ | | Including securities loaned at value | | $ | 4,912,810 | | $ | 4,778,120 | | $ | 54,813,594 | | $ | 98,489,416 | |
* | | Cost of investments in securities | | $ | 185,981,660 | | $ | 107,153,960 | | $ | 293,153,130 | | $ | 3,467,551,238 | |
** | | Cost of foreign currencies | | $ | 10,611,329 | | $ | 2,965 | | $ | 47,974 | | $ | — | |
*** | | Cost of foreign currencies overdraft | | $ | — | | $ | — | | $ | — | | $ | (1,570 | ) |
See Accompanying Notes to Financial Statements
23
STATEMENTS OF ASSETS AND LIABILITIES AS OF OCTOBER 31, 2005 (CONTINUED)
| | | | | | ING | | ING | |
| | ING | | ING | | International | | International | |
| | Foreign | | International | | SmallCap | | Value | |
| | Fund | | Fund | | Fund | | Fund | |
| | | | | | | | | |
Class A: | | | | | | | | | |
Net Assets | | | $ | 122,882,860 | | | $ | 51,192,568 | | | $ | 173,612,100 | | $ | 1,732,331,829 | |
Shares authorized | | | unlimited | | | unlimited | | | unlimited | | unlimited | |
Par value | | | $ | 0.00 | | | $ | 0.00 | | | $ | 0.00 | | $ | 0.01 | |
Shares outstanding | | | 8,309,121 | | | 4,667,084 | | | 4,598,867 | | 94,508,267 | |
Net asset value and redemption price per share | | | $ | 14.79 | | | $ | 10.97 | | | $ | 37.75 | | $ | 18.33 | |
Maximum offering price per share (5.75%)(1) | | | $ | 15.69 | | | $ | 11.64 | | | $ | 40.05 | | $ | 19.45 | |
| | | | | | | | | | | | |
Class B: | | | | | | | | | | | | |
Net Assets | | | $ | 22,943,553 | | | $ | 16,338,052 | | | $ | 57,130,991 | | $ | 411,070,804 | |
Shares authorized | | | unlimited | | | unlimited | | | unlimited | | unlimited | |
Par value | | | $ | 0.00 | | | $ | 0.00 | | | $ | 0.00 | | $ | 0.01 | |
Shares outstanding | | | 1,577,387 | | | 1,548,728 | | | 1,471,364 | | 22,898,409 | |
Net asset value and redemption price per share(2) | | | $ | 14.55 | | | $ | 10.55 | | | $ | 38.83 | | $ | 17.95 | |
Maximum offering price per share | | | $ | 14.55 | | | $ | 10.55 | | | $ | 38.83 | | $ | 17.95 | |
| | | | | | | | | | | | |
Class C: | | | | | | | | | | | | |
Net Assets | | | $ | 87,876,761 | | | $ | 15,008,117 | | | $ | 52,420,317 | | $ | 663,625,648 | |
Shares authorized | | | unlimited | | | unlimited | | | unlimited | | unlimited | |
Par value | | | $ | 0.00 | | | $ | 0.00 | | | $ | 0.00 | | $ | 0.01 | |
Shares outstanding | | | 6,032,288 | | | 1,422,269 | | | 1,472,722 | | 37,059,693 | |
Net asset value and redemption price per share(2) | | | $ | 14.57 | | | $ | 10.55 | | | $ | 35.59 | | $ | 17.91 | |
Maximum offering price per share | | | $ | 14.57 | | | $ | 10.55 | | | $ | 35.59 | | $ | 17.91 | |
| | | | | | | | | | | | |
Class I: | | | | | | | | | | | | |
Net Assets | | | $ | 1,048,708 | | | $ | 23,452,303 | | | n/a | | $ | 1,221,594,290 | |
Shares authorized | | | unlimited | | | unlimited | | | n/a | | unlimited | |
Par value | | | $ | 0.00 | | | $ | 0.00 | | | n/a | | $ | 0.01 | |
Shares outstanding | | | 70,257 | | | 2,144,563 | | | n/a | | 66,448,514 | |
Net asset value and redemption price per share | | | $ | 14.93 | | | $ | 10.94 | | | n/a | | $ | 18.38 | |
Maximum offering price per share | | | $ | 14.93 | | | $ | 10.94 | | | n/a | | $ | 18.38 | |
| | | | | | | | | | | | |
Class Q: | | | | | | | | | | | | |
Net Assets | | | $ | 1,079,173 | | | $ | 14,543,640 | | | $ | 57,846,192 | | $ | 27,993,339 | |
Shares authorized | | | unlimited | | | unlimited | | | unlimited | | unlimited | |
Par value | | | $ | 0.00 | | | $ | 0.00 | | | $ | 0.00 | | $ | 0.01 | |
Shares outstanding | | | 72,799 | | | 1,335,418 | | | 1,427,224 | | 1,524,074 | |
Net asset value and redemption price per share | | | $ | 14.82 | | | $ | 10.89 | | | $ | 40.53 | | $ | 18.37 | |
Maximum offering price per share | | | $ | 14.82 | | | $ | 10.89 | | | $ | 40.53 | | $ | 18.37 | |
(1) | | Maximum offering price is computed at 100/94.25 of net asset value. On purchases of $50,000 or more, the offering price is reduced. |
(2) | | Redemption price per share may be reduced for any applicable contingent deferred sales charges. |
See Accompanying Notes to Financial Statements
24
STATEMENTS OF OPERATIONS FOR THE YEAR ENDED OCTOBER 31, 2005
| | ING | | ING | | ING | |
| | Global | | Global | | Emerging | |
| | Real Estate | | Value Choice | | Countries | |
| | Fund | | Fund | | Fund | |
| | | | | | | |
INVESTMENT INCOME: | | | | | | | |
Dividends, net of foreign taxes withheld* | | $ | 4,228,882 | | | $ | 2,379,392 | | $ | 2,865,702 | |
Interest | | 116,406 | | | 132,408 | | 420,236 | |
Securities lending income | | — | | | 10,253 | | 40,595 | |
Total investment income | | 4,345,288 | | | 2,522,053 | | 3,326,533 | |
| | | | | | | | |
EXPENSES: | | | | | | | | |
Investment management fees | | 1,375,038 | | | 1,091,559 | | 1,424,134 | |
Distribution and service fees: | | | | | | | | |
Class A | | 275,873 | | | 157,468 | | 265,309 | |
Class B | | 86,945 | | | 262,084 | | 132,025 | |
Class C | | 177,802 | | | 337,539 | | 135,235 | |
Class M | | — | | | — | | 12,092 | |
Class Q | | — | | | 10,505 | | 25,481 | |
Transfer agent fees: | | | | | | | | |
Class A | | 52,910 | | | 99,749 | | 135,735 | |
Class B | | 4,167 | | | 58,079 | | 23,617 | |
Class C | | 8,512 | | | 75,142 | | 24,266 | |
Class M | | — | | | — | | 2,208 | |
Class I | | 84 | | | — | | — | |
Class Q | | — | | | 1,088 | | 4,203 | |
Administrative service fees | | 137,502 | | | 109,155 | | 113,930 | |
Shareholder reporting expense | | 32,065 | | | 102,819 | | 44,387 | |
Registration fees | | 58,324 | | | 53,010 | | 64,535 | |
Professional fees | | 20,675 | | | 20,232 | | 18,150 | |
Custody and accounting expense | | 22,235 | | | 47,840 | | 90,429 | |
Trustee fees | | 3,953 | | | 5,247 | | 4,056 | |
Insurance expense | | 1,697 | | | 1,851 | | 1,598 | |
Miscellaneous expense | | 7,825 | | | 12,650 | | 14,311 | |
Total expenses | | 2,265,607 | | | 2,446,017 | | 2,535,701 | |
Net recouped (waived and reimbursed) fees | | 112,929 | | | (48,215 | ) | (67,496 | ) |
Net expenses | | 2,378,536 | | | 2,397,802 | | 2,468,205 | |
Net investment income | | 1,966,752 | | | 124,251 | | 858,328 | |
| | | | | | | | |
REALIZED AND UNREALIZED GAIN (LOSS) | | | | | | | | |
ON INVESTMENTS AND FOREIGN CURRENCY | | | | | | | | |
RELATED TRANSACTIONS: | | | | | | | | |
Net realized gain (loss) on: | | | | | | | | |
Investments | | 12,517,088 | | | 25,260,163 | | 46,026,281 | |
Foreign currency related transactions | | (353,065 | ) | | (126,821 | ) | (167,217 | ) |
Payment by affiliate | | — | | | 8,840 | | 266,176 | |
Net realized gain on investments, | | | | | | | | |
foreign currency related transactions | | | | | | | | |
and payment by affiliate | | 12,164,023 | | | 25,142,182 | | 46,125,240 | |
Net change in unrealized appreciation | | | | | | | | |
or depreciation on: | | | | | | | | |
Investments | | 10,843,158 | | | (11,141,392 | ) | (26,295,657 | ) |
Foreign currency related transactions | | 2,092 | | | (30,426 | ) | (60,697 | ) |
Net change in unrealized appreciation | | | | | | | | |
or depreciation on investments and | | | | | | | | |
foreign currency related transactions | | 10,845,250 | | | (11,171,818 | ) | (26,356,354 | ) |
Net realized and unrealized gain on | | | | | | | | |
investments, foreign currency related | | | | | | | | |
transactions and payment by affiliate | | 23,009,273 | | | 13,970,364 | | 19,768,886 | |
Increase in net assets resulting from operations | | $ | 24,976,025 | | | $ | 14,094,615 | | $ | 20,627,214 | |
* | | Foreign taxes withheld | | $ | 256,645 | | | $ | 130,683 | | $ | 385,691 | |
See Accompanying Notes to Financial Statements
25
STATEMENTS OF OPERATIONS FOR THE YEAR ENDED OCTOBER 31, 2005
| | | | | | ING | | ING | |
| | ING | | ING | | International | | International | |
| | Foreign | | International | | SmallCap | | Value | |
| | Fund | | Fund | | Fund | | Fund | |
| | | | | | | | | |
INVESTMENT INCOME: | | | | | | | | | |
Dividends, net of foreign taxes withheld* | | | $ | 3,739,100 | | | $ | 2,670,663 | | | $ | 7,967,211 | | | $ | 89,590,031 | |
Interest | | | 316,283 | | | 285,638 | | | 758,864 | | | 10,347,072 | |
Securities lending income | | | 24,892 | | | 10,470 | | | 424,970 | | | 299,769 | |
Total investment income | | | 4,080,275 | | | 2,966,771 | | | 9,151,045 | | | 100,236,872 | |
| | | | | | | | | | | | | |
EXPENSES: | | | | | | | | | | | | | |
Investment management fees | | | 1,863,015 | | | 1,147,953 | | | 3,390,664 | | | 40,730,906 | |
Distribution and service fees: | | | | | | | | | | | | | |
Class A | | | 248,013 | | | 128,704 | | | 591,465 | | | 5,654,943 | |
Class B | | | 178,519 | | | 165,308 | | | 593,084 | | | 4,475,532 | |
Class C | | | 656,185 | | | 160,979 | | | 503,204 | | | 6,830,989 | |
Class Q | | | 2,852 | | | 24,243 | | | 151,115 | | | 71,976 | |
Transfer agent fees: | | | | | | | | | | | | | |
Class A | | | 111,997 | | | 74,741 | | | 274,880 | | | 2,177,078 | |
Class B | | | 20,165 | | | 23,985 | | | 96,312 | | | 516,961 | |
Class C | | | 74,134 | | | 23,374 | | | 81,816 | | | 790,777 | |
Class I | | | 914 | | | 2,257 | | | — | | | 464,180 | |
Class Q | | | 548 | | | 1,021 | | | 5,310 | | | 12,812 | |
Administrative service fees | | | 186,299 | | | 114,794 | | | 339,063 | | | 4,073,046 | |
Shareholder reporting expense | | | 31,995 | | | 37,528 | | | 137,044 | | | 617,995 | |
Registration fees | | | 69,795 | | | 49,308 | | | 58,612 | | | 82,848 | |
Professional fees | | | 17,107 | | | 12,693 | | | 29,140 | | | 244,065 | |
Custody and accounting expense | | | 239,518 | | | 59,340 | | | 163,516 | | | 1,220,150 | |
Trustee fees | | | 4,474 | | | 4,638 | | | 13,513 | | | 147,714 | |
Insurance expense | | | 1,822 | | | 1,649 | | | 5,172 | | | 60,810 | |
Miscellaneous expense | | | 9,442 | | | 9,390 | | | 27,147 | | | 1,268,609 | |
Total expenses | | | 3,716,794 | | | 2,041,905 | | | 6,461,057 | | | 69,441,391 | |
Net recouped fees | | | 25,859 | | | — | | | — | | | — | |
Net expenses | | | 3,742,653 | | | 2,041,905 | | | 6,461,057 | | | 69,441,391 | |
Net investment income | | | 337,622 | | | 924,866 | | | 2,689,988 | | | 30,795,481 | |
| | | | | | | | | | | | | |
REALIZED AND UNREALIZED GAIN (LOSS) | | | | | | | | | | | | | |
ON INVESTMENTS AND FOREIGN CURRENCY | | | | | | | | | | | | | |
RELATED TRANSACTIONS: | | | | | | | | | | | | | |
Net realized gain (loss) on: | | | | | | | | | | | | | |
Investments | | | 9,502,106 | | | 15,808,237 | | | 98,030,683 | | | 334,541,367 | |
Foreign currency related transactions | | | (1,833,185 | ) | | (163,812 | ) | | (1,085,920 | ) | | (1,313,398 | ) |
Payment by affiliate | | | — | | | 127,510 | | | 914,722 | | | 79,655 | |
Net realized gain on investments, | | | | | | | | | | | | | |
foreign currency related transactions | | | | | | | | | | | | | |
and payment by affiliate | | | 7,668,921 | | | 15,771,935 | | | 97,859,485 | | | 333,307,624 | |
Net change in unrealized appreciation | | | | | | | | | | | | | |
or depreciation on: | | | | | | | | | | | | | |
Investments | | | 21,552,282 | | | (3,056,148 | ) | | (16,250,317 | ) | | 193,480,616 | |
Foreign currency related transactions | | | (1,235,653 | ) | | (15,141 | ) | | (6,168 | ) | | (509,788 | ) |
Net change in unrealized appreciation or | | | | | | | | | | | | | |
depreciation on investments and | | | | | | | | | | | | | |
foreign currency related transactions | | | 20,316,629 | | | (3,071,289 | ) | | (16,256,485 | ) | | 192,970,828 | |
Net realized and unrealized gain on investments, | | | | | | | | | | | | | |
foreign currency related transactions and | | | | | | | | | | | | | |
payment by affiliate | | | 27,985,550 | | | 12,700,646 | | | 81,603,000 | | | 526,278,452 | |
Increase in net assets resulting from operations | | | $ | 28,323,172 | | | $ | 13,625,512 | | | $ | 84,292,988 | | $ | 557,073,933 | |
| | | | | | | | | | | | | | | | | |
* | | Foreign taxes withheld | | | $ | 547,196 | | | $ | 278,925 | | | $ | 727,389 | | $ | 11,540,682 | |
See Accompanying Notes to Financial Statements
26
STATEMENTS OF CHANGES IN NET ASSETS
| | ING Global Real Estate Fund | |
| | Year | | Year | |
| | Ended | | Ended | |
| | October 31, | | October 31, | |
| | 2005 | | 2004 | |
| | | | | |
FROM OPERATIONS: | | | | | |
Net investment income | | $ | 1,966,752 | | $ | 1,820,887 | |
Net realized gain on investments and foreign currency related transactions | | 12,164,023 | | 6,506,097 | |
Net change in unrealized appreciation or depreciation on investments and | | | | | |
foreign currency related transactions | | 10,845,250 | | 9,630,317 | |
Net increase in net assets resulting from operations | | 24,976,025 | | 17,957,301 | |
| | | | | |
FROM DISTRIBUTIONS TO SHAREHOLDERS: | | | | | |
Net investment income: | | | | | |
Class A | | (3,673,599 | ) | (2,020,848 | ) |
Class B | | (233,025 | ) | (92,026 | ) |
Class C | | (422,111 | ) | (115,157 | ) |
Class I | | (17,876 | ) | — | |
Net realized gains: | | | | | |
Class A | | (5,775,476 | ) | (2,440,018 | ) |
Class B | | (334,884 | ) | (103,979 | ) |
Class C | | (517,618 | ) | (110,735 | ) |
Total distributions | | (10,974,589 | ) | (4,882,763 | ) |
| | | | | |
FROM CAPITAL SHARE TRANSACTIONS: | | | | | |
Net proceeds from sale of shares | | 95,904,278 | | 56,992,662 | |
Dividends reinvested | | 8,286,072 | | 3,845,479 | |
| | 104,190,350 | | 60,838,141 | |
Cost of shares redeemed | | (46,019,544 | ) | (10,585,102 | ) |
Net increase in net assets resulting from capital share transactions | | 58,170,806 | | 50,253,039 | |
Net increase in net assets | | 72,172,242 | | 63,327,577 | |
| | | | | |
NET ASSETS: | | | | | |
Beginning of year | | 108,114,395 | | 44,786,818 | |
End of year | | $ | 180,286,637 | | $ | 108,114,395 | |
Accumulated net investment loss | | $ | (3,067,440 | ) | $ | (778,529 | ) |
See Accompanying Notes to Financial Statements
27
STATEMENTS OF CHANGES IN NET ASSETS
| | ING Global Value Choice Fund | | ING Emerging Countries Fund | |
| | Year | | Year | | Year | | Year | |
| | Ended | | Ended | | Ended | | Ended | |
| | October 31, | | October 31, | | October 31, | | October 31, | |
| | 2005 | | 2004 | | 2005 | | 2004 | |
| | | | | | | | | |
FROM OPERATIONS: | | | | | | | | | |
Net investment income (loss) | | $ | 124,251 | | $ | (748,568 | ) | $ | 858,328 | | $ | 276,515 | |
Net realized gain on investments, foreign currency related transactions and payment by affiliate | | 25,142,182 | | 21,327,711 | | 46,125,240 | | 17,726,017 | |
Net change in unrealized depreciation on investments and foreign currency related transactions | | (11,171,818 | ) | (10,025,365 | ) | (26,356,354 | ) | (5,624,977 | ) |
Net increase in net assets resulting from operations | | 14,094,615 | | 10,553,778 | | 20,627,214 | | 12,377,555 | |
| | | | | | | | | |
FROM DISTRIBUTIONS TO SHAREHOLDERS: | | | | | | | | | |
Net investment income: | | | | | | | | | |
Class A | | — | | — | | (59,355 | ) | (341,859 | ) |
Class M | | — | | — | | — | | (2,321 | ) |
Class Q | | — | | — | | (13,322 | ) | (96,899 | ) |
Total distributions | | — | | — | | (72,677 | ) | (441,079 | ) |
| | | | | | | | | |
FROM CAPITAL SHARE TRANSACTIONS: | | | | | | | | | |
Net proceeds from sale of shares | | 15,058,733 | | 13,920,775 | | 49,570,991 | | 63,742,660 | |
Dividends reinvested | | — | | — | | 65,764 | | 387,844 | |
| | 15,058,733 | | 13,920,775 | | 49,636,755 | | 64,130,504 | |
Cost of shares redeemed | | (43,124,283 | ) | (54,040,277 | ) | (37,110,260 | ) | (94,288,735 | ) |
Net increase (decrease) in net assets resulting from capital share transactions | | (28,065,550 | ) | (40,119,502 | ) | 12,526,495 | | (30,158,231 | ) |
Net increase (decrease) in net assets | | (13,970,935 | ) | (29,565,724 | ) | 33,081,032 | | (18,221,755 | ) |
| | | | | | | | | |
NET ASSETS: | | | | | | | | | |
Beginning of year | | 114,699,877 | | 144,265,601 | | 99,595,074 | | 117,816,829 | |
End of year | | $ | 100,728,942 | | $ | 114,699,877 | | $ | 132,676,106 | | $ | 99,595,074 | |
Undistributed net investment income at end of year | | $ | 396,508 | | $ | 947 | | $ | 670,204 | | $ | 53,249 | |
See Accompanying Notes to Financial Statements
28
STATEMENTS OF CHANGES IN NET ASSETS
| | ING Foreign Fund | | ING International Fund | |
| | Year | | Year | | Year | | Year | |
| | Ended | | Ended | | Ended | | Ended | |
| | October 31, | | October 31, | | October 31, | | October 31, | |
| | 2005 | | 2004 | | 2005 | | 2004 | |
| | | | | | | | | |
FROM OPERATIONS: | | | | | | | | | |
Net investment income | | $ | 337,622 | | $ | 22,738 | | $ | 924,866 | | $ | 627,166 | |
Net realized gain (loss) on investments, foreign currency related transactions and payment by affiliate | | 7,668,921 | | (2,094,226 | ) | 15,771,935 | | 12,363,164 | |
Net change in unrealized appreciation or depreciation on investments and foreign currency related transactions | | 20,316,629 | | 9,255,618 | | (3,071,289 | ) | 1,122,418 | |
Net increase in net assets resulting from operations | | 28,323,172 | | 7,184,130 | | 13,625,512 | | 14,112,748 | |
| | | | | | | | | |
FROM DISTRIBUTIONS TO SHAREHOLDERS: | | | | | | | | | |
Net investment income: | | | | | | | | | |
Class A | | — | | (31,426 | ) | (500,256 | ) | (65,485 | ) |
Class B | | — | | (6,143 | ) | (77,407 | ) | — | |
Class C | | — | | (20,429 | ) | (70,840 | ) | — | |
Class I | | — | | (964 | ) | (268,842 | ) | (43,979 | ) |
Class Q | | — | | (1,175 | ) | (93,747 | ) | (38,000 | ) |
Net realized gains: | | | | | | | | | |
Class A | | — | | (33,310 | ) | — | | — | |
Class B | | — | | (7,332 | ) | — | | — | |
Class C | | — | | (26,225 | ) | — | | — | |
Class I | | — | | (920 | ) | — | | — | |
Class Q | | — | | (1,471 | ) | — | | — | |
Return of capital: | | | | | | | | | |
Class A | | — | | (86,197 | ) | — | | — | |
Class B | | — | | (19,071 | ) | — | | — | |
Class C | | — | | (68,664 | ) | — | | — | |
Class I | | — | | (2,392 | ) | — | | — | |
Class Q | | — | | (3,826 | ) | — | | — | |
Total distributions | | — | | (309,545 | ) | (1,011,092 | ) | (147,464 | ) |
| | | | | | | | | |
FROM CAPITAL SHARE TRANSACTIONS: | | | | | | | | | |
Net proceeds from sale of shares | | 130,983,247 | | 117,807,728 | | 34,317,445 | | 59,336,093 | |
Dividends reinvested | | — | | 195,834 | | 927,388 | | 123,195 | |
Redemption fee proceeds | | — | | — | | 12,635 | | 9,571 | |
| | 130,983,247 | | 118,003,562 | | 35,257,468 | | 59,468,859 | |
Cost of shares redeemed | | (42,711,627 | ) | (19,794,538 | ) | (30,672,702 | ) | (67,247,422 | ) |
Net increase (decrease) in net assets resulting from capital share transactions | | 88,271,620 | | 98,209,024 | | 4,584,766 | | (7,778,563 | ) |
Net increase in net assets | | 116,594,792 | | 105,083,609 | | 17,199,186 | | 6,186,721 | |
| | | | | | | | | |
NET ASSETS: | | | | | | | | | |
Beginning of year | | 119,236,263 | | 14,152,654 | | 103,335,494 | | 97,148,773 | |
End of year | | $ | 235,831,055 | | $ | 119,236,263 | | $ | 120,534,680 | | $ | 103,335,494 | |
Undistributed net investment income at end of year | | $ | 1,106,905 | | $ | 4,284 | | $ | 1,737,694 | | $ | 1,011,247 | |
See Accompanying Notes to Financial Statements
29
STATEMENTS OF CHANGES IN NET ASSETS
| | ING International SmallCap Fund | | ING International Value Fund | |
| | Year | | Year | | Year | | Year | |
| | Ended | | Ended | | Ended | | Ended | |
| | October 31, | | October 31, | | October 31, | | October 31, | |
| | 2005 | | 2004 | | 2005 | | 2004 | |
| | | | | | | | | |
FROM OPERATIONS: | | | | | | | | | |
Net investment income (loss) | | $ | 2,689,988 | | $ | (358,177 | ) | $ | 30,795,481 | | $ | 22,990,839 | |
Net realized gain on investments, foreign currency related transactions and payment by affiliate | | 97,859,485 | | 75,495,671 | | 333,307,624 | | 282,586,322 | |
Net change in unrealized appreciation or depreciation on investments and foreign currency related transactions | | (16,256,485 | ) | (27,136,347 | ) | 192,970,828 | | 450,122,588 | |
Net increase in net assets resulting from operations | | 84,292,988 | | 48,001,147 | | 557,073,933 | | 755,699,749 | |
| | | | | | | | | |
FROM DISTRIBUTIONS TO
SHAREHOLDERS: | | | | | | | | | |
Net investment income: | | | | | | | | | |
Class A | | — | | (28,389 | ) | (24,560,725 | ) | (10,230,529 | ) |
Class B | | — | | — | | (2,978,147 | ) | (4,813,131 | ) |
Class C | | — | | — | | (4,480,827 | ) | (221,805 | ) |
Class I | | — | | — | | (14,637,231 | ) | — | |
Class Q | | — | | (35,174 | ) | (416,197 | ) | — | |
Net realized gains: | | | | | | | | | |
Class A | | — | | — | | (88,815,999 | ) | — | |
Class B | | — | | — | | (21,863,296 | ) | — | |
Class C | | — | | — | | (32,628,011 | ) | — | |
Class I | | — | | — | | (40,249,883 | ) | — | |
Class Q | | — | | — | | (1,347,031 | ) | — | |
Total distributions | | — | | (63,563 | ) | (231,977,347 | ) | (15,265,465 | ) |
| | | | | | | | | |
FROM CAPITAL SHARE TRANSACTIONS: | | | | | | | | | |
Net proceeds from sale of shares | | 93,365,295 | | 102,648,725 | | 888,315,865 | | 760,539,725 | |
Dividends reinvested | | — | | 53,883 | | 168,697,259 | | 11,832,249 | |
| | 93,365,295 | | 102,702,608 | | 1,057,013,124 | | 772,371,974 | |
Cost of shares redeemed | | (158,584,246 | ) | (170,219,420 | ) | (1,185,357,264 | ) | (855,607,324 | ) |
Net decrease in net assets resulting from capital share transactions | | (65,218,951 | ) | (67,516,812 | ) | (128,344,140 | ) | (83,235,350 | ) |
Net increase (decrease) in net assets | | 19,074,037 | | (19,579,228 | ) | 196,752,446 | | 657,198,934 | |
| | | | | | | | | |
NET ASSETS: | | | | | | | | | |
Beginning of year | | 321,935,563 | | 341,514,791 | | 3,859,863,464 | | 3,202,664,530 | |
End of year | | $ | 341,009,600 | | $ | 321,935,563 | | $ | 4,056,615,910 | | $ | 3,859,863,464 | |
Undistributed net investment income at end of year | | $ | 2,368,780 | | $ | 36,528 | | $ | 31,576,663 | | $ | 46,064,519 | |
See Accompanying Notes to Financial Statements
30
ING GLOBAL REAL ESTATE FUND | FINANCIAL HIGHLIGHTS |
Selected data for a share of beneficial interest outstanding throughout each period.
| | Class I | |
| | June 3, | |
| | 2005 to | |
| | October 31, | |
| | 2005(1) | |
Per Share Operating Performance: | | | |
Net asset value, beginning of period | | $ | 16.32 | | |
Income from investment operations: | | | | |
Net investment income | | $ | 0.14 | *† | |
Net realized and unrealized gain on investments | | $ | 0.86 | † | |
Total from investment operations | | $ | 1.00 | | |
Less distributions from: | | | | |
Net investment income | | $ | 0.18 | | |
Total distributions | | $ | 0.18 | | |
Net asset value, end of period | | $ | 17.14 | | |
Total Return(2) | | % | 6.14 | | |
| | | | |
Ratios and Supplemental Data: | | | | |
Net assets, end of period (000’s) | | $ | 1,681 | | |
Ratios to average net assets: | | | | |
Net expenses after expense reimbursement/recoupment(3) | | % | 1.30 | | |
Gross expenses prior to expense reimbursement/recoupment(3) | | % | 1.22 | | |
Net investment income(3) | | 0.85 | † | |
Portfolio turnover rate | | % | 91 | | |
| | | | | | | | |
(1) Commencement of operations.
(2) Total return is calculated assuming reinvestment of all dividends and capital gain distributions at net asset value. Total return for less than one year is not annualized
(3) Annualized for periods less than one year.
* Per share data calculated using average number of shares outstanding throughout the period.
† Effective November 1, 2004, the Fund adopted a policy to reduce cost of investments for financial statement purposes by the distributions received in excess of income from Real Estate Investment Trusts. The effect of this change for the twelve months ended October 31, 2005 was to decrease the net investment income per share by $0.30, increase net realized and unrealized gain on investments per share by $0.30 and decrease the ratio of net investment income to average net assets from 2.60% to 0.85%.
See Accompanying Notes to Financial Statements
31
ING GLOBAL VALUE CHOICE FUND | FINANCIAL HIGHLIGHTS |
Selected data for a share of beneficial interest outstanding throughout each period.
| | Class Q | |
| | Year Ended October 31, | |
| | 2005 | | 2004 | | 2003 | | 2002 | | 2001 | |
Per Share Operating Performance: | | | | | | | | | | | |
Net asset value, beginning of period | | $ | 18.61 | | | 17.17 | | | 14.34 | | | 17.87 | | | 30.37 | | |
Income (loss) from investment operations: | | | | | | | | | | | | | | | | |
Net investment income (loss) | | $ | 0.15 | | | 0.01 | | | (0.01 | ) | | (0.08 | )* | | (0.07 | )* | |
Net realized and unrealized gain (loss) on investments | | $ | 2.49 | | | 1.43 | | | 2.84 | | | (3.45 | )* | | (11.19 | )* | |
Total from investment operations | | $ | 2.64 | | | 1.44 | | | 2.83 | | | (3.53 | ) | | (11.26 | ) | |
Less distributions from: | | | | | | | | | | | | | | | | |
Net realized gains on investments | | $ | — | | | — | | | — | | | — | | | 0.89 | | |
Tax return of capital | | $ | — | | | — | | | — | | | — | | | 0.35 | | |
Total distributions | | $ | — | | | — | | | — | | | — | | | 1.24 | | |
Payment by affiliate | | $ | 0.00 | ** | | — | | | — | | | — | | | — | | |
Net asset value, end of period | | $ | 21.25 | | | 18.61 | | | 17.17 | | | 14.34 | | | 17.87 | | |
Total Return(1) | | % | 14.19 | † | | 8.39 | | | 19.74 | | | (19.75 | ) | | (38.56 | ) | |
| | | | | | | | | | | | | | | | |
Ratios and Supplemental Data: | | | | | | | | | | | | | | | | |
Net assets, end of period (000’s) | | $ | 4,387 | | | 4,223 | | | 6,454 | | | 8,194 | | | 17,178 | | |
Ratios to average net assets: | | | | | | | | | | | | | | | | |
Net expense after reimbursement/recoupment and brokerage commission recapture | | % | 1.55 | | | 1.59 | | | 1.54 | | | 1.49 | | | 1.51 | | |
Net expenses after expense reimbursement/recoupment and prior to brokerage commission recapture(2) | | % | 1.55 | | | 1.59 | | | 1.54 | | | 1.49 | | | 1.51 | | |
Gross expenses prior to expense reimbursement/recoupment and brokerage commission recapture | | % | 1.60 | | | 1.51 | | | 1.62 | | | 1.59 | | | 1.60 | | |
Net investment income (loss) after expense reimbursement/ recoupment and brokerage commission recapture(2) | | % | 0.75 | | | 0.05 | | | (0.04 | ) | | (0.47 | ) | | (0.30 | ) | |
Portfolio turnover rate | | % | 129 | | | 101 | | | 125 | | | 281 | | | 302 | | |
| | | | | | | | | | | | | | | | | | | | |
(1) Total return is calculated assuming reinvestment of all dividends and capital gain distributions at net asset value. Total return for less than one year is not annualized.
(2) The Investment Manager has agreed to limit expenses, (excluding interest, taxes, brokerage and extraordinary expenses) subject to possible recoupment by ING Investments, LLC within three years of being incurred.
* Per share data calculated using average number of shares outstanding throughout the period.
** Amount represents less than $0.005 per share.
† In 2005, there was no impact on total return due to payment by affiliate.
See Accompanying Notes to Financial Statements
32
ING EMERGING COUNTRIES FUND | FINANCIAL HIGHLIGHTS |
Selected data for a share of beneficial interest outstanding throughout each period.
| | Class Q | |
| | Year Ended October 31, | |
| | 2005 | | 2004 | | 2003 | | 2002 | | 2001 | |
Per Share Operating Performance: | | | | | | | | | | | |
Net asset value, beginning of period | | $ | 20.03 | | | 17.89 | | | 12.80 | | | 12.26 | | | 16.81 | | |
Income (loss) from investment operations: | | | | | | | | | | | | | | | | |
Net investment income (loss) | | $ | 0.26 | | | 0.09 | | | 0.12 | | | (0.14 | ) | | 0.09 | | |
Net realized and unrealized gain (loss) on investments | | $ | 4.07 | | | 2.17 | | | 4.97 | | | 0.68 | | | (4.64 | ) | |
Total from investment operations | | $ | 4.33 | | | 2.26 | | | 5.09 | | | 0.54 | | | (4.55 | ) | |
Less distributions from: | | | | | | | | | | | | | | | | |
Net investment income | | $ | 0.03 | | | 0.12 | | | — | | | 0.00 | * | | — | | |
Total distributions | | $ | 0.03 | | | 0.12 | | | — | | | 0.00 | * | | — | | |
Payment by affiliate | | $ | 0.05 | | | 0.00 | * | | — | | | — | | | — | | |
Net asset value, end of period | | $ | 24.38 | | | 20.03 | | | 17.89 | | | 12.80 | | | 12.26 | | |
Total Return(1) | | % | 21.89 | †† | | 12.70 | † | | 39.77 | | | 4.41 | | | (27.01 | ) | |
| | | | | | | | | | | | | | | | |
Ratios and Supplemental Data: | | | | | | | | | | | | | | | | |
Net assets, end of period (000’s) | | $ | 10,776 | | | 8,929 | | | 18,168 | | | 21,132 | | | 26,783 | | |
Ratios to average net assets: | | | | | | | | | | | | | | | | | |
Net expenses after expense reimbursement/recoupment(2) | | % | 1.85 | | | 2.10 | | | 1.93 | | | 2.00 | | | 1.97 | | |
Gross expenses prior to expense reimbursement/recoupment | | % | 1.85 | | | 2.00 | | | 2.03 | | | 1.94 | | | 1.98 | | |
Net investment income (loss) after expense reimbursement/recoupment(2) | | % | 1.12 | | | 0.36 | | | 0.59 | | | (0.24 | ) | | 0.42 | | |
Portfolio turnover rate | | % | 124 | | | 88 | | | 135 | | | 124 | | | 74 | | |
| | | | | | | | | | | | | | | | | | | | |
(1) Total return is calculated assuming reinvestment of all dividends and capital gain distributions at net asset value. Total return for less than one year is not annualized.
(2) The Investment Manager has agreed to limit expenses, (excluding interest, taxes, brokerage and extraordinary expenses) subject to possible recoupment by ING Investments, LLC within three years of being incurred.
* Amount represents less than $0.005 per share.
† In 2004, 0.25% of the total return consists of a gain on an investment not meeting the Fund’s investment restrictions. Excluding this item, total return would have been 21.64%. There was no impact on total return due to the payment by affiliate.
†† In 2005, 0.25% of the total return consists of a payment by affiliate. Excluding this item, total return would have been 21.64% for the Fund.
See Accompanying Notes to Financial Statements
33
ING FOREIGN FUND | FINANCIAL HIGHLIGHTS |
Selected data for a share of beneficial interest outstanding throughout each period.
| | Class I | |
| | | | | | September 10, | |
| | | | | | 2003(1) to | |
| | Year Ended October 31, | | October 31, | |
| | 2005 | | 2004 | | 2003 | |
Per Share Operating Performance: | | | | | | | |
Net asset value, beginning of period | | $ | 12.45 | | | 11.05 | | | 10.63 | | |
Income (loss) from investment operations: | | | | | | | | | | |
Net investment income (loss) | | $ | 0.34 | | | 0.19 | | | 0.00 | * | |
Net realized and unrealized gain on investments | | $ | 2.14 | | | 1.39 | | | 0.42 | | |
Total from investment operations | | $ | 2.48 | | | 1.58 | | | 0.42 | | |
Less distributions from: | | | | | | | | | | |
Net investment income | | $ | — | | | 0.04 | | | — | | |
Return of capital | | $ | — | | | 0.10 | | | — | | |
Net realized gain on investments | | $ | — | | | 0.04 | | | — | | |
Total distributions | | $ | — | | | 0.18 | | | — | | |
Net asset value, end of period | | $ | 14.93 | | | 12.45 | | | 11.05 | | |
Total Return(2) | | % | 19.92 | | | 14.53 | | | 3.95 | | |
| | | | | | | | | | |
Ratios and Supplemental Data: | | | | | | | | | | |
Net assets, end of period (000’s) | | $ | 1,049 | | | 2,547 | | | 188 | | |
Ratios to average net assets: | | | | | | | | | | |
Net expenses after expense reimbursement/recoupment(3)(4) | | % | 1.35 | | | 1.25 | | | 1.43 | | |
Gross expenses prior to and expense reimbursement/recoupment(3) | | % | 1.34 | | | 1.50 | | | 5.51 | | |
Net investment income (loss) after proceeds and expense reimbursement/recoupment(3)(4) | | % | 0.97 | | | 1.58 | | | 0.21 | | |
Portfolio turnover rate | | % | 81 | | | 141 | | | 50 | | |
| | | | | | | | | | | | | | | | |
| | Class Q | |
| | | | | | July 11, | |
| | | | | | 2003(1) to | |
| | Year Ended October 31, | | October 31, | |
| | 2005 | | 2004 | | 2003 | |
Per Share Operating Performance: | | | | | | | |
Net asset value, beginning of period | | $ | 12.40 | | | 11.02 | | | 10.13 | | |
Income (loss) from investment operations: | | | | | | | | | | |
Net investment income (loss) | | $ | 0.08 | | | 0.09 | | | (0.00 | )* | |
Net realized and unrealized gain on investments | | $ | 2.34 | | | 1.46 | | | 0.89 | | |
Total from investment operations | | $ | 2.42 | | | 1.55 | | | 0.89 | | |
Less distributions from: | | | | | | | | | | |
Net investment income | | $ | — | | | 0.03 | | | — | | |
Return of capital | | $ | — | | | 0.10 | | | — | | |
Net realized gain on investments | | $ | — | | | 0.04 | | | — | | |
Total distributions | | $ | — | | | 0.17 | | | — | | |
Net asset value, end of period | | $ | 14.82 | | | 12.40 | | | 11.02 | | |
Total Return(2) | | % | 19.52 | | | 14.28 | | | 8.79 | | |
| | | | | | | | | | |
Ratios and Supplemental Data: | | | | | | | | | | |
Net assets, end of period (000’s) | | $ | 1,079 | | | 1,054 | | | 421 | | |
Ratios to average net assets: | | | | | | | | | | |
Net expenses after expense reimbursement/recoupment(3)(4) | | % | 1.60 | | | 1.60 | | | 1.85 | | |
Gross expenses prior to and expense reimbursement/recoupment(3) | | % | 1.59 | | | 1.85 | | | 5.93 | | |
Net investment income (loss) after proceeds and expense reimbursement/recoupment(3)(4) | | % | 0.53 | | | 0.34 | | | (0.17 | ) | |
Portfolio turnover rate | | % | 81 | | | 141 | | | 50 | | |
| | | | | | | | | | | | | | | |
(1) Commencement of operations.
(2) Total return is calculated assuming reinvestment of all dividends and capital gain distributions at net asset value. Total return for less than one year is not annualized.
(3) Annualized for periods less than one year.
(4) The Investment Manager has agreed to limit expenses, (excluding interest, taxes, brokerage and extraordinary expenses) subject to possible recoupment by ING Investments, LLC within three years of being incurred.
* Amount represents less than $0.005 per share.
See Accompanying Notes to Financial Statements
34
ING INTERNATIONAL FUND | FINANCIAL HIGHLIGHTS |
Selected data for a share of beneficial interest outstanding throughout each period.
| | Class I | |
| | | | | | | | January 15, | |
| | | | | | | | 2002 to | |
| | Year Ended October 31, | | October 31, | |
| | 2005 | | 2004 | | 2003 | | 2002(1) | |
Per Share Operating Performance: | | | | | | | | | |
Net asset value, beginning of period | | $ | 9.76 | | 8.45 | | 7.06 | | 8.25 | |
Income (loss) from investment operations: | | | | | | | | | |
Net investment income | | $ | 0.14 | | 0.09 | | 0.10 | | 0.05 | |
Net realized and unrealized gain (loss) on investments | | $ | 1.18 | | 1.25 | | 1.34 | | (1.24 | ) |
Total from investment operations | | $ | 1.32 | | 1.34 | | 1.44 | | (1.19 | ) |
Less distributions from: | | | | | | | | | |
Net investment income | | $ | 0.15 | | 0.03 | | 0.05 | | — | |
Total distributions | | $ | 0.15 | | 0.03 | | 0.05 | | — | |
Payment by affiliate | | $ | 0.01 | | — | | — | | — | |
Net asset value, end of period | | $ | 10.94 | | 9.76 | | 8.45 | | 7.06 | |
Total Return(2) | | % | 13.73 | † | 15.94 | | 20.53 | | (14.42 | ) |
| | | | | | | | | |
Ratios and Supplemental Data: | | | | | | | | | |
Net assets, end of period (000’s) | | $ | 23,452 | | 17,211 | | 11,582 | | 6,384 | |
Ratios to average net assets: | | | | | | | | | |
Net expenses after expense reimbursement/recoupment | | | | | | | | | |
and brokerage commission recapture | | % | 1.26 | | 1.26 | | 1.33 | | 1.48 | |
Net expenses after expense reimbursement/recoupment and prior to brokerage commission recapture(3)(4) | | % | 1.26 | | 1.26 | | 1.33 | | 1.48 | |
Gross expenses prior to expense reimbursement/recoupment and brokerage commission recapture(3) | | % | 1.26 | | 1.22 | | 1.34 | | 1.53 | |
Net investment income after expense reimbursement/recoupment and brokerage commission recapture(3)(4) | | % | 1.34 | | 1.13 | | 1.29 | | 0.72 | |
Portfolio turnover rate | | % | 116 | | 90 | | 100 | | 126 | |
| | | | | | | | | | | | | | | |
| | Class Q | |
| | | | | | | | | | February 26, | |
| | | | | | | | | | 2001 to | |
| | Year Ended October 31, | | October 31, | |
| | 2005 | | 2004 | | 2003 | | 2002 | | 2001(1) | |
Per Share Operating Performance: | | | | | | | | | | | |
Net asset value, beginning of period | | $ | 9.72 | | | 8.43 | | | 7.04 | | | 8.10 | | | 9.89 | | |
Income (loss) from investment operations: | | | | | | | | | | | | | | | | |
Net investment income (loss) | | $ | 0.08 | | | 0.06 | | | 0.07 | | | (0.03 | ) | | (0.02 | ) | |
Net realized and unrealized gain (loss) on investments | | $ | 1.20 | | | 1.25 | | | 1.37 | | | (1.03 | ) | | (1.77 | ) | |
Total from investment operations | | $ | 1.28 | | | 1.31 | | | 1.44 | | | (1.06 | ) | | (1.79 | ) | |
Less distributions from: | | | | | | | | | | | | | | | | |
Net investment income | | $ | 0.12 | | | 0.02 | | | 0.05 | | | — | | | — | | |
Total distributions | | $ | 0.12 | | | 0.02 | | | 0.05 | | | — | | | — | | |
Payment by affiliate | | $ | 0.01 | | | — | | | — | | | — | | | — | | |
Net asset value, end of period | | $ | 10.89 | | | 9.72 | | | 8.43 | | | 7.04 | | | 8.10 | | |
Total Return(2) | | % | 13.41 | † | | 15.61 | | | 20.51 | | | (13.09 | ) | | (18.10 | ) | |
| | | | | | | | | | | | | | | | |
Ratios and Supplemental Data: | | | | | | | | | | | | | | | | |
Net assets, end of period (000’s) | | $ | 14,544 | | | 7,274 | | | 14,755 | | | 6,949 | | | 7 | | |
Ratios to average net assets: | | | | | | | | | | | | | | | | |
Net expenses after expense reimbursement/recoupment and brokerage commission recapture | | % | 1.51 | | | 1.60 | | | 1.59 | | | 1.61 | | | 2.27 | | |
Net expenses after expense reimbursement/recoupment and prior to brokerage commission recapture(3)(4) | | % | 1.51 | | | 1.60 | | | 1.59 | | | 1.61 | | | 2.27 | | |
Gross expenses prior to expense reimbursement/recoupment and brokerage commission recapture(3) | | % | 1.51 | | | 1.56 | | | 1.59 | | | 1.70 | | | 2.27 | | |
Net investment income (loss) after expense reimbursement/recoupment and brokerage commission recapture(3)(4) | | % | 1.00 | | | 0.73 | | | 0.91 | | | (0.08 | ) | | (0.24 | ) | |
Portfolio turnover rate | | % | 116 | | | 90 | | | 100 | | | 126 | | | 169 | | |
| | | | | | | | | | | | | | | | | | | | |
(1) Commencement of operations.
(2) Total return is calculated assuming reinvestment of all dividends and capital gain distributions at net asset value. Total return for less than one year is not annualized.
(3) Annualized for periods less than one year.
(4) The Investment Manager has agreed to limit expenses, (excluding interest, taxes, brokerage and extraordinary expenses) subject to possible recoupment by ING Investments, LLC within three years of being incurred.
† In 2005, 0.10% of the total return on Class I and Class Q, respectively, consists of a payment by affiliate. Excluding this item, total return would have been 13.63% and 13.31% for Class I and Class Q, respectively.
See Accompanying Notes to Financial Statements
35
ING INTERNATIONAL SMALLCAP FUND | FINANCIAL HIGHLIGHTS |
Selected data for a share of beneficial interest outstanding throughout each period.
| | Class Q | |
| | Year Ended October 31, | |
| | 2005 | | 2004 | | 2003 | | 2002 | | 2001 | |
Per Share Operating Performance: | | | | | | | | | | | |
Net asset value, beginning of period | | $ | 31.34 | | | 27.11 | | | 19.54 | | | 23.19 | | | 38.18 | | |
Income (loss) from investment operations: | | | | | | | | | | | | | | | | |
Net investment income (loss) | | $ | 0.43 | ** | | 0.10 | | | 0.21 | | | 0.04 | | | 0.00 | * | |
Net realized and unrealized gain (loss) on investments | | $ | 8.66 | | | 4.13 | | | 7.36 | | | (3.69 | ) | | (12.12 | ) | |
Total from investment operations | | $ | 9.09 | | | 4.23 | | | 7.57 | | | (3.65 | ) | | (12.12 | ) | |
Less distributions from: | | | | | | | | | | | | | | | | |
Net investment income | | $ | — | | | 0.01 | | | — | | | — | | | 0.24 | | |
Net realized gains on investments | | $ | — | | | — | | | — | | | — | | | 2.63 | | |
Total distributions | | $ | — | | | 0.01 | | | — | | | — | | | 2.87 | | |
Payment by affiliate | | $ | 0.10 | | | 0.01 | | | — | | | — | | | — | | |
Net asset value, end of period | | $ | 40.53 | | | 31.34 | | | 27.11 | | | 19.54 | | | 23.19 | | |
Total Return(1) | | % | 29.32 | †† | | 15.66 | † | | 38.74 | | | (15.74 | ) | | (34.11 | ) | |
| | | | | | | | | | | | | | | | |
Ratios and Supplemental Data: | | | | | | | | | | | | | | | | |
Net assets, end of period (000’s) | | $ | 57,846 | | | 61,166 | | | 79,140 | | | 70,404 | | | 91,089 | | |
Ratios to average net assets: | | | | | | | | | | | | | | | | |
Net expenses after expense reimbursement/recoupment(2) | | % | 1.49 | | | 1.50 | | | 1.59 | | | 1.55 | | | 1.50 | | |
Gross expenses prior to expense reimbursement/recoupment | | % | 1.49 | | | 1.47 | | | 1.58 | | | 1.59 | | | 1.50 | | |
Net investment income (loss) after expense reimbursement/recoupment(2) | | % | 1.18 | | | 0.28 | | | 0.35 | | | 0.07 | | | 0.04 | | |
Portfolio turnover rate | | % | 124 | | | 106 | | | 114 | | | 149 | | | 143 | | |
| | | | | | | | | | | | | | | | | | | | |
(1) Total return is calculated assuming reinvestment of all dividends and capital gain distributions at net asset value. Total return for less than one year is not annualized.
(2) The Investment Manager has agreed to limit expenses, (excluding interest, taxes, brokerage and extraordinary expenses) subject to possible recoupment by ING Investments , LLC within three years of being incurred.
* Amount represents less than $0.005 per share.
** Per share data calculated using average number of shares outstanding throughout the period.
† In 2004, the Sub-Adviser fully reimbursed the Fund for a loss on a transaction not meeting the Fund’s investment guidelines, which otherwise would have reduced total return by 0.04%.
†† In 2005, 0.32% of the total return on the Fund consists of a payment by affiliate. Excluding this item, total return would have been 29.00% on the Fund.
See Accompanying Notes to Financial Statements
36
ING INTERNATIONAL VALUE FUND | FINANCIAL HIGHLIGHTS |
Selected data for a share of beneficial interest outstanding throughout each period.
| | Class I | |
| | | | | | | | | | June 18, | |
| | | | | | | | | | 2001 to | |
| | Year Ended October 31, | | October 31, | |
| | 2005 | | 2004 | | 2003 | | 2002 | | 2001(1) | |
Per Share Operating Performance: | | | | | | | | | | | |
Net asset value, beginning of period | | $ | 16.96 | | | 13.74 | | | 10.43 | | | 12.35 | | | 13.89 | | |
Income (loss) from investment operations: | | | | | | | | | | | | | | | | |
Net investment income | | $ | 0.20 | | | 0.16 | | | 0.13 | | | 0.16 | | | 0.02 | | |
Net realized and unrealized gain (loss) on investments | | $ | 2.31 | | | 3.20 | | | 3.48 | | | (1.68 | ) | | (1.56 | ) | |
Total from investment operations | | $ | 2.51 | | | 3.36 | | | 3.61 | | | (1.52 | ) | | (1.54 | ) | |
Less distributions from: | | | | | | | | | | | | | | | | |
Net investment income | | $ | 0.29 | | | 0.14 | | | 0.10 | | | 0.14 | | | — | | |
Net realized gains on investments | | $ | 0.80 | | | — | | | 0.20 | | | 0.26 | | | — | | |
Total distributions | | $ | 1.09 | | | 0.14 | | | 0.30 | | | 0.40 | | | — | | |
Payment by affiliate | | $ | 0.00 | * | | — | | | — | | | — | | | — | | |
Net asset value, end of period | | $ | 18.38 | | | 16.96 | | | 13.74 | | | 10.43 | | | 12.35 | | |
Total Return(2) | | % | 15.42 | † | | 24.67 | | | 35.58 | | | (12.89 | ) | | (11.09 | ) | |
| | | | | | | | | | | | | | | | | |
Ratios and Supplemental Data: | | | | | | | | | | | | | | | | |
Net assets, end of period (000’s) | | $ | 1,221,594 | | | 831,142 | | | 482,047 | | | 372,352 | | | 226,067 | | |
Ratios to average net assets: | | | | | | | | | | | | | | | | |
Expenses(3) | | % | 1.23 | | | 1.21 | | | 1.29 | | | 1.32 | | | 1.24 | | |
Net investment income(3) | | % | 1.18 | | | 1.18 | | | 1.12 | | | 1.04 | | | 0.62 | | |
Portfolio turnover rate | | % | 21 | | | 29 | | | 9 | | | 20 | | | 15 | | |
| | | | | | | | | | | | | | | | | | | | |
| | Class Q | |
| | Year Ended October 31, | |
| | 2005 | | 2004 | | 2003 | | 2002 | | 2001 | |
Per Share Operating Performance: | | | | | | | | | | | |
Net asset value, beginning of period | | $ | 16.94 | | | 13.73 | | | 10.44 | | | 12.34 | | | 16.68 | | |
Income (loss) from investment operations: | | | | | | | | | | | | | | | | |
Net investment income | | $ | 0.19 | | | 0.14 | | | 0.10 | | | 0.07 | | | 0.10 | | |
Net realized and unrealized gain (loss) on investments | | $ | 2.29 | | | 3.17 | | | 3.49 | | | (1.63 | ) | | (2.42 | ) | |
Total from investment operations | | $ | 2.48 | | | 3.31 | | | 3.59 | | | (1.56 | ) | | (2.32 | ) | |
Less distributions from: | | | | | | | | | | | | | | | | |
Net investment income | | $ | 0.25 | | | 0.10 | | | 0.10 | | | 0.08 | | | 0.14 | | |
Net realized gains on investments | | $ | 0.80 | | | — | | | 0.20 | | | 0.26 | | | 1.88 | | |
Total distributions | | $ | 1.05 | | | 0.10 | | | 0.30 | | | 0.34 | | | 2.02 | | |
Payment by affiliate | | $ | 0.00 | * | | — | | | — | | | — | | | — | | |
Net asset value, end of period | | $ | 18.37 | | | 16.94 | | | 13.73 | | | 10.44 | | | 12.34 | | |
Total Return(2) | | % | 15.20 | † | | 24.32 | | | 35.37 | | | (13.11 | ) | | (15.80 | ) | |
| | | | | | | | | | | | | | | | |
Ratios and Supplemental Data: | | | | | | | | | | | | | | | | |
Net assets, end of period (000’s) | | $ | 27,993 | | | 28,862 | | | 29,319 | | | 29,836 | | | 35,802 | | |
Ratios to average net assets: | | | | | | | | | | | | | | | | |
Expenses(3) | | % | 1.48 | | | 1.46 | | | 1.54 | | | 1.49 | | | 1.59 | | |
Net investment income(3) | | % | 0.99 | | | 0.89 | | | 0.87 | | | 0.63 | | | 0.91 | | |
Portfolio turnover rate | | % | 21 | | | 29 | | | 9 | | | 20 | | | 15 | | |
| | | | | | | | | | | | | | | | | | | | |
(1) Commencement of operations.
(2) Total return is calculated assuming reinvestment of all dividends and capital gain distributions at net asset value. Total return for less than one year is not annualized.
(3) Annualized for periods less than one year.
* Amount represents less than $0.005 per share.
† In 2005, there was no impact on total return due to payment by affiliate.
See Accompanying Notes to Financial Statements
37
NOTES TO FINANCIAL STATEMENTS AS OF OCTOBER 31, 2005 |
NOTE 1 — ORGANIZATION
Organization. The ING Funds included in this report are comprised of ING Mutual Funds (“IMF”) and ING Mayflower Trust (“IMT”); both are organized as open-end investment management companies registered under the Investment Company Act of 1940, as amended.
IMF is a Delaware statutory trust organized in 1992 with ten separate series (“Funds”): ING Global Real Estate Fund (“Global Real Estate”), ING Global Value Choice Fund (“Global Value Choice”), ING Emerging Countries Fund (“Emerging Countries”), ING Foreign Fund (“Foreign”), ING International Fund (“International”) and ING International SmallCap Fund (“International SmallCap”). IMT is a Massachusetts business trust organized in 1993 with one series (Fund), ING International Value Fund (“International Value”). The investment objective of each Fund is described in each Fund’s prospectus.
Each Fund offers one or more of the following classes of shares: Class A, Class B, Class C, Class I, Class M and Class Q (Class I and Class Q are presented in a separate annual report). The separate classes of shares differ principally in the applicable sales charges (if any), distribution fees and shareholder servicing fees and transfer agent fees. Shareholders of each class also bear certain expenses that pertain to that particular class. All shareholders bear the common expenses of the Fund and earn income and realized gains/losses from the portfolio pro rata based on the average daily net assets of each class, without distinction between share classes. Differences in per share dividend rates generally result from the differences in separate class expenses, including distribution and shareholder servicing fees. Class B shares, along with their pro rata reinvested dividend shares, automatically convert to Class A shares approximately eight years after purchase.
Effective September 2, 2003, International Value was closed to new investments except for shares purchased (1) through the reinvestment of dividends and distributions; (2) by 401(k), 403(b) and 457 plans that have selected International Value as an investment option prior to June 28, 2002; (3) by shareholders participating in mutual fund wrap fee programs who were invested in International Value prior to June 28, 2002; (4) by new 401(k), 403(b) and 457 plans and new shareholders participating in mutual fund wrap fee programs subject to approval by the Investment Manager and Sub-Adviser based on their assessment of the Fund’s ability to invest the monies consistent with the Fund’s objectives in light of market conditions, the size of the purchase, and other relevant factors relating to International Value, or (5) by employees of the Investment Manager or Sub-Adviser and their affiliates. Proof of eligibility may be required. Employees of the Investment Manager or Sub-Adviser and their affiliates must identify themselves as such at the time of purchase. Failure to do so may result in a rejection of the purchase.
NOTE 2 — SIGNIFICANT ACCOUNTING POLICIES
The following significant accounting policies are consistently followed by the Funds in the preparation of their financial statements, and such policies are in conformity with accounting principles generally accepted in the United States of America for investment companies.
A. Security Valuation. For all Funds investments in equity securities traded on a national securities exchange are valued at the last reported sale price. Securities reported by NASDAQ will be valued at the NASDAQ official closing prices. Securities traded on an exchange or NASDAQ for which there has been no sale, securities traded in the over-the-counter-market, gold and silver bullion, platinum and palladium are valued at the mean between the last reported bid and ask prices. All investments quoted in foreign currencies will be valued daily in U.S. dollars on the basis of the foreign currency exchange rates prevailing at that time. Debt securities are valued at prices obtained from independent services or from one or more dealers making markets in the securities and may be adjusted based on the Fund’s valuation procedures. U.S. Government obligations are valued by using market quotations or independent pricing services that use prices provided by market-makers or estimates of market values obtained from yield data relating to instruments or securities with similar characteristics.
Securities and assets for which market quotations are not readily available (which may include certain restricted securities which are subject to limitations as to their sale) are valued at their fair values as determined in good faith by or under the supervision of the Fund’s Board in accordance with methods that are specifically authorized by the Board. Securities traded on exchanges, including foreign exchanges, which close earlier than the time that a Fund calculates its next net asset value may also be valued at their fair values as determined in good faith by or under the supervision of a Fund’s Board, in accordance with methods that are specifically authorized by the Board. The valuation techniques applied in any specific instance are likely
38
NOTES TO FINANCIAL STATEMENTS AS OF OCTOBER 31, 2005 (CONTINUED) |
NOTE 2 — SIGNIFICANT ACCOUNTING POLICIES (continued)
to vary from case to case. With respect to a restricted security, for example, consideration is generally given to the cost of the investment, the market value of any unrestricted securities of the same class at the time of valuation, the potential expiration of restrictions on the security, the existence of any registration rights, the costs to the Fund related to registration of the security, as well as factors relevant to the issuer itself. Consideration may also be given to the price and extent of any public trading in similar securities of the issuer or comparable companies’ securities.
The value of a foreign security traded on an exchange outside the United States is generally based on its price on the principal foreign exchange where it trades as of the time the Fund determines its NAV or if the foreign exchange closes prior to the time the Fund determines its NAV, the most recent closing price of the foreign security on its principal exchange. Trading in certain non-U.S. securities may not take place on all days on which the NYSE is open. Further, trading takes place in various foreign markets on days on which the NYSE is not open. Consequently, the calculation of the Fund’s NAV may not take place contemporaneously with the determination of the prices of securities held by the Fund in foreign securities markets. Further, the value of a Fund’s assets may be significantly affected by foreign trading on days when a shareholder cannot purchase or redeem shares of the Fund. In calculating a Fund’s NAV, foreign securities in foreign currency are converted to U.S. dollar equivalents.
If an event occurs after the time at which the market for foreign securities held by the Fund closes but before the time that the Fund’s next NAV is calculated, such event may cause the closing price on the foreign exchange to not represent a readily available reliable market value quotation for such securities at the time the Fund determines its NAV. In such a case, the Fund will use the fair value of such securities as determined under the Fund’s valuation procedures. Events after the close of trading on a foreign market that could require the Fund to fair value some or all of its foreign securities include, among others, securities trading in the U.S. and other markets, corporate announcements, natural and other disasters, and political and other events. Among other elements of analysis in the determination of a security’s fair value, the Board has authorized the use of one or more independent research services to assist with such determinations. An independent research service may use statistical analyses and quantitative models to help determine fair value as of the time a Fund calculates its NAV. There can be no assurance that such models accurately reflect the behavior of the applicable markets or the effect of the behavior of such markets on the fair value of securities, or that such markets will continue to behave in a fashion that is consistent with such models. Unlike the closing price of a security on an exchange, fair value determinations employ elements of judgment. Consequently, the fair value assigned to a security may not represent the actual value that the Fund could obtain if it were to sell the security at the time of the close of the NYSE. Pursuant to procedures adopted by the Board, the Fund is not obligated to use the fair valuations suggested by any research service, and valuation recommendations provided by such research services may be overridden if other events have occurred or if other fair valuations are determined in good faith to be more accurate. Unless an event is such that it causes the Fund to determine that the closing prices for one or more securities do not represent readily available reliable market value quotations at the time the Fund determines its NAV, events that occur between the time of the close of the foreign market on which they are traded and the close of regular trading on the NYSE will not be reflected in the Fund’s NAV. Investments in securities maturing in 60 days or less are valued at amortized cost, which, when combined with accrued interest approximates market value.
B. Security Transactions and Revenue Recognition. Securities transactions are accounted for on the trade date. Realized gains and losses are reported on the basis of identified cost of securities sold. Interest income is recorded on an accrual basis. Dividend income is recorded, net of any applicable withholding tax, on the ex-dividend date, or for certain foreign securities, when the information becomes available to the Funds. Premium amortization and discount accretion are determined by the effective yield method.
The Fund estimates components of distributions from real estate investment trust (REITs). Distributions received in excess of income are recorded as a reduction of cost of the related investments. If the Funds no longer own the applicable securities, any distributions received in excess of income are recorded as realized gains.
C. Foreign Currency Translation. The books and records of the Funds are maintained in U.S. dollars. Any foreign currency amounts are translated into U.S. dollars on the following basis:
(1) Market value of investment securities, other assets and liabilities — at the exchange rates prevailing at the end of the day.
39
NOTES TO FINANCIAL STATEMENTS AS OF OCTOBER 31, 2005 (CONTINUED) |
NOTE 2 — SIGNIFICANT ACCOUNTING POLICIES (continued)
(2) Purchases and sales of investment securities, income and expenses — at the rates of exchange prevailing on the respective dates of such transactions.
Although the net assets and the market values are presented at the foreign exchange rates at the end of the day, the Funds do not isolate the portion of the results of operations resulting from changes in foreign exchange rates on investments from the fluctuations arising from changes in market prices of securities held. Such fluctuations are included with the net realized and unrealized gains or losses from investments. For securities that are subject to foreign withholding tax upon disposition, liabilities are recorded on the Statements of Assets and Liabilities for the estimated tax withholding based on the securities’ current market value. Upon disposition, realized gains or losses on such securities are recorded net of foreign withholding tax.
Reported net realized foreign exchange gains or losses arise from sales of foreign currencies, currency gains or losses realized between the trade and settlement dates on securities transactions, the difference between the amounts of dividends, interest, and foreign withholding taxes recorded on the Fund’s books, and the U.S. dollar equivalent of the amounts actually received or paid. Net unrealized foreign exchange gains and losses arise from changes in the value of assets and liabilities other than investments in securities at fiscal year end, resulting from changes in the exchange rate. Foreign security and currency transactions may involve certain considerations and risks not typically associated with investing in U.S. companies and U.S. Government securities. These risks include, but are not limited to revaluation of currencies and future adverse political and economic developments which could cause securities and their markets to be less liquid and prices more volatile than those of comparable U.S. companies and U.S. Government securities.
D. Foreign Currency Transactions and Futures Contracts. Each Fund may enter into foreign currency exchange transactions to convert to and from different foreign currencies and to and from the U.S. dollar generally in connection with the planned purchases or sales of securities. The Funds either enter into these transactions on a spot basis at the spot rate prevailing in the foreign currency exchange market or uses forward foreign currency contracts to purchase or sell foreign currencies. When the contract is fulfilled or closed, gains or losses are realized. Until then, the gain or loss is included in unrealized appreciation or depreciation. Risks may arise upon entering into forward contracts from the potential inability of counterparties to meet the terms of their forward contracts and from unanticipated movements in the value of foreign currencies relative to the U.S. dollar.
Each Fund may enter into futures contracts involving foreign currency, interest rates, securities and securities indices. A futures contract obligates the seller of the contract to deliver and the purchaser of the contract to take delivery of the type of foreign currency, financial instrument or security called for in the contract at a specified future time for a specified price. Upon entering into such a contract, a Fund is required to deposit and maintain as collateral such initial margin as required by the exchange on which the contract is traded. Pursuant to the contract, a Fund agrees to receive from or pay to the broker an amount equal to the daily fluctuations in the value of the contract. Such receipts or payments are known as variation margin and are recorded as unrealized gains or losses by the Fund. When the contract is closed, the Fund records a realized gain or loss equal to the difference between the value of the contract at the time it was opened and the value at the time it was closed.
E. Distributions to Shareholders. The Funds record distributions to their shareholders on ex-dividend date. Each Fund pays dividends and capital gains, if any, annually (except Global Real Estate, which pay dividends, if any, quarterly). The Funds may make distributions on a more frequent basis to comply with the distribution requirements of the Internal Revenue Code. The characteristics of income and gains to be distributed are determined in accordance with income tax regulations, which may differ from accounting principles generally accepted in the United States of America for investment companies.
F. Federal Income Taxes. It is the policy of the Funds to comply with subchapter M of the Internal Revenue Code and related excise tax provisions applicable to regulated investment companies and to distribute substantially all of their net investment income and any net realized capital gains to their shareholders. Therefore, no federal income tax provision is required. No capital gain distributions shall be made until any capital loss carryforwards have been fully utilized or expired.
The Funds may utilize equalization accounting for tax purposes, where by a portion of redemption payments are treated as distributions of income or gain.
40
NOTES TO FINANCIAL STATEMENTS AS OF OCTOBER 31, 2005 (CONTINUED) |
NOTE 2 — SIGNIFICANT ACCOUNTING POLICIES (continued)
G. Use of Estimates. Management of the Funds has made certain estimates and assumptions relating to the reporting of assets, liabilities, income, and expenses to prepare these financial statements in conformity with accounting principles generally accepted in the United States of America for investment companies. Actual results could differ from these estimates.
H. Organization Expenses and Offering Costs. Costs incurred with the organization of the Funds were expensed as incurred. Costs incurred with the offering of shares of the Funds are deferred and amortized over a twelve-month period on a straight-line basis.
I. Repurchase Agreements. Each Fund may invest in repurchase agreements only with government securities dealers recognized by the Board of Governors of the Federal Reserve System. Under such agreements, the seller of the security agrees to repurchase it at a mutually agreed upon time and price. The resale price is in excess of the purchase price and reflects an agreed upon interest rate for the period of time the agreement is outstanding. The period of the repurchase agreements is usually short, from overnight to one week, while the underlying securities generally have longer maturities. Each Fund will receive as collateral securities acceptable to it whose market value is equal to at least 100% of the carrying amount of the repurchase agreements, plus accrued interest, being invested by the Fund. The underlying collateral is valued daily on a mark to market basis to assure that the value, including accrued interest is at least equal to the repurchase price. There would be potential loss to the Fund in the event the Fund is delayed or prevented from exercising its right to dispose of the collateral, and it might incur disposition costs in liquidating the collateral.
J. Securities Lending. Each Fund has the option to temporarily loan up to 30% of its total assets to brokers, dealers or other financial institutions in exchange for a negotiated lender’s fee. The borrower is required to fully collateralize the loans with cash or U.S. Government securities. Generally, in the event of counterparty default, the Fund has the right to use collateral to offset losses incurred. There would be potential loss to the Fund in the event the Fund is delayed or prevented from exercising its right to dispose of the collateral. The Fund bears the risk of loss with respect to the investment of collateral. Engaging in securities lending could have a leveraging effect, which may intensify the credit, market and other risks associated with investing in a Fund.
K. Options Contracts. All Funds may purchase put and call options and may write (sell) put options and covered call options. The Funds may engage in option transactions as a hedge against adverse movements in the value of portfolio holdings or to increase market exposure. Option contracts are valued daily and unrealized gains or losses are recorded based upon the last sales price on the principal exchange on which the options are traded. The Funds will realize a gain or loss upon the expiration or closing of the option contract. When an option is exercised, the proceeds on sales of the underlying security for a written call option, the purchase cost of the security for a written put option, or the cost of the security for a purchased put or call option is adjusted by the amount of premium received or paid. Realized and unrealized gains or losses on option contracts are reflected in the accompanying financial statements. The risk in writing a call option is that the Funds give up the opportunity for profit if the market price of the security increases and the option is exercised. The risk in writing a put option is that the Funds may incur a loss if the market price of the security decreases and the option is exercised. The risk in buying an option is that the Funds pay a premium whether or not the option is exercised. Risks may also arise from an illiquid secondary market or from the inability of counterparties to meet the terms of the contract.
L. Illiquid and Restricted Securities. Each Fund may not invest more than 15% of its net assets in illiquid securities. Illiquid securities are not readily marketable. Disposing of illiquid investments may involve time-consuming negotiation and legal expenses, and it may be difficult or impossible for the Funds to sell them promptly at an acceptable price. Each Fund may also invest in restricted securities which include those sold under Rule 144A of the Securities Act of 1933 (“1933 Act”) or securities offered pursuant to Section 4(2) of the 1933 Act, and/or are subject to legal or contractual restrictions on resale and may not be publicly sold without registration under the 1933 Act. Certain restricted securities may be considered liquid pursuant to procedures adopted by the Board or may be deemed illiquid because they may not be readily marketable. Illiquid and restricted securities are valued using market quotations when readily available. In the absence of market quotations, the securities are valued based upon their fair value determined under procedures approved by the Board.
M. Delayed Delivery Transaction. The Funds may purchase or sell securities on a when-issued or forward commitment basis. The price of the
41
NOTES TO FINANCIAL STATEMENTS AS OF OCTOBER 31, 2005 (CONTINUED)
NOTE 2 — SIGNIFICANT ACCOUNTING POLICIES (continued)
underlying securities and date when the securities will be delivered and paid for are fixed at the time the transaction is negotiated. The market value of these securities is identified in the Funds’ Portfolio of Investments. Losses may arise due to changes in the market value of the securities or from the inability of counterparties to meet the terms of the contract. In connection with such purchases, the Funds are required to segregate liquid assets sufficient to cover the purchase price.
NOTE 3 — INVESTMENT TRANSACTIONS
For the year ended October 31, 2005, the cost of purchases and proceeds from the sales of securities, excluding short-term securities, were as follows:
| | Purchases | | Sales | |
Global Real Estate | | $173,370,841 | | $ 123,334,533 | |
Global Value Choice | | 138,155,489 | | 167,790,207 | |
Emerging Countries | | 142,492,694 | | 135,260,926 | |
Foreign | | 218,049,170 | | 145,008,809 | |
International | | 133,965,201 | | 128,793,613 | |
International SmallCap | | 413,148,346 | | 475,065,711 | |
International Value | | 825,373,772 | | 1,108,212,398 | |
NOTE 4 — REDEMPTION FEES
International imposes a 2% redemption fee on Class A shares redeemed (including in connection with an exchange) within 30 days or less from their date of purchase. The redemption fee is recorded as an addition to paid-in capital. Total redemption fee proceeds for the years ended October 31, 2005 and 2004 were $12,635 and $9,571, respectively, and are set forth in the Statements of Changes in Net Assets.
NOTE 5 — INVESTMENT MANAGEMENT AND ADMINISTRATIVE FEES
Each of the Funds has entered into an Investment Management Agreement with ING Investments, LLC (the “Investment Manager”). The Investment Management Agreements compensate the Investment Manager with a fee, computed daily and payable monthly, based on the average daily net assets of each Fund, at the following annual rates:
| | As a percentage of average net assets |
Global Real Estate | | 1.00% on the first $250 million; 0.90% on the next $250 million; and 0.80% thereafter |
Global Value Choice | | 1.00% on the first $250 million; 0.90% on the next $250 million; 0.80% on the next $500 million; and 0.75% thereafter |
Emerging Countries | | 1.25% |
Foreign | | 1.00% on the first $500 million; and 0.90% thereafter |
International | | 1.00% |
International SmallCap | | 1.00% on first $500 million; 0.90% on next $500 million; and 0.85% thereafter |
International Value | | 1.00% |
ING Clarion Real Estate Securities L.P. (“ING Clarion”) a registered investment adviser, serves as a Sub-Adviser to Global Real Estate pursuant to a Sub-Advisory Agreement between the Investment Manager and ING Clarion.
NWQ Investment Management Company (“NWQ”), a registered investment adviser, serves as a Sub-Adviser to Global Value Choice pursuant to a Sub-Advisory Agreement between the Investment Manager and NWQ.
Brandes Investment Partners, L.P. (“Brandes”), a registered investment adviser, serves as a Sub-Adviser to Emerging Countries and International Value pursuant to a Sub-Advisory Agreement between the Investment Manager and Brandes.
Julius Baer Investment Management, LLC (“JBIM”), a registered investment adviser wholly-owned by the Julius Baer Group, serves as Sub-Adviser to Foreign pursuant to a Sub-Advisory Agreement between the Investment Manager and JBIM.
ING Investment Management Co. (“ING IM”), a registered investment adviser serves as Sub-Adviser to International pursuant to a Sub-Advisory Agreement between the Investment Manager and ING IM.
Acadian Asset Management (“Acadian”), a registered investment adviser, serves as a Sub-Adviser to International SmallCap pursuant to a Sub-Advisory Agreement between the Investment Manager and Acadian.
ING Funds Services, LLC (the “Administrator”), serves as administrator to each Fund. The Funds pay the Administrator a fee calculated at an annual rate of 0.10% of each Fund’s average daily net assets.
International Value Fund also pays the Administrator an annual shareholder account-servicing fee of $5.00 for each account of beneficial owners of shares.
The Investment Manager, ING IM, ING Clarion and the Administrator are indirect, wholly-owned subsidiaries of ING Groep N.V. (“ING Groep”). ING Groep is one of the largest financial services organizations in the world, and offers an array of banking, insurance and asset management services to both individual and institutional investors.
NOTE 6 — DISTRIBUTION AND SERVICE FEES
Each share class of the Funds, except Class I, has adopted a Plan pursuant to Rule 12b-1 under the 1940 Act (the “12b-1 Plans”), whereby ING Funds Distributor, LLC (the “Distributor”), an indirect, wholly-owned subsidiary of ING Groep, is reimbursed or compensated (depending on the class of shares) by the Funds for expenses incurred in the distribution of each Funds’ shares (“Distribution Fees”). Pursuant to the 12b-1 Plans, the Distributor is entitled to a payment each month for expenses incurred in the distribution and promotion of each Fund’s shares, including expenses incurred in printing prospectuses and reports used for sales purposes, expenses incurred
42
NOTES TO FINANCIAL STATEMENTS AS OF OCTOBER 31, 2005 (CONTINUED)
NOTE 6 — DISTRIBUTION AND SERVICE FEES (continued)
in preparing and printing sales literature and other such distribution related expenses, including any distribution or shareholder servicing fees (“Service Fees”) paid to securities dealers who have executed a distribution agreement with the Distributor. Under the 12b-1 Plans, each class of shares of the Fund pays the Distributor a Distribution and/or Service Fee based on average daily net assets at the following annual rates:
| | Class A | | Class B | | Class C | | Class M | | Class Q | |
Global Real Estate | | 0.25 | % | | 1.00 | % | | 1.00 | % | | N/A | | | N/A | | |
Global Value Choice | | 0.35 | % | | 1.00 | % | | 1.00 | % | | N/A | | | 0.25 | % | |
Emerging Countries | | 0.35 | %(1) | | 1.00 | % | | 1.00 | % | | 1.00 | %(2) | | 0.25 | % | |
Foreign | | 0.25 | % | | 1.00 | % | | 1.00 | % | | N/A | | | 0.25 | % | |
International | | 0.25 | % | | 1.00 | % | | 1.00 | % | | N/A | | | 0.25 | % | |
International SmallCap | | 0.35 | % | | 1.00 | % | | 1.00 | % | | N/A | | | 0.25 | % | |
International Value | | 0.30 | % | | 1.00 | % | | 1.00 | % | | N/A | | | 0.25 | % | |
(1) ING Funds Distributor, LLC has agreed to waive 0.10% of the Distribution Fee for Class A shares of Emerging Countries for the period from January 1, 2005 through December 31, 2005.
(2) ING Funds Distributor, LLC has agreed to waive 0.25% of the Distribution Fee for Class M shares of Emerging Countries.
Fees paid to the Distributor by class during the year ended October 31, 2005 are shown in the accompanying Statements of Operations.
The Distributor also receives the proceeds of the initial sales charge paid by shareholders upon the purchase of Class A shares, and the contingent deferred sales charge paid by shareholders upon certain redemptions for Class A, Class B, Class C and Class M shares. For the year ended October 31, 2005, the Distributor retained the following amounts in sales charges for the Funds:
| | Class A | | Class B | | Class C | | Class M | |
Initial Sales Charges | | | | | | | | | |
Global Real Estate | | $ | 76,837 | | N/A | | | N/A | | | N/A | | |
Global Value Choice | | | 6,567 | | N/A | | | N/A | | | N/A | | |
Emerging Countries | | | 30,457 | | N/A | | | N/A | | | $146 | | |
Foreign | | | 76,564 | | N/A | | | N/A | | | N/A | | |
International | | | 11,394 | | N/A | | | N/A | | | N/A | | |
International SmallCap | | | 20,479 | | N/A | | | N/A | | | N/A | | |
International Value | | | 2,469 | | N/A | | | N/A | | | N/A | | |
International | | | | | | | | | | | | | |
Value Choice | | | 7,489 | | N/A | | | N/A | | | N/A | | |
Precious Metals | | | 13,434 | | N/A | | | N/A | | | N/A | | |
Russia | | | 248,873 | | N/A | | | N/A | | | N/A | | |
Contingent Deferred | | | | | | | | | | | |
Sales Charges | | | | | | | | | | | |
Global Real Estate | | $ | 29 | | $ 32,065 | | | $5,284 | | | N/A | | |
Global Value Choice | | | 365 | | 89,918 | | | 415 | | | N/A | | |
Emerging Countries | | | 18,250 | | 29,798 | | | 16 | | | N/A | | |
Foreign | | | 21 | | 56,426 | | | 2,704 | | | N/A | | |
International | | | 49 | | 40,192 | | | 1,316 | | | N/A | | |
International SmallCap | | | 78,165 | | 153,738 | | | 2,317 | | | N/A | | |
International Value | | | 7,534 | | 593,800 | | | 7,385 | | | N/A | | |
| | | | | | | | | | | | | | | |
NOTE 7 — OTHER TRANSACTIONS WITH AFFILIATES AND RELATED PARTIES
At October 31, 2005, the Funds had the following amounts recorded in payable to affiliates on the accompanying Statements of Assets and Liabilities (See Notes 5 and 6):
| | | | | | Accrued | | | | | |
| | Accrued | | | | Shareholder | | | | | |
| | Investment | | Accrued | | Services and | | | | | |
| | Management | | Administrative | | Distribution | | | | | |
| | Fees | | Fees | | Fees | | Recoupment | | Total | |
Global Real Estate | | $ | 149,876 | | $ | 14,987 | | $ | 62,214 | | $ | — | | $ | 227,077 | |
Global Value Choice | | 86,204 | | 8,620 | | 60,210 | | 6,093 | | 161,127 | |
Emerging Countries | | 140,723 | | 11,258 | | 57,150 | | (7,425 | ) | 201,706 | |
Foreign Fund | | 196,652 | | 19,665 | | 118,439 | | 6,075 | | 340,831 | |
International | | 102,024 | | 10,202 | | 40,692 | | — | | 152,918 | |
International SmallCap | | 290,128 | | 29,012 | | 156,988 | | — | | 476,128 | |
International Value | | 3,477,242 | | 347,720 | | 1,377,732 | | — | | 5,202,694 | |
| | | | | | | | | | | | | | | | |
ING Funds Distributor, LLCmade the following payments in settlement of an administrative proceeding as described in Note16 and as reflected in the accompanying Statement of Operations for each Fund.
Emerging Countries | | $266,176 | |
International | | 127,510 | |
International SmallCap | | 914,722 | |
International Value | | 79,655 | |
At October 31, 2005, the following indirect wholly-owned subsidiaries of ING Groep owned shares of the following Funds:
ING National Nederlanden Intervest — Global Real Estate (27.97%).
ING National Trust — International (24.94%).
Control is defined by the Investment Company Act of 1940 (“1940 Act”) as the beneficial ownership, either directly or through one or more controlled companies, of more than 25% of the voting securities of a company. Investment activities of these shareholders could have a material impact on the Funds.
The Investment Manager may direct the Fund’s portfolio managers to use their best efforts (subject to obtaining best execution of each transaction) to allocate a Portfolio’s equity security transactions through certain designated broker-dealers. The designated broker-dealer, in turn, will reimburse a portion of the brokerage commissions to pay certain expenses of that Fund. Any amounts credited to a Fund are reflected as a reimbursement of expenses in the Statements of Operations.
Each Fund has adopted a Retirement Policy covering all independent trustees of the Fund who will have served as an independent trustee for at least five years at the time of retirement. Benefits under this plan are
43
NOTES TO FINANCIAL STATEMENTS AS OF OCTOBER 31, 2005 (CONTINUED)
NOTE 7 — OTHER TRANSACTIONS WITH AFFILIATES AND RELATED PARTIES (continued)
based on an annual rate as defined in the plan agreement.
The following is a summary of the transaction during the year ended October 31, 2005 in which the issuer was an affiliate of the ING Family of Funds.
| | | | | | Realized | | | |
ING Global Real | | | | | | gain on | | Value | |
Estate Fund | | | Purchases | | investment | | at | |
| | Shares | | Cost | | securities | | 10/31/2005 | |
ING UK Real Estate Income Trust Ltd. | | 1,475,000 | | $2,611,784 | | $51,557 | | $2,663,341 | |
| | | | | | | | | | |
NOTE 8 — OTHER ACCRUED EXPENSES AND LIABILITIES
At October 31, 2005, the funds had the following payables included in Other Accrued Expenses and Liabilities on the Statement of Assets and Liabilities that exceeded 5% of total liabilities:
| | Transfer Agent Fees | |
International Value | | $1,008,825 | |
NOTE 9 — EXPENSE LIMITATIONS
The Investment Manager has agreed to limit expenses, excluding interest, taxes, brokerage and extraordinary expenses to the levels listed below:
Maximum Operating Expense Limit (as a percentage of average net assets)
| | Class A | | Class B | | Class C | | Class I | | Class M | | Class Q | |
Global Real Estate | | 1.75 | % | | 2.50 | % | | 2.50 | % | | 1.50 | % | | N/A | | | N/A | | |
Global Value Choice | | 1.85 | % | | 2.50 | % | | 2.50 | % | | N/A | | | N/A | | | 1.75 | % | |
Emerging Countries(1) | | 2.25 | % | | 2.90 | % | | 2.90 | % | | N/A | | | 2.65 | % | | 2.15 | % | |
Foreign(2) | | 1.95 | % | | 2.70 | % | | 2.70 | % | | 1.60 | % | | N/A | | | 1.85 | % | |
International(3) | | 2.75 | % | | 3.50 | % | | 3.50 | % | | 2.50 | % | | N/A | | | 2.75 | % | |
International SmallCap | | 1.95 | % | | 2.60 | % | | 2.60 | % | | N/A | | | N/A | | | 1.85 | % | |
International Value | | N/A | | | N/A | | | N/A | | | N/A | | | N/A | | | N/A | | |
(1) Effective January 1, 2005, pursuant to a side agreement, ING Investments has lowered the expense limits for Emerging Countries through at least December 31, 2005. The expense limits for Emerging Countries are 2.10%, 2.85%, 2.85%, 2.60% and 2.10% for Class A, B, C, M and Q shares, respectively. If, after December 31, 2005, ING Investments elects not to renew the side agreement, the expense limits will revert to the limits listed in the table above. There is no guarantee that this side agreement will continue after that date. The side agreement will only renew if ING Investments elects to renew it. Any fees waived pursuant to the side agreement shall not be eligible for recoupment.
(2) Pursuant to a side agreement dated February 1, 2005, ING Investments has lowered the expense limits for Foreign through at least March 1, 2006. The expense limits for the Foreign are 1.70%, 2.45%, 2.45%, 1.35% and 1.60% for Class A, B, C, I and Q, respectively. If, after March 1, 2006, ING Investments elects not to renew the side agreement, the expense limits will revert to the limits listed in the table above. There is no guarantee that this side agreement will continue after that date. The side agreement will only renew if ING Investments, LLC elects to renew it.
(3) Pursuant to a side agreement dated February 1, 2005, ING Investments has lowered the expense limits for International through at least March 1, 2006. The expense limits for the International are 1.95%, 2.70%, 2.70%, 1.60% and 1.85% for Class A, B, C, I and Q, respectively. If, after March 1, 2006, ING Investments elects not to renew the side agreement, the expense limits will revert to the limits listed in the table above. There is no guarantee that this side agreement will continue after that date. The side agreement will only renew if ING Investments, LLC elects to renew it.
The Investment Manager may at a later date recoup from a fund management fees waived and other expenses assumed by the Investment Manager during the previous 36 months, but only if, after such recoupment, a fund’s expense ratio does not exceed the percentage described above. Waived and reimbursed fees net of any recoupment by the Investment Manager of such waived and reimbursed fees are reflected on the accompanying Statements of Operations for each fund. Amounts payable by the Investment Manager are reflected on the accompanying Statements of Assets and Liabilities for each fund.
As of October 31, 2005, the amounts of waived or reimbursed fees that are subject to possible recoupment by the Investment Manager, and the related expiration dates are as follows:
| | October 31, | | | |
| | 2006 | | 2007 | | 2008 | | Total | |
Global Value Choice | | $122,064 | | $ — | | $62,559 | | $184,623 | |
Foreign | | 36,612 | | 193,424 | | 8,141 | | 238,177 | |
The Expense Limitation Agreements are contractual and shall renew automatically for one-year terms unless ING Investments provides written notice of the termination of the Expense Limitation Agreement within 90 days of the end of the then current term.
NOTE 10 — LINE OF CREDIT
All of the Funds included in this report, in addition to certain other funds managed by the Investment Manager, have entered into an unsecured committed revolving line of credit agreement (the “Credit Agreement”) with The Bank of New York for an aggregate amount of $125,000,000. The proceeds may be used only to: (1) temporarily finance the purchase
44
NOTES TO FINANCIAL STATEMENTS AS OF OCTOBER 31, 2005 (CONTINUED)
NOTE 10 — LINE OF CREDIT (continued)
and sale of securities; (2) finance the redemption of shares of an investor in the Funds; and (3) enable the Funds to meet other emergency expenses as defined in the Credit Agreement. The Funds to which the line of credit is available pay a commitment fee equal to 0.09% per annum on the daily unused portion of the committed line amount payable quarterly in arrears. The following Funds utilized the line of credit during the year ended October 31, 2005:
| | | | | | Approximate | |
| | | | Approximate | | Weighted | |
| | Days | | Average Daily | | Average | |
| | Utilized | | Balance | | Interest Rate | |
Global Value Choice | | 1 | | | $ 610,000 | | 2.74 | % | |
Emerging Countries | | 42 | | | 1,188,690 | | 2.65 | % | |
International | | 3 | | | 1,453,333 | | 3.91 | % | |
International SmallCap | | 26 | | | 3,137,692 | | 3.46 | % | |
International Value | | 2 | | | 1,945,000 | | 3.98 | % | |
NOTE 11 — CAPITAL SHARES
Transactions in capital shares and dollars were as follows:
| | Class A Shares | | Class B Shares | | Class C Shares | |
| | Year | | Year | | Year | | Year | | Year | | Year | |
| | Ended | | Ended | | Ended | | Ended | | Ended | | Ended | |
| | October 31, | | October 31, | | October 31, | | October 31, | | October 31, | | October 31, | |
| | 2005 | | 2004 | | 2005 | | 2004 | | 2005 | | 2004 | |
Global Real Estate (Number of Shares) | | | | | | | | | | | | | |
Shares sold | | 3,934,092 | | 3,404,489 | | 555,131 | | 270,873 | | 1,428,969 | | 455,181 | |
Dividends reinvested | | 464,771 | | 264,415 | | 31,215 | | 12,799 | | 41,618 | | 15,520 | |
Shares redeemed | | (2,535,905 | ) | (643,917 | ) | (113,195 | ) | (65,421 | ) | (232,975 | ) | (62,590 | ) |
Net increase in shares outstanding | | 1,862,958 | | 3,024,987 | | 473,151 | | 218,251 | | 1,237,612 | | 408,111 | |
| | | | | | | | | | | | | |
Global Real Estate ($) | | | | | | | | | | | | | |
Shares sold | | $ | 64,903,422 | | $ | 47,609,673 | | $ | 7,963,178 | | $ | 3,405,207 | | $ | 21,436,748 | | $ | 5,977,782 | |
Dividends reinvested | | 7,259,137 | | 3,502,989 | | 429,581 | | 151,651 | | 597,354 | | 190,839 | |
Shares redeemed | | (40,814,853 | ) | (8,952,960 | ) | (1,640,044 | ) | (814,481 | ) | (3,564,647 | ) | (817,661 | ) |
Net increase | | $ | 31,347,706 | | $ | 42,159,702 | | $ | 6,752,715 | | $ | 2,742,377 | | $ | 18,469,455 | | $ | 5,350,960 | |
| | | | | | | | | | | | | |
| | Class I Shares | | | | | | | | | |
| | Year | | Year | | | | | | | | | |
| | Ended | | Ended | | | | | | | | | |
| | October 31, | | October 31, | | | | | | | | | |
| | 2005 | | 2004 | | | | | | | | | |
Global Real Estate (Number of Shares) | | | | | | | | | | | | | |
Shares sold | | 98,101 | | — | | | | | | | | | |
Net increase in shares outstanding | | 98,101 | | — | | | | | | | | | |
| | | | | | | | | | | | | |
Global Real Estate ($) | | | | | | | | | | | | | |
Shares sold | | $ | 1,600,930 | | $ | — | | | | | | | | | |
Net increase | | $ | 1,600,930 | | $ | — | | | | | | | | | |
| | | | | | | | | | | | | |
| | Class A Shares | | Class B Shares | | Class C Shares | |
| | Year | | Year | | Year | | Year | | Year | | Year | |
| | Ended | | Ended | | Ended | | Ended | | Ended | | Ended | |
| | October 31, | | October 31, | | October 31, | | October 31, | | October 31, | | October 31, | |
| | 2005 | | 2004 | | 2005 | | 2004 | | 2005 | | 2004 | |
Global Value Choice (Number of Shares) | | | | | | | | | | | | | |
Shares sold | | 516,545 | | 389,201 | | 101,943 | | 73,694 | | 150,930 | | 36,931 | |
Shares redeemed | | (1,098,757 | ) | (1,352,279 | ) | (550,241 | ) | (621,523 | ) | (696,774 | ) | (881,072 | ) |
Net decrease in shares outstanding | | (582,212 | ) | (963,078 | ) | (448,298 | ) | (547,829 | ) | (545,844 | ) | (844,141 | ) |
| | | | | | | | | | | | | |
Global Value Choice ($) | | | | | | | | | | | | | |
Shares sold | | $ | 8,997,761 | | $ | 6,113,303 | | $ | 1,939,488 | | $ | 1,315,415 | | $ | 2,547,625 | | $ | 593,544 | |
Shares redeemed | | (19,124,741 | ) | (21,218,533 | ) | (10,345,519 | ) | (10,710,909 | ) | (11,682,829 | ) | (13,463,169 | ) |
Net decrease | | $ | (10,126,980 | ) | $ | (15,105,230 | ) | $ | (8,406,031 | ) | $ | (9,395,494 | ) | $ | (9,135,204 | ) | $ | (12,869,625 | ) |
45
NOTES TO FINANCIAL STATEMENTS AS OF OCTOBER 31, 2005 (CONTINUED)
NOTE 11 — CAPITAL SHARES (continued)
| | Class Q Shares | | | | | | | | | |
| | Year | | Year | | | | | | | | | |
| | Ended | | Ended | | | | | | | | | |
| | October 31, | | October 31, | | | | | | | | | |
| | 2005 | | 2004 | | | | | | | | | |
| | | | | | | | | | | | | |
Global Value Choice (Number of Shares) | | | | | | | | | | | | | |
Shares sold | | 78,062 | | 322,006 | | | | | | | | | |
Shares redeemed | | (98,578 | ) | (471,023 | ) | | | | | | | | |
Net decrease in shares outstanding | | (20,516 | ) | (149,017 | ) | | | | | | | | |
| | | | | | | | | | | | | |
Global Value Choice ($) | | | | | | | | | | | | | |
Shares sold | | $ | 1,573,859 | | $ | 5,898,513 | | | | | | | | | |
Shares redeemed | | (1,971,194 | ) | (8,647,666 | ) | | | | | | | | |
Net decrease | | $ | (397,335 | ) | $ | (2,749,153 | ) | | | | | | | | |
| | | | | | | | | | | | | |
| | Class A Shares | | Class B Shares | | Class C Shares | |
| | Year | | Year | | Year | | Year | | Year | | Year | |
| | Ended | | Ended | | Ended | | Ended | | Ended | | Ended | |
| | October 31, | | October 31, | | October 31, | | October 31, | | October 31, | | October 31, | |
| | 2005 | | 2004 | | 2005 | | 2004 | | 2005 | | 2004 | |
| | | | | | | | | | | | | |
Emerging Countries (Number of Shares) | | | | | | | | | | | | | |
Shares sold | | 1,264,116 | | 2,481,332 | | 171,033 | | 170,377 | | 575,933 | | 110,041 | |
Dividends reinvested | | 2,583 | | 17,566 | | — | | — | | — | | — | |
Shares redeemed | | (1,042,704 | ) | (3,183,675 | ) | (285,210 | ) | (471,944 | ) | (154,421 | ) | (194,329 | ) |
Net increase (decrease) in shares outstanding | | 223,995 | | (684,777 | ) | (114,177 | ) | (301,567 | ) | 421,512 | | (84,288 | ) |
| | | | | | | | | | | | | |
Emerging Countries ($) | | | | | | | | | | | | | |
Shares sold | | $ | 28,706,819 | | $ | 44,674,187 | | $ | 3,787,933 | | $ | 3,235,271 | | $ | 12,439,033 | | $ | 2,025,487 | |
Dividends reinvested | | 53,415 | | 299,006 | | — | | — | | — | | — | |
Shares redeemed | | (22,759,798 | ) | (57,391,860 | ) | (6,281,049 | ) | (8,665,978 | ) | (3,238,715 | ) | (3,381,445 | ) |
Net increase (decrease) | | $ | 6,000,436 | | $ | (12,418,667 | ) | $ | (2,493,116 | ) | $ | (5,430,707 | ) | $ | 9,200,318 | | $ | (1,355,958 | ) |
| | | | | | | | | | | | | |
| | Class M Shares | | Class Q Shares | | | | | |
| | Year | | Year | | Year | | Year | | | | | |
| | Ended | | Ended | | Ended | | Ended | | | | | |
| | October 31, | | October 31, | | October 31, | | October 31, | | | | | |
| | 2005 | | 2004 | | 2005 | | 2004 | | | | | |
| | | | | | | | | | | | | |
Emerging Countries (Number of Shares) | | | | | | | | | | | | | |
Shares sold | | 3,080 | | 8,597 | | 197,600 | | 725,259 | | | | | |
Dividends reinvested | | — | | 136 | | 579 | | 4,931 | | | | | |
Shares redeemed | | (9,604 | ) | (22,317 | ) | (202,059 | ) | (1,300,028 | ) | | | | |
Net increase (decrease) in shares outstanding | | (6,524 | ) | (13,584 | ) | (3,880 | ) | (569,838 | ) | | | | |
| | | | | | | | | | | | | |
Emerging Countries ($) | | | | | | | | | | | | | |
Shares sold | | $ | 67,841 | | $ | 165,338 | | $ | 4,569,365 | | $ | 13,642,377 | | | | | |
Dividends reinvested | | — | | 2,297 | | 12,349 | | 86,541 | | | | | |
Shares redeemed | | (209,918 | ) | (415,172 | ) | (4,620,780 | ) | (24,434,280 | ) | | | | |
Net increase (decrease) | | $ | (142,077 | ) | $ | (247,537 | ) | $ | (39,066 | ) | $ | (10,705,362 | ) | | | | |
| | | | | | | | | | | | | |
| | Class A Shares | | Class B Shares | | Class C Shares | |
| | Year | | Year | | Year | | Year | | Year | | Year | |
| | Ended | | Ended | | Ended | | Ended | | Ended | | Ended | |
| | October 31, | | October 31, | | October 31, | | October 31, | | October 31, | | October 31, | |
| | 2005 | | 2004 | | 2005 | | 2004 | | 2005 | | 2004 | |
| | | | | | | | | | | | | |
Foreign (Number of Shares) | | | | | | | | | | | | | |
Shares sold | | 5,350,389 | | 5,895,029 | | 864,486 | | 895,922 | | 3,258,501 | | 3,047,613 | |
Dividends reinvested | | — | | 8,613 | | — | | 2,178 | | — | | 6,274 | |
Shares redeemed | | (2,127,775 | ) | (1,416,210 | ) | (205,551 | ) | (101,946 | ) | (598,703 | ) | (190,098 | ) |
Net increase in shares outstanding | | 3,222,614 | | 4,487,432 | | 658,935 | | 796,154 | | 2,659,798 | | 2,863,789 | |
| | | | | | | | | | | | | |
Foreign ($) | | | | | | | | | | | | | |
Shares sold | | $ | 74,069,872 | | $ | 68,898,162 | | $ | 11,879,135 | | $ | 10,448,476 | | $ | 44,999,926 | | $ | 35,702,440 | |
Dividends reinvested | | — | | 93,658 | | — | | 23,547 | | — | | 67,948 | |
Shares redeemed | | (29,478,835 | ) | (16,353,436 | ) | (2,815,133 | ) | (1,180,328 | ) | (8,239,806 | ) | (2,198,012 | ) |
Net increase | | $ | 44,591,037 | | $ | (52,638,384 | ) | $ | 9,064,002 | | $ | 9,291,695 | | $ | 36,760,120 | | $ | 33,572,376 | |
46
NOTES TO FINANCIAL STATEMENTS AS OF OCTOBER 31, 2005 (CONTINUED)
NOTE 11 — CAPITAL SHARES (continued)
| | Class I Shares | | Class Q Shares | | | | | |
| | Year | | Year | | Year | | Year | | | | | |
| | Ended | | Ended | | Ended | | Ended | | | | | |
| | October 31, | | October 31, | | October 31, | | October 31, | | | | | |
| | 2005 | | 2004 | | 2005 | | 2004 | | | | | |
| | | | | | | | | | | | | |
Foreign (Number of Shares) | | | | | | | | | | | | | |
Shares sold | | 1,482 | | 187,096 | | 1,009 | | 51,642 | | | | | |
Dividends reinvested | | — | | 387 | | — | | 597 | | | | | |
Shares redeemed | | (135,704 | ) | (1 | ) | (13,187 | ) | (5,471 | ) | | | | |
Net increase (decrease) in shares outstanding | | (134,222 | ) | 187,482 | | (12,178 | ) | 46,768 | | | | | |
| | | | | | | | | | | | | |
Foreign ($) | | | | | | | | | | | | | |
Shares sold | | $ | 20,576 | | $ | 2,149,750 | | $ | 13,738 | | $ | 608,900 | | | | | |
Dividends reinvested | | — | | 4,209 | | — | | 6,472 | | | | | |
Shares redeemed | | (1,983,638 | ) | (12 | ) | (194,215 | ) | (62,750 | ) | | | | |
Net increase (decrease) | | $ | (1,963,062 | ) | $ | 2,153,947 | | $ | (180,477 | ) | $ | 552,622 | | | | | |
| | | | | | | | | | | | | |
| | Class A Shares | | Class B Shares | | Class C Shares | |
| | Year | | Year | | Year | | Year | | Year | | Year | |
| | Ended | | Ended | | Ended | | Ended | | Ended | | Ended | |
| | October 31, | | October 31, | | October 31, | | October 31, | | October 31, | | October 31, | |
| | 2005 | | 2004 | | 2005 | | 2004 | | 2005 | | 2004 | |
| | | | | | | | | | | | | |
International (Number of Shares) | | | | | | | | | | | | | |
Shares sold | | 1,286,982 | | 3,451,836 | | 398,615 | | 505,076 | | 158,046 | | 393,597 | |
Dividends reinvested | | 45,507 | | 4,890 | | 6,257 | | — | | 3,911 | | — | |
Shares redeemed | | (1,528,096 | ) | (3,759,822 | ) | (454,549 | ) | (422,474 | ) | (461,767 | ) | (437,630 | ) |
Net increase (decrease) in shares outstanding | | (195,607 | ) | (303,096 | ) | (49,677 | ) | 82,602 | | (299,810 | ) | (44,033 | ) |
| | | | | | | | | | | | | |
International ($) | | | | | | | | | | | | | |
Shares sold | | $ | 13,471,465 | | $ | 31,757,670 | | $ | 4,018,737 | | $ | 4,510,934 | | $ | 1,592,528 | | $ | 3,490,125 | |
Dividends reinvested | | 464,320 | | 41,300 | | 61,882 | | — | | 38,715 | | — | |
Redemption fee proceeds | | 12,635 | | 9,571 | | — | | — | | — | | — | |
Shares redeemed | | (15,999,726 | ) | (35,163,553 | ) | (4,604,837 | ) | (3,794,744 | ) | (4,666,612 | ) | (3,937,183 | ) |
Net increase (decrease) | | $ | (2,051,306 | ) | $ | (3,355,012 | ) | $ | (524,218 | ) | $ | 716,190 | | $ | (3,035,369 | ) | $ | (447,058 | ) |
| | | | | | | | | | | | | |
| | Class I Shares | | Class Q Shares | | | | | |
| | Year | | Year | | Year | | Year | | | | | |
| | Ended | | Ended | | Ended | | Ended | | | | | |
| | October 31, | | October 31, | | October 31, | | October 31, | | | | | |
| | 2005 | | 2004 | | 2005 | | 2004 | | | | | |
| | | | | | | | | | | | | |
International (Number of Shares) | | | | | | | | | | | | | |
Shares sold | | 618,736 | | 1,345,222 | | 832,726 | | 818,308 | | | | | |
Dividends reinvested | | 26,513 | | 5,236 | | 9,243 | | 4,519 | | | | | |
Shares redeemed | | (264,569 | ) | (957,334 | ) | (255,015 | ) | (1,824,099 | ) | | | | |
Net increase (decrease) in shares outstanding | | 380,680 | | 393,124 | | 586,954 | | (1,001,272 | ) | | | | |
| | | | | | | | | | | | | |
International ($) | | | | | | | | | | | | | |
Shares sold | | $ | 6,503,305 | | $ | 12,342,742 | | $ | 8,731,410 | | $ | 7,234,622 | | | | | |
Dividends reinvested | | 268,842 | | 43,979 | | 93,629 | | 37,916 | | | | | |
Shares redeemed | | (2,749,364 | ) | (8,621,051 | ) | (2,652,163 | ) | (15,730,891 | ) | | | | |
Net increase (decrease) | | $ | 4,022,783 | | $ | 3,765,670 | | $ | 6,172,876 | | $ | (8,458,353 | ) | | | | |
47
NOTES TO FINANCIAL STATEMENTS AS OF OCTOBER 31, 2005 (CONTINUED)
NOTE 11 — CAPITAL SHARES (continued)
| | Class A Shares | | Class B Shares | | Class C Shares | |
| | Year | | Year | | Year | | Year | | Year | | Year | |
| | Ended | | Ended | | Ended | | Ended | | Ended | | Ended | |
| | October 31, | | October 31, | | October 31, | | October 31, | | October 31, | | October 31, | |
| | 2005 | | 2004 | | 2005 | | 2004 | | 2005 | | 2004 | |
| | | | | | | | | | | | | |
International SmallCap (Number of Shares) | | | | | | | | | | | | | |
Shares sold | | 2,004,704 | | 2,416,993 | | 224,730 | | 215,764 | | 190,803 | | 139,627 | |
Dividends reinvested | | — | | 864 | | — | | — | | — | | — | |
Shares redeemed | | (2,690,302 | ) | (3,047,832 | ) | (678,220 | ) | (640,673 | ) | (438,858 | ) | (491,748 | ) |
Net decrease in shares outstanding | | (685,598 | ) | (629,975 | ) | (453,490 | ) | (424,909 | ) | (248,055 | ) | (352,121 | ) |
| | | | | | | | | | | | | |
International SmallCap ($) | | | | | | | | | | | | | |
Shares sold | | $ | 69,514,851 | | $ | 67,323,822 | | $ | 7,909,327 | | $ | 6,380,056 | | $ | 6,229,347 | | $ | 3,856,477 | |
Dividends reinvested | | — | | 21,615 | | — | | — | | — | | — | |
Shares redeemed | | (92,289,760 | ) | (84,650,202 | ) | (23,667,520 | ) | (18,689,602 | ) | (14,015,886 | ) | (13,154,747 | ) |
| | | | | | | | | | | | | |
Net decrease | | $ | (22,774,909 | ) | $ | (17,304,765 | ) | $ | (15,758,193 | ) | $ | (12,309,546 | ) | $ | (7,786,539 | ) | $ | (9,298,270 | ) |
| | | | | | | | | | | | | |
| | Class Q Shares | | | | | | | | | |
| | Year | | Year | | | | | | | | | |
| | Ended | | Ended | | | | | | | | | |
| | October 31, | | October 31, | | | | | | | | | |
| | 2005 | | 2004 | | | | | | | | | |
| | | | | | | | | | | | | |
International SmallCap (Number of Shares) | | | | | | | | | | | | | |
Shares sold | | 268,648 | | 882,652 | | | | | | | | | |
Dividends reinvested | | — | | 1,207 | | | | | | | | | |
Shares redeemed | | (793,003 | ) | (1,851,928 | ) | | | | | | | | |
Net decrease in shares outstanding | | (524,355 | ) | (968,069 | ) | | | | | | | | |
| | | | | | | | | | | | | |
International SmallCap ($) | | | | | | | | | | | | | |
Shares sold | | $ | 9,711,770 | | $ | 25,088,370 | | | | | | | | | |
Dividends reinvested | | — | | 32,268 | | | | | | | | | |
Shares redeemed | | (28,611,080 | ) | (53,724,869 | ) | | | | | | | | |
Net decrease | | $ | (18,899,310 | ) | $ | (28,604,231 | ) | | | | | | | | |
| | | | | | | | | | | | | |
| | Class A Shares | | Class B Shares | | Class C Shares | |
| | Year | | Year | | Year | | Year | | Year | | Year | |
| | Ended | | Ended | | Ended | | Ended | | Ended | | Ended | |
| | October 31, | | October 31, | | October 31, | | October 31, | | October 31, | | October 31, | |
| | 2005 | | 2004 | | 2005 | | 2004 | | 2005 | | 2004 | |
| | | | | | | | | | | | | |
International Value (Number of Shares) | | | | | | | | | | | | | |
Shares sold | | 22,440,717 | | 27,310,058 | | 733,853 | | 679,383 | | 579,699 | | 167,511 | |
Dividends reinvested | | 4,658,879 | | 521,473 | | 1,078,233 | | — | | 1,619,582 | | — | |
Shares redeemed | | (43,203,094 | ) | (37,013,357 | ) | (6,355,256 | ) | (4,509,591 | ) | (5,949,587 | ) | (6,201,914 | ) |
Net decrease in shares outstanding | | (16,103,498 | ) | (9,181,826 | ) | (4,543,170 | ) | (3,830,208 | ) | (3,750,306 | ) | (6,034,403 | ) |
| | | | | | | | | | | | | |
International Value ($) | | | | | | | | | | | | | |
Shares sold | | $ | 389,616,539 | | $ | 426,282,785 | | $ | 12,423,736 | | $ | 10,492,016 | | $ | 9,661,315 | | $ | 2,545,765 | |
Dividends reinvested | | 78,640,245 | | 7,159,457 | | 17,941,796 | | — | | 26,885,154 | | — | |
Shares redeemed | | (748,947,369 | ) | (582,960,037 | ) | (109,082,787 | ) | (69,353,813 | ) | (101,804,139 | ) | (95,278,538 | ) |
Net decrease | | $ | (280,690,585 | ) | $ | (149,517,795 | ) | $ | (78,717,255 | ) | $ | (58,861,797 | ) | $ | (65,257,670 | ) | $ | (92,732,773 | ) |
48
NOTES TO FINANCIAL STATEMENTS AS OF OCTOBER 31, 2005 (CONTINUED)
NOTE 11 — CAPITAL SHARES (continued)
| | Class I Shares | | Class Q Shares | | | | | |
| | Year | | Year | | Year | | Year | | | | | |
| | Ended | | Ended | | Ended | | Ended | | | | | |
| | October 31, | | October 31, | | October 31, | | October 31, | | | | | |
| | 2005 | | 2004 | | 2005 | | 2004 | | | | | |
| | | | | | | | | | | | | |
International Value (Number of Shares) | | | | | | | | | | | | | |
Shares sold | | 27,489,973 | | 20,029,766 | | 27,155 | | 44,672 | | | | | |
Dividends reinvested | | 2,611,199 | | 334,126 | | 69,842 | | 6,447 | | | | | |
Shares redeemed | | (12,662,805 | ) | (6,425,560 | ) | (276,510 | ) | (482,259 | ) | | | | |
Net increase (decrease) in shares outstanding | | 17,438,367 | | 13,938,332 | | (179,513 | ) | (431,140 | ) | | | | |
| | | | | | | | | | | | | |
International Value ($) | | | | | | | | | | | | | |
Shares sold | | $ | 476,140,222 | | $ | 320,534,434 | | $ | 474,053 | | $ | 684,725 | | | | | |
Dividends reinvested | | 44,050,433 | | 4,584,206 | | 1,179,631 | | 88,586 | | | | | |
Shares redeemed | | (220,723,705 | ) | (100,439,982 | ) | (4,799,264 | ) | (7,574,954 | ) | | | | |
Net increase (decrease) | | $ | 299,466,950 | | $ | 224,678,658 | | $ | (3,145,580 | ) | $ | (6,801,643 | ) | | | | |
NOTE 12 — ILLIQUID SECURITIES
Pursuant to guidelines adopted by the Fund’s Board, the following securities have been deemed to be illiquid. The Funds currently limit investments in illiquid securities to 15% of the Fund’s net assets, at market value, at time of purchase.
Fund | | Security | | Shares | | Initial
Acquisition
Date | | Cost | | Value | | Percent
of Net
Assets | |
Emerging
Countries | | Siam Makro PCL | | 1,506,200 | | 03/29/05 | | $ | 2,231,811 | | $ | 2,030,666 | | 1.5 | % | |
Foreign | | Centrenergo ADR | | 1,530 | | 12/17/03 | | $ | 3,623 | | $ | 9,104 | | — | | |
NOTE 13 — CONCENTRATION OF RISKS
Foreign Securities (All Funds). Investments in foreign securities may entail risks not present in domestic investments. Since investments of securities are denominated in foreign currencies, changes in the relationship of these foreign currencies to the U.S. dollar can significantly affect the value of the investments and earnings of the Funds. Foreign investments may also subject the Funds to foreign government exchange restrictions, expropriation, taxation or other political, social or economic developments, as well as from movements in currency, security value and interest rate, all of which could affect the market and/or credit risk of the investments.
Emerging Markets Investments (All Funds). Because of less developed markets and economies and, in some countries, less mature governments and governmental institutions, the risks of investing in foreign securities can be intensified in the case of investments in issuers domiciled or doing substantial business in emerging market countries.
Industry Concentration (Global Real Estate). As a result of the Fund concentrating its assets in securities related to a particular industry, the Fund may be subject to greater market fluctuation than a fund which has securities representing a broader range of investment alternatives.
Non-Diversified (Global Real Estate). There is additional risk associated with being non-diversified, since the Fund is not limited in the proportion of its assets in a single issuer. The investment of a large percentage of a Fund’s assets in the securities of a small number of issuers may cause that Fund’s share price to fluctuate more than that of a diversified fund.
NOTE 14 — SECURITIES LENDING
Under an agreement with The Bank of New York (“BNY”), the Funds can lend their securities to approved brokers, dealers and other financial institutions. Loans are collateralized by cash and U.S. Government securities. The collateral must be in an amount equal to at least 105% of the market value of non-U.S. securities loaned and 102% of the market value of U.S. securities loaned. The cash collateral received is invested in approved investments as defined in the Securities Lending Agreement with BNY (the “Agreement”). The securities purchased with cash collateral received are reflected in the Portfolio of Investments. Generally, in the event of counterparty default, the Funds have the right to use the collateral to offset losses incurred. The Agreement contains certain guarantees by BNY in the event of counterparty default and/or a borrower’s failure to return a loaned security, however there would be a
49
NOTES TO FINANCIAL STATEMENTS AS OF OCTOBER 31, 2005 (CONTINUED)
NOTE 14 — SECURITIES LENDING (continued)
potential loss to the Funds in the event the Funds are delayed or prevented from exercising their right to dispose of the collateral. The Funds bear the risk of loss with respect to the investment of collateral. Engaging in securities lending could have a leveraging effect, which may intensify the credit, market and other risks associated with investing in a Fund. At October 31, 2005, the following Funds had securities on loan with the following market values:
Fund | | | Value of
Securities
Loaned | | Value of
Collateral | |
Global Value Choice | | | $ 6,412,204 | | | $ 6,636,000 | | |
Emerging Countries | | 18,758,086 | | | 19,481,000 | | |
Foreign | | 4,912,810 | | | 4,949,000 | | |
International | | 4,778,120 | | | 4,871,000 | | |
International SmallCap | | 54,813,594 | | | 57,748,000 | | |
International Value | | 98,489,416 | | | 104,511,000 | | |
NOTE 15 — FEDERAL INCOME TAXES
The amount of distributions from net investment income and net realized capital gains are determined in accordance with federal income tax regulations, which may differ from accounting principles generally accepted in the United States of America for investment companies. These book/tax differences may be either temporary or permanent. Permanent differences are reclassified within the capital accounts based on their federal tax-basis treatment; temporary differences are not reclassified. Key differences include the treatment of short-term capital gains, foreign currency transactions, and wash sale deferrals. Distributions in excess of net investment income and/or net realized capital gains for tax purposes are reported as distributions of paid-in capital.
The following permanent tax differences have been reclassified as of October 31, 2005:
| | Paid-in
Capital | | Undistributed
Net Investment
Income On
Investments | | Accumulated
Net Realized
Gains/
(Losses) | |
Global Real Estate(1) | | $ | — | | | $ | 90,948 | | | $ | (90,948 | ) | |
Global Value Choice | | | 82,505 | | | | 271,310 | | | | (353,815 | ) | |
Emerging Countries | | | — | | | | (168,696 | ) | | | 168,696 | | |
Foreign | | | (42,139 | ) | | | 764,999 | | | | (722,860 | ) | |
International | | | — | | | | 812,673 | | | | (812,673 | ) | |
International SmallCap | | | — | | | | (357,736 | ) | | | 357,736 | | |
International Value | | | — | | | | 1,789,790 | | | | (1,789,790 | ) | |
(1) As of the Fund’s tax year-end of December 31, 2004.
Dividends paid by the Fund from net investment income and distributions of net realized short-term capital gains are, for federal income tax purposes, taxable as ordinary income to shareholders.
The tax composition of dividends and distributions to shareholders was as follows:
| | Year Ended October 31, 2005 | | Year Ended October 31, 2004 | |
| | Ordinary
Income | | Long-Term
Capital Gains | | Ordinary
Income | | Long-Term
Capital Gains | | Return
of Capital | |
Global Real Estate(1) | | $ | 9,149,441 | | $ | 1,825,148 | | $ | 3,775,116 | | $1,107,647 | | | $ | — | | |
Emerging Countries | | 72,677 | | — | | 441,079 | | — | | | | — | | |
Foreign | | — | | — | | 214,879 | | — | | | | 94,666 | | |
International | | 1,011,092 | | — | | 147,464 | | — | | | | — | | |
International SmallCap | | — | | — | | 63,563 | | — | | | | — | | |
International Value | | 47,073,127 | | 184,904,220 | | 15,265,465 | | — | | | | — | | |
| | | | | | | | | | | | | | | | | |
(1) Composition of dividends and distributions presented herein differ from final amounts based on the Fund’s tax year-end of December 31, 2004.
The tax-basis components of distributable earnings and the expiration dates of the capital loss carryforwards which may be used to offset future realized capital gains for federal income tax purposes as of October 31, 2005 were:
| | Undistributed
Ordinary
Income | | Undistributed
Long Term
Capital Gains | | Unrealized
Appreciation/
Depreciation | | Post-
October
Currency
Losses
Deferred | | Capital
Loss
Carryforwards | | Expiration
Dates | |
Global Real Estate(1) | | $ | 4,020,925 | | | $ | 1,259,587 | | | $ | 21,712,266 | | $(105,095 | ) | | — | | | — | | |
Global Value Choice | | | 396,434 | | | | — | | | 3,490,697 | | — | | | $ | (102,001,944 | ) | | 2009 | | |
| | | | | | | | | | | | | | | | (81,779,077 | ) | | 2010 | | |
| | | | | | | | | | | | | | | | (6,183,953 | ) | | 2011 | | |
| | | | | | | | | | | | | | | $ | (189,964,974 | ) | | | | |
Emerging Countries | | | 670,276 | | | | — | | | 3,670,186 | | — | | | $ | (710,694 | ) | | 2007 | | |
| | | | | | | | | | | | | | | | (10,231,430 | ) | | 2008 | | |
| | | | | | | | | | | | | | | | (31,553,234 | ) | | 2009 | | |
| | | | | | | | | | | | | | | | (18,266,429 | ) | | 2010 | | |
| | | | | | | | | | | | | | | $ | (60,761,787 | )* | | | |
| | | | | | | | | | | | | | | | | | | | | | |
50
NOTES TO FINANCIAL STATEMENTS AS OF OCTOBER 31, 2005 (CONTINUED)
NOTE 15 — FEDERAL INCOME TAXES (continued)
| | Undistributed
Ordinary
Income | | Undistributed
Long Term
Capital Gains | | Unrealized
Appreciation/
Depreciation | | Post-
October
Currency
Losses
Deferred | | Capital
Loss
Carryforwards | | Expiration
Dates | |
Foreign | | $ | — | | | $ | 6,094,388 | | $ | 29,965,937 | | $ | — | | | $ | — | | | — | | |
International | | | 1,737,951 | | | — | | 8,440,406 | | | — | | | | (2,735,596 | ) | | 2007 | | |
| | | | | | | | | | | | | | | (3,061,891 | ) | | 2008 | | |
| | | | | | | | | | | | | | | (2,802,182 | ) | | 2010 | | |
| | | | | | | | | | | | | | | (2,172,053 | ) | | 2011 | | |
| | | | | | | | | | | | | | $ | (10,771,722 | ) | | | | |
International SmallCap | | | 2,368,870 | | | — | | 40,093,875 | | | — | | | $ | (6,087,776 | ) | | 2009 | | |
| | | | | | | | | | | | | | | (57,646,473 | ) | | 2010 | | |
| | | | | | | | | | | | | | $ | (63,734,249 | ) | | | | |
International Value | | | 49,269,447 | | | 295,069,722 | | 545,240,077 | | | — | | | | — | | | — | | |
| | | | | | | | | | | | | | | | | | | | | | |
* Utilization of these capital losses is subject to annual limitations under Section 382 of the Internal Revenue Code.
(1) As of the Fund’s tax year-end of December 31, 2004.
NOTE 16 — INFORMATION REGARDING TRADING OF ING’S U.S. MUTUAL FUNDS
ING Investments has reported to the Boards of Directors/Trustees (the “Boards”) of the ING Funds that, like many U.S. financial services companies, ING Investments and certain of its U.S. affiliates have received informal and formal requests for information since September 2003 from various governmental and self-regulatory agencies in connection with investigations related to mutual funds and variable insurance products. ING Investments has advised the Boards that it and its affiliates have cooperated fully with each request.
In addition to responding to regulatory and governmental requests, ING Investments reported that management of U.S. affiliates of ING Groep N.V., including ING Investments (collectively, “ING”), on their own initiative, have conducted, through independent special counsel and a national accounting firm, an extensive internal review of trading in ING insurance, retirement, and mutual fund products. The goal of this review was to identify any instances of inappropriate trading in those products by third parties or by ING investment professionals and other ING personnel. ING’s internal review related to mutual fund trading is now substantially completed. ING has reported that, of the millions of customer relationships that ING maintains, the internal review identified several isolated arrangements allowing third parties to engage in frequent trading of mutual funds within ING’s variable insurance and mutual fund products, and identified other circumstances where frequent trading occurred, despite measures taken by ING intended to combat market timing. ING further reported that each of these arrangements has been terminated and fully disclosed to regulators. The results of the internal review were also reported to the independent members of the Board.
ING Investments has advised the Board that most of the identified arrangements were initiated prior to ING’s acquisition of the businesses in question in the U.S. ING Investments further reported that the companies in question did not receive special benefits in return for any of these arrangements, which have all been terminated.
Based on the internal review, ING Investments has advised the Board that the identified arrangements do not represent a systemic problem in any of the companies that were involved.
In September 2005, ING Funds Distributor, LLC (“IFD”), the distributor of certain ING Funds, settled an administrative proceeding with the NASD regarding three arrangements, dating from 1995, 1996 and 1998, under which the administrator to the then-Pilgrim Funds, which subsequently became part of the ING Funds, entered into formal and informal arrangements that permitted frequent trading. Under the terms of the Letter of Acceptance, Waiver and Consent (“AWC”) with the NASD, under which IFD neither admitted nor denied the allegations or findings, IFD consented to the following sanctions: (i) a censure; (ii) a fine of $1.5 million; (iii) restitution of approximately $1.44 million to certain ING Funds for losses attributable to excessive trading described in the AWC; and (iv) agreement to make certification to NASD regarding the review and establishment of certain procedures.
51
NOTES TO FINANCIAL STATEMENTS AS OF OCTOBER 31, 2005 (CONTINUED)
NOTE 16 — INFORMATION REGARDING TRADING OF ING’S U.S. MUTUAL FUNDS (continued)
In addition to the arrangements discussed above, ING Investments reported to the Board that, at this time, these instances include the following, in addition to the arrangements subject to the AWC discussed above:
• Aeltus Investment Management, Inc. (a predecessor entity to ING Investment Management Co.) has identified two investment professionals who engaged in extensive frequent trading in certain ING Funds. One was subsequently terminated for cause and incurred substantial financial penalties in connection with this conduct and the second has been disciplined.
• ReliaStar Life Insurance Company (“ReliaStar”) entered into agreements seven years ago permitting the owner of policies issued by the insurer to engage in frequent trading and to submit orders until 4pm Central Time. In 2001 ReliaStar also entered into a selling agreement with a broker-dealer that engaged in frequent trading. Employees of ING affiliates were terminated and/or disciplined in connection with these matters.
• In 1998, Golden American Life Insurance Company entered into arrangements permitting a broker-dealer to frequently trade up to certain specific limits in a fund available in an ING variable annuity product. No employee responsible for this arrangement remains at the company.
For additional information regarding these matters, you may consult the Form 8-K and Form 8-K/A for each of four life insurance companies, ING USA Annuity and Life Insurance Company, ING Life Insurance and Annuity Company, ING Insurance Company of America, and ReliaStar Life Insurance Company of New York, each filed with the Securities and Exchange Commission (the “SEC”) on October 29, 2004 and September 8, 2004. These Forms 8-K and Forms 8-K/A can be accessed through the SEC’s Web site at http://www.sec.gov. Despite the extensive internal review conducted through independent special counsel and a national accounting firm, there can be no assurance that the instances of inappropriate trading reported to the Board are the only instances of such trading respecting the ING Funds.
ING Investments reported to the Board that ING is committed to conducting its business with the highest standards of ethical conduct with zero tolerance for noncompliance. Accordingly, ING Investments advised the Board that ING management was disappointed that its voluntary internal review identified these situations. Viewed in the context of the breadth and magnitude of its U.S. business as a whole, ING management does not believe that ING’s acquired companies had systemic ethical or compliance issues in these areas. Nonetheless, Investments reported that given ING’s refusal to tolerate any lapses, it has taken the steps noted below, and will continue to seek opportunities to further strengthen the internal controls of its affiliates.
• ING has agreed with the ING Funds to indemnify and hold harmless the ING Funds from all damages resulting from wrongful conduct by ING or its employees or from ING’s internal investigation, any investigations conducted by any governmental or self-regulatory agencies, litigation or other formal proceedings, including any proceedings by the Securities and Exchange Commission. ING Investments reported to the Board that ING management believes that the total amount of any indemnification obligations will not be material to ING or its U.S. business.
• ING updated its Code of Conduct for employees reinforcing its employees’ obligation to conduct personal trading activity consistent with the law, disclosed limits, and other requirements.
• The ING Funds, upon a recommendation from ING, updated their respective Codes of Ethics applicable to investment professionals with ING entities and certain other fund personnel, requiring such personnel to pre-clear any purchases or sales of ING Funds that are not systematic in nature (i.e., dividend reinvestment), and imposing minimum holding periods for shares of ING Funds.
• ING instituted excessive trading policies for all customers in its variable insurance and retirement products and for shareholders of the ING Funds sold to the public through financial intermediaries. ING does not make exceptions to these policies.
• ING reorganized and expanded its U.S. Compliance Department, and created an Enterprise Compliance team to enhance controls and consistency in regulatory compliance.
As has been widely reported in the media, the New York Attorney General’s office (“NYAG”) is conducting broad investigations regarding insurance quoting and
52
NOTES TO FINANCIAL STATEMENTS AS OF OCTOBER 31, 2005 (CONTINUED)
NOTE 16 — INFORMATION REGARDING TRADING OF ING’S U.S. MUTUAL FUNDS (continued)
brokerage practices. ING U.S. has been subpoenaed in this regard, and is cooperating fully with these NYAG requests for information.
ING U.S. believes that its practices are consistent with our business principles and our commitment to our customers.
At this time, in light of the current regulatory factors, ING U.S. is actively engaged in reviewing whether any modifications in our practices are appropriate for the future.
There can be no assurance that these matters, or the adverse publicity associated with them, will not result in increased fund redemptions, reduced sale of fund shares, or other adverse consequences to ING Funds.
53
| | PORTFOLIO OF INVESTMENTS |
ING GLOBAL REAL ESTATE FUND | | AS OF OCTOBER 31, 2005 |
Shares | | | | Value | |
COMMON STOCK: 98.1% | | | |
| | Australia: 8.8% | | | |
1,710,900 | | DB RREEF Trust | | $ | 1,708,033 | |
572,200 | | GPT Group | | 1,644,250 | |
1,114,900 | | Macquarie CountryWide Trust | | 1,603,530 | |
550,100 | | Macquarie Goodman Group | | 1,663,356 | |
557,100 | | Mirvac Group | | 1,591,909 | |
400,300 | | Prime Retail Group | | 1,783,767 | |
476,778 | | Westfield Group | | 5,928,768 | |
| | | | 15,923,613 | |
| | | | | |
| | Canada: 1.8% | | | |
192,600 | | RioCan Real Estate Investment
Trust | | 3,298,309 | |
| | | | 3,298,309 | |
| | | | | |
| | Finland: 0.8% | | | |
142,700 | | Sponda OYJ | | 1,375,897 | |
| | | | 1,375,897 | |
| | | | | |
| | France: 3.2% | | | |
9,200 | | Klepierre | | 861,844 | |
19,400 | | Nexity | | 884,200 | |
21,200 | | Societe de la Tour Eiffel | | 2,182,213 | |
13,400 | | Unibail | | 1,768,988 | |
| | | | 5,697,245 | |
| | | | | |
| | Germany: 1.9% | | | |
6,000 | | Deutsche Wohnen AG | | 1,354,655 | |
105,400 | | IVG Immobilien AG | | 2,026,197 | |
| | | | 3,380,852 | |
| | | | | |
| | Hong Kong: 7.5% | | | |
301,100 | | Cheung Kong Holdings Ltd. | | 3,145,103 | |
601,000 | | Great Eagle Holdg. Co. | | 1,434,642 | |
816,000 | | Hang Lung Properties Ltd. | | 1,507,827 | |
742,000 | | Hysan Development Co., Ltd. | | 1,616,754 | |
631,000 | | New World Development Ltd | | 780,931 | |
361,300 | | Sun Hung Kai Properties Ltd. | | 3,429,001 | |
453,000 | | Wharf Holdings Ltd. | | 1,551,821 | |
| | | | 13,466,079 | |
| | | | | |
| | Italy: 0.4% | | | |
753,800 | | Beni Stabili S.p.A. | | 722,387 | |
| | | | 722,387 | |
| | | | | |
| | Japan: 9.6% | | | |
111 | | Japan Retail Fund Investment
Corp. | | 803,267 | |
367,100 | | Mitsubishi Estate Co., Ltd. | | 5,426,940 | |
340,300 | | Mitsui Fudosan Co., Ltd. | | 5,570,991 | |
180 | | Nippon Building Fund, Inc. | | 1,430,683 | |
249,800 | | Sumitomo Realty &
Development Co., Ltd. | | 4,041,230 | |
| | | | 17,273,111 | |
| | | | | |
| | Netherlands: 1.7% | | | |
45,600 | | AM NV | | 535,327 | |
21,700 | | Eurocommercial Properties NV | | 802,366 | |
22,400 | | Rodamco Europe NV | | 1,782,542 | |
| | | | 3,120,235 | |
| | | | | |
| | Singapore: 2.4% | | | |
592,200 | | Ascendas Real Estate
Investment Trust | | $ | 702,071 | |
1,065,000 | | CapitaLand Ltd. | | 2,002,288 | |
546,300 | | CapitaMall Trust | | 745,795 | |
173,000 | | City Developments Ltd. | | 900,990 | |
| | | | 4,351,144 | |
| | | | | |
| | Spain: 0.9% | | | |
28,900 | | Inmobiliaria Colonial | | 1,678,381 | |
| | | | 1,678,381 | |
| | | | | |
| | Sweden: 0.8% | | | |
43,000 | | Castellum AB | | 1,490,599 | |
| | | | 1,490,599 | |
| | | | | |
| | United Kingdom: 11.8% | | | |
161,500 | | British Land Co. PLC | | 2,545,273 | |
185,815 | | Capital & Regional PLC | | 2,458,588 | |
77,400 | | Derwent Valley Holdings PLC | | 1,794,177 | |
54,300 | | Hammerson PLC | | 857,860 | |
1,475,000 | **,@ | ING UK Real Estate Income
Trust Ltd. | | 2,663,341 | |
243,150 | | Land Securities Group PLC | | 5,981,434 | |
48,000 | | Liberty Intl. PLC | | 790,882 | |
34,300 | | Mapeley Ltd. | | 1,587,817 | |
187,700 | | Slough Estates PLC | | 1,685,312 | |
145,600 | | Unite Group PLC | | 834,935 | |
| | | | 21,199,619 | |
| | | | | |
| | United States: 46.5% | | | |
77,200 | | AMB Property Corp. | | 3,410,696 | |
40,400 | | Archstone-Smith Trust | | 1,639,028 | |
84,600 | | Arden Realty, Inc. | | 3,818,844 | |
35,100 | | AvalonBay Communities, Inc. | | 3,027,375 | |
32,800 | | BioMed Realty Trust, Inc. | | 820,328 | |
52,900 | | Boston Properties, Inc. | | 3,661,738 | |
20,600 | | BRE Properties | | 908,666 | |
38,000 | | Camden Property Trust | | 2,141,300 | |
26,200 | | Corporate Office Properties Trust | | 910,712 | |
56,400 | | Developers Diversified
Realty Corp. | | 2,463,552 | |
77,300 | | Equity Office Properties Trust | | 2,380,840 | |
71,400 | | Equity Residential | | 2,802,450 | |
86,100 | | General Growth Properties, Inc. | | 3,657,528 | |
43,600 | | Highwoods Properties, Inc. | | 1,229,956 | |
110,800 | | Host Marriott Corp. | | 1,860,332 | |
52,800 | | Liberty Property Trust | | 2,201,232 | |
38,300 | | Macerich Co. | | 2,461,541 | |
54,800 | | Maguire Properties, Inc. | | 1,644,000 | |
45,200 | | Mills Corp. | | 2,418,200 | |
41,100 | | New Plan Excel Realty Trust | | 944,889 | |
116,200 | | Omega Healthcare Investors, Inc. | | 1,428,098 | |
39,500 | | Pan Pacific Retail Properties, Inc. | | 2,508,250 | |
57,000 | | Post Properties, Inc. | | 2,325,600 | |
92,900 | | ProLogis | | 3,994,700 | |
46,200 | | Public Storage, Inc. | | 3,058,440 | |
71,500 | | Reckson Associates Realty Corp. | | 2,509,650 | |
38,400 | | Regency Centers Corp. | | 2,137,728 | |
9,700 | | Shurgard Storage Centers, Inc. | | 547,371 | |
71,600 | | Simon Property Group, Inc. | | 5,127,992 | |
41,800 | | SL Green Realty Corp. | | 2,843,654 | |
44,600 | | Starwood Hotels & Resorts
Worldwide, Inc. | | 2,605,978 | |
See Accompanying Notes to Financial Statements
54
| | PORTFOLIO OF INVESTMENTS |
ING GLOBAL REAL ESTATE FUND | | AS OF OCTOBER 31, 2005 (CONTINUED) |
Shares | | | | Value | |
| | United States (continued) | | | |
39,200 | | Sunstone Hotel Investors, Inc. | | $ | 878,080 | |
142,500 | | Trizec Properties, Inc. | | 3,170,625 | |
44,100 | | U-Store-It Trust | | 919,926 | |
60,300 | | United Dominion Realty
Trust, Inc. | | 1,334,437 | |
22,800 | | Ventas, Inc. | | 698,364 | |
41,900 | | Vornado Realty Trust | | 3,393,900 | |
| | | | 83,886,000 | |
| | Total Common Stock
(Cost $150,530,597) | | 176,863,471 | |
| | | | | |
| | Total Investments In
Securities (Cost
$150,530,597)* | 98.1 | % | $ | 176,863,471 | |
| | Other Assets and
Liabilities-Net | 1.9 | | 3,423,166 | |
| | Net Assets | 100.0 | % | $ | 180,286,637 | |
| | | | | | | | |
| Securities may have been fair valued in accordance with procedures approved by the Board of Directors/Trustees (Note 2A). |
@ | Non-income producing security |
** | Investment in affiliate. |
* | Cost for federal income tax purposes is $154,834,318. Net unrealized appreciation consists of: |
| | Gross Unrealized Appreciation | | $ | 23,121,875 | |
| | Gross Unrealized Depreciation | | (1,092,722 | ) |
| | Net Unrealized Appreciation | | $ | 22,029,153 | |
Industry | | Percentage of
Net Assets | |
Closed End Investment Companies | | 1.5 | % |
Diversified Property Holdings | | 15.5 | |
Healthcare | | 1.2 | |
Industrial Properties | | 6.3 | |
Industrial/Office Mix | | 1.2 | |
Mixed Use Properties | | 1.3 | |
Office Buildings | | 29.1 | |
Real Estate Services | | 2.7 | |
Residential Apartments | | 8.9 | |
Residential: Manufactured Home Comm. | | 0.8 | |
Residential: Hotels | | 3.0 | |
Retail: Enclosed Malls | | 13.7 | |
Retail: Shopping Center | | 10.4 | |
Self Storage Property | | 2.5 | |
Other Assets & Liabilities - Net | | 1.9 | |
Net Assets | | 100.0 | % |
| | | | |
See Accompanying Notes to Financial Statements
55
| | PORTFOLIO OF INVESTMENTS |
ING GLOBAL VALUE CHOICE FUND | | AS OF OCTOBER 31, 2005 |
Shares | | | | Value | |
COMMON STOCK: 96.8% | | | |
| | | | | |
| | Australia: 1.2% | | | |
270,560 | | Alumina Ltd. | | $ | 1,170,230 | |
| | | | 1,170,230 | |
| | | | | |
| | Belgium: 0.9% | | | |
27,442 | | Belgacom SA | | 919,217 | |
| | | | 919,217 | |
| | | | | |
| | Bermuda: 0.9% | | | |
36,150 | L | Tyco Intl. Ltd. | | 953,999 | |
| | | | 953,999 | |
| | | | | |
| | Canada: 4.3% | | | |
72,400 | L | Barrick Gold Corp. | | 1,828,100 | |
55,000 | L | Placer Dome, Inc. | | 1,097,250 | |
25,850 | | Suncor Energy, Inc. | | 1,386,336 | |
| | | | 4,311,686 | |
| | | | | |
| | Finland: 1.0% | | | |
77,000 | | Stora Enso OYJ | | 984,492 | |
| | | | 984,492 | |
| | | | | |
| | France: 2.0% | | | |
4,500 | | Areva | | 2,037,682 | |
| | | | 2,037,682 | |
| | | | | |
| | Germany: 0.3% | | | |
8,800 | @ | Premiere AG | | 253,703 | |
| | | | 253,703 | |
| | | | | |
| | Italy: 2.1% | | | |
46,144 | | ENI S.p.A. | | 1,234,473 | |
353,926 | | Telecom Italia S.p.A. | | 855,424 | |
| | | | 2,089,897 | |
| | | | | |
| | Japan: 16.3% | | | |
106,000 | | Dai Nippon Printing Co., Ltd. | | 1,734,687 | |
74,900 | | Daiichi Sankyo Co., Ltd. | | 1,357,665 | |
45,800 | | Fuji Photo Film Co., Ltd. | | 1,457,376 | |
95,000 | | Kirin Brewery Co., Ltd. | | 1,056,742 | |
26,000 | | Makita Corp. | | 603,563 | |
92,000 | | Matsushita Electric
Industrial Co., Ltd. | | 1,686,014 | |
31,000 | | NEC Electronics Corp. | | 831,749 | |
14,900 | | Nintendo Co., Ltd. | | 1,670,890 | |
160,000 | | Sekisui House Ltd. | | 1,992,614 | |
107,000 | | Shiseido Co., Ltd. | | 1,716,476 | |
14,000 | | Takefuji Corp. | | 979,831 | |
96,000 | L | Wacoal Corp. | | 1,360,635 | |
| | | | 16,448,242 | |
| | | | | |
| | Netherlands: 3.3% | | | |
27,583 | | Royal Dutch Shell PLC ADR | | 1,804,204 | |
66,000 | | TPG NV | | 1,555,527 | |
| | | | 3,359,731 | |
| | | | | |
| | Papua New Guinea: 1.3% | | | |
1,008,204 | @ | Lihir Gold Ltd. | | 1,303,860 | |
| | | | 1,303,860 | |
| | | | | |
| | Portugal: 1.6% | | | |
572,602 | | Electricidade de Portugal SA | | 1,619,285 | |
| | | | 1,619,285 | |
| | | | | |
| | South Africa: 1.9% | | | |
34,600 | L | AngloGold Ashanti Ltd. ADR | | $ | 1,352,860 | |
4,800 | | Impala Platinum Holdings Ltd. | | 526,448 | |
| | | | 1,879,308 | |
| | | | | |
| | South Korea: 2.7% | | | |
64,550 | | Korea Electric Power Corp. ADR | | 1,054,102 | |
77,700 | | KT Corp. ADR | | 1,674,435 | |
| | | | 2,728,537 | |
| | | | | |
| | Switzerland: 2.1% | | | |
4,421 | | Swisscom AG | | 1,452,272 | |
31,080 | | Xstrata PLC | | 712,155 | |
| | | | 2,164,427 | |
| | | | | |
| | Taiwan: 2.0% | | | |
116,600 | L | Chunghwa Telecom Co.,
Ltd. ADR | | 2,019,512 | |
| | | | 2,019,512 | |
| | | | | |
| | United Kingdom: 6.5% | | | |
34,000 | | Anglo American PLC | | 1,006,538 | |
314,891 | | J Sainsbury PLC | | 1,555,786 | |
61,792 | | Lonmin PLC | | 1,429,007 | |
273,977 | | Misys PLC | | 994,953 | |
141,249 | | United Utilities PLC | | 1,559,789 | |
| | | | 6,546,073 | |
| | | | | |
| | United States: 46.4% | | | |
20,800 | | Aetna, Inc. | | 1,842,048 | |
48,050 | @ | Agilent Technologies, Inc. | | 1,538,081 | |
20,650 | L | Albertson’s, Inc. | | 518,522 | |
39,700 | L | Altria Group, Inc. | | 2,979,485 | |
46,100 | | Citigroup, Inc. | | 2,110,458 | |
101,000 | L | Computer Associates Intl., Inc. | | 2,824,970 | |
55,500 | | Countrywide Financial Corp. | | 1,763,235 | |
43,500 | | Fannie Mae | | 2,067,120 | |
19,500 | | Hartford Financial Services
Group, Inc. | | 1,555,125 | |
42,400 | | International Paper Co. | | 1,237,232 | |
52,700 | | JPMorgan Chase & Co. | | 1,929,874 | |
32,767 | L | Kerr-McGee Corp. | | 2,786,506 | |
25,700 | | Kimberly-Clark Corp. | | 1,460,788 | |
133,700 | @ | Liberty Media Corp. | | 1,065,589 | |
34,600 | | Lockheed Martin Corp. | | 2,095,376 | |
13,300 | | MGIC Investment Corp. | | 787,892 | |
42,300 | | Microsoft Corp. | | 1,087,110 | |
75,800 | | Motorola, Inc. | | 1,679,728 | |
76,400 | | Noble Energy, Inc. | | 3,059,820 | |
37,500 | | Northrop Grumman Corp. | | 2,011,875 | |
31,700 | | Pitney Bowes, Inc. | | 1,333,936 | |
20,400 | L | Radian Group, Inc. | | 1,062,840 | |
30,100 | | Raytheon Co. | | 1,112,195 | |
72,200 | | Sprint Corp. | | 1,682,982 | |
14,800 | | Union Pacific Corp. | | 1,023,864 | |
69,400 | | Viacom, Inc. | | 2,149,318 | |
32,200 | | Wells Fargo & Co. | | 1,938,437 | |
| | | | 46,704,406 | |
| | Total Common Stock
(Cost $93,910,959) | | 97,494,287 | |
See Accompanying Notes to Financial Statements
56
| | PORTFOLIO OF INVESTMENTS |
ING GLOBAL VALUE CHOICE FUND | | AS OF OCTOBER 31, 2005 (CONTINUED) |
Principal
Amount | | | | Value | |
SHORT-TERM INVESTMENTS: 6.6% | | | |
| | | | | |
| | Securities Lending Collateralcc: 6.6% | | | |
$ | 6,636,000 | | The Bank of New York Institutional | | | |
| | Cash Reserves Fund | | $ | 6,636,000 | |
| | Total Short-Term Investments
(Cost $6,636,000) | | 6,636,000 | |
| | Total Investments In
Securities (Cost
$100,546,959)* | 103.4 | % | $ | 104,130,287 | |
| | Other Assets and
Liabilities-Net | (3.4 | ) | (3,401,345 | ) |
| | Net Assets | 100.0 | % | $ | 100,728,942 | |
| | | | | | | | | |
| Securities may have been fair valued in accordance with procedures approved by the Board of Directors/Trustees (Note 2A). |
@ | Non-income producing security |
ADR | American Depositary Receipt |
cc | Securities purchased with cash collateral for securities loaned |
L | Loaned security, a portion or all of the security is on loan at October 31, 2005. |
* | Cost for federal income tax purposes is $100,636,686. Net unrealized appreciation consists of: |
| | Gross Unrealized Appreciation | | $ | 8,794,634 | |
| | Gross Unrealized Depreciation | | (5,301,033 | ) |
| | Net Unrealized Appreciation | | $ | 3,493,601 | |
Industry | | Percentage of
Net Assets | |
Aeorspace/Defense | | 5.2 | % |
Agriculture | | 3.0 | |
Apparel | | 1.4 | |
Banks | | 1.9 | |
Beverages | | 1.0 | |
Commercial Services | | 1.7 | |
Cosmetics/Personal Care | | 1.7 | |
Diversified Financial Services | | 8.8 | |
Electric | | 2.7 | |
Electronics | | 1.5 | |
Energy - Alternate Sources | | 2.0 | |
Food | | 2.1 | |
Forest Products and Paper | | 2.2 | |
Hand/Machine Tools | | 0.6 | |
Healthcare - Services | | 1.8 | |
Home Builders | | 2.0 | |
Home Furnishings | | 1.7 | |
Household Products/Wares | | 1.4 | |
Insurance | | 3.4 | |
Media | | 3.4 | |
Mining | | 10.4 | |
Miscellaneous Manufacturing | | 2.4 | |
Office/Business Equipment | | 1.3 | |
Oil and Gas | | 10.2 | |
Pharmaceuticals | | 1.3 | |
Semiconductors | | 0.8 | |
Software | | 4.9 | |
Telecommunications | | 10.2 | |
Toys/Games/Hobbies | | 1.7 | |
Transportation | | 2.6 | |
Water | | 1.5 | |
Securities Lending Collateral | | 6.6 | |
Other Assets and Liabilities, Net | | (3.4 | ) |
Net Assets | | 100.0 | % |
| | | | |
See Accompanying Notes to Financial Statements
57
| | PORTFOLIO OF INVESTMENTS |
ING EMERGING COUNTRIES FUND | | AS OF OCTOBER 31, 2005 |
Shares | | | | Value | |
COMMON STOCK: 90.4% | | | |
| | Argentina: 3.4% | | | |
273,000 | @,L | Grupo Financiero
Galicia SA ADR | | $ | 2,107,560 | |
178,070 | | Telecom Argentina SA ADR | | 2,343,401 | |
| | | | 4,450,961 | |
| | | | | |
| | Brazil: 18.8% | | | |
105,898,352 | | AES Tiete SA | | 2,068,832 | |
79,700 | | Brasil Telecom Participacoes
SA ADR | | 3,316,317 | |
233,000 | L | Centrais Eletricas Brasileiras
SA ADR | | 2,038,004 | |
40,000 | | Cia de Saneamento Basico do
Estado de Sao Paulo | | 2,555,667 | |
467,910 | | Cia Paranaense de Energia ADR | | 3,453,176 | |
64,500 | | Contax Participacoes SA ADR | | 48,685 | |
123,000 | | Souza Cruz SA | | 1,458,142 | |
166,120 | L | Tele Centro Oeste Celular
Participacoes SA ADR | | 1,503,386 | |
83,290 | L | Tele Norte Leste Participacoes
SA ADR | | 1,474,233 | |
527,060 | @,L | Telesp Celular Participacoes
SA ADR | | 1,923,769 | |
99,900 | | Tim Participacoes SA ADR | | 2,024,973 | |
58,480 | L | Unibanco - Uniao de Bancos
Brasileiros SA GDR | | 3,058,504 | |
| | | | 24,923,688 | |
| | | | | |
| | Chile: 1.8% | | | |
82,800 | | AFP Provida SA ADR | | 2,375,532 | |
| | | | 2,375,532 | |
| | | | | |
| | China: 2.7% | | | |
1,758,000 | | People’s Food Holdings Ltd. | | 893,214 | |
18,032,000 | | Sinopec Yizheng Chemical
Fibre Co., Ltd. | | 2,721,425 | |
| | | | 3,614,639 | |
| | | | | |
| | Croatia: 1.1% | | | |
108,670 | | Pliva DD GDR | | 1,437,704 | |
| | | | 1,437,704 | |
| | | | | |
| | Czech Republic: 1.4% | | | |
91,548 | | Cesky Telecom AS | | 1,866,262 | |
| | | | 1,866,262 | |
| | | | | |
| | Estonia: 0.7% | | | |
34,821 | | Eesti Telekom GDR | | 927,140 | |
| | | | 927,140 | |
| | | | | |
| | Greece: 1.7% | | | |
225,400 | @ | Hellenic Telecommunications
Organization SA ADR | | 2,301,334 | |
| | | | 2,301,334 | |
| | | | | |
| | Hong Kong: 5.2% | | | |
12,678,000 | L | Brilliance China Automotive
Holdings Ltd. | | 1,665,623 | |
7,670,000 | | First Pacific Co. | | 2,504,906 | |
3,556,000 | | SCMP Group Ltd. | | 1,322,763 | |
1,395,000 | | SmarTone Telecommunications
Holding Ltd. | | 1,421,569 | |
| | | | 6,914,861 | |
| | | | | |
| | Hungary: 2.9% | | | |
803,229 | | Matav Magyar Tavkozlesi Rt | | $ | 3,806,788 | |
| | | | 3,806,788 | |
| | | | | |
| | Indonesia: 2.4% | | | |
1,360,500 | | Gudang Garam Tbk PT | | 1,378,093 | |
21,484,500 | | Indofood Sukses Makmur
Tbk PT | | 1,748,172 | |
| | | | 3,126,265 | |
| | | | | |
| | Israel: 1.8% | | | |
890,850 | @ | Bezeq Israeli
Telecommunication Corp., Ltd. | | 1,206,574 | |
150,000 | @ | Partner Communications | | 1,232,487 | |
| | | | 2,439,061 | |
| | | | | |
| | Luxembourg: 1.9% | | | |
81,400 | | Quilmes Industrial SA ADR | | 2,536,424 | |
| | | | 2,536,424 | |
| | | | | |
| | Malaysia: 1.2% | | | |
812,400 | | Proton Holdings Bhd | | 1,657,081 | |
| | | | 1,657,081 | |
| | | | | |
| | Mexico: 3.7% | | | |
913,110 | | Controladora Comercial
Mexicana SA de CV | | 1,369,454 | |
510,400 | | Gruma SA de CV | | 1,324,345 | |
109,800 | L | Telefonos de Mexico SA de
CV ADR | | 2,215,764 | |
| | | | 4,909,563 | |
| | | | | |
| | Panama: 2.0% | | | |
159,610 | | Banco Latino Americano | | 2,714,966 | |
| | | | 2,714,966 | |
| | | | | |
| | Philippines: 2.1% | | | |
1,535,900 | | Bank of the Philippine Islands | | 1,460,567 | |
3,652,100 | @ | Manila Electric Co. | | 1,347,454 | |
| | | | 2,808,021 | |
| | | | | |
| | Russia: 2.6% | | | |
62,000 | | Lukoil ADR | | 3,416,760 | |
| | | | 3,416,760 | |
| | | | | |
| | Singapore: 4.5% | | | |
294,000 | | DBS Group Holdings Ltd. | | 2,658,755 | |
1,355,000 | | MobileOne Ltd. | | 1,600,434 | |
463,200 | | Oversea-Chinese Banking Corp. | | 1,722,699 | |
| | | | 5,981,888 | |
| | | | | |
| | South Africa: 0.9% | | | |
123,290 | | Sappi Ltd. | | 1,196,342 | |
| | | | 1,196,342 | |
| | | | | |
| | South Korea: 16.4% | | | |
46,570 | | Kookmin Bank | | 2,659,248 | |
117,860 | | Korea Electric Power Corp. | | 3,855,483 | |
17,200 | | KT Corp. | | 696,691 | |
90,790 | | KT Freetel Co., Ltd. | | 1,963,200 | |
76,970 | | LG Chem Ltd. | | 3,397,874 | |
23,370 | | LG Electronics, Inc. | | 1,529,497 | |
7,316 | | POSCO | | 1,503,445 | |
5,125 | | Samsung Electronics Co., Ltd. | | 2,738,653 | |
166,150 | | SK Telecom Co., Ltd. ADR | | 3,357,892 | |
| | | | 21,701,983 | |
See Accompanying Notes to Financial Statements
58
| | PORTFOLIO OF INVESTMENTS |
ING EMERGING COUNTRIES FUND | | AS OF OCTOBER 31, 2005 (CONTINUED |
Shares | | | | Value | |
| | Taiwan: 7.5% | | | |
825,000 | | China Motor Corp. | | $ | 773,681 | |
124,890 | | Chunghwa Telecom Co.,
Ltd. ADR | | 2,163,095 | |
802,268 | @,L | United Microelectronics
Corp. ADR | | 2,342,623 | |
6,357,000 | | Walsin Lihwa Corp. | | 1,869,636 | |
441,000 | @,L | Yageo Corp. GDR | | 670,364 | |
1,458,718 | @ | Yageo Corp. GDR | | 2,085,967 | |
| | | | 9,905,366 | |
| | | | | |
| | Thailand: 2.5% | | | |
2,466,600 | | Glow Energy PCL | | 1,314,439 | |
1,506,200 | I | Siam Makro PCL | | 2,030,666 | |
| | | | 3,345,105 | |
| | | | | |
| | Venezuela: 1.2% | | | |
128,500 | | Cia Anonima Nacional
Telefonos de Venezuela ADR | | 1,657,650 | |
| | | | 1,657,650 | |
| | Total Common Stock
(Cost $116,905,327) | | 120,015,384 | |
| | | | | |
PREFERRED STOCK: 1.8% | | | |
| | Brazil: 1.8% | | | |
975,469,880 | | Embratel Participacoes SA | | 2,347,451 | |
| | Total Preferred Stock
(Cost $1,717,781) | | 2,347,451 | |
| | Total Long-Term Investments
(Cost $118,623,108) | | 122,362,835 | |
| | | | | | |
Principal
Amount | | | | Value | |
| | | | | |
SHORT-TERM INVESTMENTS: 14.7% | | | |
| | | |
| | Securities Lending Collateralcc: 14.7% | | | |
$ | 19,481,000 | | The Bank of New York Insitutional
Cash Reserves Fund | | | 19,481,000 | |
| | Total Short-Term Investments:
(Cost $19,481,000) | | | 19,481,000 | |
| | Total Investments In
Securities (Cost $138,104,108)* | 106.9 | % | $ | 141,843,835 | |
| | Other Assets and
Liabilities-Net | (6.9 | ) | (9,167,729 | ) |
| | Net Assets | 100.0 | % | $ | 132,676,106 | |
| | | | | | | | |
| Securities may have been fair valued in accordance with procedures approved by the Board of Directors/Trustees (Note 2A). |
@ | Non-income producing security |
ADR | American Depositary Receipt |
GDR | Global Depositary Receipt |
cc | Securities purchased with cash collateral for securities loaned. |
I | Illiquid security |
L | Loaned security, a portion or all of the security is on loan at October 31, 2005. |
* | Cost for federal income tax purposes is $138,252,915. Net unrealized appreciation consists of: |
| | Gross Unrealized Appreciation | | $ | 15,587,716 | |
| | Gross Unrealized Depreciation | | (11,996,796 | ) |
| | Net Unrealized Appreciation | | $ | 3,590,920 | |
Industry | | Percentage of
Net Assets | |
Agriculture | | 2.1 | % |
Auto Manufacturers | | 3.1 | |
Banks | | 10.7 | |
Beverages | | 1.9 | |
Chemicals | | 4.6 | |
Diversified Financial Services | | 1.6 | |
Electric | | 10.6 | |
Electrical Components and Equipment | | 2.6 | |
Electronics | | 2.1 | |
Food | | 3.0 | |
Forest Products and Paper | | 0.9 | |
Holding Companies - Diversified | | 1.9 | |
Investment Companies | | 1.8 | |
Iron/Steel | | 1.1 | |
Media | | 1.0 | |
Oil and Gas | | 2.6 | |
Pharmaceuticals | | 1.1 | |
Retail | | 2.6 | |
Semiconductors | | 3.8 | |
Telecommunications | | 31.2 | |
Water | | 1.9 | |
Security Lending Collateral | | 14.7 | |
Other Assets and Liabilities, Net | | (6.9 | ) |
Net Assets | | 100.0 | % |
| | | | |
See Accompanying Notes to Financial Statements
59
| | PORTFOLIO OF INVESTMENTS |
ING FOREIGN FUND | | AS OF OCTOBER 31, 2005 |
Shares | | | | Value | |
COMMON STOCK: 89.7% | | | |
| | | | | |
| | Australia: 1.6% | | | |
78,943 | | BHP Billiton Ltd. | | $ | 1,223,471 | |
22,530 | | Brambles Industries Ltd. | | 142,790 | |
12,800 | | CSL Ltd. | | 359,856 | |
103,400 | | Macquarie Airports | | 232,682 | |
85,522 | | Newcrest Mining Ltd. | | 1,163,147 | |
54,492 | | Patrick Corp., Ltd. | | 278,936 | |
5,557 | | Rio Tinto Ltd. | | 234,802 | |
14,418 | | Transurban Group | | 69,145 | |
| | | | 3,704,829 | |
| | | | | |
| | Austria: 2.7% | | | |
18,829 | | Bank Austria Creditanstalt AG | | 2,069,287 | |
4,643 | | Flughafen Wien AG | | 300,316 | |
47,297 | @ | IMMOFINANZ Immobilien
Anlagen AG | | 457,242 | |
28,591 | | OMV AG | | 1,541,749 | |
17,936 | @ | Raiffeisen Intl. Bank Holding AG | | 1,128,780 | |
26,795 | | Telekom Austria AG | | 554,263 | |
9,356 | | Wienerberger AG | | 361,515 | |
| | | | 6,413,152 | |
| | | | | |
| | Belgium: 1.2% | | | |
3,906 | | Almancora Comm Va | | 378,639 | |
21,544 | | Fortis | | 612,882 | |
5,359 | | Interbrew | | 213,958 | |
21,052 | | KBC Bancassurance Holding | | 1,714,820 | |
| | | | 2,920,299 | |
| | | | | |
| | Brazil: 0.1% | | | |
5,809 | L | Aracruz Celulose SA ADR | | 222,485 | |
| | | | 222,485 | |
| | | | | |
| | Bulgaria: 0.0% | | | |
60,720 | @ | Bulgarian Compensation Notes | | 25,768 | |
25,950 | @ | Bulgarian Housing
Compensation Notes | | 10,965 | |
117,641 | @ | Bulgarian Registered
Comp Vouchers | | 49,888 | |
| | | | 86,621 | |
| | | | | |
| | Canada: 0.1% | | | |
55,092 | @ | Bema Gold Corp. | | 138,717 | |
829 | @ | Centerra Gold, Inc. | | 15,919 | |
44,793 | @ | Eldorado Gold Corp. | | 137,088 | |
3,787 | @ | Ivanhoe Mines Ltd. | | 28,445 | |
| | | | 320,169 | |
| | | | | |
| | China: 0.3% | | | |
296,000 | | Beijing Capital Intl. Airport
Co., Ltd. | | 119,925 | |
45,630 | | Shenzhen Chiwan Wharf
Holdings Ltd. | | 64,569 | |
244,498 | | Weiqiao Textile Co. | | 297,159 | |
84,393 | | Wumart Stores, Inc. | | 174,178 | |
| | | | 655,831 | |
| | | | | |
| | Cyprus: 0.0% | | | |
20,870 | | Bank of Cyprus Ltd. | | 106,182 | |
| | | | 106,182 | |
| | | | | |
| | Czech Republic: 1.6% | | | |
16,602 | @ | Cesky Telecom AS | | 338,442 | |
7,064 | | CEZ | | $ | 185,244 | |
22,540 | | Komercni Banka AS | | 3,169,137 | |
| | | | 3,692,823 | |
| | | | | |
| | Denmark: 0.9% | | | |
2,025 | | Bryggerigruppen AS | | 157,038 | |
1,975 | | Chr. Hansen Holding A/S | | 185,049 | |
20,113 | | Danske Bank A/S | | 630,479 | |
1,950 | | Kobenhavns Lufthavne | | 617,568 | |
21,143 | @ | Vestas Wind Systems A/S | | 457,367 | |
| | | | 2,047,501 | |
| | | | | |
| | Finland: 0.7% | | | |
31,708 | | Fortum Oyj | | 560,887 | |
55,443 | S | Nokia Oyj | | 928,494 | |
5,350 | | Stockmann Oyj Abp | | 190,657 | |
| | | | 1,680,038 | |
| | | | | |
| | France: 9.4% | | | |
1,956 | | Accor | | 97,647 | |
4,510 | | Air Liquide | | 819,793 | |
62,965 | @ | Alcatel SA | | 739,524 | |
2,592 | @ | Alstom RGPT | | 124,152 | |
2,740 | @ | Atos Origin | | 188,178 | |
8,061 | | Autoroutes du Sud de la France | | 449,903 | |
10,065 | | BNP Paribas | | 762,954 | |
18,689 | | Bouygues | | 921,878 | |
7,151 | | Carrefour SA | | 317,857 | |
10,184 | | Cie de Saint-Gobain | | 557,608 | |
3,086 | | Compagnie Generale des
Etablissements Michelin | | 166,442 | |
2,189 | | Eurazeo | | 212,704 | |
57,618 | | France Telecom SA | | 1,497,091 | |
6,116 | | Generale de Sante | | 211,676 | |
7,878 | @ | JC Decaux SA | | 160,982 | |
23,927 | | Lafarge SA | | 1,963,496 | |
23,782 | | LVMH Moet Hennessy Louis
Vuitton SA | | 1,925,082 | |
10,766 | | Pernod-Ricard | | 1,882,387 | |
7,398 | | PPR SA | | 777,099 | |
6,342 | | Publicis Groupe | | 209,626 | |
2,551 | | Renault SA | | 220,807 | |
32,264 | | Sanofi-Aventis SA | | 2,583,396 | |
5,315 | | Schneider Electric SA | | 436,543 | |
18,357 | | Societe Television Francaise 1 | | 470,669 | |
27,901 | | Suez SA | | 755,534 | |
7,946 | S | Total SA | | 1,998,532 | |
4,580 | | Unibail | | 604,624 | |
8,390 | | Veolia Environnement | | 348,953 | |
9,763 | | Vinci SA | | 762,938 | |
| | | | 22,168,075 | |
| | | | | |
| | Germany: 8.4% | | | |
4,058 | | Adidas-Salomon AG | | 680,513 | |
2,619 | | Allianz AG | | 369,096 | |
6,230 | | BASF AG | | 448,210 | |
18,485 | | Commerzbank AG | | 482,804 | |
2,520 | | Continental AG | | 192,495 | |
9,003 | | DaimlerChrysler AG | | 449,830 | |
8,913 | | Deutsche Bank AG | | 833,453 | |
3,650 | | Deutsche Boerse AG | | 343,273 | |
35,529 | | Deutsche Post AG | | 793,660 | |
4,309 | | Deutsche Postbank AG | | 237,411 | |
70,677 | | Deutsche Telekom AG | | 1,249,209 | |
14,313 | | E.ON AG | | 1,296,199 | |
See Accompanying Notes to Financial Statements
60
| | PORTFOLIO OF INVESTMENTS |
ING FOREIGN FUND | | AS OF OCTOBER 31, 2005 (CONTINUED) |
Shares | | | | Value | |
| | Germany (continued) | | | |
35,138 | | Fraport AG Frankfurt Airport
Services Worldwide | | $ | 1,759,217 | |
1,461 | | Freenet.de AG | | 33,824 | |
2,270 | | Fresenius AG | | 293,640 | |
11,372 | L | Fresenius Medical Care AG | | 1,026,163 | |
4,725 | | Henkel KGaA - Common | | 378,897 | |
797 | | Henkel KGaA - Preffered | | 68,352 | |
8,111 | | Hypo Real Estate Holding | | 391,066 | |
79,326 | | INDEXCHANGE - DAXEX | | 4,513,103 | |
7,208 | | IVG Immobilien AG | | 138,566 | |
16,450 | @,L | KarstadtQuelle AG | | 194,074 | |
6,350 | | Linde AG | | 452,926 | |
2,553 | | MAN AG | | 118,330 | |
10,054 | | Metro AG | | 454,882 | |
1,899 | | Muenchener
Rueckversicherungs AG | | 222,822 | |
10,434 | | RWE AG | | 663,747 | |
3,826 | | Schering AG | | 235,772 | |
19,630 | | Siemens AG | | 1,458,517 | |
| | | | 19,780,051 | |
| | | | | |
| | Greece: 0.5% | | | |
10,806 | | Alpha Bank AE | | 310,134 | |
23,994 | @ | Hellenic Telecommunications
Organization SA | | 494,897 | |
11,171 | | National Bank of Greece | | 435,651 | |
| | | | 1,240,682 | |
| | | | | |
| | Hong Kong: 0.1% | | | |
54,000 | | China Merchants Holdings Intl.
Co., Ltd. | | 105,275 | |
129,000 | @ | Clear Media Ltd. | | 108,161 | |
186,000 | | Texwinca Holdings Ltd. | | 125,962 | |
| | | | 339,398 | |
| | | | | |
| | Hungary: 0.9% | | | |
2,861 | | Egis Rt | | 244,764 | |
139,567 | | Matav Magyar Tavkozlesi Rt | | 661,458 | |
33,707 | S | OTP Bank Rt | | 1,219,279 | |
| | | | 2,125,501 | |
| | | | | |
| | Indonesia: 0.3% | | | |
838,993 | | Bank Mandiri Persero Tbk PT | | 109,656 | |
546,500 | | Indofood Sukses Makmur Tbk PT | | 44,468 | |
84,757 | | Semen Gresik Persero Tbk PT | | 156,844 | |
533,204 | | Telekomunikasi Indonesia Tbk PT | | 267,815 | |
| | | | 578,783 | |
| | | | | |
| | Ireland: 1.5% | | | |
18,807 | @ | Celtic Resources Holdings PLC | | 69,508 | |
3,554 | | Depfa Bank PLC | | 55,404 | |
210,989 | @ | Dragon Oil PLC | | 567,219 | |
68,739 | | EURO STOXX 50-NAV | | 2,735,073 | |
| | | | 3,427,204 | |
| | | | | |
| | Italy: 3.2% | | | |
33,774 | | Assicurazioni Generali S.p.A. | | 1,003,827 | |
3,345 | | Autostrada Torino-Milano S.p.A. | | 63,571 | |
144,358 | | Banca Intesa S.p.A. | | 624,947 | |
152,358 | | Banca Intesa S.p.A. | | 711,233 | |
3,543 | | Banca Popolare dell’Emilia
Romagna SCRL | | 186,823 | |
71,564 | | Banca Popolare di Milano SCRL | | 681,657 | |
10,870 | | Banca Popolare di Sondrio SCRL | | 159,477 | |
19,590 | | Banche Popolari Unite SCRL | | $ | 414,373 | |
23,252 | | Banco Popolare di Verona e
Novara SCRL | | 428,939 | |
124,078 | | Beni Stabili S.p.A. | | 118,907 | |
24,978 | | Buzzi Unicem S.p.A. | | 350,508 | |
71,866 | | Capitalia S.p.A. | | 374,834 | |
218,738 | | Cassa di Risparmio di Firenze S.p.A. | | 652,051 | |
48,755 | | Credito Emiliano S.p.A. | | 514,150 | |
9,120 | | Luxottica Group S.p.A. | | 219,967 | |
102,590 | @ | Parmalat S.p.A. | | 298,284 | |
5,806 | | Societa Iniziative Autostradali e
Servizi S.p.A. | | 67,281 | |
107,300 | | UniCredito Italiano S.p.A. | | 594,880 | |
| | | | 7,465,709 | |
| | | | | |
| | Japan: 14.4% | | | |
930 | | Acom Co., Ltd. | | 60,443 | |
5,175 | | Aeon Credit Service Co., Ltd. | | 406,508 | |
2,950 | | Aiful Corp. | | 220,663 | |
5,900 | | Aisin Seiki Co., Ltd | | 177,588 | |
11,000 | | Bank of Fukuoka Ltd. | | 85,487 | |
65,000 | | Bank of Yokohama Ltd. | | 529,251 | |
12,000 | | Bridgestone Corp. | | 245,118 | |
22,637 | S | Canon, Inc. | | 1,198,209 | |
10,000 | | Chiba Bank Ltd. | | 89,017 | |
21,558 | | Credit Saison Co., Ltd. | | 978,142 | |
5,000 | | Dai Nippon Printing Co., Ltd. | | 81,825 | |
6,000 | | Daihatsu Motor Co., Ltd. | | 57,127 | |
15,587 | | Denso Corp. | | 443,762 | |
42 | | East Japan Railway Co. | | 249,552 | |
2,800 | | Exedy Corp. | | 64,526 | |
1,100 | | Fanuc Ltd. | | 86,689 | |
9,800 | | Fuji Photo Film Co., Ltd. | | 311,840 | |
190 | S | Fuji Television Network, Inc. | | 421,958 | |
17,000 | | Gunma Bank Ltd. | | 121,118 | |
8,400 | | Hitachi Capital Corp. | | 178,651 | |
21,063 | S | Honda Motor Co., Ltd. | | 1,171,475 | |
7,700 | | Ibiden Co., Ltd. | | 312,010 | |
122 | | Japan Tobacco, Inc. | | 1,928,803 | |
14,000 | | Joyo Bank Ltd. | | 93,592 | |
19,126 | | Koito Manufacturing Co., Ltd. | | 257,187 | |
101,471 | | Matsushita Electric Industrial
Co., Ltd. | | 1,859,582 | |
328 | S | Mitsubishi Tokyo Financial
Group, Inc. | | 4,120,918 | |
374 | S | Mizuho Financial Group, Inc. | | 2,496,842 | |
8,000 | | NGK Spark Plug Co., Ltd. | | 128,550 | |
1,300 | @ | Nidec Corp. | | 72,033 | |
15,290 | | Nikko Cordial Corp. | | 185,623 | |
42,906 | | Nissan Motor Co., Ltd. | | 449,831 | |
7,700 | | Nitto Denko Corp. | | 466,234 | |
15,230 | | Nomura ETF - Nikkei 225
Exchange Traded Fund | | 1,792,457 | |
45,953 | | Nomura Holdings, Inc. | | 708,933 | |
248,400 | | Nomura TOPIX Exchange
Traded Fund | | 3,113,402 | |
500 | | ORIX Corp. | | 93,758 | |
8,000 | | Ricoh Co., Ltd. | | 127,134 | |
3,500 | | Secom Co., Ltd. | | 174,640 | |
5,586 | @ | Seven & I Holdings Co., Ltd. | | 182,353 | |
1,102 | | SMC Corp. | | 146,658 | |
13,433 | | Sony Corp. | | 438,873 | |
273 | S | Sumitomo Mitsui Financial
Group, Inc. | | 2,521,385 | |
See Accompanying Notes to Financial Statements
61
| | PORTFOLIO OF INVESTMENTS |
ING FOREIGN FUND | | AS OF OCTOBER 31, 2005 (CONTINUED) |
Shares | | | | Value | |
| | Japan (continued) | | | | |
43,830 | | Sumitomo Trust & Banking
Co., Ltd. | | $ | 373,155 | |
6,100 | | Takeda Chemical Industries Ltd. | | 334,374 | |
4,570 | | Takefuji Corp. | | 319,845 | |
46,100 | S | Tokyo Broadcasting System, Inc. | | 1,303,205 | |
16,000 | | Toppan Printing Co., Ltd. | | 154,383 | |
51,000 | | Toshiba Corp. | | 236,758 | |
45,800 | S | Toyota Motor Corp. | | 2,123,859 | |
11,100 | | Yamaha Motor Co., Ltd. | | 238,418 | |
3,092 | | Yamanouchi Pharmaceutical
Co., Ltd. | | 110,449 | |
| | | | 34,044,193 | |
| | | | | |
| | Luxembourg: 0.1% | | | |
6,516 | @,L | Millicom Intl. Cellular SA | | 123,999 | |
4,058 | @ | SBS Broadcasting SA | | 216,089 | |
| | | | 340,088 | |
| | | | | |
| | Mexico: 0.6% | | | |
13,433 | | Consorcio ARA SA | | 49,538 | |
57,758 | | Fomento Economico Mexicano
SA de CV | | 391,652 | |
6,640 | | Fomento Economico Mexicano
SA de CV ADR | | 451,454 | |
56,610 | | Grupo Financiero Banorte
SA de CV | | 482,194 | |
14,960 | @ | Urbi Desarrollos Urbanos
SA de CV | | 94,319 | |
| | | | 1,469,157 | |
| | | | | |
| | Netherlands: 2.0% | | | |
14,959 | | ABN Amro Holding NV | | 353,632 | |
15,219 | | Aegon NV | | 229,381 | |
4,661 | | Euronext NV | | 195,514 | |
6,468 | | European Aeronautic Defense
and Space Co. | | 223,981 | |
17,793 | | Heineken NV | | 563,601 | |
43,920 | | Koninklijke Philips Electronics NV | | 1,147,919 | |
31,610 | | Royal KPN NV | | 300,183 | |
6,239 | @ | Royal Numico NV | | 252,552 | |
23,062 | | TPG NV | | 543,539 | |
8,607 | | Unilever NV | | 605,282 | |
5,657 | | VNU NV | | 179,917 | |
| | | | 4,595,501 | |
| | | | | |
| | New Zealand: 0.1% | | | |
160,764 | | Auckland Intl. Airport Ltd. | | 221,065 | |
| | | | 221,065 | |
| | | | | |
| | Norway: 2.0% | | | |
45,000 | | Acta Holding ASA | | 105,924 | |
14,526 | | DNB Holding ASA | | 148,552 | |
18,610 | S | Norsk Hydro ASA | | 1,848,372 | |
8,500 | | Orkla ASA | | 298,322 | |
84,415 | | Statoil ASA | | 1,875,328 | |
24,394 | | Telenor ASA | | 238,036 | |
27,400 | | Tomra Systems ASA | | 187,407 | |
| | | | 4,701,941 | |
| | | | | |
| | Philippines: 0.1% | | | |
7,480 | | Ayala Corp. | | 39,523 | |
48,400 | | Bank of the Philippine Islands | | 46,026 | |
2,346 | | Globe Telecom, Inc. | | 30,196 | |
6,100 | L | Philippine Long Distance
Telephone ADR | | $ | 183,915 | |
| | | | 299,660 | |
| | | | | |
| | Poland: 3.8% | | | |
14,828 | | Agora SA | | 281,349 | |
3,721 | | Bank BPH SA | | 708,459 | |
10,111 | | Bank Handlowy w Warszawie | | 179,534 | |
57,150 | | Bank Millennium SA | | 79,774 | |
47,950 | | Bank Pekao SA | | 2,275,882 | |
15,562 | @ | Bank Zachodni WBK SA | | 524,281 | |
15,273 | @ | Budimex SA | | 177,501 | |
13,619 | @ | CCC SA | | 96,280 | |
5,755 | @ | Cersanit-Krsnystaw SA | | 209,866 | |
4,572 | | Grupa Kety SA | | 181,475 | |
5,162 | | Inter Cars SA | | 38,650 | |
1,975 | @ | Inter Groclin Auto SA | | 53,005 | |
8,149 | | Orbis SA | | 73,811 | |
4,510 | | Polska Grupa Framaceutycz SA | | 70,789 | |
78,920 | @ | Polski Koncernmiesny Duda SA | | 241,410 | |
353,180 | S | Pows Zechna Kasa Oszczednosci
Bank Polski | | 2,966,230 | |
10,496 | | Sniezka SA | | 72,883 | |
1,308 | @ | Stomil Sanok | | 44,258 | |
97,140 | S | Telekomunikacja Polska SA | | 698,665 | |
| | | | 8,974,102 | |
| | | | | |
| | Portugal: 0.1% | | | |
91,438 | | Banco Comercial Portugues SA | | 231,176 | |
6,004 | | Jeronimo Martins | | 86,473 | |
| | | | 317,649 | |
| | | | | |
| | Romania: 1.0% | | | |
895,328 | | Impact | | 124,249 | |
1,069,500 | @ | Rolast AG | | 26,254 | |
149,561 | | Romanian Bank for
Development SA | | 631,472 | |
154,500 | | SIF 1 Banat Crisana Arad | | 91,022 | |
167,500 | | SIF 2 Moldova Bacau | | 101,422 | |
127,000 | | SIF 3 Transilvania Brasov | | 73,574 | |
232,500 | | SIF 4 Muntenia Bucuresti | | 96,644 | |
147,500 | | SIF 5 Oltenia Craiova | | 103,795 | |
8,537,510 | @ | SNP Petrom SA | | 1,128,908 | |
585,000 | @ | Socep Constanta | | 52,654 | |
| | | | 2,429,994 | |
| | | | | |
| | Russia: 4.2% | | | |
34,300 | L | Lukoil ADR | | 1,890,240 | |
15,950 | L | MMC Norilsk Nickel ADR | | 1,172,325 | |
5,547 | | Moscow City Telephone ADR | | 91,526 | |
170 | | NovaTek OAO | | 374,289 | |
534 | # | NovaTek OAO GDR | | 11,748 | |
33,267 | L | OAO Gazprom GDR | | 1,967,080 | |
3,677 | | Sberbank RF | | 3,270,609 | |
2,289 | | Sibirtelecom ADR | | 114,084 | |
43,845 | | Tyumen Oil Co. | | 271,839 | |
7,255 | L | Unified Energy System GDR | | 256,102 | |
25,037 | L | Uralsvyazinform ADR | | 174,758 | |
30,398 | | VolgaTelecom ADR | | 220,689 | |
| | | | 9,815,289 | |
| | | | | |
| | Singapore: 0.1% | | | |
124,000 | | Singapore
Telecommunications Ltd. | | 170,663 | |
| | | | 170,663 | |
See Accompanying Notes to Financial Statements
62
| PORTFOLIO OF INVESTMENTS |
ING FOREIGN FUND | AS OF OCTOBER 31, 2005 (CONTINUED) |
Shares | | | | Value | |
| | South Korea: 1.0% | | | |
| | Samsung Electronics Co., Ltd. | | $ | 2,324,515 | |
| | | | 2,324,515 | |
| | Spain: 1.4% | | | |
10,492 | | ACS Actividades de Construccion
y Servicios SA | | 299,625 | |
12,435 | | Cintra Concesiones DE Infrae | | 147,400 | |
12,286 | | Corp Mapfre SA | | 215,031 | |
23,123 | | Endesa SA | | 573,806 | |
7,311 | | Fadesa SA | | 245,677 | |
7,485 | | Grupo Empresarial Ence SA | | 237,024 | |
9,310 | | Grupo Ferrovial | | 687,459 | |
16,152 | | Inditex SA | | 477,946 | |
12,995 | | Promotora de Informaciones SA | | 238,192 | |
14,605 | | Telefonica SA | | 232,994 | |
| | | | 3,355,154 | |
| | Sweden: 3.1% | | | |
6,426 | | Autoliv, Inc. | | 276,061 | |
38,200 | | ForeningsSparbanken AB | | 942,596 | |
30,514 | | Getinge AB | | 381,378 | |
5,350 | | Hennes & Mauritz AB | | 173,600 | |
12,650 | @ | Modern Times Group AB | | 484,678 | |
174,000 | | Nordea AB | | 1,704,494 | |
78,600 | | Skandinaviska Enskilda Banken AB | | 1,466,024 | |
65,263 | | Skanska AB | | 913,916 | |
37,195 | | Svenska Handelsbanken AB | | 847,785 | |
45,563 | | Telefonaktiebolaget LM Ericsson | | 149,281 | |
10,500 | | TeliaSonera AB | | 51,346 | |
| | | | 7,391,159 | |
| | Switzerland: 7.2% | | | |
1,140 | | BKW FMB Energie AG | | 76,564 | |
17,644 | | Compagnie Financiere
Richemont AG | | 670,317 | |
26,906 | | Holcim Ltd. | | 1,672,976 | |
15,917 | S | Nestle SA | | 4,732,981 | |
965 | | Nobel Biocare Holding AG | | 222,166 | |
56,609 | | Novartis AG | | 3,040,537 | |
31,694 | S | Roche Holding AG | | 4,728,787 | |
126 | | SGS SA | | 92,727 | |
9,984 | | Swatch Group AG | | 1,383,087 | |
3,238 | | Synthes, Inc. | | 342,414 | |
394 | @ | Unique Zurich Airport | | 65,313 | |
| | | | 17,027,869 | |
| | Turkey: 3.9% | | | |
368,306 | S | Akbank TAS | | 2,307,481 | |
19,487 | | Cimsa Cimento Sanayi VE Tica | | 113,977 | |
346,008 | @ | Dogan Sriketler Grubu Holdings | | 871,499 | |
301,833 | | HACI Omer Sabanci Holding | | 1,420,565 | |
30,295 | | Hurriyet Gazetecilik Ve Matb | | 85,965 | |
114,898 | | KOC Holding AS | | 430,400 | |
6,793 | | Tupras Turkiye Petrol Rafine | | 116,731 | |
473,123 | @ | Turkiye Garanti Bankasi | | 1,414,285 | |
359,281 | | Turkiye Is Bank ASI - C | | 2,506,110 | |
| | | | 9,267,013 | |
| | Ukraine: 0.1% | | | |
1,530 | @,I | Centrenergo ADR | | 9,104 | |
87 | | Ukrnafta Open JT STK ADR | | 18,287 | |
16,172 | | UkrTelecom ADR | | 106,535 | |
| | | | 133,926 | |
| | United Kingdom: 10.7% | | | |
37,667 | | Associated British Ports
Holdings PLC | | $ | 365,382 | |
106,953 | | BAA PLC | | 1,162,152 | |
55,127 | | BAE Systems PLC | | 322,624 | |
59,393 | | Barclays PLC | | 588,680 | |
13,743 | | BG Group PLC | | 120,921 | |
7,840 | | British Land Co. PLC | | 123,560 | |
21,225 | | British Sky Broadcasting PLC | | 191,613 | |
103,406 | | Burberry Group PLC | | 702,506 | |
19,459 | | Cadbury Schweppes PLC | | 191,787 | |
117,853 | | Compass Group PLC | | 396,681 | |
182,479 | S | Diageo PLC | | 2,695,750 | |
11,193 | | Exel PLC | | 239,114 | |
141,784 | | GlaxoSmithKline PLC | | 3,688,279 | |
34,701 | | Highland Gold Mining Ltd. | | 137,602 | |
265,523 | | Hilton Group PLC | | 1,595,969 | |
23,528 | | Imperial Tobacco Group PLC | | 674,354 | |
11,664 | @ | Kazakhmys PLC | | 111,500 | |
16,730 | | National Grid PLC | | 153,045 | |
31,156 | | Pearson PLC | | 346,539 | |
86,000 | | Peninsular and Oriental Steam
Navigation Co. | | 615,335 | |
22,050 | @ | Peter Hambro Mining PLC | | 304,387 | |
51,835 | | Prudential PLC | | 434,958 | |
31,082 | | Reckitt Benckiser PLC | | 939,320 | |
35,515 | @ | Rolls-Royce Group PLC | | 229,586 | |
1,186,201 | @ | Rolls-Royce Group PLC - Class B | | 2,100 | |
13,625 | | Royal Bank of Scotland Group PLC | | 377,357 | |
2,366 | | SABMiller PLC | | 44,646 | |
21,234 | | Scottish & Newcastle PLC | | 175,774 | |
46,824 | | Scottish Power PLC | | 458,334 | |
33,655 | | Smith & Nephew PLC | | 284,737 | |
12,254 | | Smiths Group PLC | | 198,007 | |
9,256 | @ | Telewest Global, Inc. | | 211,129 | |
363,794 | | Tesco PLC | | 1,937,450 | |
1,354,984 | S | Vodafone Group PLC | | 3,558,033 | |
14,546 | | Whitbread PLC | | 242,150 | |
41,723 | | William Hill PLC | | 394,898 | |
15,576 | | Wolseley PLC | | 316,919 | |
72,977 | | WPP Group PLC | | 716,991 | |
| | | | 25,250,169 | |
| | United States: 0.2% | | | |
19,086 | L | News Corp., Inc. | | 287,435 | |
2,231 | | Southern Copper Corp. | | 123,017 | |
| | | | 410,452 | |
| | Venezuela: 0.1% | | | |
10,148 | | Cia Anonima Nacional Telefonos
de Venezuela ADR | | 130,909 | |
| | | | 130,909 | |
| | Total Common Stock
(Cost $180,694,082) | | 211,643,701 | |
| | | |
PREFERRED STOCK: 0.2% | | | |
| | Germany: 0.2% | | | |
18,350 | | ProSieben SAT.1 Media AG | | 315,695 | |
3,215 | | Volkswagen AG | | 130,387 | |
| | Total Preferred Stock
(Cost $398,415) | | 446,082 | |
See Accompanying Notes to Financial Statements
63
| PORTFOLIO OF INVESTMENTS |
ING FOREIGN FUND | AS OF OCTOBER 31, 2005 (CONTINUED) |
Shares | | | | Value | |
RIGHTS: 0.0% | | | | |
| | Cyprus: 0.0% | | | |
7,554 | @ | Bank of Cyprus | | $ | 7,554 | |
| | Total Rights
(Cost $-) | | 7,554 | |
| | | |
EQUITY-LINKED SECURITIES: 2.1.% | | | |
| | India: 0.5% | | | |
150,817 | @,# | Bharti Televentures | | 1,078,342 | |
| | | | 1,078,342 | |
| | Japan: 1.1% | | | |
21,404 | @ | NIKKEI | | 2,519,091 | |
| | | | 2,519,091 | |
| | United Kingdom: 0.5% | | | |
103,758 | @ | Velvet Hill Fund Ltd. | | 1,300,485 | |
| | | | 1,300,485 | |
| | Total Equity Linked Securities
(Cost $4,604,532) | | 4,897,918 | |
| | | | |
WARRANTS: 0.1% | | | | |
| | India: 0.1% | | | |
14,147 | @,# | State Bank of India Ltd. | | 262,851 | |
| | Total Warrants
(Cost $284,631) | | 262,851 | |
| | Total Long-Term Investments
(Cost $185,981,660) | | 217,260,206 | |
| | | | | | |
Principal
Amount | | | | Value | |
| | | | |
SHORT-TERM INVESTMENTS: 2.1% | | | |
| Securities Lending Collateralcc: 2.1% | | | |
$4,949,000 | The Bank of New York Institutional
Cash Reserves Fund | | $ | 4,949,000 | |
| Total Short-Term Investments
(Cost $4,949,000) | | 4,949,000 | |
| Total Investments In Securities
(Cost $190,930,660)* | | 94.2 | % | $ | 222,209,206 | |
| Other Assets and
Liabilities-Net | | | 5.8 | | 13,621,849 | |
| Net Assets | | | 100.0 | % | $ | 235,831,055 | |
| | | | | | | | | |
Securities may have been fair valued in accordance with procedures approved by the Board of Directors/Trustees (Note 2A).
Equity Linked Securities (ELKS) are short-term investments that offer current income as well as limited protection against the decline in the price of the stock on which it is based.
@ Non-income producing security
ADR American Depositary Receipt
GDR Global Depositary Receipt
SIF Societati de Investitii Financiare
# Securities with purchases pursuant to Rule 144A, under the Securities Act of 1933 and may not be resold subject to that rule except to qualified institutional buyers. These securities have been determined to be liquid under the guidelines established by the Funds’ Board of Directors/Trustees.
cc Securities purchased with cash collateral for securities loaned.
S Segregated securities for certain derivatives, when-issued or delayed delivery securities and forward currency exchange contracts.
I Illiquid security
L Loaned security, a portion or all of the security is on loan at October 31, 2005.
* Cost for federal income tax purposes is $192,117,959.
Net unrealized appreciation consists of:
| Gross Unrealized Appreciation | | | | $ | 32,910,510 | |
| Gross Unrealized Depreciation | | | | (2,819,263 | ) |
| Net Unrealized Appreciation | | | | $ | 30,091,247 | |
At October 31, 2005 the following forward foreign currency contracts were outstanding for the ING Foreign Fund:
Currency | | | Buy/Sell | | Settlement
Date | | In
Exchange
For | | Value | | Unrealized
Appreciation
(Depreciation) | |
British Pound Sterling
GBP 1,027,150 | | Buy | | 11/30/05 | | USD
1,851,951 | | 1,817,687 | | $ | (34,264 | ) |
Japanese Yen
JPY 252,060,900 | | Buy | | 12/01/05 | | USD
2,525,028 | | 2,173,006 | | (352,022 | ) |
Japanese Yen
JPY 686,426,691 | | Buy | | 12/09/05 | | USD
6,540,200 | | 5,923,820 | | (616,380 | ) |
Japanese Yen JPY 125,785,500 | | Buy | | 12/01/05 | | USD
1,260,755 | | 1,084,392 | | (176,363 | ) |
Japanese Yen
JPY 194,222,019 | | Buy | | 11/08/05 | | USD
1,757,665 | | 1,670,011 | | (87,654 | ) |
Japanese Yen
JPY 153,706,900 | | Buy | | 12/21/05 | | USD
1,400,072 | | 1,328,550 | | (71,522 | ) |
Turkish New Lira
TRY 1,625,419 | | Buy | | 11/28/05 | | USD
1,146,276 | | 1,193,024 | | 46,748 | |
| | | | | | | | | | $ | (1,291,457 | ) |
See Accompanying Notes to Financial Statements
64
| PORTFOLIO OF INVESTMENTS |
ING FOREIGN FUND | AS OF OCTOBER 31, 2005 (CONTINUED) |
Currency | | | Buy/Sell | | Settlement
Date | | In
Exchange
For | | Value | | Unrealized
Appreciation
(Depreciation) | |
British Pound Sterling
GBP 168,600 | | Sell | | 11/30/05 | | USD
308,912 | | 298,362 | | $ | 10,550 | |
Czech Republic, Koruna
CZK 15,501,996 | | Sell | | 11/30/05 | | USD
641,400 | | 627,265 | | 14,135 | |
Czech Republic, Koruna
CZK 12,001,391 | | Sell | | 12/27/05 | | USD
493,641 | | 486,433 | | 7,208 | |
Czech Republic, Koruna
CZK 17,206,100 | | Sell | | 12/29/05 | | USD
704,002 | | 697,474 | | 6,528 | |
Czech Republic Koruna
CZK 2,567,850 | | Sell | | 12/29/05 | | USD
105,473 | | 103,732 | | 1,741 | |
Czech Republic, Koruna
CZK 19,081,262 | | Sell | | 01/23/06 | | USD
770,649 | | 774,486 | | (3,837 | ) |
Hungarian Forint
HUF 97,214,072 | | Sell | | 12/29/05 | | USD
469,611 | | 464,116 | | 5,495 | |
Japanese Yen
JPY 686,426,691 | | Sell | | 12/09/05 | | USD
6,100,161 | | 5,923,820 | | 176,341 | |
Polish Zloty
PLN 3,515,901 | | Sell | | 01/23/06 | | USD
1,076,088 | | 1,061,020 | | 15,068 | |
Turkish New Lira
TRY 1,625,419 | | Sell | | 11/28/05 | | USD
1,104,000 | | 1,193,022 | | (89,022 | ) |
Turkish New Lira
TRY 960,885 | | Sell | | 12/27/05 | | USD
694,934 | | 699,340 | | (4,406 | ) |
| | | | | | | | | | $ | 139,801 | |
| | | | | | | | | | | | | | |
Industry | | Percentage of
Net Assets | |
Advertising | | 0.5 | % |
Aeorspace/Defense | | 0.3 | |
Agriculture | | 1.1 | |
Apparel | | 0.6 | |
Auto Manufacturers | | 2.0 | |
Auto Parts and Equipment | | 0.9 | |
Banks | | 22.7 | |
Beverages | | 2.8 | |
Building Materials | | 2.2 | |
Chemicals | | 0.8 | |
Commercial Services | | 0.6 | |
Computers | | 0.1 | |
Cosmetics/Personal Care | | 0.0 | |
Distribution/Wholesale | | 0.2 | |
Diversified Financial Services | | 2.0 | |
Electric | | 2.1 | |
Electrical Components and Equipment | | 0.5 | |
Electronics | | 0.7 | |
Engineering and Construction | | 3.6 | |
Entertainment | | 0.8 | |
Environment Control | | 0.1 | |
Food | | 4.1 | |
Food Service | | 0.2 | |
Forest Products and Paper | | 0.2 | |
Hand/Machine Tools | | 0.1 | |
Healthcare - Products | | 0.6 | |
Healthcare - Services | | 0.6 | |
Holding Companies - Diversified | | 2.2 | |
Home Furnishings | | 1.0 | % |
Household Products/Wares | | 0.6 | |
Insurance | | 1.1 | |
Internet | | 0.0 | |
Investment Companies | | 7.5 | |
Leisure Time | | 0.1 | |
Lodging | | 0.1 | |
Machinery - Diversified | | 0.1 | |
Media | | 2.0 | |
Mining | | 2.1 | |
Miscellaneous Manufacturing | | 0.9 | |
Mutual Funds | | 0.2 | |
Office/Business Equipment | | 0.6 | |
Oil and Gas | | 5.8 | |
Pharmaceuticals | | 6.5 | |
Real Estate | | 0.5 | |
Real Estate Investment Trusts | | 0.3 | |
Retail | | 1.9 | |
Semiconductors | | 1.0 | |
Sovereign | | 0.0 | |
Telecommunications | | 5.7 | |
Textiles | | 0.2 | |
Transportation | | 1.2 | |
Water | | 0.1 | |
Securities Lending Collateral | | 2.1 | |
Other Assets and Liabilities, net | | | 5.8 | |
Net Assets | | | 100.0 | % |
See Accompanying Notes to Financial Statements
65
| PORTFOLIO OF INVESTMENTS |
ING INTERNATIONAL FUND | AS OF OCTOBER 31, 2005 |
Shares | | | | Value | |
COMMON STOCK: 96.0% | | | |
| | Australia: 1.2% | | | |
95,500 | | BHP Billiton Ltd. | | $ | 1,480,074 | |
| | | | 1,480,074 | |
| | | | | |
| | Belgium: 1.9% | | | |
14,400 | | Belgacom SA | | 482,353 | |
61,500 | | Fortis | | 1,749,548 | |
| | | | 2,231,901 | |
| | | | | |
| | Brazil: 0.7% | | | |
10,000 | #,L | Cyrela Brazil Realty SA GDR | | 785,881 | |
| | | | 785,881 | |
| | | | | |
| | Canada: 1.7% | | | |
43,406 | | EnCana Corp. | | 1,987,134 | |
| | | | 1,987,134 | |
| | | | | |
| | Denmark: 1.0% | | | |
22,100 | | TDC A/S | | 1,237,784 | |
| | | | 1,237,784 | |
| | Finland: 0.6% | | | |
38,800 | | UPM-Kymmene OYJ | | 749,589 | |
| | | | 749,589 | |
| | | | | |
| | France: 7.3% | | | |
43,500 | @,L | Business Objects SA | | 1,489,658 | |
54,589 | | France Telecom SA | | 1,418,388 | |
18,621 | | Sanofi-Synthelabo SA | | 1,490,994 | |
18,578 | | Societe Generale | | 2,120,735 | |
5,339 | | Total SA | | 1,342,834 | |
7,400 | L | Total SA ADR | | 932,548 | |
| | | | 8,795,157 | |
| | | | | |
| | Germany: 9.5% | | | |
20,007 | | Allianz AG | | 2,819,586 | |
39,700 | | Deutsche Bank AG | | 3,712,340 | |
9,600 | | Henkel KGaA | | 823,314 | |
30,250 | | Schering AG | | 1,864,117 | |
13,974 | | Siemens AG | | 1,038,274 | |
9,200 | | Solarworld AG | | 1,248,874 | |
| | | | 11,506,505 | |
| | | | | |
| | Greece: 0.9% | | | |
35,688 | | Alpha Bank AE | | 1,024,250 | |
| | | | 1,024,250 | |
| | | | | |
| | Hong Kong: 3.5% | | | |
63,000 | L | China Mobile Hong Kong | | | |
| | Ltd. ADR | | 1,414,350 | |
312,000 | | Hong Kong Exchanges and | | | |
| | Clearing Ltd. | | 1,046,157 | |
382,500 | | HongKong Electric Holdings | | 1,808,942 | |
| | | | 4,269,449 | |
| | | | | |
| | Japan: 21.2% | | | |
30,690 | | Acom Co., Ltd. | | 1,994,604 | |
191,000 | | Amada Co., Ltd. | | 1,459,240 | |
166,000 | | Bank of Kyoto Ltd. | | 1,834,988 | |
67,000 | | Komatsu Ltd. | | 892,793 | |
14,400 | | Kyocera Corp. | | 933,974 | |
101 | | Mitsubishi Tokyo Financial | | | |
| | Group, Inc. | | 1,269,468 | |
8,110 | | Nippon Television Network Corp. | | $ | 1,313,019 | |
10,500 | | ORIX Corp. | | 1,968,917 | |
22,000 | | Promise Co., Ltd. | | 1,390,170 | |
341 | @ | Resona Holdings, Inc. | | 988,691 | |
37,200 | | Sankyo Co., Ltd. | | 1,967,160 | |
105,000 | | Sekisui House Ltd. | | 1,307,653 | |
72,000 | | Sharp Corp. | | 988,701 | |
119,000 | | Sumitomo Electric Industries Ltd. | | 1,565,974 | |
59,100 | | Takeda Chemical Industries Ltd. | | 3,239,593 | |
118,000 | | Tokuyama Corp. | | 1,172,282 | |
26,500 | | Toyota Motor Corp. | | 1,228,870 | |
| | | | 25,516,097 | |
| | | | | |
| | Malaysia: 1.8% | | | |
811,500 | | Tenaga Nasional BHD | | 2,149,669 | |
| | | | 2,149,669 | |
| | | | | |
| | Netherlands: 8.4% | | | |
99,919 | | Aegon NV | | 1,505,983 | |
18,229 | | European Aeronautic Defense | | | |
| | and Space Co. | | 631,254 | |
67,533 | | Heineken NV | | 2,139,136 | |
112,823 | | Royal Dutch Shell PLC | | 3,476,990 | |
34,000 | | Unilever NV | | 2,391,027 | |
| | | | 10,144,390 | |
| | | | | |
| | Singapore: 1.0% | | | |
912,000 | @ | Singapore | | | |
| | Telecommunications Ltd. | | 1,255,196 | |
| | | | 1,255,196 | |
| | | | | |
| | South Africa: 0.7% | | | |
76,900 | | JD Group Ltd. | | 824,239 | |
| | | | 824,239 | |
| | | | | |
| | South Korea: 1.4% | | | |
14,830 | | Kookmin Bank | | 846,825 | |
5,350 | @ | NHN Corp. | | 898,043 | |
| | | | 1,744,868 | |
| | | | | |
| | Spain: 1.2% | | | |
49,400 | | Repsol YPF SA | | 1,470,633 | |
| | | | 1,470,633 | |
| | | | | |
| | Sweden: 1.3% | | | |
158,000 | | Nordea AB | | 1,547,759 | |
| | | | 1,547,759 | |
| | | | | |
| | Switzerland: 11.0% | | | |
6,666 | @ | Barry Callebaut AG | | 1,864,617 | |
39,928 | | Credit Suisse Group | | 1,763,678 | |
12,810 | | Nestle SA | | 3,809,103 | |
29,438 | | Novartis AG | | 1,581,150 | |
19,280 | | Novartis AG ADR | | 1,037,650 | |
35,600 | | STMicroelectronics NV | | 585,976 | |
14,086 | | UBS AG | | 1,199,268 | |
59,815 | | Xstrata PLC | | 1,370,578 | |
| | | | 13,212,020 | |
| | | | | |
| | United Kingdom: 18.6% | | | |
19,218 | | AstraZeneca PLC | | 859,846 | |
145,900 | | Barclays PLC | | 1,446,103 | |
278,000 | | BP PLC | | 3,080,080 | |
178,600 | | Cadbury Schweppes PLC | | 1,760,269 | |
See Accompanying Notes to Financial Statements
66
| PORTFOLIO OF INVESTMENTS |
ING INTERNATIONAL FUND | AS OF OCTOBER 31, 2005 (CONTINUED) |
Shares | | | | Value |
| | United Kingdom (continued) | | |
161,261 | | Capita Group PLC | | $ | 1,113,518 |
159,669 | | Gallaher Group PLC | | 2,481,388 |
159,890 | | HBOS PLC | | 2,362,298 |
88,000 | | HSBC Holdings PLC | | 1,382,869 |
43,200 | | Imperial Tobacco Group PLC | | 1,238,188 |
642,100 | | Legal & General Group PLC | | 1,219,770 |
87,953 | | Reed Elsevier PLC | | 803,529 |
61,000 | | Severn Trent PLC | | 1,033,615 |
1,395,849 | | Vodafone Group PLC | | 3,665,343 |
| | | | 22,446,816 |
| | United States: 1.1% | | |
32,200 | L | Newmont Mining Corp. | | 1,371,720 |
| | | | 1,371,720 |
| | Total Common Stock | | |
| | (Cost $107,153,960) | | 115,751,131 |
Principal
Amount | | | | Value | |
| | | | |
SHORT-TERM INVESTMENTS: 7.8% | | | |
| Repurchase Agreement: 3.7% | | | |
$4,462,000 | Deutsche Bank Repurchase Agreement dated 10/31/05, 4.000%, due 11/01/05, $4,462,496 to be received upon repurchase (Collateralized by $4,623,000 Various U.S. Agency Obligations, 5.300%-6.250%, Market Value plus accrued interest $4,551,358, due 08/11/15-10/27/25) | | | 4,462,000 | |
| Total Repurchase Agreement
(Cost $4,462,000) | | 4,462,000 | |
| Securities Lending Collateralcc 4.1% | | | |
4,871,000 | The Bank of New York Institutional | | | |
| Cash Reserves Fund | | 4,871,000 | |
| Total Securities Lending Collateral
(Cost $4,871,000) | | 4,871,000 | |
| Total Short-Term Investment
(Cost $9,333,000) | | 9,333,000 | |
| Total Investments In Securities
(Cost $116,486,960)* | 103.8 | % | | $ | 125,084,131 | |
| Other Assets and
Liabilities-Net | (3.8 | ) | | (4,549,451 | ) |
| Net Assets | 100.0 | % | | $ | 120,534,680 | |
| | | | | | | | | |
Securities may have been fair valued in accordance with procedures approved by the Board of Directors/Trustees (Note 2A).
@ Non-income producing security
ADR American Depositary Receipt
GDR Global Depositary Receipt
cc Securities purchased with cash collateral for securities loaned.
# Securities with purchases pursuant to Rule 144A, under the Securities Act of 1933 and may not be resold subject to that rule except to qualified institutional buyers. These securities have been determined to be liquid under the guidelines established by the Funds’ Board of Directors/Trustees.
L Loaned security, a portion or all of the security is on loan at October 31, 2005.
* Cost for federal income tax purposes is $116,636,141. Net unrealized appreciation consists of:
| Gross Unrealized Appreciation | | | | $ | 11,196,043 | |
| Gross Unrealized Depreciation | | | | (2,748,053 | ) |
| Net Unrealized Appreciation | | | | $ | 8,447,990 | |
| | Percentage of | |
Industry | | Net Assets | |
Aerospace/Defense | | 0.5 | % |
Agriculture | | 3.1 | |
Auto Manufacturers | | 1.0 | |
Banks | | 19.2 | |
Beverages | | 1.8 | |
Chemicals | | 1.0 | |
Commercial Services | | 0.9 | |
Diversified Financial Services | | 5.3 | |
Electric | | 3.3 | |
Electrical Components and Equipment | | 2.1 | |
Electronics | | 0.8 | |
Energy - Alternate Sources | | 1.0 | |
Food | | 8.1 | |
Forest Products and Paper | | 0.6 | |
Home Builders | | 1.1 | |
Household Products/Wares | | 0.7 | |
Insurance | | 4.6 | |
Internet | | 0.7 | |
Leisure Time | | 1.6 | |
Machinery - Diversified | | 1.9 | |
Media | | 1.8 | |
Mining | | 3.5 | |
Miscellaneous Manufacturing | | 0.9 | |
Oil and Gas | | 10.2 | |
Pharmaceuticals | | 8.4 | |
Real Estate | | 0.7 | |
Retail | | 0.7 | |
Semiconductors | | 0.5 | |
Software | | 1.2 | |
Telecommunications | | 7.9 | |
Water | | 0.9 | |
Repurchase Agreement | | 3.7 | |
Securities Lending Collateral | | 4.1 | |
Other Assets and Liabilities, Net | | | (3.8 | ) |
Net Assets | | | 100.0 | % |
See Accompanying Notes to Financial Statements
67
| PORTFOLIO OF INVESTMENTS |
ING INTERNATIONAL SMALLCAP FUND | AS OF OCTOBER 31, 2005 |
Shares | | | | Value | |
COMMON STOCK: 97.7% | | | |
| | Australia: 8.7% | | | |
108,418 | | Adelaide Bank Ltd. | | $ | 1,011,994 | |
194,824 | | Adelaide Brighton Ltd. | | 308,845 | |
27,801 | | Alesco Corp., Ltd. | | 176,792 | |
48,326 | | Alinta Ltd. | | 390,614 | |
19,419 | | Ansell Ltd. | | 153,274 | |
57,400 | @ | ARC Energy Ltd. | | 80,904 | |
107,566 | | Australian Stock Exchange Ltd. | | 2,317,204 | |
259,801 | L | Babcock & Brown Ltd. | | 3,250,276 | |
14,791 | | Bank of Queensland Ltd. | | 154,510 | |
133,221 | @ | Baycorp Advantage Ltd. | | 321,084 | |
53,297 | | Billabong International Ltd. | | 517,057 | |
1,388,024 | @ | Burns Philp & Co., Ltd. | | 1,184,592 | |
3,572 | | Cochlear Ltd. | | 101,698 | |
128,464 | | Corporate Express Australia Ltd. | | 577,724 | |
396,314 | | DB Rreef Trust | | 395,650 | |
146,417 | | Downer EDI Ltd. | | 667,713 | |
148,417 | | Excel Coal Ltd. | | 748,999 | |
248,421 | | Galileo Shopping America Trust | | 211,789 | |
28,900 | | Healthscope Ltd. | | 123,541 | |
28,463 | | Leighton Holdings Ltd. | | 325,512 | |
133,219 | L | MacArthur Coal Ltd. | | 584,251 | |
946,283 | L | Metcash Ltd. | | 2,876,809 | |
216,079 | | Multiplex Group | | 536,001 | |
243,097 | | OneSteel Ltd. | | 642,925 | |
91,084 | | Pacific Brands Ltd. | | 186,431 | |
195,610 | @ | PMP Ltd. | | 231,345 | |
21,461 | | Ramsay Health Care Ltd. | | 141,330 | |
131,233 | L | Record Investments Ltd. | | 753,667 | |
40,447 | | SFE Corp., Ltd. | | 377,221 | |
373,166 | | Smorgon Steel Group Ltd. | | 412,834 | |
21,296 | | Spotless Group Ltd. | | 79,584 | |
153,917 | @ | Tap Oil Ltd. | | 280,642 | |
20,343 | | UNiTAB Ltd. | | 193,898 | |
85,688 | | United Group Ltd. | | 673,821 | |
60,147 | | WorleyParsons Ltd. | | 441,418 | |
2,226,896 | L | Zinifex Ltd. | | 8,134,163 | |
| | | | 29,566,112 | |
| | Austria: 0.2% | | | |
5,442 | | Andritz AG | | 494,135 | |
867 | | Boehler-Uddeholm AG | | 131,422 | |
| | | | 625,557 | |
| | Belgium: 1.1% | | | |
12,633 | | Colruyt SA | | 1,635,460 | |
35,201 | | Compagnie Maritime Belge SA | | 1,171,652 | |
6,088 | | Euronav NV | | 187,393 | |
2,970 | | Omega Pharma SA | | 153,320 | |
3,000 | | Oriflame Cosmetics SA | | 77,398 | |
4,348 | | Umicore | | 434,905 | |
| | | | 3,660,128 | |
| | Canada: 4.0% | | | |
107,900 | | Algoma Steel, Inc. | | 2,113,086 | |
10,500 | | Focus Energy Trust | | 189,606 | |
119,400 | | IPSCO, Inc. | | 8,518,082 | |
5,200 | | Laurentian Bank Of Canada | | 133,797 | |
14,400 | | Northbridge Financial Corp. | | 392,122 | |
7,400 | @,L | Novatel, Inc. | | 211,196 | |
107,000 | @,# | Rona, Inc. | | 1,990,234 | |
3,200 | | Rothmans, Inc. | | 65,435 | |
2,000 | | Vermilion Energy Trust | | 44,322 | |
| | | | 13,657,880 | |
| | | | | |
| | China: 0.5% | | | |
1,958,000 | L | Angang New Steel Co., Ltd. | | $ | 1,065,990 | |
218,000 | | Anhui Expressway Co. | | 110,575 | |
300,000 | | Dongfang Electrical Machinery | | | |
| | Co., Ltd. | | 234,722 | |
82,000 | | FU JI Food and Catering | | | |
| | Services Holdings Ltd. | | 93,501 | |
280,000 | | Tingyi Cayman Islands | | | |
| | Holding Corp. | | 95,713 | |
294,000 | | Travelsky Technology Ltd. | | 253,184 | |
| | | | 1,853,685 | |
| | | | | |
| | Denmark: 3.8% | | | |
9,400 | | Auriga Industries | | 252,391 | |
130 | | D/S Norden | | 58,492 | |
53,250 | L | D/S Torm A/S | | 2,837,302 | |
13,500 | | DSV A/S | | 1,315,289 | |
304,400 | | GN Store Nord | | 3,667,504 | |
67,400 | @ | Jyske Bank | | 3,383,957 | |
4,450 | | NKT Holding A/S | | 174,336 | |
440 | | Sjaelso Gruppen | | 95,349 | |
10,810 | | Sydbank A/S | | 249,861 | |
11,450 | @ | Topdanmark A/S | | 873,000 | |
| | | | 12,907,481 | |
| | | | | |
| | Finland: 0.5% | | | |
12,200 | | Finnair OYJ | | 151,428 | |
95,500 | | Raisio Group PLC | | 244,773 | |
64,400 | | Rautaruukki OYJ | | 1,313,764 | |
| | | | 1,709,965 | |
| | | | | |
| | France: 6.5% | | | |
12,955 | @ | Alten | | 376,989 | |
8,745 | | Bourbon SA | | 706,622 | |
19,122 | | CFF Recycling | | 512,795 | |
301,937 | | Elior | | 3,934,976 | |
825 | | Eramet SLN | | 81,769 | |
6,922 | | Etablissements Maurel et Prom | | 127,844 | |
15,742 | @ | GameLoft | | 104,121 | |
7,244 | | Generale de Sante | | 250,716 | |
6,447 | | Iliad SA | | 343,819 | |
3,280 | | Kaufman & Broad SA | | 243,663 | |
82,583 | | Neopost SA | | 7,962,749 | |
12,798 | | Nexans SA | | 601,540 | |
12,050 | | Nexity | | 549,207 | |
36,340 | @ | Oberthur Card Systems SA | | 319,168 | |
5,447 | | Pinguely-Haulotte | | 98,385 | |
4,982 | | Trigano SA | | 210,478 | |
47,034 | @ | UBISOFT Entertainment | | 2,167,769 | |
7,935 | L | Vallourec | | 3,565,335 | |
| | | | 22,157,945 | |
| | | | | |
| | Germany: 2.9% | | | |
7,475 | | AWD Holding AG | | 200,401 | |
24,228 | | Balda AG | | 276,885 | |
2,043 | | Deutsche Wohnen AG | | 461,260 | |
25,025 | @ | EM.TV AG | | 141,662 | |
20,201 | @ | Lanxess | | 586,989 | |
2,915 | | Leoni AG | | 91,092 | |
8,321 | | MPC Muenchmeyer Petersen | | | |
| | Capital AG | | 588,702 | |
51,923 | | Salzgitter AG | | 2,286,076 | |
1,948 | | Solarworld AG | | 264,436 | |
34,486 | @ | Techem AG | | 1,371,646 | |
See Accompanying Notes to Financial Statements
68
| PORTFOLIO OF INVESTMENTS |
ING INTERNATIONAL SMALLCAP FUND | AS OF OCTOBER 31, 2005 (CONTINUED) |
Shares | | | | Value | |
| | Germany (continued) | | | |
5,000 | | United Internet AG | | $ | 160,642 | |
39,387 | | Wincor Nixdorf AG | | 3,450,463 | |
| | | | 9,880,254 | |
| | | | | |
| | Greece: 1.9% | | | |
110,240 | | Germanos SA | | 1,640,227 | |
9,340 | | Motor Oil Hellas Corinth | | | |
| | Refineries SA | | 201,809 | |
134,600 | | Tsakos Energy Navigation Ltd. | | 4,620,818 | |
| | | | 6,462,854 | |
| | | | | |
| | Hong Kong: 4.0% | | | |
128,000 | L | ASM Pacific Technology | | 594,250 | |
5,480,000 | | Cnpc Hong Kong Ltd. | | 1,070,233 | |
1,408,000 | | Emperor International Holdings | | 312,390 | |
194,000 | | Galaxy Entertainment Group Ltd. | | 106,540 | |
202,000 | L | Jinhui Shipping & | | | |
| | Transportation Ltd. | | 708,874 | |
434,000 | | Midland Realty Holdings | | 211,370 | |
878,000 | | New World Development Ltd. | | 1,086,621 | |
777,200 | L | Orient Overseas | | | |
| | International Ltd. | | 2,479,113 | |
1,659,000 | L | Pacific Basin Shipping Ltd. | | 766,969 | |
6,794,000 | | Solomon Systech | | | |
| | International Ltd. | | 2,506,110 | |
38,000 | | Television Broadcasts Ltd. | | 211,482 | |
8,040,000 | @,L | Titan Petrochemicals Group Ltd. | | 603,700 | |
85,000 | L | Vtech Holdings Ltd. | | 361,826 | |
371,500 | | Wing Hang Bank Ltd. | | 2,542,863 | |
| | | | 13,562,341 | |
| | | | | |
| | Ireland: 0.1% | | | |
44,400 | | C&C Group PLC | | 273,978 | |
2,100 | | FBD Holdings PLC | | 77,251 | |
| | | | 351,229 | |
| | | | | |
| | Italy: 1.5% | | | |
80,569 | | Aedes S.p.A | | 533,760 | |
82,586 | | Astaldi S.p.A. | | 518,044 | |
220,621 | | Banca Finnat Euramerica S.p.A. | | 325,474 | |
13,172 | | Benetton Group S.p.A. | | 139,061 | |
88,052 | | CIR-Compagnie Industriali | | | |
| | Riunite S.p.A. | | 249,199 | |
194,213 | | Cremonini S.p.A. | | 501,662 | |
24,995 | | Davide Campari-Milano S.p.A. | | 169,500 | |
105,140 | L | Esprinet S.p.A. | | 895,240 | |
42,453 | | Marzotto S.p.A. | | 190,048 | |
119,087 | | Milano Assicurazioni S.p.A. | | 744,469 | |
5,018 | | Pirelli & C Real Estate S.p.A. | | 274,720 | |
41,115 | | Sogefi S.p.A. | | 232,541 | |
1,851 | | Tod’s S.p.A. | | 105,803 | |
35,937 | L | Unipol S.p.A. | | 91,821 | |
4,212 | @ | Valentino Fashion Group S.p.A. | | 98,527 | |
| | | | 5,069,869 | |
| | | | | |
| | Japan: 31.2% | | | |
8,900 | L | ABILIT Corp. | | 276,573 | |
7,500 | | Aeon Fantasy Co., Ltd. | | 185,529 | |
42,400 | | Aichi Corp. | | 278,050 | |
26,000 | | Air Water, Inc. | | 237,776 | |
357,600 | | AOC Holdings, Inc. | | 6,616,781 | |
87,000 | L | Asahi Soft Drinks Co., Ltd. | | 967,770 | |
62,000 | | Asics Corp. | | 533,941 | |
24 | | Axell Corp. | | $ | 89,789 | |
95,601 | | Bosch Corp. | | 507,115 | |
15,000 | | Canon Finetech, Inc. | | 301,797 | |
23,000 | | Canon Sales Co., Inc. | | 502,630 | |
24,300 | | Century Leasing System, Inc. | | 325,532 | |
3,000 | @ | Chiba Kogyo Bank Ltd. | | 64,581 | |
961,000 | @ | Chori Co., Ltd. | | 2,244,664 | |
47,000 | L | Cosmo Oil Co., Ltd. | | 228,702 | |
11 | @ | Crayfish Co., Ltd. | | 194,760 | |
711,000 | L | Daiichi Chuo Kisen Kaisha | | 1,571,154 | |
504,200 | @ | DIA Kensetsu Co., Ltd. | | 975,180 | |
59,000 | L | Diamond Lease Co., Ltd. | | 2,739,535 | |
35,800 | L | Eizo Nanao Corp. | | 1,310,469 | |
573 | L | en-japan, Inc. | | 2,440,705 | |
7,700 | | Excel Co., Ltd. | | 171,258 | |
12,400 | | FamilyMart Co., Ltd. | | 368,923 | |
7,500 | | FANCL Corp. | | 366,908 | |
541,000 | | Fuji Fire & Marine Insurance | | | |
| | Co., Ltd. | | 2,147,584 | |
17,700 | | Fuji Machine Manufacturing | | | |
| | Co., Ltd. | | 215,596 | |
209,000 | | Fujikura Ltd. | | 1,352,992 | |
97,500 | | Fujitsu Frontech Ltd. | | 993,310 | |
89,000 | @,L | Fujitsu General Ltd. | | 275,749 | |
222,900 | | Glory Ltd. | | 4,349,516 | |
1,662,500 | @,L | Haseko Corp. | | 5,786,324 | |
12,500 | | Hitachi High-Technologies Corp. | | 290,303 | |
119,000 | | Hodogaya Chemical Co., Ltd. | | 692,569 | |
23,300 | | Hosiden Corp. | | 225,305 | |
3,400 | | HS Securities Co., Ltd. | | 92,036 | |
20,900 | | IBJ Leasing Co., Ltd. | | 407,142 | |
50,000 | @ | Ichiyoshi Securities Co., Ltd | | 536,820 | |
95,000 | L | Iino Kaiun Kaisha Ltd. | | 930,477 | |
38,000 | | Inabata & Co., Ltd. | | 337,794 | |
141,900 | L | Japan General Estate Co., Ltd. | | 2,017,626 | |
69,000 | | Jidosha Buhin Kogyo Co., Ltd | | 424,695 | |
14,900 | | Kanto Auto Works Ltd. | | 217,534 | |
15,200 | | Keihin Corp. | | 338,150 | |
292,000 | | Kenwood Corp. | | 545,410 | |
156,000 | @,L | Kumagai Gumi Co., Ltd. | | 713,062 | |
791,000 | L | Kyoei Tanker Co., Ltd. | | 2,780,467 | |
41,700 | | Makita Corp. | | 968,023 | |
15,100 | L | Mars Engineering Corp. | | 464,153 | |
1,223,000 | | Marubeni Corp. | | 5,732,107 | |
46,000 | | Mitsui-Soko Co., Ltd. | | 256,148 | |
3,900 | | Moshi Moshi Hotline, Inc. | | 369,433 | |
66,000 | | Nabtesco Corp. | | 553,498 | |
231,000 | | Nakayama Steel Works Ltd. | | 1,140,336 | |
11,400 | | NEC Leasing Ltd. | | 229,408 | |
506,000 | L | Nippon Metal Industry Co., Ltd. | | 1,073,424 | |
152,000 | | Nippon Suisan Kaisha Ltd. | | 609,106 | |
367,000 | L | Nippon Yakin Kogyo Co., Ltd. | | 1,372,853 | |
1,004,000 | L | Nissan Diesel Motor Co., Ltd. | | 5,435,411 | |
42,000 | | Nissan Shatai Co., Ltd. | | 293,298 | |
504,000 | | Nisshin Steel Co., Ltd. | | 1,599,985 | |
30,500 | | Nissin Kogyo Co., Ltd. | | 1,363,219 | |
11,900 | | Nitta Corp. | | 160,181 | |
150,000 | | Okuma Corp. | | 1,286,660 | |
374,000 | L | Pacific Metals Co., Ltd. | | 1,629,589 | |
5,900 | | Plenus Co., Ltd. | | 176,190 | |
25,500 | | Point, Inc. | | 1,583,735 | |
38,100 | | Ricoh Leasing Co., Ltd. | | 1,015,224 | |
28 | L | Round One Corp. | | 110,867 | |
25,700 | | Ryohin Keikaku Co., Ltd. | | 1,713,687 | |
See Accompanying Notes to Financial Statements
69
| PORTFOLIO OF INVESTMENTS |
ING INTERNATIONAL SMALLCAP FUND | AS OF OCTOBER 31, 2005 (CONTINUED) |
Shares | | | | Value | |
| | Japan (continued) | | | |
15,000 | | San-Ai Oil Co., Ltd. | | $ | 75,174 | |
79,200 | | Santen Pharmaceutical Co., Ltd. | | 2,021,996 | |
6,000 | | Sanyo Electric Credit Co., Ltd. | | 113,365 | |
9,400 | | Sanyo Shinpan Finance Co., Ltd. | | 684,014 | |
4,100 | | Seijo Corp. | | 112,088 | |
8,600 | | Shinki Co., Ltd. | | 101,436 | |
31,800 | | Shinko Electric Industries | | 1,980,928 | |
396,000 | L | Shinwa Kaiun Kaisha Ltd. | | 1,204,053 | |
46,000 | @ | Sodick Co., Ltd. | | 531,141 | |
13,400 | | STB Leasing Co., Ltd. | | 263,319 | |
22,600 | | Sumisho Lease Co., Ltd. | | 1,074,297 | |
12,000 | | Sumitomo Heavy Industries | | 84,031 | |
16,900 | | Sundrug Co., Ltd. | | 953,937 | |
24,200 | L | Tachi-S Co., Ltd. | | 262,443 | |
58,000 | | Takagi Securities Co., Ltd. | | 239,237 | |
35,400 | L | Tamron Co., Ltd. | | 485,900 | |
87,000 | | TBK Co., Ltd. | | 495,343 | |
96,000 | | Toa Corp. | | 201,570 | |
130,000 | | Toagosei Co., Ltd. | | 659,881 | |
4,900 | | Tocalo Co., Ltd. | | 126,539 | |
47,000 | | Toho Gas Co., Ltd. | | 202,385 | |
26,500 | | Tokyo Leasing Co., Ltd. | | 482,195 | |
3,000 | | Tomen Electronics Corp. | | 73,683 | |
19,000 | @,L | Tomy Co., Ltd. | | 161,850 | |
523,000 | | Tonichi Carlife Group, Inc. | | 3,160,870 | |
191,000 | @,L | Towa Real Estate Development | | | |
| | Co., Ltd. | | 975,389 | |
198,000 | | Toyo Suisan Kaisha Ltd. | | 3,433,584 | |
8,500 | | Trusco Nakayama Corp. | | 194,755 | |
28,000 | | UFJ Central Leasing Co., Ltd. | | 1,550,256 | |
10,100 | | United Arrows Ltd. | | 538,490 | |
158,000 | | Yamato Kogyo Co., Ltd. | | 2,345,515 | |
88,000 | | Yamazen Corp. | | 540,457 | |
20,000 | | Yokogawa Bridge Corp. | | 116,582 | |
25,500 | | Yonekyu Corp. | | 290,348 | |
569,000 | @ | Yuasa Trading Co., Ltd. | | 1,320,930 | |
17,700 | | Yusen Air & Sea Service Co., Ltd. | | 675,048 | |
123 | | Zephyr Co., Ltd. | | 407,148 | |
| | | | 106,447,295 | |
| | | | | |
| | Liechtenstein: 0.0% | | | |
1,170 | | Verwalt & Privat-Bank AG | | 184,354 | |
| | | | 184,354 | |
| | | | | |
| | Malaysia: 0.2% | | | |
120,400 | @ | Digi.Com BHD | | 222,142 | |
86,300 | | Golden Hope Plantations Bhd | | 95,101 | |
698,600 | | Lion Industries Corp. Bhd | | 150,824 | |
24,700 | @ | Shell Refining Co. | | 68,731 | |
| | | | 536,798 | |
| | | | | |
| | Netherlands: 3.6% | | | |
56,678 | | Aalberts Industries NV | | 2,755,483 | |
2,900 | | Athlon Holding NV | | 76,311 | |
52,499 | @ | Axalto Holding NV | | 1,428,504 | |
8,449 | | Boskalis Westminster | | 419,615 | |
7,683 | | Exact Holding NV | | 224,444 | |
25,514 | | Koninklijke BAM Groep NV | | 2,070,584 | |
56,822 | | Nutreco Holding NV | | 2,286,656 | |
65,700 | | Stork NV | | 2,441,438 | |
9,628 | | United Services Group NV | | 310,441 | |
6,212 | | Univar NV | | 249,250 | |
| | | | 12,262,726 | |
| | | | | |
| | New Zealand: 0.2% | | | |
126,091 | | Fletcher Building Ltd. | | $ | 693,804 | |
| | | | 693,804 | |
| | | | | |
| | Norway: 0.0% | | | |
80,000 | | Acta Holding ASA | | 188,310 | |
| | | | 188,310 | |
| | | | | |
| | Papua New Guinea: 1.4% | | | |
1,983,587 | | Oil Search Ltd. | | 4,905,554 | |
| | | | 4,905,554 | |
| | | | | |
| | Portugal: 0.1% | | | |
10,300 | @ | Impresa SGPS | | 57,291 | |
15,805 | | Jeronimo Martins | | 227,633 | |
| | | | 284,924 | |
| | Singapore: 0.7% | | | |
1,516,000 | | Hi-P Intl. Ltd. | | 1,254,416 | |
114,000 | | Jurong Technologies Industrial | | | |
| | Corp., Ltd. | | 131,467 | |
322,000 | @ | SembCorp Industries Ltd. | | 512,600 | |
133,000 | L | Singapore Petroleum Co., Ltd. | | 378,280 | |
| | | | 2,276,763 | |
| | | | | |
| | South Korea: 3.1% | | | |
805,810 | @ | Curitel Communications, Inc. | | 1,402,653 | |
51,850 | | Dongbu Insurance Co., Ltd. | | 654,745 | |
143,450 | | Dongyang Mechatronics Corp. | | 604,449 | |
18,900 | | Halla Engineering & | | | |
| | Construction Corp. | | 511,593 | |
17,450 | | Hanshin Construction Ltd. | | 256,667 | |
34,870 | L | INI Steel Co. | | 783,613 | |
26,960 | | Korean Petrochemical | | | |
| | Industrial Co. | | 797,238 | |
224,050 | @ | KP Chemical Corp. | | 1,202,154 | |
11,030 | | Kyeryong Construction | | | |
| | Industrial Co., Ltd. | | 273,694 | |
44,384 | | People & Telecommunication | | 382,075 | |
1,099,210 | | S&T Dynamics Co., Ltd. | | 1,537,985 | |
28,830 | | SeAH Steel Corp. | | 1,046,922 | |
35,771 | | SFA Engineering Corp. | | 862,212 | |
439,000 | @ | STX Pan Ocean Co., Ltd. | | 231,727 | |
| | | | 10,547,727 | |
| | | | | |
| | Spain: 2.2% | | | |
4,336 | | Abengoa SA | | 71,060 | |
964 | | Cementos Portland | | | |
| | Valderrivas SA | | 73,766 | |
159,555 | L | Fadesa SA | | 5,361,642 | |
8,130 | L | Grupo Empresarial Ence SA | | 257,449 | |
7,442 | | Obrascon Huarte Lain SA | | 104,405 | |
311,074 | @ | Tubacex SA | | 1,304,652 | |
88,700 | L | Uralita SA | | 403,983 | |
| | | | 7,576,957 | |
| | | | | |
| | Sweden: 0.9% | | | |
172,800 | L | Eniro AB | | 1,889,611 | |
15,500 | | JM AB | | 644,145 | |
29,400 | @ | Lundin Petroleum AB | | 296,847 | |
20,000 | | Trelleborg AB | | 306,775 | |
| | | | 3,137,378 | |
See Accompanying Notes to Financial Statements
70
| PORTFOLIO OF INVESTMENTS |
ING INTERNATIONAL SMALLCAP FUND | AS OF OCTOBER 31, 2005 (CONTINUED) |
Shares | | | | Value | |
| | Switzerland: 3.4% | | | |
1,490 | @ | Actelion NV | | $ | 167,349 | |
1,339 | | AFG Arbonia-Forster Holding | | 363,399 | |
109,974 | | Baloise Holding Ltd. | | 5,596,095 | |
1,295 | @ | Barry Callebaut AG | | 362,238 | |
4,540 | | Bucher Industries AG | | 362,182 | |
9,597 | | Charles Voegele Holding AG | | 700,112 | |
3,448 | | Geberit AG | | 2,385,861 | |
80 | | Hiestand Holding AG | | 61,785 | |
16,911 | | Phonak Holding AG | | 704,220 | |
815 | | SGS SA | | 599,784 | |
7,707 | | Vontobel Holding AG | | 216,081 | |
| | | | 11,519,106 | |
| | | | | |
| | Taiwan: 0.6% | | | |
1,697,440 | | Micro-Star International Co., Ltd. | | 863,993 | |
310,000 | | ProMOS Technologies, Inc. | | 81,610 | |
289,000 | | Quanta Storage, Inc. | | 387,144 | |
656,000 | | U-Ming Marine Transport Corp. | | 649,241 | |
277,000 | | Vanguard International | | | |
| | Semiconductor Corp. | | 180,579 | |
| | | | 2,162,567 | |
| | | | | |
| | Thailand: 0.1% | | | |
3,071,600 | | Charoen Pokphand Foods PCL | | 395,644 | |
| | | | 395,644 | |
| | Turkey: 2.9% | | | |
55,760 | | Aksa Akrilik Kimya Sanayii | | 485,033 | |
15,000 | | Anadolu Efes Biracilik Ve Malt | | | |
| | Sanayii AS | | 367,792 | |
181,497 | @ | Ayen Enerji | | 290,724 | |
297,293 | @ | Beko Elektronik | | 484,880 | |
186,274 | | Bolu Cimento Sanayii | | 347,062 | |
276,306 | | Bossa Ticaret Sanayi Isletme | | 231,762 | |
203,000 | @ | Dogan Sriketler Grubu Holdings | | 511,301 | |
310,212 | | Doktas Dokumculuk Ticaret | | 377,783 | |
34,270 | @ | Efes Sinai Yatirim Holding AS | | 347,523 | |
84,919 | | Eregli Demir ve Celik | | | |
| | Fabrikalari TAS | | 459,172 | |
28,916 | @ | Goodyear Lastikleri TAS | | 282,469 | |
746,616 | | Ihlas Holding | | 439,626 | |
64,236 | | Mardin Cimento Sanayii | | 289,192 | |
264,065 | @ | Park Elektrik Madencilik | | | |
| | Sanayi Ve Ticaret AS | | 970,736 | |
443,805 | @ | Petrol Ofisi | | 1,541,582 | |
172,470 | @ | TAT Konserve | | 252,330 | |
32,350 | @ | Turcas Petrolculuk AS | | 202,740 | |
61,364 | | Turk Ekonomi Bankasi AS | | 739,947 | |
274,917 | | Turk Sise Ve Cam Fabrikalari | | 797,080 | |
126,602 | @ | Vestel Elektronik Sanayi | | 443,377 | |
| | | | 9,862,111 | |
| | | | | |
| | United Kingdom: 11.3% | | | |
52,740 | | Admiral Group PLC | | 408,132 | |
35,723 | | Aggreko PLC | | 151,261 | |
211,837 | | Amlin PLC | | 832,969 | |
257,529 | @ | Ashtead Group PLC | | 642,837 | |
61,968 | | Body Shop International PLC | | 230,356 | |
33,832 | | Bodycote International | | 135,709 | |
348,206 | | BPB PLC | | 4,504,112 | |
30,287 | | Britannic Group PLC | | 317,500 | |
85,799 | | Burren Energy PLC | | 1,216,282 | |
21,962 | | Cranswick PLC | | 235,102 | |
41,100 | | Dairy Crest Group PLC | | $ | 327,905 | |
93,479 | @ | Dana Petroleum PLC | | 1,365,645 | |
88,334 | | De Vere Group PLC | | 935,994 | |
125,613 | | First Choice Holidays PLC | | 434,383 | |
34,500 | @ | Gyrus Group PLC | | 195,198 | |
919,865 | | HMV Group PLC | | 3,065,301 | |
47,900 | | Inchcape PLC | | 1,748,659 | |
43,900 | | Intertek Group PLC | | 553,956 | |
976,048 | @,L | Jazztel PLC | | 1,135,061 | |
53,697 | | London Stock Exchange PLC | | 538,568 | |
133,703 | | Man Group PLC | | 3,647,127 | |
176,367 | | Mcbride PLC | | 474,769 | |
71,677 | | Michael Page International PLC | | 293,180 | |
56,010 | @ | NETeller PLC | | 683,799 | |
22,041 | | Northgate PLC | | 390,282 | |
110,623 | | Paragon Group of | | | |
| | Companies LLC | | 997,880 | |
686,950 | | Pendragon PLC | | 4,649,938 | |
203,829 | | SIG PLC | | 2,455,451 | |
217,200 | | Somerfield PLC | | 749,077 | |
249,600 | | Sportingbet PLC | | 1,326,037 | |
48,586 | | Stanley Leisure PLC | | 522,338 | |
14,550 | | Stolt-Nielsen SA | | 519,041 | |
399,772 | | Taylor Woodrow PLC | | 2,216,705 | |
57,039 | | TT electronics PLC | | 148,303 | |
20,988 | | Ultra Electronics Holdings | | 327,073 | |
| | | | 38,375,930 | |
| | | | | |
| | Venezuela: 0.1% | | | |
21,600 | | Cia Anonima Nacional | | | |
| | Telefonos de Venezuela ADR | | 278,640 | |
| | | | 278,640 | |
| | Total Common Stock | | | |
| | (Cost $292,540,849) | | 333,101,888 | |
PREFERRED STOCK: 0.2% | | | |
| | Italy: 0.2% | | | |
41,454 | | Instituto Finanziario Industriale | | | |
| | S.p.A. | | 655,884 | |
| | | | 655,884 | |
| | Total Preferred Stock | | | |
| | (Cost $612,281) | | 655,884 | |
RIGHTS: 0.0% | | | |
| | Australia: 0.0% | | | |
3,612 | | Healthscope Ltd. | | 1,619 | |
| | | | 1,619 | |
| | Total Rights (Cost $-) | | 1,619 | |
| | Total Long-Term Investments | | | |
| | (Cost $293,153,130) | | 333,759,396 | |
See Accompanying Notes to Financial Statements
71
| PORTFOLIO OF INVESTMENTS |
ING INTERNATIONAL SMALLCAP FUND | AS OF OCTOBER 31, 2005 (CONTINUED) |
Principal
Amount | | | | Value | |
SHORT-TERM INVESTMENTS: 16.9% | | | |
| Securities Lending Collateralcc 16.9% | | | |
$57,748,000 | The Bank of New York Institutional | | | |
| Cash Reserves Fund | | $ | 57,748,000 | |
| Total Short-Term Investments | | | |
| (Cost $57,748,000) | | 57,748,000 | |
| Total Investments In Securities | | | |
| (Cost $350,901,130)* | | 114.8 | % | $ | 391,507,396 | |
| Other Assets and
Liabilities-Net | | (14.8 | ) | (50,497,796 | ) |
| Net Assets | | 100.0 | % | $ | 341,009,600 | |
| | | | | | | | |
Securities may have been fair valued in accordance with procedures approved by the Board of Directors/Trustees (Note 2A).
@ Non-income producing security
ADR American Depositary Receipt
cc Securities purchased with cash collateral for securities loaned.
# Securities with purchases pursuant to Rule 144A, under the Securities Act of 1933 and may not be resold subject to that rule except to qualified institutional buyers. These securities have been determined to be liquid under the guidelines established by the Funds’ Board of Directors/Trustees.
L Loaned security, a portion or all of the security is on loan at October 31, 2005.
* Cost for federal income tax purposes is $351,405,893. Net unrealized appreciation consists of:
| Gross Unrealized Appreciation | | | | $ | 56,506,417 | |
| Gross Unrealized Depreciation | | | | (16,404,914 | ) |
| Net Unrealized Appreciation | | | | $ | 40,101,503 | |
Industry | | Percentage of
Net Assets | |
Advertising | | 0.1 | % |
Agriculture | | 0.2 | |
Airlines | | 0.0 | |
Apparel | | 0.4 | |
Auto Manufacturers | | 1.7 | |
Auto Parts and Equipment | | 1.8 | |
Banks | | 2.6 | |
Beverages | | 0.6 | |
Building Materials | | 3.4 | |
Chemicals | | 1.6 | |
Coal | | 0.4 | |
Commercial Services | | 1.1 | |
Computers | | 2.0 | |
Cosmetics/Personal Care | | 0.2 | |
Distribution/Wholesale | | 4.1 | |
Diversified Financial Services | | 6.9 | |
Electric | | 0.4 | |
Electrical Components and Equipment | | 0.8 | |
Electronics | | 1.5 | |
Energy - Alternate Sources | | 0.1 | |
Engineering and Construction | | 2.6 | |
Entertainment | | 0.6 | |
Food | | 4.5 | |
Food Service | | 1.2 | |
Forest Products and Paper | | 0.1 | |
Gas | | 0.2 | |
Hand Machines/Tools | | 0.3 | |
Healthcare - Products | | 0.3 | |
Healthcare - Services | | 0.1 | % |
Holding Companies - Diversification | | 0.5 | |
Home Builders | | 2.5 | |
Home Furnishings | | 0.5 | |
Housewares | | 0.6 | |
Insurance | | 3.5 | |
Internet | | 0.9 | |
Iron/Steel | | 7.6 | |
Leisure Time | | 0.4 | |
Lodging | | 0.3 | |
Machinery - Construction and Mining | | 0.1 | |
Machinery - Diversified | | 1.9 | |
Media | | 0.8 | |
Metal Fabricate/Hardware | | 2.1 | |
Mining | | 2.9 | |
Miscellaneous Manufacturing | | 3.0 | |
Office/Business Equipment | | 2.4 | |
Oil and Gas | | 5.0 | |
Oil and Gas Services | | 0.4 | |
Pharmaceuticals | | 0.7 | |
Real Estate | | 3.9 | |
Retail | | 6.6 | |
Semiconductors | | 1.6 | |
Software | | 0.8 | |
Storage/Warehousing | | 0.1 | |
Telecommunications | | 2.2 | |
Textiles | | 0.1 | |
Toys/Games/Hobbies | | 0.0 | |
Transportation | | 6.7 | |
Securities Lending Collateral | | 16.9 | |
Other Assets and Liabilities, Net | | | (14.8 | ) |
Net Assets | | | 100.0 | % |
See Accompanying Notes to Financial Statements
72
| PORTFOLIO OF INVESTMENTS |
ING INTERNATIONAL VALUE FUND | AS OF OCTOBER 31, 2005 |
Shares | | | | Value | |
COMMON STOCK: 99.0% | | | |
| | Belgium: 0.9% | | | |
959,210 | | Interbrew | | $ | 38,296,431 | |
| | | | 38,296,431 | |
| | Brazil: 4.3% | | | |
9,510,883 | | Centrais Eletricas | | | |
| | Brasileiras SA ADR | | 83,189,790 | |
3,741,386 | @,L | Contax Participacoes SA ADR | | 2,823,998 | |
179,388 | L | Tele Centro Oeste Celular | | | |
| | Participacoes SA ADR | | 1,623,461 | |
13,898 | L | Tele Leste Celular | | | |
| | Participacoes SA ADR | | 85,056 | |
2,532,786 | L | Tele Norte Leste | | | |
| | Participacoes SA ADR | | 44,830,312 | |
1,208,600 | L | Telecomunicacoes | | | |
| | Brasileiras SA ADR | | 40,270,552 | |
169,474 | @,L | Telesp Celular | | | |
| | Participacoes SA ADR | | 618,580 | |
111,928 | L | Tim Participacoes SA ADR | | 2,268,781 | |
| | | | 175,710,530 | |
| | | | | |
| | Canada: 0.6% | | | |
12,138,000 | | Bombardier, Inc. | | 25,623,009 | |
| | | | 25,623,009 | |
| | | | | |
| | France: 5.1% | | | |
7,228,100 | @ | Alcatel SA | | 84,894,071 | |
610,400 | | Carrefour SA | | 27,131,872 | |
2,404,100 | | France Telecom SA | | 62,465,838 | |
422,650 | | Sanofi-Synthelabo SA | | 33,841,817 | |
| | | | 208,333,598 | |
| | | | | |
| | Germany: 11.4% | | | |
2,160,893 | | Commerzbank AG | | 56,439,691 | |
2,268,600 | | DaimlerChrysler AG | | 113,349,315 | |
6,906,200 | | Deutsche Telekom AG | | 122,066,408 | |
1,150,000 | | Heidelberger Druckmaschinen | | 36,514,810 | |
411,200 | | Hypo Real Estate Holding | | 19,825,718 | |
326,500 | | Muenchener | | | |
| | Rueckversicherungs AG | | 38,310,355 | |
359,298 | | Schering AG | | 22,141,269 | |
981,217 | L | Volkswagen AG | | 53,554,334 | |
| | | | 462,201,900 | |
| | | | | |
| | Hong Kong: 0.6% | | | |
1,624,636 | | Jardine Matheson | | | |
| | Holdings Ltd. | | 25,701,314 | |
| | | | 25,701,314 | |
| | | | | |
| | Italy: 3.5% | | | |
10,705,782 | | Banca Intesa S.p.A. | | 49,976,404 | |
10,329,085 | | Telecom Italia S.p.A. | | 29,876,874 | |
11,513,600 | | UniCredito Italiano S.p.A. | | 63,832,363 | |
| | | | 143,685,641 | |
| | | | | |
| | Japan: 26.2% | | | |
3,873,136 | | Daiichi Sankyo Co., Ltd. | | 70,205,893 | |
517,800 | | Fuji Photo Film Co., Ltd. | | 16,476,619 | |
12,859,700 | | Hitachi Ltd. | | 79,190,162 | |
4,749 | | Japan Tobacco, Inc. | | 75,081,036 | |
4,914,000 | | Matsushita Electric | | | |
| | Industrial Co., Ltd. | | 90,055,162 | |
5,925 | | Millea Holdings, Inc. | | 107,195,573 | |
26,907,000 | | Mitsubishi Heavy | | | |
| | Industries Ltd. | | 101,677,662 | |
8,334 | | Mitsubishi Tokyo Financial | | | |
| | Group, Inc. | | $ | 104,749,968 | |
4,932,000 | | Mitsui Sumitomo | | | |
| | Insurance Co., Ltd. | | 63,156,323 | |
13,125 | | Nippon Telegraph & | | | |
| | Telephone Corp. | | 62,740,348 | |
1,049,000 | | Ono Pharmaceutical Co., Ltd. | | 46,696,989 | |
2,592,400 | | Sony Corp. | | 84,696,904 | |
9,029 | | Sumitomo Mitsui Financial | | | |
| | Group, Inc. | | 83,390,412 | |
509,000 | | TDK Corp. | | 34,321,149 | |
1,153,800 | | Yamanouchi | | | |
| | Pharmaceutical Co., Ltd. | | 41,214,893 | |
| | | | 1,060,849,093 | |
| | | | | |
| | Mexico: 1.5% | | | |
2,942,320 | L | Telefonos de Mexico SA de | | | |
| | CV ADR | | 59,376,018 | |
| | | | 59,376,018 | |
| | Netherlands: 8.8% | | | |
5,693,688 | | Aegon NV | | 85,815,472 | |
1,737,200 | | Akzo Nobel NV | | 75,048,930 | |
9,907,141 | @ | Koninklijke Ahold NV | | 69,090,899 | |
1,188,700 | | Unilever NV | | 83,594,530 | |
2,303,184 | | Wolters Kluwer NV | | 42,707,127 | |
| | | | 356,256,958 | |
| | New Zealand: 1.4% | | | |
13,335,944 | | Telecom Corp. of | | | |
| | New Zealand Ltd. | | 54,510,038 | |
| | | | 54,510,038 | |
| | Portugal: 1.5% | | | |
6,709,676 | | Portugal Telecom SGPS SA | | 60,634,279 | |
| | | | 60,634,279 | |
| | Singapore: 3.3% | | | |
3,652,191 | | DBS Group Holdings Ltd. | | 33,028,164 | |
6,060,800 | # | DBS Group Holdings Ltd. ADR | | 54,690,235 | |
12,232,800 | | Oversea-Chinese Banking Corp. | | 45,495,324 | |
| | | | 133,213,723 | |
| | South Korea: 3.6% | | | |
1,463,610 | | Korea Electric Power Corp. | | 47,878,231 | |
2,745,880 | | Korea Electric Power | | | |
| | Corp. ADR | | 44,840,220 | |
183,200 | | KT Corp. | | 7,420,570 | |
2,192,310 | | KT Corp. ADR | | 47,244,281 | |
| | | | 147,383,302 | |
| | Spain: 4.6% | | | |
1,816,233 | | Banco Bilbao Vizcaya | | | |
| | Argentaria SA | | 32,009,277 | |
3,107,600 | | Banco Santander Central | | | |
| | Hispano SA | | 39,549,526 | |
7,078,302 | | Telefonica SA | | 112,920,298 | |
| | | | 184,479,101 | |
| | Switzerland: 6.3% | | | |
568,600 | | Nestle SA | | 169,075,402 | |
91,700 | | Swisscom AG | | 30,122,902 | |
328,715 | @ | Zurich Financial Services AG | | 55,975,744 | |
| | | | 255,174,048 | |
See Accompanying Notes to Financial Statements
73
| PORTFOLIO OF INVESTMENTS |
ING INTERNATIONAL VALUE FUND | AS OF OCTOBER 31, 2005 (CONTINUED) |
Shares | | | | Value | |
| | United Kingdom: 15.1% | | | |
12,269,781 | | BT Group PLC | | $ | 46,195,543 | |
48,322,582 | | Corus Group PLC | | 40,940,474 | |
3,882,800 | | GlaxoSmithKline PLC | | 101,004,681 | |
6,054,090 | | Imperial Chemical | | | |
| | Industries PLC | | 30,835,153 | |
78,261,262 | @ | Invensys PLC | | 18,005,194 | |
10,163,000 | | ITV PLC | | 18,720,353 | |
8,159,200 | | J Sainsbury Plc | | 40,312,262 | |
11,046,451 | | Marks & Spencer Group PLC | | 81,675,631 | |
32,163,031 | | Morrison WM Supermarkets | | 93,136,495 | |
35,348,000 | | Royal & Sun Alliance | | | |
| | Insurance Group | | 60,185,375 | |
8,253,700 | | Unilever PLC | | 83,517,435 | |
| | | | 614,528,596 | |
| | Venezuela: 0.4% | | | |
1,216,822 | | Cia Anonima Nacional | | | |
| | Telefonos de Venezuela ADR | | 15,697,004 | |
| | | | 15,697,004 | |
| | Total Common Stock | | | |
| | (Cost $3,467,551,238) | | 4,021,654,583 | |
| | | | | | |
Principal
Amount | | | | Value | |
SHORT-TERM INVESTMENTS: 2.6% | | | |
| Securities Lending Collateralcc 2.6% | | | |
$104,511,000 | The Bank of New York Institutional | | | |
| Cash Reserves Fund | | 104,511,000 | |
| Total Short-Term Investments | | | |
| (Cost $104,511,000) | | 104,511,000 | |
| Total Investments In Securities | | | |
| (Cost $3,572,062,238)* | | 101.7 | % | $ | 4,126,165,583 | |
| Other Assets and | | | | | |
| Liabilities-Net | | (1.7 | ) | (69,549,673 | ) |
| Net Assets | | 100.0 | % | $ | 4,056,615,910 | |
| | | | | | | | |
Securities may have been fair valued in accordance with procedures approved by the Board of Directors/Trustees (Note 2A).
@ Non-income producing security
ADR American Depositary Receipt
cc Securities purchased with cash collateral for securities loaned.
# Securities with purchases pursuant to Rule 144A, under the Securities Act of 1933 and may not be resold subject to that rule except to qualified institutional buyers. These securities have been determined to be liquid under the guidelines established by the Funds’ Board of Directors/Trustees.
L Loaned security, a portion or all of the security is on loan at October 31, 2005.
* Cost for federal income tax purposes is $3,580,831,246. Net unrealized appreciation consists of:
| Gross Unrealized Appreciation | | | | $ | 793,022,459 | |
| Gross Unrealized Depreciation | | | | (247,688,122 | ) |
| Net Unrealized Appreciation | | | | $ | 545,334,337 | |
Industry | | Percentage of
Net Assets | |
Agriculture | | 1.9 | % |
Auto Manufacturers | | 4.1 | |
Banks | | 14.4 | |
Beverages | | 0.9 | |
Chemicals | | 2.6 | |
Computers | | 0.9 | |
Electric | | 4.3 | |
Electrical Components and Equipment | | 2.0 | |
Food | | 13.9 | |
Holding Companies - Diversified | | 0.6 | |
Home Furnishings | | 4.3 | |
Insurance | | 10.1 | |
Iron/Steel | | 1.0 | |
Machinery - Diversified | | 0.9 | |
Media | | 1.5 | |
Miscellaneous Manufacturing | | 4.0 | |
Pharmaceuticals | | 7.8 | |
Retail | | 2.0 | |
Telecommunications | | 21.9 | |
Securities Lending Collateral | | 2.6 | |
Other Assets and Liabilities, Net | | (1.7 | ) |
Net Assets | | 100.0 | % |
See Accompanying Notes to Financial Statements
74
SHAREHOLDER MEETING INFORMATION (UNAUDITED)
A special meeting of shareholders of the ING Mutual Funds was held January 25, 2005, at the offices of ING Funds, 7337 East Doubletree Ranch Road, Scottsdale, AZ 85258.
A brief description of each matter voted upon as well as the results are outlined below:
Matters:
1 To approve a new Sub-Advisory Agreement for the Fund between ING Investments, LLC, the Fund’s investment adviser, and NWQ Investment Management Company, LLC, with no change in the Adviser or the overall management fee paid by the Fund;
2 To approve a change in the Fund’s fundamental investment objective of “maximum long-term capital appreciation” to a non-fundamental investment objective of “long-term capital appreciation”;
3 To approve a “Manager-of-Managers” arrangement for the Fund to permit ING Investments, LLC, in its capacity as the Fund’s investment adviser, subject to approval by the Board of Trustees of the Trust, to enter into and materially amend agreements with sub-advisers without obtaining the approval of the Fund’s shareholders; and
4 To transact such other business, not currently contemplated, that may properly come before the Special Meeting or any adjournment(s) or postponement(s) thereof in the discretion of the proxies or their substitutes.
Results:
| | | | | | Shares voted | | | | | | | |
| | | | | | against or | | Shares | | Broker | | Total shares | |
| | Proposal | | Shares voted for | | withheld | | abstained | | non-vote | | voted | |
| | | | | | | | | | | | | |
Global Value Choice | | 1 | | 3,683,424 | | 82,286 | | 86,342 | | — | | 3,852,052 | |
| | 2 | | 2,417,535 | | 131,702 | | 87,599 | | 1,215,216 | | 3,852,052 | |
| | 3 | | 2,349,159 | | 199,679 | | 87,998 | | 1,215,216 | | 3,852,052 | |
| | 4 | | 3,607,720 | | 131,362 | | 112,970 | | — | | 3,852,052 | |
* Proposals 1 and 4 passed at this meeting. The Shareholder Meeting was adjourned to January 27th for Proposals 2 and 3.
A special meeting of shareholders of the ING Mutual Funds was held January 27, 2005, at the offices of ING Funds, 7337 East Doubletree Ranch Road, Scottsdale, AZ 85258.
A brief description of each matter voted upon as well as the results are outlined below:
Matters:
1 To approve a new Sub-Advisory Agreement for the Fund between ING Investments, LLC, the Fund’s investment adviser, and NWQ Investment Management Company, LLC, with no change in the Adviser or the overall management fee paid by the Fund;
2 To approve a change in the Fund’s fundamental investment objective of “maximum long-term capital appreciation” to a non-fundamental investment objective of “long-term capital appreciation”;
3 To approve a “Manager-of-Managers” arrangement for the Fund to permit ING Investments, LLC, in its capacity as the Fund’s investment adviser, subject to approval by the Board of Trustees of the Trust, to enter into and materially amend agreements with sub-advisers without obtaining the approval of the Fund’s shareholders; and
4 To transact such other business, not currently contemplated, that may properly come before the Special Meeting or any adjournment(s) or postponement(s) thereof in the discretion of the proxies or their substitutes.
75
SHAREHOLDER MEETING INFORMATION (UNAUDITED) (CONTINUED)
Results:
| | | | | | Shares voted | | | | | | | |
| | | | | | against or | | Shares | | Broker | | Total shares | |
| | Proposal | | Shares voted for | | withheld | | abstained | | non-vote | | voted | |
| | | | | | | | | | | | | |
Global Value Choice | | 1 | | 3,494,048 | | 88,104 | | 88,313 | | — | | 3,670,465 | |
| | 2 | | 2,549,805 | | 139,949 | | 88,619 | | 892,092 | | 3,670,465 | |
| | 3 | | 2,478,227 | | 211,288 | | 88,858 | | 892,092 | | 3,670,465 | |
| | 4 | | 3,416,414 | | 139,062 | | 114,989 | | — | | 3,670,465 | |
A special meeting of shareholders of the ING Mutual Funds was held February 15, 2005, at the offices of ING Funds, 7337 East Doubletree Ranch Road, Scottsdale, AZ 85258.
A brief description of each matter voted upon as well as the results are outlined below:
Matters:
1 To approve a new Sub-Advisory Agreement for the Fund between ING Investments, LLC, the Fund’s investment adviser, and Brandes Investment Partners, L.P., with no change in the Adviser or the overall management fee paid by the Fund;
2 To approve a new Sub-Advisory Agreement for the Fund between ING Investments, LLC, the Fund’s investment adviser, and Acadian Asset Management, Inc., with no change in the Adviser or the overall management fee paid by the Fund;
3 To approve a “Manager-of-Managers” arrangement for the Fund to permit ING Investments, LLC, in its capacity as the Fund’s investment adviser, subject to approval by the Board of Trustees of the Trust, to enter into and materially amend agreements with sub-advisers without obtaining the approval of the Fund’s shareholders; and
4 To transact such other business, not currently contemplated, that may properly come before the Special Meeting or any adjournment(s) or postponement(s) thereof in the discretion of the proxies or their substitutes.
Results:
| | | | | | Shares voted | | | | | | | |
| | | | | | against or | | Shares | | Broker | | Total shares | |
| | Proposal | | Shares voted for | | withheld | | abstained | | non-vote | | voted | |
| | | | | | | | | | | | | |
Emerging Countries | | 1 | | 2,736,451 | | 72,825 | | 68,949 | | — | | 2,878,225 | |
| | 3 | | 1,966,239 | | 219,234 | | 77,598 | | 615,154 | | 2,878,225 | |
| | 4 | | 2,663,854 | | 117,793 | | 96,578 | | — | | 2,878,225 | |
International SmallCap | | 2 | | 5,613,886 | | 134,447 | | 113,433 | | — | | 5,861,767 | |
| | 3 | | 4,099,257 | | 335,066 | | 142,665 | | 1,284,779 | | 5,861,767 | |
| | 4 | | 5,474,858 | | 225,517 | | 161,391 | | — | | 5,861,767 | |
76
TAX INFORMATION (UNAUDITED)
Dividends paid during the year ended October 31, 2005 were as follows:
Fund Name | | | Type | | Per Share Amount | |
ING Global Real Estate Fund | | | | | |
Class A | | NII | | $0.5377 | |
Class B | | NII | | $0.4483 | |
Class C | | NII | | $0.4464 | |
Class I | | NII | | $0.2816 | |
Class Q | | NII | | $0.5818 | |
All Classes | | STCG | | $0.6655 | |
All Classes | | LTCG | | $0.2529 | |
ING Emerging Countries Fund | | | | | |
Class A | | NII | | $0.0181 | |
Class Q | | NII | �� | $0.0308 | |
ING International Fund | | | | | |
Class A | | NII | | $0.1031 | |
Class B | | NII | | $0.0475 | |
Class C | | NII | | $0.0413 | |
Class I | | NII | | $0.1486 | |
Class Q | | NII | | $0.1244 | |
Fund Name | | | Type | | Per Share Amount | |
International Value Fund | | | | | |
Class A | | NII | | $0.2225 | |
Class B | | NII | | $0.1096 | |
Class C | | NII | | $0.1105 | |
Class I | | NII | | $0.2926 | |
Class Q | | NII | | $0.2486 | |
All Classes | | LTCG | | $0.8046 | |
NII — Net investment income
STCG — Short-term capital gain
LTCG — Long-term capital gain
Of the ordinary distributions made during the year ended October 31, 2005, the following percentages qualify for the dividends received deduction available to corporate shareholders:
International | | 1.16 | % |
International Value | | 2.68 | % |
For the year ended October 31, 2005, the following are percentages of net investment income dividends paid by the Funds that are designated as qualifying dividend income (QDI) subject to reduced income tax rates for individuals:
Emerging Countries | | 100.00 | % |
International | | 100.00 | % |
International Value | | 100.00 | % |
Pursuant to Section 853 of the Internal Revenue Code, the Funds designate the following amounts as foreign taxes paid for the year ended October 31, 2005:
| | Foreign Taxes | | Per Share | |
| | Paid | | Amount | |
Emerging Countries | | $ | 214,119 | | | $0.0378 | |
International | | $ | 247,515 | | | $0.0223 | |
International Small Cap | | $ | 576,111 | | | $0.0643 | |
International Value | | $ | 8,724,737 | | | $0.0392 | |
Above figures may differ from those cited elsewhere in this report due to differences in the calculation of income and gains under accounting principles generally accepted in the United States of America (book) purposes and Internal Revenue Service (tax) purposes.
Shareholders are strongly advised to consult their own tax advisers with respect to the tax consequences of their investments in the Funds. In January, shareholders, excluding corporate shareholders, receive an IRS 1099-DIV regarding the federal tax status of the dividends and distributions they received in the calendar year.
77
TRUSTEE AND OFFICER INFORMATION (UNAUDITED)
The business and affairs of the Funds are managed under the direction of the Funds’ Board of Trustees. A Trustee who is not an interested person of the Trusts, as defined in the 1940 Act, is an independent trustee (“Independent Trustee”). The Trustees and Officers of the Funds are listed below. The Statement of Additional Information includes additional information about trustees of the Registrant and is available, without charge, upon request at 1-800-992-0180.
Name, Address
and Age | | Position(s)
Held with
Trust | | Term of
Office and
Length of
Time
Served(1) | | Principal
Occupation(s)
During the
Past Five Years | | Number of
Portfolios in
Fund Complex
Overseen
by Trustee | | Other
Directorships
Held by
Trustee |
Independent Trustees: | | | | | | | | | | |
| | | | | | | | | | |
John V. Boyer(3)
7337 E. Doubletree Ranch Rd.
Scottsdale, Arizona 85258
Age: 52 | | Trustee | | January
2005 - Present | | Executive Director, The Mark Twain House & Museum(2) (September 1989 - Present). | | 162 | | None |
| | | | | | | | | | |
J. Michael Earley(4)
7337 E. Doubletree Ranch Rd.
Scottsdale, Arizona 85258
Age : 60 | | Trustee | | February 2001 - Present | | President and Chief Executive Officer, Bankers Trust Company, N.A. (June 1992 - Present). | | 162 | | None |
| | | | | | | | | | |
R. Barbara Gitenstein(3)
7337 E. Doubletree Ranch Rd.
Scottsdale, Arizona 85258
Age : 57 | | Trustee | | February 2002 - Present | | President, College of New Jersey (January 1999 - Present). | | 162 | | None |
| | | | | | | | | | |
Patrick W. Kenny(4)
7337 E. Doubletree Ranch Rd.
Scottsdale, Arizona 85258
Age : 62 | | Trustee | | January 2005 - Present | | President and Chief Executive Officer International Insurance Society (June 2001 - Present). Formerly, Executive Vice President, Frontier Insurance Group, Inc. (September 1998 - March 2001). | | 162 | | Assured Guaranty Ltd. (November 2003 - Present). |
| | | | | | | | | | |
Walter H. May(3)
7337 E. Doubletree Ranch Rd.
Scottsdale, Arizona 85258
Age : 68 | | Trustee | | October 1999 - Present | | Retired. | | 162 | | BestPrep (September 1991 - Present). |
| | | | | | | | | | |
Jock Patton(3)
7337 E. Doubletree Ranch Rd.
Scottsdale, Arizona 85258 Age : 59 | | Chairman and Trustee | | May 1999 - Present | | Private Investor (June 1997 - Present). Formerly, Director and Chief Executive Officer, Rainbow Multimedia Group, Inc. (January 1999 - December 2001). | | 162 | | JDA Software Group, Inc. (January 1999 - Present); Swift Transportation Co. (March 2004 - Present). |
| | | | | | | | | | |
David W.C. Putnam(4)
7337 E. Doubletree Ranch Rd.
Scottsdale, Arizona 85258
Age : 66 | | Trustee | | October 1999 - Present | | President and Director, F.L. Putnam Securities Company, Inc. (June 1978 - Present). | | 162 | | Progressive Capital Accumulation Trust (August 1998 - Present); Principled Equity Market Trust (November 1996 - Present); Mercy Endowment Foundation (September 1995 - Present); Asian American Bank and Trust Company (June 1992 - Present); and Notre Dame Health Care Center (July 1991 - Present). |
| | | | | | | | | | |
Roger B. Vincent(4)
7337 E. Doubletree Ranch Rd.
Scottsdale, Arizona 85258
Age : 60 | | Trustee | | February 2002 - Present | | President, Springwell Corporation (March 1989 - Present). | | 162 | | AmeriGas Propane, Inc. (January 1998 - Present). |
78
TRUSTEE AND OFFICER INFORMATION (Unaudited) (CONTINUED)
Name, Address
and Age | | Position(s)
Held with
Trust | | Term of
Office and
Length of
Time
Served(1) | | Principal
Occupation(s)
During the
Past Five Years | | Number of
Portfolios in
Fund Complex
Overseen
by Trustee | | Other
Directorships
Held by
Trustee |
Richard A. Wedemeyer(3)
7337 E. Doubletree Ranch Rd. Scottsdale, Arizona 85258
Age : 69 | | Trustee | | February 2001 - Present | | Retired. Formerly, Vice President - Finance and Administration, The Channel Corporation (June 1996 - April 2002). Formerly, Trustee, First Choice Funds (February 1997 - April 2001). | | 162 | | Touchstone Consulting Group (June 1997 - Present) and Jim Henson Legacy (April 1994 - Present). |
| | | | | | | | | | |
Trustees who are “Interested Persons”: | | | | | | | | |
| | | | | | | | | | |
Thomas J. McInerney(5)
7337 E. Doubletree Ranch Rd.
Scottsdale, Arizona 85258
Age : 49 | | Trustee | | February 2001 - Present | | Chief Executive Officer, ING U.S. Financial Services (January 2005 - Present); General Manager and Chief Executive Officer, U.S. Financial Services (December 2003 - December 2004); Chief Executive Officer, ING U.S. Financial Services (September 2001 - December 2003); and General Manager and Chief Executive Officer, U.S. Worksite Financial Services (December 2000 - September 2001). | | 205 | | Equitable Life Insurance Co., Golden American Life Insurance Co., Life Insurance Company of Georgia, Midwestern United Life Insurance Co., ReliaStar Life Insurance Co., Security Life of Denver, Security Connecticut Life Insurance Co., Southland Life Insurance Co., USG Annuity and Life Company, and United Life and Annuity Insurance Co. Inc.; Ameribest Life Insurance Co.; First Columbine Life Insurance Co.; and Metro Atlanta Chamber of Commerce (January 2003 - Present). |
| | | | | | | | | | |
John G. Turner(6)
7337 E. Doubletree Ranch Rd.
Scottsdale, Arizona 85258
Age : 66 | | Trustee | | October 1999 - Present | | Retired. Formerly, Vice Chairman of ING Americas (September 2000 - January 2002); Director of ReliaStar Life Insurance Company of New York (April 1975 - December 2001); and Chairman and Trustee of the Northstar affiliated investment companies (May 1993 - December 2001). | | 162 | | Hormel Foods Corporation (March 2000 - Present); ShopKo Stores, Inc. (August 1999 - Present); and Conseco, Inc. (September 2003 - Present). |
(1) Trustees serve until their successors are duly elected and qualified, subject to the Board’s retirement policy.
(2) Shaun Mathews, Senior Vice President of ING Life Insurance and Annuity Company, has held a seat on the board of directors of The Mark Twain House & Museum since September 19, 2002. ING Groep N.V. makes non-material, charitable contributions to The Mark Twain House & Museum.
(3) Valuation, Proxy and Brokerage Committee member.
(4) Audit Committee member.
(5) Mr. McInerney is an “interested person,” as defined under the 1940 Act, because of his affiliation with ING Groep N.V., the parent corporation of the Investment Manager, ING Investments, LLC and the Distributor, ING Funds Distributor, LLC.
(6) Mr. Turner is an “interested person,” as defined under the 1940 Act, because of his affiliation with ING Groep N.V., the parent corporation of the Investment Manager, ING Investments, LLC and the Distributor, ING Funds Distributor, LLC.
79
TRUSTEE AND OFFICER INFORMATION (Unaudited) (CONTINUED)
Name, Address
and Age | | Position(s)
Held with Trust | | Term of Office and
Length of Time Served(1) | | Principal Occupation(s) during the
Past Five Years | |
Officers: | | | | | | | |
| | | | | | | |
James M. Hennessy
7337 E. Doubletree Ranch Rd.
Scottsdale, Arizona 85258
Age : 56 | | President and Chief
Executive Officer
Chief Operating Officer | | February 2001 - Present
July 2000 - Present | | President, Chief Executive Officer and Chief Operating Officer, ING Investments, LLC (December 2000 - Present). Formerly, Senior Executive Vice President and Chief Operating Officer, ING Investments, LLC (April 1995 - December 2000). | |
| | | | | | | |
Michael J. Roland
7337 E. Doubletree Ranch Rd.
Scottsdale, Arizona 85258
Age : 47 | | Executive Vice President | | February 2002 - Present | | Executive Vice President (December 2001 - Present) and Chief Compliance Officer (October 2004 - Present), ING Investments, LLC. Formerly, Chief Financial Officer and Treasurer, ING Investments, LLC (December 2001 - March 2005); Senior Vice President, ING Investments, LLC (June 1998 - December 2001). | |
| | | | | | | |
Stanley D. Vyner
7337 E. Doubletree Ranch Rd.
Scottsdale, Arizona 85258
Age : 55 | | Executive Vice President | | May 1999 - Present | | Executive Vice President, ING Investments, LLC (July 2000 - Present) and Chief Investment Risk Officer (January 2003 - Present). Formerly, Chief Investment Officer of the International Portfolios, ING Investments, LLC (August 2000 - January 2003). | |
| | | | | | | |
Joseph M. O’Donnell
7337 E. Doubletree Ranch Rd.
Scottsdale, Arizona 85258
Age : 50 | | Chief Compliance Officer | | November 2004 - Present | | Chief Compliance Officer of the ING Funds (November 2004 - Present). Formerly, Vice President, Chief Legal Counsel, Chief Compliance Officer and Secretary of Atlas Securities, Inc., Atlas Advisers, Inc. and Atlas Funds (October 2001 - October 2004); and Chief Operating Officer and General Counsel of Matthews International Capital Management LLC and Vice President and Secretary of Matthews International Funds (August 1999 - May 2001). | |
| | | | | | | |
Todd Modic
7337 E. Doubletree Ranch Rd.
Scottsdale, Arizona 85258
Age : 37 | | Senior Vice President, Chief Financial Officer and Assistant Secretary | | March 2005 - Present | | Senior Vice President, ING Funds Services, LLC (April 2005 - Present). Formerly, Vice President, ING Funds Services, LLC (September 2002 - March 2005); Director, Financial Reporting, ING Investments, LLC (March 2001 - September 2002); Director of Financial Reporting, Axient Communications, Inc. (May 2000 - January 2001). | |
| | | | | | | |
Robert S. Naka
7337 E. Doubletree Ranch Rd.
Scottsdale, Arizona 85258
Age : 42 | | Senior Vice President Assistant Secretary | | November 1999 - Present May 1999 - Present | | Senior Vice President (August 1999 - Present) and Assistant Secretary (October 2001 - Present), ING Funds Services, LLC. | |
| | | | | | | |
Kimberly A. Anderson
7337 E. Doubletree Ranch Rd.
Scottsdale, Arizona 85258
Age : 41 | | Senior Vice President | | November 2003 - Present | | Senior Vice President, ING Investments, LLC (October 2003 - Present). Formerly, Vice President and Assistant Secretary, ING Investments, LLC (January 2001 - October 2003); and Assistant Vice President, ING Funds Services, LLC (November 1999 - January 2001). | |
| | | | | | | |
Robyn L. Ichilov
7337 E. Doubletree Ranch Rd.
Scottsdale, Arizona 85258
Age : 38 | | Vice President and Treasurer | | May 1999 - Present | | Vice President and Treasurer, ING Funds Services, LLC (October 2001 - Present) and ING Investments, LLC (August 1997 - Present). | |
| | | | | | | |
Lauren D. Bensinger
7337 E. Doubletree Ranch Rd.
Scottsdale, Arizona 85258
Age : 51 | | Vice President | | February 2003 - Present | | Vice President and Chief Compliance Officer, ING Funds Distributor, LLC (July 1995 - Present); and Vice President, ING Investments, LLC (February 2003 - Present). Formerly, Chief Compliance Officer, ING Investments, LLC (October 2001 - October 2004). | |
80
TRUSTEE AND OFFICER INFORMATION (Unaudited) (CONTINUED)
Name, Address
and Age | | Position(s)
Held with the Trust | | Term of Office and
Length of Time Served(1) | | Principal Occupation(s) during the
Past Five Years | |
Maria M. Anderson
7337 E. Doubletree Ranch Rd.
Scottsdale, Arizona 85258
Age : 47 | | Vice President | | September 2004 - Present | | Vice President, ING Funds Services, LLC (September 2004 - Present). Formerly, Assistant Vice President, ING Funds Services, LLC (October 2001 - September 2004); and Manager Fund Accounting and Fund Compliance, ING Investments, LLC (September 1999 - October 2001). | |
| | | | | | | |
Mary A. Gaston
7337 E. Doubletree Ranch Rd
Scottsdale, Arizona 85258
Age : 39 | | Vice President | | March 2005 - Present | | Vice President, ING Fund Services, LLC (April 2005 - Present). Formerly, Assistant Vice President, Financial Reporting, ING Investments, LLC (April 2004 - April 2005); Manager, Financial Reporting, ING Investments, LLC (August 2002 - April 2004); and Controller Z Seven Fund, Inc. and Ziskin Asset Management, Inc. (January 2000 - March 2002). | |
| | | | | | | |
Susan P. Kinens
7337 E. Doubletree Ranch Rd.
Scottsdale, Arizona 85258
Age : 28 | | Assistant Vice President | | February 2003 - Present | | Assistant Vice President, ING Funds Services, LLC (December 2002 - Present); and has held various other positions with ING Funds Services, LLC for more than the last five years. | |
| | | | | | | |
Kimberly K. Palmer
7337 E. Doubletree Rand Rd.
Scottsdale, Arizona 85258
Age : 48 | | Assistant Vice President | | September 2004 - Present | | Assistant Vice President, ING Funds Services, LLC (August 2004 - Present). Formerly, Manager, Registration Statements, ING Funds Services, LLC (May 2003 - August 2004); Associate Partner, AMVESCAP PLC (October 2000 - May 2003); Director of Federal Filings and Blue Sky Filings, INVESCO Funds Group, Inc. (March 1994 - May 2003). | |
| | | | | | | |
Huey P. Falgout, Jr.
7337 E. Doubletree Ranch Rd.
Scottsdale, Arizona 85258
Age : 41 | | Secretary | | August 2003 - Present | | Chief Counsel, ING Americas, U.S. Legal Services (September 2003 - Present). Formerly, Counsel, ING Americas, U.S. Legal Services (November 2002 - September 2003); and Associate General Counsel of AIG American General (January 1999 - November 2002). | |
| | | | | | | |
Theresa K. Kelety
7337 E. Doubletree Ranch Rd.
Scottsdale, Arizona 85258
Age : 42 | | Assistant Secretary | | August 2003 - Present | | Counsel, ING Americas, U.S. Legal Services (April 2003 - Present). Formerly, Senior Associate with Shearman & Sterling (February 2000 - April 2003). | |
| | | | | | | |
Robin R. Nesbitt
7337 E. Doubletree Rand Rd.
Scottsdale, Arizona 85258
Age : 32 | | Assistant Secretary | | September 2004 - Present | | Supervisor, Board Operations, ING Funds Services, LLC (August 2003 - Present). Formerly, Senior Legal Analyst, ING Funds Services, LLC (August 2002 - August 2003); Associate, PricewaterhouseCoopers (January 2001 - August 2001); and Paralegal, McManis, Faulkner & Morgan (May 2000 - December 2000). | |
(1) The officers hold office until the next annual meeting of the Trustees and until their successors have been elected and qualified.
81
ADVISORY CONTRACT APPROVAL DISCUSSION (UNAUDITED)
Consideration of Annual Renewals
Under Section 15(c) of the Investment Company Act of 1940 (the “1940 Act”), after an initial period, the Funds’ existing investment advisory and sub-advisory contracts remain in effect only if the Boards of Trustees (the “Board”) of ING Mutual Funds and ING Mayflower Trust, including a majority of the Trustees who have no direct or indirect interest in the advisory and sub-advisory contracts, and who are not “interest persons” of the Funds, as such term is defined under the 1940 Act (the “Independent Trustees”), annually review and renew them.
In this regard, at a meeting held on August 31, 2004 the Board, including a majority of the Independent Trustees, voted to renew the investment advisory contracts (the “Advisory Contracts”) between ING Investments, LLC (the “Adviser”) and the Funds and the sub-advisory contracts (“Sub-Advisory Contracts”) with the Funds’ respective sub-advisers (each, a “Sub-Adviser,” and collectively, the “Sub-Advisers”), for the period September 1, 2004 through August 31, 2005. Subsequently, at its meeting held on July 21, 2005, the Board voted to renew the terms of the Advisory and certain Sub-Advisory Contracts for an “interim” period commencing on September 1, 2005 and ending on November 30, 2005. The interim approval was necessary to align the Funds’ annual renewal periods with those of other Funds in the ING Funds complex. In reaching these decisions, the Board took into account a number of factors its members believed, in light of the legal advice furnished to the Board by Kirkpatrick & Lockhart Nicholson Graham LLP (“K&LNG”), legal counsel to the Independent Trustees, and their own business judgment, to be relevant.
In connection with their deliberations on August 31, 2004 relating to the renewal of each Fund’s current Advisory Contract and Sub-Advisory Contract, the Board, including the Independent Trustees, considered information that had been provided by the Adviser and the Sub-Advisers throughout the year at regular Board Meetings, as well as information furnished in advance of the August 31, 2004 Board meeting, which was held to specifically consider such renewals for purposes of annual renewal. This information included the following items: (1) FACT sheets for each Fund that provide information about the performance and expenses of the Fund and its respective peer group, as well as information about the Fund’s investment portfolio, objective and strategies; (2) the 15(c) Methodology Guide that describes how the FACT sheets were prepared, including how benchmarks and peer groups were selected and how profitability was determined; (3) responses to questions from K&LNG, legal counsel to the Independent Trustees; (4) copies of each form of Advisory and Sub-Advisory Contract; (5) copies of the Form ADV for the Adviser and the Sub-Advisers; (6) financial statements for the Adviser and Sub-Advisers; and (7) other information relevant to their evaluations.
In connection with their deliberations on July 21, 2005 relating to each Fund’s current Advisory Contract and, in certain cases, Sub-Advisory Contract, the Board, including the Independent Trustees, considered information that had been provided by the Adviser and the Sub-Advisers throughout the year at regular Board and Committee Meetings, beginning in August 2004 in anticipation of the August contract renewal and continuing at periodic meetings thereafter. Such information included, among other things, detailed analysis of Fund performance, including attribution analysis, provided at all regular Board meetings.
The Board also considered information furnished in advance of the July 21, 2005 Board meeting, which was held to, among other things, specifically consider Advisory and Sub-Advisory Contract renewals for the interim period ending November 30, 2005. This information included the following items: (1) updated performance information through May 31, 2005 with respect to the Funds; (2) responses to questions from K&LNG, legal counsel to the Independent Trustees; (3) copies of each form of Advisory and Sub-Advisory Contract; (4) representations that there were no material changes in the management fees and expense ratios borne by the Funds since the August 2004 approval; and (5) other information relevant to their evaluations. In determining that this information was sufficient to support the interim renewal, the Board took into consideration that it would meet again, at an in-person meeting to be held in November 2005, to consider whether to approve the Advisory and Sub-Advisory Contracts for the Funds for a 12-month period beginning on December 1, 2005 and ending November 30, 2006. The interim and subsequent November renewals would place the Funds on a December 1 renewal cycle, and result in all of the mutual funds in the ING mutual funds complex under the purview of the Board being placed on the same annual renewal cycle on a going-forward basis.
The Board was also provided, in August 2004 and July 2005, with narrative summaries addressing key factors the Board customarily considers in evaluating
82
ADVISORY CONTRACT APPROVAL DISCUSSION (UNAUDITED) (CONTINUED)
the renewal of Advisory and Sub-Advisory Contracts, including an analysis for each Fund of how performance and fees compare to its comparable universe of funds (“Selected Peer Group”) and/or designated benchmarks.
In arriving at its conclusions with respect to the advisory arrangements with the Adviser, the Board was mindful of the “manager-of-managers” platform of the ING Funds. The Board also noted the resources that the Adviser has committed to the Board and its International Equity and Fixed Income Investment Review Committee (the “Investment Review Committee”) to assist the Board and Investment Review Committee members with their assessment of the investment performance of the Funds. This includes the appointment of a Chief Investment Risk Officer and his staff, who report directly to the Board, and who have developed attribution analyses and other metrics used by the Investment Review Committee to analyze the key factors underlying investment performance for the Funds. The Board also noted the techniques used by the Adviser to monitor the performance of the Sub-Advisers, and took note of the pro-active approach that the Adviser, working in cooperation with the Investment Review Committee, has taken to advocate or recommend, when it believed appropriate, changes intended to assist performance of the Funds.
Consideration of New Sub-Advisory Arrangements
Section 15 of the 1940 mandates that, when a Fund enters into a new advisory or sub-advisory arrangement, the Trustees, including a majority of the Independent Trustees, must approve the new Sub-Advisory Contract with respect to the Fund. The Board approved, in November 2004, the following new advisory arrangements: (1) the engagement of Brandes Investment Partners, L.P. (“Brandes”) as the new Sub-Adviser to ING Emerging Countries Fund, effective March 1, 2005, replacing ING Investment Management Advisors B.V.; (2) replacing ING Investment Management Co. with NWQ Investment Management Company, LLC (“NWQ”) as Sub-Adviser to ING Global Value Choice Fund (formerly, ING Worldwide Growth Fund), effective February 1, 2005; and (3) appointing Acadian Asset Management, Inc. (“Acadian”) as Sub-Adviser to ING International SmallCap Growth Fund, replacing Nicholas-Applegate Capital Management, effective March 1, 2005. Further, in November 2004 the Board approved the launch of ING International Value Fund, a new Fund managed by NWQ. The Board’s consideration of these new sub-advisory arrangements is discussed under the fund-by-fund analysis, below.
Fund-by-Fund Analysis
The following paragraphs outline certain of the specific factors that the Board considered, and the conclusions reached, at its August 2004 and July 2005 meetings in relation to renewing the Funds’ current Advisory Contracts and Sub-Advisory Contracts for the year ended August 31, 2005 and the interim period ended November 30, 2005. Also discussed below are the Board’s considerations at its November 2004 meeting when it determined to vote to approve new sub-advisory arrangements for certain Funds.
ING Global Real Estate Fund
In its renewal deliberations for ING Global Real Estate Fund in August 2004, the Board considered that: (1) the management fee for the Fund is above the median and average management fees of the funds in Selected Peer Group; (2) the expense ratio for the Fund is above the median and the average expense ratios of the funds in its Selected Peer Group; and (3) the Fund outperformed its primary benchmark index and Selected Peer Group for the periods reviewed by the Board.
In considering whether to approve the Fund’s interim period renewal, in July 2005 the Board further considered that: (1) the Fund outperformed its primary benchmark index, the Lipper Category Median, and the Morningstar Category Average for the three-year period ended May 31, 2005; and (2) the Fund underperformed its primary benchmark index, the Lipper Category Median, and the Morningstar Category Average for the year-to-date, one-month, three-month and one-year periods ended May 31 2005. In analyzing this performance data, the Board took into account that the Adviser had agreed to add breakpoint discounts to its management fee, which can be expected to benefit the Fund through lower fees when higher asset levels are reached. The Board further considered that, at its July meeting, the Board approved Class O shares for the Fund, which can be expected to result in increased asset levels and economies of scale benefiting the Fund and its shareholders.
After its deliberation, the Board reached the following conclusions: (1) the Fund’s management fee rate is reasonable in the context of all factors considered by the Board; (2) the Fund’s expense ratio is reasonable in the context of all factors considered
83
ADVISORY CONTRACT APPROVAL DISCUSSION (UNAUDITED) (CONTINUED)
by the Board; (3) the Fund’s performance is reasonable in the context of all factors considered by the Board; and (4) the sub-advisory fee rate payable by the Adviser to the Sub-Adviser is reasonable in the context of all factors considered by the Board. The Board also noted that there would be further opportunity for review of more recent performance and other relevant factors in the course of deliberations for the next annual renewal in November 2005.
Based on these conclusions and other factors, the Board voted to renew the Advisory and Sub-Advisory Contracts for the Fund for the year ended August 31, 2005 and the interim period ended November 30, 2005. During this renewal process, different Board members may have given different weight to different individual factors and related conclusions.
ING Global Value Choice Fund
In its renewal deliberations for ING Global Value Choice Fund (formerly, ING Worldwide Growth Fund), the Board considered that: (1) the management fee for the Fund is above the median and the average management fees of the funds in its Selected Peer Group; (2) the expense ratio for the Fund is above the median and the average expense ratios of the funds in its Selected Peer Group; and (3) the Fund underperformed its primary benchmark index for the periods presented to the Board. In analyzing this performance data, the Board considered actions taken to address the Board’s concerns about the Fund’s performance.
After deliberations based on the above-listed factors, in August 2004 the Board renewed the Advisory Contract and Sub-Advisory Contract for the Fund for the year ended August 31, 2005 because, among other considerations: (1) the Fund’s management fee rate is competitive with those of the funds in its Selected Peer Group; (2) the expense ratio for the Fund is competitive with those of the funds in its Selected Peer Group, and (3) action has been taken to improve Fund performance and the Adviser committed to further address performance concerns. During this renewal process, different Board members may have given different weight to different individual factors and related conclusions.
The Adviser further addressed the Board’s concerns by recommending the engagement of NWQ as the Fund’s Sub-Adviser, replacing ING Investment Management Co. (“ING IM”), the Fund’s then-current Sub-Adviser. On November 10, 2004, in reaching a decision to engage NWQ as the Fund’s Sub-Adviser, the Board, including a majority of the Independent Trustees, considered the performance of the Fund for the latest one-, three-, and five-year periods. The Board also considered the composite performance of portfolios managed by NWQ with similar investment styles to that of the Fund. In addition to these considerations, the Board evaluated and discussed other factors, including, but not limited to, the following: (1) the process employed by NWQ in managing international equities, the consistency of that process over time, and measures used to address the risks of international equities; (2) the Adviser’s view of the reputation of NWQ; (3) NWQ’s experience and skill in managing large cap value and international accounts; (4) the nature and quality of the services to be provided by NWQ; (5) the addition of an exclusivity provision in the proposed Sub-Advisory Contract; (6) the fairness of the compensation under the proposed Sub-Advisory Contract in light of the services to be provided by NWQ; (7) NWQ’s track record in managing the risks and volatility inherent in global funds; (8) the qualifications of NWQ’s personnel, portfolio management capabilities and investment methodologies; (9) NWQ’s operations, compliance program, and policies with respect to trade allocation and brokerage practices; (10) NWQ’s financial condition; (11) the costs for the services to be provided by NWQ and the fact that these costs will be paid by the Adviser and not directly by the Fund; (12) the consistency in investment style and portfolio turnover rates experienced over time by other international and domestic equity portfolios managed by NWQ; (13) the appropriateness of the selection of NWQ and the employment of the proposed investment strategy in light of the Fund’s investment objective and its current and prospective investor base; and (14) NWQ’s Code of Ethics and related procedures for complying with the Code. The Board also considered the advisory fee to be retained by the Adviser for its oversight and monitoring services to be provided to the Fund.
During the course of its deliberation, the Board reached the following conclusions regarding NWQ and the proposed Sub-Advisory Contract, among others: (1) NWQ is qualified to manage the Fund’s assets in accordance with the revised investment objective and the proposed investment strategy; (2) the proposed investment strategy is appropriate for pursuing long-term capital appreciation through a Fund that can invest throughout the world and is consistent with the interests of current and prospective investors in the Fund; (3) the proposed investment strategy would not materially affect the
84
ADVISORY CONTRACT APPROVAL DISCUSSION (UNAUDITED) (CONTINUED)
current risk profile of the Fund; (4) NWQ is expected to execute the proposed investment strategy consistently over time; (5) based upon the financial statements of both NWQ and its parent company, Nuveen Investments, NWQ has sufficient financial resources available to it to fulfill its commitments to the Fund under the proposed Sub-Advisory Contract; (6) the exclusivity provisions included in the proposed Sub-Advisory Contract with respect to the management of other mutual funds with similar investment objectives, policies and restrictions are likely to provide the Fund with the opportunity to realize asset growth during the exclusivity period; (7) NWQ is likely to manage the assets with a portfolio turnover rate that is relatively low for a global fund; and (8) taking into account the complexity and quality of the investment management services utilized by the Fund, the compensation to be paid by the Adviser to NWQ under the proposed Sub-Advisory Contract is fair and reasonable in relation to the services to be provided by NWQ, the compensation paid to the current Sub-Adviser, ING IM, and various industry averages for similar funds. Based upon these and other relevant conclusions, the Board determined to approve the Sub-Advisory Contract with NWQ for the Fund, with an initial two-year period that commenced on February 1, 2005
In considering whether to approve the renewal of ING Global Value Choice Fund’s Advisory Contract for the interim period, in July 2005 the Board further considered that: (1) the Fund underperformed its primary benchmark index, the Lipper Category Median and the Morningstar Category Average for the one-year, three-year and five-year periods ended May 31 2005; (2) the Fund outperformed its primary benchmark index, the Lipper Category Median and the Morningstar Category Average for the one-month, three-month and year-to-date periods ended May 31, 2005; and (3) short-term performance had improved under the management of NWQ, and longer-term underperformance could be attributed to ING IM, the Fund’s former Sub-Adviser.
After its deliberation, the Board reached the following conclusions: (1) the Fund’s management fee rate is reasonable in the context of all factors considered by the Board; (2) the Fund’s expense ratio is reasonable in the context of all factors considered by the Board; and (3) management had taken action to address Board concerns about the Fund’s performance, and short-term performance, based upon periods ended May 31, 2005, showed improvement. The Board also noted that there would be further opportunity for review of more recent performance and other relevant factors in the course of deliberations for the next annual renewal in November 2005.
Based on these conclusions and other factors, the Board voted to renew the Advisory Contract for the Fund for the interim period ended November 30, 2005. During this renewal process, different Board members may have given different weight to different individual factors and related conclusions.
ING Emerging Countries Fund
In its renewal deliberations for ING Emerging Countries Fund, the Board considered that: (1) the management fee for the Fund is above the median and the average management fees of the funds in its Selected Peer Group; (2) the expense ratio for the Fund is above the median and the average expense ratios of the funds in its Selected Peer Group; and (3) the Fund underperformed its primary benchmark index and Selected Peer Group median for the periods reviewed by the Board. In analyzing this performance data, the Board took into account the actions taken by the Adviser to address the Board’s concerns about the Fund’s performance. The Board further noted that, in response to direction from the Board, the Adviser agreed to a lower expense limit for the Fund through a waiver of 0.10% of the 12b-1 fee for the Fund’s Class A shares.
After deliberations based on the above-listed factors, in August 2004 the Board renewed the Advisory Contract and Sub-Advisory Contract for the Fund for the year ended August 31, 2005 because, among other considerations: (1) the management fee is competitive with those of the funds in its Selected Peer Group; (2) the new expense limit is below the median and average expense ratios of the funds in its Selected Peer Group; and (3) action has been taken to improve Fund performance and the Adviser committed to further address performance concerns. During this renewal process, different Board members may have given different weight to different individual factors and related conclusions.
The Adviser further addressed the Board’s concerns by recommending the engagement of Brandes as the Fund’s Sub-Adviser, replacing ING Investment Management Advisors B.V. (“IIMA”), the then-current Sub-Adviser to the Fund. On November 10, 2004, in reaching a decision to engage Brandes as the Fund’s
85
ADVISORY CONTRACT APPROVAL DISCUSSION (UNAUDITED) (CONTINUED)
Sub-Adviser, the Board, including a majority of the Independent Trustees, considered the performance of the Fund for the latest one-, three-, and five-year periods, as compared to the performance of a peer group of other international accounts with strategies comparable to the proposed investment strategy of the Fund. In addition to these considerations, the Board evaluated and discussed other factors, including, but not limited to, the following: (1) the process employed by Brandes in managing emerging market equities, the consistency of that process over time, and measures Brandes uses to address the risks of emerging market equities; (2) the nature and quality of the services to be provided by Brandes; (3) the relationship the Adviser has established with Brandes with regard to four different retail funds over the prior nine years; (4) the addition of an exclusivity provision in the proposed Sub-Advisory Contract; (5) the fairness of the compensation under the proposed Sub-Advisory Contract in light of the services to be provided by Brandes; (6) Brandes’ positive track record in managing the risks and volatility inherent in emerging markets funds; (7) the qualifications of Brandes’ personnel, portfolio management capabilities and investment methodologies; (8) Brandes’ operations, compliance program, and policies with respect to trade allocation and brokerage practices; (9) Brandes’ financial condition; (10) the costs for the services to be provided by Brandes and the fact that these costs will be paid by the Adviser and not directly by the Fund; (11) the consistency in investment style and portfolio turnover rates experienced over time by other emerging markets and international equity portfolios managed by Brandes; (12) the appropriateness of the selection of Brandes and the employment of the proposed investment strategy in light of the Fund’s investment objective and its current and prospective investor base; and (13) Brandes’ Code of Ethics, which has previously been approved for other ING Funds, and related procedures for complying with that Code. The Board also considered the advisory fee to be retained by the Adviser for its oversight and monitoring services to be provided to the Fund.
During the course of its deliberation as to whether to approve Brandes as Sub-Adviser to the Fund, the Board reached the following conclusions regarding Brandes and the proposed Sub-Advisory Contract, among others: (1) Brandes is qualified to manage the Fund’s assets in accordance with the proposed investment strategy, based in part on Brandes’ superior performance with other ING accounts currently managed by Brandes; (2) the proposed investment strategy is appropriate for pursuing long-term capital appreciation through a Fund that can invest throughout the world and is consistent with the interests of current and prospective investors in the Fund; (3) the proposed investment strategy would not materially affect the current risk profile of the Fund; (4) Brandes is expected to execute the proposed investment strategy consistently over time; (5) based on the financial statements of Brandes, Brandes has sufficient financial resources available to it to fulfill its commitments to the Fund under the proposed Sub-Advisory Contract; (6) the exclusivity provisions included in the proposed Sub-Advisory Contract with respect to the management of other mutual funds with similar investment objectives, policies and restrictions are likely to provide the Fund with the opportunity to realize asset growth during the exclusivity period; (7) Brandes is likely to manage the assets with a portfolio turnover rate that is relatively low for an international fund; and (8) the compensation to be paid by the Adviser to Brandes under the proposed Sub-Advisory Contract is fair in relation to the services to be provided by Brandes, the compensation paid to IIMA, the previous Sub-Adviser, and various industry averages for similar funds. Based upon these and other relevant conclusions, the Board determined to approve the Sub-Advisory Contract with Brandes for the Fund, with an initial two-year term that commenced on March 1, 2005.
In considering whether to approve the renewal of ING Emerging Countries Fund’s Advisory Contract for the interim period, in July 2005 the Board further considered that: (1) the Fund underperformed its primary benchmark index, the Lipper Category Median and the Morningstar Category Average for the year-to-date, one-year, three-year and five-year periods ended May 31 2005; and (2) the Fund outperformed its primary benchmark index, the Lipper Category Median and the Morningstar Category Average for the one- and three-month periods ended May 31, 2005. In considering this performance data, the Board considered that short-term performance had improved under Brandes, and longer-term performance could be attributed to IIMA, the Fund’s former Sub-Adviser.
After its deliberation, the Board reached the following conclusions: (1) the Fund’s management fee rate is reasonable in the context of all factors considered by the Board; (2) the Fund’s expense ratio is reasonable in the context of all factors considered by the Board; and (3) Brandes had been appointed as
86
ADVISORY CONTRACT APPROVAL DISCUSSION (UNAUDITED) (CONTINUED)
Sub-Adviser, effective March 1, 2005, and short-term performance, based upon periods ended May 31, 2005, showed improvement. The Board also noted that there would be further opportunity for review of more recent performance and other relevant factors in the course of deliberations for the next annual renewal in November 2005.
Based on these conclusions and other factors, the Board voted to renew the Advisory Contract for the Fund for the interim period ended November 30, 2005. During this renewal process, different Board members may have given different weight to different individual factors and related conclusions.
ING Foreign Fund
In its renewal deliberations for ING Foreign Fund in August 2004, the Board considered that: (1) the management fee for the Fund is above the median and the average management fees of the funds in its Selected Peer Group; (2) the expense ratio for the Fund is below the median and the average expense ratios of the funds in its Selected Peer Group; and (3) the Fund underperformed its primary benchmark index and Selected Peer Group for the periods presented. In analyzing this performance data, the Board considered that the Fund had commenced operations in July 2003, and therefore there had been only one year of prior performance available for analysis. The Board also noted that short-term performance was showing positive results.
In considering whether to approve the Fund’s interim period renewal, in July 2005 the Board further considered that, based on performance data for the period ended May 31, 2005: (1) the Fund outperformed its primary benchmark index, the Lipper Category Median, and the Morningstar Category Average for the one-month and one-year periods ended May 31, 2005; and (2) the Fund underperformed its primary benchmark index, the Lipper Category Median, and the Morningstar Category Average for the year-to-date and three-month period ended May 31 2005.
After its deliberation, the Board reached the following conclusions: (1) the Fund’s management fee rate is reasonable in the context of all factors considered by the Board; (2) the Fund’s expense ratio is reasonable in the context of all factors considered by the Board; (3) the Fund had been launched in July 2003 and more recent performance had been positive, and it was reasonable to permit the Sub-Adviser to continue to manage the Fund in order to demonstrate the more favorable longer-term performance anticipated by management; and (4) the sub-advisory fee rate payable by the Adviser to the Sub-Adviser is reasonable in the context of all factors considered by the Board. The Board also noted that there would be further opportunity for review of more recent performance and other relevant factors in the course of deliberations for the next annual renewal in November 2005.
Based on these conclusions and other factors, the Board voted to renew the Advisory and Sub-Advisory Contracts for the Fund for the year ended August 31, 2005 and the interim period ended November 30, 2005. During this renewal process, different Board members may have given different weight to different individual factors and related conclusions.
ING International Fund
In its renewal deliberations for ING International Fund in August 2004, the Board considered that: (1) the management fee for the Fund is above the median and the average management fees of the funds in its Selected Peer Group; (2) the expense ratio for the Fund is above the median and the average expense ratios of its Selected Peer Group; and (3) the Fund underperformed its benchmark index for the most recent calendar quarter, one-, two-, and three-year periods, but outperformed its Selected Peer Group median for the three-, five-, and ten-year periods.
In considering whether to approve the Fund’s interim period renewal, in July 2005 the Board further considered that, based on performance data for the period ended May 31, 2005, the Fund underperformed its primary benchmark index, the Lipper Category Median, and the Morningstar Category Average for all periods considered, except that it outperformed its Morningstar Category Average for the five-year period. In analyzing this performance data, the Board took into account management’s discussions regarding the performance of the Fund at periodic meetings. The Board also considered the report from the Investment Review Committee regarding discussions with management, at the Committee’s meeting on July 20, 2005, regarding recent underperformance and the measures undertaken by the Sub-Adviser to the Fund to address this underperformance, including affording portfolio managers access to additional research and enhancements to the Sub-Adviser’s stock selection process.
87
ADVISORY CONTRACT APPROVAL DISCUSSION (UNAUDITED) (CONTINUED)
After its deliberation, the Board reached the following conclusions: (1) the Fund’s management fee rate is reasonable in the context of all factors considered by the Board; (2) the expense ratio for the Fund is reasonable in the context of all factors considered by the Board; (3) the portfolio managers have been consistent in their investment approach of focusing on higher quality international securities and the Adviser was working with the Sub-Adviser to improve the Fund’s performance, and it was reasonable to permit the Sub-Adviser to continue to manage the Fund in order to demonstrate the more favorable longer-term performance anticipated by management; and (4) the sub-advisory fee rate payable by the Adviser to the Sub-Adviser is reasonable in the context of all factors considered by the Board. The Board also noted that there would be further opportunity for review of recent performance and other relevant factors in the course of deliberations for the next annual renewal in November 2005.
Based on these conclusions and other factors, the Board voted to renew the Advisory and Sub-Advisory Contracts for the Fund for the year ended August 31, 2005 and the interim period ended November 30, 2005. During this renewal process, different Board members may have given different weight to different individual factors and related conclusions.
ING International SmallCap Fund
In its renewal deliberations for the Fund in August 2005, the Board considered that: (1) the management fee for the Fund is below the median and the average management fees of the funds in its Selected Peer Group; (2) the expense ratio for the Fund is below the median and the average expense ratios of the funds in its Selected Peer Group; (3) the Fund underperformed its benchmark index for all periods reviewed by the Board and its Selected Peer Group median for the one-, two-, and three-year periods, but outperformed its Selected Peer Group for the last calendar quarter. In analyzing this performance data, the Board considered the actions taken to address the Board’s concerns about the Fund’s performance.
After deliberations based on the above-listed factors, the Board renewed the Advisory Contract and Sub-Advisory Contract for the Fund for the year ended August 31, 2005 because, among other considerations: (1) the management fee for the Fund is competitive with that of its Selected Peer Group; (2) the expense ratio for the Fund is competitive with that of its Selected Peer Group; (3) the Fund’s performance has recently improved; and (4) action has been taken to improve Fund performance by implementing a change in portfolio management and the Adviser committed to further address performance concerns. During this renewal process, different Board members may have given different weight to different individual factors and related conclusions.
The Adviser further addressed the Board’s concerns by recommending the engagement of Acadian as the Fund’s Sub-Adviser, replacing Nicholas-Applegate Capital Management (“Nicholas-Applegate”), the then-current Sub-Adviser to the Fund. On November 10, 2004, in reaching a decision to engage Acadian as the Fund’s Sub-Adviser, the Board, including a majority of the Independent Trustees, considered the performance of the Fund for the latest one-, three-, and five-year periods. The Board considered the performance of a peer group of other international accounts with strategies comparable to the proposed investment strategy. In addition to these considerations, the Board evaluated and discussed other factors, including, but not limited to, the following: (1) the process employed by NWQ in managing international equities, the consistency of that process over time, and measures used to address the risks of international equities; (2) the nature and quality of the services to be provided by Acadian, including Acadian’s extensive research capabilities, disciplined and quantitative investment techniques and sophisticated analytical models; (3) the fairness of the compensation under the proposed Sub-Advisory Contract in light of the services to be provided and various industry averages for similar funds; (4) Acadian’s positive track record in managing the risks and volatility inherent in international portfolios; (5) the strong experience of Acadian’s personnel, portfolio management capabilities and investment methodologies; (6) Acadian’s operations, compliance program, and policies with respect to trade allocation and brokerage practices; (7) Acadian’s financial condition; (8) the costs for the services to be provided by Acadian and the fact that these costs will be paid by the Adviser and not directly by the Fund; (9) the consistency in investment style and portfolio turnover rates experienced over time by other international portfolios managed by Acadian; (10) the appropriateness of the selection of Acadian and the employment of the proposed investment strategy in light of the Fund’s investment objective and its current and prospective investor base; and (11) Acadian’s Code of Ethics and related procedures for complying
88
ADVISORY CONTRACT APPROVAL DISCUSSION (UNAUDITED) (CONTINUED)
with the Code. The Board also considered the advisory fee to be retained by the Adviser for its oversight and monitoring services to be provided to the Fund, the compensation paid to the current Sub-Adviser and various industry averages for similar funds.
During the course of its deliberation, the Board reached the following conclusions regarding Acadian and the proposed Sub-Advisory Contract, among others: (1) based, among other considerations, on its review of the Acadian International Small-Cap Composite as of September 30, 2004, which has outperformed its benchmark and the Lipper and Morningstar category averages on the year-to-date, one-, three- and five-year periods, Acadian is qualified to manage the Fund’s assets in accordance with its investment objective and the proposed investment strategy; (2) the proposed investment strategy is appropriate for pursuing maximum long-term capital appreciation through a Fund that can invest throughout the world and is consistent with the interests of current and prospective investors in the Fund; (3) the proposed investment strategy would not materially affect the current risk profile of the Fund; (4) Acadian is expected to execute the proposed investment strategy consistently over time; (5) based upon the financial statements of Acadian, Acadian has sufficient financial resources available to it to fulfill its commitments to the Fund under the proposed Sub-Advisory Contract; (6) Acadian is likely to manage the assets with a portfolio turnover rate that is relatively low for an international fund; and (7) the compensation to be paid by the Adviser to Acadian under the proposed Sub-Advisory Contract is fair in relation to the services to be provided by Acadian. Based upon these and other relevant conclusions, the Board determined to approve the Sub-Advisory Contract with Acadian for the Fund, with an initial two-year period that commenced on March 1, 2005.
In considering whether to approve the renewal of ING International Small Cap Fund’s Advisory Contract for the interim period, in July 2005 the Board further considered that: (1) the Fund outperformed its primary benchmark index, the Lipper Category Median and the Morningstar Category Average for the one-month period ended May 31, 2005; (2) the Fund outperformed the Lipper Category Median for the year-to-date and three-month periods ended May 31, 2005; and (3) the Fund underperformed for all other periods considered by the Board. In analyzing this performance data, the Board considered that short-term performance had improved under the management of Acadian, and longer-term underperformance could be attributed to the Fund’s former Sub-Adviser, Nicholas-Applegate.
After its deliberation, the Board reached the following conclusions: (1) the Fund’s management fee rate is reasonable in the context of all factors considered by the Board; (2) the Fund’s expense ratio is reasonable in the context of all factors considered by the Board; and (3) management had taken action to address Board concerns about the Fund’s performance, and short-term performance, based upon periods ended May 31, 2005, showed improvement. The Board also noted that there would be further opportunity for review of more recent performance and other relevant factors in the course of deliberations for the next annual renewal in November 2005.
Based on these conclusions and other factors, the Board voted to renew the Advisory Contract for the Fund for the interim period ended November 30, 2005. During this renewal process, different Board members may have given different weight to different individual factors and related conclusions.
ING International Value Fund
In its renewal deliberations for ING International Value Fund in August 2004, the Board considered that: (1) the management fee for ING International Value Fund is above the median and the average management fees of the funds in its Selected Peer Group, (2) the expense ratio for the Fund is above the median and the average expense ratios of the funds in its Selected Peer Group; and (3) the Fund outperformed its benchmark index and Selected Peer Group median for all periods reviewed by the Board.
In considering whether to approve the Fund’s interim period renewal, in July 2005 the Board further considered that, based on performance data for the period ended May 31, 2005: (1) the Fund outperformed its primary benchmark index, the Lipper Category Median, and the Morningstar Category Average for the five years ended May 31, 2005; (2) the Fund outperformed its primary benchmark index for the three-year period ended May 31, 2005 and outperformed its Lipper Category Median for the year-to-date period ended May 31, 2005; and (3) the Fund underperformed these performance measures for all other periods considered. In analyzing this performance data, the Board took into account management’s discussions regarding the performance of the Fund at periodic meetings. The Board also considered the report from
89
ADVISORY CONTRACT APPROVAL DISCUSSION (UNAUDITED) (CONTINUED)
the Investment Review Committee regarding discussions with management, at the Committee’s meeting on July 20, 2005, regarding recent underperformance and the measures undertaken by the Sub-Adviser to the Fund to address this underperformance, including affording portfolio managers access to additional research and enhancements to the Sub-Adviser’s stock selection process.
After its deliberation, the Board reached the following conclusions: (1) the Fund’s management fee rate is reasonable in the context of all factors considered by the Board; (2) the Fund’s expense ratio is reasonable in the context of all factors considered by the Board; (3) the Fund’s performance is reasonable in the context of all factors considered by the Board; and (4) the sub-advisory fee rate payable by the Adviser to the Sub-Adviser is reasonable in the context of all factors considered by the Board. The Board also noted that there would be further opportunity for review of recent performance and other relevant factors in the course of deliberations for the next annual renewal in November 2005.
Based on these conclusions and other factors, the Board voted to renew the Advisory and Sub-Advisory Contracts for the Fund for the year ended August 31, 2005 and the interim period ended November 30, 2005. During this renewal process, different Board members may have given different weight to different individual factors and related conclusions.
90
ING Funds Distributor, LLC offers the funds listed below. Before investing in a fund, shareholders should carefully review the fund’s prospectus. Investors may obtain a copy of a prospectus of any ING Fund by calling (800) 992-0180 or by going to www.ingfunds.com.
Domestic Equity and Income Funds |
ING Balanced Fund |
ING Convertible Fund |
ING Equity and Bond Fund |
ING Equity Income Fund |
ING Real Estate Fund |
|
Domestic Equity Growth Funds |
ING Disciplined LargeCap Fund |
ING Growth Fund |
ING LargeCap Growth Fund |
ING MidCap Opportunities Fund |
ING SmallCap Opportunities Fund |
ING Small Company Fund |
|
Domestic Equity Index Funds |
ING Index Plus LargeCap Fund |
ING Index Plus MidCap Fund |
ING Index Plus SmallCap Fund |
|
Domestic Equity Value Funds |
ING Financial Services Fund |
ING LargeCap Value Fund |
ING MagnaCap Fund |
ING MidCap Value Fund |
ING MidCap Value Choice Fund |
ING SmallCap Value Fund |
ING SmallCap Value Choice Fund |
ING Value Opportunity Fund |
|
Fixed Income Funds |
ING GNMA Income Fund |
ING Government Fund |
ING High Yield Bond Fund |
ING Intermediate Bond Fund |
ING National Tax-Exempt Bond Fund |
|
Global Equity Funds |
ING Global Equity Dividend Fund |
ING Global Real Estate Fund |
ING Global Science and Technology Fund |
ING Global Value Choice Fund |
|
International Equity Funds |
ING Emerging Countries Fund |
ING Foreign Fund |
ING International Fund |
ING International Growth Fund |
ING International SmallCap Fund |
ING International Value Fund |
ING International Value Choice Fund |
ING Precious Metals Fund |
ING Russia Fund |
|
Loan Participation Fund |
ING Senior Income Fund |
|
Money Market Funds* |
ING Aeltus Money Market Fund |
ING Classic Money Market Fund |
ING Institutional Prime Money Market Fund |
|
Strategic Allocation Funds |
ING Strategic Allocation Balanced Fund |
ING Strategic Allocation Growth Fund |
ING Strategic Allocation Income Fund |
* An investment in the Fund is not insured or guaranteed by the Federal Deposit Insurance Corporation or any other government agency. Although the Fund seeks to preserve the value of your investment at $1.00 per share, it is possible to lose money by investing in the Fund.
PROXY VOTING INFORMATION
A description of the policies and procedures that the Registrant uses to determine how to vote proxies related to portfolio securities is available (1) without charge, upon request, by calling Shareholder Services toll-free at 800-992-0180; (2) on the Registrant’s website at www.ingfunds.com and (3) on the Securities and Exchange Commission’s (“SEC”) website at www.sec.gov. Information regarding how the Registrant voted proxies related to portfolio securities during the most recent 12-month period ended June 30 is available without charge on the Registrant’s website at www.ingfunds.com and on the SEC’s website at www.sec.gov.
QUARTERLY PORTFOLIO HOLDINGS
The Registrant files its complete schedule of portfolio holdings with the SEC for the first and third quarters of each fiscal year on Form N-Q. The Registrant’s Forms N-Q are available on the SEC’s website at www.sec.gov. The Registrant’s Forms N-Q may be reviewed and copied at the SEC’s Public Reference Room in Washington, DC, and information on the operation of the Public Reference Room may be obtained by calling 1-800-SEC-0330; and is available upon request from the Registrant by calling Shareholder Services toll-free at 800-992-0180.
Investment Manager
ING Investments, LLC
7337 E. Doubletree Ranch Road
Scottsdale, Arizona 85258
Administrator
ING Funds Services, LLC
7337 E. Doubletree Ranch Road
Scottsdale, Arizona 85258
Distributor
ING Funds Distributor, LLC
7337 E. Doubletree Ranch Road
Scottsdale, Arizona 85258
1-800-334-3444
Transfer Agent
DST Systems, Inc.
P.O. Box 419368
Kansas City, Missouri 64141
Custodian
The Bank of New York
100 Colonial Center Parkway, Suite 300
Lake Mary, Florida 32746
Legal Counsel
Dechert
1775 I Street, N.W.
Washington, D.C. 20006
Independent Registered Public Accounting Firm
KPMG LLP
99 High Street
Boston, Massachussetts 02110
For more complete information, or to obtain a prospectus on any ING fund, please call your Investment Professional or ING Funds Distributor, LLC at (800) 992-0180 or log on to www.ingfunds.com. The prospectus should be read carefully before investing. Consider the fund’s investment objectives, risks, charges and expenses carefully before investing. The prospectus contains this information and other information about the fund.

| PRAR-UINTLIQ | (1005-122905) |
Item 2. Code of Ethics.
As of the end of the period covered by this report, Registrant had adopted a code of ethics, as defined in Item 2 of Form N-CSR, that applies to the Registrant’s principal executive officer and principal financial officer. There were no amendments to the Code during the period covered by the report. The Registrant did not grant any waivers, including implicit waivers, from any provisions of the Code during the period covered by this report. The code of ethics is filed herewith pursuant to Item 10(a)(1), Exhibit 99.CODE ETH.
Item 3. Audit Committee Financial Expert.
The Board of Trustees has determined that Patrick W. Kenny is an audit committee financial expert, as defined in Item 3 of Form N-CSR. Mr. Kenny is “independent” for purposes of Item 3 of Form N-CSR.
Item 4. Principal Accountant Fees and Services.
(a) Audit Fees: The aggregate fees billed for each of the last two fiscal years for professional services rendered by KPMG LLP (“KPMG”), the principal accountant for the audit of the registrant’s annual financial statements, for services that are normally provided by the accountant in connection with statutory and regulatory filings or engagements for those fiscal years were $125,478 for year ended October 31, 2005 and $123,578 for year ended October 31, 2004.
(b) Audit-Related Fees: The aggregate fees billed in each of the last two fiscal years for assurance and related services by KPMG that are reasonably related to the performance of the audit of the registrant’s financial statements and are not reported under paragraph (a) of this Item.
None
(c) Tax Fees: The aggregate fees billed in each of the last two fiscal years for professional services rendered by KPMG for tax compliance, tax advice, and tax planning were $882 in the year ended October 31, 2005 and $13,330 in the year ended October 31, 2004. Such services included review of excise distribution calculations (if applicable), preparation of the Funds’ federal, state and excise tax returns, tax services related to mergers and routine consulting.
None
(d) All Other Fees: The aggregate fees billed in each of the last two fiscal years for products and services provided by KPMG, other than the services reported in paragraphs (a) through (c) of this Item.
None
(e) (1) Audit Committee Pre-Approval Policies and Procedures
2
AUDIT AND NON-AUDIT SERVICES
PRE-APPROVAL POLICY
I. Statement of Principles
Under the Sarbanes-Oxley Act of 2002 (the “Act”), the Audit Committee of the Board of Directors or Trustees (the “Committee”) of the ING Funds (each a “Fund,” collectively, the “Funds”) set out on Exhibit A to this Audit and Non-Audit Services Pre-Approval Policy (“Policy”) is responsible for the oversight of the work of the Funds’ independent auditors. As part of its responsibilities, the Committee must pre-approve the audit and non-audit services performed by the auditors in order to assure that the provision of these services does not impair the auditors’ independence from the Funds. The Committee has adopted, and the Board has ratified, this Policy, which sets out the procedures and conditions under which the services of the independent auditors may be pre-approved.
Under Securities and Exchange Commission (“SEC”) rules promulgated in accordance with the Act, the Funds may establish two different approaches to pre-approving audit and non-audit services. The Committee may approve services without consideration of specific case-by-case services (“general pre-approval”) or it may pre-approve specific services (“specific pre-approval”). The Committee believes that the combination of these approaches contemplated in this Policy results in an effective and efficient method for pre-approving audit and non-audit services to be performed by the Funds’ independent auditors. Under this Policy, services that are not of a type that may receive general pre-approval require specific pre-approval by the Committee. Any proposed services that exceed pre-approved cost levels or budgeted amounts will also require the Committee’s specific pre-approval.
For both types of approval, the Committee considers whether the subject services are consistent with the SEC’s rules on auditor independence and that such services are compatible with maintaining the auditors independence. The Committee also considers whether a particular audit firm is in the best position to provide effective and efficient services to the Funds. Reasons that the auditors are in the best position include the auditors’ familiarity with the Funds’ business, personnel, culture, accounting systems, risk profile, and other factors, and whether the services will enhance the Funds’ ability to manage and control risk or improve audit quality. Such factors will be considered as a whole, with no one factor being determinative.
The appendices attached to this Policy describe the audit, audit-related, tax-related, and other services that have the Committee’s general pre-approval. For any service that has been approved through general pre-approval, the general pre-approval will remain in place for a period 12 months from the date of pre-approval, unless the Committee determines that a different period is appropriate. The Committee will annually review and pre-approve the services that may be provided by the independent auditors without specific pre-approval. The Committee will revise the list of services subject to general pre-approval as appropriate. This Policy does not serve as a delegation to Fund management of the Committee’s duty to pre-approve services performed by the Funds’ independent auditors.
II. Audit Services
The annual audit services engagement terms and fees are subject to the Committee’s specific pre-approval. Audit services are those services that are normally provided by auditors in connection with statutory and regulatory filings or engagements or those that generally only independent auditors can reasonably provide. They include the Funds’ annual financial statement audit and procedures that the independent auditors must perform in order to form an opinion on the Funds’ financial statements (e.g., information systems and procedural reviews and testing). The Committee will monitor the audit services engagement and approve any changes in terms, conditions or fees deemed by the Committee to be necessary or appropriate.
The Committee may grant general pre-approval to other audit services, such as statutory audits and services associated with SEC registration statements, periodic reports and other documents filed with the SEC or issued in connection with securities offerings.
The Committee has pre-approved the audit services listed on Appendix A. The Committee must specifically approve all audit services not listed on Appendix A.
III. Audit-related Services
Audit-related services are assurance and related services that are reasonably related to the performance of the audit or the review of the Funds’ financial statements or are traditionally performed by the independent auditors. The Committee believes that the provision of audit-related services will not impair the independent auditors’ independence, and therefore may grant pre-approval to audit-related services. Audit-related services include accounting consultations related to accounting, financial reporting or disclosure matters not classified as “audit services;” assistance with understanding and implementing new accounting and financial reporting guidance from rulemaking authorities; agreed-upon or expanded audit procedures relating to accounting and/or billing records required to respond to or comply with financial, accounting or regulatory reporting matters; and assistance with internal control reporting requirements under Form N-SAR or Form N-CSR.
The Committee has pre-approved the audit-related services listed on Appendix B. The Committee must specifically approve all audit-related services not listed on Appendix B.
IV. Tax Services
The Committee believes the independent auditors can provide tax services to the Funds, including tax compliance, tax planning, and tax advice, without compromising the auditors’ independence. Therefore, the Committee may grant general pre-approval with respect to tax services historically provided by the Funds’ independent auditors that do not, in the Committee’s view, impair auditor independence and that are consistent with the SEC’s rules on auditor independence.
The Committee will not grant pre-approval if the independent auditors initially recommends a transaction the sole business purpose of which is tax avoidance and the tax treatment of which may not be supported in the Internal Revenue Code and related regulations. The Committee may consult
2
outside counsel to determine that tax planning and reporting positions are consistent with this Policy.
The Committee has pre-approved the tax-related services listed on Appendix C. The Committee must specifically approve all tax-related services not listed on Appendix C.
V. Other Services
The Committee believes it may grant approval of non-audit services that are permissible services for independent auditors to a Fund. The Committee has determined to grant general pre-approval to other services that it believes are routine and recurring, do not impair auditor independence, and are consistent with SEC rules on auditor independence.
The Committee has pre-approved the non-audit services listed on Appendix D. The Committee must specifically approve all non-audit services not listed on Appendix D.
A list of the SEC’s prohibited non-audit services is attached to this Policy as Appendix E. The SEC’s rules and relevant guidance should be consulted to determine the precise definitions of these impermissible services and the applicability of exceptions to certain of the SEC’s prohibitions.
VI. Pre-approval of Fee levels and Budgeted Amounts
The Committee will annually establish pre-approval fee levels or budgeted amounts for audit, audit-related, tax and non-audit services to be provided to the Funds by the independent auditors. Any proposed services exceeding these levels or amounts require the Committee’s specific pre-approval. The Committee considers fees for audit and non-audit services when deciding whether to pre-approve services. The Committee may determine, for a pre-approval period of 12 months, the appropriate ratio between the total amount of fees for the Fund’s audit, audit-related, and tax services (including fees for services provided to Fund affiliates that are subject to pre-approval), and the total amount of fees for certain permissible non-audit services for the Fund classified as other services (including any such services provided to Fund affiliates that are subject to pre-approval).
VII. Procedures
Requests or applications for services to be provided by the independent auditors will be submitted to management. If management determines that the services do not fall within those services generally pre-approved by the Committee and set out in the appendices to these procedures, management will submit the services to the Committee or its delagee. Any such submission will include a detailed description of the services to be rendered. Notwithstanding this paragraph, the Committee will, on a quarterly basis, receive from the independent auditors a list of services provided for the previous calendar quarter on a cumulative basis by the auditors during the Pre-Approval Period.
3
VIII. Delegation
The Committee may delegate pre-approval authority to one or more of the Committee’s members. Any member or members to whom such pre-approval authority is delegated must report any pre-approval decisions, including any pre-approved services, to the Committee at its next scheduled meeting. The Committee will identify any member to whom pre-approval authority is delegated in writing. The member will retain such authority for a period of 12 months from the date of pre-approval unless the Committee determines that a different period is appropriate. The period of delegated authority may be terminated by the Committee or at the option of the member.
IX. Additional Requirements
The Committee will take any measures the Committee deems necessary or appropriate to oversee the work of the independent auditors and to assure the auditors’ independence from the Funds. This may include reviewing a formal written statement from the independent auditors delineating all relationships between the auditors and the Funds, consistent with Independence Standards Board No. 1, and discussing with the auditors their methods and procedures for ensuring independence.
Amended: March 29, 2005
4
Appendix A
Pre-Approved Audit Services for the Pre-Approval Period January 1, 2005 through December 31, 2005
Service
| | The Fund(s) | | Fee Range | |
Statutory audits or financial audits (including tax services associated with audit services) | | ý | | As presented to
Audit
Committee(1) | |
| | | | | |
Services associated with SEC registration statements, periodic reports and other documents filed with the SEC or other documents issued in connection with securities offerings (e.g., consents), and assistance in responding to SEC comment letters. | | ý | | Not to exceed
$8,925 per
filing | |
| | | | | |
Consultations by Fund management with respect to accounting or disclosure treatment of transactions or events and/or the actual or potential effect of final or proposed rules, standards or interpretations by the SEC, Financial Accounting Standards Board, or other regulatory or standard setting bodies. | | ý | | Not to exceed
$8,000 during
the Pre-
Approval
Period | |
| | | | | |
Seed capital audit and related review and issuance of consent on the N-2 registration statement | | ý | | Not to exceed
$12,000 per
audit | |
(1) | | For new Funds launched during the Pre-Approval Period, the fee ranges pre-approved will be the same as those for existing Funds, pro-rated in accordance with inception dates as provided in the auditors’ Proposal or any Engagement Letter covering the period at issue. Fees in the Engagement Letter will be controlling. |
5
Appendix B
Pre-Approved Audit-Related Services for the Pre-Approval Period January 1, 2005 through December 31, 2005
Service
| | The Fund(s) | | Fund Affiliates | | Fee Range | |
Services related to Fund mergers (Excludes tax services - See Appendix C for tax services associated with Fund mergers) | | ý | | ý | | Not to exceed
$10,000 per
merger | |
| | | | | | | |
Consultations by Fund management with respect to accounting or disclosure treatment of transactions or events and/or the actual or potential effect of final or proposed rules, standards or interpretations by the SEC, Financial Accounting Standards Board, or other regulatory or standard setting bodies. [Note: Under SEC rules some consultations may be “audit” services and others may be “audit-related” services.] | | ý | | | | Not to exceed
$5,000 per
occurrence during
the Pre-Approval
Period | |
| | | | | | | |
Review of the Funds’ semi-annual financial statements | | ý | | | | Not to exceed
$2,000 per set of
financial
statements per
fund | |
| | | | | | | |
Reports to regulatory or government agencies related to the annual engagement | | ý | | | | Up to $5,000 per
occurrence during
the Pre-Approval
Period | |
| | | | | | | |
Regulatory compliance assistance | | ý | | ý | | Not to exceed
$5,000 per quarter | |
| | | | | | | |
Training courses | | ý | | ý | | Not to exceed
$2,000 per course | |
| | | | | | | |
For Prime Rate Trust, agreed upon procedures for quarterly reports to rating agencies | | ý | | | | Not to exceed
$9,000 per quarter | |
| | | | | | | |
For Prime Rate Trust and Senior Income Fund, agreed upon procedures for the Revolving Credit and Security Agreement with Citigroup | | ý | | | | Not to exceed
$20,000 per fund
per year | |
6
Appendix C
Pre-Approved Tax Services for the Pre-Approval Period January 1, 2005 through December 31, 2005
Service
| | The Fund(s) | | Fund
Affiliates | | Fee Range | |
Preparation of federal and state income tax returns and federal excise tax returns for the Funds including assistance and review with excise tax distributions. | | ý | | | | As presented to
Audit
Committee(2) | |
| | | | | | | |
Review of IRC Sections 851(b) and 817(h) diversification testing on a real-time basis | | ý | | | | As presented to
Audit
Committee(2) | |
| | | | | | | |
Review of year-end reporting for 1099’s | | ý | | | | As presented to
Audit
Committee(2) | |
| | | | | | | |
Tax assistance and advice regarding statutory, regulatory or administrative developments | | ý | | ý | | Not to exceed
$5,000 for the
Funds or for the
Funds’
investment
adviser during
the Pre-
Approval Period | |
| | | | | | | |
International tax services (e.g., Taiwan and India) | | ý | | | | Not to exceed
$5,000 per Fund
during the Pre-
Approval Period | |
(2) | | For new Funds launched during the Pre-Approval Period, the fee ranges pre-approved will be the same as those for existing Funds, pro-rated in accordance with inception dates as provided in the auditors’ Proposal or any Engagement Letter covering the period at issue. Fees in the Engagement Letter will be controlling. |
7
Service
| | The Fund(s) | | Fund
Affiliates | | Fee Range | |
Tax training courses | | ý | | ý | | Not to exceed
$2,000 per
course during
the Pre-
Approval Period | |
| | | | | | | |
Tax services associated with Fund mergers | | ý | | ý | | Not to exceed
$8,000 per
merger during
the Pre-
Approval Period | |
| | | | | | | |
Tax services related to the preparation of annual PFIC statements and annual Form 5471 (Controlled Foreign Corporation) for structured finance vehicles | | ý | | | | Not to exceed
$18,000 during
the Pre-
Approval Period | |
| | | | | | | |
Tax services related to CLOs and CBOs | | ý | | | | Not to exceed
$15,000 per
quarter | |
| | | | | | | |
Loan Staff Services | | | | ý | | Not to exceed
$15,000 during
the Pre-
Approval Period | |
| | | | | | | |
Other tax-related assistance and consultation, including, without limitation, assistance in evaluating the tax treatment of swaps, swaptions, mortgage-backed securities and other derivatives. | | ý | | | | Not to exceed
$120,000 during
the Pre-
Approval Period | |
8
Appendix D
Pre-Approved Other Services for the Pre-Approval Period January 1, 2005 through December 31, 2005
Service
| | The Fund(s) | | Fund Affiliates | | Fee Range | |
Agreed-upon procedures for Class B share 12b-1 programs | | | | ý | | Not to exceed
$50,000
during the Pre-
Approval
Period | |
| | | | | | | |
Security counts performed pursuant to Rule 17f-2 of the 1940 Act (i.e., counts for Funds holding securities with affiliated sub-custodians) | | ý | | | | Not to exceed
$5,000 per
Fund during
the Pre-
Approval
Period | |
9
Appendix E
Prohibited Non-Audit Services
Dated: January 1, 2005
• Bookkeeping or other services related to the accounting records or financial statements of the Funds
• Financial information systems design and implementation
• Appraisal or valuation services, fairness opinions, or contribution-in-kind reports
• Actuarial services
• Internal audit outsourcing services
• Management functions
• Human resources
• Broker-dealer, investment adviser, or investment banking services
• Legal services
• Expert services unrelated to the audit
• Any other service that the Public Company Accounting Oversight Board determines, by regulation, is impermissible
10
EXHIBIT A
ING INVESTORS TRUST (formerly, THE GCG TRUST)
ING EQUITY TRUST
ING FUNDS TRUST
ING GLOBAL EQUITY DIVIDEND AND PREMIUM OPPORTUNITY FUND
ING INVESTMENT FUNDS, INC.
ING MAYFLOWER TRUST
ING MUTUAL FUNDS
ING PARTNERS, INC.
ING PRIME RATE TRUST
ING SENIOR INCOME FUND
ING VARIABLE INSURANCE TRUST
ING VARIABLE PRODUCTS TRUST
ING VP EMERGING MARKETS FUND, INC.
ING VP NATURAL RESOURCES TRUST
USLICO SERIES FUND
(e) (2) Percentage of services referred to in 4(b) — (4)(d) that were approved by the audit committee
100% of the services were approved by the audit committee.
(f) Percentage of hours expended attributable to work performed by other than full time employees of KPMG if greater than 50%.
Not applicable.
(g) Non-Audit Fees: The non-audit fees billed by the registrant’s accountant for services rendered to the registrant, and rendered to the registrant’s investment adviser, and any entity controlling, controlled by, or under common control with the adviser that provides ongoing services to the registrant for each of the last two fiscal years of the registrant were $136,483 for year ended October 31, 2005 and $49,057 for year ended October 31, 2004.
(h) Principal Accountants Independence: The Registrant’s Audit committee has considered whether the provision of non-audit services that were rendered to the registrant’s investment adviser and any entity controlling, controlled by, or under common control with the investment adviser that provides ongoing services to the registrant that were not pre-approved pursuant to Rule 2-01(c)(7)(ii) of Regulation S-X is compatible with maintaining KPMG’s independence.
3
Item 5. Audit Committee of Listed Registrants.
Not applicable.
Item 6. Schedule of Investments
Schedule is included as part of the report to shareholders filed under Item 1 of this Form.
Item 7. Disclosure of Proxy Voting Policies and Procedures for Closed-End Management Investment Companies.
Not applicable.
Item 8. Portfolio Managers of Closed-End Management Investment Companies.
Not applicable.
Item 9. Purchases of Equity Securities by Closed-End Management Investment Company and Affiliated Purchasers
Not applicable.
Item 10. Submission of Matters to a Vote of Security Holders.
The Board has a Nominating Committee for the purpose of considering and presenting to the Board candidates it proposes for nomination to fill Independent Trustee vacancies on the Board. The Committee currently consists of all Independent Trustees of the Board (6 individuals). The Nominating Committee operates pursuant to a Charter approved by the Board. The primary purpose of the Nominating Committee is to consider and present to the Board the candidates it proposes for nomination to fill vacancies on the Board. In evaluating candidates, the Nominating Committee may consider a variety of factors, but it has not at this time set any specific minimum qualifications that must be met. Specific qualifications of candidates for Board membership will be based on the needs of the Board at the time of nomination.
The Nominating Committee is willing to consider nominations received from shareholders and shall assess shareholder nominees in the same manner as it reviews its own nominees. A shareholder nominee for director should be submitted in writing to the Fund’s Secretary. Any such shareholder nomination should include at a minimum the following information as to each individual proposed for nomination as trustee: such individual’s written consent to be named in the proxy statement as a nominee (if nominated) and to serve as a trustee (if elected), and all information relating to such individual that is required to be disclosed in the solicitation of proxies for election of trustees, or is otherwise required, in each case under applicable federal securities laws, rules and regulations.
The Secretary shall submit all nominations received in a timely manner to the Nominating Committee. To be timely, any such submission must be delivered to the Fund’s Secretary not earlier than the 90th day prior to such meeting and not later than the close of business on the later of the 60th day prior to such meeting or the 10th day following the day on which public announcement of the date of the meeting is first made, by either disclosure in a press release or in a document publicly filed by the Fund with the Securities and Exchange Commission.
Item 11. Controls and Procedures.
(a) Based on our evaluation conducted within 90 days of the filing date, hereof, the design and operation of the registrant’s disclosure controls and procedures are effective to ensure that material information relating to the registrant is made known to the certifying officers by others within the appropriate entities, particularly during the period in which Forms N-CSR are being prepared, and the registrant’s disclosure controls and procedures allow timely preparation and review of the information for the registrant’s Form N-CSR and the officer certifications of such Form N-CSR.
(b) There were no significant changes in the registrant’s internal controls that occurred during the second fiscal quarter of the period covered by this report that has materially affected, or is reasonably likely to materially affect, the registrant’s internal control over financial reporting.
Item 12. Exhibits.
(a)(1) Code of Ethics pursuant to Item 2 of Form N-CSR is filed and attached hereto as
EX-99.CODE ETH.
(a)(2) A separate certification for each principal executive officer and principal financial officer of the registrant as required by Rule 30a-2 under the Act (17 CFR 270.30a-2) is attached hereto as EX-99.CERT.
(b) The officer certifications required by Section 906 of the Sarbanes-Oxley Act of 2002 are attached hereto as EX-99.906CERT.
(3) Not applicable.
4
SIGNATURES
Pursuant to the requirements of the Securities Exchange Act of 1934 and the Investment Company Act of 1940, the registrant has duly caused this report to be signed on its behalf by the undersigned, thereunto duly authorized.
(Registrant): ING Mayflower Trust
By | /s/ James M. Hennessy |
| James M. Hennessy |
| President and Chief Executive Officer |
Date: January 9, 2006
Pursuant to the requirements of the Securities Exchange Act of 1934 and the Investment Company Act of 1940, this report has been signed below by the following persons on behalf of the registrant and in the capacities and on the dates indicated.
By | /s/ James M. Hennessy |
| James M. Hennessy |
| President and Chief Executive Officer |
Date: January 9, 2006
By | /s/ Todd Modic |
| Todd Modic |
| Senior Vice President and Chief Financial Officer |
Date: January 9, 2006
5