OMB APPROVAL
OMB Number: 3235-0570
Expires: August 31, 2020
Estimated average burden
hours per response……20.6
UNITED STATES
SECURITIES AND EXCHANGE COMMISSION
Washington, D.C. 20549
FORM N-CSR
CERTIFIED SHAREHOLDER REPORT OF REGISTERED MANAGEMENT
INVESTMENT COMPANIES
Investment Company Act file number 811-07986
The Alger Institutional Funds
(Exact name of registrant as specified in charter)
360 Park Avenue South New York, New York 10010
(Address of principal executive offices) (Zip code)
Mr. Hal Liebes
Fred Alger Management, Inc.
360 Park Avenue South
New York, New York 10010
(Name and address of agent for service)
Registrant's telephone number, including area code: 212-806-8800
Date of fiscal year end: October 31
Date of reporting period: April 30, 2018
ITEM 1. REPORT(S) TO STOCKHOLDERS.
Table of Contents
The Alger Institutional Funds
|
| Shareholders’ Letter | 1 |
| Fund Highlights | 11 |
| Portfolio Summary | 19 |
| Schedules of Investments | 20 |
| Statements of Assets and Liabilities | 37 |
| Statements of Operations | 41 |
| Statements of Changes in Net Assets | 43 |
| Financial Highlights | 47 |
| Notes to Financial Statements | 62 |
| Additional Information | 87 |
Go Paperless With Alger Electronic Delivery Service
Alger is pleased to provide you with the ability to access regulatory materials online.
When documents such as prospectuses and annual and semi-annual reports are
available, we’ll send you an e-mail notification with a convenient link that will take you
directly to the fund information on our website. To sign up for this free service, simply
enroll at www.icsdelivery.com/alger.
Shareholders’ Letter April 30, 2018
Dear Shareholders,
Corporations Generate Stellar Earnings but Emotions Spark Volatility
After a nearly one-and-a-half-year period during which the S&P 500 Index didn’t experience
a single monthly decline, concerns about potential inflation caused the index to tumble
11.84% in late January and early February. We believe investors may have subsequently
determined that the decline was excessive when considering the strength of corporate
fundamentals and the potential for additional economic growth. The market selloff was
therefore short-lived. The combination of strong performance leading up to the January
peak and the 4.56% market gain after the market pullback resulted in the S&P 500 Index
advancing 3.82% during the six-month reporting period ended April 30, 2018.
Not surprisingly, the market decline, which lasted less than two weeks, prompted pundits
to renew their predictions that the ongoing bull market was ending. As evidenced by the
positive performance of equities during the reporting period, the renewed predictions were
a continuation of pundits being consistently wrong since the end of the Great Recession
with negative views, driven by what we believe has been market noise. In this letter, we urge
investors to focus on the strength of corporate fundamentals and economic growth. These
factors, we believe, can potentially support equity gains in the foreseeable future. We explain
why equities still carry potential for generating attractive returns despite concerns that we
believe are misguided about the length of the current bull market, potential for inflation,
and fears that President Donald Trump’s proposed tariffs could hinder global trade.
Market Overview
News that wages were 2.9% higher in January of 2018 than in January of 2017 strengthened
fears of inflation and ushered in market volatility. Some investors may also have believed
that market gains, equity valuations, and optimism were excessive relative to corporate
fundamentals and the potential benefits of lower taxes resulting from tax reform. Despite
those concerns, anticipation of strong first-quarter earnings helped reverse the decline. The
recovery in equity prices was further supported by corporations eventually reporting strong
earnings growth. Non-U.S. equities followed a similar pattern with the MSCI Emerging
Markets Index gaining 4.94% and the MSCI ACWI ex USA Index advancing 3.73% for the
six-month reporting period.
As growth equity investors, we are encouraged by the continuation of the multiyear
outperformance of growth stocks. The Russell 1000 Growth Index led with a 5.68% return
compared to 1.94% of its value-oriented counterpart during the six-month reporting period.
Growth outperformance also occurred with mid- and small-cap stocks. At the same time,
rising interest rates caused investors to continue dumping bond-like equities in favor of
growth equities, as illustrated by the Consumer Discretionary and Information Technology
sectors’ outperformance of the overall S&P 500 Index. Sectors such as Real Estate, Utilities,
and Consumer Staples that generally consist of companies that offer higher dividend yields
but less potential for earnings growth lagged with negative returns. At Alger, we have
previously written about the potential for investors to rapidly flee bond-like equities in favor
of growth stocks, so this development was no surprise to our firm.
- 1 -
The Importance of Earnings Growth and Innovation
At Alger, our in-depth research has led us to believe that corporate fundamentals are healthy
with businesses having strong potential for growing their earnings. Our research also points
to the economy being stronger than commonly believed and therefore highly supportive
of earnings growth. We have also maintained that earnings growth resulting from lower
corporate taxes could be stronger than commonly believed. While some observers have
focused on how tax reform has directly boosted earnings by cutting corporate expenses in
the form of taxes, we have also assessed the potential for businesses to use their tax savings
to increase their investments in growth initiatives. Tax reform is also supporting business
spending by allowing full expensing of capital expenditures. Banks’ increased willingness
to provide financing to corporations is an additional tailwind for business spending. This
increased spending, in turn, is providing opportunities for certain corporations to improve
their earnings by offering products and services that can help businesses grow and increase
productivity.
Our belief that corporate earnings would be stronger than expected was validated by first-
quarter results. As of the end of the six-month reporting period, 81% of S&P 500 companies
had reported first-quarter numbers. Of those, 78% reported positive earnings-per-share
(EPS) surprises and 77% reported positive sales surprises. At that pace, the percentage of
positive EPS surprises would be the highest since FactSet Research started tracking earnings
in the third quarter of 2008. Among companies that had reported, earnings grew 24.2%
compared to earlier estimates of 17.1%.
We believe that earnings growth drives long-term equity performance. On one hand,
companies with strong earnings can reward investors with stock buybacks and dividends.
Companies can also use profits to develop new and disruptive products and services that
can capture market share. Perhaps most importantly, earnings also support valuations.
Keeping the Economy in Perspective
Economists and investors frequently focus on monetary policy to gain insight into
economic cycles. Optimism often grows as the Federal Reserve cuts the fed funds rate and
pessimism spikes when the central bank begins tightening monetary policy. We agree that it
is important to understand the relationship of monetary tightening, the economy, and equity
performance, but in our view, Fed policy appears to be a long way from sparking a recession
or a bear market. Indeed, bull markets have traditionally persisted during fed rate increases
and recessions typically haven’t occurred until the real fed funds rate, which is the nominal
fed funds rate minus inflation, hits 2% or higher. With the real fed funds rate currently at
about 0% and the Federal Reserve expected to raise rates approximately 75 basis points a
year, we maintain that monetary policy is unlikely to kill the economic recovery or stifle the
equity market in the foreseeable future.1
We believe that bonds are a different matter. During periods of fed funds rate increases,
the 10-year Treasury bond has generated an average annual return of -2.7% compared to
the average annual return of 6.2% of the S&P 500 Index.2 We also believe that valuations
imply that earnings multiples may not suffer as rates rise, with the S&P 500 Index having
an EPS yield on April 30 that was approximately 328 bps higher than the yield of the 10-
year Treasury bond. While bonds are susceptible to monetary tightening, we believe the
economy is strong and can absorb the impact of fed rate increases.3
- 2 -
Outlook
In past years, economic growth has been driven primarily by consumer spending, but
business spending, which is growing at a faster rate than the nation’s gross domestic product,
is now playing a more significant role. In our view, business spending is likely to increase
in the coming months and provide additional support to the U.S. economy while helping
corporations boost productivity and earnings. Other indicators, such as the Conference
Board’s Leading Economic Index (LEI), are encouraging. The LEI typically leads S&P 500
Index earnings by 6 to 18 months, so its record high reading of 109.4 in April suggests that
the bull market still has a long runway.
We acknowledge that over the long term, monetary tightening, rising labor costs, and tariffs
leading to a potential trade war could be a headwind for equities. We think the best way
to address those risks is to invest in highly innovative companies that can disrupt their
industries by creating new products and services. During the global financial crisis, for
example, U.S. e-commerce and internet advertising spending grew 33% while total U.S.
retail sales increased only 1%. At the same time, we are experiencing unprecedented levels
of innovation, with artificial intelligence, cloud computing, internet connectivity, genome
sequencing, and novel drug developments allowing leading companies to disrupt their
respective industries with new products and business models.
In closing, we urge investors to focus on corporate fundamentals rather than react hastily
to what we believe are short-sighted views of market pundits. As an active, research-driven
investor, we intend to continue seeking out innovative companies that can grow their
earnings and revenues.
Portfolio Matters
Alger Capital Appreciation Institutional Fund
The Alger Capital Appreciation Institutional Fund returned 6.29% for the fiscal six-month
period ended April 30, 2018, compared to the 5.68% return of the Russell 1000 Growth
Index.
Contributors to Performance
During the reporting period, the largest sector weightings were Information Technology
and Consumer Discretionary. The largest sector overweight was Information Technology
and the largest underweight was Consumer Staples. The Consumer Discretionary and
Health Care sectors provided the greatest contributions to relative performance. Regarding
individual positions, Amazon.com, Inc.; Microsoft Corp.; Visa, Inc., Cl. A; UnitedHealth
Group, Inc.; and Netflix, Inc. were the top contributors to performance.
Amazon is well known as a leading U.S. online retailer. Its shares contributed to performance
as Amazon has enjoyed strong high unit volume growth, in large part driven by the company
continuing to take market share from traditional brick and mortar retailers. Its leadership in
the sizable and expanding web hosting industry also supported the performance of Amazon
shares.
Detractors from Performance
The Industrials and Real Estate sectors were among the sectors that detracted from results.
Regarding individual positions, Broadcom, Inc.; Facebook, Inc., Cl. A; Newell Brands, Inc.;
Equinix, Inc.; and Stanley Black & Decker, Inc. were the top detractors from performance.
- 3 -
Facebook operates the world’s largest social network. Facebook continues to take advertising
market share from print, radio, and television media because the social network offers
brands a robust return on digital advertising spending. Investors have been excited by the
growth of both Instagram, which is Facebook’s video and picture sharing platform, and
WhatsApp, which is the company’s texting and voice over internet protocol service. Shares
of the company underperformed when some measures of Facebook consumer engagement
deteriorated, which suggested user fatigue may be occurring. Facebook also endured a
public relations crisis as management tried to contain media and customer fallout about a
data breach that led to reservations about the company’s privacy safeguards.
Alger Capital Appreciation Focus Fund
The Alger Capital Appreciation Focus Fund returned 8.80% for the fiscal six-month period
ended April 30, 2018, compared to the 5.68% return of the Russell 1000 Growth Index.
Contributors to Performance
During the reporting period, the largest sector weightings were Information Technology
and Consumer Discretionary. The largest sector overweight was Information Technology
and the largest underweight was Consumer Staples. The Consumer Discretionary and
Health Care sectors provided the greatest contributions to relative performance. Regarding
individual positions, Amazon.com, Inc.; Microsoft Corp.; Red Hat, Inc.; Salesforce.com,
Inc.; and Visa, Inc., Cl. A were the top contributors to performance. Shares of Amazon
outperformed in response to developments identified in the Alger Capital Appreciation
Institutional Fund discussion.
Detractors from Performance
The Industrials and Real Estate sectors were among the sectors that detracted from results.
Regarding individual positions, Broadcom, Inc.; Facebook, Inc., Cl. A; Newell Brands, Inc.;
Equinix, Inc.; and Applied Materials, Inc. were the top detractors from performance. Shares
of Facebook underperformed in response to developments identified in the Alger Capital
Appreciation Institutional Fund discussion.
Alger Mid Cap Growth Institutional Fund
The Alger Mid Cap Growth Institutional Fund returned 3.46% for the fiscal six-month
period ended April 30, 2018, compared to the 5.16% return of the Russell Midcap Growth
Index. In January 2018, Dan Chung, CEO and CIO of Alger, joined Teresa McRoberts,
Senior Vice President, in managing the Fund. In managing his portion of the portfolio, Mr.
Chung coordinates and oversees portfolio management allocations among Alger analysts.
Portfolio allocations among the investment professionals are rebalanced by Mr. Chung on a
recurring basis. Alex Goldman and Chris Walsh, formerly Senior Vice Presidents at Alger,
were previously part of the Fund’s portfolio management team and are no longer affiliated
with the Fund or with Alger.
Contributors to Performance
During the reporting period, the largest sector weightings were Information Technology
and Health Care. The largest sector overweight was Health Care and the largest underweight
was Consumer Staples. The Health Care and Financials sectors provided the greatest
contributions to relative performance. Among individual positions, Abiomed, Inc.; Insulet
Corp.; Red Hat, Inc.; Splunk, Inc.; and Match Group, Inc. were the top contributors to
performance.
- 4 -
Insulet provides a continuous insulin delivery system for people with insulin-dependent
diabetes. Insulet’s proprietary Omnipod Insulin Management System is the only tubeless
insulin delivery device available. Insulet also works with global pharmaceutical and
biotechnology companies to tailor its Omnipod system for the delivery of subcutaneous
drugs across multiple therapeutic areas. Its stock performance benefited from news that
UnitedHealth Group, Inc., which is a managed health care organization with approximately
50 million members, will provide coverage for Omnipod. Only a small portion of the
organization’s members currently use the system.
Detractors from Performance
The Information Technology and Industrials sectors were among the sectors that detracted
from results. Regarding individual positions, TESARO, Inc.; Coherent, Inc.; Clovis Oncology,
Inc.; Lumentum Holdings, Inc.; and Universal Display Corp. were the top detractors from
results. Universal Display develops and manufactures organic light emitting diode (OLED)
technologies and materials for display screens in computers, smartphones, televisions, and
automobiles. The company’s unique positioning has allowed it to capitalize on the growing
use of OLED across a broad set of customers in multiple industries. The company provided
fiscal year-end revenue guidance that was below expectations, further fueling speculation
that growth may be peaking for Apple’s OLED-based IPhone X and that Apple may not
use OLED in its new low-end iPhone model. However, we believe guidance is more a result
of timing than structural changes in OLED adoption.
Alger Small Cap Growth Institutional Fund
The Alger Small Cap Growth Institutional Fund returned 6.54% for the fiscal six-month
period ended April 30, 2018, compared to the 5.46% return of the Russell 2000 Growth
Index.
Contributors to Performance
During the reporting period, the largest sector weightings were Health Care and Information
Technology. The largest sector overweight was Health Care and the largest underweight
was Industrials. The Health Care and Information Technology sectors provided the largest
contributions to relative performance. Among individual positions, Abiomed, Inc.; Quidel
Corp.; Insulet Corp.; Tyler Technologies, Inc.; and Proofpoint, Inc. were the top contributors
to performance. Shares of Insulet performed strongly in response to developments
described in the Alger Mid Cap Growth Institutional Fund discussion.
Detractors from Performance
The Financials and Industrials sectors were among sectors that detracted from results.
Regarding individual positions, LendingClub Corp.; WageWorks, Inc.; Cognex Corp.;
ACADIA Pharmaceuticals, Inc.; and Intarcia Therapeutics, Inc. were the top detractors
from results. WageWorks is the leading provider and administrator of consumer-directed,
tax-advantaged benefit accounts that employers provide to employees. It offers its services
through its software-as-a-service (SaaS) platform. These accounts include health and
dependent care, commuter benefits, and other employee programs such as COBRA. Its
stock performance weakened in March after the company filed for an SEC extension for
releasing quarterly results. In filing the extension, WageWorks said its auditor had not yet
completed the audit of its financial statements due primarily to issues such as “managing
change and assessing risk in the areas of non-routine complex transactions.”
- 5 -
I thank you for putting your trust in Alger.
Sincerely,

Daniel C. Chung, CFA
Chief Investment Officer
Fred Alger Management, Inc.
1 Dan Chung and Brad Neuman, Capital Markets: Observations and Insights: Party Without the Punch? Fred Alger Management,
Spring 2018.
2 Ibid.
3 Ibid.
Investors cannot invest directly in an index. Index performance does not reflect the
deduction for fees, expenses or taxes.
This report and the financial statements contained herein are submitted for the general
information of shareholders of the funds. This report is not authorized for distribution to
prospective investors in a fund unless preceded or accompanied by an effective prospectus
for the fund. Fund returns represent the fiscal six-month period return of Class I shares.
The performance data quoted represents past performance, which is not an
indication or guarantee of future results.
Standardized performance results can be found on the following pages. The investment
return and principal value of an investment in a fund will fluctuate so that an investor’s shares,
when redeemed, may be worth more or less than their original cost. Current performance
may be lower or higher than the performance quoted. For performance data current to the
most recent month-end, visit us at www.alger.com, or call us at (800) 992-3863.
The views and opinions of the funds’ management in this report are as of the date of the
Shareholders’ Letter and are subject to change at any time subsequent to this date. There
is no guarantee that any of the assumptions that formed the basis for the opinions stated
herein are accurate or that they will materialize. Moreover, the information forming the
basis for such assumptions is from sources believed to be reliable; however, there is no
guarantee that such information is accurate. Any securities mentioned, whether owned in a
fund or otherwise, are considered in the context of the construction of an overall portfolio
of securities and therefore reference to them should not be construed as a recommendation
or offer to purchase or sell any such security. Inclusion of such securities in a fund and
transactions in such securities, if any, may be for a variety of reasons, including, without
limitation, in response to cash flows, inclusion in a benchmark, and risk control. The
reference to a specific security should also be understood in such context and not viewed as
a statement that the security is a significant holding in a fund. Please refer to the Schedules
of Investments for each fund that is included in this report for a complete list of fund
holdings as of April 30, 2018. Securities mentioned in the Shareholders’ Letter, if not found
in the Schedule of Investments, may have been held by the funds during the six-month
period.
- 6 -
Risk Disclosures
Alger Capital Appreciation Institutional Fund
Investing in the stock market involves gains and losses and may not be suitable for all
investors. The value of an investment may move up or down, sometimes rapidly and
unpredictably, and may be worth more or less than what you invested. Stocks tend to
be more volatile than other investments such as bonds. Growth stocks tend to be more
volatile than other stocks as the prices of growth stocks tend to be higher in relation to
their companies’ earnings and may be more sensitive to market, political, and economic
developments. The Fund may have a significant portion of its assets invested in securities
of companies conducting business in a related group of industries within a sector, which
may make the Fund more vulnerable to unfavorable developments in that sector than a fund
that has a more diversified portfolio. Many technology companies have limited operating
histories and prices of these companies’ securities have historically been more volatile
than other securities due to increased competition, government regulation, and risk of
obsolescence due to the progress of technological developments. Investing in companies
of small capitalizations involves the risk that such issuers may have limited product lines
or financial resources, lack management depth, or have more limited liquidity. The cost of
borrowing money to leverage may exceed the returns for the securities purchased or the
securities purchased may actually go down in value more quickly than if the Fund had not
borrowed.
Alger Capital Appreciation Focus Fund
Investing in the stock market involves gains and losses and may not be suitable for all
investors. The value of an investment may move up or down, sometimes rapidly and
unpredictably, and may be worth more or less than what you invested. Stocks tend to
be more volatile than other investments such as bonds. Growth stocks tend to be more
volatile than other stocks as the prices of growth stocks tend to be higher in relation to
their companies’ earnings and may be more sensitive to market, political, and economic
developments. The Fund may have a significant portion of its assets invested in securities
of companies conducting business in a related group of industries within a sector, which
may make the Fund more vulnerable to unfavorable developments in that sector than a fund
that has a more diversified portfolio. Many technology companies have limited operating
histories and prices of these companies’ securities have historically been more volatile
than other securities due to increased competition, government regulation, and risk of
obsolescence due to the progress of technological developments. Investing in companies
of all capitalizations involves the risk that smaller issuers may have limited product lines or
financial resources, lack management depth, or have more limited liquidity. The Fund may
have a more concentrated portfolio than other funds, so it may be more vulnerable to changes
in the market value of a single issuer and may be more susceptible to risks associated with
a single economic, political or regulatory occurrence than a fund that has a more diversified
portfolio. Active trading of portfolio securities may incur increased transaction costs and
brokerage commissions, and potentially increase taxes that a shareholder may pay, which can
lower the actual return on an investment.
Alger Mid Cap Growth Institutional Fund
Investing in the stock market involves gains and losses and may not be suitable for all
investors. The value of an investment may move up or down, sometimes rapidly and
unpredictably, and may be worth more or less than what you invested. Stocks tend to
- 7 -
be more volatile than other investments such as bonds. Growth stocks tend to be more
volatile than other stocks as the prices of growth stocks tend to be higher in relation to
their companies’ earnings and may be more sensitive to market, political, and economic
developments. Investing in companies of medium capitalizations involves the risk that such
issuers may have limited product lines or financial resources, lack management depth, or
have more limited liquidity. The Fund may have a significant portion of its assets invested
in securities of companies conducting business in a related group of industries within a
sector, which may make the Fund more vulnerable to unfavorable developments in that
sector than a fund that has a more diversified portfolio. Many technology companies have
limited operating histories and prices of these companies’ securities have historically been
more volatile than other securities due to increased competition, government regulation,
and risk of obsolescence due to the progress of technological developments. The Fund
may have a significant portion of its assets invested in securities of healthcare companies,
which may be significantly affected by intense competition, aggressive pricing, government
regulation, technological innovations, product obsolescence, patent considerations, product
compatibility and consumer preferences, and may be more volatile than the securities of
other companies. Foreign investing involves special risks including currency risk and risks
related to political, social, or economic conditions. Active trading of portfolio securities may
incur increased transaction costs and brokerage commissions, and potentially increase taxes
that a shareholder may pay, which can lower the actual return on an investment.
Alger Small Cap Growth Institutional Fund
Investing in the stock market involves gains and losses and may not be suitable for all
investors. The value of an investment may move up or down, sometimes rapidly and
unpredictably, and may be worth more or less than what you invested. Stocks tend to
be more volatile than other investments such as bonds. Growth stocks tend to be more
volatile than other stocks as the prices of growth stocks tend to be higher in relation to
their companies’ earnings and may be more sensitive to market, political, and economic
developments. Investing in companies of small capitalizations involves the risk that such
issuers may have limited product lines or financial resources, lack management depth, or
have more limited liquidity. The Fund may have a significant portion of its assets invested
in securities of companies conducting business in a related group of industries within a
sector, which may make the Fund more vulnerable to unfavorable developments in that
sector than a fund that has a more diversified portfolio. Many technology companies have
limited operating histories and prices of these companies’ securities have historically been
more volatile than other securities due to increased competition, government regulation,
and risk of obsolescence due to the progress of technological developments. The Fund
may have a significant portion of its assets invested in securities of healthcare companies,
which may be significantly affected by intense competition, aggressive pricing, government
regulation, technological innovations, product obsolescence, patent considerations, product
compatibility and consumer preferences, and may be more volatile than the securities of
other companies. Foreign investing involves special risks including currency risk and risks
related to political, social, or economic conditions.
For a more detailed discussion of the risks associated with a fund, please see the Prospectus.
- 8 -
Before investing, carefully consider a fund’s investment objective, risks, charges,
and expenses.
For a prospectus or a summary prospectus containing this and other information
about The Alger Institutional Funds call us at (800) 992-3863 or visit us at www.alger.
com. Read it carefully before investing.
Fred Alger & Company, Incorporated, Distributor. Member NYSE Euronext, SIPC.
NOT FDIC INSURED. NOT BANK GUARANTEED. MAY LOSE VALUE.
Definitions:
• S&P 500 Index: An index of large company stocks considered representative
of the U.S. stock market.
• Russell 1000 Growth Index: An index of common stocks designed to track
performance of large-capitalization companies with greater than average
growth orientation.
• Russell 1000 Value Index: An index of common stocks designed to measures
the performance of those Russell 1000 companies with lower price/book
ratios and lower forecasted growth values.
• Morgan Stanley Capital International (MSCI) All Country World Index
(ACWI) ex USA: An unmanaged, market capitalization-weighted index de-
signed to provide a broad measure of equity market performance throughout
the world, including both developing and emerging markets, but excluding
the United States.
• MSCI Emerging Markets Index: A free float-adjusted market capitalization
index designed to measure equity market performance in the global emerging
markets.
• Russell Midcap Growth Index: An index of common stocks designed to
track performance of medium-capitalization companies with greater than
average growth orientation.
• Russell 2500 Growth Index: An index of common stocks designed to track
performance of small- and medium-capitalization companies with greater
than average growth orientation.
• Russell 2000 Growth Index: An index of common stocks designed to track
performance of small-capitalization companies with greater than average
growth orientation.
• The Conference Board’s Leading Economic Index: An index based on a va-
riety of economic data and is part of the Conference Board’s analytic system
that seeks to signal peaks and troughs in the business cycle.
• FactSet Research Systems provides data and research for investment manag-
ers, hedge funds, investment bankers and other financial professionals.
- 9 -
| | | | | | | | | |
| FUND PERFORMANCE AS OF 3/31/18 (Unaudited) |
| AVERAGE ANNUAL TOTAL RETURNS |
| | | 1 | | 5 | | 10 | | SINCE | |
| | | YEAR | | YEARS | | YEARS | | INCEPTION | |
| Alger Capital Appreciation Institutional Class I (Inception | | | | | | | | | |
| 11/8/93) | 21.40 | % | 15.00 | % | 11.12 | % | 12.16 | % |
| Alger Capital Appreciation Institutional Class R (Inception | | | | | | | | | |
| 1/27/03)* | 20.85 | % | 14.45 | % | 10.58 | % | 11.60 | % |
| Alger Capital Appreciation Institutional Class Y (Inception | | | | | | | | | |
| 2/28/17) | 21.88 | % | n/a | | n/a | | 21.81 | % |
| Alger Capital Appreciation Institutional Class Z-2 | | | | | | | | | |
| (Inception 10/14/16) | | 21.78 | % | n/a | | n/a | | 22.94 | % |
| |
| Alger Capital Appreciation Focus Class A (Inception | | | | | | | | | |
| 12/31/12) | 18.87 | % | 15.18 | % | n/a | | 16.26 | % |
| Alger Capital Appreciation Focus Class C (Inception | | | | | | | | | |
| 12/31/12) | 23.45 | % | 15.56 | % | n/a | | 16.57 | % |
| Alger Capital Appreciation Focus Class I (Inception | | | | | | | | | |
| 11/8/93) | 25.47 | % | 16.53 | % | 9.44 | % | 9.15 | % |
| Alger Capital Appreciation Focus Class Y (Inception | | | | | | | | | |
| 2/28/17) | 25.99 | % | n/a | | n/a | | 25.98 | % |
| Alger Capital Appreciation Focus Class Z (Inception | | | | | | | | | |
| 12/31/12) | 25.82 | % | 16.83 | % | n/a | | 17.87 | % |
| |
| Alger Mid Cap Growth Institutional Class I (Inception | | | | | | | | | |
| 11/8/93) | 18.93 | % | 11.94 | % | 6.76 | % | 11.84 | % |
| Alger Mid Cap Growth Institutional Class R (Inception | | | | | | | | | |
| 1/27/03)* | 18.36 | % | 11.34 | % | 6.20 | % | 11.27 | % |
| Alger Mid Cap Growth Institutional Class Z-2 (Inception | | | | | | | | | |
| 10/14/16) | 19.27 | % | n/a | | n/a | | 23.64 | % |
| |
| Alger Small Cap Growth Institutional Class I | | | | | | | | | |
| (Inception 11/8/93) | | 22.61 | % | 10.49 | % | 8.96 | % | 9.47 | % |
| Alger Small Cap Growth Institutional Class R (Inception | | | | | | | | | |
| 1/27/03)* | 22.06 | % | 9.94 | % | 8.44 | % | 8.94 | % |
| Alger Small Cap Growth Institutional Class Z-2 (Inception | | | | | | | | | |
| 8/1/16) | 23.03 | % | n/a | | n/a | | 22.98 | % |
The performance data quoted represents past performance, which is not an indication or a guarantee of future
results. The Fund’s average annual total returns include changes in share price and reinvestment of dividends and
capital gains.
* Since inception performance is calculated from 11/08/93. Performance figures prior to 1/27/03, inception of Class R shares,
are those of the Fund's Class I Shares. The performance figures prior to 1/27/03 have been reduced to reflect the higher
operating expenses of Class R shares.
- 10 -
ALGER CAPITAL APPRECIATION INSTITUTIONAL FUND
Fund Highlights Through April 30, 2018 (Unaudited)
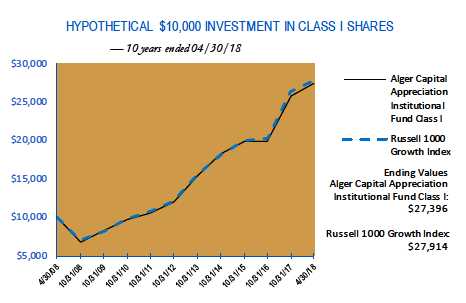
The chart above illustrates the change in value of a hypothetical $10,000 investment made in the Alger Capital
Appreciation Institutional Fund Class I shares and the Russell 1000 Growth Index (an unmanaged index of common
stocks) for the ten years ended April 30, 2018. Figures for the Alger Capital Appreciation Institutional Fund Class I
shares and the Russell 1000 Growth Index include reinvestment of dividends and capital gains. Performance for the
Alger Capital Appreciation Institutional Fund Class R, Class Y and Class Z-2 shares may vary from the results shown
above due to differences in expenses the class bears. Investors cannot invest directly in any index. Index performance
does not reflect deduction for fees, expenses, or taxes.
- 11 -
ALGER CAPITAL APPRECIATION INSTITUTIONAL FUND
Fund Highlights Through April 30, 2018 (Unaudited) (Continued)
| | | | | | | | |
| PERFORMANCE COMPARISON AS OF 04/30/18 |
| AVERAGE ANNUAL TOTAL RETURNS |
| | | | | | | | Since | |
| | 1 YEAR | | 5 YEARS | | 10 YEARS | | 11/8/1993 | |
| Class I (Inception 11/8/93) | 19.92 | % | 15.23 | % | 10.60 | % | 12.18 | % |
| Class R (Inception 1/27/03)* | 19.37 | % | 14.68 | % | 10.06 | % | 11.62 | % |
| Russell 1000 Growth Index | 18.96 | % | 15.13 | % | 10.81 | % | 9.35 | % |
| |
| |
| | | | | | | | Since | |
| | 1 YEAR | | 5 YEARS | | 10 YEARS | | 2/28/2017 | |
| Class Y (Inception 2/28/17) | 20.46 | % | n/a | | n/a | | 21.63 | % |
| Russell 1000 Growth Index | 18.96 | % | n/a | | n/a | | 19.48 | % |
| |
| |
| | | | | | | | Since | |
| | 1 YEAR | | 5 YEARS | | 10 YEARS | | 10/14/2016 | |
| Class Z-2 (Inception 10/14/16) | 20.33 | % | n/a | | n/a | | 22.74 | % |
| Russell 1000 Growth Index | 18.96 | % | n/a | | n/a | | 22.31 | % |
The performance data quoted represents past performance, which is not an indication or a guarantee of future results. The Fund’s
average annual total returns include changes in share price and reinvestment of dividends and capital gains. The chart and table above
do not reflect the deduction of taxes that a shareholder would have paid on Fund distributions or on the redemption of Fund shares.
Investment return and principal will fluctuate and the Fund’s shares, when redeemed, may be worth more or less than their original cost.
Current performance may be higher or lower than the performance quoted. For updated performance, visit us at www.alger.com or call
us at (800) 992-3863.
* Since inception performance is calculated from 11/08/93. Performance figures prior to 1/27/03, inception of Class R
shares, are those of the Fund's Class I Shares. The performance figures prior to 1/27/03 have been reduced to reflect the
higher operating expenses of Class R shares.
- 12 -
ALGER CAPITAL APPRECIATION FOCUS FUND
Fund Highlights Through April 30, 2018 (Unaudited)
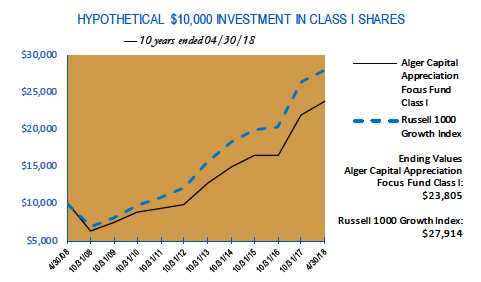
The chart above illustrates the change in value of a hypothetical $10,000 investment made in the Alger Capital
Appreciation Focus Fund Class I shares and the Russell 1000 Growth Index (an unmanaged index of common
stocks) for the ten years ended April 30, 2018. Beginning December 31, 2012 Alger Capital Appreciation Focus
Fund changed its investment strategy to invest in a smaller number of issuers. The figures for the Alger Capital
Appreciation Focus Fund Class I shares and the Russell 1000 Growth Index include reinvestment of dividends and
capital gains. Performance for the Alger Capital Appreciation Focus Fund Class A, Class C, Class Y and Class Z
shares may vary from the results shown above due to differences in expenses the class bears. Investors cannot invest
directly in any index. Index performance does not reflect deduction for fees, expenses, or taxes.
- 13 -
ALGER CAPITAL APPRECIATION FOCUS FUND
Fund Highlights Through April 30, 2018 (Unaudited) (Continued)
| | | | | | | | |
| PERFORMANCE COMPARISON AS OF 04/30/18 |
| AVERAGE ANNUAL TOTAL RETURNS |
| | | | | | | | Since | |
| | 1 YEAR | | 5 YEARS | | 10 YEARS | | 11/8/1993 | |
| Class I (Inception 11/8/93) | 24.50 | % | 17.01 | % | 9.06 | % | 9.21 | % |
| Russell 1000 Growth Index | 18.96 | % | 15.13 | % | 10.81 | % | 9.35 | % |
| |
| |
| | | | | | | | Since | |
| | 1 YEAR | | 5 YEARS | | 10 YEARS | | 12/31/2012 | |
| Class A (Inception 12/31/12) | 17.92 | % | 15.65 | % | n/a | | 16.44 | % |
| Class C (Inception 12/31/12) | 22.51 | % | 16.03 | % | n/a | | 16.73 | % |
| Class Z (Inception 12/31/12) | 24.87 | % | 17.32 | % | n/a | | 18.03 | % |
| Russell 1000 Growth Index | 18.96 | % | 15.13 | % | n/a | | 16.56 | % |
| |
| |
| | | | | | | | Since | |
| | 1 YEAR | | 5 YEARS | | 10 YEARS | | 2/28/2017 | |
| Class Y (Inception 2/28/17) | 25.04 | % | n/a | | n/a | | 26.18 | % |
| Russell 1000 Growth Index | 18.96 | % | n/a | | n/a | | 19.48 | % |
The performance data quoted represents past performance, which is not an indication or a guarantee of future results. The Fund’s average
annual total returns include changes in share price and reinvestment of dividends and capital gains. Class A returns reflect the maximum
initial sales charge and Class C returns reflect the applicable contingent deferred sales charge. The chart and table above do not reflect the
deduction of taxes that a shareholder would have paid on Fund distributions or on the redemption of Fund shares. Investment return
and principal will fluctuate and the Fund’s shares, when redeemed, may be worth more or less than their original cost. Current performance
may be higher or lower than the performance quoted. For updated performance, visit us at www.alger.com or call us at (800) 992-3863.
- 14 -
ALGER MID CAP GROWTH INSTITUTIONAL FUND
Fund Highlights Through April 30, 2018 (Unaudited)
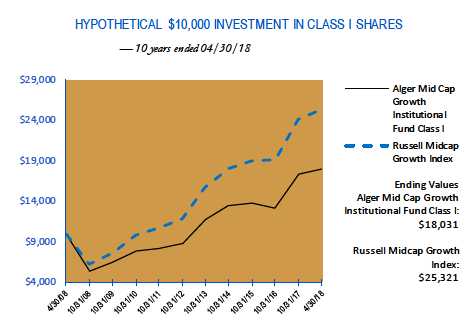
The chart above illustrates the change in value of a hypothetical $10,000 investment made in the Alger Mid Cap
Growth Institutional Fund Class I shares and the Russell Midcap Growth Index (an unmanaged index of common
stocks) for the ten years ended April 30, 2018. Figures for the Alger Mid Cap Growth Institutional Fund Class I
shares and the Russell Midcap Growth Index include reinvestment of dividends and capital gains. Performance for
the Alger Mid Cap Growth Institutional Fund Class R and Class Z-2 shares may vary from the results shown above
due to differences in expenses the class bears. Investors cannot invest directly in any index. Index performance does
not reflect deduction for fees, expenses, or taxes.
- 15 -
ALGER MID CAP GROWTH INSTITUTIONAL FUND
Fund Highlights Through April 30, 2018 (Unaudited) (Continued)
| | | | | | | | |
| PERFORMANCE COMPARISON AS OF 04/30/18 |
| AVERAGE ANNUAL TOTAL RETURNS |
| | | | | | | | Since | |
| | 1 YEAR | | 5 YEARS | | 10 YEARS | | 11/8/1993 | |
| Class I (Inception 11/8/93) | 16.60 | % | 11.71 | % | 6.07 | % | 11.77 | % |
| Class R (Inception 1/27/03)* | 16.05 | % | 11.12 | % | 5.51 | % | 11.21 | % |
| Russell Midcap Growth Index | 16.87 | % | 12.76 | % | 9.74 | % | 9.70 | % |
| |
| |
| | | | | | | | Since | |
| | 1 YEAR | | 5 YEARS | | 10 YEARS | | 10/14/2016 | |
| Class Z-2 (Inception 10/14/16) | 16.94 | % | n/a | | n/a | | 21.90 | % |
| Russell Midcap Growth Index | 16.87 | % | n/a | | n/a | | 19.37 | % |
The performance data quoted represents past performance, which is not an indication or a guarantee of future results. The Fund’s
average annual total returns include changes in share price and reinvestment of dividends and capital gains. The chart and table above
do not reflect the deduction of taxes that a shareholder would have paid on Fund distributions or on the redemption of Fund shares.
Investment return and principal will fluctuate and the Fund’s shares, when redeemed, may be worth more or less than their original cost.
Current performance may be higher or lower than the performance quoted. For updated performance, visit us at www.alger.com or call
us at (800) 992-3863.
* Since inception performance is calculated from 11/08/93. Performance figures prior to 1/27/03, inception of Class R
shares, are those of the Fund's Class I Shares. The performance figures prior to 1/27/03 have been reduced to reflect the
higher operating expenses of Class R shares.
- 16 -
ALGER SMALL CAP GROWTH INSTITUTIONAL FUND
Fund Highlights Through April 30, 2018 (Unaudited)
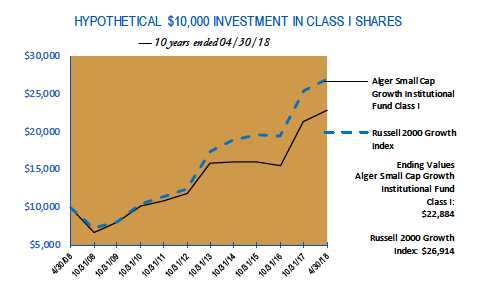
The chart above illustrates the change in value of a hypothetical $10,000 investment made in the Alger Small Cap
Growth Institutional Fund Class I shares and the Russell 2000 Growth Index (an unmanaged index of common
stocks) for the ten years ended April 30, 2018. The figures for the Alger Small Cap Growth Institutional Fund Class
I shares and the Russell 2000 Growth Index include reinvestment of dividends and capital gains. Performance for
the Alger Small Cap Growth Institutional Fund Class R and Class Z-2 shares may vary from the results shown above
due to differences in expenses the class bears. Investors cannot invest directly in any index. Index performance does
not reflect deduction for fees, expenses, or taxes.
- 17 -
ALGER SMALL CAP GROWTH INSTITUTIONAL FUND
Fund Highlights Through April 30, 2018 (Unaudited) (Continued)
| | | | | | | | |
| PERFORMANCE COMPARISON AS OF 04/30/18 |
| AVERAGE ANNUAL TOTAL RETURNS |
| | | | | | | | Since | |
| | 1 YEAR | | 5 YEARS | | 10 YEARS | | 11/8/1993 | |
| Class I (Inception 11/8/93) | 22.82 | % | 11.13 | % | 8.61 | % | 9.50 | % |
| Class R (Inception 1/27/03)* | 22.23 | % | 10.59 | % | 8.08 | % | 8.97 | % |
| Russell 2000 Growth Index | 16.60 | % | 13.07 | % | 10.41 | % | 7.68 | % |
| |
| |
| | 1 YEAR | | 5 YEARS | | 10 YEARS | | Since 8/1/2016 | |
| Class Z-2 (Inception 8/1/16) | 23.22 | % | n/a | | n/a | | 22.85 | % |
| Russell 2000 Growth Index | 16.60 | % | n/a | | n/a | | 17.50 | % |
The performance data quoted represents past performance, which is not an indication or a guarantee of future results. The Fund’s
average annual total returns include changes in share price and reinvestment of dividends and capital gains. The chart and table above
do not reflect the deduction of taxes that a shareholder would have paid on Fund distributions or on the redemption of Fund shares.
Investment return and principal will fluctuate and the Fund’s shares, when redeemed, may be worth more or less than their original cost.
Current performance may be higher or lower than the performance quoted. For updated performance, visit us at www.alger.com or call
us at (800) 992-3863.
* Since inception performance is calculated from 11/08/93. Performance figures prior to 1/27/03, inception of Class R
shares, are those of the Fund's Class I Shares. The performance figures prior to 1/27/03 have been reduced to reflect the
higher operating expenses of Class R shares.
- 18 -
PORTFOLIO SUMMARY†
April 30, 2018 (Unaudited)
| | | | | | | | | | | | | |
| | | Alger Capital | | | | | | | | | | | |
| | | Appreciation Institutional | | | Alger Capital | | | Alger Mid Cap Growth | | | Alger Small Cap Growth | |
| SECTORS | | Fund | | | Appreciation Focus Fund | | | Institutional Fund | | | Institutional Fund | |
| Consumer Discretionary | | 16.2 | % | | 14.4 | % | | 14.9 | % | | 7.9 | % |
| Consumer Staples | | 0.8 | | | | 0.0 | | | 1.4 | | | 1.0 | |
| Energy | | 1.3 | | | | 0.7 | | | 1.3 | | | 1.5 | |
| Financials | | 6.9 | | | 10.1 | | | 5.8 | | | 3.7 | |
| Health Care | | 12.6 | | | 12.0 | | | 22.6 | | | 42.5 | |
| Industrials | | 8.3 | | | | 4.8 | | | 12.4 | | | 5.5 | |
| Information Technology | | 43.5 | | | 48.0 | | | 32.9 | | | 34.9 | |
| Materials | | 3.2 | | | | 1.8 | | | 4.5 | | | 1.6 | |
| Real Estate | | 2.3 | | | | 2.2 | | | 2.1 | | | 0.8 | |
| Short-Term Investments and | | | | | | | | | | | | | |
| Net Other Assets | | 4.9 | | | | 6.0 | | | 2.1 | | | 0.6 | |
| | | 100.0 | % | | 100.0 | % | | 100.0 | % | | 100.0 | % |
† Based on net assets for each Fund.
- 19 -
THE ALGER INSTITUTIONAL FUNDS
ALGER CAPITAL APPRECIATION INSTITUTIONAL FUND
Schedule of Investments April 30, 2018 (Unaudited)
| | | | |
| COMMON STOCKS—92.0% | | SHARES | | VALUE |
| AEROSPACE & DEFENSE—2.2% | | | | |
| General Dynamics Corp. | | 67,789 | $ | 13,646,603 |
| The Boeing Co. | | 137,996 | | 46,029,946 |
| United Technologies Corp. | | 153,919 | | 18,493,368 |
| | | | | 78,169,917 |
| AIR FREIGHT & LOGISTICS—0.4% | | | | |
| FedEx Corp. | | 42,984 | | 10,625,645 |
| XPO Logistics, Inc. * | | 35,195 | | 3,419,546 |
| | | | | 14,045,191 |
| APPAREL ACCESSORIES & LUXURY GOODS—0.8% | | | | |
| Adidas AG | | 25,889 | | 6,363,253 |
| PVH Corp. | | 128,057 | | 20,446,861 |
| | | | | 26,810,114 |
| APPLICATION SOFTWARE—6.0% | | | | |
| Adobe Systems, Inc. * | | 228,384 | | 50,609,894 |
| Autodesk, Inc. * | | 337,873 | | 42,538,211 |
| salesforce. com, Inc. * | | 994,201 | | 120,288,379 |
| | | | | 213,436,484 |
| ASSET MANAGEMENT & CUSTODY BANKS—0.3% | | | | |
| BlackRock, Inc. , Cl. A | | 17,291 | | 9,017,256 |
| AUTO PARTS & EQUIPMENT—0.3% | | | | |
| Aptiv PLC. | | 111,418 | | 9,423,734 |
| BIOTECHNOLOGY—3.7% | | | | |
| AbbVie, Inc. | | 279,044 | | 26,941,698 |
| BioMarin Pharmaceutical, Inc. * | | 175,147 | | 14,626,526 |
| Celgene Corp. * | | 117,159 | | 10,204,549 |
| Exact Sciences Corp. * | | 225,449 | | 11,274,705 |
| Sarepta Therapeutics, Inc. * | | 263,420 | | 20,114,751 |
| Vertex Pharmaceuticals, Inc. * | | 323,064 | | 49,480,482 |
| | | | | 132,642,711 |
| CABLE & SATELLITE—0.6% | | | | |
| Charter Communications, Inc. , Cl. A* | | 28,361 | | 7,694,056 |
| Comcast Corp. , Cl. A | | 454,512 | | 14,267,131 |
| | | | | 21,961,187 |
| COMMUNICATIONS EQUIPMENT—0.3% | | | | |
| Palo Alto Networks, Inc. * | | 59,312 | | 11,418,153 |
| CONSTRUCTION MACHINERY & HEAVY TRUCKS—0.3% | | | | |
| Caterpillar, Inc. | | 74,130 | | 10,701,407 |
| CONSTRUCTION MATERIALS—1.0% | | | | |
| Vulcan Materials Co. | | 329,877 | | 36,843,962 |
| DATA PROCESSING & OUTSOURCED SERVICES—4.9% | | | | |
| Visa, Inc. , Cl. A | | 1,388,501 | | 176,173,007 |
| DIVERSIFIED BANKS—2.3% | | | | |
| Bank of America Corp. | | 2,043,184 | | 61,132,065 |
| Citigroup, Inc. | | 100,416 | | 6,855,400 |
- 20 -
THE ALGER INSTITUTIONAL FUNDS
ALGER CAPITAL APPRECIATION INSTITUTIONAL FUND
Schedule of Investments April 30, 2018 (Unaudited) (Continued)
| | | | |
| COMMON STOCKS—92.0% (CONT. ) | | SHARES | | VALUE |
| DIVERSIFIED BANKS—2.3% (CONT. ) | | | | |
| JPMorgan Chase & Co. | | 144,107 | $ | 15,675,960 |
| | | | | 83,663,425 |
| DIVERSIFIED CHEMICALS—0.3% | | | | |
| DowDuPont, Inc. | | 196,354 | | 12,417,427 |
| DIVERSIFIED SUPPORT SERVICES—0.5% | | | | |
| Cintas Corp. | | 111,457 | | 18,981,127 |
| FINANCIAL EXCHANGES & DATA—2.7% | | | | |
| Intercontinental Exchange, Inc. | | 817,507 | | 59,236,557 |
| S&P Global, Inc. | | 202,065 | | 38,109,459 |
| | | | | 97,346,016 |
| HEALTH CARE EQUIPMENT—3.9% | | | | |
| Boston Scientific Corp. * | | 1,090,862 | | 31,329,557 |
| Danaher Corp. | | 473,476 | | 47,499,112 |
| Intuitive Surgical, Inc. * | | 30,164 | | 13,295,688 |
| Medtronic PLC. | | 276,992 | | 22,195,369 |
| Zimmer Biomet Holdings, Inc. | | 235,578 | | 27,131,518 |
| | | | | 141,451,244 |
| HOME ENTERTAINMENT SOFTWARE—0.4% | | | | |
| Electronic Arts, Inc. * | | 120,914 | | 14,265,434 |
| HOME IMPROVEMENT RETAIL—2.6% | | | | |
| The Home Depot, Inc. | | 498,169 | | 92,061,631 |
| HOTELS RESORTS & CRUISE LINES—0.5% | | | | |
| Norwegian Cruise Line Holdings Ltd. * | | 329,433 | | 17,614,783 |
| HYPERMARKETS & SUPER CENTERS—0.2% | | | | |
| Walmart, Inc. | | 96,262 | | 8,515,337 |
| INDUSTRIAL CONGLOMERATES—2.3% | | | | |
| Honeywell International, Inc. | | 577,449 | | 83,545,321 |
| INDUSTRIAL GASES—1.0% | | | | |
| Air Products & Chemicals, Inc. | | 227,616 | | 36,939,801 |
| INDUSTRIAL MACHINERY—1.0% | | | | |
| Stanley Black & Decker, Inc. | | 262,917 | | 37,226,418 |
| INTERNET & DIRECT MARKETING RETAIL—10.0% | | | | |
| Amazon. com, Inc. * | | 211,232 | | 330,816,772 |
| Netflix, Inc. * | | 91,952 | | 28,731,322 |
| | | | | 359,548,094 |
| INTERNET SOFTWARE & SERVICES—12.3% | | | | |
| Alibaba Group Holding Ltd. #* | | 429,749 | | 76,727,386 |
| Alphabet, Inc. , Cl. C* | | 154,549 | | 157,227,334 |
| Altaba, Inc. * | | 601,133 | | 42,127,401 |
| Facebook, Inc. , Cl. A* | | 936,760 | | 161,122,720 |
| Palantir Technologies, Inc. , Cl. A*,@,(a) | | 239,030 | | 1,374,423 |
| Tencent Holdings Ltd. | | 37,111 | | 1,824,485 |
| | | | | 440,403,749 |
- 21 -
THE ALGER INSTITUTIONAL FUNDS
ALGER CAPITAL APPRECIATION INSTITUTIONAL FUND
Schedule of Investments April 30, 2018 (Unaudited) (Continued)
| | | | |
| COMMON STOCKS—92.0% (CONT. ) | | SHARES | | VALUE |
| INVESTMENT BANKING & BROKERAGE—0.8% | | | | |
| Morgan Stanley | | 533,921 | $ | 27,561,002 |
| IT CONSULTING & OTHER SERVICES—0.6% | | | | |
| Cognizant Technology Solutions Corp. , Cl. A | | 257,225 | | 21,046,150 |
| LEISURE FACILITIES—0.5% | | | | |
| Vail Resorts, Inc. | | 83,190 | | 19,076,299 |
| LIFE SCIENCES TOOLS & SERVICES—0.7% | | | | |
| Illumina, Inc. * | | 98,137 | | 23,644,147 |
| MANAGED HEALTH CARE—3.8% | | | | |
| UnitedHealth Group, Inc. | | 575,506 | | 136,049,618 |
| OIL & GAS EQUIPMENT & SERVICES—0.4% | | | | |
| Halliburton Co. | | 274,344 | | 14,537,489 |
| OIL & GAS EXPLORATION & PRODUCTION—0.9% | | | | |
| Pioneer Natural Resources Co. | | 157,483 | | 31,740,699 |
| PAPER PACKAGING—0.2% | | | | |
| International Paper Co. | | 118,938 | | 6,132,443 |
| PHARMACEUTICALS—0.4% | | | | |
| Allergan PLC. | | 43,015 | | 6,609,255 |
| Bristol-Myers Squibb Co. | | 117,896 | | 6,145,918 |
| | | | | 12,755,173 |
| PROPERTY & CASUALTY INSURANCE—0.3% | | | | |
| The Progressive Corp. | | 153,620 | | 9,261,750 |
| RAILROADS—1.4% | | | | |
| Union Pacific Corp. | | 373,658 | | 49,931,919 |
| RESTAURANTS—0.9% | | | | |
| McDonald's Corp. | | 188,559 | | 31,572,319 |
| SEMICONDUCTOR EQUIPMENT—1.5% | | | | |
| Applied Materials, Inc. | | 891,505 | | 44,281,053 |
| Lam Research Corp. | | 54,526 | | 10,090,582 |
| | | | | 54,371,635 |
| SEMICONDUCTORS—4.1% | | | | |
| Broadcom, Inc. | | 342,017 | | 78,465,540 |
| Cavium, Inc. * | | 112,088 | | 8,407,721 |
| Marvell Technology Group Ltd. | | 333,413 | | 6,688,265 |
| Microchip Technology, Inc. | | 203,639 | | 17,036,439 |
| Micron Technology, Inc. * | | 241,253 | | 11,092,813 |
| NVIDIA Corp. | | 105,887 | | 23,813,986 |
| | | | | 145,504,764 |
| SPECIALTY CHEMICALS—0.7% | | | | |
| The Sherwin-Williams Co. | | 68,415 | | 25,153,459 |
| SYSTEMS SOFTWARE—10.0% | | | | |
| Microsoft Corp. | | 3,098,923 | | 289,811,279 |
| Red Hat, Inc. * | | 276,518 | | 45,089,025 |
| ServiceNow, Inc. * | | 78,649 | | 13,066,745 |
| Smartsheet, Inc. , Cl. A* | | 28,973 | | 559,179 |
- 22 -
THE ALGER INSTITUTIONAL FUNDS
ALGER CAPITAL APPRECIATION INSTITUTIONAL FUND
Schedule of Investments April 30, 2018 (Unaudited) (Continued)
| | | | | |
| COMMON STOCKS—92.0% (CONT. ) | | SHARES | | | VALUE |
| SYSTEMS SOFTWARE—10.0% (CONT. ) | | | | | |
| VMware, Inc. , Cl. A* | | 60,812 | | $ | 8,103,807 |
| | | | | | 356,630,035 |
| TECHNOLOGY HARDWARE STORAGE & PERIPHERALS—3.2% | | | | | |
| Apple, Inc. | | 703,830 | | | 116,314,946 |
| TOBACCO—0.6% | | | | | |
| Philip Morris International, Inc. | | 267,337 | | | 21,921,634 |
| TRADING COMPANIES & DISTRIBUTORS—0.2% | | | | | |
| United Rentals, Inc. * | | 45,223 | | | 6,783,450 |
| TOTAL COMMON STOCKS | | | | | |
| (Cost $2,304,614,049) | | | | | 3,294,611,861 |
| PREFERRED STOCKS—0.3% | | SHARES | | | VALUE |
| INTERNET SOFTWARE & SERVICES—0.2% | | | | | |
| Palantir Technologies, Inc. , Cl. B*,@,(a) | | 974,841 | | | 5,605,336 |
| Palantir Technologies, Inc. , Cl. D*,@,(a) | | 127,007 | | | 730,290 |
| | | | | | 6,335,626 |
| PHARMACEUTICALS—0.1% | | | | | |
| Intarcia Therapeutics, Inc. , Series DD*,@,(a) | | 111,655 | | | 2,993,470 |
| TOTAL PREFERRED STOCKS | | | | | |
| (Cost $10,892,407) | | | | | 9,329,096 |
| MASTER LIMITED PARTNERSHIP—0.5% | | SHARES | | | VALUE |
| ASSET MANAGEMENT & CUSTODY BANKS—0.5% | | | | | |
| The Blackstone Group LP. | | 628,783 | | | 19,460,834 |
| (Cost $16,934,849) | | | | | 19,460,834 |
| REAL ESTATE INVESTMENT TRUST—2.3% | | SHARES | | | VALUE |
| SPECIALIZED—2.3% | | | | | |
| Equinix, Inc. | | 103,330 | | | 43,480,231 |
| SBA Communications Corp. , Cl. A* | | 249,566 | | | 39,987,960 |
| | | | | | 83,468,191 |
| TOTAL REAL ESTATE INVESTMENT TRUST | | | | | |
| (Cost $85,449,459) | | | | | 83,468,191 |
| Total Investments | | | | | |
| (Cost $2,417,890,764) | | 95.1 | % | $ | 3,406,869,982 |
| Unaffiliated Securities (Cost $2,417,890,764) | | | | | 3,406,869,982 |
| Other Assets in Excess of Liabilities | | 4.9 | % | | 175,887,858 |
| NET ASSETS | | 100.0 | % | $ | 3,582,757,840 |
# American Depositary Receipts.
(a) Security is valued in good faith at fair value determined using significant unobservable inputs pursuant to procedures established by the
Board.
* Non-income producing security.
- 23 -
THE ALGER INSTITUTIONAL FUNDS
ALGER CAPITAL APPRECIATION INSTITUTIONAL FUND
Schedule of Investments April 30, 2018 (Unaudited) (Continued)
@ Restricted security - Investment in security not registered under the Securities Act of 1933. The investment is deemed to not be liquid
and may be sold only to qualified buyers.
| | | | | | | | | |
| | | | | % of net assets | | | | % of net assets | |
| | Acquisition | | Acquisition | (Acquisition | | | Market | as of | |
| Security | Date(s) | | Cost | Date) | | | Value | 4/30/2018 | |
| Intarcia Therapeutics, Inc. , Series | | | | | | | | | |
| DD | 03/27/14 | $ | 3,616,505 | 014 | % | $ | 2,993,470 | 0.08 | % |
| Palantir Technologies, Inc. , Cl. A | 10/07/14 | | 1,555,368 | 0.05 | % | | 1,374,423 | 0.04 | % |
| Palantir Technologies, Inc. , Cl. B | 10/07/14 | | 6,437,297 | 0.22 | % | | 5,605,336 | 0.16 | % |
| Palantir Technologies, Inc. , Cl. D | 10/14/14 | | 838,605 | 0.03 | % | | 730,290 | 0.02 | % |
| Total | | | | | | $ | 10,703,519 | 0.30 | % |
| | | | | | | | | | |
| See Notes to Financial Statements. | | | | | | | | |
- 24 -
THE ALGER INSTITUTIONAL FUNDS | ALGER CAPITAL APPRECIATION FOCUS FUND
Schedule of Investments April 30, 2018 (Unaudited)
| | | | |
| COMMON STOCKS—91.3% | | SHARES | | VALUE |
| AIR FREIGHT & LOGISTICS—0.6% | | | | |
| XPO Logistics, Inc. * | | 11,229 | $ | 1,091,010 |
| APPAREL ACCESSORIES & LUXURY GOODS—0.5% | | | | |
| PVH Corp. | | 5,007 | | 799,468 |
| APPLICATION SOFTWARE—8.9% | | | | |
| Adobe Systems, Inc. * | | 14,818 | | 3,283,669 |
| Autodesk, Inc. * | | 23,571 | | 2,967,589 |
| salesforce. com, Inc. * | | 72,106 | | 8,724,105 |
| | | | | 14,975,363 |
| ASSET MANAGEMENT & CUSTODY BANKS—0.3% | | | | |
| BlackRock, Inc. , Cl. A | | 810 | | 422,415 |
| BIOTECHNOLOGY—2.0% | | | | |
| Exact Sciences Corp. * | | 5,324 | | 266,253 |
| Sarepta Therapeutics, Inc. * | | 11,618 | | 887,150 |
| Vertex Pharmaceuticals, Inc. * | | 14,516 | | 2,223,271 |
| | | | | 3,376,674 |
| CONSTRUCTION MACHINERY & HEAVY TRUCKS—0.3% | | | | |
| Caterpillar, Inc. | | 3,646 | | 526,337 |
| CONSTRUCTION MATERIALS—1.2% | | | | |
| Vulcan Materials Co. | | 18,852 | | 2,105,580 |
| DATA PROCESSING & OUTSOURCED SERVICES—5.1% | | | | |
| Visa, Inc. , Cl. A | | 68,181 | | 8,650,805 |
| DIVERSIFIED BANKS—2.7% | | | | |
| Bank of America Corp. | | 152,132 | | 4,551,789 |
| DIVERSIFIED SUPPORT SERVICES—0.7% | | | | |
| Cintas Corp. | | 6,958 | | 1,184,947 |
| FINANCIAL EXCHANGES & DATA—6.1% | | | | |
| Intercontinental Exchange, Inc. | | 89,381 | | 6,476,547 |
| S&P Global, Inc. | | 20,554 | | 3,876,485 |
| | | | | 10,353,032 |
| HEALTH CARE EQUIPMENT—5.0% | | | | |
| Boston Scientific Corp. * | | 79,675 | | 2,288,266 |
| Danaher Corp. | | 37,996 | | 3,811,759 |
| DexCom, Inc. * | | 9,845 | | 720,457 |
| Zimmer Biomet Holdings, Inc. | | 14,641 | | 1,686,204 |
| | | | | 8,506,686 |
| HOME ENTERTAINMENT SOFTWARE—0.3% | | | | |
| Electronic Arts, Inc. * | | 4,539 | | 535,511 |
| HOME IMPROVEMENT RETAIL—2.5% | | | | |
| The Home Depot, Inc. | | 22,646 | | 4,184,981 |
| INDUSTRIAL CONGLOMERATES—2.4% | | | | |
| Honeywell International, Inc. | | 27,817 | | 4,024,563 |
| INDUSTRIAL GASES—0.6% | | | | |
| Air Products & Chemicals, Inc. | | 6,208 | | 1,007,496 |
- 25 -
THE ALGER INSTITUTIONAL FUNDS | ALGER CAPITAL APPRECIATION FOCUS FUND
Schedule of Investments April 30, 2018 (Unaudited) (Continued)
| | | | |
| COMMON STOCKS—91.3% (CONT. ) | | SHARES | | VALUE |
| INDUSTRIAL MACHINERY—0.8% | | | | |
| Stanley Black & Decker, Inc. | | 9,098 | $ | 1,288,186 |
| INTERNET & DIRECT MARKETING RETAIL—9.7% | | | | |
| Amazon. com, Inc. * | | 9,863 | | 15,446,740 |
| Netflix, Inc. * | | 3,272 | | 1,022,369 |
| | | | | 16,469,109 |
| INTERNET SOFTWARE & SERVICES—12.5% | | | | |
| Alibaba Group Holding Ltd. #* | | 30,319 | | 5,413,154 |
| Alphabet, Inc. , Cl. C* | | 7,249 | | 7,374,625 |
| Facebook, Inc. , Cl. A* | | 44,878 | | 7,719,016 |
| Tencent Holdings Ltd. | | 1,710 | | 84,069 |
| Wix. com Ltd. * | | 5,445 | | 447,851 |
| | | | | 21,038,715 |
| INVESTMENT BANKING & BROKERAGE—0.6% | | | | |
| Morgan Stanley | | 20,876 | | 1,077,619 |
| IT CONSULTING & OTHER SERVICES—1.2% | | | | |
| EPAM Systems, Inc. * | | 17,583 | | 2,010,616 |
| LEISURE FACILITIES—1.1% | | | | |
| Vail Resorts, Inc. | | 7,844 | | 1,798,708 |
| MANAGED HEALTH CARE—4.9% | | | | |
| UnitedHealth Group, Inc. | | 35,240 | | 8,330,736 |
| OIL & GAS EXPLORATION & PRODUCTION—0.7% | | | | |
| Pioneer Natural Resources Co. | | 6,038 | | 1,216,959 |
| SEMICONDUCTOR EQUIPMENT—2.3% | | | | |
| Applied Materials, Inc. | | 79,076 | | 3,927,705 |
| SEMICONDUCTORS—3.3% | | | | |
| Broadcom, Inc. | | 19,725 | | 4,525,309 |
| Marvell Technology Group Ltd. | | 47,963 | | 962,138 |
| | | | | 5,487,447 |
| SPECIALIZED CONSUMER SERVICES—0.6% | | | | |
| ServiceMaster Global Holdings, Inc. * | | 19,782 | | 1,000,969 |
| SYSTEMS SOFTWARE—11.4% | | | | |
| Microsoft Corp. | | 153,564 | | 14,361,305 |
| Red Hat, Inc. * | | 29,996 | | 4,891,148 |
| | | | | 19,252,453 |
| TECHNOLOGY HARDWARE STORAGE & PERIPHERALS—3.0% | | | | |
| Apple, Inc. | | 30,948 | | 5,114,466 |
| TOTAL COMMON STOCKS | | | | |
| (Cost $132,541,163) | | | | 154,310,345 |
| PREFERRED STOCKS—0.1% | | SHARES | | VALUE |
| BIOTECHNOLOGY—0.1% | | | | |
| Prosetta Biosciences, Inc. , Series D*,@,(a),(b) | | 76,825 | | 230,475 |
| (Cost $345,713) | | | | 230,475 |
- 26 -
THE ALGER INSTITUTIONAL FUNDS | ALGER CAPITAL APPRECIATION FOCUS FUND
Schedule of Investments April 30, 2018 (Unaudited) (Continued)
| | | | | |
| MASTER LIMITED PARTNERSHIP—0.4% | | SHARES | | | VALUE |
| ASSET MANAGEMENT & CUSTODY BANKS—0.4% | | | | | |
| The Blackstone Group LP. | | 21,687 | | $ | 671,213 |
| (Cost $688,672) | | | | | 671,213 |
| REAL ESTATE INVESTMENT TRUST—2.2% | | SHARES | | | VALUE |
| SPECIALIZED—2.2% | | | | | |
| Equinix, Inc. | | 7,172 | | | 3,017,906 |
| SBA Communications Corp. , Cl. A* | | 4,064 | | | 651,175 |
| | | | | | 3,669,081 |
| TOTAL REAL ESTATE INVESTMENT TRUST | | | | | |
| (Cost $3,968,269) | | | | | 3,669,081 |
| Total Investments | | | | | |
| (Cost $137,543,817) | | 94.0 | % | $ | 158,881,114 |
| Affiliated Securities (Cost $345,713) | | | | | 230,475 |
| Unaffiliated Securities (Cost $137,198,104) | | | | | 158,650,639 |
| Other Assets in Excess of Liabilities | | 6.0 | % | | 10,106,341 |
| NET ASSETS | | 100.0 | % | $ | 168,987,455 |
# American Depositary Receipts.
(a) Deemed an affiliate of the Alger fund complex during the year in accordance with Section 2(a)(3) of the Investment Company Act of
1940. See Affiliated Securities Note 11.
(b) Security is valued in good faith at fair value determined using significant unobservable inputs pursuant to procedures established by
the Board.
* Non-income producing security.
@ Restricted security - Investment in security not registered under the Securities Act of 1933. The investment is deemed to not be liquid
and may be sold only to qualified buyers.
| | | | | | | | | |
| | | | | % of net assets | | | | % of net assets | |
| | Acquisition | | Acquisition | (Acquisition | | | Market | as of | |
| Security | Date(s) | | Cost | Date) | | | Value | 4/30/2018 | |
| Prosetta Biosciences, Inc. , Series D | 02/06/15 | $ | 345,713 | 0.80 | % | $ | 230,475 | 0.14 | % |
| Total | | | | | | $ | 230,475 | 0.14 | % |
| | | | | | | | | | |
| |
| |
| See Notes to Financial Statements. | | | | | | | | |
- 27 -
THE ALGER INSTITUTIONAL FUNDS | ALGER MID CAP GROWTH INSTITUTIONAL FUND
Schedule of Investments April 30, 2018 (Unaudited)
| | | | |
| COMMON STOCKS—93.3% | | SHARES | | VALUE |
| AEROSPACE & DEFENSE—1.4% | | | | |
| HEICO Corp. | | 16,929 | $ | 1,487,213 |
| APPAREL ACCESSORIES & LUXURY GOODS—2.5% | | | | |
| PVH Corp. | | 9,532 | | 1,521,974 |
| Tapestry, Inc. | | 19,927 | | 1,071,475 |
| | | | | 2,593,449 |
| APPAREL RETAIL—2.4% | | | | |
| Burlington Stores, Inc. * | | 9,565 | | 1,299,405 |
| Ross Stores, Inc. | | 15,536 | | 1,256,086 |
| | | | | 2,555,491 |
| APPLICATION SOFTWARE—4.7% | | | | |
| ANSYS, Inc. * | | 3,266 | | 527,981 |
| Autodesk, Inc. * | | 14,722 | | 1,853,500 |
| Globant SA* | | 30,247 | | 1,361,417 |
| Splunk, Inc. * | | 12,064 | | 1,238,370 |
| | | | | 4,981,268 |
| ASSET MANAGEMENT & CUSTODY BANKS—0.7% | | | | |
| WisdomTree Investments, Inc. | | 74,123 | | 783,480 |
| AUTO PARTS & EQUIPMENT—1.1% | | | | |
| Aptiv PLC. | | 14,319 | | 1,211,101 |
| AUTOMOTIVE RETAIL—0.9% | | | | |
| AutoZone, Inc. * | | 1,549 | | 967,382 |
| BIOTECHNOLOGY—5.9% | | | | |
| Agios Pharmaceuticals, Inc. * | | 3,850 | | 323,054 |
| BeiGene Ltd. #* | | 1,949 | | 330,511 |
| BioMarin Pharmaceutical, Inc. * | | 7,298 | | 609,456 |
| Bluebird Bio, Inc. * | | 5,046 | | 858,577 |
| Clovis Oncology, Inc. * | | 12,338 | | 535,222 |
| Exact Sciences Corp. * | | 8,082 | | 404,181 |
| Halozyme Therapeutics, Inc. * | | 15,653 | | 296,311 |
| Immunomedics, Inc. * | | 19,451 | | 354,203 |
| Incyte Corp. * | | 1,310 | | 81,141 |
| Neurocrine Biosciences, Inc. * | | 6,942 | | 562,857 |
| Sage Therapeutics, Inc. * | | 2,867 | | 412,619 |
| Sarepta Therapeutics, Inc. * | | 13,832 | | 1,056,212 |
| TESARO, Inc. * | | 6,982 | | 355,454 |
| | | | | 6,179,798 |
| BUILDING PRODUCTS—1.2% | | | | |
| Lennox International, Inc. | | 6,805 | | 1,315,883 |
| COMMUNICATIONS EQUIPMENT—1.6% | | | | |
| Palo Alto Networks, Inc. * | | 8,773 | | 1,688,890 |
| CONSTRUCTION MACHINERY & HEAVY TRUCKS—0.9% | | | | |
| Wabtec Corp. | | 10,500 | | 932,505 |
| CONSTRUCTION MATERIALS—1.8% | | | | |
| Vulcan Materials Co. | | 16,718 | | 1,867,233 |
- 28 -
THE ALGER INSTITUTIONAL FUNDS | ALGER MID CAP GROWTH INSTITUTIONAL FUND
Schedule of Investments April 30, 2018 (Unaudited) (Continued)
| | | | |
| COMMON STOCKS—93.3% (CONT. ) | | SHARES | | VALUE |
| DATA PROCESSING & OUTSOURCED SERVICES—6.9% | | | | |
| Alliance Data Systems Corp. | | 5,345 | $ | 1,085,303 |
| Fiserv, Inc. * | | 26,470 | | 1,875,664 |
| FleetCor Technologies, Inc. * | | 7,764 | | 1,609,322 |
| GDS Holdings Ltd. #* | | 37,207 | | 1,085,328 |
| Worldpay, Inc. , Cl. A* | | 20,259 | | 1,645,436 |
| | | | | 7,301,053 |
| DIVERSIFIED SUPPORT SERVICES—1.5% | | | | |
| Cintas Corp. | | 9,585 | | 1,632,326 |
| ELECTRICAL COMPONENTS & EQUIPMENT—2.3% | | | | |
| AMETEK, Inc. | | 16,713 | | 1,166,567 |
| Rockwell Automation, Inc. | | 7,409 | | 1,219,003 |
| | | | | 2,385,570 |
| ELECTRONIC EQUIPMENT & INSTRUMENTS—1.0% | | | | |
| Trimble, Inc. * | | 30,858 | | 1,067,687 |
| FERTILIZERS & AGRICULTURAL CHEMICALS—0.5% | | | | |
| FMC Corp. | | 6,715 | | 535,387 |
| FINANCIAL EXCHANGES & DATA—2.2% | | | | |
| Intercontinental Exchange, Inc. | | 13,279 | | 962,197 |
| MarketAxess Holdings, Inc. | | 6,597 | | 1,310,362 |
| | | | | 2,272,559 |
| GENERAL MERCHANDISE STORES—1.0% | | | | |
| Dollar Tree, Inc. * | | 11,146 | | 1,068,790 |
| HEALTH CARE EQUIPMENT—7.6% | | | | |
| ABIOMED, Inc. * | | 7,551 | | 2,272,473 |
| AxoGen, Inc. * | | 9,918 | | 394,736 |
| DexCom, Inc. * | | 8,517 | | 623,274 |
| Edwards Lifesciences Corp. * | | 7,125 | | 907,440 |
| IDEXX Laboratories, Inc. * | | 4,910 | | 954,946 |
| Insulet Corp. * | | 17,251 | | 1,483,586 |
| Masimo Corp. * | | 7,938 | | 712,277 |
| Penumbra, Inc. * | | 1,773 | | 220,473 |
| Zimmer Biomet Holdings, Inc. | | 3,619 | | 416,800 |
| | | | | 7,986,005 |
| HEALTH CARE SUPPLIES—1.2% | | | | |
| Align Technology, Inc. * | | 4,942 | | 1,234,759 |
| HEALTH CARE TECHNOLOGY—1.0% | | | | |
| Medidata Solutions, Inc. * | | 7,078 | | 505,086 |
| Veeva Systems, Inc. , Cl. A* | | 7,633 | | 535,302 |
| | | | | 1,040,388 |
| HOME ENTERTAINMENT SOFTWARE—1.5% | | | | |
| Electronic Arts, Inc. * | | 5,731 | | 676,143 |
| Take-Two Interactive Software, Inc. * | | 9,000 | | 897,390 |
| | | | | 1,573,533 |
| HOTELS RESORTS & CRUISE LINES—2.3% | | | | |
| Hilton Worldwide Holdings, Inc. | | 12,883 | | 1,015,696 |
- 29 -
THE ALGER INSTITUTIONAL FUNDS | ALGER MID CAP GROWTH INSTITUTIONAL FUND
Schedule of Investments April 30, 2018 (Unaudited) (Continued)
| | | | |
| COMMON STOCKS—93.3% (CONT. ) | | SHARES | | VALUE |
| HOTELS RESORTS & CRUISE LINES—2.3% (CONT. ) | | | | |
| Norwegian Cruise Line Holdings Ltd. * | | 26,752 | $ | 1,430,429 |
| | | | | 2,446,125 |
| HOUSEHOLD PRODUCTS—0.9% | | | | |
| Church & Dwight Co. , Inc. | | 20,572 | | 950,426 |
| INDUSTRIAL CONGLOMERATES—1.8% | | | | |
| Roper Technologies, Inc. | | 7,272 | | 1,921,190 |
| INDUSTRIAL MACHINERY—2.7% | | | | |
| Fortive Corp. | | 24,942 | | 1,753,672 |
| Parker-Hannifin Corp. | | 3,277 | | 539,460 |
| Stanley Black & Decker, Inc. | | 3,714 | | 525,865 |
| | | | | 2,818,997 |
| INTERNET SOFTWARE & SERVICES—4.5% | | | | |
| Etsy, Inc. * | | 36,587 | | 1,095,415 |
| GrubHub, Inc. * | | 10,870 | | 1,099,392 |
| IAC/InterActiveCorp* | | 4,625 | | 749,897 |
| Match Group, Inc. * | | 12,706 | | 598,707 |
| Palantir Technologies, Inc. , Cl. A*,@,(a) | | 12,426 | | 71,450 |
| Yelp, Inc. , Cl. A* | | 24,138 | | 1,082,589 |
| | | | | 4,697,450 |
| IT CONSULTING & OTHER SERVICES—2.3% | | | | |
| EPAM Systems, Inc. * | | 11,898 | | 1,360,536 |
| Gartner, Inc. * | | 8,664 | | 1,050,857 |
| | | | | 2,411,393 |
| LEISURE FACILITIES—1.3% | | | | |
| Vail Resorts, Inc. | | 5,857 | | 1,343,069 |
| LIFE SCIENCES TOOLS & SERVICES—2.3% | | | | |
| Agilent Technologies, Inc. | | 10,241 | | 673,243 |
| Bio-Techne Corp. | | 1,856 | | 280,089 |
| Illumina, Inc. * | | 6,302 | | 1,518,341 |
| | | | | 2,471,673 |
| MANAGED HEALTH CARE—0.4% | | | | |
| WellCare Health Plans, Inc. * | | 2,119 | | 434,734 |
| METAL & GLASS CONTAINERS—0.8% | | | | |
| Ball Corp. | | 20,130 | | 807,012 |
| OIL & GAS EXPLORATION & PRODUCTION—1.3% | | | | |
| Encana Corp. | | 106,625 | | 1,330,680 |
| PACKAGED FOODS & MEATS—0.5% | | | | |
| Pinnacle Foods, Inc. | | 8,548 | | 516,299 |
| PAPER PACKAGING—0.9% | | | | |
| International Paper Co. | | 18,697 | | 964,017 |
| PHARMACEUTICALS—2.3% | | | | |
| Aerie Pharmaceuticals, Inc. * | | 16,369 | | 838,093 |
| GW Pharmaceuticals PLC. #* | | 5,031 | | 668,670 |
| Zoetis, Inc. , Cl. A | | 10,484 | | 875,204 |
| | | | | 2,381,967 |
- 30 -
THE ALGER INSTITUTIONAL FUNDS | ALGER MID CAP GROWTH INSTITUTIONAL FUND
Schedule of Investments April 30, 2018 (Unaudited) (Continued)
| | | | |
| COMMON STOCKS—93.3% (CONT. ) | | SHARES | | VALUE |
| PROPERTY & CASUALTY INSURANCE—1.6% | | | | |
| The Progressive Corp. | | 28,415 | $ | 1,713,140 |
| REGIONAL BANKS—1.0% | | | | |
| Regions Financial Corp. | | 56,780 | | 1,061,786 |
| RESTAURANTS—1.9% | | | | |
| Chipotle Mexican Grill, Inc. , Cl. A* | | 1,868 | | 790,780 |
| Dunkin' Brands Group, Inc. | | 13,211 | | 805,343 |
| Restaurant Brands International, Inc. | | 7,910 | | 430,462 |
| | | | | 2,026,585 |
| SEMICONDUCTOR EQUIPMENT—2.2% | | | | |
| Lam Research Corp. | | 12,412 | | 2,296,965 |
| SEMICONDUCTORS—3.2% | | | | |
| Cavium, Inc. * | | 8,550 | | 641,335 |
| Marvell Technology Group Ltd. | | 37,235 | | 746,934 |
| Microchip Technology, Inc. | | 12,786 | | 1,069,677 |
| Skyworks Solutions, Inc. | | 11,071 | | 960,520 |
| | | | | 3,418,466 |
| SPECIALIZED CONSUMER SERVICES—1.5% | | | | |
| ServiceMaster Global Holdings, Inc. * | | 31,462 | | 1,591,977 |
| SPECIALTY CHEMICALS—0.5% | | | | |
| WR Grace & Co. | | 8,262 | | 565,451 |
| SYSTEMS SOFTWARE—4.7% | | | | |
| Proofpoint, Inc. * | | 11,539 | | 1,360,910 |
| Red Hat, Inc. * | | 12,485 | | 2,035,804 |
| ServiceNow, Inc. * | | 9,561 | | 1,588,464 |
| | | | | 4,985,178 |
| TRUCKING—0.6% | | | | |
| Old Dominion Freight Line, Inc. | | 4,322 | | 578,543 |
| TOTAL COMMON STOCKS | | | | |
| (Cost $91,043,431) | | | | 98,394,873 |
| PREFERRED STOCKS—0.9% | | SHARES | | VALUE |
| BIOTECHNOLOGY—0.4% | | | | |
| Prosetta Biosciences, Inc. , Series D*,@,(a),(b) | | 166,009 | | 498,027 |
| INTERNET SOFTWARE & SERVICES—0.3% | | | | |
| Palantir Technologies, Inc. , Cl. B*,@,(a) | | 50,675 | | 291,381 |
| PHARMACEUTICALS—0.2% | | | | |
| Intarcia Therapeutics, Inc. , Series DD*,@,(a) | | 7,588 | | 203,435 |
| TOTAL PREFERRED STOCKS | | | | |
| (Cost $1,327,445) | | | | 992,843 |
| RIGHTS—1.3% | | SHARES | | VALUE |
| BIOTECHNOLOGY—1.3% | | | | |
| Tolero CDR*,@,(a),(c) | | 422,928 | | 1,379,227 |
| (Cost $226,186) | | | | 1,379,227 |
- 31 -
THE ALGER INSTITUTIONAL FUNDS | ALGER MID CAP GROWTH INSTITUTIONAL FUND
Schedule of Investments April 30, 2018 (Unaudited) (Continued)
| | | | | |
| REAL ESTATE INVESTMENT TRUST—2.1% | | SHARES | | | VALUE |
| SPECIALIZED—2.1% | | | | | |
| CyrusOne, Inc. | | 19,723 | | $ | 1,056,956 |
| SBA Communications Corp. , Cl. A* | | 7,324 | | | 1,173,524 |
| | | | | | 2,230,480 |
| TOTAL REAL ESTATE INVESTMENT TRUST | | | | | |
| (Cost $2,045,688) | | | | | 2,230,480 |
| SPECIAL PURPOSE VEHICLE—0.3% | | SHARES | | | VALUE |
| CONSUMER FINANCE—0.3% | | | | | |
| JS Kred SPV I, LLC. *,@,(a) | | 240,362 | | | 294,540 |
| (Cost $240,362) | | | | | 294,540 |
| Total Investments | | | | | |
| (Cost $94,883,112) | | 97.9 | % | $ | 103,291,963 |
| Affiliated Securities (Cost $747,040) | | | | | 498,027 |
| Unaffiliated Securities (Cost $94,136,072) | | | | | 102,793,936 |
| Other Assets in Excess of Liabilities | | 2.10 | % | | 2,219,842 |
| NET ASSETS | | 100.0 | % | $ | 105,511,805 |
# American Depositary Receipts.
(a) Security is valued in good faith at fair value determined using significant unobservable inputs pursuant to procedures established by the
Board.
(b) Deemed an affiliate of the Alger fund complex during the year in accordance with Section 2(a)(3) of the Investment Company Act of
1940. See Affiliated Securities Note 11.
(c) Contingent Deferred Rights.
* Non-income producing security.
@ Restricted security - Investment in security not registered under the Securities Act of 1933. The investment is deemed to not be liquid
and may be sold only to qualified buyers.
| | | | | | | | | |
| | | | | % of net assets | | | | % of net assets | |
| | Acquisition | | Acquisition | (Acquisition | | | Market | as of | |
| Security | Date(s) | | Cost | Date) | | | Value | 4/30/2018 | |
| Intarcia Therapeutics, Inc. , Series | | | | | | | | | |
| DD | 03/27/14 | $ | 245,775 | 0.14 | % | $ | 203,435 | 0.19 | % |
| JS Kred SPV I, LLC. | 06/26/15 | | 240,362 | 0.15 | % | | 294,540 | 0.28 | % |
| Palantir Technologies, Inc. , Cl. A | 10/07/14 | | 80,856 | 0.05 | % | | 71,450 | 0.07 | % |
| Palantir Technologies, Inc. , Cl. B | 10/07/14 | | 334,629 | 0.22 | % | | 291,381 | 0.28 | % |
| Prosetta Biosciences, Inc. , Series D | 02/06/15 | | 747,040 | 0.50 | % | | 498,027 | 0.47 | % |
| Tolero CDR | 02/06/17 | | 226,186 | 0.23 | % | | 1,379,227 | 1.30 | % |
| Total | | | | | | $ | 2,738,060 | 2.59 | % |
| | | | | | | | | | |
| See Notes to Financial Statements. | | | | | | | | |
- 32 -
THE ALGER INSTITUTIONAL FUNDS | ALGER SMALL CAP GROWTH INSTITUTIONAL FUND
Schedule of Investments April 30, 2018 (Unaudited)
| | | | |
| COMMON STOCKS—96.4% | | SHARES | | VALUE |
| AEROSPACE & DEFENSE—1.8% | | | | |
| Hexcel Corp. | | 31,309 | $ | 2,081,109 |
| Mercury Systems, Inc. * | | 43,114 | | 1,383,097 |
| | | | | 3,464,206 |
| APPAREL ACCESSORIES & LUXURY GOODS—0.7% | | | | |
| Canada Goose Holdings, Inc. * | | 38,963 | | 1,444,748 |
| APPAREL RETAIL—0.5% | | | | |
| Burlington Stores, Inc. * | | 7,028 | | 954,754 |
| APPLICATION SOFTWARE—15.0% | | | | |
| ACI Worldwide, Inc. * | | 134,107 | | 3,117,988 |
| Blackbaud, Inc. | | 54,825 | | 5,754,432 |
| Blackline, Inc. * | | 14,457 | | 598,520 |
| Ellie Mae, Inc. * | | 16,474 | | 1,595,836 |
| Everbridge, Inc. * | | 34,915 | | 1,304,075 |
| Guidewire Software, Inc. * | | 33,337 | | 2,820,977 |
| HubSpot, Inc. * | | 28,786 | | 3,048,437 |
| Manhattan Associates, Inc. * | | 41,496 | | 1,786,818 |
| Paycom Software, Inc. * | | 25,264 | | 2,885,402 |
| Tyler Technologies, Inc. * | | 29,871 | | 6,539,359 |
| | | | | 29,451,844 |
| ASSET MANAGEMENT & CUSTODY BANKS—1.8% | | | | |
| WisdomTree Investments, Inc. | | 339,006 | | 3,583,293 |
| BIOTECHNOLOGY—4.3% | | | | |
| ACADIA Pharmaceuticals, Inc. * | | 60,455 | | 955,794 |
| Bluebird Bio, Inc. * | | 5,453 | | 927,828 |
| CareDx, Inc. * | | 104,051 | | 1,018,659 |
| Clovis Oncology, Inc. * | | 12,111 | | 525,375 |
| Exact Sciences Corp. * | | 29,596 | | 1,480,096 |
| Halozyme Therapeutics, Inc. * | | 72,115 | | 1,365,137 |
| Repligen Corp. * | | 20,172 | | 746,364 |
| Sarepta Therapeutics, Inc. * | | 17,605 | | 1,344,318 |
| | | | | 8,363,571 |
| BREWERS—0.4% | | | | |
| Craft Brew Alliance, Inc. * | | 39,776 | | 767,677 |
| COMMUNICATIONS EQUIPMENT—0.6% | | | | |
| Lumentum Holdings, Inc. * | | 24,772 | | 1,249,747 |
| CONSUMER FINANCE—0.9% | | | | |
| LendingClub Corp. * | | 655,312 | | 1,762,789 |
| ELECTRONIC COMPONENTS—1.5% | | | | |
| Dolby Laboratories, Inc. , Cl. A | | 27,372 | | 1,637,393 |
| Universal Display Corp. | | 15,693 | | 1,381,769 |
| | | | | 3,019,162 |
| ELECTRONIC EQUIPMENT & INSTRUMENTS—3.5% | | | | |
| Cognex Corp. | | 94,471 | | 4,369,284 |
| FLIR Systems, Inc. | | 46,672 | | 2,499,285 |
| | | | | 6,868,569 |
- 33 -
THE ALGER INSTITUTIONAL FUNDS | ALGER SMALL CAP GROWTH INSTITUTIONAL FUND
Schedule of Investments April 30, 2018 (Unaudited) (Continued)
| | | | |
| COMMON STOCKS—96.4% (CONT. ) | | SHARES | | VALUE |
| FINANCIAL EXCHANGES & DATA—0.5% | | | | |
| MarketAxess Holdings, Inc. | | 5,374 | $ | 1,067,438 |
| GENERAL MERCHANDISE STORES—0.4% | | | | |
| Ollie's Bargain Outlet Holdings, Inc. * | | 14,021 | | 872,106 |
| HEALTH CARE EQUIPMENT—14.8% | | | | |
| Abaxis, Inc. | | 58,619 | | 3,902,267 |
| ABIOMED, Inc. * | | 26,050 | | 7,839,747 |
| Cantel Medical Corp. | | 61,331 | | 6,873,365 |
| DexCom, Inc. * | | 22,023 | | 1,611,643 |
| Inogen, Inc. * | | 26,770 | | 3,763,327 |
| Insulet Corp. * | | 59,293 | | 5,099,198 |
| | | | | 29,089,547 |
| HEALTH CARE SUPPLIES—8.5% | | | | |
| Neogen Corp. * | | 91,154 | | 6,212,145 |
| OraSure Technologies, Inc. * | | 107,015 | | 1,897,376 |
| Quidel Corp. * | | 151,885 | | 8,611,880 |
| | | | | 16,721,401 |
| HEALTH CARE TECHNOLOGY—6.9% | | | | |
| Medidata Solutions, Inc. * | | 69,551 | | 4,963,160 |
| Veeva Systems, Inc. , Cl. A* | | 79,238 | | 5,556,961 |
| Vocera Communications, Inc. * | | 125,105 | | 3,136,382 |
| | | | | 13,656,503 |
| HOME ENTERTAINMENT SOFTWARE—3.0% | | | | |
| Take-Two Interactive Software, Inc. * | | 58,180 | | 5,801,128 |
| HUMAN RESOURCE & EMPLOYMENT SERVICES—0.9% | | | | |
| WageWorks, Inc. * | | 44,096 | | 1,836,598 |
| INDUSTRIAL MACHINERY—2.8% | | | | |
| DMC Global, Inc. | | 36,114 | | 1,397,612 |
| Sun Hydraulics Corp. | | 82,406 | | 4,002,459 |
| | | | | 5,400,071 |
| INTERNET SOFTWARE & SERVICES—5.0% | | | | |
| Apptio, Inc. , Cl. A* | | 38,436 | | 1,134,246 |
| Cornerstone OnDemand, Inc. * | | 13,859 | | 611,598 |
| Coupa Software, Inc. * | | 22,940 | | 1,063,728 |
| GrubHub, Inc. * | | 14,300 | | 1,446,302 |
| Q2 Holdings, Inc. * | | 46,860 | | 2,307,855 |
| Shopify, Inc. , Cl. A* | | 13,672 | | 1,826,989 |
| SPS Commerce, Inc. * | | 22,171 | | 1,520,266 |
| | | | | 9,910,984 |
| IT CONSULTING & OTHER SERVICES—1.5% | | | | |
| InterXion Holding NV* | | 44,797 | | 2,912,701 |
| LEISURE FACILITIES—1.5% | | | | |
| Planet Fitness, Inc. , Cl. A* | | 74,917 | | 3,018,406 |
| LIFE SCIENCES TOOLS & SERVICES—4.2% | | | | |
| Bio-Techne Corp. | | 37,954 | | 5,727,638 |
| PRA Health Sciences, Inc. * | | 29,855 | | 2,453,186 |
| | | | | 8,180,824 |
- 34 -
THE ALGER INSTITUTIONAL FUNDS | ALGER SMALL CAP GROWTH INSTITUTIONAL FUND
Schedule of Investments April 30, 2018 (Unaudited) (Continued)
| | | | |
| COMMON STOCKS—96.4% (CONT. ) | | SHARES | | VALUE |
| MANAGED HEALTH CARE—1.2% | | | | |
| HealthEquity, Inc. * | | 34,602 | $ | 2,272,313 |
| MOVIES & ENTERTAINMENT—2.6% | | | | |
| Lions Gate Entertainment Corp. , Cl. A | | 85,153 | | 2,119,458 |
| Lions Gate Entertainment Corp. , Cl. B | | 89,720 | | 2,065,354 |
| Live Nation Entertainment, Inc. * | | 24,153 | | 953,319 |
| | | | | 5,138,131 |
| OIL & GAS EQUIPMENT & SERVICES—0.6% | | | | |
| RPC, Inc. | | 62,210 | | 1,120,402 |
| OIL & GAS EXPLORATION & PRODUCTION—0.9% | | | | |
| Parsley Energy, Inc. , Cl. A* | | 61,815 | | 1,856,304 |
| PERSONAL PRODUCTS—0.6% | | | | |
| elf Beauty, Inc. * | | 64,993 | | 1,180,923 |
| PHARMACEUTICALS—0.9% | | | | |
| Aerie Pharmaceuticals, Inc. * | | 33,463 | | 1,713,306 |
| RESTAURANTS—1.6% | | | | |
| Shake Shack, Inc. , Cl. A* | | 32,473 | | 1,546,040 |
| Wingstop, Inc. | | 34,534 | | 1,687,331 |
| | | | | 3,233,371 |
| SEMICONDUCTORS—2.1% | | | | |
| Cavium, Inc. * | | 17,565 | | 1,317,551 |
| Microsemi Corp. * | | 42,437 | | 2,745,249 |
| | | | | 4,062,800 |
| SPECIALTY CHEMICALS—1.6% | | | | |
| Balchem Corp. | | 36,092 | | 3,184,758 |
| SPECIALTY STORES—0.6% | | | | |
| Five Below, Inc. * | | 16,797 | | 1,186,036 |
| SYSTEMS SOFTWARE—2.7% | | | | |
| Proofpoint, Inc. * | | 45,454 | | 5,360,845 |
| TOTAL COMMON STOCKS | | | | |
| (Cost $121,715,819) | | | | 189,707,256 |
| PREFERRED STOCKS—0.8% | | SHARES | | VALUE |
| BIOTECHNOLOGY—0.2% | | | | |
| Prosetta Biosciences, Inc. , Series D*,@,(a),(b) | | 133,263 | | 399,789 |
| PHARMACEUTICALS—0.6% | | | | |
| Intarcia Therapeutics, Inc. , Series DD*,@,(b) | | 41,238 | | 1,105,591 |
| TOTAL PREFERRED STOCKS | | | | |
| (Cost $1,935,382) | | | | 1,505,380 |
| RIGHTS—0.9% | | SHARES | | VALUE |
| BIOTECHNOLOGY—0.9% | | | | |
| Dyax Corp. *,@,(b) | | 21,650 | | 61,486 |
| Neuralstem, Inc. Strike Price: 47.61, 1/8/19* | | 19,260 | | – |
- 35 -
THE ALGER INSTITUTIONAL FUNDS | ALGER SMALL CAP GROWTH INSTITUTIONAL FUND
Schedule of Investments April 30, 2018 (Unaudited) (Continued)
| | | | | |
| RIGHTS—0.9% (CONT. ) | | SHARES | | | VALUE |
| BIOTECHNOLOGY—0.9% (CONT. ) | | | | | |
| Tolero CDR*,@,(b),(c) | | 528,559 | | $ | 1,723,705 |
| | | | | | 1,785,191 |
| TOTAL RIGHTS | | | | | |
| (Cost $285,725) | | | | | 1,785,191 |
| REAL ESTATE INVESTMENT TRUST—0.8% | | SHARES | | | VALUE |
| SPECIALIZED—0.8% | | | | | |
| CyrusOne, Inc. | | 29,145 | | | 1,561,881 |
| (Cost $971,767) | | | | | 1,561,881 |
| SPECIAL PURPOSE VEHICLE—0.5% | | SHARES | | | VALUE |
| CONSUMER FINANCE—0.5% | | | | | |
| JS Kred SPV I, LLC. *,@,(b) | | 775,134 | | | 949,849 |
| (Cost $775,134) | | | | | 949,849 |
| Total Investments | | | | | |
| (Cost $125,683,827) | | 99.4 | % | $ | 195,509,557 |
| Affiliated Securities (Cost $599,684) | | | | | 399,789 |
| Unaffiliated Securities (Cost $125,084,143) | | | | | 195,109,768 |
| Other Assets in Excess of Liabilities | | 0.6 | % | | 1,247,934 |
| NET ASSETS | | 100.0 | % | $ | 196,757,491 |
(a) Deemed an affiliate of the Alger fund complex during the year in accordance with Section 2(a)(3) of the Investment Company Act of
1940. See Affiliated Securities Note 11.
(b) Security is valued in good faith at fair value determined using significant unobservable inputs pursuant to procedures established by the
Board.
(c) Contingent Deferred Rights.
* Non-income producing security.
@ Restricted security - Investment in security not registered under the Securities Act of 1933. The investment is deemed to not be liquid
and may be sold only to qualified buyers.
| | | | | | | | | |
| | | | | % of net assets | | | | % of net assets | |
| | Acquisition | | Acquisition | (Acquisition | | | Market | as of | |
| Security | Date(s) | | Cost | Date) | | | Value | 4/30/2018 | |
| Dyax Corp. Rights | 05/01/15 | $ | 0 | 0.0 | % | $ | 37,488 | 0.02 | % |
| Dyax Corp. Rights | 08/14/15 | | 0 | 0.0 | % | | 23,998 | 0.01 | % |
| Intarcia Therapeutics, Inc. , Series | | | | | | | | | |
| DD | 03/27/14 | | 1,335,699 | 0.15 | % | | 1,105,591 | 0.56 | % |
| JS Kred SPV I, LLC. | 06/26/15 | | 775,134 | 0.15 | % | | 949,849 | 0.48 | % |
| Prosetta Biosciences, Inc. , Series D | 02/06/15 | | 599,684 | 0.10 | % | | 399,789 | 0.20 | % |
| Tolero CDR | 02/06/17 | | 285,725 | 0.16 | % | | 1,723,705 | 0.88 | % |
| Total | | | | | | $ | 4,240,420 | 2.15 | % |
| | | | | | | | | | |
| See Notes to Financial Statements. | | | | | | | | |
- 36 -
THE ALGER INSTITUTIONAL FUNDS
Statement of Assets and Liabilities April 30, 2018 (Unaudited)
| | | | | | |
| | | Alger Capital | | | Alger Capital | |
| | | Appreciation | | Appreciation Focus | |
| | Institutional Fund | | | Fund | |
| |
| ASSETS: | | | | | | |
| Investments in unaffiliated securities, at value (Identified cost | | | | | | |
| below)* see accompanying schedules of investments | $ | 3,406,869,982 | | $ | 158,650,639 | |
| Investments in affiliated securities, at value (Identified cost | | | | | | |
| below)** see accompanying schedules of investments | | — | | | 230,475 | |
| Cash and cash equivalents | | 173,713,094 | | | 8,611,375 | |
| Receivable for investment securities sold | | 44,683,586 | | | 2,615,575 | |
| Receivable for shares of beneficial interest sold | | 9,177,747 | | | 728,703 | |
| Dividends and interest receivable | | 1,271,608 | | | 24,987 | |
| Receivable from Investment Manager | | 8,978 | | | 6,780 | |
| Prepaid expenses | | 359,034 | | | 74,204 | |
| Total Assets | | 3,636,084,029 | | | 170,942,738 | |
| |
| LIABILITIES: | | | | | | |
| Payable for investment securities purchased | | 31,202,470 | | | 1,458,765 | |
| Payable for shares of beneficial interest redeemed | | 17,265,061 | | | 286,243 | |
| Accrued investment advisory fees | | 2,244,919 | | | 74,701 | |
| Accrued transfer agent fees | | 1,211,671 | | | 26,675 | |
| Accrued distribution fees | | 277,234 | | | 25,052 | |
| Accrued administrative fees | | 86,321 | | | 3,951 | |
| Accrued shareholder servicing fees | | 659,746 | | | 5,894 | |
| Accrued shareholder administrative fees | | 31,389 | | | 1,716 | |
| Accrued other expenses | | 347,378 | | | 72,286 | |
| Total Liabilities | | 53,326,189 | | | 1,955,283 | |
| NET ASSETS | $ | 3,582,757,840 | | $ | 168,987,455 | |
| |
| NET ASSETS CONSIST OF: | | | | | | |
| Paid in capital (par value of $. 001 per share) | | 2,344,680,949 | | | 131,364,986 | |
| Undistributed net investment income (accumulated loss) | | (1,546,992 | ) | | 14,097 | |
| Undistributed net realized gain | | 250,714,064 | | | 16,271,064 | |
| Net unrealized appreciation on investments | | 988,909,819 | | | 21,337,308 | |
| NET ASSETS | $ | 3,582,757,840 | | $ | 168,987,455 | |
| * Identified cost | $ | 2,417,890,764(a) | | $ | 137,198,104 | (b) |
| ** Identified cost | $ | — | | $ | 345,713 | (b) |
| See Notes to Financial Statements. | | | | | | |
- 37 -
THE ALGER INSTITUTIONAL FUNDS
Statement of Assets and Liabilities April 30, 2018 (Unaudited) (Continued)
| | | | |
| | | Alger Capital | | Alger Capital |
| | | Appreciation | Appreciation Focus |
| | Institutional Fund | | Fund |
| |
| NET ASSETS BY CLASS: | | | | |
| Class A | $ | — | $ | 28,138,120 |
| Class C | $ | — | $ | 22,126,530 |
| Class I | $ | 2,369,571,596 | $ | 27,677,001 |
| Class R | $ | 632,086,642 | $ | — |
| Class Y | $ | 125,799,117 | $ | 5,325,653 |
| Class Z | $ | — | $ | 85,720,151 |
| Class Z-2 | $ | 455,300,485 | $ | — |
| |
| SHARES OF BENEFICIAL INTEREST OUTSTANDING — NOTE 6: | | | |
| Class A | | — | | 847,256 |
| Class C | | — | | 694,763 |
| Class I | | 70,057,120 | | 829,197 |
| Class R | | 20,874,220 | | — |
| Class Y | | 3,701,785 | | 156,964 |
| Class Z | | — | | 2,530,964 |
| Class Z-2 | | 13,392,095 | | — |
| |
| NET ASSET VALUE PER SHARE: | | | | |
| Class A — Net Asset Value Per Share Class A | $ | — | $ | 33.21 |
| Class A — Offering Price Per Share | | | | |
| (includes a 5.25% sales charge) | $ | — | $ | 35.05 |
| Class C — Net Asset Value Per Share Class C | $ | — | $ | 31.85 |
| Class I — Net Asset Value Per Share Class I | $ | 33.82 | $ | 33.38 |
| Class R — Net Asset Value Per Share Class R | $ | 30.28 | $ | — |
| Class Y — Net Asset Value Per Share Class Y | $ | 33.98 | $ | 33.93 |
| Class Z — Net Asset Value Per Share Class Z | $ | — | $ | 33.87 |
| Class Z-2 — Net Asset Value Per Share Class Z-2 | $ | 34.00 | $ | — |
| See Notes to Financial Statements. | | | | |
(a) At April 30, 2018, the net unrealized appreciation on investments, based on cost for federal income tax purposes of
$2,443,550,394, amounted to $963,319,588 which consisted of aggregate gross unrealized appreciation of $1,017,598,976 and
aggregate gross unrealized depreciation of $54,279,388.
(b) At April 30, 2018, the net unrealized appreciation on investments, based on cost for federal income tax purposes of $138,409,550,
amounted to $20,471,564 which consisted of aggregate gross unrealized appreciation of $23,263,699 and aggregate gross
unrealized depreciation of $2,792,135.
- 38 -
THE ALGER INSTITUTIONAL FUNDS
Statement of Assets and Liabilities April 30, 2018 (Unaudited) (Continued)
| | | | | | |
| | | Alger Mid Cap | | Alger Small Cap | |
| | Growth Institutional | | Growth Institutional | |
| | | Fund | | | Fund | |
| |
| ASSETS: | | | | | | |
| Investments in unaffiliated securities, at value (Identified cost | | | | | | |
| below)* see accompanying schedules of investments | $ | 102,793,936 | | $ | 195,109,768 | |
| Investments in affiliated securities, at value (Identified cost | | | | | | |
| below)** see accompanying schedules of investments | | 498,027 | | | 399,789 | |
| Cash and cash equivalents | | 2,816,496 | | | 3,023,730 | |
| Receivable for investment securities sold | | 3,927,916 | | | 75,542 | |
| Receivable for shares of beneficial interest sold | | 67,656 | | | 194,301 | |
| Dividends and interest receivable | | 1,321 | | | 13,569 | |
| Receivable for escrow, at value (Identified cost below)*** | | 493,684 | | | 616,987 | |
| Receivable from Investment Manager | | 892 | | | 2,490 | |
| Prepaid expenses | | 59,180 | | | 51,753 | |
| Total Assets | | 110,659,108 | | | 199,487,929 | |
| |
| LIABILITIES: | | | | | | |
| Payable for investment securities purchased | | 3,230,014 | | | 1,449,311 | |
| Payable for shares of beneficial interest redeemed | | 1,709,437 | | | 926,372 | |
| Accrued investment advisory fees | | 71,615 | | | 140,602 | |
| Accrued transfer agent fees | | 48,469 | | | 84,013 | |
| Accrued distribution fees | | 5,229 | | | 4,214 | |
| Accrued administrative fees | | 2,591 | | | 4,773 | |
| Accrued shareholder servicing fees | | 21,039 | | | 30,741 | |
| Accrued shareholder administrative fees | | 942 | | | 1,736 | |
| Accrued other expenses | | 57,967 | | | 88,676 | |
| Total Liabilities | | 5,147,303 | | | 2,730,438 | |
| NET ASSETS | $ | 105,511,805 | | $ | 196,757,491 | |
| |
| NET ASSETS CONSIST OF: | | | | | | |
| Paid in capital (par value of $. 001 per share) | | 95,719,772 | | | 120,515,698 | |
| Undistributed net investment income (accumulated loss) | | (980,983 | ) | | (2,341,455 | ) |
| Undistributed net realized gain | | 1,949,948 | | | 8,238,310 | |
| Net unrealized appreciation on investments | | 8,823,068 | | | 70,344,938 | |
| NET ASSETS | $ | 105,511,805 | | $ | 196,757,491 | |
| * Identified cost | $ | 94,136,072(a) | | $ | 125,084,143 | (b) |
| ** Identified cost | $ | 747,040(a) | | $ | 599,684 | (b) |
| *** Identified cost escrow receivable | $ | 77,404(a) | | $ | 97,779 | (b) |
| See Notes to Financial Statements. | | | | | | |
- 39 -
THE ALGER INSTITUTIONAL FUNDS
Statement of Assets and Liabilities April 30, 2018 (Unaudited) (Continued)
| | | | |
| | | Alger Mid Cap | | Alger Small Cap |
| | Growth Institutional | Growth Institutional |
| | | Fund | | Fund |
| |
| NET ASSETS BY CLASS: | | | | |
| Class I | $ | 83,014,046 | $ | 130,433,614 |
| Class R | $ | 11,751,131 | $ | 9,556,438 |
| Class Z-2 | $ | 10,746,628 | $ | 56,767,439 |
| |
| SHARES OF BENEFICIAL INTEREST OUTSTANDING — NOTE 6: | | | |
| Class I | | 2,800,394 | | 6,138,823 |
| Class R | | 432,171 | | 533,159 |
| Class Z-2 | | 361,161 | | 2,656,121 |
| |
| NET ASSET VALUE PER SHARE: | | | | |
| Class I — Net Asset Value Per Share Class I | $ | 29.64 | $ | 21.25 |
| Class R — Net Asset Value Per Share Class R | $ | 27.19 | $ | 17.92 |
| Class Z-2 — Net Asset Value Per Share Class Z-2 | $ | 29.76 | $ | 21.37 |
| See Notes to Financial Statements. | | | | |
(a) At April 30, 2018, the net unrealized appreciation on investments, based on cost for federal income tax purposes of $94,854,444,
amounted to $8,437,519 which consisted of aggregate gross unrealized appreciation of $11,955,250 and aggregate gross
unrealized depreciation of $3,517,731.
(b) At April 30, 2018, the net unrealized appreciation on investments, based on cost for federal income tax purposes of $128,284,615,
amounted to $67,224,942 which consisted of aggregate gross unrealized appreciation of $76,746,117 and aggregate gross
unrealized depreciation of $9,521,175.
- 40 -
THE ALGER INSTITUTIONAL FUNDS
Statement of Operations for the six months ended April 30, 2018 (Unaudited)
| | | | | | |
| | | Alger Capital | | | Alger Capital | |
| | | Appreciation | | Appreciation Focus | |
| | Institutional Fund | | | Fund | |
| |
| INCOME: | | | | | | |
| Dividends | $ | 18,910,924 | | $ | 666,852 | |
| Interest from unaffiliated securities | | 164,282 | | | 17,326 | |
| Total Income | | 19,075,206 | | | 684,178 | |
| |
| EXPENSES: | | | | | | |
| Advisory fees — Note 3(a) | | 13,260,826 | | | 396,343 | |
| Distribution fees — Note 3(c) | | | | | | |
| Class A | | — | | | 32,244 | |
| Class C | | — | | | 100,580 | |
| Class R | | 1,626,641 | | | — | |
| Shareholder servicing fees — Note 3(k) | | 3,852,955 | | | 31,642 | |
| Shareholder administrative fees — Note 3(f) | | 182,169 | | | 8,982 | |
| Administration fees — Note 3(b) | | 500,965 | | | 20,597 | |
| Custodian fees | | 92,981 | | | 31,428 | |
| Interest expenses | | 13,579 | | | 305 | |
| Transfer agent fees and expenses — Note 3(f) | | 1,191,923 | | | 33,918 | |
| Printing fees | | 100,885 | | | 18,950 | |
| Professional fees | | 78,116 | | | 18,083 | |
| Registration fees | | 50,240 | | | 34,262 | |
| Trustee fees — Note 3(g) | | 67,231 | | | 2,908 | |
| Fund accounting fees | | 249,187 | | | 13,703 | |
| Miscellaneous | | 104,309 | | | 3,963 | |
| Total Expenses | | 21,372,007 | | | 747,908 | |
| Less, expense reimbursements/waivers — Note 3(a) | | (100,165 | ) | | (23,208 | ) |
| Net Expenses | | 21,271,842 | | | 724,700 | |
| NET INVESTMENT LOSS | | (2,196,636 | ) | | (40,522 | ) |
| | | | | | | |
| REALIZED AND UNREALIZED GAIN (LOSS) ON INVESTMENTS AND FOREIGN CURRENCY: | | |
| Net realized gain on unaffiliated investments | | | 280,043,533 | | | 17,192,199 | |
| Net realized (loss) on affiliated investments | | | (2,970,741 | ) | | — | |
| Net realized (loss) on foreign currency transactions | | | (31,311 | ) | | (28 | ) |
| Net change in unrealized (depreciation) on unaffiliated | | | | | | | |
| investments | | | (54,794,183 | ) | | (5,181,826 | ) |
| Net change in unrealized appreciation (depreciation) on | | | | | | | |
| affiliated investments | | | 2,970,741 | | | (9,219 | ) |
| Net change in unrealized appreciation (depreciation) on | | | | | | | |
| foreign currency | | | (197 | ) | | 11 | |
| Net realized and unrealized gain on investments and foreign | | | | | | | |
| currency | | | 225,217,842 | | | 12,001,137 | |
| NET INCREASE IN NET ASSETS RESULTING FROM | | | | | | | |
| OPERATIONS | $ | 223,021,206 | | $ | 11,960,615 | |
| See Notes to Financial Statements. | | | | | | | |
- 41 -
THE ALGER INSTITUTIONAL FUNDS
Statement of Operations for the six months ended April 30, 2018 (Unaudited) (Continued)
| | | | | | |
| | | Alger Mid Cap | | | Alger Small Cap | |
| | Growth Institutional | | Growth Institutional | |
| | | Fund | | | Fund | |
| |
| INCOME: | | | | | | |
| Dividends (net of foreign withholding taxes*) | $ | 359,297 | | $ | 470,803 | |
| Interest from unaffiliated securities | | 8,623 | | | 5,585 | |
| Total Income | | 367,920 | | | 476,388 | |
| |
| EXPENSES: | | | | | | |
| Advisory fees — Note 3(a) | | 416,155 | | | 821,889 | |
| Distribution fees — Note 3(c) | | | | | | |
| Class R | | 31,284 | | | 26,327 | |
| Shareholder servicing fees — Note 3(k) | | 124,002 | | | 176,314 | |
| Shareholder administrative fees — Note 3(f) | | 5,476 | | | 10,147 | |
| Administration fees — Note 3(b) | | 15,058 | | | 27,904 | |
| Custodian fees | | 28,483 | | | 27,852 | |
| Interest expenses | | 33 | | | 1,040 | |
| Transfer agent fees and expenses — Note 3(f) | | 43,580 | | | 77,901 | |
| Printing fees | | 6,918 | | | 14,256 | |
| Professional fees | | 30,573 | | | 31,993 | |
| Registration fees | | 17,328 | | | 19,187 | |
| Trustee fees — Note 3(g) | | 2,047 | | | 3,749 | |
| Fund accounting fees | | 9,062 | | | 15,581 | |
| Miscellaneous | | 9,954 | | | 16,459 | |
| Total Expenses | | 739,953 | | | 1,270,599 | |
| Less, expense reimbursements/waivers — Note 3(a) | | (1,195 | ) | | (2,507 | ) |
| Net Expenses | | 738,758 | | | 1,268,092 | |
| NET INVESTMENT LOSS | | (370,838 | ) | | (791,704 | ) |
| | | | | | |
| REALIZED AND UNREALIZED GAIN (LOSS) ON INVESTMENTS, ESCROW RECEIVABLE AND FOREIGN | |
| CURRENCY: | | | | | | |
| Net realized gain on unaffiliated investments | | 2,088,568 | | | 11,318,588 | |
| Net realized (loss) on affiliated investments | | (168,176 | ) | | — | |
| Net realized gain on foreign currency transactions | | — | | | 6 | |
| Net change in unrealized appreciation on unaffiliated | | | | | | |
| investments and escrow receivable | | 2,043,844 | | | 2,641,939 | |
| Net change in unrealized appreciation (depreciation) on | | | | | | |
| affiliated investments | | 148,255 | | | (15,992 | ) |
| Net realized and unrealized gain on investments, escrow | | | | | | |
| receivable and foreign currency | | 4,112,491 | | | 13,944,541 | |
| NET INCREASE IN NET ASSETS RESULTING FROM | | | | | | |
| OPERATIONS | $ | 3,741,653 | | $ | 13,152,837 | |
| * Foreign withholding taxes | $ | 1,553 | | $ | 2,395 | |
| See Notes to Financial Statements. | | | | | | |
- 42 -
THE ALGER INSTITUTIONAL FUNDS
Statements of Changes in Net Assets (Unaudited)
| | | | | | | |
| | Alger Capital Appreciation Institutional Fund | |
| | | | For the | | | For the | |
| | | | Six Months Ended | | | Year Ended | |
| | | | April 30, 2018 | | | October 31, 2017 | |
| |
| Net investment loss | $ | (2,196,636 | ) | $ | (1,862,662 | ) |
| Net realized gain on investments and foreign currency | | | 277,041,481 | | | 263,519,037 | |
| Net change in unrealized appreciation (depreciation) on | | | | | | | |
| investments and foreign currency | | | (51,823,639 | ) | | 612,149,835 | |
| Net increase in net assets resulting from operations | | | 223,021,206 | | | 873,806,210 | |
| |
| Dividends and distributions to shareholders from: | | | | | | | |
| Net realized gains: | | | | | | | |
| Class I | | | (155,695,093 | ) | | (19,820,400 | ) |
| Class R | | | (45,926,496 | ) | | (4,624,888 | ) |
| Class Y | | | (6,401,127 | ) | | — | |
| Class Z-2 | | | (28,017,833 | ) | | (1,189,367 | ) |
| Total dividends and distributions to shareholders | | | (236,040,549 | ) | | (25,634,655 | ) |
| |
| Increase (decrease) from shares of beneficial interest transactions: | | | | | | |
| Class I | | | (76,792,510 | ) | | (1,124,431,159 | ) |
| Class R | | | (15,492,857 | ) | | (72,815,333 | ) |
| Class Y | | | 27,794,478 | | | 92,176,269 | |
| Class Z-2 | | | 19,445,418 | | | 351,709,750 | |
| Net decrease from shares of beneficial interest transactions | | | | | | | |
| — Note 6 | | | (45,045,471 | ) | | (753,360,473 | ) |
| Total increase (decrease) | | | (58,064,814 | ) | | 94,811,082 | |
| |
| Net Assets: | | | | | | | |
| Beginning of period | | | 3,640,822,654 | | | 3,546,011,572 | |
| END OF PERIOD | $ | 3,582,757,840 | | $ | 3,640,822,654 | |
| Undistributed net investment income (accumulated loss) | $ | (1,546,992 | ) | $ | 649,644 | |
| See Notes to Financial Statements. | | | | | | | |
- 43 -
THE ALGER INSTITUTIONAL FUNDS
Statements of Changes in Net Assets (Unaudited) (Continued)
| | | | | | | |
| | | | Alger Capital Appreciation Focus Fund | |
| | | | For the | | | For the | |
| | | | Six Months Ended | | | Year Ended | |
| | | | April 30, 2018 | | | October 31, 2017 | |
| |
| Net investment loss | $ | (40,522 | ) | $ | (15,268 | ) |
| Net realized gain on investments and foreign currency | | | 17,192,171 | | | 8,631,002 | |
| Net change in unrealized appreciation (depreciation) on | | | | | | | |
| investments and foreign currency | | | (5,191,034 | ) | | 20,091,300 | |
| Net increase in net assets resulting from operations | | | 11,960,615 | | | 28,707,034 | |
| |
| Dividends and distributions to shareholders from: | | | | | | | |
| Net realized gains: | | | | | | | |
| Class A | | | (928,906 | ) | | — | |
| Class C | | | (741,525 | ) | | — | |
| Class I | | | (903,458 | ) | | — | |
| Class Y | | | (166,506 | ) | | — | |
| Class Z | | | (2,493,828 | ) | | — | |
| Total dividends and distributions to shareholders | | | (5,234,223 | ) | | — | |
| |
| Increase (decrease) from shares of beneficial interest transactions: | | | | | | |
| Class A | | | 3,283,437 | | | (7,858,588 | ) |
| Class C | | | 2,675,875 | | | 2,099,824 | |
| Class I | | | 2,577,805 | | | (4,667,192 | ) |
| Class Y | | | 763,286 | | | 4,131,666 | |
| Class Z | | | 20,616,028 | | | 34,166,838 | |
| Net increase from shares of beneficial interest transactions — | | | | | | | |
| Note 6 | | | 29,916,431 | | | 27,872,548 | |
| Total increase | | | 36,642,823 | | | 56,579,582 | |
| |
| Net Assets: | | | | | | | |
| Beginning of period | | | 132,344,632 | | | 75,765,050 | |
| END OF PERIOD | $ | 168,987,455 | | $ | 132,344,632 | |
| Undistributed net investment income | $ | 14,097 | | $ | 54,619 | |
| See Notes to Financial Statements. | | | | | | | |
- 44 -
THE ALGER INSTITUTIONAL FUNDS
Statements of Changes in Net Assets (Unaudited) (Continued)
| | | | | | | | |
| | | Alger Mid Cap Growth Institutional Fund | |
| | | | For the | | | | For the | |
| | | | Six Months Ended | | | | Year Ended | |
| | | | April 30, 2018 | | | | October 31, 2017 | |
| |
| Net investment loss | $ | (370,838 | ) | $ | (564,987 | ) |
| Net realized gain on investments and foreign currency | | | 1,920,392 | | | | 23,865,772 | |
| Net change in unrealized appreciation on investments and | | | | | | | | |
| escrow receivable | | | 2,192,099 | | | | 4,805,094 | |
| Net increase in net assets resulting from operations | | | 3,741,653 | | | | 28,105,879 | |
| |
| Increase (decrease) from shares of beneficial interest transactions: | | | | | | | |
| Class I | | | (5,885,286 | ) | | | (18,928,722 | ) |
| Class R | | | (1,599,937 | ) | | | (3,822,468 | ) |
| Class Z-2 | | | 1,612,141 | | | | 7,301,003 | |
| Net decrease from shares of beneficial interest transactions | | | | | | | | |
| — Note 6 | | | (5,873,082 | ) | | | (15,450,187 | ) |
| Total increase (decrease) | | | (2,131,429 | ) | | | 12,655,692 | |
| |
| Net Assets: | | | | | | | | |
| Beginning of period | | | 107,643,234 | | | | 94,987,542 | |
| END OF PERIOD | $ | 105,511,805 | | $ | 107,643,234 | |
| Undistributed net investment income (accumulated loss) | $ | (980,983 | ) | $ | (610,145 | ) |
| See Notes to Financial Statements. | | | | | | | | |
- 45 -
THE ALGER INSTITUTIONAL FUNDS
Statements of Changes in Net Assets (Unaudited) (Continued)
| | | | | | | |
| | | Alger Small Cap Growth Institutional Fund | |
| | | | For the | | | For the | |
| | | | Six Months Ended | | | Year Ended | |
| | | | April 30, 2018 | | | October 31, 2017 | |
| |
| Net investment loss | $ | (791,704 | ) | $ | (1,374,929 | ) |
| Net realized gain on investments and foreign currency | | | 11,318,594 | | | 13,341,081 | |
| Net change in unrealized appreciation on investments, escrow | | | | | | | |
| receivable and foreign currency | | | 2,625,947 | | | 49,808,677 | |
| Net increase in net assets resulting from operations | | | 13,152,837 | | | 61,774,829 | |
| |
| Dividends and distributions to shareholders from: | | | | | | | |
| Net realized gains: | | | | | | | |
| Class I | | | (3,663,266 | ) | | — | |
| Class R | | | (360,715 | ) | | — | |
| Class Z-2 | | | (1,861,053 | ) | | — | |
| Total dividends and distributions to shareholders | | | (5,885,034 | ) | | — | |
| |
| Increase (decrease) from shares of beneficial interest transactions: | | | | | | |
| Class I | | | (4,701,335 | ) | | (38,794,988 | ) |
| Class R | | | (1,958,588 | ) | | (5,270,974 | ) |
| Class Z-2 | | | (12,898,300 | ) | | 7,688,642 | |
| Net decrease from shares of beneficial interest transactions | | | | | | | |
| — Note 6 | | | (19,558,223 | ) | | (36,377,320 | ) |
| Total increase (decrease) | | | (12,290,420 | ) | | 25,397,509 | |
| |
| Net Assets: | | | | | | | |
| Beginning of period | | | 209,047,911 | | | 183,650,402 | |
| END OF PERIOD | $ | 196,757,491 | | $ | 209,047,911 | |
| Undistributed net investment income (accumulated loss) | $ | (2,341,455 | ) | $ | (1,549,751 | ) |
| See Notes to Financial Statements. | | | | | | | |
- 46 -
THE ALGER INSTITUTIONAL FUNDS
Financial Highlights for a share outstanding throughout the period (Unaudited)
| | | | | | | | | | | | | | | | | | | | | | | | |
| Alger Capital Appreciation | | | | | | | | | | | | | | | | | | | | | | | | |
| Institutional Fund | | | | | | | | | | | Class I | | | | | | | | | | |
| | | Six months | | | | | | | | | | | | | | | | | | | | | |
| | | | ended | | | Year ended | | | Year ended | | | Year ended | | | Year ended | | | Year ended | |
| | | 4/30/2018 | (i) | | 10/31/2017 | | | 10/31/2016 | | | 10/31/2015 | | | 10/31/2014 | | | 10/31/2013 | |
| Net asset value, beginning of period | | $ | 33.96 | | | $ | 26.44 | | | $ | 28.48 | | | $ | 29.34 | | | $ | 28.21 | | | $ | 22.85 | |
| INCOME FROM INVESTMENT | | | | | | | | | | | | | | | | | | | | | | | | |
| OPERATIONS: | | | | | | | | | | | | | | | | | | | | | | | | |
| Net investment income (loss)(ii) | | | (0.01 | ) | | | – | | | | 0.02 | | | | (0.02 | ) | | | (0.02 | ) | | | 0.16 | |
| Net realized and unrealized gain (loss) | | | | | | | | | | | | | | | | | | | | | | | | |
| on investments | | | 2.06 | | | | 7.71 | | | | (0.02 | ) | | | 2.46 | | | | 4.57 | | | | 6.21 | |
| Total from investment operations | | | 2.05 | | | | 7.71 | | | | – | | | | 2.44 | | | | 4.55 | | | | 6.37 | |
| Dividends from net investment income | – | | | | – | | | | – | | | | – | | | | (0.01 | ) | | | (0.17 | ) |
| Distributions from net realized gains | | | (2.19 | ) | | | (0.19 | ) | | | (2.04 | ) | | | (3.30 | ) | | | (3.41 | ) | | | (0.84 | ) |
| Net asset value, end of period | | $ | 33.82 | | | $ | 33.96 | | | $ | 26.44 | | | $ | 28.48 | | | $ | 29.34 | | | $ | 28.21 | |
| Total return | | | 6.29 | % | | | 29.38 | % | | | (0.08 | )% | | | 8.96 | % | | | 17.63 | % | | | 29.02 | % |
| RATIOS/SUPPLEMENTAL DATA: | | | | | | | | | | | | | | | | | | | | | | | | |
| Net assets, end of period (000's | | | | | | | | | | | | | | | | | | | | | | | | |
| omitted) | $ | 2,369,572 | | $ | 2,451,822 | | $ | 2,965,503 | | $ | 3,194,261 | | $ | 2,555,737 | | $ | 1,958,405 | |
| Ratio of gross expenses to average | | | | | | | | | | | | | | | | | | | | | | | | |
| net assets | | | 1.13 | % | | | 1.14 | % | | | 1.12 | % | | | 1.12 | % | | | 1.16 | % | | | 1.19 | % |
| Ratio of net expenses to average net | | | | | | | | | | | | | | | | | | | | | | | | |
| assets | | | 1.13 | % | | | 1.14 | % | | | 1.12 | % | | | 1.12 | % | | | 1.16 | % | | | 1.19 | % |
| Ratio of net investment income (loss) to | | | | | | | | | | | | | | | | | | | | | | | | |
| average net assets | | | (0.08 | )% | | | 0.01 | % | | | 0.07 | % | | | (0.07 | )% | | | (0.07 | )% | | | 0.65 | % |
| Portfolio turnover rate | | | 29.04 | % | | | 66.72 | % | | | 94.56 | % | | | 136.03 | %(ii) | | | 136.20 | %(iv) | | | 124.43 | % |
| See Notes to Financial Statements. | | | | | | | | | | | | | | | | | | | | | |
(i) Ratios have been annualized; total return and portfolio turnover rate have not been annualized.
(ii) Amount was computed based on average shares outstanding during the period.
(iii) Amount excludes redemption in kind transaction of $294,638,130.
(iv) Amount excludes redemption in kind transaction of $71,436,408.
- 47 -
THE ALGER INSTITUTIONAL FUNDS
Financial Highlights for a share outstanding throughout the period (Unaudited)
| | | | | | | | | | | | | | | | | | |
| Alger Capital Appreciation | | | | | | | | | | | | | | | | | | |
| Institutional Fund | | | | | | | | Class R | | | | | | | |
| | Six months | | | | | | | | | | | | | | | | |
| | | ended | | Year ended | | Year ended | | Year ended | | Year ended | | Year ended | |
| | 4/30/2018 | (i) | 10/31/2017 | | 10/31/2016 | | 10/31/2015 | | 10/31/2014 | | 10/31/2013 | |
| Net asset value, beginning of period | $ | 30.70 | | $ | 24.03 | | $ | 26.19 | | $ | 27.35 | | $ | 26.63 | | $ | 21.76 | |
| INCOME FROM INVESTMENT | | | | | | | | | | | | | | | | | | |
| OPERATIONS: | | | | | | | | | | | | | | | | | | |
| Net investment income (loss)(ii) | | (0.09 | ) | | (0.13 | ) | | (0.10 | ) | | (0.15 | ) | | (0.14 | ) | | 0.04 | |
| Net realized and unrealized gain (loss) | | | | | | | | | | | | | | | | | | |
| on investments | | 1.86 | | | 6.99 | | | (0.02 | ) | | 2.29 | | | 4.27 | | | 5.87 | |
| Total from investment operations | | 1.77 | | | 6.86 | | | (0.12 | ) | | 2.14 | | | 4.13 | | | 5.91 | |
| Dividends from net investment income | – | | | – | | | – | | | – | | | – | | | (0.20 | ) |
| Distributions from net realized gains | | (2.19 | ) | | (0.19 | ) | | (2.04 | ) | | (3.30 | ) | | (3.41 | ) | | (0.84 | ) |
| Net asset value, end of period | $ | 30.28 | | $ | 30.70 | | $ | 24.03 | | $ | 26.19 | | $ | 27.35 | | $ | 26.63 | |
| Total return | | 6.03 | % | | 28.78 | % | | (0.57 | )% | | 8.46 | % | | 17.04 | % | | 28.35 | % |
| RATIOS/SUPPLEMENTAL DATA: | | | | | | | | | | | | | | | | | | |
| Net assets, end of period (000's | | | | | | | | | | | | | | | | | | |
| omitted) | $ | 632,087 | | $ | 654,966 | | $ | 578,297 | | $ | 656,469 | | $ | 529,757 | | $ | 442,449 | |
| Ratio of gross expenses to average | | | | | | | | | | | | | | | | | | |
| net assets | | 1.62 | % | | 1.62 | % | | 1.61 | % | | 1.61 | % | | 1.64 | % | | 1.69 | % |
| Ratio of net expenses to average net | | | | | | | | | | | | | | | | | | |
| assets | | 1.62 | % | | 1.62 | % | | 1.61 | % | | 1.61 | % | | 1.64 | % | | 1.69 | % |
| Ratio of net investment income (loss) to | | | | | | | | | | | | | | | | | | |
| average net assets | | (0.58 | )% | | (0.48 | )% | | (0.41 | )% | | (0.57 | )% | | (0.55 | )% | | 0.17 | % |
| Portfolio turnover rate | | 29.04 | % | | 66.72 | % | | 94.56 | % | | 136.03%(iii) | | | 136.20 | %(iv) | | 124.43 | % |
| See Notes to Financial Statements. | | | | | | | | | | | | | | | | |
(i) Ratios have been annualized; total return and portfolio turnover rate have not been annualized.
(ii) Amount was computed based on average shares outstanding during the period.
(iii) Amount excludes redemption in kind transaction of $294,638,130.
(iv) Amount excludes redemption in kind transaction of $71,436,408.
- 48 -
THE ALGER INSTITUTIONAL FUNDS
Financial Highlights for a share outstanding throughout the period (Unaudited)
| | | | | | |
| Alger Capital Appreciation | | | | | | |
| Institutional Fund | | Class Y | | |
| |
| | Six months | | From 2/28/2017 | |
| | | ended | | (commencement of operations) to | |
| | 4/30/2018 | (i) | 10/31/2017 | (ii) |
| Net asset value, beginning of period | $ | 34.05 | | $ | 28.85 | |
| INCOME FROM INVESTMENT | | | | | | |
| OPERATIONS: | | | | | | |
| Net investment income(iii) | | 0.05 | | | 0.02 | |
| Net realized and unrealized gain on | | | | | | |
| investments | | 2.07 | | | 5.18 | |
| Total from investment operations | | 2.12 | | | 5.20 | |
| Distributions from net realized gains | | (2.19 | ) | | – | |
| Net asset value, end of period | $ | 33.98 | | $ | 34.05 | |
| Total return | | 6.49 | % | | 18.02 | % |
| RATIOS/SUPPLEMENTAL DATA: | | | | | | |
| Net assets, end of period (000's | | | | | | |
| omitted) | $ | 125,799 | | $ | 97,889 | |
| Ratio of gross expenses to average | | | | | | |
| net assets | | 0.82 | % | | 0.85 | % |
| Ratio of expense reimbursements to | | | | | | |
| average net assets | | (0.08 | )% | | (0.10 | )% |
| Ratio of net expenses to average net | | | | | | |
| assets | | 0.74 | % | | 0.75 | % |
| Ratio of net investment income to | | | | | | |
| average net assets | | 0.30 | % | | 0.10 | % |
| Portfolio turnover rate | | 29.04 | % | | 66.72 | % |
| See Notes to Financial Statements. | | | | |
(i) Ratios have been annualized; total return and portfolio turnover rate have not been annualized.
(ii) Ratios have been annualized; total return has not been annualized; portfolio turnover is for the twelve months then ended.
(iii) Amount was computed based on average shares outstanding during the period.
- 49 -
THE ALGER INSTITUTIONAL FUNDS
Financial Highlights for a share outstanding throughout the period (Unaudited)
| | | | | | | | | |
| Alger Capital Appreciation | | | | | | | | | |
| Institutional Fund | | | | | Class Z-2 | | | | |
| | | | | | | | From 10/14/2016 | |
| | Six months | | | Year ended | | | (commencement of | |
| | | ended 4/30/2018 (i) | | | 10/31/2017 | | | operations) to 10/31/2016(ii) | |
| Net asset value, beginning of period | $ | 34.08 | | $ | 26.44 | | $ | 26.67 | |
| INCOME FROM INVESTMENT | | | | | | | | | |
| OPERATIONS: | | | | | | | | | |
| Net investment income(iii) | | 0.04 | | | 0.07 | | | 0.01 | |
| Net realized and unrealized gain (loss) | | | | | | | | | |
| on investments | | 2.07 | | | 7.76 | | | (0.24 | ) |
| Total from investment operations | | 2.11 | | | 7.83 | | | (0.23 | ) |
| Distributions from net realized gains | | (2.19 | ) | | (0.19 | ) | | – | |
| Net asset value, end of period | $ | 34.00 | | $ | 34.08 | | $ | 26.44 | |
| Total return | | 6.45 | % | | 29.83 | % | | (0.86 | )% |
| RATIOS/SUPPLEMENTAL DATA: | | | | | | | | | |
| Net assets, end of period (000's | | | | | | | | | |
| omitted) | $ | 455,300 | | $ | 436,145 | | $ | 2,212 | |
| Ratio of gross expenses to average | | | | | | | | | |
| net assets | | 0.82 | % | | 0.84 | % | | 3.11 | % |
| Ratio of expense reimbursements to | | | | | | | | | |
| average net assets | | – | | | – | | | (2.16 | )% |
| Ratio of net expenses to average net | | | | | | | | | |
| assets | | 0.82 | % | | 0.84 | % | | 0.95 | % |
| Ratio of net investment income to | | | | | | | | | |
| average net assets | | 0.23 | % | | 0.22 | % | | 1.29 | % |
| Portfolio turnover rate | | 29.04 | % | | 66.72 | % | | 94.56 | % |
| See Notes to Financial Statements. | | | | | | | |
(i) Ratios have been annualized; total return and portfolio turnover rate have not been annualized.
(ii) Ratios have been annualized; total return has not been annualized; portfolio turnover is for the twelve months then ended.
(iii) Amount was computed based on average shares outstanding during the period.
- 50 -
THE ALGER INSTITUTIONAL FUNDS
Financial Highlights for a share outstanding throughout the period (Unaudited)
| | | | | | | | | | | | | | | | | | |
| Alger Capital Appreciation Focus | | | | | | | | | | | | | | | | | | |
| Fund | | | | | | | | Class A | | | | | | | | |
| | | | | | | | | | | | | | | | | From 12/31/2012 | |
| | | Six months ended 4/30/2018(i) | | | Year ended 10/31/2017 | | | Year ended 10/31/2016 | | | Year ended 10/31/2015 | | | Year ended 10/31/2014 | | | (commencement of operations) to 10/31/2013(ii) | |
| Net asset value, beginning of period | $ | 31.74 | | $ | 23.95 | | $ | 24.13 | | $ | 22.01 | | $ | 18.69 | | $ | 14.70 | |
| INCOME FROM INVESTMENT | | | | | | | | | | | | | | | | | | |
| OPERATIONS: | | | | | | | | | | | | | | | | | | |
| Net investment income (loss)(iii) | | (0.02 | ) | | 0.01 | | | (0.03 | ) | | (0.02 | ) | | (0.04 | ) | | (0.01 | ) |
| Net realized and unrealized gain on | | | | | | | | | | | | | | | | | | |
| investments | | 2.72 | | | 7.78 | | | 0.12 | | | 2.14 | | | 3.36 | | | 4.00 | |
| Total from investment operations | | 2.70 | | | 7.79 | | | 0.09 | | | 2.12 | | | 3.32 | | | 3.99 | |
| Distributions from net realized gains | | (1.23 | ) | | – | | | (0.27 | ) | | – | | | – | | | – | |
| Net asset value, end of period | $ | 33.21 | | $ | 31.74 | | $ | 23.95 | | $ | 24.13 | | $ | 22.01 | | $ | 18.69 | |
| Total return(iv) | | 8.74 | % | | 32.53 | % | | 0.36 | % | | 9.63 | % | | 17.76 | % | | 27.14 | % |
| RATIOS/SUPPLEMENTAL DATA: | | | | | | | | | | | | | | | | | | |
| Net assets, end of period (000's | | | | | | | | | | | | | | | | | | |
| omitted) | $ | 28,138 | | $ | 23,693 | | $ | 25,524 | | $ | 23,961 | | $ | 5,158 | | $ | 3,496 | |
| Ratio of gross expenses to average | | | | | | | | | | | | | | | | | | |
| net assets | | 1.06 | % | | 1.11 | % | | 1.26 | % | | 1.48 | % | | 2.38 | % | | 2.49 | % |
| Ratio of expense reimbursements to | | | | | | | | | | | | | | | | | | |
| average net assets | | – | | | – | | | (0.07 | )% | | (0.18 | )% | | (1.08 | )% | | (1.19 | )% |
| Ratio of net expenses to average net | | | | | | | | | | | | | | | | | | |
| assets | | 1.06 | % | | 1.11 | % | | 1.19 | % | | 1.30 | % | | 1.30 | % | | 1.30 | % |
| Ratio of net investment income (loss) to | | | | | | | | | | | | | | | | | | |
| average net assets | | (0.14 | )% | | 0.03 | % | | (0.13 | )% | | (0.08 | )% | | (0.19 | )% | | (0.09 | )% |
| Portfolio turnover rate | | 70.15 | % | | 98.57 | % | | 127.40 | % | | 182.58 | % | | 153.69 | % | | 166.61 | % |
| See Notes to Financial Statements. | | | | | | | | | | | | | | | | |
(i) Ratios have been annualized; total return and portfolio turnover rate have not been annualized.
(ii) Ratios have been annualized; total return has not been annualized; portfolio turnover is for the twelve months then ended.
(iii) Amount was computed based on average shares outstanding during the period.
(iv) Does not reflect the effect of sales charges, if applicable.
- 51 -
THE ALGER INSTITUTIONAL FUNDS
Financial Highlights for a share outstanding throughout the period (Unaudited)
| | | | | | | | | | | | | | | | | | |
| Alger Capital Appreciation Focus | | | | | | | | | | | | | | | | | | |
| Fund | | | | | | | | Class C | | | | | | | | |
| | | | | | | | | | | | | | | | | From 12/31/2012 | |
| | | Six months ended 4/30/2018(i) | | | Year ended 10/31/2017 | | | Year ended 10/31/2016 | | | Year ended 10/31/2015 | | | Year ended 10/31/2014 | | | (commencement of operations) to 10/31/2013(ii) | |
| Net asset value, beginning of period | $ | 30.59 | | $ | 23.27 | | $ | 23.62 | | $ | 21.71 | | $ | 18.58 | | $ | 14.70 | |
| INCOME FROM INVESTMENT | | | | | | | | | | | | | | | | | | |
| OPERATIONS: | | | | | | | | | | | | | | | | | | |
| Net investment loss(iii) | | (0.14 | ) | | (0.21 | ) | | (0.20 | ) | | (0.20 | ) | | (0.19 | ) | | (0.11 | ) |
| Net realized and unrealized gain on | | | | | | | | | | | | | | | | | | |
| investments | | 2.63 | | | 7.53 | | | 0.12 | | | 2.11 | | | 3.32 | | | 3.99 | |
| Total from investment operations | | 2.49 | | | 7.32 | | | (0.08 | ) | | 1.91 | | | 3.13 | | | 3.88 | |
| Distributions from net realized gains | | (1.23 | ) | | – | | | (0.27 | ) | | – | | | – | | | – | |
| Net asset value, end of period | $ | 31.85 | | $ | 30.59 | | $ | 23.27 | | $ | 23.62 | | $ | 21.71 | | $ | 18.58 | |
| Total return(iv) | | 8.37 | % | | 31.46 | % | | (0.36 | )% | | 8.80 | % | | 16.85 | % | | 26.39 | % |
| RATIOS/SUPPLEMENTAL DATA: | | | | | | | | | | | | | | | | | | |
| Net assets, end of period (000's | | | | | | | | | | | | | | | | | | |
| omitted) | $ | 22,127 | | $ | 18,660 | | $ | 12,021 | | $ | 6,542 | | $ | 2,635 | | $ | 1,913 | |
| Ratio of gross expenses to average | | | | | | | | | | | | | | | | | | |
| net assets | | 1.83 | % | | 1.90 | % | | 2.03 | % | | 2.25 | % | | 3.14 | % | | 3.27 | % |
| Ratio of expense reimbursements to | | | | | | | | | | | | | | | | | | |
| average net assets | | – | | | – | | | (0.10 | )% | | (0.20 | )% | | (1.09 | )% | | (1.22 | )% |
| Ratio of net expenses to average net | | | | | | | | | | | | | | | | | | |
| assets | | 1.83 | % | | 1.90 | % | | 1.93 | % | | 2.05 | % | | 2.05 | % | | 2.05 | % |
| Ratio of net investment loss to average | | | | | | | | | | | | | | | | | | |
| net assets | | (0.91 | )% | | (0.79 | )% | | (0.87 | )% | | (0.85 | )% | | (0.94 | )% | | (0.83 | )% |
| Portfolio turnover rate | | 70.15 | % | | 98.57 | % | | 127.40 | % | | 182.58 | % | | 153.69 | % | | 166.61 | % |
| See Notes to Financial Statements. | | | | | | | | | | | | | | | | |
(i) Ratios have been annualized; total return and portfolio turnover rate have not been annualized.
(ii) Ratios have been annualized; total return has not been annualized; portfolio turnover is for the twelve months then ended.
(iii) Amount was computed based on average shares outstanding during the period.
(iv) Does not reflect the effect of sales charges, if applicable.
- 52 -
THE ALGER INSTITUTIONAL FUNDS
Financial Highlights for a share outstanding throughout the period (Unaudited)
| | | | | | | | | | | | | | | | | | |
| Alger Capital Appreciation Focus | | | | | | | | | | | | | | | | | | |
| Fund | | | | | | | | Class I | | | | | | | | |
| | Six months | | | | | | | | | | | | | | | | |
| | | ended | | Year ended | | Year ended | | Year ended | | Year ended | | Year ended | |
| | 4/30/2018 | (i) | 10/31/2017 | | 10/31/2016 | | 10/31/2015 | | 10/31/2014 | | 10/31/2013 | |
| Net asset value, beginning of period | $ | 31.88 | | $ | 24.06 | | $ | 24.23 | | $ | 22.07 | | $ | 18.72 | | $ | 14.53 | |
| INCOME FROM INVESTMENT | | | | | | | | | | | | | | | | | | |
| OPERATIONS: | | | | | | | | | | | | | | | | | | |
| Net investment income (loss)(ii) | | (0.02 | ) | | 0.01 | | | (0.02 | ) | | 0.01 | | | (0.01 | ) | | 0.15 | |
| Net realized and unrealized gain on | | | | | | | | | | | | | | | | | | |
| investments | | 2.75 | | | 7.81 | | | 0.12 | | | 2.15 | | | 3.36 | | | 4.04 | |
| Total from investment operations | | 2.73 | | | 7.82 | | | 0.10 | | | 2.16 | | | 3.35 | | | 4.19 | |
| Distributions from net realized gains | | (1.23 | ) | | – | | | (0.27 | ) | | – | | | – | | | – | |
| Net asset value, end of period | $ | 33.38 | | $ | 31.88 | | $ | 24.06 | | $ | 24.23 | | $ | 22.07 | | $ | 18.72 | |
| Total return(iii) | | 8.80 | % | | 32.50 | % | | 0.40 | % | | 9.79 | % | | 17.90 | % | | 28.84 | % |
| RATIOS/SUPPLEMENTAL DATA: | | | | | | | | | | | | | | | | | | |
| Net assets, end of period (000's | | | | | | | | | | | | | | | | | | |
| omitted) | $ | 27,677 | | $ | 23,952 | | $ | 22,527 | | $ | 24,487 | | $ | 12,897 | | $ | 8,684 | |
| Ratio of gross expenses to average | | | | | | | | | | | | | | | | | | |
| net assets | | 1.04 | % | | 1.12 | % | | 1.30 | % | | 1.49 | % | | 2.36 | % | | 2.32 | % |
| Ratio of expense reimbursements to | | | | | | | | | | | | | | | | | | |
| average net assets | | (0.03 | )% | | – | | | (0.15 | )% | | (0.34 | )% | | (1.21 | )% | | (0.94 | )% |
| Ratio of net expenses to average net | | | | | | | | | | | | | | | | | | |
| assets | | 1.01 | % | | 1.12 | % | | 1.15 | % | | 1.15 | % | | 1.15 | % | | 1.38 | % |
| Ratio of net investment income (loss) to | | | | | | | | | | | | | | | | | | |
| average net assets | | (0.09 | )% | | 0.02 | % | | (0.09 | )% | | 0.03 | % | | (0.04 | )% | | 0.95 | % |
| Portfolio turnover rate | | 70.15 | % | | 98.57 | % | | 127.40 | % | | 182.58 | % | | 153.69 | % | | 166.61 | % |
| See Notes to Financial Statements. | | | | | | | | | | | | | | | | |
(i) Ratios have been annualized; total return and portfolio turnover rate have not been annualized.
(ii) Amount was computed based on average shares outstanding during the period.
(iii) Does not reflect the effect of sales charges, if applicable.
- 53 -
THE ALGER INSTITUTIONAL FUNDS
Financial Highlights for a share outstanding throughout the period (Unaudited)
| | | | | | |
| Alger Capital Appreciation Focus | | | | | | |
| Fund | | Class Y | | |
| |
| | Six months | | From 2/28/2017 | |
| | | ended | | (commencement of operations) to | |
| | 4/30/2018 | (i) | 10/31/2017 | (ii) |
| Net asset value, beginning of period | $ | 32.33 | | $ | 26.86 | |
| INCOME FROM INVESTMENT | | | | | | |
| OPERATIONS: | | | | | | |
| Net investment income (loss)(iii) | | 0.04 | | | (0.01 | ) |
| Net realized and unrealized gain on | | | | | | |
| investments | | 2.79 | | | 5.48 | |
| Total from investment operations | | 2.83 | | | 5.47 | |
| Distributions from net realized gains | | (1.23 | ) | | – | |
| Net asset value, end of period | $ | 33.93 | | $ | 32.33 | |
| Total return(iv) | | 8.99 | % | | 20.36 | % |
| RATIOS/SUPPLEMENTAL DATA: | | | | | | |
| Net assets, end of period (000's | | | | | | |
| omitted) | $ | 5,326 | | $ | 4,319 | |
| Ratio of gross expenses to average | | | | | | |
| net assets | | 0.74 | % | | 1.51 | % |
| Ratio of expense reimbursements to | | | | | | |
| average net assets | | (0.09 | )% | | (0.86 | )% |
| Ratio of net expenses to average net | | | | | | |
| assets | | 0.65 | % | | 0.65 | % |
| Ratio of net investment income (loss) to | | | | | | |
| average net assets | | 0.27 | % | | (0.05 | )% |
| Portfolio turnover rate | | 70.15 | % | | 98.57 | % |
| See Notes to Financial Statements. | | | | |
(i) Ratios have been annualized; total return and portfolio turnover rate have not been annualized.
(ii) Ratios have been annualized; total return has not been annualized; portfolio turnover is for the twelve months then ended.
(iii) Amount was computed based on average shares outstanding during the period.
(iv) Does not reflect the effect of sales charges, if applicable.
- 54 -
THE ALGER INSTITUTIONAL FUNDS
Financial Highlights for a share outstanding throughout the period (Unaudited)
| | | | | | | | | | | | | | | | | | |
| Alger Capital Appreciation Focus | | | | | | | | | | | | | | | | | | |
| Fund | | | | | | | | Class Z | | | | | | | | |
| | | | | | | | | | | | | | | | | From 12/31/2012 | |
| | | Six months ended 4/30/2018(i) | | | Year ended 10/31/2017 | | | Year ended 10/31/2016 | | | Year ended 10/31/2015 | | | Year ended 10/31/2014 | | | (commencement of operations) to 10/31/2013(ii) | |
| Net asset value, beginning of period | $ | 32.28 | | $ | 24.30 | | $ | 24.41 | | $ | 22.17 | | $ | 18.75 | | $ | 14.70 | |
| INCOME FROM INVESTMENT | | | | | | | | | | | | | | | | | | |
| OPERATIONS: | | | | | | | | | | | | | | | | | | |
| Net investment income(iii) | | 0.03 | | | 0.07 | | | 0.03 | | | 0.07 | | | 0.05 | | | 0.04 | |
| Net realized and unrealized gain on | | | | | | | | | | | | | | | | | | |
| investments | | 2.79 | | | 7.91 | | | 0.13 | | | 2.17 | | | 3.37 | | | 4.01 | |
| Total from investment operations | | 2.82 | | | 7.98 | | | 0.16 | | | 2.24 | | | 3.42 | | | 4.05 | |
| Distributions from net realized gains | | (1.23 | ) | | – | | | (0.27 | ) | | – | | | – | | | – | |
| Net asset value, end of period | $ | 33.87 | | $ | 32.28 | | $ | 24.30 | | $ | 24.41 | | $ | 22.17 | | $ | 18.75 | |
| Total return(iv) | | 8.97 | % | | 32.84 | % | | 0.64 | % | | 10.10 | % | | 18.24 | % | | 27.55 | % |
| RATIOS/SUPPLEMENTAL DATA: | | | | | | | | | | | | | | | | | | |
| Net assets, end of period (000's | | | | | | | | | | | | | | | | | | |
| omitted) | $ | 85,720 | | $ | 61,721 | | $ | 15,693 | | $ | 3,683 | | $ | 1,262 | | $ | 128 | |
| Ratio of gross expenses to average | | | | | | | | | | | | | | | | | | |
| net assets | | 0.75 | % | | 0.84 | % | | 1.05 | % | | 1.50 | % | | 4.78 | % | | 10.11 | % |
| Ratio of expense reimbursements to | | | | | | | | | | | | | | | | | | |
| average net assets | | (0.04 | )% | | – | | | (0.12 | )% | | (0.61 | )% | | (3.89 | )% | | (9.22 | )% |
| Ratio of net expenses to average net | | | | | | | | | | | | | | | | | | |
| assets | | 0.71 | % | | 0.84 | % | | 0.93 | % | | 0.89 | % | | 0.89 | % | | 0.89 | % |
| Ratio of net investment income to | | | | | | | | | | | | | | | | | | |
| average net assets | | 0.20 | % | | 0.25 | % | | 0.12 | % | | 0.30 | % | | 0.23 | % | | 0.32 | % |
| Portfolio turnover rate | | 70.15 | % | | 98.57 | % | | 127.40 | % | | 182.58 | % | | 153.69 | % | | 166.61 | % |
| See Notes to Financial Statements. | | | | | | | | | | | | | | | | |
(i) Ratios have been annualized; total return and portfolio turnover rate have not been annualized.
(ii) Ratios have been annualized; total return has not been annualized; portfolio turnover is for the twelve months then ended.
(iii) Amount was computed based on average shares outstanding during the period.
(iv) Does not reflect the effect of sales charges, if applicable.
- 55 -
THE ALGER INSTITUTIONAL FUNDS
Financial Highlights for a share outstanding throughout the period (Unaudited)
| | | | | | | | | | | | | | | | | | |
| Alger Mid Cap Growth Institutional | | | | | | | | | | | | | | | | | | |
| Fund | | | | | | | | Class I | | | | | | | | |
| | Six months | | | | | | | | | | | | | | | | |
| | | ended | | Year ended | | Year ended | | Year ended | | Year ended | | Year ended | |
| | 4/30/2018 | (i) | 10/31/2017 | | 10/31/2016 | | 10/31/2015 | | 10/31/2014 | | 10/31/2013 | |
| Net asset value, beginning of period | $ | 28.65 | | $ | 21.59 | | $ | 22.54 | | $ | 22.18 | | $ | 19.43 | | $ | 14.59 | |
| INCOME FROM INVESTMENT | | | | | | | | | | | | | | | | | | |
| OPERATIONS: | | | | | | | | | | | | | | | | | | |
| Net investment loss(ii) | | (0.09 | ) | | (0.13 | ) | | (0.05 | ) | | (0.13 | ) | | (0.07 | ) | | (0.03 | ) |
| Net realized and unrealized gain (loss) | | | | | | | | | | | | | | | | | | |
| on investments | | 1.08 | | | 7.19 | | | (0.90 | ) | | 0.49 | | | 2.82 | | | 4.91 | |
| Total from investment operations | | 0.99 | | | 7.06 | | | (0.95 | ) | | 0.36 | | | 2.75 | | | 4.88 | |
| Dividends from net investment income | – | | | – | | | – | | | – | | | – | | | (0.04 | ) |
| Net asset value, end of period | $ | 29.64 | | $ | 28.65 | | $ | 21.59 | | $ | 22.54 | | $ | 22.18 | | $ | 19.43 | |
| Total return | | 3.46 | % | | 32.70 | % | | (4.21 | )% | | 1.62 | % | | 14.15 | % | | 33.41 | % |
| RATIOS/SUPPLEMENTAL DATA: | | | | | | | | | | | | | | | | | | |
| Net assets, end of period (000's | | | | | | | | | | | | | | | | | | |
| omitted) | $ | 83,014 | | $ | 85,890 | | $ | 81,782 | | $ | 114,984 | | $ | 132,426 | | $ | 157,391 | |
| Ratio of gross expenses to average | | | | | | | | | | | | | | | | | | |
| net assets | | 1.32 | % | | 1.28 | % | | 1.25 | % | | 1.20 | % | | 1.30 | % | | 1.29 | % |
| Ratio of net expenses to average net | | | | | | | | | | | | | | | | | | |
| assets | | 1.32 | % | | 1.28 | % | | 1.25 | % | | 1.20 | % | | 1.30 | % | | 1.29 | % |
| Ratio of net investment loss to average | | | | | | | | | | | | | | | | | | |
| net assets | | (0.64 | )% | | (0.50 | )% | | (0.24 | )% | | (0.55 | )% | | (0.32 | )% | | (0.19 | )% |
| Portfolio turnover rate | | 46.27 | % | | 157.49 | % | | 95.75 | % | | 120.97 | % | | 192.15 | % | | 153.89 | % |
| See Notes to Financial Statements. | | | | | | | | | | | | | | | | |
(i) Ratios have been annualized; total return and portfolio turnover rate have not been annualized.
(ii) Amount was computed based on average shares outstanding during the period.
- 56 -
THE ALGER INSTITUTIONAL FUNDS
Financial Highlights for a share outstanding throughout the period (Unaudited)
| | | | | | | | | | | | | | | | | | |
| Alger Mid Cap Growth Institutional | | | | | | | | | | | | | | | | | | |
| Fund | | | | | | | | Class R | | | | | | | | |
| | Six months | | | | | | | | | | | | | | | | |
| | | ended | | Year ended | | Year ended | | Year ended | | Year ended | | Year ended | |
| | 4/30/2018 | (i) | 10/31/2017 | | 10/31/2016 | | 10/31/2015 | | 10/31/2014 | | 10/31/2013 | |
| Net asset value, beginning of period | $ | 26.35 | | $ | 19.96 | | $ | 20.96 | | $ | 20.74 | | $ | 18.26 | | $ | 13.81 | |
| INCOME FROM INVESTMENT | | | | | | | | | | | | | | | | | | |
| OPERATIONS: | | | | | | | | | | | | | | | | | | |
| Net investment loss(ii) | | (0.16 | ) | | (0.24 | ) | | (0.16 | ) | | (0.23 | ) | | (0.16 | ) | | (0.11 | ) |
| Net realized and unrealized gain (loss) | | | | | | | | | | | | | | | | | | |
| on investments | | 1.00 | | | 6.63 | | | (0.84 | ) | | 0.45 | | | 2.64 | | | 4.63 | |
| Total from investment operations | | 0.84 | | | 6.39 | | | (1.00 | ) | | 0.22 | | | 2.48 | | | 4.52 | |
| Dividends from net investment income | – | | | – | | | – | | | – | | | – | | | (0.07 | ) |
| Net asset value, end of period | $ | 27.19 | | $ | 26.35 | | $ | 19.96 | | $ | 20.96 | | $ | 20.74 | | $ | 18.26 | |
| Total return | | 3.19 | % | | 32.01 | % | | (4.82 | )% | | 1.11 | % | | 13.58 | % | | 32.83 | % |
| RATIOS/SUPPLEMENTAL DATA: | | | | | | | | | | | | | | | | | | |
| Net assets, end of period (000's | | | | | | | | | | | | | | | | | | |
| omitted) | $ | 11,751 | | $ | 12,943 | | $ | 13,093 | | $ | 17,795 | | $ | 21,953 | | $ | 23,599 | |
| Ratio of gross expenses to average | | | | | | | | | | | | | | | | | | |
| net assets | | 1.83 | % | | 1.81 | % | | 1.82 | % | | 1.74 | % | | 1.80 | % | | 1.79 | % |
| Ratio of net expenses to average net | | | | | | | | | | | | | | | | | | |
| assets | | 1.83 | % | | 1.81 | % | | 1.82 | % | | 1.74 | % | | 1.80 | % | | 1.79 | % |
| Ratio of net investment loss to average | | | | | | | | | | | | | | | | | | |
| net assets | | (1.15 | )% | | (1.04 | )% | | (0.81 | )% | | (1.08 | )% | | (0.82 | )% | | (0.69 | )% |
| Portfolio turnover rate | | 46.27 | % | | 157.49 | % | | 95.75 | % | | 120.97 | % | | 192.15 | % | | 153.89 | % |
| See Notes to Financial Statements. | | | | | | | | | | | | | | | | |
(i) Ratios have been annualized; total return and portfolio turnover rate have not been annualized.
(ii) Amount was computed based on average shares outstanding during the period.
- 57 -
THE ALGER INSTITUTIONAL FUNDS
Financial Highlights for a share outstanding throughout the period (Unaudited)
| | | | | | | | | |
| Alger Mid Cap Growth Institutional | | | | | | | | | |
| Fund | | | | | Class Z-2 | | | | |
| | | | | | | | From 10/14/2016 | |
| | | Six months ended 4/30/2018(i) | | | Year ended 10/31/2017 | | | (commencement of operations) to 10/31/2016(ii) | |
| Net asset value, beginning of period | $ | 28.72 | | $ | 21.59 | | $ | 21.95 | |
| INCOME FROM INVESTMENT | | | | | | | | | |
| OPERATIONS: | | | | | | | | | |
| Net investment income (loss)(iii) | | (0.06 | ) | | (0.08 | ) | | 0.04 | |
| Net realized and unrealized gain (loss) | | | | | | | | | |
| on investments | | 1.10 | | | 7.21 | | | (0.40 | ) |
| Total from investment operations | | 1.04 | | | 7.13 | | | (0.36 | ) |
| Net asset value, end of period | $ | 29.76 | | $ | 28.72 | | $ | 21.59 | |
| Total return | | 3.62 | % | | 33.02 | % | | (1.64 | )% |
| RATIOS/SUPPLEMENTAL DATA: | | | | | | | | | |
| Net assets, end of period (000's | | | | | | | | | |
| omitted) | $ | 10,747 | | $ | 8,810 | | $ | 113 | |
| Ratio of gross expenses to average | | | | | | | | | |
| net assets | | 1.07 | % | | 1.14 | % | | 32.21 | % |
| Ratio of expense reimbursements to | | | | | | | | | |
| average net assets | | (0.02 | )% | | (0.09 | )% | | (31.16 | )% |
| Ratio of net expenses to average net | | | | | | | | | |
| assets | | 1.05 | % | | 1.05 | % | | 1.05 | % |
| Ratio of net investment income (loss) to | | | | | | | | | |
| average net assets | | (0.39 | )% | | (0.31 | )% | | 4.35 | % |
| Portfolio turnover rate | | 46.27 | % | | 157.49 | % | | 95.75 | % |
| See Notes to Financial Statements. | | | | | | | |
(i) Ratios have been annualized; total return and portfolio turnover rate have not been annualized.
(ii) Ratios have been annualized; total return has not been annualized; portfolio turnover is for the twelve months then ended.
(iii) Amount was computed based on average shares outstanding during the period.
- 58 -
THE ALGER INSTITUTIONAL FUNDS
Financial Highlights for a share outstanding throughout the period (Unaudited)
| | | | | | | | | | | | | | | | | | |
| Alger Small Cap Growth | | | | | | | | | | | | | | | | | | |
| Institutional Fund | | | | | | | | Class I | | | | | | | | |
| | Six months | | | | | | | | | | | | | | | | |
| | | ended | | Year ended | | Year ended | | Year ended | | Year ended | | Year ended | |
| | 4/30/2018 | (i) | 10/31/2017 | | 10/31/2016 | | 10/31/2015 | | 10/31/2014 | | 10/31/2013 | |
| Net asset value, beginning of period | $ | 20.52 | | $ | 14.83 | | $ | 23.10 | | $ | 28.14 | | $ | 33.48 | | $ | 28.16 | |
| INCOME FROM INVESTMENT | | | | | | | | | | | | | | | | | | |
| OPERATIONS: | | | | | | | | | | | | | | | | | | |
| Net investment loss(ii) | | (0.09 | ) | | (0.14 | ) | | (0.10 | ) | | (0.20 | ) | | (0.20 | ) | | (0.11 | ) |
| Net realized and unrealized gain (loss) | | | | | | | | | | | | | | | | | | |
| on investments | | 1.40 | | | 5.83 | | | (0.54 | ) | | 0.42 | | | 0.60 | | | 8.66 | |
| Total from investment operations | | 1.31 | | | 5.69 | | | (0.64 | ) | | 0.22 | | | 0.40 | | | 8.55 | |
| Distributions from net realized gains | | (0.58 | ) | | – | | | (7.63 | ) | | (5.26 | ) | | (5.74 | ) | | (3.23 | ) |
| Net asset value, end of period | $ | 21.25 | | $ | 20.52 | | $ | 14.83 | | $ | 23.10 | | $ | 28.14 | | $ | 33.48 | |
| Total return | | 6.54 | % | | 38.37 | % | | (3.76 | )% | | 0.53 | % | | 1.21 | % | | 33.71 | % |
| RATIOS/SUPPLEMENTAL DATA: | | | | | | | | | | | | | | | | | | |
| Net assets, end of period (000's | | | | | | | | | | | | | | | | | | |
| omitted) | $ | 130,434 | | $ | 130,527 | | $ | 129,188 | | $ | 357,189 | | $ | 659,692 | | $ | 936,554 | |
| Ratio of gross expenses to average | | | | | | | | | | | | | | | | | | |
| net assets | | 1.33 | % | | 1.32 | % | | 1.28 | % | | 1.25 | % | | 1.24 | % | | 1.25 | % |
| Ratio of net expenses to average net | | | | | | | | | | | | | | | | | | |
| assets | | 1.33 | % | | 1.32 | % | | 1.28 | % | | 1.25 | % | | 1.24 | % | | 1.25 | % |
| Ratio of net investment loss to average | | | | | | | | | | | | | | | | | | |
| net assets | | (0.86 | )% | | (0.77 | )% | | (0.67 | )% | | (0.80 | )% | | (0.70 | )% | | (0.38 | )% |
| Portfolio turnover rate | | 10.78 | % | | 29.70 | % | | 55.08 | % | | 125.72 | % | | 84.10 | % | | 77.38 | % |
| See Notes to Financial Statements. | | | | | | | | | | | | | | | | |
(i) Ratios have been annualized; total return and portfolio turnover rate have not been annualized.
(ii) Amount was computed based on average shares outstanding during the period.
- 59 -
THE ALGER INSTITUTIONAL FUNDS
Financial Highlights for a share outstanding throughout the period (Unaudited)
| | | | | | | | | | | | | | | | | | |
| Alger Small Cap Growth | | | | | | | | | | | | | | | | | | |
| Institutional Fund | | | | | | | | Class R | | | | | | | | |
| | Six months | | | | | | | | | | | | | | | | |
| | | ended | | Year ended | | Year ended | | Year ended | | Year ended | | Year ended | |
| | 4/30/2018 | (i) | 10/31/2017 | | 10/31/2016 | | 10/31/2015 | | 10/31/2014 | | 10/31/2013 | |
| Net asset value, beginning of period | $ | 17.44 | | $ | 12.67 | | $ | 20.92 | | $ | 26.08 | | $ | 31.58 | | $ | 26.85 | |
| INCOME FROM INVESTMENT | | | | | | | | | | | | | | | | | | |
| OPERATIONS: | | | | | | | | | | | | | | | | | | |
| Net investment loss(ii) | | (0.11 | ) | | (0.19 | ) | | (0.16 | ) | | (0.29 | ) | | (0.32 | ) | | (0.23 | ) |
| Net realized and unrealized gain (loss) | | | | | | | | | | | | | | | | | | |
| on investments | | 1.17 | | | 4.96 | | | (0.46 | ) | | 0.39 | | | 0.56 | | | 8.19 | |
| Total from investment operations | | 1.06 | | | 4.77 | | | (0.62 | ) | | 0.10 | | | 0.24 | | | 7.96 | |
| Distributions from net realized gains | | (0.58 | ) | | – | | | (7.63 | ) | | (5.26 | ) | | (5.74 | ) | | (3.23 | ) |
| Net asset value, end of period | $ | 17.92 | | $ | 17.44 | | $ | 12.67 | | $ | 20.92 | | $ | 26.08 | | $ | 31.58 | |
| Total return | | 6.25 | % | | 37.65 | % | | (4.22 | )% | | 0.02 | % | | 0.74 | % | | 33.05 | % |
| RATIOS/SUPPLEMENTAL DATA: | | | | | | | | | | | | | | | | | | |
| Net assets, end of period (000's | | | | | | | | | | | | | | | | | | |
| omitted) | $ | 9,556 | | $ | 11,253 | | $ | 12,675 | | $ | 18,577 | | $ | 31,062 | | $ | 41,022 | |
| Ratio of gross expenses to average | | | | | | | | | | | | | | | | | | |
| net assets | | 1.78 | % | | 1.82 | % | | 1.80 | % | | 1.74 | % | | 1.72 | % | | 1.73 | % |
| Ratio of net expenses to average net | | | | | | | | | | | | | | | | | | |
| assets | | 1.78 | % | | 1.82 | % | | 1.80 | % | | 1.74 | % | | 1.72 | % | | 1.73 | % |
| Ratio of net investment loss to average | | | | | | | | | | | | | | | | | | |
| net assets | | (1.30 | )% | | (1.27 | )% | | (1.20 | )% | | (1.30 | )% | | (1.18 | )% | | (0.83 | )% |
| Portfolio turnover rate | | 10.78 | % | | 29.70 | % | | 55.08 | % | | 125.72 | % | | 84.10 | % | | 77.38 | % |
| See Notes to Financial Statements. | | | | | | | | | | | | | | | | |
(i) Ratios have been annualized; total return and portfolio turnover rate have not been annualized.
(ii) Amount was computed based on average shares outstanding during the period.
- 60 -
THE ALGER INSTITUTIONAL FUNDS
Financial Highlights for a share outstanding throughout the period (Unaudited)
| | | | | | | | | |
| Alger Small Cap Growth | | | | | | | | | |
| Institutional Fund | | | | | Class Z-2 | | | | |
| | | | | | | | From 8/1/2016 | |
| | | Six months ended 4/30/2018(i) | | | Year ended 10/31/2017 | | | (commencement of operations) to 10/31/2016(ii) | |
| Net asset value, beginning of period | $ | 20.60 | | $ | 14.84 | | $ | 15.35 | |
| INCOME FROM INVESTMENT | | | | | | | | | |
| OPERATIONS: | | | | | | | | | |
| Net investment loss(iii) | | (0.05 | ) | | (0.09 | ) | | (0.03 | ) |
| Net realized and unrealized gain (loss) | | | | | | | | | |
| on investments | | 1.40 | | | 5.85 | | | (0.48 | ) |
| Total from investment operations | | 1.35 | | | 5.76 | | | (0.51 | ) |
| Distributions from net realized gains | | (0.58 | ) | | – | | | – | |
| Net asset value, end of period | $ | 21.37 | | $ | 20.60 | | $ | 14.84 | |
| Total return | | 6.71 | % | | 38.81 | % | | (3.32 | )% |
| RATIOS/SUPPLEMENTAL DATA: | | | | | | | | | |
| Net assets, end of period (000's | | | | | | | | | |
| omitted) | $ | 56,767 | | $ | 67,268 | | $ | 41,787 | |
| Ratio of gross expenses to average | | | | | | | | | |
| net assets | | 1.00 | % | | 1.03 | % | | 1.07 | % |
| Ratio of expense reimbursements to | | | | | | | | | |
| average net assets | | (0.01 | )% | | (0.04 | )% | | (0.08 | )% |
| Ratio of net expenses to average net | | | | | | | | | |
| assets | | 0.99 | % | | 0.99 | % | | 0.99 | % |
| Ratio of net investment loss to average | | | | | | | | | |
| net assets | | (0.53 | )% | | (0.51 | )% | | (0.76 | )% |
| Portfolio turnover rate | | 10.78 | % | | 29.70 | % | | 55.08 | % |
| See Notes to Financial Statements. | | | | | | | |
(i) Ratios have been annualized; total return and portfolio turnover rate have not been annualized.
(ii) Ratios have been annualized; total return has not been annualized; portfolio turnover is for the twelve months then ended.
(iii) Amount was computed based on average shares outstanding during the period.
- 61 -
THE ALGER INSTITUTIONAL FUNDS
NOTES TO FINANCIAL STATEMENTS (Unaudited)
NOTE 1 — General:
The Alger Institutional Funds (the “Trust”) is an open-end registered investment company
organized as a business trust under the laws of the Commonwealth of Massachusetts. The
Trust qualifies as an investment company as defined in Financial Accounting Standards
Board Accounting Standards Codification 946-Financial Services – Investment Companies.
The Trust operates as a series company and currently offers an unlimited number of
shares of beneficial interest in four funds — Alger Capital Appreciation Institutional
Fund, Alger Capital Appreciation Focus Fund, Alger Mid Cap Growth Institutional Fund
and Alger Small Cap Growth Institutional Fund (collectively, the “Funds” or individually,
each a “Fund”). The Funds normally invest primarily in equity securities and each has an
investment objective of long-term capital appreciation.
Each Fund offers one or more of the following share classes: Class A, C, I, R, Y, Z and
Z-2. Class A shares are generally subject to an initial sales charge while Class C shares are
generally subject to a deferred sales charge. Class I, R, Y, Z and Z-2 shares are sold to
institutional investors without an initial or deferred sales charge. Each class has identical
rights to assets and earnings except that each share class bears the pro rata allocation of the
Fund’s expenses other than a class expense (not including advisory or custodial fees or other
expenses related to the management of the Fund’s assets).
NOTE 2 — Significant Accounting Policies:
(a) Investment Valuation: The Funds value their financial instruments (including escrow
receivable) at fair value using independent dealers or pricing services under policies approved
by the Trust’s Board of Trustees (“Board”). Investments are valued on each day the New
York Stock Exchange (the “NYSE”) is open, as of the close of the NYSE (normally 4:00
p.m. Eastern Standard Time).
Equity securities, including traded rights, warrants and option contracts for which valuation
information is readily available are valued at the last quoted sales price or official closing
price as reported by an independent pricing service on the primary market or exchange on
which they are traded. In the absence of quoted sales, such securities are valued at the bid
price or, in the absence of a recent bid price, the equivalent as obtained from one or more
of the major market makers for the securities to be valued.
Debt securities generally trade in the over-the-counter market. Debt securities with
remaining maturities of more than sixty days at the time of acquisition are valued on
the basis of last available bid prices or current market quotations provided by dealers
or pricing services. In determining the value of a particular investment, pricing services
may use certain information with respect to transactions in such investments, quotations
from dealers, pricing matrixes, market transactions in comparable investments, various
relationships observed in the market between investments and calculated yield measures
based on valuation technology commonly employed in the market for such investments.
Asset-backed and mortgage-backed securities are valued by independent pricing services
using models that consider estimated cash flows of each tranche of the security, establish a
benchmark yield and develop an estimated tranche-specific spread to the benchmark yield
- 62 -
THE ALGER INSTITUTIONAL FUNDS
NOTES TO FINANCIAL STATEMENTS (Unaudited) (Continued)
based on the unique attributes of the tranche. Debt securities with a remaining maturity of
sixty days or less are valued at amortized cost which approximates market value.
Securities for which market quotations are not readily available (including escrow receivable)
are valued at fair value, as determined in good faith pursuant to procedures established by
the Board.
Securities in which the Funds invest may be traded in foreign markets that close before the
close of the NYSE. Developments that occur between the close of the foreign markets
and the close of the NYSE may result in adjustments to the foreign closing prices to reflect
what the investment adviser, pursuant to policies established by the Board, believes to be
the fair value of these securities as of the close of the NYSE. The Funds may also fair value
securities in other situations, for example, when a particular foreign market is closed but the
Funds are open.
Financial Accounting Standards Board Accounting Standards Codification 820 – Fair Value
Measurements and Disclosures (“ASC 820”) defines fair value as the price that the Funds
would receive upon selling an investment in a timely transaction to an independent buyer
in the principal or most advantageous market of the investment. ASC 820 established a
three-tier hierarchy to maximize the use of observable market data and minimize the use of
unobservable inputs and to establish classification of fair value measurements for disclosure
purposes. Inputs refer broadly to the assumptions that market participants would use in
pricing the asset or liability and may be observable or unobservable. Observable inputs
are based on market data obtained from sources independent of the Funds. Unobservable
inputs are inputs that reflect the Funds’ own assumptions based on the best information
available in the circumstances. The three-tier hierarchy of inputs is summarized in the three
broad Levels listed below.
• Level 1 – quoted prices in active markets for identical investments
• Level 2 – significant other observable inputs (including quoted prices for similar
investments, interest rates, prepayment speeds, credit risk, etc.)
• Level 3 – significant unobservable inputs (including the Funds’ own assumptions in
determining the fair value of investments)
The Funds’ valuation techniques are generally consistent with either the market or the
income approach to fair value. The market approach considers prices and other relevant
information generated by market transactions involving identical or comparable assets
to measure fair value. The income approach converts future amounts to a current, or
discounted, single amount. These fair value measurements are determined on the basis of
the value indicated by current market expectations about such future events. Inputs for Level
1 include exchange-listed prices and broker quotes in an active market. Inputs for Level 2
include the last trade price in the case of a halted security, an exchange-listed price which
has been adjusted for fair value factors, and prices of closely related securities. Additional
Level 2 inputs include an evaluated price which is based upon a compilation of observable
market information such as spreads for fixed income and preferred securities. Inputs for
Level 3 include, but are not limited to, revenue multiples, earnings before interest, taxes,
- 63 -
THE ALGER INSTITUTIONAL FUNDS
NOTES TO FINANCIAL STATEMENTS (Unaudited) (Continued)
depreciation and amortization (“EBITDA”) multiples, discount rates, and the probabilities
of success of certain outcomes. Such unobservable market information may be obtained
from a company’s financial statements and from industry studies, market data, and market
indicators such as benchmarks and indexes. Because of the inherent uncertainty and often
limited markets for restricted securities, the values may significantly differ from the values
if there was an active market.
Valuation processes are determined by a Valuation Committee (“Committee”) established
by the Board and comprised of representatives of the Trust’s investment adviser. The
Committee reports its fair valuation determinations to the Board which is responsible for
approving valuation policy and procedures.
While the Committee meets on an as-needed basis, the Committee generally meets
quarterly to review and evaluate the effectiveness of the procedures for making fair value
determinations. The Committee considers, among other things, the results of quarterly
back testing of the fair value model for foreign securities, pricing comparisons between
primary and secondary price sources, the outcome of price challenges put to the Funds’
pricing vendor, and variances between transactional prices and previous days price.
The Funds will record a change to a security’s fair value level if new inputs are available
or it becomes evident that inputs previously considered for leveling have changed or are
no longer relevant. Transfers between Levels 1, 2 and 3 are recognized at the end of the
reporting period.
(b) Cash and Cash Equivalents: Cash and cash equivalents include U.S. dollars and overnight
time deposits.
(c) Securities Transactions and Investment Income: Securities transactions are recorded on a
trade date basis. Realized gains and losses from securities transactions are recorded on the
identified cost basis. Dividend income is recognized on the ex-dividend date and interest
income is recognized on the accrual basis.
Premiums and discounts on debt securities purchased are amortized or accreted over the
lives of the respective securities.
(d) Foreign Currency Translations: The books and records of the Funds are maintained in U.S.
dollars. Foreign currencies, investments and other assets and liabilities are translated into
U.S. dollars at the prevailing rates of exchange on the valuation date. Purchases and sales
of investment securities and income and expenses are translated into U.S. dollars at the
prevailing exchange rates on the respective dates of such transactions.
Net realized gains and losses on foreign currency transactions represent net gains and losses
from the disposition of foreign currencies, currency gains and losses realized between the
trade dates and settlement dates of security transactions, and the difference between the
amount of net investment income accrued and the U.S. dollar amount actually received.
The effects of changes in foreign currency exchange rates on investments in securities
are included in realized and unrealized gain or loss on investments in the accompanying
Statements of Operations.
- 64 -
THE ALGER INSTITUTIONAL FUNDS
NOTES TO FINANCIAL STATEMENTS (Unaudited) (Continued)
(e) Lending of Fund Securities: The Funds may lend their securities to financial institutions,
provided that the market value of the securities loaned will not at any time exceed one
third of a Fund’s total assets, as defined in its prospectuses. The Funds earn fees on the
securities loaned, which are included in interest income in the accompanying Statements
of Operations. In order to protect against the risk of failure by the borrower to return the
securities loaned or any delay in the delivery of such securities, the loan is collateralized by
cash or securities that are maintained with the Custodian (“Brown Brothers Harriman &
Company”) in an amount equal to at least 102 percent of the current market value of U.S.
loaned securities or 105 percent for non-U.S. loaned securities. The market value of the
loaned securities is determined at the close of business of the Fund. Any required additional
collateral is delivered to the Custodian and any excess collateral is returned to the borrower
on the next business day. In the event the borrower fails to return the loaned securities when
due, the Funds may take the collateral to replace the securities. If the value of the collateral
is less than the purchase cost of replacement securities, the Custodian shall be responsible
for any shortfall, but only to the extent that the shortfall is not due to any diminution in
collateral value, as defined in the securities lending agreement. The Funds are required to
maintain the collateral in a segregated account and determine its value each day until the
loaned securities are returned. Cash collateral may be invested as determined by the Funds.
Collateral is returned to the borrower upon settlement of the loan. There were no securities
loaned as of April 30, 2018.
(f) Dividends to Shareholders: Dividends and distributions payable to shareholders are recorded
by the Funds on the ex-dividend date. Dividends from net investment income, if available,
and distributions from net realized gains, offset by any loss carryforward, are declared and
paid annually after the end of the fiscal year in which earned.
Each class is treated separately in determining the amounts of dividends from net investment
income payable to holders of its shares.
The characterization of distributions to shareholders for financial reporting purposes is
determined in accordance with federal income tax rules. Therefore, the source of a Fund’s
distributions may be shown in the accompanying financial statements as either from, or in
excess of, net investment income, net realized gain on investment transactions or return of
capital, depending on the type of book/tax differences that may exist. Capital accounts within
the financial statements are adjusted for permanent book/tax differences. Reclassifications
result primarily from the difference in tax treatment of net operating losses, passive foreign
investment companies, and foreign currency transactions. The reclassifications are done
annually at fiscal year end and have no impact on the net asset values of the Funds and are
designed to present each Fund’s capital accounts on a tax basis.
(g) Federal Income Taxes: It is each Fund’s policy to comply with the requirements of the
Internal Revenue Code Subchapter M applicable to regulated investment companies and
to distribute all of its taxable income to its shareholders. Provided that the Funds maintain
such compliance, no federal income tax provision is required. Each Fund is treated as a
separate entity for the purpose of determining such compliance.
- 65 -
THE ALGER INSTITUTIONAL FUNDS
NOTES TO FINANCIAL STATEMENTS (Unaudited) (Continued)
Financial Accounting Standards Board Accounting Standards Codification 740 – Income
Taxes (“ASC 740”) requires the Funds to measure and recognize in their financial statements
the benefit of a tax position taken (or expected to be taken) on an income tax return
if such position will more likely than not be sustained upon examination based on the
technical merits of the position. No tax years are currently under investigation. The Funds
file income tax returns in the U.S., as well as New York State and New York City. The
statute of limitations on the Funds’ tax returns remains open for the tax years 2014-2017.
Management does not believe there are any uncertain tax positions that require recognition
of a tax liability.
(h) Allocation Methods: The Trust accounts separately for the assets, liabilities and operations
of each Fund. Expenses directly attributable to each Fund are charged to that Fund’s
operations; expenses which are applicable to all Funds are allocated among them based on
net assets. Income, realized and unrealized gains and losses, and expenses of each Fund
are allocated among the Fund’s classes based on relative net assets, with the exception of
distribution fees, transfer agency fees, and shareholder servicing and related fees.
(i) Estimates: These financial statements have been prepared in accordance with accounting
principles generally accepted in the United States of America, which require using estimates
and assumptions that affect the reported amounts therein. These unaudited interim financial
statements reflect all adjustments which are, in the opinion of management, necessary to
present a fair statement of results for the interim period. Actual results may differ from
those estimates. All such estimates are of normal recurring nature.
NOTE 3 — Investment Advisory Fees and Other Transactions with Affiliates:
(a) Investment Advisory Fees: Fees incurred by each Fund, pursuant to the provisions of
the Trust’s Investment Advisory Agreement with Fred Alger Management, Inc. (“Alger
Management” or the “Investment Manager”), are payable monthly and computed based on
the following rates. The actual rate paid as a percentage of average daily net assets, for the
six months ended April 30, 2018, is set forth below under the heading “Actual Rate.”
| | | | | | | | | | | | | | | | | | | | |
| | | Tier 1 | | Tier 2 | | | Tier 3 | | | | Tier 4 | | | | Tier 5 | | | Actual Rate | |
| Alger Capital | | | | | | | | | | | | | | | | | | | | |
| Appreciation | | | | | | | | | | | | | | | | | | | | |
| Institutional Fund(a) | 0.810 | % | 0.650 | % | | 0.600 | % | | | 0.550 | % | | | 0.450 | % | | 0.730 | % |
| Alger Capital | | | | | | | | | | | | | | | | | | | | |
| Appreciation Focus | | | | | | | | | | | | | | | | | | | | |
| Fund(c)(d) | | 0.520 | % | — | | | — | | | | — | | | | — | | | 0.530 | % |
| Alger Mid Cap | | | | | | | | | | | | | | | | | | | | |
| Growth Institutional | | | | | | | | | | | | | | | | | | | | |
| Fund(b) | | 0.760 | % | 0.700 | % | | — | | | | — | | | | — | | | 0.760 | % |
| Alger Small Cap | | | | | | | | | | | | | | | | | | | | |
| Growth Institutional | | | | | | | | | | | | | | | | | | | | |
| Fund(b) | | 0.810 | % | 0.750 | % | | — | | | | — | | | | — | | | 0.810 | % |
(a) Tier 1 rate is paid on assets up to $2 billion, Tier 2 rate is paid on assets between $2 billion and $3 billion, Tier 3
rate is paid on assets between $3 billion and $4 billion, Tier 4 rate is paid on assets between $4 billion and $5 billion,
and Tier 5 rate is paid on assets in excess of $5 billion.
- 66 -
THE ALGER INSTITUTIONAL FUNDS
NOTES TO FINANCIAL STATEMENTS (Unaudited) (Continued)
(b) Tier 1 rate is paid on assets up to $1 billion and Tier 2 rate is paid on assets in excess of $1 billion.
(c) Tier 1 rate is paid on all assets.
(d) Prior to January 1, 2018, Alger Capital Appreciation Focus Fund Advisory Fee rate was 0.550%.
Alger Management has established expense caps for several shares classes, effective through
February 28, 2019, whereby it reimburses the share classes if annualized operating expenses
(excluding interest, taxes, brokerage, dividend expenses and extraordinary expenses) exceed
the rates, based on average daily net assets, listed below.
Also, Alger Management has contractually agreed to reimburse Alger Capital Appreciation
Institutional Fund Class Y shares expenses (excluding interest, taxes, brokerage and
extraordinary expenses) through February 28, 2019 to the extent necessary to limit the total
annual fund operating expenses to the actual investment advisory fee plus incurred custody
fee. This expense reimbursement cannot be terminated.
| | | | | | | | | | | |
| | | | | | | | | | FEES WAIVED |
| | | | | | | | | | / REIMBURSED |
| | | | | | | | | | FOR THE SIX |
| | | | | CLASS | | | | | MONTHS ENDED |
| | A | C | I | Y | | Z | Z-2 | | APRIL 30, 2018 |
| Alger Capital Appreciation Institutional Fund | – | – | – | 0.75% | | – | 0.95 | % | | $ | 49,665 |
| Alger Capital Appreciation Focus Fund | 1.15% | 1.90%* | 0.99%** | 0.65% | | 0.68%** | – | | | $ | 23,208 |
| Alger Mid Cap Growth Institutional Fund | – | – | – | – | | – | 1.05 | % | | $ | 1,195 |
| Alger Small Cap Growth Institutional Fund | – | – | – | – | | – | 0.99 | % | | $ | 2,507 |
* Effective August 30, 2018 to February 28, 2019, the expense cap will be 1.95%.
**Prior to January 1, 2018, the expense cap for the Alger Capital Appreciation Focus Fund Class I was 1.15% and
Class Z was 0.95%.
Alger Management may, during the one-year term of the expense reimbursement contract,
recoup any expenses waived or reimbursed pursuant to the expense reimbursement contract
to the extent that such recoupment would not cause the expense ratio to exceed the lesser
of the stated limitation in effect at the time of (i) the waiver or reimbursement and (ii) the
recoupment. For the six months ended April 30, 2018, there were no recoupments made
by the Funds to the Investment Manager. As of April 30, 2018, the total repayments that
may potentially be made by the Funds to the Investment Manager for the Alger Capital
Appreciation Institutional Fund, Alger Capital Appreciation Focus Fund, Alger Mid Cap
Growth Institutional Fund and Alger Small Cap Growth Institutional Fund are $49,665,
$23,208, $1,195 and $2,507, respectively, which will expire February 28, 2019.
(b) Administration Fees: Fees incurred by each Fund, pursuant to the provisions of the Trust’s
Administration Agreement with Alger Management, are payable monthly and computed
based on the average daily net assets of each Fund at the annual rate of 0.0275%.
(c) Distribution Fees:
Class A Shares: The Trust has adopted a Distribution Plan pursuant to which Class A shares
of Alger Capital Appreciation Focus Fund pays Fred Alger & Company, Incorporated, the
Fund’s distributor (“Alger Inc.”) and an affiliate of Alger Management, a fee at the annual
rate of 0.25% of the respective average daily net assets of the Class A shares of the Fund to
- 67 -
THE ALGER INSTITUTIONAL FUNDS
NOTES TO FINANCIAL STATEMENTS (Unaudited) (Continued)
compensate Alger Inc. for its activities and expenses incurred in distributing and servicing
the Class A shares. The fees paid may be more or less than the expenses incurred by Alger
Inc.
Class C Shares: The Trust has adopted a Distribution Plan pursuant to which Class C shares
of Alger Capital Appreciation Focus Fund pays Alger Inc. a fee at the annual rate of 1% of
the average daily net assets of the Class C shares of the Fund to compensate Alger Inc. for
its activities and expenses incurred in distributing and servicing the Class C shares. The fees
paid may be more or less than the expenses incurred by Alger Inc.
Class R Shares: The Trust has adopted a Distribution Plan pursuant to which Class R shares
of each Fund issuing such shares pays Alger Inc. a fee at the annual rate of 0.50% of
the respective average daily net assets of the Class R shares of the designated Fund to
compensate Alger Inc. for its activities and expenses incurred in distributing and servicing
the Class R shares. The fees paid may be more or less than the expenses incurred by the
Distributor.
(d) Sales Charges: Purchases and sales of shares of the Alger Capital Appreciation Focus Fund
may be subject to initial sales charges or contingent deferred sales charges. The contingent
deferred sales charges are used by Alger Inc. to offset distribution expenses previously
incurred. Sales charges do not represent expenses of the Trust. For the six months ended
April 30, 2018, the initial sales charges and contingent deferred sales charges imposed, all of
which were retained by Alger Inc., were as follows:
| | | | |
| | | | | CONTINGENT |
| | INITIAL SALES | DEFERRED SALES |
| | | CHARGES | | CHARGES |
| Alger Capital Appreciation Focus Fund | $ | 825 | $ | – |
(e) Brokerage Commissions: During the six months ended April 30, 2018, Alger Capital
Appreciation Institutional Fund, Alger Capital Appreciation Focus Fund, Alger Mid Cap
Growth Institutional Fund and Alger Small Cap Growth Institutional Fund paid Alger Inc.
commissions of $176,207, $12,029, $14,450 and $7,497, respectively, in connection with
securities transactions.
(f) Shareholder Administrative Fees: The Trust has entered into a shareholder administrative
services agreement with Alger Management to compensate Alger Management for its liaison
and administrative oversight of DST Asset Manager Solutions, Inc., the transfer agent, and
for other related services. The Funds compensate Alger Management at the annual rate of
0.0165% of their respective average daily net assets for the Class A and Class C shares and
0.01% of their respective average daily net assets of the Class I, Class R, Class Y, Class Z
and Class Z-2 shares for these services.
Alger Management makes payments to intermediaries that provide sub-accounting services
to omnibus accounts invested in the Funds. A portion of the fees paid by Alger Management
to intermediaries that provide sub-accounting services are charged back to the appropriate
Fund, subject to certain limitations, as approved by the Trust’s Board of Trustees. For
the six months ended April 30, 2018, Alger Management charged back to Alger Capital
- 68 -
THE ALGER INSTITUTIONAL FUNDS
NOTES TO FINANCIAL STATEMENTS (Unaudited) (Continued)
Appreciation Institutional Fund, Alger Capital Appreciation Focus Fund, Alger Mid Cap
Growth Institutional Fund, and Alger Small Cap Growth Institutional Fund, $828,600,
$11,540, $28,221 and $43,997, respectively, for these services, which are included in the
transfer agent fees and expenses in the accompanying Statements of Operations.
(g) Trustees’ Fees: From November 1, 2017 through February 28, 2018, each Independent
Trustee received a fee of $27,250 for each board meeting attended, to a maximum of
$109,000 per annum, paid pro rata by each fund in the Alger Fund Complex, plus travel
expenses incurred for attending the meeting. The term “Alger Fund Complex” refers to
the Trust, The Alger Funds II, Alger Global Growth Fund, The Alger Portfolios and
The Alger Funds, each of which is a registered investment company managed by Alger
Management. The Independent Trustee appointed as Chairman of the Board of Trustees
receives additional compensation of $26,000 per annum paid pro rata by each fund in the
Alger Fund Complex. Additionally, each member of the Audit Committee receives a fee of
$2,500 for each Audit Committee meeting attended to a maximum of $10,000 per annum,
paid pro rata by each fund in the Alger Fund Complex.
Effective March 1, 2018, each Independent Trustee receives a fee of $28,000 for each board
meeting attended, to a maximum of $112,000 per annum, paid pro rata by each fund in
the Alger Fund Complex, plus travel expenses incurred for attending the meeting. The
Independent Trustee appointed as Chairman of the Board of Trustees receives additional
compensation of $30,000 per annum paid pro rata by each fund in the Alger Fund Complex.
Additionally, each member of the Audit Committee receives a fee of $2,750 for each Audit
Committee meeting attended to a maximum of $11,000 per annum, paid pro rata by each
fund in the Alger Fund Complex.
(h) Interfund Trades: The Funds engage in purchase and sale transactions with other funds
advised by Alger Management. There were no interfund trades during the six months ended
April 30, 2018.
(i) Interfund Loans: The Funds may borrow money from other funds advised by Alger
Management for temporary or emergency purposes. If a fund has borrowed from other
funds and has aggregate borrowings from all sources that exceed 10% of the fund’s total
assets, such fund will secure all of its loans from other funds. The interest rate charged on
interfund loans is equal to the average of the overnight time deposit rate and bank loan
rate available to the funds. There were no interfund loans outstanding as of April 30, 2018.
During the six months ended April 30, 2018, Alger Capital Appreciation Institutional Fund
and Alger Small Cap Growth Institutional Fund incurred interest expense of $12,513 and
$665, respectively, in connection with interfund loans.
(j) Other Transactions With Affiliates: Certain officers of the Trust are directors and officers
of Alger Management and the Distributor. At April 30, 2018, Alger Management and its
affiliated entities owned the following shares:
- 69 -
THE ALGER INSTITUTIONAL FUNDS
NOTES TO FINANCIAL STATEMENTS (Unaudited) (Continued)
| | | | | | | | |
| | | | | SHARE CLASS | | |
| | | | A | C | I | Y | Z | Z-2 |
| Alger Capital Appreciation Institutional Fund | – | – | – | 370 | – | 4,030 |
| Alger Capital Appreciation Focus Fund | 7,148 | 7,161 | – | 387 | 36,729 | – |
| Alger Mid Cap Growth Institutional Fund | – | – | – | – | – | 4,556 |
(k) Shareholder Servicing Fees: The Trust has entered into a shareholder servicing agreement
with Alger Inc. whereby Alger Inc. provides Class I shares and Class R shares of the Trust
with ongoing servicing of shareholder accounts. As compensation for such services, the
Class I shares and Class R shares of each Fund pay Alger Inc. a monthly fee at an annual
rate of 0.25% of the value of the average daily net assets of those classes. The fees paid
may be more or less than the expenses incurred by the Distributor.
NOTE 4 — Securities Transactions:
The following summarizes the securities transactions by the Funds other than short-term
securities for the six months ended April 30, 2018:
| | | | | | |
| | | | PURCHASES | | | SALES |
| Alger Capital Appreciation Institutional Fund | | $ | 1,050,475,023 | | $ | 1,498,989,290 |
| Alger Capital Appreciation Focus Fund | | | 120,029,729 | | | 101,749,756 |
| Alger Mid Cap Growth Institutional Fund | | | 49,353,555 | | | 53,675,110 |
| Alger Small Cap Growth Institutional Fund | | | 21,765,703 | | | 44,850,700 |
Transactions in foreign securities may involve certain considerations and risks not typically
associated with those of U.S. companies because of, among other factors, the level of
governmental supervision and regulation of foreign security markets, and the possibility
of political or economic instability. Additional risks associated with investing in emerging
markets include increased volatility, limited liquidity, and less stringent regulatory and legal
systems.
NOTE 5 — Borrowing:
The Funds may borrow from their custodian on an uncommitted basis. Each Fund pays the
custodian a market rate of interest, generally based upon the London Interbank Offered
Rate. The Funds may also borrow from other funds advised by Alger Management,
as discussed in Note 3(i). For the six months ended April 30, 2018, the Funds had the
following borrowings:
| | | | | | |
| | | AVERAGE DAILY | WEIGHTED AVERAGE | |
| | | BORROWING | | INTEREST RATE | |
| Alger Capital Appreciation Institutional Fund | $ | 1,229,938 | | 2.18 | % |
| Alger Capital Appreciation Focus Fund | | | 17,164 | | 3.59 | |
| Alger Mid Cap Growth Institutional Fund | | | 1,791 | | 3.74 | |
| Alger Small Cap Growth Institutional Fund | | | 79,690 | | 2.63 | |
The highest amount borrowed from its custodian and other funds during the six months
ended April 30, 2018, for each Fund was as follows:
- 70 -
THE ALGER INSTITUTIONAL FUNDS
NOTES TO FINANCIAL STATEMENTS (Unaudited) (Continued)
| | | |
| | HIGHEST BORROWING |
| Alger Capital Appreciation Institutional Fund | | $ | 33,941,000 |
| Alger Capital Appreciation Focus Fund | | | 410,251 |
| Alger Mid Cap Growth Institutional Fund | | | 108,027 |
| Alger Small Cap Growth Institutional Fund | | | 7,284,000 |
NOTE 6 — Share Capital:
The Trust has an unlimited number of authorized shares of beneficial interest of $.001 par
value which are presently divided into four series. Each series is divided into separate classes.
The transactions of shares of beneficial interest were as follows:
| | | | | | | | | | | | | | | | | |
| | FOR THE SIX MONTHS ENDED | | | | FOR THE YEAR ENDED | |
| | | APRIL 30, 2018 | | | | OCTOBER 31, 2017 | |
| | | SHARES | | | | | AMOUNT | | | | SHARES | | | | | AMOUNT | |
| Alger Capital Appreciation Institutional Fund | | | | | | | | | | | | | | | |
| Class I: | | | | | | | | | | | | | | | | | |
| Shares sold | | 5,546,442 | | | $ | | 188,689,610 | | | | 16,153,920 | | | $ | | 476,641,428 | |
| Dividends reinvested | | 4,697,031 | | | | | 152,798,034 | | | | 718,981 | | | | | 19,268,689 | |
| Shares redeemed | | (12,376,862 | ) | | (418,280,154 | ) | | | (56,847,411 | ) | | (1,620,341,276 | ) |
| Net decrease | | (2,133,389 | ) | | $ | | (76,792,510 | ) | | | | (39,974,510 | ) | | $ | | (1,124,431,159 | ) |
| Class R: | | | | | | | | | | | | | | | | | |
| Shares sold | | 1,202,731 | | | $ | | 36,659,162 | | | | 3,468,162 | | | $ | | 92,794,162 | |
| Dividends reinvested | | 1,485,308 | | | | | 43,341,280 | | | | 178,580 | | | | | 4,344,841 | |
| Shares redeemed | | (3,147,653 | ) | | | | (95,493,299 | ) | | | (6,378,683 | ) | | (169,954,336 | ) |
| Net decrease | | (459,614 | ) | | $ | | (15,492,857 | ) | | | | (2,731,941 | ) | | $ | | (72,815,333 | ) |
| Class Y: | | | | | | | | | | | | | | | | | |
| Shares sold | | 799,566 | | | $ | | 27,088,657 | | | | 2,938,772 | | | $ | | 94,267,571 | |
| Dividends reinvested | | 182,194 | | | | | 5,946,816 | | | | — | | | | | — | |
| Shares redeemed | | (154,848 | ) | | | | (5,240,995 | ) | | | (63,899 | ) | | | | (2,091,302 | ) |
| Net increase | | 826,912 | | | $ | | 27,794,478 | | | | 2,874,873 | | | $ | | 92,176,269 | |
| Class Z-2: | | | | | | | | | | | | | | | | | |
| Shares sold | | 2,202,854 | | | $ | | 75,349,608 | | | | 17,233,735 | | | $ | | 490,233,250 | |
| Dividends reinvested | | 855,586 | | | | | 27,943,443 | | | | 44,346 | | | | | 1,189,367 | |
| Shares redeemed | | (2,465,179 | ) | | | | (83,847,633 | ) | | | (4,562,899 | ) | | (139,712,867 | ) |
| Net increase | | 593,261 | | | $ | | 19,445,418 | | | | 12,715,182 | | | $ | | 351,709,750 | |
- 71 -
THE ALGER INSTITUTIONAL FUNDS
NOTES TO FINANCIAL STATEMENTS (Unaudited) (Continued)
| | | | | | | | | | | | | | | |
| | FOR THE SIX MONTHS ENDED | | | | FOR THE YEAR ENDED | |
| | | APRIL 30, 2018 | | | | OCTOBER 31, 2017 | |
| | | SHARES | | | | AMOUNT | | | | SHARES | | | | AMOUNT | |
| Alger Capital Appreciation Focus Fund | | | | | | | | | | | | | | |
| Class A: | | | | | | | | | | | | | | | |
| Shares sold | | 137,891 | | $ | | 4,546,064 | | | | 238,196 | | $ | | 6,398,589 | |
| Dividends reinvested | | 28,879 | | | | 899,639 | | | | — | | | | — | |
| Shares redeemed | | (66,056 | ) | | | (2,162,266 | ) | | | (557,255 | ) | | | (14,257,177 | ) |
| Net increase (decrease) | | 100,714 | | $ | | 3,283,437 | | | | (319,059 | ) | $ | | (7,858,588 | ) |
| Class C: | | | | | | | | | | | | | | | |
| Shares sold | | 119,616 | | $ | | 3,810,436 | | | | 238,598 | | $ | | 5,944,197 | |
| Dividends reinvested | | 23,853 | | | | 717,111 | | | | — | | | | — | |
| Shares redeemed | | (58,660 | ) | | | (1,851,672 | ) | | | (145,227 | ) | | | (3,844,373 | ) |
| Net increase | | 84,809 | | $ | | 2,675,875 | | | | 93,371 | | $ | | 2,099,824 | |
| Class I: | | | | | | | | | | | | | | | |
| Shares sold | | 185,327 | | $ | | 6,080,645 | | | | 394,922 | | $ | | 10,973,042 | |
| Dividends reinvested | | 26,742 | | | | 838,900 | | | | — | | | | — | |
| Shares redeemed | | (134,164 | ) | | | (4,341,740 | ) | | | (579,798 | ) | | | (15,640,234 | ) |
| Net increase (decrease) | | 77,905 | | $ | | 2,577,805 | | | | (184,876 | ) | $ | | (4,667,192 | ) |
| Class Y: | | | | | | | | | | | | | | | |
| Shares sold | | 42,141 | | $ | | 1,390,939 | | | | 136,508 | | $ | | 4,223,668 | |
| Dividends reinvested | | 130 | | | | 4,151 | | | | — | | | | — | |
| Shares redeemed | | (18,881 | ) | | | (631,804 | ) | | | (2,934 | ) | | | (92,002 | ) |
| Net increase | | 23,390 | | $ | | 763,286 | | | | 133,574 | | $ | | 4,131,666 | |
| Class Z: | | | | | | | | | | | | | | | |
| Shares sold | | 865,347 | | $ | | 28,857,502 | | | | 1,675,218 | | $ | | 45,981,326 | |
| Dividends reinvested | | 78,422 | | | | 2,493,828 | | | | — | | | | — | |
| Shares redeemed | | (324,578 | ) | | | (10,735,302 | ) | | | (409,196 | ) | | | (11,814,488 | ) |
| Net increase | | 619,191 | | $ | | 20,616,028 | | | | 1,266,022 | | $ | | 34,166,838 | |
| |
| Alger Mid Cap Growth Institutional Fund | | | | | | | | | | | | | | |
| Class I: | | | | | | | | | | | | | | | |
| Shares sold | | 227,595 | | $ | | 6,753,156 | | | | 393,700 | | $ | | 9,942,979 | |
| Shares redeemed | | (425,191 | ) | | | (12,638,442 | ) | | | (1,184,092 | ) | | | (28,871,701 | ) |
| Net decrease | | (197,596 | ) | $ | | (5,885,286 | ) | | | (790,392 | ) | $ | | (18,928,722 | ) |
| Class R: | | | | | | | | | | | | | | | |
| Shares sold | | 29,459 | | $ | | 811,311 | | | | 102,239 | | $ | | 2,357,701 | |
| Shares redeemed | | (88,575 | ) | | | (2,411,248 | ) | | | (266,903 | ) | | | (6,180,169 | ) |
| Net decrease | | (59,116 | ) | $ | | (1,599,937 | ) | | | (164,664 | ) | $ | | (3,822,468 | ) |
| Class Z-2: | | | | | | | | | | | | | | | |
| Shares sold | | 170,436 | | $ | | 5,093,530 | | | | 336,377 | | $ | | 8,195,951 | |
| Shares redeemed | | (116,044 | ) | | | (3,481,389 | ) | | | (34,849 | ) | | | (894,948 | ) |
| Net increase | | 54,392 | | $ | | 1,612,141 | | | | 301,528 | | $ | | 7,301,003 | |
- 72 -
THE ALGER INSTITUTIONAL FUNDS
NOTES TO FINANCIAL STATEMENTS (Unaudited) (Continued)
| | | | | | | | | | | | | | | |
| | FOR THE SIX MONTHS ENDED | | | | FOR THE YEAR ENDED | |
| | | APRIL 30, 2018 | | | | OCTOBER 31, 2017 | |
| | | SHARES | | | | AMOUNT | | | | SHARES | | | | AMOUNT | |
| Alger Small Cap Growth Institutional Fund | | | | | | | | | | | | | |
| Class I: | | | | | | | | | | | | | | | |
| Shares sold | | 568,661 | | $ | | 11,866,771 | | | | 1,256,731 | | $ | | 22,874,804 | |
| Dividends reinvested | | 172,670 | | | | 3,468,934 | | | | — | | | | — | |
| Shares redeemed | | (964,347 | ) | | | (20,037,040 | ) | | | (3,607,295 | ) | | | (61,669,792 | ) |
| Net decrease | | (223,016 | ) | $ | | (4,701,335 | ) | | | (2,350,564 | ) | $ | | (38,794,988 | ) |
| Class R: | | | | | | | | | | | | | | | |
| Shares sold | | 51,328 | | $ | | 905,076 | | | | 172,015 | | $ | | 2,578,445 | |
| Dividends reinvested | | 20,472 | | | | 347,610 | | | | — | | | | — | |
| Shares redeemed | | (184,009 | ) | | | (3,211,274 | ) | | | (527,393 | ) | | | (7,849,419 | ) |
| Net decrease | | (112,209 | ) | $ | | (1,958,588 | ) | | | (355,378 | ) | $ | | (5,270,974 | ) |
| Class Z-2: | | | | | | | | | | | | | | | |
| Shares sold | | 107,211 | | $ | | 2,249,691 | | | | 1,507,588 | | $ | | 26,380,218 | |
| Dividends reinvested | | 92,065 | | | | 1,858,797 | | | | — | | | | — | |
| Shares redeemed | | (808,384 | ) | | | (17,006,788 | ) | | | (1,058,368 | ) | | | (18,691,576 | ) |
| Net increase (decrease) | | (609,108 | ) | $ | | (12,898,300 | ) | | | 449,220 | | $ | | 7,688,642 | |
NOTE 7 — Income Tax Information:
At October 31, 2017, the Funds, for federal income tax purposes, had no capital loss
carryforwards.
During the year ended October 31, 2017, Alger Mid Cap Growth Institutional Fund utilized
$22,850,923 of its capital loss carryforwards.
Under the Regulated Investment Company Modernization Act of 2010, capital losses
incurred by the Funds will not be subject to expiration.
The difference between book-basis and tax-basis unrealized appreciation (depreciation) is
determined annually and is attributable primarily to the tax deferral of losses on wash sales,
U.S. Internal Revenue Code Section 988 currency transactions, nondeductible expenses
on dividends sold short, the tax treatment of partnerships investments, the realization of
unrealized appreciation of passive foreign investment companies, and return of capital from
real estate investment trust investments.
NOTE 8 — Fair Value Measurements
The following is a summary of the inputs used as of April 30, 2018, in valuing the Funds’
investments carried at fair value on a recurring basis. Based upon the nature, characteristics,
and risks associated with their investments, the Funds have determined that presenting them
by security type and sector is appropriate.
- 73 -
THE ALGER INSTITUTIONAL FUNDS
NOTES TO FINANCIAL STATEMENTS (Unaudited) (Continued)
| | | | | | | | | | | | | | | | |
| Alger Capital Appreciation | | | | | | | | | | | | | | | | |
| Institutional Fund | TOTAL FUND | | LEVEL 1 | | | | LEVEL 2 | | | | LEVEL 3 |
| COMMON STOCKS | | | | | | | | | | | | | | | | |
| Consumer Discretionary | $ | 578,068,162 | $ | 571,704,909 | | | $ | | 6,363,253 | | | | | — |
| Consumer Staples | | 30,436,971 | | 30,436,971 | | | | | — | | | | | — |
| Energy | | 46,278,187 | | 46,278,187 | | | | | — | | | | | — |
| Financials | | 226,849,450 | | 226,849,450 | | | | | — | | | | | — |
| Health Care | | 446,542,893 | | 446,542,893 | | | | | — | | | | | — |
| Industrials | | 299,384,750 | | 299,384,750 | | | | | — | | | | | — |
| Information Technology | | 1,549,564,356 | | 1,546,365,448 | | | | | 1,824,485 | | | $ | | 1,374,423 |
| Materials | | 117,487,092 | | 117,487,092 | | | | | — | | | | | — |
| TOTAL COMMON STOCKS | $ | 3,294,611,861 | $ | 3,285,049,700 | | | $ | | 8,187,738 | | | $ | | 1,374,423 |
| MASTER LIMITED PARTNERSHIP | | | | | | | | | | | | | | | |
| Financials | | 19,460,834 | | 19,460,834 | | | | | — | | | | | — |
| PREFERRED STOCKS | | | | | | | | | | | | | | | | |
| Health Care | | 2,993,470 | | — | | | | | — | | | | | 2,993,470 |
| Information Technology | | 6,335,626 | | — | | | | | — | | | | | 6,335,626 |
| TOTAL PREFERRED STOCKS | $ | 9,329,096 | | — | | | | | — | | | $ | | 9,329,096 |
| REAL ESTATE INVESTMENT TRUST | | | | | | | | | | | | | | | |
| Real Estate | | 83,468,191 | | 83,468,191 | | | | | — | | | | | — |
| TOTAL INVESTMENTS IN | | | | | | | | | | | | | | | | |
| SECURITIES | $ | 3,406,869,982 | $ | 3,387,978,725 | | | $ | | 8,187,738 | | | $ | | 10,703,519 |
| |
| Alger Capital Appreciation Focus | | | | | | | | | | | | | | | | |
| Fund | TOTAL FUND | | LEVEL 1 | | | | LEVEL 2 | | | | LEVEL 3 |
| COMMON STOCKS | | | | | | | | | | | | | | | | |
| Consumer Discretionary | $ | 24,253,235 | $ | 24,253,235 | | | | | — | | | | | — |
| Energy | | 1,216,959 | | 1,216,959 | | | | | — | | | | | — |
| Financials | | 16,404,855 | | 16,404,855 | | | | | — | | | | | — |
| Health Care | | 20,214,096 | | 20,214,096 | | | | | — | | | | | — |
| Industrials | | 8,115,043 | | 8,115,043 | | | | | — | | | | | — |
| Information Technology | | 80,993,081 | | 80,909,012 | | | | $ | 84,069 | | | | | — |
| Materials | | 3,113,076 | | 3,113,076 | | | | | — | | | | | — |
| TOTAL COMMON STOCKS | $ | 154,310,345 | $ | 154,226,276 | | | | $ | 84,069 | | | | | — |
| MASTER LIMITED PARTNERSHIP | | | | | | | | | | | | | | | |
| Financials | | 671,213 | | 671,213 | | | | | — | | | | | — |
| PREFERRED STOCKS | | | | | | | | | | | | | | | | |
| Health Care | | 230,475 | | — | | | | | — | | | | $ | 230,475 |
| REAL ESTATE INVESTMENT TRUST | | | | | | | | | | | | | | |
| Real Estate | | 3,669,081 | | 3,669,081 | | | | | — | | | | | — |
| TOTAL INVESTMENTS IN | | | | | | | | | | | | | | | | |
| SECURITIES | $ | 158,881,114 | $ | 158,566,570 | | | | $ | 84,069 | | | | $ | 230,475 |
- 74 -
THE ALGER INSTITUTIONAL FUNDS
NOTES TO FINANCIAL STATEMENTS (Unaudited) (Continued)
| | | | | | | | | | | | |
| Alger Mid Cap Growth Institutional | | | | | | | | | | | | |
| Fund | TOTAL FUND | | LEVEL 1 | | | LEVEL 2 | | | LEVEL 3 |
| COMMON STOCKS | | | | | | | | | | | | |
| Consumer Discretionary | $ | 15,803,969 | $ | 15,803,969 | | | — | | | — |
| Consumer Staples | | 1,466,726 | | 1,466,726 | | | — | | | — |
| Energy | | 1,330,680 | | 1,330,680 | | | — | | | — |
| Financials | | 5,830,965 | | 5,830,965 | | | — | | | — |
| Health Care | | 21,729,324 | | 21,729,324 | | | — | | | — |
| Industrials | | 13,072,226 | | 13,072,226 | | | — | | | — |
| Information Technology | | 34,421,883 | | 34,350,433 | | | — | | $ | 71,450 |
| Materials | | 4,739,100 | | 4,739,100 | | | — | | | — |
| TOTAL COMMON STOCKS | $ | 98,394,873 | $ | 98,323,423 | | | — | | $ | 71,450 |
| PREFERRED STOCKS | | | | | | | | | | | | |
| Health Care | | 701,462 | | — | | | — | | | 701,462 |
| Information Technology | | 291,381 | | — | | | — | | | 291,381 |
| TOTAL PREFERRED STOCKS | $ | 992,843 | | — | | | — | | $ | 992,843 |
| REAL ESTATE INVESTMENT TRUST | | | | | | | | | | | |
| Real Estate | | 2,230,480 | | 2,230,480 | | | — | | | — |
| RIGHTS | | | | | | | | | | | | |
| Health Care | | 1,379,227 | | — | | | — | | | 1,379,227 |
| SPECIAL PURPOSE VEHICLE | | | | | | | | | | | | |
| Financials | | 294,540 | | — | | | — | | | 294,540 |
| TOTAL INVESTMENTS IN | | | | | | | | | | | | |
| SECURITIES | $ | 103,291,963 | $ | 100,553,903 | | | — | | $ | 2,738,060 |
| Escrow Receivable | $ | 493,684 | | — | | $ | 493,684 | * | | — |
| |
| |
| Alger Small Cap Growth | | | | | | | | | | | | |
| Institutional Fund | TOTAL FUND | | LEVEL 1 | | | LEVEL 2 | | | LEVEL 3 |
| COMMON STOCKS | | | | | | | | | | | | |
| Consumer Discretionary | $ | 15,847,552 | $ | 15,847,552 | | | — | | | — |
| Consumer Staples | | 1,948,600 | | 1,948,600 | | | — | | | — |
| Energy | | 2,976,707 | | 2,976,707 | | | — | | | — |
| Financials | | 6,413,520 | | 6,413,520 | | | — | | | — |
| Health Care | | 79,997,464 | | 79,997,464 | | | — | | | — |
| Industrials | | 10,700,875 | | 10,700,875 | | | — | | | — |
| Information Technology | | 68,637,780 | | 68,637,780 | | | — | | | — |
| Materials | | 3,184,758 | | 3,184,758 | | | — | | | — |
| TOTAL COMMON STOCKS | $ | 189,707,256 | $ | 189,707,256 | | | — | | | — |
| PREFERRED STOCKS | | | | | | | | | | | | |
| Health Care | | 1,505,380 | | — | | | — | $ | | 1,505,380 |
| REAL ESTATE INVESTMENT TRUST | | | | | | | | | | |
| Real Estate | | 1,561,881 | | 1,561,881 | | | — | | | — |
| RIGHTS | | | | | | | | | | | | |
| Health Care | | 1,785,191 | | — | | | —** | | | 1,785,191 |
| SPECIAL PURPOSE VEHICLE | | | | | | | | | | | | |
| Financials | | 949,849 | | — | | | — | | | 949,849 |
| TOTAL INVESTMENTS IN | | | | | | | | | | | | |
| SECURITIES | $ | 195,509,557 | $ | 191,269,137 | | | — | $ | | 4,240,420 |
| Escrow Receivable | $ | 616,987 | | — | | $ | 616,987 | * | | — |
* Amounts held for indemnification claims of Sumitomo Dainippon Pharma Co., Ltd. following its acquisition of
Tolero Pharmaceuticals, Inc.
- 75 -
THE ALGER INSTITUTIONAL FUNDS
NOTES TO FINANCIAL STATEMENTS (Unaudited) (Continued)
**Alger Small Cap Growth Institutional Fund’s holding of Neuralstem Inc. rights is classified as a Level 2 investment
and fair valued at zero as of April 30, 2018.
| | | | |
| | | FAIR VALUE | |
| | | MEASUREMENTS | |
| | | USING SIGNIFICANT | |
| | | UNOBSERVABLE | |
| | | INPUTS (LEVEL 3) | |
| Alger Capital Appreciation Institutional Fund | | Common Stocks | |
| Opening balance at November 1, 2017 | | $ | 1,374,423 | * |
| Transfers into Level 3 | | | — | |
| Transfers out of Level 3 | | | — | |
| Total gains or losses | | | | |
| Included in net realized gain (loss) on investments | | | (36,151 | ) |
| Included in net change in unrealized appreciation (depreciation) on investments | | 36,151 | |
| Purchases and sales | | | | |
| Purchases | | | — | |
| Sales | | | — | |
| Closing balance at April 30, 2018 | | | 1,374,423 | |
| Net change in unrealized appreciation (depreciation) attributable to investments | | | | |
| still held at April 30, 2018 | | $ | — | |
| |
| Alger Capital Appreciation Institutional Fund | | Corporate Bonds | |
| Opening balance at November 1, 2017 | | $ | 0 | * |
| Transfers into Level 3 | | | — | |
| Transfers out of Level 3 | | | — | |
| Total gains or losses | | | | |
| Included in net realized gain (loss) on investments | | | (575 | ) |
| Included in net change in unrealized appreciation (depreciation) on investments | | 575 | |
| Purchases and sales | | | | |
| Purchases | | | — | |
| Sales | | | — | |
| Closing balance at April 30, 2018 | | | — | |
| Net change in unrealized appreciation (depreciation) attributable to investments | | | | |
| still held at April 30, 2018 | | $ | — | |
| |
| Alger Capital Appreciation Institutional Fund | | Preferred Stocks | |
| Opening balance at November 1, 2017 | | $ | 12,747,973 | * |
| Transfers into Level 3 | | | — | |
| Transfers out of Level 3 | | | — | |
| Total gains or losses | | | | |
| Included in net realized gain (loss) on investments | | | (2,359,928 | ) |
| Included in net change in unrealized appreciation (depreciation) on investments | | (1,058,949 | ) |
| Purchases and sales | | | | |
| Purchases | | | — | |
| Sales | | | — | |
| Closing balance at April 30, 2018 | | | 9,329,096 | |
| Net change in unrealized appreciation (depreciation) attributable to investments | | | | |
| still held at April 30, 2018 | | $ | (3,418,877 | ) |
- 76 -
THE ALGER INSTITUTIONAL FUNDS
NOTES TO FINANCIAL STATEMENTS (Unaudited) (Continued)
| | | | |
| | | FAIR VALUE | |
| | | MEASUREMENTS | |
| | | USING SIGNIFICANT | |
| | | UNOBSERVABLE | |
| | | INPUTS (LEVEL 3) | |
| Alger Capital Appreciation Institutional Fund | | | Warrants | |
| Opening balance at November 1, 2017 | | $ | 0 | * |
| Transfers into Level 3 | | | — | |
| Transfers out of Level 3 | | | — | |
| Total gains or losses | | | | |
| Included in net realized gain (loss) on investments | | | (574,087 | ) |
| Included in net change in unrealized appreciation (depreciation) on investments | | 574,087 | |
| Purchases and sales | | | | |
| Purchases | | | — | |
| Sales | | | — | |
| Closing balance at April 30, 2018 | | | — | |
| Net change in unrealized appreciation (depreciation) attributable to investments | | | | |
| still held at April 30, 2018 | | $ | — | |
| |
| |
| | | FAIR VALUE | |
| | | MEASUREMENTS | |
| | | USING SIGNIFICANT | |
| | | UNOBSERVABLE | |
| | | INPUTS (LEVEL 3) | |
| Alger Capital Appreciation Focus Fund | | Preferred Stocks | |
| Opening balance at November 1, 2017 | | $ | 239,694 | |
| Transfers into Level 3 | | | — | |
| Transfers out of Level 3 | | | — | |
| Total gains or losses | | | | |
| Included in net realized gain (loss) on investments | | | — | |
| Included in net change in unrealized appreciation (depreciation) on investments | | (9,219 | ) |
| Purchases and sales | | | | |
| Purchases | | | — | |
| Sales | | | — | |
| Closing balance at April 30, 2018 | | | 230,475 | |
| Net change in unrealized appreciation (depreciation) attributable to investments | | | | |
| still held at April 30, 2018 | | $ | (9,219 | ) |
- 77 -
THE ALGER INSTITUTIONAL FUNDS
NOTES TO FINANCIAL STATEMENTS (Unaudited) (Continued)
| | | | |
| | | FAIR VALUE | |
| | | MEASUREMENTS | |
| | | USING SIGNIFICANT | |
| | | UNOBSERVABLE | |
| | | INPUTS (LEVEL 3) | |
| Alger Mid Cap Growth Institutional Fund | | Common Stocks | |
| Opening balance at November 1, 2017 | | $ | 71,450 | * |
| Transfers into Level 3 | | | — | |
| Transfers out of Level 3 | | | — | |
| Total gains or losses | | | | |
| Included in net realized gain (loss) on investments | | | (2,590 | ) |
| Included in net change in unrealized appreciation (depreciation) on investments | | 2,590 | |
| Purchases and sales | | | | |
| Purchases | | | — | |
| Sales | | | — | |
| Closing balance at April 30, 2018 | | | 71,450 | |
| Net change in unrealized appreciation (depreciation) attributable to investments | | | | |
| still held at April 30, 2018 | | $ | — | |
| |
| Alger Mid Cap Growth Institutional Fund | | Corporate Bonds | |
| Opening balance at November 1, 2017 | | $ | 0 | * |
| Transfers into Level 3 | | | — | |
| Transfers out of Level 3 | | | — | |
| Total gains or losses | | | | |
| Included in net realized gain (loss) on investments | | | (17 | ) |
| Included in net change in unrealized appreciation (depreciation) on investments | | 17 | |
| Purchases and sales | | | | |
| Purchases | | | — | |
| Sales | | | — | |
| Closing balance at April 30, 2018 | | | — | |
| Net change in unrealized appreciation (depreciation) attributable to investments | | | | |
| still held at April 30, 2018 | | $ | — | |
| |
| Alger Mid Cap Growth Institutional Fund | | Preferred Stocks | |
| Opening balance at November 1, 2017 | | $ | 1,283,070 | * |
| Transfers into Level 3 | | | — | |
| Transfers out of Level 3 | | | — | |
| Total gains or losses | | | | |
| Included in net realized gain (loss) on investments | | | (155,739 | ) |
| Included in net change in unrealized appreciation (depreciation) on investments | | (98,177 | ) |
| Purchases and sales | | | | |
| Purchases | | | — | |
| Sales | | | (36,311 | ) |
| Closing balance at April 30, 2018 | | | 992,843 | |
| Net change in unrealized appreciation (depreciation) attributable to investments | | | | |
| still held at April 30, 2018 | | $ | (252,265 | ) |
- 78 -
THE ALGER INSTITUTIONAL FUNDS
NOTES TO FINANCIAL STATEMENTS (Unaudited) (Continued)
| | | | |
| | | FAIR VALUE | |
| | | MEASUREMENTS | |
| | | USING SIGNIFICANT | |
| | | UNOBSERVABLE | |
| | | INPUTS (LEVEL 3) | |
| Alger Mid Cap Growth Institutional Fund | | | Rights | |
| Opening balance at November 1, 2017 | | $ | 1,207,798 | |
| Transfers into Level 3 | | | — | |
| Transfers out of Level 3 | | | — | |
| Total gains or losses | | | | |
| Included in net realized gain (loss) on investments | | | — | |
| Included in net change in unrealized appreciation (depreciation) on investments | | 171,429 | |
| Purchases and sales | | | | |
| Purchases | | | — | |
| Sales | | | — | |
| Closing balance at April 30, 2018 | | | 1,379,227 | |
| Net change in unrealized appreciation (depreciation) attributable to investments | | | | |
| still held at April 30, 2018 | | $ | 171,429 | |
| |
| | | Special Purpose | |
| Alger Mid Cap Growth Institutional Fund | | | Vehicle | |
| Opening balance at November 1, 2017 | | $ | 290,165 | |
| Transfers into Level 3 | | | — | |
| Transfers out of Level 3 | | | — | |
| Total gains or losses | | | | |
| Included in net realized gain (loss) on investments | | | — | |
| Included in net change in unrealized appreciation (depreciation) on investments | | 4,375 | |
| Purchases and sales | | | | |
| Purchases | | | — | |
| Sales | | | — | |
| Closing balance at April 30, 2018 | | | 294,540 | |
| Net change in unrealized appreciation (depreciation) attributable to investments | | | | |
| still held at April 30, 2018 | | $ | 4,375 | |
| |
| Alger Mid Cap Growth Institutional Fund | | | Warrants | |
| Opening balance at November 1, 2017 | | $ | 0 | * |
| Transfers into Level 3 | | | — | |
| Transfers out of Level 3 | | | — | |
| Total gains or losses | | | | |
| Included in net realized gain (loss) on investments | | | (17,111 | ) |
| Included in net change in unrealized appreciation (depreciation) on investments | | 17,111 | |
| Purchases and sales | | | | |
| Purchases | | | — | |
| Sales | | | — | |
| Closing balance at April 30, 2018 | | | — | |
| Net change in unrealized appreciation (depreciation) attributable to investments | | | | |
| still held at April 30, 2018 | | $ | — | |
- 79 -
THE ALGER INSTITUTIONAL FUNDS
NOTES TO FINANCIAL STATEMENTS (Unaudited) (Continued)
| | | | |
| | | FAIR VALUE | |
| | | MEASUREMENTS | |
| | | USING SIGNIFICANT | |
| | | UNOBSERVABLE | |
| | | INPUTS (LEVEL 3) | |
| Alger Small Cap Growth Institutional Fund | | Preferred Stocks | |
| Opening balance at November 1, 2017 | | $ | 2,784,079 | |
| Transfers into Level 3 | | | — | |
| Transfers out of Level 3 | | | — | |
| Total gains or losses | | | | |
| Included in net realized gain (loss) on investments | | | – | |
| Included in net change in unrealized appreciation (depreciation) on investments | | (1,278,699 | ) |
| Purchases and sales | | | | |
| Purchases | | | – | |
| Sales | | | – | |
| Closing balance at April 30, 2018 | | | 1,505,380 | |
| Net change in unrealized appreciation (depreciation) attributable to investments | | | | |
| still held at April 30, 2018 | | $ | (1,278,699 | ) |
| |
| Alger Small Cap Growth Institutional Fund | | | Rights | |
| Opening balance at November 1, 2017 | | $ | 1,570,945 | |
| Transfers into Level 3 | | | — | |
| Transfers out of Level 3 | | | — | |
| Total gains or losses | | | | |
| Included in net realized gain (loss) on investments | | | – | |
| Included in net change in unrealized appreciation (depreciation) on investments | | 214,246 | |
| Purchases and sales | | | | |
| Purchases | | | – | |
| Sales | | | – | |
| Closing balance at April 30, 2018 | | | 1,785,191 | |
| Net change in unrealized appreciation (depreciation) attributable to investments | | | | |
| still held at April 30, 2018 | | $ | 214,246 | |
| |
| | | Special Purpose | |
| Alger Small Cap Growth Institutional Fund | | | Vehicle | |
| Opening balance at November 1, 2017 | | $ | 935,742 | |
| Transfers into Level 3 | | | — | |
| Transfers out of Level 3 | | | — | |
| Total gains or losses | | | | |
| Included in net realized gain (loss) on investments | | | – | |
| Included in net change in unrealized appreciation (depreciation) on investments | | 14,107 | |
| Purchases and sales | | | | |
| Purchases | | | – | |
| Sales | | | – | |
| Closing balance at April 30, 2018 | | | 949,849 | |
| Net change in unrealized appreciation (depreciation) attributable to investments | | | | |
| still held at April 30, 2018 | | $ | 14,107 | |
* Includes securities that are fair valued at $0.
- 80 -
THE ALGER INSTITUTIONAL FUNDS
NOTES TO FINANCIAL STATEMENTS (Unaudited) (Continued)
The following table provides quantitative information about our Level 3 fair value
measurements of our investments as of April 30, 2018. In addition to the techniques and
inputs noted in the table below, according to our valuation policy we may also use other
valuation techniques and methodologies when determining our fair value measurements.
The table below is not intended to be all-inclusive, but rather provides information on the
Level 3 inputs as they relate to our fair value measurements.
| | | | | | | | |
| | | Fair Value | Valuation | Unobservable | | | Weighted Average | |
| | | April 30, 2018 | Methodology | Input | Input/Range | | Inputs | |
| Alger Capital Appreciation Institutional Fund | | | | | | |
| Common Stocks | $ | 1,374,423 | Market | Market | N/A* | | N/A | |
| | | | Approach | Quotation | | | | |
| Preferred Stocks | | 9,329,096 | Market | Time to Exit | 2 years | | N/A | |
| | | | Approach | Volatility | 75.1 | % | N/A | |
| | | | | Market | N/A* | | N/A | |
| | | | | Quotation | | | | |
| |
| Alger Capital Appreciation Focus Fund | | | | | | |
| Preferred Stocks | $ | 230,475 | Income | Discount Rate | 41%-45% | | N/A | |
| | | | Approach | | | | | |
| |
| Alger Mid Cap Growth Institutional Fund | | | | | | |
| Common Stocks | $ | 71,450 | Market | Market | N/A* | | N/A | |
| | | | Approach | Quotation | | | | |
| Preferred Stocks | | 498,027 | Income | Discount Rate | 41%-45% | | N/A | |
| | | | Approach | | | | | |
| Preferred Stocks | | 494,816 | Market | Time to Exit | 2 years | | N/A | |
| | | | Approach | Volatility | 75.1 | % | N/A | |
| | | | | Market | N/A* | | N/A | |
| | | | | Quotation | | | | |
| Special Purpose Vehicle | | 294,540 | Market | Revenue Multiple | 2.9x-4.2x | | N/A | |
| | | | Approach | | | | | |
| Rights | | 1,379,227 | Income | Discount Rate | 5.70%-27.40% | | N/A | |
| | | | Approach | | | | | |
| |
| Alger Small Cap Growth Institutional Fund | | | | | | |
| |
| Preferred Stocks | | 399,789 | Income | Discount Rate | 41%-45% | | N/A | |
| | | | Approach | | | | | |
| Preferred Stocks | | 1,105,591 | Market | Time to Exit | 2 years | | N/A | |
| | | | Approach | Volatility | 75.1 | % | | |
| Special Purpose Vehicle | | 949,849 | Market | Revenue Multiple | 2.9x-4.2x | | N/A | |
| | | | Approach | | | | | |
| Rights | | 1,785,191 | Income | Discount Rate | 2.05%-27.40% | | 16.05 | % |
| | | | Approach | | | | | |
* The Fund utilized a market approach to fair value this security. The significant unobservable input used in the
valuation model was a market quotation available to the Fund at April 30, 2018.
- 81 -
THE ALGER INSTITUTIONAL FUNDS
NOTES TO FINANCIAL STATEMENTS (Unaudited) (Continued)
The significant unobservable inputs used in the fair value measurement of the Fund’s
securities are revenue and EBITDA multiples, discount rates, and the probabilities of
success of certain outcomes. Significant increases and decreases in these inputs in isolation
and interrelationships between those inputs could result in significantly higher or lower fair
value measurements than those noted in the table above.
As of April 30, 2018, there were no transfers of securities between Level 1 and Level 2.
Certain of the Funds’ assets and liabilities are held at carrying amount or face value, which
approximates fair value for financial statement purposes. As of April 30, 2018, such assets
are categorized within the disclosure hierarchy as follows:
| | | | | | | | | | | | |
| | | TOTAL FUND | | LEVEL 1 | | LEVEL 2 | | | LEVEL 3 |
| Cash, Foreign cash and Cash equivalents: | | | | | | | | | | | | |
| Alger Capital Appreciation Institutional Fund | $ | 173,713,094 | | | — | $ | 173,713,094 | | | | — |
| Alger Capital Appreciation Focus Fund | | | 8,611,375 | | | — | | 8,611,375 | | | | — |
| Alger Mid Cap Growth Institutional Fund | | | 2,816,496 | | | — | | 2,816,496 | | | | — |
| Alger Small Cap Growth Institutional Fund | | | 3,023,730 | | | — | | 3,023,730 | | | | — |
NOTE 9 — Derivatives:
Financial Accounting Standards Board Accounting Standards Codification 815 – Derivatives
and Hedging (“ASC 815”) requires qualitative disclosures about objectives and strategies for
using derivatives, quantitative disclosures about fair value amounts of and gains and losses
on derivative instruments, and disclosures about credit-risk-related contingent features in
derivative agreements.
Options— The Funds seek to capture the majority of the returns associated with equity
market investments. To meet this investment goal, the Funds invest in a broadly diversified
portfolio of common stocks, while also buying and selling call and put options on equities
and equity indexes. The Funds purchase call options to increase their exposure to the stock
market and also provide diversification of risk. The Funds purchase put options in order
to protect from significant market declines that may occur over a short period of time. The
Funds will write covered call and cash secured put options to generate cash flows while
reducing the volatility of the Funds’ portfolios. The cash flows may be an important source
of the Funds’ returns, although written call options may reduce the Funds’ ability to profit
from increases in the value of the underlying security or equity portfolio. The value of a
call option generally increases as the price of the underlying stock increases and decreases
as the stock decreases in price. Conversely, the value of a put option generally increases as
the price of the underlying stock decreases and decreases as the stock increases in price.
The combination of the diversified stock portfolio and the purchase and sale of options
is intended to provide the Funds with the majority of the returns associated with equity
market investments but with reduced volatility and returns that are augmented with the cash
fÿÿÿÿlows from the sale of options.
The Funds’ option contracts were not subject to any rights of offset with any counterparty.
All of the Funds’ options were exchange traded which utilize a clearing house that acts as an
- 82 -
THE ALGER INSTITUTIONAL FUNDS
NOTES TO FINANCIAL STATEMENTS (Unaudited) (Continued)
intermediary between buyer and seller, receiving initial and maintenance margin from both,
and guaranteeing performance of the option contract.
There were no open derivative instruments throughout the period or as of April 30, 2018.
NOTE 10 — Principal Risks:
Alger Capital Appreciation Institutional Fund — Investing in the stock market involves
gains and losses and may not be suitable for all investors. The value of an investment may
move up or down, sometimes rapidly and unpredictably, and may be worth more or less than
what you invested. Stocks tend to be more volatile than other investments such as bonds.
Growth stocks tend to be more volatile than other stocks as the prices of growth stocks tend
to be higher in relation to their companies’ earnings and may be more sensitive to market,
political, and economic developments. The Fund may have a significant portion of its assets
invested in securities of companies conducting business in a related group of industries
within a sector, which may make the Fund more vulnerable to unfavorable developments in
that sector than a fund that has a more diversified portfolio. Many technology companies
have limited operating histories and prices of these companies’ securities have historically
been more volatile than other securities due to increased competition, government
regulation, and risk of obsolescence due to the progress of technological developments.
Investing in companies of small capitalizations involve the risk that such issuers may have
limited product lines or financial resources, lack management depth, or have more limited
liquidity. The cost of borrowing money to leverage may exceed the returns for the securities
purchased or the securities purchased may actually go down in value more quickly than if
the Fund had not borrowed.
Alger Capital Appreciation Focus Fund — Investing in the stock market involves gains and
losses and may not be suitable for all investors. The value of an investment may move up or
down, sometimes rapidly and unpredictably, and may be worth more or less than what you
invested. Stocks tend to be more volatile than other investments such as bonds. Growth
stocks tend to be more volatile than other stocks as the prices of growth stocks tend to
be higher in relation to their companies’ earnings and may be more sensitive to market,
political, and economic developments. The Fund may have a significant portion of its assets
invested in securities of companies conducting business in a related group of industries
within a sector, which may make the Fund more vulnerable to unfavorable developments in
that sector than a fund that has a more diversified portfolio. Many technology companies
have limited operating histories and prices of these companies’ securities have historically
been more volatile than other securities due to increased competition, government
regulation, and risk of obsolescence due to the progress of technological developments.
Investing in companies of all capitalizations involve the risk that smaller issuers may have
limited product lines or financial resources, lack management depth, or have more limited
liquidity. The Fund may have a more concentrated portfolio than other funds, so it may
be more vulnerable to changes in the market value of a single issuer and may be more
susceptible to risks associated with a single economic, political or regulatory occurrence
than a fund that has a more diversified portfolio. Active trading of portfolio securities may
- 83 -
THE ALGER INSTITUTIONAL FUNDS
NOTES TO FINANCIAL STATEMENTS (Unaudited) (Continued)
incur increased transaction costs and brokerage commissions, and potentially increase taxes
that a shareholder may pay, which can lower the actual return on an investment.
Alger Mid Cap Growth Institutional Fund — Investing in the stock market involves gains
and losses and may not be suitable for all investors. The value of an investment may move
up or down, sometimes rapidly and unpredictably, and may be worth more or less than what
you invested. Stocks tend to be more volatile than other investments such as bonds. Growth
stocks tend to be more volatile than other stocks as the prices of growth stocks tend to be
higher in relation to their companies’ earnings and may be more sensitive to market, political,
and economic developments. Investing in companies of medium capitalizations involves the
risk that such issuers may have limited product lines or financial resources, lack management
depth, or have more limited liquidity. The Fund may have a significant portion of its assets
invested in securities of companies conducting business in a related group of industries
within a sector, which may make the Fund more vulnerable to unfavorable developments in
that sector than a fund that has a more diversified portfolio. Many technology companies
have limited operating histories and prices of these companies’ securities have historically
been more volatile than other securities due to increased competition, government regulation,
and risk of obsolescence due to the progress of technological developments. The Fund
may have a significant portion of its assets invested in securities of healthcare companies,
which may be significantly affected by intense competition, aggressive pricing, government
regulation, technological innovations, product obsolescence, patent considerations, product
compatibility and consumer preferences, and may be more volatile than the securities of
other companies. Foreign investing involves special risks including currency risk and risks
related to political, social, or economic conditions. Active trading of portfolio securities may
incur increased transaction costs and brokerage commissions, and potentially increase taxes
that a shareholder may pay, which can lower the actual return on an investment.
Alger Small Cap Growth Institutional Fund — Investing in the stock market involves gains
and losses and may not be suitable for all investors. The value of an investment may move
up or down, sometimes rapidly and unpredictably, and may be worth more or less than what
you invested. Stocks tend to be more volatile than other investments such as bonds. Growth
stocks tend to be more volatile than other stocks as the prices of growth stocks tend to be
higher in relation to their companies’ earnings and may be more sensitive to market, political,
and economic developments. Investing in companies of small capitalizations involve the
risk that such issuers may have limited product lines or financial resources, lack management
depth, or have more limited liquidity. The Fund may have a significant portion of its assets
invested in securities of companies conducting business in a related group of industries
within a sector, which may make the Fund more vulnerable to unfavorable developments in
that sector than a fund that has a more diversified portfolio. Many technology companies
have limited operating histories and prices of these companies’ securities have historically
been more volatile than other securities due to increased competition, government regulation,
and risk of obsolescence due to the progress of technological developments. The Fund
may have a significant portion of its assets invested in securities of healthcare companies,
which may be significantly affected by intense competition, aggressive pricing, government
regulation, technological innovations, product obsolescence, patent considerations, product
- 84 -
THE ALGER INSTITUTIONAL FUNDS
NOTES TO FINANCIAL STATEMENTS (Unaudited) (Continued)
compatibility and consumer preferences, and may be more volatile than the securities of
other companies. Foreign investing involves special risks including currency risk and risks
related to political, social, or economic conditions.
NOTE 11 — Affiliated Securities:
The issuers of the securities listed below are deemed to be affiliates of the Funds because
the Funds or their affiliates owned 5% or more of the issuer’s voting securities during all or
part of the six months ended April 30, 2018. Purchase and sale transactions and dividend
income earned during the period were as follows:
| | | | | | | | | | | | | | | | | |
| | | | | | | | | | | | Net Increase | | | |
| | | Shares/ | | | | Shares/ | | | | | (Decrease) | | | |
| | | Par at | | | | Par at | | | | | | | | in | | | Value at |
| | | October 31, | Purchases/ | Sales/ | | April 30, | | Interest | Realized | | Unrealized | | | April 30, |
| Security | | 2017 | Conversion | Conversion | | 2018 | | Income | Gain (Loss) | | | | | App(Dep) | | | 2018 |
| Alger Capital Appreciation Institutional Fund | | | | | | | | | | | | | | |
| Common Stocks | | | | | | | | | | | | | | | | | |
| Choicestream, Inc.* | | 124,658 | – | (124,658 | )* | – | | – | $ (36,151 | ) | | $ | | 36,151 | | | – |
| Preferred Stocks | | | | | | | | | | | | | | | | | |
| Choicestream, Inc. , | | | | | | | | | | | | | | | | | |
| Series A* | | 1,074,935 | – | (1,074,935 | )* | – | | – | (859,605 | ) | | | | 859,605 | | | – |
| Choicestream, Inc. , | | | | | | | | | | | | | | | | | |
| Series B* | | 2,500,538 | – | (2,500,538 | )* | – | | – | (1,500,323 | ) | | | | 1,500,323 | | | – |
| Warrants | | | | | | | | | | | | | | | | | |
| Choicestream, Inc. , | | | | | | | | | | | | | | | | | |
| 6/22/26 * | 574,662 | – | (574,662 | )* | – | | – | (574,087 | ) | | | | 574,087 | | | – |
| Corporate Bonds | | | | | | | | | | | | | | | | | |
| Choicestream, Inc. , | | | | | | | | | | | | | | | | | |
| 11.00%, 8/05/18* | | 574,662 | – | (574,622 | )* | – | | – | (575 | ) | | | | 575 | | | – |
| Total | | | | | | | | – | $ 2,970,741 | ) | | $ | | 2,970,741 | | | – |
| |
| |
| |
| | | | | | | | | | | | Net Increase | | | |
| | | Shares/ | | | | Shares/ | | | | | (Decrease) | | | |
| | | Par at | | | | Par at | | | | | | | | in | | | Value at |
| | | October 31, | Purchases/ | Sales/ | | April 30, | | Interest | Realized | | Unrealized | | | April 30, |
| Security | | 2017 | Conversion | Conversion | | 2018 | | Income | Gain (Loss) | | | | | App(Dep) | | | 2018 |
| Alger Capital Appreciation Focus Fund | | | | | | | | | | | | | | |
| Preferred Stocks | | | | | | | | | | | | | | | | | |
| Prosetta Biosciences, | | | | | | | | | | | | | | | | | |
| Inc. , Series D | | 76,825 | – | – | | 76,825 | | – | – | | | | $ | (9,219 | ) | $ | 230,475 |
| Total | | | | | | | | – | – | | | | $ | (9,219 | ) | $ | 230,475 |
- 85 -
THE ALGER INSTITUTIONAL FUNDS
NOTES TO FINANCIAL STATEMENTS (Unaudited) (Continued)
| | | | | | | | | | | | | | | |
| | | | | | | | | | | | | Net Increase | | | |
| | | Shares/ | | | | Shares/ | | | | | | (Decrease) | | | |
| | | Par at | | | | Par at | | | | | | in | | | Value at |
| | | October 31, | Purchases/ | Sales/ | | April 30, | | Interest | Realized | | | Unrealized | | | April 30, |
| Security | | 2017 | Conversion | Conversion | | 2018 | | Income | Gain (Loss) | | | App(Dep) | | | 2018 |
| Alger Mid Cap Growth Institutional Fund | | | | | | | | | | | | |
| Common Stocks | | | | | | | | | | | | | | | |
| Choicestream, Inc.* | | 8,930 | – | (8,930 | )* | – | | – | $ (2,590 | ) | $ | 2,590 | | | – |
| Preferred Stocks | | | | | | | | | | | | | | | |
| Choicestream, Inc. , | | | | | | | | | | | | | | | |
| Series A* | | 77,008 | – | (77,008 | )* | – | | – | (61,582 | ) | | 61,582 | | | – |
| Choicestream, Inc. , | | | | | | | | | | | | | | | |
| Series B* | | 144,793 | – | (144,793 | )* | – | | – | (86,876 | ) | | 86,876 | | | – |
| Prosetta Biosciences, | | | | | | | | | | | | | | | |
| Inc. , Series D | | 166,009 | – | – | | 166,009 | | – | – | | | (19,921 | ) | $ | 498,027 |
| Warrants | | | | | | | | | | | | | | | |
| Choicestream, Inc., | | | | | | | | | | | | | | | |
| 6/22/26 * | 17,128 | – | (17,128 | )* | – | | – | (17,111 | ) | | 17,111 | | | – |
| Corporate Bonds | | | | | | | | | | | | | | | |
| Choicestream, Inc. * | | 17,128 | – | (17,128 | )* | – | | – | (17 | ) | | 17 | | | – |
| Total | | | | | | | | – | $ (168,176 | ) | $ | 148,255 | | $ | 498,027 |
| |
| |
| | | | | | | | | | | | | Net Increase | | | |
| | | Shares/ | | | | Shares/ | | | | | | (Decrease) | | | |
| | | Par at | | | | Par at | | | | | | in | | | Value at |
| | | October 31, | Purchases/ | Sales/ | | April 30, | | Interest | Realized | | | Unrealized | | | April 30, |
| Security | | 2017 | Conversion | Conversion | | 2018 | | Income | Gain (Loss) | | | App(Dep) | | | 2018 |
| Alger Small Cap Growth Institutional Fund | | | | | | | | | | | | |
| Preferred Stocks | | | | | | | | | | | | | | | |
| Prosetta Biosciences, | | | | | | | | | | | | | | | |
| Inc. , Series D | | 133,263 | – | – | | 133,263 | | – | – | | $ | (15,992 | ) | $ | 399,789 |
| Total | | | | | | | | – | – | | $ | (15,992 | ) | $ | 399,789 |
| * The company was dissolved on December 20, 2017. | | | | | | | | | | | |
NOTE 12 — Subsequent Events:
Management of each Fund has evaluated events that have occurred subsequent to April
30, 2018, through the issuance date of the Financial Statements. Effective August 30, 2018,
Class C shares will automatically convert to Class A shares on the fifth business day of
the month following the tenth anniversary of the purchase. No other events have been
identified which require recognition and/or disclosure.
- 86 -
THE ALGER INSTITUTIONAL FUNDS
ADDITIONAL INFORMATION (Unaudited)
Shareholder Expense Example
As a shareholder of a Fund, you incur two types of costs: transaction costs, if applicable,
including sales charges (loads) and redemption fees; and ongoing costs, including
management fees, distribution (12b-1) fees, if applicable, and other fund expenses. This
example is intended to help you understand your ongoing costs (in dollars) of investing in
the Fund and to compare these costs with the ongoing costs of investing in other mutual
funds.
The example below is based on an investment of $1,000 invested at the beginning of the
six-month period starting November 1, 2017 and ending April 30, 2018.
Actual Expenses
The first line for each class of shares in the table below provides information about actual
account values and actual expenses. You may use the information in this line, together
with the amount you invested, to estimate the expenses that you would have paid over the
period. Simply divide your account value by $1,000 (for example, an $8,600 account value
divided by $1,000 = 8.6), then multiply the result by the number in the first line under the
heading entitled “Expenses Paid during the Period” to estimate the expenses you paid on
your account during this period.
Hypothetical Example for Comparison Purposes
The second line for each class of shares in the table below provides information about
hypothetical account values and hypothetical expenses based on the Fund’s actual expense
ratios for each class of shares and an assumed rate of return of 5% per year before expenses,
which is not the Fund’s actual return. The hypothetical account values and expenses may not
be used to estimate the actual ending account balance or expenses you paid for the period.
You may use this information to compare the ongoing costs of investing in the Fund and
other funds. To do so, compare this 5% hypothetical example with the 5% hypothetical
examples that appear in the shareholder reports of other funds.
Please note that the expenses shown in the table are meant to highlight your ongoing costs
only and do not reflect any transaction costs, such as sales charges (loads) and redemption
fees. Therefore, the second line under each class of shares in the table is useful in comparing
ongoing costs only, and will not help you determine the relative total costs of owning
different funds. In addition, if these transactional costs were included, your costs would
have been higher.
- 87 -
THE ALGER INSTITUTIONAL FUNDS
ADDITIONAL INFORMATION (Unaudited) (Continued)
| | | | | | | | | | |
| | | | | | | | | Annualized | |
| | | | | | | Expenses | Expense Ratio | |
| | | Beginning | | Ending | Paid During | | For the | |
| | | | Account | | Account | the Six Months | Six Months | |
| | | | Value | | Value | | Ended | | Ended | |
| | | November 1, 2017 | | April 30, 2018 | April 30, 2018(a) | April 30, 2018(b) | |
| Alger Capital Appreciation Institutional Fund | | | | | | | | |
| Class I | Actual | $ | 1,000.00 | $ | 1,062.90 | $ | 5.78 | | 1.13 | % |
| | Hypothetical(c) | | 1,000.00 | | 1,019.19 | | 5.66 | | 1.13 | |
| Class R | Actual | | 1,000.00 | | 1,060.30 | | 8.28 | | 1.62 | |
| | Hypothetical(c) | | 1,000.00 | | 1,016.71 | | 8.10 | | 1.62 | |
| Class Y | Actual | | 1,000.00 | | 1,064.90 | | 3.79 | | 0.74 | |
| | Hypothetical(c) | | 1,000.00 | | 1,021.12 | | 3.71 | | 0.74 | |
| Class Z-2 | Actual | | 1,000.00 | | 1,064.50 | | 4.20 | | 0.82 | |
| | Hypothetical(c) | | 1,000.00 | | 1,020.73 | | 4.11 | | 0.82 | |
| | | | | | | | | | | |
| Alger Capital Appreciation Focus Fund | | | | | | | | | |
| Class A | Actual | $ | 1,000.00 | $ | 1,030.30 | $ | 5.34 | | 1.06 | % |
| | Hypothetical(c) | | 1,000.00 | | 1,019.54 | | 5.31 | | 1.06 | |
| Class C | Actual | | 1,000.00 | | 1,073.70 | | 9.41 | | 1.83 | |
| | Hypothetical(c) | | 1,000.00 | | 1,015.72 | | 9.15 | | 1.83 | |
| Class I | Actual | | 1,000.00 | | 1,088.00 | | 5.23 | | 1.01 | |
| | Hypothetical(c) | | 1,000.00 | | 1,019.79 | | 5.06 | | 1.01 | |
| Class Y | Actual | | 1,000.00 | | 1,089.90 | | 3.37 | | 0.65 | |
| | Hypothetical(c) | | 1,000.00 | | 1,021.57 | | 3.26 | | 0.65 | |
| Class Z | Actual | | 1,000.00 | | 1,089.70 | | 3.68 | | 0.71 | |
| | Hypothetical(c) | | 1,000.00 | | 1,021.32 | | 3.56 | | 0.71 | |
| | | | | | | | | | | |
| Alger Mid Cap Growth Institutional Fund | | | | | | | | | |
| Class I | Actual | $ | 1,000.00 | $ | 1,034.60 | $ | 6.66 | | 1.32 | % |
| | Hypothetical(c) | | 1,000.00 | | 1,018.25 | | 6.61 | | 1.32 | |
| Class R | Actual | | 1,000.00 | | 1,031.90 | | 9.22 | | 1.83 | |
| | Hypothetical(c) | | 1,000.00 | | 1,015.72 | | 9.15 | | 1.83 | |
| Class Z-2 | Actual | | 1,000.00 | | 1,036.20 | | 5.30 | | 1.05 | |
| | Hypothetical(c) | | 1,000.00 | | 1,019.59 | | 5.26 | | 1.05 | |
| | | | | | | | | | | |
| Alger Small Cap Growth Institutional Fund | | | | | | | | | |
| Class I | Actual | $ | 1,000.00 | $ | 1,065.40 | $ | 6.81 | | 1.33 | % |
| | Hypothetical(c) | | 1,000.00 | | 1,018.20 | | 6.66 | | 1.33 | |
| Class R | Actual | | 1,000.00 | | 1,062.50 | | 9.10 | | 1.78 | |
| | Hypothetical(c) | | 1,000.00 | | 1,015.97 | | 8.90 | | 1.78 | |
| Class Z-2 | Actual | | 1,000.00 | | 1,067.10 | | 5.07 | | 0.99 | |
| | Hypothetical(c) | | 1,000.00 | | 1,019.89 | | 4.96 | | 0.99 | |
| | | | | | | | | | | |
(a) Expenses are equal to the annualized expense ratio of the respective share class, multiplied by the average account value over
the period, multiplied by 181/365 (to reflect the one-half year period).
(b) Annualized.
(c) 5% annual return before expenses.
- 88 -
THE ALGER INSTITUTIONAL FUNDS
ADDITIONAL INFORMATION (Unaudited) (Continued)
| | | | |
| Privacy Policy | | | | |
| |
| U. S. Consumer Privacy Notice | Rev. 12/20/16 |
| FACTS | WHAT DOES ALGER DO WITH YOUR PERSONAL INFORMATION? |
| |
| |
| Why? | Financial companies choose how they share your personal information. Federal law |
| | gives consumers the right to limit some but not all sharing. Federal law also requires us |
| | to tell you how we collect, share, and protect your personal information. Please read this |
| | notice carefully to understand what we do. | |
| What? | The types of personal information we collect and share depend on the product or service |
| | you have with us. This information can include: | |
| | • | Social Security number and | |
| | • | Account balances and | |
| | • | Transaction history and | |
| | • | Purchase history and | |
| | • | Assets | | |
| | When you are no longer our customer, we continue to share your information as |
| | described in this notice. | | |
| How? | All financial companies need to share personal information to run their everyday business. |
| | In the section below, we list the reasons financial companies can share personal |
| | information; the reasons Alger chooses to share; and whether you can limit this sharing. |
| |
| Reasons we can share your personal | Does | Can you limit |
| information | | | Alger share? | this sharing? |
| For our everyday business purposes — | Yes | No |
| such as to process your transactions, maintain | | |
| your account(s), respond to court orders and | | |
| legal investigations, or report to credit bureaus | | |
| For our marketing purposes — to offer our | Yes | No |
| products and services to you | | | |
| For joint marketing with other financial | No | We don’t share |
| companies | | | | |
| For our affiliates’ everyday business | Yes | No |
| purposes — information about your | | |
| transactions and experiences | | | |
| For our affiliates’ everyday business | No | We don’t share |
| purposes — information about your | | |
| creditworthiness | | | | |
| For nonaffiliates to market to you | | No | We don’t share |
| Questions? Call 1-800-342-2186 | | | |
- 89 -
THE ALGER INSTITUTIONAL FUNDS
ADDITIONAL INFORMATION (Unaudited) (Continued)
| |
| Who we are | |
| |
| Who is providing this notice? | • Alger includes Fred Alger Management, Inc. and Fred |
| | Alger & Company, Incorporated as well as the following |
| | funds: The Alger Funds, The Alger Funds II, The Alger |
| | Institutional Funds, The Alger Portfolios, and Alger |
| | Global Growth Fund. |
| |
| |
| What we do | |
| How does Alger | To protect your personal information from unauthorized |
| protect my personal | access and use, we use security measures that comply |
| information? | with federal law. These measures include computer |
| | safeguards and secured files and buildings. |
| How does Alger | We collect your personal information, for example, |
| collect my personal | when you: |
| information? | • Open an account or |
| | • Make deposits or withdrawals from your account or |
| | • Give us your contact information or |
| | • Provide account information or |
| | • Pay us by check. |
| |
| |
| Why can’t I limit all sharing? | Federal law gives you the right to limit only |
| | • sharing for affiliates’ everyday business purposes |
| | information about your credit worthiness |
| | • affiliates from using your information to market to you |
| | • sharing for nonaffiliates to market to you |
| | State laws and individual companies may give you |
| | additional rights to limit sharing. |
| |
| |
| Definitions | |
| Affiliates | Companies related by common ownership or control. |
| | They can be financial and nonfinancial companies. |
| | • Our affiliates include Fred Alger Management, Inc. |
| | and Fred Alger & Company, Incorporated as well as the |
| | following funds: The Alger Funds, The Alger Funds II, |
| | The Alger Institutional Funds, The Alger Portfolios, and |
| | Alger Global Growth Fund. |
| Nonaffiliates | Companies not related by common ownership or |
| | control. They can be financial and nonfinancial |
| | companies. |
| Joint marketing | A formal agreement between nonaffiliated financial |
| | companies that together market financial products or |
| | services to you. |
- 90 -
THE ALGER INSTITUTIONAL FUNDS
ADDITIONAL INFORMATION (Unaudited) (Continued)
Proxy Voting Policies
A description of the policies and procedures the Trust uses to determine how to vote
proxies relating to portfolio securities and information regarding how the Fund voted
proxies relating to portfolio securities during the most recent 12-month period ended June
30 are available, without charge, by calling (800) 992-3863 or online on the Funds’ website
at www.alger.com or on the SEC’s website at www.sec.gov.
Fund Holdings
The Board of Trustees has adopted policies and procedures relating to disclosure of the
Funds’ portfolio securities. These policies and procedures recognize that there may be
legitimate business reasons for holdings to be disclosed and seek to balance those interests
to protect the proprietary nature of the trading strategies and implementation thereof by
the Funds.
Generally, the policies prohibit the release of information concerning portfolio holdings
which have not previously been made public to individual investors, institutional investors,
intermediaries that distribute the Funds’ shares and other parties which are not employed
by the Investment Manager or its affiliates except when the legitimate business purposes
for selective disclosure and other conditions (designed to protect the Funds) are acceptable.
The Funds make their full holdings available semi-annually in shareholder reports filed on
Form N-CSR and after the first and third fiscal quarters in regulatory filings on Form N-Q.
These shareholder reports and regulatory filings are filed with the SEC, as required by federal
securities laws, and are generally available within sixty (60) days of the end of the Funds’
fiscal quarter. The Funds’ Forms N-Q are available online on the SEC’s website at www.
sec.gov or may be reviewed and copied at the SEC’s Public Reference Room in Washington,
D.C. Information regarding the operation of the SEC’s Public Reference Room may be
obtained by calling 1-800-SEC-0330.
In addition, the Funds make publicly available their respective month-end top 10 holdings
with a 10 day lag and their month-end full portfolios with a 60 day lag on their website www.
alger.com and through other marketing communications (including printed advertising/
sales literature and/or shareholder telephone customer service centers). No compensation
or other consideration is received for the non-public disclosure of portfolio holdings
information.
In accordance with the foregoing, the Funds provide portfolio holdings information to
service providers who provide necessary or beneficial services when such service providers
need access to this information in the performance of their services and are subject to
duties of confidentiality (1) imposed by law, including a duty not to trade on non-public
information, and/or (2) pursuant to an agreement that confidential information is not to
be disclosed or used (including trading on such information) other than as required by law.
From time to time, the Funds will communicate with these service providers to confirm
that they understand the Funds’ policies and procedures regarding such disclosure. This
- 91 -
THE ALGER INSTITUTIONAL FUNDS
ADDITIONAL INFORMATION (Unaudited) (Continued)
agreement must be approved by the Funds’ Chief Compliance Officer, President, Secretary
or Assistant Secretary.
The Board of Trustees periodically reviews a report disclosing the third parties to whom
each Fund’s holdings information has been disclosed and the purpose for such disclosure,
and it considers whether or not the release of information to such third parties is in the best
interest of the Fund and its shareholders.
In addition to material the Funds routinely provide to shareholders, the Investment Manager
may, upon request, make additional statistical information available regarding the Funds.
Such information will include, but not be limited to, relative weightings and characteristics
of a Fund’s portfolio versus its peers or an index (such as P/E ratio, alpha, beta, capture
ratio, maximum drawdown, standard deviation, EPS forecasts, Sharpe ratio, information
ratio, R-squared, and market cap analysis), security specific impact on overall portfolio
performance, month-end top ten contributors to and detractors from performance,
breakdown of High Unit Volume Growth holdings vs. Positive Lifecycle Change holdings,
portfolio turnover, and requests of a similar nature. Please contact the Funds at (800) 992-
3863 to obtain such information.
- 92 -
THE ALGER INSTITUTIONAL FUNDS
360 Park Avenue South
New York, NY 10010
(800) 992-3863
www.alger.com
Investment Manager
Fred Alger Management, Inc.
360 Park Avenue South
New York, NY 10010
Distributor
Fred Alger & Company, Incorporated
360 Park Avenue South
New York, NY 10010
Transfer Agent and Dividend Disbursing Agent
DST Asset Manager Solutions, Inc.
P.O. Box 8480
Boston, MA 02266
Custodian
Brown Brothers Harriman & Company
50 Post Office Square
Boston, MA 02110
This report is submitted for the general information of the shareholders of The Alger
Institutional Funds. It is not authorized for distribution to prospective investors unless
accompanied by an effective Prospectus for the Trust, which contains information
concerning the Trust’s investment policies, fees and expenses as well as other pertinent
information.
- 93 -

ITEM 2. CODE OF ETHICS.
Not applicable.
ITEM 3. AUDIT COMMITTEE FINANCIAL EXPERT.
Not applicable.
ITEM 4. PRINCIPAL ACCOUNTANT FEES AND SERVICES.
Not applicable.
ITEM 5. AUDIT COMMITTEE OF LISTED REGISTRANTS.
Not applicable.
ITEM 6. INVESTMENTS.
Not applicable.
ITEM 7. DISCLOSURE OF PROXY VOTING POLICIES AND PROCEDURES FOR CLOSED-END MANAGEMENT
INVESTMENT COMPANIES.
Not applicable.
ITEM 8. PORTFOLIO MANAGERS OF CLOSED-END MANAGEMENT INVESTMENT COMPANIES.
Not applicable.
ITEM 9. PURCHASES OF EQUITY SECURITIES BY CLOSED-END MANAGEMENT INVESTMENT COMPANY
AND AFFILIATED PURCHASERS.
Not applicable.
ITEM 10. SUBMISSION OF MATTERS TO A VOTE OF SECURITY HOLDERS.
Not applicable.
ITEM 11. CONTROLS AND PROCEDURES.
(a) The Registrant’s principal executive officer and principal financial officer have concluded that
the Registrant’s disclosure controls and procedures (as defined in Rule 30a-3(c) under the
Investment Company Act of 1940, as amended) are effective based on their evaluation of the
disclosure controls and procedures as of a date within 90 days of the filing date of this document.
(b) No changes in the Registrant’s internal control over financial reporting occurred during the
Registrant’s second fiscal quarter of the period covered by this report that materially affected, or
are reasonably likely to materially affect, the Registrant’s internal control over financial reporting.
ITEM 12. EXHIBITS.
(a) (1) Not applicable
(a) (2) Certifications of principal executive officer and principal financial officer as required by rule 30a-
2(a) under the Investment Company Act of 1940 are attached as Exhibit 99.CERT
(a) (3) Not applicable
(b) Certifications of principal executive officer and principal financial officer as required by rule 30a-2(b)
under the Investment Company Act of 1940 are attached as Exhibit 99.906CERT
SIGNATURES
Pursuant to the requirements of the Securities Exchange Act of 1934 and the Investment Company
Act of 1940, the registrant has duly caused this report to be signed on its behalf by the
undersigned, thereunto duly authorized.
The Alger Institutional Funds
By: /s/Hal Liebes
Hal Liebes
President
Date: June 26, 2018
Pursuant to the requirements of the Securities Exchange Act of 1934 and the Investment Company
Act of 1940, this report has been signed below by the following persons on behalf of the registrant
and in the capacities and on the dates indicated.
By: /s/Hal Liebes
Hal Liebes
President
Date: June 26, 2018
By: /s/Michael D. Martins
Michael D. Martins
Treasurer
Date: June 26, 2018