OMB APPROVAL
OMB Number: 3235-0570
Expires: January 31, 2017
Estimated average burden
hours per response……20.6
UNITED STATES
SECURITIES AND EXCHANGE COMMISSION
Washington, D.C. 20549
FORM N-CSR
CERTIFIED SHAREHOLDER REPORT OF REGISTERED MANAGEMENT
INVESTMENT COMPANIES
Investment Company Act file number 811-07986
The Alger Institutional Funds
(Exact name of registrant as specified in charter)
360 Park Avenue South New York, New York 10010
(Address of principal executive offices) (Zip code)
Mr. Hal Liebes
Fred Alger Management, Inc.
360 Park Avenue South
New York, New York 10010
(Name and address of agent for service)
Registrant's telephone number, including area code: 212-806-8800
Date of fiscal year end: October 31
Date of reporting period: April 30, 2016
ITEM 1. REPORT(S) TO STOCKHOLDERS.
Table of Contents
The Alger Institutional Funds
|
| Shareholders’ Letter | 1 |
| Fund Highlights | 11 |
| Portfolio Summary | 15 |
| Schedules of Investments | 16 |
| Statements of Assets and Liabilities | 37 |
| Statements of Operations | 41 |
| Statements of Changes in Net Assets | 43 |
| Financial Highlights | 47 |
| Notes to Financial Statements | 57 |
| Additional Information | 79 |
Go Paperless With Alger Electronic Delivery Service
Alger is pleased to provide you with the ability to access regulatory materials online.
When documents such as prospectuses and annual and semi-annual reports are
available, we’ll send you an e-mail notification with a convenient link that will take you
directly to the fund information on our website. To sign up for this free service, simply
enroll at www.icsdelivery.com/alger.
Shareholders' Letter April 30, 2016
Dear Shareholders,
Investor Stampede Creates Risks and Opportunities
Gary Larson’s quirky cartoon series “The Far Side” draws chuckles by having animals
exhibit human-like behavior. In one popular cartoon, a massive bison stampede extends
to the horizon. One insightful bison quips to a neighboring beast “As if we all knew where
we’re going.” The six-month reporting period ended April 30 was notable as a period filled
with economic uncertainty, diverging global monetary policies, and significant pressure on
interest rates. As with the cartoon, where this takes us as investors is unclear, yet in such
periods of deep uncertainty we are reminded that the best decisions are those that are the
most thoughtful and not based upon emotion. Many investors, in an unquenchable thirst
for income (and a misguided flight to “safety”) have rushed to bond-like equities, that is,
equities that pay steady dividends. The end result was striking. While the S&P 500 index
gained 0.43%, the Telecomm, Utilities, and Consumer Staples sectors climbed 14.68%,
12.90%, and 6.02%, respectively. These sectors have some of the poorest long-term growth
prospects in the current economic environment. On the other hand, higher growth sectors
like Information Technology, Health Care, and Consumer Discretionary each sustained
losses.
We have learned in our 52 years of investing that there is no free lunch. Success in investing is
not achieved by considering one factor, such as dividend yield, but instead by understanding
companies, their management, their industries, and their competitors. It is with this more
complete view that high-quality companies with strong growth potential can be identified.
Such companies, we maintain, can potentially provide investors with wealth creation from
capital appreciation and with protection from the erosion of inflation upon their savings.
Stampedes, of course, can have dire consequences. The recent investor stampede, we believe,
is dangerous, as investors have increased their exposure to the risk of higher interest rates
and, at the same time, the relatively high valuations of stocks with generally poor growth
prospects. We think the opportunities, long term, lie in the opposite direction. In particular,
these investors may miss the attractive investment opportunities that can be found within the
most vibrant industries in the U.S. and the world. America is seen as a leader in innovation
in the Health Care and IT sectors, and has the richest and most diverse consumer market in
the world. We believe it is within these sectors that superior companies and investments for
long-term growth and capital appreciation can be found.
Investing in overseas markets is more challenging with different dynamics at play. The
widely followed MSCI ACWI ex USA and MSCI Emerging Markets indices declined 1.51%
and 0.01%, respectively, during the reporting period with concerns over commodity prices
contributing to weakening investor sentiment. In many overseas markets, this is entirely
logical as the economies of many countries are strongly tied to their roles as commodities
producers. As in the U.S., defensive sectors tended to outperform abroad. Nevertheless,
international markets also have sectors that offer strong potential for long-term growth.
The rising middle class in many international markets is creating increased demand for
goods and services, which in turn is creating opportunities for leading companies. Our
team of international and emerging markets portfolio managers and analysts has a depth of
- 1 -
experience in navigating foreign markets and identifying through fundamental research high-
quality growth companies across the globe. In these markets, diversification is paramount,
so our international funds are well diversified, typically owning companies across the globe
and across industries.
Oil and the U.S. Economy
From late 2013 until the start of the reporting period, the price of West Texas Intermediate
(WTI) fell from $110.62 a barrel to $46.12. It then declined to a low of $26.19 a barrel as
of February 11, which was a 43.20% drop. The decline was accompanied by an 11.43%
decline of the S&P 500. In both 2015 and early 2016, many investors misread the decline in
oil as a harbinger of a U.S. recession in 2016. We have consistently argued otherwise, noting
that while cheap oil prices would, not surprisingly, drive down earnings in the energy and
closely related sectors, there were broad benefits to the U.S. economy from lower energy
prices. Cheap oil has bolstered Americans’ finances by slashing energy costs and allowing
Americans to strengthen their personal balance sheets by increasing their savings. It has
also supported retail shopping and spending on homes. The U.S. housing market continues
to improve in a steady fashion. Many indicators of consumer spending like ecommerce,
travel, leisure, automotive, and home durables are quite healthy, despite the weakness
reported in headlines about department store sales and the sales of other “old” economy
retailers. Changing patterns of consumer preferences – largely based, in our view, on both
ecommerce technology and on the rise of younger generations of Americans (the X and Y
generations) as the baby boomers increasingly retire – is a large phenomenon that creates
challenges for companies that have failed to adapt to the “new” marketplace and great
opportunities for those that have helped define it in our time. Amazon.com, Inc., Netflix,
Inc., Alphabet, Inc. (formerly Google), and Apple, Inc. are all doing quite well in this new
American marketplace, while the landscape, especially in retail, is littered with companies,
once good or even great, but today struggling to adapt their business models to the new and
obvious reality.
So despite fears, corporate fundamentals are fine in the U.S. S&P 500 earnings ex-materials
and ex-energy grew a healthy 6.3% in 2015, despite the additional headwind of a strong U.S.
dollar weighing on both exports and foreign earnings. For the first quarter of 2016, overall
results for the S&P 500 slowed from that pace, but we expect continued growth in earnings
in 2016 (again, ex-materials and ex-energy, though these might actually contribute to
earnings growth on a reported basis through declining losses in these sectors). We note that
oil appears to have bottomed in February and has since rebounded to close the reporting
period at $45.98. Investor sentiment remains very cautious in our view, and indeed almost
bearish, but there has been a significant rally in equities of late, with the S&P 500 generating
a 13.39% return from February 12 to April 30.
Global Economy Weakens
Concerns over global economic growth continue. In early 2015, the International Monetary
Fund forecasted that the global economy would grow 3.3% in 2015 and 3.8% in 2016. In
October, it lowered those numbers to 3.1% for 2015 and 3.6% for this year. It maintained
its 2015 estimate in January, but lowered its 2016 estimate to 3.4%. Also during the reporting
period, estimates for global corporate earnings per share for the MSCI World Index were
revised downward each month, declining from $106.72 in November to $101.20 as of April
30.
- 2 -
We are encouraged by the actions of many central banks across the globe, including the Bank
of Japan (BOJ), the People’s Bank of China, and the European Central Bank, to provide
additional economic stimulus. The BOJ, for its part, joined a handful of other countries that
have maintained negative interest rates. Many central banks have also expressed a willingness
to provide additional stimulus, and in the U.S., the Federal Reserve is taking a cautious
approach to normalizing monetary policy after raising the fed funds rate in December.
We note, as we did in the fall of 2015 in an Alger market commentary, that monetary
policy is not sufficient to stimulate fundamental, lasting growth in any economy. We hope
to see future governmental actions to improve structural growth in Europe, Asia, and other
foreign markets, and certainly we see that austerity policies are fading globally.
Further, in the significant changes occurring in international markets and economies, we
see many opportunities for investors. Economic and political concerns have dominated
investors’ mindset for a significant time now. But, as in the U.S., there are many companies
forging ahead in their markets and globally, showing both solid earnings growth and strong
fundamentals. We are always on the lookout for companies that are disrupting traditional
business models by exploiting large-scale changes. The internet continues to be an investable
trend but, especially in emerging markets, adoption of Western technology and lifestyles
(whether directly or in copycat fashion) is meeting with notable success in many regions
and sectors.
The U.S. Dollar, Emerging Markets, and Interest Rates
The previous end of the U.S. asset buying program, or quantitative easing, combined with
the Federal Reserve’s start to raising interest rates and anticipation of domestic economic
growth, has supported a strong U.S. dollar, especially relative to countries that have been
increasing monetary stimulus. At the start of the reporting period, the U.S. Dollar Index,
which measures U.S. currency against currencies of trading partners, was at 96.89, up
considerably from 79.14 in early 2014. Later in the reporting period, the Federal Reserve
signaled that it would take a cautious approach to raising interest rates, which caused the
strengthening of the U.S. dollar to moderate slightly, and the U.S. Dollar Index closed the
reporting period at 93.80. As mentioned previously, investors have fretted over the impact
of a strong dollar on U.S. exports and foreign earnings. We think the strong dollar does pose
challenges to U.S. exporters, especially those of undifferentiated commodity-like products
or services. In the end, however, we think U.S. companies with value-added products
and service models that are differentiated from the competition will do fine. Since global
competition is fierce, foreign companies seeking to succeed will invest in superior products
and services that will help them obtain their goals. We think there are many U.S. companies
that offer highly competitive products and services to the global market, even with the
recent disadvantage of a stronger U.S. dollar.
Finally, it’s important to note that the strong U.S. dollar has also driven periods of capital
outflows from countries with weaker currencies, especially emerging markets. We believe
the sensitivity of global markets to the U.S. dollar is likely to cause the Federal Reserve to
exercise extreme caution when normalizing monetary policy. At the same time, an estimated
$8 trillion in debt is trading globally with negative yields. When the Federal Reserve eventually
takes further actions to normalize policy, it’s likely that higher interest rates will attract even
more investors to U.S. debt, which could limit increases in yields here at home.
- 3 -
The Appeal of Growth Equities and the Downside of the Investor Stampede
We believe growth stocks are well positioned to outperform the market and especially bond-
like equites that have recently reached extreme valuations. The recent market action has
left traditional growth stocks at attractive valuations, especially when assessing PEG ratios.
PEG ratios are determined by dividing a company’s price-to-earnings ratio, or P/E, by its
expected earnings growth rate. As of April 30 of this year, the 12-month forward earnings
PEG for the Russell 1000 Growth Index was 42% lower than that of the Russell 1000 Value
Index. For most of 2016, the difference in PEGs has exceeded anything that has occurred
since at least 2002. In addition, bond-like sectors such as Utilities and Consumer Staples
are trading at over a 20% premium to their 20-year average P/E ratio while growth sectors
like Information Technology and Health Care are trading at double-digit discounts. From a
historical perspective, low P/E ratios have typically indicated strong potential for stocks to
outperform and we believe the current valuations of growth stocks are no exception.
Over the long term, equity returns are driven by corporate fundamentals, including earnings
and revenue growth. While dividend yields play an important role in the total return an
investor should expect from equities, it is a mistake, in our view, to focus solely, or overly, on
the dividend yield of a stock itself. It is, after all, a company’s fundamental success growing
its sales and profits that ultimately will deliver the cash flow to support dividends and
future dividend growth. The recent stampede into bond-like equities shows many signs of
investors’ failure to discriminate between companies with strong longer term fundamentals
and those that simply happen to pay a relatively higher dividend yield today. Much like
fixed-income securities, these bond-like equities will be very interest-rate sensitive. Even a
small change in interest rates or inflation could hurt the performance of bond-like stocks,
especially those trading at high valuations with poor growth prospects or leveraged balance
sheets.
Reasons for Optimism
Concerns over global growth are likely to drive market volatility, but we maintain that the
U.S. will continue to be an economic leader. April marked the 74th consecutive month of
private-sector job growth in the U.S., which is an unprecedented accomplishment. Over the
last year, the majority of those who have returned to the labor force have been from among
the long-term unemployed, which is a category of Americans that has traditionally faced
substantial challenges with finding work. In addition to steady job creation, the nation’s
5.0% unemployment rate implies that the job market is healthy. We continue to believe that
low oil prices combined with low inflation and the Federal Reserve’s cautious approach to
raising interest rates will continue to support the country’s economy.
Corporate America is also strong. In the fourth quarter, S&P 500 companies ex-financials
held $1.44 trillion in cash, according to FactSet Research Systems, Inc. The figure represents
a 0.5% year-over-year decline, but is still the third-highest level in 10 years. Fixed capital
expenditures during the quarter also declined when compared to the record level of outlays
during the same quarter of 2014. Yet, the $170.4 billion in outlays for the final quarter
of 2015 represented the third-highest level in 10 years, despite a 41% drop in capital
expenditures by energy companies. Corporations are also buying back stock at a rapid pace,
with approximately 30% of S&P 500 constituents having reduced their share count by at
least 4% during the first quarter, according to S&P Capital IQ.
- 4 -
We urge investors to carefully assess the appeal of growth equities and to evaluate the role
of bond-like equities in their investment strategies. We are in an era of rapid and dynamic
change. New technologies such as the internet, smartphones, ebooks, and social media have
reached 50% market penetration in a fraction of the time that older innovations such as
washing machines, dishwashers, and landline telephones required. Medical innovation in
orthopedic, cardiac, and cancer treatments (to name only a few) has advanced and will
continue to advance in ways that were unimaginable only a generation or so ago. We think
every prudent, long-term investor should have a portfolio “overweight” in the industries,
companies, and trends that are changing nearly every aspect of modern day life.
Portfolio Matters
Alger Capital Appreciation Institutional Fund
The Alger Capital Appreciation Institutional Fund returned -4.12% for the fiscal six-month
period ended April 30, 2016, compared to the -1.37% return of the Russell 1000 Growth
Index.
During the period, the largest sector weightings were Information Technology and
Consumer Discretionary. The largest sector overweight was Information Technology
and the largest sector underweight was Consumer Staples. Stock selection resulted in the
Consumer Discretionary sector contributing to relative performance, while other sectors
detracted from results.
Among the most important relative contributors were Apple, Inc.; Newell Brands, Inc.;
Honeywell International, Inc.; and Edwards Lifesciences Corp. Shares of social network
provider Facebook, Inc., Cl. A also contributed to performance. Facebook performed
strongly in response to the company’s social network continuing to take advertising market
share from print and television media. We believe investors were also encouraged by the
growth of Instagram, which is the company’s video- and photo-sharing network, and by the
potential for Facebook to further grow advertising revenues.
Conversely, detracting from overall results on a relative basis were Allergan PLC.; Vertex
Pharmaceuticals, Inc.; Norwegian Cruise Line Holdings Ltd.; and Anadarko Petroleum
Corp. Also detracting from performance were shares of LinkedIn Corporation Cl A. The
company operates the world’s largest social network for professionals and provides services
for recruiters and human resource professionals. LinkedIn also offers digital advertising and
premium memberships. During the first quarter, the company disclosed disappointing sales
and it provided weak profit guidance. It said Europe and Asia were weak areas.
Alger Capital Appreciation Focus Fund
The Alger Capital Appreciation Focus Fund returned -4.28% for the fiscal six-month period
ended April 30, 2016, compared to the -1.37% return of its benchmark, the Russell 1000
Growth Index.
During the reporting period, the largest sector weightings were Information Technology
and Health Care. The largest sector overweight was Information Technology and the largest
sector underweight was Consumer Staples. Relative outperformance in the Information
Technology and Industrials sectors was the most important contributor to performance,
while Health Care and Financials were among sectors that detracted from results.
- 5 -
Among the most important relative contributors were Apple, Inc.; Honeywell International,
Inc.; Newell Brands, Inc.; and HD Supply Holdings, Inc. Shares of social network provider
Facebook, Inc., Cl. A also contributed to performance. The stock performed strongly
in response to reasons identified in the Alger Capital Appreciation Institutional Fund
discussion.
Conversely, detracting from overall results on a relative basis were Norwegian Cruise Line
Holdings Ltd.; Vertex Pharmaceuticals, Inc.; Delphi Automotive PLC.; and Shire PLC. Shares
of Allergan PLC. also detracted from results. The company manufactures and distributes
both branded and generic pharmaceuticals globally. With an upcoming presidential
election, investors were concerned that increased government regulatory intervention could
negatively affect the company’s closing of a planned merger with Pfizer, Inc. The deal was
eventually halted by regulators.
Alger Mid Cap Growth Institutional Fund
The Alger Mid Cap Growth Institutional Fund returned -6.12% for the fiscal six-month
period ended April 30, 2016, compared to the -1.54% return of Russell Midcap Growth
Index.
During the reporting period, the largest sector weightings were Consumer Discretionary
and Information Technology. The largest sector overweight was Information Technology
and the largest sector underweight was Consumer Staples. Stock selection in the Consumer
Discretionary, Materials and Energy sectors contributed to relative performance, while
Health Care and Information Technology were among sectors that detracted from results.
Among the most important relative contributors were Newell Brands, Inc.; Broadcom Ltd.;
Coach, Inc.; and CBS Corp., Cl. B. Shares of HD Supply Holdings, Inc. also contributed to
performance. HD Supply Holdings is an industrial distributor of products for infrastructure,
housing, commercial buildings, and other construction applications. During the first quarter,
investors responded favorably to the healthy residential housing market and stronger-than-
expected guidance from the company. Investors also responded favorably to the company
refinancing expensive debt.
Conversely, detracting from overall results on a relative basis were NetScout Systems,
Inc.; Norwegian Cruise Line Holdings Ltd.; Portola Pharmaceuticals, Inc.; and DexCom,
Inc. Shares of Royal Caribbean Cruises Ltd. also detracted from results. Royal Caribbean
is a leading cruise operator. Investor concerns over the impact of a potential economic
slowdown on consumer cyclicals caused shares of Royal Caribbean to underperform.
We believe investors’ outlook for the economy has improved, but performance of Royal
Caribbean stock did not initially bounce back, perhaps because of concerns over terrorism.
Alger Small Cap Growth Institutional Fund
The Alger Small Cap Growth Institutional Fund returned -9.54% for the fiscal six-month
period ended April 30, 2016, compared to the -4.96 % return of the Russell 2000 Growth
Index.
During the period, the largest sector weightings were Information Technology and Health
Care. The largest sector overweight was Information Technology and the largest sector
underweight was Consumer Discretionary. The Energy and Health Care sectors provided
- 6 -
the largest contributions to relative performance, while Information Technology and
Consumer Discretionary were among sectors that detracted from results.
Among the most important relative contributors were CyrusOne, Inc.; PRA Health Sciences,
Inc.; Sun Hydraulics Corp.; and FEI Co. Shares of Burlington Stores, Inc. also contributed
to performance. Burlington Stores is a retailer of branded clothing and other apparel in
the U.S. The company’s off-price retail model has benefitted from a lackluster economic
environment highlighted by wages not keeping pace with increasing clothing prices. As a
result, Burlington reported revenues that were in line with expectations and earnings growth
for 2015 despite weak fourth-quarter margins due in part to mild fall and winter weather
hurting sales of warm clothing.
Conversely, detracting from overall results on a relative basis were WisdomTree Investments,
Inc.; Proofpoint, Inc.; and Incyte Corp. Shares of SPS Commerce, Inc. also detracted from
results. The company offers cloud-based software that enhances how suppliers, retailers,
and distributors manage and fulfill customer orders. The company reported fourth-quarter
earnings that were slightly above expectations, but it issued disappointing guidance for
2016. This past quarter, management said the company faced challenges in hiring additional
salespeople due to the improving labor market; therefore, SPS Commerce expects to ramp
up hiring this year, which could delay re-acceleration in recurring revenue growth.
I thank you for putting your trust in Alger.

Daniel C. Chung, CFA
Chief Investment Officer
Fred Alger Management, Inc.
As of April 30, 2016, the following companies represented the stated percentages of Alger
assets under management: Amazon.com, Inc., 3.56%; Netflix, Inc.; 0.27%; Alphabet, Inc.;
(formerly Google), 05.81%; and Apple, Inc., 4.15%.
Investors cannot invest directly in an index. Index performance does not
reflect the deduction for fees, expenses or taxes.
This report and the financial statements contained herein are submitted for the general
information of shareholders of the funds. This report is not authorized for distribution to
prospective investors in a fund unless preceded or accompanied by an effective prospectus
for the fund. Fund returns represent the fiscal period return of Class I shares.
The performance data quoted represent past performance, which is not an
indication or guarantee of future results.
Standardized performance results can be found on the following pages. The investment
return and principal value of an investment in a fund will fluctuate so that an investor’s shares,
when redeemed, may be worth more or less than their original cost. Current performance
- 7 -
may be lower or higher than the performance quoted. For performance data current to the
most recent month-end, visit us at www.alger.com, or call us at (800) 992-3863.
The views and opinions of the funds’ management in this report are as of the date of the
Shareholders’ Letter and are subject to change at any time subsequent to this date. There
is no guarantee that any of the assumptions that formed the basis for the opinions stated
herein are accurate or that they will materialize. Moreover, the information forming the
basis for such assumptions is from sources believed to be reliable; however, there is no
guarantee that such information is accurate. Any securities mentioned, whether owned in a
fund or otherwise, are considered in the context of the construction of an overall portfolio
of securities and therefore reference to them should not be construed as a recommendation
or offer to purchase or sell any such security. Inclusion of such securities in a fund and
transactions in such securities, if any, may be for a variety of reasons, including, without
limitation, in response to cash flows, inclusion in a benchmark, and risk control. The
reference to a specific security should also be understood in such context and not viewed as
a statement that the security is a significant holding in a fund. Please refer to the Schedules
of Investments for each fund that is included in this report for a complete list of fund
holdings as of April 30, 2016. Securities mentioned in the Shareholders’ Letter, if not found
in the Schedule of Investments, may have been held by the funds during the six-month
period.
A Word about Risk
Growth stocks tend to be more volatile than other stocks as the price of growth stocks tends
to be higher in relation to their companies’ earnings and may be more sensitive to market,
political and economic developments. Investing in the stock market involves gains and
losses and may not be suitable for all investors. Stocks of small- and mid-sized companies
are subject to greater risk than stocks of larger, more established companies owing to such
factors as limited liquidity, inexperienced management, and limited financial resources.
Funds that participate in leveraging, such as the Capital Appreciation Institutional Fund, are
subject to the risk that the cost of borrowing money to leverage will exceed the returns for
securities purchased or that the securities purchased may actually go down in value; thus, a
fund’s net asset value can decrease more quickly than if the fund had not borrowed.
A small investment in derivatives could have a potentially large impact on a fund’s
performance. When purchasing options, a fund bears the risk that if the market value of
the underlying security does not move to a level that would make exercise of the option
profitable, the option will expire unexercised. When a call option written by a fund is
exercised, the fund will not participate in any increase in the underlying security’s value
above the exercise price. When a put option written by a fund is exercised, the fund will
be required to purchase the underlying security at a price in excess of its market value. Use
of options on securities indexes is subject to the risk that trading in the options may be
interrupted if trading in certain securities included in the index is interrupted, the risk that
price movements in a fund’s portfolio securities may not correlate precisely with movements
in the level of an index, and the risk that Fred Alger Management, Inc. may not predict
correctly movements in the direction of a particular market or of the stock market generally.
- 8 -
Because certain options may require settlement in cash, a fund may be forced to liquidate
portfolio securities to meet settlement obligations. For a more detailed discussion of the
risks associated with these funds, please see the prospectus.
Before investing, carefully consider a fund’s investment objective, risks, charges,
and expenses. For a prospectus or a summary prospectus containing this and other
information about The Alger Institutional Funds call us at (800) 992-3863 or visit us
at www.alger.com. Read it carefully before investing.
Fred Alger & Company, Incorporated, Distributor. Member NYSE Euronext,
SIPC.
NOT FDIC INSURED. NOT BANK GUARANTEED. MAY LOSE VALUE.
Definitions:
• S&P 500 index: An index of large company stocks considered representative
of the U.S. stock market.
• Morgan Stanley Capital International (MSCI) All Country World Index
(ACWI) ex USA is an unmanaged, market capitalization-weighted index de-
signed to provide a broad measure of equity market performance throughout
the world, including both developing and emerging markets, but excluding
the United States.
• MSCI Emerging Markets Index: A free float-adjusted market capitalization
index designed to measure equity market performance in the global emerging
markets.
• Russell 3000 Growth Index: An index of common stocks designed to track
performance of companies with greater than average growth orientation in
general.
• Russell 1000 Growth Index: An index of common stocks designed to track
performance of large-capitalization companies with greater than average
growth orientation.
• Russell 1000 Value Index: An index designed to track the performance of
large-capitalization stocks that have value characteristics.
• Russell Midcap Growth Index: An index of common stocks designed to
track performance of medium-capitalization companies with greater than
average growth orientation.
• Russell 2000 Growth Index: An index of common stocks designed to track
performance of small-capitalization companies with greater than average
growth orientation.
• The MSCI World Index: An index that captures large and mid cap repre-
sentation across 23 Developed Markets (DM) countries. The index covers
approximately 85% of the free float-adjusted market capitalization in each
country.
• FactSet Research Systems, Inc. is a multinational financial data and software
company.
• S&P Capital IQ provides research, data, and analysis on capital markets and
- 9 -
other topics for investment managers, investment banks, private equity funds,
advisory firms, corporations and universities.
• The U.S. Dollar Index measures US currency against currencies of trading
partners.
| | | | | | | | | |
| FUND PERFORMANCE AS OF 3/31/16 (Unaudited) |
| AVERAGE ANNUAL TOTAL RETURNS |
| | | 1 | | 5 | | 10 | | SINCE | |
| | | YEAR | | YEARS | | YEARS | | INCEPTION | |
| Alger Capital Appreciation Class I (Inception 11/8/93) | | (2.10 | )% | 11.41 | % | 9.76 | % | 11.63 | % |
| Alger Capital Appreciation Class R (Inception 1/27/03)* | | (2.56 | )% | 10.86 | % | 9.21 | % | 11.07 | % |
| |
| Alger Capital Appreciation Focus Class A (Inception | | | | | | | | | |
| 12/31/12) | | (6.53 | )% | n/a | | n/a | | 13.67 | % |
| Alger Capital Appreciation Focus Class C (Inception | | | | | | | | | |
| 12/31/12) | | (3.03 | )% | n/a | | n/a | | 14.70 | % |
| Alger Capital Appreciation Focus Class I (Inception | | | | | | | | | |
| 11/8/93) | | (1.22 | )% | 10.49 | % | 6.03 | % | 8.18 | % |
| Alger Capital Appreciation Focus Class Z (Inception | | | | | | | | | |
| 12/31/12) | | (0.96 | )% | n/a | | n/a | | 16.03 | % |
| |
| Alger Mid Cap Growth Class I (Inception 11/8/93) | | (12.45 | )% | 6.51 | % | 4.30 | % | 11.28 | % |
| Alger Mid Cap Growth Class R (Inception 1/27/03)* | | (12.95 | )% | 5.95 | % | 3.76 | % | 10.72 | % |
| |
| Alger Small Cap Growth Class I (Inception 11/8/93) | | (17.72 | )% | 3.23 | % | 4.20 | % | 8.18 | % |
| Alger Small Cap Growth Class R (Inception 1/27/03)* | | (18.16 | )% | 2.71 | % | 3.69 | % | 7.66 | % |
The performance data quoted represents past performance, which is not an indication or a guarantee of future
results. The Fund’s average annual total returns include changes in share price and reinvestment of dividends
and capital gains.
* Since inception performance is calculated from 11/08/93. Performance figures prior to 1/27/03, inception of Class R shares,
are those of the Fund's Class I Shares. The performance figures prior to 1/27/03 have been reduced to reflect the higher
operating expenses of Class R shares.
- 10 -
ALGER CAPITAL APPRECIATION INSTITUTIONAL FUND
Fund Highlights Through April 30, 2016 (Unaudited)
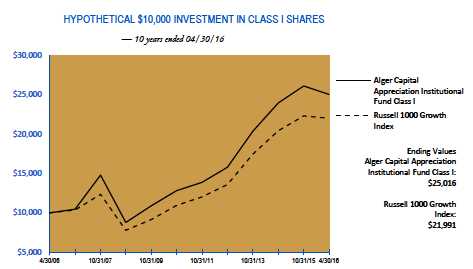
The chart above illustrates the change in value of a hypothetical $10,000 investment made in the Alger Capital
Appreciation Institutional Fund Class I shares and the Russell 1000 Growth Index (an unmanaged index of common
stocks) for the ten years ended April 30, 2016. Figures for the Alger Capital Appreciation Institutional Fund Class
I shares and the Russell 1000 Growth Index include reinvestment of dividends. Performance for the Alger Capital
Appreciation Institutional Fund Class R shares may vary from the results shown above due to differences in expenses
the class bears. Investors cannot invest directly in any index. Index performance does not reflect deduction for fees,
expenses, or taxes.
| | | | | | | | |
| PERFORMANCE COMPARISON AS OF 4/30/16 |
| AVERAGE ANNUAL TOTAL RETURNS |
| | | | | | | | Since | |
| | 1 YEAR | | 5 YEARS | | 10 YEARSr | | 11/8/1993 | |
| Class I (Inception 11/8/93) | (2.34 | )% | 10.34 | % | 9.60 | % | 11.53 | % |
| Class R (Inception 1/27/03)* | (2.82 | )% | 9.79 | % | 9.05 | % | 10.97 | % |
| Russell 1000 Growth Index | 1.07 | % | 11.44 | % | 8.20 | % | 8.51 | % |
The performance data quoted represents past performance, which is not an indication or a guarantee of future results. The Fund’s
average annual total returns include changes in share price and reinvestment of dividends and capital gains. The chart and table above
do not reflect the deduction of taxes that a shareholder would have paid on Fund distributions or on the redemption of Fund shares.
Investment return and principal will fluctuate and the Fund’s shares, when redeemed, may be worth more or less than their original cost.
Current performance may be higher or lower than the performance quoted. For updated performance, visit us at www.alger.com or call
us at (800) 992-3863.
* Since inception performance is calculated from 11/08/93. Performance figures prior to 1/27/03, inception of Class R
shares, are those of the Fund's Class I Shares. The performance figures prior to 1/27/03 have been reduced to reflect the
higher operating expenses of Class R shares.
- 11 -
ALGER CAPITAL APPRECIATION FOCUS FUND
Fund Highlights Through April 30, 2016 (Unaudited)

The chart above illustrates the change in value of a hypothetical $10,000 investment made in the Alger Capital
Appreciation Focus Fund Class I shares and the Russell 1000 Growth Index (an unmanaged index of common
stocks) for the ten years ended April 30, 2016. Beginning December 31, 2012 Alger Capital Appreciation Focus
Fund changed its investment strategy to invest a substantial portion of its assets in a small number of issuers. The
figures for the Alger Capital Appreciation Focus Fund Class I shares and the Russell 1000 Growth Index include
reinvestment of dividends. Performance for the Alger Capital Appreciation Focus Fund Class A, Class C and Class Z
shares may vary from the results shown above due to differences in expenses the class bears. Investors cannot invest
directly in any index. Index performance does not reflect deduction for fees, expenses, or taxes.
| | | | | | | | |
| PERFORMANCE COMPARISON AS OF 4/30/16 |
| AVERAGE ANNUAL TOTAL RETURNS |
| | | | | | | | Since | |
| | 1 YEAR | | 5 YEARS | | 10 YEARS | | 11/8/1993 | |
| Class I (Inception 11/8/93) | (2.67 | )% | 9.42 | % | 5.71 | % | 8.06 | % |
| Russell 1000 Growth Index | 1.07 | % | 11.44 | % | 8.20 | % | 8.51 | % |
| |
| | | | | | | | Since | |
| | 1 YEAR | | 5 YEARS | | 10 YEARS | | 12/31/2012 | |
| Class A (Inception 12/31/12) | (7.92 | )% | n/a | | n/a | | 12.69 | % |
| Class C (Inception 12/31/12) | (4.45 | )% | n/a | | n/a | | 13.68 | % |
| Class Z (Inception 12/31/12) | (2.40 | )% | n/a | | n/a | | 14.98 | % |
| Russell 1000 Growth Index | 1.07 | % | n/a | | n/a | | 14.99 | % |
The performance data quoted represents past performance, which is not an indication or a guarantee of future results. The Fund’s
average annual total returns include changes in share price and reinvestment of dividends and capital gains. The chart and table above
do not reflect the deduction of taxes that a shareholder would have paid on Fund distributions or on the redemption of Fund shares.
Investment return and principal will fluctuate and the Fund’s shares, when redeemed, may be worth more or less than their original cost.
Current performance may be higher or lower than the performance quoted. For updated performance, visit us at www.alger.com or call
us at (800) 992-3863.
- 12 -
ALGER MID CAP GROWTH INSTITUTIONAL FUND
Fund Highlights Through April 30, 2016 (Unaudited)
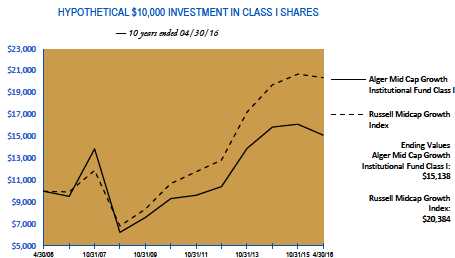
The chart above illustrates the change in value of a hypothetical $10,000 investment made in the Alger Mid Cap
Growth Institutional Fund Class I shares and the Russell Midcap Growth Index (an unmanaged index of common
stocks) for the ten years ended April 30, 2016. Figures for the Alger Mid Cap Growth Institutional Fund Class I
shares and the Russell Midcap Growth Index include reinvestment of dividends. Performance for the Alger Mid Cap
Growth Institutional Fund Class R shares may vary from the results shown above due to differences in expenses
the class bears. Investors cannot invest directly in any index. Index performance does not reflect deduction for fees,
expenses, or taxes.
| | | | | | | | |
| PERFORMANCE COMPARISON AS OF 4/30/16 |
| AVERAGE ANNUAL TOTAL RETURNS |
| | | | | | | | Since | |
| | 1 YEAR | | 5 YEARS | | 10 YEARS | | 11/8/1993 | |
| Class I (Inception 11/8/93) | (11.09 | )% | 5.53 | % | 4.23 | % | 11.21 | % |
| Class R (Inception 1/27/03)* | (11.54 | )% | 4.99 | % | 3.70 | % | 10.65 | % |
| Russell Midcap Growth Index | (4.13 | )% | 9.20 | % | 7.38 | % | 9.12 | % |
The performance data quoted represents past performance, which is not an indication or a guarantee of future results. The Fund’s
average annual total returns include changes in share price and reinvestment of dividends and capital gains. The chart and table above
do not reflect the deduction of taxes that a shareholder would have paid on Fund distributions or on the redemption of Fund shares.
Investment return and principal will fluctuate and the Fund’s shares, when redeemed, may be worth more or less than their original cost.
Current performance may be higher or lower than the performance quoted. For updated performance, visit us at www.alger.com or call
us at (800) 992-3863.
* Since inception performance is calculated from 11/08/93. Performance figures prior to 1/27/03, inception of Class R
shares, are those of the Fund's Class I Shares. The performance figures prior to 1/27/03 have been reduced to reflect the
higher operating expenses of Class R shares.
- 13 -
ALGER SMALL CAP GROWTH INSTITUTIONAL FUND
Fund Highlights Through April 30, 2016 (Unaudited)
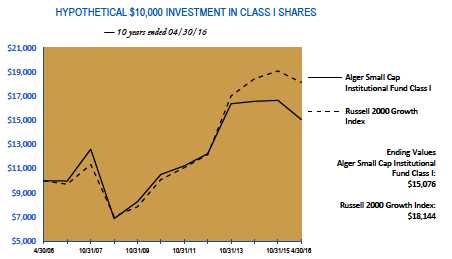
The chart above illustrates the change in value of a hypothetical $10,000 investment made in the Alger Small Cap
Growth Institutional Fund Class I shares and the Russell 2000 Growth Index (an unmanaged index of common
stocks) for the ten years ended April 30, 2016. The figures for the Alger Small Cap Growth Institutional Fund Class
I shares and the Russell 2000 Growth Index include reinvestment of dividends. Performance for the Alger Small
Cap Growth Institutional Fund Class R shares may vary from the results shown above due to differences in expenses
the class bears. Investors cannot invest directly in any index. Index performance does not reflect deduction for fees,
expenses, or taxes.
| | | | | | | | |
| PERFORMANCE COMPARISON AS OF 4/30/16 |
| AVERAGE ANNUAL TOTAL RETURNS |
| | | | | | | | Since | |
| | 1 YEAR | | 5 YEARS | | 10 YEARS | | 11/8/1993 | |
| Class I (Inception 11/8/93) | (13.72 | )% | 2.53 | % | 4.19 | % | 8.20 | % |
| Class R (Inception 1/27/03)* | (14.17 | )% | 2.03 | % | 3.68 | % | 7.68 | % |
| Russell 2000 Growth Index | (8.27 | )% | 7.15 | % | 6.14 | % | 6.62 | % |
The performance data quoted represents past performance, which is not an indication or a guarantee of future results. The Fund’s
average annual total returns include changes in share price and reinvestment of dividends and capital gains. The chart and table above
do not reflect the deduction of taxes that a shareholder would have paid on Fund distributions or on the redemption of Fund shares.
Investment return and principal will fluctuate and the Fund’s shares, when redeemed, may be worth more or less than their original cost.
Current performance may be higher or lower than the performance quoted. For updated performance, visit us at www.alger.com or call
us at (800) 992-3863.
* Since inception performance is calculated from 11/08/93. Performance figures prior to 1/27/03, inception of Class R
shares, are those of the Fund's Class I Shares. The performance figures prior to 1/27/03 have been reduced to reflect the
higher operating expenses of Class R shares.
- 14 -
PORTFOLIO SUMMARY†
April 30, 2016 (Unaudited)
| | | | | | | | | | | | | |
| | | Alger Capital | | | | | | | | | | | |
| | | Appreciation Institutional | | | Alger Capital | | | Alger Mid Cap Growth | | | Alger Small Cap Growth | |
| SECTORS | | Fund | | | Appreciation Focus Fund | | | Institutional Fund | | | Institutional Fund | |
| Consumer Discretionary | | 18.4 | % | | 20.1 | % | | 27.1 | % | | 12.0 | % |
| Consumer Staples | | 8.2 | | | | 3.7 | | | 5.0 | | | 1.7 | |
| Energy | | 1.6 | | | | 1.4 | | | 1.0 | | | 1.6 | |
| Financials | | 3.1 | | | | 5.0 | | | 7.7 | | | 8.1 | |
| Health Care | | 18.3 | | | 18.0 | | | 15.7 | | | 28.7 | |
| Industrials | | 10.7 | | | | 8.3 | | | 15.9 | | | 10.3 | |
| Information Technology | | 33.1 | | | 36.8 | | | 22.4 | | | 31.7 | |
| Materials | | 1.2 | | | | 0.7 | | | 4.8 | | | 3.0 | |
| Telecommunication Services | 1.9 | | | | 1.5 | | | 0.0 | | | 0.0 | |
| Short-Term Investments and | | | | | | | | | | | | | |
| Net Other Assets | | 3.5 | | | | 4.5 | | | 0.4 | | | 2.9 | |
| | | 100.0 | % | | 100.0 | % | | 100.0 | % | | 100.0 | % |
| |
| † Based on net assets for each Fund | | | | | | | | | | | |
- 15 -
THE ALGER INSTITUTIONAL FUNDS |
ALGER CAPITAL APPRECIATION INSTITUTIONAL FUND
Schedule of Investments April 30, 2016 (Unaudited)
| | | | | | |
| COMMON STOCKS—94.4% | | SHARES | | | | VALUE |
| ADVERTISING—0.0% | | | | | | |
| Choicestream, Inc.*,@,(a) | | 124,658 | $ | 52,356 |
| AEROSPACE & DEFENSE—5.1% | | | | | | |
| Honeywell International, Inc. | | 1,180,459 | | | 134,891,050 |
| Lockheed Martin Corp. | | 98,571 | | | | 22,905,929 |
| The Boeing Co. | | 175,763 | | | | 23,692,852 |
| TransDigm Group, Inc.* | | 15,600 | | | | 3,554,772 |
| | | | | | 185,044,603 |
| AIRLINES—1.2% | | | | | | |
| Delta Air Lines, Inc. | | 579,700 | | | | 24,156,099 |
| Southwest Airlines Co | | 424,500 | | | | 18,936,945 |
| Spirit Airlines, Inc.* | | 36,500 | | | | 1,603,445 |
| | | | | | 44,696,489 |
| ALTERNATIVE CARRIERS—0.6% | | | | | | |
| Level 3 Communications, Inc.* | | 416,109 | | | 21,745,856 |
| APPAREL ACCESSORIES & LUXURY GOODS—0.6% | | | | | | |
| Hanesbrands, Inc. | | 316,500 | | | | 9,187,995 |
| PVH Corp. | | 100,500 | | | | 9,607,800 |
| Under Armour, Inc., Cl. A* | | 59,500 | | | | 2,614,430 |
| | | | | | 21,410,225 |
| APPLICATION SOFTWARE—2.2% | | | | | | |
| Adobe Systems, Inc.* | | 357,554 | | | | 33,688,738 |
| salesforce.com, inc.* | | 625,234 | | | | 47,392,737 |
| | | | | | 81,081,475 |
| AUTO PARTS & EQUIPMENT—1.4% | | | | | | |
| Delphi Automotive PLC. | | 595,027 | | | | 43,811,838 |
| WABCO Holdings, Inc.* | | 60,300 | | | | 6,763,248 |
| | | | | | 50,575,086 |
| AUTOMOBILE MANUFACTURERS—0.1% | | | | | | |
| Tesla Motors, Inc.* | | 15,800 | | | | 3,804,008 |
| BIOTECHNOLOGY—4.7% | | | | | | |
| ACADIA Pharmaceuticals, Inc.* | | 286,100 | | | | 9,241,030 |
| Biogen, Inc.* | | 122,045 | | | | 33,561,155 |
| BioMarin Pharmaceutical, Inc.* | | 266,130 | | | | 22,535,888 |
| Celgene Corp.* | | 420,690 | | | | 43,503,553 |
| Gilead Sciences, Inc. | | 363,022 | | | | 32,022,171 |
| Incyte Corp.* | | 75,798 | | | | 5,477,921 |
| Vertex Pharmaceuticals, Inc.* | | 286,718 | | | | 24,181,796 |
| | | | | | 170,523,514 |
| BREWERS—1.5% | | | | | | |
| Molson Coors Brewing Co., Cl. B | | 571,576 | | | 54,659,813 |
| BROADCASTING—1.5% | | | | | | |
| CBS Corp., Cl. B | | 1,003,000 | | | 56,077,730 |
| BUILDING PRODUCTS—0.3% | | | | | | |
| Fortune Brands Home & Security, Inc. | | 183,497 | | | | 10,167,569 |
| Lennox International, Inc. | | 13,684 | | | | 1,846,656 |
| | | | | | 12,014,225 |
- 16 -
THE ALGER INSTITUTIONAL FUNDS |
ALGER CAPITAL APPRECIATION INSTITUTIONAL FUND
Schedule of Investments April 30, 2016 (Unaudited) (Continued)
| | | | | | |
| COMMON STOCKS—(CONT.) | | SHARES | | | | VALUE |
| CABLE & SATELLITE—1.7% | | | | | | |
| Comcast Corporation, Cl. A | | 1,022,820 | $ | | 62,146,543 |
| CASINOS & GAMING—0.2% | | | | | | |
| Las Vegas Sands Corp. | | 120,700 | | | | 5,449,605 |
| COMMUNICATIONS EQUIPMENT—0.3% | | | | | | |
| Arista Networks, Inc.* | | 106,330 | | | | 7,083,705 |
| Cisco Systems, Inc. | | 144,400 | | | | 3,969,556 |
| | | | | | | 11,053,261 |
| CONSUMER FINANCE—0.1% | | | | | | |
| LendingClub Corp.* | | 397,300 | | | | 3,138,670 |
| DATA PROCESSING & OUTSOURCED SERVICES—4.0% | | | | | | |
| Alliance Data Systems Corp.* | | 18,427 | | | | 3,746,394 |
| Sabre Corp. | | 682,740 | | | | 19,765,323 |
| Visa, Inc., Cl. A | | 1,562,555 | | | 120,691,748 |
| | | | | | 144,203,465 |
| DIVERSIFIED CHEMICALS—0.2% | | | | | | |
| EI Du Pont de Nemours & Co. | | 118,400 | | | | 7,803,744 |
| DRUG RETAIL—1.5% | | | | | | |
| CVS Caremark Corp. | | 418,108 | | | | 42,019,854 |
| Walgreens Boots Alliance, Inc. | | 170,293 | | | | 13,500,829 |
| | | | | | 55,520,683 |
| ELECTRICAL COMPONENTS & EQUIPMENT—0.4% | | | | | | |
| Eaton Corp., PLC. | | 213,500 | | | 13,508,145 |
| ENVIRONMENTAL & FACILITIES SERVICES—0.4% | | | | | | |
| Stericycle, Inc.* | | 168,400 | | | 16,092,304 |
| FOOD RETAIL—0.6% | | | | | | |
| The Kroger Co. | | 575,252 | | | 20,358,168 |
| GENERAL MERCHANDISE STORES—0.9% | | | | | | |
| Dollar General Corp. | | 217,429 | | | | 17,809,609 |
| Dollar Tree, Inc.* | | 163,721 | | | | 13,050,201 |
| | | | | | 30,859,810 |
| HEALTH CARE EQUIPMENT—3.2% | | | | | | |
| Boston Scientific Corp.* | | 991,300 | | | | 21,729,296 |
| DexCom, Inc.* | | 188,100 | | | | 12,109,878 |
| Edwards Lifesciences Corp.* | | 273,000 | | | | 28,995,330 |
| Medtronic PLC. | | 234,900 | | | | 18,592,335 |
| STERIS PLC. | | 335,700 | | | | 23,723,919 |
| Stryker Corp. | | 111,300 | | | | 12,132,813 |
| | | | | | 117,283,571 |
| HEALTH CARE FACILITIES—0.7% | | | | | | |
| Acadia Healthcare Co., Inc.* | | 47,000 | | | | 2,969,930 |
| Amsurg Corp.* | | 120,300 | | | | 9,741,894 |
| HCA Holdings, Inc.* | | 170,047 | | | | 13,709,189 |
| | | | | | 26,421,013 |
| HOME ENTERTAINMENT SOFTWARE—1.0% | | | | | | |
| Activision Blizzard, Inc. | | 165,954 | | | | 5,720,434 |
| Electronic Arts, Inc.* | | 502,800 | | | | 31,098,180 |
| | | | | | 36,818,614 |
- 17 -
THE ALGER INSTITUTIONAL FUNDS |
ALGER CAPITAL APPRECIATION INSTITUTIONAL FUND
Schedule of Investments April 30, 2016 (Unaudited) (Continued)
| | | | | | |
| COMMON STOCKS—(CONT.) | | SHARES | | | | VALUE |
| HOME IMPROVEMENT RETAIL—0.8% | | | | | | |
| The Home Depot, Inc. | | 220,807 | $ | | 29,563,849 |
| HOTELS RESORTS & CRUISE LINES—1.4% | | | | | | |
| Ctrip.com International Ltd.#* | | 299,894 | | | | 13,078,377 |
| Norwegian Cruise Line Holdings Ltd.* | | 486,000 | | | | 23,760,540 |
| Royal Caribbean Cruises Ltd. | | 189,300 | | | | 14,651,820 |
| | | | | | 51,490,737 |
| HOUSEWARES & SPECIALTIES—1.9% | | | | | | |
| Newell Brands, Inc. | | 1,534,493 | | | | 69,880,811 |
| HYPERMARKETS & SUPER CENTERS—0.5% | | | | | | |
| Costco Wholesale Corp. | | 123,000 | | | 18,219,990 |
| INDUSTRIAL CONGLOMERATES—0.8% | | | | | | |
| 3M Co. | | 70,100 | | | | 11,733,338 |
| General Electric Co. | | 584,189 | | | | 17,963,812 |
| | | | | | 29,697,150 |
| INDUSTRIAL GASES—0.2% | | | | | | |
| Air Products & Chemicals, Inc. | | 39,027 | | | | 5,693,649 |
| INTEGRATED OIL & GAS—0.3% | | | | | | |
| TOTAL SA# | | 207,400 | | | 10,525,550 |
| INTEGRATED TELECOMMUNICATION SERVICES—1.3% | | | | | | |
| AT&T, Inc. | | 661,400 | | | | 25,675,548 |
| Verizon Communications, Inc. | | 433,600 | | | | 22,087,584 |
| | | | | | 47,763,132 |
| INTERNET RETAIL—4.3% | | | | | | |
| Amazon.com, Inc.* | | 223,571 | | | 147,465,196 |
| NetFlix, Inc.* | | 99,996 | | | | 9,002,640 |
| The Priceline Group, Inc.* | | 1,400 | | | | 1,881,124 |
| | | | | | 158,348,960 |
| INTERNET SOFTWARE & SERVICES—12.8% | | | | | | |
| Alphabet, Inc., Cl. C* | | 352,219 | | | 244,091,289 |
| comScore, Inc.* | | 225,400 | | | | 6,901,748 |
| Facebook, Inc., Cl. A* | | 1,403,932 | | | 165,074,325 |
| LinkedIn Corp., Cl. A* | | 81,036 | | | | 10,154,621 |
| Palantir Technologies, Inc., Cl. A*,@ | | 239,030 | | | | 2,629,330 |
| Twitter, Inc.* | | 67,900 | | | | 992,698 |
| Yahoo! Inc.* | | 1,035,148 | | | | 37,886,417 |
| | | | | | 467,730,428 |
| INVESTMENT BANKING & BROKERAGE—0.5% | | | | | | |
| Morgan Stanley | | 543,430 | | | | 14,705,216 |
| The Goldman Sachs Group, Inc. | | 29,000 | | | | 4,759,190 |
| | | | | | 19,464,406 |
| LEISURE PRODUCTS—0.5% | | | | | | |
| Coach, Inc. | | 471,200 | | | 18,975,224 |
| LIFE SCIENCES TOOLS & SERVICES—2.1% | | | | | | |
| Thermo Fisher Scientific, Inc. | | 518,779 | | | 74,833,871 |
| MANAGED HEALTH CARE—2.3% | | | | | | |
| Aetna, Inc. | | 116,557 | | | | 13,085,854 |
| Humana, Inc. | | 50,200 | | | | 8,888,914 |
- 18 -
THE ALGER INSTITUTIONAL FUNDS |
ALGER CAPITAL APPRECIATION INSTITUTIONAL FUND
Schedule of Investments April 30, 2016 (Unaudited) (Continued)
| | | | | | |
| COMMON STOCKS—(CONT.) | | SHARES | | | | VALUE |
| MANAGED HEALTH CARE—(CONT.) | | | | | | |
| UnitedHealth Group, Inc. | | 470,204 | $ | | 61,916,463 |
| | | | | | 83,891,231 |
| MOVIES & ENTERTAINMENT—0.5% | | | | | | |
| The Walt Disney Co. | | 67,865 | | | | 7,007,740 |
| Time Warner, Inc. | | 127,952 | | | | 9,614,313 |
| | | | | | 16,622,053 |
| OIL & GAS EQUIPMENT & SERVICES—0.6% | | | | | | |
| Halliburton Company | | 294,991 | | | | 12,186,078 |
| Schlumberger Ltd. | | 41,400 | | | | 3,326,076 |
| Weatherford International PLC.* | | 694,900 | | | | 5,649,537 |
| | | | | | 21,161,691 |
| OIL & GAS EXPLORATION & PRODUCTION—0.7% | | | | | | |
| EOG Resources, Inc. | | 242,400 | | | | 20,027,088 |
| Pioneer Natural Resources Co. | | 35,100 | | | | 5,830,110 |
| | | | | | 25,857,198 |
| OTHER DIVERSIFIED FINANCIAL SERVICES—0.5% | | | | | | |
| Bank of America Corp. | | 1,301,243 | | | 18,946,098 |
| PACKAGED FOODS & MEATS—0.5% | | | | | | |
| Mead Johnson Nutrition Co., Cl. A | | 21,800 | | | | 1,899,870 |
| The Kraft Heinz Co. | | 194,000 | | | | 15,145,580 |
| TreeHouse Foods, Inc.* | | 25,500 | | | | 2,254,200 |
| | | | | | 19,299,650 |
| PHARMACEUTICALS—5.2% | | | | | | |
| Allergan PLC.* | | 365,010 | | | | 79,046,566 |
| Bristol-Myers Squibb Co. | | 837,940 | | | | 60,482,509 |
| Eli Lilly & Co. | | 207,900 | | | | 15,702,687 |
| Pacira Pharmaceuticals, Inc.* | | 305,694 | | | | 16,541,102 |
| Pfizer, Inc. | | 334,300 | | | | 10,934,953 |
| Shire PLC. | | 116,632 | | | | 7,278,817 |
| | | | | | 189,986,634 |
| RAILROADS—0.3% | | | | | | |
| Union Pacific Corp. | | 136,846 | | | | 11,937,077 |
| REGIONAL BANKS—0.2% | | | | | | |
| Citizens Financial Group, Inc. | | 350,000 | | | | 7,997,500 |
| RESEARCH & CONSULTING SERVICES—0.5% | | | | | | |
| Verisk Analytics, Inc., Cl. A* | | 244,800 | | | 18,991,584 |
| RESTAURANTS—1.4% | | | | | | |
| McDonald's Corp. | | 166,294 | | | | 21,034,528 |
| Starbucks Corp. | | 512,973 | | | | 28,844,472 |
| | | | | | 49,879,000 |
| SECURITY & ALARM SERVICES—0.6% | | | | | | |
| Tyco International PLC. | | 523,373 | | | 20,160,328 |
| SEMICONDUCTORS—2.5% | | | | | | |
| Broadcom Ltd. | | 274,560 | | | | 40,017,120 |
| Microsemi Corp.* | | 636,000 | | | | 21,490,440 |
| NXP Semiconductors NV* | | 350,397 | | | | 29,881,856 |
| | | | | | 91,389,416 |
- 19 -
THE ALGER INSTITUTIONAL FUNDS |
ALGER CAPITAL APPRECIATION INSTITUTIONAL FUND
Schedule of Investments April 30, 2016 (Unaudited) (Continued)
| | | | | | | |
| COMMON STOCKS—(CONT.) | | SHARES | | | | | VALUE |
| SOFT DRINKS—2.1% | | | | | | | |
| Monster Beverage Corp.* | | 59,900 | $ | | 8,638,778 |
| PepsiCo, Inc. | | 648,547 | | | | | 66,774,399 |
| The Coca-Cola Co. | | 39,400 | | | | | 1,765,120 |
| | | | | | 77,178,297 |
| SPECIALIZED CONSUMER SERVICES—0.6% | | | | | | | |
| ServiceMaster Global Holdings, Inc.* | | 531,000 | | | 20,347,920 |
| SPECIALIZED FINANCE—0.2% | | | | | | | |
| S&P Global, Inc. | | 68,566 | | | | | 7,326,277 |
| SPECIALTY CHEMICALS—0.8% | | | | | | | |
| PPG Industries, Inc. | | 131,869 | | | | | 14,557,019 |
| The Sherwin-Williams Co. | | 55,800 | | | | | 16,031,898 |
| | | | | | 30,588,917 |
| SPECIALTY STORES—0.7% | | | | | | | |
| Signet Jewelers Ltd. | | 218,293 | | | 23,697,888 |
| SYSTEMS SOFTWARE—5.4% | | | | | | | |
| Microsoft Corp. | | 3,252,219 | | | 162,188,162 |
| Oracle Corp. | | 181,900 | | | | | 7,250,534 |
| Red Hat, Inc.* | | 180,400 | | | | | 13,235,948 |
| ServiceNow, Inc.* | | 224,834 | | | | | 16,071,134 |
| | | | | | 198,745,778 |
| TECHNOLOGY HARDWARE STORAGE & PERIPHERALS—4.6% | | | | | | | |
| Apple, Inc. | | 1,791,321 | | | 167,918,431 |
| TOBACCO—1.5% | | | | | | | |
| Altria Group, Inc. | | 532,194 | | | | | 33,373,886 |
| Philip Morris International, Inc. | | 220,900 | | | | | 21,674,708 |
| | | | | | 55,048,594 |
| TRADING COMPANIES & DISTRIBUTORS—0.9% | | | | | | | |
| HD Supply Holdings, Inc.* | | 997,656 | | | 34,199,648 |
| TOTAL COMMON STOCKS | | | | | | | |
| (Cost $3,152,285,223) | | | | | 3,445,701,943 |
| PREFERRED STOCKS—0.5% | | SHARES | | | | | VALUE |
| ADVERTISING—0.1% | | | | | | | |
| Choicestream, Inc., Cl. A*,@,(a) | | 1,074,935 | | | | | 451,473 |
| Choicestream, Inc., Cl. B*,@,(a) | | 2,500,538 | | | | | 1,050,226 |
| | | | | | | | 1,501,699 |
| INTERNET SOFTWARE & SERVICES—0.3% | | | | | | | |
| Palantir Technologies, Inc., Cl. B*,@ | | 974,841 | | | | | 10,723,251 |
| Palantir Technologies, Inc., Cl. D*,@ | | 127,007 | | | | | 1,397,077 |
| | | | | | 12,120,328 |
| PHARMACEUTICALS—0.1% | | | | | | | |
| Intarcia Therapeutics, Inc.*,@ | | 111,655 | | | | | 3,690,198 |
| TOTAL PREFERRED STOCKS | | | | | | | |
| (Cost $13,252,335) | | | | | | | 17,312,225 |
| MASTER LIMITED PARTNERSHIP—0.7% | | SHARES | | | | | VALUE |
| ASSET MANAGEMENT & CUSTODY BANKS—0.7% | | | | | | | |
| The Blackstone Group LP. | | 953,062 | | | 26,152,021 |
| (Cost $30,055,316) | | | | | | | 26,152,021 |
- 20 -
THE ALGER INSTITUTIONAL FUNDS |
ALGER CAPITAL APPRECIATION INSTITUTIONAL FUND
Schedule of Investments April 30, 2016 (Unaudited) (Continued)
| | | | | |
| REAL ESTATE INVESTMENT TRUST—0.9% | | SHARES | | | VALUE |
| MORTGAGE—0.6% | | | | | |
| Blackstone Mortgage Trust, Inc., Cl. A | | 833,840 | | $ | 22,913,923 |
| SPECIALIZED—0.3% | | | | | |
| Crown Castle International Corp. | | 144,700 | | | 12,571,536 |
| TOTAL REAL ESTATE INVESTMENT TRUST | | | | | |
| (Cost $36,699,515) | | | | | 35,485,459 |
| Total Investments | | | | | |
| (Cost $3,232,292,389)(b) | | 96.5 | % | | 3,524,651,648 |
| Other Assets in Excess of Liabilities | | 3.5 | % | | 126,528,597 |
| NET ASSETS | | 100.0 | % | $ | 3,651,180,245 |
# American Depositary Receipts.
(a) Deemed an affiliate of the Alger fund complex during the year for purposes of Section 2(a)(3) of the Investment
Company Act of 1940. See Affiliated Securities in Notes to Financial Statements.
(b) At April 30, 2016, the net unrealized appreciation on investments, based on cost for federal income tax purposes
of $3,293,870,885, amounted to $230,780,763 which consisted of aggregate gross unrealized appreciation of
$368,002,684 and aggregate gross unrealized depreciation of $137,221,921.
* Non-income producing security.
@ Restricted security - Investment in security not registered under the Securities Act of 1933. The investment is deemed
to not be liquid and may be sold only to qualified buyers.
| | | | | | | | | |
| | | | | % of net assets | | | | % of net assets | |
| | Acquisition | | | (Acquisition | | | Market | as of | |
| Security | Date(s) | | Cost | Date) | | | Value | 4/30/2016 | |
| Choicestream, Inc. | 03/14/14 | $ | 36,151 | 0.00 | % | $ | 52,356 | 0.00 | % |
| Choicestream, Inc., Cl. A | 12/17/13 | | 859,605 | 0.03 | % | | 451,473 | 0.01 | % |
| Choicestream, Inc., Cl. B | 07/10/14 | | 1,500,323 | 0.05 | % | | 1,050,226 | 0.03 | % |
| Intarcia Therapeutics, Inc. | 03/27/14 | | 3,616,506 | 0.14 | % | | 3,690,198 | 0.10 | % |
| Palantir Technologies, Inc., Cl. A | 10/07/14 | | 1,555,368 | 0.05 | % | | 2,629,330 | 0.07 | % |
| Palantir Technologies, Inc., Cl. B | 10/07/14 | | 6,437,297 | 0.22 | % | | 10,723,251 | 0.29 | % |
| Palantir Technologies, Inc., Cl. D | 10/14/14 | | 838,605 | 0.03 | % | | 1,397,077 | 0.04 | % |
| Total | | | | | | $ | 19,993,911 | 0.54 | % |
| | | | | | | | | | |
| See Notes to Financial Statements. | | | | | | | | | |
- 21 -
THE ALGER INSTITUTIONAL FUNDS | ALGER CAPITAL APPRECIATION FOCUS FUND
Schedule of Investments April 30, 2016 (Unaudited)
| | | | | |
| COMMON STOCKS—91.6% | | SHARES | | | VALUE |
| AEROSPACE & DEFENSE—5.2% | | | | | |
| Honeywell International, Inc. | | 32,190 | $ | 3,678,351 |
| AIRLINES—1.1% | | | | | |
| Delta Air Lines, Inc. | | 18,060 | | | 752,560 |
| ALTERNATIVE CARRIERS—1.5% | | | | | |
| Level 3 Communications, Inc.* | | 20,060 | | | 1,048,336 |
| APPAREL ACCESSORIES & LUXURY GOODS—1.2% | | | | | |
| PVH Corp. | | 9,080 | | | 868,048 |
| APPLICATION SOFTWARE—2.6% | | | | | |
| Adobe Systems, Inc.* | | 8,550 | | | 805,581 |
| salesforce.com, inc.* | | 13,960 | | | 1,058,168 |
| | | | | | 1,863,749 |
| AUTO PARTS & EQUIPMENT—1.5% | | | | | |
| Delphi Automotive PLC. | | 14,000 | | | 1,030,820 |
| BIOTECHNOLOGY—5.0% | | | | | |
| Biogen, Inc.* | | 3,100 | | | 852,469 |
| BioMarin Pharmaceutical, Inc.* | | 6,350 | | | 537,718 |
| Celgene Corp.* | | 10,260 | | | 1,060,987 |
| Gilead Sciences, Inc. | | 6,830 | | | 602,474 |
| Vertex Pharmaceuticals, Inc.* | | 5,310 | | | 447,845 |
| | | | | | 3,501,493 |
| BREWERS—1.5% | | | | | |
| Molson Coors Brewing Co., Cl. B | | 10,840 | | | 1,036,629 |
| BROADCASTING—4.8% | | | | | |
| CBS Corp., Cl. B | | 60,690 | | | 3,393,178 |
| CABLE & SATELLITE—2.3% | | | | | |
| Comcast Corporation, Cl. A | | 26,630 | | | 1,618,039 |
| CASINOS & GAMING—0.9% | | | | | |
| Red Rock Resorts, Inc., Cl. A* | | 32,700 | | | 609,528 |
| DATA PROCESSING & OUTSOURCED SERVICES—3.9% | | | | | |
| Visa, Inc., Cl. A | | 35,490 | | | 2,741,248 |
| DRUG RETAIL—1.2% | | | | | |
| CVS Caremark Corp. | | 8,400 | | | 844,200 |
| HEALTH CARE EQUIPMENT—2.1% | | | | | |
| DexCom, Inc.* | | 7,080 | | | 455,810 |
| Edwards Lifesciences Corp.* | | 4,660 | | | 494,939 |
| STERIS PLC. | | 7,390 | | | 522,251 |
| | | | | | 1,473,000 |
| HOME ENTERTAINMENT SOFTWARE—2.3% | | | | | |
| Electronic Arts, Inc.* | | 25,880 | | | 1,600,678 |
| HOTELS RESORTS & CRUISE LINES—2.5% | | | | | |
| Norwegian Cruise Line Holdings Ltd.* | | 35,767 | | | 1,748,649 |
| HOUSEWARES & SPECIALTIES—1.8% | | | | | |
| Newell Brands, Inc. | | 27,825 | | | 1,267,151 |
- 22 -
THE ALGER INSTITUTIONAL FUNDS | ALGER CAPITAL APPRECIATION FOCUS FUND
Schedule of Investments April 30, 2016 (Unaudited) (Continued)
| | | | | | |
| COMMON STOCKS—(CONT.) | | SHARES | | | | VALUE |
| INTERNET RETAIL—4.1% | | | | | | |
| Amazon.com, Inc.* | | 4,430 | $ | 2,921,984 |
| INTERNET SOFTWARE & SERVICES—14.9% | | | | | | |
| Alphabet, Inc., Cl. C* | | 6,851 | | | | 4,747,812 |
| comScore, Inc.* | | 10,190 | | | | 312,018 |
| Facebook, Inc., Cl. A* | | 27,530 | | | | 3,236,977 |
| Match Group, Inc.* | | 29,580 | | | | 337,212 |
| Stamps.com, Inc.* | | 11,620 | | | | 957,023 |
| Yahoo! Inc.* | | 26,230 | | | | 960,018 |
| | | | | | 10,551,060 |
| INVESTMENT BANKING & BROKERAGE—0.6% | | | | | | |
| Morgan Stanley | | 16,790 | | | | 454,337 |
| LIFE SCIENCES TOOLS & SERVICES—2.3% | | | | | | |
| Thermo Fisher Scientific, Inc. | | 11,280 | | | | 1,627,140 |
| MANAGED HEALTH CARE—2.7% | | | | | | |
| UnitedHealth Group, Inc. | | 14,710 | | | | 1,937,013 |
| OIL & GAS EQUIPMENT & SERVICES—0.3% | | | | | | |
| Weatherford International PLC.* | | 28,810 | | | | 234,225 |
| OIL & GAS EXPLORATION & PRODUCTION—1.1% | | | | | | |
| Anadarko Petroleum Corp. | | 15,129 | | | | 798,206 |
| OTHER DIVERSIFIED FINANCIAL SERVICES—1.0% | | | | | | |
| Bank of America Corp. | | 49,010 | | | | 713,586 |
| PACKAGED FOODS & MEATS—1.0% | | | | | | |
| Pinnacle Foods, Inc. | | 16,310 | | | | 694,643 |
| PHARMACEUTICALS—5.4% | | | | | | |
| Allergan PLC.* | | 8,760 | | | | 1,897,066 |
| Bristol-Myers Squibb Co. | | 22,380 | | | | 1,615,388 |
| Pacira Pharmaceuticals, Inc.* | | 6,020 | | | | 325,742 |
| | | | | | | 3,838,196 |
| SECURITY & ALARM SERVICES—0.7% | | | | | | |
| Tyco International PLC. | | 12,030 | | | | 463,396 |
| SEMICONDUCTORS—3.1% | | | | | | |
| Broadcom Ltd. | | 7,350 | | | | 1,071,262 |
| Microsemi Corp.* | | 13,460 | | | | 454,813 |
| NXP Semiconductors NV* | | 7,870 | | | | 671,154 |
| | | | | | | 2,197,229 |
| SPECIALTY CHEMICALS—0.7% | | | | | | |
| The Sherwin-Williams Co. | | 1,640 | | | | 471,188 |
| SPECIALTY STORES—1.0% | | | | | | |
| Signet Jewelers Ltd. | | 6,450 | | | | 700,212 |
| SYSTEMS SOFTWARE—5.3% | | | | | | |
| Microsoft Corp. | | 66,990 | | | | 3,340,791 |
| TubeMogul, Inc.* | | 32,630 | | | | 422,885 |
| | | | | | | 3,763,676 |
- 23 -
THE ALGER INSTITUTIONAL FUNDS | ALGER CAPITAL APPRECIATION FOCUS FUND
Schedule of Investments April 30, 2016 (Unaudited) (Continued)
| | | | | | |
| COMMON STOCKS—(CONT.) | | SHARES | | | | VALUE |
| TECHNOLOGY HARDWARE STORAGE & PERIPHERALS—4.7% | | | | | | |
| Apple, Inc. | | 35,711 | | $ | | 3,347,549 |
| TRADING COMPANIES & DISTRIBUTORS—1.3% | | | | | | |
| HD Supply Holdings, Inc.* | | 27,130 | | | | 930,016 |
| TOTAL COMMON STOCKS | | | | | | |
| (Cost $61,854,144) | | | | | | 64,719,313 |
| PREFERRED STOCKS—0.5% | | SHARES | | | | VALUE |
| BIOTECHNOLOGY—0.5% | | | | | | |
| Prosetta Biosciences, Inc.*,@,(a) | | 76,825 | | | | 347,249 |
| (Cost $345,713) | | | | | | 347,249 |
| MASTER LIMITED PARTNERSHIP—1.2% | | SHARES | | | | VALUE |
| ASSET MANAGEMENT & CUSTODY BANKS—1.2% | | | | | | |
| The Blackstone Group LP. | | 31,770 | | | | 871,769 |
| (Cost $945,997) | | | | | | 871,769 |
| REAL ESTATE INVESTMENT TRUST—2.2% | | SHARES | | | | VALUE |
| SPECIALIZED—2.2% | | | | | | |
| Crown Castle International Corp. | | 17,970 | | | | 1,561,234 |
| (Cost $1,521,597) | | | | | | 1,561,234 |
| Total Investments | | | | | | |
| (Cost $64,667,451)(b) | | 95.5 | % | | | 67,499,565 |
| Other Assets in Excess of Liabilities | | 4.5 | % | | | 3,151,188 |
| NET ASSETS | | 100.0 | % | $ | | 70,650,753 |
(a) Deemed an affiliate of the Alger fund complex during the year for purposes of Section 2(a)(3) of the Investment
Company Act of 1940. See Affiliated Securities in Notes to Financial Statements.
(b) At April 30, 2016, the net unrealized appreciation on investments, based on cost for federal income tax purposes
of $65,845,255, amounted to $1,654,310 which consisted of aggregate gross unrealized appreciation of
$4,623,399 and aggregate gross unrealized depreciation of $2,969,089.
* Non-income producing security.
@ Restricted security - Investment in security not registered under the Securities Act of 1933. The investment is deemed
to not be liquid and may be sold only to qualified buyers.
| | | | | | | | | |
| | | | | % of net assets | | | | % of net assets | |
| | Acquisition | | | (Acquisition | | | Market | as of | |
| Security | Date(s) | | Cost | Date) | | | Value | 4/30/2016 | |
| Prosetta Biosciences, Inc. | 02/06/15 | $ | 345,713 | 0.80 | % | $ | 347,249 | 0.49 | % |
| Total | | | | | | $ | 347,249 | 0.49 | % |
| | | | | | | | | | |
| |
| |
| See Notes to Financial Statements. | | | | | | | | | |
- 24 -
THE ALGER INSTITUTIONAL FUNDS | ALGER MID CAP GROWTH INSTITUTIONAL FUND
Schedule of Investments April 30, 2016 (Unaudited)
| | | | | |
| COMMON STOCKS—94.2% | | SHARES | | | VALUE |
| ADVERTISING—0.0% | | | | | |
| Choicestream, Inc.*,@,(a) | | 8,930 | $ | 3,750 |
| AEROSPACE & DEFENSE—2.4% | | | | | |
| Hexcel Corp. | | 26,800 | | | 1,213,236 |
| TransDigm Group, Inc.* | | 6,800 | | | 1,549,516 |
| | | | | | 2,762,752 |
| AIRLINES—1.9% | | | | | |
| Southwest Airlines Co | | 24,400 | | | 1,088,484 |
| Spirit Airlines, Inc.* | | 7,800 | | | 342,654 |
| United Continental Holdings, Inc.* | | 15,100 | | | 691,731 |
| | | | | | 2,122,869 |
| APPAREL ACCESSORIES & LUXURY GOODS—3.4% | | | | | |
| Hanesbrands, Inc. | | 48,900 | | | 1,419,567 |
| lululemon athletica, Inc.* | | 8,000 | | | 524,400 |
| PVH Corp. | | 10,500 | | | 1,003,800 |
| Under Armour, Inc., Cl. A* | | 11,800 | | | 518,492 |
| Under Armour, Inc., Cl. C* | | 10,600 | | | 432,480 |
| | | | | | 3,898,739 |
| APPAREL RETAIL—1.8% | | | | | |
| Burlington Stores, Inc.* | | 11,800 | | | 672,246 |
| Ross Stores, Inc. | | 24,500 | | | 1,391,110 |
| | | | | | 2,063,356 |
| APPLICATION SOFTWARE—0.5% | | | | | |
| Guidewire Software, Inc.* | | 3,300 | | | 188,001 |
| Intuit, Inc. | | 3,700 | | | 373,293 |
| | | | | | 561,294 |
| AUTO PARTS & EQUIPMENT—2.4% | | | | | |
| Delphi Automotive PLC. | | 20,950 | | | 1,542,548 |
| WABCO Holdings, Inc.* | | 10,000 | | | 1,121,600 |
| | | | | | 2,664,148 |
| AUTOMOBILE MANUFACTURERS—0.2% | | | | | |
| Tesla Motors, Inc.* | | 800 | | | 192,608 |
| AUTOMOTIVE RETAIL—0.9% | | | | | |
| O'Reilly Automotive, Inc.* | | 3,900 | | | 1,024,452 |
| BIOTECHNOLOGY—3.4% | | | | | |
| Anacor Pharmaceuticals, Inc.* | | 5,600 | | | 351,344 |
| BioMarin Pharmaceutical, Inc.* | | 8,000 | | | 677,440 |
| Bluebird Bio, Inc.* | | 5,100 | | | 226,185 |
| Incyte Corp.* | | 8,500 | | | 614,295 |
| Juno Therapeutics, Inc.* | | 2,500 | | | 105,225 |
| Portola Pharmaceuticals, Inc.* | | 11,600 | | | 275,616 |
| Ultragenyx Pharmaceutical, Inc.* | | 6,400 | | | 432,768 |
| United Therapeutics Corp.* | | 5,700 | | | 599,640 |
| Vertex Pharmaceuticals, Inc.* | | 6,300 | | | 531,342 |
| | | | | | 3,813,855 |
| BROADCASTING—1.2% | | | | | |
| CBS Corp., Cl. B | | 23,900 | | | 1,336,249 |
- 25 -
THE ALGER INSTITUTIONAL FUNDS | ALGER MID CAP GROWTH INSTITUTIONAL FUND
Schedule of Investments April 30, 2016 (Unaudited) (Continued)
| | | | | |
| COMMON STOCKS—(CONT.) | | SHARES | | | VALUE |
| BROADCASTING & CABLE TV—0.7% | | | | | |
| Discovery Communications, Inc., Series A* | | 30,200 | $ | 824,762 |
| BUILDING PRODUCTS—3.0% | | | | | |
| Allegion PLC. | | 25,000 | | | 1,636,250 |
| AO Smith Corp. | | 8,600 | | | 664,092 |
| Fortune Brands Home & Security, Inc. | | 20,300 | | | 1,124,823 |
| | | | | | 3,425,165 |
| CASINOS & GAMING—1.1% | | | | | |
| Penn National Gaming, Inc.* | | 44,200 | | | 712,946 |
| Red Rock Resorts, Inc., Cl. A* | | 30,100 | | | 561,064 |
| | | | | | 1,274,010 |
| COMMUNICATIONS EQUIPMENT—2.7% | | | | | |
| Arista Networks, Inc.* | | 9,200 | | | 612,904 |
| Ciena Corp.* | | 20,000 | | | 336,600 |
| F5 Networks, Inc.* | | 9,500 | | | 995,125 |
| Finisar Corp.* | | 20,800 | | | 342,368 |
| Lumentum Holdings, Inc.* | | 13,700 | | | 346,610 |
| Palo Alto Networks, Inc.* | | 3,200 | | | 482,784 |
| | | | | | 3,116,391 |
| CONSTRUCTION & FARM MACHINERY & HEAVY | | | | | |
| TRUCKS—0.6% | | | | | |
| Wabtec Corp. | | 8,300 | | | 688,319 |
| CONSUMER FINANCE—0.1% | | | | | |
| LendingClub Corp.* | | 18,900 | | | 149,310 |
| DATA PROCESSING & OUTSOURCED SERVICES—4.4% | | | | | |
| Alliance Data Systems Corp.* | | 3,800 | | | 772,578 |
| Fiserv, Inc.* | | 14,900 | | | 1,456,028 |
| MAXIMUS, Inc. | | 18,300 | | | 968,070 |
| Sabre Corp. | | 34,400 | | | 995,880 |
| Vantiv, Inc., CL. A* | | 14,500 | | | 790,830 |
| | | | | | 4,983,386 |
| DISTILLERS & VINTNERS—0.4% | | | | | |
| Constellation Brands Inc., Cl. A | | 2,700 | | | 421,362 |
| ENVIRONMENTAL & FACILITIES SERVICES—0.9% | | | | | |
| Stericycle, Inc.* | | 10,400 | | | 993,824 |
| FOOD RETAIL—0.8% | | | | | |
| The Kroger Co. | | 26,500 | | | 937,835 |
| GENERAL MERCHANDISE STORES—2.0% | | | | | |
| Dollar General Corp. | | 16,200 | | | 1,326,942 |
| Dollar Tree, Inc.* | | 12,500 | | | 996,375 |
| | | | | | 2,323,317 |
| HEALTH CARE EQUIPMENT—5.0% | | | | | |
| ABIOMED, Inc.* | | 11,800 | | | 1,146,252 |
| DexCom, Inc.* | | 21,600 | | | 1,390,608 |
| Edwards Lifesciences Corp.* | | 14,200 | | | 1,508,182 |
| Hologic, Inc.* | | 15,100 | | | 507,209 |
- 26 -
THE ALGER INSTITUTIONAL FUNDS | ALGER MID CAP GROWTH INSTITUTIONAL FUND
Schedule of Investments April 30, 2016 (Unaudited) (Continued)
| | | | | |
| COMMON STOCKS—(CONT.) | | SHARES | | | VALUE |
| HEALTH CARE EQUIPMENT—(CONT.) | | | | | |
| IDEXX Laboratories, Inc.* | | 10,100 | $ | 851,935 |
| STERIS PLC. | | 3,300 | | | 233,211 |
| | | | | | 5,637,397 |
| HEALTH CARE FACILITIES—3.9% | | | | | |
| Acadia Healthcare Co., Inc.* | | 16,400 | | | 1,036,316 |
| Amsurg Corp.* | | 11,700 | | | 947,466 |
| Universal Health Services, Inc., Cl. B | | 9,800 | | | 1,310,064 |
| VCA Antech, Inc.* | | 18,100 | | | 1,139,757 |
| | | | | | 4,433,603 |
| HEALTH CARE SERVICES—0.8% | | | | | |
| Adeptus Health, Inc., Cl. A* | | 8,700 | | | 592,644 |
| Diplomat Pharmacy, Inc.* | | 10,500 | | | 318,045 |
| | | | | | 910,689 |
| HOME ENTERTAINMENT SOFTWARE—0.7% | | | | | |
| Electronic Arts, Inc.* | | 13,500 | | | 834,975 |
| HOMEBUILDING—0.3% | | | | | |
| Toll Brothers, Inc.* | | 10,900 | | | 297,570 |
| HOTELS RESORTS & CRUISE LINES—5.9% | | | | | |
| Ctrip.com International Ltd.#* | | 6,400 | | | 279,104 |
| Diamond Resorts International, Inc.* | | 72,100 | | | 1,529,241 |
| Norwegian Cruise Line Holdings Ltd.* | | 54,300 | | | 2,654,727 |
| Royal Caribbean Cruises Ltd. | | 29,500 | | | 2,283,300 |
| | | | | | 6,746,372 |
| HOUSEHOLD PRODUCTS—1.1% | | | | | |
| Church & Dwight Co., Inc. | | 12,900 | | | 1,195,830 |
| HOUSEWARES & SPECIALTIES—2.4% | | | | | |
| Newell Brands, Inc. | | 59,096 | | | 2,691,232 |
| INDUSTRIAL GASES—0.5% | | | | | |
| Air Products & Chemicals, Inc. | | 4,000 | | | 583,560 |
| INDUSTRIAL MACHINERY—1.5% | | | | | |
| Colfax Corp.* | | 17,300 | | | 561,039 |
| Donaldson Co., Inc. | | 23,300 | | | 761,444 |
| Graco, Inc. | | 5,300 | | | 415,467 |
| | | | | | 1,737,950 |
| INTERNET SOFTWARE & SERVICES—2.9% | | | | | |
| comScore, Inc.* | | 21,300 | | | 652,206 |
| Cornerstone OnDemand, Inc.* | | 14,139 | | | 485,675 |
| Criteo SA#* | | 10,400 | | | 433,576 |
| LinkedIn Corp., Cl. A* | | 3,300 | | | 413,523 |
| Palantir Technologies, Inc., Cl. A*,@ | | 12,426 | | | 136,686 |
| SPS Commerce, Inc.* | | 10,500 | | | 534,765 |
| Stamps.com, Inc.* | | 6,200 | | | 510,632 |
| Twitter, Inc.* | | 9,300 | | | 135,966 |
| | | | | | 3,303,029 |
- 27 -
THE ALGER INSTITUTIONAL FUNDS | ALGER MID CAP GROWTH INSTITUTIONAL FUND
Schedule of Investments April 30, 2016 (Unaudited) (Continued)
| | | | | |
| COMMON STOCKS—(CONT.) | | SHARES | | | VALUE |
| INVESTMENT BANKING & BROKERAGE—0.6% | | | | | |
| TD Ameritrade Holding Corp. | | 24,600 | $ | 733,818 |
| LEISURE PRODUCTS—1.0% | | | | | |
| Coach, Inc. | | 26,700 | | | 1,075,209 |
| LIFE SCIENCES TOOLS & SERVICES—0.3% | | | | | |
| Quintiles Transnational Holdings, Inc.* | | 5,400 | | | 372,978 |
| OIL & GAS DRILLING—0.3% | | | | | |
| Patterson-UTI Energy, Inc. | | 16,900 | | | 333,775 |
| OIL & GAS EXPLORATION & PRODUCTION—0.7% | | | | | |
| Devon Energy Corp. | | 7,500 | | | 260,100 |
| Newfield Exploration Co.* | | 6,300 | | | 228,375 |
| PDC Energy, Inc.* | | 4,400 | | | 276,276 |
| | | | | | 764,751 |
| PACKAGED FOODS & MEATS—2.1% | | | | | |
| ConAgra Foods, Inc. | | 4,000 | | | 178,240 |
| Mead Johnson Nutrition Co., Cl. A | | 4,100 | | | 357,315 |
| The WhiteWave Foods Co.* | | 20,600 | | | 828,326 |
| TreeHouse Foods, Inc.* | | 12,000 | | | 1,060,800 |
| | | | | | 2,424,681 |
| PHARMACEUTICALS—1.0% | | | | | |
| Akorn, Inc.* | | 4,000 | | | 101,800 |
| Jazz Pharmaceuticals PLC.* | | 2,400 | | | 361,680 |
| Pacira Pharmaceuticals, Inc.* | | 11,300 | | | 611,443 |
| | | | | | 1,074,923 |
| REAL ESTATE SERVICES—0.4% | | | | | |
| Jones Lang LaSalle, Inc. | | 4,000 | | | 460,680 |
| REGIONAL BANKS—1.7% | | | | | |
| Citizens Financial Group, Inc. | | 36,000 | | | 822,600 |
| Signature Bank* | | 8,400 | | | 1,157,772 |
| | | | | | 1,980,372 |
| RESEARCH & CONSULTING SERVICES—2.4% | | | | | |
| CoStar Group, Inc.* | | 3,700 | | | 730,047 |
| Verisk Analytics, Inc., Cl. A* | | 25,100 | | | 1,947,258 |
| | | | | | 2,677,305 |
| SECURITY & ALARM SERVICES—0.8% | | | | | |
| Tyco International PLC. | | 24,900 | | | 959,148 |
| SEMICONDUCTOR EQUIPMENT—0.9% | | | | | |
| Lam Research Corp. | | 12,700 | | | 970,280 |
| SEMICONDUCTORS—4.6% | | | | | |
| Broadcom Ltd. | | 13,600 | | | 1,982,200 |
| Cavium Networks, Inc.* | | 8,100 | | | 399,897 |
| Microsemi Corp.* | | 22,900 | | | 773,791 |
| NXP Semiconductors NV* | | 10,900 | | | 929,552 |
| Skyworks Solutions, Inc. | | 16,800 | | | 1,122,576 |
| | | | | | 5,208,016 |
- 28 -
THE ALGER INSTITUTIONAL FUNDS | ALGER MID CAP GROWTH INSTITUTIONAL FUND
Schedule of Investments April 30, 2016 (Unaudited) (Continued)
| | | | | | |
| COMMON STOCKS—(CONT.) | | SHARES | | | | VALUE |
| SOFT DRINKS—0.6% | | | | | | |
| Monster Beverage Corp.* | | 4,700 | $ | 677,834 |
| SPECIALIZED CONSUMER SERVICES—1.3% | | | | | | |
| ServiceMaster Global Holdings, Inc.* | | 38,200 | | | | 1,463,824 |
| SPECIALIZED FINANCE—1.4% | | | | | | |
| Moody's Corp. | | 2,900 | | | | 277,588 |
| S&P Global, Inc. | | 11,900 | | | | 1,271,515 |
| | | | | | | 1,549,103 |
| SPECIALTY CHEMICALS—4.3% | | | | | | |
| Axalta Coating Systems Ltd.* | | 34,000 | | | | 967,980 |
| Balchem Corp. | | 7,300 | | | | 447,928 |
| Celanese Corp. | | 11,800 | | | | 834,260 |
| PPG Industries, Inc. | | 11,300 | | | | 1,247,407 |
| The Sherwin-Williams Co. | | 4,900 | | | | 1,407,819 |
| | | | | | | 4,905,394 |
| SPECIALTY STORES—3.4% | | | | | | |
| Signet Jewelers Ltd. | | 10,300 | | | | 1,118,168 |
| The Michaels Cos, Inc.* | | 26,400 | | | | 750,552 |
| Tractor Supply Co. | | 10,900 | | | | 1,031,794 |
| Ulta Salon, Cosmetics & Fragrance, Inc.* | | 4,800 | | | | 999,744 |
| | | | | | | 3,900,258 |
| SYSTEMS SOFTWARE—4.5% | | | | | | |
| Fortinet, Inc.* | | 41,800 | | | | 1,358,918 |
| Proofpoint, Inc.* | | 9,900 | | | | 576,774 |
| Red Hat, Inc.* | | 6,400 | | | | 469,568 |
| ServiceNow, Inc.* | | 26,800 | | | | 1,915,664 |
| Tableau Software, Inc., Cl. A* | | 4,900 | | | | 253,330 |
| TubeMogul, Inc.* | | 43,100 | | | | 558,576 |
| | | | | | | 5,132,830 |
| TRADING COMPANIES & DISTRIBUTORS—1.7% | | | | | | |
| HD Supply Holdings, Inc.* | | 56,200 | | | | 1,926,536 |
| TRUCKING—0.4% | | | | | | |
| Old Dominion Freight Line, Inc.* | | 6,000 | | | | 396,300 |
| TOTAL COMMON STOCKS | | | | | | |
| (Cost $104,408,492) | | | | | 106,941,975 |
| PREFERRED STOCKS—1.9% | | SHARES | | | | VALUE |
| ADVERTISING—0.1% | | | | | | |
| Choicestream, Inc., Cl. A*,@,(a) | | 77,008 | | | | 32,344 |
| Choicestream, Inc., Cl. B*,@,(a) | | 144,793 | | | | 60,813 |
| | | | | | | 93,157 |
| BIOTECHNOLOGY—1.1% | | | | | | |
| Prosetta Biosciences, Inc.*,@,(a) | | 166,009 | | | | 750,361 |
| Tolero Pharmaceuticals, Inc.*,@,(a) | | 354,870 | | | | 468,428 |
| | | | | | | 1,218,789 |
| INTERNET SOFTWARE & SERVICES—0.5% | | | | | | |
| Palantir Technologies, Inc., Cl. B*,@ | | 50,675 | | | | 557,425 |
- 29 -
THE ALGER INSTITUTIONAL FUNDS | ALGER MID CAP GROWTH INSTITUTIONAL FUND
Schedule of Investments April 30, 2016 (Unaudited) (Continued)
| | | | | | | |
| PREFERRED STOCKS—(CONT.) | | SHARES | | | | | VALUE |
| INTERNET SOFTWARE & SERVICES—(CONT.) | | | | | | | |
| Palantir Technologies, Inc., Cl. D*,@ | | 6,602 | | | $ | | 72,622 |
| | | | | | | | 630,047 |
| PHARMACEUTICALS—0.2% | | | | | | | |
| Intarcia Therapeutics, Inc.*,@ | | 7,588 | | | | | 250,783 |
| TOTAL PREFERRED STOCKS | | | | | | | |
| (Cost $2,589,818) | | | | | | | 2,192,776 |
| REAL ESTATE INVESTMENT TRUST—3.3% | | SHARES | | | | | VALUE |
| HEALTH CARE—0.5% | | | | | | | |
| Omega Healthcare Investors, Inc. | | 15,900 | | | | | 536,943 |
| MORTGAGE—0.5% | | | | | | | |
| Blackstone Mortgage Trust, Inc., Cl. A | | 22,200 | | | | | 610,056 |
| OFFICE—0.7% | | | | | | | |
| Digital Realty Trust, Inc. | | 8,700 | | | | | 765,426 |
| SPECIALIZED—1.6% | | | | | | | |
| Crown Castle International Corp. | | 14,300 | | | | | 1,242,384 |
| Lamar Advertising Co., Cl. A | | 9,300 | | | | | 576,972 |
| | | | | | | | 1,819,356 |
| TOTAL REAL ESTATE INVESTMENT TRUST | | | | | | | |
| (Cost $3,847,331) | | | | | | | 3,731,781 |
| SPECIAL PURPOSE VEHICLE—0.2% | | SHARES | | | | | VALUE |
| CONSUMER FINANCE—0.2% | | | | | | | |
| JS Kred SPV I, LLC.@ | | 240,362 | | | | | 240,362 |
| (Cost $240,362) | | | | | | | 240,362 |
| Total Investments | | | | | | | |
| (Cost $111,086,003)(b) | | 99.6 | % | | 113,106,894 |
| Other Assets in Excess of Liabilities | | 0.4 | % | | | | 401,472 |
| NET ASSETS | | 100.0 | % | | $ | | 113,508,366 |
# American Depositary Receipts.
(a) Deemed an affiliate of the Alger fund complex during the year for purposes of Section 2(a)(3) of the Investment
Company Act of 1940. See Affiliated Securities in Notes to Financial Statements.
(b) At April 30, 2016, the net unrealized appreciation on investments, based on cost for federal income tax purposes
of $111,151,232, amounted to $1,955,662 which consisted of aggregate gross unrealized appreciation of
$9,720,231 and aggregate gross unrealized depreciation of $7,764,569.
* Non-income producing security.
- 30 -
THE ALGER INSTITUTIONAL FUNDS | ALGER MID CAP GROWTH INSTITUTIONAL FUND
Schedule of Investments April 30, 2016 (Unaudited) (Continued)
@ Restricted security - Investment in security not registered under the Securities Act of 1933. The investment is deemed
to not be liquid and may be sold only to qualified buyers.
| | | | | | | | | |
| | | | | % of net assets | | | | % of net assets | |
| | Acquisition | | | (Acquisition | | | Market | as of | |
| Security | Date(s) | | Cost | Date) | | | Value | 4/30/2016 | |
| Choicestream, Inc. | 03/14/14 | $ | 2,590 | 0.00 | % | $ | 3,750 | 0.00 | % |
| Choicestream, Inc., Cl. A | 12/17/13 | | 61,582 | 0.03 | % | | 32,344 | 0.03 | % |
| Choicestream, Inc., Cl. B | 07/10/14 | | 86,876 | 0.05 | % | | 60,813 | 0.05 | % |
| Intarcia Therapeutics, Inc. | 03/27/14 | | 245,775 | 0.14 | % | | 250,783 | 0.22 | % |
| JS Kred SPV I, LLC. | 06/26/15 | | 240,362 | 0.15 | % | | 240,362 | 0.21 | % |
| Palantir Technologies, Inc., Cl. A | 10/07/14 | | 80,856 | 0.05 | % | | 136,686 | 0.12 | % |
| Palantir Technologies, Inc., Cl. B | 10/07/14 | | 334,629 | 0.22 | % | | 557,425 | 0.49 | % |
| Palantir Technologies, Inc., Cl. D | 10/14/14 | | 43,592 | 0.03 | % | | 72,622 | 0.07 | % |
| Prosetta Biosciences, Inc. | 02/06/15 | | 747,041 | 0.50 | % | | 750,361 | 0.66 | % |
| Tolero Pharmaceuticals, Inc. | 08/01/14 | | 705,514 | 0.45 | % | | 308,769 | 0.27 | % |
| Tolero Pharmaceuticals, Inc. | 10/31/14 | | 364,809 | 0.23 | % | | 159,659 | 0.14 | % |
| Total | | | | | | $ | 2,573,574 | 2.26 | % |
| | | | | | | | | | |
| See Notes to Financial Statements. | | | | | | | | | |
- 31 -
THE ALGER INSTITUTIONAL FUNDS | ALGER SMALL CAP GROWTH INSTITUTIONAL FUND
Schedule of Investments April 30, 2016 (Unaudited)
| | | | | | |
| COMMON STOCKS—92.7% | | SHARES | | | | VALUE |
| AEROSPACE & DEFENSE—0.8% | | | | | | |
| Hexcel Corp. | | 40,650 | $ | 1,840,225 |
| AIR FREIGHT & LOGISTICS—0.5% | | | | | | |
| Forward Air Corp. | | 26,303 | | | | 1,198,891 |
| APPAREL ACCESSORIES & LUXURY GOODS—0.6% | | | | | | |
| G-III Apparel Group Ltd.* | | 31,800 | | | | 1,438,950 |
| APPAREL RETAIL—1.7% | | | | | | |
| American Eagle Outfitters, Inc. | | 114,300 | | | | 1,635,633 |
| Burlington Stores, Inc.* | | 43,400 | | | | 2,472,498 |
| | | | | | | 4,108,131 |
| APPLICATION SOFTWARE—13.9% | | | | | | |
| American Software, Inc., Cl. A | | 381,602 | | | | 3,487,842 |
| ANSYS, Inc.* | | 13,200 | | | | 1,198,164 |
| Blackbaud, Inc. | | 69,650 | | | | 4,302,280 |
| Ellie Mae, Inc.* | | 19,000 | | | | 1,588,400 |
| Fair Isaac Corp. | | 14,350 | | | | 1,531,288 |
| Guidewire Software, Inc.* | | 34,350 | | | | 1,956,920 |
| HubSpot, Inc.* | | 27,750 | | | | 1,229,048 |
| Manhattan Associates, Inc.* | | 81,050 | | | | 4,906,767 |
| Monotype Imaging Holdings, Inc. | | 39,500 | | | | 870,185 |
| Paycom Software, Inc.* | | 98,550 | | | | 3,765,596 |
| Textura Corp.* | | 76,000 | | | | 2,005,640 |
| Tyler Technologies, Inc.* | | 42,100 | | | | 6,163,861 |
| | | | | | 33,005,991 |
| ASSET MANAGEMENT & CUSTODY BANKS—0.9% | | | | | | |
| WisdomTree Investments, Inc. | | 202,277 | | | | 2,202,797 |
| AUTO PARTS & EQUIPMENT—0.9% | | | | | | |
| Tenneco, Inc.* | | 42,300 | | | | 2,254,590 |
| AUTOMOTIVE RETAIL—0.8% | | | | | | |
| Lithia Motors, Inc., Cl. A | | 21,800 | | | | 1,809,836 |
| BIOTECHNOLOGY—3.9% | | | | | | |
| ACADIA Pharmaceuticals, Inc.* | | 57,550 | | | | 1,858,865 |
| Anacor Pharmaceuticals, Inc.* | | 15,750 | | | | 988,155 |
| Halozyme Therapeutics, Inc.* | | 66,850 | | | | 705,267 |
| Heron Therapeutics, Inc.* | | 34,750 | | | | 745,040 |
| Juno Therapeutics, Inc.* | | 15,100 | | | | 635,559 |
| Neurocrine Biosciences, Inc.* | | 18,350 | | | | 836,393 |
| Portola Pharmaceuticals, Inc.* | | 39,450 | | | | 937,332 |
| TESARO, Inc.* | | 35,400 | | | | 1,466,976 |
| Ultragenyx Pharmaceutical, Inc.* | | 16,100 | | | | 1,088,682 |
| | | | | | | 9,262,269 |
| BUILDING PRODUCTS—1.7% | | | | | | |
| Masonite International Corp.* | | 61,050 | | | | 4,130,643 |
| CASINOS & GAMING—1.0% | | | | | | |
| Penn National Gaming, Inc.* | | 142,850 | | | | 2,304,171 |
- 32 -
THE ALGER INSTITUTIONAL FUNDS | ALGER SMALL CAP GROWTH INSTITUTIONAL FUND
Schedule of Investments April 30, 2016 (Unaudited) (Continued)
| | | | | | |
| COMMON STOCKS—(CONT.) | | SHARES | | | | VALUE |
| COMMODITY CHEMICALS—0.6% | | | | | | |
| Calgon Carbon Corp. | | 80,000 | $ | | 1,311,200 |
| CONSUMER FINANCE—1.1% | | | | | | |
| LendingClub Corp.* | | 330,500 | | | | 2,610,950 |
| DATA PROCESSING & OUTSOURCED SERVICES—2.1% | | | | | | |
| Euronet Worldwide, Inc.* | | 41,450 | | | | 3,195,795 |
| MAXIMUS, Inc. | | 35,050 | | | | 1,854,145 |
| | | | | | | 5,049,940 |
| EDUCATION SERVICES—0.5% | | | | | | |
| Strayer Education, Inc.* | | 25,850 | | | | 1,283,194 |
| ELECTRONIC COMPONENTS—1.1% | | | | | | |
| DTS, Inc.* | | 117,950 | | | | 2,573,669 |
| ELECTRONIC EQUIPMENT MANUFACTURERS—3.8% | | | | | | |
| Cognex Corp. | | 95,997 | | | | 3,410,773 |
| FEI Co. | | 44,550 | | | | 3,965,841 |
| FLIR Systems, Inc. | | 57,300 | | | | 1,731,033 |
| | | | | | | 9,107,647 |
| FOOD DISTRIBUTORS—1.1% | | | | | | |
| Performance Food Group Co.* | | 104,650 | | | | 2,708,342 |
| HEALTH CARE EQUIPMENT—5.8% | | | | | | |
| Abaxis, Inc. | | 85,000 | | | | 3,852,200 |
| ABIOMED, Inc.* | | 36,700 | | | | 3,565,038 |
| Cantel Medical Corp. | | 74,600 | | | | 4,997,454 |
| STERIS PLC. | | 20,550 | | | | 1,452,268 |
| | | | | | 13,866,960 |
| HEALTH CARE FACILITIES—3.3% | | | | | | |
| Amsurg Corp.* | | 34,350 | | | | 2,781,663 |
| Surgery Partners, Inc.* | | 92,300 | | | | 1,503,567 |
| VCA Antech, Inc.* | | 55,150 | | | | 3,472,795 |
| | | | | | | 7,758,025 |
| HEALTH CARE SUPPLIES—4.4% | | | | | | |
| Meridian Bioscience, Inc. | | 68,950 | | | | 1,317,635 |
| Neogen Corp.* | | 121,350 | | | | 5,732,574 |
| Quidel Corp.* | | 196,901 | | | | 3,406,387 |
| | | | | | 10,456,596 |
| HEALTH CARE TECHNOLOGY—3.8% | | | | | | |
| Medidata Solutions, Inc.* | | 93,800 | | | | 4,092,494 |
| Veeva Systems, Inc., Cl. A* | | 95,150 | | | | 2,617,577 |
| Vocera Communications, Inc.* | | 193,200 | | | | 2,264,304 |
| | | | | | | 8,974,375 |
| HOME ENTERTAINMENT SOFTWARE—0.5% | | | | | | |
| Take-Two Interactive Software, Inc.* | | 32,150 | | | | 1,098,887 |
| HOME FURNISHING RETAIL—0.3% | | | | | | |
| Williams-Sonoma, Inc. | | 14,000 | | | | 822,920 |
- 33 -
THE ALGER INSTITUTIONAL FUNDS | ALGER SMALL CAP GROWTH INSTITUTIONAL FUND
Schedule of Investments April 30, 2016 (Unaudited) (Continued)
| | | | | | |
| COMMON STOCKS—(CONT.) | | SHARES | | | | VALUE |
| HOTELS RESORTS & CRUISE LINES—0.9% | | | | | | |
| Diamond Resorts International, Inc.* | | 103,550 | $ | | 2,196,295 |
| HUMAN RESOURCE & EMPLOYMENT SERVICES—2.9% | | | | | | |
| On Assignment, Inc.* | | 84,850 | | | | 3,059,691 |
| WageWorks, Inc.* | | 69,850 | | | | 3,762,121 |
| | | | | | | 6,821,812 |
| INDUSTRIAL MACHINERY—3.3% | | | | | | |
| Proto Labs, Inc.* | | 60,950 | | | | 3,646,639 |
| Sun Hydraulics Corp. | | 119,600 | | | | 4,231,448 |
| | | | | | | 7,878,087 |
| INTERNET SOFTWARE & SERVICES—4.3% | | | | | | |
| comScore, Inc.* | | 48,450 | | | | 1,483,539 |
| NIC, Inc. | | 109,450 | | | | 1,938,360 |
| SPS Commerce, Inc.* | | 50,700 | | | | 2,582,151 |
| Stamps.com, Inc.* | | 50,254 | | | | 4,138,919 |
| | | | | | 10,142,969 |
| INVESTMENT BANKING & BROKERAGE—0.5% | | | | | | |
| Evercore Partners, Inc., Cl. A | | 24,750 | | | | 1,278,090 |
| LEISURE FACILITIES—0.5% | | | | | | |
| Planet Fitness, Inc., Cl. A* | | 77,800 | | | | 1,195,008 |
| LIFE SCIENCES TOOLS & SERVICES—4.1% | | | | | | |
| Bio-Techne Corp. | | 55,400 | | | | 5,162,172 |
| Luminex Corp.* | | 163,700 | | | | 3,290,370 |
| PRA Health Sciences, Inc.* | | 24,900 | | | | 1,181,505 |
| | | | | | | 9,634,047 |
| MANAGED HEALTH CARE—0.6% | | | | | | |
| Molina Healthcare, Inc.* | | 29,500 | | | | 1,526,920 |
| MOVIES & ENTERTAINMENT—0.6% | | | | | | |
| Lions Gate Entertainment Corp. | | 61,750 | | | | 1,370,850 |
| OIL & GAS EQUIPMENT & SERVICES—0.6% | | | | | | |
| RPC, Inc. | | 87,650 | | | | 1,325,268 |
| OIL & GAS EXPLORATION & PRODUCTION—1.0% | | | | | | |
| Parsley Energy, Inc., Cl. A* | | 39,050 | | | | 914,551 |
| QEP Resources, Inc. | | 83,600 | | | | 1,498,948 |
| | | | | | | 2,413,499 |
| PACKAGED FOODS & MEATS—0.6% | | | | | | |
| TreeHouse Foods, Inc.* | | 17,350 | | | | 1,533,740 |
| PAPER PACKAGING—0.5% | | | | | | |
| Graphic Packaging Holding Co. | | 94,600 | | | | 1,256,288 |
| PHARMACEUTICALS—1.7% | | | | | | |
| Impax Laboratories, Inc.* | | 33,550 | | | | 1,118,892 |
| Pacira Pharmaceuticals, Inc.* | | 28,850 | | | | 1,561,074 |
| Revance Therapeutics, Inc.* | | 35,800 | | | | 658,004 |
| The Medicines Co.* | | 21,250 | | | | 756,287 |
| | | | | | | 4,094,257 |
- 34 -
THE ALGER INSTITUTIONAL FUNDS | ALGER SMALL CAP GROWTH INSTITUTIONAL FUND
Schedule of Investments April 30, 2016 (Unaudited) (Continued)
| | | | | | | |
| COMMON STOCKS—(CONT.) | | SHARES | | | | | VALUE |
| REGIONAL BANKS—2.3% | | | | | | | |
| Bank of the Ozarks, Inc. | | 42,600 | $ | | 1,759,380 |
| Boston Private Financial Holdings, Inc. | | 172,750 | | | | | 2,111,005 |
| Investors Bancorp, Inc. | | 138,100 | | | | | 1,595,055 |
| | | | | | | | 5,465,440 |
| RESTAURANTS—3.3% | | | | | | | |
| Dave & Buster's Entertainment, Inc.* | | 50,300 | | | | | 1,946,610 |
| Fiesta Restaurant Group, Inc.* | | 33,700 | | | | | 1,082,107 |
| Shake Shack, Inc., Cl. A* | | 61,600 | | | | | 2,249,632 |
| Wingstop, Inc.* | | 102,050 | | | | | 2,545,127 |
| | | | | | | | 7,823,476 |
| SEMICONDUCTORS—2.8% | | | | | | | |
| Cavium Networks, Inc.* | | 35,050 | | | | | 1,730,418 |
| Microsemi Corp.* | | 77,550 | | | | | 2,620,415 |
| Monolithic Power Systems, Inc. | | 38,650 | | | | | 2,412,533 |
| | | | | | | | 6,763,366 |
| SPECIALTY CHEMICALS—1.9% | | | | | | | |
| Balchem Corp. | | 74,530 | | | | | 4,573,161 |
| SPECIALTY STORES—0.9% | | | | | | | |
| Five Below, Inc.* | | 48,390 | | | | | 2,017,863 |
| SYSTEMS SOFTWARE—3.2% | | | | | | | |
| Fleetmatics Group PLC.* | | 51,500 | | | | | 1,866,875 |
| Proofpoint, Inc.* | | 57,546 | | | | | 3,352,630 |
| TubeMogul, Inc.* | | 188,900 | | | | | 2,448,144 |
| | | | | | | | 7,667,649 |
| TRADING COMPANIES & DISTRIBUTORS—1.1% | | | | | | | |
| Watsco, Inc. | | 18,700 | | | | | 2,514,589 |
| TOTAL COMMON STOCKS | | | | | | | |
| (Cost $214,642,880) | | | | | 220,671,873 |
| PREFERRED STOCKS—1.1% | | SHARES | | | | | VALUE |
| BIOTECHNOLOGY—0.5% | | | | | | | |
| Prosetta Biosciences, Inc.*,@,(a) | | 133,263 | | | | | 602,349 |
| Tolero Pharmaceuticals, Inc.*,@,(a) | | 448,284 | | | | | 591,735 |
| | | | | | | | 1,194,084 |
| PHARMACEUTICALS—0.6% | | | | | | | |
| Intarcia Therapeutics, Inc.*,@ | | 41,238 | | | | | 1,362,916 |
| TOTAL PREFERRED STOCKS | | | | | | | |
| (Cost $3,287,452) | | | | | | | 2,557,000 |
| RIGHTS—–% | | SHARES | | | | | VALUE |
| BIOTECHNOLOGY—–% | | | | | | | |
| Dyax Corp.* | | 21,650 | | | | | – |
| Neuralstem, Inc., 1/8/2019* | | 250,375 | | | | | – |
| | | | | | | | – |
| TOTAL RIGHTS | | | | | | | |
| (Cost $0) | | | | | | | – |
- 35 -
THE ALGER INSTITUTIONAL FUNDS | ALGER SMALL CAP GROWTH INSTITUTIONAL FUND
Schedule of Investments April 30, 2016 (Unaudited) (Continued)
| | | | | | | |
| REAL ESTATE INVESTMENT TRUST—3.0% | | SHARES | | | | | VALUE |
| SPECIALIZED—3.0% | | | | | | | |
| CyrusOne, Inc. | | 86,500 | | | $ | | 3,817,245 |
| Sovran Self Storage, Inc. | | 31,300 | | | | | 3,324,686 |
| | | | | | | | 7,141,931 |
| TOTAL REAL ESTATE INVESTMENT TRUST | | | | | | | |
| (Cost $5,188,034) | | | | | | | 7,141,931 |
| SPECIAL PURPOSE VEHICLE—0.3% | | SHARES | | | | | VALUE |
| CONSUMER FINANCE—0.3% | | | | | | | |
| JS Kred SPV I, LLC.@ | | 775,134 | | | | | 775,134 |
| (Cost $775,134) | | | | | | | 775,134 |
| Total Investments | | | | | | | |
| (Cost $223,893,500)(b) | | 97.1 | % | | 231,145,938 |
| Other Assets in Excess of Liabilities | | 2.9 | % | | | | 6,877,432 |
| NET ASSETS | | 100.0 | % | | $ | | 238,023,370 |
(a) Deemed an affiliate of the Alger fund complex during the year for purposes of Section 2(a)(3) of the Investment
Company Act of 1940. See Affiliated Securities in Notes to Financial Statements.
(b) At April 30, 2016, the net unrealized appreciation on investments, based on cost for federal income tax purposes
of $229,762,922, amounted to $1,383,016 which consisted of aggregate gross unrealized appreciation of
$21,938,309 and aggregate gross unrealized depreciation of $20,555,293.
* Non-income producing security.
@ Restricted security - Investment in security not registered under the Securities Act of 1933. The investment is deemed
to not be liquid and may be sold only to qualified buyers.
| | | | | | | | | |
| | | | | % of net assets | | | | % of net assets | |
| | Acquisition | | | (Acquisition | | | Market | as of | |
| Security | Date(s) | | Cost | Date) | | | Value | 4/30/2016 | |
| Intarcia Therapeutics, Inc. | 03/27/14 | $ | 1,335,699 | 0.15 | % | $ | 1,362,916 | 0.57 | % |
| JS Kred SPV I, LLC. | 06/26/15 | | 775,134 | 0.15 | % | | 775,134 | 0.33 | % |
| Prosetta Biosciences, Inc. | 02/06/15 | | 599,684 | 0.10 | % | | 602,349 | 0.25 | % |
| Tolero Pharmaceuticals, Inc. | 10/31/14 | | 1,352,069 | 0.20 | % | | 591,735 | 0.25 | % |
| Total | | | | | | $ | 3,332,134 | 1.40 | % |
| | | | | | | | | | |
| See Notes to Financial Statements. | | | | | | | | | |
- 36 -
THE ALGER INSTITUTIONAL FUNDS
Statement of Assets and Liabilities April 30, 2016 (Unaudited)
| | | | | | |
| | | Alger Capital | | | Alger Capital | |
| | | Appreciation | | Appreciation Focus | |
| | Institutional Fund | | | Fund | |
| |
| ASSETS: | | | | | | |
| Investments in securities, at value (Identified cost below)* | | | | | | |
| see accompanying schedules of investments | $ | 3,523,097,593 | | $ | 67,152,316 | |
| Investments in affiliated securities, at value (Identified cost | | | | | | |
| below)** see accompanying schedules of investments | | 1,554,055 | | | 347,249 | |
| Cash and cash equivalents | | 133,799,720 | | | 3,324,233 | |
| Receivable for investment securities sold | | 67,626,289 | | | 2,132,282 | |
| Receivable for shares of beneficial interest sold | | 8,612,380 | | | 90,551 | |
| Dividends and interest receivable | | 1,858,062 | | | 28,022 | |
| Receivable from Investment Manager | | — | | | 23,320 | |
| Prepaid expenses | | 277,828 | | | 50,642 | |
| Total Assets | | 3,736,825,927 | | | 73,148,615 | |
| |
| LIABILITIES: | | | | | | |
| Payable for investment securities purchased | | 68,228,750 | | | 2,275,479 | |
| Payable for shares of beneficial interest redeemed | | 12,879,887 | | | 101,390 | |
| Accrued investment advisory fees | | 2,249,498 | | | 41,604 | |
| Accrued transfer agent fees | | 920,611 | | | 20,826 | |
| Accrued distribution fees | | 247,758 | | | 12,740 | |
| Accrued administrative fees | | 84,074 | | | 1,611 | |
| Accrued shareholder servicing fees | | 764,309 | | | 5,168 | |
| Accrued shareholder administrative fees | | 30,572 | | | 774 | |
| Accrued other expenses | | 240,223 | | | 38,270 | |
| Total Liabilities | | 85,645,682 | | | 2,497,862 | |
| NET ASSETS | $ | 3,651,180,245 | | $ | 70,650,753 | |
| |
| NET ASSETS CONSIST OF: | | | | | | |
| Paid in capital (par value of $.001 per share) | | 3,456,961,176 | | | 72,038,511 | |
| Undistributed net investment income (accumulated loss) | | (14,405,430 | ) | | (324,641 | ) |
| Undistributed net realized gain (accumulated realized loss) | | (83,734,760 | ) | | (3,895,230 | ) |
| Net unrealized appreciation on investments | | 292,359,259 | | | 2,832,113 | |
| NET ASSETS | $ | 3,651,180,245 | | $ | 70,650,753 | |
| * Identified cost | $ | 3,229,896,310 | | $ | 64,321,738 | |
| ** Identified cost | $ | 2,396,079 | | $ | 345,713 | |
| See Notes to Financial Statements. | | | | | | |
- 37 -
THE ALGER INSTITUTIONAL FUNDS
Statement of Assets and Liabilities April 30, 2016 (Unaudited) (Continued)
| | | | |
| | | Alger Capital | | Alger Capital |
| | | Appreciation | Appreciation Focus |
| | Institutional Fund | | Fund |
| |
| NET ASSETS BY CLASS: | | | | |
| Class A | $ | — | $ | 25,889,187 |
| Class C | $ | — | $ | 8,847,645 |
| Class I | $ | 3,056,715,906 | $ | 24,535,130 |
| Class R | $ | 594,464,339 | $ | — |
| Class Z | $ | — | $ | 11,378,791 |
| |
| SHARES OF BENEFICIAL INTEREST OUTSTANDING — NOTE 6: | | | |
| Class A | | — | | 1,133,755 |
| Class C | | — | | 397,327 |
| Class I | | 120,505,848 | | 1,069,481 |
| Class R | | 25,721,849 | | — |
| Class Z | | — | | 491,690 |
| |
| NET ASSET VALUE PER SHARE: | | | | |
| Class A — Net Asset Value Per Share | $ | — | $ | 22.83 |
| Class A — Offering Price Per Share | | | | |
| (includes a 5.25% sales charge) | $ | — | $ | 24.10 |
| Class C — Net Asset Value Per Share | $ | — | $ | 22.27 |
| Class I — Net Asset Value Per Share | $ | 25.37 | $ | 22.94 |
| Class R — Net Asset Value Per Share | $ | 23.11 | $ | — |
| Class Z — Net Asset Value Per Share | $ | — | $ | 23.14 |
| See Notes to Financial Statements. | | | | |
- 38 -
THE ALGER INSTITUTIONAL FUNDS
Statement of Assets and Liabilities April 30, 2016 (Unaudited) (Continued)
| | | | | | |
| | | | | | Alger Small Cap | |
| | Alger Mid Cap Growth | | Growth Institutional | |
| | Institutional Fund | | | Fund | |
| |
| ASSETS: | | | | | | |
| Investments in securities, at value (Identified cost below)* | | | | | | |
| see accompanying schedules of investments | $ | 111,791,198 | | $ | 229,951,854 | |
| Investments in affiliated securities, at value (Identified cost | | | | | | |
| below)** see accompanying schedules of investments | | 1,315,696 | | | 1,194,084 | |
| Cash and cash equivalents | | 569,694 | | | 7,319,034 | |
| Receivable for investment securities sold | | 3,258,957 | | | 4,058,643 | |
| Receivable for shares of beneficial interest sold | | 56,857 | | | 212,857 | |
| Dividends and interest receivable | | 33,918 | | | 5,180 | |
| Prepaid expenses | | 21,615 | | | 68,056 | |
| Total Assets | | 117,047,935 | | | 242,809,708 | |
| |
| LIABILITIES: | | | | | | |
| Payable for investment securities purchased | | 3,000,589 | | | 2,995,183 | |
| Payable for shares of beneficial interest redeemed | | 331,451 | | | 1,315,461 | |
| Accrued investment advisory fees | | 72,337 | | | 165,141 | |
| Accrued transfer agent fees | | 49,803 | | | 148,424 | |
| Accrued distribution fees | | 6,162 | | | 6,003 | |
| Accrued administrative fees | | 2,617 | | | 5,607 | |
| Accrued shareholder servicing fees | | 23,795 | | | 50,970 | |
| Accrued shareholder administrative fees | | 952 | | | 2,039 | |
| Accrued other expenses | | 51,863 | | | 97,510 | |
| Total Liabilities | | 3,539,569 | | | 4,786,338 | |
| NET ASSETS | $ | 113,508,366 | | $ | 238,023,370 | |
| |
| NET ASSETS CONSIST OF: | | | | | | |
| Paid in capital (par value of $.001 per share) | | 396,339,370 | | | 245,371,105 | |
| Undistributed net investment income (accumulated loss) | | (670,068 | ) | | 2,000,206 | |
| Undistributed net realized gain (accumulated realized loss) | | (284,181,558 | ) | | (16,600,379 | ) |
| Net unrealized appreciation on investments | | 2,020,892 | | | 7,252,438 | |
| NET ASSETS | $ | 113,508,636 | | $ | 238,023,370 | |
| * Identified cost | $ | 109,117,591 | | $ | 221,941,747 | |
| ** Identified cost | $ | 1,968,412 | | $ | 1,951,753 | |
| See Notes to Financial Statements. | | | | | | |
- 39 -
THE ALGER INSTITUTIONAL FUNDS
Statement of Assets and Liabilities April 30, 2016 (Unaudited) (Continued)
| | | | |
| | | | | Alger Small Cap |
| | Alger Mid Cap Growth | Growth Institutional |
| | Institutional Fund | | Fund |
| |
| NET ASSETS BY CLASS: | | | | |
| Class I | $ | 98,716,014 | $ | 223,723,062 |
| Class R | $ | 14,792,352 | $ | 14,300,308 |
| |
| SHARES OF BENEFICIAL INTEREST OUTSTANDING — NOTE 6: | | | |
| Class I | | 4,664,719 | | 16,048,309 |
| Class R | | 753,768 | | 1,197,983 |
| |
| NET ASSET VALUE PER SHARE: | | | | |
| Class I — Net Asset Value Per Share | $ | 21.16 | $ | 13.94 |
| Class R — Net Asset Value Per Share | $ | 19.62 | $ | 11.94 |
| See Notes to Financial Statements. | | | | |
- 40 -
THE ALGER INSTITUTIONAL FUNDS
Statement of Operations For the six months ended April 30, 2016 (Unaudited)
| | | | | | |
| | | Alger Capital | | | Alger Capital | |
| | | Appreciation | | Appreciation Focus | |
| | Institutional Fund | | | Fund | |
| |
| INCOME: | | | | | | |
| Dividends (net of foreign withholding taxes*) | $ | 20,809,885 | | $ | 334,732 | |
| Interest | | 91,907 | | | 2,119 | |
| Total Income | | 20,901,792 | | | 336,851 | |
| |
| EXPENSES: | | | | | | |
| Advisory fees — Note 3(a) | | 13,521,916 | | | 240,512 | |
| Distribution fees — Note 3(c) | | | | | | |
| Class A | | — | | | 32,170 | |
| Class C | | — | | | 38,878 | |
| Class R | | 1,512,799 | | | — | |
| Shareholder servicing fees — Note 3(k) | | 4,588,715 | | | 30,507 | |
| Shareholder administrative fees — Note 3(f) | | 183,549 | | | 4,477 | |
| Administration fees — Note 3(b) | | 504,758 | | | 9,316 | |
| Custodian fees | | 108,925 | | | 30,162 | |
| Transfer agent fees and expenses — Note 3(f) | | 1,085,732 | | | 31,901 | |
| Printing fees | | 134,852 | | | 5,094 | |
| Professional fees | | 106,338 | | | 14,221 | |
| Registration fees | | 75,276 | | | 35,659 | |
| Trustee fees — Note 3(g) | | 73,378 | | | 1,461 | |
| Fund accounting fees | | 233,223 | | | 6,682 | |
| Miscellaneous | | 53,615 | | | 3,622 | |
| Total Expenses | | 22,183,076 | | | 484,662 | |
| Less, expense reimbursements/waivers — Note 3(a) | | — | | | (64,428 | ) |
| Net Expenses | | 22,183,076 | | | 420,234 | |
| NET INVESTMENT LOSS | | (1,281,284 | ) | | (83,383 | ) |
| |
| REALIZED AND UNREALIZED GAIN (LOSS) ON INVESTMENTS, OPTIONS AND FOREIGN CURRENCY: | |
| Net realized gain (loss) on investments | | 21,543,170 | | | (2,832,818 | ) |
| Net realized (loss) on foreign currency transactions | | (14,707 | ) | | — | |
| Net change in unrealized (depreciation) on investments, | | | | | | |
| options and foreign currency | | (180,558,304 | ) | | (588,307 | ) |
| Net realized and unrealized (loss) on investments, options, | | | | | | |
| and foreign currency | | (159,029,841 | ) | | (3,421,125 | ) |
| NET DECREASE IN NET ASSETS RESULTING FROM | | | | | | |
| OPERATIONS | $ | (160,311,125 | ) | $ | (3,504,508 | ) |
| * Foreign withholding taxes | $ | 92,083 | | $ | — | |
| See Notes to Financial Statements. | | | | | | |
- 41 -
THE ALGER INSTITUTIONAL FUNDS
Statement of Operations For the six months ended April 30, 2016 (Unaudited) (Continued)
| | | | | | |
| | | | | | Alger Small Cap | |
| | Alger Mid Cap Growth | | Growth Institutional | |
| | Institutional Fund | | | Fund | |
| |
| INCOME: | | | | | | |
| Dividends | $ | 425,699 | | $ | 721,683 | |
| Interest | | 1,968 | | | 1,370 | |
| Total Income | | 427,667 | | | 723,053 | |
| |
| EXPENSES: | | | | | | |
| Advisory fees — Note 3(a) | | 450,655 | | | 1,196,112 | |
| Distribution fees — Note 3(c) | | | | | | |
| Class R | | 38,716 | | | 38,684 | |
| Shareholder servicing fees — Note 3(k) | | 148,242 | | | 369,170 | |
| Shareholder administrative fees — Note 3(f) | | 5,929 | | | 14,767 | |
| Administration fees — Note 3(b) | | 16,306 | | | 40,609 | |
| Custodian fees | | 23,845 | | | 29,946 | |
| Interest expenses | | — | | | 5,757 | |
| Transfer agent fees and expenses — Note 3(f) | | 52,946 | | | 99,344 | |
| Printing fees | | 1,700 | | | 17,480 | |
| Professional fees | | 22,879 | | | 24,975 | |
| Registration fees | | 2,352 | | | 38,815 | |
| Trustee fees — Note 3(g) | | 2,484 | | | 5,557 | |
| Fund accounting fees | | 8,035 | | | 17,781 | |
| Miscellaneous | | 5,347 | | | 7,870 | |
| Total Expenses | | 779,436 | | | 1,906,867 | |
| NET INVESTMENT LOSS | | (351,769 | ) | | (1,183,814 | ) |
| |
| REALIZED AND UNREALIZED GAIN (LOSS) ON INVESTMENTS, OPTIONS AND FOREIGN CURRENCY: | |
| Net realized (loss) on investments | | (4,050,057 | ) | | (11,100,828 | ) |
| Net change in unrealized (depreciation) on investments, | | | | | | |
| options and foreign currency | | (3,790,954 | ) | | (22,576,081 | ) |
| Net realized and unrealized (loss) on investments, options, | | | | | | |
| and foreign currency | | (7,841,011 | ) | | (33,676,909 | ) |
| NET DECREASE IN NET ASSETS RESULTING FROM | | | | | | |
| OPERATIONS | $ | (8,192,780 | ) | $ | (34,860,723 | ) |
| See Notes to Financial Statements. | | | | | | |
- 42 -
THE ALGER INSTITUTIONAL FUNDS
Statements of Changes in Net Assets (Unaudited)
| | | | | | | |
| | Alger Capital Appreciation Institutional Fund | |
| | | | For the | | | For the | |
| | | | Six Months Ended | | | Year Ended | |
| | | | April 30, 2016 | | | October 31, 2015 | |
| |
| Net investment loss | $ | (1,281,284 | ) | $ | (5,661,878 | ) |
| Net realized gain on investments, options and foreign currency | | | 21,528,463 | | | 293,239,703 | |
| Net change in unrealized appreciation (depreciation) on | | | | | | | |
| investments, options and foreign currency | | | (180,558,304 | ) | | 25,070,288 | |
| Net increase (decrease) in net assets resulting from operations | | | (160,311,125 | ) | | 312,648,113 | |
| |
| Dividends and distributions to shareholders from: | | | | | | | |
| Net realized gains: | | | | | | | |
| Class I | | | (229,560,756 | ) | | (321,833,735 | ) |
| Class R | | | (50,476,174 | ) | | (64,146,416 | ) |
| Total dividends and distributions to shareholders | | | (280,036,930 | ) | | (385,980,151 | ) |
| |
| Increase (decrease) from shares of beneficial interest transactions: | | | | | | |
| Class I | | | 223,058,987 | | | 693,918,464 | |
| Class R | | | 17,739,614 | | | 144,649,699 | |
| Net increase from shares of beneficial interest transactions — | | | | | | | |
| Note 6(a) | | | 240,798,601 | | | 838,568,163 | |
| Total increase (decrease) | | | (199,549,454 | ) | | 765,236,125 | |
| |
| Net Assets: | | | | | | | |
| Beginning of period | | | 3,850,729,699 | | | 3,085,493,574 | |
| END OF PERIOD | $ | 3,651,180,245 | | $ | 3,850,729,699 | |
| Undistributed net investment income (accumulated loss) | $ | (14,405,430 | ) | $ | (9,105,013 | ) |
| See Notes to Financial Statements. | | | | | | | |
- 43 -
THE ALGER INSTITUTIONAL FUNDS
Statements of Changes in Net Assets (Unaudited) (Continued)
| | | | | | | |
| | | | Alger Capital Appreciation Focus Fund | |
| | | | For the | | | For the | |
| | | | Six Months Ended | | | Year Ended | |
| | | | April 30, 2016 | | | October 31, 2015 | |
| |
| Net investment loss | $ | (83,383 | ) | $ | (42,037 | ) |
| Net realized gain (loss) on investments, options and foreign | | | | | | | |
| currency | | | (2,832,818 | ) | | 2,309,907 | |
| Net change in unrealized appreciation (depreciation) on | | | | | | | |
| investments, options and foreign currency | | | (588,307 | ) | | 1,268,548 | |
| Net increase (decrease) in net assets resulting from operations | | | (3,504,508 | ) | | 3,536,418 | |
| |
| Dividends and distributions to shareholders from: | | | | | | | |
| Net realized gains: | | | | | | | |
| Class A | | | (316,453 | ) | | — | |
| Class C | | | (87,313 | ) | | — | |
| Class I | | | (274,831 | ) | | — | |
| Class Z | | | (120,412 | ) | | — | |
| Total dividends and distributions to shareholders | | | (799,009 | ) | | — | |
| |
| Increase (decrease) from shares of beneficial interest transactions: | | | | | | |
| Class A | | | 3,609,012 | | | 16,877,719 | |
| Class C | | | 2,783,922 | | | 3,632,471 | |
| Class I | | | 1,511,803 | | | 10,433,186 | |
| Class Z | | | 8,376,754 | | | 2,241,175 | |
| Net increase from shares of beneficial interest transactions — | | | | | | | |
| Note 6(a) | | | 16,281,491 | | | 33,184,551 | |
| |
| Redemption Fees: | | | | | | | |
| Class A | | | — | | | 180 | |
| Total Redemption Fees — Note 6(b) | | | — | | | 180 | |
| Total increase | | | 11,977,974 | | | 36,721,149 | |
| |
| Net Assets: | | | | | | | |
| Beginning of period | | | 58,672,779 | | | 21,951,630 | |
| END OF PERIOD | $ | 70,650,753 | | $ | 58,672,779 | |
| Undistributed net investment income (accumulated loss) | $ | (324,641 | ) | $ | (164,935 | ) |
| See Notes to Financial Statements. | | | | | | | |
- 44 -
THE ALGER INSTITUTIONAL FUNDS
Statements of Changes in Net Assets (Unaudited) (Continued)
| | | | | | | | |
| | | Alger Mid Cap Growth Institutional Fund | |
| | | | For the | | | | For the | |
| | | | Six Months Ended | | | | Year Ended | |
| | | | April 30, 2016 | | | | October 31, 2015 | |
| |
| Net investment loss | $ | (351,769 | ) | $ | (930,358 | ) |
| Net realized gain (loss) on investments, options and foreign | | | | | | | | |
| currency | | | (4,050,057 | ) | | | 6,256,111 | |
| Net realized loss on written options | | | — | | | | (85,147 | ) |
| Net change in unrealized depreciation on investments, options | | | | | | | | |
| and foreign currency | | | (3,790,954 | ) | | | (2,097,299 | ) |
| Net change in unrealized depreciation on investments, written | | | | | | | | |
| options | | | — | | | | (48,165 | ) |
| Net increase (decrease) in net assets resulting from operations | | | (8,192,780 | ) | | | 3,095,142 | |
| |
| Increase (decrease) from shares of beneficial interest transactions: | | | | | | | |
| Class I | | | (9,186,123 | ) | | | (20,175,331 | ) |
| Class R | | | (1,891,284 | ) | | | (4,520,619 | ) |
| Net decrease from shares of beneficial interest transactions | | | | | | | | |
| — Note 6(a) | | | (11,077,407 | ) | | | (24,695,950 | ) |
| Total decrease | | | (19,270,187 | ) | | | (21,600,808 | ) |
| |
| Net Assets: | | | | | | | | |
| Beginning of period | | | 132,778,553 | | | | 154,379,361 | |
| END OF PERIOD | $ | 113,508,366 | | $ | 132,778,553 | |
| Undistributed net investment income (accumulated loss) | $ | (670,068 | ) | $ | (1,080,394 | ) |
| See Notes to Financial Statements. | | | | | | | | |
- 45 -
THE ALGER INSTITUTIONAL FUNDS
Statements of Changes in Net Assets (Unaudited) (Continued)
| | | | | | | |
| | | Alger Small Cap Growth Institutional Fund | |
| | | | For the | | | For the | |
| | | | Six Months Ended | | | Year Ended | |
| | | | April 30, 2016 | | | October 31, 2015 | |
| |
| Net investment loss | $ | (1,183,814 | ) | $ | (4,446,611 | ) |
| Net realized gain (loss) on investments, options and foreign | | | | | | | |
| currency | | | (11,100,828 | ) | | 116,168,863 | |
| Net change in unrealized depreciation on investments, options | | | | | | | |
| and foreign currency | | | (22,576,081 | ) | | (95,572,078 | ) |
| Net increase (decrease) in net assets resulting from operations | | | (34,860,723 | ) | | 16,150,174 | |
| |
| Dividends and distributions to shareholders from: | | | | | | | |
| Net realized gains: | | | | | | | |
| Class I | | | (112,158,310 | ) | | (115,227,005 | ) |
| Class R | | | (6,331,284 | ) | | (5,978,217 | ) |
| Total dividends and distributions to shareholders | | | (118,489,594 | ) | | (121,205,222 | ) |
| |
| Increase (decrease) from shares of beneficial interest transactions: | | | | | | |
| Class I | | | 11,857,459 | | | (202,968,640 | ) |
| Class R | | | 3,750,286 | | | (6,964,356 | ) |
| Net increase (decrease) from shares of beneficial interest | | | | | | | |
| transactions — Note 6(a) | | | 15,607,745 | | | (209,932,996 | ) |
| Total decrease | | | (137,742,572 | ) | | (314,988,044 | ) |
| |
| Net Assets: | | | | | | | |
| Beginning of period | | | 375,765,942 | | | 690,753,986 | |
| END OF PERIOD | $ | 238,023,370 | | $ | 375,765,942 | |
| Undistributed net investment income (accumulated loss) | $ | 2,000,206 | | $ | (3,790,706 | ) |
| See Notes to Financial Statements. | | | | | | | |
- 46 -
THE ALGER INSTITUTIONAL FUNDS
Financial Highlights for a share outstanding throughout the period (Unaudited)
| | | | | | | | | | | | | | | | | | | | | | | | | | | |
| Alger Capital Appreciation | | | | | | | | | | | | | | | | | | | | | | | | | | | |
| Institutional Fund | | | | | | | | | | | | | Class I | | | | | | | | | |
| | | Six months | | | | | | | | | | | | | | | | | | | | | | | | |
| | | | ended | | | Year ended | | | Year ended | | | Year ended | | | Year ended | | | Year ended | |
| | | 4/30/2016 | (i) | | 10/31/2015 | | | 10/31/2014 | | | 10/31/2013 | | | 10/31/2012 | | | 10/31/2011 | |
| Net asset value, beginning of period | | $ | 28.48 | | $ | | | 29.34 | | $ | | | 28.21 | | $ | | | 22.85 | | $ | | 20.88 | | $ | | 19.28 | |
| INCOME FROM INVESTMENT | | | | | | | | | | | | | | | | | | | | | | | | | | | |
| OPERATIONS: | | | | | | | | | | | | | | | | | | | | | | | | | | | |
| Net investment income (loss)(ii) | | | – | | | | | (0.02 | ) | | | | (0.02 | ) | | | | 0.16 | | | | 0.09 | | | | (0.01 | ) |
| Net realized and unrealized gain (loss) | | | | | | | | | | | | | | | | | | | | | | | | | | | |
| on investments | | | (1.07 | ) | | | | 2.46 | | | | | 4.57 | | | | | 6.21 | | | | 2.64 | | | | 1.61 | |
| Total from investment operations | | | (1.07 | ) | | | | 2.44 | | | | | 4.55 | | | | | 6.37 | | | | 2.73 | | | | 1.60 | |
| Dividends from net investment income | – | | | | | – | | | | | (0.01 | ) | | | | (0.17 | ) | | | – | | | | – | |
| Distributions from net realized gains | | | (2.04 | ) | | | | (3.30 | ) | | | | (3.41 | ) | | | | (0.84 | ) | | | (0.76 | ) | | | – | |
| Net asset value, end of period | | $ | 25.37 | | $ | | | 28.48 | | $ | | | 29.34 | | $ | | | 28.21 | | $ | | 22.85 | | $ | | 20.88 | |
| Total return | | | (4.12 | )% | | | | 8.96 | % | | | | 17.63 | % | | | | 29.02 | % | | | 13.70 | % | | | 8.30 | % |
| RATIOS/SUPPLEMENTAL DATA: | | | | | | | | | | | | | | | | | | | | | | | | | | | |
| Net assets, end of period (000's | | | | | | | | | | | | | | | | | | | | | | | | | | | |
| omitted) | $ | 3,056,716 | | $ | 3,194,261 | | $ | 2,555,737 | | $ | 1,958,405 | | $ | 1,470,078 | | $ | 1,041,609 | |
| Ratio of gross expenses to average | | | | | | | | | | | | | | | | | | | | | | | | | | | |
| net assets | | | 1.13 | % | | | | 1.12 | % | | | | 1.16 | % | | | | 1.19 | % | | | 1.19 | % | | | 1.17 | % |
| Ratio of expense reimbursements to | | | | | | | | | | | | | | | | | | | | | | | | | | | |
| average net assets | | | – | | | | | – | | | | | – | | | | | – | | | | – | | | | – | |
| Ratio of net expenses to average net | | | | | | | | | | | | | | | | | | | | | | | | | | | |
| assets | | | 1.13 | % | | | | 1.12 | % | | | | 1.16 | % | | | | 1.19 | % | | | 1.19 | % | | | 1.17 | % |
| Ratio of net investment income (loss) to | | | | | | | | | | | | | | | | | | | | | | | | | | | |
| average net assets | | | 0.01 | % | | | | (0.07 | )% | | | | (0.07 | )% | | | | 0.65 | % | | | 0.41 | % | | | (0.04 | )% |
| | | | | | | | | | | | | | | | | | | | | | | | | | | | |
| Portfolio turnover rate | | | 60.02 | % | | 136.03%(iii) | | | | | 136.20%(iv) | | | | | 124.43 | % | | | 137.16 | % | | | 153.30 | % |
| See Notes to Financial Statements. | | | | | | | | | | | | | | | | | | | | | | | | | |
(i) Ratios have been annualized; total return and portfolio turnover rate have not been annualized.
(ii) Amount was computed based on average shares outstanding during the period.
(iii) Amount excludes redemption in kind transaction of $294,638,130. Please see note 6 to the financial statements.
(iv) Amount excludes redemption in kind transaction of $71,436,408.
- 47 -
THE ALGER INSTITUTIONAL FUNDS
Financial Highlights for a share outstanding throughout the period (Unaudited)
| | | | | | | | | | | | | | | | | | | | | | | | | | | | | |
| Alger Capital Appreciation | | | | | | | | | | | | | | | | | | | | | | | | | | | | | |
| Institutional Fund | | | | | | | | | | | | | Class R | | | | | | | | | | |
| | | Six months | | | | | | | | | | | | | | | | | | | | | | | | | | |
| | | | ended | | | Year ended | | | Year ended | | | Year ended | | | Year ended | | | Year ended | |
| | | 4/30/2016 | (i) | | 10/31/2015 | | | 10/31/2014 | | | | | 10/31/2013 | | | 10/31/2012 | | | 10/31/2011 | |
| Net asset value, beginning of period | | $ | 26.19 | | | $ | | 27.35 | | | $ | | 26.63 | | | $ | 21.76 | | | $ | 20.01 | | | $ | | 18.57 | |
| INCOME FROM INVESTMENT | | | | | | | | | | | | | | | | | | | | | | | | | | | | | |
| OPERATIONS: | | | | | | | | | | | | | | | | | | | | | | | | | | | | | |
| Net investment income (loss)(ii) | | | (0.06 | ) | | | | (0.15 | ) | | | | (0.14 | ) | | | | | 0.04 | | | | (0.02 | ) | | | | (0.11 | ) |
| Net realized and unrealized gain (loss) | | | | | | | | | | | | | | | | | | | | | | | | | | | | | |
| on investments | | | (0.98 | ) | | | | 2.29 | | | | | 4.27 | | | | | | 5.87 | | | | 2.53 | | | | | 1.55 | |
| Total from investment operations | | | (1.04 | ) | | | | 2.14 | | | | | 4.13 | | | | | | 5.91 | | | | 2.51 | | | | | 1.44 | |
| Dividends from net investment income | – | | | | | – | | | | | – | | | | | | (0.20 | ) | | | – | | | | | – | |
| Distributions from net realized gains | | | (2.04 | ) | | | | (3.30 | ) | | | | (3.41 | ) | | | | | (0.84 | ) | | | (0.76 | ) | | | | – | |
| Net asset value, end of period | | $ | 23.11 | | | $ | | 26.19 | | | $ | | 27.35 | | | $ | 26.63 | | | $ | 21.76 | | | $ | | 20.01 | |
| Total return | | | (4.38 | )% | | | | 8.46 | % | | | | 17.04 | % | | | | | 28.35 | % | | | 13.20 | % | | | | 7.80 | % |
| RATIOS/SUPPLEMENTAL DATA: | | | | | | | | | | | | | | | | | | | | | | | | | | | | | |
| Net assets, end of period (000's | | | | | | | | | | | | | | | | | | | | | | | | | | | | | |
| omitted) | $ | 594,464 | | $ | 656,469 | | $ | 529,757 | | $ | 442,449 | | $ | 347,634 | | $ | 227,260 | |
| Ratio of gross expenses to average | | | | | | | | | | | | | | | | | | | | | | | | | | | | | |
| net assets | | | 1.61 | % | | | | 1.61 | % | | | | 1.64 | % | | | | | 1.69 | % | | | 1.69 | % | | | | 1.68 | % |
| Ratio of expense reimbursements to | | | | | | | | | | | | | | | | | | | | | | | | | | | | | |
| average net assets | | | – | | | | | – | | | | | – | | | | | | – | | | | – | | | | | – | |
| Ratio of net expenses to average net | | | | | | | | | | | | | | | | | | | | | | | | | | | | | |
| assets | | | 1.61 | % | | | | 1.61 | % | | | | 1.64 | % | | | | | 1.69 | % | | | 1.69 | % | | | | 1.68 | % |
| Ratio of net investment income (loss) to | | | | | | | | | | | | | | | | | | | | | | | | | | | | | |
| average net assets | | | (0.47 | )% | | | | (0.57 | )% | | | | (0.55 | )% | | | | | 0.17 | % | | | (0.09 | )% | | | | (0.56 | )% |
| | | | | | | | | | | | | | | | | | | | | | | | | | | | | | |
| Portfolio turnover rate | | | 60.02 | % | | 136.03%(iii) | | | | | 136.20%(iv) | | | | | | 124.43 | % | | | 137.16 | % | | | | 153.30 | % |
| See Notes to Financial Statements. | | | | | | | | | | | | | | | | | | | | | | | | | | | |
(i) Ratios have been annualized; total return and portfolio turnover rate have not been annualized.
(ii) Amount was computed based on average shares outstanding during the period.
(iii) Amount excludes redemption in kind transaction of $294,638,130. Please see note 6 to the financial statements.
(iv) Amount excludes redemption in kind transaction of $71,436,408.
- 48 -
THE ALGER INSTITUTIONAL FUNDS
Financial Highlights for a share outstanding throughout the period (Unaudited)
| | | | | | | | | | | | | | | | | | | |
| Alger Capital Appreciation Focus | | | | | | | | | | | | | | | | | | | |
| Fund | | | | | | | | Class A | | | | | | |
| | | | | | | | | | | | | | | | From 12/31/2012 | |
| | | | Six months ended 4/30/2016(i) | | | | | Year ended 10/31/2015 | | | | | Year ended 10/31/2014 | | | | | (commencement of operations) to 10/31/2013 (ii) | |
| Net asset value, beginning of period | | $ | 24.13 | | | $ | | 22.01 | | $ | 18.69 | | $ | 14.70 | |
| INCOME FROM INVESTMENT | | | | | | | | | | | | | | | | | | | |
| OPERATIONS: | | | | | | | | | | | | | | | | | | | |
| Net investment loss(iii) | | | (0.03 | ) | | | | (0.02 | ) | | | | (0.04 | ) | | | | (0.01 | ) |
| Net realized and unrealized gain (loss) | | | | | | | | | | | | | | | | | | | |
| on investments | | | (1.00 | ) | | | | 2.14 | | | | | 3.36 | | | | | 4.00 | |
| Total from investment operations | | | (1.03 | ) | | | | 2.12 | | | | | 3.32 | | | | | 3.99 | |
| Distributions from net realized gains | | | (0.27 | ) | | | | – | | | | | – | | | | | – | |
| Net asset value, end of period | | $ | 22.83 | | | $ | | 24.13 | | $ | 22.01 | | $ | 18.69 | |
| Total return(iv) | | | (4.33 | )% | | | | 9.63 | % | | | | 17.76 | % | | | | 27.14 | % |
| RATIOS/SUPPLEMENTAL DATA: | | | | | | | | | | | | | | | | | | | |
| Net assets, end of period (000's | | | | | | | | | | | | | | | | | | | |
| omitted) | $ | 25,889 | | $ | 23,961 | | $ | 5,158 | | $ | 3,496 | |
| Ratio of gross expenses to average | | | | | | | | | | | | | | | | | | | |
| net assets | | | 1.36 | % | | | | 1.48 | % | | | | 2.38 | % | | | | 2.49 | % |
| Ratio of expense reimbursements to | | | | | | | | | | | | | | | | | | | |
| average net assets | | | (0.12 | )% | | | | (0.18 | )% | | | | (1.08 | )% | | | | (1.19 | )% |
| Ratio of net expenses to average net | | | | | | | | | | | | | | | | | | | |
| assets | | | 1.24 | % | | | | 1.30 | % | | | | 1.30 | % | | | | 1.30 | % |
| Ratio of net investment income (loss) to | | | | | | | | | | | | | | | | | | | |
| average net assets | | | (0.23 | )% | | | | (0.08 | )% | | | | (0.19 | )% | | | | (0.09 | )% |
| Portfolio turnover rate | | | 76.60 | % | | | | 182.58 | % | | | | 153.69 | % | | | | 166.61 | % |
| See Notes to Financial Statements. | | | | | | | | | | | | | | | | | |
(i) Ratios have been annualized; total return and portfolio turnover rate have not been annualized.
(ii) Ratios have been annualized; total return has not been annualized; portfolio turnover is for the twelve months then ended.
(iii) Amount was computed based on average shares outstanding during the period.
(iv) Does not reflect the effect of sales charges, if applicable.
- 49 -
THE ALGER INSTITUTIONAL FUNDS
Financial Highlights for a share outstanding throughout the period (Unaudited)
| | | | | | | | | | | | | | | | | |
| Alger Capital Appreciation Focus | | | | | | | | | | | | | | | | | |
| Fund | | | | | | Class C | | | | | | |
| | | | | | | | | | | | | | From 12/31/2012 | |
| | Six months ended 4/30/2016(i) | | | | Year ended 10/31/2015 | | | | | Year ended 10/31/2014 | | | | | (commencement of operations) to 10/31/2013(ii) | |
| Net asset value, beginning of period | $ | 23.62 | | $ | | 21.71 | | $ | 18.58 | | $ | 14.70 | |
| INCOME FROM INVESTMENT | | | | | | | | | | | | | | | | | |
| OPERATIONS: | | | | | | | | | | | | | | | | | |
| Net investment loss(iii) | | (0.11 | ) | | | (0.20 | ) | | | | (0.19 | ) | | | | (0.11 | ) |
| Net realized and unrealized gain (loss) | | | | | | | | | | | | | | | | | |
| on investments | | (0.97 | ) | | | 2.11 | | | | | 3.32 | | | | | 3.99 | |
| Total from investment operations | | (1.08 | ) | | | 1.91 | | | | | 3.13 | | | | | 3.88 | |
| Distributions from net realized gains | | (0.27 | ) | | | – | | | | | – | | | | | – | |
| Net asset value, end of period | $ | 22.27 | | $ | | 23.62 | | $ | 21.71 | | $ | 18.58 | |
| Total return(iv) | | (4.64 | )% | | | | 8.80 | % | | | | 16.85 | % | | | | 26.39 | % |
| RATIOS/SUPPLEMENTAL DATA: | | | | | | | | | | | | | | | | | |
| Net assets, end of period (000's | | | | | | | | | | | | | | | | | |
| omitted) | $ | 8,848 | | $ | | 6,542 | | $ | 2,635 | | $ | 1,913 | |
| Ratio of gross expenses to average | | | | | | | | | | | | | | | | | |
| net assets | | 2.17 | % | | | 2.25 | % | | | | 3.14 | % | | | | 3.27 | % |
| Ratio of expense reimbursements to | | | | | | | | | | | | | | | | | |
| average net assets | | (0.20 | )% | | | | (0.20 | )% | | | | (1.09 | )% | | | | (1.22 | )% |
| Ratio of net expenses to average net | | | | | | | | | | | | | | | | | |
| assets | | 1.97 | % | | | 2.05 | % | | | | 2.05 | % | | | | 2.05 | % |
| Ratio of net investment income (loss) to | | | | | | | | | | | | | | | | | |
| average net assets | | (0.99 | )% | | | | (0.85 | )% | | | | (0.94 | )% | | | | (0.83 | )% |
| Portfolio turnover rate | | 76.60 | % | | | 182.58 | % | | | | 153.69 | % | | | | 166.61 | % |
| See Notes to Financial Statements. | | | | | | | | | | | | | | | | |
(i) Ratios have been annualized; total return and portfolio turnover rate have not been annualized.
(ii) Ratios have been annualized; total return has not been annualized; portfolio turnover is for the twelve months then ended.
(iii) Amount was computed based on average shares outstanding during the period.
(iv) Does not reflect the effect of sales charges, if applicable.
- 50 -
THE ALGER INSTITUTIONAL FUNDS
Financial Highlights for a share outstanding throughout the period (Unaudited)
| | | | | | | | | | | | | | | | | | | | | | | | | | | | |
| Alger Capital Appreciation Focus | | | | | | | | | | | | | | | | | | | | | | | | | | | | |
| Fund | | | | | | | | | | | | | Class I | | | | | | | | | | | |
| | | Six months | | | | | | | | | | | | | | | | | | | | | | | | | |
| | | | ended | | | Year ended | | | Year ended | | Year ended | | | Year ended | | | Year ended | |
| | | 4/30/2016 | (i) | | 10/31/2015 | | | 10/31/2014 | | 10/31/2013 | | | 10/31/2012 | | | 10/31/2011 | |
| Net asset value, beginning of period | | $ | 24.23 | | | $ | | 22.07 | | | $ | | 18.72 | | $ | | 14.53 | | | $ | | 13.75 | | | $ | | 13.03 | |
| INCOME FROM INVESTMENT | | | | | | | | | | | | | | | | | | | | | | | | | | | | |
| OPERATIONS: | | | | | | | | | | | | | | | | | | | | | | | | | | | | |
| Net investment income (loss)(ii) | | | (0.02 | ) | | | | 0.01 | | | | | (0.01 | ) | | | 0.15 | | | | | (0.03 | ) | | | | (0.04 | ) |
| Net realized and unrealized gain (loss) | | | | | | | | | | | | | | | | | | | | | | | | | | | | |
| on investments | | | (1.00 | ) | | | | 2.15 | | | | | 3.36 | | | | 4.04 | | | | | 0.81 | | | | | 0.86 | |
| Total from investment operations | | | (1.02 | ) | | | | 2.16 | | | | | 3.35 | | | | 4.19 | | | | | 0.78 | | | | | 0.82 | |
| Dividends from net investment income | – | | | | | – | | | | | – | | | | – | | | | | – | | | | | (0.10 | ) |
| Distributions from net realized gains | | | (0.27 | ) | | | | – | | | | | – | | | | – | | | | | – | | | | | – | |
| Net asset value, end of period | | $ | 22.94 | | | $ | | 24.23 | | | $ | | 22.07 | | $ | | 18.72 | | | $ | | 14.53 | | | $ | | 13.75 | |
| Total return(iii) | | | (4.28 | )% | | | | 9.79 | % | | | | 17.90 | % | | | 28.84 | % | | | | 5.70 | % | | | | 6.30 | % |
| RATIOS/SUPPLEMENTAL DATA: | | | | | | | | | | | | | | | | | | | | | | | | | | | | |
| Net assets, end of period (000's | | | | | | | | | | | | | | | | | | | | | | | | | | | | |
| omitted) | $ | 24,535 | | $ | 24,487 | | $ | 12,897 | | $ | | 8,684 | | $ | 15,101 | | $ | 16,294 | |
| Ratio of gross expenses to average | | | | | | | | | | | | | | | | | | | | | | | | | | | | |
| net assets | | | 1.39 | % | | | | 1.49 | % | | | | 2.36 | % | | | 2.32 | % | | | | 1.83 | % | | | | 1.69 | % |
| Ratio of expense reimbursements to | | | | | | | | | | | | | | | | | | | | | | | | | | | | |
| average net assets | | | (0.24 | )% | | | | (0.34 | )% | | | | (1.21 | )% | | | (0.94 | )% | | | | – | | | | | – | |
| Ratio of net expenses to average net | | | | | | | | | | | | | | | | | | | | | | | | | | | | |
| assets | | | 1.15 | % | | | | 1.15 | % | | | | 1.15 | % | | | 1.38 | % | | | | 1.83 | % | | | | 1.69 | % |
| Ratio of net investment income (loss) to | | | | | | | | | | | | | | | | | | | | | | | | | | | | |
| average net assets | | | (0.14 | )% | | | | 0.03 | % | | | | (0.04 | )% | | | 0.95 | % | | | | (0.22 | )% | | | | (0.27 | )% |
| Portfolio turnover rate | | | 76.60 | % | | | | 182.58 | % | | | | 153.69 | % | | | 166.61 | % | | | | 153.72 | % | | | | 57.74 | % |
| See Notes to Financial Statements. | | | | | | | | | | | | | | | | | | | | | | | | | | |
(i) Ratios have been annualized; total return and portfolio turnover rate have not been annualized.
(ii) Amount was computed based on average shares outstanding during the period.
(iii) Does not reflect the effect of sales charges, if applicable.
- 51 -
THE ALGER INSTITUTIONAL FUNDS
Financial Highlights for a share outstanding throughout the period (Unaudited)
| | | | | | | | | | | | | | | | | | |
| Alger Capital Appreciation Focus | | | | | | | | | | | | | | | | | | |
| Fund | | | | | | | Class Z | | | | | | |
| | | | | | | | | | | | | | | From 12/31/2012 | |
| | | | Six months ended 4/30/2016 (i) | | | | Year ended 10/31/2015 | | | | | Year ended 10/31/2014 | | | | | (commencement of operations) to 10/31/2013 (ii) | |
| Net asset value, beginning of period | | $ | 24.41 | | $ | | 22.17 | | $ | 18.75 | | $ | 14.70 | |
| INCOME FROM INVESTMENT | | | | | | | | | | | | | | | | | | |
| OPERATIONS: | | | | | | | | | | | | | | | | | | |
| Net investment income(iii) | | | 0.01 | | | | 0.07 | | | | | 0.05 | | | | | 0.04 | |
| Net realized and unrealized gain (loss) | | | | | | | | | | | | | | | | | | |
| on investments | | | (1.01 | ) | | | 2.17 | | | | | 3.37 | | | | | 4.01 | |
| Total from investment operations | | | (1.00 | ) | | | 2.24 | | | | | 3.42 | | | | | 4.05 | |
| Distributions from net realized gains | | | (0.27 | ) | | | – | | | | | – | | | | | – | |
| Net asset value, end of period | | $ | 23.14 | | $ | | 24.41 | | $ | 22.17 | | $ | 18.75 | |
| Total return(iv) | | | (4.16 | | | )% | 10.10 | % | | | | 18.24 | % | | | | 27.55 | % |
| RATIOS/SUPPLEMENTAL DATA: | | | | | | | | | | | | | | | | | | |
| Net assets, end of period (000's | | | | | | | | | | | | | | | | | | |
| omitted) | $ | 11,379 | | $ | | 3,683 | | $ | 1,262 | | $ | 128 | |
| Ratio of gross expenses to average | | | | | | | | | | | | | | | | | | |
| net assets | | | 1.16 | % | | | 1.50 | % | | | | 4.78 | % | | | | 10.11 | % |
| Ratio of expense reimbursements to | | | | | | | | | | | | | | | | | | |
| average net assets | | | (0.26 | )% | | | (0.61 | )% | | | | (3.89 | )% | | | | (9.22 | )% |
| Ratio of net expenses to average net | | | | | | | | | | | | | | | | | | |
| assets | | | 0.90 | % | | | 0.89 | % | | | | 0.89 | % | | | | 0.89 | % |
| Ratio of net investment income (loss) to | | | | | | | | | | | | | | | | | | |
| average net assets | | | 0.06 | % | | | 0.30 | % | | | | 0.23 | % | | | | 0.32 | % |
| Portfolio turnover rate | | | 76.60 | % | | | 182.58 | % | | | | 153.69 | % | | | | 166.61 | % |
| See Notes to Financial Statements. | | | | | | | | | | | | | | | | |
(i) Ratios have been annualized; total return and portfolio turnover rate have not been annualized.
(ii) Ratios have been annualized; total return has not been annualized; portfolio turnover is for the twelve months then ended.
(iii) Amount was computed based on average shares outstanding during the period.
(iv) Does not reflect the effect of sales charges, if applicable.
- 52 -
THE ALGER INSTITUTIONAL FUNDS
Financial Highlights for a share outstanding throughout the period (Unaudited)
| | | | | | | | | | | | | | | | | | | | | | | | | | | | |
| Alger Mid Cap Growth Institutional | | | | | | | | | | | | | | | | | | | | | | | | | | | | |
| Fund | | | | | | | | | | | | | Class I | | | | | | | | | | |
| | | Six months | | | | | | | | | | | | | | | | | | | | | | | | | |
| | | | ended | | | Year ended | | | Year ended | | | Year ended | | | Year ended | | | Year ended | |
| | | 4/30/2016 | (i) | | 10/31/2015 | | | 10/31/2014 | | | 10/31/2013 | | | 10/31/2012 | | | 10/31/2011 | |
| Net asset value, beginning of period | | $ | 22.54 | | | $ | | 22.18 | | | $ | | 19.43 | | | $ | | 14.59 | | | $ | | 13.50 | | | $ | 13.11 | |
| INCOME FROM INVESTMENT | | | | | | | | | | | | | | | | | | | | | | | | | | | | |
| OPERATIONS: | | | | | | | | | | | | | | | | | | | | | | | | | | | | |
| Net investment loss(ii) | | | (0.05 | ) | | | | (0.13 | ) | | | | (0.07 | ) | | | | (0.03 | ) | | | | – | | | | (0.10 | ) |
| Net realized and unrealized gain (loss) | | | | | | | | | | | | | | | | | | | | | | | | | | | | |
| on investments | | | (1.33 | ) | | | | 0.49 | | | | | 2.82 | | | | | 4.91 | | | | | 1.09 | | | | 0.52 | |
| Total from investment operations | | | (1.38 | ) | | | | 0.36 | | | | | 2.75 | | | | | 4.88 | | | | | 1.09 | | | | 0.42 | |
| Dividends from net investment income | – | | | | | – | | | | | – | | | | | (0.04 | ) | | | | – | | | | (0.03 | ) |
| Net asset value, end of period | | $ | 21.16 | | | $ | | 22.54 | | | $ | | 22.18 | | | $ | | 19.43 | | | $ | | 14.59 | | | $ | 13.50 | |
| Total return | | | (6.12 | )% | | | | 1.62 | % | | | | 14.15 | % | | | | 33.41 | % | | | | 8.10 | % | | | 3.30 | % |
| RATIOS/SUPPLEMENTAL DATA: | | | | | | | | | | | | | | | | | | | | | | | | | | | | |
| Net assets, end of period (000's | | | | | | | | | | | | | | | | | | | | | | | | | | | | |
| omitted) | $ | 98,716 | | $ | 114,984 | | $ | 132,426 | | $ | 157,391 | | $ | 182,087 | | $ | 317,893 | |
| Ratio of gross expenses to average | | | | | | | | | | | | | | | | | | | | | | | | | | | | |
| net assets | | | 1.24 | % | | | | 1.20 | % | | | | 1.30 | % | | | | 1.29 | % | | | | 1.23 | % | | | 1.18 | % |
| Ratio of expense reimbursements to | | | | | | | | | | | | | | | | | | | | | | | | | | | | |
| average net assets | | | – | | | | | – | | | | | – | | | | | – | | | | | – | | | | – | |
| Ratio of net expenses to average net | | | | | | | | | | | | | | | | | | | | | | | | | | | | |
| assets | | | 1.24 | % | | | | 1.20 | % | | | | 1.30 | % | | | | 1.29 | % | | | | 1.23 | % | | | 1.18 | % |
| Ratio of net investment income (loss) to | | | | | | | | | | | | | | | | | | | | | | | | | | | | |
| average net assets | | | (0.52 | )% | | | | (0.55 | )% | | | | (0.32 | )% | | | | (0.19 | )% | | | | 0.02 | % | | | (0.69 | )% |
| Portfolio turnover rate | | | 45.00 | % | | | | 120.97 | % | | | | 192.15 | % | | | | 153.89 | % | | | | 232.99 | % | | | 233.50 | % |
| See Notes to Financial Statements. | | | | | | | | | | | | | | | | | | | | | | | | | | |
(i) Ratios have been annualized; total return and portfolio turnover rate have not been annualized.
(ii) Amount was computed based on average shares outstanding during the period.
- 53 -
THE ALGER INSTITUTIONAL FUNDS
Financial Highlights for a share outstanding throughout the period (Unaudited)
| | | | | | | | | | | | | | | | | | | | | | | | | | | | | | |
| Alger Mid Cap Growth Institutional | | | | | | | | | | | | | | | | | | | | | | | | | | | | | | |
| Fund | | | | | | | | | | | | | Class R | | | | | | | | | | | |
| | | Six months | | | | | | | | | | | | | | | | | | | | | | | | | | | |
| | | | ended | | | Year ended | | | Year ended | | | Year ended | | | Year ended | | | Year ended | |
| | | 4/30/2016 | (i) | | 10/31/2015 | | | 10/31/2014 | | | | | 10/31/2013 | | | 10/31/2012 | | | 10/31/2011 | |
| Net asset value, beginning of period | | $ | 20.96 | | | $ | | 20.74 | | | $ | | 18.26 | | | $ | 13.81 | | | $ | | 12.85 | | | $ | | 12.51 | |
| INCOME FROM INVESTMENT | | | | | | | | | | | | | | | | | | | | | | | | | | | | | | |
| OPERATIONS: | | | | | | | | | | | | | | | | | | | | | | | | | | | | | | |
| Net investment loss(ii) | | | (0.11 | ) | | | | (0.23 | ) | | | | (0.16 | ) | | | | | (0.11 | ) | | | | (0.07 | ) | | | | (0.17 | ) |
| Net realized and unrealized gain (loss) | | | | | | | | | | | | | | | | | | | | | | | | | | | | | | |
| on investments | | | (1.23 | ) | | | | 0.45 | | | | | 2.64 | | | | | | 4.63 | | | | | 1.03 | | | | | 0.51 | |
| Total from investment operations | | | (1.34 | ) | | | | 0.22 | | | | | 2.48 | | | | | | 4.52 | | | | | 0.96 | | | | | 0.34 | |
| Dividends from net investment income | – | | | | | – | | | | | – | | | | | | (0.07 | ) | | | | – | | | | | – | |
| Net asset value, end of period | | $ | 19.62 | | | $ | | 20.96 | | | $ | | 20.74 | | | $ | 18.26 | | | $ | | 13.81 | | | $ | | 12.85 | |
| Total return | | | (6.39 | )% | | | | 1.11 | % | | | | 13.58 | % | | | | | 32.83 | % | | | | 7.50 | % | | | | 2.70 | % |
| RATIOS/SUPPLEMENTAL DATA: | | | | | | | | | | | | | | | | | | | | | | | | | | | | | | |
| Net assets, end of period (000's | | | | | | | | | | | | | | | | | | | | | | | | | | | | | | |
| omitted) | $ | 14,792 | | $ | 17,795 | | $ | 21,953 | | $ | 23,599 | | $ | 26,661 | | $ | 34,795 | |
| Ratio of gross expenses to average | | | | | | | | | | | | | | | | | | | | | | | | | | | | | | |
| net assets | | | 1.80 | % | | | | 1.74 | % | | | | 1.80 | % | | | | | 1.79 | % | | | | 1.76 | % | | | | 1.74 | % |
| Ratio of expense reimbursements to | | | | | | | | | | | | | | | | | | | | | | | | | | | | | | |
| average net assets | | | – | | | | | – | | | | | – | | | | | | – | | | | | – | | | | | – | |
| Ratio of net expenses to average net | | | | | | | | | | | | | | | | | | | | | | | | | | | | | | |
| assets | | | 1.80 | % | | | | 1.74 | % | | | | 1.80 | % | | | | | 1.79 | % | | | | 1.76 | % | | | | 1.74 | % |
| Ratio of net investment income (loss) to | | | | | | | | | | | | | | | | | | | | | | | | | | | | | | |
| average net assets | | | (1.09 | )% | | | | (1.08 | )% | | | | (0.82 | )% | | | | | (0.69 | )% | | | | (0.50 | )% | | | | (1.24 | )% |
| Portfolio turnover rate | | | 45.00 | % | | | | 120.97 | % | | | | 192.15 | % | | | | | 153.89 | % | | | | 232.99 | % | | | | 233.50 | % |
| See Notes to Financial Statements. | | | | | | | | | | | | | | | | | | | | | | | | | | | | |
(i) Ratios have been annualized; total return and portfolio turnover rate have not been annualized.
(ii) Amount was computed based on average shares outstanding during the period.
- 54 -
THE ALGER INSTITUTIONAL FUNDS
Financial Highlights for a share outstanding throughout the period (Unaudited)
| | | | | | | | | | | | | | | | | | | | | | | | | | | | | |
| Alger Small Cap Growth | | | | | | | | | | | | | | | | | | | | | | | | | | | | | |
| Institutional Fund | | | | | | | | | | | | | Class I | | | | | | | | | | | | | |
| | | Six months | | | | | | | | | | | | | | | | | | | | | | | | | | |
| | | | ended | | | Year ended | | | Year ended | | | Year ended | | | Year ended | | | Year ended | |
| | | 4/30/2016 | (i) | | 10/31/2015 | | | 10/31/2014 | | | 10/31/2013 | | | 10/31/2012 | | | 10/31/2011 | |
| Net asset value, beginning of period | | $ | 23.10 | | | $ | | 28.14 | | | $ | | 33.48 | | | $ | | 28.16 | | | $ | | 26.99 | | | $ | | 25.28 | |
| INCOME FROM INVESTMENT | | | | | | | | | | | | | | | | | | | | | | | | | | | | | |
| OPERATIONS: | | | | | | | | | | | | | | | | | | | | | | | | | | | | | |
| Net investment loss(ii) | | | (0.06 | ) | | | | (0.20 | ) | | | | (0.20 | ) | | | | (0.11 | ) | | | | (0.15 | ) | | | | (0.26 | ) |
| Net realized and unrealized gain (loss) | | | | | | | | | | | | | | | | | | | | | | | | | | | | | |
| on investments | | | (1.47 | ) | | | | 0.42 | | | | | 0.60 | | | | | 8.66 | | | | | 2.45 | | | | | 1.97 | |
| Total from investment operations | | | (1.53 | ) | | | | 0.22 | | | | | 0.40 | | | | | 8.55 | | | | | 2.30 | | | | | 1.71 | |
| Distributions from net realized gains | | | (7.63 | ) | | | | (5.26 | ) | | | | (5.74 | ) | | | | (3.23 | ) | | | | (1.13 | ) | | | | – | |
| Net asset value, end of period | | $ | 13.94 | | | $ | | 23.10 | | | $ | | 28.14 | | | $ | | 33.48 | | | $ | | 28.16 | | | $ | | 26.99 | |
| Total return | | | (9.54 | )% | | | | 0.53 | % | | | | 1.21 | % | | | | 33.71 | % | | | | 8.93 | % | | | | 6.80 | % |
| RATIOS/SUPPLEMENTAL DATA: | | | | | | | | | | | | | | | | | | | | | | | | | | | | | |
| Net assets, end of period (000's | | | | | | | | | | | | | | | | | | | | | | | | | | | | | |
| omitted) | $ | 223,723 | | $ | 357,189 | | $ | 659,692 | | $ | 936,554 | | $ | 929,237 | | $ | 1,119,966 | |
| Ratio of gross expenses to average | | | | | | | | | | | | | | | | | | | | | | | | | | | | | |
| net assets | | | 1.26 | % | | | | 1.25 | % | | | | 1.24 | % | | | | 1.25 | % | | | | 1.23 | % | | | | 1.18 | % |
| Ratio of expense reimbursements to | | | | | | | | | | | | | | | | | | | | | | | | | | | | | |
| average net assets | | | – | | | | | – | | | | | – | | | | | – | | | | | – | | | | | – | |
| Ratio of net expenses to average net | | | | | | | | | | | | | | | | | | | | | | | | | | | | | |
| assets | | | 1.26 | % | | | | 1.25 | % | | | | 1.24 | % | | | | 1.25 | % | | | | 1.23 | % | | | | 1.18 | % |
| Ratio of net investment income (loss) to | | | | | | | | | | | | | | | | | | | | | | | | | | | | | |
| average net assets | | | (0.78 | )% | | | | (0.80 | )% | | | | (0.70 | )% | | | | (0.38 | )% | | | | (0.54 | )% | | | | (0.94 | )% |
| Portfolio turnover rate | | | 32.75 | % | | | | 125.72 | % | | | | 84.10 | % | | | | 77.38 | % | | | | 72.43 | % | | | | 70.57 | % |
| See Notes to Financial Statements. | | | | | | | | | | | | | | | | | | | | | | | | | | | |
(i) Ratios have been annualized; total return and portfolio turnover rate have not been annualized.
(ii) Amount was computed based on average shares outstanding during the period.
- 55 -
THE ALGER INSTITUTIONAL FUNDS
Financial Highlights for a share outstanding throughout the period (Unaudited)
| | | | | | | | | | | | | | | | | | | | | | | | | | | | | | |
| Alger Small Cap Growth | | | | | | | | | | | | | | | | | | | | | | | | | | | | | | |
| Institutional Fund | | | | | | | | | | | | | Class R | | | | | | | | | | | | |
| | | Six months | | | | | | | | | | | | | | | | | | | | | | | | | | | |
| | | | ended | | | Year ended | | | Year ended | | | Year ended | | | Year ended | | | Year ended | |
| | | 4/30/2016 | (i) | | 10/31/2015 | | | 10/31/2014 | | | | | 10/31/2013 | | | 10/31/2012 | | | 10/31/2011 | |
| Net asset value, beginning of period | | $ | 20.92 | | | $ | | 26.08 | | | $ | | 31.58 | | | $ | 26.85 | | | $ | | 25.91 | | | $ | | 24.39 | |
| INCOME FROM INVESTMENT | | | | | | | | | | | | | | | | | | | | | | | | | | | | | | |
| OPERATIONS: | | | | | | | | | | | | | | | | | | | | | | | | | | | | | | |
| Net investment loss(ii) | | | (0.09 | ) | | | | (0.29 | ) | | | | (0.32 | ) | | | | | (0.23 | ) | | | | (0.28 | ) | | | | (0.40 | ) |
| Net realized and unrealized gain (loss) | | | | | | | | | | | | | | | | | | | | | | | | | | | | | | |
| on investments | | | (1.26 | ) | | | | 0.39 | | | | | 0.56 | | | | | | 8.19 | | | | | 2.35 | | | | | 1.92 | |
| Total from investment operations | | | (1.35 | ) | | | | 0.10 | | | | | 0.24 | | | | | | 7.96 | | | | | 2.07 | | | | | 1.52 | |
| Distributions from net realized gains | | | (7.63 | ) | | | | (5.26 | ) | | | | (5.74 | ) | | | | | (3.23 | ) | | | | (1.13 | ) | | | | – | |
| Net asset value, end of period | | $ | 11.94 | | | $ | | 20.92 | | | $ | | 26.08 | | | $ | 31.58 | | | $ | | 26.85 | | | $ | | 25.91 | |
| Total return | | | (9.74 | )% | | | | 0.02 | % | | | | 0.74 | % | | | | | 33.05 | % | | | | 8.40 | % | | | | 6.20 | % |
| RATIOS/SUPPLEMENTAL DATA: | | | | | | | | | | | | | | | | | | | | | | | | | | | | | | |
| Net assets, end of period (000's | | | | | | | | | | | | | | | | | | | | | | | | | | | | | | |
| omitted) | $ | 14,300 | | $ | 18,577 | | $ | 31,062 | | $ | 41,022 | | $ | 47,507 | | $ | 62,211 | |
| Ratio of gross expenses to average | | | | | | | | | | | | | | | | | | | | | | | | | | | | | | |
| net assets | | | 1.78 | % | | | | 1.74 | % | | | | 1.72 | % | | | | | 1.73 | % | | | | 1.73 | % | | | | 1.71 | % |
| Ratio of expense reimbursements to | | | | | | | | | | | | | | | | | | | | | | | | | | | | | | |
| average net assets | | | – | | | | | – | | | | | – | | | | | | – | | | | | – | | | | | – | |
| Ratio of net expenses to average net | | | | | | | | | | | | | | | | | | | | | | | | | | | | | | |
| assets | | | 1.78 | % | | | | 1.74 | % | | | | 1.72 | % | | | | | 1.73 | % | | | | 1.73 | % | | | | 1.71 | % |
| Ratio of net investment income (loss) to | | | | | | | | | | | | | | | | | | | | | | | | | | | | | | |
| average net assets | | | (1.30 | )% | | | | (1.30 | )% | | | | (1.18 | )% | | | | | (0.83 | )% | | | | (1.05 | )% | | | | (1.47 | )% |
| Portfolio turnover rate | | | 32.75 | % | | | | 125.72 | % | | | | 84.10 | % | | | | | 77.38 | % | | | | 72.43 | % | | | | 70.57 | % |
| See Notes to Financial Statements. | | | | | | | | | | | | | | | | | | | | | | | | | | | | |
(i) Ratios have been annualized; total return and portfolio turnover rate have not been annualized.
(ii) Amount was computed based on average shares outstanding during the period.
- 56 -
THE ALGER INSTITUTIONAL FUNDS
NOTES TO FINANCIAL STATEMENTS (Unaudited)
NOTE 1 — General:
The Alger Institutional Funds (the “Trust”) is a diversified, open-end registered investment
company organized as a business trust under the laws of the Commonwealth of
Massachusetts. The Trust qualifies as an investment company as defined in the Financial
Accounting Standards Board Accounting Standards Codification 946-Financial Services
– Investment Companies. The Trust operates as a series company and currently offers
an unlimited number of shares of beneficial interest in four funds — Alger Capital
Appreciation Institutional Fund, Alger Capital Appreciation Focus Fund, Alger Mid Cap
Growth Institutional Fund and Alger Small Cap Growth Institutional Fund (collectively,
the “Funds” or individually, each a “Fund”). The Funds normally invest primarily in equity
securities and each has an investment objective of long-term capital appreciation.
Each Fund offers one or more of the following share classes: Class A, C, I, R and Z. Class
A shares are generally subject to an initial sales charge while Class C shares are generally
subject to a deferred sales charge. Class I, R and Z shares are sold to institutional investors
without an initial or deferred sales charge. Each class has identical rights to assets and
earnings except that each share class bears the cost of its transfer agency and sub-transfer
agency services, and each of Classes A, C and R bears the cost of its plan of distribution.
NOTE 2 — Significant Accounting Policies:
(a) Investment Valuation: The Funds value their financial instruments at fair value using
independent dealers or pricing services under policies approved by the Trust’s Board of
Trustees (“Board”). Investments are valued on each day the New York Stock Exchange (the
“NYSE”) is open, as of the close of the NYSE (normally 4:00 p.m. Eastern Standard Time).
Equity securities and option contracts for which valuation information is readily available are
valued at the last quoted sales price or official closing price as reported by an independent
pricing service on the primary market or exchange on which they are traded. In the absence
of quoted sales, such securities are valued at the bid price or, in the absence of a recent
bid price, the equivalent as obtained from one or more of the major market makers for the
securities to be valued.
Debt securities generally trade in the over-the-counter market. Debt securities with
remaining maturities of more than sixty days at the time of acquisition are valued on
the basis of last available bid prices or current market quotations provided by dealers
or pricing services. In determining the value of a particular investment, pricing services
may use certain information with respect to transactions in such investments, quotations
from dealers, pricing matrixes, market transactions in comparable investments, various
relationships observed in the market between investments and calculated yield measures
based on valuation technology commonly employed in the market for such investments.
Asset-backed and mortgage-backed securities are valued by independent pricing services
using models that consider estimated cash flows of each tranche of the security, establish a
benchmark yield and develop an estimated tranche-specific spread to the benchmark yield
based on the unique attributes of the tranche. Debt securities with a remaining maturity of
sixty days or less are valued at amortized cost which approximates market value.
- 57 -
THE ALGER INSTITUTIONAL FUNDS
NOTES TO FINANCIAL STATEMENTS (Unaudited) (Continued)
Securities for which market quotations are not readily available are valued at fair value, as
determined in good faith pursuant to procedures established by the Board.
Securities in which the Funds invest may be traded in foreign markets that close before the
close of the NYSE. Developments that occur between the close of the foreign markets
and the close of the NYSE may result in adjustments to the foreign closing prices to reflect
what the investment adviser, pursuant to policies established by the Board, believes to be
the fair value of these securities as of the close of the NYSE. The Funds may also fair value
securities in other situations, for example, when a particular foreign market is closed but the
Funds are open.
Financial Accounting Standards Board Accounting Standards Codification 820 – Fair Value
Measurements and Disclosures (“ASC 820”) defines fair value as the price that the Funds
would receive upon selling an investment in a timely transaction to an independent buyer
in the principal or most advantageous market of the investment. ASC 820 established a
three-tier hierarchy to maximize the use of observable market data and minimize the use of
unobservable inputs and to establish classification of fair value measurements for disclosure
purposes. Inputs refer broadly to the assumptions that market participants would use in
pricing the asset or liability and may be observable or unobservable. Observable inputs
are based on market data obtained from sources independent of the Funds. Unobservable
inputs are inputs that reflect the Funds’ own assumptions based on the best information
available in the circumstances. The three-tier hierarchy of inputs is summarized in the three
broad Levels listed below.
• Level 1 – quoted prices in active markets for identical investments
• Level 2 – significant other observable inputs (including quoted prices for similar
investments, interest rates, prepayment speeds, credit risk, etc.)
• Level 3 – significant unobservable inputs (including the Funds’ own assumptions in
determining the fair value of investments)
The Funds’ valuation techniques are generally consistent with either the market or the
income approach to fair value. The market approach considers prices and other relevant
information generated by market transactions involving identical or comparable assets
to measure fair value. The income approach converts future amounts to a current, or
discounted, single amount. These fair value measurements are determined on the basis
of the value indicated by current market expectations about such future events. Inputs
for Level 1 include exchange-listed prices and broker quotes in an active market. Inputs
for Level 2 include the last trade price in the case of a halted security, an exchange-listed
price which has been adjusted for fair value factors, and prices of closely related securities.
Additional Level 2 inputs include an evaluated price which is based upon a compilation of
observable market information such as spreads for fixed income and preferred securities.
Inputs for Level 3 include revenue multiples, earnings before interest, taxes, depreciation
and amortization (“EBITDA”) multiples, discount rates, and the probabilities of success of
certain outcomes. Such unobservable market information may be obtained from a company’s
- 58 -
THE ALGER INSTITUTIONAL FUNDS
NOTES TO FINANCIAL STATEMENTS (Unaudited) (Continued)
financial statements and from industry studies, market data, and market indicators such as
benchmarks and indices.
Valuation processes are determined by a Valuation Committee (“Committee”) established
by the Board and comprised of representatives of the Trust’s investment adviser. The
Committee reports its fair valuation determinations to the Board which is responsible for
approving valuation policy and procedures.
While the Committee meets on an as-needed basis, the Committee generally meets
quarterly to review and evaluate the effectiveness of the procedures for making fair value
determinations. The Committee considers, among other things, the results of quarterly
back testing of the fair value model for foreign securities, pricing comparisons between
primary and secondary price sources, the outcome of price challenges put to the Funds’
pricing vendor, and variances between transactional prices and previous mark-to-markets.
The Funds will record a change to a security’s fair value level if new inputs are available
or it becomes evident that inputs previously considered for leveling have changed or are
no longer relevant. Transfers between Levels 1, 2 and 3 are recognized at the end of the
reporting period.
(b) Cash and Cash Equivalents: Cash and cash equivalents include U.S. dollars and overnight
time deposits.
(c) Securities Transactions and Investment Income: Securities transactions are recorded on a
trade date basis. Realized gains and losses from securities transactions are recorded on the
identified cost basis. Dividend income is recognized on the ex-dividend date and interest
income is recognized on the accrual basis.
(d) Foreign Currency Translations: The books and records of the Funds are maintained in U.S.
dollars. Foreign currencies, investments and other assets and liabilities are translated into
U.S. dollars at the prevailing rates of exchange on the valuation date. Purchases and sales
of investment securities and income and expenses are translated into U.S. dollars at the
prevailing exchange rates on the respective dates of such transactions.
Net realized gains and losses on foreign currency transactions represent net gains and losses
from the disposition of foreign currencies, currency gains and losses realized between the
trade dates and settlement dates of security transactions, and the difference between the
amount of net investment income accrued and the U.S. dollar amount actually received.
The effects of changes in foreign currency exchange rates on investments in securities
are included in realized and unrealized gain or loss on investments in the accompanying
Statements of Operations.
(e) Option Contracts: When a Fund writes an option, an amount equal to the premium received
by the Fund is recorded as a liability and is subsequently adjusted to the current fair value
of the option written. Premiums received from writing options that expire unexercised are
treated by the Fund on the expiration date as realized gains from investments. The difference
between the premium and the amount paid on effecting a closing purchase transaction,
including brokerage commissions, is also treated as a realized gain, or, if the premium is less
- 59 -
THE ALGER INSTITUTIONAL FUNDS
NOTES TO FINANCIAL STATEMENTS (Unaudited) (Continued)
than the amount paid for the closing purchase transaction, as a realized loss. If a call option
is exercised, the premium is added to the proceeds from the sale of the underlying security
in determining whether the Fund has realized a gain or loss. If a put option is exercised, the
premium reduces the cost basis of the securities purchased by the Fund. The Fund as writer
of an option bears the market risk of an unfavorable change in the price of the security
underlying the written option.
The Funds may also purchase put and call options. Each Fund pays a premium which is
included in the Fund’s accompanying Statement of Assets and Liabilities as an investment
and subsequently marked to market to reflect the current value of the option. Premiums
paid for purchasing options which expire are treated as realized losses. The risk associated
with purchasing put and call options is limited to the premium paid. Premiums paid for
purchasing options which are exercised or closed are added to the amounts paid or offset
against the proceeds on the underlying security to determine the realized gain or loss.
(f) Lending of Fund Securities: The Funds may lend their securities to financial institutions,
provided that the market value of the securities loaned will not at any time exceed one
third of a Fund’s total assets, as defined in its prospectuses. The Funds earn fees on the
securities loaned, which are included in interest income in the accompanying Statements
of Operations. In order to protect against the risk of failure by the borrower to return the
securities loaned or any delay in the delivery of such securities, the loan is collateralized by
cash or securities that are maintained with the Custodian in an amount equal to at least 102
percent of the current market value of U.S. loaned securities or 105 percent for non-U.S.
loaned securities. The market value of the loaned securities is determined at the close of
business of the Fund. Any required additional collateral is delivered to the Custodian and
any excess collateral is returned to the borrower on the next business day. In the event the
borrower fails to return the loaned securities when due, the Funds may take the collateral
to replace the securities. If the value of the collateral is less than the purchase cost of
replacement securities, the Custodian shall be responsible for any shortfall, but only to
the extent that the shortfall is not due to any diminution in collateral value, as defined in
the securities lending agreement. The Funds are required to maintain the collateral in a
segregated account and determine its value each day until the loaned securities are returned.
Cash collateral may be invested as determined by the Funds. Collateral is returned to the
borrower upon settlement of the loan. There were no securities loaned as of April 30, 2016.
(g) Dividends to Shareholders: Dividends and distributions payable to shareholders are
recorded by the Funds on the ex-dividend date. Dividends from net investment income and
distributions from net realized gains are declared and paid annually after the end of the fiscal
year in which earned.
Each class is treated separately in determining the amounts of dividends from net investment
income payable to holders of its shares.
The characterization of distributions to shareholders for financial reporting purposes is
determined in accordance with federal income tax rules. Therefore, the source of a Fund’s
distributions may be shown in the accompanying financial statements as either from, or in
excess of, net investment income, net realized gain on investment transactions or return of
- 60 -
THE ALGER INSTITUTIONAL FUNDS
NOTES TO FINANCIAL STATEMENTS (Unaudited) (Continued)
capital, depending on the type of book/tax differences that may exist. Capital accounts within
the financial statements are adjusted for permanent book/tax differences. Reclassifications
result primarily from the difference in tax treatment of net operating losses, passive foreign
investment companies, and foreign currency transactions. The reclassifications are done
annually at fiscal year end and have no impact on the net asset values of the Funds and are
designed to present each Fund’s capital accounts on a tax basis.
(h) Federal Income Taxes: It is each Fund’s policy to comply with the requirements of the
Internal Revenue Code Subchapter M applicable to regulated investment companies and
to distribute all of its taxable income to its shareholders. Provided that the Funds maintain
such compliance, no federal income tax provision is required. Each Fund is treated as a
separate entity for the purpose of determining such compliance.
Financial Accounting Standards Board Accounting Standards Codification 740 – Income
Taxes (“ASC 740”) requires the Funds to measure and recognize in their financial statements
the benefit of a tax position taken (or expected to be taken) on an income tax return
if such position will more likely than not be sustained upon examination based on the
technical merits of the position. No tax years are currently under investigation. The Funds
file income tax returns in the U.S., as well as New York State and New York City. The
statute of limitations on the Funds’ tax returns remains open for the tax years 2012-2015.
Management does not believe there are any uncertain tax positions that require recognition
of a tax liability.
(i) Allocation Methods: The Trust accounts separately for the assets, liabilities and operations
of each Fund. Expenses directly attributable to each Fund are charged to that Fund’s
operations; expenses which are applicable to all Funds are allocated among them based on
net assets. Income, realized and unrealized gains and losses, and expenses of each Fund
are allocated among the Fund’s classes based on relative net assets, with the exception of
distribution fees, transfer agency fees, and shareholder servicing and related fees.
(j) Estimates: These financial statements have been prepared in accordance with accounting
principles generally accepted in the United States of America, which require using estimates
and assumptions that affect the reported amounts therein. These unaudited interim financial
statements reflect all adjustments which are, in the opinion of management, necessary to
present a fair statement of results for the interim period. Actual results may differ from
those estimates. All such adjustments are of normal recurring nature.
NOTE 3 — Investment Advisory Fees and Other Transactions with Affiliates:
(a) Investment Advisory Fees: Fees incurred by each Fund, pursuant to the provisions of
the Trust’s Investment Advisory Agreement with Fred Alger Management, Inc. (“Alger
Management” or the “Manager”), are payable monthly and computed based on the following
rates. The actual rate paid as a percentage of average daily net assets, for the six months
ended April 30, 2016, is set forth below under the heading “Actual Rate.”
| | | | | | | | | | | | | | |
| | | | Tier 1 | | | Tier 2 | | | | Tier 3 | | | Actual Rate | |
| | Alger Capital Appreciation Institutional Fund(a) | 0.810 | % | | 0.650 | % | | | 0.600 | % | | 0.740 | % |
| | Alger Capital Appreciation Focus Fund(b) | | 0.710 | | | 0.600 | | | | — | | | 0.710 | |
| - 61 - | | | | | | | | | | | | | | |
THE ALGER INSTITUTIONAL FUNDS
NOTES TO FINANCIAL STATEMENTS (Unaudited) (Continued)
| | | | | | | |
| | | Tier 1 | | Tier 2 | Tier 3 | | Actual Rate |
| Alger Mid Cap Growth Institutional Fund(b) | | 0.760 | | 0.700 | — | | 0.760 |
| Alger Small Cap Growth Institutional Fund(b) | | 0.810 | | 0.750 | — | | 0.810 |
(a) Tier 1 rate is paid on assets up to $2 billion, Tier 2 rate is paid on assets between $2 to $4 billion, and Tier 3
rate is paid on assets in excess of $4 billion.
(b) Tier 1 rate is paid on assets up to $1 billion and Tier 2 rate is paid on assets in excess of $1 billion.
Alger Management has established expense caps for the Alger Capital Appreciation Focus
Fund Class A, Class C, Class I and Class Z shares, effective through February 28, 2017,
whereby it reimburses the share classes if annualized operating expenses (excluding interest,
taxes, brokerage, dividend expenses and extraordinary expenses) exceed the rates, based on
average daily net assets, listed below:
| | | | | | | | | | |
| | | | | | | | | | FEES WAIVED / |
| | | | | | | | | | REIMBURSED FOR |
| | | | | | | | | | THE SIX MONTHS |
| | | | CLASS | | | | ENDED |
| | A | | C | | I | | Z | | APRIL 30, 2016 |
| Alger Capital Appreciation Focus Fund* | 1.15 | % | 1.90 | % | 1.15 | % | 0.95 | % | $ | 64,428 |
*Prior to March 1, 2016, the expense cap for the Alger Capital Appreciation Focus Fund
Class A was 1.30%, Class C was 2.05% Class I was 1.15% and Class Z was 0.89%.
Fred Alger Management, Inc. may recoup reimbursed expenses during the one-year term of
the expense reimbursement contract if the expense ratio falls below the stated limitation.
(b) Administration Fees: Fees incurred by each Fund, pursuant to the provisions of the Trust’s
Administration Agreement with Fred Alger Management, Inc., are payable monthly and
computed based on the average daily net assets of each Fund at the annual rate of 0.0275%.
(c) Distribution Fees:
Class A Shares: The Trust has adopted a Distribution Plan pursuant to which Class A shares
of Alger Capital Appreciation Focus Fund pay Fred Alger & Company, Incorporated, the
Fund’s distributor (the “Distributor” or “Alger Inc.”) and an affiliate of Alger Management,
a fee at the annual rate of 0.25% of the respective average daily net assets of the Class A
shares of the Fund to compensate Alger Inc. for its activities and expenses incurred in
distributing and servicing the Class A shares. The fees paid may be more or less than the
expenses incurred by Alger Inc.
Class C Shares: The Trust has adopted a Distribution Plan pursuant to which Class C shares
of Alger Capital Appreciation Focus Fund pay Alger Inc. a fee at the annual rate of 1% of
the average daily net assets of the Class C shares of the Fund to compensate Alger Inc. for
its activities and expenses incurred in distributing and servicing the Class C shares. The fees
paid may be more or less than the expenses incurred by Alger Inc.
Class R Shares: The Trust has adopted a Distribution Plan pursuant to which Class R
shares of each Fund issuing such shares pay Alger Inc. a fee at the annual rate of 0.50%
of the respective average daily net assets of the Class R shares of the designated Fund to
compensate Alger Inc. for its activities and expenses incurred in distributing and servicing
- 62 -
THE ALGER INSTITUTIONAL FUNDS
NOTES TO FINANCIAL STATEMENTS (Unaudited) (Continued)
the Class R shares. The fees paid may be more or less than the expenses incurred by the
Distributor.
(d) Sales Charges: Purchases and sales of shares of the Alger Capital Appreciation Focus Fund
may be subject to initial sales charges or contingent deferred sales charges. The contingent
deferred sales charges are used by Alger Inc. to offset distribution expenses previously
incurred. Sales charges do not represent expenses of the Trust. For the six months ended
April 30, 2016, the initial sales charges and contingent deferred sales charges imposed, all of
which were retained by Alger Inc., were as follows:
| | | | | |
| | | | | CONTINGENT | |
| | INITIAL SALES | DEFERRED SALES | |
| | | CHARGES | | CHARGES | |
| Alger Capital Appreciation Focus Fund | $ | – | $ | 235 | |
(e) Brokerage Commissions: During the six months ended April 30, 2016, the Alger Capital
Appreciation Institutional Fund, Alger Capital Appreciation Focus Fund, Alger Mid Cap
Growth Institutional Fund and Alger Small Cap Growth Institutional Fund paid Alger Inc.
commissions of $744,434, $10,992, $13,935 and $46,366, respectively, in connection with
securities transactions.
(f) Shareholder Administrative Fees: The Trust has entered into a shareholder administrative
services agreement with Alger Management to compensate Alger Management for its liaison
and administrative oversight of Boston Financial Data Services, Inc., the transfer agent, and
other related services. The Funds compensate Alger Management at the annual rate of
0.0165% of their respective average daily net assets for the Class A and Class C shares and
0.01% of their respective average daily net assets of the Class I, Class R and Class Z shares
for these services.
Alger Management makes payments to intermediaries that provide sub-accounting services
to omnibus accounts invested in the Funds. A portion of the fees paid by Alger Management
to intermediaries that provide sub-accounting services are charged back to the appropriate
Fund, subject to certain limitations, as approved by the Trust’s Board of Trustees. For the
six months ended April 30, 2016, Alger Management charged back to the Alger Capital
Appreciation Institutional Fund, Alger Capital Appreciation Focus Fund, Alger Mid Cap
Growth Institutional Fund, and Alger Small Cap Growth Institutional Fund, $688,349,
$11,424, $38,154 and $104,400, respectively, for these services, which are included in the
transfer agent fees and expenses in the accompanying Statements of Operations.
(g) Trustee Fees: From November 1, 2015 through February 29, 2016, each trustee who is not
affiliated with Alger Management or its affiliates each, an “Independent Trustee” received
a fee of $25,875 for each board meeting attended, to a maximum of $103,500 per annum,
paid pro rata by each fund in the Alger Fund Complex, plus travel expenses incurred for
attending the meeting. The Independent Trustee appointed as Chairman of the Board of
Trustees received additional compensation of $24,300 per annum paid pro rata by each fund
in the Alger Fund Complex. Additionally, each member of the Audit Committee received
a fee of $2,500 for each Audit Committee meeting attended to a maximum of $10,000 per
annum, paid pro rata by each fund in the Alger Fund Complex.
- 63 -
THE ALGER INSTITUTIONAL FUNDS
NOTES TO FINANCIAL STATEMENTS (Unaudited) (Continued)
Effective March 1, 2016, each Independent Trustee receives a fee of $27,250 for each board
meeting attended, to a maximum of $109,000 per annum, paid pro rata by each fund in
the Alger Fund Complex, plus travel expenses incurred for attending the meeting. The
Independent Trustee appointed as Chairman of the Board of Trustees receives additional
compensation of $26,000 per annum paid pro rata by each fund in the Alger Fund Complex.
Additionally, each member of the Audit Committee receives a fee of $2,500 for each Audit
Committee meeting attended to a maximum of $10,000 per annum, paid pro rata by each
fund in the Alger Fund Complex.
(h) Interfund Trades: The Funds engaged in purchase and sale transactions with funds
that have a common investment adviser. For the six months ended April 30, 2016, these
purchases and sales were as follows:
| | | | | | |
| | | | Purchases | | | Sales |
| Alger Capital Appreciation Institutional Fund | | $ | 899,850 | | | – |
| Alger Small Cap Growth Institutional Fund | | | – | | $ | 608,470 |
(i) Interfund Loans: The Funds, along with other funds advised by Alger Management, may
borrow money from and lend money to each other for temporary or emergency purposes.
To the extent permitted under its investment restrictions, each fund may lend uninvested
cash in an amount up to 15% of its net assets to other funds. If a fund has borrowed from
other funds and has aggregate borrowings from all sources that exceed 10% of the fund’s
total assets, such fund will secure all of its loans from other funds. The interest rate charged
on interfund loans is equal to the average of the overnight time deposit rate and bank loan
rate available to the funds. There were no interfund loans outstanding as of April 30, 2016.
During the six months ended April 30, 2016, Alger Small Cap Growth Institutional Fund
incurred interest expense of $5,561 in connection with interfund loans.
(j) Other Transactions With Affiliates: Certain officers of the Trust are directors and officers
of Alger Management and the Distributor. At April 30, 2016, Alger Management and its
affiliated entities owned the following shares:
| | | | | | |
| | | | | SHARE CLASS |
| | | A | | C | | Z |
| Alger Capital Appreciation Focus Fund | | 6,878 | | 6,880 | | 35,366 |
(k) Shareholder Servicing Fees: The Trust has entered into a shareholder servicing agreement
with Alger Inc. whereby Alger Inc. provides Class I shares and Class R shares of the Trust
with ongoing servicing of shareholder accounts. As compensation for such services, the
Class I shares and Class R shares of each Fund pay Alger Inc. a monthly fee at an annual
rate of 0.25% of the value of the average daily net assets of those classes. The fees paid
may be more or less than the expenses incurred by the Distributor.
NOTE 4 — Securities Transactions:
The following summarizes the securities transactions by the Funds, other than U.S.
Government securities, short-term securities, purchased options and short sales, for the six
months ended April 30, 2016:
- 64 -
THE ALGER INSTITUTIONAL FUNDS
NOTES TO FINANCIAL STATEMENTS (Unaudited) (Continued)
| | | | | | |
| | | | PURCHASES | | | SALES |
| Alger Capital Appreciation Institutional Fund | | $ | 4,444,944,081 | | $ | 2,134,408,637 |
| Alger Capital Appreciation Focus Fund | | | 63,938,245 | | | 49,447,338 |
| Alger Mid Cap Growth Institutional Fund | | | 52,660,446 | | | 57,096,754 |
| Alger Small Cap Growth Institutional Fund | | | 98,117,706 | | | 204,137,030 |
Transactions in foreign securities may involve certain considerations and risks not typically
associated with those of U.S. companies because of, among other factors, the level of
governmental supervision and regulation of foreign security markets, and the possibility
of political or economic instability. Additional risks associated with investing in emerging
markets include increased volatility, limited liquidity, and less stringent regulatory and legal
system.
NOTE 5 — Borrowing:
The Funds may borrow from their custodian on an uncommitted basis. Each Fund pays the
custodian a market rate of interest, generally based upon the London Interbank Offered
Rate. The Funds may also borrow from other funds advised by Alger Management,
as discussed in Note 3(i). For the six months ended April 30, 2016, the Funds had the
following borrowings:
| | | | | |
| | AVERAGE DAILY | WEIGHTED AVERAGE | |
| | | BORROWING | | INTEREST RATE | |
| Alger Small Cap Growth Institutional Fund | $ | 902,796 | | 1.28 | % |
The highest amount borrowed during the six months ended April 30, 2016 for each Fund
was as follows:
| |
| | HIGHEST BORROWING |
| Alger Small Cap Growth Institutional Fund | $ | 13,450,000 |
- 65 -
THE ALGER INSTITUTIONAL FUNDS
NOTES TO FINANCIAL STATEMENTS (Unaudited) (Continued)
NOTE 6 — Share Capital:
(a) The Trust has an unlimited number of authorized shares of beneficial interest of $.001
par value which are presently divided into four series. Each series is divided into two sep-
arate classes, except that the shares of Alger Capital Appreciation Focus Fund are divided
into four separate classes. The transactions of shares of beneficial interest were as follows:
| | | | | | | | | | | | | | |
| | | FOR THE SIX MONTHS ENDED | | | FOR THE YEAR ENDED | |
| | | APRIL 30, 2016 | | | OCTOBER 31, 2015 | |
| | | SHARES | | | | AMOUNT | | | SHARES | | | | AMOUNT | |
| Alger Capital Appreciation Institutional Fund | | | | | | | | | | | | |
| Class I: | | | | | | | | | | | | | | |
| Shares sold | | 19,836,293 | | | $ | 510,259,367 | | | 50,542,053 | | | $ | 1,431,830,828 | |
| Dividends reinvested | | 8,328,490 | | | | 222,703,812 | | | 11,586,846 | | | | 312,381,372 | |
| Shares redeemed | | (19,801,968 | ) | | (509,904,191 | ) | | (37,104,435 | ) | | (1,050,293,736 | ) |
| Net increase | | 8,362,815 | | | $ | 223,058,988 | | | 25,024,464 | | | $ | 693,918,464 | |
| Class R: | | | | | | | | | | | | | | |
| Shares sold | | 3,136,557 | | | $ | 74,082,545 | | | 9,057,734 | | | $ | 233,025,489 | |
| Dividends reinvested | | 1,958,801 | | | | 47,814,339 | | | 2,422,309 | | | | 60,291,275 | |
| Shares redeemed | | (4,438,054 | ) | | (104,157,270 | ) | | (5,783,826 | ) | | (148,667,065 | ) |
| Net increase | | 657,304 | | | $ | 17,739,614 | | | 5,696,217 | | | $ | 144,649,699 | |
| |
| Alger Capital Appreciation Focus Fund | | | | | | | | | | | | | |
| Class A: | | | | | | | | | | | | | | |
| Shares sold | | 548,914 | | | $ | 12,972,801 | | | 1,183,661 | | | $ | 26,976,396 | |
| Dividends reinvested | | 12,944 | | | | 312,984 | | | — | | | | — | |
| Shares redeemed | | (421,088 | ) | | | (9,676,773 | ) | | (425,035 | ) | | | (10,098,497 | ) |
| Net increase | | 140,770 | | | $ | 3,609,012 | | | 758,626 | | | $ | 16,877,899 | |
| Class C: | | | | | | | | | | | | | | |
| Shares sold | | 136,413 | | | $ | 3,132,590 | | | 178,046 | | | $ | 4,152,257 | |
| Dividends reinvested | | 3,659 | | | | 86,523 | | | — | | | | — | |
| Shares redeemed | | (19,660 | ) | | | (435,191 | ) | | (22,530 | ) | | | (519,786 | ) |
| Net increase | | 120,412 | | | $ | 2,783,922 | | | 155,516 | | | $ | 3,632,471 | |
| Class I: | | | | | | | | | | | | | | |
| Shares sold | | 294,002 | | | $ | 6,949,053 | | | 827,893 | | | $ | 19,755,163 | |
| Dividends reinvested | | 9,363 | | | | 227,418 | | | — | | | | — | |
| Shares redeemed | | (244,417 | ) | | | (5,664,668 | ) | | (401,861 | ) | | | (9,321,977 | ) |
| Net increase | | 58,948 | | | $ | 1,511,803 | | | 426,032 | | | $ | 10,433,186 | |
| Class Z: | | | | | | | | | | | | | | |
| Shares sold | | 514,212 | | | $ | 12,301,091 | | | 119,545 | | | $ | 2,843,126 | |
| Dividends reinvested | | 4,919 | | | | 120,412 | | | — | | | | — | |
| Shares redeemed | | (178,321 | ) | | | (4,044,749 | ) | | (25,582 | ) | | | (601,951 | ) |
| Net increase | | 340,810 | | | $ | 8,376,754 | | | 93,963 | | | $ | 2,241,175 | |
- 66 -
THE ALGER INSTITUTIONAL FUNDS
NOTES TO FINANCIAL STATEMENTS (Unaudited) (Continued)
| | | | | | | | | | | | | | | | | |
| | | FOR THE SIX MONTHS ENDED | | | | FOR THE YEAR ENDED | |
| | | APRIL 30, 2016 | | | | OCTOBER 31, 2015 | |
| | | SHARES | | | | | AMOUNT | | | | SHARES | | | | | AMOUNT | |
| Alger Mid Cap Growth Institutional Fund | | | | | | | | | | | | | | | | |
| Class I: | | | | | | | | | | | | | | | | | |
| Shares sold | | 296,545 | | | $ | | 6,295,942 | | | | 902,649 | | | $ | | 21,241,975 | |
| Shares redeemed | | (732,896 | ) | | | | (15,482,065 | ) | | | (1,770,784 | ) | | | | (41,417,306 | ) |
| Net decrease | | (436,351 | ) | | $ | | (9,186,123 | ) | | | (868,135 | ) | | $ | | (20,175,331 | ) |
| Class R: | | | | | | | | | | | | | | | | | |
| Shares sold | | 71,305 | | | $ | | 1,419,481 | | | | 203,467 | | | $ | | 4,468,737 | |
| Shares redeemed | | (166,418 | ) | | | | (3,310,765 | ) | | | (412,966 | ) | | | | (8,989,356 | ) |
| Net decrease | | (95,113 | ) | | $ | | (1,891,284 | ) | | | (209,499 | ) | | $ | | (4,520,619 | ) |
| |
| Alger Small Cap Growth Institutional Fund | | | | | | | | | | | | | | | |
| Class I: | | | | | | | | | | | | | | | | | |
| Shares sold | | 2,047,516 | | | $ | | 32,789,211 | | | | 2,831,473 | | | $ | | 69,667,841 | |
| Dividends reinvested | | 7,154,149 | | | | | 109,458,479 | | | | 4,775,991 | | | | | 111,758,197 | |
| Shares redeemed | | (8,614,942 | ) | | (130,390,231 | ) | | | (15,587,700 | ) | | (384,394,678 | ) |
| Net increase (decrease) | | 586,723 | | | $ | | 11,857,459 | | | | (7,980,236 | ) | | $ | | (202,968,640 | ) |
| Class R: | | | | | | | | | | | | | | | | | |
| Shares sold | | 123,639 | | | $ | | 1,648,887 | | | | 227,162 | | | $ | | 5,071,784 | |
| Dividends reinvested | | 449,925 | | | | | 5,907,509 | | | | 259,849 | | | | | 5,532,180 | |
| Shares redeemed | | (263,419 | ) | | | | (3,806,110 | ) | | | (790,204 | ) | | | | (17,568,320 | ) |
| Net increase (decrease) | | 310,145 | | | $ | | 3,750,286 | | | | (303,193 | ) | | $ | | (6,964,356 | ) |
(b) Redemption Fee: Prior to March 1, 2015, the Alger Capital Appreciation Focus Fund
imposed a 2.00% redemption fee on certain Class A and Class C Fund shares redeemed
(including shares redeemed by exchange) within 30 days after such shares were acquired.
Since March 1, 2015, the redemption fee is no longer imposed.
During the year ended October 31, 2015, shares redeemed for the Class I shares of Alger
Capital Appreciation Institutional Fund include redemption-in-kind transactions of
10,621,246 shares valued at $307,755,100. The Fund had realized gains on these transactions
of $47,725,674.
NOTE 7 — Income Tax Information:
At October 31, 2015, the Funds, for federal income tax purposes, had capital loss
carryforwards as set forth in the table below. These amounts may be applied against future
net realized gains until the earlier of their utilization or expiration.
| | | | | | | | |
| | Alger Capital | Alger Capital | | Alger Mid | | Alger Small |
| | Appreciation | Appreciation Focus | | Cap Growth | | Cap Growth |
| Expiration Dates | Institutional Fund | | Fund | Institutional Fund | Institutional Fund |
| 2017 | | — | | — | $ | 280,123,926 | | — |
| Total | | — | | — | | 280,123,926 | | — |
- 67 -
THE ALGER INSTITUTIONAL FUNDS
NOTES TO FINANCIAL STATEMENTS (Unaudited) (Continued)
Under the Regulated Investment Company Modernization Act of 2010, capital losses
incurred by the Funds after October 31, 2011 will not be subject to expiration. In addition,
losses incurred after October 31, 2011 must be utilized prior to the utilization of capital loss
carryforwards above.
During the year ended October 31, 2015 the Alger Capital Appreciation Focus Fund, and
Alger Mid Cap Growth Institutional Fund utilized $2,828,765, and $5,674,132 of their
capital loss carryforwards, respectively.
The difference between book-basis and tax-basis unrealized appreciation (depreciation) is
determined annually and is attributable primarily to the tax deferral of losses on wash sales,
U.S. Internal Revenue Code Section 988 currency transactions, nondeductible expenses
on dividends sold short, the tax treatment of partnerships investments, the realization of
unrealized appreciation of passive foreign investment companies, and return of capital from
real estate investment trust investments.
NOTE 8 — Fair Value Measurements
The following is a summary of the inputs used as of April 30, 2016 in valuing the Funds’
investments carried at fair value on a recurring basis. Based upon the nature, characteristics,
and risks associated with their investments, the Funds have determined that presenting them
by security type and sector is appropriate.
| | | | | | | | | | | | | | | | | |
| Alger Capital Appreciation | | | | | | | | | | | | | | | | | |
| Institutional Fund | | | | TOTAL FUND | | | | LEVEL 1 | | | | LEVEL 2 | | | | LEVEL 3 |
| COMMON STOCKS | | | | | | | | | | | | | | | | | |
| Consumer Discretionary | $ | 662,418,557 | $ | 662,366,201 | | | | — | | $ | 52,356 |
| Consumer Staples | | | | 300,285,195 | | 300,285,195 | | | | — | | | | — |
| Energy | | | | 57,544,439 | | 57,544,439 | | | | — | | | | — |
| Financials | | | | 56,872,951 | | 56,872,951 | | | | — | | | | — |
| Health Care | | | | 662,939,834 | | 655,661,017 | | 7,278,817 | | | | — |
| Industrials | | | | 393,104,801 | | 393,104,801 | | | | — | | | | — |
| Information Technology | | | | 1,198,940,868 | | 1,196,311,538 | | | | — | | | 2,629,330 |
| Materials | | | | 44,086,310 | | 44,086,310 | | | | — | | | | — |
| Telecommunication Services | | | | 69,508,988 | | 69,508,988 | | | | — | | | | — |
| TOTAL COMMON STOCKS | $ | 3,445,701,943 | $ | 3,435,741,440 | $ | | | 7,278,817 | | $ | | 2,681,686 |
| MASTER LIMITED PARTNERSHIP | | | | | | | | | | | | | | | | | |
| Financials | | | | 26,152,021 | | 26,152,021 | | | | — | | | | — |
| PREFERRED STOCKS | | | | | | | | | | | | | | | | | |
| Consumer Discretionary | | | | | 1,501,699 | | | | — | | | | — | | | 1,501,699 |
| Health Care | | | | | 3,690,198 | | | | — | | | | — | | | 3,690,198 |
| Information Technology | | | | 12,120,328 | | | | — | | | | — | | 12,120,328 |
| TOTAL PREFERRED STOCKS | $ | | 17,312,225 | | | | — | | | | — | | $ | | 17,312,225 |
| REAL ESTATE INVESTMENT TRUST | | | | | | | | | | | | | | | |
| Financials | | | | 35,485,459 | | 35,485,459 | | | | — | | | | — |
| TOTAL INVESTMENTS IN | | | | | | | | | | | | | | | | | |
| SECURITIES | $ | 3,524,651,648 | $ | 3,497,378,920 | $ | | | 7,278,817 | | $ | | 19,993,911 |
- 68 -
THE ALGER INSTITUTIONAL FUNDS
NOTES TO FINANCIAL STATEMENTS (Unaudited) (Continued)
| | | | | | | | | | | | | | | |
| Alger Capital Appreciation Focus | | | | | | | | | | | | | | | |
| Fund | | | TOTAL FUND | | | | LEVEL 1 | | | LEVEL 2 | | | LEVEL 3 |
| COMMON STOCKS | | | | | | | | | | | | | | | |
| Consumer Discretionary | | | $ | 14,157,609 | $ | 14,157,609 | | | | — | | | — |
| Consumer Staples | | | | 2,575,472 | | | 2,575,472 | | | | — | | | — |
| Energy | | | | 1,032,431 | | | 1,032,431 | | | | — | | | — |
| Financials | | | | 1,167,923 | | | 1,167,923 | | | | — | | | — |
| Health Care | | | 12,376,842 | | 12,376,842 | | | | — | | | — |
| Industrials | | | | 5,824,323 | | | 5,824,323 | | | | — | | | — |
| Information Technology | | | 26,065,189 | | 26,065,189 | | | | — | | | — |
| Materials | | | | 471,188 | | | 471,188 | | | | — | | | — |
| Telecommunication Services | | | | 1,048,336 | | | 1,048,336 | | | | — | | | — |
| TOTAL COMMON STOCKS | $ | 64,719,313 | | $ | | 64,719,313 | | | | — | | | — |
| MASTER LIMITED PARTNERSHIP | | | | | | | | | | | | | | | |
| Financials | | | | 871,769 | | | 871,769 | | | | — | | | — |
| PREFERRED STOCKS | | | | | | | | | | | | | | | |
| Health Care | | | | 347,249 | | | | — | | | | — | | 347,249 |
| REAL ESTATE INVESTMENT TRUST | | | | | | | | | | | | |
| Financials | | | | 1,561,234 | | | 1,561,234 | | | | — | | | — |
| TOTAL INVESTMENTS IN | | | | | | | | | | | | | | | |
| SECURITIES | $ | 67,499,565 | | $ | | 67,152,316 | | | | — | $ | | 347,249 |
| |
| |
| Alger Mid Cap Growth Institutional | | | | | | | | | | | | | | | |
| Fund | | | TOTAL FUND | | | | LEVEL 1 | | | LEVEL 2 | | | LEVEL 3 |
| COMMON STOCKS | | | | | | | | | | | | | | | |
| Consumer Discretionary | $ 30,658,256 | $ | 30,654,506 | | | | — | $ | 3,750 |
| Consumer Staples | | | | 5,657,542 | | | 5,657,542 | | | | — | | | — |
| Energy | | | | 1,098,526 | | | 1,098,526 | | | | — | | | — |
| Financials | | | | 4,873,283 | | | 4,873,283 | | | | — | | | — |
| Health Care | | | 16,243,445 | | 16,243,445 | | | | — | | | — |
| Industrials | | | 18,081,721 | | 18,081,721 | | | | — | | | — |
| Information Technology | | | 24,840,248 | | 24,703,562 | | | | — | | 136,686 |
| Materials | | | | 5,488,954 | | | 5,488,954 | | | | — | | | — |
| TOTAL COMMON STOCKS | $ | 106,941,975 | | $ | | 106,801,539 | | | | — | $ | | 140,436 |
| PREFERRED STOCKS | | | | | | | | | | | | | | | |
| Consumer Discretionary | | | | 93,157 | | | | — | | | | — | | 93,157 |
| Health Care | | | | 1,469,572 | | | | — | | | | — | | 1,469,572 |
| Information Technology | | | | 630,047 | | | | — | | | | — | | 630,047 |
| TOTAL PREFERRED STOCKS | $ | 2,192,776 | | | | — | | | | — | $ | | 2,192,776 |
| REAL ESTATE INVESTMENT TRUST | | | | | | | | | | | | | | |
| Financials | | | | 3,731,781 | | | 3,731,781 | | | | — | | | — |
| SPECIAL PURPOSE VEHICLE | | | | | | | | | | | | | | | |
| Financials | | | | 240,362 | | | | — | | | | — | | 240,362 |
| TOTAL INVESTMENTS IN | | | | | | | | | | | | | | | |
| SECURITIES | $ | 113,106,894 | | $ | | 110,533,320 | | | | — | $ | | 2,573,574 |
- 69 -
THE ALGER INSTITUTIONAL FUNDS
NOTES TO FINANCIAL STATEMENTS (Unaudited) (Continued)
| | | | | | | | | | | | | | |
| Alger Small Cap Growth Institutional | | | | | | | | | | | | | | |
| Fund | | | TOTAL FUND | | | | LEVEL 1 | | | LEVEL 2 | | | LEVEL 3 |
| COMMON STOCKS | | | | | | | | | | | | | | |
| Consumer Discretionary | $ | | 28,625,284 | | $ | 28,625,284 | | | — | | | — |
| Consumer Staples | | | | 4,242,082 | | | | 4,242,082 | | | — | | | — |
| Energy | | | | 3,738,767 | | | | 3,738,767 | | | — | | | — |
| Financials | | | 11,557,277 | | | 11,557,277 | | | — | | | — |
| Health Care | | | 65,573,449 | | | 65,573,449 | | | — | | | — |
| Industrials | | | 24,384,247 | | | 24,384,247 | | | — | | | — |
| Information Technology | | | 75,410,118 | | | 75,410,118 | | | — | | | — |
| Materials | | | | 7,140,649 | | | | 7,140,649 | | | — | | | — |
| TOTAL COMMON STOCKS | $ | 220,671,873 | $ | 220,671,873 | | | — | | | — |
| PREFERRED STOCKS | | | | | | | | | | | | | | |
| Health Care | | | | 2,557,000 | | | | — | | | — | | 2,557,000 |
| REAL ESTATE INVESTMENT TRUST | | | | | | | | | | | | | |
| Financials | | | | 7,141,931 | | | | 7,141,931 | | | — | | | — |
| RIGHTS | | | | | | | | | | | | | | |
| Health Care | | | | — | | | | — | | | —* | | | —* |
| SPECIAL PURPOSE VEHICLE | | | | | | | | | | | | | | |
| Financials | | | | 775,134 | | | | — | | | — | | 775,134 |
| TOTAL INVESTMENTS IN | | | | | | | | | | | | | | |
| SECURITIES | $ | 231,145,938 | $ | 227,813,804 | | | — | $ | | 3,332,134 |
| *Small Cap Growth Institutional Fund Rights are fair valued at zero as of April 30, 2016. | | | | | | |
| | | |
| | | FAIR VALUE |
| | MEASUREMENTS |
| | USING SIGNIFICANT |
| | UNOBSERVABLE |
| | INPUTS (LEVEL 3) |
| Alger Capital Appreciation Institutional Fund | Common Stocks |
| Opening balance at November 1, 2015 | $ | 2,203,626 |
| Transfers into Level 3 | | | — |
| Transfers out of Level 3 | | | — |
| Total gains or losses | | | |
| Included in net realized gain (loss) on investments | | – |
| Included in net unrealized gain (loss) on investments | | 478,060 |
| Purchases and sales | | | – |
| Purchases | | – |
| Sales | | – |
| Closing balance at April 30, 2016 | | | 2,681,686 |
| The amount of total gains or losses for the period included in net realized | | | |
| and unrealized gain (loss) attributable to change in unrealized appreciation | | | |
| (depreciation) relating to investments still held at April 30,2016 | $ | 478,060 |
- 70 -
THE ALGER INSTITUTIONAL FUNDS
NOTES TO FINANCIAL STATEMENTS (Unaudited) (Continued)
| | | |
| | | FAIR VALUE |
| | MEASUREMENTS |
| | USING SIGNIFICANT |
| | UNOBSERVABLE |
| | INPUTS (LEVEL 3) |
| Alger Capital Appreciation Institutional Fund | Preferred Stocks |
| Opening balance at November 1, 2015 | $ | 15,625,491 |
| Transfers into Level 3 | | | — |
| Transfers out of Level 3 | | | — |
| Total gains or losses | | | |
| Included in net realized gain (loss) on investments | | – |
| Included in net unrealized gain (loss) on investments | | 1,686,734 |
| Purchases and sales | | | – |
| Purchases | | – |
| Sales | | – |
| Closing balance at April 30, 2016 | | | 17,312,225 |
| The amount of total gains or losses for the period included in net realized | | | |
| and unrealized gain (loss) attributable to change in unrealized appreciation | | | |
| (depreciation) relating to investments still held at April 30,2016 | $ | 1,686,734 |
| |
| | | FAIR VALUE |
| | MEASUREMENTS |
| | USING SIGNIFICANT |
| | UNOBSERVABLE |
| | INPUTS (LEVEL 3) |
| Alger Capital Appreciation Focus Fund | Preferred Stocks |
| Opening balance at November 1, 2015 | $ | 345,713 |
| Transfers into Level 3 | | | — |
| Transfers out of Level 3 | | | — |
| Total gains or losses | | | |
| Included in net realized gain (loss) on investments | | – |
| Included in net unrealized gain (loss) on investments | | 1,536 |
| Purchases and sales | | | – |
| Purchases | | – |
| Sales | | – |
| Closing balance at April 30, 2016 | | | 347,249 |
| The amount of total gains or losses for the period included in net realized | | | |
| and unrealized gain (loss) attributable to change in unrealized appreciation | | | |
| (depreciation) relating to investments still held at April 30,2016 | $ | 1,536 |
- 71 -
THE ALGER INSTITUTIONAL FUNDS
NOTES TO FINANCIAL STATEMENTS (Unaudited) (Continued)
| | | | |
| | | FAIR VALUE | |
| | MEASUREMENTS | |
| | USING SIGNIFICANT | |
| | UNOBSERVABLE | |
| | INPUTS (LEVEL 3) | |
| Alger Mid Cap Growth Institutional Fund | Common Stocks | |
| Opening balance at November 1, 2015 | $ | 115,585 | |
| Transfers into Level 3 | | | — | |
| Transfers out of Level 3 | | | — | |
| Total gains or losses | | | | |
| Included in net realized gain (loss) on investments | | – | |
| Included in net unrealized gain (loss) on investments | | 24,851 | |
| Purchases and sales | | | – | |
| Purchases | | – | |
| Sales | | – | |
| Closing balance at April 30, 2016 | | | 140,436 | |
| The amount of total gains or losses for the period included in net realized | | | | |
| and unrealized gain (loss) attributable to change in unrealized appreciation | | | | |
| (depreciation) relating to investments still held at April 30,2016 | $ | 24,851 | |
| |
| Alger Mid Cap Growth Institutional Fund | Preferred Stocks | |
| Opening balance at November 1, 2015 | $ | 2,711,929 | |
| Transfers into Level 3 | | | — | |
| Transfers out of Level 3 | | | — | |
| Total gains or losses | | | | |
| Included in net realized gain (loss) on investments | | – | |
| Included in net unrealized gain (loss) on investments | | (519,153 | ) |
| Purchases and sales | | | – | |
| Purchases | | – | |
| Sales | | – | |
| Closing balance at April 30, 2016 | | | 2,192,776 | |
| The amount of total gains or losses for the period included in net realized | | | | |
| and unrealized gain (loss) attributable to change in unrealized appreciation | | | | |
| (depreciation) relating to investments still held at April 30,2016 | $ | (519,153 | ) |
| |
| | Special Purpose | |
| Alger Mid Cap Growth Institutional Fund | | | Vehicle | |
| Opening balance at November 1, 2015 | $ | 240,362 | |
| Transfers into Level 3 | | | — | |
| Transfers out of Level 3 | | | — | |
| Total gains or losses | | | | |
| Included in net realized gain (loss) on investments | | – | |
| Included in net unrealized gain (loss) on investments | | – | |
| Purchases and sales | | | – | |
| Purchases | | – | |
| Sales | | – | |
| Closing balance at April 30, 2016 | | | 240,362 | |
| The amount of total gains or losses for the period included in net realized | | | | |
| and unrealized gain (loss) attributable to change in unrealized appreciation | | | | |
| (depreciation) relating to investments still held at April 30,2016 | $ | – | |
- 72 -
THE ALGER INSTITUTIONAL FUNDS
NOTES TO FINANCIAL STATEMENTS (Unaudited) (Continued)
| | | | |
| | | FAIR VALUE | |
| | MEASUREMENTS | |
| | USING SIGNIFICANT | |
| | UNOBSERVABLE | |
| | INPUTS (LEVEL 3) | |
| |
| | | FAIR VALUE | |
| | MEASUREMENTS | |
| | USING SIGNIFICANT | |
| | UNOBSERVABLE | |
| | INPUTS (LEVEL 3) | |
| Alger Small Cap Growth Institutional Fund | Preferred Stocks | |
| Opening balance at November 1, 2015 | $ | 3,505,601 | |
| Transfers into Level 3 | | | — | |
| Transfers out of Level 3 | | | — | |
| Total gains or losses | | | | |
| Included in net realized gain (loss) on investments | | – | |
| Included in net unrealized gain (loss) on investments | | (948,601 | ) |
| Purchases and sales | | | – | |
| Purchases | | – | |
| Sales | | – | |
| Closing balance at April 30, 2016 | | | 2,557,000 | |
| The amount of total gains or losses for the period included in net realized | | | | |
| and unrealized gain (loss) attributable to change in unrealized appreciation | | | | |
| (depreciation) relating to investments still held at April 30,2016 | $ | (948,601 | ) |
| |
| Alger Small Cap Growth Institutional Fund | | | Rights | |
| Opening balance at November 1, 2015 | $ | — | |
| Transfers into Level 3 | | | — | |
| Transfers out of Level 3 | | | — | |
| Total gains or losses | | | | |
| Included in net realized gain (loss) on investments | | – | |
| Included in net unrealized gain (loss) on investments | | – | |
| Purchases and sales | | | – | |
| Purchases | | – | |
| Sales | | – | |
| Closing balance at April 30, 2016 | | | — | |
| The amount of total gains or losses for the period included in net realized | | | | |
| and unrealized gain (loss) attributable to change in unrealized appreciation | | | | |
| (depreciation) relating to investments still held at April 30,2016 | $ | — | |
- 73 -
THE ALGER INSTITUTIONAL FUNDS
NOTES TO FINANCIAL STATEMENTS (Unaudited) (Continued)
| | | |
| | | FAIR VALUE |
| | MEASUREMENTS |
| | USING SIGNIFICANT |
| | UNOBSERVABLE |
| | INPUTS (LEVEL 3) |
| | Special Purpose |
| Alger Small Cap Growth Institutional Fund | | | Vehicle |
| Opening balance at November 1, 2015 | $ | 775,134 |
| Transfers into Level 3 | | | — |
| Transfers out of Level 3 | | | — |
| Total gains or losses | | | |
| Included in net realized gain (loss) on investments | | – |
| Included in net unrealized gain (loss) on investments | | – |
| Purchases and sales | | | – |
| Purchases | | – |
| Sales | | – |
| Closing balance at April 30, 2016 | | | 775,134 |
| The amount of total gains or losses for the period included in net realized | | | |
| and unrealized gain (loss) attributable to change in unrealized appreciation | | | |
| (depreciation) relating to investments still held at April 30,2016 | $ | – |
The following table provides quantitative information about our Level 3 fair value
measurements of our investments as of April 30, 2016. In addition to the techniques and
inputs noted in the table below, according to our valuation policy we may also use other
valuation techniques and methodologies when determining our fair value measurements.
The table below is not intended to be all-inclusive, but rather provides information on the
Level 3 inputs as they relate to our fair value measurements.
| | | | | | |
| | | Fair Value | Valuation | Unobservable | | |
| | | April 30, 2016 | Methodology | Input | Input/Range | |
| Alger Capital Appreciation Institutional Fund | | | | |
| Common Stocks | $ | 52,356 | Income | Discount Rate | 40 | % |
| | | | Approach | | | |
| Common Stocks | | 2,629,330 | Performance | Market Multiple | 11.5x-12.3x | |
| | | | Multiple | | | |
| | | | Methodology | | | |
| | | | (xRevenue) | | | |
| Preferred Stocks | | 1,501,699 | Income | Discount Rate | 40 | % |
| | | | Approach | | | |
| Preferred Stocks | | 3,690,198 | Discounted | Discount Rate | 20 | % |
| | | | Cash Flow | | | |
| Preferred Stocks | | 12,120,328 | Performance | Market Multiple | 11.5x-12.3x | |
| | | | Multiple | | | |
| | | | Methodology | | | |
| | | | (xRevenue) | | | |
| Alger Capital Appreciation Focus Fund | | | | |
| Preferred Stocks | $ | 347,249 | Discounted | Discount Rate | 28 | % |
| | | | Cash Flow | | | |
- 74 -
THE ALGER INSTITUTIONAL FUNDS
NOTES TO FINANCIAL STATEMENTS (Unaudited) (Continued)
| | | | | | |
| Alger Mid Cap Growth Institutional Fund | | | | |
| Common Stocks | $ | 3,751 | Income | Discount Rate | 40 | % |
| | | | Approach | | | |
| Common Stocks | | 136,686 | Performance | Market Multiple | 11.5x-12.3x | |
| | | | Multiple | | | |
| | | | Methodology | | | |
| | | | (xRevenue) | | | |
| Preferred Stocks | | 93,156 | Income | Discount Rate | 40 | % |
| | | | Approach | | | |
| Preferred Stocks | | 250,783 | Discounted | Discount Rate | 20 | % |
| | | | Cash Flow | | | |
| Preferred Stocks | | 557,425 | Performance | Market Multiple | 11.5x-12.3x | |
| | | | Multiple | | | |
| | | | Methodology | | | |
| | | | (xRevenue) | | | |
| Special Purpose Vehicle | | 240,362 | Performance | Market Multiple | 4.38x-4.88x | |
| | | | Multiple | | | |
| | | | Methodology | | | |
| | | | (xRevenue) | | | |
| |
| Alger Small Cap Growth Institutional Fund | | | | |
| Preferred Stocks | | 1,965,265 | Discounted | Discount Rate | 20-28 | % |
| | | | Cash Flow | | | |
| Preferred Stocks | | 591,735 | Discounted | Discount Rate | 20.7 | % |
| | | | Cash Flow | Weight | 40 | % |
| | | | Liquidation | Estimated Recover | NA | |
| | | | Analysis | Levels | | |
| | | | | Weight | 60 | % |
| Special Purpose Vehicle | | 775,134 | Performance | Market Multiple | 4.38x-4.88x | |
| | | | Multiple | | | |
| | | | Methodology | | | |
| | | | (xRevenue) | | | |
The significant unobservable inputs used in the fair value measurement of the company’s
securities are revenue and EBITDA multiples, discount rates, and the probabilities of
success of certain outcomes. Significant increases and decreases in these inputs in isolation
and interrelationships between those inputs could result in significantly higher or lower fair
value measurements as noted in the table above.
On April 30, 2016, there were no transfers of securities between Level 1 and Level 2.
Certain of the Funds’ assets and liabilities are held at carrying amount or face value, which
approximates fair value for financial statement purposes. As of April 30, 2016, such assets
are categorized within the disclosure hierarchy as follows:
- 75 -
THE ALGER INSTITUTIONAL FUNDS
NOTES TO FINANCIAL STATEMENTS (Unaudited) (Continued)
| | | | | | | | | | |
| | | TOTAL FUND | LEVEL 1 | | LEVEL 2 | | LEVEL 3 |
| Cash, Foreign cash and Cash equivalents: | | | | | | | | | | |
| | | | | | | | | | | |
| Alger Capital Appreciation Institutional Fund | $ | 133,799,720 | $ | — | $ | 133,799,720 | | | — |
| Alger Capital Appreciation Focus Fund | | | 3,324,233 | | — | | 3,324,233 | | | — |
| Alger Mid Cap Growth Institutional Fund | | | 569,694 | | — | | 569,694 | | | — |
| Alger Small Cap Growth Institutional Fund | | | 7,319,034 | | — | | 7,319,034 | | | — |
NOTE 9 — Derivatives:
Financial Accounting Standards Board Accounting Standards Codification 815 – Derivatives
and Hedging (“ASC 815”) requires qualitative disclosures about objectives and strategies for
using derivatives, quantitative disclosures about fair value amounts of and gains and losses
on derivative instruments, and disclosures about credit-risk-related contingent features in
derivative agreements.
Options— The Funds seek to capture the majority of the returns associated with equity
market investments. To meet this investment goal, the Funds invest in a broadly diversified
portfolio of common stocks, while also buying and selling call and put options on equities
and equity indices. The Funds purchase call options to increase their exposure to the stock
market and also provide diversification of risk. The Funds purchase put options in order
to protect from significant market declines that may occur over a short period of time. The
Funds will write covered call and cash secured put options to generate cash flows while
reducing the volatility of the Funds’ portfolios. The cash flows may be an important source
of the Funds’ returns, although written call options may reduce the Funds’ ability to profit
from increases in the value of the underlying security or equity portfolio. The value of a
call option generally increases as the price of the underlying stock increases and decreases
as the stock decreases in price. Conversely, the value of a put option generally increases
as the price of the underlying stock decreases and decreases as the stock increases in price.
The combination of the diversified stock portfolio and the purchase and sale of options
is intended to provide the Funds with the majority of the returns associated with equity
market investments but with reduced volatility and returns that are augmented with the cash
flows from the sale of options. During the six months ended April 30, 2016, options were
used in accordance with these objectives.
The Funds’ option contracts were not subject to any rights of offset with any counterparty.
All of the Funds’ options were exchange traded which utilize a clearing house that acts as an
intermediary between buyer and seller, receiving initial and maintenance margin from both,
and guaranteeing performance of the option contract.
There were no open derivative instruments as of April 30, 2016.
NOTE 10 — Principal Risks:
As of April 30, 2016, the Funds invested a significant portion of its assets in securities in
the consumer discretionary, health care and information technology sectors. Changes in
- 76 -
THE ALGER INSTITUTIONAL FUNDS
NOTES TO FINANCIAL STATEMENTS (Unaudited) (Continued)
economic conditions affecting such sectors would have a greater impact on the Funds and
could affect the value, income and/or liquidity of positions in such securities.
In the normal course of business, the Funds invest in securities and enter into transactions
where risks exist due to fluctuations in the market (market risk) or failure of the issuer
of a security to meet all its obligations (issuer credit risk). The value of securities held by
the Funds may decline in response to certain events, including those directly involving the
issuers whose securities are owned by the Funds; conditions affecting the general economy;
overall market changes; local, regional or global political, social or economic instability; and
currency and interest rate and price fluctuations. Similar to issuer credit risk, the Funds may
be exposed to counterparty credit risk, or the risk that an entity with which the Funds have
unsettled or open transactions may fail to or be unable to perform on its commitments. The
Funds manage counterparty credit risk by entering into transactions only with counterparties
that they believe have the financial resources to honor their obligations and by monitoring
the financial stability of those counterparties. Financial assets, which potentially expose
the Funds to market, issuer and counterparty credit risks, consist principally of financial
instruments and receivables due from counterparties. The extent of the Funds’ exposure to
market, issuer and counterparty credit risks with respect to these financial assets is generally
approximated by its value recorded in the Statement of Assets and Liabilities, less any
collateral held by the Funds.
NOTE 11 — Affiliated Securities:
The issuers of the securities listed below are deemed to be affiliates of the Funds because
the Funds or their affiliates owned 5% or more of the issuer’s voting securities during all or
part of the six months ended April 30, 2016. Purchase and sale transactions and dividend
income earned during the period were as follows:
| | | | | | | | |
| | Shares/Par | | | Shares/Par | | | | |
| | at | | | at | | Realized | | Value at |
| | October 31, | Purchases/ | Sales/ | April | Dividend | Gain | | April |
| Security | 2015 | Conversion | Conversion | 30, 2016 | Income | (Loss) | | 30, 2016 |
| |
| Alger Capital Appreciation Institutional Fund | | | | | | |
| Common Stocks | | | | | | | | |
| Choicestream, Inc.* | 124,658 | – | – | 124,658 | – | – | $ | 52,356 |
| Preferred Stocks | | | | | | | | |
| Choicestream, Inc.* | 3,575,473 | – | – | 3,575,473 | – | – | | 1,501,699 |
| |
| Alger Capital Appreciation Focus Fund | | | | | | |
| Preferred Stocks | | | | | | | | |
| Prosetta Biosciences, | | | | | | | | |
| Inc.* | 76,825 | – | – | 76,825 | – | – | | 347,249 |
- 77 -
THE ALGER INSTITUTIONAL FUNDS
NOTES TO FINANCIAL STATEMENTS (Unaudited) (Continued)
| | | | | | | | |
| | Shares/Par | | | Shares/Par | | | | |
| | at | | | at | | Realized | | Value at |
| | October 31, | Purchases/ | Sales/ | April | Dividend | Gain | | April |
| Security | 2015 | Conversion | Conversion | 30, 2016 | Income | (Loss) | | 30, 2016 |
| |
| Alger Mid Cap Growth Institutional Fund | | | | | | |
| Common Stocks | | | | | | | | |
| Choicestream, Inc.* | 8,930 | – | – | 8,930 | – | – | $ | 3,750 |
| Preferred Stocks | | | | | | | | |
| Choicestream, Inc.* | 221,801 | – | – | 221,801 | – | – | | 93,157 |
| Prosetta Biosciences, | | | | | | | | |
| Inc.* | 166,009 | – | – | 166,009 | – | – | | 750,361 |
| Tolero | | | | | | | | |
| Pharmaceuticals, Inc.* | 354,870 | – | – | 354,870 | – | – | | 468,428 |
| |
| Alger Small Cap Growth Institutional Fund | | | | | | |
| Preferred Stocks | | | | | | | | |
| Prosetta Biosciences, | | | | | | | | |
| Inc.* | 133,263 | – | – | 133,263 | – | – | | 602,349 |
| Tolero | | | | | | | | |
| Pharmaceuticals, Inc.* | 448,284 | – | – | 448,284 | – | – | | 591,735 |
| * Non-income producing security. | | | | | | |
| |
| NOTE 12 — Subsequent Events: | | | | | | |
Management of each Fund has evaluated events that have occurred subsequent to April
30, 2016 through the issuance date of the Financial Statements. No such events have been
identified which require recognition and/or disclosure.
- 78 -
THE ALGER INSTITUTIONAL FUNDS
ADDITIONAL INFORMATION (Unaudited)
Shareholder Expense Example
As a shareholder of a Fund, you incur two types of costs: transaction costs, if applicable,
including sales charges (loads) and redemption fees; and ongoing costs, including
management fees, distribution (12b-1) fees, if applicable, and other fund expenses. This
example is intended to help you understand your ongoing costs (in dollars) of investing in
the Fund and to compare these costs with the ongoing costs of investing in other mutual
funds.
The example below is based on an investment of $1,000 invested at the beginning of the
six-month period starting November 1, 2015 and ending April 30, 2016.
Actual Expenses
The first line for each class of shares in the table below provides information about actual
account values and actual expenses. You may use the information in this line, together
with the amount you invested, to estimate the expenses that you would have paid over the
period. Simply divide your account value by $1,000 (for example, an $8,600 account value
divided by $1,000 = 8.6), then multiply the result by the number in the first line under the
heading entitled “Expenses Paid during the Period” to estimate the expenses you paid on
your account during this period.
Hypothetical Example for Comparison Purposes
The second line for each class of shares in the table below provides information about
hypothetical account values and hypothetical expenses based on the Fund’s actual expense
ratios for each class of shares and an assumed rate of return of 5% per year before expenses,
which is not the Fund’s actual return. The hypothetical account values and expenses may not
be used to estimate the actual ending account balance or expenses you paid for the period.
You may use this information to compare the ongoing costs of investing in the Fund and
other funds. To do so, compare this 5% hypothetical example with the 5% hypothetical
examples that appear in the shareholder reports of other funds.
Please note that the expenses shown in the table are meant to highlight your ongoing costs
only and do not reflect any transaction costs, such as sales charges (loads) and redemption
fees. Therefore, the second line under each class of shares in the table is useful in comparing
ongoing costs only, and will not help you determine the relative total costs of owning
different funds. In addition, if these transactional costs were included, your costs would
have been higher.
- 79 -
THE ALGER INSTITUTIONAL FUNDS
ADDITIONAL INFORMATION (Unaudited) (Continued)
| | | | | | | | | | | |
| | | | | | | | | | Annualized | |
| | | | | | | | Expenses | Expense Ratio | |
| | | Beginning | | | Ending | Paid During | | For the | |
| | | | Account | | | Account | the Six Months | Six Months | |
| | | | Value | | | Value | | Ended | | Ended | |
| | | November 1, 2015 | | April 30, 2016 | April 30, 2016(a) | April 30, 2016(b) | |
| Alger Capital Appreciation Institutional Fund | | | | | | | | | |
| Class I | Actual | $ | 1,000.00 | | $ | 958.80 | $ | 5.50 | | 1.13 | % |
| | Hypothetical(c) | | 1,000.00 | | 1,019.24 | | 5.67 | | 1.13 | |
| Class R | Actual | | 1,000.00 | | | 956.19 | | 7.83 | | 1.61 | |
| | Hypothetical(c) | | 1,000.00 | | 1,016.86 | | 8.07 | | 1.61 | |
| | | | | | | | | | | | |
| Alger Capital Appreciation Focus Fund | | | | | | | | | | |
| Class A | Actual | $ | 1,000.00 | | $ | 956.65 | $ | 5.98 | | 1.24 | % |
| | Hypothetical(c) | | 1,000.00 | | 1,018.75 | | 6.17 | | 1.24 | |
| Class C | Actual | | 1,000.00 | | | 953.57 | | 9.52 | | 1.97 | |
| | Hypothetical(c) | | 1,000.00 | | 1,015.12 | | 9.82 | | 1.97 | |
| Class I | Actual | | 1,000.00 | | | 957.25 | | 5.60 | | 1.15 | |
| | Hypothetical(c) | | 1,000.00 | | 1,019.14 | | 5.77 | | 1.15 | |
| Class Z | Actual | | 1,000.00 | | | 958.39 | | 4.33 | | 0.90 | |
| | Hypothetical(c) | | 1,000.00 | | 1,020.44 | | 4.47 | | 0.90 | |
| | | | | | | | | | | | |
| Alger Mid Cap Growth Institutional Fund | | | | | | | | | | |
| Class I | Actual | $ | 1,000.00 | | $ | 938.78 | $ | 5.98 | | 1.24 | % |
| | Hypothetical(c) | | 1,000.00 | | 1,018.70 | | 6.22 | | 1.24 | |
| Class R | Actual | | 1,000.00 | | | 936.10 | | 8.71 | | 1.80 | |
| | Hypothetical(c) | | 1,000.00 | | 1,015.86 | | 9.07 | | 1.80 | |
| | | | | | | | | | | | |
| Alger Small Cap Growth Institutional Fund | | | | | | | | | | |
| Class I | Actual | $ | 1,000.00 | | $ | 904.60 | $ | 6.01 | | 1.26 | % |
| | Hypothetical(c) | | 1,000.00 | | 1,018.55 | | 6.37 | | 1.26 | |
| Class R | Actual | | 1,000.00 | | | 902.62 | | 8.47 | | 1.78 | |
| | Hypothetical(c) | | 1,000.00 | | 1,015.96 | | 8.97 | | 1.78 | |
| | | | | | | | | | | | |
(a) Expenses are equal to the annualized expense ratio of the respective share class, multiplied by the average account value over
the period, multiple by 182/366 (to reflect the one-half year period).
(b) Annualized.
(c) 5% annual return before expenses.
- 80 -
THE ALGER INSTITUTIONAL FUNDS
ADDITIONAL INFORMATION (Unaudited) (Continued)
Privacy Policy
U.S. Consumer Privacy Notice Rev. 01/2015 3/30/15
| | |
| FACTS | WHAT DOES ALGER DO WITH YOUR PERSONAL INFORMATION? |
| |
| |
| Why? | Financial companies choose how they share your personal information. Federal law |
| | gives consumers the right to limit some but not all sharing. Federal law also requires us |
| | to tell you how we collect, share, and protect your personal information. Please read this |
| | notice carefully to understand what we do. |
| What? | The types of personal information we collect and share depend on the product or service |
| | you have with us. This information can include: |
| | • | Social Security number and |
| | • | Account balances and |
| | • | Transaction history and |
| | • | Purchase history and |
| | • | Assets |
| | When you are no longer our customer, we continue to share your information as |
| | described in this notice. |
| How? | All financial companies need to share personal information to run their everyday business. |
| | In the section below, we list the reasons financial companies can share personal |
| | information; the reasons Alger chooses to share; and whether you can limit this sharing. |
| | |
| Reasons we can share your personal | Does | Can you limit |
| information | Alger share? | this sharing? |
| For our everyday business purposes — | Yes | No |
| such as to process your transactions, maintain | | |
| your account(s), respond to court orders and | | |
| legal investigations, or report to credit bureaus | | |
| For our marketing purposes — to offer our | Yes | No |
| products and services to you | | |
| For joint marketing with other financial | No | We don’t share |
| companies | | |
| For our affiliates’ everyday business | Yes | No |
| purposes — information about your | | |
| transactions and experiences | | |
| For our affiliates’ everyday business | No | We don’t share |
| purposes — information about your | | |
| creditworthiness | | |
| For nonaffiliates to market to you | No | We don’t share |
| Questions? Call 1-800-342-2186 | | |
- 81 -
THE ALGER INSTITUTIONAL FUNDS
ADDITIONAL INFORMATION (Unaudited) (Continued)
| |
| Who we are | |
| |
| Who is providing this notice? | Alger includes Fred Alger Management, Inc. and Fred |
| | Alger & Company, Incorporated as well as the following |
| | funds: The Alger Funds, The Alger Funds II, The Alger |
| | Institutional Funds, The Alger Portfolios, and Alger |
| | Global Growth Fund. |
| |
| |
| What we do | |
| How does Alger | To protect your personal information from unauthorized |
| protect my personal | access and use, we use security measures that comply |
| information? | with federal law. These measures include computer |
| | safeguards and secured files and buildings. |
| How does Alger | We collect your personal information, for example, |
| collect my personal | when you: |
| information? | • Open an account or |
| | • Make deposits or withdrawals from your account or |
| | • Provide account information or |
| | • Pay us by check. |
| |
| |
| Why can’t I limit all sharing? | Federal law gives you the right to limit only |
| | • sharing for affiliates’ everyday business purposes |
| | information about your credit worthiness |
| | • affiliates from using your information to market to you |
| | • sharing for nonaffiliates to market to you |
| | State laws and individual companies may give you |
| | additional rights to limit sharing. |
| |
| |
| Definitions | |
| Affiliates | Companies related by common ownership or control. |
| | They can be financial and nonfinancial companies. |
| | • Our affiliates include Fred Alger Management, Inc. |
| | and Fred Alger & Company, Incorporated as well as the |
| | following funds: The Alger Funds, The Alger Funds II, |
| | The Alger Institutional Funds, The Alger Portfolios, and |
| | Alger Global Growth Fund. |
| Nonaffiliates | Companies not related by common ownership or |
| | control. They can be financial and nonfinancial |
| | companies. |
| Joint marketing | A formal agreement between nonaffiliated financial |
| | companies that together market financial products or |
| | services to you. |
| Other important information | |
- 82 -
THE ALGER INSTITUTIONAL FUNDS
ADDITIONAL INFORMATION (Unaudited) (Continued)
Proxy Voting Policies
A description of the policies and procedures the Trust uses to determine how to vote
proxies relating to portfolio securities and information regarding how the Fund voted
proxies relating to portfolio securities during the most recent 12-month period ended June
30 are available, without charge, by calling (800) 992-3863 or online on the Funds’ website
at www.alger.com or on the SEC’s website at www.sec.gov.
Fund Holdings
The Board of Trustees has adopted policies and procedures relating to disclosure of the
Funds’ portfolio securities. These policies and procedures recognize that there may be
legitimate business reasons for holdings to be disclosed and seek to balance those interests
to protect the proprietary nature of the trading strategies and implementation thereof by
the Funds.
Generally, the policies prohibit the release of information concerning portfolio holdings
which have not previously been made public to individual investors, institutional investors,
intermediaries that distribute the Funds’ shares and other parties which are not employed
by the Manager or its affiliates except when the legitimate business purposes for selective
disclosure and other conditions (designed to protect the Funds) are acceptable.
The Funds make their full holdings available semi-annually in shareholder reports filed on
Form N-CSR and after the first and third fiscal quarters in regulatory filings on Form N-Q.
These shareholder reports and regulatory filings are filed with the SEC, as required by federal
securities laws, and are generally available within sixty (60) days of the end of the Funds’
fiscal quarter. The Funds’ Forms N-Q are available online on the SEC’s website at www.
sec.gov or may be reviewed and copied at the SEC’s Public Reference Room in Washington,
D.C. Information regarding the operation of the SEC’s Public Reference Room may be
obtained by calling 1-800-SEC-0330.
In addition, the Funds make publicly available their respective month-end top 10 holdings
with a 15 day lag and their month-end full portfolios with a 60 day lag on their website www.
alger.com and through other marketing communications (including printed advertising/
sales literature and/or shareholder telephone customer service centers). No compensation
or other consideration is received for the non-public disclosure of portfolio holdings
information.
In accordance with the foregoing, the Funds provide portfolio holdings information to
service providers who provide necessary or beneficial services when such service providers
need access to this information in the performance of their services and are subject to
duties of confidentiality (1) imposed by law, including a duty not to trade on non-public
information, and/or (2) pursuant to an agreement that confidential information is not to be
disclosed or used (including trading on such information) other than as required by law. From
time to time, the Funds will communicate with these service providers to confirm that they
understand the Funds’ policies and procedures regarding such disclosure. This agreement
must be approved by the Funds’ Chief Compliance Officer, President or Secretary.
- 83 -
THE ALGER INSTITUTIONAL FUNDS
ADDITIONAL INFORMATION (Unaudited) (Continued)
The Board of Trustees periodically reviews a report disclosing the third parties to whom
each Fund’s holdings information has been disclosed and the purpose for such disclosure,
and it considers whether or not the release of information to such third parties is in the best
interest of the Fund and its shareholders.
In addition to material the Funds routinely provide to shareholders, the Manager may,
upon request, make additional statistical information available regarding the Funds. Such
information will include, but not be limited to, relative weightings and characteristics of a
Fund portfolios versus its peers or an index (such as P/E ratio, alpha, beta, capture ratio,
standard deviation, EPS forecasts, Sharpe ratio, information ratio, R-squared, and market
cap analysis), security specific impact on overall portfolio performance month-end top
ten contributors to and detractors from performance, breakdown of High Unit Volume
Growth holdings vs. Positive Lifecycle Change holdings, portfolio turnover, and requests
of a similar nature. Please contact the Funds at (800) 992-3863 to obtain such information.
- 84 -
THE ALGER INSTITUTIONAL FUNDS
360 Park Avenue South
New York, NY 10010
(800) 992-3863
www.alger.com
Investment Manager
Fred Alger Management, Inc.
360 Park Avenue South
New York, NY 10010
Distributor
Fred Alger & Company, Incorporated
360 Park Avenue South
New York, NY 10010
Transfer Agent and Dividend Disbursing Agent
State Street Bank and Trust Company
c/o Boston Financial Data Services, Inc.
P.O. Box 8480
Boston, MA 02266-8480
Custodian
Brown Brothers Harriman & Company
50 Post Office Square
Boston, MA 02110
This report is submitted for the general information of the shareholders of The Alger
Institutional Funds. It is not authorized for distribution to prospective investors unless
accompanied by an effective Prospectus for the Trust, which contains information
concerning the Trust’s investment policies, fees and expenses as well as other pertinent
information.
- 85 -
ITEM 2. CODE OF ETHICS.
Not applicable.
ITEM 3. AUDIT COMMITTEE FINANCIAL EXPERT.
Not applicable.
ITEM 4. PRINCIPAL ACCOUNTANT FEES AND SERVICES.
Not applicable.
ITEM 5. AUDIT COMMITTEE OF LISTED REGISTRANTS.
Not applicable.
ITEM 6. INVESTMENTS.
Not applicable.
ITEM 7. DISCLOSURE OF PROXY VOTING POLICIES AND PROCEDURES FOR CLOSED-END MANAGEMENT
INVESTMENT COMPANIES.
Not applicable.
ITEM 8. PORTFOLIO MANAGERS OF CLOSED-END MANAGEMENT INVESTMENT COMPANIES.
Not applicable.
ITEM 9. PURCHASES OF EQUITY SECURITIES BY CLOSED-END MANAGEMENT INVESTMENT COMPANY
AND AFFILIATED PURCHASERS.
Not applicable.
ITEM 10. SUBMISSION OF MATTERS TO A VOTE OF SECURITY HOLDERS.
Not applicable.
ITEM 11. CONTROLS AND PROCEDURES.
(a) The Registrant’s principal executive officer and principal financial officer have concluded that
the Registrant’s disclosure controls and procedures (as defined in Rule 30a-3(c) under the
Investment Company Act of 1940, as amended) are effective based on their evaluation of the
disclosure controls and procedures as of a date within 90 days of the filing date of this document.
(b) No changes in the Registrant’s internal control over financial reporting occurred during the
Registrant’s second fiscal quarter of the period covered by this report that materially affected, or
are reasonably likely to materially affect, the Registrant’s internal control over financial reporting.
ITEM 12. EXHIBITS.
(a) (1) Not applicable
(a) (2) Certifications of principal executive officer and principal financial officer as required by rule 30a-
2(a) under the Investment Company Act of 1940 are attached as Exhibit 99.CERT
(a) (3) Not applicable
(b) Certifications of principal executive officer and principal financial officer as required by rule 30a-2(b)
under the Investment Company Act of 1940 are attached as Exhibit 99.906CERT
SIGNATURES
Pursuant to the requirements of the Securities Exchange Act of 1934 and the Investment Company
Act of 1940, the registrant has duly caused this report to be signed on its behalf by the
undersigned, thereunto duly authorized.
The Alger Institutional Funds
By: /s/Hal Liebes
Hal Liebes
President
Date: June 24, 2016
Pursuant to the requirements of the Securities Exchange Act of 1934 and the Investment Company
Act of 1940, this report has been signed below by the following persons on behalf of the registrant
and in the capacities and on the dates indicated.
By: /s/Hal Liebes
Hal Liebes
President
Date: June 24, 2016
By: /s/Michael D. Martins
Michael D. Martins
Treasurer
Date: June 24, 2016