| | OMB APPROVAL |
| | OMB Number: | 3235-0570 |
| | Expires: | January 31, 2014 |
| UNITED STATES | Estimated average burden hours per response. . . . . . . . . . . . . . . . .20.6 |
| SECURITIES AND EXCHANGE COMMISSION | |
| Washington, D.C. 20549 | |
| | | | |
FORM N-CSR
CERTIFIED SHAREHOLDER REPORT OF REGISTERED
MANAGEMENT INVESTMENT COMPANIES
Investment Company Act file number | 811-07986 |
|
The Alger Institutional Funds |
(Exact name of registrant as specified in charter) |
|
360 Park Avenue South New York, New York | | 10010 |
(Address of principal executive offices) | | (Zip code) |
|
Mr. Hal Liebes
Fred Alger Management, Inc.
360 Park Avenue South
New York, New York 10010 |
(Name and address of agent for service) |
|
Registrant’s telephone number, including area code: | 212-806-8800 | |
|
Date of fiscal year end: | October 31 | |
|
Date of reporting period: | April 30, 2012 | |
| | | | | | | | |
ITEM 1. REPORT(S) TO STOCKHOLDERS.
The Alger
Institutional Funds
SEMI-ANNUAL REPORT
April 30, 2012
(Unaudited)
Table of Contents
THE ALGER INSTITUTIONAL FUNDS
Shareholders’ Letter | 1 |
Fund Highlights | 9 |
Portfolio Summary | 13 |
Schedules of Investments | 14 |
Statements of Assets and Liabilities | 39 |
Statements of Operations | 41 |
Statements of Changes in Net Assets | 44 |
Financial Highlights | 46 |
Notes to Financial Statements | 54 |
Additional Information | 69 |
Go Paperless With Alger Electronic Delivery Service
Alger is pleased to provide you with the ability to access regulatory materials online. When documents such as prospectuses and annual and semi-annual reports are available, we’ll send you an e-mail notification with a convenient link that will take you directly to the fund information on our website. To sign up for this free service, simply enroll at www.icsdelivery.com/alger.
Shareholders’ Letter | June 5, 2012 |
Dear Shareholders,
A distorted view of reality can be costly. In one famous example, a radio broadcast depicting space aliens attacking New Jersey and New York City caused panicked listeners to hastily load their cars with emergency rations and flee to the mountains. As hysteria grew, some Americans even reported smelling poisonous gas and seeing explosions. Yet, Americans quickly learned that their efforts were pointless—the broadcast by Orson Welles was only for entertainment and not a depiction of reality. Today, the notorious War of the Worlds broadcast of 1938, which included frequent announcements that it was for entertainment only, illustrates the hazards of perception not reflecting reality.
In some ways, many investors who fled from equities over the past few years acted like panicked Americans fleeing fictional aliens. Just as Americans ignored notices that the War of the Worlds broadcast was for entertainment only, investors who sold stocks ignored strengthening U.S. corporate fundamentals, an improving domestic economy, and other factors that have helped drive strong equity market performance. Those investors accepted media pundits’ forecasts of economic gloom and hastily sold equities and loaded their portfolios with cash and bonds. Indeed, fund tracker Morningstar says redemptions from equity mutual funds since the financial crisis of 2008 have been extremely high, peaking at $278 billion in 2011. At the same time, strong U.S. corporate earnings and slow but significant economic growth resulted in equities, as measured by the S&P 500 Index, generating an 86.81% return from the end of the first quarter of 2009 until April 30, 2012. Unfortunately, investors who redeemed equity fund shares during that time period may have missed participating in an estimated $55.44 billion that would have resulted if they had maintained their stock exposure.(1)
At Fred Alger Management, Inc. (“Alger”), we acknowledge that the euro-zone debt crisis, rising fuel prices, and other developments that have driven market volatility are serious concerns. We also believe, however, that investors should take a balanced and long-term approach when assessing market conditions, rather than focus on negative news and run from equity investing. For example, in a Barron’s article last September, I maintained that market volatility was creating an excellent opportunity for buying equities. I reasoned that corporate fundamentals were strong, the economy was improving, and valuations, as measured by price-to-earnings ratios, were attractive. This call proved correct—from the September 3 date of the Barron’s article until April 30, 2012, equities, as measured by the S&P 500 Index, returned 19.04%.
A Valuable Lesson
The reasons for the strong market performance over the past few years are many and would take many more pages to dissect. However, at Alger, we have observed for many decades how strong companies can exploit change to build their businesses and to boost their free cash flow. Fundamental to exploiting change is management’s ability to adapt to developments, such as new regulations, rapid acceptance of the Internet, changing demographics, strong growth in emerging markets, and price volatility for commodities, including energy products. As an example, concerns that turmoil associated with the Arab Spring last year could disrupt oil production pushed prices of West Texas Intermediate Crude from $91.55 to $107.94 a barrel during the first quarter of 2011, striking fear that an oil shock could derail the global economic recovery. Prices eventually subsided only to
1
climb from $92.19 to $104.87 per barrel during the six-month reporting period as tensions grew over allegations that oil-rich Iran is developing nuclear weapons.
Many decades ago, such price volatility would disrupt company operations and push equity markets downward, but American businesses, or at least the better managed ones, have acted to minimize the impact of energy costs. In New York City, this means that the Empire State Building is generating attention for more than its highly regarded art-deco design and its role in the movie King Kong. Impressively, recent modifications to the office facility are expected to reduce energy usage by 38%, thereby saving some $4.40 million annually. At Alger, we believe that energy price volatility is a form of disruptive change and that companies that adapt to such change will have an advantage over competitors that continue conducting business as usual. The adaption is creating attractive investment opportunities as companies implement energy efficiency programs, create a seemingly endless assortment of energy savings products, and develop technologies for extracting energy commodities that were once inaccessible.
As oil prices soared in early 2011 and during the six-month reporting period, we continued to conduct in-depth research of company fundamentals to find compelling investment opportunities and we urged our clients to stay the course rather than sell equities. We stuck by our belief that oil price increases must be sudden and severe to spark a recession and that the U.S. is well prepared for price increases. At the time, we noted that Americans spend just slightly more than 5% of their disposable income on energy, compared to slightly more than 8% in the 1980s, according to BCA Research. Our conviction in equities proved to be correct, with the S&P 500 Index climbing 5.92% during the first quarter of 2011 and a modest, but still positive, 2.11% for that year. For the six-month reporting period ended April 30, 2012, furthermore, the S&P 500 gained 12.77%.
Much like radio listeners who heard ongoing reports of aliens attacking, investors over the past few years heard an ongoing stream of alleged reasons for selling equity investments. Investors were deluged with claims that the euro-zone debt crisis and drastic government austerity programs in Greece and other countries could push the region into a nasty recession and curtail global economic growth. On other days, media reports claimed that slowing economic growth in China—a country that is helping to spur strong global acceleration—could weaken. Those claims missed a more encouraging and accurate view that acknowledges an improving job market with the U.S. unemployment rate dropping from 8.7% in November of 2011 to 8.2% in March. A more accurate view also acknowledges that corporate fundamentals remained strong and that the troubled housing market continued to improve. In October of 2011, 7.6 months of residential inventory was available, according to the National Association of Realtors. Inventory has since declined to only 6.3 months as of March of this year.
Pundits also maintained that first quarter 2012 earnings would be disappointing and some added that the 8% year-over-year earnings increase for the fourth quarter of 2011, as reported by First Call, shows a moderation of earnings growth. Yet after more than 90% of S&P 500 Index companies reported first quarter results, Standard & Poor’s estimated that operating earnings would increase slightly more than 7% on a year-over-year basis. We note that as economic recoveries advance, quarterly earnings are compared against strong prior quarters rather than periods during recessions. This trend causes year-over-year increases to eventually moderate. Comparing the most recent two quarters to the
2
fourth quarter of 2009 and the first quarter of 2010, when earnings had yet to fully recover, provides a more favorable view. Earnings for the two recent quarters increased by more than 20% from levels two years earlier. The strong earnings are occurring even as corporations build cash balances rather than deploy the assets in new growth initiatives.
Going Forward
We think corporate fundamentals will remain strong. American businesses have done an admirable job of curtailing expenses, while job market improvements have strengthened consumers’ spending clout by providing more Americans with income. Corporations’ large cash balances, meanwhile, leave businesses well-positioned to invest in growth opportunities, pay dividends, and buy back stock. Also encouraging, manufacturing in the U.S. appears to be strengthening as illustrated by Carlisle Companies, which plans to move tire manufacturing from China to the U.S., and by foreign auto manufacturers Honda Motor Co., BMW AG, and Daimler AG, all of which plan to increase production in America.
Looking ahead, the nation’s lack of progress on curtailing annual budget deficits, which have been exceeding $1 trillion, and on reducing outstanding debt, which is approximately $15.50 trillion, remains a concern. We believe that a lack of clarity on addressing the problem has prevented corporations from investing their sizeable amounts of cash in growth initiatives. Additionally, as debt grows, the nation will face an increasing burden of paying creditors. Clearly, much work remains to reform taxation and government spending, but we are hopeful that elections in November will provide some indication of the direction that the nation will take to address the problem.
For the coming months, concerns over the euro zone and fuel prices may support increasing market volatility, which we believe may create an attractive buying opportunity similar to the one that emerged last summer. We believe that substantial support for equities would surface if the S&P 500 Index declined to approximately 1250. That would create a price-to-earnings ratio of only 12 times trailing earnings, which would significantly undervalue equities relative to other asset classes like bonds or real estate. At the same time, we believe that the strengthening U.S. economy, improving economic growth in China, and investors’ eventual acceptance of the euro zone’s ability to stem its debt crisis should result in the continuation of a bull market in U.S. equities. We believe that such a recovery could take the S&P 500 Index to new post-financial crisis highs. We note that the S&P 500 Index at 1600 would still represent a fair valuation at a roughly 15 P/E ratio based on our expectations for trailing earnings. That P/E would be in line with long-term historical averages. Viewed as an earnings yield, U.S. equities would still be attractively priced at a 6.67% earnings yield plus the 2% dividend yield as of April 30. A result of careful and cautious management, the quality of those earnings is very high. Thus, as of April 30, the S&P 500 Index free cash flow yield was 6%, which is highly attractive, especially when compared to the 1.92% yield of 10-year Treasury bonds.
In the meantime, large scale developments, such as the increasing use of the Internet, rapid growth of emerging markets, and regulatory changes, are creating compelling opportunities for leading companies to grow, making this an attractive time, we believe, for Alger to use its time-tested, disciplined, and research-driven strategy for finding compelling growth investments for our clients.
3
Portfolio Matters
Alger Capital Appreciation Institutional Fund
The Alger Capital Appreciation Institutional Fund returned 13.63% for the six-month period ended April 30, 2012, compared to the Russell 1000 Growth Index return of 14.13%.
During the period, the largest sector weightings were in the Information Technology and Consumer Discretionary sectors. The largest sector overweight was Industrials and the largest sector underweight was Consumer Staples. Relative outperformance in the Industrials and Information Technology sectors was the most important contributor to performance, while Energy and Consumer Staples detracted from results.
Among the most important contributors to relative performance were Lowe’s Companies, Inc.; Apple, Inc.; United Rentals, Inc.; CVS Caremark Corp.; and Seagate Technology PLC. Shares of home improvement retailer Lowe’s performed strongly after the company reported better-than-expected earnings driven by higher store traffic, mild weather, and strong sales of tools, appliances, lumber, and nursery items. The company’s planned $4.5 billion share purchase also supported enthusiasm for its stock.
Conversely, detracting from overall results on a relative basis were Focus Media Holding Ltd.; Baker Hughes, Inc.; Abercrombie & Fitch Co., Cl A; Arch Coal, Inc.; and Molycorp, Inc. Baker Hughes is a diversified oilfield service company providing products and technology services for the oil and gas industry. It has strong exposure to both offshore operations and onshore pressure pumping markets. The company preannounced lower-than-anticipated margins. A mild winter and natural gas prices that dropped below anticipated levels caused near-term overcapacity in North America pressure pumping, which hurt profits.
Alger Large Cap Growth Institutional Fund
The Alger Large Cap Growth Institutional Fund returned 10.62% for the six-month period ended April 30, 2012, compared with a return of 14.13% for the Russell 1000 Growth Index.
During the period, the largest sector weightings were in the Information Technology and Industrials sectors. The largest sector overweight for the period was Information Technology and the largest sector underweight was Consumer Discretionary. Relative outperformance in the Utilities and Industrials sectors was the most important contributor to performance, while Energy and Consumer Discretionary detracted from results.
Among the most important contributors to relative performance were Lowe’s Companies, Inc.; CVS Caremark Corp.; Tyco International Ltd.; JPMorgan Chase & Co.; and Pfizer, Inc. Shares of home improvement retailer Lowe’s performed strongly after the company reported better-than-expected earnings driven by higher store traffic, mild weather, and strong sales of tools, appliances, lumber, and nursery items. The company’s planned $4.5 billion share purchase also supported enthusiasm for its stock.
Conversely, detracting from overall results on a relative basis were Microsoft Corp.; Exxon Mobil Corp.; Baker Hughes, Inc.; Peabody Energy Corp.; and International Business Machines Corp. Baker Hughes is a diversified oilfield service company providing products and technology services for the oil and gas industry, with strong
4
exposure to both offshore operations and onshore pressure pumping markets. The company preannounced lower-than-anticipated margins. A mild winter and natural gas prices that dropped below anticipated levels caused near-term overcapacity in North America pressure pumping, which hurt profits.
Alger Mid Cap Growth Institutional Fund
The Alger Mid Cap Growth Institutional Fund returned 11.40% for the six-month period ended April 30, 2012, compared to the 12.26% return of the Russell Midcap Growth Index.
During the period, the largest sector weightings were in the Information Technology and Consumer Discretionary sectors. The largest sector overweight was Information Technology and the largest sector underweight was Materials. Relative outperformance in the Industrials and Consumer Discretionary sectors was the most important contributor to performance, while Materials and Health Care detracted from results.
Among the most important relative contributors were Spirit AeroSystems Holdings, Inc., Cl A; SPX Corp.; CBS Corp., Cl. B; Pioneer Natural Resources Co.; and HMS Holdings Corp. SPX stock performed well after the company announced plans to sell its Service Solutions business for $1.15 billion. SPX produces power, heating, and consumer goods and its Service Solutions business has strong exposure to the automobile industry. SPX will use proceeds of the sale for a stock buyback program and to continue developing its fluids monitoring, blending, metering, and transportation products.
Conversely, detracting from overall results on a relative basis were Metabolix, Inc.; Allscripts Healthcare Solutions, Inc.; Arch Coal, Inc.; Molycorp, Inc.; and Groupon, Inc. Allscripts Healthcare Solutions reported flat sales of its software, which fell short of consensus expectations. The company’s software is used by hospitals and doctors for medical records, revenue tracking, and practice management. We believe concerns over health care reform’s impact on insurance reimbursement rates caused medical providers to delay purchasing the company’s products.
The Fund used options to hedge against market risk and to generate incremental income during the reporting period. The options did not meaningfully impact performance.
Alger Small Cap Growth Institutional Fund
For the six-month period ended April 30, 2012, the Alger Small Cap Growth Institutional Fund returned 12.14%, compared to the Russell 2000 Growth Index, which returned 10.58%.
During the period, the largest sector weightings were in the Information Technology and Health Care sectors. The largest sector overweight for the period was Utilities and the largest sector underweight for the period was Health Care. Relative outperformance in the Materials and Consumer Staples sectors was the most important contributor to performance, while Consumer Discretionary and Health Care detracted from results.
Among the most important relative contributors were United Rentals, Inc.; Solutia, Inc.; Mellanox Technologies Ltd.; Catalyst Health Solutions, Inc.; and Novellus Systems, Inc. Shares of United Rentals performed strongly after the company reported that increased construction activity resulted in stronger-than-expected demand for its rental equipment and that cost controls enhanced results. The company also upgraded its 2012 pricing and time utilization guidance.
5
Conversely, detracting from overall results on a relative basis were RF Micro Devices, Inc.; Shutterfly, Inc.; RealPage, Inc.; Medivation, Inc.; and AAR Corp. RealPage provides website services for managing and marketing single-family and multi-family home rentals. We believe its stock price declined during the reporting period because investors grew concerned over the company’s ability to integrate various acquisitions.
As always, we strive to deliver consistently superior investment results for you, our shareholders, and we thank you for your business and your continued confidence in Alger.
Respectfully submitted, | |
| |

| |
Daniel C. Chung, CFA | |
Chief Investment Officer | |
BCA Research is an independent provider of global research.
Morningstar provides research on mutual funds, equities, and other investments.
Footnotes:
(1) Estimated value was determined by applying the historical returns of the S&P 500 Index to the equity mutual fund flows for each quarter as determined by Morningstar. During the period spanning March 30, 2009 to April 30, 2012, the S&P 500 Index experienced certain periods of negative performance returns.
Investors cannot invest directly in an index. Index performance does not reflect the deduction for fees, expenses or taxes.
This report and the financial statements contained herein are submitted for the general information of shareholders of the Fund. This report is not authorized for distribution to prospective investors in the Funds unless preceded or accompanied by an effective prospectus for the Funds. Fund returns represent the fiscal six-month period return of Class I shares.
The performance data quoted represents past performance, which is not an indication or guarantee of future results.
Standardized performance results can be found on the following pages. The investment return and principal value of an investment in a Fund will fluctuate so that an investor’s shares, when redeemed, may be worth more or less than their original cost. Current performance may be lower or higher than the performance quoted. For performance data current to the most recent month-end, visit us at www.alger.com, or call us at (800) 992-3863.
The views and opinions of the Funds’ management in this report are as of the date of the Shareholders’ letter and are subject to change at any time subsequent to this date. There is no guarantee that any of the assumptions that formed the basis for the opinions stated herein are accurate or that they will materialize. Moreover, the information forming the basis for such assumptions is from sources believed to be reliable; however, there is no
6
guarantee that such information is accurate. Any securities mentioned, whether owned in a Fund or otherwise, are considered in the context of the construction of an overall portfolio of securities and therefore reference to them should not be construed as a recommendation or offer to purchase or sell any such security. Inclusion of such securities in a Fund and transactions in such securities, if any, may be for a variety of reasons, including without limitation, in response to cash flows, inclusion in a benchmark, and risk control. The reference to a specific security should also be understood in such context and not viewed as a statement that the security is a significant holding in a Fund. Please refer to the Schedules of Investments for each Fund that is included in this report for a complete list of Fund holdings as of April 30, 2012. Securities mentioned in the Shareholders’ letter, if not found in the Schedule of Investments, may have been held by the Funds during the six-month fiscal period.
A Word About Risk
Growth stocks tend to be more volatile than other stocks as the price of growth stocks tends to be higher in relation to their companies’ earnings and may be more sensitive to market, political and economic developments. Investing in the stock market involves gains and losses and may not be suitable for all investors. Stocks of small- and mid-sized companies are subject to greater risk than stocks of larger, more established companies owing to such factors as limited liquidity, inexperienced management, and limited financial resources. Funds that participate in leveraging, such as the Capital Appreciation Institutional Fund, are subject to the risk that borrowing money to leverage will exceed the returns for securities purchased or that the securities purchased may actually go down in value; thus, the Funds’ net asset values can decrease more quickly than if the Funds had not borrowed. For a more detailed discussion of the risks associated with these Funds, please see the Funds’ Prospectus.
Before investing, carefully consider a fund’s investment objective, risks, charges, and expenses. For a prospectus containing this and other information about The Alger Institutional Funds call us at (800) 992-3863 or visit us at www.alger.com. Read it carefully before investing.
Fred Alger & Company, Incorporated, Distributor. Member NYSE Euronext, SIPC.
NOT FDIC INSURED. NOT BANK GUARANTEED. MAY LOSE VALUE.
Index Definitions:
· The Russell 1000 Growth Index is an unmanaged index designed to measure the performance of the largest 1,000 companies in the Russell 3000 Index with higher price-to-book ratios and higher forecasted growth values.
· The Russell Midcap Growth Index measures the performance of the mid-cap segment of the U.S. equity universe. It includes those Russell Midcap Index companies with higher price-to-book ratios and higher forecasted growth values. The Russell Midcap Index measures the performance of the mid-cap segment of the U.S. equity universe.
· The Russell 2000 Growth Index measures the performance of the small-cap growth segment of the U.S. equity universe. It includes those Russell 2000 companies with higher price-to-book ratios and higher forecasted growth values. The Russell 2000 Index measures the performance of the small-cap segment of the U.S. equity universe.
7
· The S&P 500 Index is an unmanaged index generally representative of the U.S. stock market without regard to company size.
FUND PERFORMANCE AS OF 3/31/12 (Unaudited)
AVERAGE ANNUAL TOTAL RETURNS
| | 1 YEAR | | 5 YEARS | | 10 YEARS | |
Alger Capital Appreciation Class I (Inception 11/8/93) | | 7.87 | % | 6.23 | % | 6.94 | % |
Alger Capital Appreciation Class R* (Inception 1/27/03) | | 7.33 | % | 5.69 | % | 6.40 | % |
Alger Large Cap Growth Class I (Inception 11/8/93) | | 7.60 | % | 2.12 | % | 2.47 | % |
Alger Large Cap Growth Class R* (Inception 1/27/03) | | 6.83 | % | 1.53 | % | 1.92 | % |
Alger Mid Cap Growth Class I (Inception 11/8/93) | | (4.30 | )% | (0.15 | )% | 4.20 | % |
Alger Mid Cap Growth Class R* (Inception 1/27/03) | | (4.84 | )% | (0.66 | )% | 3.68 | % |
Alger Small Cap Growth Class I (Inception 11/8/93) | | (0.38 | )% | 3.50 | % | 7.36 | % |
Alger Small Cap Growth Class R* (Inception 1/27/03) | | (0.91 | )% | 3.00 | % | 6.85 | % |
The performance data quoted represents past performance, which is not an indication or a guarantee of future results. The Fund’s average annual total returns include changes in share price and reinvestment of dividends and capital gains.
* | Performance figures prior to 1/27/03, inception of Class R shares, are those of the Fund’s Class I Shares. The performance figures prior to 1/27/03 have been adjusted to reflect the higher operating expenses of Class R shares. |
8
ALGER CAPITAL APPRECIATION INSTITUTIONAL FUND
Fund Highlights Through April 30, 2012 (Unaudited)
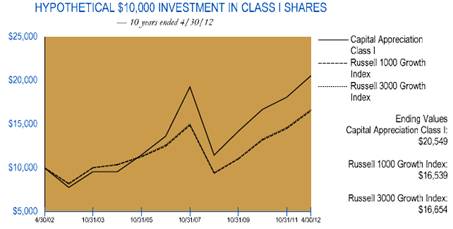
The chart above illustrates the change in value of a hypothetical $10,000 investment made in the Alger Capital Appreciation Institutional Fund Class I shares, the Russell 1000 Growth Index (an unmanaged indices of common stocks) and the Russell 3000 Growth Index (a unmanaged index of common stocks) for the ten years ended April 30, 2012. Figures for the Alger Capital Appreciation Institutional Fund Class I shares, the Russell 1000 Growth Index and the Russell 3000 Growth Index include reinvestment of dividends. Performance for the Alger Capital Appreciation Institutional Fund Class R shares may vary from the results shown above due to differences in expenses the class bears. Investors cannot invest directly in any index. Index performance does not reflect deduction for fees, expenses, or taxes.
PERFORMANCE COMPARISON AS OF 4/30/12
AVERAGE ANNUAL TOTAL RETURNS
| | 1 YEAR | | 5 YEARS | | 10 YEARS | | Since
11/8/1993 | |
Class I (Inception 11/8/93) | | 3.12 | % | 5.26 | % | 7.47 | % | 11.38 | % |
Class R* (Inception 1/27/03) | | 2.60 | % | 4.72 | % | 6.92 | % | 10.82 | % |
Russell 1000 Growth Index | | 7.26 | % | 4.11 | % | 5.16 | % | 7.66 | % |
Russell 3000 Growth Index | | 6.26 | % | 4.04 | % | 5.23 | % | 7.38 | % |
The performance data quoted represents past performance, which is not an indication or a guarantee of future results. The Fund’s average annual total returns include changes in share price and reinvestment of dividends and capital gains. The chart and table above do not reflect the deduction of taxes that a shareholder would have paid on Fund distributions or on the redemption of Fund shares. Investment return and principal will fluctuate and the Fund’s shares, when redeemed, may be worth more or less than their original cost. Current performance may be higher or lower than the performance quoted. For performance current to the most recent month end, visit us at www.alger.com or call us at (800) 992-3863.
* | Performance figures prior to 1/27/03, inception of Class R shares, are those of the Fund’s Class I Shares. The performance figures prior to 1/27/03 have been adjusted to reflect the higher operating expenses of Class R shares. |
9
ALGER LARGE CAP GROWTH INSTITUTIONAL FUND
Fund Highlights Through April 30, 2012 (Unaudited)
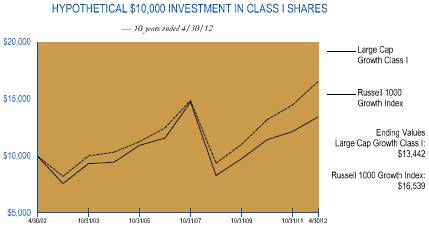
The chart above illustrates the change in value of a hypothetical $10,000 investment made in the Alger Large Cap Growth Institutional Fund Class I shares and the Russell 1000 Growth Index (an unmanaged index of common stocks) for the ten years ended April 30, 2012. The figures for the Alger Large Cap Growth Institutional Fund Class I shares and the Russell 1000 Growth Index include reinvestment of dividends. Performance for the Alger Large Cap Growth Institutional Fund Class R shares may vary from the results shown above due to differences in expenses the class bears. Investors cannot invest directly in any index. Index performance does not reflect deduction for fees, expenses, or taxes.
PERFORMANCE COMPARISON AS OF 4/30/12
AVERAGE ANNUAL TOTAL RETURNS
| | 1 YEAR | | 5 YEARS | | 10 YEARS | | Since
11/8/1993 | |
Class I (Inception 11/8/93) | | 2.84 | % | 1.12 | % | 3.00 | % | 7.41 | % |
Class R* (Inception 1/27/03) | | 2.16 | % | 0.52 | % | 2.44 | % | 6.85 | % |
Russell 1000 Growth Index | | 7.26 | % | 4.11 | % | 5.16 | % | 7.66 | % |
The performance data quoted represents past performance, which is not an indication or a guarantee of future results. The Fund’s average annual total returns include changes in share price and reinvestment of dividends and capital gains. The chart and table above do not reflect the deduction of taxes that a shareholder would have paid on Fund distributions or on the redemption of Fund shares. Investment return and principal will fluctuate and the Fund’s shares, when redeemed, may be worth more or less than their original cost. Current performance may be higher or lower than the performance quoted. For performance current to the most recent month end, visit us at www.alger.com or call us at (800) 992-3863.
* | Performance figures prior to 1/27/03, inception of Class R shares, are those of the Fund’s Class I Shares. The performance figures prior to 1/27/03 have been adjusted to reflect the higher operating expenses of Class R shares. |
10
ALGER MID CAP GROWTH INSTITUTIONAL FUND
Fund Highlights Through April 30, 2012 (Unaudited)
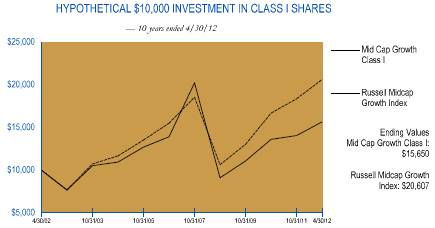
The chart above illustrates the change in value of a hypothetical $10,000 investment made in the Alger Mid Cap Growth Institutional Fund Class I shares and the Russell Midcap Growth Index (an unmanaged index of common stocks) for the ten years ended April 30, 2012. Figures for the Alger Mid Cap Growth Institutional Fund Class I shares and the Russell Midcap Growth Index include reinvestment of dividends. Performance for the Alger Mid Cap Growth Institutional Fund Class R shares may vary from the results shown above due to differences in expenses the class bears. Investors cannot invest directly in any index. Index performance does not reflect deduction for fees, expenses, or taxes.
PERFORMANCE COMPARISON AS OF 4/30/12
AVERAGE ANNUAL TOTAL RETURNS
| | 1 YEAR | | 5 YEARS | | 10 YEARS | | Since
11/8/1993 | |
Class I (Inception 11/8/93) | | (7.16 | )% | (0.69 | )% | 4.58 | % | 11.70 | % |
Class R* (Inception 1/27/03) | | (7.63 | )% | (1.20 | )% | 4.06 | % | 11.14 | % |
Russell Midcap Growth Index | | 0.78 | % | 3.55 | % | 7.50 | % | 8.62 | % |
The performance data quoted represents past performance, which is not an indication or a guarantee of future results. The Fund’s average annual total returns include changes in share price and reinvestment of dividends and capital gains. The chart and table above do not reflect the deduction of taxes that a shareholder would have paid on Fund distributions or on the redemption of Fund shares. Investment return and principal will fluctuate and the Fund’s shares, when redeemed, may be worth more or less than their original cost. Current performance may be higher or lower than the performance quoted. For performance current to the most recent month end, visit us at www.alger.com or call us at (800) 992-3863.
* | Performance figures prior to 1/27/03, inception of Class R shares, are those of the Fund’s Class I Shares. The performance figures prior to 1/27/03 have been adjusted to reflect the higher operating expenses of Class R shares. |
11
ALGER SMALL CAP GROWTH INSTITUTIONAL FUND
Fund Highlights Through April 30, 2012 (Unaudited)
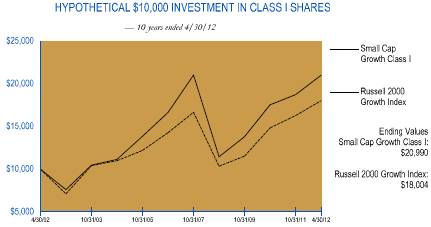
The chart above illustrates the change in value of a hypothetical $10,000 investment made in the Alger Small Cap Growth Institutional Fund Class I shares and the Russell 2000 Growth Index (an unmanaged index of common stocks) for the ten years ended April 30, 2012. The figures for the Alger Small Cap Growth Institutional Fund Class I shares and the Russell 2000 Growth Index include reinvestment of dividends. Performance for the Alger Small Cap Growth Institutional Fund Class R shares may vary from the results shown above due to differences in expenses the class bears. Investors cannot invest directly in any index. Index performance does not reflect deduction for fees, expenses, or taxes.
PERFORMANCE COMPARISON AS OF 4/30/12
AVERAGE ANNUAL TOTAL RETURNS
| | 1 YEAR | | 5 YEARS | | 10 YEARS | | Since
11/8/1993 | |
Class I (Inception 11/8/93) | | (5.24 | )% | 2.77 | % | 7.70 | % | 9.00 | % |
Class R* (Inception 1/27/03) | | (5.71 | )% | 2.28 | % | 7.19 | % | 8.48 | % |
Russell 2000 Growth Index | | (4.42 | )% | 3.27 | % | 6.06 | % | 5.85 | % |
The performance data quoted represents past performance, which is not an indication or a guarantee of future results. The Fund’s average annual total returns include changes in share price and reinvestment of dividends and capital gains. The chart and table above do not reflect the deduction of taxes that a shareholder would have paid on Fund distributions or on the redemption of Fund shares. Investment return and principal will fluctuate and the Fund’s shares, when redeemed, may be worth more or less than their original cost. Current performance may be higher or lower than the performance quoted. For performance current to the most recent month end, visit us at www.alger.com or call us at (800) 992-3863.
* | Performance figures prior to 1/27/03, inception of Class R shares, are those of the Fund’s Class I Shares. The performance figures prior to 1/27/03 have been adjusted to reflect the higher operating expenses of Class R shares. |
12
PORTFOLIO SUMMARY*
April 30, 2012 (Unaudited)
SECTORS | | Alger Capital
Appreciation
Institutional Fund | | Alger Large Cap
Growth
Institutional Fund | | Alger Mid Cap
Growth
Institutional Fund | | Alger Small Cap
Growth
Institutional Fund | |
Consumer Discretionary | | 18.6 | % | 19.1 | % | 22.8 | % | 15.4 | % |
Consumer Staples | | 6.3 | | 5.9 | | 1.2 | | 2.6 | |
Energy | | 8.8 | | 10.0 | | 10.5 | | 7.6 | |
Financials | | 7.1 | | 3.2 | | 9.2 | | 7.7 | |
Health Care | | 10.0 | | 10.0 | | 11.0 | | 17.3 | |
Industrials | | 15.0 | | 13.9 | | 15.6 | | 15.5 | |
Information Technology | | 24.8 | | 29.0 | | 17.0 | | 24.9 | |
Materials | | 4.0 | | 3.7 | | 7.1 | | 4.5 | |
Telecommunication Services | | 1.4 | | 0.0 | | 1.8 | | 0.0 | |
Utilities | | 0.0 | | 0.0 | | 0.0 | | 1.2 | |
Short-Term Investments and Net Other Assets | | 4.0 | | 5.2 | | 3.8 | | 3.3 | |
| | 100.0 | % | 100.0 | % | 100.0 | % | 100.0 | % |
* Based on net assets for each Fund.
13
THE ALGER INSTITUTIONAL FUNDS |
ALGER CAPITAL APPRECIATION INSTITUTIONAL FUND
Schedule of Investments‡ (Unaudited) April 30, 2012
| | SHARES | | VALUE | |
COMMON STOCKS—94.6% | | | | | |
ADVERTISING—0.8% | | | | | |
Focus Media Holding Ltd.# | | 560,800 | | $ | 13,397,512 | |
| | | | | |
AEROSPACE & DEFENSE—3.5% | | | | | |
Boeing Co., /The | | 126,500 | | 9,715,200 | |
General Dynamics Corp. | | 110,200 | | 7,438,500 | |
Goodrich Corp. | | 45,100 | | 5,658,246 | |
Honeywell International, Inc. | | 366,300 | | 22,219,758 | |
United Technologies Corp. | | 171,600 | | 14,009,424 | |
| | | | 59,041,128 | |
AIR FREIGHT & LOGISTICS—1.0% | | | | | |
United Parcel Service, Inc., Cl. B | | 215,400 | | 16,831,356 | |
| | | | | |
AIRLINES—0.3% | | | | | |
United Continental Holdings, Inc.* | | 266,000 | | 5,830,720 | |
| | | | | |
APPAREL ACCESSORIES & LUXURY GOODS—0.9% | | | | | |
PVH Corp. | | 116,600 | | 10,354,080 | |
Ralph Lauren Corp. | | 28,000 | | 4,823,560 | |
| | | | 15,177,640 | |
APPLICATION SOFTWARE—0.4% | | | | | |
Salesforce.com, Inc.* | | 46,400 | | 7,225,872 | |
| | | | | |
ASSET MANAGEMENT & CUSTODY BANKS—0.2% | | | | | |
Affiliated Managers Group, Inc.* | | 35,100 | | 3,988,062 | |
| | | | | |
AUTO PARTS & EQUIPMENT—1.3% | | | | | |
Delphi Automotive PLC * | | 665,800 | | 20,433,402 | |
Lear Corp. | | 21,300 | | 883,950 | |
| | | | 21,317,352 | |
AUTO RENTAL—0.7% | | | | | |
Hertz Global Holdings, Inc.* | | 793,715 | | 12,231,148 | |
| | | | | |
BIOTECHNOLOGY—1.1% | | | | | |
Gilead Sciences, Inc. * | | 251,100 | | 13,059,711 | |
United Therapeutics Corp. * | | 137,500 | | 6,015,625 | |
| | | | 19,075,336 | |
BROADCASTING & CABLE TV—1.5% | | | | | |
CBS Corp., Cl. B | | 578,840 | | 19,304,314 | |
Liberty Media Corp., Capital, Cl. A * | | 65,200 | | 5,701,088 | |
| | | | 25,005,402 | |
BUILDING PRODUCTS—0.5% | | | | | |
Owens Corning* | | 231,900 | | 7,965,765 | |
| | | | | |
CASINOS & GAMING—0.9% | | | | | |
Las Vegas Sands Corp. | | 272,800 | | 15,137,672 | |
| | | | | |
COMMUNICATIONS EQUIPMENT—3.5% | | | | | |
Cisco Systems, Inc. | | 563,800 | | 11,360,570 | |
QUALCOMM, Inc. | | 659,900 | | 42,128,016 | |
Riverbed Technology, Inc. * | | 272,400 | | 5,374,452 | |
| | | | 58,863,038 | |
| | | | | | |
14
| | SHARES | | VALUE | |
COMMON STOCKS—(CONT.) | | | | | |
COMPUTER HARDWARE—6.6% | | | | | |
Apple, Inc.* | | 188,100 | | $ | 109,895,543 | |
| | | | | |
COMPUTER STORAGE & PERIPHERALS—2.3% | | | | | |
EMC Corp. * | | 641,100 | | 18,085,431 | |
NetApp, Inc. * | | 205,200 | | 7,967,916 | |
Seagate Technology PLC | | 388,800 | | 11,959,488 | |
| | | | 38,012,835 | |
CONSTRUCTION & ENGINEERING—0.8% | | | | | |
Chicago Bridge & Iron Co., NV # | | 64,200 | | 2,851,764 | |
KBR, Inc. | | 299,700 | | 10,147,842 | |
| | | | 12,999,606 | |
CONSTRUCTION & FARM MACHINERY & HEAVY TRUCKS—1.9% | | | | | |
Caterpillar, Inc. | | 188,096 | | 19,330,626 | |
Deere & Co. | | 57,700 | | 4,752,172 | |
WABCO Holdings, Inc. * | | 112,200 | | 7,071,966 | |
| | | | 31,154,764 | |
DATA PROCESSING & OUTSOURCED SERVICES—1.1% | | | | | |
Mastercard, Inc. | | 35,697 | | 16,144,682 | |
VeriFone Systems, Inc. * | | 50,900 | | 2,424,876 | |
| | | | 18,569,558 | |
DIVERSIFIED BANKS—1.7% | | | | | |
Wells Fargo & Co. | | 811,700 | | 27,135,131 | |
| | | | | |
DIVERSIFIED CHEMICALS—0.7% | | | | | |
Eastman Chemical Co. | | 201,400 | | 10,869,558 | |
| | | | | |
DIVERSIFIED METALS & MINING—0.7% | | | | | |
Freeport-McMoRan Copper & Gold, Inc. | | 285,000 | | 10,915,500 | |
| | | | | |
DRUG RETAIL—1.7% | | | | | |
CVS Caremark Corp. | | 643,585 | | 28,716,763 | |
| | | | | |
EDUCATION SERVICES—0.3% | | | | | |
New Oriental Education & Technology Group#* | | 196,800 | | 5,260,464 | |
| | | | | |
ELECTRICAL COMPONENTS & EQUIPMENT—1.0% | | | | | |
Cooper Industries PLC, CL. A | | 271,600 | | 16,994,012 | |
| | | | | |
FOOTWEAR—0.8% | | | | | |
NIKE, Inc., Cl. B | | 59,500 | | 6,656,265 | |
Salvatore Ferragamo Italia SpA * | | 288,750 | | 7,059,840 | |
| | | | 13,716,105 | |
GENERAL MERCHANDISE STORES—1.2% | | | | | |
Dollar General Corp. * | | 261,400 | | 12,406,044 | |
Target Corp. | | 124,900 | | 7,236,706 | |
| | | | 19,642,750 | |
HEALTH CARE EQUIPMENT—1.5% | | | | | |
Covidien PLC | | 356,740 | | 19,702,750 | |
Gen-Probe, Inc. * | | 46,000 | | 3,751,300 | |
| | | | | | |
15
| | SHARES | | VALUE | |
COMMON STOCKS—(CONT.) | | | | | |
HEALTH CARE EQUIPMENT—(CONT.) | | | | | |
Insulet Corp. * | | 133,500 | | $ | 2,384,310 | |
| | | | 25,838,360 | |
HEALTH CARE FACILITIES—0.5% | | | | | |
Universal Health Services, Inc., Cl. B | | 189,100 | | 8,076,461 | |
| | | | | |
HEALTH CARE SERVICES—1.7% | | | | | |
Express Scripts, Inc.* | | 501,100 | | 27,956,369 | |
| | | | | |
HEALTH CARE TECHNOLOGY—0.3% | | | | | |
Agilent Technologies, Inc. | | 113,200 | | 4,774,776 | |
| | | | | |
HOME IMPROVEMENT RETAIL—1.8% | | | | | |
Lowe’s Companies, Inc. | | 963,300 | | 30,315,051 | |
| | | | | |
HOMEBUILDING—0.2% | | | | | |
Lennar Corp., Cl. A | | 99,200 | | 2,751,808 | |
| | | | | |
HOTELS RESORTS & CRUISE LINES—1.1% | | | | | |
Hyatt Hotels Corp., Cl. A * | | 205,800 | | 8,855,574 | |
Wyndham Worldwide Corporation | | 177,600 | | 8,940,384 | |
| | | | 17,795,958 | |
HOUSEHOLD PRODUCTS—1.0% | | | | | |
Procter & Gamble Co., /The | | 257,500 | | 16,387,300 | |
| | | | | |
HUMAN RESOURCE & EMPLOYMENT SERVICES—0.3% | | | | | |
Towers Watson & Co. | | 70,370 | | 4,602,198 | |
| | | | | |
INDUSTRIAL CONGLOMERATES—1.1% | | | | | |
Tyco International Ltd. | | 316,055 | | 17,740,167 | |
| | | | | |
INDUSTRIAL MACHINERY—1.2% | | | | | |
Ingersoll-Rand PLC | | 59,900 | | 2,546,948 | |
Stanley Black & Decker, Inc. | | 236,400 | | 17,295,024 | |
| | | | 19,841,972 | |
INTEGRATED OIL & GAS—2.6% | | | | | |
ConocoPhillips | | 415,300 | | 29,747,939 | |
Royal Dutch Shell PLC # | | 194,600 | | 13,921,684 | |
| | | | 43,669,623 | |
INTERNET RETAIL—3.3% | | | | | |
Amazon.com, Inc. * | | 182,900 | | 42,414,510 | |
Expedia, Inc. | | 350,300 | | 14,933,289 | |
| | | | 57,347,799 | |
INTERNET SOFTWARE & SERVICES—4.5% | | | | | |
eBay, Inc. * | | 719,000 | | 29,514,950 | |
Google, Inc., Cl. A * | | 47,710 | | 28,875,523 | |
VistaPrint NV * | | 435,102 | | 16,224,954 | |
| | | | 74,615,427 | |
IT CONSULTING & OTHER SERVICES—2.7% | | | | | |
Cognizant Technology Solutions Corp., Cl. A * | | 108,900 | | 7,984,548 | |
Gartner, Inc. * | | 38,200 | | 1,673,160 | |
International Business Machines Corp. | | 171,500 | | 35,514,220 | |
| | | | 45,171,928 | |
| | | | | | |
16
| | SHARES | | VALUE | |
COMMON STOCKS—(CONT.) | | | | | |
LEISURE PRODUCTS—0.3% | | | | | |
Michael Kors Holdings Ltd.* | | 98,000 | | $ | 4,475,660 | |
| | | | | |
LIFE & HEALTH INSURANCE—0.4% | | | | | |
Lincoln National Corp. | | 299,500 | | 7,418,615 | |
| | | | | |
LIFE SCIENCES TOOLS & SERVICES—1.1% | | | | | |
Life Technologies Corp. * | | 205,700 | | 9,536,252 | |
Thermo Fisher Scientific, Inc. | | 168,200 | | 9,360,330 | |
| | | | 18,896,582 | |
MANAGED HEALTH CARE—1.9% | | | | | |
Aetna, Inc. | | 231,200 | | 10,182,048 | |
Cigna Corp. | | 142,700 | | 6,597,021 | |
UnitedHealth Group, Inc. | | 235,900 | | 13,245,785 | |
| | | | 30,024,854 | |
MORTGAGE REITS—1.2% | | | | | |
American Capital Agency Corp. | | 652,700 | | 20,390,348 | |
| | | | | |
MOVIES & ENTERTAINMENT—1.7% | | | | | |
News Corp., Cl. A | | 1,406,600 | | 27,569,360 | |
| | | | | |
OIL & GAS DRILLING—0.7% | | | | | |
Nabors Industries Ltd.* | | 728,996 | | 12,137,783 | |
| | | | | |
OIL & GAS EQUIPMENT & SERVICES—1.8% | | | | | |
Halliburton Company | | 349,400 | | 11,956,468 | |
National Oilwell Varco, Inc. | | 109,600 | | 8,303,296 | |
Weatherford International Ltd. * | | 671,000 | | 9,575,170 | |
| | | | 29,834,934 | |
OIL & GAS EXPLORATION & PRODUCTION—3.3% | | | | | |
Anadarko Petroleum Corp. | | 348,200 | | 25,491,723 | |
Cabot Oil & Gas Corp. | | 111,800 | | 3,928,652 | |
Kodiak Oil & Gas Corp. * | | 463,200 | | 4,099,320 | |
Pioneer Natural Resources Co. | | 188,455 | | 21,826,858 | |
| | | | 55,346,553 | |
OTHER DIVERSIFIED FINANCIAL SERVICES—0.1% | | | | | |
JPMorgan Chase & Co. | | 23,300 | | 1,001,434 | |
| | | | | |
PAPER PRODUCTS—0.3% | | | | | |
International Paper Co. | | 158,100 | | 5,266,311 | |
| | | | | |
PHARMACEUTICALS—1.7% | | | | | |
Johnson & Johnson | | 178,250 | | 11,602,293 | |
Pfizer, Inc. | | 715,200 | | 16,399,536 | |
| | | | 28,001,829 | |
RAILROADS—1.4% | | | | | |
CSX Corp. | | 1,024,910 | | 22,865,742 | |
| | | | | |
REGIONAL BANKS—0.7% | | | | | |
East West Bancorp, Inc. | | 258,900 | | 5,895,153 | |
Regions Financial Corp. | | 965,500 | | 6,507,470 | |
| | | | 12,402,623 | |
| | | | | | |
17
| | SHARES | | VALUE | |
COMMON STOCKS—(CONT.) | | | | | |
RESEARCH & CONSULTING SERVICES—0.4% | | | | | |
Verisk Analytics, Inc., Cl. A* | | 138,600 | | $ | 6,784,470 | |
| | | | | |
RESIDENTIAL REITS—0.5% | | | | | |
Home Properties, Inc. | | 132,100 | | 8,064,705 | |
| | | | | |
RESTAURANTS—1.7% | | | | | |
McDonald’s Corp. | | 213,200 | | 20,776,340 | |
Starbucks Corp. | | 121,900 | | 6,994,622 | |
| | | | 27,770,962 | |
SEMICONDUCTOR EQUIPMENT—1.4% | | | | | |
ASML Holding NV # | | 196,700 | | 10,029,733 | |
Lam Research Corp. * | | 308,100 | | 12,832,365 | |
| | | | 22,862,098 | |
SEMICONDUCTORS—1.9% | | | | | |
Avago Technologies Ltd. | | 318,800 | | 10,992,224 | |
Broadcom Corp., Cl. A * | | 299,800 | | 10,972,680 | |
Skyworks Solutions, Inc. * | | 357,700 | | 9,707,978 | |
| | | | 31,672,882 | |
SOFT DRINKS—1.9% | | | | | |
Coca-Cola Co., /The | | 288,400 | | 22,010,687 | |
PepsiCo, Inc. | | 143,100 | | 9,444,600 | |
| | | | 31,455,287 | |
SPECIALIZED FINANCE—1.2% | | | | | |
IntercontinentalExchange, Inc.* | | 156,000 | | 20,754,240 | |
| | | | | |
SPECIALIZED REITS—0.5% | | | | | |
American Tower Corp., Cl. A | | 126,900 | | 8,322,102 | |
| | | | | |
SPECIALTY CHEMICALS—2.3% | | | | | |
Celanese Corp. | | 225,400 | | 10,922,884 | |
Cytec Industries, Inc. | | 161,200 | | 10,247,484 | |
LyondellBasell Industries NV | | 152,400 | | 6,367,272 | |
Rockwood Holdings, Inc. * | | 213,700 | | 11,826,158 | |
| | | | 39,363,798 | |
SPECIALTY STORES—0.6% | | | | | |
Dick’s Sporting Goods, Inc. | | 190,300 | | 9,629,180 | |
| | | | | |
SYSTEMS SOFTWARE—0.4% | | | | | |
Oracle Corp. | | 251,700 | | 7,397,463 | |
| | | | | |
TOBACCO—1.7% | | | | | |
Philip Morris International, Inc. | | 319,405 | | 28,589,942 | |
| | | | | |
TRADING COMPANIES & DISTRIBUTORS—0.9% | | | | | |
United Rentals, Inc. * | | 221,700 | | 10,348,956 | |
WESCO International, Inc. * | | 61,600 | | 4,089,624 | |
| | | | 14,438,580 | |
WIRELESS TELECOMMUNICATION SERVICES—1.4% | | | | | |
SBA Communications Corp. * | | 165,000 | | 8,867,100 | |
| | | | | | |
18
| | SHARES | | VALUE | |
COMMON STOCKS—(CONT.) | | | | | |
WIRELESS TELECOMMUNICATION SERVICES—(CONT.) | | | | | |
Vodafone Group PLC # | | 524,800 | | $ | 14,605,184 | |
| | | | 23,472,284 | |
TOTAL COMMON STOCKS
(Cost $1,393,662,980) | | | | 1,578,066,410 | |
| | | | | |
CONVERTIBLE PREFERRED STOCK—0.2% | | | | | |
PHARMACEUTICALS—0.2% | | | | | |
Merrimack Pharmaceuticals, Inc., Series G*,(L2),(a)
(Cost $3,475,570) | | 496,510 | | 3,647,859 | |
| | | | | |
MASTER LIMITED PARTNERSHIP —1.0% | | | | | |
ASSET MANAGEMENT & CUSTODY BANKS—0.6% | | | | | |
Blackstone Group LP | | 699,900 | | 9,490,644 | |
| | | | | |
OIL & GAS STORAGE & TRANSPORTATION—0.4% | | | | | |
Plains All American Pipeline LP | | 76,300 | | 6,251,259 | |
| | | | | |
TOTAL MASTER LIMITED PARTNERSHIP
(Cost $15,573,205) | | | | 15,741,903 | |
| | | | | |
| | PRINCIPAL
AMOUNT | | | |
CONVERTIBLE CORPORATE BONDS—0.2% | | | | | |
HOMEBUILDING—0.2% | | | | | |
Lennar Corp., 3.25%, 11/15/21*,(L2)(b)
(Cost $1,982,000) | | 1,982,000 | | 2,772,323 | |
| | | | | |
Total Investments
(Cost $1,414,693,755)(c) | | 96.0 | % | 1,600,228,495 | |
Other Assets in Excess of Liabilities | | 4.0 | | 66,883,366 | |
| | | | | |
NET ASSETS | | 100.0 | % | $ | 1,667,111,861 | |
‡ | Securities classified as Level 1 for ASC 820 disclosure purposes based on valuation inputs unless otherwise noted. |
19
* | Non-income producing security. |
# | American Depository Receipts. |
(a) | Pursuant to Securities and Exchange Commission Rule 144 deemed illiquid until eligible for sale on September 25, 2012. Security was acquired on April 6, 2011 for a cost of $3,475,570 and represents 0.2% of the net assets of the Fund. |
(b) | Pursuant to Securities and Exchange Commission Rule 144A, these securities may be sold prior to their maturity only to qualified institutional buyers. These securities are deemed to be liquid and represent 0.2% of the net assets of the Fund. |
(c) | At April 30, 2012, the net unrealized appreciation on investments, based on cost for federal income tax purposes of $1,441,547,892, amounted to $158,680,603 which consisted of aggregate gross unrealized appreciation of $199,213,464 and aggregate gross unrealized depreciation of $40,532,861. |
(L2) | Security classified as Level 2 for ASC 820 disclosure purposes based on valuation inputs. |
See Notes to Financial Statements.
20
THE ALGER INSTITUTIONAL FUNDS | ALGER LARGE CAP GROWTH INSTITUTIONAL FUND
Schedule of Investments‡ (Unaudited) April 30, 2012
| | SHARES | | VALUE | |
COMMON STOCKS—93.8% | | | | | |
AEROSPACE & DEFENSE—4.4% | | | | | |
Boeing Co., /The | | 2,800 | | $ | 215,040 | |
General Dynamics Corp. | | 3,200 | | 216,000 | |
Precision Castparts Corp. | | 1,250 | | 220,463 | |
United Technologies Corp. | | 3,850 | | 314,313 | |
| | | | 965,816 | |
AIR FREIGHT & LOGISTICS—1.1% | | | | | |
United Parcel Service, Inc., Cl. B | | 2,950 | | 230,513 | |
| | | | | |
AIRLINES—0.5% | | | | | |
Delta Air Lines, Inc.* | | 9,050 | | 99,188 | |
| | | | | |
APPAREL ACCESSORIES & LUXURY GOODS—0.7% | | | | | |
Ralph Lauren Corp. | | 950 | | 163,657 | |
| | | | | |
APPAREL RETAIL—0.5% | | | | | |
Limited Brands, Inc. | | 2,200 | | 109,340 | |
| | | | | |
APPLICATION SOFTWARE—3.1% | | | | | |
Informatica Corp. * | | 2,250 | | 103,545 | |
Intuit, Inc. | | 3,750 | | 217,388 | |
Salesforce.com, Inc. * | | 1,550 | | 241,381 | |
TIBCO Software, Inc. * | | 3,500 | | 115,150 | |
| | | | 677,464 | |
ASSET MANAGEMENT & CUSTODY BANKS—0.8% | | | | | |
T. Rowe Price Group, Inc. | | 2,900 | | 183,034 | |
| | | | | |
AUTO PARTS & EQUIPMENT—1.2% | | | | | |
Allison Transmission Holdings, Inc. * | | 4,700 | | 98,230 | |
Delphi Automotive PLC * | | 5,300 | | 162,657 | |
| | | | 260,887 | |
AUTO RENTAL—0.5% | | | | | |
Hertz Global Holdings, Inc.* | | 7,000 | | 107,870 | |
| | | | | |
BIOTECHNOLOGY—0.8% | | | | | |
Gilead Sciences, Inc.* | | 3,500 | | 182,035 | |
| | | | | |
BROADCASTING & CABLE TV—1.6% | | | | | |
CBS Corp., Cl. B | | 6,500 | | 216,775 | |
Discovery Communications, Inc., Series A * | | 2,500 | | 136,050 | |
| | | | 352,825 | |
CABLE & SATELLITE—0.5% | | | | | |
DISH Network Corp. | | 3,550 | | 113,494 | |
| | | | | |
CASINOS & GAMING—1.2% | | | | | |
Las Vegas Sands Corp. | | 1,700 | | 94,333 | |
Melco Crown Entertainment Ltd. #* | | 10,650 | | 165,288 | |
| | | | 259,621 | |
COAL & CONSUMABLE FUELS—0.8% | | | | | |
Peabody Energy Corp. | | 5,300 | | 164,883 | |
| | | | | |
COMMUNICATIONS EQUIPMENT—3.5% | | | | | |
Cisco Systems, Inc. | | 16,300 | | 328,445 | |
| | | | | | |
21
| | SHARES | | VALUE | |
COMMON STOCKS—(CONT.) | | | | | |
COMMUNICATIONS EQUIPMENT—(CONT.) | | | | | |
QUALCOMM, Inc. | | 7,000 | | $ | 446,879 | |
| | | | 775,324 | |
COMPUTER HARDWARE—7.4% | | | | | |
Apple, Inc. * | | 2,600 | | 1,519,023 | |
Dell, Inc. * | | 7,100 | | 116,227 | |
| | | | 1,635,250 | |
COMPUTER STORAGE & PERIPHERALS—2.9% | | | | | |
EMC Corp. * | | 7,650 | | 215,807 | |
NetApp, Inc. * | | 10,550 | | 409,656 | |
| | | | 625,463 | |
CONSTRUCTION & FARM MACHINERY & HEAVY TRUCKS—1.4% | | | | | |
Caterpillar, Inc. | | 1,900 | | 195,263 | |
Joy Global, Inc. | | 1,650 | | 116,771 | |
| | | | 312,034 | |
CONSUMER FINANCE—0.6% | | | | | |
American Express Co. | | 2,150 | | 129,452 | |
| | | | | |
DATA PROCESSING & OUTSOURCED SERVICES—1.1% | | | | | |
Mastercard, Inc. | | 550 | | 248,749 | |
| | | | | |
DIVERSIFIED CHEMICALS—1.2% | | | | | |
Dow Chemical Co., /The | | 3,850 | | 130,438 | |
EI Du Pont de Nemours & Co. | | 2,400 | | 128,304 | |
| | | | 258,742 | |
DIVERSIFIED METALS & MINING—1.0% | | | | | |
Freeport-McMoRan Copper & Gold, Inc. | | 5,800 | | 222,140 | |
| | | | | |
DRUG RETAIL—1.0% | | | | | |
Walgreen Co. | | 5,950 | | 208,607 | |
| | | | | |
ELECTRICAL COMPONENTS & EQUIPMENT—0.6% | | | | | |
Emerson Electric Co. | | 2,550 | | 133,977 | |
| | | | | |
ENVIRONMENTAL & FACILITIES SERVICES—0.7% | | | | | |
Stericycle, Inc.* | | 1,850 | | 160,210 | |
| | | | | |
FOOTWEAR—0.5% | | | | | |
NIKE, Inc., Cl. B | | 1,050 | | 117,464 | |
| | | | | |
GENERAL MERCHANDISE STORES—1.9% | | | | | |
Dollar General Corp. * | | 4,700 | | 223,062 | |
Target Corp. | | 3,200 | | 185,408 | |
| | | | 408,470 | |
HEALTH CARE EQUIPMENT—1.5% | | | | | |
Covidien PLC | | 3,550 | | 196,066 | |
Edwards Lifesciences Corp. * | | 1,550 | | 128,604 | |
| | | | 324,670 | |
HEALTH CARE SERVICES—2.5% | | | | | |
Express Scripts, Inc.* | | 9,750 | | 543,953 | |
| | | | | |
HOME FURNISHING RETAIL—0.8% | | | | | |
Bed Bath & Beyond, Inc.* | | 2,350 | | 165,417 | |
| | | | | | |
22
| | SHARES | | VALUE | |
COMMON STOCKS—(CONT.) | | | | | |
HOME IMPROVEMENT RETAIL—0.8% | | | | | |
Lowe’s Companies, Inc. | | 5,800 | | $ | 182,526 | |
| | | | | |
HOTELS RESORTS & CRUISE LINES—2.0% | | | | | |
Hyatt Hotels Corp., Cl. A * | | 7,100 | | 305,512 | |
Starwood Hotels & Resorts Worldwide, Inc. | | 2,200 | | 130,240 | |
| | | | 435,752 | |
HOUSEHOLD PRODUCTS—1.4% | | | | | |
Procter & Gamble Co., /The | | 4,900 | | 311,836 | |
| | | | | |
INDUSTRIAL CONGLOMERATES—1.1% | | | | | |
Tyco International Ltd. | | 4,100 | | 230,133 | |
| | | | | |
INDUSTRIAL MACHINERY—1.6% | | | | | |
Eaton Corp. | | 1,650 | | 79,497 | |
Pall Corp. | | 4,600 | | 274,205 | |
| | | | 353,702 | |
INTEGRATED OIL & GAS—1.2% | | | | | |
ConocoPhillips | | 3,800 | | 272,194 | |
| | | | | |
INTERNET RETAIL—1.2% | | | | | |
Amazon.com, Inc.* | | 1,100 | | 255,090 | |
| | | | | |
INTERNET SOFTWARE & SERVICES—3.5% | | | | | |
eBay, Inc. * | | 13,450 | | 552,122 | |
Google, Inc., Cl. A * | | 350 | | 211,831 | |
| | | | 763,953 | |
IT CONSULTING & OTHER SERVICES—3.0% | | | | | |
Cognizant Technology Solutions Corp., Cl. A * | | 2,950 | | 216,294 | |
International Business Machines Corp. | | 2,150 | | 445,222 | |
| | | | 661,516 | |
LEISURE PRODUCTS—1.0% | | | | | |
Coach, Inc. | | 3,000 | | 219,480 | |
| | | | | |
MANAGED HEALTH CARE—2.0% | | | | | |
Aetna, Inc. | | 3,750 | | 165,150 | |
Cigna Corp. | | 5,700 | | 263,511 | |
| | | | 428,661 | |
MOTORCYCLE MANUFACTURERS—1.2% | | | | | |
Harley-Davidson, Inc. | | 5,050 | | 264,267 | |
| | | | | |
MOVIES & ENTERTAINMENT—1.0% | | | | | |
Walt Disney Co., /The | | 5,200 | | 224,172 | |
| | | | | |
OIL & GAS DRILLING—1.2% | | | | | |
Nabors Industries Ltd.* | | 15,900 | | 264,735 | |
| | | | | |
OIL & GAS EQUIPMENT & SERVICES—2.0% | | | | | |
Cameron International Corp. * | | 3,250 | | 166,563 | |
Halliburton Company | | 8,050 | | 275,471 | |
| | | | 442,034 | |
OIL & GAS EXPLORATION & PRODUCTION—4.8% | | | | | |
Anadarko Petroleum Corp. | | 4,200 | | 307,482 | |
Denbury Resources, Inc. * | | 17,850 | | 339,863 | |
Nexen, Inc. | | 5,550 | | 107,393 | |
| | | | | | |
23
| | SHARES | | VALUE | |
COMMON STOCKS—(CONT.) | | | | | |
OIL & GAS EXPLORATION & PRODUCTION—(CONT.) | | | | | |
Pioneer Natural Resources Co. | | 2,450 | | $ | 283,759 | |
| | | | 1,038,497 | |
PAPER PRODUCTS—0.5% | | | | | |
International Paper Co. | | 3,550 | | 118,251 | |
| | | | | |
PHARMACEUTICALS—3.2% | | | | | |
Johnson & Johnson | | 5,000 | | 325,449 | |
Pfizer, Inc. | | 9,250 | | 212,103 | |
Teva Pharmaceutical Industries Ltd. # | | 3,550 | | 162,377 | |
| | | | 699,929 | |
RAILROADS—1.3% | | | | | |
CSX Corp. | | 12,550 | | 279,991 | |
| | | | | |
RESEARCH & CONSULTING SERVICES—0.7% | | | | | |
Verisk Analytics, Inc., Cl. A* | | 3,350 | | 163,983 | |
| | | | | |
RESTAURANTS—3.0% | | | | | |
Chipotle Mexican Grill, Inc. * | | 650 | | 269,197 | |
Yum! Brands, Inc. | | 5,250 | | 381,832 | |
| | | | 651,029 | |
SEMICONDUCTOR EQUIPMENT—2.1% | | | | | |
ASML Holding NV# | | 9,050 | | 461,460 | |
| | | | | |
SEMICONDUCTORS—1.8% | | | | | |
Broadcom Corp., Cl. A * | | 4,350 | | 159,210 | |
Intel Corp. | | 8,050 | | 228,620 | |
| | | | 387,830 | |
SOFT DRINKS—2.5% | | | | | |
Coca-Cola Co., /The | | 4,400 | | 335,808 | |
Monster Beverage Corp. * | | 850 | | 55,216 | |
PepsiCo, Inc. | | 2,400 | | 158,400 | |
| | | | 549,424 | |
SPECIALIZED FINANCE—0.8% | | | | | |
IntercontinentalExchange, Inc.* | | 1,250 | | 166,300 | |
| | | | | |
SPECIALTY CHEMICALS—1.0% | | | | | |
Celanese Corp. | | 4,550 | | 220,493 | |
| | | | | |
SYSTEMS SOFTWARE—0.6% | | | | | |
VMware, Inc., Cl. A* | | 1,100 | | 122,892 | |
| | | | | |
TOBACCO—1.0% | | | | | |
Philip Morris International, Inc. | | 2,500 | | 223,775 | |
| | | | | |
TOTAL COMMON STOCKS
(Cost $18,589,553) | | | | 20,534,454 | |
| | | | | | |
24
| | SHARES | | VALUE | |
MASTER LIMITED PARTNERSHIP —1.0% | | | | | |
ASSET MANAGEMENT & CUSTODY BANKS—1.0% | | | | | |
KKR & Co., LP | | 15,450 | | $ | 218,153 | |
| | | | | |
TOTAL MASTER LIMITED PARTNERSHIP
(Cost $220,441) | | | | 218,153 | |
| | | | | |
Total Investments
(Cost $18,809,994)(a) | | 94.8 | % | 20,752,607 | |
Other Assets in Excess of Liabilities | | 5.2 | | 1,127,036 | |
| | | | | |
NET ASSETS | | 100.0 | % | $ | 21,879,643 | |
‡ | Securities classified as Level 1 for ASC 820 disclosure purposes based on valuation inputs unless otherwise noted. |
| |
* | Non-income producing security. |
# | American Depository Receipts. |
(a) | At April 30, 2012, the net unrealized appreciation on investments, based on cost for federal income tax purposes of $18,817,734, amounted to $1,934,873 which consisted of aggregate gross unrealized appreciation of $2,490,335 and aggregate gross unrealized depreciation of $555,462. |
See Notes to Financial Statements.
25
THE ALGER INSTITUTIONAL FUNDS | ALGER MID CAP GROWTH INSTITUTIONAL FUND
Schedule of Investments‡ (Unaudited) April 30, 2012
| | SHARES | | VALUE | |
COMMON STOCKS—91.4% | | | | | |
AEROSPACE & DEFENSE—3.1% | | | | | |
Spirit Aerosystems Holdings, Inc., Cl. A * | | 182,600 | | $ | 4,565,000 | |
Triumph Group, Inc. | | 76,300 | | 4,793,166 | |
| | | | 9,358,166 | |
AIRLINES—0.6% | | | | | |
United Continental Holdings, Inc.* | | 82,400 | | 1,806,208 | |
| | | | | |
APPAREL ACCESSORIES & LUXURY GOODS—1.8% | | | | | |
PVH Corp. | | 34,800 | | 3,090,240 | |
Ralph Lauren Corp. | | 13,600 | | 2,342,872 | |
| | | | 5,433,112 | |
APPAREL RETAIL—3.1% | | | | | |
Fast Retailing Co., Ltd. (L2) | | 7,000 | | 1,564,374 | |
Limited Brands, Inc. | | 61,800 | | 3,071,460 | |
Ross Stores, Inc. | | 39,200 | | 2,414,328 | |
Urban Outfitters, Inc. * | | 91,600 | | 2,652,736 | |
| | | | 9,702,898 | |
APPLICATION SOFTWARE—3.6% | | | | | |
Cadence Design Systems, Inc. * | | 261,200 | | 3,048,204 | |
Informatica Corp. * | | 46,500 | | 2,139,930 | |
Intuit, Inc. | | 41,800 | | 2,423,146 | |
Tangoe, Inc. * | | 85,800 | | 1,757,184 | |
TIBCO Software, Inc. * | | 51,400 | | 1,691,060 | |
| | | | 11,059,524 | |
AUTO PARTS & EQUIPMENT—1.3% | | | | | |
Delphi Automotive PLC * | | 86,100 | | 2,642,409 | |
Tenneco, Inc. * | | 44,500 | | 1,371,935 | |
| | | | 4,014,344 | |
AUTO RENTAL—0.8% | | | | | |
Hertz Global Holdings, Inc.* | | 151,500 | | 2,334,615 | |
| | | | | |
BIOTECHNOLOGY—3.5% | | | | | |
Alexion Pharmaceuticals, Inc. * | | 17,500 | | 1,580,600 | |
Alkermes Plc * | | 96,200 | | 1,664,260 | |
Human Genome Sciences, Inc. * | | 41,930 | | 616,790 | |
Incyte Corp., Ltd. * | | 65,300 | | 1,481,004 | |
Regeneron Pharmaceuticals, Inc. * | | 6,200 | | 838,612 | |
United Therapeutics Corp. * | | 68,200 | | 2,983,750 | |
Vertex Pharmaceuticals, Inc. * | | 39,600 | | 1,523,808 | |
| | | | 10,688,824 | |
BROADCASTING & CABLE TV—4.3% | | | | | |
CBS Corp., Cl. B | | 185,600 | | 6,189,759 | |
Discovery Communications, Inc., Series C * | | 91,700 | | 4,556,573 | |
Scripps Networks Interactive, Inc. | | 56,300 | | 2,827,386 | |
| | | | 13,573,718 | |
BUILDING PRODUCTS—1.0% | | | | | |
Owens Corning* | | 90,600 | | 3,112,110 | |
| | | | | |
CASINOS & GAMING—0.5% | | | | | |
Melco Crown Entertainment Ltd.#* | | 101,100 | | 1,569,072 | |
| | | | | | |
26
| | SHARES | | VALUE | |
COMMON STOCKS—(CONT.) | | | | | |
CHEMICALS—0.1% | | | | | |
Metabolix, Inc.* | | 163,698 | | $ | 443,622 | |
| | | | | |
COAL & CONSUMABLE FUELS—0.9% | | | | | |
Peabody Energy Corp. | | 92,000 | | 2,862,120 | |
| | | | | |
COMMUNICATIONS EQUIPMENT—2.2% | | | | | |
Ciena Corp. * | | 138,200 | | 2,048,124 | |
F5 Networks, Inc. * | | 17,600 | | 2,357,168 | |
Riverbed Technology, Inc. * | | 117,600 | | 2,320,248 | |
| | | | 6,725,540 | |
COMPUTER HARDWARE—1.5% | | | | | |
NCR Corp.* | | 201,234 | | 4,728,999 | |
| | | | | |
COMPUTER STORAGE & PERIPHERALS—2.0% | | | | | |
NetApp, Inc. * | | 115,900 | | 4,500,397 | |
Seagate Technology PLC | | 49,900 | | 1,534,924 | |
| | | | 6,035,321 | |
CONSTRUCTION & ENGINEERING—0.5% | | | | | |
Chicago Bridge & Iron Co., NV#,^ | | 37,600 | | 1,670,192 | |
| | | | | |
CONSTRUCTION & FARM MACHINERY & HEAVY TRUCKS—1.1% | | | | | |
Joy Global, Inc. | | 21,100 | | 1,493,247 | |
Westport Innovations, Inc. * | | 61,000 | | 1,909,300 | |
| | | | 3,402,547 | |
DISTILLERS & VINTNERS—1.0% | | | | | |
Beam, Inc. | | 54,100 | | 3,071,798 | |
| | | | | |
DIVERSIFIED CHEMICALS—2.0% | | | | | |
Eastman Chemical Co. | | 58,100 | | 3,135,657 | |
PPG Industries, Inc. | | 30,000 | | 3,157,200 | |
| | | | 6,292,857 | |
ELECTRICAL COMPONENTS & EQUIPMENT—2.1% | | | | | |
AMETEK, Inc. | | 68,600 | | 3,452,638 | |
Cooper Industries PLC, CL. A | | 50,100 | | 3,134,757 | |
| | | | 6,587,395 | |
ENVIRONMENTAL & FACILITIES SERVICES—1.0% | | | | | |
Stericycle, Inc.* | | 37,400 | | 3,238,840 | |
| | | | | |
FOOTWEAR—0.6% | | | | | |
Salvatore Ferragamo Italia SpA* | | 78,348 | | 1,915,582 | |
| | | | | |
GENERAL MERCHANDISE STORES—1.1% | | | | | |
Dollar General Corp.* | | 72,000 | | 3,417,120 | |
| | | | | |
HEALTH CARE EQUIPMENT—0.3% | | | | | |
Edwards Lifesciences Corp.* | | 10,800 | | 896,076 | |
| | | | | |
HEALTH CARE FACILITIES—1.3% | | | | | |
Tenet Healthcare Corporation * | | 284,900 | | 1,478,631 | |
Universal Health Services, Inc., Cl. B | | 60,600 | | 2,588,226 | |
| | | | 4,066,857 | |
HOME ENTERTAINMENT SOFTWARE—0.7% | | | | | |
Take-Two Interactive Software, Inc.* | | 156,800 | | 2,210,880 | |
| | | | | | |
27
| | SHARES | | VALUE | |
COMMON STOCKS—(CONT.) | | | | | |
HOMEBUILDING—1.1% | | | | | |
KB Home | | 186,000 | | $ | 1,614,480 | |
Lennar Corp., Cl. A | | 61,300 | | 1,700,462 | |
| | | | 3,314,942 | |
HOTELS RESORTS & CRUISE LINES—1.6% | | | | | |
Hyatt Hotels Corp., Cl. A * | | 74,400 | | 3,201,432 | |
Marriott International, Inc., Cl. A | | 43,600 | | 1,704,324 | |
| | | | 4,905,756 | |
HUMAN RESOURCE & EMPLOYMENT SERVICES—1.0% | | | | | |
Robert Half International, Inc. | | 106,400 | | 3,170,720 | |
| | | | | |
INDUSTRIAL MACHINERY—3.0% | | | | | |
Pall Corp. | | 78,100 | | 4,655,541 | |
SPX Corp. | | 60,900 | | 4,675,902 | |
| | | | 9,331,443 | |
INTERNET RETAIL—1.5% | | | | | |
Expedia, Inc. | | 47,300 | | 2,016,399 | |
Groupon, Inc. * | | 237,700 | | 2,545,767 | |
| | | | 4,562,166 | |
INTERNET SOFTWARE & SERVICES—1.6% | | | | | |
LinkedIn Corp. * | | 14,600 | | 1,583,370 | |
OpenTable, Inc. * | | 76,000 | | 3,399,480 | |
| | | | 4,982,850 | |
LEISURE PRODUCTS—1.1% | | | | | |
Michael Kors Holdings Ltd.* | | 75,000 | | 3,425,250 | |
| | | | | |
LIFE & HEALTH INSURANCE—0.6% | | | | | |
Lincoln National Corp. | | 68,700 | | 1,701,699 | |
| | | | | |
LIFE SCIENCES TOOLS & SERVICES—0.6% | | | | | |
Covance, Inc.* | | 41,100 | | 1,921,836 | |
| | | | | |
MANAGED HEALTH CARE—0.7% | | | | | |
Cigna Corp. | | 49,500 | | 2,288,385 | |
| | | | | |
MORTGAGE REITS—1.0% | | | | | |
American Capital Agency Corp. | | 100,400 | | 3,136,496 | |
| | | | | |
MOTORCYCLE MANUFACTURERS—1.3% | | | | | |
Harley-Davidson, Inc. | | 75,300 | | 3,940,449 | |
| | | | | |
OIL & GAS DRILLING—1.5% | | | | | |
Nabors Industries Ltd.* | | 287,700 | | 4,790,205 | |
| | | | | |
OIL & GAS EQUIPMENT & SERVICES—2.6% | | | | | |
Cameron International Corp. *,^ | | 78,950 | | 4,046,188 | |
Superior Energy Services, Inc. * | | 153,100 | | 4,121,452 | |
| | | | 8,167,640 | |
OIL & GAS EXPLORATION & PRODUCTION—4.7% | | | | | |
Cabot Oil & Gas Corp. | | 47,300 | | 1,662,122 | |
Denbury Resources, Inc. * | | 267,900 | | 5,100,816 | |
Nexen, Inc. | | 78,300 | | 1,515,105 | |
Pioneer Natural Resources Co. ^ | | 51,700 | | 5,987,894 | |
| | | | 14,265,937 | |
| | | | | | |
28
| | SHARES | | VALUE | |
COMMON STOCKS—(CONT.) | | | | | |
OIL & GAS REFINING & MARKETING—0.8% | | | | | |
Valero Energy Corp. | | 97,800 | | $ | 2,415,660 | |
| | | | | |
PHARMACEUTICALS—1.0% | | | | | |
Mylan, Inc. * | | 71,900 | | 1,560,949 | |
Warner Chilcott PLC, Cl. A * | | 71,900 | | 1,563,825 | |
| | | | 3,124,774 | |
REAL ESTATE MANAGEMENT & DEVELOPMENT—1.4% | | | | | |
BR Malls Participacoes SA | | 219,640 | | 2,728,576 | |
BR Properties SA | | 125,700 | | 1,559,586 | |
| | | | 4,288,162 | |
REGIONAL BANKS—0.8% | | | | | |
East West Bancorp, Inc. | | 107,200 | | 2,440,944 | |
| | | | | |
REINSURANCE—1.0% | | | | | |
Validus Holdings Ltd. | | 96,900 | | 3,149,250 | |
| | | | | |
RESEARCH & CONSULTING SERVICES—1.4% | | | | | |
Verisk Analytics, Inc., Cl. A* | | 85,400 | | 4,180,330 | |
| | | | | |
RESIDENTIAL REITS—1.0% | | | | | |
Home Properties, Inc. | | 50,200 | | 3,064,710 | |
| | | | | |
RESTAURANTS—1.2% | | | | | |
Chipotle Mexican Grill, Inc.* | | 9,300 | | 3,851,595 | |
| | | | | |
SEMICONDUCTORS—3.4% | | | | | |
Altera Corp. | | 43,000 | | 1,529,510 | |
Avago Technologies Ltd. | | 91,200 | | 3,144,576 | |
Skyworks Solutions, Inc. * | | 127,800 | | 3,468,492 | |
Xilinx, Inc. | | 67,000 | | 2,437,460 | |
| | | | 10,580,038 | |
SOFT DRINKS—0.2% | | | | | |
Monster Beverage Corp.* | | 11,900 | | 773,024 | |
| | | | | |
SPECIALIZED CONSUMER SERVICES—0.8% | | | | | |
Weight Watchers International, Inc. | | 31,000 | | 2,354,760 | |
| | | | | |
SPECIALIZED FINANCE—2.2% | | | | | |
IntercontinentalExchange, Inc. * | | 35,500 | | 4,722,920 | |
Moody’s Corp. | | 56,800 | | 2,325,960 | |
| | | | 7,048,880 | |
SPECIALTY CHEMICALS—4.5% | | | | | |
Celanese Corp. | | 95,200 | | 4,613,392 | |
Cytec Industries, Inc. | | 24,300 | | 1,544,751 | |
Ecolab, Inc. | | 50,000 | | 3,184,500 | |
Rockwood Holdings, Inc. * | | 77,200 | | 4,272,248 | |
| | | | 13,614,891 | |
SPECIALTY STORES—1.5% | | | | | |
Dick’s Sporting Goods, Inc. | | 61,300 | | 3,101,780 | |
L’Occitane International SA | | 576,700 | | 1,538,630 | |
| | | | 4,640,410 | |
STEEL—0.5% | | | | | |
Allegheny Technologies, Inc. | | 34,500 | | 1,481,430 | |
| | | | | | |
29
| | SHARES | | VALUE | |
COMMON STOCKS—(CONT.) | | | | | |
SYSTEMS SOFTWARE—2.0% | | | | | |
Fortinet, Inc. * | | 76,884 | | $ | 2,008,210 | |
MICROS Systems, Inc. * | | 73,000 | | 4,148,590 | |
| | | | 6,156,800 | |
WIRELESS TELECOMMUNICATION SERVICES—1.8% | | | | | |
SBA Communications Corp.* | | 102,800 | | 5,524,472 | |
| | | | | |
TOTAL COMMON STOCKS
(Cost $277,349,784) | | | | 282,814,241 | |
| | | | | |
CONVERTIBLE PREFERRED STOCK—3.6% | | | | | |
BIOTECHNOLOGY—3.6% | | | | | |
Merrimack Pharmaceuticals, Inc., Series B-10, *,(L2),(a) | | 115,098 | | 1,302,263 | |
Merrimack Pharmaceuticals, Inc., Series B-3, *,(L2),(b) | | 11,510 | | 130,229 | |
Merrimack Pharmaceuticals, Inc., Series B-4, *,(L2),(c) | | 345,008 | | 3,903,552 | |
Merrimack Pharmaceuticals, Inc., Series B-7, *,(L2),(a) | | 115,098 | | 1,302,263 | |
Merrimack Pharmaceuticals, Inc., Series C-2, *,(L2),(d) | | 611,759 | | 4,494,592 | |
| | | | 11,132,899 | |
TOTAL CONVERTIBLE PREFERRED STOCK
(Cost $5,689,999) | | | | 11,132,899 | |
| | | | | |
MASTER LIMITED PARTNERSHIP —1.2% | | | | | |
ASSET MANAGEMENT & CUSTODY BANKS—1.2% | | | | | |
KKR & Co., LP | | 266,900 | | 3,768,628 | |
| | | | | |
TOTAL MASTER LIMITED PARTNERSHIP
(Cost $4,354,187) | | | | 3,768,628 | |
| | | | | |
| | CONTRACTS | | | |
PURCHASED OPTIONS—0.0% | | | | | |
PUT OPTIONS—0.0% | | | | | |
Denbury Resources, Inc./ May/ 17*,~
(Cost $1,461) | | 65 | | 910 | |
| | | | | |
CALL OPTIONS—0.0% | | | | | |
Denbury Resources, Inc./ May/ 20*
(Cost $1,409) | | 65 | | 1,625 | |
| | | | | |
TOTAL PURCHASED OPTIONS
(Cost $2,870) | | | | 2,535 | |
| | | | | |
Total Investments
(Cost $287,396,840)(e) | | 96.2 | % | 297,718,303 | |
Other Assets in Excess of Liabilities | | 3.8 | | 11,647,176 | |
| | | | | | |
NET ASSETS | | 100.0 | % | $ | 309,365,479 | |
‡ | Securities classified as Level 1 for ASC 820 disclosure purposes based on valuation inputs unless otherwise noted. |
| |
^ | All or a portion of this security has been pledged as collateral for written call options. |
~ | All or a portion of this security has been pledged as collateral for written put options. |
* | Non-income producing security. |
30
# | American Depository Receipts. |
(a) | Pursuant to Securities and Exchange Commission Rule 144 deemed illiquid until eligible for sale on September 25, 2012. Security was acquired on August 25, 2010 for a cost of $666,188 and represents 0.4% of the net assets of the Fund. |
(b) | Pursuant to Securities and Exchange Commission Rule 144 deemed illiquid until eligible for sale on September 25, 2012. Security was acquired on August 25, 2010 for a cost of $66,620 and represents 0.0% of the net assets of the Fund. |
(c) | Pursuant to Securities and Exchange Commission Rule 144 deemed illiquid until eligible for sale on September 25, 2012. Security was acquired on August 25, 2010 for a cost of $1,996,908 and represents 1.3% of the net assets of the Fund. |
(d) | Pursuant to Securities and Exchange Commission Rule 144 deemed illiquid until eligible for sale on September 25, 2012. Security was acquired on August 25, 2010 for a cost of $2,294,095 and represents 1.5% of the net assets of the Fund. |
(e) | At April 30, 2012, the net unrealized appreciation on investments, based on cost for federal income tax purposes of $292,675,236, amounted to $5,043,067 which consisted of aggregate gross unrealized appreciation of $26,023,340 and aggregate gross unrealized depreciation of $20,980,273. |
(L2) | Security classified as Level 2 for ASC 820 disclosure purposes based on valuation inputs. |
See Notes to Financial Statements.
31
| | CONTRACTS | | SHARES
SUBJECT
TO PUT/
CALL | | VALUE | |
PUT OPTIONS WRITTEN | | | | | | | |
Cliffs Natural Resources, Inc./ May/ 62.50 | | 43 | | 4,300 | | $ | 9,761 | |
Cliffs Natural Resources, Inc./ May/ 65 | | 22 | | 2,200 | | 8,250 | |
Denbury Resources, Inc./ May/ 19 | | 65 | | 6,500 | | 4,680 | |
Energy XXI Bermuda Ltd./ May/ 36 | | 87 | | 8,700 | | 6,960 | |
SM Energy Co./ May/ 65 | | 33 | | 3,300 | | 7,095 | |
SM Energy Co./ May/ 70 | | 33 | | 3,300 | | 19,932 | |
TOTAL PUT OPTIONS WRITTEN
(Premiums Received $69,268) | | | | | | 56,678 | |
| | | | | | | |
CALL OPTIONS WRITTEN | | | | | | | |
Cameron International Corp./ May/ 50 | | 108 | | 10,800 | | 23,220 | |
Chicago Bridge & Iron Co., NV/ May/ 44 | | 44 | | 4,400 | | 6,600 | |
Chicago Bridge & Iron Co., NV/ May/ 45 | | 44 | | 4,400 | | 4,180 | |
Pioneer Natural Resources Co./ May/ 110 | | 33 | | 3,300 | | 24,750 | |
Pioneer Natural Resources Co./ May/ 115 | | 33 | | 3,300 | | 15,180 | |
TOTAL CALL OPTIONS WRITTEN
(Premiums Received $66,009) | | | | | | 73,930 | |
| | | | | | | |
TOTAL OPTIONS WRITTEN
(Premiums Received $135,277) | | | | | | $ | 130,608 | |
‡ | Securities classified as Level 1 for ASC 820 disclosure purposes based on valuation inputs unless otherwise noted. |
See Notes to Financial Statements.
32
THE ALGER INSTITUTIONAL FUNDS | ALGER SMALL CAP GROWTH INSTITUTIONAL FUND
Schedule of Investments‡ (Unaudited) April 30, 2012
| | SHARES | | VALUE | |
COMMON STOCKS—96.2% | | | | | |
AEROSPACE & DEFENSE—1.9% | | | | | |
AAR Corp. | | 562,600 | | $ | 8,692,170 | |
Esterline Technologies Corp. * | | 195,675 | | 13,401,781 | |
| | | | 22,093,951 | |
AIR FREIGHT & LOGISTICS—1.1% | | | | | |
HUB Group, Inc., Cl. A* | | 368,100 | | 12,883,500 | |
| | | | | |
APPAREL RETAIL—3.9% | | | | | |
Aeropostale, Inc. * | | 273,300 | | 6,061,794 | |
ANN, Inc. * | | 361,200 | | 10,001,628 | |
Children’s Place Retail Stores, Inc., /The * | | 168,850 | | 7,763,723 | |
DSW, Inc., Cl. A | | 216,700 | | 12,191,541 | |
Express, Inc. * | | 421,600 | | 9,958,192 | |
| | | | 45,976,878 | |
APPLICATION SOFTWARE—7.5% | | | | | |
BroadSoft, Inc. * | | 243,719 | | 10,433,610 | |
Cadence Design Systems, Inc. * | | 1,216,500 | | 14,196,554 | |
Concur Technologies, Inc. * | | 179,800 | | 10,169,488 | |
Nice Systems Ltd. #* | | 244,355 | | 9,388,119 | |
QLIK Technologies, Inc. * | | 413,000 | | 11,898,530 | |
RealPage, Inc. * | | 326,000 | | 5,916,900 | |
SolarWinds, Inc. * | | 237,000 | | 11,117,670 | |
Tangoe, Inc. * | | 207,050 | | 4,240,384 | |
Ultimate Software Group, Inc. * | | 158,700 | | 12,245,292 | |
| | | | 89,606,547 | |
ASSET MANAGEMENT & CUSTODY BANKS—0.7% | | | | | |
Cohen & Steers, Inc. | | 244,800 | | 8,626,752 | |
| | | | | |
AUTO PARTS & EQUIPMENT—1.1% | | | | | |
Dana Holding Corp. | | 519,150 | | 7,589,973 | |
Tenneco, Inc. * | | 162,500 | | 5,009,875 | |
| | | | 12,599,848 | |
BIOTECHNOLOGY—5.0% | | | | | |
Alkermes Plc * | | 450,700 | | 7,797,109 | |
Cepheid, Inc. * | | 98,200 | | 3,771,862 | |
Cubist Pharmaceuticals, Inc. * | | 143,850 | | 6,081,978 | |
Incyte Corp., Ltd. * | | 334,400 | | 7,584,192 | |
Ironwood Pharmaceuticals, Inc. * | | 352,650 | | 4,658,507 | |
Medivation, Inc. * | | 72,950 | | 5,900,196 | |
Onyx Pharmaceuticals, Inc. * | | 127,100 | | 5,784,321 | |
Optimer Pharmaceuticals, Inc. * | | 520,712 | | 7,706,537 | |
Seattle Genetics, Inc. * | | 181,500 | | 3,588,255 | |
Theravance, Inc. * | | 257,850 | | 5,579,874 | |
| | | | 58,452,831 | |
BUILDING PRODUCTS—0.4% | | | | | |
AO Smith Corp. | | 107,200 | | 5,102,720 | |
| | | | | |
CABLE & SATELLITE—0.6% | | | | | |
AMC Networks, Inc.* | | 175,150 | | 7,443,875 | |
| | | | | | |
33
| | SHARES | | VALUE | |
COMMON STOCKS—(CONT.) | | | | | |
COMMUNICATIONS EQUIPMENT—1.7% | | | | | |
Acme Packet, Inc. * | | 211,350 | | $ | 5,932,595 | |
Ciena Corp. * | | 502,400 | | 7,445,568 | |
Finisar Corp. * | | 376,300 | | 6,216,476 | |
| | | | 19,594,639 | |
COMPUTER HARDWARE—0.4% | | | | | |
Silicon Graphics International Corp.* | | 509,150 | | 4,806,376 | |
| | | | | |
DATA PROCESSING & OUTSOURCED SERVICES—2.0% | | | | | |
Jack Henry & Associates, Inc. | | 292,450 | | 9,931,602 | |
Wright Express Corp. * | | 219,085 | | 13,982,005 | |
| | | | 23,913,607 | |
DIVERSIFIED METALS & MINING—0.2% | | | | | |
Globe Specialty Metals, Inc. | | 209,200 | | 2,790,728 | |
| | | | | |
EDUCATION SERVICES—0.6% | | | | | |
American Public Education, Inc.* | | 198,950 | | 6,907,544 | |
| | | | | |
ELECTRIC UTILITIES—1.2% | | | | | |
ITC Holdings Corp. | | 175,385 | | 13,585,322 | |
| | | | | |
ELECTRONIC EQUIPMENT MANUFACTURERS—0.9% | | | | | |
Cognex Corp. | | 254,600 | | 10,247,650 | |
| | | | | |
ELECTRONIC MANUFACTURING SERVICES—0.4% | | | | | |
TTM Technologies, Inc.* | | 510,050 | | 5,268,817 | |
| | | | | |
ENVIRONMENTAL & FACILITIES SERVICES—3.4% | | | | | |
Clean Harbors, Inc. * | | 218,250 | | 14,893,380 | |
Tetra Tech, Inc. * | | 521,650 | | 13,928,055 | |
Waste Connections, Inc. | | 333,500 | | 10,748,705 | |
| | | | 39,570,140 | |
FOOD DISTRIBUTORS—1.1% | | | | | |
United Natural Foods, Inc.* | | 269,250 | | 13,271,333 | |
| | | | | |
FOOD RETAIL—0.5% | | | | | |
Fresh Market, Inc., /The* | | 115,800 | | 5,925,486 | |
| | | | | |
GOLD—0.5% | | | | | |
AuRico Gold, Inc.* | | 669,900 | | 6,136,284 | |
| | | | | |
HEALTH CARE EQUIPMENT—4.3% | | | | | |
Insulet Corp. * | | 543,450 | | 9,706,016 | |
MAKO Surgical Corp. * | | 144,692 | | 5,977,227 | |
NxStage Medical, Inc. * | | 347,550 | | 5,908,350 | |
Sirona Dental Systems, Inc. * | | 155,350 | | 7,846,729 | |
Thoratec Corp. * | | 170,200 | | 5,924,662 | |
Volcano Corp. * | | 274,900 | | 7,463,535 | |
Wright Medical Group, Inc. * | | 416,150 | | 7,752,875 | |
| | | | 50,579,394 | |
HEALTH CARE FACILITIES—1.4% | | | | | |
Healthsouth Corp. * | | 426,400 | | 9,547,096 | |
LifePoint Hospitals, Inc. * | | 169,000 | | 6,594,380 | |
| | | | 16,141,476 | |
| | | | | | |
34
| | SHARES | | VALUE | |
COMMON STOCKS—(CONT.) | | | | | |
HEALTH CARE SERVICES—1.9% | | | | | |
Catalyst Health Solutions, Inc. * | | 168,350 | | $ | 14,540,390 | |
HMS Holdings Corp. * | | 319,050 | | 7,676,343 | |
| | | | 22,216,733 | |
HEALTH CARE SUPPLIES—0.9% | | | | | |
Align Technology, Inc.* | | 349,850 | | 11,093,744 | |
| | | | | |
HEALTH CARE TECHNOLOGY—0.3% | | | | | |
Greenway Medical Technologies* | | 224,100 | | 3,451,140 | |
| | | | | |
HOME FURNISHINGS—0.4% | | | | | |
Ethan Allen Interiors, Inc. | | 217,200 | | 5,039,040 | |
| | | | | |
HOMEFURNISHING RETAIL—0.7% | | | | | |
Pier 1 Imports, Inc. | | 465,350 | | 7,994,713 | |
| | | | | |
HOTELS RESORTS & CRUISE LINES—1.4% | | | | | |
Interval Leisure Group | | 361,416 | | 6,245,268 | |
Marriott Vacations Worldwide Corp. * | | 204,500 | | 6,038,885 | |
Orient-Express Hotels Ltd., Cl. A * | | 382,350 | | 4,087,322 | |
| | | | 16,371,475 | |
INDUSTRIAL MACHINERY—4.7% | | | | | |
Actuant Corp., Cl. A | | 495,660 | | 13,516,648 | |
Barnes Group, Inc. | | 519,100 | | 13,704,240 | |
RBC Bearings, Inc. * | | 312,000 | | 14,626,559 | |
Woodward Governor Co. | | 325,650 | | 13,543,784 | |
| | | | 55,391,231 | |
INTERNET SOFTWARE & SERVICES—6.4% | | | | | |
Ancestry.com, Inc. * | | 338,350 | | 9,033,945 | |
comScore, Inc. * | | 554,900 | | 11,053,608 | |
Cornerstone OnDemand, Inc. * | | 410,100 | | 8,521,878 | |
DealerTrack Holdings, Inc. * | | 394,500 | | 11,767,935 | |
ExactTarget, Inc. * | | 162,150 | | 4,379,672 | |
LogMeIn, Inc. * | | 339,800 | | 12,236,197 | |
OpenTable, Inc. * | | 209,700 | | 9,379,881 | |
VistaPrint NV * | | 238,590 | | 8,897,021 | |
| | | | 75,270,137 | |
IT CONSULTING & OTHER SERVICES—0.6% | | | | | |
InterXion Holding NV* | | 353,850 | | 7,101,770 | |
| | | | | |
LEISURE FACILITIES—2.0% | | | | | |
Life Time Fitness, Inc. * | | 185,145 | | 8,620,351 | |
Six Flags Entertainment Corp. | | 314,350 | | 15,060,508 | |
| | | | 23,680,859 | |
LEISURE PRODUCTS—1.5% | | | | | |
Brunswick Corp. | | 395,750 | | 10,404,268 | |
Warnaco Group, Inc., /The * | | 146,000 | | 7,732,160 | |
| | | | 18,136,428 | |
LIFE SCIENCES TOOLS & SERVICES—0.7% | | | | | |
PAREXEL International Corp.* | | 319,192 | | 8,599,032 | |
| | | | | |
MANAGED HEALTH CARE—1.0% | | | | | |
Centene Corp. * | | 137,350 | | 5,437,687 | |
| | | | | | |
35
| | SHARES | | VALUE | |
COMMON STOCKS—(CONT.) | | | | | |
MANAGED HEALTH CARE—(CONT.) | | | | | |
WellCare Health Plans, Inc. * | | 103,900 | | $ | 6,356,602 | |
| | | | 11,794,289 | |
METAL & GLASS CONTAINERS—1.2% | | | | | |
Silgan Holdings, Inc. | | 330,450 | | 14,496,842 | |
| | | | | |
MORTGAGE REITS—0.7% | | | | | |
Two Harbors Investment Corp. | | 789,350 | | 8,256,601 | |
| | | | | |
OIL & GAS EQUIPMENT & SERVICES—1.6% | | | | | |
Dril-Quip, Inc. * | | 108,520 | | 7,313,163 | |
Key Energy Services, Inc. * | | 539,800 | | 6,833,868 | |
Lufkin Industries, Inc. | | 54,450 | | 4,183,938 | |
| | | | 18,330,969 | |
OIL & GAS EXPLORATION & PRODUCTION—6.0% | | | | | |
Berry Petroleum Co. | | 200,790 | | 9,145,984 | |
Energy XXI Bermuda Ltd. * | | 360,200 | | 13,572,335 | |
Gulfport Energy Corp. * | | 155,750 | | 4,082,208 | |
Kodiak Oil & Gas Corp. * | | 910,850 | | 8,061,023 | |
Nothern Oil and Gas, Inc. * | | 357,000 | | 6,936,510 | |
Rosetta Resources, Inc. * | | 233,350 | | 11,730,504 | |
Stone Energy Corp. * | | 316,400 | | 8,875,020 | |
Swift Energy Co. * | | 288,450 | | 8,725,613 | |
| | | | 71,129,197 | |
PACKAGED FOODS & MEATS—1.0% | | | | | |
Hain Celestial Group, Inc.* | | 252,217 | | 11,929,864 | |
| | | | | |
PHARMACEUTICALS—1.8% | | | | | |
Medicis Pharmaceutical Corp., Cl. A | | 266,150 | | 10,238,790 | |
Salix Pharmaceuticals Ltd. * | | 95,200 | | 4,702,880 | |
ViroPharma, Inc. * | | 282,650 | | 6,147,638 | |
| | | | 21,089,308 | |
RAILROADS—1.0% | | | | | |
Genesee & Wyoming, Inc., Cl. A* | | 214,550 | | 11,566,391 | |
| | | | | |
REAL ESTATE SERVICES—0.9% | | | | | |
Jones Lang LaSalle, Inc. | | 126,400 | | 10,104,416 | |
| | | | | |
REGIONAL BANKS—1.2% | | | | | |
Signature Bank * | | 143,100 | | 9,400,239 | |
SVB Financial Group * | | 75,300 | | 4,825,977 | |
| | | | 14,226,216 | |
REINSURANCE—0.7% | | | | | |
Endurance Specialty Holdings Ltd. | | 203,850 | | 8,190,693 | |
| | | | | |
RESEARCH & CONSULTING SERVICES—0.9% | | | | | |
CoStar Group, Inc.* | | 140,105 | | 10,212,253 | |
| | | | | |
RESIDENTIAL REITS—1.3% | | | | | |
American Campus Communities, Inc. | | 176,450 | | 7,843,202 | |
Home Properties, Inc. | | 126,000 | | 7,692,300 | |
| | | | 15,535,502 | |
| | | | | | |
36
| | SHARES | | VALUE | |
COMMON STOCKS—(CONT.) | | | | | |
RESTAURANTS—1.6% | | | | | |
Cheesecake Factory, Inc., /The * | | 293,300 | | $ | 9,238,950 | |
Domino’s Pizza, Inc. | | 256,150 | | 9,685,032 | |
| | | | 18,923,982 | |
SEMICONDUCTOR EQUIPMENT—1.2% | | | | | |
Novellus Systems, Inc.* | | 296,000 | | 13,838,000 | |
| | | | | |
SEMICONDUCTORS—2.7% | | | | | |
Applied Micro Circuits Corporation * | | 432,100 | | 2,411,118 | |
Cavium Networks, Inc. * | | 181,950 | | 5,323,857 | |
Inphi Corp. * | | 642,550 | | 6,521,883 | |
Mellanox Technologies Ltd. * | | 207,650 | | 12,166,213 | |
RF Micro Devices, Inc. * | | 1,303,650 | | 5,644,805 | |
| | | | 32,067,876 | |
SPECIALIZED CONSUMER SERVICES—0.5% | | | | | |
Sotheby’s | | 139,750 | | 5,494,970 | |
| | | | | |
SPECIALIZED REITS—0.6% | | | | | |
Extra Space Storage, Inc. | | 240,950 | | 7,312,833 | |
| | | | | |
SPECIALTY CHEMICALS—2.6% | | | | | |
Cytec Industries, Inc. | | 137,550 | | 8,744,054 | |
PolyOne Corp. | | 577,950 | | 8,010,387 | |
Rockwood Holdings, Inc. * | | 229,250 | | 12,686,694 | |
| | | | 29,441,135 | |
SPECIALTY STORES—1.1% | | | | | |
Vitamin Shoppe, Inc.* | | 284,550 | | 13,393,769 | |
| | | | | |
SYSTEMS SOFTWARE—1.1% | | | | | |
AVG Technologies NV * | | 397,050 | | 5,499,143 | |
CommVault Systems, Inc. * | | 136,550 | | 7,110,158 | |
| | | | 12,609,301 | |
THRIFTS & MORTGAGE FINANCE—1.1% | | | | | |
Northwest Bancshares, Inc. | | 1,008,150 | | 12,420,408 | |
| | | | | |
TRADING COMPANIES & DISTRIBUTORS—1.2% | | | | | |
United Rentals, Inc.* | | 302,600 | | 14,125,368 | |
| | | | | |
TRUCKING—0.9% | | | | | |
Avis Budget Group, Inc.* | | 845,150 | | 11,122,174 | |
| | | | | |
TOTAL COMMON STOCKS
(Cost $966,744,455) | | | | 1,133,484,357 | |
| | | | | | |
37
| | SHARES | | VALUE | |
MASTER LIMITED PARTNERSHIP —0.5% | | | | | |
ASSET MANAGEMENT & CUSTODY BANKS—0.5% | | | | | |
Fortress Investment Group LLC, Cl. A | | 1,648,250 | | $ | 5,900,735 | |
| | | | | |
TOTAL MASTER LIMITED PARTNERSHIP
(Cost $8,784,110) | | | | 5,900,735 | |
| | | | | |
Total Investments
(Cost $975,528,565)(a) | | 96.7 | % | 1,139,385,092 | |
Other Assets in Excess of Liabilities | | 3.3 | | 38,526,556 | |
| | | | | |
NET ASSETS | | 100.0 | % | $ | 1,177,911,648 | |
‡ | Securities classified as Level 1 for ASC 820 disclosure purposes based on valuation inputs unless otherwise noted. |
| |
* | Non-income producing security. |
# | American Depository Receipts. |
(a) | At April 30, 2012, the net unrealized appreciation on investments, based on cost for federal income tax purposes of $976,528,714, amounted to $162,856,378 which consisted of aggregate gross unrealized appreciation of $204,880,895 and aggregate gross unrealized depreciation of $42,024,517. |
See Notes to Financial Statements.
38
THE ALGER INSTITUTIONAL FUNDS
Statements of Assets and Liabilities (Unaudited) April 30, 2012
| | Alger Capital
Appreciation
Institutional Fund | | Alger Large Cap
Growth
Institutional Fund | |
ASSETS: | | | | | |
Investments in securities, at value (identified cost)*
see accompanying schedules of investments | | $ | 1,600,228,495 | | $ | 20,752,607 | |
Cash and cash equivalents# | | 54,911,948 | | 965,081 | |
Receivable for investment securities sold | | 29,603,920 | | 1,328,460 | |
Receivable for shares of beneficial interest sold | | 13,427,822 | | 116,637 | |
Dividends and interest receivable | | 1,038,113 | | 14,616 | |
Prepaid expenses | | 99,594 | | 35,111 | |
Total Assets | | 1,699,309,892 | | 23,212,512 | |
LIABILITIES: | | | | | |
Payable for investment securities purchased | | 26,824,321 | | 1,223,833 | |
Payable for shares of beneficial interest redeemed | | 3,547,385 | | 41,303 | |
Accrued investment advisory fees | | 1,116,378 | | 13,185 | |
Accrued transfer agent fees | | 42,262 | | 9,892 | |
Accrued distribution fees | | 134,250 | | 2,072 | |
Accrued administrative fees | | 37,902 | | 511 | |
Accrued shareholder servicing fees | | 358,343 | | 4,829 | |
Accrued other expenses | | 137,190 | | 37,244 | |
Total Liabilities | | 32,198,031 | | 1,332,869 | |
NET ASSETS | | $ | 1,667,111,861 | | $ | 21,879,643 | |
Net Assets Consist of: | | | | | |
Paid in capital (par value of $.001 per share) | | 1,449,637,082 | | 28,581,318 | |
Undistributed net investment income (accumulated loss) | | 790,326 | | (42,680 | ) |
Undistributed net realized gain (accumulated realized loss) | | 31,148,467 | | (8,601,608 | ) |
Net unrealized appreciation on investments | | 185,535,986 | | 1,942,613 | |
NET ASSETS | | $ | 1,667,111,861 | | $ | 21,879,643 | |
Net Assets By Class | | | | | |
Class I | | $ | 1,342,170,016 | | $ | 17,031,199 | |
Class R | | $ | 324,941,845 | | $ | 4,848,444 | |
Shares Of Beneficial Interest Outstanding—Note 6 | | | | | |
Class I | | 58,765,913 | | 1,120,048 | |
Class R | | 14,906,920 | | 331,359 | |
Net Asset Value Per Share | | | | | |
Class I | | $ | 22.84 | | $ | 15.21 | |
Class R | | $ | 21.80 | | $ | 14.63 | |
*Identified cost | | $ | 1,414,693,755 | | $ | 18,809,994 | |
**Written options premiums received | | $ | — | | $ | — | |
See Notes to Financial Statements.
39
| | Alger Mid Cap
Growth
Institutional Fund | | Alger Small Cap
Growth
Institutional Fund | |
ASSETS: | | | | | |
Investments in securities, at value (identified cost)*
see accompanying schedules of investments | | $ | 297,718,303 | | $ | 1,139,385,092 | |
Cash and cash equivalents# | | 9,215,342 | | 33,964,725 | |
Receivable for investment securities sold | | 15,272,243 | | 14,522,143 | |
Receivable for shares of beneficial interest sold | | 601,110 | | 3,820,763 | |
Dividends and interest receivable | | 707,371 | | 77,961 | |
Prepaid expenses | | 55,231 | | 105,015 | |
Total Assets | | 323,569,600 | | 1,191,875,699 | |
LIABILITIES: | | | | | |
Payable for investment securities purchased | | 9,327,556 | | 5,280,467 | |
Written options outstanding** | | 130,608 | | — | |
Payable for shares of beneficial interest redeemed | | 4,302,445 | | 7,300,954 | |
Accrued investment advisory fees | | 203,254 | | 807,051 | |
Accrued transfer agent fees | | 51,276 | | 96,045 | |
Accrued distribution fees | | 13,708 | | 26,447 | |
Accrued administrative fees | | 7,355 | | 27,400 | |
Accrued shareholder servicing fees | | 69,534 | | 259,053 | |
Accrued other expenses | | 98,385 | | 166,634 | |
Total Liabilities | | 14,204,121 | | 13,964,051 | |
NET ASSETS | | $ | 309,365,479 | | $ | 1,177,911,648 | |
Net Assets Consist of: | | | | | |
Paid in capital (par value of $.001 per share) | | 656,330,891 | | 932,580,589 | |
Undistributed net investment income (accumulated loss) | | (869,377 | ) | (4,233,494 | ) |
Undistributed net realized gain (accumulated realized loss) | | (356,421,324 | ) | 85,708,026 | |
Net unrealized appreciation on investments | | 10,325,289 | | 163,856,527 | |
NET ASSETS | | $ | 309,365,479 | | $ | 1,177,911,648 | |
Net Assets By Class | | | | | |
Class I | | $ | 277,162,887 | | $ | 1,116,292,280 | |
Class R | | $ | 32,202,592 | | $ | 61,619,368 | |
Shares Of Beneficial Interest Outstanding—Note 6 | | | | | |
Class I | | 18,417,946 | | 38,499,932 | |
Class R | | 2,255,618 | | 2,223,398 | |
Net Asset Value Per Share | | | | | |
Class I | | $ | 15.05 | | $ | 28.99 | |
Class R | | $ | 14.28 | | $ | 27.71 | |
*Identified cost | | $ | 287,396,840 | | $ | 975,528,565 | |
**Written options premiums received | | $ | 135,277 | | $ | — | |
# Alger Mid Cap Growth Institutional Fund includes cash of $857,500 held as collateral for written options.
See Notes to Financial Statements.
40
THE ALGER INSTITUTIONAL FUNDS
Statements of Operations (Unaudited)
For the six months ended April 30, 2012
| | Alger Capital
Appreciation
Institutional Fund | | Alger Large Cap
Growth
Institutional Fund | |
INCOME | | | | | |
Dividends (net of foreign withholding taxes*) | | $ | 9,651,688 | | $ | 162,280 | |
Interest | | 46,767 | | 214 | |
Total Income | | 9,698,455 | | 162,494 | |
EXPENSES | | | | | |
Advisory fees—Note 3(a) | | 5,720,893 | | 75,753 | |
Distribution fees—Note3(b): | | | | | |
Class R | | 666,058 | | 12,988 | |
Shareholder servicing fees—Note 3(e) | | 1,836,336 | | 27,741 | |
Administrative fees—Note 3(a) | | 194,228 | | 2,934 | |
Custodian fees | | 53,144 | | 9,890 | |
Transfer agent fees and expenses—Note 3(d) | | 87,350 | | 17,904 | |
Printing fees | | 84,479 | | 1,550 | |
Professional fees | | 41,737 | | 15,221 | |
Registration fees | | 47,008 | | 19,193 | |
Trustee fees—Note 3(f) | | 9,393 | | 8,856 | |
Miscellaneous | | 167,503 | | 13,699 | |
Total Expenses | | 8,908,129 | | 205,729 | |
NET INVESTMENT INCOME (LOSS) | | 790,326 | | (43,235 | ) |
REALIZED AND UNREALIZED GAIN (LOSS) ON INVESTMENTS, OPTIONS AND FOREIGN CURRENCY | | | | | |
Net realized gain on investments and purchased options | | 58,013,712 | | 1,143,364 | |
Net realized gain (loss) on foreign currency transactions | | 437 | | (367 | ) |
Net change in unrealized appreciation (depreciation) on investments, options and foreign currency | | 124,408,852 | | 1,006,061 | |
Net realized and unrealized gain on investments, options and foreign currency | | 182,423,001 | | 2,149,058 | |
NET INCREASE IN NET ASSETS RESULTING FROM OPERATIONS | | $ | 183,213,327 | | $ | 2,105,823 | |
*Foreign withholding taxes | | $ | 109,800 | | $ | 1,553 | |
See Notes to Financial Statements.
41
THE ALGER INSTITUTIONAL FUNDS
Statements of Operations
For the year ended April 30, 2012
| | Alger Mid Cap
Growth
Institutional Fund | | Alger Small Cap
Growth
Institutional Fund | |
INCOME | | | | | |
Dividends (net of foreign withholding taxes*) | | $ | 1,912,416 | | $ | 3,017,996 | |
Interest | | 2,260 | | 4,550 | |
Total Income | | 1,914,676 | | 3,022,546 | |
EXPENSES | | | | | |
Advisory fees—Note 3(a) | | 1,230,943 | | 4,751,417 | |
Distribution fees—Note3(b): | | | | | |
Class R | | 82,056 | | 154,314 | |
Shareholder servicing fees—Note 3(e) | | 421,112 | | 1,525,146 | |
Administrative fees—Note 3(a) | | 44,541 | | 161,313 | |
Custodian fees | | 38,027 | | 42,040 | |
Interest expenses | | 1,614 | | 1,181 | |
Transfer agent fees and expenses—Note 3(d) | | 31,881 | | 146,256 | |
Printing fees | | 1,259 | | 102,000 | |
Professional fees | | 24,879 | | 31,529 | |
Registration fees | | 26,996 | | 51,734 | |
Trustee fees—Note 3(f) | | 9,462 | | 9,680 | |
Miscellaneous | | 45,709 | | 145,230 | |
Total Expenses | | 1,958,479 | | 7,121,840 | |
NET INVESTMENT LOSS | | (43,803 | ) | (4,099,294 | ) |
REALIZED AND UNREALIZED GAIN (LOSS) ON INVESTMENTS, OPTIONS AND FOREIGN CURRENCY | | | | | |
Net realized gain (loss) on investments and purchased options | | (12,266,605 | ) | 86,574,552 | |
Net realized loss on foreign currency transactions | | (23,238 | ) | — | |
Net realized gain on options written | | 756,483 | | — | |
Net change in unrealized appreciation (depreciation) on investments, options and foreign currency | | 45,716,775 | | 53,538,489 | |
Net change in unrealized appreciation (depreciation) on written options | | 116,608 | | — | |
Net realized and unrealized gain on investments, options and foreign currency | | 34,300,023 | | 140,113,041 | |
NET INCREASE IN NET ASSETS RESULTING FROM OPERATIONS | | $ | 34,256,220 | | $ | 136,013,747 | |
*Foreign withholding taxes | | $ | 5,521 | | $ | — | |
See Notes to Financial Statements.
42
(This page has been intentionally left blank.)
43
THE ALGER INSTITUTIONAL FUNDS
Statements of Changes in Net Assets
| | Alger Capital Appreciation Institutional
Fund | |
| | For the
Six Months Ended
April 30, 2012
(Unaudited) | | For the
Year Ended
October 31, 2011 | |
Net investment income (loss) | | $ | 790,326 | | $ | (1,589,518 | ) |
Net realized gain (loss) on investments, options and foreign currency | | 58,014,149 | | 66,785,560 | |
Net change in unrealized appreciation (depreciation) on investments, options and foreign currency | | 124,408,852 | | 14,788,025 | |
Net increase in net assets resulting from operations | | 183,213,327 | | 79,984,067 | |
Dividends and distributions to shareholders from: | | | | | |
Net investment income | | | | | |
Class I | | — | | — | |
Class R | | — | | — | |
Net realized gains | | | | | |
Class I | | (38,935,171 | ) | — | |
Class R | | (8,986,963 | ) | — | |
Total dividends and distributions to shareholders | | (47,922,134 | ) | — | |
Increase (decrease) from shares of beneficial interest transactions: | | | | | |
Class I | | 190,707,126 | | 164,881,101 | |
Class R | | 72,244,124 | | 43,192,466 | |
Net increase (decrease) from shares of beneficial interest transactions—Note 6(a) | | 262,951,250 | | 208,073,567 | |
Total increase (decrease) | | 398,242,443 | | 288,057,634 | |
Net Assets: | | | | | |
Beginning of period | | 1,268,869,418 | | 980,811,784 | |
END OF PERIOD | | $ | 1,667,111,861 | | $ | 1,268,869,418 | |
Undistributed net investment income (accumulated loss) | | $ | 790,326 | | $ | — | |
See Notes to Financial Statements.
44
| | Alger Large Cap Growth Institutional
Fund | | Alger Mid Cap Growth Institutional
Fund | | Alger Small Cap Growth Institutional
Fund | |
| | For the
Six Months Ended
April 30, 2012
(Unaudited) | | For the
Year Ended
October 31, 2011 | | For the
Six Months Ended
April 30, 2012
(Unaudited) | | For the
Year Ended
October 31, 2011 | | For the
Six Months Ended
April 30, 2012
(Unaudited) | | For the
Year Ended
October 31, 2011 | |
Net investment income (loss) | | $ | (43,235 | ) | $ | (108,363 | ) | $ | (43,803 | ) | $ | (4,548,980 | ) | $ | (4,099,294 | ) | $ | (12,258,756 | ) |
Net realized gain (loss) on investments, options and foreign currency | | 1,142,997 | | 2,144,219 | | (11,533,360 | ) | 134,742,835 | | 86,574,552 | | 127,490,807 | |
Net change in unrealized appreciation (depreciation) on investments, options and foreign currency | | 1,006,061 | | (251,222 | ) | 45,833,383 | | (65,789,120 | ) | 53,538,489 | | (33,597,608 | ) |
Net increase in net assets resulting from operations | | 2,105,823 | | 1,784,634 | | 34,256,220 | | 64,404,735 | | 136,013,747 | | 81,634,443 | |
Dividends and distributions to shareholders from: | | | | | | | | | | | | | |
Net investment income | | | | | | | | | | | | | |
Class I | | — | | (168,982 | ) | — | | (1,902,006 | ) | — | | — | |
Class R | | — | | (10,503 | ) | — | | — | | — | | — | |
Net realized gains | | | | | | | | | | | | | |
Class I | | — | | — | | — | | — | | (45,919,886 | ) | — | |
Class R | | — | | — | | — | | — | | (2,661,491 | ) | — | |
Total dividends and distributions to shareholders | | — | | (179,485 | ) | — | | (1,902,006 | ) | (48,581,377 | ) | — | |
Increase (decrease) from shares of beneficial interest transactions: | | | | | | | | | | | | | |
Class I | | (868,346 | ) | (7,898,934 | ) | (71,583,312 | ) | (479,440,924 | ) | (86,906,067 | ) | (61,833,473 | ) |
Class R | | (1,156,418 | ) | (978,506 | ) | (5,995,066 | ) | (17,489,577 | ) | (4,791,740 | ) | (10,560,397 | ) |
Net increase (decrease) from shares of beneficial interest transactions—Note 6(a) | | (2,024,764 | ) | (8,877,440 | ) | (77,578,378 | ) | (496,930,501 | ) | (91,697,807 | ) | (72,393,870 | ) |
Total increase (decrease) | | 81,059 | | (7,272,291 | ) | (43,322,158 | ) | (434,427,772 | ) | (4,265,437 | ) | 9,240,573 | |
Net Assets: | | | | | | | | | | | | | |
Beginning of period | | 21,798,584 | | 29,070,875 | | 352,687,637 | | 787,115,409 | | 1,182,177,085 | | 1,172,936,512 | |
END OF PERIOD | | $ | 21,879,643 | | $ | 21,798,584 | | $ | 309,365,479 | | $ | 352,687,637 | | $ | 1,177,911,648 | | $ | 1,182,177,085 | |
Undistributed net investment income (accumulated loss) | | $ | (42,680 | ) | $ | 554 | | $ | (869,377 | ) | $ | (825,574 | ) | $ | (4,233,494 | ) | $ | (134,200 | ) |
45
THE ALGER INSTITUTIONAL FUNDS
Financial Highlights for a share outstanding throughout the period
Alger Capital Appreciation Institutional Fund
| | Class I | |
| | Six months
ended
4/30/2012(i) | | Year ended
10/31/2011 | | Year ended
10/31/2010 | | Year ended
10/31/2009 | | Year ended
10/31/2008 | | Year ended
10/31/2007 | |
Net asset value, beginning of period | | $ | 20.88 | | $ | 19.28 | | $ | 16.41 | | $ | 13.23 | | $ | 22.27 | | $ | 15.77 | |
INCOME FROM INVESTMENT OPERATIONS: | | | | | | | | | | | | | |
Net investment income (loss)(ii) | | 0.02 | | (0.01 | ) | 0.00 | | 0.04 | | (0.04 | ) | (0.06 | ) |
Net realized and unrealized gain (loss) on investments | | 2.70 | | 1.61 | | 2.90 | | 3.14 | | (9.00 | ) | 6.56 | |
Total from investment operations | | 2.72 | | 1.60 | | 2.90 | | 3.18 | | (9.04 | ) | 6.50 | |
Dividends from net investment income | | — | | — | | (0.03 | ) | — | | — | | — | |
Distributions from net realized gains | | (0.76 | ) | — | | — | | — | | — | | — | |
Net asset value, end of period | | $ | 22.84 | | $ | 20.88 | | $ | 19.28 | | $ | 16.41 | | $ | 13.23 | | $ | 22.27 | |
Total return | | 13.6 | % | 8.3 | % | 17.7 | % | 23.9 | % | (40.6 | )% | 41.3 | % |
RATIOS/SUPPLEMENTAL DATA: | | | | | | | | | | | | | |
Net assets, end of period (000’s omitted) | | $ | 1,342,170 | | $ | 1,041,609 | | $ | 809,468 | | $ | 632,250 | | $ | 411,056 | | $ | 537,928 | |
Ratio of gross expenses to average net assets | | 1.17 | % | 1.17 | % | 1.17 | % | 1.21 | % | 1.18 | % | 1.23 | % |
Ratio of expense reimbursements to average net assets | | 0.00 | % | 0.00 | % | 0.00 | % | 0.00 | % | 0.00 | % | 0.00 | % |
Ratio of net expenses to average net assets | | 1.17 | % | 1.17 | % | 1.17 | % | 1.21 | % | 1.18 | % | 1.23 | % |
Ratio of net investment income (loss) to average net assets | | 0.21 | % | (0.04 | )% | (0.02 | )% | 0.32 | % | (0.21 | )% | (0.33 | )% |
Portfolio turnover rate | | 64.38 | % | 153.30 | % | 209.52 | % | 306.87 | % | 291.85 | % | 232.13 | % |
(i) Unaudited. Ratios have been annualized; total return and portfolio turnover rate have not been annualized.
(ii) Amount was computed based on average shares outstanding during the period.
See Notes to Financial Statements.
46
| | Class R | |
| | Six months
ended
4/30/2012(i) | | Year ended
10/31/2011 | | Year ended
10/31/2010 | | Year ended
10/31/2009 | | Year ended
10/31/2008 | | Year ended
10/31/2007 | |
Net asset value, beginning of period | | $ | 20.01 | | $ | 18.57 | | $ | 15.86 | | $ | 12.85 | | $ | 21.75 | | $ | 15.47 | |
INCOME FROM INVESTMENT OPERATIONS: | | | | | | | | | | | | | |
Net investment loss(ii) | | (0.03 | ) | (0.11 | ) | (0.10 | ) | (0.02 | ) | (0.13 | ) | (0.16 | ) |
Net realized and unrealized gain (loss) on investments | | 2.58 | | 1.55 | | 2.81 | | 3.03 | | (8.77 | ) | 6.44 | |
Total from investment operations | | 2.55 | | 1.44 | | 2.71 | | 3.01 | | (8.90 | ) | 6.28 | |
Distributions from net realized gains | | (0.76 | ) | — | | — | | — | | — | | — | |
Net asset value, end of period | | $ | 21.80 | | $ | 20.01 | | $ | 18.57 | | $ | 15.86 | | $ | 12.85 | | $ | 21.75 | |
Total return | | 13.4 | % | 7.8 | % | 17.1 | % | 23.3 | % | (40.9 | )% | 40.6 | % |
RATIOS/SUPPLEMENTAL DATA: | | | | | | | | | | | | | |
Net assets, end of period (000’s omitted) | | $ | 324,942 | | $ | 227,260 | | $ | 171,344 | | $ | 89,676 | | $ | 53,557 | | $ | 39,442 | |
Ratio of gross expenses to average net assets | | 1.67 | % | 1.68 | % | 1.67 | % | 1.71 | % | 1.68 | % | 1.72 | % |
Ratio of expense reimbursements to average net assets | | 0.00 | % | 0.00 | % | 0.00 | % | 0.00 | % | 0.00 | % | 0.00 | % |
Ratio of net expenses to average net assets | | 1.67 | % | 1.68 | % | 1.67 | % | 1.71 | % | 1.68 | % | 1.72 | % |
Ratio of net investment income (loss) to average net assets | | (0.31 | )% | (0.56 | )% | (0.55 | )% | (0.18 | )% | (0.70 | )% | (0.86 | )% |
Portfolio turnover rate | | 64.38 | % | 153.30 | % | 209.52 | % | 306.87 | % | 291.85 | % | 232.13 | % |
(i) Unaudited. Ratios have been annualized; total return and portfolio turnover rate have not been annualized.
(ii) Amount was computed based on average shares outstanding during the period.
See Notes to Financial Statements.
47
Alger Large Cap Growth Institutional Fund
| | Class I | |
| | Six months
ended
4/30/2012(i) | | Year ended
10/31/2011 | | Year ended
10/31/2010 | | Year ended
10/31/2009 | | Year ended
10/31/2008 | | Year ended
10/31/2007 | |
Net asset value, beginning of period | | $ | 13.75 | | $ | 13.03 | | $ | 11.17 | | $ | 9.48 | | $ | 16.87 | | $ | 13.25 | |
INCOME FROM INVESTMENT OPERATIONS: | | | | | | | | | | | | | |
Net investment income (loss)(ii) | | (0.02 | ) | (0.04 | ) | 0.07 | | 0.04 | | (0.01 | ) | (0.03 | ) |
Net realized and unrealized gain (loss) on investments | | 1.48 | | 0.86 | | 1.83 | | 1.65 | | (7.38 | ) | 3.65 | |
Total from investment operations | | 1.46 | | 0.82 | | 1.90 | | 1.69 | | (7.39 | ) | 3.62 | |
Dividends from net investment income | | — | | (0.10 | ) | (0.04 | ) | — | | — | | — | |
Net asset value, end of period | | $ | 15.21 | | $ | 13.75 | | $ | 13.03 | | $ | 11.17 | | $ | 9.48 | | $ | 16.87 | |
Total return | | 10.6 | % | 6.3 | % | 17.1 | % | 17.7 | % | (43.8 | )% | 27.3 | % |
RATIOS/SUPPLEMENTAL DATA: | | | | | | | | | | | | | |
Net assets, end of period (000’s omitted) | | $ | 17,031 | | $ | 16,294 | | $ | 22,961 | | $ | 39,412 | | $ | 20,415 | | $ | 52,127 | |
Ratio of gross expenses to average net assets | | 1.75 | % | 1.69 | % | 1.36 | % | 1.37 | % | 1.23 | % | 1.32 | % |
Ratio of expense reimbursements to average net assets | | 0.00 | % | 0.00 | % | 0.00 | % | 0.00 | % | 0.00 | % | 0.00 | % |
Ratio of net expenses to average net assets | | 1.75 | % | 1.69 | % | 1.36 | % | 1.37 | % | 1.23 | % | 1.32 | % |
Ratio of net investment income (loss) to average net assets | | (0.23 | )% | (0.27 | )% | 0.56 | % | 0.46 | % | 0.04 | % | (0.19 | )% |
Portfolio turnover rate | | 71.00 | % | 57.74 | % | 58.73 | % | 87.57 | % | 187.80 | % | 192.18 | % |
(i) Unaudited. Ratios have been annualized; total return and portfolio turnover rate have not been annualized.
(ii) Amount was computed based on average shares outstanding during the period.
See Notes to Financial Statements.
48
| | Class R | |
| | Six months
ended
4/30/2012(i) | | Year ended
10/31/2011 | | Year ended
10/31/2010 | | Year ended
10/31/2009 | | Year ended
10/31/2008 | | Year ended
10/31/2007 | |
Net asset value, beginning of period | | $ | 13.28 | | $ | 12.59 | | $ | 10.83 | | $ | 9.24 | | $ | 16.52 | | $ | 13.04 | |
INCOME FROM INVESTMENT OPERATIONS: | | | | | | | | | | | | | |
Net investment loss(ii) | | (0.06 | ) | (0.13 | ) | (0.02 | ) | 0.00 | | (0.08 | ) | (0.10 | ) |
Net realized and unrealized gain (loss) on investments | | 1.41 | | 0.84 | | 1.78 | | 1.59 | | (7.20 | ) | 3.58 | |
Total from investment operations | | 1.35 | | 0.71 | | 1.76 | | 1.59 | | (7.28 | ) | 3.48 | |
Dividends from net investment income | | — | | (0.02 | ) | — | | — | | — | | — | |
Net asset value, end of period | | $ | 14.63 | | $ | 13.28 | | $ | 12.59 | | $ | 10.83 | | $ | 9.24 | | $ | 16.52 | |
Total return | | 10.2 | % | 5.7 | % | 16.3 | % | 17.2 | % | (44.1 | )% | 26.7 | % |
RATIOS/SUPPLEMENTAL DATA: | | | | | | | | | | | | | |
Net assets, end of period (000’s omitted) | | $ | 4,849 | | $ | 5,505 | | $ | 6,110 | | $ | 5,933 | | $ | 5,112 | | $ | 8,747 | |
Ratio of gross expenses to average net assets | | 2.47 | % | 2.40 | % | 2.05 | % | 1.89 | % | 1.73 | % | 1.81 | % |
Ratio of expense reimbursements to average net assets | | 0.00 | % | 0.00 | % | 0.00 | % | 0.00 | % | 0.00 | % | 0.00 | % |
Ratio of net expenses to average net assets | | 2.47 | % | 2.40 | % | 2.05 | % | 1.89 | % | 1.73 | % | 1.81 | % |
Ratio of net investment income (loss) to average net assets | | (0.94 | )% | (0.99 | )% | (0.16 | )% | (0.03 | )% | (0.55 | )% | (0.72 | )% |
Portfolio turnover rate | | 71.00 | % | 57.74 | % | 58.73 | % | 87.57 | % | 187.80 | % | 192.18 | % |
(i) Unaudited. Ratios have been annualized; total return and portfolio turnover rate have not been annualized.
(ii) Amount was computed based on average shares outstanding during the period.
See Notes to Financial Statements.
49
Alger Mid Cap Growth Institutional Fund
| | Class I | |
| | Six months
ended
4/30/2012(i) | | Year ended
10/31/2011 | | Year ended
10/31/2010 | | Year ended
10/31/2009 | | Year ended
10/31/2008 | | Year ended
10/31/2007 | |
Net asset value, beginning of period | | $ | 13.50 | | $ | 13.11 | | $ | 10.68 | | $ | 8.76 | | $ | 23.24 | | $ | 17.29 | |
INCOME FROM INVESTMENT OPERATIONS: | | | | | | | | | | | | | |
Net investment income (loss)(ii) | | 0.00 | | (0.10 | ) | 0.01 | | (0.04 | ) | (0.09 | ) | (0.11 | ) |
Net realized and unrealized gain (loss) on investments | | 1.55 | | 0.52 | | 2.42 | | 1.96 | | (10.85 | ) | 7.44 | |
Total from investment operations | | 1.55 | | 0.42 | | 2.43 | | 1.92 | | (10.94 | ) | 7.33 | |
Dividends from net investment income | | — | | (0.03 | ) | — | | — | | — | | — | |
Distributions from net realized gains | | — | | — | | — | | — | | (3.54 | ) | (1.38 | ) |
Net asset value, end of period | | $ | 15.05 | | $ | 13.50 | | $ | 13.11 | | $ | 10.68 | | $ | 8.76 | | $ | 23.24 | |
Total return | | 11.4 | % | 3.3 | % | 22.8 | % | 21.8 | % | (55.0 | )% | 45.5 | % |
RATIOS/SUPPLEMENTAL DATA: | | | | | | | | | | | | | |
Net assets, end of period (000’s omitted) | | $ | 277,163 | | $ | 317,893 | | $ | 737,099 | | $ | 872,936 | | $ | 882,046 | | $ | 2,032,326 | |
Ratio of gross expenses to average net assets | | 1.15 | % | 1.18 | % | 1.12 | % | 1.17 | % | 1.11 | % | 1.17 | % |
Ratio of expense reimbursements to average net assets | | 0.00 | % | 0.00 | % | 0.00 | % | 0.00 | % | 0.00 | % | 0.00 | % |
Ratio of net expenses to average net assets | | 1.15 | % | 1.18 | % | 1.12 | % | 1.17 | % | 1.11 | % | 1.17 | % |
Ratio of net investment income (loss) to average net assets | | 0.03 | % | (0.69 | )% | 0.07 | % | (0.44 | )% | (0.56 | )% | (0.54 | )% |
Portfolio turnover rate | | 113.18 | % | 233.50 | % | 193.69 | % | 297.99 | % | 324.49 | % | 274.32 | % |
(i) Unaudited. Ratios have been annualized; total return and portfolio turnover rate have not been annualized.
(ii) Amount was computed based on average shares outstanding during the period.
See Notes to Financial Statements.
50
| | Class R | |
| | Six months
ended
4/30/2012(i) | | Year ended
10/31/2011 | | Year ended
10/31/2010 | | Year ended
10/31/2009 | | Year ended
10/31/2008 | | Year ended
10/31/2007 | |
Net asset value, beginning of period | | $ | 12.85 | | $ | 12.51 | | $ | 10.24 | | $ | 8.45 | | $ | 22.64 | | $ | 16.95 | |
INCOME FROM INVESTMENT OPERATIONS: | | | | | | | | | | | | | |
Net investment loss(ii) | | (0.03 | ) | (0.17 | ) | (0.05 | ) | (0.08 | ) | (0.16 | ) | (0.20 | ) |
Net realized and unrealized gain (loss) on investments | | 1.46 | | 0.51 | | 2.32 | | 1.87 | | (10.49 | ) | 7.27 | |
Total from investment operations | | 1.43 | | 0.34 | | 2.27 | | 1.79 | | (10.65 | ) | 7.07 | |
Distributions from net realized gains | | — | | — | | — | | — | | (3.54 | ) | (1.38 | ) |
Net asset value, end of period | | $ | 14.28 | | $ | 12.85 | | $ | 12.51 | | $ | 10.24 | | $ | 8.45 | | $ | 22.64 | |
Total return | | 11.1 | % | 2.7 | % | 22.2 | % | 21.0 | % | (55.3 | )% | 44.7 | % |
RATIOS/SUPPLEMENTAL DATA: | | | | | | | | | | | | | |
Net assets, end of period (000’s omitted) | | $ | 32,202 | | $ | 34,795 | | $ | 50,016 | | $ | 50,919 | | $ | 40,374 | | $ | 69,877 | |
Ratio of gross expenses to average net assets | | 1.70 | % | 1.74 | % | 1.65 | % | 1.68 | % | 1.61 | % | 1.67 | % |
Ratio of expense reimbursements to average net assets | | 0.00 | % | 0.00 | % | 0.00 | % | 0.00 | % | 0.00 | % | 0.00 | % |
Ratio of net expenses to average net assets | | 1.70 | % | 1.74 | % | 1.65 | % | 1.68 | % | 1.61 | % | 1.67 | % |
Ratio of net investment income (loss) to average net assets | | (0.51 | )% | (1.24 | )% | (0.46 | )% | (0.96 | )% | (1.05 | )% | (1.04 | )% |
Portfolio turnover rate | | 113.18 | % | 233.50 | % | 193.69 | % | 297.99 | % | 324.49 | % | 274.32 | % |
(i) Unaudited. Ratios have been annualized; total return and portfolio turnover rate have not been annualized.
(ii) Amount was computed based on average shares outstanding during the period.
See Notes to Financial Statements.
51
Alger Small Cap Growth Institutional Fund
| | Class I | |
| | Six months
ended
4/30/2012(i) | | Year ended
10/31/2011 | | Year ended
10/31/2010 | | Year ended
10/31/2009 | | Year ended
10/31/2008 | | Year ended
10/31/2007 | |
Net asset value, beginning of period | | $ | 26.99 | | $ | 25.28 | | $ | 19.90 | | $ | 16.52 | | $ | 30.30 | | $ | 23.98 | |
INCOME FROM INVESTMENT OPERATIONS: | | | | | | | | | | | | | |
Net investment loss(ii) | | (0.09 | ) | (0.26 | ) | (0.22 | ) | (0.16 | ) | (0.23 | ) | (0.21 | ) |
Net realized and unrealized gain (loss) on investments | | 3.22 | | 1.97 | | 5.60 | | 3.54 | | (13.55 | ) | 6.53 | |
Total from investment operations | | 3.13 | | 1.71 | | 5.38 | | 3.38 | | (13.78 | ) | 6.32 | |
Distributions from net realized gains | | (1.13 | ) | — | | — | | — | | — | | — | |
Net asset value, end of period | | $ | 28.99 | | $ | 26.99 | | $ | 25.28 | | $ | 19.90 | | $ | 16.52 | | $ | 30.30 | |
Total return | | 12.1 | % | 6.8 | % | 27.0 | % | 20.5 | % | (45.5 | )% | 26.4 | % |
RATIOS/SUPPLEMENTAL DATA: | | | | | | | | | | | | | |
Net assets, end of period (000’s omitted) | | $ | 1,116,292 | | $ | 1,119,966 | | $ | 1,104,866 | | $ | 968,776 | | $ | 634,542 | | $ | 894,802 | |
Ratio of gross expenses to average net assets | | 1.19 | % | 1.18 | % | 1.23 | % | 1.32 | % | 1.27 | % | 1.33 | % |
Ratio of expense reimbursements to average net assets | | 0.00 | % | 0.00 | % | 0.00 | % | 0.00 | % | 0.00 | % | (0.03 | )% |
Ratio of net expenses to average net assets | | 1.19 | % | 1.18 | % | 1.23 | % | 1.32 | % | 1.27 | % | 1.30 | % |
Ratio of net investment income (loss) to average net assets | | (0.67 | )% | (0.94 | )% | (0.94 | )% | (0.94 | )% | (0.97 | )% | (0.78 | )% |
Portfolio turnover rate | | 30.96 | % | 70.57 | % | 61.40 | % | 90.49 | % | 62.68 | % | 67.53 | % |
(i) Unaudited. Ratios have been annualized; total return and portfolio turnover rate have not been annualized.
(ii) Amount was computed based on average shares outstanding during the period.
See Notes to Financial Statements.
52
| | Class R | |
| | Six months
ended
4/30/2012(i) | | Year ended
10/31/2011 | | Year ended
10/31/2010 | | Year ended
10/31/2009 | | Year ended
10/31/2008 | | Year ended
10/31/2007 | |
Net asset value, beginning of period | | $ | 25.91 | | $ | 24.39 | | $ | 19.30 | | $ | 16.08 | | $ | 29.64 | | $ | 23.58 | |
INCOME FROM INVESTMENT OPERATIONS: | | | | | | | | | | | | | |
Net investment loss(ii) | | (0.15 | ) | (0.40 | ) | (0.31 | ) | (0.22 | ) | (0.35 | ) | (0.35 | ) |
Net realized and unrealized gain (loss) on investments | | 3.08 | | 1.92 | | 5.40 | | 3.44 | | (13.21 | ) | 6.41 | |
Total from investment operations | | 2.93 | | 1.52 | | 5.09 | | 3.22 | | (13.56 | ) | 6.06 | |
Distributions from net realized gains | | (1.13 | ) | — | | — | | — | | — | | — | |
Net asset value, end of period | | $ | 27.71 | | $ | 25.91 | | $ | 24.39 | | $ | 19.30 | | $ | 16.08 | | $ | 29.64 | |
Total return | | 11.9 | % | 6.2 | % | 26.4 | % | 20.1 | % | (45.8 | )% | 25.7 | % |
RATIOS/SUPPLEMENTAL DATA: | | | | | | | | | | | | | |
Net assets, end of period (000’s omitted) | | $ | 61,620 | | $ | 62,211 | | $ | 68,071 | | $ | 51,707 | | $ | 39,033 | | $ | 47,042 | |
Ratio of gross expenses to average net assets | | 1.70 | % | 1.71 | % | 1.69 | % | 1.73 | % | 1.77 | % | 1.86 | % |
Ratio of expense reimbursements to average net assets | | 0.00 | % | 0.00 | % | 0.00 | % | 0.00 | % | 0.00 | % | (0.03 | )% |
Ratio of net expenses to average net assets | | 1.70 | % | 1.71 | % | 1.69 | % | 1.73 | % | 1.77 | % | 1.83 | % |
Ratio of net investment income (loss) to average net assets | | (1.18 | )% | (1.47 | )% | (1.40 | )% | (1.35 | )% | (1.47 | )% | (1.32 | )% |
Portfolio turnover rate | | 30.96 | % | 70.57 | % | 61.40 | % | 90.49 | % | 62.68 | % | 67.53 | % |
(i) Unaudited. Ratios have been annualized; total return and portfolio turnover rate have not been annualized.
(ii) Amount was computed based on average shares outstanding during the period.
See Notes to Financial Statements.
53
THE ALGER INSTITUTIONAL FUNDS
NOTES TO FINANCIAL STATEMENTS (Unaudited)
NOTE 1 — General:
The Alger Institutional Funds (the “Trust”), is a diversified, open-end registered investment company organized as a business trust under the laws of the Commonwealth of Massachusetts. The Trust operates as a series company and currently issues an unlimited number of shares of beneficial interest in four funds — Alger Capital Appreciation Institutional Fund, Alger Large Cap Growth Institutional Fund, Alger Mid Cap Growth Institutional Fund and Alger Small Cap Growth Institutional Fund (collectively, the “Funds” or individually, each a “Fund”). The Funds normally invest primarily in equity securities and each has an investment objective of long-term capital appreciation.
Each Fund offers Class I and Class R shares. Each class has identical rights to assets and earnings except that each share class bears the cost of its transfer agency and sub-transfer agency services and Class R shares bear the cost of its plan of distribution.
NOTE 2 — Significant Accounting Policies:
(a) Investment Valuation: The Funds value their financial instruments at fair value using independent dealers or pricing services under policies approved by the Board. Investments are valued on each day the New York Stock Exchange (the “NYSE”) is open, as of the close of the NYSE (normally 4:00 p.m. Eastern time).
Equity securities and option contracts for which valuation information is readily available are valued at the last reported sales price or official closing price as reported by an independent pricing service on the primary market or exchange on which they are traded. In the absence of reported sales, such securities are valued at a price within the bid and ask price or, in the absence of a recent bid or ask price, the equivalent as obtained from one or more of the major market makers for the securities to be valued.
Debt securities generally trade in the over-the-counter market. Debt securities with remaining maturities of more than sixty days at the time of acquisition are valued on the basis of last available bid prices or current market quotations provided by dealers or pricing services. In determining the value of a particular investment, pricing services may use certain information with respect to transactions in such investments, quotations from dealers, pricing matrixes, market transactions in comparable investments, various relationships observed in the market between investments and calculated yield measures based on valuation technology commonly employed in the market for such investments. Asset-backed and mortgage-backed securities are valued by independent pricing services using models that consider estimated cash flows of each tranche of the security, establish a benchmark yield and develop an estimated tranche-specific spread to the benchmark yield based on the unique attributes of the tranche. Debt securities with a remaining maturity of less than sixty days are valued at amortized cost which approximates market value.
Securities for which market quotations are not readily available are valued at fair value, as determined in good faith pursuant to procedures established by the Board of Trustees.
54
THE ALGER INSTITUTIONAL FUNDS
NOTES TO FINANCIAL STATEMENTS (Unaudited) (Continued)
Securities in which the Funds invest may be traded in foreign markets that close before the close of the NYSE. Developments that occur between the close of the foreign markets and the close of the NYSE may result in adjustments to the foreign closing prices to reflect what the investment adviser, pursuant to policies established by the Board of Trustees, believes to be the fair value of these securities as of the close of the NYSE. The Funds may also fair value securities in other situations, for example, when a particular foreign market is closed but the Fund is open.
Financial Accounting Standards Board Accounting Standards Codification 820 — Fair Value Measurements and Disclosures (“ASC 820”) defines fair value as the price that the Funds would receive upon selling an investment in a timely transaction to an independent buyer in the principal or most advantageous market of the investment. ASC 820 established a three-tier hierarchy to maximize the use of observable market data and minimize the use of unobservable inputs and to establish classification of fair value measurements for disclosure purposes. Inputs refer broadly to the assumptions that market participants would use in pricing the asset or liability and may be observable or unobservable. Observable inputs are based on market data obtained from sources independent of the Funds. Unobservable inputs are inputs that reflect the Funds’ own assumptions based on the best information available in the circumstances. The three-tier hierarchy of inputs is summarized in the three broad Levels listed below.
· Level 1 — quoted prices in active markets for identical investments
· Level 2 — significant other observable inputs (including quoted prices for similar investments, interest rates, prepayment speeds, credit risk, etc.)
· Level 3 — significant unobservable inputs (including the Funds’ own assumptions in determining the fair value of investments)
The Funds’ valuation techniques are generally consistent with the market approach whereby prices and other relevant information generated by market transactions involving identical or comparable assets are used to measure fair value. Inputs for Level 1 include exchange-listed prices and broker quotes in an active market. Inputs for Level 2 include the last trade price in the case of a halted security, an exchange-listed price which has been adjusted for fair value factors, and prices of closely related securities. Additional Level 2 inputs include an evaluated price which is based upon a compilation of observable market information such as spreads for fixed income and preferred securities. Valuation techniques for Level 3 securities include using the income approach whereby future amounts are converted, or discounted, to a current single amount. These fair value measurements are determined on the basis of the value indicated by current market expectations about such future events. Inputs for Level 3 include unobservable market information which can include cash flows, income and expenses, and other information obtained from a company’s financial statements, or from market indicators such as benchmarks and indices.
Valuation processes are determined by a Valuation Committee (“Committee”) established by the Trust’s Board of Trustees (“Board”) and comprised of representatives of the
55
THE ALGER INSTITUTIONAL FUNDS
NOTES TO FINANCIAL STATEMENTS (Unaudited) (Continued)
Trust’s investment advisor. The Committee reports its valuation determinations to the Board which is responsible for approving valuation policy and procedures.
The Committee meets quarterly to review and evaluate the effectiveness of the procedures for making fair value determinations. The Committee considers, among other things, the results of quarterly back testing of the fair value model for foreign securities, pricing comparisons between primary and secondary price sources, the outcome of price challenges put to the Funds’ pricing vendor, and variances between transactional prices and previous mark-to-markets.
The Funds will record a change to a security’s fair value level if new inputs are available or it becomes evident that inputs previously considered for leveling have changed or are no longer relevant. Transfers between Levels 1 and 2 are recognized at the end of the reporting period, and transfers into and out of Level 3 are recognized during the reporting period.
(b) Cash and Cash Equivalents: Cash and cash equivalents include U.S. dollars and overnight time deposits.
(c) Securities Transactions and Investment Income: Securities transactions are recorded on a trade date basis. Realized gains and losses from securities transactions are recorded on the identified cost basis. Dividend income is recognized on the ex-dividend date and interest income is recognized on the accrual basis.
(d) Foreign Currency Translations: The books and records of the Funds are maintained in U.S. dollars. Foreign currencies, investments and other assets and liabilities are translated into U.S. dollars at the prevailing rates of exchange on the valuation date. Purchases and sales of investment securities and income and expenses are translated into U.S. dollars at the prevailing exchange rates on the respective dates of such transactions.
Net realized gains and losses on foreign currency transactions represent net gains and losses from the disposition of foreign currencies, currency gains and losses realized between the trade dates and settlement dates of security transactions, and the difference between the amount of net investment income accrued and the U.S. dollar amount actually received. The effects of changes in foreign currency exchange rates on investments in securities are included in realized and unrealized gain or loss on investments in the Statement of Operations.
(e) Option Contracts: When a Fund writes an option, an amount equal to the premium received by the Fund is recorded as a liability and is subsequently adjusted to the current fair value of the option written. Premiums received from writing options that expire unexercised are treated by the Fund on the expiration date as realized gains from investments. The difference between the premium and the amount paid on effecting a closing purchase transaction, including brokerage commissions, is also treated as a realized gain, or, if the premium is less than the amount paid for the closing purchase transaction, as a realized loss. If a call option is exercised, the premium is added to the proceeds from the sale of the underlying security in determining whether the Fund has realized a gain or loss. If a put option is exercised, the premium reduces the cost basis of the securities
56
THE ALGER INSTITUTIONAL FUNDS
NOTES TO FINANCIAL STATEMENTS (Unaudited) (Continued)
purchased by the Fund. The Fund as writer of an option bears the market risk of an unfavorable change in the price of the security underlying the written option.
The Funds may also purchase put and call options. Each Fund pays a premium which is included in the Fund’s Statement of Assets and Liabilities as an investment and subsequently marked to market to reflect the current value of the option. Premiums paid for purchasing options which expire are treated as realized losses. The risk associated with purchasing put and call options is limited to the premium paid. Premiums paid for purchasing options which are exercised or closed are added to the amounts paid or offset against the proceeds on the underlying security to determine the realized gain or loss.
(f) Dividends to Shareholders: Dividends and distributions payable to shareholders are recorded by the Funds on the ex-dividend date. Dividends from net investment income and distributions from net realized gains are declared and paid annually after the end of the fiscal year in which earned.
Each class is treated separately in determining the amounts of dividends from net investment income payable to holders of its shares.
The characterization of distributions to shareholders for financial reporting purposes is determined in accordance with federal income tax rules. Therefore, the source of a Fund’s distributions may be shown in the accompanying financial statements as either from, or in excess of, net investment income, net realized gain on investment transactions or return of capital, depending on the type of book/tax differences that may exist. Capital accounts within the financial statements are adjusted for permanent book/tax differences. Reclassifications result primarily from the difference in tax treatment of net operating losses, passive foreign investment companies, and foreign currency transactions. The reclassifications are done annually at fiscal year end and have no impact on the net asset values of the Funds and are designed to present each Fund’s capital accounts on a tax basis.
(g) Federal Income Taxes: It is each Fund’s policy to comply with the requirements of the Internal Revenue Code Subchapter M applicable to regulated investment companies and to distribute all of its taxable income to its shareholders. Provided that the Funds maintain such compliance, no federal income tax provision is required. Each Fund is treated as a separate entity for the purpose of determining such compliance.
Financial Accounting Standards Board Accounting Standards Codification 740 — Income Taxes (“ASC 740”) requires the Funds to measure and recognize in their financial statements the benefit of a tax position taken (or expected to be taken) on an income tax return if such position will more likely than not be sustained upon examination based on the technical merits of the position. No tax years are currently under investigation. The Funds file income tax returns in the U.S. Federal jurisdiction, as well as the New York State and New York City jurisdictions. The statute of limitations on the Fund’s tax returns remains open for the tax years 2007-2011. Management does not believe there are any uncertain tax positions that require recognition of a tax liability.
(h) Allocation Methods: The Trust accounts separately for the assets, liabilities and operations of each Fund. Expenses directly attributable to each Fund are charged to that
57
THE ALGER INSTITUTIONAL FUNDS
NOTES TO FINANCIAL STATEMENTS (Unaudited) (Continued)
Fund’s operations; expenses which are applicable to all Funds are allocated among them based on net assets. Income, realized and unrealized gains and losses, and expenses of each Fund are allocated among the Fund’s classes based on relative net assets, with the exception of distribution fees and transfer agency fees.
(i) Estimates: These financial statements have been prepared in accordance with accounting principles generally accepted in the United States of America, which require using estimates and assumptions that affect the reported amounts therein. Actual results may differ from those estimates. These unaudited interim financial statements reflect all adjustments which are, in the opinion of management, necessary to a present a fair statement of results for the interim period. All such adjustments are of a normal recurring nature.
NOTE 3 — Investment Advisory Fees and Other Transactions with Affiliates:
(a) Investment Advisory and Administration Fees: Fees incurred by each Fund, pursuant to the provisions of its Investment Advisory Agreement and its Administration Agreement with Fred Alger Management, Inc. (“Alger Management” or the “Manager”), are payable monthly and computed based on the value of the average daily net assets of each Fund, at the following rates:
| | ADVISORY
FEE | | ADMINISTRATION
FEE |
Alger Capital Appreciation Institutional Fund | | .81% | | .0275% |
Alger Large Cap Growth Institutional Fund | | .71 | | .0275 |
Alger Mid Cap Growth Institutional Fund | | .76 | | .0275 |
Alger Small Cap Growth Institutional Fund | | .81 | | .0275 |
(b) Distribution Fees: Class R Shares: The Trust has adopted a Distribution Plan pursuant to which Class R shares of each Fund pay Fred Alger & Company, Incorporated, the Trust’s distributor (the “Distributor” or “Alger Inc.”) and an affiliate of Alger Management, a fee at the annual rate of 0.50% of the respective average daily net assets of the Class R shares of the designated Fund to compensate the Distributor for its activities and expenses incurred in distributing the Class R shares. The fees charged may be more or less than the expenses incurred by the Distributor.
(c) Brokerage Commissions: During the six months ended April 30, 2012, the Alger Capital Appreciation Institutional Fund, Alger Large Cap Growth Institutional Fund, Alger Mid Cap Growth Institutional Fund and Alger Small Cap Growth Institutional Fund paid Alger Inc. commissions of $752,415, $10,402, $334,825 and $460,350, respectively, in connection with securities transactions.
(d) Shareholder Administrative Fees: The Trust has entered into a shareholder administrative services agreement with Alger Management to compensate Alger Management for its liaison and administrative oversight of Boston Financial Data Services, Inc., the transfer agent, and other related services. The Fund compensate Alger Management at the annual rate of 0.01% of their average daily net assets for these services. During the six months ended April 30, 2012, the Alger Capital Appreciation Institutional Fund, Alger Large Cap
58
THE ALGER INSTITUTIONAL FUNDS
NOTES TO FINANCIAL STATEMENTS (Unaudited) (Continued)
Growth Institutional Fund, Alger Mid Cap Growth Institutional Fund and Alger Small Cap Growth Institutional Fund incurred fees of $70,628, $1,067, $16,197 and $58,659, respectively, for these services provided by Alger Management, which are included in the transfer agent fees and expenses in the Statement of Operations.
Alger Management makes payments to intermediaries that provide sub-accounting services to omnibus accounts held by the Funds. A portion of the fees paid by Alger Management to intermediaries that provide sub-accounting services are charged back to the appropriate Fund, subject to certain limitations, as approved by the Trust’s Board of Trustees. For the six months ended April 30, 2012, Alger Management charged back to the Alger Capital Appreciation Institutional Fund, Alger Large Cap Growth Institutional Fund, Alger Mid Cap Growth Institutional Fund, and Alger Small Cap Growth Institutional Fund, $13,993, $3,603, $34,972 and $37,003, respectively, for these services, which are included in the transfer agent fees and expenses in the Statements of Operations.
(e) Shareholder Servicing Fees: The Trust has entered into a shareholder servicing agreement with Alger Inc. whereby Alger Inc. provides the Trust with ongoing servicing of shareholder accounts. As compensation for such services, each Fund pays Alger Inc. a monthly fee at an annual rate of 0.25% of the value of its average daily net assets. The fees charged may be more or less than the expenses incurred by the Distributor.
(f) Trustee Fees: Each Fund pays each trustee who is not affiliated with Alger Management or its affiliates $750 for each meeting attended, to a maximum of $3,000 per annum, plus travel expenses incurred for attending the meeting. The Chairman of the Board of Trustees receives an additional annual fee of $15,000 which is paid, pro rata, by all funds managed by Alger Management. Additionally, each member of a Fund’s audit committee receives an additional $75 from the Fund for each audit committee meeting attended, to a maximum of $300 per annum.
(g) Interfund Loans: The Funds, along with other funds advised by Alger Management, may borrow money from and lend money to each other for temporary or emergency purposes. To the extent permitted under its investment restrictions, each fund may lend uninvested cash in an amount up to 15% of its net assets to other funds. If a fund has borrowed from other funds and has aggregate borrowings from all sources that exceed 10% of the fund’s total assets, such fund will secure all of its loans from other funds. The interest rate charged on interfund loans is equal to the average of the overnight time deposit rate and bank loan rate available to the funds.
During the six months ended April 30, 2012, Alger Mid Cap Growth Institutional Fund and Alger Small Cap Growth Institutional Fund incurred interest expense of $1,437 and $1,181, respectively, in connection with interfund loans.
(h) Other Transactions With Affiliates: Certain officers of the Trust are directors and officers of Alger Management and the Distributor.
59
THE ALGER INSTITUTIONAL FUNDS
NOTES TO FINANCIAL STATEMENTS (Unaudited) (Continued)
NOTE 4 — Securities Transactions:
The following summarizes the securities transactions by the Funds, other than U.S. Government and short-term securities, for the six months ended April 30, 2012:
| | PURCHASES | | SALES | |
Alger Capital Appreciation Institutional Fund | | $ | 1,080,715,706 | | $ | 894,739,452 | |
Alger Large Cap Growth Institutional Fund | | 14,276,021 | | 15,749,700 | |
Alger Mid Cap Growth Institutional Fund | | 351,440,148 | | 418,981,723 | |
Alger Small Cap Growth Institutional Fund | | 356,254,278 | | 501,640,147 | |
| | | | | | | |
Written call and put options activity for the six months ended April 30, 2012, was as follows:
| | NUMBER OF
CONTRACTS | | PREMIUMS
RECEIVED | |
Alger Mid Cap Growth Institutional Fund | | | | | |
Call Options outstanding at October 31, 2011 | | 463 | | $ | 135,583 | |
Call Options written | | 1,425 | | 312,857 | |
Call Options closed | | (178 | ) | (19,817 | ) |
Call Options expired | | (1,079 | ) | (227,550 | ) |
Call Options exercised | | (369 | ) | (135,064 | ) |
Call Options outstanding at April 30, 2012 | | 262 | | $ | 66,009 | |
| | NUMBER OF
CONTRACTS | | PREMIUMS
RECEIVED | |
Alger Mid Cap Growth Institutional Fund | | | | | |
Put Options outstanding at October 31, 2011 | | 1,293 | | $ | 329,563 | |
Put Options written | | 651 | | 184,235 | |
Put Options closed | | (168 | ) | (60,133 | ) |
Put Options expired | | (783 | ) | (225,609 | ) |
Put Options exercised | | (710 | ) | (158,788 | ) |
Put Options outstanding at April 30, 2012 | | 283 | | $ | 69,268 | |
As of April 30, 2012, Alger Mid Cap Growth Institutional Fund had portfolio securities and cash valued at $2,566,308, segregated as collateral for written options.
NOTE 5 — Borrowings:
The Funds may borrow from their custodian on an uncommitted basis. Each Fund pays the custodian a market rate of interest, generally based upon the London Interbank Offered Rate. The Funds may also borrow from other funds advised by Alger Management, as discussed in Note 3(g). For the six months ended April 30, 2012, the Funds had the following borrowings:
60
THE ALGER INSTITUTIONAL FUNDS
NOTES TO FINANCIAL STATEMENTS (Unaudited) (Continued)
| | AVERAGE DAILY
BORROWING | | WEIGHTED AVERAGE
INTEREST RATE | |
Alger Mid Cap Growth Institutional Fund | | $ | 261,353 | | 1.18 | % |
Alger Small Cap Growth Institutional Fund | | 207,692 | | 1.12 | |
| | | | | | |
The highest amount borrowed during the six months ended April 30, 2012 for each Fund was as follows:
| | HIGHEST BORROWING | |
Alger Mid Cap Growth Institutional Fund | | $ | 13,000,000 | |
Alger Small Cap Growth Institutional Fund | | 1,260,000 | |
| | | | |
NOTE 6 — Share Capital:
The Trust has an unlimited number of authorized shares of beneficial interest of $.001 par value which are presently divided into four series. Each series is divided into two separate classes. The transactions of shares of beneficial interest were as follows:
| | FOR THE SIX MONTHS ENDED
APRIL 30, 2012 | | FOR THE YEAR ENDED
OCTOBER 31, 2011 | |
| | SHARES | | AMOUNT | | SHARES | | AMOUNT | |
Alger Capital Appreciation Institutional Fund | | | | | | | | | |
Class I: | | | | | | | | | |
Shares sold | | 13,929,562 | | $ | 301,078,731 | | 20,110,824 | | $ | 421,647,062 | |
Dividends reinvested | | 1,899,304 | | 37,169,382 | | — | | — | |
Shares redeemed | | (6,953,526 | ) | (147,540,987 | ) | (12,211,244 | ) | (256,765,961 | ) |
Net increase | | 8,875,340 | | $ | 190,707,126 | | 7,899,580 | | $ | 164,881,101 | |
Class R: | | | | | | | | | |
Shares sold | | 4,537,607 | | $ | 93,110,804 | | 4,952,676 | | $ | 100,314,955 | |
Dividends reinvested | | 434,479 | | 8,133,448 | | — | | — | |
Shares redeemed | | (1,422,577 | ) | (29,000,128 | ) | (2,822,040 | ) | (57,122,489 | ) |
Net increase | | 3,549,509 | | $ | 72,244,124 | | 2,130,636 | | $ | 43,192,466 | |
| | | | | | | | | |
Alger Large Cap Growth Institutional Fund | | | | | | | | | |
Class I: | | | | | | | | | |
Shares sold | | 263,930 | | $ | 3,814,850 | | 601,991 | | $ | 8,363,658 | |
Dividends reinvested | | — | | — | | 6,139 | | 83,370 | |
Shares redeemed | | (328,573 | ) | (4,683,195 | ) | (1,186,020 | ) | (16,345,962 | ) |
Net decrease | | (64,643 | ) | $ | (868,345 | ) | (577,890 | ) | $ | (7,898,934 | ) |
Class R: | | | | | | | | | |
Shares sold | | 82,245 | | $ | 1,140,395 | | 125,947 | | $ | 1,662,036 | |
Dividends reinvested | | — | | — | | 117 | | 1,538 | |
Shares redeemed | | (165,276 | ) | (2,296,813 | ) | (196,843 | ) | (2,642,080 | ) |
Net decrease | | (83,031 | ) | $ | (1,156,418 | ) | (70,779 | ) | $ | (978,506 | ) |
61
THE ALGER INSTITUTIONAL FUNDS
NOTES TO FINANCIAL STATEMENTS (Unaudited) (Continued)
| | FOR THE SIX MONTHS ENDED
APRIL 30, 2012 | | FOR THE YEAR ENDED
OCTOBER 31, 2011 | |
| | SHARES | | AMOUNT | | SHARES | | AMOUNT | |
Alger Mid Cap Growth Institutional Fund | | | | | | | | | |
Class I: | | | | | | | | | |
Shares sold | | 2,110,415 | | $ | 29,283,034 | | 9,162,719 | | $ | 132,880,088 | |
Dividends reinvested | | — | | — | | 104,528 | | 1,490,566 | |
Shares redeemed | | (7,231,960 | ) | (100,866,346 | ) | (41,941,828 | ) | (613,811,578 | ) |
Net decrease | | (5,121,545 | ) | $ | (71,583,312 | ) | (32,674,581 | ) | $ | (479,440,924 | ) |
Class R: | | | | | | | | | |
Shares sold | | 375,126 | | $ | 4,971,902 | | 1,103,541 | | $ | 15,171,863 | |
Shares redeemed | | (827,908 | ) | (10,966,968 | ) | (2,392,797 | ) | (32,661,440 | ) |
Net decrease | | (452,782 | ) | $ | (5,995,066 | ) | (1,289,256 | ) | $ | (17,489,577 | ) |
| | | | | | | | | |
Alger Small Cap Growth Institutional Fund | | | | | | | | | |
Class I: | | | | | | | | | |
Shares sold | | 4,778,646 | | $ | 132,396,591 | | 16,073,601 | | $ | 446,521,164 | |
Dividends reinvested | | 1,691,801 | | 43,496,198 | | — | | — | |
Shares redeemed | | (9,468,179 | ) | (262,798,856 | ) | (18,288,847 | ) | (508,354,637 | ) |
Net decrease | | (2,997,732 | ) | $ | (86,906,067 | ) | (2,215,246 | ) | $ | (61,833,473 | ) |
Class R: | | | | | | | | | |
Shares sold | | 203,730 | | $ | 5,432,291 | | 650,452 | | $ | 17,559,906 | |
Dividends reinvested | | 97,573 | | 2,402,238 | | — | | — | |
Shares redeemed | | (478,916 | ) | (12,626,269 | ) | (1,039,917 | ) | (28,120,303 | ) |
Net decrease | | (177,613 | ) | $ | (4,791,740 | ) | (389,465 | ) | $ | (10,560,397 | ) |
NOTE 7 — Income Tax Information:
At October 31, 2011, the Funds, for federal income tax purposes, had capital loss carryforwards which expire as set forth in the table below. These amounts may be applied against future net realized gains until the earlier of their utilization or expiration.
Expiration Dates | | Alger Capital
Appreciation
Institutional Fund | | Alger Large Cap
Growth
Institutional Fund | | Alger Mid Cap
Growth
Institutional Fund | | Alger Small Cap
Growth
Institutional Fund | |
2016 | | — | | $ | 5,521,428 | | $ | 18,359,838 | | — | |
2017 | | — | | 4,214,883 | | 322,038,630 | | — | |
Total | | — | | $ | 9,736,311 | | $ | 340,398,468 | | — | |
Under the recently enacted Regulated Investment Company Modernization Act of 2010, capital losses incurred by the Funds after October 31, 2011 will not be subject to expiration. In addition, losses incurred after October 31, 2011 must be utilized prior to the utilization of capital loss carryforwards above.
The difference between book-basis and tax-basis unrealized appreciation (depreciation) is determined annually and is attributable primarily to the tax deferral of losses on wash sales, the tax treatment of premium/discount on debt securities, the tax treatment of partnerships investments, the realization of unrealized appreciation of Passive Foreign Investment Companies, and return of capital from Real Estate Investment Trust investments.
62
THE ALGER INSTITUTIONAL FUNDS
NOTES TO FINANCIAL STATEMENTS (Unaudited) (Continued)
NOTE 8 — Fair Value Measurements:
The major categories of securities and their respective fair value inputs are detailed in each Fund’s Schedule of Investments. The following is a summary of the inputs used as of April 30, 2012 in valuing the Funds’ investments carried at fair value on a recurring basis. Based upon the nature, characteristics, and risks associated with their investments, the Funds have determined that presenting them by security type and sector is appropriate.
Alger Capital Appreciation Institutional
Fund | | TOTAL FUND | | LEVEL 1 | | LEVEL 2 | | LEVEL 3 | |
COMMON STOCKS | | | | | | | | | |
Consumer Discretionary | | $ | 306,310,675 | | $ | 306,310,675 | | — | | — | |
Consumer Staples | | 105,149,292 | | 105,149,292 | | — | | — | |
Energy | | 140,988,893 | | 140,988,893 | | — | | — | |
Financials | | 109,477,260 | | 109,477,260 | | — | | — | |
Health Care | | 162,644,567 | | 162,644,567 | | — | | — | |
Industrials | | 249,321,628 | | 249,321,628 | | — | | — | |
Information Technology | | 414,286,644 | | 414,286,644 | | — | | — | |
Materials | | 66,415,167 | | 66,415,167 | | — | | — | |
Telecommunication Services | | 23,472,284 | | 23,472,284 | | — | | — | |
TOTAL COMMON STOCKS | | $ | 1,578,066,410 | | $ | 1,578,066,410 | | — | | — | |
CONVERTIBLE CORPORATE BONDS | | | | | | | | | |
Consumer Discretionary | | $ | 2,772,323 | | — | | $ | 2,772,323 | | — | |
CONVERTIBLE PREFERRED STOCK | | | | | | | | | |
Health Care | | $ | 3,647,859 | | — | | $ | 3,647,859 | | — | |
MASTER LIMITED PARTNERSHIP | | | | | | | | | |
Energy | | $ | 6,251,259 | | $ | 6,251,259 | | — | | — | |
Financials | | 9,490,644 | | 9,490,644 | | — | | — | |
TOTAL MASTER LIMITED PARTNERSHIP | | $ | 15,741,903 | | $ | 15,741,903 | | — | | — | |
TOTAL INVESTMENTS IN SECURITIES | | $ | 1,600,228,495 | | $ | 1,593,808,313 | | $ | 6,420,182 | | — | |
Alger Large Cap Growth Institutional
Fund | | TOTAL FUND | | LEVEL 1 | | LEVEL 2 | | LEVEL 3 | |
COMMON STOCKS | | | | | | | | | |
Consumer Discretionary | | $ | 4,183,491 | | $ | 4,183,491 | | — | | — | |
Consumer Staples | | 1,293,642 | | 1,293,642 | | — | | — | |
Energy | | 2,182,343 | | 2,182,343 | | — | | — | |
Financials | | 478,786 | | 478,786 | | — | | — | |
Health Care | | 2,179,248 | | 2,179,248 | | — | | — | |
Industrials | | 3,037,417 | | 3,037,417 | | — | | — | |
Information Technology | | 6,359,901 | | 6,359,901 | | — | | — | |
Materials | | 819,626 | | 819,626 | | — | | — | |
TOTAL COMMON STOCKS | | $ | 20,534,454 | | $ | 20,534,454 | | — | | — | |
MASTER LIMITED PARTNERSHIP | | | | | | | | | |
Financials | | $ | 218,153 | | $ | 218,153 | | — | | — | |
TOTAL INVESTMENTS IN SECURITIES | | $ | 20,752,607 | | $ | 20,752,607 | | — | | — | |
63
THE ALGER INSTITUTIONAL FUNDS
NOTES TO FINANCIAL STATEMENTS (Unaudited) (Continued)
Alger Mid Cap Growth Institutional
Fund | | TOTAL FUND | | LEVEL 1 | | LEVEL 2 | | LEVEL 3 | |
COMMON STOCKS | | | | | | | | | |
Consumer Discretionary | | $ | 70,621,174 | | $ | 69,056,800 | | $ | 1,564,374 | | — | |
Consumer Staples | | 3,844,822 | | 3,844,822 | | — | | — | |
Energy | | 32,501,562 | | 32,501,562 | | — | | — | |
Financials | | 24,830,141 | | 24,830,141 | | — | | — | |
Health Care | | 22,986,752 | | 22,986,752 | | — | | — | |
Industrials | | 48,192,566 | | 48,192,566 | | — | | — | |
Information Technology | | 52,479,952 | | 52,479,952 | | — | | — | |
Materials | | 21,832,800 | | 21,832,800 | | — | | — | |
Telecommunication Services | | 5,524,472 | | 5,524,472 | | — | | — | |
TOTAL COMMON STOCKS | | $ | 282,814,241 | | $ | 281,249,867 | | $ | 1,564,374 | | — | |
CONVERTIBLE PREFERRED STOCK | | | | | | | | | |
Health Care | | $ | 11,132,899 | | — | | $ | 11,132,899 | | — | |
PURCHASED OPTIONS | | | | | | | | | |
Energy | | $ | 2,535 | | $ | 2,535 | | — | | — | |
MASTER LIMITED PARTNERSHIP | | | | | | | | | |
Financials | | $ | 3,768,628 | | $ | 3,768,628 | | — | | — | |
TOTAL INVESTMENTS IN SECURITIES | | $ | 297,718,303 | | $ | 285,021,030 | | $ | 12,697,273 | | — | |
SECURITIES SOLD SHORT | | | | | | | | | |
OPTIONS WRITTEN | | | | | | | | | |
Energy | | $ | 101,817 | | $ | 101,817 | | — | | — | |
Industrials | | $ | 10,780 | | $ | 10,780 | | — | | — | |
Materials | | 18,011 | | 18,011 | | — | | — | |
TOTAL OPTIONS WRITTEN | | $ | 130,608 | | $ | 130,608 | | — | | — | |
Alger Small Cap Growth Institutional
Fund | | TOTAL FUND | | LEVEL 1 | | LEVEL 2 | | LEVEL 3 | |
COMMON STOCKS | | | | | | | | | |
Consumer Discretionary | | $ | 181,963,381 | | $ | 181,963,381 | | — | | — | |
Consumer Staples | | 31,126,683 | | 31,126,683 | | — | | — | |
Energy | | 89,460,166 | | 89,460,166 | | — | | — | |
Financials | | 84,673,421 | | 84,673,421 | | — | | — | |
Health Care | | 203,417,947 | | 203,417,947 | | — | | — | |
Industrials | | 182,067,728 | | 182,067,728 | | — | | — | |
Information Technology | | 294,324,720 | | 294,324,720 | | — | | — | |
Materials | | 52,864,989 | | 52,864,989 | | — | | — | |
Utilities | | 13,585,322 | | 13,585,322 | | — | | — | |
TOTAL COMMON STOCKS | | $ | 1,133,484,357 | | $ | 1,133,484,357 | | — | | — | |
MASTER LIMITED PARTNERSHIP | | | | | | | | | |
Financials | | $ | 5,900,735 | | $ | 5,900,735 | | — | | — | |
TOTAL INVESTMENTS IN SECURITIES | | $ | 1,139,385,092 | | $ | 1,139,385,092 | | — | | — | |
64
THE ALGER INSTITUTIONAL FUNDS
NOTES TO FINANCIAL STATEMENTS (Unaudited) (Continued)
| | FAIR VALUE
MEASUREMENTS
USING SIGNIFICANT
UNOBSERVABLE
INPUTS (LEVEL3) | |
Alger Capital Appreciation Institutional Fund | | Convertible
Preferred Stock | |
Opening balance at November 1, 2011 | | $ | 3,475,570 | |
Transfers into Level 3 | | — | |
Transfers out of Level 3(i) | | (3,647,859 | ) |
Total gains or losses | | | |
Included in net realized gain (loss) on investments | | — | |
Included in net unrealized gain (loss) on investments | | 172,289 | |
Purchases, issuances, sales, and settlements | | | |
Purchases | | $ | — | |
Issuances | | — | |
Sales | | — | |
Settlements | | — | |
Closing balance at April 30, 2012 | | — | |
The amount of total gains or losses for the period included in net realized and unrealized gain (loss) attributable to change in unrealized appreciation (depreciation) relating to investments still held at April 30, 2012 | | $ | — | |
Alger Mid Cap Growth Institutional Fund | | Convertible
Preferred Stock | |
Opening balance at November 1, 2011 | | $ | 10,607,090 | |
Transfers into Level 3 | | — | |
Transfers out of Level 3(i) | | (11,132,899 | ) |
Total gains or losses | | | |
Included in net realized gain (loss) on investments | | — | |
Included in net unrealized gain (loss) on investments | | 525,809 | |
Purchases, issuances, sales, and settlements | | | |
Purchases | | — | |
Issuances | | — | |
Sales | | — | |
Settlements | | — | |
Closing balance at April 30, 2012 | | — | |
The amount of total gains or losses for the period included in net realized and unrealized gain (loss) attributable to change in unrealized appreciation (depreciation) relating to investments still held at April 30, 2012 | | $ | — | |
(i) Securities transferred out of Level 3 upon closing of IPO and commencement of trading.
On April 30, 2012 the Alger Capital Appreciation Institutional Fund and the Alger Mid Cap Growth Institutional Fund transferred securities totaling $7,059,840 and $6,182,788, respectively, from Level 2 to Level 1, utilizing exchange listed prices rather than fair value adjusted prices.
NOTE 9 — Derivatives:
Financial Accounting Standards Board Accounting Standards Codification 815 — Derivatives and Hedging (“ASC 815”) requires qualitative disclosures about objectives
65
THE ALGER INSTITUTIONAL FUNDS
NOTES TO FINANCIAL STATEMENTS (Unaudited) (Continued)
and strategies for using derivatives, quantitative disclosures about fair value amounts of and gains and losses on derivative instruments, and disclosures about credit-risk-related contingent features in derivative agreements.
Forward currency contracts—In connection with portfolio purchases and sales of securities denominated in foreign currencies, the Funds may enter into forward currency contracts. Additionally, each Fund may enter into such contracts to economically hedge certain other foreign currency denominated investments. These contracts are valued at the current cost of covering or offsetting such contracts, and the related realized and unrealized foreign exchange gains and losses are included in the statement of operations. In the event that counterparties fail to settle these currency contracts or the related foreign security trades, a Fund could be exposed to foreign currency fluctuations.
Options—The Funds seek to capture the majority of the returns associated with equity market investments. To meet this investment goal, the Funds invest in a broadly diversified portfolio of common stocks, while also buying and selling call and put options on equities and equity indices. The Funds purchase call options to increase their exposure to stock market risk and also provide diversification of risk. The Funds purchase put options in order to protect from significant market declines that may occur over a short period of time. The Funds will write covered call and cash secured put options to generate cash flows while reducing the volatility of the Funds’ portfolios. The cash flows may be an important source of the Funds’ returns, although written call options may reduce the Funds’ ability to profit from increases in the value of the underlying security or equity portfolio. The value of a call option generally increases as the price of the underlying stock increases and decreases as the stock decreases in price. Conversely, the value of a put option generally increases as the price of the underlying stock decreases and decreases as the stock increases in price. The combination of the diversified stock portfolio and the purchase and sale of options is intended to provide the Funds with the majority of the returns associated with equity market investments but with reduced volatility and returns that are augmented with the cash flows from the sale of options. During the six months ended April 30, 2012, options were used in accordance with these objectives.
The fair values of derivative instruments as of April 30, 2012 are as follows:
Alger Mid Cap Growth Institutional Fund
| | ASSET DERIVATIVES 2012 | | LIABILITY DERIVATIVES 2012 | |
Derivatives not accounted
for as hedging instruments | | Balance Sheet
Location | | Fair Value | | Balance Sheet
Location | | Fair Value | |
Purchased Put Options | | Investments in Securities, at value | | $ | 910 | | | | | |
Purchased Call Options | | Investments in Securities, at value | | 1,625 | | | | | |
Written Put Options | | — | | — | | Written options outstanding, at value | | $ | 56,678 | |
Written Call Options | | — | | — | | Written options outstanding, at value | | 73,930 | |
Total | | | | $ | 2,535 | | | | $ | 130,608 | |
66
THE ALGER INSTITUTIONAL FUNDS
NOTES TO FINANCIAL STATEMENTS (Unaudited) (Continued)
For the six months ended April 30, 2012, Alger Mid Cap Growth Institutional Fund had option purchases of $668,002 and option sales of $1,454,610. The effect of derivative instruments on the Statement of Operations for the six months ended April 30, 2012 is as follows:
NET REALIZED GAIN ON INVESTMENTS AND OPTIONS
Alger Mid Cap Growth Institutional Fund
Derivatives not accounted for as hedging instruments | | Options | |
Purchased Options | | $ | (1,930,164 | ) |
Written Options | | 756,483 | |
Total | | $ | (1,173,681 | ) |
NET CHANGE IN UNREALIZED APPRECIATION (DEPRECIATION) ON INVESTMENTS, OPTIONS
Alger Mid Cap Growth Institutional Fund
Derivatives not accounted for as hedging instruments under Statement | | Options | |
Purchased Options | | $ | 1,048,084 | |
Written Options | | 116,608 | |
Total | | $ | 1,164,692 | |
NOTE 10 — Litigation:
On August 31, 2005, the West Virginia Securities Commissioner (the “WVSC”), in an ex parte Summary Order to Cease and Desist and Notice of Right to Hearing, concluded that the Manager and the Distributor had violated the West Virginia Uniform Securities Act (the “WVUSA”), and ordered the Manager and the Distributor to cease and desist from further violations of the WVUSA by engaging in the market-timing-related conduct described in the order. The ex parte order provided notice of their right to a hearing with respect to the violations of law asserted by the WVSC. Other firms unaffiliated with the Manager were served with similar orders. The Manager and the Distributor intend to request a hearing for the purpose of seeking to vacate or modify the order.
NOTE 11 — Recent Accounting Pronouncements:
In December 2011, the FASB issued ASU 2011-11, Balance Sheet (Topic 210): Disclosures about Offsetting Assets and Liabilities (“ASU 2011-11”), which provides guidance regarding balance sheet offsetting disclosures. The amendments in ASU 2011-11 require an entity to disclose information about offsetting and related arrangements to enable users of its financial statements to understand the effects of those arrangements on its financial position. Entities are required to disclose gross information and net information about both instruments and transactions eligible for offset in the statement of
67
THE ALGER INSTITUTIONAL FUNDS
NOTES TO FINANCIAL STATEMENTS (Unaudited) (Continued)
assets and liabilities and transactions subject to an agreement similar to a master netting arrangement. The objective of ASU 2011-11 is to facilitate comparison between those entities that prepare their financial statements on the basis of GAAP and those entities that prepare their financial statements on the basis of IFRS. The new guidance is effective for annual reporting periods beginning on or after January 1, 2013. The Fund does not believe that this will have a material impact on the financial statements.
NOTE 12 — Subsequent Events:
Management of each Fund has evaluated events that have occurred subsequent to April 30, 2012. No such events have been identified which require recognition and disclosure.
68
THE ALGER INSTITUTIONAL FUNDS
ADDITIONAL INFORMATION (Unaudited)
Expense Example
As a shareholder of a Fund, you incur two types of costs: transaction costs, if applicable, including sales charges (loads) and redemption fees; and ongoing costs, including management fees, distribution (12b-1) fees, if applicable, and other fund expenses. This example is intended to help you understand your ongoing costs (in dollars) of investing in the Fund and to compare these costs with the ongoing costs of investing in other mutual funds.
The example below is based on an investment of $1,000 invested at the beginning of the six-month period starting November 1, 2011 and ending April 30, 2012.
Actual Expenses
The first line for each class of shares in the table below provides information about actual account values and actual expenses. You may use the information in this line, together with the amount you invested, to estimate the expenses that you would have paid over the period. Simply divide your account value by $1,000 (for example, an $8,600 account value divided by $1,000 = 8.6), then multiply the result by the number in the first line under the heading entitled “Expenses Paid During the Period” to estimate the expenses you paid on your account during this period.
Hypothetical Example for Comparison Purposes
The second line for each class of shares in the table below provides information about hypothetical account values and hypothetical expenses based on the Fund’s actual expense ratios for each class of shares and an assumed rate of return of 5% per year before expenses, which is not the Fund’s actual return. The hypothetical account values and expenses may not be used to estimate the actual ending account balance or expenses you paid for the period. You may use this information to compare the ongoing costs of investing in the Fund and other funds. To do so, compare this 5% hypothetical example with the 5% hypothetical examples that appear in the shareholder reports of other funds.
Please note that the expenses shown in the table are meant to highlight your ongoing costs only and do not reflect any transaction costs, such as sales charges (loads) and redemption fees. Therefore, the second line under each class of shares in the table is useful in comparing ongoing costs only, and will not help you determine the relative total costs of owning different funds. In addition, if these transactional costs were included, your costs would have been higher.
69
| | Beginning
Account
Value
November 1, 2011 | | Ending
Account
Value
April 30, 2012 | | Expenses
Paid During
the Six Months
Ended
April 30, 2012(a) | | Ratio of
Expenses to
Average
Net Assets
For the
Six Months
Ended
April 30, 2012(b) | |
Alger Capital Appreciation Institutional Fund | | | | | | | | | |
Class I | Actual | | $ | 1,000.00 | | $ | 1,136.34 | | $ | 6.20 | | 1.17 | % |
| Hypothetical(c) | | 1,000.00 | | 1,019.06 | | 5.86 | | 1.17 | |
Class R | Actual | | 1,000.00 | | 1,133.68 | | 8.87 | | 1.67 | |
| Hypothetical(c) | | 1,000.00 | | 1,016.55 | | 8.39 | | 1.67 | |
| | | | | | | | | | |
Alger Large Cap Growth Institutional Fund | | | | | | | | | |
Class I | Actual | | $ | 1,000.00 | | $ | 1,106.18 | | $ | 9.18 | | 1.75 | % |
| Hypothetical(c) | | 1,000.00 | | 1,016.15 | | 8.79 | | 1.75 | |
Class R | Actual | | 1,000.00 | | 1,102.41 | | 12.92 | | 2.47 | |
| Hypothetical(c) | | 1,000.00 | | 1,012.57 | | 12.37 | | 2.47 | |
| | | | | | | | | | |
Alger Mid Cap Growth Institutional Fund | | | | | | | | | |
Class I | Actual | | $ | 1,000.00 | | $ | 1,113.99 | | $ | 6.07 | | 1.15 | % |
| Hypothetical(c) | | 1,000.00 | | 1,019.13 | | 5.79 | | 1.15 | |
Class R | Actual | | 1,000.00 | | 1,111.28 | | 8.91 | | 1.70 | |
| Hypothetical(c) | | 1,000.00 | | 1,016.43 | | 8.51 | | 1.70 | |
| | | | | | | | | | |
Alger Small Cap Growth Institutional Fund | | | | | | | | | |
Class I | Actual | | $ | 1,000.00 | | $ | 1,121.45 | | $ | 6.26 | | 1.19 | % |
| Hypothetical(c) | | 1,000.00 | | 1,018.96 | | 5.96 | | 1.19 | |
Class R | Actual | | 1,000.00 | | 1,118.70 | | 8.93 | | 1.70 | |
| Hypothetical(c) | | 1,000.00 | | 1,016.43 | | 8.50 | | 1.70 | |
(a) Expenses are equal to the annualized expense ratio of the respective share class, multiplied by the average account value over the period, multiplied by 182/366 (to reflect the one-half year period).
(b) Annualized.
(c) 5% annual return before expenses.
70
Privacy Policy
U.S. Consumer Privacy Notice Rev. 01/2011 3/31/11
FACTS | | WHAT DOES ALGER DO WITH YOUR PERSONAL INFORMATION? |
| | |
Why? | | Financial companies choose how they share your personal information, which, under Federal law, means personally identifiable information. Federal law gives consumers the right to limit some but not all sharing. Federal law also requires us to tell you how we collect, share, and protect your personal information. Please read this notice carefully to understand what we do. |
| | |
What? | | The types of personal information we collect and share depend on the product or service you have with us. This information can include: · Social Security number · account balances, transaction history and credit information |
| | |
How? | | All financial companies need to share customers’ personal information to run their everyday business. In the section below, we list the reasons financial companies can share their customers’ personal information; the reasons Alger chooses to share; and whether you can limit this sharing. |
Reasons we can share your personal
information | | Does
Alger share? | | Can you limit
this sharing? |
| | | | |
For our everyday business purposes — such as to process your transactions, maintain your account(s), respond to court orders and legal investigations, or report to credit bureaus | | Yes | | No |
| | | | |
For our marketing purposes — with service providers we use to offer our products and services to you | | Yes | | No |
| | | | |
For joint marketing with other financial companies | | No | | We don’t share |
| | | | |
For our affiliates’ everyday business purposes—information about your transactions and experiences | | Yes | | No |
| | | | |
For our affiliates’ everyday business purposes—information about your creditworthiness | | No | | We don’t share |
| | | | |
For nonaffiliates to market to you — for all credit card accounts | | No | | We don’t share |
| | | | |
For nonaffiliates to market to you — for accounts and services endorsed by another organization | | No | | We don’t share |
| | | | |
For nonaffiliates to market to you — for accounts other than credit card accounts and Sponsored Accounts, such as insurance, investments, deposit and lending | | No | | We don’t share |
71
Who we are | | |
| | |
Who is providing this notice? | | Alger includes Fred Alger Management, Inc. and Fred Alger & Company, Incorporated as well as the following funds: The Alger Funds, The Alger Funds II, The Alger Institutional Funds, The Alger Portfolios, and Alger China-U.S. Growth Fund. |
What we do | | |
| | |
How does Alger protect my personal information? | | To protect your personal information from unauthorized access and use, we use security measures that comply with federal law. These measures include computer safeguards and secured files and buildings. For more information visit alger.com. |
| | |
How does Alger collect my personal information? | | We collect your personal information, for example, when you: · open an account or perform transactions · seek advice about your investments We also collect your personal information from others, such as credit bureaus, affiliates, or other companies. |
| | |
Why can’t I limit all sharing? | | Federal law gives you the right to limit some but not all sharing related to: · sharing for affiliates’ everyday business purposes — information about your creditworthiness · affiliates from using your information to market to you · sharing for nonaffiliates to market to you State laws and individual companies may give you additional rights to limit sharing. |
Definitions | | |
| | |
Affiliates | | Companies related by common ownership or control. They can be financial and nonfinancial companies. · Our affiliates include Fred Alger Management, Inc. and Fred Alger & Company, Incorporated as well as the following funds: The Alger Funds, The Alger Funds II, The Alger Institutional Funds, The Alger Portfolios, and Alger China-U.S. Growth Fund. |
| | |
Nonaffiliates | | Companies not related by common ownership or control. They can be financial and nonfinancial companies |
| | |
Joint marketing | | A formal agreement between nonaffiliated financial companies that together market financial products or services to you. |
72
Proxy Voting Policies
A description of the policies and procedures the Trust uses to determine how to vote proxies relating to portfolio securities and information regarding how the Funds voted proxies relating to portfolio securities during the most recent 12-month period ended June 30 are available, without charge, by calling (800) 992-3863 or online on the Funds’ website at www.alger.com or on the SEC’s website at www.sec.gov.
Fund Holdings
The Funds’ most recent month end portfolio holdings are available approximately sixty days after month end on the Funds’ website at www.alger.com. The Funds also file their complete schedule of portfolio holdings with the SEC for the first and third quarter of each fiscal year on Form N-Q. The Funds’ Forms N-Q are available online on the SEC’s website at www.sec.gov or may be reviewed and copied at the SEC’s Public Reference Room in Washington, D.C. Information regarding the operation of the SEC’s Public Reference Room may be obtained by calling 1-800-SEC-0330. A copy of the most recent quarterly holdings may also be obtained from the Funds by calling (800) 992-3863.
73
THE ALGER INSTITUTIONAL FUNDS
360 Park Avenue South
New York, NY 10010
(800) 992-3863
www.alger.com
Investment Manager
Fred Alger Management, Inc.
360 Park Avenue South
New York, NY 10010
Distributor
Fred Alger & Company, Incorporated
360 Park Avenue South
New York, NY 10010
Transfer Agent and Dividend Disbursing Agent
Boston Financial Data Services, Inc.
P.O. Box 8480
Boston, MA 02266
This report is submitted for the general information of the shareholders of The Alger Institutional Funds. It is not authorized for distribution to prospective investors unless accompanied by an effective Prospectus for the Trust, which contains information concerning the Trust’s investment policies, fees and expenses as well as other pertinent information.
(This page has been intentionally left blank.)
(This page has been intentionally left blank.)
(This page has been intentionally left blank.)

AIFSAR
ITEM 2. CODE OF ETHICS.
Not applicable.
ITEM 3. AUDIT COMMITTEE FINANCIAL EXPERT.
Not applicable.
ITEM 4. PRINCIPAL ACCOUNTANT FEES AND SERVICES.
Not applicable.
ITEM 5. AUDIT COMMITTEE OF LISTED REGISTRANTS.
Not applicable.
ITEM 6. INVESTMENTS.
Not applicable.
ITEM 7. DISCLOSURE OF PROXY VOTING POLICIES AND PROCEDURES FOR CLOSED-END MANAGEMENT INVESTMENT COMPANIES.
Not applicable.
ITEM 8. PORTFOLIO MANAGERS OF CLOSED-END MANAGEMENT INVESTMENT COMPANIES.
Not applicable.
ITEM 9. PURCHASES OF EQUITY SECURITIES BY CLOSED-END MANAGEMENT INVESTMENT COMPANY AND AFFILIATED PURCHASERS.
Not applicable.
ITEM 10. SUBMISSION OF MATTERS TO A VOTE OF SECURITY HOLDERS.
Not applicable.
ITEM 11. CONTROLS AND PROCEDURES.
(a) The Registrant’s principal executive officer and principal financial officer have concluded that the Registrant’s disclosure controls and procedures (as defined in Rule 30a-3(c) under the Investment Company Act of 1940, as amended) are effective based on their evaluation of the disclosure controls and procedures as of a date within 90 days of the filing date of this document.
(b) No changes in the Registrant’s internal control over financial reporting occurred during the Registrant’s second fiscal quarter of the period covered by this report that materially affected, or are reasonably likely to materially affect, the Registrant’s internal control over financial reporting.
ITEM 12. EXHIBITS.
(a) (1) Not applicable
(a) (2) Certifications of principal executive officer and principal financial officer as required by rule 30a-2(a) under the Investment Company Act of 1940 are attached as Exhibit 99.CERT
(a) (3) Not applicable
(b) Certifications of principal executive officer and principal financial officer as required by rule 30a-2(b) under the Investment Company Act of 1940 are attached as Exhibit 99.906CERT
SIGNATURES
Pursuant to the requirements of the Securities Exchange Act of 1934 and the Investment Company Act of 1940, the registrant has duly caused this report to be signed on its behalf by the undersigned, thereunto duly authorized.
The Alger Institutional Funds
By: | /s/Dan C. Chung | |
| |
| Dan C. Chung |
| |
| President |
Date: June 19, 2012
Pursuant to the requirements of the Securities Exchange Act of 1934 and the Investment Company Act of 1940, this report has been signed below by the following persons on behalf of the registrant and in the capacities and on the dates indicated.
By: | /s/Dan C. Chung | |
| |
| Dan C. Chung |
| |
| President |
Date: June 19, 2012
By: | /s/Michael D. Martins | |
| |
| Michael D. Martins |
| |
| Treasurer |
Date: June 19, 2012