| | OMB APPROVAL |
| | OMB Number: | 3235-0570 |
| | Expires: | August 31, 2011 |
| UNITED STATES | Estimated average burden hours per response. . . . . . . . . . . . . . . . 18.9 |
| SECURITIES AND EXCHANGE COMMISSION | |
| Washington, D.C. 20549 | |
| | | | |
FORM N-CSR
CERTIFIED SHAREHOLDER REPORT OF REGISTERED
MANAGEMENT INVESTMENT COMPANIES
Investment Company Act file number | 811-07986 |
|
The Alger Institutional Funds |
(Exact name of registrant as specified in charter) |
|
111 Fifth Avenue New York, New York | | 10003 |
(Address of principal executive offices) | | (Zip code) |
|
Mr. Hal Liebes Fred Alger Management, Inc. 111 Fifth Avenue New York, New York 10003 |
(Name and address of agent for service) |
|
Registrant’s telephone number, including area code: | 212-806-8800 | |
|
Date of fiscal year end: | October 31 | |
|
Date of reporting period: | April 30, 2009 | |
| | | | | | | | |
ITEM 1. REPORT(S) TO STOCKHOLDERS.
Alger Capital Appreciation Institutional Fund |Alger LargeCap Growth Institutional Fund | Alger MidCap Growth Institutional Fund | Alger SmallCap Growth Institutional Fund |
The Alger
Institutional Funds
| | 
|
| |
SEMI-ANNUAL REPORT | |
April 30, 2009 | |
(Unaudited) | |
Table of Contents | |
| |
THE ALGER INSTITUTIONAL FUNDS | |
| |
Letter to Our Shareholders | 1 |
| |
Fund Highlights | 9 |
| |
Portfolio Summary | 13 |
| |
Schedules of Investments | 14 |
| |
Statements of Assets and Liabilities | 38 |
| |
Statements of Operations | 40 |
| |
Statements of Changes in Net Assets | 42 |
| |
Financial Highlights | 44 |
| |
Notes to Financial Statements | 52 |
| |
Additional Information | 62 |
Go Paperless With Alger Electronic Delivery Service
Alger is pleased to provide you with the ability to access regulatory materials online. When documents such as prospectuses and annual and semi-annual reports are available, we’ll send you an e-mail notification with a convenient link that will take you directly to the fund information on our website. To sign up for this free service, simply enroll at www.icsdelivery.com/alger.
Dear Shareholders, | | May 25, 2009 |
We can look at the last six months as the melting away of an illusion; as a time when reality has come painfully back into play. Many philosophers built vast realms of study on the idea that misguided reason can twist reality into something that perhaps suits us in the moment but ultimately only serves to keep us in an illusory state—and, in our current case, wreak havoc on our economy and our confidence.
The housing and credit crises and ensuing financial breakdown began with an illusion based on flawed ideas held by many financial lenders and insurers: the latent belief that growth in the housing market would continue unhampered on its upward trajectory. Underlying the assumption of unimpeded growth was the idea that financial derivatives could not only provide the increase in debt necessary to support the financial system but also manage the associated risk. In the mid-2000s, the illusion grew as more and more lenders extended more and more credit to “subprime” borrowers who, if their circumstances declined, were less and less likely to be able to pay the loans back. Although the practice was based on a belief that growth would continue, experience has shown again and again that the upward trend of growth over time is much more jagged than we like to recall.
When the illusion disintegrated, not only did the borrowers suffer from foreclosures, but the resulting housing crisis created a massive ripple effect that crippled the U.S.’s major financial firms. Along with the weakening of the financial sector, so went credit availability, consumer spending, jobs, and, ultimately, consumer confidence. By the fourth quarter of 2008, the scale of the crisis had ceased to be solely “subprime”—it had gone global. Into the first quarter of 2009, the volatility continued with the Dow Jones Industrial Average(i) climbing as high as 9,034 points and falling as low as 6,547 points.
Toward the end of the first quarter and into the second quarter of the calendar year, economic indicators were struggling to recover. Retail sales fell 1.3% in March and a further 0.4% in April—a larger dip than expected. The Consumer Price Index declined 0.7% on an annual basis in April, only the second year-over-year decline in nearly 54 years following March’s 0.4% drop(ii). Industrial production decreased 0.5% in April after having fallen 1.7% in March(iii). And GDP for the first quarter of 2009 decreased 6.1% compared to the fourth quarter of 2008, which experienced a decline of 6.3%.
Europe did not fare much better. GDP fell 2.5% in the first quarter of 2009 versus the last quarter of 2008, which experienced a decline of 1.5%—the figures were for both the 16-country euro currency zone and the broader 27-country European Union bloc(iv). China is anticipated to fare less poorly, and although its export growth is expected to slow, the country is taking measures to focus on innovation rather than outright cost-efficiency.
Emerging from the Darkness
Plato famously dealt with illusion in what came to be called Plato’s Cave. He described people in a cave whose notion of reality was entirely comprised of shadows projected on a wall. Similarly, one could say that we were in such a cave, deceived by
1
the shadows of easy credit, with no real idea of the hows or whys of what we were seeing.
Now, however, we are beginning to see clearly where things unraveled. Actions are being taken by the Obama administration as well as the housing, financial, and automotive industries to stave off a repetition of the disaster; whether or not those actions will succeed remains to be seen.
What we do know is that, as of the date of this writing, some light has begun to shine in growth investing. In the first quarter, growth funds beat their value rivals by the largest margin in nine years. As of April 28, mid-cap growth funds were up 4.3%, small-cap growth funds were up 0.8%, and large-cap growth funds were up 2.6%, according to investment researcher Morningstar Inc.—a sign that investors are beginning to shed their aversion to risk and test the market.
Then and Now
Much has been made of the similarities between the current downturn and the Great Depression. During the “Roaring Twenties,” people were busy buying automobiles and appliances on credit and eagerly speculating in the stock market, feeding the illusion that the good times would continue to roll.
Then, like now, thought—in terms of easy credit and unimpeded growth—was divorced from reality. Back then, however, government policy either declined to intervene or, worse, intervened in ways that exacerbated rather than alleviated the financial crisis, thus allowing the devastation to spread across the U.S. economy. Things today move much more quickly. The current economy has turned downward faster in a shorter period of time than in any prior period, including the Depression. Fortunately, our government has responded with alacrity and, in a broad sense, moved in the right direction both by injecting massive amounts of liquidity into the financial system and by proactively assuring consumers of the safety of their savings and deposit accounts. As a result, we are likely to emerge faster from this crisis, and certainly much faster than in the 1930s. Government cannot be the only driver of recovery. Today, the depth and breadth of investors in markets across the globe is much stronger than ever before, and their actions will likely speed and strengthen the shape of recovery in both equity and debt markets.
As we have noted in our Alger Market Commentaries (see www.alger.com), companies were quick to respond to the downturn in the second half of 2008 by moving rapidly to cut expenses. At the end of the first quarter of 2009, as we tracked the corporate earnings results of the companies we follow, we discovered a pattern: despite the rapidity of the economic downturn, we saw companies reporting free cash flow of both absolute strength and relative resilience. We expect the continued stabilization of the U.S. economy and company fundamentals to support the market’s rally from March lows.
We are already seeing signs of a bottoming in the housing market in the earliest-hit and hardest-hit areas of the U.S. where declines in foreclosures and short sales have begun to occur. Looking at Orange County, California, home prices increased 2.5% in March from February; sales jumped 27.5% in March from February and 47.4% from last year, according to the California Association of Realtors. The county had about four months of inventory as of May, a level not seen since April 2006. Inventory was at eight months a year ago and peaked at 11 months in 2007.
2
As a lagging indicator, the unemployment rate won’t yield for a while as companies are expected to be slow to add new jobs, but the market can rebound long before the level of employment does. The unemployment rate hit a 25-year high in April, but there were signs of hope as the monthly job loss total for April fell to 539,000, down from 699,000 jobs lost in March and the lowest level in six months—since October, when the economy shed 380,000 jobs.
The Institute for Supply Management’s manufacturing index, a key measure of manufacturing activity, rose for the fourth straight month in April, suggesting the sector may be stabilizing even though the indicator has been at the contraction level for 15 months in a row. And the Consumer Confidence Index, which had posted a slight increase in March, improved considerably in April. The Index now stands at 39.2 (1985=100), up from 26.9 in March.
Apart from the Crowd
Looking forward, we are grounded in a more complete picture of reality—for the overall economy and our firm. Danish philosopher Søren Kierkegaard, too, examined illusion in a way, writing that crowds limit and stifle the unique individual. Like any economic bubble, we can, of course, now say in hindsight that the adjoining crises were a result of exactly this kind of crowd mentality. The resulting economic disaster, while painful, has effectively broken up the crowd, razing the illusion and once again opening the investing field up to new and creative opportunities. There is, after all, a stunning amount of cash on the sidelines. The savings rate is up to 5%, meaning that there is about $500 billion currently being held in cash. As consumer confidence repairs itself, the sidelined cash will be invested. While we believe that the economy will technically be in recession for most of 2009, negative GDP figures will gradually become less severe.
The stock market, however, is a discounting mechanism; investors look forward toward the potential range of economic, sector, and company-specific outcomes in terms of revenues, margins, profits, and growth to assess the value of equity. At Alger, our investment process includes valuation analysis that considers outcomes that are both highly pessimistic and optimistic. Most of the time, we observe stocks selling within ranges that reflect varying but ultimately balanced views between the divergent possibilities.
Occasionally, however, the crowd mentality of the market overwhelms such rational behavior and investors see something entirely different: equities of companies, even the strongest, suddenly priced to fail. We believe the S&P 500 Index(v) lows in March reflected such an event and, thus, we are increasingly confident that those lows will mark the bottom. Because we do not expect the economy—and, in particular, investor sentiment about economic recovery and future growth—to recover in a straight line, we think continued market volatility is likely. The inevitable sell-offs in the stock market that will accompany such uncertain economic progress will offer excellent buying opportunities for patient, long-term investors.
During the last six months, we had limited exposure to the hardest-hit areas of the financial sector, and our performance was largely a result of the market’s broad and indiscriminate decline. Even in the best of times investing is a challenge; however, it is during bad times that an investment firm proves its capability to manage through crisis, focus on improving performance, and not only endure but also improve upon its strengths. Alger investment professionals have remained
3
focused and disciplined in executing upon our consistent investment philosophy and process. Now in 2009, our 45th year in the business of investing, we have successfully passed through many shadowy times and found new opportunities amidst economic and generational change.
Kierkegaard once wrote, “The task must be made difficult, for only the difficult inspires the noble-hearted.” We have perhaps encountered the most difficult task our generation will see, and our firm has come out of it more inspired than ever to deliver exceptional investment results for an exceptional group of individuals and institutions: our clients.
Portfolio Matters
Alger Capital Appreciation Institutional Fund
The Alger Capital Appreciation Institutional Fund returned 0.31% for the six months ended April 30, 2009, compared to the Russell 3000 Growth Index(vi) return of -1.70%.
During the period, the largest portfolio weightings in the Alger Capital Appreciation Institutional Fund were in the Information Technology and Health Care sectors. The largest sector overweight for the period was in Financials. The largest sector underweight for the period was in Industrials. Relative outperformance in the Energy and Information Technology sectors were the most important contributors to performance. Sectors that detracted from the portfolio included Consumer Discretionary and Materials.
Among the most important relative contributors to the portfolio during the six months ended April 30, 2009, were Apple Inc., Transocean Ltd., Google Inc. (ClA), Chesapeake Energy Corp., and Marvell Technology Group Ltd.. Conversely, detracting from overall results on a relative basis were Satyam Computer Services Ltd. (ADS), Gildan Activewear Inc., Abbott Laboratories, Covidien Ltd., and Activision Blizzard Inc.
Alger LargeCap Growth Institutional Fund
The Alger LargeCap Growth Institutional Fund returned -0.46% for the fiscal year ended April 30, 2009, compared with a return of -1.54% for the Russell 1000 Growth Index(vii).
During the period, the largest portfolio weightings in the Alger LargeCap Growth Institutional Fund were in the Information Technology and Consumer Staples sectors. The largest sector overweight for the period was in Financials. The largest sector underweight for the period was in Industrials. Relative outperformance in the Energy and Health Care sectors were the most important contributors to performance. Sectors that detracted from the portfolio included Industrials and Financials.
Among the most important relative contributors to the portfolio during the six months ended April 30, 2009, were Weatherford International Ltd., Wyeth, Research In Motion Ltd., QUALCOMM Inc., and Walgreen Co. Conversely, detracting from overall results on a relative basis were McDermott International Inc., General Electric Co., Devon Energy Corp., JPMorgan Chase & Co., and Freeport-McMoRan Copper & Gold Inc.
4
Alger MidCap Growth Institutional Fund
For the six months ended April 30, 2009, the Alger MidCap Growth Institutional Fund returned - -1.32%, compared to the Russell MidCap Growth Index(viii) with a return of 2.70%.
During the period, the largest portfolio weightings in the Alger MidCap Growth Institutional Fund were in the Information Technology and Health Care sectors. The largest sector overweight for the period was in Information Technology. The largest sector underweight for the period was in Industrials. Relative outperformance in the Energy and Financials sectors were the most important contributors to performance. Sectors that detracted from the portfolio included Information Technology and Health Care.
Among the most important relative contributors to the portfolio during the six months ended April 30, 2009, were Chico’s FAS Inc., Mylan Inc., SPX Corp., Optimer Pharmaceuticals Inc., and Hansen Natural Corp. Conversely, detracting from overall results on a relative basis were Satyam Computer Services Ltd. (ADS), Gildan Activewear Inc., McDermott International Inc., United Therapeutics Corp., and Tessera Technologies Inc.
Alger SmallCap Growth Institutional Fund
The Alger SmallCap Growth Institutional Fund returned 2.10% for the six months ended April 30, 2009, compared to the Russell 2000 Growth Index(ix), which returned -3.78%.
During the period, the largest portfolio weightings in the Alger SmallCap Growth Institutional Fund were in the Information Technology and Health Care sectors. The largest sector overweight for the period was in Information Technology. The largest sector underweight for the period was in Industrials. Relative outperformance in the Industrials and Health Care sectors were the most important contributors to performance. Sectors that detracted from the portfolio included Telecommunications Services and Consumer Staples.
Among the most important relative contributors to the portfolio during the six months ended April 30, 2009, were Optimer Pharmaceuticals Inc., AECOM Technology Corp., VistaPrint Ltd., priceline.com Inc., and URS Corp. Conversely, detracting from overall results on a relative basis were Tenet Healthcare Corp., Icon PLC (ADS), Microsemi Corp., Ann Taylor Stores Corp., and International Coal Group Inc.
| Respectfully submitted, |
| 
|
| Daniel C. Chung |
| Chief Investment Officer |
(i) | The Dow Jones Industrial Average is an index of common stocks comprised of major industrial companies and assumes reinvestment of dividends. It is frequently used as a general measure of stock market performance. |
5
(ii) | Labor Department |
(iii) | Federal Reserve |
(iv) | EU statistics office |
(v) | Standard & Poor’s 500 Index is an index of the 500 largest and most profitable companies in the United States. |
(vi) | The Russell 3000 Growth Index is an unmanaged index designed to measure the performance of those Russell 3000 Index companies with higher price-to-book ratios and higher forecasted growth values. |
(vii) | The Russell 1000 Growth Index is an unmanaged index designed to measure the performance of the largest 1,000 companies in the Russell 3000 Index with higher price-to-book ratios and higher forecasted growth values. The Russell 3000 Index measures the performance of the 3000 largest U.S. companies based on the total market capitalization, which represents 98% of the U.S. Equity Market. |
(viii) | The Russell Midcap Growth Index is an unmanaged index designed to measure the performance of the 800 smallest companies in the Russell 1000 Index with higher price-to-book ratios and higher forecasted growth values. |
(ix) | The Russell 2000 Growth Index is an unmanaged index designed to measure the performance of the 2,000 smallest companies in the Russell 3000 Index with higher price-to-book ratios and higher forecasted growth values. |
Investors cannot invest directly in an index. Index performance does not reflect the deduction for fees, expenses or taxes.
This report and the financial statements contained herein are submitted for the general information of shareholders of the Fund. This report is not authorized for distribution to prospective investors in the Funds unless proceeded or accompanied by an effective prospectus for the Funds. Funds returns represent the fiscal six-month period return of Class I shares. The performance data quoted represents past performance, which is not an indication or guarantee of future results.
Standardized performance results can be found on the following page. The investment return and principal value of an investment in a fund will fluctuate so that an investor’s shares, when redeemed, may be worth more or less than their original cost. Current performance may be lower or higher than the performance quoted. For performance data current to the most recent month-end, visit us at www.alger.com, or call us at (800) 992-3863.
The views and opinions of the Funds’ management in this report are as of the date of the Shareholders letter and are subject to change at any time subsequent to this date. There is no guarantee that any of the assumptions that formed the basis for the opinions stated herein are accurate or that they will materialize. Moreover, the information forming the basis for such assumptions is from sources believed to be reliable; however, there is no guarantee that such information is accurate. Any securities mentioned, whether owned in a fund or otherwise, are considered in the context of the construction of an overall portfolio of securities and therefore reference to them should not be construed as a recommendation or offer to purchase or sell any such security. Inclusion of such securities in a fund and transactions in such securities, if any, may be for a variety of reasons, including without limitation, in response to cash flows, inclusion in a benchmark, and risk control. The reference to a specific security should also be understood in such context and not viewed as a statement that the security is a significant holding in a portfolio. Please refer to the Schedules of Investments for each fund that is included in this report for a complete list of fund holdings as of April 30, 2009. Securities mentioned in the Shareholders letter, if not found in the Schedule of Investments, may have been held by the Funds during the six-month fiscal period.
6
A Word About Risk
Growth stocks tend to be more volatile than other stocks as the price of growth stocks tends to be higher in relation to their companies’ earnings and may be more sensitive to market, political and economic developments. Investing in the stock market involves gains and losses and may not be suitable for all investors. Stocks of small and mid-sized companies are subject to greater risk than stocks of larger, more established companies owing to such factors as limited liquidity, inexperienced management, and limited financial resources. Funds that participate in leveraging, such as the Capital Appreciation Institutional Fund, are subject to the risk that borrowing money to leverage will exceed the returns for securities purchased or that the securities purchased may actually go down in value; thus, the Funds’ net asset value can decrease more quickly than if the Funds had not borrowed. For a more detailed discussion of the risks associated with these Funds, please see the Funds’ Prospectus.
Before investing, carefully consider a fund’s investment objective, risks, charges, and expenses. For a prospectus containing this and other information about The Alger Institutional Funds call us at (800) 992-3863 or visit us at www.alger.com. Read it carefully before investing. Fred Alger & Company, Incorporated, Distributor. Member NYSE Euronext, SIPC.
NOT FDIC INSURED. NOT BANK GUARANTEED. MAY LOSE VALUE.
7
FUND PERFORMANCE AS OF 3/31/09 (Unaudited)
AVERAGE ANNUAL TOTAL RETURNS
| | 1 | | 5 | | 10 | | SINCE | |
| | YEAR | | YEARS | | YEARS | | INCEPTION | |
Alger Capital Appreciation Class I | | | | | | | | | |
(Inception 11/8/93) | | (34.99 | )% | 0.67 | % | (1.42 | )% | 8.90 | % |
Alger Capital Appreciation Class R | | | | | | | | | |
(Inception 1/27/03) | | (35.34 | )% | 0.15 | % | n/a | | 5.57 | % |
Alger LargeCap Growth Class I | | | | | | | | | |
(Inception 11/8/93) | | (39.22 | )% | (5.57 | )% | (4.66 | )% | 4.89 | % |
Alger LargeCap Growth Class R | | | | | | | | | |
(Inception 1/27/03) | | (39.55 | )% | (6.05 | )% | n/a | | 0.41 | % |
Alger MidCap Growth Class I | | | | | | | | | |
(Inception 11/8/93) | | (49.10 | )% | (6.27 | )% | 1.36 | % | 9.51 | % |
Alger MidCap Growth Class R | | | | | | | | | |
(Inception 1/27/03) | | (49.34 | )% | (6.74 | )% | n/a | | 1.45 | % |
Alger SmallCap Growth Class I | | | | | | | | | |
(Inception 11/8/93) | | (36.12 | )% | (2.00 | )% | (2.45 | )% | 6.01 | % |
Alger SmallCap Growth Class R | | | | | | | | | |
(Inception 1/27/03) | | (36.43 | )% | (2.45 | )% | n/a | | 5.25 | % |
8
ALGER CAPITAL APPRECIATION INSTITUTIONAL FUND
Fund Highlights Through April 30, 2009 (Unaudited)
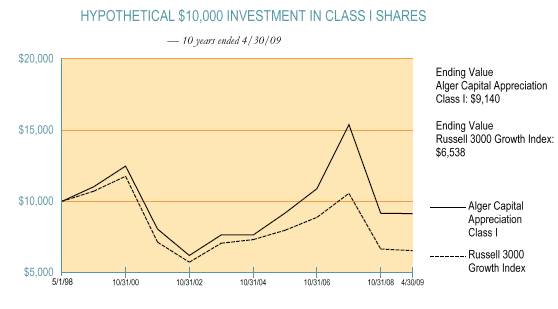
The chart above illustrates the change in value of a hypothetical $10,000 investment made in the Alger Capital Appreciation Institutional Class I shares and the Russell 3000 Growth Index (an unmanaged index of common stocks) for the ten years ended April 30, 2009. Figures for the Alger Capital Appreciation Institutional Class I shares and the Russell 3000 Growth Index include reinvestment of dividends. Performance for the Alger Capital Appreciation Institutional Class R shares may vary from the results shown above due to differences in expenses the class bears.
PERFORMANCE COMPARISON AS OF 4/30/09
AVERAGE ANNUAL TOTAL RETURNS
| | | | | | | | SINCE | |
| | 1 YEAR | | 5 YEARS | | 10 YEARS | | INCEPTION | |
Class I (Inception 11/8/93) | | (32.96 | )% | 3.47 | % | (0.89 | )% | 9.50 | % |
Russell 3000 Growth Index | | (31.47 | )% | (2.33 | )% | (4.16 | )% | 4.86 | % |
| | | | | | | | | |
Class R (Inception 1/27/03) | | (33.32 | )% | 2.94 | % | n/a | | 7.05 | % |
Russell 3000 Growth Index | | (31.47 | )% | (2.33 | )% | n/a | | 2.74 | % |
The performance data quoted represents past performance, which is not an indication or a guarantee of future results. The Fund’s average annual total returns include changes in share price and reinvestment of dividends and capital gains. The chart and table above do not reflect the deduction of taxes that a shareholder would have paid on fund distributions or on the redemption of fund shares. Investment return and principal will fluctuate and the Fund’s shares, when redeemed, may be worth more or less than their original cost. Current performance may be higher or lower than the performance quoted. For performance current to the most recent month end, visit us at www.alger.com or call us at (800) 992-3863.
9
ALGER LARGECAP GROWTH INSTITUTIONAL FUND
Fund Highlights Through April 30, 2009 (Unaudited)

The chart above illustrates the change in value of a hypothetical $10,000 investment made in the Alger LargeCap Growth Institutional Class I shares and the Russell 1000 Growth Index (an unmanaged index of common stocks) for the ten years ended April 30, 2009. The figures for the Alger LargeCap Growth Institutional Class I shares and the Russell 1000 Growth Index include reinvestment of dividends. Performance for the Alger LargeCap Growth Institutional Class R shares may vary from the results shown above due to differences in expenses the class bears.
PERFORMANCE COMPARISON AS OF 4/30/09
AVERAGE ANNUAL TOTAL RETURNS
| | | | | | | | SINCE | |
| | 1 YEAR | | 5 YEARS | | 10 YEARS | | INCEPTION | |
Class I (Inception 11/8/93) | | (37.52 | )% | (3.08 | )% | (3.88 | )% | 5.43 | % |
Russell 1000 Growth Index | | (31.56 | )% | (2.38 | )% | (4.40 | )% | 5.09 | % |
| | | | | | | | | |
Class R (Inception 1/27/03) | | (37.80 | )% | (3.56 | )% | n/a | | 1.75 | % |
Russell 1000 Growth Index | | (31.56 | )% | (2.38 | )% | n/a | | 2.54 | % |
The performance data quoted represents past performance, which is not an indication or a guarantee of future results. The Fund’s average annual total returns include changes in share price and reinvestment of dividends and capital gains. The chart and table above do not reflect the deduction of taxes that a shareholder would have paid on fund distributions or on the redemption of fund shares. Investment return and principal will fluctuate and the Fund’s shares, when redeemed, may be worth more or less than their original cost. Current performance may be higher or lower than the performance quoted. For performance current to the most recent month end, visit us at www.alger.com or call us at (800) 992-3863.
10
ALGER MIDCAP GROWTH INSTITUTIONAL FUND
Fund Highlights Through April 30, 2009 (Unaudited)
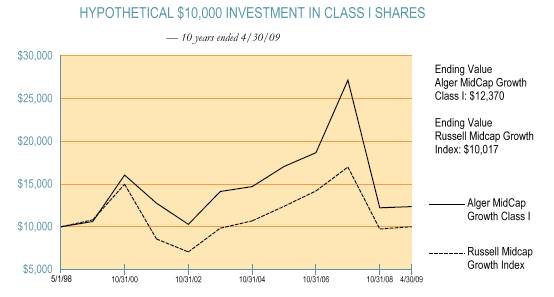
The chart above illustrates the growth in value of a hypothetical $10,000 investment made in the Alger MidCap Growth Institutional Class I shares and the Russell Midcap Growth Index (an unmanaged index of common stocks) for the ten years ended April 30, 2009. Figures for the Alger MidCap Growth Institutional Class I shares and the Russell Midcap Growth Index include reinvestment of dividends. Performance for the Alger MidCap Growth Institutional Class R shares may vary from the results shown above due to differences in expenses the class bears.
PERFORMANCE COMPARISON AS OF 4/30/09
AVERAGE ANNUAL TOTAL RETURNS
| | | | | | | | SINCE | |
| | 1 YEAR | | 5 YEARS | | 10 YEARS | | INCEPTION | |
Class I (Inception 11/8/93) | | (46.31 | )% | (3.02 | )% | 2.15 | % | 10.26 | % |
Russell Midcap Growth Index | | (35.66 | )% | (0.76 | )% | 0.02 | % | 5.99 | % |
| | | | | | | | | |
Class R (Inception 1/27/03) | | (46.59 | )% | (3.49 | )% | n/a | | 3.27 | % |
Russell Midcap Growth Index | | (35.66 | )% | (0.76 | )% | n/a | | 5.66 | % |
The performance data quoted represents past performance, which is not an indication or a guarantee of future results. The Fund’s average annual total returns include changes in share price and reinvestment of dividends and capital gains. The chart and table above do not reflect the deduction of taxes that a shareholder would have paid on fund distributions or on the redemption of fund shares. Investment return and principal will fluctuate and the Fund’s shares, when redeemed, may be worth more or less than their original cost. Current performance may be higher or lower than the performance quoted. For performance current to the most recent month end, visit us at www.alger.com or call us at (800) 992-3863.
11
ALGER SMALLCAP GROWTH INSTITUTIONAL FUND
Fund Highlights Through April 30, 2009 (Unaudited)

The chart above illustrates the change in value of a hypothetical $10,000 investment made in the Alger SmallCap Growth Institutional Class I shares and the Russell 2000 Growth Index (an unmanaged index of common stocks) for the ten years ended April 30, 2009. The figures for the Alger SmallCap Growth Institutional Class I shares and the Russell 2000 Growth Index include reinvestment of dividends. Performance for the Alger SmallCap Growth Institutional Class R shares may vary from the results shown above due to differences in expenses the class bears.
PERFORMANCE COMPARISON AS OF 4/30/09
AVERAGE ANNUAL TOTAL RETURNS
| | | | | | | | SINCE | |
| | 1 YEAR | | 5 YEARS | | 10 YEARS | | INCEPTION | |
Class I (Inception 11/8/93) | | (32.41 | )% | 0.87 | % | (1.72 | )% | 6.69 | % |
Russell 2000 Growth Index | | (30.36 | )% | (1.67 | )% | (1.06 | )% | 2.98 | % |
| | | | | | | | | |
Class R (Inception 1/27/03) | | (32.71 | )% | 0.41 | % | n/a | | 6.93 | % |
Russell 2000 Growth Index | | (30.36 | )% | (1.67 | )% | n/a | | 5.54 | % |
The performance data quoted represents past performance, which is not an indication or a guarantee of future results. The Fund’s average annual total returns include changes in share price and reinvestment of dividends and capital gains. The chart and table above do not reflect the deduction of taxes that a shareholder would have paid on fund distributions or on the redemption of fund shares. Investment return and principal will fluctuate and the Fund’s shares, when redeemed, may be worth more or less than their original cost. Current performance may be higher or lower than the performance quoted. For performance current to the most recent month end, visit us at www.alger.com or call us at (800) 992-3863
12
PORTFOLIO SUMMARY*
April 30, 2009 (Unaudited)
| | CAPITAL | | LARGECAP | | MIDCAP | | SMALLCAP | |
| | APPRECIATION | | GROWTH | | GROWTH | | GROWTH | |
| | INSTITUTIONAL | | INSTITUTIONAL | | INSTITUTIONAL | | INSTITUTIONAL | |
SECTORS | | FUND | | FUND | | FUND | | FUND | |
Consumer Discretionary | | 10.2 | % | 8.2 | % | 18.0 | % | 14.9 | % |
Consumer Staples | | 11.6 | | 14.9 | | 4.8 | | 3.8 | |
Energy | | 7.2 | | 8.4 | | 7.7 | | 6.0 | |
Financials | | 6.0 | | 4.3 | | 7.3 | | 6.3 | |
Health Care | | 17.8 | | 14.9 | | 19.4 | | 22.3 | |
Industrials | | 9.3 | | 9.2 | | 9.4 | | 12.4 | |
Information Technology | | 29.6 | | 31.3 | | 27.0 | | 26.3 | |
Materials | | 4.8 | | 3.3 | | 3.4 | | 1.6 | |
Telecommunication Services | | 1.2 | | 0.7 | | 2.4 | | 1.9 | |
Utilities | | 1.2 | | 0.0 | | 1.0 | | 1.3 | |
Short-Term Investments and Net Other | | | | | | | | | |
Assets | | 1.1 | | 4.8 | | (0.4 | ) | 3.2 | |
| | 100.0 | % | 100.0 | % | 100.0 | % | 100.0 | % |
* Based on net assets for each Fund.
13
THE ALGER INSTITUTIONAL FUNDS |
ALGER CAPITAL APPRECIATION INSTITUTIONAL FUND
Schedule of Investments (Unaudited) April 30, 2009
| | SHARES | | VALUE | |
COMMON STOCKS—98.0% | | | | | |
AEROSPACE & DEFENSE—5.6% | | | | | |
BE Aerospace Inc. * | | 1,030,800 | | $ | 11,122,332 | |
General Dynamics Corp. | | 88,600 | | 4,577,962 | |
Lockheed Martin Corp. | | 157,600 | | 12,376,328 | |
| | | | 28,076,622 | |
AIR FREIGHT & LOGISTICS—0.3% | | | | | |
United Parcel Service Inc., Cl. B | | 31,900 | | 1,669,646 | |
| | | | | |
APPAREL RETAIL—0.5% | | | | | |
Gap Inc., /The | | 165,100 | | 2,565,654 | |
| | | | | |
APPLICATION SOFTWARE—1.0% | | | | | |
Net 1 UEPS Technologies Inc. * | | 29,200 | | 481,800 | |
Solera Holdings Inc. * | | 151,500 | | 3,457,230 | |
Synopsys Inc. * | | 46,800 | | 1,019,304 | |
| | | | 4,958,334 | |
ASSET MANAGEMENT & CUSTODY BANKS—0.5% | | | | | |
AllianceBernstein Holding LP | | 50,800 | | 890,016 | |
Invesco Ltd. | | 124,200 | | 1,828,224 | |
| | | | 2,718,240 | |
AUTOMOBILE MANUFACTURERS—0.3% | | | | | |
Honda Motor Co., Ltd. | | 52,683 | | 1,523,435 | |
| | | | | |
BIOTECHNOLOGY—3.7% | | | | | |
Alexion Pharmaceuticals Inc. * | | 51,000 | | 1,704,420 | |
Biogen Idec Inc. * | | 57,600 | | 2,784,384 | |
Celgene Corp. * | | 156,400 | | 6,681,408 | |
Cephalon Inc. * | | 85,400 | | 5,603,094 | |
Genzyme Corp. * | | 32,900 | | 1,754,557 | |
| | | | 18,527,863 | |
CABLE & SATELLITE—0.4% | | | | | |
DIRECTV Group Inc., /The* | | 78,600 | | 1,943,778 | |
| | | | | |
CASINOS & GAMING—0.7% | | | | | |
Las Vegas Sands Corp.* | | 467,100 | | 3,652,722 | |
| | | | | |
COMMUNICATIONS EQUIPMENT—3.6% | | | | | |
Cisco Systems Inc. * | | 302,300 | | 5,840,436 | |
Corning Inc. | | 33,600 | | 491,232 | |
Nice Systems Ltd. #* | | 33,300 | | 852,813 | |
Qualcomm Inc. | | 179,400 | | 7,592,208 | |
Research In Motion Ltd. * | | 45,800 | | 3,183,100 | |
| | | | 17,959,789 | |
COMPUTER & ELECTRONICS RETAIL—0.6% | | | | | |
Best Buy Co., Inc. | | 84,500 | | 3,243,110 | |
| | | | | |
COMPUTER HARDWARE—6.8% | | | | | |
Apple Inc. * | | 133,800 | | 16,836,055 | |
Hewlett-Packard Co. | | 259,300 | | 9,329,614 | |
International Business Machines Corp. | | 79,000 | | 8,153,590 | |
| | | | 34,319,259 | |
| | | | | | |
14
| | SHARES | | VALUE | |
COMMON STOCKS—(CONT.) | | | | | |
COMPUTER STORAGE & PERIPHERALS—1.1% | | | | | |
EMC Corp.* | | 420,600 | | $ | 5,270,118 | |
| | | | | |
CONSTRUCTION & ENGINEERING—0.1% | | | | | |
Foster Wheeler AG* | | 23,400 | | 503,802 | |
| | | | | |
DATA PROCESSING & OUTSOURCED SERVICES—3.2% | | | | | |
Mastercard Inc. | | 73,500 | | 13,483,575 | |
Visa Inc., Cl. A | | 35,700 | | 2,319,072 | |
| | | | 15,802,647 | |
DISTILLERS & VINTNERS—0.2% | | | | | |
Central European Distribution Corp.* | | 54,400 | | 1,218,560 | |
| | | | | |
DIVERSIFIED METALS & MINING—0.3% | | | | | |
Cia Vale do Rio Doce# | | 91,700 | | 1,513,967 | |
| | | | | |
DRUG RETAIL—3.5% | | | | | |
CVS Caremark Corp. | | 552,400 | | 17,555,272 | |
| | | | | |
EDUCATION SERVICES—0.5% | | | | | |
ITT Educational Services Inc.* | | 26,100 | | 2,630,097 | |
| | | | | |
ELECTRIC UTILITIES—0.5% | | | | | |
Northeast Utilities | | 130,100 | | 2,734,702 | |
| | | | | |
ELECTRICAL COMPONENTS & EQUIPMENT—0.3% | | | | | |
General Cable Corp.* | | 49,500 | | 1,343,430 | |
| | | | | |
FERTILIZERS & AGRICULTURAL CHEMICALS—0.4% | | | | | |
Mosaic Co., /The | | 54,900 | | 2,220,705 | |
| | | | | |
FOOD RETAIL—1.6% | | | | | |
Kroger Co., /The | | 370,300 | | 8,005,886 | |
| | | | | |
FOOTWEAR—0.3% | | | | | |
NIKE Inc., Cl. B | | 27,600 | | 1,448,172 | |
| | | | | |
GOLD—0.5% | | | | | |
Goldcorp Inc. | | 83,500 | | 2,297,920 | |
| | | | | |
HEALTH CARE EQUIPMENT—1.4% | | | | | |
Covidien Ltd. | | 143,640 | | 4,737,247 | |
Insulet Corp. * | | 133,500 | | 767,625 | |
Medtronic Inc. | | 38,700 | | 1,238,400 | |
Varian Medical Systems Inc. * | | 14,400 | | 480,528 | |
| | | | 7,223,800 | |
HEALTH CARE FACILITIES—0.8% | | | | | |
Community Health Systems Inc. * | | 47,700 | | 1,089,468 | |
Universal Health Services Inc., Cl. B | | 61,600 | | 3,104,640 | |
| | | | 4,194,108 | |
HEALTH CARE SERVICES—0.4% | | | | | |
Medco Health Solutions Inc.* | | 41,200 | | 1,794,260 | |
| | | | | |
HEALTH CARE SUPPLIES—1.1% | | | | | |
Inverness Medical Innovations Inc.* | | 173,400 | | 5,599,086 | |
| | | | | |
HOME ENTERTAINMENT SOFTWARE—0.5% | | | | | |
Activision Blizzard Inc. * | | 62,600 | | 674,202 | |
| | | | | | |
15
| | SHARES | | VALUE | |
COMMON STOCKS—(CONT.) | | | | | |
HOME ENTERTAINMENT SOFTWARE—(CONT.) | | | | | |
Nintendo Co., Ltd. # | | 54,526 | | $ | 1,834,800 | |
| | | | 2,509,002 | |
HOME IMPROVEMENT RETAIL—1.0% | | | | | |
Lowe’s Companies, Inc. | | 222,600 | | 4,785,900 | |
| | | | | |
HOMEBUILDING—0.5% | | | | | |
KB Home | | 44,000 | | 795,080 | |
Toll Brothers Inc. * | | 89,500 | | 1,813,270 | |
| | | | 2,608,350 | |
HOTELS RESORTS & CRUISE LINES—0.2% | | | | | |
Carnival Corp. | | 45,100 | | 1,212,288 | |
| | | | | |
HOUSEWARES & SPECIALTIES—0.2% | | | | | |
Newell Rubbermaid Inc. | | 46,700 | | 488,015 | |
Tupperware Brands Corp. | | 27,700 | | 693,331 | |
| | | | 1,181,346 | |
HYPERMARKETS & SUPER CENTERS—1.0% | | | | | |
Wal-Mart Stores Inc. | | 96,200 | | 4,848,480 | |
| | | | | |
INDUSTRIAL CONGLOMERATES—2.2% | | | | | |
Tyco International Ltd. | | 454,700 | | 10,803,672 | |
| | | | | |
INDUSTRIAL MACHINERY—0.8% | | | | | |
SPX Corp. | | 87,300 | | 4,030,641 | |
| | | | | |
INTEGRATED OIL & GAS—0.8% | | | | | |
Total SA# | | 82,600 | | 4,106,872 | |
| | | | | |
INTEGRATED TELECOMMUNICATION SERVICES—0.8% | | | | | |
AT&T Inc. | | 141,800 | | 3,632,916 | |
| | | | | |
INTERNET RETAIL—1.6% | | | | | |
Amazon.com Inc. * | | 6,000 | | 483,120 | |
Expedia Inc. * | | 529,400 | | 7,205,134 | |
| | | | 7,688,254 | |
INTERNET SOFTWARE & SERVICES—4.7% | | | | | |
eBay Inc. * | | 227,300 | | 3,743,631 | |
Google Inc., Cl. A * | | 15,600 | | 6,177,132 | |
IAC/InterActiveCorp. * | | 484,600 | | 7,763,292 | |
Netease.com #* | | 129,000 | | 3,893,220 | |
Yahoo! Inc. * | | 151,800 | | 2,169,222 | |
| | | | 23,746,497 | |
INVESTMENT BANKING & BROKERAGE—1.4% | | | | | |
Goldman Sachs Group Inc., /The | | 24,200 | | 3,109,700 | |
Morgan Stanley | | 150,200 | | 3,550,728 | |
| | | | 6,660,428 | |
IT CONSULTING & OTHER SERVICES—1.2% | | | | | |
Cognizant Technology Solutions Corp., Cl. A* | | 245,500 | | 6,085,945 | |
| | | | | |
LEISURE PRODUCTS—0.3% | | | | | |
Gildan Activewear Inc.* | | 116,200 | | 1,330,490 | |
| | | | | | |
16
| | SHARES | | VALUE | |
COMMON STOCKS—(CONT.) | | | | | |
LIFE SCIENCES TOOLS & SERVICES—2.1% | | | | | |
Icon PLC #* | | 239,700 | | $ | 3,796,848 | |
Life Technologies Corp. * | | 109,300 | | 4,076,890 | |
Thermo Fisher Scientific Inc. * | | 74,200 | | 2,602,936 | |
| | | | 10,476,674 | |
MANAGED HEALTH CARE—2.3% | | | | | |
Aetna Inc. | | 68,400 | | 1,505,484 | |
WellPoint Inc. * | | 237,700 | | 10,164,052 | |
| | | | 11,669,536 | |
METAL & GLASS CONTAINERS—2.6% | | | | | |
Crown Holdings Inc. * | | 294,900 | | 6,502,545 | |
Owens-Illinois Inc. * | | 279,000 | | 6,804,810 | |
| | | | 13,307,355 | |
MOVIES & ENTERTAINMENT—1.0% | | | | | |
Regal Entertainment Group, Cl. A | | 250,200 | | 3,267,612 | |
Walt Disney Co., /The | | 70,200 | | 1,537,380 | |
| | | | 4,804,992 | |
MULTI-UTILITIES—0.7% | | | | | |
Veolia Environnement# | | 112,000 | | 3,058,720 | |
| | | | | |
OIL & GAS DRILLING—1.2% | | | | | |
Transocean Ltd.* | | 90,500 | | 6,106,940 | |
| | | | | |
OIL & GAS EQUIPMENT & SERVICES—0.8% | | | | | |
Weatherford International Ltd.* | | 253,100 | | 4,209,053 | |
| | | | | |
OIL & GAS EXPLORATION & PRODUCTION—3.7% | | | | | |
Chesapeake Energy Corp. | | 453,100 | | 8,930,601 | |
Newfield Exploration Co. * | | 43,100 | | 1,343,858 | |
Nexen Inc. | | 424,700 | | 8,111,770 | |
| | | | 18,386,229 | |
OIL & GAS REFINING & MARKETING—0.5% | | | | | |
NuStar Energy LP | | 46,900 | | 2,363,291 | |
| | | | | |
OIL & GAS STORAGE & TRANSPORTATION—0.2% | | | | | |
Magellan Midstream Holdings LP | | 25,200 | | 499,968 | |
Plains All American Pipeline LP | | 12,100 | | 512,314 | |
| | | | 1,012,282 | |
OTHER DIVERSIFIED FINANCIAL SERVICES—0.8% | | | | | |
BM&F BOVESPA SA | | 823,800 | | 3,369,115 | |
JPMorgan Chase & Co. | | 14,900 | | 491,700 | |
| | | | 3,860,815 | |
PACKAGED FOODS & MEATS—1.1% | | | | | |
General Mills Inc. | | 113,100 | | 5,733,039 | |
| | | | | |
PAPER PACKAGING—0.1% | | | | | |
Temple-Inland Inc. | | 39,600 | | 472,824 | |
| | | | | |
PHARMACEUTICALS—5.1% | | | | | |
Abbott Laboratories | | 378,800 | | 15,852,780 | |
Allergan Inc. | | 21,900 | | 1,021,854 | |
Bristol-Myers Squibb Co. | | 71,300 | | 1,368,960 | |
| | | | | | |
17
| | SHARES | | VALUE | |
COMMON STOCKS—(CONT.) | | | | | |
PHARMACEUTICALS—(CONT.) | | | | | |
Johnson & Johnson | | 18,900 | | $ | 989,604 | |
Shire PLC # | | 13,300 | | 495,691 | |
Teva Pharmaceutical Industries Ltd. # | | 10,900 | | 478,401 | |
Wyeth | | 118,500 | | 5,024,400 | |
| | | | 25,231,690 | |
PROPERTY & CASUALTY INSURANCE—0.9% | | | | | |
Travelers Cos. Inc., /The | | 105,400 | | 4,336,156 | |
| | | | | |
PUBLISHING—1.4% | | | | | |
McGraw-Hill Cos. Inc., /The | | 227,800 | | 6,868,170 | |
| | | | | |
REAL ESTATE SERVICES—0.1% | | | | | |
Mack-Cali Realty Corp. | | 21,200 | | 569,432 | |
| | | | | |
REGIONAL BANKS—0.1% | | | | | |
Keycorp | | 87,900 | | 540,585 | |
| | | | | |
RESTAURANTS—0.7% | | | | | |
McDonald’s Corp. | | 44,600 | | 2,376,734 | |
Wendy’s/Arby’s Group Inc. | | 263,700 | | 1,318,500 | |
| | | | 3,695,234 | |
SEMICONDUCTORS—3.7% | | | | | |
Atheros Communications Inc. * | | 267,743 | | 4,610,534 | |
Broadcom Corp., Cl. A * | | 105,800 | | 2,453,502 | |
Marvell Technology Group Ltd. * | | 403,200 | | 4,427,136 | |
National Semiconductor Corp. | | 133,300 | | 1,648,921 | |
ON Semiconductor Corp. * | | 639,800 | | 3,467,716 | |
Taiwan Semiconductor Manufacturing Co., Ltd. # | | 174,800 | | 1,847,636 | |
| | | | 18,455,445 | |
SOFT DRINKS—0.9% | | | | | |
Coca-Cola Co., /The | | 98,800 | | 4,253,340 | |
| | | | | |
SPECIALIZED FINANCE—1.0% | | | | | |
NYSE Euronext | | 217,600 | | 5,041,792 | |
| | | | | |
SPECIALTY CHEMICALS—0.8% | | | | | |
Albemarle Corp. | | 36,400 | | 976,248 | |
Lubrizol Corp. | | 46,700 | | 2,018,374 | |
Rockwood Holdings Inc. * | | 85,600 | | 1,052,880 | |
| | | | 4,047,502 | |
STEEL—0.1% | | | | | |
AK Steel Holding Corp. | | 24,500 | | 318,745 | |
| | | | | |
SYSTEMS SOFTWARE—3.8% | | | | | |
Microsoft Corp. | | 803,900 | | 16,287,014 | |
Symantec Corp. * | | 160,000 | | 2,760,000 | |
| | | | 19,047,014 | |
THRIFTS & MORTGAGE FINANCE—1.2% | | | | | |
People’s United Financial Inc. | | 120,600 | | 1,883,772 | |
TFS Financial Corp. | | 360,100 | | 4,223,973 | |
| | | | 6,107,745 | |
| | | | | | |
18
| | SHARES | | VALUE | |
COMMON STOCKS—(CONT.) | | | | | |
TOBACCO—3.3% | | | | | |
Philip Morris International Inc. | | 459,950 | | $ | 16,650,190 | |
| | | | | |
WIRELESS TELECOMMUNICATION SERVICES—0.4% | | | | | |
American Tower Corp., Cl. A* | | 70,300 | | 2,232,728 | |
| | | | | |
TOTAL COMMON STOCKS
(Cost $518,891,419) | | | | 490,603,583 | |
| | | | | |
CONVERTIBLE PREFERRED STOCK—0.6% | | | | | |
PHARMACEUTICALS—0.6% | | | | | |
Mylan Inc., 6.50%, 11/15/10(a)
(Cost $2,297,731) | | 3,254 | | 2,772,408 | |
| | | | | |
| | PRINCIPAL | | | |
| | AMOUNT | | | |
CONVERTIBLE CORPORATE BONDS—0.3% | | | | | |
LIFE SCIENCES TOOLS & SERVICES—0.3% | | | | | |
Invitrogen Corp., 3.25%, 6/15/25
(Cost $1,294,309) | | 1,474,000 | | 1,486,898 | |
| | | | | |
SHORT-TERM INVESTMENTS—1.7% | | | | | |
TIME DEPOSITS—1.7% | | | | | |
Citibank London, 0.03%, 5/01/09
(Cost $8,455,712) | | 8,455,712 | | 8,455,712 | |
| | | | | |
Total Investments
(Cost $530,939,171)(b) | | 100.6 | % | 503,318,601 | |
Liabilities in Excess of Other Assets | | (0.6 | ) | (3,043,911 | ) |
| | | | | |
NET ASSETS | | 100.0 | % | $ | 500,274,690 | |
* | Non-income producing security. |
# | American Depositary Receipts. |
(a) | These securities are required to be converted on the date listed; they generally may be converted prior to this date at the option of the holder. |
(b) | At April 30, 2009, the net unrealized depreciation on investments, based on cost for federal income tax purposes of $559,601,060 amounted to $56,282,459 which consisted of aggregate gross unrealized appreciation of $29,985,674 and aggregate gross unrealized depreciation of $86,268,133. |
See Notes to Financial Statements.
19
(This page has been intentionally left blank)
THE ALGER INSTITUTIONAL FUNDS | ALGER LARGECAP GROWTH INSTITUTIONAL FUND
Schedule of Investments (Unaudited) April 30, 2009
| | SHARES | | VALUE | |
COMMON STOCKS—95.2% | | | | | |
AEROSPACE & DEFENSE—3.9% | | | | | |
Boeing Co., /The | | 8,500 | | $ | 340,425 | |
General Dynamics Corp. | | 7,500 | | 387,525 | |
Lockheed Martin Corp. | | 10,700 | | 840,271 | |
| | | | 1,568,221 | |
AIR FREIGHT & LOGISTICS—1.0% | | | | | |
United Parcel Service Inc., Cl. B | | 7,400 | | 387,316 | |
| | | | | |
APPAREL RETAIL—0.8% | | | | | |
Gap Inc., /The | | 19,550 | | 303,807 | |
| | | | | |
ASSET MANAGEMENT & CUSTODY BANKS—1.0% | | | | | |
BlackRock Inc. | | 1,300 | | 190,476 | |
Invesco Ltd. | | 14,550 | | 214,176 | |
| | | | 404,652 | |
BIOTECHNOLOGY—3.9% | | | | | |
Amgen Inc. * | | 3,350 | | 162,375 | |
Biogen Idec Inc. * | | 4,800 | | 232,032 | |
Celgene Corp. * | | 11,450 | | 489,144 | |
Genzyme Corp. * | | 5,500 | | 293,315 | |
Gilead Sciences Inc. * | | 7,700 | | 352,660 | |
| | | | 1,529,526 | |
CABLE & SATELLITE—0.3% | | | | | |
Comcast Corp., Cl. A | | 6,850 | | 100,558 | |
| | | | | |
COAL & CONSUMABLE FUELS—0.5% | | | | | |
Consol Energy Inc. | | 6,150 | | 192,372 | |
| | | | | |
COMMUNICATIONS EQUIPMENT—5.3% | | | | | |
Cisco Systems Inc. * | | 49,100 | | 948,611 | |
Qualcomm Inc. | | 16,550 | | 700,396 | |
Research In Motion Ltd. * | | 6,300 | | 437,850 | |
| | | | 2,086,857 | |
COMPUTER & ELECTRONICS RETAIL—0.6% | | | | | |
GameStop Corp., Cl. A* | | 7,900 | | 238,264 | |
| | | | | |
COMPUTER HARDWARE—7.5% | | | | | |
Apple Inc. * | | 9,850 | | 1,239,425 | |
Hewlett-Packard Co. | | 28,550 | | 1,027,229 | |
International Business Machines Corp. | | 6,900 | | 712,149 | |
| | | | 2,978,803 | |
COMPUTER STORAGE & PERIPHERALS—1.2% | | | | | |
EMC Corp.* | | 39,050 | | 489,297 | |
| | | | | |
CONSTRUCTION & FARM MACHINERY & HEAVY TRUCKS—1.7% | | | | | |
Caterpillar Inc. | | 6,350 | | 225,933 | |
Deere & Co. | | 10,600 | | 437,356 | |
| | | | 663,289 | |
DATA PROCESSING & OUTSOURCED SERVICES—2.8% | | | | | |
Mastercard Inc. | | 3,550 | | 651,248 | |
Visa Inc., Cl. A | | 3,100 | | 201,376 | |
Western Union Co., /The | | 15,200 | | 254,600 | |
| | | | 1,107,224 | |
| | | | | | |
21
| | SHARES | | VALUE | |
COMMON STOCKS—(CONT.) | | | | | |
DIVERSIFIED CHEMICALS—0.7% | | | | | |
El Du Pont de Nemours & Co. | | 10,350 | | $ | 288,765 | |
| | | | | |
DRUG RETAIL—3.3% | | | | | |
CVS Caremark Corp. | | 22,550 | | 716,639 | |
Walgreen Co. | | 18,600 | | 584,598 | |
| | | | 1,301,237 | |
FERTILIZERS & AGRICULTURAL CHEMICALS—1.7% | | | | | |
Monsanto Co. | | 4,700 | | 398,983 | |
Potash Corporation of Saskatchewan Inc. | | 2,650 | | 229,199 | |
| | | | 628,182 | |
FOOD RETAIL—0.9% | | | | | |
Kroger Co., /The | | 16,750 | | 362,135 | |
| | | | | |
FOOTWEAR—0.9% | | | | | |
NIKE Inc., Cl. B | | 6,750 | | 354,173 | |
| | | | | |
GENERAL MERCHANDISE STORES—0.6% | | | | | |
Target Corp. | | 6,100 | | 251,686 | |
| | | | | |
GOLD—0.9% | | | | | |
Barrick Gold Corp. | | 4,900 | | 142,590 | |
Goldcorp Inc. | | 8,300 | | 228,416 | |
| | | | 371,006 | |
HEALTH CARE EQUIPMENT—3.1% | | | | | |
Baxter International Inc. | | 2,700 | | 130,950 | |
Boston Scientific Corp. * | | 20,600 | | 173,246 | |
Covidien Ltd. | | 12,500 | | 412,249 | |
Stryker Corp. | | 6,350 | | 245,809 | |
Zimmer Holdings Inc. * | | 6,250 | | 274,938 | |
| | | | 1,237,192 | |
HOME ENTERTAINMENT SOFTWARE—2.9% | | | | | |
Activision Blizzard Inc. * | | 31,800 | | 342,486 | |
Electronic Arts Inc. * | | 16,550 | | 336,793 | |
Nintendo Co., Ltd. # | | 14,150 | | 476,147 | |
| | | | 1,155,426 | |
HOTELS RESORTS & CRUISE LINES—1.1% | | | | | |
Carnival Corp. | | 10,000 | | 268,800 | |
Marriott International Inc., Cl. A | | 6,550 | | 154,318 | |
| | | | 423,118 | |
HOUSEHOLD PRODUCTS—1.2% | | | | | |
Procter & Gamble Co., /The | | 9,500 | | 469,680 | |
| | | | | |
HYPERMARKETS & SUPER CENTERS—2.1% | | | | | |
Costco Wholesale Corp. | | 3,250 | | 157,950 | |
Wal-Mart Stores Inc. | | 13,300 | | 670,320 | |
| | | | 828,270 | |
INDUSTRIAL CONGLOMERATES—1.3% | | | | | |
Tyco International Ltd. | | 21,150 | | 502,524 | |
| | | | | |
INTEGRATED OIL & GAS—3.0% | | | | | |
Chevron Corp. | | 5,800 | | 383,380 | |
Exxon Mobil Corp. | | 6,250 | | 416,688 | |
| | | | | | |
22
| | SHARES | | VALUE | |
COMMON STOCKS—(CONT.) | | | | | |
INTEGRATED OIL & GAS—(CONT.) | | | | | |
Petroleo Brasileiro SA # | | 5,200 | | $ | 174,564 | |
Total SA # | | 4,050 | | 201,366 | |
| | | | 1,175,998 | |
INTEGRATED TELECOMMUNICATION SERVICES—0.7% | | | | | |
AT&T Inc. | | 11,100 | | 284,382 | |
| | | | | |
INTERNET RETAIL—0.7% | | | | | |
Amazon.com Inc.* | | 3,250 | | 261,690 | |
| | | | | |
INTERNET SOFTWARE & SERVICES—4.8% | | | | | |
eBay Inc. * | | 29,950 | | 493,277 | |
Google Inc., Cl. A * | | 2,463 | | 975,273 | |
Yahoo! Inc. * | | 29,500 | | 421,555 | |
| | | | 1,890,105 | |
INVESTMENT BANKING & BROKERAGE—0.8% | | | | | |
Goldman Sachs Group Inc., /The | | 1,150 | | 147,775 | |
Morgan Stanley | | 6,750 | | 159,570 | |
| | | | 307,345 | |
IT CONSULTING & OTHER SERVICES—1.2% | | | | | |
Cognizant Technology Solutions Corp., Cl. A* | | 18,550 | | 459,855 | |
| | | | | |
LIFE SCIENCES TOOLS & SERVICES—0.9% | | | | | |
Thermo Fisher Scientific Inc.* | | 10,300 | | 361,324 | |
| | | | | |
MANAGED HEALTH CARE—0.6% | | | | | |
UnitedHealth Group Inc. | | 9,250 | | 217,560 | |
| | | | | |
MOVIES & ENTERTAINMENT—1.3% | | | | | |
Regal Entertainment Group, Cl. A | | 19,450 | | 254,017 | |
Viacom Inc., Cl. B * | | 13,850 | | 266,474 | |
| | | | 520,491 | |
OIL & GAS DRILLING—1.2% | | | | | |
Transocean Ltd.* | | 7,147 | | 482,280 | |
| | | | | |
OIL & GAS EQUIPMENT & SERVICES—0.6% | | | | | |
Weatherford International Ltd.* | | 14,500 | | 241,135 | |
| | | | | |
OIL & GAS EXPLORATION & PRODUCTION—3.1% | | | | | |
Anadarko Petroleum Corp. | | 11,750 | | 505,954 | |
Chesapeake Energy Corp. | | 22,700 | | 447,417 | |
Nexen Inc. | | 13,600 | | 259,760 | |
| | | | 1,213,131 | |
OTHER DIVERSIFIED FINANCIAL SERVICES—0.2% | | | | | |
Bank of America Corp. | | 9,050 | | 80,817 | |
| | | | | |
PACKAGED FOODS & MEATS—1.1% | | | | | |
General Mills Inc. | | 3,500 | | 177,415 | |
Kraft Foods Inc., Cl. A | | 11,600 | | 271,440 | |
| | | | 448,855 | |
PHARMACEUTICALS—6.4% | | | | | |
Abbott Laboratories | | 20,650 | | 864,202 | |
Allergan Inc. | | 6,250 | | 291,625 | |
Bristol-Myers Squibb Co. | | 7,400 | | 142,080 | |
Johnson & Johnson | | 11,850 | | 620,466 | |
| | | | | | |
23
| | SHARES | | VALUE | |
COMMON STOCKS—(CONT.) | | | | | |
PHARMACEUTICALS—(CONT.) | | | | | |
Novartis AG # | | 3,450 | | $ | 130,790 | |
Wyeth | | 11,250 | | 477,000 | |
| | | | 2,526,163 | |
PROPERTY & CASUALTY INSURANCE—0.6% | | | | | |
Travelers Cos. Inc., /The | | 5,600 | | 230,384 | |
| | | | | |
RAILROADS—1.3% | | | | | |
Burlington Northern Santa Fe Corp. | | 7,800 | | 526,344 | |
| | | | | |
RESTAURANTS—1.9% | | | | | |
McDonald’s Corp. | | 8,450 | | 450,300 | |
Starbucks Corp. * | | 22,450 | | 324,627 | |
| | | | 774,927 | |
SEMICONDUCTORS—2.5% | | | | | |
Broadcom Corp., Cl. A * | | 11,400 | | 264,366 | |
Intel Corp. | | 31,400 | | 495,492 | |
Taiwan Semiconductor Manufacturing Co., Ltd. # | | 21,600 | | 228,312 | |
| | | | 988,170 | |
SOFT DRINKS—2.9% | | | | | |
Coca-Cola Co., /The | | 14,550 | | 626,378 | |
PepsiCo Inc. | | 10,150 | | 505,064 | |
| | | | 1,131,442 | |
SPECIALIZED FINANCE—1.7% | | | | | |
CME Group Inc. | | 1,412 | | 312,546 | |
NYSE Euronext | | 16,250 | | 376,512 | |
| | | | 689,058 | |
SYSTEMS SOFTWARE—3.1% | | | | | |
Microsoft Corp. | | 59,500 | | 1,205,470 | |
| | | | | |
TOBACCO—3.4% | | | | | |
Altria Group Inc. | | 34,200 | | 558,486 | |
Philip Morris International Inc. | | 21,450 | | 776,490 | |
| | | | 1,334,976 | |
TOTAL COMMON STOCKS
(Cost $43,926,569) | | | | 37,575,482 | |
| | | | | |
| | PRINCIPAL | | | |
| | AMOUNT | | | |
SHORT-TERM INVESTMENTS—4.1% | | | | | |
TIME DEPOSITS—4.1% | | | | | |
Wells Fargo Grand Cayman, 0.03%, 5/1/09 | | 117,190 | | 117,190 | |
Citibank London, 0.03%, 5/1/09 | | 1,500,000 | | 1,500,000 | |
| | | | | |
TOTAL TIME DEPOSITS
(Cost $1,617,190) | | | | 1,617,190 | |
| | | | | |
Total Investments
(Cost $45,543,759)(a) | | 99.3 | % | 39,192,672 | |
Other Assets in Excess of Liabilities | | 0.7 | | 263,927 | |
| | | | | |
NET ASSETS | | 100.0 | % | $ | 39,456,599 | |
24
* | Non-income producing security. |
# | American Depositary Receipts. |
(a) | At April 30, 2009, the net unrealized depreciation on investments, based on cost for federal income tax purposes of $46,519,958 amounted to $7,327,286 which consisted of aggregate gross unrealized appreciation of $1,495,667 and aggregate gross unrealized depreciation of $8,822,953. |
See Notes to Financial Statements.
25
THE ALGER INSTITUTIONAL FUNDS | ALGER MIDCAP GROWTH INSTITUTIONAL FUND
Schedule of Investments (Unaudited) April 30, 2009
| | SHARES | | VALUE | |
COMMON STOCKS—98.9% | | | | | |
AEROSPACE & DEFENSE—0.9% | | | | | |
BE Aerospace Inc.* | | 704,790 | | $ | 7,604,684 | |
| | | | | |
APPAREL RETAIL—1.3% | | | | | |
Chico’s FAS Inc. * | | 447,300 | | 3,417,372 | |
TJX Cos Inc. | | 245,500 | | 6,866,635 | |
| | | | 10,284,007 | |
APPLICATION SOFTWARE—3.7% | | | | | |
Ansys Inc. * | | 87,800 | | 2,425,036 | |
Informatica Corp. * | | 555,400 | | 8,830,860 | |
Intuit Inc. * | | 215,700 | | 4,989,141 | |
Salesforce.com Inc. * | | 58,000 | | 2,482,980 | |
Solera Holdings Inc. * | | 206,800 | | 4,719,176 | |
Taleo Corp., Cl. A * | | 215,200 | | 2,584,552 | |
TIBCO Software Inc. * | | 576,290 | | 3,642,153 | |
| | | | 29,673,898 | |
ASSET MANAGEMENT & CUSTODY BANKS—2.4% | | | | | |
AllianceBernstein Holding LP | | 173,200 | | 3,034,464 | |
Invesco Ltd. | | 503,700 | | 7,414,464 | |
Northern Trust Corp. | | 176,600 | | 9,599,976 | |
| | | | 20,048,904 | |
BIOTECHNOLOGY—5.2% | | | | | |
Alexion Pharmaceuticals Inc. * | | 218,100 | | 7,288,902 | |
Biogen Idec Inc. * | | 94,800 | | 4,582,632 | |
Celgene Corp. * | | 153,300 | | 6,548,976 | |
Cephalon Inc. * | | 90,000 | | 5,904,900 | |
Genzyme Corp. * | | 83,200 | | 4,437,056 | |
Metabolix Inc. * | | 1,126,960 | | 8,902,984 | |
OSI Pharmaceuticals Inc. * | | 140,800 | | 4,726,656 | |
| | | | 42,392,106 | |
CASINOS & GAMING—1.5% | | | | | |
Las Vegas Sands Corp.* | | 1,554,200 | | 12,153,844 | |
| | | | | |
COMMERCIAL PRINTING—0.5% | | | | | |
Warnaco Group Inc., /The* | | 132,200 | | 3,812,648 | |
| | | | | |
COMMUNICATIONS EQUIPMENT—2.1% | | | | | |
Brocade Communications Systems Inc. * | | 745,800 | | 4,310,724 | |
F5 Networks Inc. * | | 81,700 | | 2,227,959 | |
Research In Motion Ltd. * | | 89,600 | | 6,227,200 | |
Starent Networks Corp. * | | 209,900 | | 4,141,327 | |
| | | | 16,907,210 | |
COMPUTER & ELECTRONICS RETAIL—1.6% | | | | | |
Best Buy Co., Inc. | | 78,100 | | 2,997,478 | |
GameStop Corp., Cl. A * | | 318,300 | | 9,599,928 | |
| | | | 12,597,406 | |
COMPUTER HARDWARE—2.0% | | | | | |
Apple Inc.* | | 125,400 | | 15,779,082 | |
| | | | | |
COMPUTER STORAGE & PERIPHERALS—1.2% | | | | | |
Data Domain Inc. * | | 226,200 | | 3,750,396 | |
| | | | | | |
26
| | SHARES | | VALUE | |
COMMON STOCKS—(CONT.) | | | | | |
COMPUTER STORAGE & PERIPHERALS—(CONT.) | | | | | |
NetApp Inc. * | | 333,800 | | $ | 6,108,540 | |
| | | | 9,858,936 | |
DATA PROCESSING & OUTSOURCED SERVICES—2.4% | | | | | |
Affiliated Computer Services Inc., Cl. A * | | 230,500 | | 11,151,590 | |
Mastercard Inc. | | 46,500 | | 8,530,425 | |
| | | | 19,682,015 | |
DIVERSIFIED REITS—0.5% | | | | | |
Vornado Realty Trust | | 77,600 | | 3,793,864 | |
| | | | | |
EDUCATION SERVICES—2.2% | | | | | |
Corinthian Colleges Inc. * | | 637,800 | | 9,822,120 | |
ITT Educational Services Inc. * | | 81,500 | | 8,212,755 | |
| | | | 18,034,875 | |
ELECTRIC UTILITIES—0.6% | | | | | |
Northeast Utilities | | 252,100 | | 5,299,142 | |
| | | | | |
ELECTRICAL COMPONENTS & EQUIPMENT—1.8% | | | | | |
AMETEK Inc. | | 179,400 | | 5,778,474 | |
First Solar Inc. * | | 22,300 | | 4,176,567 | |
General Cable Corp. * | | 171,900 | | 4,665,366 | |
| | | | 14,620,407 | |
ENVIRONMENTAL & FACILITIES SERVICES—0.5% | | | | | |
Covanta Holding Corp.* | | 300,500 | | 4,240,055 | |
| | | | | |
FOOD RETAIL—0.3% | | | | | |
Whole Foods Market Inc. | | 136,000 | | 2,819,280 | |
| | | | | |
FOOTWEAR—1.4% | | | | | |
Iconix Brand Group Inc.* | | 820,200 | | 11,696,052 | |
| | | | | |
GENERAL MERCHANDISE STORES—0.7% | | | | | |
Dollar Tree Inc.* | | 135,900 | | 5,754,006 | |
| | | | | |
GOLD—0.3% | | | | | |
Yamana Gold Inc. | | 330,600 | | 2,615,046 | |
| | | | | |
HEALTH CARE EQUIPMENT—2.0% | | | | | |
Covidien Ltd. | | 235,600 | | 7,770,088 | |
Insulet Corp. * | | 871,000 | | 5,008,250 | |
Intuitive Surgical Inc. * | | 24,800 | | 3,564,504 | |
| | | | 16,342,842 | |
HEALTH CARE FACILITIES—2.0% | | | | | |
Community Health Systems Inc. * | | 198,400 | | 4,531,456 | |
Universal Health Services Inc., Cl. B | | 91,200 | | 4,596,480 | |
VCA Antech Inc. * | | 270,100 | | 6,757,902 | |
| | | | 15,885,838 | |
HEALTH CARE SERVICES—2.7% | | | | | |
DaVita Inc. * | | 92,500 | | 4,289,225 | |
Express Scripts Inc. * | | 269,300 | | 17,227,121 | |
| | | | 21,516,346 | |
HEAVY ELECTRICAL EQUIPMENT—1.0% | | | | | |
Vestas Wind Systems A/S* | | 122,300 | | 8,082,696 | |
| | | | | | |
27
| | SHARES | | VALUE | |
COMMON STOCKS—(CONT.) | | | | | |
HOME ENTERTAINMENT SOFTWARE—2.7% | | | | | |
Activision Blizzard Inc. * | | 659,000 | | $ | 7,097,430 | |
Nintendo Co., Ltd. # | | 315,530 | | 10,617,585 | |
Rosetta Stone Inc. * | | 147,500 | | 4,417,625 | |
| | | | 22,132,640 | |
HOMEBUILDING—1.7% | | | | | |
KB Home | | 320,300 | | 5,787,821 | |
Meritage Homes Corp. * | | 197,700 | | 4,114,137 | |
NVR Inc. * | | 7,800 | | 3,941,886 | |
| | | | 13,843,844 | |
HOTELS RESORTS & CRUISE LINES—0.9% | | | | | |
Carnival Corp. | | 269,600 | | 7,246,848 | |
| | | | | |
HOUSEHOLD PRODUCTS—1.0% | | | | | |
Church & Dwight Co., Inc. | | 146,000 | | 7,943,860 | |
| | | | | |
INDUSTRIAL GASES—1.6% | | | | | |
Praxair Inc. | | 170,000 | | 12,683,700 | |
| | | | | |
INDUSTRIAL MACHINERY—2.3% | | | | | |
Clarcor Inc. | | 332,800 | | 10,343,424 | |
SPX Corp. | | 168,000 | | 7,756,560 | |
| | | | 18,099,984 | |
INTERNET RETAIL—2.3% | | | | | |
Expedia Inc. * | | 1,067,900 | | 14,534,119 | |
Shutterfly Inc. * | | 381,500 | | 4,887,015 | |
| | | | 19,421,134 | |
INTERNET SOFTWARE & SERVICES—5.1% | | | | | |
eBay Inc. * | | 650,000 | | 10,705,500 | |
IAC/InterActiveCorp. * | | 495,389 | | 7,936,132 | |
Netease.com #* | | 63,900 | | 1,928,502 | |
Omniture Inc. * | | 336,945 | | 4,151,162 | |
Vignette Corp. * | | 532,000 | | 4,394,320 | |
VistaPrint Ltd. * | | 161,300 | | 5,540,655 | |
Yahoo! Inc. * | | 481,100 | | 6,874,919 | |
| | | | 41,531,190 | |
IT CONSULTING & OTHER SERVICES—2.1% | | | | | |
Cognizant Technology Solutions Corp., Cl. A* | | 688,600 | | 17,070,394 | |
| | | | | |
LIFE SCIENCES TOOLS & SERVICES—2.0% | | | | | |
Charles River Laboratories International Inc. * | | 153,500 | | 4,244,275 | |
Icon PLC #* | | 741,198 | | 11,740,576 | |
| | | | 15,984,851 | |
MANAGED HEALTH CARE—0.7% | | | | | |
Aetna Inc. | | 245,800 | | 5,410,058 | |
| | | | | |
METAL & GLASS CONTAINERS—0.8% | | | | | |
Crown Holdings Inc. * | | 132,400 | | 2,919,420 | |
Silgan Holdings Inc. | | 75,600 | | 3,514,644 | |
| | | | 6,434,064 | |
MOVIES & ENTERTAINMENT—0.7% | | | | | |
Regal Entertainment Group, Cl. A | | 416,400 | | 5,438,184 | |
| | | | | | |
28
| | SHARES | | VALUE | |
COMMON STOCKS—(CONT.) | | | | | |
MULTI-UTILITIES—0.4% | | | | | |
Veolia Environnement# | | 105,300 | | $ | 2,875,743 | |
| | | | | |
OIL & GAS DRILLING—0.7% | | | | | |
Transocean Ltd.* | | 89,200 | | 6,019,216 | |
| | | | | |
OIL & GAS EQUIPMENT & SERVICES—0.7% | | | | | |
Smith International Inc. | | 221,100 | | 5,715,435 | |
| | | | | |
OIL & GAS EXPLORATION & PRODUCTION—5.2% | | | | | |
Chesapeake Energy Corp. | | 300,700 | | 5,926,797 | |
Concho Resources Inc. * | | 135,100 | | 3,704,442 | |
Denbury Resources Inc. * | | 132,500 | | 2,157,100 | |
Linc Energy Ltd. * | | 1,776,908 | | 3,276,790 | |
Newfield Exploration Co. * | | 200,800 | | 6,260,944 | |
Nexen Inc. | | 421,500 | | 8,050,650 | |
Plains Exploration & Production Co. * | | 206,500 | | 3,896,655 | |
Quicksilver Resources Inc. * | | 1,015,600 | | 8,256,828 | |
| | | | 41,530,206 | |
OIL & GAS REFINING & MARKETING—0.7% | | | | | |
NuStar Energy LP | | 31,600 | | 1,592,324 | |
Sunoco Inc. | | 148,400 | | 3,934,084 | |
| | | | 5,526,408 | |
OTHER DIVERSIFIED FINANCIAL SERVICES—0.7% | | | | | |
BM&F BOVESPA SA | | 1,452,487 | | 5,940,272 | |
| | | | | |
PACKAGED FOODS & MEATS—2.9% | | | | | |
Flowers Foods Inc. | | 228,300 | | 5,273,730 | |
General Mills Inc. | | 198,500 | | 10,061,965 | |
Ralcorp Holdings Inc. * | | 131,100 | | 7,493,676 | |
| | | | 22,829,371 | |
PHARMACEUTICALS—4.8% | | | | | |
Allergan Inc. | | 66,800 | | 3,116,888 | |
Ardea Biosciences Inc. * | | 141,500 | | 1,746,110 | |
Auxilium Pharmaceuticals Inc. * | | 241,100 | | 5,521,190 | |
Optimer Pharmaceuticals Inc. * | | 617,674 | | 8,628,906 | |
Perrigo Co. | | 222,800 | | 5,774,976 | |
Shire PLC # | | 105,700 | | 3,939,439 | |
Teva Pharmaceutical Industries Ltd. # | | 243,500 | | 10,687,215 | |
| | | | 39,414,724 | |
PROPERTY & CASUALTY INSURANCE—0.4% | | | | | |
Travelers Cos. Inc., /The | | 69,100 | | 2,842,774 | |
| | | | | |
PUBLISHING—0.8% | | | | | |
McGraw-Hill Cos. Inc., /The | | 201,500 | | 6,075,225 | |
| | | | | |
REAL ESTATE SERVICES—0.1% | | | | | |
Mack-Cali Realty Corp. | | 34,200 | | 918,612 | |
| | | | | |
RESEARCH & CONSULTING SERVICES—1.2% | | | | | |
FTI Consulting Inc.* | | 179,200 | | 9,834,496 | |
| | | | | |
RESTAURANTS—1.7% | | | | | |
McCormick & Schmick’s Seafood Restaurants Inc. * | | 544,950 | | 3,858,246 | |
| | | | | | |
29
| | SHARES | | VALUE | |
COMMON STOCKS—(CONT.) | | | | | |
RESTAURANTS—(CONT.) | | | | | |
Starbucks Corp. * | | 660,800 | | $ | 9,555,168 | |
| | | | 13,413,414 | |
SECURITY & ALARM SERVICES—1.2% | | | | | |
Geo Group Inc., /The* | | 570,300 | | 9,484,089 | |
| | | | | |
SEMICONDUCTORS—3.6% | | | | | |
Altera Corp. | | 358,700 | | 5,850,397 | |
Atheros Communications Inc. * | | 432,535 | | 7,448,253 | |
Broadcom Corp., Cl. A * | | 289,200 | | 6,706,548 | |
Marvell Technology Group Ltd. * | | 655,700 | | 7,199,586 | |
ON Semiconductor Corp. * | | 318,100 | | 1,724,102 | |
| | | | 28,928,886 | |
SOFT DRINKS—0.6% | | | | | |
Hansen Natural Corp.* | | 118,300 | | 4,821,908 | |
| | | | | |
SPECIALIZED FINANCE—1.0% | | | | | |
NYSE Euronext | | 347,100 | | 8,042,307 | |
| | | | | |
SPECIALIZED REITS—0.6% | | | | | |
Host Hotels & Resorts Inc. | | 587,300 | | 4,516,337 | |
| | | | | |
SPECIALTY CHEMICALS—0.7% | | | | | |
Albemarle Corp. | | 136,000 | | 3,647,520 | |
Nalco Holding Co. | | 124,500 | | 2,031,840 | |
| | | | 5,679,360 | |
SPECIALTY STORES—0.9% | | | | | |
PetSmart Inc. | | 307,000 | | 7,024,160 | |
| | | | | |
SYSTEMS SOFTWARE—1.6% | | | | | |
Red Hat Inc. * | | 112,600 | | 1,944,602 | |
Symantec Corp. * | | 621,300 | | 10,717,425 | |
| | | | 12,662,027 | |
TECHNOLOGY DISTRIBUTORS—0.5% | | | | | |
Mellanox Technologies Ltd.* | | 377,480 | | 3,850,296 | |
| | | | | |
THRIFTS & MORTGAGE FINANCE—1.6% | | | | | |
People’s United Financial Inc. | | 411,400 | | 6,426,068 | |
TFS Financial Corp. | | 527,900 | | 6,192,267 | |
| | | | 12,618,335 | |
WIRELESS TELECOMMUNICATION SERVICES—1.6% | | | | | |
American Tower Corp., Cl. A * | | 237,300 | | 7,536,648 | |
SBA Communications Corp. * | | 202,065 | | 5,092,038 | |
| | | | 12,628,686 | |
TOTAL COMMON STOCKS
(Cost $869,254,611) | | | | 797,928,227 | |
| | | | | | |
| | PRINCIPAL | | | |
| | AMOUNT | | | |
CORPORATE BONDS—0.3% | | | | | |
CASINOS & GAMING—0.3% | | | | | |
Wynn Las Vegas, LLC / Wynn Las Vegas Capital Corp., 0.06%, 12/1/14
(Cost $2,545,577) | | 3,096,000 | | 2,631,600 | |
30
| | PRINCIPAL | | | |
| | AMOUNT | | VALUE | |
CONVERTIBLE CORPORATE BONDS —1.2% | | | | | |
OIL & GAS DRILLING—0.4% | | | | | |
Transocean Inc., 1.50%, 12/15/37 | | $ | 3,929,000 | | $ | 3,378,940 | |
| | | | | |
WIRELESS TELECOMMUNICATION SERVICES—0.8% | | | | | |
SBA Communications Corp., 4.00%, 10/1/14(a) | | 5,922,000 | | 6,121,868 | |
| | | | | |
TOTAL CONVERTIBLE CORPORATE BONDS
(Cost $9,956,183) | | | | 9,500,808 | |
| | | | | |
SHORT-TERM INVESTMENTS—0.4% | | | | | |
TIME DEPOSITS—0.4% | | | | | |
Citibank London, 0.03%, 5/01/09
(Cost $3,464,196) | | 3,464,196 | | 3,464,196 | |
| | | | | |
Total Investments
(Cost $885,220,567)(b) | | 100.8 | % | 813,524,831 | |
Liabilities in Excess of Other Assets | | (0.8 | ) | (6,479,426 | ) |
| | | | | |
NET ASSETS | | 100.0 | % | $ | 807,045,405 | |
| | | | | | | |
* | Non-income producing security. |
# | American Depositary Receipts. |
(a) | Pursuant to Securities and Exchange Commission Rule 144A, these securities may be sold prior to their maturity only to qualified institutional buyers. These securities are deemed to be liquid and represent 0.8%, of the net assets of the Fund. |
(b) | At April 30, 2009, the net unrealized depreciation on investments, based on cost for federal income tax purposes of $967,206,742 amounted to $153,681,911 which consisted of aggregate gross unrealized appreciation of $44,720,633 and aggregate gross unrealized depreciation of $198,402,544. |
See Notes to Financial Statements.
31
THE ALGER INSTITUTIONAL FUNDS | ALGER SMALLCAP GROWTH INSTITUTIONAL FUND
Schedule of Investments (Unaudited) April 30, 2009
| | SHARES | | VALUE | |
COMMON STOCKS—96.8% | | | | | |
AEROSPACE & DEFENSE—2.2% | | | | | |
BE Aerospace Inc. * | | 478,005 | | $ | 5,157,674 | |
Esterline Technologies Corp. * | | 240,675 | | 6,341,785 | |
Orbital Sciences Corp. * | | 312,250 | | 4,827,385 | |
| | | | 16,326,844 | |
AIRLINES—1.0% | | | | | |
Airtran Holdings Inc.* | | 1,032,490 | | 7,175,806 | |
| | | | | |
APPAREL RETAIL—2.9% | | | | | |
Aeropostale Inc. * | | 274,350 | | 9,319,669 | |
Chico’s FAS Inc. * | | 561,300 | | 4,288,332 | |
Childrens Place Retail Stores Inc., /The * | | 128,200 | | 3,646,008 | |
J Crew Group Inc. * | | 228,550 | | 3,933,346 | |
| | | | 21,187,355 | |
APPLICATION SOFTWARE—6.5% | | | | | |
Ansys Inc. * | | 234,286 | | 6,470,979 | |
Concur Technologies Inc. * | | 207,150 | | 5,607,551 | |
Informatica Corp. * | | 424,700 | | 6,752,730 | |
Pegasystems Inc. | | 397,350 | | 6,941,705 | |
Solera Holdings Inc. * | | 352,400 | | 8,041,767 | |
Taleo Corp., Cl. A * | | 696,900 | | 8,369,768 | |
TIBCO Software Inc. * | | 968,680 | | 6,122,058 | |
VanceInfo Technologies Inc. #* | | 102,050 | | 812,318 | |
| | | | 49,118,876 | |
ASSET MANAGEMENT & CUSTODY BANKS—0.4% | | | | | |
AllianceBernstein Holding LP | | 187,150 | | 3,278,868 | |
| | | | | |
BIOTECHNOLOGY—5.1% | | | | | |
Alexion Pharmaceuticals Inc. * | | 265,050 | | 8,857,970 | |
Allos Therapeutics Inc. * | | 896,100 | | 5,493,093 | |
Cubist Pharmaceuticals Inc. * | | 163,250 | | 2,709,950 | |
Myriad Genetics Inc. * | | 183,300 | | 7,110,207 | |
OSI Pharmaceuticals Inc. * | | 180,250 | | 6,050,993 | |
Seattle Genetics Inc. * | | 464,800 | | 4,290,104 | |
United Therapeutics Corp. * | | 56,415 | | 3,543,426 | |
| | | | 38,055,743 | |
CASINOS & GAMING—2.1% | | | | | |
Bally Technologies Inc. * | | 200,100 | | 5,238,618 | |
Penn National Gaming Inc. * | | 277,400 | | 9,437,148 | |
| | | | 14,675,766 | |
COMMUNICATIONS EQUIPMENT—4.0% | | | | | |
Brocade Communications Systems Inc. * | | 864,550 | | 4,997,099 | |
F5 Networks Inc. * | | 196,700 | | 5,364,009 | |
Nice Systems Ltd. #* | | 324,655 | | 8,314,415 | |
Polycom Inc. * | | 215,305 | | 4,013,285 | |
Starent Networks Corp. * | | 356,400 | | 7,031,772 | |
| | | | 29,720,580 | |
COMPUTER STORAGE & PERIPHERALS—0.9% | | | | | |
Synaptics Inc.* | | 201,725 | | 6,552,028 | |
| | | | | | |
32
| | SHARES | | VALUE | |
COMMON STOCKS—(CONT.) | | | | | |
CONSTRUCTION & ENGINEERING—2.1% | | | | | |
Aecom Technology Corp. * | | 293,550 | | $ | 7,553,042 | |
URS Corp. * | | 185,705 | | 8,182,162 | |
| | | | 15,735,204 | |
DATA PROCESSING & OUTSOURCED SERVICES—3.2% | | | | | |
NeuStar Inc., Cl. A * | | 254,760 | | 4,842,988 | |
TeleTech Holdings Inc. * | | 650,250 | | 8,628,817 | |
VenFone Holdings Inc. * | | 458,045 | | 3,439,918 | |
Wright Express Corp. * | | 302,535 | | 6,922,001 | |
| | | | 23,833,724 | |
DISTILLERS & VINTNERS—1.1% | | | | | |
Central European Distribution Corp.* | | 370,800 | | 8,305,920 | |
| | | | | |
DISTRIBUTORS—1.3% | | | | | |
LKQ Corp.* | | 550,590 | | 9,349,018 | |
| | | | | |
EDUCATION SERVICES—1.4% | | | | | |
American Public Education Inc. * | | 104,250 | | 3,753,000 | |
Corinthian Colleges Inc. * | | 454,650 | | 7,001,610 | |
| | | | 10,754,610 | |
ELECTRIC UTILITIES—1.3% | | | | | |
ITC Holdings Corp. | | 218,385 | | 9,506,299 | |
| | | | | |
ELECTRICAL COMPONENTS & EQUIPMENT—0.8% | | | | | |
SunPower Corp., Cl. A * | | 59,800 | | 1,637,324 | |
SunPower Corp., Cl. B * | | 55,700 | | 1,412,552 | |
Woodward Governor Co. | | 154,500 | | 3,083,820 | |
| | | | 6,133,696 | |
ENVIRONMENTAL & FACILITIES SERVICES—1.1% | | | | | |
Waste Connections Inc.* | | 323,500 | | 8,339,830 | |
| | | | | |
FOOD RETAIL—0.9% | | | | | |
Whole Foods Market Inc. | | 326,750 | | 6,773,528 | |
| | | | | |
FOOTWEAR—1.3% | | | | | |
Iconix Brand Group Inc.* | | 703,875 | | 10,037,258 | |
| | | | | |
HEALTH CARE DISTRIBUTORS—1.0% | | | | | |
Owens & Minor Inc. | | 146,850 | | 5,092,758 | |
PharMerica Corp. * | | 118,950 | | 2,170,838 | |
| | | | 7,263,596 | |
HEALTH CARE EQUIPMENT—4.3% | | | | | |
Hologic Inc. * | | 286,650 | | 4,259,619 | |
Insulet Corp. * | | 376,700 | | 2,166,025 | |
Masimo Corp. * | | 252,150 | | 7,287,135 | |
NuVasive Inc. * | | 228,000 | | 8,641,200 | |
Thoratec Corp. * | | 290,900 | | 8,453,554 | |
Wright Medical Group Inc. * | | 92,900 | | 1,277,375 | |
| | | | 32,084,908 | |
HEALTH CARE FACILITIES—1.2% | | | | | |
Community Health Systems Inc.* | | 405,200 | | 9,254,768 | |
| | | | | |
HEALTH CARE SERVICES—0.5% | | | | | |
Gentiva Health Services Inc.* | | 215,400 | | 3,431,322 | |
| | | | | | |
33
| | SHARES | | VALUE | |
COMMON STOCKS—(CONT.) | | | | | |
HEALTH CARE SUPPLIES—1.6% | | | | | |
Immucor Inc. * | | 211,000 | | $ | 3,437,190 | |
Inverness Medical Innovations Inc. * | | 272,300 | | 8,792,567 | |
| | | | 12,229,757 | |
HOUSEWARES & SPECIALTIES—0.8% | | | | | |
Tupperware Brands Corp. | | 247,950 | | 6,206,189 | |
| | | | | |
INDUSTRIAL MACHINERY—2.6% | | | | | |
Actuant Corp., Cl. A | | 501,360 | | 6,146,674 | |
Clarcor Inc. | | 229,100 | | 7,120,427 | |
RBC Bearings Inc. * | | 320,440 | | 5,928,140 | |
| | | | 19,195,241 | |
INTERNET RETAIL—1.8% | | | | | |
NetFlix Inc. * | | 115,500 | | 5,233,305 | |
priceline.com Inc. * | | 84,260 | | 8,180,803 | |
| | | | 13,414,108 | |
INTERNET SOFTWARE & SERVICES—4.4% | | | | | |
GSI Commerce Inc. * | | 597,822 | | 8,495,051 | |
Omniture Inc. * | | 254,805 | | 3,139,198 | |
SkillSoft PLC. #* | | 1,053,050 | | 8,866,681 | |
Vignette Corp. * | | 398,550 | | 3,292,023 | |
VistaPrint Ltd. * | | 264,090 | | 9,071,491 | |
| | | | 32,864,444 | |
INVESTMENT BANKING & BROKERAGE—1.7% | | | | | |
GFI Group Inc. | | 326,750 | | 1,333,140 | |
Investment Technology Group Inc. * | | 339,700 | | 7,738,366 | |
Lazard Ltd., Cl. A | | 134,450 | | 3,670,485 | |
| | | | 12,741,991 | |
IT CONSULTING & OTHER SERVICES—0.8% | | | | | |
Mantech International Corp., Cl. A* | | 154,450 | | 5,589,546 | |
| | | | | |
LEISURE FACILITIES—1.0% | | | | | |
Life Time Fitness Inc.* | | 393,545 | | 7,382,904 | |
| | | | | |
LIFE SCIENCES TOOLS & SERVICES—3.2% | | | | | |
Icon PLC #* | | 506,402 | | 8,021,407 | |
Illumina Inc. * | | 206,910 | | 7,728,089 | |
Parexel International Corp. * | | 779,612 | | 7,725,955 | |
| | | | 23,475,451 | |
MANAGED HEALTH CARE—1.1% | | | | | |
AMERIGROUP Corp.* | | 276,300 | | 8,253,081 | |
| | | | | |
METAL & GLASS CONTAINERS—1.1% | | | | | |
Silgan Holdings Inc. | | 165,400 | | 7,689,446 | |
| | | | | |
MOVIES & ENTERTAINMENT—1.1% | | | | | |
Regal Entertainment Group, Cl. A | | 654,350 | | 8,545,811 | |
| | | | | |
OIL & GAS EQUIPMENT & SERVICES—1.9% | | | | | |
Acergy SA # | | 271,350 | | 2,092,109 | |
Dril-Quip Inc. * | | 145,720 | | 5,009,854 | |
IHS Inc., Cl. A * | | 177,250 | | 7,331,059 | |
| | | | 14,433,022 | |
| | | | | | |
34
| | SHARES | | VALUE | |
COMMON STOCKS—(CONT.) | | | | | |
OIL & GAS EXPLORATION & PRODUCTION—4.1% | | | | | |
Comstock Resources Inc. * | | 105,350 | | $ | 3,630,361 | |
Concho Resources Inc. * | | 305,310 | | 8,371,600 | |
Denbury Resources Inc. * | | 268,500 | | 4,371,180 | |
Mariner Energy Inc. * | | 588,950 | | 6,702,251 | |
Penn Virginia Corp. | | 367,099 | | 5,165,083 | |
Quicksilver Resources Inc. * | | 215,700 | | 1,753,641 | |
| | | | 29,994,116 | |
PACKAGED FOODS & MEATS—1.8% | | | | | |
Flowers Foods Inc. | | 240,350 | | 5,552,085 | |
Hain Celestial Group Inc. * | | 446,665 | | 7,454,838 | |
| | | | 13,006,923 | |
PHARMACEUTICALS—4.3% | | | | | |
Auxilium Pharmaceuticals Inc. * | | 268,880 | | 6,157,352 | |
Medicis Pharmaceutical Corp., Cl. A | | 464,250 | | 7,460,498 | |
Mylan Inc. * | | 631,050 | | 8,361,413 | |
Optimer Pharmaceuticals Inc. * | | 739,962 | | 10,337,268 | |
| | | | 32,316,531 | |
PROPERTY & CASUALTY INSURANCE—1.0% | | | | | |
First Mercury Financial Corp.* | | 557,901 | | 7,375,451 | |
| | | | | |
RAILROADS—0.2% | | | | | |
Genesee & Wyoming Inc., Cl. A* | | 40,850 | | 1,225,500 | |
| | | | | |
REGIONAL BANKS—1.1% | | | | | |
Boston Private Financial Holdings Inc. | | 371,750 | | 1,713,768 | |
First Commonwealth Financial Corp. | | 577,550 | | 5,007,358 | |
Webster Financial Corp. | | 246,900 | | 1,291,287 | |
| | | | 8,012,413 | |
REINSURANCE—1.0% | | | | | |
Platinum Underwriters Holdings Ltd. | | 251,300 | | 7,229,901 | |
| | | | | |
RESEARCH & CONSULTING SERVICES—1.2% | | | | | |
FTI Consulting Inc. * | | 144,010 | | 7,903,269 | |
Resources Connection Inc. * | | 65,300 | | 1,276,615 | |
| | | | 9,179,884 | |
RESTAURANTS—1.2% | | | | | |
Jack in the Box Inc. * | | 215,400 | | 5,296,686 | |
McCormick & Schmick’s Seafood Restaurants Inc. * | | 553,200 | | 3,916,656 | |
| | | | 9,213,342 | |
SECURITY & ALARM SERVICES—1.2% | | | | | |
Geo Group Inc., /The* | | 524,450 | | 8,721,604 | |
| | | | | |
SEMICONDUCTOR EQUIPMENT—0.2% | | | | | |
ATMI Inc.* | | 96,050 | | 1,516,630 | |
| | | | | |
SEMICONDUCTORS—5.1% | | | | | |
Atheros Communications Inc. * | | 510,935 | | 8,798,300 | |
Cavium Networks Inc. * | | 207,948 | | 2,615,986 | |
Microsemi Corp. * | | 399,750 | | 5,364,645 | |
Monolithic Power Systems Inc. * | | 376,800 | | 6,970,800 | |
Netlogic Microsystems Inc. * | | 162,450 | | 5,294,246 | |
ON Semiconductor Corp. * | | 1,390,400 | | 7,535,968 | |
| | | | | | |
35
| | SHARES | | VALUE | |
COMMON STOCKS—(CONT.) | | | | | |
SEMICONDUCTORS—(CONT.) | | | | | |
Volterra Semiconductor Corp.* | | 141,550 | | $ | 1,626,410 | |
| | | | 38,206,355 | |
SPECIALTY CHEMICALS—0.5% | | | | | |
Nalco Holding Co. | | 246,400 | | 4,021,248 | |
| | | | | |
TECHNOLOGY DISTRIBUTORS—1.2% | | | | | |
Mellanox Technologies Ltd.* | | 852,900 | | 8,699,580 | |
| | | | | |
THRIFTS & MORTGAGE FINANCE—1.1% | | | | | |
Brookline Bancorp Inc. | | 849,150 | | 8,423,568 | |
| | | | | |
WIRELESS TELECOMMUNICATION SERVICES—1.9% | | | | | |
SBA Communications Corp.* | | 357,725 | | 9,014,670 | |
Syniverse Holdings Inc.* | | 389,000 | | 4,901,400 | |
| | | | 13,916,070 | |
TOTAL COMMON STOCKS
(Cost $863,853,689) | | | | 719,975,654 | |
| | | | | | |
| | PRINCIPAL | | | |
| | AMOUNT | | | |
SHORT-TERM INVESTMENTS—4.7% | | | | | |
TIME DEPOSITS—4.7% | | | | | |
Wells Fargo Grand Cayman, 0.03%, 5/1/09 | | 6,514,330 | | 6,514,330 | |
Citibank London, 0.03%, 5/1/09 | | 28,500,000 | | 28,500,000 | |
| | | | | |
TOTAL TIME DEPOSITS
(Cost $35,014,330) | | | | 35,014,330 | |
| | | | | |
Total Investments
(Cost $898,868,019)(a) | | 101.5 | % | 754,989,984 | |
Liabilities in Excess of Other Assets | | (1.5 | ) | (10,797,815 | ) |
| | | | | |
NET ASSETS | | 100.0 | % | $ | 744,192,169 | |
| | | | | | |
* | Non-income producing security. |
# | American Depositary Receipts. |
(a) | At April 30, 2009, the net unrealized depreciation on investments, based on cost for federal income tax purposes of $899,673,529 amounted to $144,683,545 which consisted of aggregate gross unrealized appreciation of $45,572,965 and aggregate gross unrealized depreciation of $190,256,510. |
See Notes to Financial Statements.
36
(This page has been intentionally left blank)
THE ALGER INSTITUTIONAL FUNDS
Statements of Assets and Liabilities (Unaudited) April 30, 2009
| | Capital | | | |
| | Appreciation | | LargeCap Growth | |
| | Fund | | Fund | |
ASSETS: | | | | | |
Investments in securities, at value (Identified cost)* | | | | | |
see accompanying schedules of investments | | $ | 503,318,601 | | $ | 39,192,672 | |
Receivable for investment securities sold | | 30,838,596 | | 344,741 | |
Receivable for shares of beneficial interest sold | | 734,690 | | 122,685 | |
Dividends and interest receivable | | 632,165 | | 35,103 | |
Other receivables | | — | | — | |
Prepaid Expenses | | 54,321 | | 14,645 | |
Total Assets | | 535,578,373 | | 39,709,846 | |
LIABILITIES: | | | | | |
Payable for investment securities purchased | | 34,327,229 | | 165,386 | |
Payable for foreign currency contracts | | 9,901 | | — | |
Payable for shares of beneficial interest redeemed | | 411,063 | | 31,379 | |
Accrued investment advisory fees | | 320,184 | | 22,191 | |
Accrued transfer agent fees | | 25,647 | | 1,767 | |
Accrued distribution fees | | 23,829 | | 2,146 | |
Accrued administrative fees | | 10,870 | | 860 | |
Accrued shareholder servicing fees | | 98,822 | | 7,814 | |
Accrued other expenses | | 76,138 | | 21,704 | |
Total Liabilities | | 35,303,683 | | 253,247 | |
NET ASSETS | | $ | 500,274,690 | | $ | 39,456,599 | |
Net Assets Consist of: | | | | | |
Paid in capital | | 756,272,239 | | 63,477,870 | |
Undistributed net investment income (accumulated loss) | | 1,299,480 | | 79,805 | |
Undistributed net realized gain (accumulated loss) | | (229,675,196 | ) | (17,749,989 | |
Net unrealized depreciation on investments | | (27,621,833 | ) | (6,351,087 | |
NET ASSETS | | $ | 500,274,690 | | $ | 39,456,599 | |
SHARES OF BENEFICIAL INTEREST OUTSTANDING—NOTE 6 | | | | | |
Class I | | 33,262,160 | | 3,655,409 | |
Class R | | 4,729,786 | | 598,453 | |
Net Asset Value Per Share | | | | | |
Class I | | $ | 13.22 | | $ | 9.31 | |
Class R | | $ | 12.81 | | $ | 9.05 | |
*Identified Cost | | $ | 530,939,171 | | $ | 45,543,759 | |
See Notes to Financial Statements.
38
| | MidCap Growth | | SmallCap Growth | |
| | Fund | | Fund | |
ASSETS: | | | | | |
Investments in securities, at value (Identified cost)* | | | | | |
see accompanying schedules of investments | | $ | 813,524,831 | | $ | 754,989,984 | |
Receivable for investment securities sold | | 37,540,522 | | 7,883,757 | |
Receivable for shares of beneficial interest sold | | 4,692,503 | | 3,152,262 | |
Dividends and interest receivable | | 372,631 | | 83,912 | |
Other receivables | | 12,912 | | — | |
Prepaid Expenses | | 108,224 | | 72,137 | |
Total Assets | | 856,251,623 | | 766,182,052 | |
LIABILITIES: | | | | | |
Payable for investment securities purchased | | 46,715,836 | | 19,855,159 | |
Payable for foreign currency contracts | | — | | — | |
Payable for shares of beneficial interest redeemed | | 1,626,456 | | 1,178,050 | |
Accrued investment advisory fees | | 494,528 | | 465,722 | |
Accrued transfer agent fees | | 34,150 | | 192,436 | |
Accrued distribution fees | | 16,468 | | 16,204 | |
Accrued administrative fees | | 17,894 | | 15,812 | |
Accrued shareholder servicing fees | | 162,674 | | 143,741 | |
Accrued other expenses | | 138,212 | | 122,759 | |
Total Liabilities | | 49,206,218 | | 21,989,883 | |
NET ASSETS | | $ | 807,045,405 | | $ | 744,192,169 | |
Net Assets Consist of: | | | | | |
Paid in capital | | 1,603,652,960 | | 1,098,285,539 | |
Undistributed net investment income (accumulated loss) | | (1,350,334 | ) | (2,868,188 | ) |
Undistributed net realized gain (accumulated loss) | | (723,561,485 | ) | (207,347,147 | ) |
Net unrealized depreciation on investments | | (71,695,736 | ) | (143,878,035 | ) |
NET ASSETS | | $ | 807,045,405 | | $ | 744,192,169 | |
SHARES OF BENEFICIAL INTEREST OUTSTANDING—NOTE 6 | | | | | |
Class I | | | | | |
Class R | | 86,351,408 | | 41,869,147 | |
Net Asset Value Per Share | | 4,858,881 | | 2,541,572 | |
Class I | | $ | 8.87 | | $ | 16.78 | |
Class R | | $ | 8.53 | | $ | 16.31 | |
*Identified Cost | | $ | 885,220,567 | | $ | 898,868,019 | |
39
THE ALGER INSTITUTIONAL FUNDS
Statements of Operations (Unaudited)
For the six months ended April 30, 2009
| | Capital | | | |
| | Appreciation | | LargeCap Growth | |
| | Fund | | Fund | |
INCOME: | | | | | |
Dividends (net of foreign withholding taxes*) | | $ | 4,047,841 | | $ | 325,764 | |
Interest (net of foreign withholding*) | | 64,364 | | 825 | |
Total Income | | 4,112,205 | | 326,589 | |
EXPENSES | | | | | |
Advisory fees—Note 3(a) | | 1,756,937 | | 114,621 | |
Distribution fees—Note3(b): | | | | | |
Class R | | 128,848 | | 12,192 | |
Shareholder servicing fees | | 542,265 | | 40,359 | |
Administrative fees—Note 3(a) | | 59,649 | | 4,439 | |
Custodian fees | | 57,800 | | 21,340 | |
Transfer agent fees and expenses—Note 3(d)(e) | | 95,985 | | 5,950 | |
Prepaid expenses | | 65,662 | | 18,190 | |
Printing fees | | 20,125 | | 4,025 | |
Professional fees | | 21,571 | | 5,654 | |
Registration fees | | 13,592 | | 10,296 | |
Trustee fees—Note 3(f) | | 6,447 | | 6,447 | |
Miscellaneous | | 43,844 | | 3,271 | |
Total Expenses | | 2,812,725 | | 246,784 | |
NET INVESTMENT INCOME (LOSS) | | 1,299,480 | | 79,805 | |
REALIZED AND UNREALIZED GAIN (LOSS) ON INVESTMENTS AND FOREIGN CURRENCY TRANSACTIONS: | | | | | |
Net realized loss on investments | | (109,167,263 | ) | (5,180,593 | ) |
Net realized loss on foreign currency transactions | | (6,226 | ) | — | |
Net change in unrealized appreciation (depreciation) on investments and foreign currency translations | | 109,439,059 | | 6,129,531 | |
Net realized and unrealized gain (loss) on investments, options and foreign currency | | 265,570 | | 948,938 | |
NET INCREASE (DECREASE) IN NET ASSETS RESULTING FROM OPERATIONS | | $ | 1,565,050 | | $ | 1,028,743 | |
*Foreign withholding taxes | | $ | 69,979 | | $ | 3,096 | |
See Notes to Financial Statements.
40
| | MidCap Growth | | SmallCap Growth | |
| | Fund | | Fund | |
INCOME: | | | | | |
Dividends (net of foreign withholding taxes*) | | $ | 3,321,744 | | $ | 1,453,258 | |
Interest (net of foreign withholding*) | | 42,625 | | 15,174 | |
Total Income | | 3,364,369 | | 1,468,432 | |
EXPENSES | | | | | |
Advisory fees—Note 3(a) | | 2,980,649 | | 2,551,802 | |
Distribution fees—Note3(b): | | | | | |
Class R | | 91,692 | | 89,372 | |
Shareholder servicing fees | | 980,476 | | 787,593 | |
Administrative fees—Note 3(a) | | 107,852 | | 86,635 | |
Custodian fees | | 102,930 | | 28,550 | |
Transfer agent fees and expenses—Note 3(d)(e) | | 140,385 | | 490,855 | |
Prepaid expenses | | 140,331 | | 90,462 | |
Printing fees | | 32,920 | | 95,400 | |
Professional fees | | 30,361 | | 31,881 | |
Registration fees | | 14,525 | | 14,117 | |
Trustee fees—Note 3(f) | | 6,447 | | 6,447 | |
Miscellaneous | | 86,135 | | 63,506 | |
Total Expenses | | 4,714,703 | | 4,336,620 | |
NET INVESTMENT INCOME (LOSS) | | (1,350,334 | ) | (2,868,188 | ) |
REALIZED AND UNREALIZED GAIN (LOSS) ON INVESTMENTS AND FOREIGN CURRENCY TRANSACTIONS: | | | | | |
Net realized loss on investments | | (351,121,717 | ) | (128,715,936 | ) |
Net realized loss on foreign currency transactions | | (22,821 | ) | — | |
Net change in unrealized appreciation (depreciation) on investments and foreign currency translations | | 350,388,244 | | 145,940,609 | |
Net realized and unrealized gain (loss) on investments, options and foreign currency | | (756,294 | ) | 17,224,673 | |
NET INCREASE (DECREASE) IN NET ASSETS RESULTING FROM OPERATIONS | | $ | (2,106,628 | ) | $ | 14,356,485 | |
*Foreign withholding taxes | | $ | 71,974 | | $ | — | |
41
THE ALGER INSTITUTIONAL FUNDS
Statements of Changes in Net Assets
| | Capital Appreciation Fund | |
| | For the | | | |
| | Six Months Ended | | For the | |
| | April 30, 2009 | | Year Ended | |
| | (Unaudited) | | October 31, 2008 | |
Net investment income (loss) | | $ | 1,299,480 | | $ | (1,617,140 | ) |
Net realized loss on investments and foreign currency transactions | | (109,173,489 | ) | (109,247,661 | ) |
Net change in unrealized appreciation (depreciation) on investments, options and foreign currency translations | | 109,439,059 | | (196,607,893 | ) |
Net increase (decrease) in net assets resulting from operations | | 1,565,050 | | (307,472,694 | ) |
Distributions to shareholders from: | | | | | |
Net realized gains | | | | | |
Class I | | — | | — | |
Class R | | — | | — | |
Total distributions to shareholders | | — | | — | |
Increase (decrease) from shares of beneficial interest transactions: | | | | | |
Class I | | 27,338,472 | | 150,407,353 | |
Class R | | 6,758,196 | | 44,308,239 | |
Net increase (decrease) from shares of beneficial interest transactions—Note 6 | | 34,096,668 | | 194,715,592 | |
Total increase (decrease) | | 35,661,718 | | (112,757,102 | ) |
Net Assets: | | | | | |
Beginning of period | | 464,612,972 | | 577,370,074 | |
END OF PERIOD | | $ | 500,274,690 | | $ | 464,612,972 | |
Undistributed net investment income (accumulated loss) | | $ | 1,299,480 | | $ | — | |
See Notes to Financial Statements.
42
| | LargeCap Growth Fund | | MidCap Growth Fund | | SmallCap Growth Fund | |
| | For the | | | | For the | | | | For the | | | |
| | Six Months Ended | | For the | | Six Months Ended | | For the | | Six Months Ended | | For the | |
| | April 30, 2009 | | Year Ended | | April 30, 2009 | | Year Ended | | April 30, 2009 | | Year Ended | |
| | (Unaudited) | | October 31, 2008 | | (Unaudited) | | October 31, 2008 | | (Unaudited) | | October 31, 2008 | |
Net investment income (loss) | | $ | 79,805 | | $ | (61,020 | ) | $ | (1,350,334 | ) | $ | (9,762,757 | ) | $ | (2,868,188 | ) | $ | (8,791,701 | ) |
Net realized loss on investments and foreign currency transactions | | (5,180,593) | | (6,417,546 | ) | (351,144,538 | ) | (358,540,521 | ) | (128,715,936 | ) | (71,748,163 | ) |
Net change in unrealized appreciation (depreciation) on investments, options and foreign currency translations | | 6,129,531 | | (20,745,764 | ) | 350,388,244 | | (783,011,959 | ) | 145,940,609 | | (432,433,215 | ) |
Net increase (decrease) in net assets resulting from operations | | 1,028,743 | | (27,224,330 | ) | (2,106,628 | ) | (1,151,315,237 | ) | 14,356,485 | | (512,973,079 | ) |
Distributions to shareholders from: | | | | | | | | | | | | | |
Net realized gains | | | | | | | | | | | | | |
Class I | | — | | — | | — | | (306,838,433 | ) | — | | — | |
Class R | | — | | — | | — | | (10,895,934 | ) | — | | — | |
Total distributions to shareholders | | — | | — | | — | | (317,734,367 | ) | — | | — | |
Increase (decrease) from shares of beneficial interest transactions: | | | | | | | | | | | | | |
Class I | | 12,489,886 | | (8,534,603 | ) | (113,808,854 | ) | 262,079,027 | | 54,563,224 | | 223,920,798 | |
Class R | | 411,346 | | 411,794 | | 540,993 | | 27,187,010 | | 1,697,008 | | 20,783,378 | |
Net increase (decrease) from shares of beneficial interest transactions—Note 6 | | 12,901,232 | | (8,122,809 | ) | (113,267,861 | ) | 289,266,037 | | 56,260,232 | | 244,704,176 | |
Total increase (decrease) | | 13,929,975 | | (35,347,139 | ) | (115,374,489 | ) | (1,179,783,567 | ) | 70,616,717 | | (268,268,903 | ) |
Net Assets: | | | | | | | | | | | | | |
Beginning of period | | 25,526,624 | | 60,873,763 | | 922,419,894 | | 2,102,203,461 | | 673,575,452 | | 941,844,355 | |
END OF PERIOD | | $ | 39,456,599 | | $ | 25,526,624 | | $ | 807,045,405 | | $ | 922,419,894 | | $ | 744,192,169 | | $ | 673,575,452 | |
Undistributed net investment income (accumulated loss | | $ | 79,805 | | $ | — | | $ | (1,350,334 | ) | $ | — | | $ | (2,868,188 | ) | $ | — | |
43
THE ALGER INSTITUTIONAL FUNDS
Financial Highlights for a share outstanding throughout the period
ALGER CAPITAL APPRECIATION INSTITUTIONAL FUND
| | Class I | |
| | Six months | | | | | | | | | | | |
| | ended | | Year ended | | Year ended | | Year ended | | Year ended | | Year ended | |
| | 4/30/2009(i) | | 10/31/2008 | | 10/31/2007 | | 10/31/2006 | | 10/31/2005 | | 10/31/2004 | |
INCOME FROM INVESTMENT OPERATIONS | | | | | | | | | | | | | |
Net asset value, beginning of period | | $ | 13.23 | | $ | 22.27 | | $ | 15.77 | | $ | 13.28 | | $ | 11.05 | | $ | 11.06 | |
Net investment income (loss)(ii) | | 0.04 | | (0.04 | ) | (0.06 | ) | (0.06 | ) | — | | (0.10 | ) |
Net realized and unrealized gain (loss) on investments | | (0.05 | ) | (9.00 | ) | 6.56 | | 2.55 | | 2.23 | | 0.09 | |
Total from investment operations | | (0.01 | ) | (9.04 | ) | 6.50 | | 2.49 | | 2.23 | | (0.01 | ) |
Net asset value, end of period | | $ | 13.22 | | $ | 13.23 | | $ | 22.27 | | $ | 15.77 | | $ | 13.28 | | $ | 11.05 | |
Total return | | (0.2 | )% | (40.6 | )% | 41.3 | % | 18.7 | % | 20.2 | % | (0.1 | )% |
RATIOS/SUPPLEMENTAL DATA: | | | | | | | | | | | | | |
Net assets, end of period (000’s omitted) | | $ | 439,696 | | $ | 411,056 | | $ | 537,928 | | $ | 165,422 | | $ | 128,646 | | $ | 124,889 | |
Ratio of gross expenses to average net assets | | 1.24 | % | 1.18 | % | 1.23 | % | 1.27 | % | 1.17 | % | 1.23 | % |
Ratio of expense reimbursements to average net assets | | 0.00 | % | 0.00 | % | 0.00 | % | 0.00 | % | 0.00 | % | 0.00 | % |
Ratio of net expenses to average net assets | | 1.24 | % | 1.18 | % | 1.23 | % | 1.27 | % | 1.17 | % | 1.23 | % |
Ratio of net investment income to average net assets | | 0.69 | % | (0.21 | )% | (0.33 | )% | (0.38 | )% | 0.04 | % | (0.87 | )% |
Portfolio turnover rate | | 192.11 | % | 291.85 | % | 232.13 | % | 225.25 | % | 148.91 | % | 160.00 | % |
(i) Unaudited. Ratios have been annualized; total return and portfolio turnover rate have not been annualized.
(ii) Amount was computed based on average shares outstanding during the period.
See Notes to Financial Statements.
44
ALGER CAPITAL APPRECIATION INSTITUTIONAL FUND
| | Class R | |
| | Six months | | | | | | | | | | | |
| | ended | | Year ended | | Year ended | | Year ended | | Year ended | | Year ended | |
| | 4/30/2009(i) | | 10/31/2008 | | 10/31/2007 | | 10/31/2006 | | 10/31/2005 | | 10/31/2004 | |
INCOME FROM INVESTMENT OPERATIONS | | | | | | | | | | | | | |
Net asset value, beginning of period | | $ | 12.85 | | $ | 21.75 | | $ | 15.47 | | $ | 13.09 | | $ | 10.95 | | $ | 11.01 | |
Net investment income (loss)(ii) | | 0.01 | | (0.13 | ) | (0.16 | ) | (0.15 | ) | (0.06 | ) | (0.16 | ) |
Net realized and unrealized gain (loss) on investments | | (0.05 | ) | (8.77 | ) | 6.44 | | 2.53 | | 2.20 | | 0.10 | |
Total from investment operations | | (0.04 | ) | (8.90 | ) | 6.28 | | 2.38 | | 2.14 | | (0.06 | ) |
Net asset value, end of period | | $ | 12.81 | | $ | 12.85 | | $ | 21.75 | | $ | 15.47 | | $ | 13.09 | | $ | 10.95 | |
Total return | | (0.4 | )% | (40.9 | )% | 40.6 | % | 18.2 | % | 19.5 | % | (0.5 | )% |
RATIOS/SUPPLEMENTAL DATA: | | | | | | | | | | | | | |
Net assets, end of period (000’s omitted) | | $ | 60,579 | | $ | 53,557 | | $ | 39,442 | | $ | 5,969 | | $ | 1,073 | | $ | 706 | |
Ratio of gross expenses to average net assets | | 1.73 | % | 1.68 | % | 1.72 | % | 1.79 | % | 1.67 | % | 1.73 | % |
Ratio of expense reimbursements to average net assets | | 0.00 | % | 0.00 | % | 0.00 | % | 0.00 | % | 0.00 | % | 0.00 | % |
Ratio of net expenses to average net assets | | 1.73 | % | 1.68 | % | 1.72 | % | 1.79 | % | 1.67 | % | 1.73 | % |
Ratio of net investment income to average net assets | | 0.20 | % | (0.70 | )% | (0.86 | )% | (0.90 | )% | (0.51 | )% | (1.39 | )% |
Portfolio turnover rate | | 192.11 | % | 291.85 | % | 232.13 | % | 225.25 | % | 148.91 | % | 160.00 | % |
(i) Unaudited. Ratios have been annualized; total return and portfolio turnover rate have not been annualized.
(ii) Amount was computed based on average shares outstanding during the period.
45
THE ALGER INSTITUTIONAL FUNDS
Financial Highlights for a share outstanding throughout the period
ALGER LARGECAP GROWTH INSTITUTIONAL FUND
| | Class I | |
| | Six months | | | | | | | | | | | |
| | ended | | Year ended | | Year ended | | Year ended | | Year ended | | Year ended | |
| | 4/30/2009(i) | | 10/31/2008 | | 10/31/2007 | | 10/31/2006 | | 10/31/2005 | | 10/31/2004 | |
INCOME FROM INVESTMENT OPERATIONS | | | | | | | | | | | | | |
Net asset value, beginning of period | | $ | 9.48 | | $ | 16.87 | | $ | 13.25 | | $ | 12.56 | | $ | 10.86 | | $ | 10.71 | |
Net investment income (loss)(ii) | | 0.02 | | (0.01 | ) | (0.03 | ) | (0.01 | ) | 0.04 | | (0.06 | ) |
Net realized and unrealized gain (loss) on investments | | (0.19 | ) | (7.38 | ) | 3.65 | | 0.74 | | 1.66 | | 0.21 | |
Total from investment operations | | (0.17 | ) | (7.39 | ) | 3.62 | | 0.73 | | 1.70 | | 0.15 | |
Dividends from net investment income | | — | | — | | — | | (0.04 | ) | — | | — | |
Net asset value, end of period | | $ | 9.31 | | $ | 9.48 | | $ | 16.87 | | $ | 13.25 | | $ | 12.56 | | $ | 10.86 | |
Total return | | (1.9 | )% | (43.8 | )% | 27.3 | % | 5.8 | % | 15.7 | % | 1.4 | % |
RATIOS/SUPPLEMENTAL DATA: | | | | | | | | | | | | | |
Net assets, end of period (000’s omitted) | | $ | 34,040 | | $ | 20,415 | | $ | 52,127 | | $ | 106,335 | | $ | 86,725 | | $ | 88,098 | |
Ratio of gross expenses to average net assets | | 1.45 | % | 1.23 | % | 1.32 | % | 1.21 | % | 1.08 | % | 1.13 | % |
Ratio of expense reimbursements to average net assets | | 0.00 | % | 0.00 | % | 0.00 | % | 0.00 | % | 0.00 | % | 0.00 | % |
Ratio of net expenses to average net assets | | 1.45 | % | 1.23 | % | 1.32 | % | 1.21 | % | 1.08 | % | 1.13 | % |
Ratio of net investment income to average net assets | | 0.59 | % | 0.04 | % | (0.19 | )% | (0.08 | )% | (0.31 | )% | (0.51 | )% |
Portfolio turnover rate | | 63.23 | % | 187.80 | % | 192.18 | % | 322.72 | % | 249.06 | % | 191.48 | % |
(i) Unaudited. Ratios have been annualized; total return and portfolio turnover rate have not been annualized.
(ii) Amount was computed based on average shares outstanding during the period.
See Notes to Financial Statements.
46
ALGER LARGECAP GROWTH INSTITUTIONAL FUND
| | Class R | |
| | Six months | | | | | | | | | | | |
| | ended | | Year ended | | Year ended | | Year ended | | Year ended | | Year ended | |
| | 4/30/2009(i) | | 10/31/2008 | | 10/31/2007 | | 10/31/2006 | | 10/31/2005 | | 10/31/2004 | |
INCOME FROM INVESTMENT OPERATIONS | | | | | | | | | | | | | |
Net asset value, beginning of period | | $ | 9.24 | | $ | 16.52 | | $ | 13.04 | | $ | 12.39 | | $ | 10.76 | | $ | 10.66 | |
Net investment loss(ii) | | 0.00 | | (0.08 | ) | (0.10 | ) | (0.08 | ) | (0.03 | ) | (0.12 | ) |
Net realized and unrealized gain (loss) on investments | | (0.19 | ) | (7.20 | ) | 3.58 | | 0.73 | | 1.66 | | 0.22 | |
Total from investment operations | | (0.19 | ) | (7.28 | ) | 3.48 | | 0.65 | | 1.63 | | 0.10 | |
Net asset value, end of period | | $ | 9.05 | | $ | 9.24 | | $ | 16.52 | | $ | 13.04 | | $ | 12.39 | | $ | 10.76 | |
Total return | | (2.1 | )% | (44.1 | )% | 26.7 | % | 5.3 | % | 15.2 | % | 0.9 | % |
RATIOS/SUPPLEMENTAL DATA: | | | | | | | | | | | | | |
Net assets, end of period (000’s omitted) | | $ | 5,417 | | $ | 5,112 | | $ | 8,747 | | $ | 5,372 | | $ | 3,826 | | $ | 2,493 | |
Ratio of gross expenses to average net assets | | 1.97 | % | 1.73 | % | 1.81 | % | 1.71 | % | 1.57 | % | 1.64 | % |
Ratio of expense reimbursements to average net assets | | 0.00 | % | 0.00 | % | 0.00 | % | 0.00 | % | 0.00 | % | 0.00 | % |
Ratio of net expenses to average net assets | | 1.97 | % | 1.73 | % | 1.81 | % | 1.71 | % | 1.57 | % | 1.64 | % |
Ratio of net investment income to average net assets | | 0.11 | % | (0.55 | )% | (0.72 | )% | (0.59 | )% | (0.29 | )% | (1.05 | )% |
Portfolio turnover rate | | 62.23 | % | 187.80 | % | 192.18 | % | 322.72 | % | 249.06 | % | 191.48 | % |
(i) Unaudited. Ratios have been annualized; total return and portfolio turnover rate have not been annualized.
(ii) Amount was computed based on average shares outstanding during the period.
47
THE ALGER INSTITUTIONAL FUNDS
Financial Highlights for a share outstanding throughout the period
ALGER MIDCAP GROWTH INSTITUTIONAL FUND
| | Class I | |
| | Six months | | | | | | | | | | | |
| | ended | | Year ended | | Year ended | | Year ended | | Year ended | | Year ended | |
| | 4/30/2009(i) | | 10/31/2008 | | 10/31/2007 | | 10/31/2006 | | 10/31/2005 | | 10/31/2004 | |
INCOME FROM INVESTMENT OPERATIONS | | | | | | | | | | | | | |
Net asset value, beginning of period | | $ | 8.76 | | $ | 23.24 | | $ | 17.29 | | $ | 17.57 | | $ | 15.38 | | $ | 14.78 | |
Net investment loss(ii) | | (0.01 | ) | (0.09 | ) | (0.11 | ) | (0.09 | ) | (0.11 | ) | (0.13 | ) |
Net realized and unrealized gain (loss) on investments | | 0.12 | | (10.85 | ) | 7.44 | | 1.69 | | 2.55 | | 0.73 | |
Total from investment operations | | 0.11 | | (10.94 | ) | 7.33 | | 1.60 | | 2.44 | | 0.60 | |
Distributions from net realized gains | | — | | (3.54 | ) | (1.38 | ) | (1.88 | ) | (0.25 | ) | — | |
Net asset value, end of period | | $ | 8.87 | | $ | 8.76 | | $ | 23.24 | | $ | 17.29 | | $ | 17.57 | | $ | 15.38 | |
Total return | | 1.1 | % | (55.0 | )% | 45.5 | % | 9.5 | % | 16.0 | % | 4.1 | % |
RATIOS/SUPPLEMENTAL DATA: | | | | | | | | | | | | | |
Net assets, end of period (000’s omitted) | | $ | 765,618 | | $ | 882,046 | | $ | 2,032,326 | | $ | 1,349,500 | | $ | 1,093,486 | | $ | 839,273 | |
Ratio of gross expenses to average net assets | | 1.18 | % | 1.11 | % | 1.17 | % | 1.13 | % | 1.10 | % | 1.15 | % |
Ratio of expense reimbursements to average net assets | | 0.00 | % | 0.00 | % | 0.00 | % | 0.00 | % | 0.00 | % | 0.00 | % |
Ratio of net expenses to average net assets | | 1.18 | % | 1.11 | % | 1.17 | % | 1.13 | % | 1.10 | % | 1.15 | % |
Ratio of net investment income to average net assets | | (0.30 | )% | (0.56 | )% | (0.54 | )% | (0.54 | )% | (0.64 | )% | (0.87 | )% |
Portfolio turnover rate | | 174.60 | % | 324.49 | % | 274.32 | % | 253.59 | % | 237.74 | % | 190.93 | % |
(i) Unaudited. Ratios have been annualized; total return and portfolio turnover rate have not been annualized.
(ii) Amount was computed based on average shares outstanding during the period.
See Notes to Financial Statements.
48
ALGER MIDCAP GROWTH INSTITUTIONAL FUND
| | Class R | |
| | Six months | | | | | | | | | | | |
| | ended | | Year ended | | Year ended | | Year ended | | Year ended | | Year ended | |
| | 4/30/2009(i) | | 10/31/2008 | | 10/31/2007 | | 10/31/2006 | | 10/31/2005 | | 10/31/2004 | |
INCOME FROM INVESTMENT OPERATIONS | | | | | | | | | | | | | |
Net asset value, beginning of period | | $ | 8.45 | | $ | 22.64 | | $ | 16.95 | | $ | 17.34 | | $ | 15.25 | | $ | 14.73 | |
Net investment loss(ii) | | (0.03 | ) | (0.16 | ) | (0.20 | ) | (0.18 | ) | (0.19 | ) | (0.21 | ) |
Net realized and unrealized gain (loss) on investments | | 0.11 | | (10.49 | ) | 7.27 | | 1.67 | | 2.53 | | 0.73 | |
Total from investment operations | | 0.08 | | (10.65 | ) | 7.07 | | 1.49 | | 2.34 | | 0.52 | |
Distributions from net realized gains | | — | | (3.54 | ) | (1.38 | ) | (1.88 | ) | (0.25 | ) | — | |
Net asset value, end of period | | $ | 8.53 | | $ | 8.45 | | $ | 22.64 | | $ | 16.95 | | $ | 17.35 | | $ | 15.25 | |
Total return | | 0.8 | % | (55.3 | )% | 44.7 | % | 9.0 | % | 15.4 | % | 3.5 | % |
RATIOS/SUPPLEMENTAL DATA: | | | | | | | | | | | | | |
Net assets, end of period (000’s omitted) | | $ | 41,427 | | $ | 40,374 | | $ | 69,877 | | $ | 43,355 | | $ | 22,127 | | $ | 12,000 | |
Ratio of gross expenses to average net assets | | 1.69 | % | 1.61 | % | 1.67 | % | 1.63 | % | 1.60 | % | 1.65 | % |
Ratio of expense reimbursements to average net assets | | 0.00 | % | 0.00 | % | 0.00 | % | 0.00 | % | 0.00 | % | 0.00 | % |
Ratio of net expenses to average net assets | | 1.69 | % | 1.61 | % | 1.67 | % | 1.63 | % | 1.60 | % | 1.65 | % |
Ratio of net investment income to average net assets | | (0.82 | )% | (1.05 | )% | (1.04 | )% | (1.05 | )% | (1.15 | )% | (1.37 | )% |
Portfolio turnover rate | | 174.60 | % | 324.49 | % | 274.32 | % | 253.59 | % | 237.74 | % | 190.93 | % |
(i) Unaudited. Ratios have been annualized; total return and portfolio turnover rate have not been annualized.
(ii) Amount was computed based on average shares outstanding during the period.
49
THE ALGER INSTITUTIONAL FUNDS
Financial Highlights for a share outstanding throughout the period
ALGER SMALLCAP GROWTH INSTITUTIONAL FUND
| | Class I | |
| | Six months | | | | | | | | | | | |
| | ended | | Year ended | | Year ended | | Year ended | | Year ended | | Year ended | |
| | 4/30/2009(i) | | 10/31/2008 | | 10/31/2007 | | 10/31/2006 | | 10/31/2005 | | 10/31/2004 | |
INCOME FROM INVESTMENT OPERATIONS | | | | | | | | | | | | | |
Net asset value, beginning of period | | $ | 16.52 | | $ | 30.30 | | $ | 23.98 | | $ | 19.97 | | $ | 16.07 | | $ | 15.10 | |
Net investment loss(ii) | | (0.07 | ) | (0.23 | ) | (0.21 | ) | (0.16 | ) | (0.14 | ) | (0.16 | ) |
Net realized and unrealized gain (loss) on investments | | 0.33 | | (13.55 | ) | 6.53 | | 4.17 | | 4.04 | | 1.13 | |
Total from investment operations | | 0.26 | | (13.78 | ) | 6.32 | | 4.01 | | 3.90 | | 0.97 | |
Net asset value, end of period | | $ | 16.78 | | $ | 16.52 | | $ | 30.30 | | $ | 23.98 | | $ | 19.97 | | $ | 16.07 | |
Total return | | 1.7 | % | (45.5 | )% | 26.4 | % | 20.1 | % | 24.3 | % | 6.4 | % |
RATIOS/SUPPLEMENTAL DATA: | | | | | | | | | | | | | |
Net assets, end of period (000’s omitted) | | $ | 702,750 | | $ | 634,542 | | $ | 894,802 | | $ | 305,843 | | $ | 71,224 | | $ | 69,788 | |
Ratio of gross expenses to average net assets | | 1.36 | % | 1.27 | % | 1.33 | % | 1.31 | % | 1.20 | % | 1.25 | % |
Ratio of expense reimbursements to average net assets | | 0.00 | % | 0.00 | % | (0.03 | )% | 0.00 | % | 0.00 | % | 0.00 | % |
Ratio of net expenses to average net assets | | 1.36 | % | 1.27 | % | 1.30 | % | 1.31 | % | 1.20 | % | 1.25 | % |
Ratio of net investment income to average net assets | | (0.89 | )% | (0.97 | )% | (0.78 | )% | (0.74 | )% | (0.77 | )% | (1.03 | )% |
Portfolio turnover rate | | 43.57 | % | 62.68 | % | 67.53 | % | 88.67 | % | 116.16 | % | 135.80 | % |
(i) Unaudited. Ratios have been annualized; total return and portfolio turnover rate have not been annualized.
(ii) Amount was computed based on average shares outstanding during the period.
See Notes to Financial Statements.
50
ALGER SMALLCAP GROWTH INSTITUTIONAL FUND
| | Class R | |
| | Six months | | | | | | | | | | | |
| | ended | | Year ended | | Year ended | | Year ended | | Year ended | | Year ended | |
| | 4/30/2009 (i) | | 10/31/2008 | | 10/31/2007 | | 10/31/2006 | | 10/31/2005 | | 10/31/2004 | |
INCOME FROM INVESTMENT OPERATIONS | | | | | | | | | | | | | |
Net asset value, beginning of period | | $ | 16.08 | | $ | 29.64 | | $ | 23.58 | | $ | 19.74 | | $ | 15.93 | | $ | 15.05 | |
Net investment loss(ii) | | (0.09 | ) | (0.35 | ) | (0.35 | ) | (0.28 | ) | (0.22 | ) | (0.25 | ) |
Net realized and unrealized gain (loss) on investments | | 0.32 | | (13.21 | ) | 6.41 | | 4.12 | | 4.03 | | 1.13 | |
Total from investment operations | | 0.23 | | (13.56 | ) | 6.06 | | 3.84 | | 3.81 | | 0.88 | |
Net asset value, end of period | | $ | 16.31 | | $ | 16.08 | | $ | 29.64 | | $ | 23.58 | | $ | 19.74 | | $ | 15.93 | |
Total return | | 1.5 | % | (45.8 | )% | 25.7 | % | 19.5 | % | 23.9 | % | 5.8 | % |
RATIOS/SUPPLEMENTAL DATA: | | | | | | | | | | | | | |
Net assets, end of period (000’s omitted) | | $ | 41,442 | | $ | 39,033 | | $ | 47,042 | | $ | 8,018 | | $ | 2,487 | | $ | 284 | |
Ratio of gross expenses to average net assets | | 1.79 | % | 1.77 | % | 1.86 | % | 1.83 | % | 1.68 | % | 1.75 | % |
Ratio of expense reimbursements to average net assets | | 0.00 | % | 0.00 | % | (0.03 | )% | 0.00 | % | 0.00 | % | 0.00 | % |
Ratio of net expenses to average net assets | | 1.79 | % | 1.77 | % | 1.83 | % | 1.83 | % | 1.68 | % | 1.75 | % |
Ratio of net investment income to average net assets | | (1.32 | )% | (1.47 | )% | (1.32 | )% | (1.26 | )% | (1.20 | )% | (1.55 | )% |
Portfolio turnover rate | | 43.57 | % | 62.68 | % | 67.53 | % | 88.67 | % | 116.16 | % | 135.00 | % |
(i) Unaudited. Ratios have been annualized; total return and portfolio turnover rate have not been annualized.
(ii) Amount was computed based on average shares outstanding during the period.
51
THE ALGER INSTITUTIONAL FUNDS |
NOTES TO FINANCIAL STATEMENTS (Unaudited)
NOTE 1 — General:
The Alger Institutional Funds (the “Trust”), is a diversified, open-end registered investment company organized as a business trust under the laws of the Commonwealth of Massachusetts. The Trust operates as a series company and currently issues an unlimited number of shares of beneficial interest in four funds— Capital Appreciation Fund, LargeCap Growth Fund, MidCap Growth Fund and SmallCap Growth Fund (collectively, the “Funds” or individually, each a “Fund”). The Funds normally invest primarily in equity securities and each has an investment objective of long-term capital appreciation.
Each Fund offers Class I and Class R shares. Each class has identical rights to assets and earnings except that only Class R shares have a plan of distribution and bear the related expenses.
NOTE 2 — Significant Accounting Policies:
(a) Investment Valuation: Investments of the Funds are valued on each day the New York Stock Exchange (the “NYSE”) is open as of the close of the NYSE (currently 4:00 p.m. Eastern time). Securities for which such information is readily available are valued at the last reported sales price or official closing price as reported by an independent pricing service on the primary market or exchange on which they are traded. In the absence of reported sales, securities are valued at a price within the bid and asked price or, in the absence of a recent bid or asked price, the equivalent as obtained from one or more of the major market makers for the securities to be valued.
Securities for which market quotations are not readily available are valued at fair value, as determined in good faith pursuant to procedures established by the Board of Trustees.
Securities in which the Funds invest may be traded in markets that close before the close of the NYSE. Developments that occur between the close of the foreign markets and the close of the NYSE (normally 4:00 p.m. Eastern time) may result in adjustments to the closing prices to reflect what the investment manager, pursuant to policies established by the Board of Trustees, believes to be the fair values of these securities as of the close of the NYSE. The Funds may also fair value securities in other situations, for example, when a particular foreign market is closed but the Funds are open.
Short-term securities having a remaining maturity of sixty days or less are valued at amortized cost which approximates market value. Shares of mutual funds are valued at the net asset value of the underlying mutual fund.
Effective November 1, 2008, the Funds adopted Financial Accounting Standards Board Statement of Financial Accounting Standards No. 157, Fair Value Measurements (FAS 157). In accordance with FAS 157, fair value is defined as a price that a Fund would receive upon selling an investment in a timely transaction to an independent buyer in the principal or most advantageous market of the investment. FAS 157 established a three-tier hierarchy to maximize the use of observable market data and minimize the use of
52
THE ALGER INSTITUTIONAL FUNDS |
NOTES TO FINANCIAL STATEMENTS (Unaudited) (Continued)
unobservable inputs and to establish classification of fair value measurements for disclosure purposes. Inputs refer broadly to the assumptions that market participants would use in pricing the asset or liability and may be observable or unobservable. Observable inputs are based on market data obtained from sources independent of the Fund. Unobservable inputs are inputs that reflect the Fund’s own assumptions based on the best information available in the circumstances. The three-tier hierarchy of inputs is summarized in the three broad Levels listed below.
· Level 1 – quoted prices in active markets for identical securities
· Level 2 – other significant observable inputs (including quoted prices for similar securities, interest rates, prepayment speeds, credit risk, etc.)
· Level 3 – significant unobservable inputs (including the Fund’s own assumptions in determining the fair value of investments)
The inputs or methodology used for valuing securities are not necessarily an indication of the risk associated with investing in those securities. For example, money market securities are valued using amortized cost, in accordance with rules under the Investment Company Act of 1940 (the “1940 Act”). Generally, amortized cost approximates the current fair value of a security, but since the value is not obtained from a quoted price in an active market, such securities are reflected as level 2.
The Funds’ valuation techniques are consistent with the market approach whereby prices and other relevant information generated by market transactions involving identical or comparable assets are used to measure fair value.
The following is a summary of the inputs used as of April 30, 2009 in valuing the Funds’ investments carried at fair value:
DESCRIPTION | | TOTAL FUND | | LEVEL 1 | | LEVEL 2 | | LEVEL 3 | |
Alger Capital Appreciation Institutional Fund | | | | | | | | | |
Investments in securities | | $ | 503,318,601 | | $ | 501,831,703 | | $ | 1,486,898 | | $ | — | |
Total | | $ | 503,318,601 | | $ | 501,831,703 | | $ | 1,486,898 | | $ | — | |
Alger LargeCap Growth Institutional Fund | | | | | | | | | |
Investments in securities | | $ | 39,192,672 | | $ | 39,192,672 | | $ | — | | $ | — | |
Total | | $ | 39,192,672 | | $ | 39,192,672 | | $ | — | | $ | — | |
Alger MidCap Growth Institutional Fund | | | | | | | | | |
Investments in securities | | $ | 813,524,831 | | $ | 801,392,423 | | $ | 12,132,408 | | $ | — | |
Total | | $ | 813,524,831 | | $ | 801,392,423 | | $ | 12,132,408 | | $ | — | |
Alger SmallCap Growth Institutional Fund | | | | | | | | | |
Investments in securities | | $ | 754,989,984 | | $ | 754,989,984 | | $ | — | | $ | — | |
Total | | $ | 754,989,984 | | $ | 754,989,984 | | $ | — | | $ | — | |
53
THE ALGER INSTITUTIONAL FUNDS |
NOTES TO FINANCIAL STATEMENTS (Unaudited) (Continued)
(b) Securities Transactions and Investment Income: Securities transactions are recorded on a trade date basis. Realized gains and losses from securities transactions are recorded on the identified cost basis. Dividend income is recognized on the ex-dividend date and interest income is recognized on the accrual basis.
Premiums and discounts on debt securities purchased are amortized or accreted over the lives of the respective securities.
(c) Foreign Currency Translations: The books and records of the Funds are maintained in U.S. dollars. Foreign currencies, investments and other assets and liabilities are translated into U.S. dollars at the prevailing rates of exchange on the valuation date. Purchases and sales of investment securities and income and expenses are translated into U.S. dollars at the prevailing exchange rates on the respective dates of such transactions.
Net realized gains and losses on foreign currency transactions represent net gains and losses from the disposition of foreign currencies, currency gains and losses realized between the trade dates and settlement dates of security transactions, and the difference between the amount of net investment income accrued and the U.S. dollar amount actually received. The effects of changes in foreign currency exchange rates on investments in securities are included in realized and unrealized gain or loss on investments in the Statements of Operations.
(d) Lending of Fund Securities: The Funds may lend their securities to financial institutions, provided that the market value of the securities loaned will not at any time exceed one third of a Fund’s total assets, as defined. The Funds earn fees on the securities loaned. In order to protect against the risk of failure by the borrower to return the securities loaned or any delay in the delivery of such securities, the loan is collateralized by cash, letters of credit or U.S. Government securities that are maintained in an amount equal to at least 100 percent of the current market value of the loaned securities. The market value of the loaned securities is determined at the close of business of the Funds and any required additional collateral is delivered to the Funds on the next business day. There were no securities on loan during the six months ended April 30, 2009.
(e) Dividends to Shareholders: Dividends payable to shareholders are recorded on the ex-dividend date. With respect to all Funds, dividends from net investment income and distributions from net realized gains, offset by any loss carry forward, are declared and paid annually after the end of the fiscal year in which earned.
Each class is treated separately in determining the amounts of dividends of net investment income payable to holders of its shares.
The characterization of distributions to shareholders for financial reporting purposes is determined in accordance with federal income tax rules. Therefore, the source of the Funds’ distributions may be shown in the accompanying financial statements as either from, or in excess of net investment income, net realized gain on investment transactions or return of capital, depending on the type of book/tax differences that may exist. Capital accounts within the financial statements are adjusted for permanent book/tax differences. Reclassifications result primarily from the differences in tax treatment of net operating losses, foreign currency transactions and amortization adjustments on debt securities. The
54
THE ALGER INSTITUTIONAL FUNDS |
NOTES TO FINANCIAL STATEMENTS (Unaudited) (Continued)
reclassifications had no impact on the net asset values of the Funds and are designed to present the Funds’ capital accounts on a tax basis.
(f) Federal Income Taxes: It is each Fund’s policy to comply with the requirements of the Internal Revenue Code Subchapter M applicable to regulated investment companies and to distribute all of its investment company taxable income to its shareholders. Provided a Fund maintains such compliance, no federal income tax provision is required. Each Fund is treated as a separate entity for the purpose of determining such compliance.
The Funds have adopted Financial Accounting Standards Board Interpretation No. 48 “Accounting for Uncertainty in Income Taxes” (‘FIN 48”). FIN 48 requires the Funds to measure and recognize in their financial statements the benefit of a tax position taken (or expected to be taken) on an income tax return if such position will more likely than not be sustained upon examination based on the technical merits of the position. The Funds file income tax returns in the US Federal jurisdiction, as well as the New York State and New York City jurisdictions. Based upon their review of tax positions for the Funds’ open tax years of 2005-2008 in these jurisdictions, the Funds have determined that FIN 48 did not have a material impact on the Funds’ financial statements for the six months ended April 30, 2009.
(g) Allocation Methods: The Trust accounts separately for the assets, liabilities and operations of each Fund. Expenses directly attributable to each Fund are charged to that Fund’s operations; expenses which are applicable to all Funds are allocated among them based on net assets. Income, realized and unrealized gains and losses, and expenses of each Fund, are allocated among the Fund’s classes based on relative net assets, with the exception of distribution fees, which are only applicable to Class R shares.
(h) Indemnification: The Trust enters into contracts that contain a variety of indemnification provisions. The Trust’s maximum exposure under these arrangements is unknown. The Trust does not anticipate recognizing any loss related to these arrangements.
(i) Estimates: These financial statements have been prepared in accordance with U.S. generally accepted accounting principles, which require using estimates and assumptions that affect the reported amounts therein. Actual results may differ from those estimates. These unaudited interim financial statements reflect all adjustments which are, in the opinion of management, necessary to a fair statement of results for the interim period presented. All such adjustments are of a normal recurring nature.
NOTE 3 — Investment Advisory Fees and Other Transactions with Affiliates:
(a) Investment Advisory and Administration Fees: Fees incurred by each Fund, pursuant to the provisions of its Investment Advisory Agreement and its Administration Agreement with Fred Alger Management, Inc. (Alger Management), are payable monthly and computed based on the value of the average daily net assets of each Fund, at the following rates:
55
THE ALGER INSTITUTIONAL FUNDS |
NOTES TO FINANCIAL STATEMENTS (Unaudited) (Continued)
| | Advisory | | Administration | |
| | Fee | | Fee | |
Capital Appreciation Fund | | .81 | % | .0275 | % |
LargeCap Growth Fund | | .71 | % | .0275 | % |
MidCap Growth Fund | | .76 | | .0275 | |
SmallCap Growth Fund | | .81 | | .0275 | |
(b) Distribution Fees: Class R Shares: The Funds have adopted a Distribution Plan pursuant to which Class R shares of each Fund pays Fred Alger & Company, Incorporated, the Trust’s distributor (the “Distributor”) and an affiliate of Alger Management, a fee at the annual rate of .50% of the respective average daily net assets of the Class R shares of the designated Funds to compensate the Distributor for its activities and expenses incurred in distributing the Class R shares. The fees charged may be more or less than the expenses incurred by the Distributor.
(c) Brokerage Commissions: During the six months ended April 30, 2009, the Capital Appreciation Fund, the LargeCap Growth Fund, the MidCap Growth Fund and the SmallCap Growth Fund paid the Distributor commissions of $1,393,567, $31,466, $2,451,770 and $581,538, respectively, in connection with securities transactions.
(d) Shareholder Administrative Fees: The Trust has entered into a shareholder administrative services agreement with Alger Management, to compensate Alger Management on a per account basis for its liaison and administrative oversight of Boston Financial Data Services, Inc., the transfer agent, and other related services. During the six months ended April 30, 2009, the Capital Appreciation Fund, LargeCap Growth Fund, MidCap Growth Fund and SmallCap Growth Fund incurred fees of $4,139, $132, $4,653 and $62,405 respectively, for these services provided by Alger Management which are included in transfer agent fees and expenses in the Statement of Operations.
(e) Shareholder Servicing Fees: The Trust has entered into a shareholder servicing agreement with Alger Inc. whereby Alger Inc. provides the Trust with ongoing servicing of shareholder accounts. As Compensation for such services, each Fund pays Alger Inc. a monthly fee at an annual rate of .25% of the value of its average daily net assets.
(f) Trustee Fees: Each Fund pays each trustee who is not affiliated with Alger Management or its affiliates $500 for each meeting attended, to a maximum of $2,000 per annum. The Chairman of the Board of Trustees receives an additional annual fee of $10,000 which is paid, pro rata, by all funds managed by Alger Management. Additionally, each member of the audit committee receives an additional $50 from each Fund for each audit committee meeting attended, to a maximum of $200 per annum.
(g) Other Transactions With Affiliates: Certain trustees and officers of the Trust are directors and officers of Alger Management, the Distributor and Alger Services.
NOTE 4 — Securities Transactions:
The following summarizes the securities transactions by the Funds, other than short-term securities, for the six months ended April 30, 2009:
56
THE ALGER INSTITUTIONAL FUNDS |
NOTES TO FINANCIAL STATEMENTS (Unaudited) (Continued)
| | PURCHASES | | SALES | |
Capital Appreciation Fund | | $ | 883,911,031 | | $ | 800,601,063 | |
LargeCap Growth Fund | | 31,675,049 | | 18,895,159 | |
MidCap Growth Fund | | 1,366,785,003 | | 1,450,709,277 | |
SmallCap Growth Fund | | 347,440,366 | | 267,263,870 | |
| | | | | | | |
NOTE 5 — Borrowings:
The Funds may borrow from their custodian on an uncommitted basis. For the six months ended April 30, 2009, the Funds had the following borrowings:
| | AVERAGE | | WEIGHTED AVERAGE | |
| | BORROWING | | INTEREST RATE | |
MidCap Growth Fund | | $ | 89,447 | | 3.46 | % |
| | | | | | |
NOTE 6 — Share Capital:
The Trust has an unlimited number of authorized shares of beneficial interest of $.001 par value which are presently divided into four series. Each series is divided into two separate classes. The transactions of shares of beneficial interest were as follows:
| | FOR THE SIX MONTHS ENDED | | FOR THE YEAR ENDED | |
| | APRIL 30, 2009 | | OCTOBER 31, 2008 | |
| | SHARES | | AMOUNT | | SHARES | | AMOUNT | |
ALGER CAPITAL APPRECIATION INSTITUTIONAL FUND | | | | | | | | | |
Class I: | | | | | | | | | |
Shares sold | | 7,065,524 | | $ | 84,969,887 | | 17,682,410 | | $ | 347,270,443 | |
Shares redeemed | | (4,873,249 | ) | (57,631,415 | ) | (10,767,402 | ) | (196,863,090 | ) |
Net increase | | 2,192,275 | | $ | 27,338,472 | | 6,915,008 | | $ | 150,407,353 | |
Class R: | | | | | | | | | |
Shares sold | | 1,286,880 | | $ | 15,057,659 | | 3,262,769 | | $ | 60,529,232 | |
Shares redeemed | | (723,476 | ) | (8,299,463 | ) | (910,034 | ) | (16,220,993 | ) |
Net increase | | 563,404 | | $ | 6,758,196 | | 2,352,735 | | $ | 44,308,239 | |
| | | | | | | | | |
ALGER LARGECAP GROWTH INSTITUTIONAL FUND | | | | | | | | | |
Class I: | | | | | | | | | |
Shares sold | | 2,460,597 | | $ | 20,490,898 | | 1,904,017 | | $ | 27,095,815 | |
Shares redeemed | | (958,771 | ) | (8,001,012 | ) | (2,840,554 | ) | (35,630,418 | ) |
Net increase (decrease) | | 1,501,826 | | $ | 12,489,886 | | (936,537 | ) | $ | (8,534,603 | ) |
Class R: | | | | | | | | | |
Shares sold | | 176,198 | | $ | 1,487,940 | | 273,662 | | $ | 3,895,941 | |
Shares redeemed | | (131,194 | ) | (1,076,594 | ) | (249,731 | ) | (3,484,147 | ) |
Net increase | | 45,004 | | $ | 411,346 | | 23,931 | | $ | 411,794 | |
57
THE ALGER INSTITUTIONAL FUNDS |
NOTES TO FINANCIAL STATEMENTS (Unaudited) (Continued)
| | FOR THE SIX MONTHS ENDED | | FOR THE YEAR ENDED | |
| | APRIL 30, 2009 | | OCTOBER 31, 2008 | |
| | SHARES | | AMOUNT | | SHARES | | AMOUNT | |
ALGER MIDCAP GROWTH INSTITUTIONAL FUND | | | | | | | | | |
Class I: | | | | | | | | | |
Shares sold | | 21,615,948 | | $ | 166,439,599 | | 48,070,990 | | $ | 775,162,164 | |
Dividends reinvested | | — | | — | | 13,730,131 | | 251,810,604 | |
Shares redeemed | | (35,919,990 | ) | (280,248,453 | ) | (48,592,293 | ) | (764,893,741 | ) |
Net increase (decrease) | | (14,304,042 | ) | $ | (113,808,854 | ) | 13,208,828 | | $ | 262,079,027 | |
Class R: | | | | | | | | | |
Shares sold | | 1,466,011 | | $ | 10,825,925 | | 3,375,697 | | $ | 52,591,052 | |
Dividends reinvested | | — | | — | | 275,824 | | 4,898,632 | |
Shares redeemed | | (1,386,510 | ) | (10,284,932 | ) | (1,959,087 | ) | (30,302,674 | ) |
Net increase | | 79,501 | | $ | 540,993 | | 1,692,434 | | $ | 27,187,010 | |
| | | | | | | | | |
ALGER SMALLCAP GROWTH INSTITUTIONAL FUND | | | | | | | | | |
Class I: | | | | | | | | | |
Shares sold | | 11,328,482 | | $ | 169,086,467 | | 19,701,594 | | $ | 473,018,042 | |
Shares redeemed | | (7,879,116 | ) | (114,523,243 | ) | (10,816,750 | ) | (249,097,244 | ) |
Net increase | | 3,449,366 | | $ | 54,563,224 | | 8,884,844 | | $ | 223,920,798 | |
Class R: | | | | | | | | | |
Shares sold | | 528,904 | | $ | 7,642,950 | | 1,585,566 | | $ | 38,302,703 | |
Shares redeemed | | (414,824 | ) | (5,945,942 | ) | (745,031 | ) | (17,519,325 | ) |
Net increase | | 114,080 | | $ | 1,697,008 | | 840,535 | | $ | 20,783,378 | |
NOTE 7 — Tax Character of Distributions to Shareholders:
The tax character of distributions paid, during the six months ended April 30, 2009 and the year ended October 31, 2008 were as follows:
| | SIX MONTHS ENDED | | YEAR ENDED | |
| | April 30, 2009 | | October 31, 2008 | |
Capital Appreciation Fund | | | | | |
Distributions paid from: | | | | | |
Ordinary Income | | — | | — | |
Long-term capital gain | | — | | — | |
Total distributions paid | | — | | — | |
| | | | | |
LargeCap Growth Fund | | | | | |
Distributions paid from: | | | | | |
Ordinary Income | | — | | — | |
Long-term capital gain | | — | | — | |
Total distributions paid | | — | | — | |
| | | | | |
MidCap Growth Fund | | | | | |
Distributions paid from: | | | | | |
Ordinary Income | | — | | $ | 295,577,096 | |
Long-term capital gain | | — | | 22,157,271 | |
Total distributions paid | | — | | $ | 317,734,367 | |
58
THE ALGER INSTITUTIONAL FUNDS |
NOTES TO FINANCIAL STATEMENTS (Unaudited) (Continued)
| | SIX MONTHS ENDED | | YEAR ENDED | |
| | April 30, 2009 | | October 31, 2008 | |
SmallCap Growth Fund | | | | | |
Distributions paid from: | | | | | |
Ordinary Income | | — | | — | |
Long-term capital gain | | — | | — | |
Total distributions paid | | — | | — | |
As of October 31, 2008, the components of distributable earnings on a tax basis were as follows:
CAPITAL APPRECIATION FUND | | | |
Undistributed ordinary income | | $ | — | |
Undistributed long-term gain | | — | |
Unrealized appreciation | | $ | (165,722,780 | ) |
| | | |
LARGECAP GROWTH FUND | | | |
Undistributed ordinary income | | $ | — | |
Undistributed long-term gain | | — | |
Unrealized appreciation | | $ | (13,456,817 | ) |
| | | |
MIDCAP GROWTH FUND | | | |
Undistributed ordinary income | | $ | — | |
Undistributed long-term gain | | — | |
Unrealized appreciation | | $ | (504,070,154 | ) |
| | | |
SMALLCAP GROWTH FUND | | | |
Undistributed ordinary income | | $ | — | |
Undistributed long-term gain | | — | |
Unrealized appreciation | | $ | (290,624,154 | ) |
The difference between book basis and tax basis unrealized appreciation is determined annually and is attributable primarily to the tax deferral of losses on wash sales.
At October 31, 2008, the Funds, for federal income tax purposes, had capital loss carryforwards which expire as set forth in the table below. These amounts may be applied against future net realized gains until the earlier of their utilization or expiration.
EXPIRATION DATE
| | 2010 | | 2011 | | 2016 | | TOTAL | |
Capital Appreciation Fund | | $ | 9,021,946 | | $ | — | | $ | 81,933,898 | | $ | 90,955,844 | |
LargeCap Growth Fund | | $ | 945,854 | | $ | 5,070,663 | | $ | 5,539,061 | | $ | 11,555,578 | |
MidCap Growth Fund | | $ | — | | $ | — | | $ | 286,663,057 | | $ | 286,663,057 | |
SmallCap Growth Fund | | $ | 5,654,698 | | $ | — | | $ | 72,171,002 | | $ | 77,825,700 | |
NOTE 8 — Litigation:
The Manager has responded to inquiries, document requests and/or subpoenas from various regulatory authorities in connection with their investigations of practices in the mutual fund industry identified as “market timing” and “late trading.” On October 11,
59
THE ALGER INSTITUTIONAL FUNDS |
NOTES TO FINANCIAL STATEMENTS (Unaudited) (Continued)
2006, the Manager, the Distributor and Alger Shareholder Services, Inc. executed an Assurance of Discontinuance with the Office of the New York State Attorney General (“NYAG”). On January 18, 2007, the Securities and Exchange Commission (the “SEC”) approved a settlement with the Manager and the Distributor. As part of the settlements with the NYAG and the SEC, without admitting or denying liability, the firms consented to the payment of $30 million to reimburse fund shareholders; a fine of $10 million; and certain other remedial measures including a reduction in management fees of $1 million per year for five years. The $40 million was paid into an SEC Fair Fund for distribution to investors.
On August 31, 2005, the West Virginia Securities Commissioner (the “WVSC”), in an ex parte Summary Order to Cease and Desist and Notice of Right to Hearing, concluded that the Manager and the Distributor had violated the West Virginia Uniform Securities Act (the “WVUSA”), and ordered the Manager and the Distributor to cease and desist from further violations of the WVUSA by engaging in the market-timing-related conduct described in the order. The ex parte order provided notice of their right to a hearing with respect to the violations of law asserted by the WVSC. Other firms unaffiliated with the Manager were served with similar orders. The Manager and the Distributor intend to request a hearing for the purpose of seeking to vacate or modify the order.
In addition, in 2003 and 2004 several purported class actions and shareholder derivative suits were filed against various parties in the mutual fund industry, including the Manager, certain mutual funds managed by the Manager (the “Alger Mutual Funds”), and certain current and former Alger Mutual Fund trustees and officers, alleging wrongful conduct related to market-timing and late-trading by mutual fund shareholders. These cases were transferred to the U.S. District Court of Maryland by the Judicial Panel on Multidistrict Litigation for consolidated pre-trial proceedings under the caption number 1:04-MD-15863 (JFM). After a number of the claims were dismissed by the court, the class and derivative suits were settled in principle, but such settlement remains subject to court approval.
NOTE 9 — Recent Accounting Pronouncements:
On March 19, 2008, the Financial Accounting Standards Board issued the Statement of Financial Accounting Standards No. 161, Disclosures about Derivative Instruments and Hedging Activities (“FAS 161”). FAS 161 requires qualitative disclosures about objective and strategies for using derivatives, quantitative disclosures about fair value amounts of and gains and losses on derivative instruments, and disclosures about credit-risk-related contingent features in derivative agreements. The application of FAS 161 is required for fiscal years and interim periods beginning after November 15, 2008. At this time, management is evaluating the implications of FAS 161 and believes that adoptions of FAS 161 will have no material impact on the Funds’ financial statements.
In April 2009, FASB issued a new Staff Position FSP FAS 157-4 which amends FASB Statement No. 157, Fair Value Measurements, and is effective for interim and annual periods ending after June 15, 2009. FSP FAS 157-4 provides additional guidance when the volume and level of activity for the asset or liability measured at fair value has significantly decreased. Additionally, FSP FAS 157-4 expands disclosure by reporting
60
THE ALGER INSTITUTIONAL FUNDS |
NOTES TO FINANCIAL STATEMENTS (Unaudited) (Continued)
entities with respect to categories of assets and liabilities carried at fair value. Management is currently evaluating the impact the adoption of FSP FAS 157-4 will have on the Fund’s financial statements and related disclosures.
In May 2009, FASB issued Statement of Financial Accounting Standards No. 165, Subsequent Events (“FAS 165”), which establishes general standards of accounting for and disclosure of events that occur after the balance sheet date but before financial statements are issued or are available to be issued. Although there is new terminology, the standard is based on the same principles as those that currently exist in the auditing standards. The standard, which includes a new required disclosure of the date through which an entity has evaluated subsequent events, is effective for interim or annual periods ending after June 15, 2009. Management is currently evaluating the impact the adoption of FAS 165 will have on the Fund’s financial statements and related disclosures.
61
THE ALGER INSTITUTIONAL FUNDS
ADDITIONAL INFORMATION (Unaudited)
Shareholder Expense Example
As a shareholder of the Fund, you incur two types of costs: transaction costs, if applicable, including sales charges (loads) and redemption fees; and ongoing costs, including management fees, distribution (12b-1) fees, if applicable, and other fund expenses. This example is intended to help you understand your ongoing costs (in dollars) of investing in the Fund and to compare these costs with the ongoing costs of investing in other mutual funds.
The example below is based on an investment of $1,000 invested at the beginning of the six-month period starting November 1, 2008 and ending April 30, 2009.
Actual Expenses
The first line for each class of shares in the table below provides information about actual account values and actual expenses. You may use the information in this line, together with the amount you invested, to estimate the expenses that you would have paid over the period. Simply divide your account value by $1,000 (for example, an $8,600 account value divided by $1,000 = 8.6), then multiply the result by the number in the first line under the heading entitled “Expenses Paid During the Period” to estimate the expenses you paid on your account during this period.
Hypothetical Example for Comparison Purposes
The second line for each class of shares in the table below provides information about hypothetical account values and hypothetical expenses based on the Fund’s actual expense ratios for each class of shares and an assumed rate of return of 5% per year before expenses, which is not the Fund’s actual return. The hypothetical account values and expenses may not be used to estimate the actual ending account balance or expenses you paid for the period. You may use this information to compare the ongoing costs of investing in the Fund and other funds. To do so, compare this 5% hypothetical example with the 5% hypothetical examples that appear in the shareholder reports of other funds.
Please note that the expenses shown in the table are meant to highlight your ongoing costs only and do not reflect any transaction costs, such as sales charges (loads) and redemption fees. Therefore, the second line under each class of shares in the table is useful in comparing ongoing costs only, and will not help you determine the relative total costs of owning different funds. In addition, if these transactional costs were included, your costs would have been higher.
62
Shareholder Expense Example (Continued)
| | | | | | | | Ratio of | |
| | | | | | | | Expenses to | |
| | | | | | | | Average | |
| | | | | | Expenses | | Net Assets | |
| | Beginning | | Ending | | Paid During | | For the | |
| | Account | | Account | | the Six Months | | Six Months | |
| | Value | | Value | | Ended | | Ended | |
| | November 1, 2008 | | April 30, 2009 | | April 30, 2009(a) | | April 30, 2009(b) | |
ALGER CAPITAL APPRECIATION INSTITUTIONAL FUND | | | | | | | | | |
Class I | Actual | | $ | 1,000.00 | | $ | 998.50 | | $ | 6.14 | | 1.24 | % |
| Hypothetical(c) | | 1,000.00 | | 1,018.65 | | 6.21 | | 1.24 | |
Class R | Actual | | 1,000.00 | | 996.10 | | 8.56 | | 1.73 | |
| Hypothetical(c) | | 1,000.00 | | 1,016.22 | | 8.65 | | 1.73 | |
| | | | | | | | | | |
ALGER LARGECAP GROWTH INSTITUTIONAL FUND | | | | | | | | | |
Class I | Actual | | $ | 1,000.00 | | $ | 981.00 | | $ | 7.12 | | 1.45 | % |
| Hypothetical(c) | | 1,000.00 | | 1,017.60 | | 7.25 | | 1.45 | |
Class R | Actual | | 1,000.00 | | 979.40 | | 9.67 | | 1.97 | |
| Hypothetical(c) | | 1,000.00 | | 1,015.03 | | 9.84 | | 1.97 | |
| | | | | | | | | | |
ALGER MIDCAP GROWTH INSTITUTIONAL FUND | | | | | | | | | |
Class I | Actual | | $ | 1,000.00 | | $ | 1,011.40 | | $ | 5.88 | | 1.18 | % |
| Hypothetical(c) | | 1,000.00 | | 1,018.94 | | 5.91 | | 1.18 | |
Class R | Actual | | 1,000.00 | | 1,008.30 | | 8.42 | | 1.69 | |
| Hypothetical(c) | | 1,000.00 | | 1,016.41 | | 8.45 | | 1.69 | |
| | | | | | | | | | |
ALGER SMALLCAP GROWTH INSTITUTIONAL FUND | | | | | | | | | |
Class I | Actual | | $ | 1,000.00 | | $ | 1,017.00 | | $ | 6.80 | | 1.36 | % |
| Hypothetical(c) | | 1,000.00 | | 1,018.05 | | 6.80 | | 1.36 | |
Class R | Actual | | 1,000.00 | | 1,014.90 | | 8.94 | | 1.79 | |
| Hypothetical(c) | | 1,000.00 | | 1,015.92 | | 8.95 | | 1.79 | |
(a) | Expenses are equal to the annualized expense ratio of the respective share class, multiplied by the average account value over the period, multiplied by 181/365 (to reflect the one-half year period). |
(b) | Annualized |
(c) | 5% annual return before expenses. |
63
Proxy Voting Policies
A description of the policies and procedures the Trust uses to determine how to vote proxies relating to portfolio securities and the proxy voting record is available, without charge, by calling (800) 992-3863 or online on the Funds’ website at http://www.alger.com or on the SEC’s website at http://www.sec.gov.
Fund Holdings
The Funds’ most recent month end portfolio holdings are available approximately sixty days after month end on the Funds’ website at www.alger.com. The Funds also file their complete schedule of portfolio holdings with the SEC for the first and third quarter of each fiscal year on Form N-Q. The Funds’ Forms N-Q is available online on the SEC’s website at http://www.sec.gov or may be reviewed and copied at the SEC’s Public Reference Room in Washington, D.C. Information regarding the operation of the SEC’s Public Reference Room may be obtained by calling 1-800-SEC-0330. A copy of the most recent quarterly holdings may also be obtained from the Funds by calling (800) 992-3863.
Change in Independent Registered Public Accounting Firm
On May 12, 2009, Deloitte & Touche LLP was selected as each Fund’s independent registered public accounting firm for the 2009 fiscal year. A majority of each Fund’s Board of Trustees, including a majority of the Independent Trustees, approved the appointment of Deloitte & Touche LLP. The predecessor independent registered public accounting firm’s report on the Fund’s financial statements for the year ended October 31, 2008 and the year ended October 31, 2007 contained no adverse opinion or disclaimer of opinion and were not qualified or modified as to uncertainty, audit scope or accounting principles. During such fiscal periods and through May 12, 2009, there were no disagreements between the Funds and the predecessor independent registered public accounting firm on any matter of accounting principles or practices, financial statement disclosure, or audit scope or procedures, which such disagreements, if not resolved to the satisfaction of the predecessor independent registered public accounting firm, would have caused them to make reference to the subject matter of the disagreement in connection with their reports on the financial statements for such fiscal periods.
64
(This page has been intentionally left blank.)
(This page has been intentionally left blank.)
(This page has been intentionally left blank.)
(This page has been intentionally left blank.)
THE ALGER INSTITUTIONAL FUNDS
111 Fifth Avenue
New York, NY 10003
(800) 992-3362
www.alger.com
Investment Manager
Fred Alger Management, Inc.
111 Fifth Avenue
New York, NY 10003
Transfer Agent and Dividend Disbursing Agent
Boston Financial Data Services, Inc.
P.O. Box 8480
Boston, MA 02266
This report is submitted for the general information of the shareholders of The Alger Institutional Funds. It is not authorized for distribution to prospective investors unless accompanied by an effective Prospectus for the Trust, which contains information concerning the Trust’s investment policies, fees and expenses as well as other pertinent information.

SAIF 043009
ITEM 2. CODE OF ETHICS.
Not applicable.
ITEM 3. AUDIT COMMITTEE FINANCIAL EXPERT.
Not applicable.
ITEM 4. PRINCIPAL ACCOUNTANT FEES AND SERVICES.
Not applicable.
ITEM 5. AUDIT COMMITTEE OF LISTED REGISTRANTS.
Not applicable.
ITEM 6. INVESTMENTS.
Not applicable.
ITEM 7. DISCLOSURE OF PROXY VOTING POLICIES AND PROCEDURES FOR CLOSED END MANAGEMENT INVESTMENT COMPANIES.
Not applicable.
ITEM 8. PORTFOLIO MANAGERS OF CLOSED-END MANAGEMENT INVESTMENT COMPANIES.
Not applicable.
ITEM 9. PURCHASES OF EQUITY SECURITIES BY CLOSED-END MANAGEMENT INVESTMENT COMPANY AND AFFILIATED PURCHASERS.
Not applicable.
ITEM 10. SUBMISSION OF MATTERS TO A VOTE OF SECURITY HOLDERS.
Not applicable.
ITEM 11. CONTROLS AND PROCEDURES.
(a) The Registrant’s principal executive officer and principal financial officer have concluded that the Registrant’s disclosure controls and procedures (as defined in Rule 30a-3(c) under the Investment Company Act of 1940, as amended) are effective based on their evaluation of the disclosure controls and procedures as of a date within 90 days of the filing date of this document.
(b) No changes in the Registrant’s internal control over financial reporting occurred during the Registrant’s second fiscal quarter of the period covered by this report that materially affected, or are reasonably likely to materially affect, the Registrant’s internal control over financial reporting.
ITEM 12. EXHIBITS.
(a) (1) Not applicable
(a) (2) Certifications of principal executive officer and principal financial officer as required by rule 30a-2(a) under the Investment Company Act of 1940 are attached as Exhibit 99.CERT
(a) (3) Not applicable
(b) Certifications of principal executive officer and principal financial officer as required by rule 30a-2(b) under the Investment Company Act of 1940 are attached as Exhibit 99.906CERT
SIGNATURES
Pursuant to the requirements of the Securities Exchange Act of 1934 and the Investment Company Act of 1940, the registrant has duly caused this report to be signed on its behalf by the undersigned, thereunto duly authorized.
The Alger Institutional Funds
By: | /s/Dan C. Chung | |
| |
| Dan C. Chung |
| |
| President |
Date: June 30, 2009
Pursuant to the requirements of the Securities Exchange Act of 1934 and the Investment Company Act of 1940, this report has been signed below by the following persons on behalf of the registrant and in the capacities and on the dates indicated.
By: | /s/Dan C. Chung | |
| |
| Dan C. Chung |
| |
| President |
Date: June 30, 2009
By: | /s/Michael D. Martins | |
| |
| Michael D. Martins |
| |
| Treasurer |
Date: June 30, 2009