| | OMB APPROVAL |
| | OMB Number: | 3235-0570 |
| | Expires: | August 31, 2010 |
| UNITED STATES | Estimated average burden hours per response. . . . . . . . . . . . . . . . .18.9 |
| SECURITIES AND EXCHANGE COMMISSION | |
| Washington, D.C. 20549 | |
| | | | |
FORM N-CSR
CERTIFIED SHAREHOLDER REPORT OF REGISTERED
MANAGEMENT INVESTMENT COMPANIES
Investment Company Act file number | 811-7986 |
|
The Alger Institutional Funds |
(Exact name of registrant as specified in charter) |
|
111 Fifth Avenue New York, New York | | 10003 |
(Address of principal executive offices) | | (Zip code) |
|
Mr. Hal Liebes
Fred Alger Management, Inc.
111 Fifth Avenue
New York, New York 10003 |
(Name and address of agent for service) |
|
Registrant’s telephone number, including area code: | 212-806-8800 | |
|
Date of fiscal year end: | October 31 | |
|
Date of reporting period: | April 30, 2008 | |
| | | | | | | | |
ITEM 1. REPORT(S) TO STOCKHOLDERS.
Alger LargeCap Growth Institutional Fund
| Alger SmallCap Growth Institutional Fund |
Alger MidCap Growth Institutional Fund
| Alger Capital Appreciation Institutional Fund |
The Alger
Institutional Funds

SEMI-ANNUAL REPORT
April 30, 2008
(Unaudited)

Table Of Contents
THE ALGER INSTITUTIONAL FUNDS
| Letter to Our Shareholders | | | 1 | | |
|
| Fund Highlights | | | 9 | | |
|
| Portfolio Summary | | | 13 | | |
|
| Schedules of Investments | | | 14 | | |
|
| Statements of Assets and Liabilities | | | 32 | | |
|
| Statements of Operations | | | 34 | | |
|
| Statements of Changes in Net Assets | | | 36 | | |
|
| Financial Highlights | | | 38 | | |
|
| Notes to Financial Statements | | | 46 | | |
|
| Additional Information | | | 57 | | |
|
Go Paperless With Alger Electronic Delivery Service
Alger is pleased to provide you with the ability to access regulatory materials online. When documents such as prospectuses and annual and semi-annual reports are available, we'll send you an e-mail notification with a convenient link that will take you directly to the fund information on our website. To sign up for this free service, simply enroll at www.icsdelivery.com/alger.
Dear Shareholders, May 30, 2008
Typically, halfway through the fiscal year is not the time to start making predictions. Those often rose-tinged foresights are usually better saved for year-end when the turbulence and froth of a hectic year have begun to settle down and investors have started to relax in an atmosphere of seasonal and consumer-driven glad tidings.
However, finding any reason to relax — much less celebrate — at our previous fiscal year-end proved difficult. Following one of the strongest growth-driven markets in years — with the Dow Jones Industrial Averagei spending several days above 14,000 — the end of 2007 saw the markets take a severe tailspin fueled by the subprime debacle and subsequent mass paranoia, only to worsen in early 2008. Only in the past month has the fallout begun to subside, providing investors with much needed breathing room.
So, while we'll save our broad predictions for another six months, we feel optimistic enough to reflect on why we think the worst of this cycle may be behind us, and why the recent downturn may actually provide investors with an opportunity to take advantage of what we are calling an "if only" market.
First Quarter Blues
The beginning of 2008 was remarkably painful in the markets, both in the United States and globally. Fall-out from the subprime mess touched almost every aspect of the economy, and reached well beyond the financial sector. The sell-off happened rapidly and with little fanfare, and few names or investors escaped unscathed. Without question, economic data for January was almost completely grim: an anemic jobs report that showed the first contraction (-17,000) of the labor force since 2003, although the unemployment rate did tick down to 4.9%; a preliminary reading of GDP growth for the last quarter of 2007 that showed the economy barely expanding at 0.6%.
It would be nice to say that the markets took these data points in stride. They did not. In fact, through the first week of February, both the S&P 500ii (down 9.3%) and the Nasdaqiii (down 13.2%) had their worst performance ever for the beginning of the year. While markets often end the year up when they begin the year down, the depth, speed, and intensity of the sell-off in January and early February hardly instilled investors with an optimistic sense of what lay ahead.
As of this writing, whether the economy as a whole ever officially entered a statistical recession or not seems beside the point. A significant majority of the American public — not to mention investors abroad — believed that it did, with investors feeling a significant psychological impediment to the aggressive devil-may-care spending of years past. Perception — particularly in the early months of 2008 — dictated that Wall Street earnings expectations for the year ahead were unrealistically high, with future growth likely to be minimal or non-existent.
Now, at the halfway mark of the fiscal year, it would be presumptuous to imply that the pain experienced during the first months of the year is over. Bear Stearn's
-1-
meltdown may — or may not — be an isolated institutional failure, and repercussions from the fall-out may be felt throughout this year, and perhaps even into the next. As investors, we think that it's wise in the current market climate to take a conservative view of the economy and future earnings. At a time when negative results trigger sharp stock sell-offs and good results fade quickly, investors are well served by assessing base case and bear scenarios rigorously and steering clear of names where the downside risk outweighs the upside potential.
The above being said, we think there are certainly positives to consider, particularly concerning growth equity investing. Stocks and the economy do not necessarily move in sync, and few believe that we are looking at a protracted or steep economic contraction. Corporate balance sheets appear as stable and clean as they have ever been, with little debt and lots of cash. And the equity markets have already priced in most negative economic scenarios. In fact, we believe that years from now, today's market may be seen as one of the great "if only" markets: a missed opportunity for those who withdrew and have yet to re-enter; and a boom time for those who have returned or "stuck it out."
The "If Only" Market
What exactly is an "if only" market? It is a market looked back upon wistfully by those not in it, who mutter to themselves, "If only I had known then what I know now, I would have bought, bought, and bought some more." And then they sigh, and say even more quietly, "If only..."
This is not a judgment call on the next few months. The markets have been trading sideways since early February and may even "violate" the lows of January and go down sharply. However, in our view, the markets have been witnessing a classic financial crisis unfolding in the context of a softening domestic economy. Unlike previous crises, however, the present issues are offset by a climate of global strength that benefits the earnings potential of many U.S.-listed companies. It is also occurring in a world awash in liquidity and where interest rates are historically low.
Typically, in periods of market flight, it is rare for growth managers to do particularly well, especially when the selling is not based on weak fundamentals. However, stock declines notwithstanding, the composition of many of our portfolios suggest strong earnings and revenue growth, certainly when compared to the S&P 500, as well as price-to-earnings-growth ratios that we believe are quite reasonable.
Investors discounting the possibility of future growth — a typical reaction in negative markets — have themselves created buying opportunities. Some companies we follow have sold off as much as 30% or more with forward earnings still looking to be above 20%. In many cases, that leads to buy points for growth stocks at unusually low prices.
And just to put too fine a point on it, historical evidence shows us that "significantly down" quarters (defined as a decline of 5% or more of the S&P 500 over the last 25 years) rarely happen back-to-back. During the subsequent rebound periods, those markets were more likely to favor growth-style investing.
-2-
Our research has shown us that investors who immediately invested after each down quarter fared significantly better than investors who waited to invest only after returns had already improved or enough time for the "markets to stabilize" had passed. So, it's quite possible that, years from now, the second fiscal quarter of 2008 may be viewed as that tremendous quarter in which to have invested, leaving many investors saying, "If only I had gotten in then."
Portfolio Matters
Alger LargeCap Growth Institutional Fund
The Alger LargeCap Growth Institutional Fund returned -11.68% for the six months ended April 30, 2008, compared with a return of -9.28% for the Russell 1000 Growth Indexiv.
Information Technology represented an average weight of 30.58%. The Fund was overweight compared to the benchmark, but outperformed in this sector, despite a decidedly down market for tech stocks. Strong performers included Research In Motion, Ltd., manufacturer of the Blackberry and other wireless communication products, Take-Two Interactive Software, Inc., a leading developer and distributor of video and computer games, and Broadcom Corporation, a supplier of integrated circuits. In this sector, the Fund saw detractors from Cisco Systems, Inc., Google, Inc., and Microsoft Corp.
At an average weight of 16.38%, the Fund was overweight the benchmark, but outperformed in the Health Care sector. Leading contributors included Zimmer Holdings, Inc., a world leader in orthopedics and joint replacement solutions, Covidien Ltd., one of the largest healthcare devices and supplies companies worldwide, and Celgene Corp., a biopharmaceutical company developing innovative cancer therapies. Less impressive performances were seen from pharmaceutical distributors Merck & Co. Inc., and Schering-Plough Corp.
At an average weight of 10.98%, the Fund was underweight the benchmark in the Industrials sector and outperformed. BE Aerospace, the world's leading manufacturer of cabin interior products for commercial aircraft, Fluor Corporation, an engineering, construction, and maintenance services organizations, and First Solar, Inc., a manufacturer of thin film solar modules for solar power plants, were the key performers in this sector. Detractors included Boeing, Inc. the world's leading aerospace company, and General Electric Co.
In the Consumer Discretionary sector, at an average weight of 8.72%, the Fund was underweight and underperformed the benchmark. The Fund was negatively impacted by a steep drop in GPS device manufacturers due to a bidding war between competitors TomTom N.V. and Garmin, Ltd., as well as worries about intensifying competition from cell phones. The Fund did see solid contributions from E.W. Scripps Co., and DreamWorks Animation SKG, Inc., however, MGM MIRAGE resorts was another significant detractor.
-3-
Alger SmallCap Growth Institutional Fund
The Alger SmallCap Growth Institutional Fund returned -18.02% for the six months ended April 30, 2008, compared to the Russell 2000 Growth Indexv which returned -14.14%.
In the Information Technology sector, the Fund, at an average weight of 23.73%, was underweight compared to the benchmark, and underperformed. While the Fund saw solid contributions from software manufacturers Solera Holdings Inc. and THQ, Inc., they were not enough to offset weaker performances from Novatel Wireless, Inc., VeriFone Holdings, Inc., the global leader in secure electronic payment technologies, and DealerTrack Holdings, Inc., a leading provider of on-demand software and data solutions for the automotive retail industry in the United States.
At an average weight of 17.06%, the Fund was underweight but outperformed the benchmark in Health Care despite an increasingly complex market for health care. The Fund saw particularly strong performances from Illumina, Inc., a developer of genomic and proteomic analysis tools, and pharmaceutical screening applications, Adams Respiratory Therapeutics, Inc., a developer of prescription pharmaceuticals for the treatment of respiratory disorders, and Savient Pharmaceuticals, Inc., a biopharmaceutical company focused on developing products that target unmet medical needs. In this sector, the Fund saw less prominent performances within the biotech area from Progenics Pharmaceuticals, Inc., a developer of products for the treatment of cancer and viral diseases, OMRIX Pharmaceuticals, Inc., a leading developer of biosurgical and immunotherapy products, and in equipment and supplies from Inverness Medical Innovations, Inc., a manufacturer of women's health, cardiology, and infectious disease products.
At an average weight of 14.92%, the Fund was underweight but outperformed the benchmark in the Industrials sector. Solid performers were FTI Consulting, Inc., a global business advisory firm, Bucyrus International, Inc., a world leader in the manufacture of draglines, drills and shovels for the surface mining industry, and JA Solar Holdings Co., Ltd., a China-based manufacturer of high-performance solar cells. In this sector, the Fund saw detractors in URS Corporation, one of the world's largest engineering design services firms, and AirTran Holdings, the company that owns and operates the low-cost AirTran Airways.
In the Consumer Discretionary sector, the Fund, at an average weight of 13.25% was underweight the benchmark but outperformed. Top performers in this sector were the discount online travel provider priceline.com, Inc., Deckers Outdoor Corp., a manufacturer of function-oriented, high-performance outdoor footwear, and LKQ Corp., a provider of recycled components to repair light vehicles in the United States. Weaker performers in this sector came from GSI Commerce, Inc., an e-commerce company specializing in developing online shopping sites for retail companies, Iconix Brand Group, Inc., a designer, marketer, and distributor of leisure and fashion footwear, and Life Time Fitness, Inc., a national chain of fitness centers.
-4-
Alger MidCap Growth Institutional Fund
For the six months ended April 30, 2008, the Alger MidCap Growth Institutional Fund returned -15.22%, compared to the Russell MidCap Growth Indexvi with a return of -8.44%.
The Fund, at an average weight of 24.01%, had a significant exposure in Information Technology. This weighting was overweight the benchmark and underperformed. Despite good performances from Solera Holdings Inc., Broadcom Corporation, and Take-Two Interactive Software, Inc., the Fund showed less than satisfactory returns from Tessera Technologies, Inc., a leading provider of miniaturization technologies for the electronics industry, DealerTrack Holdings, Inc., and Apple, Inc.
At an average weight of 14.59%, the Fund was overweight the benchmark in the Health Care sector, but underperformed. Significant detractors included Metabolix, Inc., a biotech manufacturer of sustainable, environmentally-friendly plastics and chemicals, Allscripts Healthcare Solutions, Inc., a provider of management services and solutions for physicians, hospitals, and clinical education, and Inverness Medical Innovations, Inc. Stronger contributions in this sector primarily came from biotechnology providers including United Therapeutics Corp., Celgene Corp., and Pharmion.
In Consumer Discretionary the Fund, at an average weight of 14.20%, was underweight the benchmark and underperformed. GPS manufacturers Garmin Ltd., and TomTom N.V. were among the largest detractors, along with the auction house Sotheby's. The Fund did see solid contributions in the specialty retail space from GAME Group, PLC, Europe's leading retailer of video game products, and clothing retailer J. Crew Group, Inc.
The Fund was underweight the benchmark, at an average weight of 13.82%, in the Industrials sector but outperformed. Strong contributors included solar energy equipment providers JA Solar Holdings Co. Ltd., and First Solar, Inc., as well as TeleTech Holdings, Inc., a global business process company providing outsourced e-commerce services. The Fund did have less prominent performers in this sector, including BE Aerospace Inc., the world's leading manufacturer of cabin interior products for commercial aircraft, Textron, Inc. a global network of aircraft, industrial and finance businesses, and Shaw Group, Inc., an engineering company focused on piping, energy, and nuclear power.
Alger Capital Appreciation Institutional Fund
The Alger Capital Appreciation Institutional Fund returned -11.45% for the six months ended April 30, 2008, underperforming the Russell 3000 Growth Indexvii return of -9.68%.
Information Technology represented an average weight of 28.00% of the Fund's holdings, an overweight to the benchmark, and slightly underperformed. Leading contributors included Research in Motion, Ltd., Solera Holdings, Inc., and Broadcom Corp. The first half of the fiscal year showed mixed returns in this sector reflected in weaker performances including ON Semiconductor Corp., a leading provider of semiconductor components, Tessera Technologies, Inc., and DealerTrack Holdings, Inc.
-5-
In the Health Care sector, the Fund, at an average weight of 14.70%, was underweight compared to the benchmark but outperformed. Illumina, Inc., Celgene Corp., and United Therapeutics Corp. were among the top performers. The Fund saw poorer returns in this sector from the pharmaceutical leader Merck & Co., Inc., insurance provider Aetna, Inc., and Inverness Medical Innovations, Inc.
At an average weight of 11.71%, the Fund was underweight the benchmark in the Industrials sector but outperformed. The Fund saw substantial contributions from JA Solar Holdings Co., Ltd., First Solar, Inc., and BE Aerospace Inc. Detractors included Oshkosh Corporation, a manufacturer of trucking and specialty vehicles worldwide, and Boeing Co.
At an average weight of 11.14%, the Fund was underweight the benchmark in the Consumer Discretionary sector and underperformed. While the Fund had promising returns from Deckers Outdoor Corp., and LKQ Corp., it could not withstand lesser performances including Accor SA, one of the world's largest hotel groups, Sotheby's, and TomTom N.V.
In Summary
There may still be continued fall-out in the credit markets; the U.S. economy may remain weak or even contract in the coming quarters; but the long-term investing climate for stocks strikes us as extremely favorable given both the global profit growth, reasonable valuations, and signs that not all areas of the U.S. economy are impacted by the twin blows of the housing crisis and the credit crunch. To reiterate, we firmly believe that years from now, the present could be seen as one of the great "if only" markets, a time when the stocks of quality growth companies could be purchased at deep discounts and deliver returns that most investors dream of but never quite attain.
Respectfully submitted,
 | |
|
| Daniel C. Chung | |
|
| Chief Investment Officer | |
|
i The Dow Jones Industrial Average is an index of common stocks comprised of major industrial companies and assumes reinvestment of dividends. It is frequently used as a general measure of stock market performance.
ii Standard & Poor's 500 Index is an index of the 500 largest and most profitable companies in the United States.
iii The Nasdaq Composite Index is a market value-weighted index that measures all domestic and non-U.S.-based securities listed on the Nasdaq stock market.
-6-
iv The Russell 1000 Growth Index is an unmanaged index designed to measure the performance of the largest 1000 companies in the Russell 3000 Index with higher price-to-book ratios and higher forecasted growth values. The Russell 3000 Index measures the performance of the 3000 largest U.S. companies based on the total market capitalization, which represents 98% of the U.S. Equity Market. Investors can not invest directly in any index.
v The Russell 2000 Growth Index is an unmanaged index designed to measure the performance of the 2000 smallest companies in the Russell 3000 Index with higher price-to-book ratios and higher forecasted growth values.
vi The Russell Midcap Growth Index is an unmanaged index designed to measure the performance of the 800 smallest companies in the Russell 1000 Index with higher price-to-book ratios and higher forecasted growth values.
vii The Russell 3000 Growth Index is an unmanaged index designed to measure the performance of those Russell 3000 Index companies with higher price-to-book ratios and higher forecasted growth values.
Investors can not invest directly in an index. Index performance does not reflect the deduction for fees, expenses or taxes.
This report and the financial statements contained herein are submitted for the general information of shareholders of the Fund. This report is not authorized for distribution to prospective investors in the Fund unless preceded or accompanied by an effective prospectus for the Fund. Fund returns represent the fiscal six month period return of Class I shares. The performance data quoted represents past performance, which is not an indication or guarantee of future results. Standardized performance results can be found on the following pages. The investment return and principal value of an investment in a fund will fluctuate so that an investor's shares when redeemed may be worth more or less than their original cost. Current performance may be lower or higher than the performance quoted. For p erformance data current to the most recent month-end, visit us at www.alger.com, or call us at (800) 992-3863.
The views and opinions of the Fund's management in this report are as of the date of the Shareholders letter and are subject to change at any time subsequent to this date. There is no guarantee that any of the assumptions that formed the basis for the opinions stated herein are accurate or that they will materialize. Moreover, the information forming the basis for such assumptions is from sources believed to be reliable; however, there is no guarantee that such information is accurate. Any securities mentioned should be considered in the context of the construction of an overall portfolio of securities and therefore reference to them should not be construed as a recommendation or offer to purchase or sell any such security. Inclusion of such securities in a fund and transactions in such securities may be for a variety of reasons, including without limitation, in response to cash flows, inclusion in a benchmark and risk control. Please refer to the Schedule of Investments for each fund which is included in this report for a complete list of fund holdings as of April 30, 2008. Securities mentioned in the Shareholders letter, if not found in the Schedule of Investments, were held by the Fund during the six months ended April 30, 2008.
A Word About Risk
Growth stocks tend to be more volatile than other stocks as the price of growth stocks tends to be higher in relation to their companies' earnings and may be more
-7-
sensitive to market, political and economic developments. Investing in the stock market involves gains and losses and may not be suitable for all investors. Stocks of small- and mid-sized companies are subject to greater risk than stocks of larger, more established companies owing to such factors as limited liquidity, inexperienced management, and limited financial resources. Funds that participate in leveraging, such as the Capital Appreciation Institutional Fund, are subject to the risk that borrowing money to leverage will exceed the returns for securities purchased or that the securities purchased may actually go down in value; thus, the Fund's net asset value can decrease more quickly than if the Fund had not borrowed. For a more detailed discussion of the risks associated with a Fund, please see the Fund's Prospectus.
Before investing, carefully consider a fund's investment objective, risks, charges, and expenses. For a prospectus containing this and other information about The Alger Institutional Funds call us at (800) 992-3863 or visit us at www.alger.com. Read it carefully before investing. Fred Alger & Company, Incorporated, Distributor. Member NYSE, SIPC.
NOT FDIC INSURED. NOT BANK GUARANTEED. MAY LOSE VALUE.
-8-
ALGER LARGECAP GROWTH INSTITUTIONAL FUND
Fund Highlights Through April 30, 2008 (Unaudited)
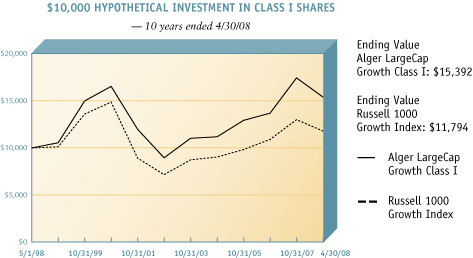
The chart above illustrates the growth in value of a hypothetical $10,000 investment made in the Alger LargeCap Growth Institutional Class I shares and the Russell 1000 Growth Index (an unmanaged index of common stocks) for the ten years ended April 30, 2008. The figures for the Alger LargeCap Growth Institutional Class I shares and the Russell 1000 Growth Index include reinvestment of dividends. Performance for the Alger LargeCap Growth Institutional Class R shares may vary from the results shown above due to differences in expenses the class bears.
PERFORMANCE COMPARISON
AVERAGE ANNUAL TOTAL RETURNS
| | | 1
YEAR | | 5
YEARS | | 10
YEARS | | SINCE
INCEPTION | |
| As of 4/30/08 | |
| Class I (Inception 11/8/93) | | | 2.41 | % | | | 10.60 | % | | | 4.41 | % | | | 9.31 | % | |
| Russell 1000 Growth Index | | | (0.24 | %) | | | 9.52 | % | | | 1.66 | % | | | 8.25 | % | |
| Class R (Inception 1/27/03) | | | 1.82 | % | | | 10.04 | % | | | N/A | | | | 11.72 | % | |
| Russell 1000 Growth Index | | | (0.24 | %) | | | 9.52 | % | | | N/A | | | | 10.73 | % | |
| As of 3/31/08 | |
| Class I | | | 0.36 | % | | | 11.17 | % | | | 3.96 | % | | | 8.94 | % | |
| Russell 1000 Growth Index | | | (0.24 | %) | | | 9.52 | % | | | 1.66 | % | | | 7.91 | % | |
| Class R | | | (0.14 | %) | | | 10.62 | % | | | N/A | | | | 10.75 | % | |
| Russell 1000 Growth Index | | | (0.24 | %) | | | 9.52 | % | | | N/A | | | | 7.91 | % | |
The performance data quoted represents past performance, which is not an indication or a guarantee of future results. The Fund's average annual total returns include changes in share price and reinvestment of dividends and capital gains. The graph and table above do not reflect the deduction of taxes that a shareholder would have paid on fund distributions or on the redemption of fund shares. Investment return and principal will fluctuate and the Fund's shares, when redeemed, may be worth more or less than their original cost. Current performance may be higher or lower than the performance quoted. For performance current to the most recent month end, visit us at www.alger.com or call us at (800) 992-3863.
-9-
ALGER SMALLCAP GROWTH INSTITUTIONAL FUND
Fund Highlights Through April 30, 2008 (Unaudited)
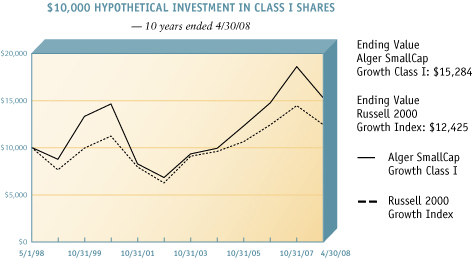
The chart above illustrates the growth in value of a hypothetical $10,000 investment made in the Alger SmallCap Growth Institutional Class I shares and the Russell 2000 Growth Index (an unmanaged index of common stocks) for the ten years ended April 30, 2008. The figures for the Alger SmallCap Growth Institutional Class I shares and the Russell 2000 Growth Index include reinvestment of dividends. Performance for the Alger SmallCap Growth Institutional Class R shares may vary from the results shown above due to differences in expenses the class bears.
PERFORMANCE COMPARISON
AVERAGE ANNUAL TOTAL RETURNS
| | | 1
YEAR | | 5
YEARS | | 10
YEARS | | SINCE
INCEPTION | |
| As of 4/30/08 | |
| Class I (Inception 11/8/93) | | | (5.91 | %) | | | 16.61 | % | | | 4.33 | % | | | 10.11 | % | |
| Russell 2000 Growth Index | | | (6.69 | %) | | | 13.33 | % | | | 2.20 | % | | | 5.80 | % | |
| Class R (Inception 1/27/03) | | | (6.41 | %) | | | 16.06 | % | | | N/A | | | | 16.77 | % | |
| Russell 2000 Growth Index | | | (6.69 | %) | | | 13.33 | % | | | N/A | | | | 14.22 | % | |
| As of 3/31/08 | |
| Class I | | | (7.57 | %) | | | 17.04 | % | | | 3.89 | % | | | 9.81 | % | |
| Russell 2000 Growth Index | | | (8.93 | %) | | | 14.24 | % | | | 1.75 | % | | | 5.47 | % | |
| Class R | | | (8.03 | %) | | | 16.51 | % | | | N/A | | | | 16.01 | % | |
| Russell 2000 Growth Index | | | (8.93 | %) | | | 14.24 | % | | | N/A | | | | 13.36 | % | |
The performance data quoted represents past performance, which is not an indication or a guarantee of future results. The Fund's average annual total returns include changes in share price and reinvestment of dividends and capital gains. The graph and table above do not reflect the deduction of taxes that a shareholder would have paid on fund distributions or on the redemption of fund shares. Investment return and principal will fluctuate and the Fund's shares, when redeemed, may be worth more or less than their original cost. Current performance may be higher or lower than the performance quoted. For performance current to the most recent month end, visit us at www.alger.com or call us at (800) 992-3863.
-10-
ALGER MIDCAP GROWTH INSTITUTIONAL FUND
Fund Highlights Through April 30, 2008 (Unaudited)
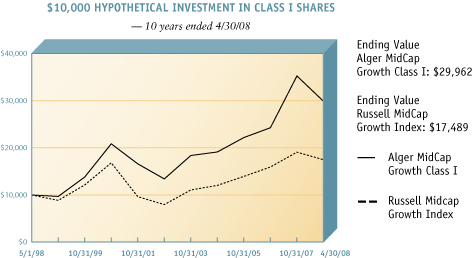
The chart above illustrates the growth in value of a hypothetical $10,000 investment made in the Alger MidCap Growth Institutional Class I shares and the Russell Midcap Growth Index (an unmanaged index of common stocks) for the ten years ended April 30, 2008. Figures for the Alger MidCap Growth Institutional Class I shares and the Russell Midcap Growth Index include reinvestment of dividends. Performance for the Alger MidCap Growth Institutional Class R shares may vary from the results shown above due to differences in expenses the class bears.
PERFORMANCE COMPARISON
AVERAGE ANNUAL TOTAL RETURNS
| | | 1
YEAR | | 5
YEARS | | 10
YEARS | | SINCE
INCEPTION | |
| As of 4/30/08 | |
| Class I (Inception 11/8/93) | | | 5.76 | % | | | 16.07 | % | | | 11.60 | % | | | 15.88 | % | |
| Russell Midcap Growth Index | | | (1.93 | %) | | | 15.29 | % | | | 5.75 | % | | | 9.70 | % | |
| Class R (Inception 1/27/03) | | | 5.27 | % | | | 15.53 | % | | | N/A | | | | 17.06 | % | |
| Russell Midcap Growth Index | | | (1.93 | %) | | | 15.29 | % | | | N/A | | | | 16.10 | % | |
| As of 3/31/08 | |
| Class I | | | 3.34 | % | | | 16.21 | % | | | 10.97 | % | | | 15.50 | % | |
| Russell MidCap Growth Index | | | (4.56 | %) | | | 15.20 | % | | | 5.15 | % | | | 9.23 | % | |
| Class R | | | 2.81 | % | | | 15.65 | % | | | N/A | | | | 16.00 | % | |
| Russell MidCap Growth Index | | | (4.56 | %) | | | 15.29 | % | | | N/A | | | | 14.81 | % | |
The performance data quoted represents past performance, which is not an indication or a guarantee of future results. The Fund's average annual total returns include changes in share price and reinvestment of dividends and capital gains. The graph and table above do not reflect the deduction of taxes that a shareholder would have paid on fund distributions or on the redemption of fund shares. Investment return and principal will fluctuate and the Fund's shares, when redeemed, may be worth more or less than their original cost. Current performance may be higher or lower than the performance quoted. For performance current to the most recent month end, visit us at www.alger.com or call us at (800) 992-3863.
-11-
ALGER CAPITAL APPRECIATION INSTITUTIONAL FUND
Fund Highlights Through April 30, 2008 (Unaudited)
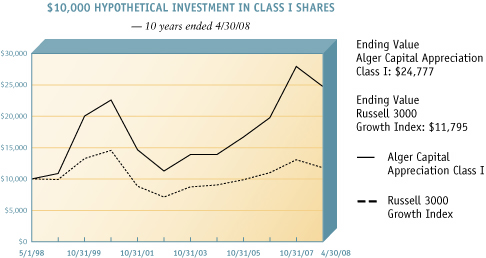
The chart above illustrates the growth in value of a hypothetical $10,000 investment made in the Alger Capital Appreciation Institutional Class I shares and the Russell 3000 Growth Index (an unmanaged index of common stocks) for the ten years ended April 30, 2008. Figures for the Alger Capital Appreciation Institutional Class I shares and the Russell 3000 Growth Index include reinvestment of dividends. Performance for the Alger Capital Appreciation Institutional Class R shares may vary from the results shown above due to differences in expenses the class bears.
PERFORMANCE COMPARISON
AVERAGE ANNUAL TOTAL RETURNS
| | | 1
YEAR | | 5
YEARS | | 10
YEARS | | SINCE
INCEPTION | |
| As of 4/30/08 | |
| Class I shares (Inception 11/8/93) | | | 7.23 | % | | | 16.00 | % | | | 9.50 | % | | | 13.27 | % | |
| Russell 3000 Growth Index | | | (0.79 | %) | | | 9.78 | % | | | 1.66 | % | | | 7.98 | % | |
| Class R shares (Inception 1/27/03) | | | 6.66 | % | | | 15.44 | % | | | N/A | | | | 17.13 | % | |
| Russell 3000 Growth Index | | | (0.79 | %) | | | 9.78 | % | | | N/A | | | | 10.97 | % | |
| As of 3/31/08 | |
| Class I shares | | | 4.74 | % | | | 16.33 | % | | | 9.19 | % | | | 12.87 | % | |
| Russell 3000 Growth Index | | | (1.46 | %) | | | 10.25 | % | | | 1.28 | % | | | 7.64 | % | |
| Class R shares | | | 4.27 | % | | | 15.75 | % | | | N/A | | | | 16.05 | % | |
| Russell 3000 Growth Index | | | (1.46 | %) | | | 10.25 | % | | | N/A | | | | 10.06 | % | |
The performance data quoted represents past performance, which is not an indication or a guarantee of future results. The Fund's average annual total returns include changes in share price and reinvestment of dividends and capital gains. The graph and table above do not reflect the deduction of taxes that a shareholder would have paid on fund distributions or on the redemption of fund shares. Investment return and principal will fluctuate and the Fund's shares, when redeemed, may be worth more or less than their original cost. Current performance may be higher or lower than the performance quoted. For performance current to the most recent month end, visit us at www.alger.com or call us at (800) 992-3863.
-12-
PORTFOLIO SUMMARY*
April 30, 2008 (Unaudited)
| SECTORS | | LARGECAP
GROWTH
INSTITUTIONAL
FUND | | SMALLCAP
GROWTH
INSTITUTIONAL
FUND | | MIDCAP
GROWTH
INSTITUTIONAL
FUND | | CAPITAL
APPRECIATION
INSTITUTIONAL
FUND | |
| Consumer Discretionary | | | 12.9 | % | | | 14.1 | % | | | 10.1 | % | | | 7.5 | % | |
| Consumer Staples | | | 8.5 | | | | 2.2 | | | | 3.1 | | | | 5.8 | | |
| Energy | | | 8.0 | | | | 9.4 | | | | 14.2 | | | | 10.1 | | |
| Financials | | | 6.8 | | | | 4.4 | | | | 6.4 | | | | 8.2 | | |
| Health Care | | | 14.4 | | | | 15.2 | | | | 14.7 | | | | 15.1 | | |
| Industrials | | | 9.2 | | | | 17.1 | | | | 13.0 | | | | 11.0 | | |
| Information Technology | | | 29.1 | | | | 24.8 | | | | 27.3 | | | | 30.7 | | |
| Materials | | | 1.9 | | | | 3.9 | | | | 6.5 | | | | 4.9 | | |
| Telecommunication Services | | | 1.5 | | | | 3.2 | | | | 1.7 | | | | 0.4 | | |
| Utilities | | | 0.0 | | | | 1.4 | | | | 1.7 | | | | 0.0 | | |
| Cash and Net Other Assets | | | 7.7 | | | | 4.3 | | | | 1.3 | | | | 6.3 | | |
| | | | 100.0 | % | | | 100.0 | % | | | 100.0 | % | | | 100.0 | % | |
* Based on net assets for each Fund.
-13-
THE ALGER INSTITUTIONAL FUNDS | ALGER LARGECAP GROWTH INSTITUTIONAL FUND
Schedule of Investments (Unaudited) April 30, 2008
| COMMON STOCKS—92.3% | | SHARES | | VALUE | |
| ADVERTISING—.6% | |
| Focus Media Holding Ltd.*# | | | 9,350 | | | $ | 344,922 | | |
| AEROSPACE/DEFENSE—4.4% | |
| BE Aerospace Inc.* | | | 8,150 | | | | 328,934 | | |
| Boeing Co. | | | 10,250 | | | | 869,815 | | |
| General Dynamics Corp. | | | 15,100 | | | | 1,365,342 | | |
| | | | 2,564,091 | | |
| AGRICULTURE—3.1% | |
| Altria Group Inc. | | | 33,300 | | | | 666,000 | | |
| Philip Morris International Inc.* | | | 22,300 | | | | 1,137,969 | | |
| | | | 1,803,969 | | |
| BANKS—.6% | |
| PNC Financial Services Group Inc. | | | 4,950 | | | | 343,283 | | |
| BEVERAGES—2.1% | |
| PepsiCo Inc. | | | 17,950 | | | | 1,230,114 | | |
| BIOTECHNOLOGY—2.4% | |
| Amgen Inc.* | | | 8,250 | | | | 345,427 | | |
| Celgene Corp.* | | | 7,700 | | | | 478,478 | | |
| Genentech Inc.* | | | 8,050 | | | | 549,010 | | |
| | | | 1,372,915 | | |
| CHEMICALS—1.3% | |
| Monsanto Co. | | | 5,300 | | | | 604,306 | | |
| Potash Corp. of Saskatchewan | | | 650 | | | | 119,568 | | |
| | | | 723,874 | | |
| COMPUTERS—9.6% | |
| Apple Inc.* | | | 10,150 | | | | 1,765,592 | | |
| Cognizant Technology Solutions Corp., Cl. A* | | | 19,450 | | | | 627,262 | | |
| Dell Inc.* | | | 20,350 | | | | 379,120 | | |
| EMC Corp.* | | | 61,550 | | | | 947,870 | | |
| Hewlett-Packard Co. | | | 16,750 | | | | 776,362 | | |
| Research In Motion Ltd.* | | | 6,900 | | | | 839,247 | | |
| SanDisk Corp.* | | | 8,200 | | | | 222,138 | | |
| | | | 5,557,591 | | |
| COSMETICS/PERSONAL CARE—1.1% | |
| Procter & Gamble Co. | | | 9,650 | | | | 647,033 | | |
| DIVERSIFIED FINANCIAL SERVICES—6.3% | |
| AllianceBernstein Holding LP | | | 5,300 | | | | 328,706 | | |
| Bolsa de Mercadorias e Futuros—BM&F | | | 850 | | | | 8,338 | | |
| Bovespa Holding SA | | | 33,450 | | | | 492,173 | | |
| Goldman Sachs Group Inc./The | | | 2,600 | | | | 497,562 | | |
| Janus Capital Group Inc. | | | 14,800 | | | | 415,288 | | |
| Lazard Ltd., Cl. A | | | 4,100 | | | | 160,474 | | |
| Nymex Holdings Inc. | | | 12,750 | | | | 1,180,650 | | |
| NYSE Euronext | | | 8,050 | | | | 532,105 | | |
| | | | 3,615,296 | | |
-14-
THE ALGER INSTITUTIONAL FUNDS | ALGER LARGECAP GROWTH INSTITUTIONAL FUND
Schedule of Investments (Continued) (Unaudited) April 30, 2008
| COMMON STOCKS—(CONT.) | | SHARES | | VALUE | |
| ELECTRONICS—1.2% | |
| Garmin Ltd. | | | 16,850 | | | $ | 689,165 | | |
| ENGINEERING & CONSTRUCTION—1.0% | |
| Fluor Corp. | | | 3,650 | | | | 557,975 | | |
| ENTERTAINMENT—.8% | |
| DreamWorks Animation SKG Inc., Cl. A* | | | 6,900 | | | | 192,924 | | |
| International Game Technology | | | 8,300 | | | | 288,342 | | |
| | | | 481,266 | | |
| FOOD—.5% | |
| Whole Foods Market Inc. | | | 8,605 | | | | 280,867 | | |
| HEALTHCARE—PRODUCTS—8.3% | |
| Beckman Coulter Inc. | | | 4,450 | | | | 303,935 | | |
| Covidien Ltd. | | | 11,450 | | | | 534,601 | | |
| Hologic Inc.* | | | 18,000 | | | | 525,420 | | |
| Inverness Medical Innovations Inc.* | | | 12,750 | | | | 471,750 | | |
| Johnson & Johnson | | | 18,900 | | | | 1,268,001 | | |
| Quest Diagnostics Inc. | | | 14,100 | | | | 707,538 | | |
| St. Jude Medical Inc.* | | | 16,300 | | | | 713,614 | | |
| Varian Medical Systems Inc.* | | | 6,400 | | | | 300,032 | | |
| | | | 4,824,891 | | |
| HOME FURNISHINGS—1.5% | |
| Harman International Industries Inc. | | | 3,700 | | | | 151,219 | | |
| Sony Corp.# | | | 15,650 | | | | 716,614 | | |
| | | | 867,833 | | |
| INTERNET—6.4% | |
| Alibaba.com Ltd.* | | | 136,450 | | | | 252,082 | | |
| Amazon.Com Inc.* | | | 5,000 | | | | 393,150 | | |
| eBay Inc.* | | | 35,400 | | | | 1,107,666 | | |
| Expedia Inc.* | | | 10,850 | | | | 274,071 | | |
| Google Inc., Cl. A* | | | 2,950 | | | | 1,694,155 | | |
| | | | 3,721,124 | | |
| LODGING—2.1% | |
| MGM Mirage* | | | 23,200 | | | | 1,186,680 | | |
| MEDIA—2.7% | |
| EW Scripps Co., Cl. A | | | 34,450 | | | | 1,547,150 | | |
| MINING—1.1% | |
| Freeport-McMoRan Copper & Gold Inc. | | | 3,402 | | | | 386,977 | | |
| Uranium One Inc.* | | | 59,050 | | | | 272,647 | | |
| | | | 659,624 | | |
| MISCELLANEOUS MANUFACTURING—3.8% | |
| General Electric Co. | | | 21,800 | | | | 712,860 | | |
| ITT Corp. | | | 22,802 | | | | 1,459,328 | | |
| | | | 2,172,188 | | |
-15-
THE ALGER INSTITUTIONAL FUNDS | ALGER LARGECAP GROWTH INSTITUTIONAL FUND
Schedule of Investments (Continued) (Unaudited) April 30, 2008
| COMMON STOCKS—(CONT.) | | SHARES | | VALUE | |
| OIL & GAS—2.8% | |
| ConocoPhillips | | | 7,900 | | | $ | 680,585 | | |
| Exxon Mobil Corp. | | | 9,750 | | | | 907,432 | | |
| | | | 1,588,017 | | |
| OIL & GAS SERVICES—4.8% | |
| National Oilwell Varco Inc.* | | | 8,750 | | | | 598,938 | | |
| Schlumberger Ltd. | | | 10,350 | | | | 1,040,693 | | |
| Transocean Inc.* | | | 7,747 | | | | 1,142,373 | | |
| | | | 2,782,004 | | |
| PHARMACEUTICALS—3.7% | |
| Abbott Laboratories | | | 6,100 | | | | 321,775 | | |
| Allergan Inc. | | | 8,050 | | | | 453,778 | | |
| Merck & Co., Inc. | | | 16,100 | | | | 612,444 | | |
| Mylan Inc. | | | 29,900 | | | | 393,783 | | |
| Shire PLC# | | | 6,750 | | | | 370,845 | | |
| | | | 2,152,625 | | |
| RETAIL—4.1% | |
| Kohl's Corp.* | | | 11,000 | | | | 537,350 | | |
| Macy's Inc. | | | 17,050 | | | | 431,195 | | |
| Starbucks Corp.* | | | 29,000 | | | | 470,670 | | |
| Walgreen Co. | | | 27,300 | | | | 951,405 | | |
| | | | 2,390,620 | | |
| SEMICONDUCTORS—4.4% | |
| Broadcom Corp., Cl. A* | | | 19,100 | | | | 495,836 | | |
| Intel Corp. | | | 31,600 | | | | 703,416 | | |
| MEMC Electronic Materials Inc.* | | | 14,150 | | | | 891,025 | | |
| NVIDIA Corp.* | | | 23,200 | | | | 476,760 | | |
| | | | 2,567,037 | | |
| SOFTWARE—5.8% | |
| Intuit Inc.* | | | 15,650 | | | | 422,080 | | |
| Microsoft Corp. | | | 81,700 | | | | 2,330,084 | | |
| Oracle Corp.* | | | 17,150 | | | | 357,578 | | |
| TomTom NV* | | | 6,550 | | | | 228,428 | | |
| | | | 3,338,170 | | |
| TELECOMMUNICATIONS—4.6% | |
| Cisco Systems Inc.* | | | 43,650 | | | | 1,119,186 | | |
| QUALCOMM Inc. | | | 16,800 | | | | 725,592 | | |
| Verizon Communications Inc. | | | 21,850 | | | | 840,788 | | |
| | | | 2,685,566 | | |
| TOYS/GAMES/HOBBIES—1.2% | |
| Nintendo Co., Ltd.# | | | 9,850 | | | | 672,705 | | |
TOTAL COMMON STOCKS
(Cost $54,476,561) | | | | | | | 53,368,595 | | |
-16-
THE ALGER INSTITUTIONAL FUNDS | ALGER LARGECAP GROWTH INSTITUTIONAL FUND
Schedule of Investments (Continued) (Unaudited) April 30, 2008
| SHORT-TERM INVESTMENTS—7.9% | | PRINCIPAL
AMOUNT | | VALUE | |
| TIME DEPOSITS | |
| Branch Bank & Trust Grand Cayman, 1.84%, 5/1/08 | | $ | 2,200,000 | | | $ | 2,200,000 | | |
| Wachovia London, 1.84%, 5/1/08 | | | 2,200,000 | | | | 2,200,000 | | |
| Wells Fargo Grand Cayman, 1.84%, 5/1/08 | | | 153,412 | | | | 153,412 | | |
TOTAL TIME DEPOSITS
(Cost $4,553,412) | | | | | | | 4,553,412 | | |
Total Investments
(Cost $59,029,973)(a) | | | 100.2 | % | | | 57,922,007 | | |
| Liabilities in Excess of Other Assets | | | (0.2 | ) | | | (101,240 | ) | |
| NET ASSETS | | | 100.0 | % | | $ | 57,820,767 | | |
* Non-income producing securities.
# American Depositary Trust
(a) At April 30, 2008, the net unrealized depreciation on investments, based on cost for federal income tax purposes of $59,029,973 amounted to $1,107,966 which consisted of aggregate gross unrealized appreciation of $3,182,367 and aggregate gross unrealized depreciation of $4,290,333.
See Notes to Financial Statements.
-17-
THE ALGER INSTITUTIONAL FUNDS | ALGER SMALLCAP GROWTH INSTITUTIONAL FUND
Schedule of Investments (Unaudited) April 30, 2008
| COMMON STOCKS—95.7% | | SHARES | | VALUE | |
| AEROSPACE/DEFENSE—2.9% | |
| BE Aerospace Inc.* | | | 328,655 | | | $ | 13,264,516 | | |
| Esterline Technologies Corp.* | | | 244,525 | | | | 13,610,261 | | |
| | | | 26,874,777 | | |
| AIRLINES—.3% | |
| Airtran Holdings Inc.* | | | 914,190 | | | | 3,117,388 | | |
| APPAREL—2.2% | |
| Deckers Outdoor Corp.* | | | 83,250 | | | | 11,494,327 | | |
| Iconix Brand Group Inc.* | | | 519,225 | | | | 8,266,062 | | |
| | | | 19,760,389 | | |
| AUTO PARTS & EQUIPMENT—.8% | |
| Tenneco Inc.* | | | 286,155 | | | | 7,319,845 | | |
| BANKS—1.8% | |
| First Midwest Bancorp Inc. | | | 327,600 | | | | 8,363,628 | | |
| Signature Bank* | | | 315,460 | | | | 8,321,835 | | |
| | | | 16,685,463 | | |
| BEVERAGES—1.0% | |
| Central European Distribution Corp.* | | | 155,650 | | | | 9,482,198 | | |
| BIOTECHNOLOGY—3.4% | |
| Acorda Therapeutics Inc.* | | | 245,850 | | | | 5,175,142 | | |
| Illumina Inc.* | | | 165,330 | | | | 12,877,554 | | |
| InterMune Inc.* | | | 369,055 | | | | 5,849,522 | | |
| Savient Pharmaceuticals Inc.* | | | 321,200 | | | | 7,015,008 | | |
| | | | 30,917,226 | | |
| CHEMICALS—.7% | |
| Zoltek Cos., Inc.* | | | 238,230 | | | | 6,353,594 | | |
| COMMERCIAL SERVICES—7.4% | |
| Corinthian Colleges Inc.* | | | 282,350 | | | | 3,204,672 | | |
| FTI Consulting Inc.* | | | 185,810 | | | | 11,891,840 | | |
| Geo Group Inc./The* | | | 466,100 | | | | 12,328,345 | | |
| Parexel International Corp.* | | | 477,112 | | | | 12,118,645 | | |
| TeleTech Holdings Inc.* | | | 491,000 | | | | 11,258,630 | | |
| VistaPrint Ltd.* | | | 291,750 | | | | 9,928,252 | | |
| Wright Express Corp.* | | | 219,885 | | | | 7,256,205 | | |
| | | | 67,986,589 | | |
| COMPUTERS—2.7% | |
| IHS Inc., Cl. A* | | | 110,750 | | | | 7,315,037 | | |
| SI International Inc.* | | | 312,530 | | | | 7,169,438 | | |
| Synaptics Inc.* | | | 298,550 | | | | 10,132,787 | | |
| | | | 24,617,262 | | |
| DISTRIBUTION/WHOLESALE—1.2% | |
| LKQ Corp.* | | | 518,990 | | | | 11,293,222 | | |
| DIVERSIFIED FINANCIAL SERVICES—.7% | |
| Greenhill & Co., Inc. | | | 92,560 | | | | 6,021,028 | | |
-18-
THE ALGER INSTITUTIONAL FUNDS | ALGER SMALLCAP GROWTH INSTITUTIONAL FUND
Schedule of Investments (Continued) (Unaudited) April 30, 2008
| COMMON STOCKS—(CONT.) | | SHARES | | VALUE | |
| ELECTRIC—1.4% | |
| ITC Holdings Corp. | | | 236,210 | | | $ | 13,175,794 | | |
| ENERGY—ALTERNATE SOURCES—1.4% | |
| JA Solar Holdings Co., Ltd.*# | | | 517,200 | | | | 12,417,972 | | |
| ENGINEERING & CONSTRUCTION—2.1% | |
| Aecom Technology Corp.* | | | 462,250 | | | | 12,693,385 | | |
| URS Corp.* | | | 170,505 | | | | 6,878,172 | | |
| | | | 19,571,557 | | |
| ENTERTAINMENT—.8% | |
| Bally Technologies Inc.* | | | 219,800 | | | | 7,405,062 | | |
| FOOD—1.2% | |
| Hain Celestial Group Inc.* | | | 425,215 | | | | 10,494,306 | | |
| HEALTHCARE—PRODUCTS—6.9% | |
| Cepheid Inc.* | | | 329,700 | | | | 6,452,229 | | |
| Gentiva Health Services Inc.* | | | 479,400 | | | | 10,422,156 | | |
| Hologic Inc.* | | | 332,300 | | | | 9,699,837 | | |
| Icon PLC# | | | 74,300 | | | | 5,349,600 | | |
| Inverness Medical Innovations Inc.* | | | 220,100 | | | | 8,143,700 | | |
| Meridian Bioscience Inc. | | | 274,700 | | | | 7,397,671 | | |
| Psychiatric Solutions Inc.* | | | 216,720 | | | | 7,522,351 | | |
| Thoratec Corp.* | | | 543,300 | | | | 8,687,367 | | |
| | | | 63,674,911 | | |
| HOUSEHOLD PRODUCTS/WARES—.6% | |
| Tupperware Brands Corp. | | | 146,100 | | | | 5,756,340 | | |
| INSURANCE—2.0% | |
| First Mercury Financial Corp.* | | | 540,551 | | | | 8,540,706 | | |
| Max Capital Group Ltd. | | | 215,760 | | | | 5,050,942 | | |
| Platinum Underwriters Holdings Ltd. | | | 129,000 | | | | 4,627,230 | | |
| | | | 18,218,878 | | |
| INTERNET—4.4% | |
| DealerTrack Holdings Inc.* | | | 341,795 | | | | 6,576,136 | | |
| Digital River Inc.* | | | 156,300 | | | | 5,134,455 | | |
| GSI Commerce Inc.* | | | 743,200 | | | | 10,345,344 | | |
| Priceline.com Inc.* | | | 91,010 | | | | 11,616,516 | | |
| TIBCO Software Inc.* | | | 866,930 | | | | 6,649,353 | | |
| | | | 40,321,804 | | |
| LEISURE TIME—2.2% | |
| Life Time Fitness Inc.* | | | 338,095 | | | | 12,289,753 | | |
| WMS Industries Inc.* | | | 220,400 | | | | 7,976,276 | | |
| | | | 20,266,029 | | |
| MACHINERY—CONSTRUCTION & MINING—1.5% | |
| Bucyrus International Inc., Cl. A | | | 111,130 | | | | 13,994,601 | | |
| METAL FABRICATE/HARDWARE—1.4% | |
| RBC Bearings Inc.* | | | 332,990 | | | | 13,309,610 | | |
-19-
THE ALGER INSTITUTIONAL FUNDS | ALGER SMALLCAP GROWTH INSTITUTIONAL FUND
Schedule of Investments (Continued) (Unaudited) April 30, 2008
| COMMON STOCKS—(CONT.) | | SHARES | | VALUE | |
| MINING—2.3% | |
| RTI International Metals Inc.* | | | 99,550 | | | $ | 4,100,465 | | |
| Thompson Creek Metals Co., Inc.* | | | 576,850 | | | | 12,477,266 | | |
| Uranium One Inc.* | | | 1,069,750 | | | | 4,939,269 | | |
| | | | 21,517,000 | | |
| MISCELLANEOUS MANUFACTURING—2.8% | |
| Actuant Corp., Cl. A | | | 379,810 | | | | 12,864,165 | | |
| Clarcor Inc. | | | 294,300 | | | | 12,348,828 | | |
| | | | 25,212,993 | | |
| OIL & GAS—5.8% | |
| Carrizo Oil & Gas Inc.* | | | 179,410 | | | | 11,390,741 | | |
| Concho Resources Inc.* | | | 490,260 | | | | 13,516,468 | | |
| CVR Energy Inc.* | | | 372,950 | | | | 8,029,614 | | |
| Mariner Energy Inc.* | | | 351,350 | | | | 9,683,206 | | |
| Petrobank Energy & Resources Ltd.* | | | 229,610 | | | | 11,080,375 | | |
| | | | 53,700,404 | | |
| OIL & GAS SERVICES—3.0% | |
| Cal Dive International Inc.* | | | 612,984 | | | | 7,472,279 | | |
| Dril-Quip Inc.* | | | 190,920 | | | | 10,912,987 | | |
| T-3 Energy Services Inc.* | | | 174,100 | | | | 9,192,480 | | |
| | | | 27,577,746 | | |
| PACKAGING & CONTAINERS—1.4% | |
| Silgan Holdings Inc. | | | 239,450 | | | | 12,757,896 | | |
| PHARMACEUTICALS—3.6% | |
| BioMarin Pharmaceutical Inc.* | | | 295,000 | | | | 10,755,700 | | |
| Cubist Pharmaceuticals Inc.* | | | 357,100 | | | | 6,913,456 | | |
| OSI Pharmaceuticals Inc.* | | | 122,200 | | | | 4,234,230 | | |
| Pozen Inc.* | | | 149,750 | | | | 1,981,193 | | |
| United Therapeutics Corp.* | | | 113,715 | | | | 9,608,918 | | |
| | | | 33,493,497 | | |
| RETAIL—3.5% | |
| AnnTaylor Stores Corp.* | | | 433,000 | | | | 10,954,900 | | |
| Bebe Stores Inc. | | | 708,950 | | | | 7,082,410 | | |
| McCormick & Schmick's Seafood Restaurants Inc.* | | | 384,750 | | | | 4,628,542 | | |
| Phillips-Van Heusen Corp. | | | 234,870 | | | | 9,913,863 | | |
| | | | 32,579,715 | | |
| SEMICONDUCTORS—4.9% | |
| Cavium Networks Inc.* | | | 260,398 | | | | 5,351,179 | | |
| Emulex Corp.* | | | 340,850 | | | | 4,461,726 | | |
| Mellanox Technologies Ltd.* | | | 675,800 | | | | 10,116,726 | | |
| Microsemi Corp.* | | | 467,550 | | | | 11,454,975 | | |
| ON Semiconductor Corp.* | | | 923,450 | | | | 6,898,172 | | |
| Tessera Technologies Inc.* | | | 344,610 | | | | 6,974,906 | | |
| | | | 45,257,684 | | |
-20-
THE ALGER INSTITUTIONAL FUNDS | ALGER SMALLCAP GROWTH INSTITUTIONAL FUND
Schedule of Investments (Continued) (Unaudited) April 30, 2008
| COMMON STOCKS—(CONT.) | | SHARES | | VALUE | |
| SOFTWARE—7.3% | |
| Ansys Inc.* | | | 336,586 | | | $ | 13,540,855 | | |
| Concur Technologies Inc.* | | | 231,600 | | | | 7,675,224 | | |
| Omniture Inc.* | | | 249,955 | | | | 5,703,973 | | |
| Solera Holdings Inc.* | | | 487,750 | | | | 12,588,828 | | |
| Synchronoss Technologies Inc.* | | | 306,300 | | | | 6,392,481 | | |
| Taleo Corp.* | | | 416,800 | | | | 8,127,600 | | |
| THQ Inc.* | | | 459,650 | | | | 9,781,352 | | |
| VeriFone Holdings Inc.* | | | 299,445 | | | | 3,350,790 | | |
| | | | 67,161,103 | | |
| TELECOMMUNICATIONS—10.1% | |
| Acme Packet Inc.* | | | 670,500 | | | | 6,135,075 | | |
| Atheros Communications Inc.* | | | 380,135 | | | | 10,119,194 | | |
| Cincinnati Bell Inc.* | | | 2,425,290 | | | | 11,253,346 | | |
| Foundry Networks Inc.* | | | 583,900 | | | | 7,433,047 | | |
| NeuStar Inc., Cl. A* | | | 387,410 | | | | 10,657,649 | | |
| Nice Systems Ltd.*# | | | 407,200 | | | | 12,965,248 | | |
| Polycom Inc.* | | | 460,405 | | | | 10,313,072 | | |
| SBA Communications Corp.* | | | 408,725 | | | | 13,218,167 | | |
| Sonus Networks Inc.* | | | 1,650,535 | | | | 6,618,645 | | |
| Time Warner Telecom Inc., Cl. A* | | | 244,350 | | | | 4,789,260 | | |
| | | | 93,502,703 | | |
TOTAL COMMON STOCKS
(Cost $886,630,494) | | | | | | | 881,796,586 | | |
| SHORT-TERM INVESTMENTS—4.0% | | PRINCIPAL
AMOUNT | | | |
| TIME DEPOSITS | |
| Branch Bank & Trust Grand Cayman, 1.84%, 5/1/08 | | $ | 35,700,000 | | | | 35,700,000 | | |
| Wachovia London, 1.84%, 5/1/08 | | | 1,025,542 | | | | 1,025,542 | | |
TOTAL TIME DEPOSITS
(Cost $36,725,542) | | | | | | | 36,725,542 | | |
Total Investments
(Cost $923,356,036)(a) | | | 99.7 | % | | | 918,522,128 | | |
| Other Assets in Excess of Liabilities | | | 0.3 | | | | 3,214,870 | | |
| NET ASSETS | | | 100.0 | % | | $ | 921,736,998 | | |
* Non-income producing securities.
# American Depositary Trust
(a) At April 30, 2008, the net unrealized depreciation on investments, based on cost for federal income tax purposes of $923,356,036 amounted to $4,833,908 which consisted of aggregate gross unrealized appreciation of $99,368,835 and aggregate gross unrealized depreciation of $104,202,743.
See Notes to Financial Statements.
-21-
THE ALGER INSTITUTIONAL FUNDS | ALGER MIDCAP GROWTH INSTITUTIONAL FUND
Schedule of Investments (Unaudited) April 30, 2008
| COMMON STOCKS—98.5% | | SHARES | | VALUE | |
| AEROSPACE/DEFENSE—1.5% | |
| BE Aerospace Inc.* | | | 726,190 | | | $ | 29,309,028 | | |
| APPAREL—1.5% | |
| American Apparel Inc.* | | | 772,200 | | | | 6,038,604 | | |
| Iconix Brand Group Inc.* | | | 1,355,500 | | | | 21,579,560 | | |
| | | | 27,618,164 | | |
| BEVERAGES—1.1% | |
| Hansen Natural Corp.* | | | 544,500 | | | | 19,269,855 | | |
| BIOTECHNOLOGY—2.0% | |
| Celgene Corp.* | | | 432,500 | | | | 26,875,550 | | |
| InterMune Inc.* | | | 511,100 | | | | 8,100,935 | | |
| | | | 34,976,485 | | |
| CHEMICALS—4.7% | |
| Metabolix Inc.* | | | 1,581,500 | | | | 17,412,315 | | |
| Mosaic Co./The* | | | 189,200 | | | | 23,178,892 | | |
| Praxair Inc. | | | 208,100 | | | | 19,001,611 | | |
| Terra Industries Inc.* | | | 638,200 | | | | 24,162,252 | | |
| | | | 83,755,070 | | |
| COMMERCIAL SERVICES—6.0% | |
| FTI Consulting Inc.* | | | 193,400 | | | | 12,377,600 | | |
| Geo Group Inc./The* | | | 855,000 | | | | 22,614,750 | | |
| ITT Educational Services Inc.* | | | 157,200 | | | | 12,050,952 | | |
| Net 1 UEPS Technologies Inc.* | | | 653,652 | | | | 15,321,603 | | |
| Parexel International Corp.* | | | 394,400 | | | | 10,017,760 | | |
| Sotheby's | | | 829,600 | | | | 22,979,920 | | |
| TeleTech Holdings Inc.* | | | 503,700 | | | | 11,549,841 | | |
| | | | 106,912,426 | | |
| COMPUTERS—6.9% | |
| Apple Inc.* | | | 208,500 | | | | 36,268,575 | | |
| Cognizant Technology Solutions Corp., Cl. A* | | | 1,147,800 | | | | 37,016,550 | | |
| NetApp Inc.* | | | 616,200 | | | | 14,912,040 | | |
| Research In Motion Ltd.* | | | 280,195 | | | | 34,080,118 | | |
| | | | 122,277,283 | | |
| DISTRIBUTION/WHOLESALE—.5% | |
| LKQ Corp.* | | | 422,200 | | | | 9,187,072 | | |
| DIVERSIFIED FINANCIAL SERVICES—5.7% | |
| Affiliated Managers Group Inc.* | | | 131,900 | | | | 13,102,946 | | |
| AllianceBernstein Holding LP | | | 307,600 | | | | 19,077,352 | | |
| Bolsa de Mercadorias e Futuros—BM&F | | | 1,718,600 | | | | 16,857,980 | | |
| Franklin Resources Inc. | | | 94,400 | | | | 8,982,160 | | |
| Lehman Brothers Holdings Inc. | | | 286,000 | | | | 12,652,640 | | |
| Nymex Holdings Inc. | | | 332,400 | | | | 30,780,240 | | |
| | | | 101,453,318 | | |
-22-
THE ALGER INSTITUTIONAL FUNDS | ALGER MIDCAP GROWTH INSTITUTIONAL FUND
Schedule of Investments (Continued) (Unaudited) April 30, 2008
| COMMON STOCKS—(CONT.) | | SHARES | | VALUE | |
| ELECTRIC—1.7% | |
| FirstEnergy Corp. | | | 232,500 | | | $ | 17,586,300 | | |
| ITC Holdings Corp. | | | 226,100 | | | | 12,611,858 | | |
| | | | 30,198,158 | | |
| ELECTRICAL COMPONENTS & EQUIPMENT—.5% | |
| General Cable Corp.* | | | 135,700 | | | | 9,091,900 | | |
| ELECTRONICS—1.6% | |
| Garmin Ltd. | | | 707,700 | | | | 28,944,930 | | |
| ENERGY—ALTERNATE SOURCES—3.5% | |
| First Solar Inc.* | | | 60,300 | | | | 17,606,997 | | |
| JA Solar Holdings Co Ltd.*# | | | 1,108,660 | | | | 26,618,927 | | |
| Vestas Wind Systems* | | | 159,400 | | | | 17,425,308 | | |
| | | | 61,651,232 | | |
| ENGINEERING & CONSTRUCTION—3.2% | |
| Chicago Bridge & Iron Co. NV# | | | 417,500 | | | | 16,633,200 | | |
| Fluor Corp. | | | 120,700 | | | | 18,451,409 | | |
| McDermott International Inc.* | | | 419,480 | | | | 22,475,738 | | |
| | | | 57,560,347 | | |
| ENTERTAINMENT—1.1% | |
| Bally Technologies Inc.* | | | 574,500 | | | | 19,354,905 | | |
| FOOD—.8% | |
| Cosan Ltd., Cl. A* | | | 1,140,100 | | | | 15,117,726 | | |
| HEALTHCARE—PRODUCTS—5.7% | |
| Community Health Systems Inc.* | | | 486,900 | | | | 18,273,357 | | |
| Hologic Inc.* | | | 471,100 | | | | 13,751,409 | | |
| Psychiatric Solutions Inc.* | | | 267,400 | | | | 9,281,454 | | |
| Smith & Nephew PLC# | | | 354,100 | | | | 22,920,893 | | |
| St. Jude Medical Inc.* | | | 260,000 | | | | 11,382,800 | | |
| Varian Medical Systems Inc.* | | | 562,000 | | | | 26,346,560 | | |
| | | | 101,956,473 | | |
| HOME BUILDERS—.3% | |
| Toll Brothers Inc.* | | | 201,100 | | | | 4,552,904 | | |
| INTERNET—5.0% | |
| DealerTrack Holdings Inc.* | | | 827,772 | | | | 15,926,333 | | |
| eBay Inc.* | | | 980,700 | | | | 30,686,103 | | |
| Shutterfly Inc.* | | | 511,900 | | | | 8,369,565 | | |
| Sina Corp./China* | | | 406,800 | | | | 18,794,160 | | |
| TIBCO Software Inc.* | | | 2,112,590 | | | | 16,203,565 | | |
| | | | 89,979,726 | | |
| MINING—2.5% | |
| Thompson Creek Metals Co., Inc.* | | | 780,200 | | | | 16,875,726 | | |
| Uranium One Inc.* | | | 2,386,275 | | | | 11,017,951 | | |
| Yamana Gold Inc. | | | 1,316,300 | | | | 16,874,966 | | |
| | | | 44,768,643 | | |
-23-
THE ALGER INSTITUTIONAL FUNDS | ALGER MIDCAP GROWTH INSTITUTIONAL FUND
Schedule of Investments (Continued) (Unaudited) April 30, 2008
| COMMON STOCKS—(CONT.) | | SHARES | | VALUE | |
| MISCELLANEOUS MANUFACTURING—1.6% | |
| ITT Corp. | | | 440,800 | | | $ | 28,211,200 | | |
| OIL & GAS—5.0% | |
| Cabot Oil & Gas Corp. | | | 272,300 | | | | 15,512,931 | | |
| Concho Resources Inc.* | | | 393,000 | | | | 10,835,010 | | |
| Diamond Offshore Drilling Inc. | | | 113,600 | | | | 14,246,576 | | |
| Nabors Industries Ltd.* | | | 801,700 | | | | 30,095,818 | | |
| Range Resources Corp. | | | 32,200 | | | | 2,137,436 | | |
| Valero Energy Corp. | | | 337,800 | | | | 16,501,530 | | |
| | | | 89,329,301 | | |
| OIL & GAS SERVICES—9.2% | |
| Acergy SA# | | | 334,200 | | | | 8,231,346 | | |
| Cameron International Corp.* | | | 880,983 | | | | 43,370,793 | | |
| FMC Technologies Inc.* | | | 181,600 | | | | 12,203,520 | | |
| Flotek Industries Inc.* | | | 800,900 | | | | 14,992,848 | | |
| National Oilwell Varco Inc.* | | | 431,370 | | | | 29,527,277 | | |
| Transocean Inc.* | | | 171,483 | | | | 25,286,883 | | |
| Weatherford International Ltd.* | | | 371,500 | | | | 29,968,905 | | |
| | | | 163,581,572 | | |
| PHARMACEUTICALS—5.5% | |
| Barr Pharmaceuticals Inc.* | | | 431,200 | | | | 21,659,176 | | |
| BioMarin Pharmaceutical Inc.* | | | 117,000 | | | | 4,265,820 | | |
| Cephalon Inc.* | | | 281,200 | | | | 17,549,692 | | |
| ImClone Systems Inc.* | | | 474,000 | | | | 22,112,100 | | |
| Mylan Inc. | | | 1,426,100 | | | | 18,781,737 | | |
| United Therapeutics Corp.* | | | 153,055 | | | | 12,933,148 | | |
| | | | 97,301,673 | | |
| RETAIL—3.8% | |
| China Nepstar Chain Drugstore Ltd.# | | | 1,753,441 | | | | 20,708,138 | | |
| Game Group PLC | | | 2,665,100 | | | | 14,475,913 | | |
| GameStop Corp., Cl. A* | | | 272,116 | | | | 14,977,265 | | |
| PetSmart Inc. | | | 767,900 | | | | 17,185,602 | | |
| | | | 67,346,918 | | |
| SAVINGS & LOANS—.7% | |
| People's United Financial Inc. | | | 693,900 | | | | 11,775,483 | | |
| SEMICONDUCTORS—4.8% | |
| Broadcom Corp., Cl. A* | | | 774,400 | | | | 20,103,424 | | |
| Intersil Corp. | | | 664,100 | | | | 17,744,752 | | |
| MEMC Electronic Materials Inc.* | | | 590,165 | | | | 37,162,690 | | |
| Spreadtrum Communications Inc.*# | | | 779,300 | | | | 6,772,117 | | |
| Tessera Technologies Inc.* | | | 211,045 | | | | 4,271,551 | | |
| | | | 86,054,534 | | |
| SOFTWARE—5.5% | |
| Intuit Inc.* | | | 477,900 | | | | 12,888,963 | | |
| Satyam Computer Services Ltd.# | | | 1,694,100 | | | | 43,504,488 | | |
| Solera Holdings Inc.* | | | 454,330 | | | | 11,726,257 | | |
-24-
THE ALGER INSTITUTIONAL FUNDS | ALGER MIDCAP GROWTH INSTITUTIONAL FUND
Schedule of Investments (Continued) (Unaudited) April 30, 2008
| COMMON STOCKS—(CONT.) | | SHARES | | VALUE | |
| SOFTWARE—(CONT.) | |
| Take-Two Interactive Software Inc.* | | | 852,600 | | | $ | 22,372,224 | | |
| Taleo Corp., Cl. A* | | | 370,400 | | | | 7,222,800 | | |
| | | | 97,714,732 | | |
| TELECOMMUNICATIONS—3.6% | |
| Atheros Communications Inc.* | | | 748,035 | | | | 19,912,692 | | |
| NeuStar Inc., Cl. A* | | | 480,900 | | | | 13,229,559 | | |
| SBA Communications Corp.* | | | 948,165 | | | | 30,663,656 | | |
| | | | 63,805,907 | | |
| TOYS/GAMES/HOBBIES—3.0% | |
| Nintendo Co Ltd.# | | | 778,430 | | | | 53,162,799 | | |
TOTAL COMMON STOCK
(Cost $1,592,909,470) | | | | | | | 1,756,219,764 | | |
| CONVERTIBLE CORPORATE BONDS—.2% | |
| OIL & GAS | |
Transocean Inc., 1.50%, 12/15/37
(Cost $4,000,000) | | $ | 4,000,000 | | | | 4,520,000 | | |
| SHORT-TERM INVESTMENTS—1.6% | | PRINCIPAL
AMOUNT | | | |
| TIME DEPOSITS | |
Branch Bank & Trust Grand Cayman, 1.84%, 5/1/08
(Cost $27,877,623) | | | 27,877,623 | | | | 27,877,623 | | |
Total Investments
(Cost $1,624,787,093)(a) | | | 100.3 | % | | | 1,788,617,387 | | |
| Liabilities in Excess of Other Assets | | | (0.3 | ) | | | (5,871,396 | ) | |
| NET ASSETS | | | 100.0 | % | | $ | 1,782,745,991 | | |
* Non-income producing securities.
# American Depositary Trust
(a) At April 30, 2008, the net unrealized appreciation on investments, based on cost for federal income tax purposes of $1,624,787,093 amounted to $163,830,294 which consisted of aggregate gross unrealized appreciation of $234,942,276 and aggregate gross unrealized depreciation of $71,111,982.
See Notes to Financial Statements.
-25-
THE ALGER INSTITUTIONAL FUNDS | ALGER CAPITAL APPRECIATION INSTITUTIONAL FUND
Schedule of Investments (Unaudited) April 30, 2008
| COMMON STOCKS—93.5% | | SHARES | | VALUE | |
| ADVERTISING—.1% | |
| Focus Media Holding Ltd.*# | | | 21,900 | | | $ | 807,891 | | |
| AEROSPACE/DEFENSE—5.3% | |
| BE Aerospace Inc.* | | | 134,400 | | | | 5,424,384 | | |
| General Dynamics Corp. | | | 204,800 | | | | 18,518,016 | | |
| Lockheed Martin Corp. | | | 110,500 | | | | 11,717,420 | | |
| | | | 35,659,820 | | |
| AGRICULTURE—3.7% | |
| Altria Group Inc. | | | 162,750 | | | | 3,255,000 | | |
| Philip Morris International Inc.* | | | 420,750 | | | | 21,470,872 | | |
| | | | 24,725,872 | | |
| APPAREL—2.4% | |
| American Apparel Inc.* | | | 344,500 | | | | 2,693,990 | | |
| Deckers Outdoor Corp.* | | | 69,028 | | | | 9,530,696 | | |
| Iconix Brand Group Inc.* | | | 212,900 | | | | 3,389,368 | | |
| | | | 15,614,054 | | |
| AUTO MANUFACTURERS—.9% | |
| Oshkosh Corp. | | | 146,800 | | | | 5,960,080 | | |
| BIOTECHNOLOGY—2.0% | |
| Celgene Corp.* | | | 68,482 | | | | 4,255,471 | | |
| Genentech Inc.* | | | 87,200 | | | | 5,947,040 | | |
| Illumina Inc.* | | | 40,700 | | | | 3,170,123 | | |
| | | | 13,372,634 | | |
| CHEMICALS—2.1% | |
| Celanese Corp. | | | 148,500 | | | | 6,645,375 | | |
| Mosaic Co.* | | | 55,300 | | | | 6,774,803 | | |
| Zoltek Cos., Inc.* | | | 13,200 | | | | 352,044 | | |
| | | | 13,772,222 | | |
| COMMERCIAL SERVICES—1.9% | |
| Aegean Marine Petroleum Network Inc. | | | 85,300 | | | | 3,102,361 | | |
| Net 1 UEPS Technologies Inc.* | | | 184,300 | | | | 4,319,992 | | |
| Quanta Services Inc.* | | | 72,500 | | | | 1,924,150 | | |
| Sotheby's | | | 141,200 | | | | 3,911,240 | | |
| | | | 13,257,743 | | |
| COMPUTERS—9.2% | |
| Apple Inc.* | | | 87,600 | | | | 15,238,020 | | |
| Brocade Communications Systems Inc.* | | | 364,600 | | | | 2,610,536 | | |
| Cognizant Technology Solutions Corp.* | | | 274,800 | | | | 8,862,300 | | |
| Dell Inc.* | | | 75,000 | | | | 1,397,250 | | |
| EMC Corp.* | | | 629,100 | | | | 9,688,140 | | |
| Hewlett-Packard Co. | | | 53,700 | | | | 2,488,995 | | |
| NCR Corp.* | | | 406,600 | | | | 10,014,558 | | |
| NetApp Inc.* | | | 317,800 | | | | 7,690,760 | | |
| Research In Motion Ltd.* | | | 27,200 | | | | 3,308,336 | | |
| | | | 61,298,895 | | |
-26-
THE ALGER INSTITUTIONAL FUNDS | ALGER CAPITAL APPRECIATION INSTITUTIONAL FUND
Schedule of Investments (Continued) (Unaudited) April 30, 2008
| COMMON STOCKS—(CONT.) | | SHARES | | VALUE | |
| DISTRIBUTION/WHOLESALE—.2% | |
| LKQ Corp.* | | | 58,400 | | | $ | 1,270,784 | | |
| DIVERSIFIED FINANCIAL SERVICE—5.9% | |
| Affiliated Managers Group Inc.* | | | 33,600 | | | | 3,337,824 | | |
| AllianceBernstein Holding LP | | | 79,200 | | | | 4,911,984 | | |
| Bolsa de Mercadorias e Futuros—BM&F | | | 115,900 | | | | 1,136,879 | | |
| Bovespa Holding SA | | | 470,510 | | | | 6,922,944 | | |
| Janus Capital Group Inc. | | | 99,300 | | | | 2,786,358 | | |
| Lazard Ltd., Cl. A | | | 156,800 | | | | 6,137,152 | | |
| Merrill Lynch & Co., Inc.* | | | 211,525 | | | | 5,288,125 | | |
| Nymex Holdings Inc. | | | 100,100 | | | | 9,269,260 | | |
| | | | 39,790,526 | | |
| ELECTRONICS—.7% | |
| Dolby Laboratories Inc. Cl. A* | | | 26,000 | | | | 1,043,900 | | |
| Garmin Ltd. | | | 81,500 | | | | 3,333,350 | | |
| | | | 4,377,250 | | |
| ENERGY—ALTERNATE SOURCES—1.9% | |
| First Solar Inc.* | | | 6,200 | | | | 1,810,338 | | |
| JA Solar Holdings Co., Ltd.*# | | | 446,700 | | | | 10,725,267 | | |
| | | | 12,535,605 | | |
| ENGINEERING & CONSTRUCTION—1.1% | |
| Chicago Bridge & Iron Co., NV# | | | 192,400 | | | | 7,665,216 | | |
| ENTERTAINMENT—1.6% | |
| Bally Technologies Inc.* | | | 317,600 | | | | 10,699,944 | | |
| HEALTHCARE—PRODUCTS—4.0% | |
| Baxter International Inc. | | | 84,200 | | | | 5,247,344 | | |
| Hologic Inc.* | | | 160,496 | | | | 4,684,878 | | |
| Intuitive Surgical Inc.* | | | 5,650 | | | | 1,634,319 | | |
| Inverness Medical Innovations Inc.* | | | 411,100 | | | | 15,210,700 | | |
| | | | 26,777,241 | | |
| HEALTHCARE—SERVICES—1.9% | |
| Aetna Inc. | | | 145,700 | | | | 6,352,520 | | |
| Community Health Systems Inc.* | | | 103,300 | | | | 3,876,849 | | |
| LifePoint Hospitals Inc.* | | | 58,047 | | | | 1,748,376 | | |
| Quest Diagnostics Inc. | | | 20,000 | | | | 1,003,600 | | |
| | | | 12,981,345 | | |
| HOME FURNISHINGS—.1% | |
| Sony Corp.# | | | 10,900 | | | | 499,111 | | |
| INSURANCE—2.0% | |
| ACE Ltd. | | | 45,800 | | | | 2,761,282 | | |
| MetLife Inc. | | | 93,000 | | | | 5,659,050 | | |
| PartnerRe Ltd. | | | 68,600 | | | | 5,075,028 | | |
| | | | 13,495,360 | | |
-27-
THE ALGER INSTITUTIONAL FUNDS | ALGER CAPITAL APPRECIATION INSTITUTIONAL FUND
Schedule of Investments (Continued) (Unaudited) April 30, 2008
| COMMON STOCKS—(CONT.) | | SHARES | | VALUE | |
| INTERNET—4.4% | |
| Digital River Inc.* | | | 116,000 | | | $ | 3,810,600 | | |
| eBay Inc.* | | | 206,300 | | | | 6,455,127 | | |
| Google Inc., Cl. A* | | | 15,600 | | | | 8,958,924 | | |
| Sina Corp.* | | | 154,100 | | | | 7,119,420 | | |
| Yahoo! Inc.* | | | 124,200 | | | | 3,404,322 | | |
| | | | 29,748,393 | | |
| LODGING—1.3% | |
| Accor SA | | | 51,900 | | | | 4,306,806 | | |
| MGM Mirage* | | | 89,200 | | | | 4,562,580 | | |
| | | | 8,869,386 | | |
| MACHINERY—DIVERSIFIED—.2% | |
| Cummins Inc. | | | 18,646 | | | | 1,168,172 | | |
| MINING—2.5% | |
| Eurasian Natural Resources Corporation* | | | 103,600 | | | | 2,462,220 | | |
| Freeport-McMoRan Copper & Gold Inc. | | | 93,200 | | | | 10,601,500 | | |
| Thompson Creek Metals Co., Inc.* | | | 124,300 | | | | 2,688,609 | | |
| Uranium One Inc.* | | | 120,600 | | | | 556,836 | | |
| | | | 16,309,165 | | |
| MISCELLANEOUS MANUFACTURER—.8% | |
| ITT Corp. | | | 88,400 | | | | 5,657,600 | | |
| OIL & GAS—5.4% | |
| Cabot Oil & Gas Corp. | | | 119,600 | | | | 6,813,612 | | |
| ConocoPhillips | | | 135,100 | | | | 11,638,865 | | |
| Hess Corp. | | | 45,300 | | | | 4,810,860 | | |
| Nabors Industries Ltd.* | | | 177,500 | | | | 6,663,350 | | |
| Petrobank Energy & Resources Ltd.* | | | 85,400 | | | | 4,121,180 | | |
| Range Resources Corp. | | | 33,200 | | | | 2,203,816 | | |
| | | | 36,251,683 | | |
| OIL & GAS SERVICES—4.6% | |
| Exterran Holdings Inc.* | | | 31,482 | | | | 2,102,683 | | |
| National Oilwell Varco Inc.* | | | 45,300 | | | | 3,100,785 | | |
| Transocean Inc.* | | | 101,934 | | | | 15,031,188 | | |
| Weatherford International Ltd.* | | | 130,900 | | | | 10,559,703 | | |
| | | | 30,794,359 | | |
| PACKAGING & CONTAINERS—.5% | |
| Ball Corp. | | | 66,600 | | | | 3,581,748 | | |
| PHARMACEUTICALS—7.1% | |
| Abbott Laboratories | | | 249,900 | | | | 13,182,225 | | |
| Cardinal Health Inc. | | | 146,500 | | | | 7,628,255 | | |
| Cephalon Inc.* | | | 75,800 | | | | 4,730,678 | | |
| Gilead Sciences Inc.* | | | 43,500 | | | | 2,251,560 | | |
| ImClone Systems Inc.* | | | 121,900 | | | | 5,686,635 | | |
| Merck & Co., Inc. | | | 117,300 | | | | 4,462,092 | | |
| Mylan Inc. | | | 325,900 | | | | 4,292,103 | | |
-28-
THE ALGER INSTITUTIONAL FUNDS | ALGER CAPITAL APPRECIATION INSTITUTIONAL FUND
Schedule of Investments (Continued) (Unaudited) April 30, 2008
| COMMON STOCKS—(CONT.) | | SHARES | | VALUE | |
| PHARMACEUTICALS—(CONT.) | |
| United Therapeutics Corp.* | | | 62,000 | | | $ | 5,239,000 | | |
| | | | 47,472,548 | | |
| REITS—.3% | |
| Digital Realty Trust Inc. | | | 45,700 | | | | 1,770,875 | | |
| RETAIL—2.4% | |
| CVS Caremark Corp. | | | 257,400 | | | | 10,391,238 | | |
| Kohl's Corp.* | | | 35,000 | | | | 1,709,750 | | |
| Wal-Mart Stores Inc. | | | 64,700 | | | | 3,751,306 | | |
| | | | 15,852,294 | | |
| SEMICONDUCTORS—4.8% | |
| Broadcom Corp., Cl. A* | | | 216,800 | | | | 5,628,128 | | |
| Intel Corp. | | | 653,100 | | | | 14,538,006 | | |
| Lam Research Corp.* | | | 31,800 | | | | 1,298,712 | | |
| MEMC Electronic Materials Inc.* | | | 80,100 | | | | 5,043,897 | | |
| Tessera Technologies Inc.* | | | 279,000 | | | | 5,646,960 | | |
| | | | 32,155,703 | | |
| SOFTWARE—7.3% | |
| Intuit Inc.* | | | 187,800 | | | | 5,064,966 | | |
| Microsoft Corp. | | | 951,300 | | | | 27,131,076 | | |
| NAVTEQ Corp.* | | | 28,600 | | | | 2,122,406 | | |
| Satyam Computer Services Ltd.# | | | 218,200 | | | | 5,603,376 | | |
| Solera Holdings Inc.* | | | 243,000 | | | | 6,271,830 | | |
| Tele Atlas NV* | | | 24,900 | | | | 1,100,977 | | |
| TomTom NV* | | | 39,600 | | | | 1,381,032 | | |
| | | | 48,675,663 | | |
| TELECOMMUNICATIONS—3.8% | |
| America Movil SAB de CV# | | | 14,300 | | | | 828,828 | | |
| American Tower Corp., Cl. A* | | | 49,669 | | | | 2,156,628 | | |
| Atheros Communications Inc.* | | | 284,680 | | | | 7,578,182 | | |
| Nice Systems Ltd.*# | | | 234,100 | | | | 7,453,744 | | |
| SAVVIS Inc.* | | | 175,500 | | | | 2,571,075 | | |
| Sonus Networks Inc.* | | | 1,287,800 | | | | 5,164,078 | | |
| | | | 25,752,535 | | |
| TOYS/GAMES/HOBBIES—1.1% | |
| Nintendo Co Ltd.# | | | 110,400 | | | | 7,539,757 | | |
TOTAL COMMON STOCKS
(Cost $648,820,148) | | | | | | | 626,161,474 | | |
-29-
THE ALGER INSTITUTIONAL FUNDS | ALGER CAPITAL APPRECIATION INSTITUTIONAL FUND
Schedule of Investments (Continued) (Unaudited) April 30, 2008
| CONVERTIBLE CORPORATE BONDS—.2% | | PRINCIPAL
AMOUNT | | VALUE | |
| APPAREL | |
Iconix Brand Group Inc., 1.875%, 6/30/12
(Cost $1,195,000) | | $ | 1,195,000 | | | $ | 1,024,713 | | |
| SHORT-TERM INVESTMENTS—6.7% | | | | | |
| TIME DEPOSITS | |
| Branch Bank & Trust Grand Cayman, 1.84%, 5/1/08 | | | 26,100,000 | | | | 26,100,000 | | |
| Wachovia London, 1.84%, 5/1/08 | | | 18,650,173 | | | | 18,650,173 | | |
TOTAL TIME DEPOSITS
(Cost $44,750,173) | | | | | | | 44,750,173 | | |
Total Investments
(Cost $694,765,320)(a) | | | 100.4 | % | | | 671,936,360 | | |
| Liabilities in Excess of Other Assets | | | (0.4 | ) | | | (2,395,593 | ) | |
| NET ASSETS | | | 100.0 | % | | $ | 669,540,767 | | |
* Non-income producing securities.
# American Depositary Trust
(a) At April 30, 2008, the net unrealized depreciation on investments, based on cost for federal income tax purposes of $694,765,321 amounted to $22,828,960 which consisted of aggregate gross unrealized appreciation of $35,256,440 and aggregate gross unrealized depreciation of $58,085,400.
See Notes to Financial Statements.
-30-
(This page has been intentionally left blank.)
THE ALGER INSTITUTIONAL FUNDS
Statements of Assets and Liabilities (Unaudited) April 30, 2008
| | | LargeCap
Growth
Fund | | SmallCap
Growth
Fund | |
| ASSETS: | |
Investments in securities, at value (identified cost*)
see accompanying schedules of investments | | $ | 57,922,007 | | | $ | 918,522,128 | | |
| Receivable for investment securities sold | | | 246,205 | | | | 2,735,798 | | |
| Receivable foreign currency contracts | | | — | | | | — | | |
| Receivable for shares of beneficial interest sold | | | 209,739 | | | | 3,643,932 | | |
| Dividends and interest receivable | | | 29,821 | | | | 38,458 | | |
| Prepaid expenses | | | 28,099 | | | | 72,929 | | |
| Total Assets | | | 58,435,871 | | | | 925,013,245 | | |
| LIABILITES: | |
| Payable for investment securities purchased | | | 476,986 | | | | 1,538,356 | | |
| Payable for shares of beneficial interest redeemed | | | 111,717 | | | | 1,326,798 | | |
| Accrued investment advisory fees | | | 1,130 | | | | 20,387 | | |
| Accrued transfer agent fees | | | 5,785 | | | | 318,638 | | |
| Accrued distribution fees | | | 119 | | | | 686 | | |
| Accrued administrative fees | | | 64 | | | | 1,007 | | |
| Accrued shareholder servicing fees | | | 398 | | | | 6,292 | | |
| Accrued expenses | | | 18,905 | | | | 64,083 | | |
| Total Liabilites | | | 615,104 | | | | 3,276,247 | | |
| NET ASSETS | | $ | 57,820,767 | | | $ | 921,736,998 | | |
| Net assets consist of: | | | | | |
| Paid in capital | | $ | 62,650,432 | | | $ | 961,449,925 | | |
| Undistributed net investment income (accumulated loss) | | | (74,573 | ) | | | (3,983,261 | ) | |
| Undistributed net realized gain (accumulated loss) | | | (3,647,112 | ) | | | (30,895,758 | ) | |
| Net unrealized appreciation on investments | | | (1,107,980 | ) | | | (4,833,908 | ) | |
| NET ASSETS | | $ | 57,820,767 | | | $ | 921,736,998 | | |
| SHARES OF BENEFICIAL INTEREST OUTSTANDING—NOTE 6 | |
| Class I | | | 3,303,801 | | | | 35,087,208 | | |
| Class R | | | 590,959 | | | | 2,073,785 | | |
| Net Asset Value Per Share | | | | | | | | | |
| Class I | | $ | 14.90 | | | $ | 24.84 | | |
| Class R | | $ | 14.55 | | | $ | 24.24 | | |
| *Identified Cost | | $ | 59,029,973 | | | $ | 923,356,036 | | |
See Notes to Financial Statements.
-32-
| | | MidCap
Growth
Fund | | Capital
Appreciation
Fund | |
| ASSETS: | |
Investments in securities, at value (identified cost*)
see accompanying schedules of investments | | $ | 1,788,617,387 | | | $ | 671,936,360 | | |
| Receivable for investment securities sold | | | 74,230,751 | | | | 15,144,564 | | |
| Receivable foreign currency contracts | | | 906 | | | | 3,747 | | |
| Receivable for shares of beneficial interest sold | | | 11,547,944 | | | | 3,369,628 | | |
| Dividends and interest receivable | | | 675,290 | | | | 223,187 | | |
| Prepaid expenses | | | 101,053 | | | | 50,178 | | |
| Total Assets | | | 1,875,173,331 | | | | 690,727,664 | | |
| LIABILITES: | |
| Payable for investment securities purchased | | | 85,708,263 | | | | 19,890,029 | | |
| Payable for shares of beneficial interest redeemed | | | 6,401,320 | | | | 1,188,373 | | |
| Accrued investment advisory fees | | | 37,219 | | | | 14,842 | | |
| Accrued transfer agent fees | | | 93,351 | | | | 24,526 | | |
| Accrued distribution fees | | | 956 | | | | 868 | | |
| Accrued administrative fees | | | 1,959 | | | | 733 | | |
| Accrued shareholder servicing fees | | | 12,243 | | | | 4,581 | | |
| Accrued expenses | | | 172,029 | | | | 62,945 | | |
| Total Liabilites | | | 92,427,340 | | | | 21,186,897 | | |
| NET ASSETS | | $ | 1,782,745,991 | | | $ | 669,540,767 | | |
| Net assets consist of: | |
| Paid in capital | | $ | 1,755,755,462 | | | $ | 697,763,062 | | |
| Undistributed net investment income (accumulated loss) | | | (9,446,789 | ) | | | (1,056,758 | ) | |
| Undistributed net realized gain (accumulated loss) | | | (127,409,023 | ) | | | (4,347,357 | ) | |
| Net unrealized appreciation on investments | | | 163,846,341 | | | | (22,818,180 | ) | |
| NET ASSETS | | $ | 1,782,745,991 | | | $ | 669,540,767 | | |
| SHARES OF BENEFICIAL INTEREST OUTSTANDING—NOTE 6 | |
| Class I | | | 103,662,163 | | | | 30,745,300 | | |
| Class R | | | 4,374,280 | | | | 3,294,755 | | |
| Net Asset Value Per Share | | | | | | | | | |
| Class I | | $ | 16.52 | | | $ | 19.72 | | |
| Class R | | $ | 15.97 | | | $ | 19.21 | | |
| *Identified Cost | | $ | 1,624,787,093 | | | $ | 694,765,320 | | |
-33-
THE ALGER INSTITUTIONAL FUNDS
Statements of Operations (Unaudited)
For the six months ended April 30, 2008
| | | LargeCap
Growth
Fund | | SmallCap
Growth
Fund | |
| INCOME: | |
| Dividends (net of foreign withholding taxes*) | | $ | 241,833 | | | $ | 797,669 | | |
| Interest and other | | | 36,665 | | | | 801,350 | | |
| Total Income | | | 278,498 | | | | 1,599,019 | | |
| EXPENSES: | |
| Investment advisory fees—Note 3(a) | | | 197,485 | | | | 3,527,896 | | |
| Distribution fees—Note 3(b) | | | 21,242 | | | | 117,874 | | |
| Shareholder servicing fees—Note 3(e) | | | 69,537 | | | | 1,088,857 | | |
| Administrative fees—Note 3(a) | | | 10,280 | | | | 160,965 | | |
| Interest expense | | | — | | | | 216 | | |
| Custodian fees | | | 14,349 | | | | 63,786 | | |
| Transfer agent fees and expenses—Note 3(d) | | | 6,274 | | | | 462,134 | | |
| Professional fees | | | 3,775 | | | | 11,839 | | |
| Printing fees | | | 3,230 | | | | 51,300 | | |
| Trustees fees | | | 6,412 | | | | 6,412 | | |
| Registration fees | | | 15,123 | | | | 20,568 | | |
| Miscellaneous | | | 5,364 | | | | 70,433 | | |
| Total Expenses | | | 353,071 | | | | 5,582,280 | | |
| NET INVESTMENT LOSS | | | (74,573 | ) | | | (3,983,261 | ) | |
REALIZED AND UNREALIZED GAIN (LOSS)
ON INVESTMENTS AND FOREIGN CURRENCY TRANSACTIONS: | |
| Net realized gain (loss) on investments | | | 2,414,587 | | | | (24,012,710 | ) | |
| Net realized gain on foreign currency transactions | | | 33,611 | | | | — | | |
Net change in unrealized appreciation (depreciation)
on investments and foreign currency translations | | | (9,373,126 | ) | | | (147,448,479 | ) | |
Net realized and unrealized loss on investments
and foreign currency | | | (6,924,928 | ) | | | (171,461,189 | ) | |
| NET DECREASE IN NET ASSETS RESULTING FROM OPERATIONS | | $ | (6,999,501 | ) | | $ | (175,444,450 | ) | |
| *Foreign withholding taxes | | $ | 520 | | | $ | — | | |
See Notes to Financial Statements.
-34-
| | | MidCap
Growth
Fund | | Capital
Appreciation
Fund | |
| INCOME: | |
| Dividends (net of foreign withholding taxes*) | | $ | 3,258,943 | | | $ | 1,860,292 | | |
| Interest and other | | | 818,154 | | | | 869,856 | | |
| Total Income | | | 4,077,097 | | | | 2,730,148 | | |
| EXPENSES: | |
| Investment advisory fees—Note 3(a) | | | 6,980,609 | | | | 2,530,828 | | |
| Distribution fees—Note 3(b) | | | 161,512 | | | | 124,279 | | |
| Shareholder servicing fees—Note 3(e) | | | 2,296,253 | | | | 781,120 | | |
| Administrative fees—Note 3(a) | | | 340,544 | | | | 115,139 | | |
| Interest expense | | | 6,474 | | | | 1,246 | | |
| Custodian fees | | | 136,322 | | | | 62,693 | | |
| Transfer agent fees and expenses—Note 3(d) | | | 114,083 | | | | 49,535 | | |
| Professional fees | | | 33,039 | | | | 16,163 | | |
| Printing fees | | | 58,948 | | | | 28,650 | | |
| Trustees fees | | | 6,412 | | | | 6,412 | | |
| Registration fees | | | 25,785 | | | | 26,937 | | |
| Miscellaneous | | | 155,685 | | | | 43,904 | | |
| Total Expenses | | | 10,315,666 | | | | 3,786,906 | | |
| NET INVESTMENT LOSS | | | (6,238,569 | ) | | | (1,056,758 | ) | |
REALIZED AND UNREALIZED GAIN (LOSS)
ON INVESTMENTS AND FOREIGN CURRENCY TRANSACTIONS: | |
| Net realized gain (loss) on investments | | | (115,622,789 | ) | | | 5,073,438 | | |
| Net realized gain on foreign currency transactions | | | — | | | | 880,628 | | |
Net change in unrealized appreciation (depreciation)
on investments and foreign currency translations | | | (197,081,639 | ) | | | (82,365,182 | ) | |
Net realized and unrealized loss on investments
and foreign currency | | | (312,704,428 | ) | | | (76,411,116 | ) | |
| NET DECREASE IN NET ASSETS RESULTING FROM OPERATIONS | | $ | (318,942,997 | ) | | $ | (77,467,874 | ) | |
| *Foreign withholding taxes | | $ | 32,170 | | | $ | 3,574 | | |
-35-
THE ALGER INSTITUTIONAL FUNDS
Statements of Changes in Net Assets
| | | LargeCap Growth Fund | | SmallCap Growth Fund | |
| | | For the
Six Months Ended
April 30,
2008
(Unaudited) | | For the
Year Ended
October 31,
2007 | | For the
Six Months Ended
April 30,
2008
(Unaudited) | | For the
Year Ended
October 31,
2007 | |
| Net investment loss | | $ | (74,573 | ) | | $ | (159,630 | ) | | $ | (3,983,261 | ) | | $ | (4,839,811 | ) | |
Net realized gain (loss) on investments and foreign
currency transactions | | | 2,448,198 | | | | 14,503,129 | | | | (24,012,710 | ) | | | 46,281,847 | | |
Net change in unrealized appreciation (depreciation)
on investments and foreign currency translations | | | (9,373,126 | ) | | | 1,792,315 | | | | (147,448,479 | ) | | | 112,536,968 | | |
| Net increase (decrease) in net assets resulting from operations | | | (6,999,501 | ) | | | 16,135,814 | | | | (175,444,450 | ) | | | 153,979,004 | | |
| Distributions to shareholders from: | |
| Net realized gains | |
| Class I | | | — | | | | — | | | | — | | | | — | | |
| Class R | | | — | | | | — | | | | — | | | | — | | |
| Total distributions to shareholders | | | — | | | | — | | | | — | | | | — | | |
| Increase (decrease) from shares of beneficial interest transactions: | |
| Class I | | | 3,012,053 | | | | (68,755,483 | ) | | | 142,672,249 | | | | 441,527,169 | | |
| Class R | | | 934,452 | | | | 1,786,330 | | | | 12,664,844 | | | | 32,476,922 | | |
Net increase (decrease) from shares of beneficial
interest transactions—Note 6 | | | 3,946,505 | | | | (66,969,153 | ) | | | 155,337,093 | | | | 474,004,091 | | |
| Total increase (decrease) | | | (3,052,996 | ) | | | (50,833,339 | ) | | | (20,107,357 | ) | | | 627,983,095 | | |
| Net Assets: | |
| Beginning of period | | | 60,873,763 | | | | 111,707,102 | | | | 941,844,355 | | | | 313,861,260 | | |
| END OF PERIOD $57,820,767 | | $ | 60,873,763 | | | $ | 921,736,998 | | | $ | 941,844,355 | | | $ | 1,782,745,991 | | |
| Undistributed net investment income (accumulated loss) | | $ | (74,573 | ) | | $ | — | | | $ | (3,983,261 | ) | | $ | — | | |
See Notes to Financial Statements.
-36-
| | | MidCap Growth Fund | | Capital Appreciation Fund | |
| | | For the
Six Months Ended
April 30,
2008
(Unaudited) | | For the
Year Ended
October 31,
2007 | | For the
Six Months Ended
April 30,
2008
(Unaudited) | | For the
Year Ended
October 31,
2007 | |
| Net investment loss | | $ | (6,238,569 | ) | | $ | (8,584,775 | ) | | $ | (1,056,758 | ) | | $ | (1,036,528 | ) | |
Net realized gain (loss) on investments and foreign
currency transactions | | | (115,622,789 | ) | | | 334,251,916 | | | | 5,954,066 | | | | 63,602,689 | | |
Net change in unrealized appreciation (depreciation)
on investments and foreign currency translations | | | (197,081,639 | ) | | | 275,497,572 | | | | (82,365,182 | ) | | | 47,211,518 | | |
| Net increase (decrease) in net assets resulting from operations | | | (318,942,997 | ) | | | 601,164,713 | | | | (77,467,874 | ) | | | 109,777,679 | | |
| Distributions to shareholders from: | |
| Net realized gains | |
| Class I | | | (306,838,433 | ) | | | (105,905,536 | ) | | | — | | | | — | | |
| Class R | | | (10,895,934 | ) | | | (3,494,730 | ) | | | — | | | | — | | |
| Total distributions to shareholders | | | (317,734,367 | ) | | | (109,400,266 | ) | | | — | | | | — | | |
| Increase (decrease) from shares of beneficial interest transactions: | |
| Class I | | | 295,794,974 | | | | 207,121,687 | | | | 140,661,966 | | | | 269,214,084 | | |
| Class R | | | 21,424,920 | | | | 10,462,384 | | | | 28,976,601 | | | | 26,986,851 | | |
Net increase (decrease) from shares of beneficial
interest transactions—Note 6 | | | 317,219,894 | | | | 217,584,071 | | | | 169,638,567 | | | | 296,200,935 | | |
| Total increase (decrease) | | | (319,457,470 | ) | | | 709,348,518 | | | | 92,170,693 | | | | 405,978,614 | | |
| Net Assets: | |
| Beginning of period | | | 2,102,203,461 | | | | 1,392,854,943 | | | | 577,370,074 | | | | 171,391,460 | | |
| END OF PERIOD $57,820,767 | | | $ | | | | 2,102,203,461 | | | $ | 669,540,767 | | | $ | 577,370,074 | | |
| Undistributed net investment income (accumulated loss) | | $ | (9,446,789 | ) | | $ | — | | | $ | (1,056,758 | ) | | $ | — | | |
-37-
THE ALGER INSTITUTIONAL FUNDS
Financial Highlights for a share outstanding throughout the period
| ALGER LARGECAP GROWTH INSTITUTIONAL FUND | | CLASS I | |
| | | Six months
ended
4/30/08 (iii)(iv) | | Year ended
10/31/07 | | Year ended
10/31/06 | | Year ended
10/31/05 | | Year ended
10/31/04 | | Year ended
10/31/03 | |
INCOME FROM INVESTMENT
OPERATIONS | |
Net asset value,
beginning of period | | $ | 16.87 | | | $ | 13.25 | | | $ | 12.56 | | | $ | 10.86 | | | $ | 10.71 | | | $ | 8.70 | | |
| Net investment income (loss) (ii) | | | (0.01 | ) | | | (0.03 | ) | | | (0.01 | ) | | | 0.04 | | | | (0.06 | ) | | | (0.03 | ) | |
Net realized and unrealized gain
(loss) on investments | | | (1.96 | ) | | | 3.65 | | | | 0.74 | | | | 1.66 | | | | 0.21 | | | | 2.04 | | |
| Total from investment operations | | | (1.97 | ) | | | 3.62 | | | | 0.73 | | | | 1.70 | | | | 0.15 | | | | 2.01 | | |
| Dividend from net investment income | | | — | | | | — | | | | (0.04 | ) | | | — | | | | — | | | | — | | |
| Net asset value, end of period | | $ | 14.90 | | | $ | 16.87 | | | $ | 13.25 | | | $ | 12.56 | | | $ | 10.86 | | | $ | 10.71 | | |
| Total return | | | (11.7 | )% | | | 27.3 | % | | | 5.8 | % | | | 15.7 | % | | | 1.4 | % | | | 23.1 | % | |
| RATIOS/SUPPLEMENTAL DATA: | |
Net assets, end of period
(000's omitted) | | $ | 49,221 | | | $ | 52,127 | | | $ | 106,335 | | | $ | 86,725 | | | $ | 88,098 | | | $ | 91,588 | | |
Ratio of expenses to average
net assets | | | 1.19 | % | | | 1.32 | % | | | 1.21 | % | | | 1.08 | % | | | 1.13 | % | | | 1.14 | % | |
Ratio of net investment income
(loss) to average net assets | | | (0.19 | )% | | | (0.19 | )% | | | (0.08 | )% | | | 0.31 | % | | | (0.51 | )% | | | (0.31 | )% | |
| Portfolio turnover rate | | | 81.45 | % | | | 192.18 | % | | | 322.72 | % | | | 249.06 | % | | | 191.48 | % | | | 255.49 | % | |
(i) Commenced operations January 27, 2003.
(ii) Amount was computed based on average shares outstanding during the period.
(iii) Ratios have been annualized; total return and portfolio turnover have not been annualized.
(iv) Unaudited.
See Notes to Financial Statements.
-38-
| ALGER LARGECAP GROWTH INSTITUTIONAL FUND | | CLASS R | |
| | | Six months
ended
4/30/08 (iii)(v) | | Year ended
10/31/07 | | Year ended
10/31/06 | | Year ended
10/31/05 | | Year ended
10/31/04 | | From
1/27/03 to
10/31/03 (i)(iii) | |
INCOME FROM INVESTMENT
OPERATIONS | |
Net asset value,
beginning of period | | $ | 16.52 | | | $ | 13.04 | | | $ | 12.39 | | | $ | 10.76 | | | $ | 10.66 | | | $ | 8.12 | | |
| Net investment income (loss) (ii) | | | (0.05 | ) | | | (0.10 | ) | | | (0.08 | ) | | | (0.03 | ) | | | (0.12 | ) | | | (0.06 | ) | |
Net realized and unrealized gain
(loss) on investments | | | (1.92 | ) | | | 3.58 | | | | 0.73 | | | | 1.66 | | | | 0.22 | | | | 2.60 | | |
| Total from investment operations | | | (1.97 | ) | | | 3.48 | | | | 0.65 | | | | 1.63 | | | | 0.10 | | | | 2.54 | | |
| Dividend from net investment income | | | — | | | | — | | | | — | | | | — | | | | — | | | | — | | |
| Net asset value, end of period | | $ | 14.55 | | | $ | 16.52 | | | $ | 13.04 | | | $ | 12.39 | | | $ | 10.76 | | | $ | 10.66 | | |
| Total return | | | (11.9 | )% | | | 26.7 | % | | | 5.3 | % | | | 15.2 | % | | | 0.9 | % | | | 31.3 | % | |
| RATIOS/SUPPLEMENTAL DATA: | |
Net assets, end of period
(000's omitted) | | $ | 8,600 | | | $ | 8,747 | | | $ | 5,372 | | | $ | 3,826 | | | $ | 2,493 | | | $ | 133 | | |
Ratio of expenses to average
net assets | | | 1.69 | % | | | 1.81 | % | | | 1.71 | % | | | 1.57 | % | | | 1.64 | % | | | 1.62 | % | |
Ratio of net investment income
(loss) to average net assets | | | (0.69 | )% | | | (0.72 | )% | | | (0.59 | )% | | | (0.29 | )% | | | (1.05 | )% | | | (0.84 | )% | |
| Portfolio turnover rate | | | 81.45 | % | | | 192.18 | % | | | 322.72 | % | | | 249.06 | % | | | 191.48 | % | | | 255.49 | % | |
-39-
THE ALGER INSTITUTIONAL FUNDS
Financial Highlights for a share outstanding throughout the period
| ALGER SMALLCAP GROWTH INSTITUTIONAL FUND | | CLASS I | |
| | | Six months
ended
4/30/08 (iii)(v) | | Year ended
10/31/07 | | Year ended
10/31/06 | | Year ended
10/31/05 | | Year ended
10/31/04 | | Year ended
10/31/03 | |
INCOME FROM INVESTMENT
OPERATIONS | |
Net asset value,
beginning of period | | $ | 30.30 | | | $ | 23.98 | | | $ | 19.97 | | | $ | 16.07 | | | $ | 15.10 | | | $ | 10.97 | | |
| Net investment income (loss) (ii) | | | (0.11 | ) | | | (0.21 | ) | | | (0.16 | ) | | | (0.14 | ) | | | (0.16 | ) | | | (0.12 | ) | |
Net realized and unrealized gain
(loss) on investments | | | (5.35 | ) | | | 6.53 | | | | 4.17 | | | | 4.04 | | | | 1.13 | | | | 4.25 | | |
| Total from investment operations | | | (5.46 | ) | | | 6.32 | | | | 4.01 | | | | 3.90 | | | | 0.97 | | | | 4.13 | | |
| Net asset value, end of period | | $ | 24.84 | | | $ | 30.30 | | | $ | 23.98 | | | $ | 19.97 | | | $ | 16.07 | | | $ | 15.10 | | |
| Total return | | | (18.0 | )% | | | 26.4 | % | | | 20.1 | % | | | 24.3 | % | | | 6.4 | % | | | 37.7 | % | |
| RATIOS/SUPPLEMENTAL DATA: | |
Net assets, end of period
(000's omitted) | | $ | 871,466 | | | $ | 894,802 | | | $ | 305,843 | | | $ | 71,224 | | | $ | 69,788 | | | $ | 93,300 | | |
Ratio of expenses to average
net assets | | | 1.25 | % | | | 1.30 | %(iv) | | | 1.31 | % | | | 1.20 | % | | | 1.25 | % | | | 1.24 | % | |
Ratio of net investment income
(loss) to average net assets | | | (0.89 | )% | | | (0.78 | )% | | | (0.74 | )% | | | (0.77 | )% | | | (1.03 | )% | | | (0.99 | )% | |
| Portfolio turnover rate | | | 31.07 | % | | | 67.53 | % | | | 88.67 | % | | | 116.16 | % | | | 135.80 | % | | | 139.97 | % | |
(i) Commenced operations January 27, 2003.
(ii) Amount was computed based on average shares outstanding during the period.
(iii) Ratios have been annualized; total return and portfolio turnover have not been annualized.
(iv) Amount has been reduced by 0.03% due to expense reimbursement.
(v) Unaudited.
See Notes to Financial Statements.
-40-
| ALGER SMALLCAP GROWTH INSTITUTIONAL FUND | | CLASS R | |
| | | Six months
ended
4/30/08 (iii)(v) | | Year ended
10/31/07 | | Year ended
10/31/06 | | Year ended
10/31/05 | | Year ended
10/31/04 | | From
1/27/03 to
10/31/03 (i)(iii) | |
INCOME FROM INVESTMENT
OPERATIONS | |
Net asset value,
beginning of period | | $ | 29.64 | | | $ | 23.58 | | | $ | 19.74 | | | $ | 15.93 | | | $ | 15.05 | | | $ | 10.72 | | |
| Net investment income (loss) (ii) | | | (0.18 | ) | | | (0.35 | ) | | | (0.28 | ) | | | (0.22 | ) | | | (0.25 | ) | | | (0.14 | ) | |
Net realized and unrealized gain
(loss) on investments | | | (5.22 | ) | | | 6.41 | | | | 4.12 | | | | 4.03 | | | | 1.13 | | | | 4.47 | | |
| Total from investment operations | | | (5.40 | ) | | | 6.06 | | | | 3.84 | | | | 3.81 | | | | 0.88 | | | | 4.33 | | |
| Net asset value, end of period | | $ | 24.24 | | | $ | 29.64 | | | $ | 23.58 | | | $ | 19.74 | | | $ | 15.93 | | | $ | 15.05 | | |
| Total return | | | (18.2 | )% | | | 25.7 | % | | | 19.5 | % | | | 23.9 | % | | | 5.8 | % | | | 40.4 | % | |
| RATIOS/SUPPLEMENTAL DATA: | |
Net assets, end of period
(000's omitted) | | $ | 50,271 | | | $ | 47,042 | | | $ | 8,018 | | | $ | 2,487 | | | $ | 284 | | | $ | 70 | | |
Ratio of expenses to average
net assets | | | 1.75 | % | | | 1.83 | %(iv) | | | 1.83 | % | | | 1.68 | % | | | 1.75 | % | | | 1.74 | % | |
Ratio of net investment income
(loss) to average net assets | | | (1.39 | )% | | | (1.32 | )% | | | (1.26 | )% | | | (1.20 | )% | | | (1.55 | )% | | | (1.49 | )% | |
| Portfolio turnover rate | | | 31.07 | % | | | 67.53 | % | | | 88.67 | % | | | 116.16 | % | | | 135.0 | % | | | 139.97 | % | |
-41-
THE ALGER INSTITUTIONAL FUNDS
Financial Highlights for a share outstanding throughout the period
| ALGER MIDCAP GROWTH INSTITUTIONAL FUND | | CLASS I | |
| | | Six months
ended
4/30/08 (iii)(iv) | | Year ended
10/31/07 | | Year ended
10/31/06 | | Year ended
10/31/05 | | Year ended
10/31/04 | | Year ended
10/31/03 | |
INCOME FROM INVESTMENT
OPERATIONS | |
Net asset value,
beginning of period | | $ | 23.24 | | | $ | 17.29 | | | $ | 17.57 | | | $ | 15.38 | | | $ | 14.78 | | | $ | 10.76 | | |
| Net investment income (loss) (ii) | | | (0.06 | ) | | | (0.11 | ) | | | (0.09 | ) | | | (0.11 | ) | | | (0.13 | ) | | | (0.11 | ) | |
Net realized and unrealized gain
(loss) on investments | | | (3.13 | ) | | | 7.44 | | | | 1.69 | | | | 2.55 | | | | 0.73 | | | | 4.13 | | |
| Total from investment operations | | | (3.19 | ) | | | 7.33 | | | | 1.60 | | | | 2.44 | | | | 0.60 | | | | 4.02 | | |
| Distributions from net realized gains | | | (3.53 | ) | | | (1.38 | ) | | | (1.88 | ) | | | (0.25 | ) | | | — | | | | — | | |
| Net asset value, end of period | | $ | 16.52 | | | $ | 23.24 | | | $ | 17.29 | | | $ | 17.57 | | | $ | 15.38 | | | $ | 14.78 | | |
| Total return | | | (15.2 | )% | | | 45.5 | % | | | 9.5 | % | | | 16.0 | % | | | 4.1 | % | | | 37.4 | % | |
| RATIOS/SUPPLEMENTAL DATA: | |
Net assets, end of period
(000's omitted) | | $ | 1,712,889 | | | $ | 2,032,326 | | | $ | 1,349,500 | | | $ | 1,093,486 | | | $ | 839,273 | | | $ | 540,742 | | |
Ratio of expenses to average
net assets | | | 1.11 | % | | | 1.17 | % | | | 1.13 | % | | | 1.10 | % | | | 1.15 | % | | | 1.17 | % | |
Ratio of net investment income
(loss) to average net assets | | | (0.66 | )% | | | (0.54 | )% | | | (0.54 | )% | | | (0.64 | )% | | | (0.87 | )% | | | (0.89 | )% | |
| Portfolio turnover rate | | | 147.30 | % | | | 274.32 | % | | | 253.59 | % | | | 237.74 | % | | | 190.93 | % | | | 217.33 | % | |
(i) Commenced operations January 27, 2003.
(ii) Amount was computed based on average shares outstanding during the period.
(iii) Ratios have been annualized; total return and portfolio turnover have not been annualized.
(iv) Unaudited.
See Notes to Financial Statements.
-42-
| ALGER MIDCAP GROWTH INSTITUTIONAL FUND | | CLASS R | |
| | | Six months
ended
4/30/08 (iii)(iv) | | Year ended
10/31/07 | | Year ended
10/31/06 | | Year ended
10/31/05 | | Year ended
10/31/04 | | From
1/27/03 to
10/31/03 (i)(iii) | |
INCOME FROM INVESTMENT
OPERATIONS | |
Net asset value,
beginning of period | | $ | 22.64 | | | $ | 16.95 | | | $ | 17.34 | | | $ | 15.25 | | | $ | 14.73 | | | $ | 10.25 | | |
| Net investment income (loss) (ii) | | | (0.10 | ) | | | (0.20 | ) | | | (0.18 | ) | | | (0.19 | ) | | | (0.21 | ) | | | (0.14 | ) | |
Net realized and unrealized gain
(loss) on investments | | | (3.04 | ) | | | 7.27 | | | | 1.67 | | | | 2.53 | | | | 0.73 | | | | 4.62 | | |
| Total from investment operations | | | (3.14 | ) | | | 7.07 | | | | 1.49 | | | | 2.34 | | | | 0.52 | | | | 4.48 | | |
| Distributions from net realized gains | | | (3.53 | ) | | | (1.38 | ) | | | (1.88 | ) | | | (0.25 | ) | | | — | | | | — | | |
| Net asset value, end of period | | $ | 15.97 | | | $ | 22.64 | | | $ | 16.95 | | | $ | 17.34 | | | $ | 15.25 | | | $ | 14.73 | | |
| Total return | | | (15.4 | )% | | | 44.7 | % | | | 9.0 | % | | | 15.4 | % | | | 3.5 | % | | | 43.7 | % | |
| RATIOS/SUPPLEMENTAL DATA: | |
Net assets, end of period
(000's omitted) | | $ | 69,857 | | | $ | 69,877 | | | $ | 43,355 | | | $ | 22,127 | | | $ | 12,000 | | | $ | 790 | | |
Ratio of expenses to average
net assets | | | 1.60 | % | | | 1.67 | % | | | 1.63 | % | | | 1.60 | % | | | 1.65 | % | | | 1.66 | % | |
Ratio of net investment income
(loss) to average net assets | | | (1.16 | )% | | | (1.04 | )% | | | (1.05 | )% | | | (1.15 | )% | | �� | (1.37 | )% | | | (1.40 | )% | |
| Portfolio turnover rate | | | 147.30 | % | | | 274.32 | % | | | 253.59 | % | | | 237.74 | % | | | 190.93 | % | | | 217.33 | % | |
-43-
THE ALGER INSTITUTIONAL FUNDS
Financial Highlights for a share outstanding throughout the period
| ALGER CAPITAL APPRECIATION INSTITUTIONAL FUND | | CLASS I | |
| | | Six months
ended
4/30/08 (iii)(iv) | | Year ended
10/31/07 | | Year ended
10/31/06 | | Year ended
10/31/05 | | Year ended
10/31/04 | | Year ended
10/31/03 | |
INCOME FROM INVESTMENT
OPERATIONS | |
Net asset value,
beginning of period | | $ | 22.27 | | | $ | 15.77 | | | $ | 13.28 | | | $ | 11.05 | | | $ | 11.06 | | | $ | 8.97 | | |
| Net investment income (loss) (ii) | | | (0.03 | ) | | | (0.06 | ) | | | (0.06 | ) | | | — | | | | (0.10 | ) | | | (0.06 | ) | |
Net realized and unrealized gain
(loss) on investments | | | (2.52 | ) | | | 6.56 | | | | 2.55 | | | | 2.23 | | | | 0.09 | | | | 2.15 | | |
| Total from investment operations | | | (2.55 | ) | | | 6.50 | | | | 2.49 | | | | 2.23 | | | | (0.01 | ) | | | 2.09 | | |
| Net asset value, end of period | | $ | 19.72 | | | $ | 22.27 | | | $ | 15.77 | | | $ | 13.28 | | | $ | 11.05 | | | $ | 11.06 | | |
| Total return | | | (11.5 | )% | | | 41.3 | % | | | 18.7 | % | | | 20.2 | % | | | (0.1 | )% | | | 23.3 | % | |
| RATIOS/SUPPLEMENTAL DATA: | |
Net assets, end of period
(000's omitted) | | $ | 606,256 | | | $ | 537,928 | | | $ | 165,422 | | | $ | 128,646 | | | $ | 124,889 | | | $ | 160,569 | | |
Ratio of expenses to average
net assets | | | 1.17 | % | | | 1.23 | % | | | 1.27 | % | | | 1.17 | % | | | 1.23 | % | | | 1.23 | % | |
Ratio of net investment income
(loss) to average net assets | | | (0.30 | )% | | | (0.33 | )% | | | (0.38 | )% | | | 0.04 | % | | | (0.87 | )% | | | (0.59 | )% | |
| Portfolio turnover rate | | | 101.40 | % | | | 232.13 | % | | | 225.25 | % | | | 148.91 | % | | | 160.00 | % | | | 187.72 | % | |
(i) Commenced operations January 27, 2003.
(ii) Amount was computed based on average shares outstanding during the period.
(iii) Ratios have been annualized; total return and portfolio turnover have not been annualized.
(iv) Unaudited.
See Notes to Financial Statements.
-44-
| ALGER CAPITAL APPRECIATION INSTITUTIONAL FUND | | CLASS R | |
| | | Six months
ended
4/30/08 (iii)(iv) | | Year ended
10/31/07 | | Year ended
10/31/06 | | Year ended
10/31/05 | | Year ended
10/31/04 | | From
1/27/03 to
10/31/03 (i)(iii) | |
INCOME FROM INVESTMENT
OPERATIONS | |
Net asset value,
beginning of period | | $ | 21.75 | | | $ | 15.47 | | | $ | 13.09 | | | $ | 10.95 | | | $ | 11.01 | | | $ | 8.36 | | |
| Net investment income (loss) (ii) | | | (0.08 | ) | | | (0.16 | ) | | | (0.15 | ) | | | (0.06 | ) | | | (0.16 | ) | | | (0.08 | ) | |
Net realized and unrealized gain
(loss) on investments | | | (2.46 | ) | | | 6.44 | | | | 2.53 | | | | 2.20 | | | | 0.10 | | | | 2.73 | | |
| Total from investment operations | | | (2.54 | ) | | | 6.28 | | | | 2.38 | | | | 2.14 | | | | (0.06 | ) | | | 2.65 | | |
| Net asset value, end of period | | $ | 19.21 | | | $ | 21.75 | | | $ | 15.47 | | | $ | 13.09 | | | $ | 10.95 | | | $ | 11.01 | | |
| Total return | | | (11.7 | )% | | | 40.6 | % | | | 18.2 | % | | | 19.5 | % | | | (0.5 | )% | | | 31.7 | % | |
| RATIOS/SUPPLEMENTAL DATA: | |
Net assets, end of period
(000's omitted) | | $ | 63,285 | | | $ | 39,442 | | | $ | 5,969 | | | $ | 1,073 | | | $ | 706 | | | $ | 66 | | |
Ratio of expenses to average
net assets | | | 1.67 | % | | | 1.72 | % | | | 1.79 | % | | | 1.67 | % | | | 1.73 | % | | | 1.72 | % | |
Ratio of net investment income
(loss) to average net assets | | | (0.81 | )% | | | (0.86 | )% | | | (0.90 | )% | | | (0.51 | )% | | | (1.39 | )% | | | (1.01 | )% | |
| Portfolio turnover rate | | | 101.40 | % | | | 232.13 | % | | | 225.25 | % | | | 148.91 | % | | | 160.00 | % | | | 187.72 | % | |
-45-
THE ALGER INSTITUTIONAL FUNDS |
NOTES TO FINANCIAL STATEMENTS (Unaudited)
NOTE 1 — General:
The Alger Institutional Funds (the "Trust"), is a diversified, open-end registered investment company organized as a business trust under the laws of the Commonwealth of Massachusetts. The Trust operates as a series company and currently issues an unlimited number of shares of beneficial interest in four funds—LargeCap Growth Fund, SmallCap Growth Fund, MidCap Growth Fund and Capital Appreciation Fund (collectively, the "Funds" or individually, each a "Fund"). The LargeCap Growth Fund, SmallCap Growth Fund, MidCap Growth Fund and Capital Appreciation Fund normally invest primarily in equity securities and each has an investment objective of long-term capital appreciation.
Each Fund offers Class I and Class R shares. Class R shares were first offered January 27, 2003. Each class has identical rights to assets and earnings except that only Class R shares have a plan of distribution and bear the related expenses.
NOTE 2 — Significant Accounting Policies:
(a) Investment Valuation: Investments of the Funds are valued on each day the New York Stock Exchange (the "NYSE") is open as of the close of the NYSE (currently 4:00 p.m. Eastern time). Securities for which such information is readily available are valued at the last reported sales price or official closing price as reported by an independent pricing service on the primary market or exchange on which they are traded. In the absence of reported sales, securities are valued at a price within the bid and asked price or, in the absence of a recent bid or asked price, the equivalent as obtained from one or more of the major market makers for the securities to be valued.
Securities for which market quotations are not readily available are valued at fair value, as determined in good faith pursuant to procedures established by the Board of Trustees.
Securities in which the Funds invest may be traded in markets that close before the close of the NYSE. Developments that occur between the close of the foreign markets and the close of the NYSE (normally 4:00 p.m. Eastern time) may result in adjustments to the closing prices to reflect what the investment manager, pursuant to policies established by the Board of Trustees, believes to be the fair values of these securities as of the close of the NYSE. The Funds may also fair value securities in other situations, for example, when a particular foreign market is closed but the Funds are open.
Short-term securities having a remaining maturity of sixty days or less are valued at amortized cost which approximates market value. Shares of mutual funds are valued at the net asset value of the underlying mutual fund.
Statement on Financial Accounting Standards No. 157, "Fair Value Measurements" (FAS 157) defines fair value for financial reporting, establishes a framework for measuring fair value and requires additional disclosures about the use of fair value
-46-
THE ALGER INSTITUTIONAL FUNDS |
NOTES TO FINANCIAL STATEMENTS (Unaudited) (Continued)
measurements. FAS 157 is effective for financial statements issued for fiscal years beginning after November 15, 2007 and interim periods within those fiscal years. The Fund does not believe the adoption of FAS 157 will impact the amounts reported in the financial statements, however, additional disclosures will be required about the inputs used to develop the measurements of fair value and the effect of certain of the measurements reported in the statement of operations for a fiscal period. These inputs are summarized in the three broad levels listed below:
• Level 1 – quoted prices in active markets for identical securities
• Level 2 – other significant observable inputs (including quoted prices for similar securities, interest rates, credit risk, etc.)
• Level 3 – significant unobservable inputs (including the Fund's own assumptions in determining the fair value of investments)
The inputs or methodology used for valuing securities are not necessarily an indication of the risk associated with investing in those securities.
Recent Accounting Pronouncements
In March 2008, the Financial Accounting Standards Board issued the Statement of Financial Accounting Standards No. 161, Disclosures about Derivative Instruments and Hedging Activities ("FAS 161"). FAS 161 is effective for fiscal years and interim periods beginning after November 15, 2008. FAS 161 requires enhanced disclosures about the Fund's derivative and hedging activities, including how such activities are accounted for and their effect on the Fund's financial position, performance and cash flows. Management is currently evaluating the impact the adoption of FAS 161 will have on the Fund's financial statements and related disclosures.
(b) Securities Transactions and Investment Income: Securities transactions are recorded on a trade date basis. Realized gains and losses from securities transactions are recorded on the identified cost basis. Dividend income is recognized on the ex-dividend date and interest income is recognized on the accrual basis.
Premiums and discounts on debt securities purchased are amortized or accreted over the lives of the respective securities.
(c) Foreign Currency Translations: The books and records of the Funds are maintained in U.S. dollars. Foreign currencies, investments and other assets and liabilities are translated into U.S. dollars at the prevailing rates of exchange on the valuation date. Purchases and sales of investment securities and income and expenses are translated into U.S. dollars at the prevailing exchange rates on the respective dates of such transactions.
Net realized gains and losses on foreign currency transactions represent net gains and losses from the disposition of foreign currencies, currency gains and losses realized between the trade dates and settlement dates of security transactions, and the difference between the amount of net investment income accrued and the U.S. dollar amount actually received. The effects of changes in foreign currency exchange rates
-47-
THE ALGER INSTITUTIONAL FUNDS |
NOTES TO FINANCIAL STATEMENTS (Unaudited) (Continued)
on investments in securities are included in realized and unrealized gain or loss on investments in the Statements of Operations.
(d) Lending of Fund Securities: The Funds may lend their securities to financial institutions, provided that the market value of the securities loaned will not at any time exceed one third of a Fund's total assets, as defined. The Funds earn fees on the securities loaned. In order to protect against the risk of failure by the borrower to return the securities loaned or any delay in the delivery of such securities, the loan is collateralized by cash, letters of credit or U.S. Government securities that are maintained in an amount equal to at least 100 percent of the current market value of the loaned securities. The market value of the loaned securities is determined at the close of business of the Funds and any required additional collateral is delivered to the Funds on the next business day. There were no securities on loan during the six months ended April 30, 2 008.
(e) Dividends to Shareholders: Dividends payable to shareholders are recorded on the ex-dividend date. With respect to all Funds, dividends from net investment income and distributions from net realized gains, offset by any loss carry forward, are declared and paid annually after the end of the fiscal year in which earned.
Each class is treated separately in determining the amounts of dividends of net investment income payable to holders of its shares.
The characterization of distributions to shareholders for financial reporting purposes is determined in accordance with federal income tax rules. Therefore, the source of the Funds' distributions may be shown in the accompanying financial statements as either from, or in excess of net investment income, net realized gain on investment transactions or return of capital, depending on the type of book/tax differences that may exist. Capital accounts within the financial statements are adjusted for permanent book/tax differences. Reclassifications result primarily from the differences in tax treatment of net operating losses, foreign currency transactions and amortization adjustments on debt securities. The reclassifications had no impact on the net asset values of the Funds and are designed to present the Funds' capital accounts on a tax basis.
(f) Federal Income Taxes: It is each Fund's policy to comply with the requirements of the Internal Revenue Code applicable to regulated investment companies and to distribute all of its investment company taxable income to its shareholders. Provided a Fund maintains such compliance, no federal income tax provision is required. Each Fund is treated as a separate entity for the purpose of determining such compliance.
(g) Allocation Methods: The Trust accounts separately for the assets, liabilities and operations of each Fund. Expenses directly attributable to each Fund are charged to that Fund's operations; expenses which are applicable to all Funds are allocated among them based on net assets. Income, realized and unrealized gains and losses, and expenses of each Fund, are allocated among the Fund's classes based on relative net assets, with the exception of distribution fees, which are only applicable to Class R shares.
-48-
THE ALGER INSTITUTIONAL FUNDS |
NOTES TO FINANCIAL STATEMENTS (Unaudited) (Continued)
(h) Indemnification: The Trust enters into contracts that contain a variety of indemnification provisions. The Trust's maximum exposure under these arrangements is unknown. The Trust does not anticipate recognizing any loss related to these arrangements.
(i) Other: These financial statements have been prepared in accordance with U.S. generally accepted accounting principles, which require using estimates and assumptions that affect the reported amounts therein. Actual results may differ from those estimates.
NOTE 3 — Investment Advisory Fees and Other Transactions with Affiliates:
(a) Investment Advisory and Administration Fees: Fees incurred by each Fund, pursuant to the provisions of its Investment Advisory Agreement and its Administration Agreement with Fred Alger Management, Inc. (Alger Management), are payable monthly and computed based on the value of the average daily net assets of each Fund, at the following rates:
| | | Advisory Fee | | Administration
Fee through
March 16, 2008 | | Administration
Fee Effective
March 17, 2008 | |
| LargeCap Growth Fund | | | .71 | % | | | .04 | % | | | .0275 | % | |
| SmallCap Growth Fund | | | .81 | | | | .04 | | | | .0275 | | |
| MidCap Growth Fund | | | .76 | | | | .04 | | | | .0275 | | |
| Capital Appreciation Fund | | | .81 | | | | .04 | | | | .0275 | | |
Prior to September 12, 2006, Alger Management provided both advisory services and administrative services to each Fund pursuant to a separate investment management agreement with each Fund.
(b) Distribution Fees: Class R Shares: The Funds have adopted a Distribution Plan pursuant to which Class R shares of each Fund pays Fred Alger & Company, Incorporated, the Trust's distributor (the "Distributor") and an affiliate of Alger Management, a fee at the annual rate of .50% of the respective average daily net assets of the Class R shares of the designated Funds to compensate the Distributor for its activities and expenses incurred in distributing the Class R shares. The fees charged may be more or less than the expenses incurred by the Distributor.
(c) Brokerage Commissions: During the six months ended April 30, 2008, the LargeCap Growth Fund, the SmallCap Growth Fund, the MidCap Growth Fund and the Capital Appreciation Fund paid the Distributor commissions of $33,732, $278,330, $2,140,657 and $438,478, respectively, in connection with securities transactions.
(d) Shareholder Administrative Fees: The Trust has entered into a shareholder administrative services agreement with Alger Management, to compensate Alger Management on a per account basis for its liaison and administrative oversight of
-49-
THE ALGER INSTITUTIONAL FUNDS |
NOTES TO FINANCIAL STATEMENTS (Unaudited) (Continued)
Boston Financial Data Services, Inc., the transfer agent, and other related services. During the six months ended April 30, 2008, the LargeCap Growth Fund, SmallCap Growth Fund, MidCap Growth Fund and Capital Appreciation Fund incurred fees of $188, $67,386, $3,654 and $4,031 respectively, for these services provided by Alger Management which are included in transfer agent fees and expenses in the Statement of Operations.
(e) Shareholder Servicing Fees: Effective June 1, 2007, the Trust has entered into a shareholder servicing agreement with Alger Inc. whereby Alger Inc. provides the Trust with ongoing servicing of shareholder accounts. As Compensation for such services, each Fund pays Alger Inc. a monthly fee at an annual rate of .25% of the value of its average daily net assets.
(f) Trustee Fees: Each Fund pays each trustee who is not affiliated with Alger Management or its affiliates $500 for each meeting attended, to a maximum of $2,000 per annum. The Chairman of the Board of Trustees receives an additional annual fee of $10,000 which is paid, pro rata, by all funds managed by Alger Management. Additionally, each member of the audit committee receives an additional $50 from each Fund for each audit committee meeting attended, to a maximum of $200 per annum.
(g) Other Transactions With Affiliates: Certain trustees and officers of the Trust are directors and officers of Alger Management, the Distributor and Alger Services.
NOTE 4 — Securities Transactions:
The following summarizes the securities transactions by the Funds, other than short-term securities, for the six months ended April 30, 2008:
| | | PURCHASES | | SALES | |
| LargeCap Growth Fund | | $ | 46,330,835 | | | $ | 44,025,460 | | |
| SmallCap Growth Fund | | | 412,036,197 | | | | 263,149,458 | | |
| MidCap Growth Fund | | | 2,718,095,799 | | | | 2,699,925,873 | | |
| Capital Appreciation Fund | | | 722,571,963 | | | | 589,620,100 | | |
NOTE 5 — Lines of Credit:
The Trust participated in $50 million committed lines of credit with other mutual funds managed by Alger Management through March 14, 2008. All borrowings had variable interest rates and were payable on demand.
With the exception of the Capital Appreciation Fund, the Trust borrows under such lines of credit exclusively for temporary or emergency purposes. The Capital Appreciation Fund may borrow under these lines up to 1/3 of the value of its assets, to purchase additional securities. To the extent the Capital Appreciation Fund borrows under these lines, it must pledge securities with a total value of at
-50-
THE ALGER INSTITUTIONAL FUNDS |
NOTES TO FINANCIAL STATEMENTS (Unaudited) (Continued)
least twice the amount borrowed. Effective March 17, 2008, the funds borrows from its custodian on an uncommitted basis.
For the six months ended April 30, 2008, the Trust had the following borrowings:
| | | AVERAGE
BORROWING | | WEIGHTED AVERAGE
INTEREST RATE | |
| SmallCap Growth Fund | | $ | 11,714 | | | | 3.63 | % | |
| MidCap Growth Fund | | | 308,302 | | | | 4.15 | | |
| Capital Appreciation Fund | | | 13,736 | | | | 3.56 | | |
NOTE 6 — Share Capital:
The Trust has an unlimited number of authorized shares of beneficial interest of $.001 par value which are presently divided into four series. Each series is divided into two separate classes.
During the six months ended April 30, 2008, transactions of shares of beneficial interest were as follows:
| | | SHARES | | AMOUNT | |
| LARGECAP GROWTH FUND | |
| Class I | |
| Shares sold | | | 1,065,320 | | | $ | 16,043,224 | | |
| Shares redeemed | | | (851,639 | ) | | | (13,031,171 | ) | |
| Net increase | | | 213,681 | | | $ | 3,012,053 | | |
| LARGECAP GROWTH FUND | |
| Class R | |
| Shares sold | | | 173,826 | | | $ | 2,588,895 | | |
| Shares redeemed | | | (112,385 | ) | | | (1,654,443 | ) | |
| Net increase | | | 61,441 | | | $ | 934,452 | | |
| SMALLCAP GROWTH FUND | |
| Class I | |
| Shares sold | | | 10,151,186 | | | $ | 261,007,363 | | |
| Shares redeemed | | | (4,598,915 | ) | | | (118,335,114 | ) | |
| Net increase | | | 5,552,271 | | | $ | 142,672,249 | | |
| Class R | |
| Shares sold | | | 863,013 | | | $ | 22,127,044 | | |
| Shares redeemed | | | (376,185 | ) | | | (9,462,200 | ) | |
| Net increase | | | 486,828 | | | $ | 12,664,844 | | |
-51-
THE ALGER INSTITUTIONAL FUNDS |
NOTES TO FINANCIAL STATEMENTS (Unaudited) (Continued)
| | | SHARES | | AMOUNT | |
| MIDCAP GROWTH FUND | |
| Class I | |
| Shares sold | | | 27,866,444 | | | $ | 503,000,964 | | |
| Dividends reinvested | | | 13,730,131 | | | | 251,810,604 | | |
| Shares redeemed | | | (25,381,034 | ) | | | (459,016,594 | ) | |
| Net increase | | | 16,215,541 | | | $ | 295,794,974 | | |
| Class R | |
| Shares sold | | | 1,855,220 | | | $ | 31,817,951 | | |
| Dividends reinvested | | | 275,824 | | | | 4,898,632 | | |
| Shares redeemed | | | (843,709 | ) | | | (15,291,663 | ) | |
| Net increase | | | 1,287,335 | | | $ | 21,424,920 | | |
| CAPITAL APPRECIATION FUND | |
| Class I | |
| Shares sold | | | 11,756,909 | | | $ | 242,807,870 | | |
| Shares redeemed | | | (5,166,486 | ) | | | (102,145,904 | ) | |
| Net increase | | | 6,590,423 | | | $ | 140,661,966 | | |
| Class R | |
| Shares sold | | | 1,848,975 | | | $ | 36,019,445 | | |
| Shares redeemed | | | (367,867 | ) | | | (7,042,844 | ) | |
| Net increase | | | 1,481,108 | | | $ | 28,976,601 | | |
During the year ended October 31, 2007, transactions of shares of beneficial interest were as follows:
| | | SHARES | | AMOUNT | |
| LARGECAP GROWTH FUND | |
| Class I | |
| Shares sold | | | 1,570,277 | | | $ | 23,081,729 | | |
| Shares redeemed | | | (6,507,676 | ) | | | (91,837,212 | ) | |
| Net decrease | | | (4,937,399 | ) | | $ | (68,755,483 | ) | |
| Class R | |
| Shares sold | | | 303,055 | | | $ | 4,427,270 | | |
| Shares redeemed | | | (185,509 | ) | | | (2,640,940 | ) | |
| Net increase | | | 117,546 | | | $ | 1,786,330 | | |
-52-
THE ALGER INSTITUTIONAL FUNDS |
NOTES TO FINANCIAL STATEMENTS (Unaudited) (Continued)
| | | SHARES | | AMOUNT | |
| SMALLCAP GROWTH FUND | |
| Class I | |
| Shares sold | | | 23,138,022 | | | $ | 612,294,019 | | |
| Shares redeemed | | | (6,357,696 | ) | | | (170,766,850 | ) | |
| Net increase | | | 16,780,326 | | | $ | 441,527,169 | | |
| Class R | |
| Shares sold | | | 1,560,038 | | | $ | 40,720,126 | | |
| Shares redeemed | | | (313,081 | ) | | | (8,243,204 | ) | |
| Net increase | | | 1,246,957 | | | $ | 32,476,922 | | |
| MIDCAP GROWTH FUND | |
| Class I | |
| Shares sold | | | 36,433,129 | | | $ | 720,986,230 | | |
| Dividends reinvested | | | 5,120,164 | | | | 86,991,587 | | |
| Shares redeemed | | | (32,166,978 | ) | | | (600,856,130 | ) | |
| Net increase | | | 9,386,315 | | | $ | 207,121,687 | | |
| Class R | |
| Shares sold | | | 1,665,514 | | | $ | 31,680,100 | | |
| Dividends reinvested | | | 82,715 | | | | 1,374,727 | | |
| Shares redeemed | | | (1,218,937 | ) | | | (22,592,443 | ) | |
| Net increase | | | 529,292 | | | $ | 10,462,384 | | |
| CAPITAL APPRECIATION FUND | |
| Class I | |
| Shares sold | | | 16,699,383 | | | $ | 324,186,877 | | |
| Shares redeemed | | | (3,037,507 | ) | | | (54,972,793 | ) | |
| Net increase | | | 13,661,876 | | | $ | 269,214,084 | | |
| CAPITAL APPRECIATION FUND | |
| Class R | |
| Shares sold | | | 1,724,940 | | | $ | 32,565,363 | | |
| Shares redeemed | | | (297,044 | ) | | | (5,578,512 | ) | |
| Net increase | | | 1,427,896 | | | $ | 26,986,851 | | |
-53-
THE ALGER INSTITUTIONAL FUNDS |
NOTES TO FINANCIAL STATEMENTS (Unaudited) (Continued)
NOTE 7 — Tax Character of Distributions to Shareholders:
The tax character of distributions paid during the six months ended April 30, 2008 and the year ended October 31, 2007 were as follows:
| | | SIX MONTHS ENDED
APRIL 30, 2008 | | YEAR ENDED
OCTOBER 31, 2007 | |
| MIDCAP GROWTH FUND | |
| Distributions paid from: | |
| Ordinary income | | $ | 295,577,096 | | | $ | 48,716,257 | | |
| Long-term capital gain | | | 22,157,271 | | | | 60,684,009 | | |
| Total distributions paid | | $ | 317,734,367 | | | $ | 109,400,266 | | |
As of October 31, 2007, the components of distributable earnings on a tax basis were as follows:
| LARGECAP GROWTH FUND | |
| Undistributed ordinary income | | $ | — | | |
| Undistributed long-term gain | | | — | | |
| Unrealized appreciation | | $ | 8,186,352 | | |
| SMALLCAP GROWTH FUND | |
| Undistributed ordinary income | | $ | — | | |
| Undistributed long-term gain | | | — | | |
| Unrealized appreciation | | | 141,386,221 | | |
| MIDCAP GROWTH FUND | |
| Undistributed ordinary income | | $ | 295,570,615 | | |
| Undistributed long-term gain | | | 22,157,687 | | |
| Unrealized appreciation | | | 345,939,590 | | |
| CAPITAL APPRECIATION FUND | |
| Undistributed ordinary income | | $ | — | | |
| Undistributed long-term gain | | | — | | |
| Unrealized appreciation | | | 58,267,522 | | |
The differences between book basis and tax basis unrealized appreciation is determined annually and is attributable primarily to the tax deferral of losses on wash sales.
At October 31, 2007, the Funds, for federal income tax purposes, had capital loss carryforwards which expire as set forth in the table below. These amounts may be applied against future net realized gains until the earlier of their utilization or expiration.
EXPIRATION DATE
| | | 2010 | | 2011 | | 2012 | | 2013 | | 2014 | | TOTAL | |
| LargeCap Growth Fund | | $ | 945,854 | | | $ | 5,070,663 | | | | — | | | | — | | | | — | | | $ | 6,016,517 | | |
| SmallCap Growth Fund | | $ | 5,654,698 | | | | — | | | | — | | | | — | | | | — | | | $ | 5,654,698 | | |
| Capital Appreciation Fund | | $ | 9,021,946 | | | | — | | | | — | | | | — | | | | — | | | $ | 9,021,946 | | |
-54-
THE ALGER INSTITUTIONAL FUNDS |
NOTES TO FINANCIAL STATEMENTS (Unaudited) (Continued)
NOTE 8 — Litigation:
Alger Management has responded to inquiries, document requests and/or subpoenas from various regulatory authorities, in connection with their investigations of practices in the mutual fund industry identified as "market timing" and "late trading." On October 11, 2006, Alger Management, Alger Inc. and Alger Shareholder Services, Inc. executed an Assurance of Discontinuance with the Office of the New York State Attorney General ("NYAG"). On January 18, 2007 the Securities and Exchange Commission issued an order implementing settlements reached with Alger Management and Alger Inc. As part of the settlements with the Commission and the NYAG, without admitting or denying liability, the firms paid $30 million to reimburse fund shareholders and a fine of $10 million; and agreed to certain other remedial measures including a reduction in management fees of $1 million per year for five years. The entire $40 million and fee reduction will be available for the benefit of investors. Alger Management has advised the Funds that the settlement has not adversely affected the operations of Alger Management, Alger Inc. or their affiliates, or adversely affected their ability to continue to provide services to the Funds.
On August 31, 2005, the West Virginia Securities Commissioner (the "WVSC") in an ex parte Summary Order to Cease and Desist and Notice of Right to Hearing concluded that Alger Management and Alger Inc. had violated the West Virginia Uniform Securities Act (the "WVUSA"), and ordered Alger Management and Alger Inc. to cease and desist from further violations of the WVUSA by engaging in the market-timing related conduct described in the order. The ex parte order provided notice of their right to a hearing with respect to the violations of law asserted by the WVSC. Other firms unaffiliated with Alger Management were served with similar orders. Alger Management and Alger Inc. intend to request a hearing for the purpose of seeking to vacate or modify the order.
In addition, in 2003 and 2004 several purported class actions and shareholder derivative suits were filed against various parties in the mutual fund industry, including Alger Management, certain mutual funds managed by Alger Management (the "Alger Mutual Funds"), and certain current and former Alger Mutual Fund trustees and officers, alleging wrongful conduct related to market-timing and late-trading by mutual fund shareholders. These cases were transferred to the U.S. District Court of Maryland by the Judicial Panel on Multidistrict Litigation for consolidated pre-trial proceedings. In September 2004, consolidated amended complaints involving these cases — a Consolidated Amended Fund Derivative Complaint (the "Derivative Complaint") and two substantially identical Consolidated Amended Class Action Complaints (together, the "Class Action Complaint") — were filed in the Maryland federal district court under the caption number 1:04-M D-15863 (JFM). In April 2005, a civil lawsuit involving similar allegations was filed by the West Virginia Attorney General and also transferred to the Maryland District Court, but such lawsuit has since been withdrawn.
-55-
THE ALGER INSTITUTIONAL FUNDS |
NOTES TO FINANCIAL STATEMENTS (Unaudited) (Continued)
The Derivative Complaint (which was later amended a second time) alleged (i) violations, by Alger Management and, depending on the specific offense alleged, by Alger Inc. and/or the fund trustee defendants, of Sections 36(a), 36(b), 47, and 48 of the Investment Company Act of 1940, as amended, (the "1940 Act") and of Sections 206 and 215 of the Investment Advisers Act of 1940, as amended, breach of fiduciary duty, and breach of contract, (ii) various offenses by other third-party defendants, and (iii) unjust enrichment by all the named defendants. The Class Action Complaint alleged, in addition to the offenses listed above, (i) violations, by Alger Management, Alger Inc., their affiliates, the funds named as defendants, including the Funds, and the current and former fund trustees and officers, of Sections 11, 12(a)(2), and 15 of the Securities Act of 1933, as amended, Sections 10(b) (and Rule 10b-5 thereunder) and 20(a) of the Securities Ex change Act of 1934, as amended, (the "1934 Act"), and Section 34(b) of the Investment Company Act, (ii) breach of contract by the funds named as defendants, and (iii) unjust enrichment of the defendants.
Motions to dismiss the Class Action Complaint and the Derivative Complaint were subsequently filed.
As a result of a series of court orders, all claims in the Class Action Complaint and the Derivative Complaint have been dismissed, other than claims under the 1934 Act against Alger Management, Alger Inc., Alger Associates, Inc. and Alger Shareholder Services, Inc., and certain present and former members of the senior management of Alger Management and/or Alger Inc., and claims under Section 36(b) of the Investment Company Act against Alger Management, Alger Inc., Alger Associates, Inc. and Alger Shareholder Services, Inc.
-56-
THE ALGER INSTITUTIONAL FUNDS
ADDITIONAL INFORMATION (Unaudited)
Shareholder Expense Example
As a shareholder of the Funds, you incur two types of costs: transaction costs, if applicable, and ongoing costs, including management fees, distribution (12b-1) fees, if applicable, and other fund expenses. This example is intended to help you understand your ongoing costs (in dollars) of investing in the Funds and to compare these costs with the ongoing costs of investing in other mutual funds.
The example below is based on an investment of $1,000 invested at the beginning of the six-month period starting November 1, 2007 and ending April 30, 2008.
Actual Expenses
The first line for each class of shares in the table below provides information about actual account values and actual expenses. You may use the information in this line, together with the amount you invested, to estimate the expenses that you would have paid over the period. Simply divide your account value by $1,000 (for example, an $8,600 account value divided by $1,000 = 8.6), then multiply the result by the number in the first line under the heading entitled "Expenses Paid During the Period" to estimate the expenses you paid on your account during this period.
Hypothetical Example for Comparison Purposes
The second line for each class of shares in the table below provides information about hypothetical account values and hypothetical expenses based on the Fund's actual expense ratios for each class of shares and an assumed rate of return of 5% per year before expenses, which is not the Fund's actual return. The hypothetical account values and expenses may not be used to estimate the actual ending account balance or expenses you paid for the period. You may use this information to compare the ongoing costs of investing in the Funds and other funds. To do so, compare this 5% hypothetical example with the 5% hypothetical examples that appear in the shareholder reports of other funds.
Please note that the expenses shown in the table are meant to highlight your ongoing costs only and do not reflect any transaction costs. Therefore, the second line under each class of shares in the table is useful in comparing ongoing costs only, and will not help you determine the relative total costs of owning different funds. In addition, if these transactional costs were included, your costs would have been higher.
-57-
THE ALGER INSTITUTIONAL FUNDS
ADDITIONAL INFORMATION (Unaudited) (Continued)
Shareholder Expense Example (Continued)
| |
| |
Beginning
Account
Value
November 1,
2007 | |
Ending
Account
Value
April 30,
2008 | |
Expenses
Paid During
the Period
November 1, 2007
to April 30,
2008(b) | | Ratio of
Expenses to
Average
Net Assets
For the
Six Months
Ended
April 30,
2008(c) | |
| ALGER LARGECAP GROWTH INSTITUTIONAL FUND | |
| Class I | | Actual | | $ | 1,000.00 | | | $ | 883.20 | | | $ | 5.57 | | | | 1.19 | % | |
| | | Hypothetical(a) | | | 1,000.00 | | | | 1,018.95 | | | | 5.97 | | | | 1.19 | | |
| Class R | | Actual | | | 1,000.00 | | | | 880.80 | | | | 7.90 | | | | 1.69 | | |
| | | Hypothetical(a) | | | 1,000.00 | | | | 1,016.46 | | | | 8.47 | | | | 1.69 | | |
| ALGER SMALLCAP GROWTH INSTITUTIONAL FUND | |
| Class I | | Actual | | $ | 1,000.00 | | | $ | 819.80 | | | $ | 5.66 | | | | 1.25 | % | |
| | | Hypothetical(a) | | | 1,000.00 | | | | 1,018.65 | | | | 6.27 | | | | 1.25 | | |
| Class R | | Actual | | | 1,000.00 | | | | 1,182.20 | | | | 9.49 | | | | 1.75 | | |
| | | Hypothetical(a) | | | 1,000.00 | | | | 1,016.16 | | | | 8.77 | | | | 1.75 | | |
| ALGER MIDCAP GROWTH INSTITUTIONAL FUND | |
| Class I | | Actual | | $ | 1,000.00 | | | $ | 847.80 | | | $ | 5.10 | | | | 1.11 | % | |
| | | Hypothetical(a) | | | 1,000.00 | | | | 1,019.34 | | | | 5.57 | | | | 1.11 | | |
| Class R | | Actual | | | 1,000.00 | | | | 845.80 | | | | 7.34 | | | | 1.60 | | |
| | | Hypothetical(a) | | | 1,000.00 | | | | 1,016.91 | | | | 8.02 | | | | 1.60 | | |
| ALGER CAPITAL APPRECIATION INSTITUTIONAL FUND | |
| Class I | | Actual | | $ | 1,000.00 | | | $ | 885.50 | | | $ | 5.48 | | | | 1.17 | % | |
| | | Hypothetical(a) | | | 1,000.00 | | | | 1,019.05 | | | | 5.87 | | | | 1.17 | | |
| Class R | | Actual | | | 1,000.00 | | | | 883.20 | | | | 7.82 | | | | 1.67 | | |
| | | Hypothetical(a) | | | 1,000.00 | | | | 1,016.56 | | | | 8.37 | | | | 1.67 | | |
(a) 5% annual return before expenses.
(b) Expenses are equal to the annualized expense ratio of the respective share class, multiplied by the average account value over the period, multiplied by 182/366 (to reflect the one-half year period).
(c) Annualized.
Proxy Voting Policies
A description of the policies and procedures the Trust uses to determine how to vote proxies relating to portfolio securities and the proxy voting record is available, without charge, by calling (800) 992-3362 or online on the Funds' website at http://www.alger.com or on the SEC's website at http://www.sec.gov.
-58-
THE ALGER INSTITUTIONAL FUNDS
ADDITIONAL INFORMATION (Unaudited) (Continued)
Fund Holdings
The Funds' most recent month end portfolio holdings are available approximately sixty days after month end on the Funds' website at www.alger.com. The Funds also file their complete schedule of portfolio holdings with the SEC for the first and third quarter of each fiscal year on Form N-Q. The Funds' Forms N-Q is available online on the SEC's website at www.sec.gov or may be reviewed and copied at the SEC's Public Reference Room in Washington, D.C. Information regarding the operation of the SEC's Public Reference Room may be obtained by calling 1-800-SEC-0330. A copy of the most recent quarterly holdings may also be obtained from the Funds by calling (800) 992-3362.
-59-
(This page has been intentionally left blank.)
(This page has been intentionally left blank.)
(This page has been intentionally left blank.)
(This page has been intentionally left blank.)
(This page has been intentionally left blank.)
THE ALGER INSTITUTIONAL FUNDS
111 Fifth Avenue
New York, NY 10003
(800) 992-3362
www.alger.com
Investment Manager
Fred Alger Management, Inc.
111 Fifth Avenue
New York, NY 10003
Transfer Agent and Dividend Disbursing Agent
Boston Financial Data Services, Inc.
P.O. Box 8480
Boston, MA 02266
This report is submitted for the general information of the shareholders of The Alger Institutional Funds. It is not authorized for distribution to prospective investors unless accompanied by an effective Prospectus for the Trust, which contains information concerning the Trust's investment policies, fees and expenses as well as other pertinent information.

SAIF 043008


ITEM 2. CODE OF ETHICS.
Not applicable.
ITEM 3. AUDIT COMMITTEE FINANCIAL EXPERT.
Not applicable.
ITEM 4. PRINCIPAL ACCOUNTANT FEES AND SERVICES.
Not applicable.
ITEM 5. AUDIT COMMITTEE OF LISTED REGISTRANTS.
Not applicable.
ITEM 6. INVESTMENTS.
Not applicable.
ITEM 7. DISCLOSURE OF PROXY VOTING POLICIES AND PROCEDURES FOR CLOSED END MANAGEMENT INVESTMENT COMPANIES.
Not applicable.
ITEM 8. PORTFOLIO MANAGERS OF CLOSED-END MANAGEMENT INVESTMENT COMPANIES.
Not applicable.
ITEM 9. PURCHASES OF EQUITY SECURITIES BY CLOSED-END MANAGEMENT INVESTMENT COMPANY AND AFFILIATED PURCHASERS.
Not applicable.
ITEM 10. SUBMISSION OF MATTERS TO A VOTE OF SECURITY HOLDERS.
Not applicable.
ITEM 11. CONTROLS AND PROCEDURES.
(a) The registrant’s principal executive officer and principal financial officer have concluded that the registrant’s disclosure controls and procedures (as defined in Rule 30a-3(c) under the Investment Company Act of 1940, as amended) are effective based on their evaluation of the disclosure controls and procedures as of a date within 90 days of the filing date of this document.
(b) No changes in the registrant’s internal control over financial reporting occurred during the registrant’s second fiscal quarter of the period covered by this report that materially affected, or are reasonably likely to materially affect, the registrant’s internal control over financial reporting.
ITEM 12. EXHIBITS.
(a) (1) Not applicable
(a) (2) Certifications of principal executive officer and principal financial officer as required by rule 30a-2(a) under the Investment Company Act of 1940 are attached as Exhibit 99.CERT
(a) (3) Not applicable
(b) Certifications of principal executive officer and principal financial officer as required by rule 30a-2(b) under the Investment Company Act of 1940 are attached as Exhibit 99.906CERT
SIGNATURES
Pursuant to the requirements of the Securities Exchange Act of 1934 and the Investment Company Act of 1940, the registrant has duly caused this report to be signed on its behalf by the undersigned, thereunto duly authorized.
The Alger Institutional Funds
By: | /s/Dan C. Chung | | |
| | | |
| Dan C. Chung | | |
| | | |
| President | | |
| |
Date: June 17, 2008 | |
Pursuant to the requirements of the Securities Exchange Act of 1934 and the Investment Company Act of 1940, this report has been signed below by the following persons on behalf of the registrant and in the capacities and on the dates indicated.
By: | /s/Dan C. Chung | | |
| | | |
| Dan C. Chung | | |
| | | |
| President | | |
| |
Date: June 17, 2008 | |
By: | /s/Michael D. Martins | | |
| | | |
| Michael D. Martins | | |
| | | |
| Treasurer | | |
| |
Date: June 17, 2008 | |