| | OMB APPROVAL |
| | OMB Number: | 3235-0570 |
| | Expires: | January 31, 2014 |
| UNITED STATES | Estimated average burden hours per response. . . . . . . . . . . . . . . . .20.6 |
| SECURITIES AND EXCHANGE COMMISSION | |
| Washington, D.C. 20549 | |
| | | | |
FORM N-CSR
CERTIFIED SHAREHOLDER REPORT OF REGISTERED
MANAGEMENT INVESTMENT COMPANIES
Investment Company Act file number | 811-07986 |
|
The Alger Institutional Funds |
(Exact name of registrant as specified in charter) |
|
111 Fifth Avenue New York, New York | | 10003 |
(Address of principal executive offices) | | (Zip code) |
|
Mr. Hal Liebes Fred Alger Management, Inc. 111 Fifth Avenue New York, New York 10003 |
(Name and address of agent for service) |
|
Registrant’s telephone number, including area code: | 212-806-8800 | |
|
Date of fiscal year end: | October 31 | |
|
Date of reporting period: | April 30, 2011 | |
| | | | | | | | |
ITEM 1. REPORT(S) TO STOCKHOLDERS.
The Alger Institutional Funds
SEMI-ANNUAL REPORT
April 30, 2011
(Unaudited)
Table of Contents
THE ALGER INSTITUTIONAL FUNDS
Letter to Our Shareholders | 1 |
| |
Fund Highlights | 9 |
| |
Portfolio Summary | 13 |
| |
Schedules of Investments | 14 |
| |
Statements of Assets and Liabilities | 38 |
| |
Statements of Operations | 40 |
| |
Statements of Changes in Net Assets | 42 |
| |
Financial Highlights | 44 |
| |
Notes to Financial Statements | 52 |
| |
Additional Information | 67 |
Go Paperless With Alger Electronic Delivery Service
Alger is pleased to provide you with the ability to access regulatory materials online. When documents such as prospectuses and annual and semi-annual reports are available, we’ll send you an e-mail notification with a convenient link that will take you directly to the fund information on our website. To sign up for this free service, simply enroll at www.icsdelivery.com/alger.
Dear Shareholders, | | May 20, 2011 |
Indications that the economic recovery was gaining traction fueled a strong equity rally during the six-month period ended April 30, 2011, with the S&P 500 posting a 16.36% return. Market volatility was prevalent, however, as many investors feared that political turmoil in the Middle East and North Africa would disrupt global oil production and lead to higher energy prices. Concerns over the economic impact of the earthquake, tsunami and nuclear power plant accident in Japan also weighed heavily on investors. During the period, we maintained our focus on generating strong investment returns by conducting thoughtful, research-driven stock selection, while also assessing macro economic developments and the humanitarian impact of the Japan crisis.
Performance of the S&P 500 was virtually flat in November, but encouraging retail shopping trends and other upbeat news pushed the index into positive territory for December and January. Yet, by mid-February, investors’ fears over rising oil prices strengthened and equity markets started to perform in a manner that we have seen before—market returns became inversely correlated to the price of oil. Market volatility continued as investors focused on the implications of the Japan crisis, although a steady stream of encouraging economic data helped support the ongoing equity rally throughout the remainder of the six-month period.
Broadly speaking, market performance was consistent with our expectations. In our Winter 2010/2011 Market Commentary, we maintained that economic acceleration, strong corporate earnings, healthy balance sheets, job market improvements, and other developments would lead to further gains in U.S. equities this year. Yet, we cautioned that volatility would continue and markets would eventually struggle to maintain gains as weak real estate prices, high unemployment rates, and fears of potential global trade conflicts lingered.
The Recovery Strengthens
The six-month period was highlighted by a variety of encouraging developments. In January, for example, the Department of Labor announced that December unemployment dropped to 9.4%, down from 9.8% in November. The trend continued, with the rate dropping to 9.0% in January and to 8.9% in February—its lowest level since April of 2009. Also encouraging, applications for unemployment insurance declined by 22,000 to 391,000 for the week ended February 19, sparking optimism that job layoffs were slowing. In the corporate world, earnings growth continued with many of our holdings, like Apple, Inc., Oracle Corp., United Parcel Service, Inc., ConocoPhillips, Cliffs Natural Resources, Inc., and Aetna, Inc. contributing to optimism with earnings that outpaced analysts’ forecasts. In Detroit, Chrysler Group LLC’s January U.S. auto sales climbed 23% and General Motors Co. achieved its first annual profit since 2004.
The Conference Board, meanwhile, reported that its Consumer Confidence Index climbed to 70.4 in February, its highest level in three years. Also impressive was
1
Federal Reserve data showing annualized GDP growth of 2.8% for the fourth quarter, which while below analysts’ expectations, was still encouraging. The Federal Reserve also estimated that 2011 GDP would grow 3.4% to 3.9%, compared to a previous estimate of 3.0% to 3.6%.
Trouble Overseas
Investor optimism eventually waned and the S&P 500 tumbled approximately 6.41% during the three-and-a-half-week period ended March 18. While the end of earnings season may have naturally shifted investor attention from corporate fundamentals, turmoil in the Middle East and in North Africa clearly weighed heavily on markets by creating concerns over the possible economic implications of higher energy prices and the lack of decisive change in U.S. energy consumption and in U.S. energy policy. Rising prices for all types of commodities also continued to be a central issue. Indeed, escalating food prices and the economic challenges they created in many parts of the world were significant triggers to the anti-government protests in Tunisia that sparked rebellion across Bahrain, Yemen, Egypt, Algeria, and eventually Libya. In Egypt, where 40% of the nation lives in poverty, President Hosni Mubarak was forced to resign, which encouraged similar protests in other countries. Protestors in Libya eventually shut down an estimated 50% of the country’s daily oil production of 1.8 million barrels. Concerns over a tightening of oil supply drove prices of West Texas Intermediate Crude from $91.55 a barrel at the beginning of the year to $113.52 on April 29.
Investors became even more skittish in March when Japan was hit by a magnitude 8.9 earthquake—the strongest in the country’s history. The quake and resulting tsunami left a wake of despair, destroying entire towns and communities in a single day. Even more alarming, the earthquake damaged cooling systems at the Fukushima Daiichi nuclear power facility, and a series of explosions damaged the plant’s nuclear reactors, left fuel rods exposed, and released radiation into the atmosphere. U.S. officials urged expatriates to stay at least 50 miles from the facility as Japanese workers frantically struggled to stop the crisis from worsening. Investors, understandably, grew concerned: Japan is the world’s third-largest economy, so disruptions in manufacturing and consumption could have a considerable impact on global growth, at least in the near term. As we watch the disaster unfold, we feel confident that as the Japanese rebuild their nation, they will become stronger as a country, and they will eventually make many positive contributions to society and the global economy. In the meantime, we continue to admire their perseverance.
Investor Psychology and the Road Ahead
We still believe that equity markets have strong potential for generating attractive gains, although fears over oil prices and concerns over Japan’s impact on global economic growth will be significant challenges. Regarding oil, higher energy prices do not necessarily cause economic recession. Rather, it is the rate of change that is important. Oil price spikes must be drastic to cause an “oil shock” to the economy (we recognize that the fundamental strength of the economy at the time oil prices increase also matters, but we currently think the U.S. economy is stronger than most
2
believe). Generally speaking, past global recessions and cyclical bear markets triggered by oil have occurred only after prices increased by more than 100% in a short period, according to BCA Research, an independent economic research firm. We are not at that point yet. Disruptions in petroleum production, of course, could cause pain at the pump for American motorists, but in some ways, the U.S. is better prepared for price increases than in the past. Americans now spend just slightly more than 5% of their disposable income on energy, down from more than 8% in the 1980s, according to BCA. Oil’s role in America’s energy usage has also declined, accounting for only 37% of energy consumed in 2009, down from 44% in 1980, according to the U.S. Energy Information Administration. We also believe that the run up in oil prices that occurred from 2003 to 2008 succeeded in conditioning, at least partially, American consumers and businesses to potentially higher energy prices over the long term.
We believe that the development of a substantial oil shortage is unlikely. World oil production exceeds demand by an estimated three million to four million barrels per day, and many oil producing countries are capable of boosting output. Demand in the U.S. and developed economies has, in fact, been relatively flat, with emerging markets, especially China, driving recent oil demand growth. Additionally, consumption of oil in Japan, at least for the short term, has been crimped by the country’s crisis. An escalation of political turmoil in the Middle East and North Africa is still possible, but unless it affects oil production in Saudi Arabia, which is the world’s second-largest oil producer, it is unlikely to result in near-term supply shortages.
Regarding Japan, the impact of the country’s crisis on the global economy will be felt in coming months. Japan represents 6% to 8% of global GDP, and power outages have shut down many factories in the country. Supply chain disruptions, especially in the auto and technology industries, will occur as a result. These are short-term events that long-term investors should, and we think will, look beyond. Moreover, the massive rebuilding of Japan should eventually be a source of global economic stimulus. Finally, with an unreliable power supply in Japan, it is currently unknown if the country’s manufacturing capacity is significantly compromised even in the short term; however, much of the country’s industry infrastructure is state-of-the-art technology that minimizes damage from earthquakes, so it’s possible that manufacturing production will resume as soon as dependable electrical energy is restored.
We maintain that market resilience in the first quarter signals investors’ understanding of a vital fact: the U.S. economic recovery is strengthening. This has and will continue to support, we believe, a continuing rally in U.S. equities. Alger’s philosophy of “Investing in Positive Dynamic Change” has never been more appropriate than today. Change, whether from political events such as the uprisings in the Middle East or from the continuing impact of emerging markets across Asia and South America, has never been more evident. While change is almost always unsettling for some investors, we believe that it generates opportunities to buy attractively priced and well-run companies that have superior potential for growth. We continue to believe that research is the cornerstone of superior portfolio management, regardless of economic conditions and that our proven and disciplined process for identifying
3
companies experiencing Positive Dynamic Change will continue to produce superior long-term results for our clients.
Portfolio Matters
Alger Capital Appreciation Institutional Fund
The Alger Capital Appreciation Institutional Fund returned 19.35% for the fiscal six-month period ended April 30, 2011, compared to the Russell 3000 Growth Index return of 17.77%.
During the period, the largest portfolio weightings in the Alger Capital Appreciation Institutional Fund were in the Information Technology and Health Care sectors. The largest sector overweight for the period was in Financials and the largest sector underweight for the period was in Consumer Staples. Relative outperformance in the Information Technology and Energy sectors was the most important contributor to performance. Sectors that detracted from performance included Health Care and Consumer Staples.
Among the most important relative contributors were Patriot Coal Corp., Skyworks Solutions, Inc., Cliffs Natural Resources, Inc., Seagate Technology PLC, and Marvell Technology Group Ltd. Conversely, detracting from overall results on a relative basis were Brocade Communications Systems Inc., Oracle Corp., United Technologies Corp., Baxter International Inc., and International Business Machines Corp.
Alger Large Cap Growth Institutional Fund
The Alger Large Cap Growth Institutional Fund returned 14.38% for the fiscal six-month period ended April 30, 2011, compared with a return of 16.96% for the Russell 1000 Growth Index.
During the period, the largest portfolio weightings in the Alger Large Cap Growth Institutional Fund were in the Information Technology and Health Care sectors. The largest sector overweight for the period was in Energy and the largest sector underweight for the period was in Industrials. Relative outperformance in the Materials and Energy sectors was the most important contributor to performance. Sectors that detracted from performance included Health Care and Consumer Staples.
Among the most important relative contributors were Burlington Northern Santa Fe Railway, Boeing Co., Las Vegas Sands Corp., Lowe’s Cos., and Carnival Corp. Conversely, detracting from relative performance were United Technologies Corp., Oracle Corp., International Business Machines Corp., Medco Health Solutions, Inc., and Transocean Ltd.
4
Alger Mid Cap Growth Institutional Fund
The Alger Mid Cap Growth Institutional Fund returned 23.95% for the fiscal six-month period ended April 30, 2011, compared to the 22.62% return of the Russell Midcap Growth Index.
During the period, the largest portfolio weightings in the Alger Mid Cap Growth Institutional Fund were in the Information Technology and Consumer Discretionary sectors. The largest sector overweight for the period was in Information Technology and the largest sector underweight for the period was in Industrials. Relative outperformance in the Information Technology and Energy sectors was the most important contributor to performance. Sectors that detracted from the portfolio included Industrials and Consumer Staples.
Among the most important relative contributors were Cliffs Natural Resources, Inc., Skyworks Solutions, Inc., Human Genome Sciences, Inc., Atheros Communications Inc., and Mariner Energy Inc. Conversely, detracting from overall results on a relative basis were Brocade Communications Systems, Inc., Intuitive Surgical, Inc., SmartHeat, Inc., New York Times Co., and Select Medical Holdings Corporation.
Alger Small Cap Growth Institutional Fund
For the fiscal six-month period ended April 30, 2011, the Alger Small Cap Growth Institutional Fund returned 26.35%, compared to the Russell 2000 Growth Index, which returned 27.07%.
During the period, the largest portfolio weightings in the Alger Small Cap Growth Institutional Fund were in the Information Technology and Health Care sectors. The largest sector overweight for the period was in Industrials and the largest sector underweight for the period was in Information Technology. Relative outperformance in the Energy and Materials sectors was the most important contributor to performance. Sectors that detracted from the portfolio included Financials and Consumer Staples.
Among the most important relative contributors were Dollar Thrifty Automotive Group, Inc., Mariner Energy Inc., Dana Holding Corp., PAREXEL International Corp., and BE Aerospace, Inc. Conversely, detracting from overall results on a relative basis were Brocade Communications Systems, Inc., InterMune, Inc., PMI Group, Inc., Acorda Therapeutics, Inc., and Medivation, Inc.
As always, we strive to deliver consistently superior investment results for you, our shareholders, and we thank you for your business and your continued confidence in Alger.
Respectfully submitted,

Dan Chung, CFA
Chief Investment Officer
5
Investors cannot invest directly in an index. Index performance does not reflect the deduction for fees, expenses or taxes.
This report and the financial statements contained herein are submitted for the general information of shareholders of the Fund. This report is not authorized for distribution to prospective investors in the Funds unless proceeded or accompanied by an effective prospectus for the Funds. Fund returns represent the fiscal six-month period return of Class I shares. The performance data quoted represents past performance, which is not an indication or guarantee of future results. Standardized performance results can be found on the following pages. The investment return and principal value of an investment in a fund will fluctuate so that an investor’s shares, when redeemed, may be worth more or less than their original cost. Current performance may be lower or higher than the performance quoted. For performance data current to the most recent month-end, visit us at www.alger.com, or call us at (800) 992-3863.
The views and opinions of the Funds’ management in this report are as of the date of the Shareholders letter and are subject to change at any time subsequent to this date. There is no guarantee that any of the assumptions that formed the basis for the opinions stated herein are accurate or that they will materialize. Moreover, the information forming the basis for such assumptions is from sources believed to be reliable; however, there is no guarantee that such information is accurate. Any securities mentioned, whether owned in a fund or otherwise, are considered in the context of the construction of an overall portfolio of securities and therefore reference to them should not be construed as a recommendation or offer to purchase or sell any such security. Inclusion of such securities in a fund and transactions in such securities, if any, may be for a variety of reasons, including without limitation, in response to cash flows, inclusion in a benchmark, and risk control. The reference to a specific security should also be understood in such context and not viewed as a statement that the security is a significant holding in a portfolio. Please refer to the Schedules of Investments for each fund that is included in this report for a complete list of fund holdings as of April 30, 2011. Securities mentioned in the Shareholders Letter, if not found in the Schedule of Investments, may have been held by the Funds during the six-month fiscal period.
A Word About Risk
Growth stocks tend to be more volatile than other stocks as the price of growth stocks tends to be higher in relation to their companies’ earnings and may be more sensitive to market, political and economic developments. Investing in the stock market involves gains and losses and may not be suitable for all investors. Stocks of small and mid-sized companies are subject to greater risk than stocks of larger, more established companies owing to such factors as limited liquidity, inexperienced management, and limited financial resources. Funds that participate in leveraging, such as the Capital Appreciation Institutional Fund, are subject to the risk that borrowing money to leverage will exceed the returns for securities purchased or that the securities purchased may actually go down in value; thus, the Funds’ net asset
6
value can decrease more quickly than if the Funds had not borrowed. For a more detailed discussion of the risks associated with these Funds, please see the Funds’ Prospectus.
Before investing, carefully consider a Fund’s investment objective, risks, charges, and expenses.
For a prospectus or a summary prospectus containing this and other information about the Alger Institutional Funds call us at (800) 992-3863 or visit us at www.alger.com. Read it carefully before investing.
Fred Alger & Company, Incorporated, Distributor. Member NYSE Euronext, SIPC.
NOT FDIC INSURED. NOT BANK GUARANTEED. MAY LOSE VALUE.
Index Definitions:
· Russell 3000 Growth Index measures the performance of the broad growth segment of the U.S. equity universe. It includes those Russell 3000 Index companies with higher price-to-book ratios and higher forecasted growth values. The Russell 3000 Index measures the performance of the 3,000 largest U.S. companies based on the total market capitalization, which represents 98% of the U.S. Equity Market.
· Russell 1000 Growth Index is an unmanaged index designed to measure the performance of the largest 1,000 companies in the Russell 3000 Index with higher price-to-book ratios and higher forecasted growth values.
· Russell Midcap Growth Index measures the performance of the mid-cap growth segment of the U.S. equity universe. It includes those Russell Midcap Index companies with higher price-to-book ratios and higher forecasted growth values. The Russell Midcap Index measures the performance of the mid-cap segment of the U.S. equity universe
· Russell 2000 Growth Index measures the performance of the small-cap growth segment of the U.S. equity universe. It includes those Russell 2000 companies with higher price-to-book ratios and higher forecasted growth values. The Russell 2000 Index measures the performance of the small-cap segment of the U.S. equity universe.
· The Standard & Poor’s 500 Index is an index of large-company common stocks and is considered to be representative of the U.S. stock market.
· Investors cannot invest directly in any index.
7
FUND PERFORMANCE AS OF 3/31/11 (Unaudited)
AVERAGE ANNUAL TOTAL RETURNS
| | 1 YEAR | | 5 YEARS | | 10 YEARS | |
Alger Capital Appreciation Class I (Inception 11/8/93) | | 16.38 | % | 8.14 | % | 5.99 | % |
Alger Capital Appreciation Class R* (Inception 1/27/03) | | 15.75 | % | 7.58 | % | 5.45 | % |
| | | | | | | |
Alger Large Cap Growth Class I (Inception 11/8/93) | | 14.77 | % | 1.75 | % | 1.30 | % |
Alger Large Cap Growth Class R* (Inception 1/27/03) | | 14.02 | % | 1.19 | % | 0.77 | % |
| | | | | | | |
Alger Mid Cap Growth Class I (Inception 11/8/93) | | 23.17 | % | 2.14 | % | 5.70 | % |
Alger Mid Cap Growth Class R* (Inception 1/27/03) | | 22.49 | % | 1.62 | % | 5.17 | % |
| | | | | | | |
Alger Small Cap Growth Class I (Inception 11/8/93) | | 26.18 | % | 5.19 | % | 7.18 | % |
Alger Small Cap Growth Class R* (Inception 1/27/03) | | 25.55 | % | 4.68 | % | 6.68 | % |
The performance data quoted represents past performance, which is not an indication or a guarantee of future results. The Fund’s average annual total returns include changes in share price and reinvestment of dividends and capital gains.
* | Performance figures prior to 1/27/03, inception of Class R shares, are those of the Fund’s Class I Shares. The performance figures prior to 1/27/03 have been adjusted to reflect the higher operating expenses of Class R shares. |
8
ALGER CAPITAL APPRECIATION INSTITUTIONAL FUND
Fund Highlights Through April 30, 2011 (Unaudited)

The chart above illustrates the change in value of a hypothetical $10,000 investment made in the Alger Capital Appreciation Institutional Fund Class I shares, the Russell 3000 Growth Index (an unmanaged indices of common stocks) and the Russell 1000 Growth Index (a unmanaged index of common stocks) for the ten years ended April 30, 2011. Figures for the Alger Capital Appreciation Institutional Fund Class I shares, the Russell 3000 Growth Index and the Russell 1000 Growth Index include reinvestment of dividends. Performance for the Alger Capital Appreciation Institutional Fund Class R shares may vary from the results shown above due to differences in expenses the class bears.
PERFORMANCE COMPARISON AS OF 4/30/11
AVERAGE ANNUAL TOTAL RETURNS
| | 1 YEAR | | 5 YEARS | | 10 YEARS | | Since
11/8/1993 | |
Class I (Inception 11/8/93) | | 20.66 | % | 8.87 | % | 5.27 | % | 11.88 | % |
Class R* (Inception 1/27/03) | | 20.03 | % | 8.32 | % | 4.73 | % | 11.31 | % |
Russell 3000 Growth Index | | 21.62 | % | 5.05 | % | 2.38 | % | 7.44 | % |
Russell 1000 Growth Index | | 20.87 | % | 5.06 | % | 2.11 | % | 7.68 | % |
The performance data quoted represents past performance, which is not an indication or a guarantee of future results. The Fund’s average annual total returns include changes in share price and reinvestment of dividends and capital gains. The chart and table above do not reflect the deduction of taxes that a shareholder would have paid on Fund distributions or on the redemption of Fund shares. Investment return and principal will fluctuate and the Fund’s shares, when redeemed, may be worth more or less than their original cost. Current performance may be higher or lower than the performance quoted. For performance current to the most recent month end, visit us at www.alger.com or call us at (800) 992-3863.
* | Performance figures prior to 1/27/03, inception of Class R shares, are those of the Fund’s Class I Shares. The performance figures prior to 1/27/03 have been adjusted to reflect the higher operating expenses of Class R shares. |
9
ALGER LARGE CAP GROWTH INSTITUTIONAL FUND
Fund Highlights Through April 30, 2011 (Unaudited)
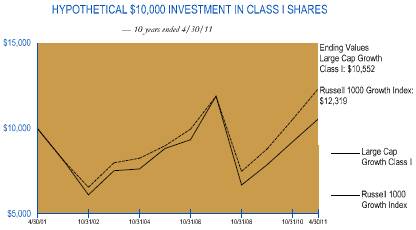
The chart above illustrates the change in value of a hypothetical $10,000 investment made in the Alger Large Cap Growth Institutional Fund Class I shares and the Russell 1000 Growth Index (an unmanaged index of common stocks) for the ten years ended April 30, 2011. The figures for the Alger Large Cap Growth Institutional Fund Class I shares and the Russell 1000 Growth Index include reinvestment of dividends. Performance for the Alger Large Cap Growth Institutional Fund Class R shares may vary from the results shown above due to differences in expenses the class bears.
PERFORMANCE COMPARISON AS OF 4/30/11
AVERAGE ANNUAL TOTAL RETURNS
| | 1 YEAR | | 5 YEARS | | 10 YEARS | | Since
11/8/1993 | |
Class I (Inception 11/8/93) | | 17.54 | % | 2.13 | % | 0.54 | % | 7.68 | % |
Class R* (Inception 1/27/03) | | 16.70 | % | 1.57 | % | 0.01 | % | 7.12 | % |
Russell 1000 Growth Index | | 20.87 | % | 5.06 | % | 2.11 | % | 7.68 | % |
The performance data quoted represents past performance, which is not an indication or a guarantee of future results. The Fund’s average annual total returns include changes in share price and reinvestment of dividends and capital gains. The chart and table above do not reflect the deduction of taxes that a shareholder would have paid on Fund distributions or on the redemption of Fund shares. Investment return and principal will fluctuate and the Fund’s shares, when redeemed, may be worth more or less than their original cost. Current performance may be higher or lower than the performance quoted. For performance current to the most recent month end, visit us at www.alger.com or call us at (800) 992-3863.
* | Performance figures prior to 1/27/03, inception of Class R shares, are those of the Fund’s Class I Shares. The performance figures prior to 1/27/03 have been adjusted to reflect the higher operating expenses of Class R shares. |
10
ALGER MID CAP GROWTH INSTITUTIONAL FUND
Fund Highlights Through April 30, 2011 (Unaudited)
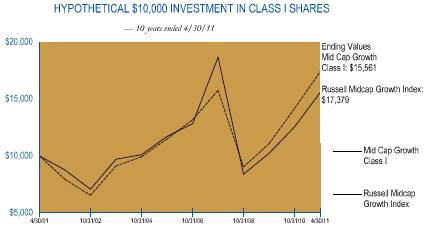
The chart above illustrates the change in value of a hypothetical $10,000 investment made in the Alger Mid Cap Growth Institutional Fund Class I shares and the Russell Midcap Growth Index (an unmanaged index of common stocks) for the ten years ended April 30, 2011. Figures for the Alger Mid Cap Growth Institutional Fund Class I shares and the Russell Midcap Growth Index include reinvestment of dividends. Performance for the Alger Mid Cap Growth Institutional Fund Class R shares may vary from the results shown above due to differences in expenses the class bears.
PERFORMANCE COMPARISON AS OF 4/30/11
AVERAGE ANNUAL TOTAL RETURNS
| | 1 YEAR | | 5 YEARS | | 10 YEARS | | Since
11/8/1993 | |
Class I (Inception 11/8/93) | | 25.77 | % | 2.96 | % | 4.52 | % | 12.89 | % |
Class R* (Inception 1/27/03) | | 25.08 | % | 2.43 | % | 4.00 | % | 12.33 | % |
Russell Midcap Growth Index | | 27.40 | % | 5.59 | % | 5.68 | % | 9.09 | % |
The performance data quoted represents past performance, which is not an indication or a guarantee of future results. The Fund’s average annual total returns include changes in share price and reinvestment of dividends and capital gains. The chart and table above do not reflect the deduction of taxes that a shareholder would have paid on Fund distributions or on the redemption of Fund shares. Investment return and principal will fluctuate and the Fund’s shares, when redeemed, may be worth more or less than their original cost. Current performance may be higher or lower than the performance quoted. For performance current to the most recent month end, visit us at www.alger.com or call us at (800) 992-3863.
* | Performance figures prior to 1/27/03, inception of Class R shares, are those of the Fund’s Class I Shares. The performance figures prior to 1/27/03 have been adjusted to reflect the higher operating expenses of Class R shares. |
11
ALGER SMALL CAP GROWTH INSTITUTIONAL FUND
Fund Highlights Through April 30, 2011 (Unaudited)
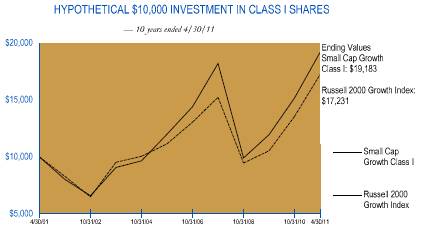
The chart above illustrates the change in value of a hypothetical $10,000 investment made in the Alger Small Cap Growth Institutional Fund Class I shares and the Russell 2000 Growth Index (an unmanaged index of common stocks) for the ten years ended April 30, 2011. The figures for the Alger Small Cap Growth Institutional Fund Class I shares and the Russell 2000 Growth Index include reinvestment of dividends. Performance for the Alger Small Cap Growth Institutional Fund Class R shares may vary from the results shown above due to differences in expenses the class bears.
PERFORMANCE COMPARISON AS OF 4/30/11
AVERAGE ANNUAL TOTAL RETURNS
| | 1 YEAR | | 5 YEARS | | 10 YEARS | | Since
11/8/1993 | |
Class I (Inception 11/8/93) | | 27.10 | % | 5.88 | % | 6.73 | % | 9.88 | % |
Class R* (Inception 1/27/03) | | 26.45 | % | 5.37 | % | 6.23 | % | 9.35 | % |
Russell 2000 Growth Index | | 30.29 | % | 5.14 | % | 5.59 | % | 6.47 | % |
The performance data quoted represents past performance, which is not an indication or a guarantee of future results. The Fund’s average annual total returns include changes in share price and reinvestment of dividends and capital gains. The chart and table above do not reflect the deduction of taxes that a shareholder would have paid on Fund distributions or on the redemption of Fund shares. Investment return and principal will fluctuate and the Fund’s shares, when redeemed, may be worth more or less than their original cost. Current performance may be higher or lower than the performance quoted. For performance current to the most recent month end, visit us at www.alger.com or call us at (800) 992-3863.
* | Performance figures prior to 1/27/03, inception of Class R shares, are those of the Fund’s Class I Shares. The performance figures prior to 1/27/03 have been adjusted to reflect the higher operating expenses of Class R shares. |
12
PORTFOLIO SUMMARY*
April 30, 2011 (Unaudited)
SECTORS | | Alger Capital
Appreciation
Institutional Fund | | Alger Large Cap
Growth
Institutional Fund | | Alger Mid Cap
Growth
Institutional Fund | | Alger Small Cap
Growth
Institutional Fund | |
Consumer Discretionary | | 12.8 | % | 13.9 | % | 13.2 | % | 18.2 | % |
Consumer Staples | | 4.1 | | 7.5 | | 1.7 | | 2.2 | |
Energy | | 11.5 | | 11.0 | | 9.0 | | 5.8 | |
Financials | | 6.7 | | 5.4 | | 7.2 | | 4.0 | |
Health Care | | 10.7 | | 9.7 | | 13.0 | | 17.6 | |
Industrials | | 15.3 | | 11.1 | | 20.3 | | 15.7 | |
Information Technology | | 29.0 | | 27.8 | | 28.1 | | 26.6 | |
Materials | | 4.8 | | 4.7 | | 8.3 | | 5.2 | |
Telecommunication Services | | 0.5 | | 1.0 | | 0.0 | | 0.0 | |
Utilities | | 0.0 | | 0.0 | | 0.0 | | 1.1 | |
Short-Term Investments and Net Other Assets | | 4.6 | | 7.9 | | (0.8 | ) | 3.6 | |
| | 100.0 | % | 100.0 | % | 100.0 | % | 100.0 | % |
* Based on net assets for each Fund.
13
THE ALGER INSTITUTIONAL FUNDS |
ALGER CAPITAL APPRECIATION INSTITUTIONAL FUND
Schedule of Investments‡ (Unaudited) April 30, 2011
| | SHARES | | VALUE | |
COMMON STOCKS—95.1% | | | | | |
ADVERTISING—1.7% | | | | | |
Focus Media Holding Ltd.#* | | 603,300 | | $ | 21,205,995 | |
| | | | | |
AEROSPACE & DEFENSE—0.8% | | | | | |
Goodrich Corp. | | 118,700 | | 10,489,519 | |
| | | | | |
AIR FREIGHT & LOGISTICS—2.7% | | | | | |
FedEx Corp. | | 114,600 | | 10,963,782 | |
United Parcel Service, Inc., Cl. B | | 309,200 | | 23,180,724 | |
| | | | 34,144,506 | |
AIRLINES—0.7% | | | | | |
United Continental Holdings, Inc.* | | 376,000 | | 8,580,320 | |
| | | | | |
APPAREL RETAIL—0.3% | | | | | |
Abercrombie & Fitch Co., Cl. A | | 61,300 | | 4,340,040 | |
| | | | | |
APPLICATION SOFTWARE—1.5% | | | | | |
Informatica Corp. * | | 153,200 | | 8,580,732 | |
Nice Systems Ltd. #* | | 153,000 | | 5,833,890 | |
Salesforce.com, Inc. * | | 35,900 | | 4,975,740 | |
| | | | 19,390,362 | |
ASSET MANAGEMENT & CUSTODY BANKS—0.9% | | | | | |
BlackRock, Inc. | | 56,500 | | 11,070,610 | |
| | | | | |
AUTO PARTS & EQUIPMENT—0.4% | | | | | |
Lear Corp. | | 111,800 | | 5,717,452 | |
| | | | | |
AUTOMOBILE MANUFACTURERS—1.4% | | | | | |
Bayerische Motoren Werke AG# | | 549,800 | | 17,236,230 | |
| | | | | |
BIOTECHNOLOGY—0.8% | | | | | |
Human Genome Sciences, Inc.* | | 326,100 | | 9,610,167 | |
| | | | | |
BROADCASTING & CABLE TV—0.3% | | | | | |
CBS Corp., Cl. B | | 149,900 | | 3,780,478 | |
| | | | | |
COAL & CONSUMABLE FUELS—1.0% | | | | | |
Peabody Energy Corp. | | 181,400 | | 12,121,148 | |
| | | | | |
COMMODITY CHEMICALS—0.6% | | | | | |
Celanese Corp. | | 153,100 | | 7,642,752 | |
| | | | | |
COMMUNICATIONS EQUIPMENT—3.1% | | | | | |
Ciena Corp. * | | 180,500 | | 5,097,320 | |
Cisco Systems, Inc. | | 167,400 | | 2,939,544 | |
Corning, Inc. | | 248,700 | | 5,207,778 | |
Qualcomm, Inc. | | 381,400 | | 21,678,776 | |
Riverbed Technology, Inc. * | | 113,300 | | 3,981,362 | |
| | | | 38,904,780 | |
COMPUTER HARDWARE—6.5% | | | | | |
Apple, Inc. * | | 187,900 | | 65,432,416 | |
Hewlett-Packard Co. | | 442,700 | | 17,871,799 | |
| | | | 83,304,215 | |
COMPUTER STORAGE & PERIPHERALS—2.0% | | | | | |
EMC Corp. * | | 565,900 | | 16,037,606 | |
SanDisk Corp. * | | 103,200 | | 5,071,248 | |
| | | | | | |
14
| | SHARES | | VALUE | |
COMMON STOCKS—(CONT.) | | | | | |
COMPUTER STORAGE & PERIPHERALS—(CONT.) | | | | | |
Seagate Technology PLC | | 233,400 | | $ | 4,112,508 | |
| | | | 25,221,362 | |
CONSTRUCTION & ENGINEERING—0.1% | | | | | |
Chicago Bridge & Iron Co., NV# | | 31,800 | | 1,289,172 | |
| | | | | |
CONSTRUCTION & FARM MACHINERY & HEAVY TRUCKS—3.8% | | | | | |
Caterpillar, Inc. | | 124,500 | | 14,368,545 | |
Cummins, Inc. | | 134,000 | | 16,104,120 | |
Deere & Co. | | 83,100 | | 8,102,250 | |
WABCO Holdings, Inc. * | | 112,400 | | 8,300,740 | |
| | | | 46,875,655 | |
DATA PROCESSING & OUTSOURCED SERVICES—0.9% | | | | | |
Mastercard, Inc. | | 40,400 | | 11,145,956 | |
| | | | | |
DEPARTMENT STORES—0.7% | | | | | |
Kohl’s Corp. | | 162,600 | | 8,570,646 | |
| | | | | |
DIVERSIFIED BANKS—0.2% | | | | | |
Itau Unibanco Holding SA# | | 124,500 | | 2,956,875 | |
| | | | | |
DIVERSIFIED METALS & MINING—2.5% | | | | | |
Cliffs Natural Resources, Inc. | | 134,800 | | 12,633,456 | |
Freeport-McMoRan Copper & Gold, Inc. | | 132,700 | | 7,302,481 | |
Molycorp, Inc. * | | 146,300 | | 10,723,790 | |
| | | | 30,659,727 | |
DRUG RETAIL—0.8% | | | | | |
CVS Caremark Corp. | | 292,200 | | 10,589,328 | |
| | | | | |
ENVIRONMENTAL & FACILITIES SERVICES—0.6% | | | | | |
Republic Services, Inc. | | 255,900 | | 8,091,558 | |
| | | | | |
FERTILIZERS & AGRICULTURAL CHEMICALS—0.7% | | | | | |
Mosaic Co., /The | | 125,100 | | 9,364,986 | |
| | | | | |
FOOTWEAR—0.2% | | | | | |
NIKE Inc., Cl. B | | 37,800 | | 3,111,696 | |
| | | | | |
GOLD—0.4% | | | | | |
Yamana Gold, Inc. | | 446,000 | | 5,668,660 | |
| | | | | |
HEALTH CARE DISTRIBUTORS—0.5% | | | | | |
McKesson Corp. | | 74,600 | | 6,192,546 | |
| | | | | |
HEALTH CARE EQUIPMENT—1.6% | | | | | |
Covidien PLC | | 309,740 | | 17,249,421 | |
Insulet Corp. * | | 133,500 | | 2,868,915 | |
| | | | 20,118,336 | |
HEALTH CARE FACILITIES—0.7% | | | | | |
Universal Health Services, Inc., Cl. B | | 173,700 | | 9,515,286 | |
| | | | | |
HEALTH CARE SERVICES—0.8% | | | | | |
Express Scripts, Inc.* | | 184,600 | | 10,474,204 | |
| | | | | | |
15
| | SHARES | | VALUE | |
COMMON STOCKS—(CONT.) | | | | | |
HOME IMPROVEMENT RETAIL—1.6% | | | | | |
Lowe’s Companies, Inc. | | 772,600 | | $ | 20,280,750 | |
| | | | | | |
HOTELS RESORTS & CRUISE LINES—0.5% | | | | | |
Wyndham Worldwide Corporation | | 192,800 | | 6,672,808 | |
| | | | | |
HOUSEHOLD APPLIANCES—0.4% | | | | | |
Stanley Black & Decker, Inc. | | 77,700 | | 5,644,905 | |
| | | | | |
HOUSEHOLD PRODUCTS—1.1% | | | | | |
Procter & Gamble Co., /The | | 203,000 | | 13,174,700 | |
| | | | | |
HUMAN RESOURCE & EMPLOYMENT SERVICES—0.4% | | | | | |
Towers Watson & Co. | | 91,170 | | 5,229,511 | |
| | | | | |
HYPERMARKETS & SUPER CENTERS—0.5% | | | | | |
Wal-Mart Stores, Inc. | | 114,410 | | 6,290,262 | |
| | | | | |
INDUSTRIAL CONGLOMERATES—1.4% | | | | | |
3M Co. | | 65,400 | | 6,357,534 | |
Tyco International Ltd. | | 246,255 | | 12,002,469 | |
| | | | 18,360,003 | |
INDUSTRIAL MACHINERY—1.9% | | | | | |
Flowserve Corp. | | 61,900 | | 7,837,778 | |
Ingersoll-Rand PLC | | 333,800 | | 16,856,900 | |
| | | | 24,694,678 | |
INTEGRATED OIL & GAS—4.3% | | | | | |
Chevron Corp. | | 60,600 | | 6,632,064 | |
ConocoPhillips | | 309,800 | | 24,452,514 | |
Royal Dutch Shell PLC # | | 322,200 | | 24,964,056 | |
| | | | 56,048,634 | |
INTEGRATED TELECOMMUNICATION SERVICES—0.2% | | | | | |
Verizon Communications, Inc. | | 78,800 | | 2,977,064 | |
| | | | | |
INTERNET RETAIL—1.9% | | | | | |
Amazon.com, Inc. * | | 77,300 | | 15,189,450 | |
Expedia, Inc. | | 304,225 | | 7,614,752 | |
| | | | 22,804,202 | |
INTERNET SOFTWARE & SERVICES—5.6% | | | | | |
eBay, Inc. * | | 235,300 | | 8,094,320 | |
Google, Inc., Cl. A * | | 43,710 | | 23,782,610 | |
GSI Commerce, Inc. * | | 383,750 | | 11,232,363 | |
IAC/InterActiveCorp. * | | 224,300 | | 8,099,473 | |
Sina Corp. * | | 29,930 | | 4,033,068 | |
VistaPrint Ltd. * | | 171,200 | | 9,313,280 | |
Yahoo! Inc. * | | 363,800 | | 6,457,450 | |
| | | | 71,012,564 | |
INVESTMENT BANKING & BROKERAGE—1.1% | | | | | |
Goldman Sachs Group, Inc., /The | | 48,500 | | 7,323,985 | |
Lazard Ltd., Cl. A | | 120,800 | | 4,952,800 | |
LPL Investment Holdings, Inc. * | | 46,400 | | 1,701,952 | |
| | | | 13,978,737 | |
16
| | SHARES | | VALUE | |
COMMON STOCKS—(CONT.) | | | | | |
IT CONSULTING & OTHER SERVICES—2.0% | | | | | |
International Business Machines Corp. | | 146,800 | | $ | 25,041,144 | |
| | | | | | |
LEISURE PRODUCTS—1.6% | | | | | |
Hanesbrands, Inc. * | | 203,600 | | 6,619,036 | |
Phillips-Van Heusen Corp. | | 197,600 | | 13,913,016 | |
Warnaco Group Inc., /The * | | 4,800 | | 308,928 | |
| | | | 20,840,980 | |
LIFE & HEALTH INSURANCE—1.0% | | | | | |
MetLife, Inc. | | 266,600 | | 12,474,214 | |
| | | | | |
LIFE SCIENCES TOOLS & SERVICES—1.8% | | | | | |
Thermo Fisher Scientific, Inc.* | | 390,400 | | 23,420,096 | |
| | | | | |
MANAGED HEALTH CARE—1.4% | | | | | |
Aetna, Inc. | | 429,300 | | 17,764,434 | |
| | | | | |
MOVIES & ENTERTAINMENT—0.9% | | | | | |
Liberty Media Corp., Capital, Cl. A * | | 62,600 | | 5,150,102 | |
Walt Disney Co., /The | | 138,300 | | 5,960,730 | |
| | | | 11,110,832 | |
OIL & GAS EQUIPMENT & SERVICES—3.1% | | | | | |
Baker Hughes, Inc. | | 371,800 | | 28,781,038 | |
Halliburton Company | | 127,300 | | 6,426,104 | |
National Oilwell Varco, Inc. | | 58,300 | | 4,471,027 | |
| | | | 39,678,169 | |
OIL & GAS EXPLORATION & PRODUCTION—2.5% | | | | | |
Devon Energy Corp. | | 81,800 | | 7,443,800 | |
Newfield Exploration Co. * | | 89,000 | | 6,301,200 | |
Nexen, Inc. | | 506,100 | | 13,376,223 | |
Petrohawk Energy Corp. * | | 150,500 | | 4,065,005 | |
| | | | 31,186,228 | |
OIL, GAS & CONSUMABLE FUELS—0.6% | | | | | |
Williams Cos., Inc., /The | | 231,900 | | 7,692,123 | |
| | | | | |
OTHER DIVERSIFIED FINANCIAL SERVICES—2.9% | | | | | |
BM&F Bovespa SA | | 1,437,400 | | 10,785,066 | |
Citigroup, Inc. * | | 1,743,800 | | 8,004,042 | |
JPMorgan Chase & Co. | | 407,400 | | 18,589,662 | |
| | | | 37,378,770 | |
PHARMACEUTICALS—2.8% | | | | | |
Allergan, Inc. | | 153,900 | | 12,244,284 | |
Auxilium Pharmaceuticals, Inc. * | | 246,000 | | 5,992,560 | |
Johnson & Johnson | | 128,400 | | 8,438,448 | |
Pfizer, Inc. | | 382,200 | | 8,010,912 | |
| | | | 34,686,204 | |
PRECIOUS METALS & MINERALS—0.6% | | | | | |
Stillwater Mining Co.* | | 343,300 | | 7,830,673 | |
| | | | | |
RAILROADS—1.3% | | | | | |
CSX Corp. | | 210,100 | | 16,532,769 | |
17
| | SHARES | | VALUE | |
COMMON STOCKS—(CONT.) | | | | | |
RESEARCH & CONSULTING SERVICES—0.3% | | | | | |
Verisk Analytic, Inc., Cl. A* | | 99,500 | | $ | 3,273,550 | |
| | | | | | |
RESTAURANTS—0.9% | | | | | |
McDonald’s Corp. | | 147,600 | | 11,558,556 | |
| | | | | |
SEMICONDUCTOR EQUIPMENT—0.6% | | | | | |
Lam Research Corp.* | | 167,299 | | 8,082,215 | |
| | | | | |
SEMICONDUCTORS—3.9% | | | | | |
Altera Corp. | | 161,600 | | 7,869,920 | |
Avago Technologies Ltd. | | 280,600 | | 9,388,876 | |
Broadcom Corp., Cl. A * | | 94,600 | | 3,328,028 | |
NXP Semiconductor NV * | | 212,800 | | 7,107,520 | |
ON Semiconductor Corp. * | | 165,400 | | 1,738,354 | |
Skyworks Solutions, Inc. * | | 348,000 | | 10,948,080 | |
Texas Instruments, Inc. | | 276,600 | | 9,827,598 | |
| | | | 50,208,376 | |
SOFT DRINKS—1.0% | | | | | |
PepsiCo, Inc. | | 187,000 | | 12,882,430 | |
| | | | | |
SPECIALIZED FINANCE—0.6% | | | | | |
CME Group, Inc. | | 25,700 | | 7,601,289 | |
| | | | | |
SYSTEMS SOFTWARE—2.9% | | | | | |
Oracle Corp. | | 1,028,900 | | 37,091,845 | |
| | | | | |
TOBACCO—0.7% | | | | | |
Philip Morris International, Inc. | | 127,050 | | 8,822,352 | |
| | | | | |
TRUCKING—1.3% | | | | | |
Hertz Global Holdings, Inc.* | | 968,900 | | 16,674,769 | |
| | | | | |
WIRELESS TELECOMMUNICATION SERVICES—0.3% | | | | | |
SBA Communications Corp.* | | 101,300 | | 3,913,219 | |
| | | | | |
TOTAL COMMON STOCKS | | | | | |
(Cost $1,052,570,830) | | | | 1,210,298,622 | |
| | | | | |
CONVERTIBLE PREFERRED STOCK—0.3% | | | | | |
PHARMACEUTICALS—0.3% | | | | | |
Merrimack Pharmaceuticals, Inc., Series G, %, *,(L3),(a) | | | | | |
(Cost $3,475,570) | | 496,510 | | 3,475,570 | |
| | | | | |
Total Investments | | | | | |
(Cost $1,056,046,400)(b) | | 95.4 | % | 1,213,774,192 | |
Other Assets in Excess of Liabilities | | 4.6 | | 58,851,655 | |
| | | | | |
NET ASSETS | | 100.0 | % | $ | 1,272,625,847 | |
‡ | Securities classified as Level 1 for ASC 820 disclosure purposes based on valuation inputs unless otherwise noted. |
* | Non-income producing security. |
# | American Depository Receipts. |
18
(a) | Restricted Security - Investment in security not registered under the Securities Act of 1933. The investment is deemed to be illiquid and may be sold only to qualified institutional buyers. Security was acquired on August 25, 2010 for a cost of $3,475,570 and represents 0.3% of the net assets of the Fund. |
(b) | At April 30, 2011, the net unrealized appreciation on investments, based on cost for federal income tax purposes of $1,061,339,610 amounted to $152,434,582 which consisted of aggregate gross unrealized appreciation of $171,372,818 and aggregate gross unrealized depreciation of $18,938,236. |
(L3) | Security classified as Level 3 for ASC 820 disclosure purposes based on valuation inputs. |
See Notes to Financial Statements.
19
THE ALGER INSTITUTIONAL FUNDS | ALGER LARGE CAP GROWTH INSTITUTIONAL FUND
Schedule of Investments‡ (Unaudited) April 30, 2011
| | SHARES | | VALUE | |
COMMON STOCKS—92.1% | | | | | |
AEROSPACE & DEFENSE—1.9% | | | | | |
Boeing Co., /The | | 3,100 | | $ | 247,318 | |
General Dynamics Corp. | | 3,100 | | 225,742 | |
| | | | 473,060 | |
AIR FREIGHT & LOGISTICS—2.1% | | | | | |
FedEx Corp. | | 2,550 | | 243,958 | |
United Parcel Service, Inc., Cl. B | | 3,250 | | 243,652 | |
| | | | 487,610 | |
AIRLINES—0.5% | | | | | |
Delta Air Lines, Inc.* | | 12,550 | | 130,269 | |
| | | | | |
APPLICATION SOFTWARE—1.6% | | | | | |
Adobe Systems, Inc. * | | 5,400 | | 181,170 | |
Salesforce.com, Inc. * | | 1,500 | | 207,900 | |
| | | | 389,070 | |
ASSET MANAGEMENT & CUSTODY BANKS—0.9% | | | | | |
BlackRock, Inc. | | 1,150 | | 225,331 | |
| | | | | |
AUTOMOBILE MANUFACTURERS—0.7% | | | | | |
General Motors Co.* | | 5,400 | | 173,286 | |
| | | | | |
BIOTECHNOLOGY—1.4% | | | | | |
Celgene Corp. * | | 2,100 | | 123,648 | |
Gilead Sciences, Inc. * | | 5,650 | | 219,446 | |
| | | | 343,094 | |
BREWERS—0.5% | | | | | |
Anheuser-Busch InBev NV# | | 1,950 | | 124,742 | |
| | | | | |
BROADCASTING & CABLE TV—0.6% | | | | | |
Discovery Communications, Inc., Series C* | | 3,650 | | 144,029 | |
| | | | | |
CABLE & SATELLITE—0.8% | | | | | |
Comcast Corporation, Cl. A | | 7,700 | | 202,048 | |
| | | | | |
CASINOS & GAMING—0.4% | | | | | |
Las Vegas Sands Corp.* | | 2,350 | | 110,474 | |
| | | | | |
COAL & CONSUMABLE FUELS—0.9% | | | | | |
Peabody Energy Corp. | | 3,500 | | 233,870 | |
| | | | | |
COMMUNICATIONS EQUIPMENT—4.3% | | | | | |
Cisco Systems, Inc. | | 13,400 | | 235,304 | |
Corning, Inc. | | 12,600 | | 263,844 | |
Juniper Networks, Inc. * | | 2,200 | | 84,326 | |
Qualcomm, Inc. | | 8,250 | | 468,930 | |
| | | | 1,052,404 | |
COMPUTER HARDWARE—5.7% | | | | | |
Apple, Inc. * | | 3,350 | | 1,166,570 | |
Hewlett-Packard Co. | | 6,150 | | 248,275 | |
| | | | 1,414,845 | |
COMPUTER STORAGE & PERIPHERALS—1.3% | | | | | |
EMC Corp.* | | 11,350 | | 321,659 | |
| | | | | | |
20
| | SHARES | | VALUE | |
COMMON STOCKS—(CONT.) | | | | | |
CONSTRUCTION & FARM MACHINERY & HEAVY TRUCKS—1.7% | | | | | |
Caterpillar, Inc. | | 2,000 | | $ | 230,820 | |
Cummins, Inc. | | 1,600 | | 192,288 | |
| | | | 423,108 | |
CONSUMER FINANCE—0.6% | | | | | |
American Express Co. | | 2,800 | | 137,424 | |
| | | | | |
DATA PROCESSING & OUTSOURCED SERVICES—0.8% | | | | | |
Mastercard, Inc. | | 750 | | 206,918 | |
| | | | | |
DEPARTMENT STORES—0.8% | | | | | |
Kohl’s Corp. | | 3,950 | | 208,205 | |
| | | | | |
DIVERSIFIED CHEMICALS—0.8% | | | | | |
EI Du Pont de Nemours & Co. | | 3,300 | | 187,407 | |
| | | | | |
DIVERSIFIED METALS & MINING—1.7% | | | | | |
Cliffs Natural Resources, Inc. | | 2,500 | | 234,300 | |
Freeport-McMoRan Copper & Gold, Inc. | | 3,400 | | 187,102 | |
| | | | 421,402 | |
DRUG RETAIL—1.0% | | | | | |
CVS Caremark Corp. | | 6,650 | | 240,996 | |
| | | | | |
ELECTRICAL COMPONENTS & EQUIPMENT—0.5% | | | | | |
Emerson Electric Co.* | | 2,000 | | 121,520 | |
| | | | | |
ENVIRONMENTAL & FACILITIES SERVICES—0.8% | | | | | |
Republic Services, Inc. | | 6,550 | | 207,111 | |
| | | | | |
FERTILIZERS & AGRICULTURAL CHEMICALS—0.6% | | | | | |
Mosaic Co., /The | | 2,100 | | 157,206 | |
| | | | | |
FOOTWEAR—0.9% | | | | | |
NIKE Inc., Cl. B | | 2,600 | | 214,032 | |
| | | | | |
GENERAL MERCHANDISE STORES—1.3% | | | | | |
Dollar General Corp. * | | 3,500 | | 114,065 | |
Target Corp. | | 4,150 | | 203,765 | |
| | | | 317,830 | |
GOLD—0.9% | | | | | |
Goldcorp, Inc. | | 3,800 | | 212,154 | |
| | | | | |
HEALTH CARE EQUIPMENT—1.0% | | | | | |
Covidien PLC | | 4,250 | | 236,683 | |
| | | | | |
HEALTH CARE SERVICES—1.1% | | | | | |
Medco Health Solutions, Inc. * | | 3,200 | | 189,856 | |
Quest Diagnostics, Inc. | | 1,300 | | 73,294 | |
| | | | 263,150 | |
HOME IMPROVEMENT RETAIL—0.9% | | | | | |
Lowe’s Companies, Inc. | | 8,900 | | 233,625 | |
| | | | | |
HOTELS RESORTS & CRUISE LINES—1.5% | | | | | |
Carnival Corp. | | 5,050 | | 192,254 | |
Marriott International, Inc., Cl. A | | 5,050 | | 178,265 | |
| | | | 370,519 | |
| | | | | | |
21
| | SHARES | | VALUE | |
COMMON STOCKS—(CONT.) | | | | | |
HOUSEHOLD APPLIANCES—0.7% | | | | | |
Stanley Black & Decker, Inc. | | 2,450 | | $ | 177,993 | |
| | | | | | |
HOUSEHOLD PRODUCTS—1.2% | | | | | |
Procter & Gamble Co., /The | | 4,600 | | 298,540 | |
| | | | | |
HYPERMARKETS & SUPER CENTERS—1.2% | | | | | |
Wal-Mart Stores, Inc. | | 5,600 | | 307,888 | |
| | | | | |
INDUSTRIAL CONGLOMERATES—1.8% | | | | | |
3M Co. | | 2,200 | | 213,862 | |
Tyco International Ltd. | | 4,550 | | 221,767 | |
| | | | 435,629 | |
INDUSTRIAL MACHINERY—0.8% | | | | | |
Illinois Tool Works, Inc. | | 3,550 | | 207,356 | |
| | | | | |
INTEGRATED OIL & GAS—5.4% | | | | | |
Chevron Corp. | | 4,850 | | 530,784 | |
Exxon Mobil Corp. | | 5,550 | | 488,400 | |
Royal Dutch Shell PLC # | | 3,750 | | 290,550 | |
| | | | 1,309,734 | |
INTERNET RETAIL—1.8% | | | | | |
Amazon.com, Inc. * | | 1,550 | | 304,574 | |
Expedia, Inc. | | 5,300 | | 132,659 | |
| | | | 437,233 | |
INTERNET SOFTWARE & SERVICES—4.4% | | | | | |
eBay, Inc. * | | 5,750 | | 197,800 | |
Google, Inc., Cl. A * | | 1,302 | | 708,417 | |
Yahoo! Inc. * | | 9,850 | | 174,838 | |
| | | | 1,081,055 | |
INVESTMENT BANKING & BROKERAGE—1.0% | | | | | |
Charles Schwab Corp., /The | | 6,350 | | 116,269 | |
Goldman Sachs Group, Inc., /The | | 850 | | 128,358 | |
| | | | 244,627 | |
IT CONSULTING & OTHER SERVICES—2.8% | | | | | |
Cognizant Technology Solutions Corp., Cl. A * | | 1,450 | | 120,205 | |
International Business Machines Corp. | | 3,400 | | 579,972 | |
| | | | 700,177 | |
LIFE SCIENCES TOOLS & SERVICES—1.1% | | | | | |
Thermo Fisher Scientific, Inc.* | | 4,350 | | 260,957 | |
| | | | | |
MANAGED HEALTH CARE—1.1% | | | | | |
Aetna, Inc. | | 6,650 | | 275,177 | |
| | | | | |
MOVIES & ENTERTAINMENT—0.7% | | | | | |
Walt Disney Co., /The | | 4,150 | | 178,865 | |
| | | | | |
OIL & GAS EQUIPMENT & SERVICES—2.2% | | | | | |
Baker Hughes, Inc. | | 2,800 | | 216,748 | |
Schlumberger Ltd. | | 3,550 | | 318,613 | |
| | | | 535,361 | |
OIL & GAS EXPLORATION & PRODUCTION—2.5% | | | | | |
Devon Energy Corp. | | 4,150 | | 377,650 | |
22
| | SHARES | | VALUE | |
COMMON STOCKS—(CONT.) | | | | | |
OIL & GAS EXPLORATION & PRODUCTION—(CONT.) | | | | | |
Nexen, Inc. | | 9,500 | | $ | 251,085 | |
| | | | 628,735 | |
OTHER DIVERSIFIED FINANCIAL SERVICES—2.4% | | | | | |
BM&F Bovespa SA | | 19,700 | | 147,813 | |
Citigroup, Inc. * | | 38,500 | | 176,715 | |
JPMorgan Chase & Co. | | 5,700 | | 260,090 | |
| | | | 584,618 | |
PACKAGED FOODS & MEATS—0.7% | | | | | |
Kraft Foods, Inc., Cl. A | | 5,450 | | 183,011 | |
| | | | | |
PAPER PRODUCTS—0.7% | | | | | |
International Paper Co. | | 6,000 | | 185,280 | |
| | | | | |
PHARMACEUTICALS—4.0% | | | | | |
Allergan, Inc. | | 2,150 | | 171,054 | |
Bristol-Myers Squibb Co. | | 6,600 | | 185,460 | |
Johnson & Johnson | | 4,050 | | 266,165 | |
Pfizer, Inc. | | 9,800 | | 205,408 | |
Teva Pharmaceutical Industries Ltd. # | | 3,900 | | 178,347 | |
| | | | 1,006,434 | |
RAILROADS—1.0% | | | | | |
CSX Corp. | | 3,150 | | 247,874 | |
| | | | | |
RESTAURANTS—2.1% | | | | | |
McDonald’s Corp. | | 4,150 | | 324,986 | |
Starbucks Corp. | | 5,350 | | 193,616 | |
| | | | 518,602 | |
SEMICONDUCTORS—2.7% | | | | | |
ARM Holdings PLC # | | 3,900 | | 122,694 | |
Broadcom Corp., Cl. A * | | 5,350 | | 188,213 | |
Intel Corp. | | 9,050 | | 209,870 | |
Texas Instruments, Inc. | | 4,400 | | 156,332 | |
| | | | 677,109 | |
SOFT DRINKS—2.9% | | | | | |
Coca-Cola Co., /The | | 4,750 | | 320,435 | |
PepsiCo, Inc. | | 5,450 | | 375,450 | |
| | | | 695,885 | |
SPECIALIZED FINANCE—0.5% | | | | | |
CME Group, Inc. | | 450 | | 133,097 | |
| | | | | |
SPECIALTY STORES—0.7% | | | | | |
Staples, Inc. | | 8,550 | | 180,747 | |
| | | | | |
SYSTEMS SOFTWARE—4.2% | | | | | |
Check Point Software Technologies Ltd. * | | 2,400 | | 131,832 | |
Microsoft Corp. | | 10,700 | | 278,414 | |
Oracle Corp. | | 13,850 | | 499,293 | |
VMware, Inc., Cl. A * | | 1,400 | | 133,602 | |
| | | | 1,043,141 | |
| | | | | | |
23
| | SHARES | | VALUE | |
COMMON STOCKS—(CONT.) | | | | | |
WIRELESS TELECOMMUNICATION SERVICES—1.0% | | | | | |
American Tower Corp., Cl. A* | | 4,700 | | $ | 245,857 | |
| | | | | |
TOTAL COMMON STOCKS | | | | | |
(Cost $19,694,848) | | | | 22,766,063 | |
| | | | | |
Total Investments | | | | | |
(Cost $19,694,848)(a) | | 92.1 | % | 22,766,063 | |
Other Assets in Excess of Liabilities | | 7.9 | | 1,947,791 | |
| | | | | |
NET ASSETS | | 100.0 | % | $ | 24,713,854 | |
‡ | Securities classified as Level 1 for ASC 820 disclosure purposes based on valuation inputs unless otherwise noted. |
| |
* | Non-income producing security. |
# | American Depository Receipts. |
(a) | At April 30, 2011, the net unrealized appreciation on investments, based on cost for federal income tax purposes of $19,725,005 amounted to $3,041,058 which consisted of aggregate gross unrealized appreciation of $3,641,436 and aggregate gross unrealized depreciation of $600,378. |
See Notes to Financial Statements.
24
THE ALGER INSTITUTIONAL FUNDS | ALGER MID CAP GROWTH INSTITUTIONAL FUND
Schedule of Investments‡ (Unaudited) April 30, 2011
| | SHARES | | VALUE | |
COMMON STOCKS—99.3% | | | | | |
ADVERTISING—0.4% | | | | | |
Interpublic Group of Cos., Inc., /The | | 265,300 | | $ | 3,117,275 | |
| | | | | | |
AEROSPACE & DEFENSE—2.9% | | | | | |
Goodrich Corp. | | 89,400 | | 7,900,278 | |
Spirit Aerosystems Holdings, Inc., Cl. A * | | 506,800 | | 12,467,280 | |
| | | | 20,367,558 | |
AIRLINES—0.9% | | | | | |
United Continental Holdings, Inc.* | | 277,800 | | 6,339,396 | |
| | | | | |
APPAREL RETAIL—1.3% | | | | | |
Abercrombie & Fitch Co., Cl. A | | 73,700 | | 5,217,960 | |
Fast Retailing Co., Ltd. | | 23,200 | | 3,635,010 | |
| | | | 8,852,970 | |
APPLICATION SOFTWARE—4.7% | | | | | |
Adobe Systems, Inc. * | | 157,300 | | 5,277,415 | |
Cadence Design Systems, Inc. * | | 325,600 | | 3,379,728 | |
Informatica Corp. * | | 159,200 | | 8,916,792 | |
QLIK Technologies, Inc. * | | 95,355 | | 3,057,081 | |
RealPage, Inc. * | | 76,500 | | 2,440,350 | |
Salesforce.com, Inc. * | | 67,200 | | 9,313,920 | |
| | | | 32,385,286 | |
ASSET MANAGEMENT & CUSTODY BANKS—2.6% | | | | | |
Blackstone Group LP | | 278,100 | | 5,267,214 | |
KKR & Co., LP | | 360,900 | | 6,842,664 | |
T. Rowe Price Group, Inc. | | 96,200 | | 6,180,850 | |
| | | | 18,290,728 | |
AUTOMOTIVE RETAIL—1.0% | | | | | |
Carmax, Inc.* | | 207,400 | | 7,196,780 | |
| | | | | |
BIOTECHNOLOGY—1.8% | | | | | |
Human Genome Sciences, Inc. * | | 274,900 | | 8,101,303 | |
InterMune, Inc. * | | 43,900 | | 1,959,696 | |
Optimer Pharmaceuticals, Inc. * | | 189,559 | | 2,394,130 | |
| | | | 12,455,129 | |
BROADCASTING & CABLE TV—2.8% | | | | | |
CBS Corp., Cl. B | | 344,500 | | 8,688,290 | |
Discovery Communications, Inc., Series C * | | 261,400 | | 10,314,843 | |
| | | | 19,003,133 | |
CASINOS & GAMING—0.5% | | | | | |
Wynn Resorts Ltd. | | 23,900 | | 3,516,885 | |
| | | | | |
CHEMICALS—0.8% | | | | | |
Metabolix, Inc.* | | 656,860 | | 5,307,429 | |
| | | | | |
COAL & CONSUMABLE FUELS—1.3% | | | | | |
Arch Coal, Inc. | | 114,900 | | 3,941,070 | |
Patriot Coal Corp. * | | 210,100 | | 5,290,318 | |
| | | | 9,231,388 | |
COMMUNICATIONS EQUIPMENT—2.6% | | | | | |
Ciena Corp. * | | 195,400 | | 5,518,096 | |
25
| | SHARES | | VALUE | |
COMMON STOCKS—(CONT.) | | | | | |
COMMUNICATIONS EQUIPMENT—(CONT.) | | | | | |
Finisar Corp. * | | 255,000 | | $ | 7,162,950 | |
Riverbed Technology, Inc. * | | 152,200 | | 5,348,308 | |
| | | | 18,029,354 | |
COMPUTER HARDWARE—1.3% | | | | | |
Teradata Corp.* | | 165,500 | | 9,254,760 | |
| | | | | |
COMPUTER STORAGE & PERIPHERALS—1.2% | | | | | |
SanDisk Corp.* | | 169,300 | | 8,319,402 | |
| | | | | |
CONSTRUCTION & ENGINEERING—1.8% | | | | | |
Aecom Technology Corp. * | | 217,300 | | 5,923,598 | |
Chicago Bridge & Iron Co., NV # | | 165,800 | | 6,721,532 | |
| | | | 12,645,130 | |
CONSTRUCTION & FARM MACHINERY & HEAVY TRUCKS—3.7% | | | | | |
Cummins, Inc. | | 57,700 | | 6,934,386 | |
Joy Global, Inc. | | 141,700 | | 14,304,615 | |
Westport Innovations, Inc. * | | 165,300 | | 4,182,090 | |
| | | | 25,421,091 | |
DISTILLERS & VINTNERS—0.5% | | | | | |
Brown-Forman Corp., Cl. B | | 47,800 | | 3,434,908 | |
| | | | | |
DIVERSIFIED BANKS—0.7% | | | | | |
Comerica, Inc. | | 131,800 | | 4,999,174 | |
| | | | | |
DIVERSIFIED METALS & MINING—4.9% | | | | | |
Cliffs Natural Resources, Inc. | | 154,500 | | 14,479,740 | |
Ivanhoe Mines Ltd. * | | 138,600 | | 3,642,408 | |
Molycorp, Inc. * | | 89,000 | | 6,523,700 | |
Walter Energy, Inc. | | 70,200 | | 9,703,044 | |
| | | | 34,348,892 | |
EDUCATION SERVICES—0.5% | | | | | |
ITT Educational Services, Inc.* | | 49,500 | | 3,550,635 | |
| | | | | |
ELECTRICAL COMPONENTS & EQUIPMENT—2.4% | | | | | |
AMETEK, Inc. | | 226,850 | | 10,444,174 | |
General Cable Corp. * | | 124,600 | | 6,043,100 | |
| | | | 16,487,274 | |
ELECTRONIC MANUFACTURING SERVICES—0.9% | | | | | |
Trimble Navigation Ltd.* | | 136,000 | | 6,370,240 | |
| | | | | |
ENVIRONMENTAL & FACILITIES SERVICES—1.0% | | | | | |
Stericycle, Inc.* | | 76,100 | | 6,946,408 | |
| | | | | |
FOOD RETAIL—0.5% | | | | | |
Whole Foods Market, Inc.* | | 55,500 | | 3,483,180 | |
| | | | | |
GENERAL MERCHANDISE STORES—1.0% | | | | | |
Dollar General Corp.* | | 215,200 | | 7,013,368 | |
| | | | | |
GOLD—1.6% | | | | | |
Yamana Gold, Inc. | | 885,100 | | 11,249,621 | |
| | | | | |
HEALTH CARE EQUIPMENT—0.9% | | | | | |
Hospira, Inc.* | | 112,400 | | 6,376,452 | |
| | | | | | |
26
| | SHARES | | VALUE | |
COMMON STOCKS—(CONT.) | | | | | |
HEALTH CARE FACILITIES—1.0% | | | | | |
Universal Health Services, Inc., Cl. B | | 127,195 | | $ | 6,967,742 | |
| | | | | | |
HEALTH CARE SERVICES—0.5% | | | | | |
Quest Diagnostics, Inc. | | 57,400 | | 3,236,212 | |
| | | | | |
HEALTH CARE TECHNOLOGY—1.4% | | | | | |
Agilent Technologies, Inc. * | | 69,600 | | 3,473,736 | |
Allscripts Healthcare Solutions, Inc. * | | 288,500 | | 6,214,290 | |
| | | | 9,688,026 | |
HOTELS RESORTS & CRUISE LINES—1.2% | | | | | |
Interval Leisure Group * | | 92,300 | | 1,483,261 | |
Orient-Express Hotels Ltd., Cl. A * | | 140,200 | | 1,720,254 | |
Royal Caribbean Cruises Ltd. * | | 134,200 | | 5,343,844 | |
| | | | 8,547,359 | |
HOUSEHOLD PRODUCTS—0.7% | | | | | |
Church & Dwight Co., Inc. | | 58,500 | | 4,825,080 | |
| | | | | |
HUMAN RESOURCE & EMPLOYMENT SERVICES—1.0% | | | | | |
Robert Half International, Inc. | | 227,700 | | 6,906,141 | |
| | | | | |
INDUSTRIAL MACHINERY—4.0% | | | | | |
Flowserve Corp. | | 73,000 | | 9,243,260 | |
Pall Corp. | | 86,200 | | 5,037,528 | |
SPX Corp. | | 156,800 | | 13,555,360 | |
| | | | 27,836,148 | |
INTERNET RETAIL—1.1% | | | | | |
NetFlix, Inc. * | | 14,100 | | 3,280,647 | |
priceline.com, Inc. * | | 7,600 | | 4,157,276 | |
| | | | 7,437,923 | |
INTERNET SOFTWARE & SERVICES—4.9% | | | | | |
Ancestry.com, Inc. * | | 103,400 | | 4,725,380 | |
OpenTable, Inc. * | | 182,600 | | 20,321,554 | |
VistaPrint Ltd. * | | 162,500 | | 8,840,000 | |
| | | | 33,886,934 | |
INVESTMENT BANKING & BROKERAGE—1.4% | | | | | |
Greenhill & Co., Inc. | | 167,600 | | 9,888,400 | |
| | | | | |
IT CONSULTING & OTHER SERVICES—2.3% | | | | | |
Cognizant Technology Solutions Corp., Cl. A * | | 157,500 | | 13,056,750 | |
Gartner, Inc. * | | 64,100 | | 2,750,531 | |
| | | | 15,807,281 | |
LEISURE PRODUCTS—1.6% | | | | | |
Coach, Inc. | | 90,700 | | 5,424,767 | |
Polo Ralph Lauren Corp., Cl. A | | 40,600 | | 5,309,262 | |
| | | | 10,734,029 | |
LIFE SCIENCES TOOLS & SERVICES—0.5% | | | | | |
Waters Corp.* | | 35,400 | | 3,469,200 | |
| | | | | |
MANAGED HEALTH CARE—4.9% | | | | | |
Aetna, Inc. | | 242,100 | | 10,018,098 | |
CIGNA Corp. | | 303,100 | | 14,194,173 | |
27
| | SHARES | | VALUE | |
COMMON STOCKS—(CONT.) | | | | | |
MANAGED HEALTH CARE—(CONT.) | | | | | |
Humana, Inc. * | | 137,700 | | $ | 10,481,724 | |
| | | | 34,693,995 | |
MOTORCYCLE MANUFACTURERS—0.4% | | | | | |
Harley-Davidson, Inc. | | 81,400 | | 3,032,964 | |
| | | | | |
NETWORKING EQUIPMENT—0.7% | | | | | |
Fortinet, Inc.* | | 100,800 | | 4,908,960 | |
| | | | | |
OIL & GAS DRILLING—1.2% | | | | | |
Nabors Industries Ltd.* | | 263,800 | | 8,082,832 | |
| | | | | |
OIL & GAS EQUIPMENT & SERVICES—0.8% | | | | | |
Superior Energy Services, Inc.* | | 143,700 | | 5,520,954 | |
| | | | | |
OIL & GAS EXPLORATION & PRODUCTION—5.7% | | | | | |
Concho Resources, Inc., /Restricted * | | 33,100 | | 3,536,735 | |
Newfield Exploration Co. * | | 157,000 | | 11,115,600 | |
Nexen, Inc. | | 267,557 | | 7,071,532 | |
Petrohawk Energy Corp. *,^ | | 402,800 | | 10,879,628 | |
Pioneer Natural Resources Co. | | 69,500 | | 7,104,985 | |
| | | | 39,708,480 | |
OTHER DIVERSIFIED FINANCIAL SERVICES—0.5% | | | | | |
BM&F Bovespa SA | | 445,887 | | 3,345,569 | |
| | | | | |
PHARMACEUTICALS—0.5% | | | | | |
Medicis Pharmaceutical Corp., Cl. A | | 98,700 | | 3,499,902 | |
| | | | | |
PRECIOUS METALS & MINERALS—1.0% | | | | | |
Stillwater Mining Co.* | | 314,400 | | 7,171,464 | |
| | | | | |
RAILROADS—1.5% | | | | | |
Kansas City Southern* | | 179,700 | | 10,442,367 | |
| | | | | |
REAL ESTATE MANAGEMENT & DEVELOPMENT—0.7% | | | | | |
BR Malls Participacoes SA | | 471,740 | | 4,963,160 | |
| | | | | |
REAL ESTATE SERVICES—1.3% | | | | | |
CB Richard Ellis Group, Inc.* | | 327,900 | | 8,758,209 | |
| | | | | |
RESEARCH & CONSULTING SERVICES—1.1% | | | | | |
Verisk Analytic, Inc., Cl. A* | | 235,000 | | 7,731,500 | |
| | | | | |
RESTAURANTS—0.4% | | | | | |
McCormick & Schmick’s Seafood Restaurants, Inc.* | | 292,976 | | 2,674,871 | |
| | | | | |
SEMICONDUCTOR EQUIPMENT—2.0% | | | | | |
Kla-Tencor Corp. | | 121,100 | | 5,316,290 | |
Lam Research Corp. * | | 177,000 | | 8,550,870 | |
| | | | 13,867,160 | |
SEMICONDUCTORS—6.7% | | | | | |
Altera Corp. | | 215,300 | | 10,485,110 | |
Avago Technologies Ltd. | | 200,500 | | 6,708,730 | |
Netlogic Microsystems, Inc. * | | 120,100 | | 5,179,913 | |
NVIDIA Corp. * | | 270,300 | | 5,406,000 | |
NXP Semiconductor NV * | | 150,800 | | 5,036,720 | |
ON Semiconductor Corp. * | | 512,400 | | 5,385,324 | |
| | | | | | |
28
| | SHARES | | VALUE | |
COMMON STOCKS—(CONT.) | | | | | |
SEMICONDUCTORS—(CONT.) | | | | | |
Skyworks Solutions, Inc. * | | 255,500 | | $ | 8,038,030 | |
| | | | 46,239,827 | |
SPECIALIZED CONSUMER SERVICES—0.5% | | | | | |
Sotheby’s | | 75,200 | | 3,799,104 | |
| | | | | |
SPECIALTY STORES—0.5% | | | | | |
L’Occitane International SA* | | 1,426,200 | | 3,423,042 | |
| | | | | |
SYSTEMS SOFTWARE—0.8% | | | | | |
Check Point Software Technologies Ltd.* | | 106,300 | | 5,839,059 | |
| | | | | |
TOTAL COMMON STOCKS
(Cost $614,316,914) | | | | 690,927,740 | |
| | | | | |
CONVERTIBLE PREFERRED STOCK—1.5% | | | | | |
BIOTECHNOLOGY—1.5% | | | | | |
Merrimack Pharmaceuticals, Inc., Series B-10, *,(L3),(a) | | 115,098 | | 1,240,756 | |
Merrimack Pharmaceuticals, Inc., Series B-3, *,(L3),(b) | | 11,510 | | 124,078 | |
Merrimack Pharmaceuticals, Inc., Series B-4, *,(L3),(c) | | 345,008 | | 3,719,186 | |
Merrimack Pharmaceuticals, Inc., Series B-7, *,(L3),(a) | | 115,098 | | 1,240,756 | |
Merrimack Pharmaceuticals, Inc., Series C-2, *,(L3),(d) | | 611,759 | | 4,282,314 | |
| | | | 10,607,090 | |
TOTAL CONVERTIBLE PREFERRED STOCK
(Cost $5,689,999) | | | | 10,607,090 | |
| | | | | |
Total Investments
(Cost $620,006,913)(e) | | 100.8 | % | 701,534,830 | |
Liabilities in Excess of Other Assets | | (0.8 | ) | (5,336,637 | ) |
| | | | | |
NET ASSETS | | 100.0 | % | $ | 696,198,193 | |
‡ | Securities classified as Level 1 for ASC 820 disclosure purposes based on valuation inputs unless otherwise noted. |
| |
^ | All or a portion of this security has been pledged as collateral for written call options. |
* | Non-income producing security. |
# | American Depository Receipts. |
(a) | Restricted Security - Investment in security not registered under the Securities Act of 1933. The investment is deemed to be illiquid and may be sold only to qualified institutional buyers. Security was acquired on August 25, 2010 for a cost of $666,188 and represents 0.2% of the net assets of the Fund. |
(b) | Restricted Security - Investment in security not registered under the Securities Act of 1933. The investment is deemed to be illiquid and may be sold only to qualified institutional buyers. Security was acquired on August 25, 2010 for a cost of $66,620 and represents 0.0% of the net assets of the Fund. |
(c) | Restricted Security - Investment in security not registered under the Securities Act of 1933. The investment is deemed to be illiquid and may be sold only to qualified institutional buyers. Security was acquired on August 25, 2010 for a cost of $1,996,908 and represents 0.5% of the net assets of the Fund. |
(d) | Restricted Security - Investment in security not registered under the Securities Act of 1933. The investment is deemed to be illiquid and may be sold only to qualified institutional buyers. Security was acquired on August 25, 2010 for a cost of $2,294,095 and represents 0.6% of the net assets of the Fund. |
29
(e) | At April 30, 2011, the net unrealized appreciation on investments, based on cost for federal income tax purposes of $624,073,945 amounted to $77,460,885 which consisted of aggregate gross unrealized appreciation of $95,567,652 and aggregate gross unrealized depreciation of $18,106,767. |
(L3) | Security classified as Level 3 for ASC 820 disclosure purposes based on valuation inputs. |
See Notes to Financial Statements.
30
THE ALGER INSTITUTIONAL FUNDS | ALGER MID CAP GROWTH INSTITUTIONAL FUND
Schedule of Options Written‡ (Unaudited) April 30, 2011
| | CONTRACTS | | SHARES
SUBJECT
TO PUT/
CALL | | VALUE | |
PUT OPTIONS WRITTEN | | | | | | | |
Petrohawk Energy Corp./ June/ 27 | | 600 | | 60,000 | | 107,400 | |
| | | | | | | |
TOTAL PUT OPTIONS WRITTEN | | | | | | | |
(Premiums Received $124,789) | | | | | | 107,400 | |
| | | | | | | |
CALL OPTIONS WRITTEN | | | | | | | |
Concho Resources, Inc./ May/ 105 | | 169 | | 16,900 | | $ | 57,460 | |
Petrohawk Energy Corp./ June/ 27 | | 600 | | 60,000 | | 105,600 | |
| | | | | | | |
TOTAL CALL OPTIONS WRITTEN | | | | | | | |
(Premiums Received $140,801) | | | | | | 163,060 | |
| | | | | | | |
TOTAL OPTIONS WRITTEN | | | | | | | |
(Premiums Received $265,590) | | | | | | $ | 270,460 | |
‡ | Securities classified as Level 1 for ASC 820 disclosure purposes based on valuation inputs unless otherwise noted. |
See Notes to Financial Statements.
31
THE ALGER INSTITUTIONAL FUNDS | ALGER SMALL CAP GROWTH INSTITUTIONAL FUND
Schedule of Investments‡ (Unaudited) April 30, 2011
| | SHARES | | VALUE | |
COMMON STOCKS—96.4% | | | | | |
AEROSPACE & DEFENSE—2.1% | | | | | |
AAR Corp. | | 534,800 | | $ | 13,926,192 | |
Esterline Technologies Corp. * | | 224,775 | | 16,138,845 | |
| | | | 30,065,037 | |
AIRLINES—0.5% | | | | | |
US Airways Group, Inc.* | | 745,650 | | 6,777,959 | |
| | | | | |
APPAREL RETAIL—2.6% | | | | | |
ANN Inc. * | | 538,350 | | 16,801,903 | |
Childrens Place Retail Stores, Inc., /The * | | 209,700 | | 11,149,748 | |
DSW Inc., Cl. A * | | 64,150 | | 3,045,842 | |
Express, Inc. | | 324,950 | | 7,015,671 | |
| | | | 38,013,164 | |
APPLICATION SOFTWARE—8.8% | | | | | |
BroadSoft, Inc. * | | 219,919 | | 9,995,319 | |
Cadence Design Systems, Inc. * | | 1,372,050 | | 14,241,879 | |
Concur Technologies, Inc. * | | 191,350 | | 11,073,425 | |
Nice Systems Ltd. #* | | 424,655 | | 16,192,094 | |
QLIK Technologies, Inc. * | | 478,700 | | 15,347,121 | |
RealPage, Inc. * | | 380,100 | | 12,125,190 | |
Solera Holdings, Inc. | | 241,600 | | 13,288,000 | |
Taleo Corp., Cl. A * | | 338,100 | | 12,262,887 | |
Ultimate Software Group, Inc. * | | 208,000 | | 11,648,000 | |
VanceInfo Technologies, Inc. #* | | 303,600 | | 9,763,776 | |
| | | | 125,937,691 | |
ASSET MANAGEMENT & CUSTODY BANKS—1.0% | | | | | |
Fortress Investment Group LLC, Cl. A* | | 2,362,950 | | 14,579,402 | |
| | | | | |
AUTO PARTS & EQUIPMENT—1.1% | | | | | |
Dana Holding Corp.* | | 879,900 | | 15,987,783 | |
| | | | | |
BIOTECHNOLOGY—2.9% | | | | | |
Cubist Pharmaceuticals, Inc. * | | 287,250 | | 9,723,413 | |
Incyte Corp., Ltd. * | | 310,500 | | 5,738,040 | |
InterMune, Inc. * | | 256,100 | | 11,432,303 | |
Onyx Pharmaceuticals, Inc. * | | 104,100 | | 3,911,037 | |
Optimer Pharmaceuticals, Inc. * | | 890,812 | | 11,250,956 | |
| | | | 42,055,749 | |
COAL & CONSUMABLE FUELS—0.6% | | | | | |
Patriot Coal Corp.* | | 343,350 | | 8,645,553 | |
| | | | | |
COMMUNICATIONS EQUIPMENT—3.7% | | | | | |
Acme Packet, Inc. * | | 132,050 | | 10,908,651 | |
Aruba Networks, Inc. * | | 319,200 | | 11,468,856 | |
Ciena Corp. * | | 394,800 | | 11,149,152 | |
Finisar Corp. * | | 360,300 | | 10,120,827 | |
Riverbed Technology, Inc. * | | 292,600 | | 10,281,964 | |
| | | | 53,929,450 | |
CONSTRUCTION & ENGINEERING—0.7% | | | | | |
Aecom Technology Corp.* | | 351,450 | | 9,580,527 | |
| | | | | | |
32
| | SHARES | | VALUE | |
COMMON STOCKS—(CONT.) | | | | | |
DATA PROCESSING & OUTSOURCED SERVICES—2.0% | | | | | |
Jack Henry & Associates, Inc. | | 350,550 | | $ | 11,908,184 | |
Wright Express Corp. * | | 289,985 | | 16,334,855 | |
| | | | 28,243,039 | |
DISTRIBUTORS—0.8% | | | | | |
LKQ Corp.* | | 479,240 | | 12,086,433 | |
| | | | | |
DIVERSIFIED CHEMICALS—0.9% | | | | | |
Solutia, Inc.* | | 492,900 | | 12,987,915 | |
| | | | | |
EDUCATION SERVICES—0.5% | | | | | |
American Public Education, Inc.* | | 163,900 | | 6,924,775 | |
| | | | | |
ELECTRIC UTILITIES—1.1% | | | | | |
ITC Holdings Corp. | | 215,385 | | 15,277,258 | |
| | | | | |
ELECTRICAL COMPONENTS & EQUIPMENT—2.1% | | | | | |
GrafTech International Ltd. * | | 664,300 | | 15,411,760 | |
Woodward Governor Co. | | 382,000 | | 14,153,100 | |
| | | | 29,564,860 | |
ELECTRONIC COMPONENTS—1.0% | | | | | |
Aeroflex Holding Corp. * | | 385,100 | | 6,816,270 | |
Fabrinet * | | 307,700 | | 7,092,485 | |
| | | | 13,908,755 | |
ENVIRONMENTAL & FACILITIES SERVICES—2.8% | | | | | |
Clean Harbors, Inc. * | | 149,500 | | 14,725,750 | |
Tetra Tech, Inc. * | | 432,650 | | 10,219,193 | |
Waste Connections, Inc. | | 533,400 | | 16,412,718 | |
| | | | 41,357,661 | |
FOOD DISTRIBUTORS—0.9% | | | | | |
United Natural Foods, Inc.* | | 308,850 | | 13,184,807 | |
| | | | | |
FOOD RETAIL—0.5% | | | | | |
Fresh Market, Inc., /The* | | 171,650 | | 7,178,403 | |
| | | | | |
GOLD—0.7% | | | | | |
Gammon Gold, Inc.* | | 879,600 | | 9,596,436 | |
| | | | | |
HEALTH CARE EQUIPMENT—3.0% | | | | | |
Arthrocare Corp. * | | 180,300 | | 6,369,999 | |
Insulet Corp. * | | 565,150 | | 12,145,073 | |
MAKO Surgical Corp. * | | 374,842 | | 10,296,910 | |
Sirona Dental Systems, Inc. * | | 159,300 | | 9,091,251 | |
Thoratec Corp. * | | 201,650 | | 6,190,655 | |
| | | | 44,093,888 | |
HEALTH CARE FACILITIES—1.5% | | | | | |
Healthsouth Corp. * | | 404,350 | | 10,363,491 | |
Kindred Healthcare, Inc. * | | 124,350 | | 3,136,107 | |
LifePoint Hospitals, Inc. * | | 180,200 | | 7,498,122 | |
| | | | 20,997,720 | |
HEALTH CARE SERVICES—2.3% | | | | | |
Catalyst Health Solutions, Inc. * | | 243,500 | | 14,502,860 | |
Gentiva Health Services, Inc. * | | 374,650 | | 10,490,200 | |
| | | | | | |
33
| | SHARES | | VALUE | |
COMMON STOCKS—(CONT.) | | | | | |
HEALTH CARE SERVICES—(CONT.) | | | | | |
HMS Holdings Corp. * | | 110,000 | | $ | 8,658,100 | |
| | | | 33,651,160 | |
HEALTH CARE SUPPLIES—0.9% | | | | | |
Align Technology, Inc.* | | 512,300 | | 12,366,922 | |
| | | | | |
HEALTH CARE TECHNOLOGY—1.3% | | | | | |
MedAssets, Inc. * | | 289,650 | | 4,640,193 | |
Medidata Solutions, Inc. * | | 526,550 | | 13,516,539 | |
| | | | 18,156,732 | |
HOME FURNISHINGS—0.4% | | | | | |
Ethan Allen Interiors, Inc. | | 217,350 | | 5,235,962 | |
| | | | | |
HOTELS RESORTS & CRUISE LINES—1.5% | | | | | |
Gaylord Entertainment Co. * | | 289,050 | | 10,368,224 | |
Interval Leisure Group * | | 731,316 | | 11,752,248 | |
| | | | 22,120,472 | |
HOUSEHOLD APPLIANCES—0.6% | | | | | |
SodaStream International Ltd.* | | 173,450 | | 7,933,603 | |
| | | | | |
HOUSEWARES & SPECIALTIES—1.0% | | | | | |
Tupperware Brands Corp. | | 229,350 | | 14,602,715 | |
| | | | | |
INDUSTRIAL MACHINERY—3.9% | | | | | |
Actuant Corp., Cl. A | | 546,260 | | 15,164,178 | |
Barnes Group, Inc. | | 658,650 | | 16,295,001 | |
CLARCOR, Inc. | | 202,550 | | 9,153,235 | |
RBC Bearings, Inc. * | | 417,390 | | 16,386,730 | |
| | | | 56,999,144 | |
INTERNET RETAIL—1.2% | | | | | |
Shutterfly, Inc.* | | 291,400 | | 17,938,584 | |
| | | | | |
INTERNET SOFTWARE & SERVICES—5.3% | | | | | |
Ancestry.com, Inc. * | | 292,500 | | 13,367,250 | |
comScore, Inc. * | | 348,100 | | 10,376,861 | |
GSI Commerce, Inc. * | | 372,522 | | 10,903,719 | |
LogMeIn, Inc. * | | 310,800 | | 13,386,156 | |
OpenTable, Inc. * | | 121,550 | | 13,527,300 | |
VistaPrint Ltd. * | | 273,440 | | 14,875,135 | |
| | | | 76,436,421 | |
INVESTMENT BANKING & BROKERAGE—0.8% | | | | | |
Greenhill & Co., Inc. | | 189,450 | | 11,177,550 | |
| | | | | |
LEISURE FACILITIES—1.1% | | | | | |
Life Time Fitness, Inc. * | | 181,445 | | 7,098,128 | |
Six Flags Entertainment Corp. | | 132,650 | | 9,090,505 | |
| | | | 16,188,633 | |
LEISURE PRODUCTS—2.4% | | | | | |
Brunswick Corp. | | 548,600 | | 12,820,782 | |
Vera Bradley, Inc. * | | 157,300 | | 7,651,072 | |
Warnaco Group Inc., /The * | | 211,850 | | 13,634,665 | |
| | | | 34,106,519 | |
| | | | | | |
34
| | SHARES | | VALUE | |
COMMON STOCKS—(CONT.) | | | | | |
LIFE SCIENCES TOOLS & SERVICES—1.8% | | | | | |
Bruker Corp. * | | 703,300 | | $ | 13,883,142 | |
Parexel International Corp. * | | 442,342 | | 12,279,414 | |
| | | | 26,162,556 | |
MANAGED HEALTH CARE—1.7% | | | | | |
Amerigroup Corp. * | | 189,900 | | 12,970,170 | |
Healthspring, Inc. * | | 268,100 | | 11,123,469 | |
| | | | 24,093,639 | |
METAL & GLASS CONTAINERS—1.0% | | | | | |
Silgan Holdings, Inc. | | 303,100 | | 13,900,166 | |
| | | | | |
NETWORKING EQUIPMENT—0.8% | | | | | |
Fortinet, Inc.* | | 246,250 | | 11,992,375 | |
| | | | | |
OFFICE SERVICES & SUPPLIES—0.3% | | | | | |
American Reprographics Co.* | | 431,000 | | 3,857,450 | |
| | | | | |
OIL & GAS EQUIPMENT & SERVICES—2.3% | | | | | |
Cal Dive International, Inc. * | | 978,300 | | 7,689,438 | |
Complete Production Services, Inc. * | | 308,150 | | 10,458,611 | |
Dril-Quip, Inc. * | | 138,170 | | 10,578,295 | |
Lufkin Industries, Inc. | | 52,300 | | 4,828,859 | |
| | | | 33,555,203 | |
OIL & GAS EXPLORATION & PRODUCTION—2.9% | | | | | |
Brigham Exploration Co. * | | 380,300 | | 12,751,459 | |
Energy XXI Bermuda Ltd. * | | 280,600 | | 10,171,750 | |
Quicksilver Resources, Inc. * | | 580,800 | | 8,624,880 | |
Rosetta Resources, Inc. * | | 204,250 | | 9,381,203 | |
| | | | 40,929,292 | |
PACKAGED FOODS & MEATS—0.8% | | | | | |
Hain Celestial Group, Inc.* | | 336,415 | | 11,441,474 | |
| | | | | |
PHARMACEUTICALS—2.2% | | | | | |
Auxilium Pharmaceuticals, Inc. * | | 422,080 | | 10,281,869 | |
Medicis Pharmaceutical Corp., Cl. A | | 345,650 | | 12,256,748 | |
Salix Pharmaceuticals Ltd. * | | 120,100 | | 4,718,729 | |
Viropharma, Inc. * | | 245,250 | | 4,730,873 | |
| | | | 31,988,219 | |
PRECIOUS METALS & MINERALS—0.5% | | | | | |
Stillwater Mining Co.* | | 322,000 | | 7,344,820 | |
| | | | | |
RAILROADS—1.0% | | | | | |
Genesee & Wyoming, Inc., Cl. A* | | 237,350 | | 14,710,953 | |
| | | | | |
REGIONAL BANKS—1.4% | | | | | |
Signature Bank * | | 223,000 | | 12,980,829 | |
Texas Capital Bancshares, Inc. * | | 263,300 | | 6,793,140 | |
| | | | 19,773,969 | |
RESEARCH & CONSULTING SERVICES—0.6% | | | | | |
Resources Connection, Inc. | | 560,300 | | 8,286,837 | |
| | | | | |
RESTAURANTS—1.9% | | | | | |
Cheesecake Factory, Inc., /The * | | 393,500 | | 11,576,770 | |
| | | | | | |
35
| | SHARES | | VALUE | |
COMMON STOCKS—(CONT.) | | | | | |
RESTAURANTS—(CONT.) | | | | | |
McCormick & Schmick’s Seafood Restaurants, Inc. * | | 649,267 | | $ | 5,927,808 | |
Sonic Corp. * | | 877,800 | | 9,848,916 | |
| | | | 27,353,494 | |
SECURITY & ALARM SERVICES—0.9% | | | | | |
Geo Group Inc., /The* | | 511,250 | | 13,640,150 | |
| | | | | |
SEMICONDUCTOR EQUIPMENT—0.9% | | | | | |
Novellus Systems, Inc.* | | 420,650 | | 13,502,865 | |
| | | | | |
SEMICONDUCTORS—4.1% | | | | | |
Applied Micro Circuits Corporation * | | 932,150 | | 9,768,932 | |
Inphi Corp. * | | 380,050 | | 8,201,479 | |
Mellanox Technologies Ltd. * | | 377,450 | | 11,149,873 | |
Monolithic Power Systems, Inc. * | | 361,050 | | 6,130,629 | |
Netlogic Microsystems, Inc. * | | 311,600 | | 13,439,308 | |
RF Micro Devices, Inc. * | | 1,592,850 | | 10,608,381 | |
| | | | 59,298,602 | |
SPECIALIZED CONSUMER SERVICES—0.8% | | | | | |
Sotheby’s | | 222,450 | | 11,238,174 | |
| | | | | |
SPECIALTY CHEMICALS—2.1% | | | | | |
Kraton Performance Polymers, Inc. * | | 292,050 | | 13,481,028 | |
Rockwood Holdings, Inc. * | | 318,050 | | 18,046,157 | |
| | | | 31,527,185 | |
SPECIALTY STORES—2.3% | | | | | |
OfficeMax, Inc. * | | 457,500 | | 4,556,700 | |
Ulta Salon, Cosmetics & Fragrance, Inc. * | | 266,100 | | 14,153,859 | |
Vitamin Shoppe, Inc. * | | 352,350 | | 13,748,697 | |
| | | | 32,459,256 | |
THRIFTS & MORTGAGE FINANCE—0.8% | | | | | |
Northwest Bancshares, Inc. | | 918,850 | | 11,568,322 | |
| | | | | |
TRADING COMPANIES & DISTRIBUTORS—0.6% | | | | | |
United Rentals, Inc.* | | 279,200 | | 8,214,064 | |
| | | | | |
TRUCKING—0.2% | | | | | |
Zipcar, Inc.* | | 107,500 | | 2,772,425 | |
| | | | | |
TOTAL COMMON STOCKS | | | | | |
(Cost $1,048,241,126) | | | | 1,387,500,172 | |
| | | | | |
Total Investments | | | | | |
(Cost $1,048,241,126)(a) | | 96.4 | % | 1,387,500,172 | |
Other Assets in Excess of Liabilities | | 3.6 | | 51,643,541 | |
| | | | | |
NET ASSETS | | 100.0 | % | $ | 1,439,143,713 | |
‡ | Securities classified as Level 1 for ASC 820 disclosure purposes based on valuation inputs unless otherwise noted. |
| |
* | Non-income producing security. |
36
# | American Depository Receipts. |
(a) | At April 30, 2011, the net unrealized appreciation on investments, based on cost for federal income tax purposes of $1,048,842,139 amounted to $338,658,033 which consisted of aggregate gross unrealized appreciation of $365,597,983 and aggregate gross unrealized depreciation of $26,939,950. |
See Notes to Financial Statements.
37
THE ALGER INSTITUTIONAL FUNDS
Statements of Assets and Liabilities (Unaudited) April 30, 2011
| | Alger Capital
Appreciation
Institutional Fund | | Alger Large Cap
Growth
Institutional Fund | |
ASSETS: | | | | | |
Investments in securities, at value (identified cost)* see accompanying schedules of investments | | $ | 1,213,774,192 | | $ | 22,766,063 | |
Cash and cash equivalents | | 63,053,265 | | 1,593,421 | |
Receivable for investment securities sold | | 11,970,662 | | 587,096 | |
Receivable for shares of beneficial interest sold | | 3,561,319 | | 38,312 | |
Dividends and interest receivable | | 765,419 | | 19,288 | |
Prepaid expenses | | 84,629 | | 36,540 | |
Total Assets | | 1,293,209,486 | | 25,040,720 | |
LIABILITIES: | | | | | |
Payable for investment securities purchased | | 16,797,140 | | 260,059 | |
Payable for shares of beneficial interest redeemed | | 2,458,130 | | 1,619 | |
Accrued investment advisory fees | | 808,068 | | 14,054 | |
Accrued transfer agent fees | | 45,260 | | 8,676 | |
Accrued distribution fees | | 91,555 | | 2,437 | |
Accrued administrative fees | | 27,434 | | 545 | |
Accrued shareholder servicing fees | | 259,380 | | 5,146 | |
Accrued other expenses | | 96,672 | | 34,330 | |
Total Liabilities | | 20,583,639 | | 326,866 | |
NET ASSETS | | $ | 1,272,625,847 | | $ | 24,713,854 | |
Net Assets Consist of: | | | | | |
Paid in capital (par value of $.001 per share) | | 1,074,079,466 | | 32,600,050 | |
Undistributed net investment income (accumulated loss) | | (1,368,615 | ) | (44,544 | ) |
Undistributed net realized gain (accumulated realized loss) | | 42,187,204 | | (10,912,867 | ) |
Net unrealized appreciation on investments | | 157,727,792 | | 3,071,215 | |
NET ASSETS | | $ | 1,272,625,847 | | $ | 24,713,854 | |
Net Assets By Class | | | | | |
Class I | | $ | 1,040,731,790 | | $ | 18,940,408 | |
Class R | | $ | 231,894,057 | | $ | 5,773,446 | |
Shares Of Beneficial Interest Outstanding—Note 6 | | | | | |
Class I | | 45,225,828 | | 1,280,947 | |
Class R | | 10,487,398 | | 402,909 | |
Net Asset Value Per Share | | | | | |
Class I | | $ | 23.01 | | $ | 14.79 | |
Class R | | $ | 22.11 | | $ | 14.33 | |
*Identified cost | | $ | 1,056,046,400 | | $ | 19,694,848 | |
**Written options premiums received | | $ | — | | $ | — | |
See Notes to Financial Statements.
38
THE ALGER INSTITUTIONAL FUNDS
Statements of Assets and Liabilities (Unaudited) April 30, 2011
| | Alger Mid Cap
Growth
Institutional Fund | | Alger Small Cap
Growth
Institutional Fund | |
ASSETS: | | | | | |
Investments in securities, at value (identified cost)* see accompanying schedules of investments | | $ | 701,534,830 | | $ | 1,387,500,172 | |
Cash and cash equivalents | | 16,332,705 | | 48,747,460 | |
Receivable for investment securities sold | | 36,332,553 | | 11,930,976 | |
Receivable foreign currency contracts | | 9,248 | | — | |
Receivable for shares of beneficial interest sold | | 917,968 | | 4,383,546 | |
Dividends and interest receivable | | 33,580 | | 40,110 | |
Prepaid expenses | | 73,364 | | 99,762 | |
Total Assets | | 755,234,248 | | 1,452,702,026 | |
LIABILITIES: | | | | | |
Payable for investment securities purchased | | 46,872,420 | | 8,994,954 | |
Written options outstanding** | | 270,460 | | — | |
Payable for shares of beneficial interest redeemed | | 10,980,362 | | 2,991,282 | |
Accrued investment advisory fees | | 453,288 | | 919,364 | |
Accrued transfer agent fees | | 124,785 | | 108,710 | |
Accrued distribution fees | | 21,754 | | 31,827 | |
Accrued administrative fees | | 16,402 | | 31,213 | |
Accrued shareholder servicing fees | | 155,072 | | 295,104 | |
Accrued other expenses | | 141,512 | | 185,859 | |
Total Liabilities | | 59,036,055 | | 13,558,313 | |
NET ASSETS | | $ | 696,198,193 | | $ | 1,439,143,713 | |
Net Assets Consist of: | | | | | |
Paid in capital (par value of $.001 per share) | | 981,141,905 | | 1,072,563,518 | |
Undistributed net investment income (accumulated loss) | | (4,646,590 | ) | (6,445,932 | ) |
Undistributed net realized gain (accumulated realized loss) | | (361,825,330 | ) | 33,767,081 | |
Net unrealized appreciation on investments | | 81,528,208 | | 339,259,046 | |
NET ASSETS | | $ | 696,198,193 | | $ | 1,439,143,713 | |
Net Assets By Class | | | | | |
Class I | | $ | 642,233,497 | | $ | 1,359,243,029 | |
Class R | | $ | 53,964,696 | | $ | 79,900,684 | |
Shares Of Beneficial Interest Outstanding—Note 6 | | | | | |
Class I | | 39,614,767 | | 42,556,950 | |
Class R | | 3,489,786 | | 2,598,954 | |
Net Asset Value Per Share | | | | | |
Class I | | $ | 16.21 | | $ | 31.94 | |
Class R | | $ | 15.46 | | $ | 30.74 | |
*Identified cost | | $ | 620,006,913 | | $ | 1,048,241,126 | |
**Written options premiums received | | $ | 265,590 | | $ | — | |
See Notes to Financial Statements.
39
THE ALGER INSTITUTIONAL FUNDS
Statements of Operations (Unaudited)
For the six months ended April 30, 2011
| | Alger Capital
Appreciation
Institutional Fund | | Alger Large Cap
Growth
Institutional Fund | |
INCOME | | | | | |
Dividends (net of foreign withholding taxes*) | | $ | 5,515,643 | | $ | 186,590 | |
Interest | | 5,315 | | 110 | |
Total Income | | 5,520,958 | | 186,700 | |
EXPENSES | | | | | |
Advisory fees—Note 3(a) | | 4,511,162 | | 92,543 | |
Distribution fees—Note3(b): | | | | | |
Class R | | 501,712 | | 15,484 | |
Shareholder servicing fees—Note 3(e) | | 1,448,027 | | 33,889 | |
Administrative fees—Note 3(a) | | 153,157 | | 3,585 | |
Custodian fees | | 55,970 | | 17,310 | |
Interest expenses | | — | | 604 | |
Transfer agent fees and expenses—Note 3(d) | | 87,384 | | 20,066 | |
Printing fees | | 42,680 | | 2,425 | |
Professional fees | | 28,330 | | 14,364 | |
Registration fees | | 66,821 | | 18,705 | |
Trustee fees—Note 3(f) | | 9,341 | | 8,807 | |
Miscellaneous | | 113,256 | | 3,360 | |
Total Expenses | | 7,017,840 | | 231,142 | |
NET INVESTMENT LOSS | | (1,496,882 | ) | (44,442 | ) |
REALIZED AND UNREALIZED GAIN (LOSS) ON INVESTMENTS, OPTIONS AND FOREIGN CURRENCY | | | | | |
Net realized gain on investments and purchased options | | 86,662,267 | | 1,631,032 | |
Net realized loss on foreign currency transactions | | (207,208 | ) | (2,396 | ) |
Net change in unrealized appreciation (depreciation) on investments, options and foreign currency | | 111,388,682 | | 1,883,440 | |
Net realized and unrealized gain on investments, options and foreign currency | | 197,843,741 | | 3,512,076 | |
NET INCREASE IN NET ASSETS RESULTING FROM OPERATIONS | | $ | 196,346,859 | | $ | 3,467,634 | |
*Foreign withholding taxes | | $ | 9,645 | | $ | 1,791 | |
See Notes to Financial Statements.
40
THE ALGER INSTITUTIONAL FUNDS
Statements of Operations (Unaudited)
For the six months ended April 30, 2011
| | Alger Mid Cap
Growth
Institutional Fund | | Alger Small Cap
Growth
Institutional Fund | |
INCOME | | | | | |
Dividends (net of foreign withholding taxes*) | | $ | 1,739,983 | | $ | 1,204,817 | |
Interest | | (27,163 | ) | 5,850 | |
Total Income | | 1,712,820 | | 1,210,667 | |
EXPENSES | | | | | |
Advisory fees—Note 3(a) | | 2,942,734 | | 5,198,542 | |
Distribution fees—Note3(b): | | | | | |
Class R | | 128,568 | | 182,392 | |
Shareholder servicing fees—Note 3(e) | | 1,006,725 | | 1,668,668 | |
Administrative fees—Note 3(a) | | 106,481 | | 176,494 | |
Custodian fees | | 71,530 | | 42,720 | |
Interest expenses | | 10,996 | | — | |
Transfer agent fees and expenses—Note 3(d) | | 190,478 | | 119,568 | |
Printing fees | | 48,780 | | 104,220 | |
Professional fees | | 26,841 | | 31,286 | |
Registration fees | | 55,932 | | 76,731 | |
Trustee fees—Note 3(f) | | 9,410 | | 9,627 | |
Miscellaneous | | 84,629 | | 118,782 | |
Total Expenses | | 4,683,104 | | 7,729,030 | |
NET INVESTMENT LOSS | | (2,970,284 | ) | (6,518,363 | ) |
REALIZED AND UNREALIZED GAIN (LOSS) ON INVESTMENTS, OPTIONS AND FOREIGN CURRENCY | | | | | |
Net realized gain on investments and purchased options | | 116,592,675 | | 113,447,883 | |
Net realized loss on foreign currency transactions | | (339,766 | ) | — | |
Net realized gain on options written | | 696,273 | | — | |
Net change in unrealized appreciation (depreciation) on investments, options and foreign currency | | 51,252,053 | | 195,343,400 | |
Net change in unrealized appreciation (depreciation) on written options | | (4,870 | ) | — | |
Net realized and unrealized gain on investments, options and foreign currency | | 168,196,365 | | 308,791,283 | |
NET INCREASE IN NET ASSETS RESULTING FROM OPERATIONS | | $ | 165,226,081 | | $ | 302,272,920 | |
*Foreign withholding taxes | | $ | 21,717 | | $ | — | |
See Notes to Financial Statements.
41
THE ALGER INSTITUTIONAL FUNDS
Statements of Changes in Net Assets
| | Alger Capital Appreciation Institutional
Fund | |
| | For the
Six Months Ended
April 30, 2011
(Unaudited) | | For the
Year Ended
October 31, 2010 | |
Net investment income (loss) | | $ | (1,496,882 | ) | $ | (890,700 | ) |
Net realized gain on investments, options and foreign currency | | 86,455,059 | | 101,248,723 | |
Net change in unrealized appreciation on investments, options and foreign currency | | 111,388,682 | | 31,598,335 | |
Net increase in net assets resulting from operations | | 196,346,859 | | 131,956,358 | |
Dividends and distributions to shareholders from: | | | | | |
Net investment income | | | | | |
Class I | | — | | (1,279,828 | ) |
Class R | | — | | — | |
Total dividends and distributions to shareholders | | — | | (1,279,828 | ) |
Increase (decrease) from shares of beneficial interest transactions: | | | | | |
Class I | | 69,784,054 | | 65,815,020 | |
Class R | | 25,683,150 | | 62,394,146 | |
Net increase (decrease) from shares of beneficial interest transactions—Note 6 | | 95,467,204 | | 128,209,166 | |
Total increase (decrease) | | 291,814,063 | | 258,885,696 | |
Net Assets: | | | | | |
Beginning of period | | 980,811,784 | | 721,926,088 | |
END OF PERIOD | | $ | 1,272,625,847 | | $ | 980,811,784 | |
Undistributed net investment income (accumulated loss) | | $ | (1,368,615 | ) | $ | 128,267 | |
See Notes to Financial Statements.
42
| | Alger Large Cap Growth Institutional
Fund | | Alger Mid Cap Growth Institutional
Fund | | Alger Small Cap Growth Institutional
Fund | |
| | For the
Six Months Ended
April 30, 2011
(Unaudited) | | For the
Year Ended
October 31, 2010 | | For the
Six Months Ended
April 30, 2011
(Unaudited) | | For the
Year Ended
October 31, 2010 | | For the
Six Months Ended
April 30, 2011
(Unaudited) | | For the
Year Ended
October 31, 2010 | |
Net investment income (loss) | | $ | (44,442 | ) | $ | 184,121 | | $ | (2,970,284 | ) | $ | 356,200 | | $ | (6,518,363 | ) | $ | (11,420,394 | ) |
Net realized gain on investments, options and foreign currency | | 1,628,636 | | 3,578,613 | | 116,949,182 | | 140,274,983 | | 113,447,883 | | 102,355,700 | |
Net change in unrealized appreciation on investments, options and foreign currency | | 1,883,440 | | 1,434,610 | | 51,247,183 | | 36,648,897 | | 195,343,400 | | 172,896,159 | |
Net increase in net assets resulting from operations | | 3,467,634 | | 5,197,344 | | 165,226,081 | | 177,280,080 | | 302,272,920 | | 263,831,465 | |
Dividends and distributions to shareholders from: | | | | | | | | | | | | | |
Net investment income | | | | | | | | | | | | | |
Class I | | (168,982 | ) | (150,594 | ) | (1,902,007 | ) | — | | — | | — | |
Class R | | (10,503 | ) | — | | — | | — | | — | | — | |
Total dividends and distributions to shareholders | | (179,485 | ) | (150,594 | ) | (1,902,007 | ) | — | | — | | — | |
Increase (decrease) from shares of beneficial interest transactions: | | | | | | | | | | | | | |
Class I | | (6,527,463 | ) | (20,603,532 | ) | (247,323,250 | ) | (303,170,480 | ) | (30,879,861 | ) | (113,843,842 | ) |
Class R | | (1,117,707 | ) | (717,668 | ) | (6,918,040 | ) | (10,849,685 | ) | (5,185,858 | ) | 2,465,726 | |
Net increase (decrease) from shares of beneficial interest transactions—Note 6 | | (7,645,170 | ) | (21,321,200 | ) | (254,241,290 | ) | (314,020,165 | ) | (36,065,719 | ) | (111,378,116 | ) |
Total increase (decrease) | | (4,357,021 | ) | (16,274,450 | ) | (90,917,216 | ) | (136,740,085 | ) | 266,207,201 | | 152,453,349 | |
Net Assets: | | | | | | | | | | | | | |
Beginning of period | | 29,070,875 | | 45,345,325 | | 787,115,409 | | 923,855,494 | | 1,172,936,512 | | 1,020,483,163 | |
END OF PERIOD | | $ | 24,713,854 | | $ | 29,070,875 | | $ | 696,198,193 | | $ | 787,115,409 | | $ | 1,439,143,713 | | $ | 1,172,936,512 | |
Undistributed net investment income (accumulated loss) | | $ | (44,544 | ) | $ | 179,383 | | $ | (4,646,590 | ) | $ | 225,701 | | $ | (6,445,932 | ) | $ | 72,431 | |
43
THE ALGER INSTITUTIONAL FUNDS
Financial Highlights for a share outstanding throughout the period
Alger Capital Appreciation Institutional Fund
| | Class I | |
| | Six months
ended
4/30/2011(i) | | Year ended
10/31/2010 | | Year ended
10/31/2009 | | Year ended
10/31/2008 | | Year ended
10/31/2007 | | Year ended
10/31/2006 | |
Net asset value, beginning of period | | $ | 19.28 | | $ | 16.41 | | $ | 13.23 | | $ | 22.27 | | $ | 15.77 | | $ | 13.28 | |
INCOME FROM INVESTMENT OPERATIONS: | | | | | | | | | | | | | |
Net investment income (loss)(ii) | | (0.02 | ) | 0.00 | | 0.04 | | (0.04 | ) | (0.06 | ) | (0.06 | ) |
Net realized and unrealized gain (loss) on investments | | 3.75 | | 2.90 | | 3.14 | | (9.00 | ) | 6.56 | | 2.55 | |
Total from investment operations | | 3.73 | | 2.90 | | 3.18 | | (9.04 | ) | 6.50 | | 2.49 | |
Dividends from net investment income | | — | | (0.03 | ) | — | | — | | — | | — | |
Net asset value, end of period | | $ | 23.01 | | $ | 19.28 | | $ | 16.41 | | $ | 13.23 | | $ | 22.27 | | $ | 15.77 | |
Total return | | 19.3 | % | 17.7 | % | 23.9 | % | (40.6 | )% | 41.3 | % | 18.7 | % |
RATIOS/SUPPLEMENTAL DATA: | | | | | | | | | | | | | |
Net assets, end of period (000’s omitted) | | $ | 1,040,732 | | $ | 809,468 | | $ | 632,250 | | $ | 411,056 | | $ | 537,928 | | $ | 165,422 | |
Ratio of gross expenses to average net assets | | 1.17 | % | 1.17 | % | 1.21 | % | 1.18 | % | 1.23 | % | 1.27 | % |
Ratio of expense reimbursements to average net assets | | 0.00 | % | 0.00 | % | 0.00 | % | 0.00 | % | 0.00 | % | 0.00 | % |
Ratio of net expenses to average net assets | | 1.17 | % | 1.17 | % | 1.21 | % | 1.18 | % | 1.23 | % | 1.27 | % |
Ratio of net investment income (loss) to average net assets | | (0.18 | )% | (0.02 | )% | 0.32 | % | (0.21 | )% | (0.33 | )% | (0.38 | )% |
Portfolio turnover rate | | 73.44 | % | 209.52 | % | 306.87 | % | 291.85 | % | 232.13 | % | 225.25 | % |
(i) Unaudited. Ratios have been annualized; total return and portfolio turnover rate have not been annualized.
(ii) Amount was computed based on average shares outstanding during the period.
See Notes to Financial Statements.
44
Alger Capital Appreciation Institutional Fund
| | Class R | |
| | Six months
ended
4/30/2011(i) | | Year ended
10/31/2010 | | Year ended
10/31/2009 | | Year ended
10/31/2008 | | Year ended
10/31/2007 | | Year ended
10/31/2006 | |
Net asset value, beginning of period | | $ | 18.57 | | $ | 15.86 | | $ | 12.85 | | $ | 21.75 | | $ | 15.47 | | $ | 13.09 | |
INCOME FROM INVESTMENT OPERATIONS: | | | | | | | | | | | | | |
Net investment loss(ii) | | (0.07 | ) | (0.10 | ) | (0.02 | ) | (0.13 | ) | (0.16 | ) | (0.15 | ) |
Net realized and unrealized gain (loss) on investments | | 3.61 | | 2.81 | | 3.03 | | (8.77 | ) | 6.44 | | 2.53 | |
Total from investment operations | | 3.54 | | 2.71 | | 3.01 | | (8.90 | ) | 6.28 | | 2.38 | |
Net asset value, end of period | | $ | 22.11 | | $ | 18.57 | | $ | 15.86 | | $ | 12.85 | | $ | 21.75 | | $ | 15.47 | |
Total return | | 19.1 | % | 17.1 | % | 23.3 | % | (40.9 | )% | 40.6 | % | 18.2 | % |
RATIOS/SUPPLEMENTAL DATA: | | | | | | | | | | | | | |
Net assets, end of period (000’s omitted) | | $ | 231,894 | | $ | 171,344 | | $ | 89,676 | | $ | 53,557 | | $ | 39,442 | | $ | 5,969 | |
Ratio of gross expenses to average net assets | | 1.68 | % | 1.67 | % | 1.71 | % | 1.68 | % | 1.72 | % | 1.79 | % |
Ratio of expense reimbursements to average net assets | | 0.00 | % | 0.00 | % | 0.00 | % | 0.00 | % | 0.00 | % | 0.00 | % |
Ratio of net expenses to average net assets | | 1.68 | % | 1.67 | % | 1.71 | % | 1.68 | % | 1.72 | % | 1.79 | % |
Ratio of net investment income (loss) to average net assets | | (0.69 | )% | (0.55 | )% | (0.18 | )% | (0.70 | )% | (0.86 | )% | (0.90 | )% |
Portfolio turnover rate | | 73.44 | % | 209.52 | % | 306.87 | % | 291.85 | % | 232.13 | % | 225.25 | % |
(i) Unaudited. Ratios have been annualized; total return and portfolio turnover rate have not been annualized.
(ii) Amount was computed based on average shares outstanding during the period.
See Notes to Financial Statements.
45
Alger Large Cap Growth Institutional Fund
| | Class I | |
| | Six months
ended
4/30/2011(i) | | Year ended
10/31/2010 | | Year ended
10/31/2009 | | Year ended
10/31/2008 | | Year ended
10/31/2007 | | Year ended
10/31/2006 | |
Net asset value, beginning of period | | $ | 13.03 | | $ | 11.17 | | $ | 9.48 | | $ | 16.87 | | $ | 13.25 | | $ | 12.56 | |
INCOME FROM INVESTMENT OPERATIONS: | | | | | | | | | | | | | |
Net investment income (loss)(ii) | | (0.01 | ) | 0.07 | | 0.04 | | (0.01 | ) | (0.03 | ) | (0.01 | ) |
Net realized and unrealized gain (loss) on investments | | 1.87 | | 1.83 | | 1.65 | | (7.38 | ) | 3.65 | | 0.74 | |
Total from investment operations | | 1.86 | | 1.90 | | 1.69 | | (7.39 | ) | 3.62 | | 0.73 | |
Dividends from net investment income | | (0.10 | ) | (0.04 | ) | — | | — | | — | | (0.04 | ) |
Net asset value, end of period | | $ | 14.79 | | $ | 13.03 | | $ | 11.17 | | $ | 9.48 | | $ | 16.87 | | $ | 13.25 | |
Total return | | 14.4 | % | 17.1 | % | 17.7 | % | (43.8 | )% | 27.3 | % | 5.8 | % |
RATIOS/SUPPLEMENTAL DATA: | | | | | | | | | | | | | |
Net assets, end of period (000’s omitted) | | $ | 18,940 | | $ | 22,961 | | $ | 39,412 | | $ | 20,415 | | $ | 52,127 | | $ | 106,335 | |
Ratio of gross expenses to average net assets | | 1.60 | % | 1.36 | % | 1.37 | % | 1.23 | % | 1.32 | % | 1.21 | % |
Ratio of expense reimbursements to average net assets | | 0.00 | % | 0.00 | % | 0.00 | % | 0.00 | % | 0.00 | % | 0.00 | % |
Ratio of net expenses to average net assets | | 1.60 | % | 1.36 | % | 1.37 | % | 1.23 | % | 1.32 | % | 1.21 | % |
Ratio of net investment income (loss) to average net assets | | (0.17 | )% | 0.56 | % | 0.46 | % | 0.04 | % | (0.19 | )% | (0.08 | )% |
Portfolio turnover rate | | 31.66 | % | 58.73 | % | 87.57 | % | 187.80 | % | 192.18 | % | 322.72 | % |
(i) Unaudited. Ratios have been annualized; total return and portfolio turnover rate have not been annualized.
(ii) Amount was computed based on average shares outstanding during the period.
See Notes to Financial Statements.
46
Alger Large Cap Growth Institutional Fund
| | Class R | |
| | Six months
ended
4/30/2011(i) | | Year ended
10/31/2010 | | Year ended
10/31/2009 | | Year ended
10/31/2008 | | Year ended
10/31/2007 | | Year ended
10/31/2006 | |
Net asset value, beginning of period | | $ | 12.59 | | $ | 10.83 | | $ | 9.24 | | $ | 16.52 | | $ | 13.04 | | $ | 12.39 | |
INCOME FROM INVESTMENT OPERATIONS: | | | | | | | | | | | | | |
Net investment loss(ii) | | (0.06 | ) | (0.02 | ) | 0.00 | | (0.08 | ) | (0.10 | ) | (0.08 | ) |
Net realized and unrealized gain (loss) on investments | | 1.82 | | 1.78 | | 1.59 | | (7.20 | ) | 3.58 | | 0.73 | |
Total from investment operations | | 1.76 | | 1.76 | | 1.59 | | (7.28 | ) | 3.48 | | 0.65 | |
Dividends from net investment income | | (0.02 | ) | — | | — | | — | | — | | — | |
Net asset value, end of period | | $ | 14.33 | | $ | 12.59 | | $ | 10.83 | | $ | 9.24 | | $ | 16.52 | | $ | 13.04 | |
Total return | | 14.0 | % | 16.3 | % | 17.2 | % | (44.1 | )% | 26.7 | % | 5.3 | % |
RATIOS/SUPPLEMENTAL DATA: | | | | | | | | | | | | | |
Net assets, end of period (000’s omitted) | | $ | 5,774 | | $ | 6,110 | | $ | 5,933 | | $ | 5,112 | | $ | 8,747 | | $ | 5,372 | |
Ratio of gross expenses to average net assets | | 2.32 | % | 2.05 | % | 1.89 | % | 1.73 | % | 1.81 | % | 1.71 | % |
Ratio of expense reimbursements to average net assets | | 0.00 | % | 0.00 | % | 0.00 | % | 0.00 | % | 0.00 | % | 0.00 | % |
Ratio of net expenses to average net assets | | 2.32 | % | 2.05 | % | 1.89 | % | 1.73 | % | 1.81 | % | 1.71 | % |
Ratio of net investment income (loss) to average net assets | | (0.90 | )% | (0.16 | )% | (0.03 | )% | (0.55 | )% | (0.72 | )% | (0.59 | )% |
Portfolio turnover rate | | 31.66 | % | 58.73 | % | 87.57 | % | 187.80 | % | 192.18 | % | 322.72 | % |
(i) Unaudited. Ratios have been annualized; total return and portfolio turnover rate have not been annualized.
(ii) Amount was computed based on average shares outstanding during the period.
See Notes to Financial Statements.
47
Alger Mid Cap Growth Institutional Fund
| | Class I | |
| | Six months
ended
4/30/2011(i) | | Year ended
10/31/2010 | | Year ended
10/31/2009 | | Year ended
10/31/2008 | | Year ended
10/31/2007 | | Year ended
10/31/2006 | |
Net asset value, beginning of period | | $ | 13.11 | | $ | 10.68 | | $ | 8.76 | | $ | 23.24 | | $ | 17.29 | | $ | 17.57 | |
INCOME FROM INVESTMENT OPERATIONS: | | | | | | | | | | | | | |
Net investment income (loss)(ii) | | (0.05 | ) | 0.01 | | (0.04 | ) | (0.09 | ) | (0.11 | ) | (0.09 | ) |
Net realized and unrealized gain (loss) on investments | | 3.18 | | 2.42 | | 1.96 | | (10.85 | ) | 7.44 | | 1.69 | |
Total from investment operations | | 3.13 | | 2.43 | | 1.92 | | (10.94 | ) | 7.33 | | 1.60 | |
Dividends from net investment income | | (0.03 | ) | — | | — | | — | | — | | — | |
Distributions from net realized gains | | — | | — | | — | | (3.54 | ) | (1.38 | ) | (1.88 | ) |
Net asset value, end of period | | $ | 16.21 | | $ | 13.11 | | $ | 10.68 | | $ | 8.76 | | $ | 23.24 | | $ | 17.29 | |
Total return | | 23.9 | % | 22.8 | % | 21.8 | % | (55.0 | )% | 45.5 | % | 9.5 | % |
RATIOS/SUPPLEMENTAL DATA: | | | | | | | | | | | | | |
Net assets, end of period (000’s omitted) | | $ | 642,233 | | $ | 737,099 | | $ | 872,936 | | $ | 882,046 | | $ | 2,032,326 | | $ | 1,349,500 | |
Ratio of gross expenses to average net assets | | 1.17 | % | 1.12 | % | 1.17 | % | 1.11 | % | 1.17 | % | 1.13 | % |
Ratio of expense reimbursements to average net assets | | 0.00 | % | 0.00 | % | 0.00 | % | 0.00 | % | 0.00 | % | 0.00 | % |
Ratio of net expenses to average net assets | | 1.17 | % | 1.12 | % | 1.17 | % | 1.11 | % | 1.17 | % | 1.13 | % |
Ratio of net investment income (loss) to average net assets | | (0.73 | )% | 0.07 | % | (0.44 | )% | (0.56 | )% | (0.54 | )% | (0.54 | )% |
Portfolio turnover rate | | 108.28 | % | 193.69 | % | 297.99 | % | 324.49 | % | 274.32 | % | 253.59 | % |
(i) Unaudited. Ratios have been annualized; total return and portfolio turnover rate have not been annualized.
(ii) Amount was computed based on average shares outstanding during the period.
See Notes to Financial Statements.
48
Alger Mid Cap Growth Institutional Fund
| | Class R | |
| | Six months
ended
4/30/2011(i) | | Year ended
10/31/2010 | | Year ended
10/31/2009 | | Year ended
10/31/2008 | | Year ended
10/31/2007 | | Year ended
10/31/2006 | |
Net asset value, beginning of period | | $ | 12.51 | | $ | 10.24 | | $ | 8.45 | | $ | 22.64 | | $ | 16.95 | | $ | 17.34 | |
INCOME FROM INVESTMENT OPERATIONS: | | | | | | | | | | | | | |
Net investment loss(ii) | | (0.09 | ) | (0.05 | ) | (0.08 | ) | (0.16 | ) | (0.20 | ) | (0.18 | ) |
Net realized and unrealized gain (loss) on investments | | 3.04 | | 2.32 | | 1.87 | | (10.49 | ) | 7.27 | | 1.67 | |
Total from investment operations | | 2.95 | | 2.27 | | 1.79 | | (10.65 | ) | 7.07 | | 1.49 | |
Distributions from net realized gains | | — | | — | | — | | (3.54 | ) | (1.38 | ) | (1.88 | ) |
Net asset value, end of period | | $ | 15.46 | | $ | 12.51 | | $ | 10.24 | | $ | 8.45 | | $ | 22.64 | | $ | 16.95 | |
Total return | | 23.6 | % | 22.2 | % | 21.0 | % | (55.3 | )% | 44.7 | % | 9.0 | % |
RATIOS/SUPPLEMENTAL DATA: | | | | | | | | | | | | | |
Net assets, end of period (000’s omitted) | | $ | 53,965 | | $ | 50,016 | | $ | 50,919 | | $ | 40,374 | | $ | 69,877 | | $ | 43,355 | |
Ratio of gross expenses to average net assets | | 1.73 | % | 1.65 | % | 1.68 | % | 1.61 | % | 1.67 | % | 1.63 | % |
Ratio of expense reimbursements to average net assets | | 0.00 | % | 0.00 | % | 0.00 | % | 0.00 | % | 0.00 | % | 0.00 | % |
Ratio of net expenses to average net assets | | 1.73 | % | 1.65 | % | 1.68 | % | 1.61 | % | 1.67 | % | 1.63 | % |
Ratio of net investment income (loss) to average net assets | | (1.29 | )% | (0.46 | )% | (0.96 | )% | (1.05 | )% | (1.04 | )% | (1.05 | )% |
Portfolio turnover rate | | 108.28 | % | 193.69 | % | 297.99 | % | 324.49 | % | 274.32 | % | 253.59 | % |
(i) Unaudited. Ratios have been annualized; total return and portfolio turnover rate have not been annualized.
(ii) Amount was computed based on average shares outstanding during the period.
See Notes to Financial Statements.
49
Alger Small Cap Growth Institutional Fund
| | Class I | |
| | Six months
ended
4/30/2011(i) | | Year ended
10/31/2010 | | Year ended
10/31/2009 | | Year ended
10/31/2008 | | Year ended
10/31/2007 | | Year ended
10/31/2006 | |
Net asset value, beginning of period | | $ | 25.28 | | $ | 19.90 | | $ | 16.52 | | $ | 30.30 | | $ | 23.98 | | $ | 19.97 | |
INCOME FROM INVESTMENT OPERATIONS: | | | | | | | | | | | | | |
Net investment loss(ii) | | (0.14 | ) | (0.22 | ) | (0.16 | ) | (0.23 | ) | (0.21 | ) | (0.16 | ) |
Net realized and unrealized gain (loss) on investments | | 6.80 | | 5.60 | | 3.54 | | (13.55 | ) | 6.53 | | 4.17 | |
Total from investment operations | | 6.66 | | 5.38 | | 3.38 | | (13.78 | ) | 6.32 | | 4.01 | |
Net asset value, end of period | | $ | 31.94 | | $ | 25.28 | | $ | 19.90 | | $ | 16.52 | | $ | 30.30 | | $ | 23.98 | |
Total return | | 26.3 | % | 27.0 | % | 20.5 | % | (45.5 | )% | 26.4 | % | 20.1 | % |
RATIOS/SUPPLEMENTAL DATA: | | | | | | | | | | | | | |
Net assets, end of period (000’s omitted) | | $ | 1,359,243 | | $ | 1,104,866 | | $ | 968,776 | | $ | 634,542 | | $ | 894,802 | | $ | 305,843 | |
Ratio of gross expenses to average net assets | | 1.17 | % | 1.23 | % | 1.32 | % | 1.27 | % | 1.33 | % | 1.31 | % |
Ratio of expense reimbursements to average net assets | | 0.00 | % | 0.00 | % | 0.00 | % | 0.00 | % | (0.03 | )% | 0.00 | % |
Ratio of net expenses to average net assets | | 1.17 | % | 1.23 | % | 1.32 | % | 1.27 | % | 1.30 | % | 1.31 | % |
Ratio of net investment income (loss) to average net assets | | (0.99 | )% | (0.94 | )% | (0.94 | )% | (0.97 | )% | (0.78 | )% | (0.74 | )% |
Portfolio turnover rate | | 38.43 | % | 61.40 | % | 90.49 | % | 62.68 | % | 67.53 | % | 88.67 | % |
(i) Unaudited. Ratios have been annualized; total return and portfolio turnover rate have not been annualized.
(ii) Amount was computed based on average shares outstanding during the period.
See Notes to Financial Statements.
50
Alger Small Cap Growth Institutional Fund
| | Class R | |
| | Six months
ended
4/30/2011(i) | | Year ended
10/31/2010 | | Year ended
10/31/2009 | | Year ended
10/31/2008 | | Year ended
10/31/2007 | | Year ended
10/31/2006 | |
Net asset value, beginning of period | | $ | 24.39 | | $ | 19.30 | | $ | 16.08 | | $ | 29.64 | | $ | 23.58 | | $ | 19.74 | |
INCOME FROM INVESTMENT OPERATIONS: | | | | | | | | | | | | | |
Net investment loss(ii) | | (0.21 | ) | (0.31 | ) | (0.22 | ) | (0.35 | ) | (0.35 | ) | (0.28 | ) |
Net realized and unrealized gain (loss) on investments | | 6.56 | | 5.40 | | 3.44 | | (13.21 | ) | 6.41 | | 4.12 | |
Total from investment operations | | 6.35 | | 5.09 | | 3.22 | | (13.56 | ) | 6.06 | | 3.84 | |
Net asset value, end of period | | $ | 30.74 | | $ | 24.39 | | $ | 19.30 | | $ | 16.08 | | $ | 29.64 | | $ | 23.58 | |
Total return | | 26.0 | % | 26.4 | % | 20.1 | % | (45.8 | )% | 25.7 | % | 19.5 | % |
RATIOS/SUPPLEMENTAL DATA: | | | | | | | | | | | | | |
Net assets, end of period (000’s omitted) | | $ | 79,901 | | $ | 68,071 | | $ | 51,707 | | $ | 39,033 | | $ | 47,042 | | $ | 8,018 | |
Ratio of gross expenses to average net assets | | 1.71 | % | 1.69 | % | 1.73 | % | 1.77 | % | 1.86 | % | 1.83 | % |
Ratio of expense reimbursements to average net assets | | 0.00 | % | 0.00 | % | 0.00 | % | 0.00 | % | (0.03 | )% | 0.00 | % |
Ratio of net expenses to average net assets | | 1.71 | % | 1.69 | % | 1.73 | % | 1.77 | % | 1.83 | % | 1.83 | % |
Ratio of net investment income (loss) to average net assets | | (1.52 | )% | (1.40 | )% | (1.35 | )% | (1.47 | )% | (1.32 | )% | (1.26 | )% |
Portfolio turnover rate | | 38.43 | % | 61.40 | % | 90.49 | % | 62.68 | % | 67.53 | % | 88.67 | % |
(i) Unaudited. Ratios have been annualized; total return and portfolio turnover rate have not been annualized.
(ii) Amount was computed based on average shares outstanding during the period.
See Notes to Financial Statements.
51
THE ALGER INSTITUTIONAL FUNDS
NOTES TO FINANCIAL STATEMENTS (Unaudited)
NOTE 1 — General:
The Alger Institutional Funds (the “Trust”), is a diversified, open-end registered investment company organized as a business trust under the laws of the Commonwealth of Massachusetts. The Trust operates as a series company and currently issues an unlimited number of shares of beneficial interest in four funds — Alger Capital Appreciation Institutional Fund, Alger Large Cap Growth Institutional Fund, Alger Mid Cap Growth Institutional Fund and Alger Small Cap Growth Institutional Fund (collectively, the “Funds” or individually, each a “Fund”). The Funds normally invest primarily in equity securities and each has an investment objective of long-term capital appreciation.
Each Fund offers Class I and Class R shares. Each class has identical rights to assets and earnings except that each share class bears the cost of its transfer agency and sub-transfer agency services and Class R shares bear the cost of its plan of distribution.
NOTE 2 — Significant Accounting Policies:
(a) Investment Valuation: The Funds value their financial instruments at fair value using independent dealers or pricing services under policies approved by the Board. Investments are valued on each day the New York Stock Exchange (the “NYSE”) is open, as of the close of the NYSE (normally 4:00 p.m. Eastern time).
Equity securities and option contracts for which valuation information is readily available are valued at the last reported sales price or official closing price as reported by an independent pricing service on the primary market or exchange on which they are traded. In the absence of reported sales, such securities are valued at a price within the bid and ask price or, in the absence of a recent bid or ask price, the equivalent as obtained from one or more of the major market makers for the securities to be valued.
Debt securities generally trade in the over-the-counter market. Debt securities with remaining maturities of more than sixty days at the time of acquisition are valued on the basis of last available bid prices or current market quotations provided by dealers or pricing services. In determining the value of a particular investment, pricing services may use certain information with respect to transactions in such investments, quotations from dealers, pricing matrixes, market transactions in comparable investments, various relationships observed in the market between investments and calculated yield measures based on valuation technology commonly employed in the market for such investments. Asset-backed and mortgage-backed securities are valued by independent pricing services using models that consider estimated cash flows of each tranche of the security, establish a benchmark yield and develop an estimated tranche-specific spread to the benchmark yield based on the unique attributes of the tranche.
Securities for which market quotations are not readily available are valued at fair value, as determined in good faith pursuant to procedures established by the Board of Trustees.
Securities in which the Funds invest may be traded in foreign markets that close before the close of the NYSE. Developments that occur between the close of the foreign
52
THE ALGER INSTITUTIONAL FUNDS
NOTES TO FINANCIAL STATEMENTS (Unaudited) (Continued)
markets and the close of the NYSE may result in adjustments to the closing prices to reflect what the investment adviser, pursuant to policies established by the Board of Trustees, believes to be the fair value of these securities as of the close of the NYSE. The Funds may also fair value securities in other situations, for example, when a particular foreign market is closed but the Fund is open.
Financial Accounting Standards Board Accounting Standards Codification 820 — Fair Value Measurements and Disclosures (“ASC 820”) defines fair value as the price that the Funds would receive upon selling an investment in a timely transaction to an independent buyer in the principal or most advantageous market of the investment. ASC 820 established a three-tier hierarchy to maximize the use of observable market data and minimize the use of unobservable inputs and to establish classification of fair value measurements for disclosure purposes. Inputs refer broadly to the assumptions that market participants would use in pricing the asset or liability and may be observable or unobservable. Observable inputs are based on market data obtained from sources independent of the Funds. Unobservable inputs are inputs that reflect the Funds’ own assumptions based on the best information available in the circumstances. The three-tier hierarchy of inputs is summarized in the three broad Levels listed below.
· Level 1 — quoted prices in active markets for identical investments
· Level 2 — significant other observable inputs (including quoted prices for similar investments, interest rates, prepayment speeds, credit risk, etc.)
· Level 3 — significant unobservable inputs (including the Funds’ own assumptions in determining the fair value of investments)
The Funds’ valuation techniques are consistent with the market approach whereby prices and other relevant information generated by market transactions involving identical or comparable assets are used to measure fair value. Inputs for Level 1 include exchange listed prices and broker quotes in an active market. Inputs for Level 2 include the last trade price in the case of a halted security, a broker quote in an inactive market, an exchange listed price which has been adjusted for fair value factors, and prices of closely related securities. Additional Level 2 inputs include an evaluated price which is based upon a compilation of observable market information such as spreads for fixed income and preferred securities. Inputs for Level 3 include derived prices from unobservable market information which can include cash flows and other information obtained from a company’s financial statements, or from market indicators such as benchmarks and indices.
(b) Cash and Cash Equivalents: Cash and cash equivalents include U.S. dollars and short-term securities maturing in sixty days or less. Such short-term securities are valued at amortized cost which approximates market value.
(c) Securities Transactions and Investment Income: Securities transactions are recorded on a trade date basis. Realized gains and losses from securities transactions are recorded on the identified cost basis. Dividend income is recognized on the ex-dividend date and interest income is recognized on the accrual basis.
53
THE ALGER INSTITUTIONAL FUNDS
NOTES TO FINANCIAL STATEMENTS (Unaudited) (Continued)
(d) Foreign Currency Translations: The books and records of the Funds are maintained in U.S. dollars. Foreign currencies, investments and other assets and liabilities are translated into U.S. dollars at the prevailing rates of exchange on the valuation date. Purchases and sales of investment securities and income and expenses are translated into U.S. dollars at the prevailing exchange rates on the respective dates of such transactions.
Net realized gains and losses on foreign currency transactions represent net gains and losses from the disposition of foreign currencies, currency gains and losses realized between the trade dates and settlement dates of security transactions, and the difference between the amount of net investment income accrued and the U.S. dollar amount actually received. The effects of changes in foreign currency exchange rates on investments in securities are included in realized and unrealized gain or loss on investments in the Statement of Operations.
(e) Option Contracts: When a Fund writes an option, an amount equal to the premium received by the Fund is recorded as a liability and is subsequently adjusted to the current fair value of the option written. Premiums received from writing options that expire unexercised are treated by the Fund on the expiration date as realized gains from investments. The difference between the premium and the amount paid on effecting a closing purchase transaction, including brokerage commissions, is also treated as a realized gain, or, if the premium is less than the amount paid for the closing purchase transaction, as a realized loss. If a call option is exercised, the premium is added to the proceeds from the sale of the underlying security in determining whether the Fund has realized a gain or loss. If a put option is exercised, the premium reduces the cost basis of the securities purchased by the Fund. The Fund as writer of an option bears the market risk of an unfavorable change in the price of the security underlying the written option.
The Funds may also purchase put and call options. Each Fund pays a premium which is included in the Fund’s Statement of Assets and Liabilities as an investment and subsequently marked to market to reflect the current value of the option. Premiums paid for purchasing options which expire are treated as realized losses. The risk associated with purchasing put and call options is limited to the premium paid. Premiums paid for purchasing options which are exercised or closed are added to the amounts paid or offset against the proceeds on the underlying security to determine the realized gain or loss.
(f) Dividends to Shareholders: Dividends and distributions payable to shareholders are recorded by the Funds on the ex-dividend date. Dividends from net investment income and distributions from net realized gains are declared and paid annually after the end of the fiscal year in which earned.
Each class is treated separately in determining the amounts of dividends from net investment income payable to holders of its shares.
The characterization of distributions to shareholders for financial reporting purposes is determined in accordance with federal income tax rules. Therefore, the source of a Fund’s distributions may be shown in the accompanying financial statements as either from, or in excess of net investment income, net realized gain on investment transactions or return of capital, depending on the type of book/tax differences that may exist. Capital accounts within the financial statements are adjusted for permanent book/tax differences.
54
THE ALGER INSTITUTIONAL FUNDS
NOTES TO FINANCIAL STATEMENTS (Unaudited) (Continued)
Reclassifications result primarily from the difference in tax treatment of net operating losses, passive foreign investment companies, and foreign currency transactions. The reclassifications are done annually at fiscal year end and have no impact on the net asset value of the Fund and are designed to present the Fund’s capital accounts on a tax basis.
(g) Federal Income Taxes: It is each Fund’s policy to comply with the requirements of the Internal Revenue Code Subchapter M applicable to regulated investment companies and to distribute all of its taxable income to its shareholders. Provided that the Funds maintain such compliance, no federal income tax provision is required. Each Fund is treated as a separate entity for the purpose of determining such compliance.
Financial Accounting Standards Board Accounting Standards Codification 740 — Income Taxes (“ASC 740”) requires the Funds to measure and recognize in their financial statements the benefit of a tax position taken (or expected to be taken) on an income tax return if such position will more likely than not be sustained upon examination based on the technical merits of the position. No tax years are currently under investigation. The Funds file income tax returns in the U.S. Federal jurisdiction, as well as the New York State and New York City jurisdictions. The statute of limitations on the Fund’s tax returns remains open for the tax years 2007-2010. Management does not believe there are any uncertain tax positions that require recognition of a tax liability.
(h) Allocation Methods: The Trust accounts separately for the assets, liabilities and operations of each Fund. Expenses directly attributable to each Fund are charged to that Fund’s operations; expenses which are applicable to all Funds are allocated among them based on net assets. Income, realized and unrealized gains and losses, and expenses of each Fund are allocated among the Fund’s classes based on relative net assets, with the exception of distribution fees and transfer agency fees.
(i) Estimates: These financial statements have been prepared in accordance with accounting principles generally accepted in the United States of America, which require using estimates and assumptions that affect the reported amounts therein. Actual results may differ from those estimates. These unaudited interim financial statements reflect all adjustments which are, in the opinion of management, necessary to a present a fair statement of results for the interim period. All such adjustments are of a normal recurring nature.
NOTE 3 — Investment Advisory Fees and Other Transactions with Affiliates:
(a) Investment Advisory and Administration Fees: Fees incurred by each Fund, pursuant to the provisions of its Investment Advisory Agreement and its Administration Agreement with Fred Alger Management, Inc. (Alger Management or the Manager), are payable monthly and computed based on the value of the average daily net assets of each Fund, at the following rates:
55
THE ALGER INSTITUTIONAL FUNDS
NOTES TO FINANCIAL STATEMENTS (Unaudited) (Continued)
| | Advisory
Fee | | Administration
Fee | |
Alger Capital Appreciation Institutional Fund | | .81 | % | .0275 | % |
Alger Large Cap Growth Institutional Fund | | .71 | | .0275 | |
Alger Mid Cap Growth Institutional Fund | | .76 | | .0275 | |
Alger Small Cap Growth Institutional Fund | | .81 | | .0275 | |
(b) Distribution Fees: Class R Shares: The Trust has adopted a Distribution Plan pursuant to which Class R shares of each Fund pay Fred Alger & Company, Incorporated, the Trust’s distributor (the “Distributor” or “Alger Inc.”) and an affiliate of Alger Management, a fee at the annual rate of 0.50% of the respective average daily net assets of the Class R shares of the designated Fund to compensate the Distributor for its activities and expenses incurred in distributing the Class R shares. The fees charged may be more or less than the expenses incurred by the Distributor.
(c) Brokerage Commissions: During the six months ended April 30, 2011, the Alger Capital Appreciation Institutional Fund, Alger Large Cap Growth Institutional Fund, Alger Mid Cap Growth Institutional Fund and Alger Small Cap Growth Institutional Fund paid Alger Inc. commissions of $554,357, $8,303, $639,657 and $453,334, respectively, in connection with securities transactions.
(d) Shareholder Administrative Fees: The Trust has entered into a shareholder administrative services agreement with Alger Management, to compensate Alger Management for its liaison and administrative oversight of Boston Financial Data Services, Inc. the transfer agent, and other related services. The Fund compensates Alger Management at the annual rate of 0.01% of the average daily net assets for these services. From November 1, 2010 through April 30, 2011, the Alger Capital Appreciation Institutional Fund, Alger Large Cap Growth Institutional Fund, Alger Mid Cap Growth Institutional Fund and Alger Small Cap Growth Institutional Fund incurred fees of $55,693, $1,303, $38,720 and $64,180, respectively, for these services provided by Alger Management, which are included in the transfer agent fees and expenses in the Statement of Operations.
(e) Shareholder Servicing Fees: The Trust has entered into a shareholder servicing agreement with Alger Inc. whereby Alger Inc. provides the Trust with ongoing servicing of shareholder accounts. As compensation for such services, each Fund pays Alger Inc. a monthly fee at an annual rate of 0.25% of the value of its average daily net assets. The fees charged may be more or less than the expenses incurred by the Distributor.
(f) Trustee Fees: Each Fund pays each trustee who is not affiliated with Alger Management or its affiliates $750 for each meeting attended, to a maximum of $3,000 per annum, plus travel expenses incurred for attending the meeting. The Chairman of the Board of Trustees receives an additional annual fee of $15,000 which is paid, pro rata, by all funds managed by Alger Management. Additionally, each member of a Fund’s audit committee receives an additional $75 from the Fund for each audit committee meeting attended, to a maximum of $300 per annum.
(g) Interfund Loans: The Funds, along with other funds advised by Alger Management, may borrow money from and lend money to each other for temporary or emergency purposes. To the extent permitted under its investment restrictions, each fund may lend uninvested
56
THE ALGER INSTITUTIONAL FUNDS
NOTES TO FINANCIAL STATEMENTS (Unaudited) (Continued)
cash in an amount up to 15% of its net assets to other funds, and each fund may borrow in an amount up to 10% of its net assets from other funds. If a fund has borrowed from other funds and has aggregate borrowings from all sources that exceed 10% of the fund’s total assets, such fund will secure all of its loans from other funds. The interest rate charged on interfund loans is equal to the average of the overnight time deposit rate and bank loan rate available to the funds.
During the six months ended April 30 2011, Alger Large Cap Growth Institutional Fund and Alger Mid Cap Growth Institutional Fund incurred interest expense of $573 and $8,971, respectively, in connection with interfund loans.
(h) Other Transactions With Affiliates: Certain officers of the Trust are directors and officers of Alger Management and the Distributor.
NOTE 4 — Securities Transactions:
The following summarizes the securities transactions by the Funds, other than short-term securities, for the six months ended April 30, 2011:
| | PURCHASES | | SALES | |
Alger Capital Appreciation Institutional Fund | | $ | 854,921,661 | | $ | 794,986,743 | |
Alger Large Cap Growth Institutional Fund | | 8,060,140 | | 16,547,625 | |
Alger Mid Cap Growth Institutional Fund | | 820,005,046 | | 1,066,105,041 | |
Alger Small Cap Growth Institutional Fund | | 479,305,630 | | 532,747,528 | |
| | | | | | | |
Written call and put options activity for the six months ended April 30, 2011, was as follows:
| | NUMBER OF
CONTRACTS | | PREMIUMS
RECEIVED | |
Alger Mid Cap Growth Institutional Fund | | | | | |
Call Options outstanding at October 31, 2010 | | — | | $ | — | |
Call Options written | | 769 | | 140,801 | |
Call Options closed | | — | | — | |
Call Options expired | | — | | — | |
Call Options exercised | | — | | — | |
Call Options outstanding at April 30, 2011 | | 769 | | $ | 140,801 | |
| | NUMBER OF
CONTRACTS | | PREMIUMS
RECEIVED | |
Alger Mid Cap Growth Institutional Fund | | | | | |
Put Options outstanding at October 31, 2010 | | — | | $ | — | |
Put Options written | | 13,836 | | 1,803,954 | |
Put Options closed | | 13,236 | | 1,679,165 | |
Put Options expired | | — | | — | |
Put Options exercised | | — | | — | |
Put Options outstanding at April 30, 2011 | | 600 | | $ | 124,789 | |
57
THE ALGER INSTITUTIONAL FUNDS
NOTES TO FINANCIAL STATEMENTS (Unaudited) (Continued)
As of April 30, 2011, Alger Mid Cap Growth Institutional Fund had portfolio securities valued at $3,426,365, segregated as collateral for written options.
NOTE 5 — Borrowings:
The Funds may borrow from their custodian on an uncommitted basis. Each Fund pays the custodian a market rate of interest, generally based upon the London Inter-Bank Offer Rate. The Funds may also borrow from other funds advised by Alger Management, as discussed in Note 3 (g). For the six months ended April 30, 2011, the Funds had the following borrowings:
| | AVERAGE DAILY
BORROWING | | WEIGHTED AVERAGE
INTEREST RATE | |
Alger Large Cap Growth Institutional Fund | | $ | 106,529 | | 1.20 | % |
Alger Mid Cap Growth Institutional Fund | | 2,333,569 | | 1.46 | |
| | | | | | |
The highest amount borrowed during the six months ended April 30, 2011 for each Fund was as follows:
| | Highest Borrowing | |
Alger Large Cap Growth Institutional Fund | | $ | 2,600,000 | |
Alger Mid Cap Growth Institutional Fund | | 35,000,000 | |
| | | | |
NOTE 6 — Share Capital:
The Trust has an unlimited number of authorized shares of beneficial interest of $.001 par value which are presently divided into four series. Each series is divided into two separate classes. The transactions of shares of beneficial interest were as follows:
| | FOR THE SIX MONTHS ENDED | | FOR THE YEAR ENDED | |
| | APRIL 30, 2011 | | OCTOBER 31, 2010 | |
| | SHARES | | AMOUNT | | SHARES | | AMOUNT | |
Alger Capital Appreciation Institutional Fund | | | | | | | | | |
Class I: | | | | | | | | | |
Shares sold | | 8,327,177 | | $ | 178,472,435 | | 19,473,961 | | $ | 352,937,591 | |
Dividends reinvested | | — | | — | | 66,060 | | 1,200,314 | |
Shares redeemed | | (5,092,342 | ) | (108,688,381 | ) | (16,081,225 | ) | (288,322,885 | ) |
Net increase | | 3,234,835 | | $ | 69,784,054 | | 3,458,796 | | $ | 65,815,020 | |
Class R: | | | | | | | | | |
Shares sold | | 2,493,611 | | $ | 50,783,354 | | 5,268,214 | | $ | 91,995,788 | |
Shares redeemed | | (1,232,988 | ) | (25,100,204 | ) | (1,696,170 | ) | (29,601,642 | ) |
Net increase | | 1,260,623 | | $ | 25,683,150 | | 3,572,044 | | $ | 62,394,146 | |
58
THE ALGER INSTITUTIONAL FUNDS
NOTES TO FINANCIAL STATEMENTS (Unaudited) (Continued)
| | FOR THE SIX MONTHS ENDED | | FOR THE YEAR ENDED | |
| | APRIL 30, 2011 | | OCTOBER 31, 2010 | |
| | SHARES | | AMOUNT | | SHARES | | AMOUNT | |
Alger Large Cap Growth Institutional Fund | | | | | | | | | |
Class I: | | | | | | | | | |
Shares sold | | 362,118 | | $ | 5,097,265 | | 777,982 | | $ | 9,369,072 | |
Dividends reinvested | | 6,139 | | 83,370 | | 9,295 | | 111,911 | |
Shares redeemed | | (849,890 | ) | (11,708,097 | ) | (2,552,508 | ) | (30,084,515 | ) |
Net decrease | | (481,633 | ) | $ | (6,527,463 | ) | (1,765,231 | ) | $ | (20,603,532 | ) |
Class R: | | | | | | | | | |
Shares sold | | 57,931 | | $ | 784,480 | | 110,668 | | $ | 1,296,682 | |
Dividends reinvested | | 117 | | 1,538 | | — | | — | |
Shares redeemed | | (140,308 | ) | (1,903,726 | ) | (173,294 | ) | (2,014,350 | ) |
Net decrease | | (82,260 | ) | $ | (1,117,707 | ) | (62,626 | ) | $ | (717,668 | ) |
| | | | | | | | | |
Alger Mid Cap Growth Institutional Fund | | | | | | | | | |
Class I: | | | | | | | | | |
Shares sold | | 6,094,655 | | $ | 89,834,988 | | 15,997,853 | | $ | 192,249,971 | |
Dividends reinvested | | 104,528 | | 1,490,566 | | — | | — | |
Shares redeemed | | (22,798,488 | ) | (338,648,804 | ) | (41,542,288 | ) | (495,420,451 | ) |
Net decrease | | (16,599,305 | ) | $ | (247,323,250 | ) | (25,544,435 | ) | $ | (303,170,480 | ) |
Class R: | | | | | | | | | |
Shares sold | | 670,284 | | $ | 9,454,010 | | 1,296,391 | | $ | 14,963,925 | |
Shares redeemed | | (1,178,154 | ) | (16,372,050 | ) | (2,270,655 | ) | (25,813,610 | ) |
Net decrease | | (507,870 | ) | $ | (6,918,040 | ) | (974,264 | ) | $ | (10,849,685 | ) |
| | | | | | | | | |
Alger Small Cap Growth Institutional Fund | | | | | | | | | |
Class I: | | | | | | | | | |
Shares sold | | 7,658,633 | | $ | 218,951,550 | | 20,108,242 | | $ | 459,585,650 | |
Shares redeemed | | (8,814,593 | ) | (249,831,411 | ) | (25,069,150 | ) | (573,429,492 | ) |
Net decrease | | (1,155,960 | ) | $ | (30,879,861 | ) | (4,960,908 | ) | $ | (113,843,842 | ) |
Class R: | | | | | | | | | |
Shares sold | | 367,877 | | $ | 10,099,034 | | 930,438 | | $ | 20,803,418 | |
Shares redeemed | | (559,400 | ) | (15,284,892 | ) | (819,511 | ) | (18,337,692 | ) |
Net increase (decrease) | | (191,523 | ) | $ | (5,185,858 | ) | 110,927 | | $ | 2,465,726 | |
During the year ended October 31, 2010, shares redeemed for the Alger Small Cap Growth Institutional Fund included a redemption-in-kind of 1,732,850 Class I shares valued at $38,781,182.
NOTE 7 — Income Tax Information:
At October 31, 2010, the Funds, for federal income tax purposes, had capital loss carryforwards which expire as set forth in the table below. These amounts may be applied against future net realized gains until the earlier of their utilization or expiration.
59
THE ALGER INSTITUTIONAL FUNDS
NOTES TO FINANCIAL STATEMENTS (Unaudited) (Continued)
Expiration Dates | | Alger Capital
Appreciation
Institutional Fund | | Alger Large Cap
Growth
Institutional Fund | | Alger Mid Cap
Growth
Institutional Fund | | Alger Small Cap
Growth
Institutional Fund | |
2011 | | — | | $ | 2,775,036 | | — | | — | |
2016 | | — | | 5,521,428 | | $ | 154,341,477 | | — | |
2017 | | $ | 38,846,382 | | 4,214,883 | | 322,038,630 | | $ | 79,007,358 | |
Total | | $ | 38,846,382 | | $ | 12,511,347 | | $ | 476,380,107 | | $ | 79,007,358 | |
Under the recently enacted Regulated Investment Company Modernization Act of 2010, capital losses incurred by the Funds after October 31, 2011 will not be subject to expiration. In addition, losses incurred after October 31, 2011 must be utilized prior to the utilization of capital loss carryforwards above.
The difference between book-basis and tax-basis unrealized appreciation (depreciation) is determined annually and is attributable primarily to the tax deferral of losses on wash sales, the tax treatment of premium/discount on debt securities, the tax treatment of partnerships investments, the realization of unrealized appreciation of Passive Foreign Investment Companies, and return of capital from Real Estate Investment Trust investments.
NOTE 8 — Fair Value Measurements:
The major categories of securities and their respective fair value inputs are detailed in each Fund’s Schedule of Investments. The following is a summary of the inputs used as of six months ended April 30, 2011 in valuing the Funds’ investments carried at fair value:
Alger Capital Appreciation Institutional
Fund | | TOTAL FUND | | LEVEL 1 | | LEVEL 2 | | LEVEL 3 | |
COMMON STOCKS | | | | | | | | | |
Consumer Discretionary | | $ | 162,875,570 | | $ | 162,875,570 | | — | | — | |
Consumer Staples | | 51,759,072 | | 51,759,072 | | — | | — | |
Energy | | 146,726,302 | | 146,726,302 | | — | | — | |
Financials | | 85,460,495 | | 85,460,495 | | — | | — | |
Health Care | | 131,781,273 | | 131,781,273 | | — | | — | |
Industrials | | 194,236,010 | | 194,236,010 | | — | | — | |
Information Technology | | 369,402,819 | | 369,402,819 | | — | | — | |
Materials | | 61,166,798 | | 61,166,798 | | — | | — | |
Telecommunication Services | | 6,890,283 | | 6,890,283 | | — | | — | |
TOTAL COMMON STOCKS | | $ | 1,210,298,622 | | $ | 1,210,298,622 | | — | | — | |
CONVERTIBLE PREFERRED STOCK | | | | | | | | | |
Health Care | | $ | 3,475,570 | | — | | — | | $ | 3,475,570 | |
TOTAL INVESTMENTS IN SECURITIES | | $ | 1,213,774,192 | | $ | 1,210,298,622 | | — | | $ | 3,475,570 | |
60
THE ALGER INSTITUTIONAL FUNDS
NOTES TO FINANCIAL STATEMENTS (Unaudited) (Continued)
Alger Large Cap Growth Institutional
Fund | | TOTAL FUND | | LEVEL 1 | | LEVEL 2 | | LEVEL 3 | |
COMMON STOCKS | | | | | | | | | |
Consumer Discretionary | | $ | 3,467,488 | | $ | 3,467,488 | | — | | — | |
Consumer Staples | | 1,851,062 | | 1,851,062 | | — | | — | |
Energy | | 2,707,700 | | 2,707,700 | | — | | — | |
Financials | | 1,325,097 | | 1,325,097 | | — | | — | |
Health Care | | 2,385,495 | | 2,385,495 | | — | | — | |
Industrials | | 2,733,537 | | 2,733,537 | | — | | — | |
Information Technology | | 6,886,378 | | 6,886,378 | | — | | — | |
Materials | | 1,163,449 | | 1,163,449 | | — | | — | |
Telecommunication Services | | 245,857 | | 245,857 | | — | | — | |
TOTAL COMMON STOCKS | | $ | 22,766,063 | | $ | 22,766,063 | | — | | — | |
TOTAL INVESTMENTS IN SECURITIES | | $ | 22,766,063 | | $ | 22,766,063 | | — | | — | |
Alger Mid Cap Growth Institutional
Fund | | TOTAL FUND | | LEVEL 1 | | LEVEL 2 | | LEVEL 3 | |
COMMON STOCKS | | | | | | | | | |
Consumer Discretionary | | $ | 91,900,338 | | $ | 91,900,338 | | — | | — | |
Consumer Staples | | 11,743,168 | | 11,743,168 | | — | | — | |
Energy | | 62,543,654 | | 62,543,654 | | — | | — | |
Financials | | 50,245,240 | | 50,245,240 | | — | | — | |
Health Care | | 80,386,658 | | 80,386,658 | | — | | — | |
Industrials | | 141,123,013 | | 141,123,013 | | — | | — | |
Information Technology | | 194,908,263 | | 194,908,263 | | — | | — | |
Materials | | 58,077,406 | | 58,077,406 | | — | | — | |
TOTAL COMMON STOCKS | | $ | 690,927,740 | | $ | 690,927,740 | | — | | — | |
CONVERTIBLE PREFERRED STOCK | | | | | | | | | |
Health Care | | $ | 10,607,090 | | — | | — | | $ | 10,607,090 | |
TOTAL INVESTMENTS IN SECURITIES | | $ | 701,534,830 | | $ | 690,927,740 | | — | | $ | 10,607,090 | |
SECURITIES SOLD SHORT | | | | | | | | | |
OPTIONS WRITTEN | | | | | | | | | |
Energy | | $ | 270,460 | | $ | 270,460 | | — | | — | |
TOTAL SECURITIES SOLD SHORT | | $ | 270,460 | | $ | 270,460 | | — | | — | |
61
THE ALGER INSTITUTIONAL FUNDS
NOTES TO FINANCIAL STATEMENTS (Unaudited) (Continued)
Alger Small Cap Growth Institutional
Fund | | TOTAL FUND | | LEVEL 1 | | LEVEL 2 | | LEVEL 3 | |
COMMON STOCKS | | | | | | | | | |
Consumer Discretionary | | $ | 262,189,567 | | $ | 262,189,567 | | — | | — | |
Consumer Staples | | 31,804,684 | | 31,804,684 | | — | | — | |
Energy | | 83,130,048 | | 83,130,048 | | — | | — | |
Financials | | 57,099,243 | | 57,099,243 | | — | | — | |
Health Care | | 253,566,585 | | 253,566,585 | | — | | — | |
Industrials | | 225,827,067 | | 225,827,067 | | — | | — | |
Information Technology | | 383,249,198 | | 383,249,198 | | — | | — | |
Materials | | 75,356,522 | | 75,356,522 | | — | | — | |
Utilities | | 15,277,258 | | 15,277,258 | | — | | — | |
TOTAL COMMON STOCKS | | $ | 1,387,500,172 | | $ | 1,387,500,172 | | — | | — | |
TOTAL INVESTMENTS IN SECURITIES | | $ | 1,387,500,172 | | $ | 1,387,500,172 | | — | | — | |
| | FAIR VALUE
MEASUREMENTS
USING SIGNIFICANT
UNOBSERVABLE
INPUTS (LEVEL3) | |
Alger Capital Appreciation Institutional Fund | | Convertible
Preferred Stock | |
Opening balance at November 1, 2010 | | $ | — | |
Transfers into Level 3 | | — | |
Transfers out of Level 3 | | — | |
Total gains or losses | | | |
Included in net realized gain (loss) on investments | | — | |
Included in net unrealized gain (loss) on investments | | — | |
Purchases, issuances, sales, and settlements | | | |
Purchases | | 3,475,570 | |
Issuances | | — | |
Sales | | — | |
Settlements | | — | |
Closing balance at April 30, 2011 | | 3,475,570 | |
The amount of total gains or losses for the period included in net realized and unrealized gain (loss) attributable to change in unrealized appreciation (depreciation) relating to investments still held at April 30, 2011 | | $ | — | |
62
THE ALGER INSTITUTIONAL FUNDS
NOTES TO FINANCIAL STATEMENTS (Unaudited) (Continued)
| | FAIR VALUE
MEASUREMENTS
USING SIGNIFICANT
UNOBSERVABLE
INPUTS (LEVEL3) | |
Alger Mid Cap Growth Institutional Fund | | Convertible
Preferred Stock | |
Opening balance at November 1, 2010 | | $ | 5,689,997 | |
Transfers into Level 3 | | — | |
Transfers out of Level 3 | | — | |
Total gains or losses | | | |
Included in net realized gain (loss) on investments | | — | |
Included in net unrealized gain (loss) on investments | | 4,917,093 | |
Purchases, issuances, sales, and settlements | | | |
Purchases | | $ | — | |
Issuances | | — | |
Sales | | — | |
Settlements | | — | |
Closing balance at April 30, 2011 | | 10,607,090 | |
The amount of total gains or losses for the period included in net realized and unrealized gain (loss) attributable to change in unrealized appreciation (depreciation) relating to investments still held at April 30, 2011 | | $ | 4,917,093 | |
For the 6 months ended April 30, 2011, significant transfers between Levels 1 and 2 were as follows: Alger Capital Appreciation Institutional Fund and Alger Mid Cap Growth Institutional Fund transferred securities totaling $10,444,976 and $12,799,504, respectively, from Level 2 to Level 1, utilizing exchange listed prices rather than fair value adjusted prices.
NOTE 9 — Derivatives:
Financial Accounting Standards Board Accounting Standards Codification 815 — Derivatives and Hedging (“ASC 815”) requires qualitative disclosures about objectives and strategies for using derivatives, quantitative disclosures about fair value amounts of and gains and losses on derivative instruments, and disclosures about credit-risk-related contingent features in derivative agreements.
Forward currency contracts—In connection with portfolio purchases and sales of securities denominated in foreign currencies, the Funds may enter into forward currency contracts. Additionally, each Fund may enter into such contracts to economically hedge certain other foreign currency denominated investments. These contracts are valued at the current cost of covering or offsetting such contracts, and the related realized and unrealized foreign exchange gains and losses are included in the statement of operations. In the event that counterparties fail to settle these currency contracts or the related foreign security trades, a Fund could be exposed to foreign currency fluctuations.
Options—The Funds seek to capture the majority of the returns associated with equity market investments. To meet this investment goal, the Funds invest in a broadly diversified portfolio of common stocks, while also buying and selling call and put options on equities and equity indices. The Funds purchase call options to increase their exposure to stock market risk and also provide diversification of risk. The Funds purchase put
63
THE ALGER INSTITUTIONAL FUNDS
NOTES TO FINANCIAL STATEMENTS (Unaudited) (Continued)
options in order to protect from significant market declines that may occur over a short period of time. The Funds will write covered call and cash secured put options to generate cash flows while reducing the volatility of the Funds’ portfolios. The cash flows may be an important source of the Funds’ return, although written call options may reduce the Funds’ ability to profit from increases in the value of the underlying security or equity portfolio. The value of a call option generally increases as the price of the underlying stock increases and decreases as the stock decreases in price. Conversely, the value of a put option generally increases as the price of the underlying stock decreases and decreases as the stock increases in price. The combination of the diversified stock portfolio and the purchase and sale of options is intended to provide the Funds with the majority of the returns associated with equity market investments but with reduced volatility and returns that are augmented with the cash flows from the sale of options. During the six months ended April 30, 2011, options were used in accordance with these objectives.
The fair values of derivative instruments as of April 30, 2011 are as follows:
Alger Mid Cap Growth Institutional Fund
| | ASSET DERIVATIVES 2010 | | LIABILITY DERIVATIVES 2010 | |
Derivatives not accounted
for as hedging instruments | | Balance Sheet
Location | | Fair Value | | Balance Sheet
Location | | Fair Value | |
Written Put Options | | — | | — | | Written options outstanding, at value | | $ | 163,060 | |
Written Call Options | | — | | — | | Written options outstanding, at value | | $ | 107,400 | |
Total | | — | | — | | | | $ | 270,460 | |
For the six months ended April 30, 2011, Alger Mid Cap Growth Institutional Fund had option purchases of $5,142,226 and option sales of $4,517,399. The effect of derivative instruments on the Statement of Operations for the six months ended April 30, 2011 is as follows:
Net realized gain on investments and options
Alger Mid Cap Growth Institutional Fund
Derivatives not accounted for as hedging instruments | | Options | |
Purchased Options | | $ | (1,586,689 | ) |
Written Options | | 696,273 | |
Total | | $ | (890,416 | ) |
64
THE ALGER INSTITUTIONAL FUNDS
NOTES TO FINANCIAL STATEMENTS (Unaudited) (Continued)
Net change in unrealized appreciation (depreciation) on investments, options
Alger Mid Cap Growth Institutional Fund
Derivatives not accounted for as hedging instruments under Statement 133 | | Options | |
Purchased Options | | $ | — | |
Written Options | | (4,870 | ) |
Total | | $ | (4,870 | ) |
NOTE 10 — Litigation:
On August 31, 2005, the West Virginia Securities Commissioner (the “WVSC”), in an ex parte Summary Order to Cease and Desist and Notice of Right to Hearing, concluded that the Manager and the Distributor had violated the West Virginia Uniform Securities Act (the “WVUSA”), and ordered the Manager and the Distributor to cease and desist from further violations of the WVUSA by engaging in the market-timing-related conduct described in the order. The ex parte order provided notice of their right to a hearing with respect to the violations of law asserted by the WVSC. Other firms unaffiliated with the Manager were served with similar orders. The Manager and the Distributor intend to request a hearing for the purpose of seeking to vacate or modify the order.
In addition, in 2003 and 2004 several purported class actions and shareholder derivative suits were filed against various parties in the mutual fund industry, including the Manager, certain mutual funds managed by the Manager (the “Alger Mutual Funds”), and certain current and former Alger Mutual Fund trustees and officers, alleging wrongful conduct related to market-timing and late-trading by mutual fund shareholders. These cases were transferred to the U.S. District Court of Maryland by the Judicial Panel on Multidistrict Litigation for consolidated pre-trial proceedings under the caption number 1:04-MD-15863 (JFM). After a number of the claims in the Alger lawsuits, including all claims against Alger Mutual Funds and their independent trustees, were dismissed by the court, the Alger-related class and derivative suits were settled. A Final Judgment and Order approving the settlement was entered on October 25, 2010. No appeals from the Final Judgment and Order were filed within the allotted time limit. The settlement was paid by insurance, and had no financial impact on the Alger Mutual Funds.
NOTE 11 — Recent Accounting Pronouncements:
The Financial Accounting Standards Board (FASB) issued Accounting Standards Update (ASU) 2011-04, Amendments to Achieve Common Fair Value Measurement and Disclosure Requirements in U.S. GAAP and IFRSs (International Financial Reporting Standards). The ASU converge fair value measurement and disclosure guidance in U.S. GAAP with the guidance in the International Accounting Standards Board’s concurrently issued IFRS 13, Fair Value Measurement. These amendments do not modify the requirements for when fair value measurements apply; rather, they generally represent clarifications on how to measure and disclose fair value under ASC 820, Fair Value Measurement. The application of ASU 2011-04 is required for fiscal years and interim
65
THE ALGER INSTITUTIONAL FUNDS
NOTES TO FINANCIAL STATEMENTS (Unaudited) (Continued)
periods beginning after Dec. 15, 2011. At this time, management is evaluation the implications of ASU 2011-04.
NOTE 12 — Subsequent Events:
Management of each Fund has evaluated events that have occurred subsequent to April 30, 2011. No such events have been identified which require recognition and disclosure.
66
THE ALGER INSTITUTIONAL FUNDS
ADDITIONAL INFORMATION (Unaudited)
Shareholder Expense Example
As a shareholder of a Fund, you incur two types of costs: transaction costs, if applicable, including sales charges (loads) and redemption fees; and ongoing costs, including management fees, distribution (12b-1) fees, if applicable, and other fund expenses. This example is intended to help you understand your ongoing costs (in dollars) of investing in the Fund and to compare these costs with the ongoing costs of investing in other mutual funds.
The example below is based on an investment of $1,000 invested at the beginning of the six-month period starting November 1, 2010 and ending April 30, 2011.
Actual Expenses
The first line for each class of shares in the table below provides information about actual account values and actual expenses. You may use the information in this line, together with the amount you invested, to estimate the expenses that you would have paid over the period. Simply divide your account value by $1,000 (for example, an $8,600 account value divided by $1,000 = 8.6), then multiply the result by the number in the first line under the heading entitled “Expenses Paid During the Period” to estimate the expenses you paid on your account during this period.
Hypothetical Example for Comparison Purposes
The second line for each class of shares in the table below provides information about hypothetical account values and hypothetical expenses based on the Fund’s actual expense ratios for each class of shares and an assumed rate of return of 5% per year before expenses, which is not the Fund’s actual return. The hypothetical account values and expenses may not be used to estimate the actual ending account balance or expenses you paid for the period. You may use this information to compare the ongoing costs of investing in the Fund and other funds. To do so, compare this 5% hypothetical example with the 5% hypothetical examples that appear in the shareholder reports of other funds.
Please note that the expenses shown in the table are meant to highlight your ongoing costs only and do not reflect any transaction costs, such as sales charges (loads) and redemption fees. Therefore, the second line under each class of shares in the table is useful in comparing ongoing costs only, and will not help you determine the relative total costs of owning different funds. In addition, if these transactional costs were included, your costs would have been higher.
67
| | Beginning
Account
Value
November 1, 2010 | | Ending
Account
Value
April 30, 2011 | | Expenses
Paid During
the Six Months
Ended
April 30, 2011(a) | | Ratio of
Expenses to
Average
Net Assets
For the
Six Months
Ended
April 30, 2011(b) | |
Alger Capital Appreciation Institutional Fund | | | | | | | | | |
Class I | Actual | | $ | 1,000.00 | | $ | 1,193.46 | | $ | 6.35 | | 1.17 | % |
| Hypothetical(c) | | 1,000.00 | | 1,019.00 | | 5.85 | | 1.17 | |
Class R | Actual | | 1,000.00 | | 1,190.63 | | 9.14 | | 1.68 | |
| Hypothetical(c) | | 1,000.00 | | 1,016.45 | | 8.42 | | 1.68 | |
| | | | | | | | | |
Alger Large Cap Growth Institutional Fund | | | | | | | | | |
Class I | Actual | | $ | 1,000.00 | | $ | 1,143.78 | | $ | 8.51 | | 1.60 | % |
| Hypothetical(c) | | 1,000.00 | | 1,016.85 | | 8.01 | | 1.60 | |
Class R | Actual | | 1,000.00 | | 1,140.11 | | 12.30 | | 2.32 | |
| Hypothetical(c) | | 1,000.00 | | 1,013.30 | | 11.57 | | 2.32 | |
| | | | | | | | | |
Alger Mid Cap Growth Institutional Fund | | | | | | | | | |
Class I | Actual | | $ | 1,000.00 | | $ | 1,239.49 | | $ | 6.51 | | 1.17 | % |
| Hypothetical(c) | | 1,000.00 | | 1,018.98 | | 5.87 | | 1.17 | |
Class R | Actual | | 1,000.00 | | 1,235.81 | | 9.60 | | 1.73 | |
| Hypothetical(c) | | 1,000.00 | | 1,016.20 | | 8.66 | | 1.73 | |
| | | | | | | | | |
Alger Small Cap Growth Institutional Fund | | | | | | | | | |
Class I | Actual | | $ | 1,000.00 | | $ | 1,263.45 | | $ | 6.59 | | 1.17 | % |
| Hypothetical(c) | | 1,000.00 | | 1,018.97 | | 5.88 | | 1.17 | |
Class R | Actual | | 1,000.00 | | 1,260.35 | | 9.60 | | 1.71 | |
| Hypothetical(c) | | 1,000.00 | | 1,016.30 | | 8.56 | | 1.71 | |
(a) | Expenses are equal to the annualized expense ratio of the respective share class, multiplied by the average account value over the period, multiplied by 181/365 (to reflect the one-half year period). |
(b) | Annualized. |
(c) | 5% annual return before expenses. |
68
THE ALGER INSTITUTIONAL FUNDS
ADDITIONAL INFORMATION (Unaudited)
Privacy Policy | |
U.S. Consumer Privacy Notice Rev. 01/2011 | 3/31/11 |
FACTS | | WHAT DOES ALGER DO WITH YOUR PERSONAL INFORMATION? |
Why? | | Financial companies choose how they share your personal information, which, under Federal law, means personally identifiable information. Federal law gives consumers the right to limit some but not all sharing. Federal law also requires us to tell you how we collect, share, and protect your personal information. Please read this notice carefully to understand what we do. |
What? | | The types of personal information we collect and share depend on the product or service you have with us. This information can include: · Social Security number · account balances, transaction history and credit information |
How? | | All financial companies need to share customers’ personal information to run their everyday business. In the section below, we list the reasons financial companies can share their customers’ personal information; the reasons Alger chooses to share; and whether you can limit this sharing. |
Reasons we can share your personal
information | | Does
Alger share? | | Can you limit
this sharing? |
For our everyday business purposes — such as to process your transactions, maintain your account(s), respond to court orders and legal investigations, or report to credit bureaus | | Yes | | No |
For our marketing purposes — with service providers we use to offer our products and services to you | | Yes | | No |
For joint marketing with other financial companies | | No | | We don’t share |
For our affiliates’ everyday business purposes—information about your transactions and experiences | | Yes | | No |
For our affiliates’ everyday business purposes—information about your creditworthiness | | No | | We don’t share |
For nonaffiliates to market to you — for all credit card accounts | | No | | We don’t share |
For nonaffiliates to market to you — for accounts and services endorsed by another organization | | No | | We don’t share |
For nonaffiliates to market to you — for accounts other than credit card accounts and Sponsored Accounts, such as insurance, investments, deposit and lending | | No | | We don’t share |
69
Who we are | | |
Who is providing this notice? | | Alger includes Fred Alger Management, Inc. and Fred Alger & Company, Incorporated as well as the following funds: The Alger Funds, The Alger Funds II, The Alger Institutional Funds, The Alger Portfolios, and Alger China-U.S. Growth Fund. |
What we do | | |
How does Alger
protect my personal
information? | | To protect your personal information from unauthorized access and use, we use security measures that comply with federal law. These measures include computer safeguards and secured files and buildings. For more information visit alger.com. |
How does Alger
collect my personal
information? | | We collect your personal information, for example, when you:
· open an account or perform transactions
· seek advice about your investments
We also collect your personal information from others, such as credit bureaus, affiliates, or other companies. |
Why can’t I limit all sharing? | | Federal law gives you the right to limit some but not all sharing related to:
· sharing for affiliates’ everyday business purposes — information about your creditworthiness
· affiliates from using your information to market to you
· sharing for nonaffiliates to market to you
State laws and individual companies may give you additional rights to limit sharing. |
| | |
Definitions | | |
Affiliates | | Companies related by common ownership or control. They can be financial and nonfinancial companies.
· Our affiliates include Fred Alger Management, Inc. and Fred Alger & Company, Incorporated as well as the following funds: The Alger Funds, The Alger Funds II, The Alger Institutional Funds, The Alger Portfolios, and Alger China-U.S. Growth Fund. |
Nonaffiliates | | Companies not related by common ownership or control. They can be financial and nonfinancial companies |
Joint marketing | | A formal agreement between nonaffiliated financial companies that together market financial products or services to you. |
70
Proxy Voting Policies
A description of the policies and procedures the Trust uses to determine how to vote proxies relating to portfolio securities and information regarding how the Fund voted proxies relating to portfolio securities during the most recent 12-month period ended June 30 are available, without charge, by calling (800) 992-3863 or online on the Funds’ website at http://www.alger.com or on the SEC’s website at http://www.sec.gov.
Fund Holdings
The Funds’ most recent month end portfolio holdings are available approximately sixty days after month end on the Funds’ website at www.alger.com. The Funds also file their complete schedule of portfolio holdings with the SEC for the first and third quarter of each fiscal year on Form N-Q. The Funds’ Forms N-Q are available online on the SEC’s website at http://www.sec.gov or may be reviewed and copied at the SEC’s Public Reference Room in Washington, D.C. Information regarding the operation of the SEC’s Public Reference Room may be obtained by calling 1-800-SEC-0330. A copy of the most recent quarterly holdings may also be obtained from the Funds by calling (800) 992-3863.
71
THE ALGER INSTITUTIONAL FUNDS
111 Fifth Avenue
New York, NY 10003
(800) 992-3863
www.alger.com
Investment Manager
Fred Alger Management, Inc.
111 Fifth Avenue
New York, NY 10003
Distributor
Fred Alger & Company, Incorporated
111 Fifth Avenue
New York, NY 10003
Transfer Agent and Dividend Disbursing Agent
Boston Financial Data Services, Inc.
P.O. Box 8480
Boston, MA 02266
This report is submitted for the general information of the shareholders of The Alger Institutional Funds. It is not authorized for distribution to prospective investors unless accompanied by an effective Prospectus for the Trust, which contains information concerning the Trust’s investment policies, fees and expenses as well as other pertinent information.
(This page has been intentionally left blank.)
(This page has been intentionally left blank.)
(This page has been intentionally left blank.)
(This page has been intentionally left blank.)
(This page has been intentionally left blank.)

AIFSAR
ITEM 2. CODE OF ETHICS.
Not applicable.
ITEM 3. AUDIT COMMITTEE FINANCIAL EXPERT.
Not applicable.
ITEM 4. PRINCIPAL ACCOUNTANT FEES AND SERVICES.
Not applicable.
ITEM 5. AUDIT COMMITTEE OF LISTED REGISTRANTS.
Not applicable.
ITEM 6. INVESTMENTS.
Not applicable.
ITEM 7. DISCLOSURE OF PROXY VOTING POLICIES AND PROCEDURES FOR CLOSED-END MANAGEMENT INVESTMENT COMPANIES.
Not applicable.
ITEM 8. PORTFOLIO MANAGERS OF CLOSED-END MANAGEMENT INVESTMENT COMPANIES.
Not applicable.
ITEM 9. PURCHASES OF EQUITY SECURITIES BY CLOSED-END MANAGEMENT INVESTMENT COMPANY AND AFFILIATED PURCHASERS.
Not applicable.
ITEM 10. SUBMISSION OF MATTERS TO A VOTE OF SECURITY HOLDERS.
Not applicable.
ITEM 11. CONTROLS AND PROCEDURES.
(a) The Registrant’s principal executive officer and principal financial officer have concluded that the Registrant’s disclosure controls and procedures (as defined in Rule 30a-3(c) under the Investment Company Act of 1940, as amended) are effective based on their evaluation of the disclosure controls and procedures as of a date within 90 days of the filing date of this document.
(b) No changes in the Registrant’s internal control over financial reporting occurred during the Registrant’s second fiscal quarter of the period covered by this report that materially affected, or are reasonably likely to materially affect, the Registrant’s internal control over financial reporting.
ITEM 12. EXHIBITS.
(a) (1) Not applicable
(a) (2) Certifications of principal executive officer and principal financial officer as required by rule 30a-2(a) under the Investment Company Act of 1940 are attached as Exhibit 99.CERT
(a) (3) Not applicable
(b) Certifications of principal executive officer and principal financial officer as required by rule 30a-2(b) under the Investment Company Act of 1940 are attached as Exhibit 99.906CERT
SIGNATURES
Pursuant to the requirements of the Securities Exchange Act of 1934 and the Investment Company Act of 1940, the registrant has duly caused this report to be signed on its behalf by the undersigned, thereunto duly authorized.
The Alger Institutional Funds
By: | /s/Dan C. Chung | |
| | |
| Dan C. Chung | |
| | |
| President | |
| | |
Date: June 15, 2011 | |
Pursuant to the requirements of the Securities Exchange Act of 1934 and the Investment Company Act of 1940, this report has been signed below by the following persons on behalf of the registrant and in the capacities and on the dates indicated.
By: | /s/Dan C. Chung | |
| | |
| Dan C. Chung | |
| | |
| President | |
| | |
Date: June 15, 2011 | |
By: | /s/Michael D. Martins | |
| | |
| Michael D. Martins | |
| | |
| Treasurer | |
| | |
Date: June 15, 2011 | |