| | OMB APPROVAL |
| | OMB Number: | 3235-0570 |
| | Expires: | August 31, 2020 |
| UNITED STATES | Estimated average burden hours per response. . . . . . . . . . . . . . .20.6 |
| SECURITIES AND EXCHANGE COMMISSION | |
| Washington, D.C. 20549 | |
FORM N-CSR
CERTIFIED SHAREHOLDER REPORT OF REGISTERED
MANAGEMENT INVESTMENT COMPANIES
Investment Company Act file number | 811-07986 |
|
The Alger Institutional Funds |
(Exact name of registrant as specified in charter) |
|
360 Park Avenue South New York, New York | | 10010 |
(Address of principal executive offices) | | (Zip code) |
|
Mr. Hal Liebes Fred Alger Management, Inc. 360 Park Avenue South New York, New York 10010 |
(Name and address of agent for service) |
|
Registrant’s telephone number, including area code: | 212-806-8800 | |
|
Date of fiscal year end: | October 31 | |
|
Date of reporting period: | October 31, 2018 | |
| | | | | | | | |
Form N-CSR is to be used by management investment companies to file reports with the Commission not later than 10 days after the transmission to stockholders of any report that is required to be transmitted to stockholders under Rule 30e-1 under the Investment Company Act of 1940 (17 CFR 270.30e-1). The Commission may use the information provided on Form N-CSR in its regulatory, disclosure review, inspection, and policymaking roles.
A registrant is required to disclose the information specified by Form N-CSR, and the Commission will make this information public. A registrant is not required to respond to the collection of information contained in Form N-CSR unless the Form displays a currently valid Office of Management and Budget (“OMB”) control number. Please direct comments concerning the accuracy of the information collection burden estimate and any suggestions for reducing the burden to Secretary, Securities and Exchange Commission, 450 Fifth Street, NW, Washington, DC 20549-0609. The OMB has reviewed this collection of information under the clearance requirements of 44 U.S.C. § 3507.
ITEM 1. REPORTS TO STOCKHOLDERS.
Table of Contents
The Alger Institutional Funds
Shareholders’ Letter (Unaudited) | 1 |
Fund Highlights (Unaudited) | 12 |
Portfolio Summary (Unaudited) | 20 |
Schedules of Investments | 21 |
Statements of Assets and Liabilities | 37 |
Statements of Operations | 41 |
Statements of Changes in Net Assets | 43 |
Financial Highlights | 47 |
Notes to Financial Statements | 62 |
Report of Independent Registered Public Accounting Firm | 88 |
Additional Information (Unaudited) | 90 |
Go Paperless With Alger Electronic Delivery Service
Alger is pleased to provide you with the ability to access regulatory materials online. When documents such as prospectuses and annual and semi-annual reports are available, we’ll send you an e-mail notification with a convenient link that will take you directly to the fund information on our website. To sign up for this free service, simply enroll at www.icsdelivery.com/alger.
Shareholders’ Letter (Unaudited) | October 31, 2018 |
Dear Shareholders,
Investors Grow Cautious Despite Strong Corporate Fundamentals
Volatility during the final weeks of the 12-month reporting period ended October 31, 2018, illustrated investors’ increased focus on climbing interest rates, growing global trade tension and expectations of moderating earnings growth. In the process, investors shifted their focus from strong corporate fundamentals and a vibrant U.S. economy that has continued to surprise to the upside in terms of both revenues and earnings during another strong earnings season in the third quarter of 2018. The rapidity of this market selloff reminds us at Alger of past “bouts of doubt” that in recent years have proven to be excellent buying opportunities in U.S. equities.
With that in mind, I provide the following perspective on recent market volatility and I suggest that investors may be well served by taking a long-term approach to equities.
· First, we maintain that corporate earnings and economic growth can potentially support equity markets in the near term despite ongoing concerns regarding interest rates, trade tension and earnings growth. It is important to note that both the level of earnings and cash flow from U.S. companies continue to be impressive. The growth rates of earnings and cash flow clearly and even mechanically had to slow from the one-time boost in 2018 caused by the change in corporate tax rates versus 2017. However, these growth rates will not, in our view, be a sign of impending recession in 2019. By historical standards, 2018’s third quarter earnings and revenues growth (e.g., in the S&P 500 constituents) was, in fact, very impressive.
· As of the end of the reporting period, S&P 500 third quarter earnings increased 24.9%, which is the second fastest growth rate since the third quarter of 2010 and only slightly below the 25.2% growth rate of the second quarter of this year, according to FactSet Research. Analysts are projecting a 15.0% earnings growth rate for the final three months of 2018 and a 9.4% rate for calendar year 2019.
· While some signs of weakness appeared, often related to trade tensions and slow growth in other regions of the world, they were in many cases confined to specific industries. Innovation in the U.S. remains high and the growth drivers of the continuing digital and internet revolution, medical advances and breakthroughs to meet the demands of our large and aging population, as well as other trends in our society, are likely to continue to support an extended economic expansion into 2019.
· Another concern for many investors is that rising interest rates could curtail economic growth and hurt equity valuations. The U.S. economy, however, has been shrugging off higher interest rates and showing signs of continued strength such as a healthy labor market and GDP growth that increased to 3.5% on an annualized basis during the third quarter. By some estimates, the U.S. economy is expected to grow 3.0% this year, its strongest showing
1
since 2005. We also believe that current equity valuations can potentially withstand higher interest rates. The earnings per share (EPS) yields of market benchmarks, such as the S&P 500, have historically been comparable to Treasury bonds. As Treasury yields change, equity valuations may also change to maintain an EPS yield that is comparable to that of bonds. As of the end of October, however, the S&P 500 EPS yield was approximately 300 basis points higher than that of Treasury bonds, which implies equity valuations may not be significantly impacted when interest rates increase. In sum, while the Fed is tightening, U.S. real interest rates are still very supportive of continued growth. Globally, the interest rate picture remains highly stimulative and “easy” as real rates, or interest rates minus inflation, in Europe, the United Kingdom and Japan are below 0%. China, meanwhile, is providing monetary stimulus. We also note that equity markets have traditionally generated gains as the Fed raises rates, as illustrated by tightening cycles starting in 1994, 1999 and 2004.
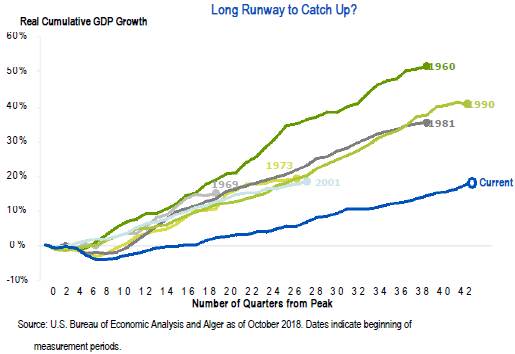
· Finally, we address the “time” element. In the view of some, because the U.S. economy has expanded for 10 years since 2009, it is simply too “old” a bull market to persist. From a fundamental perspective, the real question is not “time” but whether the economy has grown too much, i.e., whether economic output has reached levels that are unsustainable. The current period of expansion has generated cumulative economic growth of only 18% but various past economic recoveries of comparable length have advanced beyond 30% and some even above 50%. Viewed from that perspective, the current economic recovery likely still has a bright future. Recoveries have also been increasing in length, a result of improved inventory management, fiscal and monetary intervention and structural changes in the economy. (See chart below).
2
· Assuming the S&P 500 Index’s price-to-earnings ratio (P/E) based on forward earnings estimates remains constant next year and earnings for 2020 are expected to increase at a mid-to-upper single digit rate, the index price would increase by approximately the same amount. The potential price increase combined with the index’s 2% dividend yield would then result in a return in the upper single digit range. Most importantly, we believe that, as a result of the October selloff, the S&P 500’s P/E multiple of 15.7 has corrected more than is appropriate for the fundamental outlook. This P/E is currently at the long-term historical average for the S&P 500, yet we note many positive potential events including positive resolution of the trade tensions between the U.S. and China, improvement in European economies, Brexit becoming an economic “non-event” rather than the “catastrophe” some pundits predict, which is beginning to remind us of the “Y2K” doomsday predictions, and of course continuing U.S. growth, especially from a much strengthened yet still cautious U.S. consumer. If the P/E were to increase even to the level that existed at the end of the third quarter of 2018, the market return would be in the mid-teens.
· We acknowledge that the issues that have driven volatility may strengthen and drive additional market declines in the near future. We note that some of the rapid selling in October appears to have been driven by quantitative trading and also the closure of hedge funds with poor performance. We see this trend continuing into November and perhaps year-end. However, we believe that, as in the past, the best long-term investment strategy is to approach such market volatility, if it continues to the downside, as an opportunity to add to or initiate new investments in high quality growth companies, especially those that are either innovation or disruption leaders in their industries or have proven management with durable business models that have established their resiliency in past cycles. We strongly advise against “timing the market” by attempting to sell out near term and buy back in “when it’s all clear.” Time and time again academic research and common knowledge have shown that investors are very poor at making two such dramatic decisions. Investors who sold out in 2008, by and large, did not get back into the market in February 2009. But that was the ideal buying opportunity of the last decade. We have talked to countless investors who, up until September 30th of this year, bemoaned that they had “missed” the many opportunities to buy the leading growth stocks of this time, e.g., the “FAANG” stocks. We are specifically not advising that today is the time to buy any individual member of that group (or the many other stocks our Alger team identifies as high quality growth franchises). However, we firmly believe the recent selloff has likely already created a buying opportunity in these types of companies if one holds the long-term view and, whatever further short-term volatility or decline may occur, one holds through the cycle to the next leg of growth for these companies and the market.
Earnings, Markets and Optimism
Strong corporate earnings, record high levels of innovation and optimism about U.S. tax reform supported equities during the first 11 months of the reporting period, during which
3
the S&P 500 Index generated an impressive 15.22% gain. Optimism, however, quickly plummeted in October when the 10-year Treasury bond yield reached 3.23%, its highest level since early 2011. For the reasons we’ve reviewed above, a broad selloff in equities occurred with the S&P 500 declining 9.27% from October 1 to October 29.
Growth Equities Dominate
Despite exhibiting weakness in October, growth stocks outperformed during the reporting period with the Russell 1000 Growth Index’s 10.71% return exceeding the benchmark’s value-focused counterpart by 7.67 percentage points. The broad market also performed strongly as depicted by the 7.35% return of the S&P 500 Index. Looking beyond the U.S., the MSCI ACWI ex USA Index declined 7.80% and the MSCI Emerging Markets Index declined 12.19% as investors grew increasingly concerned about trade conflicts while global economic growth appeared to be slowing.
Looking Ahead
As the economic recovery continues, we urge investors to focus on the long-term outlook for the U.S. economy and the world, and on a long-term strategy for investing. In closing, we remain optimistic regarding the outlook for equities, although we acknowledge that additional declines may occur in the near future. Our firm was started in 1964 and we have considerable experience in dealing with different phases of economic cycles. We believe that investing in high quality innovative companies with attractive products and maintaining a long-term, patient approach is the best way to weather the ebb and flow of economic cycles.
Portfolio Matters
Alger Capital Appreciation Institutional Fund
The Alger Capital Appreciation Institutional Fund returned 8.46% for the fiscal year ended October 31, 2018, compared to the 10.71% return of the Russell 1000 Growth Index.
Contributors to Performance
During the reporting period, the largest portfolio sector weightings were Information Technology and Consumer Discretionary. The largest sector overweight was Consumer Discretionary and the largest sector underweight was Consumer Staples. The Health Care and Financials sectors provided the largest contributions to relative performance.
Amazon.com, Inc.; Microsoft Corp.; Apple, Inc.; Visa, Inc., Cl. A; and UnitedHealth Group, Inc. were the top contributors to performance. Shares of Amazon.com performed strongly in response to the company continuing to take market share from brick and mortar retailers. Strong growth of the company’s web hosting and digital advertising services also supported the performance of Amazon.com shares.
Detractors from Performance
Consumer Staples and Information Technology were among the sectors that detracted from relative performance. Regarding individual positions, Applied Materials, Inc.; Facebook, Inc., Cl. A; Alibaba Group Holding Ltd.; Broadcom, Inc.; and Vulcan Materials Co. were among the top detractors from performance. Facebook’s social network that bears the company’s name is one of the world’s largest social networks. Facebook also owns the Instagram social network and WhatsApp, a messaging service. We are excited about the growth of user activity within Instagram and WhatsApp. Facebook is also benefiting from the growth of digital marketing and it continues to take advertising market share from print, radio and
4
TV mediums because the company’s platforms provide robust returns on spending for advertisers. Facebook shares underperformed because investors became concerned about weakening consumer engagement at the company’s Facebook property and increasing operating costs associated with improving data privacy and content quality.
Alger Focus Equity Fund
The Alger Focus Equity Fund returned 11.50% for the fiscal year ended October 31, 2018, compared to the 10.71% return of the Russell 1000 Growth Index. Prior to October 15, 2018, the Fund followed its current investment strategy, with the same portfolio managers, under the name “Alger Capital Appreciation Focus Fund.”
Contributors to Performance
During the reporting period, the largest sector weightings were Information Technology and Consumer Discretionary. The largest sector overweight was Financials and the largest underweight was Consumer Staples. The Health Care and Financials sectors provided the greatest contributions to relative performance. Regarding individual positions, Amazon. com, Inc.; Microsoft Corp.; Apple, Inc.; salesforce.com, Inc.; and Visa, Inc., Cl A were the top contributors to performance. Shares of Amazon outperformed in response to developments identified in the Alger Capital Appreciation Institutional Fund discussion.
Detractors from Performance
The Consumer Staples and Real Estate sectors were among the sectors that detracted from results. Regarding individual positions, Applied Materials, Inc.; Alibaba Group Holding Ltd. Sponsored ADR; Facebook, Inc. Cl. A; Broadcom, Inc.; and Equinix, Inc. were the top detractors from performance. Shares of Facebook underperformed in response to developments identified in the Alger Capital Appreciation Institutional Fund discussion.
Alger Mid Cap Growth Institutional Fund
The Alger Mid Cap Growth Institutional Fund returned 5.44% for the fiscal year ended October 31, 2018, compared to the 6.14% return of the Russell Midcap Growth Index.
Contributors to Performance
During the reporting period, the largest portfolio sector weightings were Information Technology and Health Care. The largest sector overweight was Health Care and the largest sector underweight was Information Technology. The Health Care and Financials sectors provided the greatest contributions to relative performance.
Among individual holdings, ABIOMED, Inc.; Sarepta Therapeutics, Inc.; Tandem Diabetes Care, Inc.; Burlington Stores, Inc.; and DexCom, Inc. were among the top contributors to performance. ABIOMED develops and manufactures devices that assist or replace the pumping function of a failing heart. ABIOMED’s major product line is the Impella platform, which consists of heart pumps that are inserted with catheters. The pumps can be used to assist weakened hearts during the repair of coronary artery blockages and in the event of cardiogenic shock, which occurs when organs begin to fail due to the heart’s inability to pump blood. Adoption of ABIOMED’s Impella products has continued to grow and we believe the platform is becoming a new standard of care. The company also has potential for expanding its addressable market with new product launches and by expanding across adjacent patient populations. ABIOMED shares have performed strongly in response to the company’s margin expansion in the midst of aggressively investing in growth opportunities.
5
Detractors from Performance
The Information Technology and Consumer Staples sectors were among the sectors that detracted from results. Among individual positions, TESARO, Inc.; Clovis Oncology, Inc.; Lam Research Corp.; Microchip Technology, Inc.; and Coherent, Inc. were the biggest detractors from performance. TESARO is a biopharmaceutical company dedicated to improving the lives of cancer patients by developing and providing safer and more effective therapeutics and supportive care products. The company’s shares detracted from performance due to diminishing sales expectations for its Zejula product, which is used for treating various forms of recurrent fallopian tube and ovarian cancers that haven’t responded to other forms of treatments.
Alger Small Cap Growth Institutional Fund
The Alger Small Cap Growth Institutional Fund returned 12.96% for the fiscal year ended October 31, 2018, compared to the 4.13% return of the Russell 2000 Growth Index.
Contributors to Performance
During the reporting period, the largest portfolio sector weightings were Health Care and Information Technology. The largest sector overweight was Health Care and the largest underweight was Industrials. The Health Care and Consumer Discretionary sectors provided the greatest contributions to relative performance. Among individual positions, ABIOMED, Inc.; Quidel Corp.; Inogen, Inc.; Veeva Systems, Inc., Cl A; and Abaxis, Inc. were the largest contributors to performance. Shares of ABIOMED outperformed in response to developments described in the Alger Mid Cap Growth Institutional Fund discussion.
Detractors from Performance
The Financials and Consumer Staples sectors were among the sectors that detracted from results. Among individual positions, Intarcia Therapeutics, Inc., Series DD; LendingClub Corp.; Cognex Corp; WageWorks, Inc.; and Blackbaud, Inc. were the biggest detractors from performance. Cognex Corp. is a leader in machine vision technology that captures and analyzes visual information to automate and improve manufacturing and associated processes. Among other functions, manufacturers use Cognex technology to locate, track, identify, and inspect items in the production process. Cognex shares underperformed in large part due to the company’s exposure to Apple and the slowdown in iPhone sales and sales of other smartphones, particularly as it pertains to phones with organic light-emitting diode (OLED) display screens. However, we believe Cognex is benefiting from a number of secular trends including ongoing warehouse and factory automation and increasing machine vision penetration across a number of industries, including logistics, which is helping offset the adverse impacts of recent weakness in consumer electronics.
I thank you for putting your trust in Alger. | |
| |
Sincerely, | |
| |

| |
| |
Daniel C. Chung, CFA | |
Chief Investment Officer | |
Fred Alger Management, Inc. | |
6
Investors cannot invest directly in an index. Index performance does not reflect the deduction for fees, expenses or taxes.
This report and the financial statements contained herein are submitted for the general information of shareholders of the funds. This report is not authorized for distribution to prospective investors in a fund unless preceded or accompanied by an effective prospectus for the fund. Fund returns represent the fiscal 12-month period return of Class I shares.
The performance data quoted represents past performance, which is not an indication or guarantee of future results.
Standardized performance results can be found on the following pages. The investment return and principal value of an investment in a fund will fluctuate so that an investor’s shares, when redeemed, may be worth more or less than their original cost. Current performance may be lower or higher than the performance quoted. For performance data current to the most recent month-end, visit us at www.alger.com, or call us at (800) 992-3863.
The views and opinions of the funds’ management in this report are as of the date of the Shareholders’ Letter and are subject to change at any time subsequent to this date. There is no guarantee that any of the assumptions that formed the basis for the opinions stated herein are accurate or that they will materialize. Moreover, the information forming the basis for such assumptions is from sources believed to be reliable; however, there is no guarantee that such information is accurate. Any securities mentioned, whether owned in a fund or otherwise, are considered in the context of the construction of an overall portfolio of securities and therefore reference to them should not be construed as a recommendation or offer to purchase or sell any such security. Inclusion of such securities in a fund and transactions in such securities, if any, may be for a variety of reasons, including, without limitation, in response to cash flows, inclusion in a benchmark, and risk control. The reference to a specific security should also be understood in such context and not viewed as a statement that the security is a significant holding in a fund. Please refer to the Schedules of Investments for each fund that is included in this report for a complete list of fund holdings as of October 31, 2018. Securities mentioned in the Shareholders’ Letter, if not found in the Schedule of Investments, may have been held by the funds during the 12-month period ended October 31, 2018.
Risk Disclosures
Alger Capital Appreciation Institutional Fund
Investing in the stock market involves gains and losses and may not be suitable for all investors. The value of an investment may move up or down, sometimes rapidly and unpredictably, and may be worth more or less than what you invested. Stocks tend to be more volatile than other investments such as bonds. Growth stocks tend to be more volatile than other stocks as the prices of growth stocks tend to be higher in relation to their companies’ earnings and may be more sensitive to market, political, and economic developments. The Fund may have a significant portion of its assets invested in securities of companies conducting business in a related group of industries within a sector, which may make the Fund more vulnerable to unfavorable developments in that sector than a fund that has a more diversified portfolio. Many technology companies have limited operating histories and prices of these companies’ securities have historically been more volatile than other securities due to increased competition, government regulation, and risk of
7
obsolescence due to the progress of technological developments. Investing in companies of small capitalizations involve the risk that such issuers may have limited product lines or financial resources, lack management depth, or have more limited liquidity. The cost of borrowing money to leverage may exceed the returns for the securities purchased or the securities purchased may actually go down in value more quickly than if the Fund had not borrowed.
Alger Focus Equity Fund
Investing in the stock market involves gains and losses and may not be suitable for all investors. The value of an investment may move up or down, sometimes rapidly and unpredictably, and may be worth more or less than what you invested. Stocks tend to be more volatile than other investments such as bonds. Growth stocks tend to be more volatile than other stocks as the prices of growth stocks tend to be higher in relation to their companies’ earnings and may be more sensitive to market, political, and economic developments. The Fund may have a significant portion of its assets invested in securities of companies conducting business in a related group of industries within a sector, which may make the Fund more vulnerable to unfavorable developments in that sector than a fund that has a more diversified portfolio. Many technology companies have limited operating histories and prices of these companies’ securities have historically been more volatile than other securities due to increased competition, government regulation, and risk of obsolescence due to the progress of technological developments. Investing in companies of all capitalizations involve the risk that smaller issuers may have limited product lines or financial resources, lack management depth, or have more limited liquidity. The Fund may have a more concentrated portfolio than other funds, so it may be more vulnerable to changes in the market value of a single issuer and may be more susceptible to risks associated with a single economic, political or regulatory occurrence than a fund that has a more diversified portfolio. Active trading of portfolio securities may incur increased transaction costs and brokerage commissions, and potentially increase taxes that a shareholder may pay, which can lower the actual return on an investment.
Alger Mid Cap Growth Institutional Fund
Investing in the stock market involves gains and losses and may not be suitable for all investors. The value of an investment may move up or down, sometimes rapidly and unpredictably, and may be worth more or less than what you invested. Stocks tend to be more volatile than other investments such as bonds. Growth stocks tend to be more volatile than other stocks as the prices of growth stocks tend to be higher in relation to their companies’ earnings and may be more sensitive to market, political, and economic developments. Investing in companies of medium capitalizations involves the risk that such issuers may have limited product lines or financial resources, lack management depth, or have more limited liquidity. The Fund may have a significant portion of its assets invested in securities of companies conducting business in a related group of industries within a sector, which may make the Fund more vulnerable to unfavorable developments in that sector than a fund that has a more diversified portfolio. Many technology companies have limited operating histories and prices of these companies’ securities have historically been more volatile than other securities due to increased competition, government regulation, and risk of obsolescence due to the progress of technological developments. The Fund may have a significant portion of its assets invested in securities of healthcare companies, which may be significantly affected by intense competition, aggressive pricing, government
8
regulation, technological innovations, product obsolescence, patent considerations, product compatibility and consumer preferences, and may be more volatile than the securities of other companies. Foreign investing involves special risks including currency risk and risks related to political, social, or economic conditions. Active trading of portfolio securities may incur increased transaction costs and brokerage commissions, and potentially increase taxes that a shareholder may pay, which can lower the actual return on an investment.
Alger Small Cap Growth Institutional Fund
Investing in the stock market involves gains and losses and may not be suitable for all investors. The value of an investment may move up or down, sometimes rapidly and unpredictably, and may be worth more or less than what you invested. Stocks tend to be more volatile than other investments such as bonds. Growth stocks tend to be more volatile than other stocks as the prices of growth stocks tend to be higher in relation to their companies’ earnings and may be more sensitive to market, political, and economic developments. Investing in companies of small capitalizations involve the risk that such issuers may have limited product lines or financial resources, lack management depth, or have more limited liquidity. The Fund may have a significant portion of its assets invested in securities of companies conducting business in a related group of industries within a sector, which may make the Fund more vulnerable to unfavorable developments in that sector than a fund that has a more diversified portfolio. Many technology companies have limited operating histories and prices of these companies’ securities have historically been more volatile than other securities due to increased competition, government regulation, and risk of obsolescence due to the progress of technological developments. The Fund may have a significant portion of its assets invested in securities of healthcare companies, which may be significantly affected by intense competition, aggressive pricing, government regulation, technological innovations, product obsolescence, patent considerations, product compatibility and consumer preferences, and may be more volatile than the securities of other companies. Foreign investing involves special risks including currency risk and risks related to political, social, or economic conditions.
For a more detailed discussion of the risks associated with a fund, please see the Prospectus.
Before investing, carefully consider a fund’s investment objective, risks, charges, and expenses.
For a prospectus or a summary prospectus containing this and other information about The Alger Institutional Funds call us at (800) 992-3863 or visit us at www.alger. com. Read it carefully before investing.
Fred Alger & Company, Incorporated, Distributor. Member NYSE Euronext, SIPC.
NOT FDIC INSURED. NOT BANK GUARANTEED. MAY LOSE VALUE.
Definitions:
· S&P 500 Index: An index of large company stocks considered to be representative of the U.S. stock market.
· Russell 1000 Growth Index: unmanaged index designed to measure the performance of the largest 1000 capitalization companies in the Russell 3000 Index with higher price-to-book ratios and higher forecasted growth values.
9
· Russell 1000 Value Index: An index of common stocks designed to measures the performance of those Russell 1000 companies with lower price/book ratios and lower forecasted growth values.
· Morgan Stanley Capital International (MSCI) All Country World Index (ACWI) ex USA is an unmanaged, market capitalization-weighted index designed to provide a broad measure of equity market performance throughout the world, including both developed and emerging markets, but excluding the United States.
· MSCI Emerging Markets Index: A free float-adjusted market capitalization index designed to measure equity market performance in the global emerging markets.
· Russell Midcap Growth Index: An index of common stocks designed to track performance of medium-capitalization companies with greater than average growth orientation.
· Russell 2500 Growth Index: An unmanaged index designed to measure the performance of the 2,500 smallest companies in the Russell 3000 Index with higher price-to-book ratios and higher forecasted growth values.
· Russell 2000 Growth Index: An unmanaged index designed to measure the performance of the 2,000 smallest companies in the Russell 3000 Index with higher price-to-book ratios and higher forecasted growth values.
· FactSet Research Systems provides data and research for investment managers, hedge funds, investment bankers and other financial professionals.
10
FUND PERFORMANCE AS OF 9/30/18 (Unaudited)
AVERAGE ANNUAL TOTAL RETURNS
| | 1
YEAR | | 5
YEARS | | 10
YEARS | | SINCE
INCEPTION | |
Alger Capital Appreciation Institutional Class I (Inception 11/8/93) | | 25.69 | % | 15.82 | % | 14.55 | % | 12.52 | % |
Alger Capital Appreciation Institutional Class R (Inception 1/27/03)* | | 25.15 | % | 15.27 | % | 13.99 | % | 11.96 | % |
Alger Capital Appreciation Institutional Class Y (Inception 2/28/17) | | 26.22 | % | n/a | | n/a | | 24.94 | % |
Alger Capital Appreciation Institutional Class Z-2 (Inception 10/14/16) | | 26.10 | % | n/a | | n/a | | 25.16 | % |
Alger Focus Equity Class A (Inception 12/31/12) | | 22.58 | % | 16.03 | % | n/a | | 17.70 | % |
Alger Focus Equity Class C (Inception 12/31/12) | | 27.41 | % | 16.41 | % | n/a | | 17.91 | % |
Alger Focus Equity Class I (Inception 11/8/93) | | 29.45 | % | 17.38 | % | 12.86 | % | 9.60 | % |
Alger Focus Equity Class Y (Inception 2/28/17) | | 29.91 | % | n/a | | n/a | | 28.56 | % |
Alger Focus Equity Class Z (Inception 12/31/12) | | 29.85 | % | 17.70 | % | n/a | | 19.22 | % |
Alger Mid Cap Growth Institutional Class I (Inception 11/8/93) | | 25.45 | % | 12.94 | % | 11.52 | % | 12.28 | % |
Alger Mid Cap Growth Institutional Class R (Inception 1/27/03)* | | 24.88 | % | 12.34 | % | 10.94 | % | 11.71 | % |
Alger Mid Cap Growth Institutional Class Z-2 (Inception 10/14/16) | | 25.83 | % | n/a | | n/a | | 26.81 | % |
Alger Small Cap Growth Institutional Class I (Inception 11/8/93) | | 34.62 | % | 12.28 | % | 12.61 | % | 10.23 | % |
Alger Small Cap Growth Institutional Class R (Inception 1/27/03)* | | 34.03 | % | 11.74 | % | 12.07 | % | 9.70 | % |
Alger Small Cap Growth Institutional Class Z-2 (Inception 8/1/16) | | 35.04 | % | n/a | | n/a | | 29.77 | % |
The performance data quoted represents past performance, which is not an indication or a guarantee of future results. The Fund’s average annual total returns include changes in share price and reinvestment of dividends and capital gains.
On October 15, 2018, Alger Appreciation Focus Fund changed its name to Alger Focus Equity Fund.
* Since inception performance is calculated from 11/08/93. Performance figures prior to 1/27/03, inception of Class R shares, are those of the Fund’s Class I Shares. The performance figures prior to 1/27/03 have been reduced to reflect the higher operating expenses of Class R shares.
11
ALGER CAPITAL APPRECIATION INSTITUTIONAL FUND
Fund Highlights Through October 31, 2018 (Unaudited)
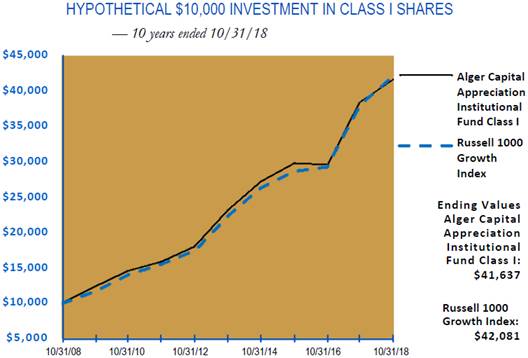
The chart above illustrates the change in value of a hypothetical $10,000 investment made in the Alger Capital Appreciation Institutional Fund Class I shares and the Russell 1000 Growth Index (an unmanaged index of common stocks) for the ten years ended October 31, 2018. Figures for the Alger Capital Appreciation Institutional Fund Class I shares and the Russell 1000 Growth Index include reinvestment of dividends. Alger Capital Appreciation Institutional Fund Class I shares also include reinvestment of capital gains. Performance for the Alger Capital Appreciation Institutional Fund Class R, Class Y and Class Z-2 shares may vary from the results shown above due to differences in expenses the class bears. Investors cannot invest directly in any index. Index performance does not reflect deduction for fees, expenses, or taxes.
12
ALGER CAPITAL APPRECIATION INSTITUTIONAL FUND
Fund Highlights Through October 31, 2018 (Unaudited) (Continued)
PERFORMANCE COMPARISON AS OF 10/31/18
AVERAGE ANNUAL TOTAL RETURNS
| | 1 YEAR | | 5 YEARS | | 10 YEARS | | Since
11/8/1993 | |
Class I (Inception 11/8/93) | | 8.46 | % | 12.44 | % | 15.33 | % | 12.01 | % |
Class R (Inception 1/27/03)* | | 7.96 | % | 11.90 | % | 14.77 | % | 11.45 | % |
Russell 1000 Growth Index | | 10.71 | % | 13.43 | % | 15.45 | % | 9.35 | % |
| | 1 YEAR | | 5 YEARS | | 10 YEARS | | Since
2/28/2017 | |
Class Y (Inception 2/28/17) | | 8.90 | % | n/a | | n/a | | 16.20 | % |
Russell 1000 Growth Index | | 10.71 | % | n/a | | n/a | | 16.43 | % |
| | | | | | | | Since | |
| | 1 YEAR | | 5 YEARS | | 10 YEARS | | 10/14/2016 | |
Class Z-2 (Inception 10/14/16) | | 8.80 | % | n/a | | n/a | | 17.94 | % |
Russell 1000 Growth Index | | 10.71 | % | n/a | | n/a | | 19.06 | % |
The performance data quoted represents past performance, which is not an indication or a guarantee of future results. The Fund’s average annual total returns include changes in share price and reinvestment of dividends and capital gains. The chart and table above do not reflect the deduction of taxes that a shareholder would have paid on Fund distributions or on the redemption of Fund shares. Investment return and principal will fluctuate and the Fund’s shares, when redeemed, may be worth more or less than their original cost. Current performance may be higher or lower than the performance quoted. For updated performance, visit us at www.alger.com or call us at (800) 992-3863.
* Since inception performance is calculated from 11/8/93. Performance figures prior to 1/27/03, inception of Class R shares, are those of the Fund’s Class I Shares. The performance figures prior to 1/27/03 have been reduced to reflect the higher operating expenses of Class R shares.
13
ALGER FOCUS EQUITY FUND
Fund Highlights Through October 31, 2018 (Unaudited)

The chart above illustrates the change in value of a hypothetical $10,000 investment made in the Alger Focus Equity Fund Class I shares and the Russell 1000 Growth Index (an unmanaged index of common stocks) for the ten years ended October 31, 2018. On October 15, 2018, Alger Appreciation Focus Fund changed its name to Alger Focus Equity Fund. Beginning December 31, 2012, Alger Focus Equity Fund changed its investment strategy to invest in a smaller number of issuers. The figures for Alger Focus Equity Fund Class I shares and the Russell 1000 Growth Index include reinvestment of dividends. Alger Focus Equity Fund Class I shares also include reinvestment of capital gains. Performance for Alger Focus Equity Fund Class A, Class C, Class Y and Class Z shares may vary from the results shown above due to differences in expenses the class bears. Investors cannot invest directly in any index. Index performance does not reflect deduction for fees, expenses, or taxes.
14
ALGER FOCUS EQUITY FUND
Fund Highlights Through October 31, 2018 (Unaudited) (Continued)
PERFORMANCE COMPARISON AS OF 10/31/18
AVERAGE ANNUAL TOTAL RETURNS
| | 1 YEAR | | 5 YEARS | | 10 YEARS | | Since
11/8/1993 | |
Class I (Inception 11/8/93) | | 11.37 | % | 13.91 | % | 14.36 | % | 9.12 | % |
Russell 1000 Growth Index | | 10.71 | % | 13.43 | % | 15.45 | % | 9.35 | % |
| | | | | | | | Since | |
| | 1 YEAR | | 5 YEARS | | 10 YEARS | | 12/31/2012 | |
Class A (Inception 12/31/12) | | 5.48 | % | 12.61 | % | n/a | | 15.38 | % |
Class C (Inception 12/31/12) | | 9.48 | % | 12.97 | % | n/a | | 15.56 | % |
Class Z (Inception 12/31/12) | | 11.74 | % | 14.23 | % | n/a | | 16.85 | % |
Russell 1000 Growth Index | | 10.71 | % | 13.43 | % | n/a | | 15.95 | % |
| | | | | | | | Since | |
| | 1 YEAR | | 5 YEARS | | 10 YEARS | | 2/28/2017 | |
Class Y (Inception 2/28/17) | | 11.75 | % | n/a | | n/a | | 19.41 | % |
Russell 1000 Growth Index | | 10.71 | % | n/a | | n/a | | 16.43 | % |
The performance data quoted represents past performance, which is not an indication or a guarantee of future results. The Fund’s average annual total returns include changes in share price and reinvestment of dividends and capital gains. Class A returns reflect the maximum initial sales charge and Class C returns reflect the applicable contingent deferred sales charge. The chart and table above do not reflect the deduction of taxes that a shareholder would have paid on Fund distributions or on the redemption of Fund shares. Investment return and principal will fluctuate and the Fund’s shares, when redeemed, may be worth more or less than their original cost. Current performance may be higher or lower than the performance quoted. For updated performance, visit us at www.alger.com or call us at (800) 992-3863.
15
ALGER MID CAP GROWTH INSTITUTIONAL FUND
Fund Highlights Through October 31, 2018 (Unaudited)
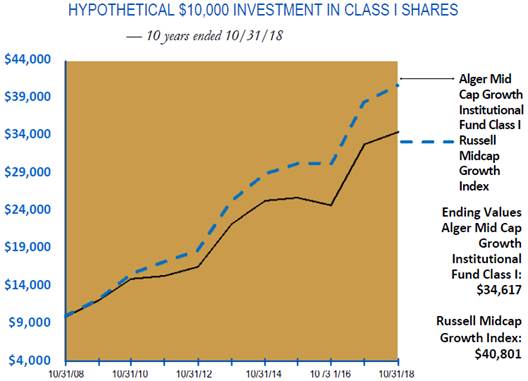
The chart above illustrates the change in value of a hypothetical $10,000 investment made in the Alger Mid Cap Growth Institutional Fund Class I shares and the Russell Midcap Growth Index (an unmanaged index of common stocks) for the ten years ended October 31, 2018. Figures for Alger Mid Cap Growth Institutional Fund Class I shares and the Russell Midcap Growth Index include reinvestment of dividends. Alger Mid Cap Growth Institutional Fund Class I shares also include reinvestment of capital gains. Performance for the Alger Mid Cap Growth Institutional Fund Class R and Class Z-2 shares may vary from the results shown above due to differences in expenses the class bears. Investors cannot invest directly in any index. Index performance does not reflect deduction for fees, expenses, or taxes.
16
ALGER MID CAP GROWTH INSTITUTIONAL FUND
Fund Highlights Through October 31, 2018 (Unaudited) (Continued)
PERFORMANCE COMPARISON AS OF 10/31/18
AVERAGE ANNUAL TOTAL RETURNS
| | 1 YEAR | | 5 YEARS | | 10 YEARS | | Since
11/8/1993 | |
Class I (Inception 11/8/93) | | 5.44 | % | 9.23 | % | 13.22 | % | 11.61 | % |
Class R (Inception 1/27/03)* | | 4.90 | % | 8.64 | % | 12.62 | % | 11.04 | % |
Russell Midcap Growth Index | | 6.14 | % | 10.10 | % | 15.10 | % | 9.53 | % |
| | | | | | | | Since | |
| | 1 YEAR | | 5 YEARS | | 10 YEARS | | 10/14/2016 | |
Class Z-2 (Inception 10/14/16) | | 5.74 | % | n/a | | n/a | | 17.24 | % |
Russell Midcap Growth Index | | 6.14 | % | n/a | | n/a | | 14.78 | % |
The performance data quoted represents past performance, which is not an indication or a guarantee of future results. The Fund’s average annual total returns include changes in share price and reinvestment of dividends and capital gains. The chart and table above do not reflect the deduction of taxes that a shareholder would have paid on Fund distributions or on the redemption of Fund shares. Investment return and principal will fluctuate and the Fund’s shares, when redeemed, may be worth more or less than their original cost. Current performance may be higher or lower than the performance quoted. For updated performance, visit us at www.alger.com or call us at (800) 992-3863.
* Since inception performance is calculated from 11/8/93. Performance figures prior to 1/27/03, inception of Class R shares, are those of the Fund’s Class I Shares. The performance figures prior to 1/27/03 have been reduced to reflect the higher operating expenses of Class R shares.
17
ALGER SMALL CAP GROWTH INSTITUTIONAL FUND
Fund Highlights Through October 31, 2018 (Unaudited)
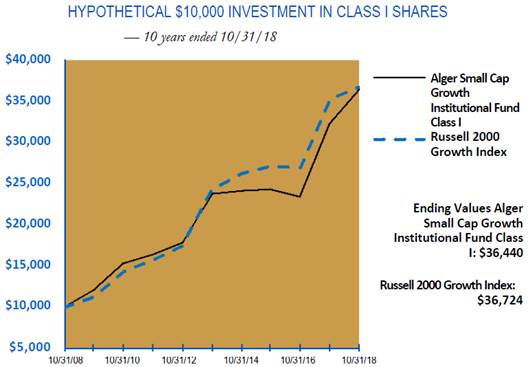
The chart above illustrates the change in value of a hypothetical $10,000 investment made in the Alger Small Cap Growth Institutional Fund Class I shares and the Russell 2000 Growth Index (an unmanaged index of common stocks) for the ten years ended October 31, 2018. The figures for the Alger Small Cap Growth Institutional Fund Class I shares and the Russell 2000 Growth Index include reinvestment of dividends. Alger Small Cap Growth Institutional Fund Class I shares also include reinvestment of capital gains. Performance for the Alger Small Cap Growth Institutional Fund Class R and Class Z-2 shares may vary from the results shown above due to differences in expenses the class bears. Investors cannot invest directly in any index. Index performance does not reflect deduction for fees, expenses, or taxes.
18
ALGER SMALL CAP GROWTH INSTITUTIONAL FUND
Fund Highlights Through October 31, 2018 (Unaudited) (Continued)
PERFORMANCE COMPARISON AS OF 10/31/18
AVERAGE ANNUAL TOTAL RETURNS
| | 1 YEAR | | 5 YEARS | | 10 YEARS | | Since
11/8/1993 | |
Class I (Inception 11/8/93) | | 12.96 | % | 8.88 | % | 13.80 | % | 9.55 | % |
Class R (Inception 1/27/03)* | | 12.48 | % | 8.36 | % | 13.26 | % | 9.03 | % |
Russell 2000 Growth Index | | 4.13 | % | 8.75 | % | 13.89 | % | 7.46 | % |
| | 1 YEAR | | 5 YEARS | | 10 YEARS | | Since 8/1/2016 | |
Class Z-2 (Inception 8/1/16) | | 13.35 | % | n/a | | n/a | | 20.50 | % |
Russell 2000 Growth Index | | 4.13 | % | n/a | | n/a | | 12.69 | % |
The performance data quoted represents past performance, which is not an indication or a guarantee of future results. The Fund’s average annual total returns include changes in share price and reinvestment of dividends and capital gains. The chart and table above do not reflect the deduction of taxes that a shareholder would have paid on Fund distributions or on the redemption of Fund shares. Investment return and principal will fluctuate and the Fund’s shares, when redeemed, may be worth more or less than their original cost. Current performance may be higher or lower than the performance quoted. For updated performance, visit us at www.alger.com or call us at (800) 992-3863.
* Since inception performance is calculated from 11/8/93. Performance figures prior to 1/27/03, inception of Class R shares, are those of the Fund’s Class I Shares. The performance figures prior to 1/27/03 have been reduced to reflect the higher operating expenses of Class R shares.
19
PORTFOLIO SUMMARY†
October 31, 2018 (Unaudited)
SECTORS | | Alger Capital
Appreciation Institutional
Fund | | Alger Focus Equity
Fund | | Alger Mid Cap Growth
Institutional Fund | | Alger Small Cap Growth
Institutional Fund | |
Communication Services | | 11.6 | % | 11.9 | % | 8.8 | % | 5.1 | % |
Consumer Discretionary | | 16.0 | | 15.3 | | 15.3 | | 10.0 | |
Consumer Staples | | 0.7 | | 0.1 | | 3.1 | | 0.8 | |
Energy | | 0.4 | | 0.0 | | 0.0 | | 0.8 | |
Financials | | 3.8 | | 1.9 | | 4.7 | | 2.2 | |
Health Care | | 20.0 | | 19.1 | | 26.6 | | 44.7 | |
Industrials | | 5.8 | | 6.4 | | 13.3 | | 4.7 | |
Information Technology | | 31.7 | | 35.4 | | 25.5 | | 28.6 | |
Materials | | 2.5 | | 1.9 | | 0.5 | | 1.7 | |
Real Estate | | 1.3 | | 1.5 | | 2.6 | | 0.7 | |
Short-Term Investments and Net Other Assets (Liabilities) | | 6.2 | | 6.5 | | (0.4 | ) | 0.7 | |
| | 100.0 | % | 100.0 | % | 100.0 | % | 100.0 | % |
† Based on net assets for each Fund.
20
THE ALGER INSTITUTIONAL FUNDS | ALGER CAPITAL APPRECIATION INSTITUTIONAL FUND
Schedule of Investments October 31, 2018
COMMON STOCKS—92.0% | | SHARES | | VALUE | |
AEROSPACE & DEFENSE—2.0% | | | | | |
The Boeing Co. | | 151,710 | | $ | 53,835,811 | |
United Technologies Corp. | | 129,759 | | 16,117,365 | |
| | | | 69,953,176 | |
AIR FREIGHT & LOGISTICS—0.1% | | | | | |
XPO Logistics, Inc.* | | 55,639 | | 4,973,014 | |
| | | | | |
APPAREL ACCESSORIES & LUXURY GOODS—0.6% | | | | | |
Lululemon Athletica, Inc.* | | 83,715 | | 11,781,212 | |
PVH Corp. | | 89,694 | | 10,834,138 | |
| | | | 22,615,350 | |
APPLICATION SOFTWARE—6.7% | | | | | |
Adobe, Inc.* | | 388,689 | | 95,524,209 | |
Autodesk, Inc.* | | 91,808 | | 11,866,184 | |
Palantir Technologies, Inc., Cl. A*,@,(a) | | 239,030 | | 1,374,423 | |
salesforce.com, Inc.* | | 896,493 | | 123,034,699 | |
| | | | 231,799,515 | |
AUTO PARTS & EQUIPMENT—0.2% | | | | | |
Aptiv PLC. | | 89,439 | | 6,868,915 | |
| | | | | |
BIOTECHNOLOGY—3.7% | | | | | |
Biogen, Inc.* | | 55,350 | | 16,841,344 | |
BioMarin Pharmaceutical, Inc.* | | 160,592 | | 14,801,765 | |
Sarepta Therapeutics, Inc.* | | 252,162 | | 33,729,189 | |
Vertex Pharmaceuticals, Inc.* | | 381,733 | | 64,688,474 | |
| | | | 130,060,772 | |
COMMUNICATIONS EQUIPMENT—0.5% | | | | | |
Palo Alto Networks, Inc.* | | 91,987 | | 16,837,301 | |
| | | | | |
CONSTRUCTION MATERIALS—1.2% | | | | | |
Vulcan Materials Co. | | 402,043 | | 40,662,629 | |
| | | | | |
DATA PROCESSING & OUTSOURCED SERVICES—7.6% | | | | | |
Automatic Data Processing, Inc. | | 81,964 | | 11,809,373 | |
PayPal Holdings, Inc.* | | 707,317 | | 59,549,018 | |
Square, Inc., Cl. A* | | 157,245 | | 11,549,646 | |
Visa, Inc., Cl. A | | 1,311,573 | | 180,800,338 | |
| | | | 263,708,375 | |
DIVERSIFIED BANKS—0.5% | | | | | |
Citigroup, Inc. | | 79,968 | | 5,234,705 | |
JPMorgan Chase & Co. | | 114,943 | | 12,531,086 | |
| | | | 17,765,791 | |
DIVERSIFIED SUPPORT SERVICES—0.8% | | | | | |
Cintas Corp. | | 163,224 | | 29,685,549 | |
| | | | | |
FINANCIAL EXCHANGES & DATA—1.6% | | | | | |
Intercontinental Exchange, Inc. | | 362,277 | | 27,909,820 | |
S&P Global, Inc. | | 147,348 | | 26,864,487 | |
| | | | 54,774,307 | |
| | | | | | |
21
THE ALGER INSTITUTIONAL FUNDS | ALGER CAPITAL APPRECIATION INSTITUTIONAL FUND
Schedule of Investments October 31, 2018 (Continued)
COMMON STOCKS—92.0% (CONT.) | | SHARES | | VALUE | |
HEALTH CARE EQUIPMENT—7.4% | | | | | |
Abbott Laboratories | | 742,229 | | $ | 51,169,267 | |
ABIOMED, Inc.* | | 25,586 | | 8,729,943 | |
Boston Scientific Corp.* | | 1,927,144 | | 69,646,984 | |
Danaher Corp. | | 516,968 | | 51,386,619 | |
Intuitive Surgical, Inc.* | | 64,624 | | 33,680,737 | |
Medtronic PLC. | | 255,344 | | 22,934,998 | |
Zimmer Biomet Holdings, Inc. | | 163,847 | | 18,611,381 | |
| | | | 256,159,929 | |
HOME IMPROVEMENT RETAIL—1.8% | | | | | |
The Home Depot, Inc. | | 360,642 | | 63,429,715 | |
| | | | | |
HOTELS RESORTS & CRUISE LINES—1.0% | | | | | |
Royal Caribbean Cruises Ltd. | | 318,118 | | 33,316,498 | |
| | | | | |
INDUSTRIAL CONGLOMERATES—1.9% | | | | | |
Honeywell International, Inc. | | 446,803 | | 64,706,011 | |
| | | | | |
INDUSTRIAL GASES—0.7% | | | | | |
Air Products & Chemicals, Inc. | | 165,187 | | 25,496,613 | |
| | | | | |
INTERACTIVE HOME ENTERTAINMENT—0.4% | | | | | |
Activision Blizzard, Inc. | | 218,785 | | 15,107,104 | |
| | | | | |
INTERACTIVE MEDIA & SERVICES—8.0% | | | | | |
Alphabet, Inc., Cl. C* | | 174,069 | | 187,432,277 | |
Facebook, Inc., Cl. A* | | 611,719 | | 92,852,827 | |
| | | | 280,285,104 | |
INTERNET & DIRECT MARKETING RETAIL—11.1% | | | | | |
Alibaba Group Holding Ltd.#,* | | 240,249 | | 34,182,628 | |
Altaba, Inc.* | | 969,824 | | 58,286,422 | |
Amazon.com, Inc.* | | 181,177 | | 289,522,658 | |
GrubHub, Inc.* | | 69,183 | | 6,416,031 | |
| | | | 388,407,739 | |
INVESTMENT BANKING & BROKERAGE—0.4% | | | | | |
Morgan Stanley | | 269,804 | | 12,319,251 | |
| | | | | |
LEISURE FACILITIES—0.7% | | | | | |
Vail Resorts, Inc. | | 95,095 | | 23,899,275 | |
| | | | | |
LIFE SCIENCES TOOLS & SERVICES—3.2% | | | | | |
Illumina, Inc.* | | 171,696 | | 53,423,211 | |
Thermo Fisher Scientific, Inc. | | 241,768 | | 56,489,093 | |
| | | | 109,912,304 | |
MANAGED HEALTH CARE—5.1% | | | | | |
UnitedHealth Group, Inc. | | 682,409 | | 178,347,592 | |
| | | | | |
MOVIES & ENTERTAINMENT—2.3% | | | | | |
Netflix, Inc.* | | 122,408 | | 36,940,286 | |
The Walt Disney Co. | | 388,414 | | 44,601,580 | |
| | | | 81,541,866 | |
OIL & GAS EXPLORATION & PRODUCTION—0.4% | | | | | |
Pioneer Natural Resources Co. | | 84,090 | | 12,383,934 | |
| | | | | | |
22
THE ALGER INSTITUTIONAL FUNDS | ALGER CAPITAL APPRECIATION INSTITUTIONAL FUND
Schedule of Investments October 31, 2018 (Continued)
COMMON STOCKS—92.0% (CONT.) | | SHARES | | VALUE | |
PACKAGED FOODS & MEATS—0.7% | | | | | |
Conagra Brands, Inc. | | 641,475 | | $ | 22,836,510 | |
| | | | | |
PHARMACEUTICALS—0.6% | | | | | |
Allergan PLC. | | 42,438 | | 6,705,628 | |
GW Pharmaceuticals PLC.#,* | | 94,583 | | 13,004,217 | |
| | | | 19,709,845 | |
PROPERTY & CASUALTY INSURANCE—1.0% | | | | | |
The Progressive Corp. | | 503,511 | | 35,094,717 | |
| | | | | |
RAILROADS—1.0% | | | | | |
Union Pacific Corp. | | 236,351 | | 34,559,243 | |
| | | | | |
RESTAURANTS—0.4% | | | | | |
McDonald’s Corp. | | 88,370 | | 15,632,653 | |
| | | | | |
SEMICONDUCTOR EQUIPMENT—1.2% | | | | | |
Lam Research Corp. | | 295,879 | | 41,934,931 | |
| | | | | |
SEMICONDUCTORS—0.9% | | | | | |
Broadcom, Inc. | | 85,485 | | 19,105,043 | |
NVIDIA Corp. | | 62,753 | | 13,230,215 | |
| | | | 32,335,258 | |
SPECIALTY CHEMICALS—0.6% | | | | | |
The Sherwin-Williams Co. | | 55,671 | | 21,904,868 | |
| | | | | |
SPECIALTY STORES—0.2% | | | | | |
Tiffany & Co. | | 75,707 | | 8,426,189 | |
| | | | | |
SYSTEMS SOFTWARE—9.4% | | | | | |
Microsoft Corp. | | 2,977,625 | | 318,040,126 | |
Red Hat, Inc.* | | 47,937 | | 8,227,907 | |
| | | | 326,268,033 | |
TECHNOLOGY HARDWARE STORAGE & PERIPHERALS—5.2% | | | | | |
Apple, Inc. | | 833,624 | | 182,446,949 | |
| | | | | |
WIRELESS TELECOMMUNICATION SERVICES—0.9% | | | | | |
T-Mobile US, Inc.* | | 437,366 | | 29,981,439 | |
TOTAL COMMON STOCKS
(Cost $2,254,508,264) | | | | 3,206,148,264 | |
| | | | | | |
PREFERRED STOCKS—0.2% | | SHARES | | VALUE | |
APPLICATION SOFTWARE—0.2% | | | | | |
Palantir Technologies, Inc., Cl. B*,@,(a) | | 974,841 | | 5,605,336 | |
Palantir Technologies, Inc., Cl. D*,@,(a) | | 127,007 | | 730,290 | |
| | | | 6,335,626 | |
PHARMACEUTICALS—0.0% | | | | | |
Intarcia Therapeutics, Inc., Series DD*,@,(a) | | 111,655 | | 1,219,273 | |
TOTAL PREFERRED STOCKS
(Cost $10,892,407) | | | | 7,554,899 | |
23
THE ALGER INSTITUTIONAL FUNDS | ALGER CAPITAL APPRECIATION INSTITUTIONAL FUND
Schedule of Investments October 31, 2018 (Continued)
MASTER LIMITED PARTNERSHIP—0.3% | | SHARES | | VALUE | |
ASSET MANAGEMENT & CUSTODY BANKS—0.3% | | | | | |
The Blackstone Group LP. | | 306,062 | | $ | 9,904,166 | |
(Cost $7,342,058) | | | | 9,904,166 | |
| | | | | | |
REAL ESTATE INVESTMENT TRUST—1.3% | | SHARES | | VALUE | |
SPECIALIZED—1.3% | | | | | |
Crown Castle International Corp. | | 219,466 | | 23,864,733 | |
Equinix, Inc. | | 51,850 | | 19,637,669 | |
| | | | 43,502,402 | |
TOTAL REAL ESTATE INVESTMENT TRUST
(Cost $45,650,638) | | | | 43,502,402 | |
Total Investments
(Cost $2,318,393,367) | | 93.8 | % | $ | 3,267,109,731 | |
Unaffiliated Securities (Cost $2,318,393,367) | | | | 3,267,109,731 | |
Other Assets in Excess of Liabilities | | 6.2 | % | 216,724,001 | |
NET ASSETS | | 100.0 | % | $ | 3,483,833,732 | |
# | American Depositary Receipts. |
(a) | Security is valued in good faith at fair value determined using significant unobservable inputs pursuant to procedures established by the Board. |
* | Non-income producing security. |
@ | Restricted security - Investment in security not registered under the Securities Act of 1933. The investment is deemed to not be liquid and may be sold only to qualified buyers. |
| | | | | | % of net assets | | | | % of net assets | |
| | Acquisition | | Acquisition | | (Acquisition | | Market | | as of | |
Security | | Date(s) | | Cost | | Date) | | Value | | 10/31/2018 | |
Intarcia Therapeutics, Inc., Series DD | | 03/27/14 | | $ | 3,616,505 | | 0.14 | % | $ | 1,219,273 | | 0.04 | % |
Palantir Technologies, Inc., Cl. A | | 10/07/14 | | 1,555,368 | | 0.05 | % | 1,374,423 | | 0.04 | % |
Palantir Technologies, Inc., Cl. B | | 10/07/14 | | 6,437,297 | | 0.22 | % | 5,605,336 | | 0.16 | % |
Palantir Technologies, Inc., Cl. D | | 10/14/14 | | 838,605 | | 0.03 | % | 730,290 | | 0.02 | % |
Total | | | | | | | | $ | 8,929,322 | | 0.26 | % |
| | | | | | | | | | | | | |
See Notes to Financial Statements.
24
THE ALGER INSTITUTIONAL FUNDS | ALGER FOCUS EQUITY FUND
Schedule of Investments October 31, 2018
COMMON STOCKS—91.7% | | SHARES | | VALUE | |
AEROSPACE & DEFENSE—1.5% | | | | | |
The Boeing Co. | | 14,281 | | $ | 5,067,756 | |
| | | | | |
AIR FREIGHT & LOGISTICS—0.1% | | | | | |
XPO Logistics, Inc.* | | 5,174 | | 462,452 | |
| | | | | |
APPLICATION SOFTWARE—7.7% | | | | | |
Adobe, Inc.* | | 51,016 | | 12,537,692 | |
RealPage, Inc.* | | 52,654 | | 2,790,662 | |
salesforce.com, Inc.* | | 78,873 | | 10,824,531 | |
| | | | 26,152,885 | |
BIOTECHNOLOGY—2.9% | | | | | |
Sarepta Therapeutics, Inc.* | | 27,995 | | 3,744,611 | |
Vertex Pharmaceuticals, Inc.* | | 35,961 | | 6,093,951 | |
| | | | 9,838,562 | |
CONSTRUCTION MATERIALS—0.8% | | | | | |
Vulcan Materials Co. | | 26,948 | | 2,725,521 | |
| | | | | |
DATA PROCESSING & OUTSOURCED SERVICES—10.7% | | | | | |
Automatic Data Processing, Inc. | | 16,579 | | 2,388,702 | |
PayPal Holdings, Inc.* | | 112,376 | | 9,460,936 | |
Visa, Inc., Cl. A | | 119,513 | | 16,474,867 | |
Worldpay, Inc., Cl. A* | | 84,855 | | 7,793,083 | |
| | | | 36,117,588 | |
DIVERSIFIED BANKS—0.4% | | | | | |
Citigroup, Inc. | | 18,704 | | 1,224,364 | |
| | | | | |
DIVERSIFIED SUPPORT SERVICES—2.7% | | | | | |
Cintas Corp. | | 50,858 | | 9,249,544 | |
| | | | | |
FINANCIAL EXCHANGES & DATA—0.7% | | | | | |
S&P Global, Inc. | | 13,521 | | 2,465,149 | |
| | | | | |
HEALTH CARE EQUIPMENT—10.1% | | | | | |
Abbott Laboratories | | 105,609 | | 7,280,684 | |
Boston Scientific Corp.* | | 423,592 | | 15,308,615 | |
Danaher Corp. | | 76,958 | | 7,649,625 | |
DexCom, Inc.* | | 13,892 | | 1,844,441 | |
Tandem Diabetes Care, Inc.* | | 30,703 | | 1,154,740 | |
Zimmer Biomet Holdings, Inc. | | 8,262 | | 938,481 | |
| | | | 34,176,586 | |
HOME IMPROVEMENT RETAIL—1.5% | | | | | |
The Home Depot, Inc. | | 28,276 | | 4,973,183 | |
| | | | | |
HOTELS RESORTS & CRUISE LINES—1.2% | | | | | |
Royal Caribbean Cruises Ltd. | | 40,031 | | 4,192,447 | |
| | | | | |
INDUSTRIAL CONGLOMERATES—1.5% | | | | | |
Honeywell International, Inc. | | 33,670 | | 4,876,089 | |
| | | | | |
INDUSTRIAL GASES—0.5% | | | | | |
Air Products & Chemicals, Inc. | | 11,340 | | 1,750,329 | |
| | | | | |
INTERACTIVE HOME ENTERTAINMENT—0.8% | | | | | |
Activision Blizzard, Inc. | | 41,127 | | 2,839,819 | |
| | | | | | |
25
THE ALGER INSTITUTIONAL FUNDS | ALGER FOCUS EQUITY FUND
Schedule of Investments October 31, 2018 (Continued)
COMMON STOCKS—91.7% (CONT.) | | SHARES | | VALUE | |
INTERACTIVE MEDIA & SERVICES—9.0% | | | | | |
Alphabet, Inc., Cl. C* | | 17,778 | | $ | 19,142,817 | |
Facebook, Inc., Cl. A* | | 73,971 | | 11,228,058 | |
| | | | 30,370,875 | |
INTERNET & DIRECT MARKETING RETAIL—10.9% | | | | | |
Altaba, Inc.* | | 137,137 | | 8,241,933 | |
Amazon.com, Inc.* | | 17,777 | | 28,407,824 | |
| | | | 36,649,757 | |
INVESTMENT BANKING & BROKERAGE—0.6% | | | | | |
Morgan Stanley | | 41,108 | | 1,876,991 | |
| | | | | |
IT CONSULTING & OTHER SERVICES—0.5% | | | | | |
EPAM Systems, Inc.* | | 14,316 | | 1,710,333 | |
| | | | | |
LEISURE FACILITIES—1.2% | | | | | |
Vail Resorts, Inc. | | 15,434 | | 3,878,873 | |
| | | | | |
LIFE SCIENCES TOOLS & SERVICES—1.2% | | | | | |
Illumina, Inc.* | | 13,271 | | 4,129,272 | |
| | | | | |
MANAGED HEALTH CARE—4.8% | | | | | |
UnitedHealth Group, Inc. | | 62,192 | | 16,253,879 | |
| | | | | |
MOVIES & ENTERTAINMENT—1.1% | | | | | |
Netflix, Inc.* | | 12,336 | | 3,722,758 | |
| | | | | |
PACKAGED FOODS & MEATS—0.1% | | | | | |
Conagra Brands, Inc. | | 4,415 | | 157,174 | |
| | | | | |
RAILROADS—0.6% | | | | | |
Union Pacific Corp. | | 13,285 | | 1,942,533 | |
| | | | | |
SEMICONDUCTOR EQUIPMENT—1.3% | | | | | |
Lam Research Corp. | | 31,202 | | 4,422,259 | |
| | | | | |
SEMICONDUCTORS—0.6% | | | | | |
Broadcom, Inc. | | 6,940 | | 1,551,021 | |
NVIDIA Corp. | | 2,441 | | 514,636 | |
| | | | 2,065,657 | |
SPECIALIZED CONSUMER SERVICES—0.5% | | | | | |
ServiceMaster Global Holdings, Inc.* | | 42,187 | | 1,808,979 | |
| | | | | |
SPECIALTY CHEMICALS—0.6% | | | | | |
The Sherwin-Williams Co. | | 5,019 | | 1,974,826 | |
| | | | | |
SYSTEMS SOFTWARE—9.7% | | | | | |
Microsoft Corp. | | 305,543 | | 32,635,048 | |
| | | | | |
TECHNOLOGY HARDWARE STORAGE & PERIPHERALS—4.9% | | | | | |
Apple, Inc. | | 76,276 | | 16,693,765 | |
| | | | | |
WIRELESS TELECOMMUNICATION SERVICES—1.0% | | | | | |
T-Mobile US, Inc.* | | 47,528 | | 3,258,044 | |
TOTAL COMMON STOCKS
(Cost $294,233,773) | | | | 309,663,297 | |
| | | | | | |
26
THE ALGER INSTITUTIONAL FUNDS | ALGER FOCUS EQUITY FUND
Schedule of Investments October 31, 2018 (Continued)
PREFERRED STOCKS—0.1% | | SHARES | | VALUE | |
BIOTECHNOLOGY—0.1% | | | | | |
Prosetta Biosciences, Inc., Series D*,@,(a),(b) | | 76,825 | | $ | 241,230 | |
(Cost $345,713) | | | | 241,230 | |
| | | | | | |
MASTER LIMITED PARTNERSHIP—0.2% | | SHARES | | VALUE | |
ASSET MANAGEMENT & CUSTODY BANKS—0.2% | | | | | |
The Blackstone Group LP. | | 21,521 | | 696,419 | |
(Cost $734,743) | | | | 696,419 | |
REAL ESTATE INVESTMENT TRUST—1.5% | | SHARES | | VALUE | |
SPECIALIZED—1.5% | | | | | |
Crown Castle International Corp. | | 39,218 | | 4,264,566 | |
Equinix, Inc. | | 2,345 | | 888,145 | |
| | | | 5,152,711 | |
TOTAL REAL ESTATE INVESTMENT TRUST
(Cost $5,285,367) | | | | 5,152,711 | |
Total Investments
(Cost $300,599,596) | | 93.5 | % | $ | 315,753,657 | |
Affiliated Securities (Cost $345,713) | | | | 241,230 | |
Unaffiliated Securities (Cost $300,253,883) | | | | 315,512,427 | |
Other Assets in Excess of Liabilities | | 6.5 | % | 22,082,931 | |
NET ASSETS | | 100.0 | % | $ | 337,836,588 | |
(a) | Deemed an affiliate of the Alger fund complex in accordance with Section 2(a)(3) of the Investment Company Act of 1940. See Note 11 - Affiliated Securities. |
(b) | Security is valued in good faith at fair value determined using significant unobservable inputs pursuant to procedures established by the Board. |
* | Non-income producing security. |
@ | Restricted security - Investment in security not registered under the Securities Act of 1933. The investment is deemed to not be liquid and may be sold only to qualified buyers. |
| | | | | | % of net assets | | | | % of net assets | |
| | Acquisition | | Acquisition | | (Acquisition | | Market | | as of | |
Security | | Date(s) | | Cost | | Date) | | Value | | 10/31/2018 | |
Prosetta Biosciences, Inc., Series D | | 02/06/15 | | $ | 345,713 | | 0.80 | % | $ | 241,230 | | 0.07 | % |
Total | | | | | | | | $ | 241,230 | | 0.07 | % |
| | | | | | | | | | | | | |
See Notes to Financial Statements.
27
THE ALGER INSTITUTIONAL FUNDS | ALGER MID CAP GROWTH INSTITUTIONAL FUND
Schedule of Investments October 31, 2018
COMMON STOCKS—95.7% | | SHARES | | VALUE | |
AEROSPACE & DEFENSE—2.9% | | | | | |
HEICO Corp. | | 22,929 | | $ | 1,922,138 | |
L3 Technologies, Inc. | | 5,301 | | 1,004,381 | |
| | | | 2,926,519 | |
APPAREL ACCESSORIES & LUXURY GOODS—2.1% | | | | | |
Lululemon Athletica, Inc.* | | 15,196 | | 2,138,533 | |
| | | | | |
APPAREL RETAIL—4.1% | | | | | |
Burlington Stores, Inc.* | | 14,259 | | 2,445,276 | |
Ross Stores, Inc. | | 17,271 | | 1,709,829 | |
| | | | 4,155,105 | |
APPLICATION SOFTWARE—9.7% | | | | | |
ANSYS, Inc.* | | 9,367 | | 1,400,835 | |
Avalara, Inc.* | | 41,332 | | 1,385,449 | |
Fair Isaac Corp.* | | 1,307 | | 251,872 | |
Hortonworks, Inc.* | | 48,736 | | 870,425 | |
MicroStrategy, Inc., Cl. A* | | 12,159 | | 1,531,669 | |
Palantir Technologies, Inc., Cl. A*,@,(a) | | 12,426 | | 71,450 | |
PTC, Inc.* | | 18,673 | | 1,538,842 | |
RealPage, Inc.* | | 22,986 | | 1,218,258 | |
Smartsheet, Inc., Cl. A* | | 21,444 | | 507,365 | |
Splunk, Inc.* | | 11,395 | | 1,137,677 | |
| | | | 9,913,842 | |
AUTO PARTS & EQUIPMENT—0.7% | | | | | |
Aptiv PLC. | | 9,629 | | 739,507 | |
| | | | | |
BIOTECHNOLOGY—4.4% | | | | | |
BeiGene Ltd.#,* | | 2,218 | | 279,335 | |
BioMarin Pharmaceutical, Inc.* | | 8,034 | | 740,494 | |
Immunomedics, Inc.* | | 27,788 | | 626,064 | |
Madrigal Pharmaceuticals, Inc.* | | 1,601 | | 305,567 | |
Neurocrine Biosciences, Inc.* | | 8,969 | | 961,028 | |
Sarepta Therapeutics, Inc.* | | 11,711 | | 1,566,463 | |
| | | | 4,478,951 | |
BROADCASTING—1.5% | | | | | |
CBS Corp., Cl. B | | 27,210 | | 1,560,493 | |
| | | | | |
COMMUNICATIONS EQUIPMENT—0.7% | | | | | |
Palo Alto Networks, Inc.* | | 3,831 | | 701,226 | |
| | | | | |
DATA PROCESSING & OUTSOURCED SERVICES—6.3% | | | | | |
Fiserv, Inc.* | | 32,028 | | 2,539,821 | |
Square, Inc., Cl. A* | | 29,098 | | 2,137,248 | |
Worldpay, Inc., Cl. A* | | 19,461 | | 1,787,298 | |
| | | | 6,464,367 | |
DIVERSIFIED SUPPORT SERVICES—2.6% | | | | | |
Cintas Corp. | | 14,344 | | 2,608,743 | |
| | | | | |
ELECTRICAL COMPONENTS & EQUIPMENT—0.7% | | | | | |
AMETEK, Inc. | | 11,132 | | 746,735 | |
| | | | | |
ELECTRONIC EQUIPMENT & INSTRUMENTS—1.4% | | | | | |
FLIR Systems, Inc. | | 20,197 | | 935,323 | |
| | | | | | |
28
THE ALGER INSTITUTIONAL FUNDS | ALGER MID CAP GROWTH INSTITUTIONAL FUND
Schedule of Investments October 31, 2018 (Continued)
COMMON STOCKS—95.7% (CONT.) | | SHARES | | VALUE | |
ELECTRONIC EQUIPMENT & INSTRUMENTS—1.4% (CONT.) | | | | | |
Trimble, Inc.* | | 13,715 | | $ | 512,667 | |
| | | | 1,447,990 | |
FERTILIZERS & AGRICULTURAL CHEMICALS—0.5% | | | | | |
FMC Corp. | | 6,530 | | 509,862 | |
| | | | | |
FINANCIAL EXCHANGES & DATA—1.8% | | | | | |
MarketAxess Holdings, Inc. | | 8,784 | | 1,841,741 | |
| | | | | |
HEALTH CARE EQUIPMENT—9.0% | | | | | |
ABIOMED, Inc.* | | 6,035 | | 2,059,142 | |
AxoGen, Inc.* | | 5,625 | | 209,756 | |
Cantel Medical Corp. | | 15,266 | | 1,208,304 | |
DexCom, Inc.* | | 12,384 | | 1,644,224 | |
IDEXX Laboratories, Inc.* | | 3,210 | | 680,905 | |
Masimo Corp.* | | 5,906 | | 682,734 | |
Penumbra, Inc.* | | 1,194 | | 162,384 | |
Tandem Diabetes Care, Inc.* | | 65,994 | | 2,482,034 | |
| | | | 9,129,483 | |
HEALTH CARE SERVICES—0.3% | | | | | |
Guardant Health, Inc.* | | 10,226 | | 342,366 | |
| | | | | |
HEALTH CARE SUPPLIES—0.8% | | | | | |
Align Technology, Inc.* | | 2,880 | | 637,056 | |
STAAR Surgical Co.* | | 5,119 | | 205,323 | |
| | | | 842,379 | |
HEALTH CARE TECHNOLOGY—2.5% | | | | | |
Teladoc Health, Inc.* | | 17,198 | | 1,192,509 | |
Veeva Systems, Inc., Cl. A* | | 14,351 | | 1,310,964 | |
| | | | 2,503,473 | |
HOTELS RESORTS & CRUISE LINES—1.0% | | | | | |
Norwegian Cruise Line Holdings Ltd.* | | 23,039 | | 1,015,329 | |
| | | | | |
HOUSEHOLD PRODUCTS—1.5% | | | | | |
Church & Dwight Co., Inc. | | 25,051 | | 1,487,278 | |
| | | | | |
HYPERMARKETS & SUPER CENTERS—1.1% | | | | | |
BJ’s Wholesale Club Holdings, Inc.* | | 49,877 | | 1,104,776 | |
| | | | | |
INDUSTRIAL CONGLOMERATES—2.0% | | | | | |
Roper Technologies, Inc. | | 7,104 | | 2,009,722 | |
| | | | | |
INDUSTRIAL MACHINERY—3.5% | | | | | |
Fortive Corp. | | 20,770 | | 1,542,173 | |
The Middleby Corp.* | | 9,228 | | 1,036,304 | |
Xylem, Inc. | | 15,407 | | 1,010,391 | |
| | | | 3,588,868 | |
INTERACTIVE HOME ENTERTAINMENT—3.4% | | | | | |
Activision Blizzard, Inc. | | 18,546 | | 1,280,601 | |
Take-Two Interactive Software, Inc.* | | 16,651 | | 2,145,815 | |
| | | | 3,426,416 | |
INTERACTIVE MEDIA & SERVICES—1.7% | | | | | |
Yelp, Inc., Cl. A* | | 41,277 | | 1,767,481 | |
| | | | | | |
29
THE ALGER INSTITUTIONAL FUNDS | ALGER MID CAP GROWTH INSTITUTIONAL FUND
Schedule of Investments October 31, 2018 (Continued)
COMMON STOCKS—95.7% (CONT.) | | SHARES | | VALUE | |
INTERNET & DIRECT MARKETING RETAIL—3.9% | | | | | |
Etsy, Inc.* | | 36,111 | | $ | 1,535,440 | |
GrubHub, Inc.* | | 23,273 | | 2,158,338 | |
Wayfair, Inc., Cl. A* | | 2,398 | | 264,475 | |
| | | | 3,958,253 | |
INTERNET SERVICES & INFRASTRUCTURE—0.8% | | | | | |
GoDaddy, Inc., Cl. A* | | 10,876 | | 795,797 | |
| | | | | |
INVESTMENT COMPANIES—0.2% | | | | | |
Landcadia Holdings, Inc.* | | 22,170 | | 248,969 | |
| | | | | |
IT CONSULTING & OTHER SERVICES—0.8% | | | | | |
EPAM Systems, Inc.* | | 6,419 | | 766,878 | |
| | | | | |
LEISURE FACILITIES—1.0% | | | | | |
Vail Resorts, Inc. | | 3,986 | | 1,001,762 | |
| | | | | |
LIFE SCIENCES TOOLS & SERVICES—2.7% | | | | | |
Bio-Techne Corp. | | 4,171 | | 699,560 | |
Illumina, Inc.* | | 5,288 | | 1,645,361 | |
NanoString Technologies, Inc.* | | 27,329 | | 421,140 | |
| | | | 2,766,061 | |
MANAGED HEALTH CARE—1.7% | | | | | |
Molina Healthcare, Inc.* | | 3,306 | | 419,102 | |
WellCare Health Plans, Inc.* | | 4,794 | | 1,323,096 | |
| | | | 1,742,198 | |
MOVIES & ENTERTAINMENT—2.2% | | | | | |
Live Nation Entertainment, Inc.* | | 43,865 | | 2,294,140 | |
| | | | | |
PACKAGED FOODS & MEATS—0.5% | | | | | |
Conagra Brands, Inc. | | 13,464 | | 479,318 | |
| | | | | |
PHARMACEUTICALS—3.4% | | | | | |
Aerie Pharmaceuticals, Inc.* | | 12,187 | | 648,105 | |
Canopy Growth Corp.* | | 35,074 | | 1,293,880 | |
Elanco Animal Health, Inc.* | | 6,432 | | 196,047 | |
GW Pharmaceuticals PLC.#,* | | 6,931 | | 952,943 | |
Pacira Pharmaceuticals, Inc.* | | 8,571 | | 419,036 | |
| | | | 3,510,011 | |
PROPERTY & CASUALTY INSURANCE—1.7% | | | | | |
The Progressive Corp. | | 24,758 | | 1,725,633 | |
| | | | | |
REGIONAL BANKS—1.0% | | | | | |
Webster Financial Corp. | | 18,013 | | 1,059,885 | |
| | | | | |
RESEARCH & CONSULTING SERVICES—1.1% | | | | | |
IHS Markit Ltd.* | | 20,934 | | 1,099,663 | |
| | | | | |
RESTAURANTS—1.0% | | | | | |
Domino’s Pizza, Inc. | | 3,893 | | 1,046,399 | |
| | | | | |
SEMICONDUCTOR EQUIPMENT—0.5% | | | | | |
Lam Research Corp. | | 3,750 | | 531,487 | |
| | | | | |
SEMICONDUCTORS—1.5% | | | | | |
Advanced Micro Devices, Inc.* | | 41,098 | | 748,395 | |
| | | | | | |
30
THE ALGER INSTITUTIONAL FUNDS | ALGER MID CAP GROWTH INSTITUTIONAL FUND
Schedule of Investments October 31, 2018 (Continued)
COMMON STOCKS—95.7% (CONT.) | | SHARES | | VALUE | |
SEMICONDUCTORS—1.5% (CONT.) | | | | | |
Microchip Technology, Inc. | | 11,744 | | $ | 772,520 | |
| | | | 1,520,915 | |
SPECIALTY STORES—1.5% | | | | | |
Tiffany & Co. | | 13,681 | | 1,522,695 | |
| | | | | |
SYSTEMS SOFTWARE—2.4% | | | | | |
Proofpoint, Inc.* | | 11,266 | | 1,024,643 | |
SailPoint Technologies Holding, Inc.* | | 21,315 | | 555,042 | |
ServiceNow, Inc.* | | 4,571 | | 827,534 | |
| | | | 2,407,219 | |
TECHNOLOGY HARDWARE STORAGE & PERIPHERALS—1.1% | | | | | |
NetApp, Inc. | | 13,898 | | 1,090,854 | |
| | | | | |
TRUCKING—0.5% | | | | | |
Old Dominion Freight Line, Inc. | | 4,152 | | 541,504 | |
TOTAL COMMON STOCKS
(Cost $92,297,743) | | | | 97,560,826 | |
| | | | | |
PREFERRED STOCKS—0.9% | | SHARES | | VALUE | |
APPLICATION SOFTWARE—0.3% | | | | | |
Palantir Technologies, Inc., Cl. B*,@,(a) | | 50,675 | | 291,381 | |
| | | | | |
BIOTECHNOLOGY—0.5% | | | | | |
Prosetta Biosciences, Inc., Series D*,@,(a),(b) | | 166,009 | | 521,268 | |
| | | | | |
PHARMACEUTICALS—0.1% | | | | | |
Intarcia Therapeutics, Inc., Series DD*,@,(a) | | 7,588 | | 82,861 | |
TOTAL PREFERRED STOCKS
(Cost $1,327,444) | | | | 895,510 | |
| | | | | |
RIGHTS—1.2% | | SHARES | | VALUE | |
BIOTECHNOLOGY—1.2% | | | | | |
Tolero CDR*,@,(a),(c) | | 422,928 | | 1,190,838 | |
(Cost $226,186) | | | | 1,190,838 | |
| | | | | |
REAL ESTATE INVESTMENT TRUST—2.6% | | SHARES | | VALUE | |
SPECIALIZED—2.6% | | | | | |
Crown Castle International Corp. | | 13,551 | | 1,473,536 | |
SBA Communications Corp., Cl. A* | | 7,426 | | 1,204,274 | |
| | | | 2,677,810 | |
TOTAL REAL ESTATE INVESTMENT TRUST
(Cost $2,505,135) | | | | 2,677,810 | |
| | | | | |
SPECIAL PURPOSE VEHICLE—0.0% | | SHARES | | VALUE | |
CONSUMER FINANCE—0.0% | | | | | |
JS Kred SPV I, LLC.*,@,(a) | | 240,362 | | — | |
(Cost $240,362) | | | | — | |
| | | | | | |
31
THE ALGER INSTITUTIONAL FUNDS | ALGER MID CAP GROWTH INSTITUTIONAL FUND
Schedule of Investments October 31, 2018 (Continued)
| | | | VALUE | |
Total Investments
(Cost $96,596,870) | | 100.4 | % | $ | 102,324,984 | |
Affiliated Securities (Cost $747,040) | | | | 521,268 | |
Unaffiliated Securities (Cost $95,849,830) | | | | 101,803,716 | |
Liabilities in Excess of Other Assets | | (0.4 | )% | (383,256 | ) |
NET ASSETS | | 100.0 | % | $ | 101,941,728 | |
# American Depositary Receipts.
(a) Security is valued in good faith at fair value determined using significant unobservable inputs pursuant to procedures established by the Board.
(b) Deemed an affiliate of the Alger fund complex in accordance with Section 2(a)(3) of the Investment Company Act of 1940. See Note 11- Affiliated Securities.
(c) Contingent Deferred Rights.
* Non-income producing security.
@ Restricted security - Investment in security not registered under the Securities Act of 1933. The investment is deemed to not be liquid and may be sold only to qualified buyers.
| | | | | | % of net assets | | | | % of net assets | |
| | Acquisition | | Acquisition | | (Acquisition | | Market | | as of | |
Security | | Date(s) | | Cost | | Date) | | Value | | 10/31/2018 | |
Intarcia Therapeutics, Inc., Series DD | | 03/27/14 | | $ | 245,775 | | 0.14 | % | $ | 82,861 | | 0.08 | % |
JS Kred SPV I, LLC. | | 06/26/15 | | 240,362 | | 0.15 | % | 0 | | 0.00 | % |
Palantir Technologies, Inc., Cl. A | | 10/07/14 | | 80,856 | | 0.05 | % | 71,450 | | 0.07 | % |
Palantir Technologies, Inc., Cl. B | | 10/07/14 | | 334,629 | | 0.22 | % | 291,381 | | 0.29 | % |
Prosetta Biosciences, Inc., Series D | | 02/06/15 | | 747,040 | | 0.50 | % | 521,268 | | 0.51 | % |
Tolero CDR | | 02/06/17 | | 226,186 | | 0.23 | % | 1,190,838 | | 1.17 | % |
Total | | | | | | | | $ | 2,157,798 | | 2.12 | % |
| | | | | | | | | | | | | |
See Notes to Financial Statements.
32
THE ALGER INSTITUTIONAL FUNDS | ALGER SMALL CAP GROWTH INSTITUTIONAL FUND
Schedule of Investments October 31, 2018
COMMON STOCKS—97.3% | | SHARES | | VALUE | |
AEROSPACE & DEFENSE—1.4% | | | | | |
Hexcel Corp. | | 13,808 | | $ | 808,044 | |
Mercury Systems, Inc.* | | 39,632 | | 1,857,156 | |
| | | | 2,665,200 | |
APPAREL ACCESSORIES & LUXURY GOODS—1.0% | | | | | |
Canada Goose Holdings, Inc.* | | 35,817 | | 1,954,534 | |
| | | | | |
APPAREL RETAIL—1.7% | | | | | |
Burlington Stores, Inc.* | | 18,850 | | 3,232,587 | |
| | | | | |
APPLICATION SOFTWARE—19.5% | | | | | |
ACI Worldwide, Inc.* | | 123,281 | | 3,093,120 | |
Apptio, Inc., Cl. A* | | 42,974 | | 1,113,026 | |
Avalara, Inc.* | | 82,811 | | 2,775,825 | |
Blackbaud, Inc. | | 53,441 | | 3,832,788 | |
Blackline, Inc.* | | 22,444 | | 1,040,953 | |
Coupa Software, Inc.* | | 21,089 | | 1,367,200 | |
Ellie Mae, Inc.* | | 15,146 | | 1,003,877 | |
Everbridge, Inc.* | | 34,034 | | 1,729,948 | |
Guidewire Software, Inc.* | | 32,496 | | 2,891,169 | |
HubSpot, Inc.* | | 26,463 | | 3,589,706 | |
Manhattan Associates, Inc.* | | 38,147 | | 1,821,138 | |
MicroStrategy, Inc., Cl. A* | | 7,980 | | 1,005,241 | |
Paycom Software, Inc.* | | 23,225 | | 2,907,770 | |
Q2 Holdings, Inc.* | | 43,077 | | 2,292,989 | |
Smartsheet, Inc., Cl. A* | | 34,305 | | 811,656 | |
SPS Commerce, Inc.* | | 17,872 | | 1,663,704 | |
Tyler Technologies, Inc.* | | 20,657 | | 4,372,261 | |
| | | | 37,312,371 | |
ASSET MANAGEMENT & CUSTODY BANKS—1.1% | | | | | |
WisdomTree Investments, Inc. | | 273,991 | | 2,128,910 | |
| | | | | |
BIOTECHNOLOGY—5.6% | | | | | |
Bluebird Bio, Inc.* | | 8,277 | | 949,372 | |
CareDx, Inc.* | | 121,207 | | 3,164,715 | |
Exact Sciences Corp.* | | 17,899 | | 1,271,724 | |
Halozyme Therapeutics, Inc.* | | 46,658 | | 724,598 | |
Repligen Corp.* | | 19,581 | | 1,061,682 | |
Sarepta Therapeutics, Inc.* | | 26,616 | | 3,560,156 | |
| | | | 10,732,247 | |
CONSUMER FINANCE—0.6% | | | | | |
LendingClub Corp.* | | 373,759 | | 1,207,242 | |
| | | | | |
DATA PROCESSING & OUTSOURCED SERVICES—0.6% | | | | | |
GreenSky, Inc., Cl. A* | | 82,862 | | 1,092,121 | |
| | | | | |
ELECTRONIC COMPONENTS—0.9% | | | | | |
Dolby Laboratories, Inc., Cl. A | | 25,162 | | 1,731,397 | |
| | | | | |
ELECTRONIC EQUIPMENT & INSTRUMENTS—3.5% | | | | | |
Cognex Corp. | | 86,844 | | 3,720,397 | |
FLIR Systems, Inc. | | 62,457 | | 2,892,384 | |
| | | | 6,612,781 | |
| | | | | | |
33
THE ALGER INSTITUTIONAL FUNDS | ALGER SMALL CAP GROWTH INSTITUTIONAL FUND
Schedule of Investments October 31, 2018 (Continued)
COMMON STOCKS—97.3% (CONT.) | | SHARES | | VALUE | |
GENERAL MERCHANDISE STORES—0.6% | | | | | |
Ollie’s Bargain Outlet Holdings, Inc.* | | 12,889 | | $ | 1,197,388 | |
| | | | | |
HEALTH CARE EQUIPMENT—15.2% | | | | | |
ABIOMED, Inc.* | | 23,144 | | 7,896,733 | |
AxoGen, Inc.* | | 35,600 | | 1,327,524 | |
Cantel Medical Corp. | | 59,780 | | 4,731,587 | |
CryoPort, Inc.* | | 64,976 | | 721,234 | |
DexCom, Inc.* | | 20,996 | | 2,787,639 | |
Inogen, Inc.* | | 24,609 | | 4,665,128 | |
Insulet Corp.* | | 54,507 | | 4,808,062 | |
Tandem Diabetes Care, Inc.* | | 58,353 | | 2,194,656 | |
| | | | 29,132,563 | |
HEALTH CARE SUPPLIES—8.1% | | | | | |
Neogen Corp.* | | 83,795 | | 5,088,032 | |
OraSure Technologies, Inc.* | | 98,378 | | 1,367,454 | |
Quidel Corp.* | | 139,621 | | 8,986,008 | |
| | | | 15,441,494 | |
HEALTH CARE TECHNOLOGY—8.1% | | | | | |
Medidata Solutions, Inc.* | | 63,937 | | 4,494,771 | |
Veeva Systems, Inc., Cl. A* | | 77,237 | | 7,055,600 | |
Vocera Communications, Inc.* | | 115,004 | | 3,991,789 | |
| | | | 15,542,160 | |
HUMAN RESOURCE & EMPLOYMENT SERVICES—0.8% | | | | | |
WageWorks, Inc.* | | 40,536 | | 1,613,738 | |
| | | | | |
HYPERMARKETS & SUPER CENTERS—0.5% | | | | | |
BJ’s Wholesale Club Holdings, Inc.* | | 39,568 | | 876,431 | |
| | | | | |
INDUSTRIAL MACHINERY—2.5% | | | | | |
DMC Global, Inc. | | 33,199 | | 1,279,821 | |
Sun Hydraulics Corp. | | 75,755 | | 3,515,032 | |
| | | | 4,794,853 | |
INTERACTIVE HOME ENTERTAINMENT—3.6% | | | | | |
Take-Two Interactive Software, Inc.* | | 53,482 | | 6,892,225 | |
| | | | | |
INTERACTIVE MEDIA & SERVICES—0.7% | | | | | |
Yelp, Inc., Cl. A* | | 30,811 | | 1,319,327 | |
| | | | | |
INTERNET & DIRECT MARKETING RETAIL—3.2% | | | | | |
Etsy, Inc.* | | 83,375 | | 3,545,105 | |
GrubHub, Inc.* | | 26,861 | | 2,491,089 | |
| | | | 6,036,194 | |
INTERNET SERVICES & INFRASTRUCTURE—1.1% | | | | | |
Shopify, Inc., Cl. A* | | 15,291 | | 2,112,452 | |
| | | | | |
INVESTMENT COMPANIES—0.5% | | | | | |
Landcadia Holdings, Inc.* | | 83,158 | | 933,864 | |
| | | | | |
IT CONSULTING & OTHER SERVICES—0.7% | | | | | |
InterXion Holding NV* | | 22,874 | | 1,346,592 | |
| | | | | |
LEISURE FACILITIES—1.4% | | | | | |
Planet Fitness, Inc., Cl. A* | | 55,268 | | 2,713,106 | |
| | | | | | |
34
THE ALGER INSTITUTIONAL FUNDS | ALGER SMALL CAP GROWTH INSTITUTIONAL FUND
Schedule of Investments October 31, 2018 (Continued)
COMMON STOCKS—97.3% (CONT.) | | SHARES | | VALUE | |
LIFE SCIENCES TOOLS & SERVICES—4.3% | | | | | |
Bio-Techne Corp. | | 34,891 | | $ | 5,851,918 | |
PRA Health Sciences, Inc.* | | 23,886 | | 2,313,837 | |
| | | | 8,165,755 | |
MANAGED HEALTH CARE—1.5% | | | | | |
HealthEquity, Inc.* | | 31,811 | | 2,920,250 | |
| | | | | |
MOVIES & ENTERTAINMENT—0.8% | | | | | |
Live Nation Entertainment, Inc.* | | 28,715 | | 1,501,795 | |
| | | | | |
OIL & GAS EXPLORATION & PRODUCTION—0.8% | | | | | |
Magnolia Oil & Gas Corp.* | | 117,302 | | 1,460,410 | |
| | | | | |
PERSONAL PRODUCTS—0.3% | | | | | |
elf Beauty, Inc.* | | 59,746 | | 633,905 | |
| | | | | |
PHARMACEUTICALS—0.6% | | | | | |
Aerie Pharmaceuticals, Inc.* | | 22,801 | | 1,212,557 | |
| | | | | |
RESTAURANTS—1.2% | | | | | |
Shake Shack, Inc., Cl. A* | | 19,193 | | 1,015,118 | |
Wingstop, Inc. | | 19,766 | | 1,237,747 | |
| | | | 2,252,865 | |
SEMICONDUCTORS—0.5% | | | | | |
Universal Display Corp. | | 8,120 | | 998,841 | |
| | | | | |
SPECIALTY CHEMICALS—1.7% | | | | | |
Balchem Corp. | | 35,181 | | 3,294,701 | |
| | | | | |
SPECIALTY STORES—0.9% | | | | | |
Five Below, Inc.* | | 15,441 | | 1,757,495 | |
| | | | | |
SYSTEMS SOFTWARE—1.8% | | | | | |
Proofpoint, Inc.* | | 36,909 | | 3,356,874 | |
TOTAL COMMON STOCKS
(Cost $114,932,204) | | | | 186,177,225 | |
| | | | | |
PREFERRED STOCKS—0.5% | | SHARES | | VALUE | |
BIOTECHNOLOGY—0.2% | | | | | |
Prosetta Biosciences, Inc., Series D*,@,(a),(b) | | 133,263 | | 418,446 | |
| | | | | |
PHARMACEUTICALS—0.3% | | | | | |
Intarcia Therapeutics, Inc., Series DD*,@,(b) | | 41,238 | | 450,319 | |
TOTAL PREFERRED STOCKS
(Cost $1,935,383) | | | | 868,765 | |
| | | | | |
RIGHTS—0.8% | | SHARES | | VALUE | |
BIOTECHNOLOGY—0.8% | | | | | |
Neuralstem, Inc., Strike Price: 47.61%, 1/8/19* | | 19,260 | | — | |
Tolero CDR*,@,(b),(c) | | 528,559 | | 1,488,264 | |
| | | | 1,488,264 | |
TOTAL RIGHTS
(Cost $285,725) | | | | 1,488,264 | |
| | | | | | |
35
THE ALGER INSTITUTIONAL FUNDS | ALGER SMALL CAP GROWTH INSTITUTIONAL FUND
Schedule of Investments October 31, 2018 (Continued)
REAL ESTATE INVESTMENT TRUST—0.7% | | SHARES | | VALUE | |
SPECIALIZED—0.7% | | | | | |
CyrusOne, Inc. | | 26,793 | | $ | 1,426,191 | |
(Cost $901,812) | | | | 1,426,191 | |
| | | | | |
SPECIAL PURPOSE VEHICLE—0.0% | | SHARES | | VALUE | |
CONSUMER FINANCE—0.0% | | | | | |
JS Kred SPV I, LLC.*,@,(b) | | 775,134 | | — | |
(Cost $775,134) | | | | — | |
Total Investments
(Cost $118,830,258) | | 99.3 | % | $ | 189,960,445 | |
Affiliated Securities (Cost $599,684) | | | | 418,446 | |
Unaffiliated Securities (Cost $118,230,574) | | | | 189,541,999 | |
Other Assets in Excess of Liabilities | | 0.7 | % | 1,356,261 | |
NET ASSETS | | 100.0 | % | $ | 191,316,706 | |
(a) Deemed an affiliate of the Alger fund complex in accordance with Section 2(a)(3) of the Investment Company Act of 1940. See Note 11 - Affiliated Securities.
(b) Security is valued in good faith at fair value determined using significant unobservable inputs pursuant to procedures established by the Board.
(c) Contingent Deferred Rights.
* Non-income producing security.
@ Restricted security - Investment in security not registered under the Securities Act of 1933. The investment is deemed to not be liquid and may be sold only to qualified buyers.
| | | | | | % of net assets | | | | % of net assets | |
| | Acquisition | | Acquisition | | (Acquisition | | Market | | as of | |
Security | | Date(s) | | Cost | | Date) | | Value | | 10/31/2018 | |
Intarcia Therapeutics, Inc., Series DD | | 03/27/14 | | $ | 1,335,699 | | 0.15 | % | $ | 450,319 | | 0.23 | % |
JS Kred SPV I, LLC. | | 06/26/15 | | 775,134 | | 0.15 | % | 0 | | 0.00 | % |
Prosetta Biosciences, Inc., Series D | | 02/06/15 | | 599,684 | | 0.10 | % | 418,446 | | 0.22 | % |
Tolero CDR | | 02/06/17 | | 285,725 | | 0.16 | % | 1,488,264 | | 0.78 | % |
Total | | | | | | | | $ | 2,357,029 | | 1.23 | % |
| | | | | | | | | | | | | |
See Notes to Financial Statements.
36
THE ALGER INSTITUTIONAL FUNDS
Statements of Assets and Liabilities October 31, 2018
| | Alger Capital | | | |
| | Appreciation | | Alger Focus Equity | |
| | Institutional Fund | | Fund | |
ASSETS: | | | | | |
Investments in unaffiliated securities, at value (Identified cost below)* see accompanying schedules of investments | | $ | 3,267,109,731 | | $ | 315,512,427 | |
Investments in affiliated securities, at value (Identified cost below)** see accompanying schedules of investments | | — | | 241,230 | |
Cash and cash equivalents | | 256,970,340 | | 28,193,760 | |
Receivable for investment securities sold | | 55,580,578 | | 5,697,064 | |
Receivable for shares of beneficial interest sold | | 7,723,147 | | 4,175,183 | |
Dividends and interest receivable | | 1,420,276 | | 58,534 | |
Receivable from Investment Manager | | 13,886 | | 10,775 | |
Prepaid expenses | | 224,746 | | 51,753 | |
Total Assets | | 3,589,042,704 | | 353,940,726 | |
| | | | | |
LIABILITIES: | | | | | |
Payable for investment securities purchased | | 93,210,928 | | 15,668,267 | |
Payable for shares of beneficial interest redeemed | | 7,128,420 | | 123,322 | |
Accrued investment advisory fees | | 2,343,905 | | 157,155 | |
Accrued transfer agent fees | | 1,134,275 | | 30,539 | |
Accrued distribution fees | | 283,265 | | 34,268 | |
Accrued administrative fees | | 90,763 | | 8,311 | |
Accrued shareholder servicing fees | | 676,417 | | 8,579 | |
Accrued shareholder administrative fees | | 33,005 | | 3,435 | |
Accrued trustee fees | | 10,659 | | 844 | |
Accrued other expenses | | 297,335 | | 69,418 | |
Total Liabilities | | 105,208,972 | | 16,104,138 | |
NET ASSETS | | $ | 3,483,833,732 | | $ | 337,836,588 | |
| | | | | |
NET ASSETS CONSIST OF: | | | | | |
Paid in capital (par value of $.001 per share) | | 2,202,470,795 | | 308,231,562 | |
Distributable earnings | | 1,281,362,937 | | 29,605,026 | |
NET ASSETS | | $ | 3,483,833,732 | | $ | 337,836,588 | |
* Identified cost | | $ | 2,318,393,367 | (a) | $ | 300,253,883 | (b) |
** Identified cost | | $ | — | | $ | 345,713 | (b) |
See Notes to Financial Statements.
37
THE ALGER INSTITUTIONAL FUNDS
Statements of Assets and Liabilities October 31, 2018 (Continued)
| | Alger Capital
Appreciation
Institutional Fund | | Alger Focus Equity
Fund | |
| | | | | |
NET ASSETS BY CLASS: | | | | | |
Class A | | $ | — | | $ | 43,620,597 | |
Class C | | $ | — | | $ | 26,366,047 | |
Class I | | $ | 2,258,999,880 | | $ | 37,070,092 | |
Class R | | $ | 595,009,843 | | $ | — | |
Class Y | | $ | 166,778,203 | | $ | 57,879,711 | |
Class Z | | $ | — | | $ | 172,900,141 | |
Class Z-2 | | $ | 463,045,806 | | $ | — | |
| | | | | |
SHARES OF BENEFICIAL INTEREST OUTSTANDING — NOTE 6: | | | | | |
Class A | | — | | 1,283,035 | |
Class C | | — | | 811,890 | |
Class I | | 65,463,640 | | 1,084,810 | |
Class R | | 19,298,154 | | — | |
Class Y | | 4,799,916 | | 1,663,505 | |
Class Z | | — | | 4,978,531 | |
Class Z-2 | | 13,327,151 | | — | |
| | | | | |
NET ASSET VALUE PER SHARE: | | | | | |
Class A — Net Asset Value Per Share Class A | | $ | — | | $ | 34.00 | |
Class A — Offering Price Per Share (includes a 5.25% sales charge) | | $ | — | | $ | 35.88 | |
Class C — Net Asset Value Per Share Class C | | $ | — | | $ | 32.47 | |
Class I — Net Asset Value Per Share Class I | | $ | 34.51 | | $ | 34.17 | |
Class R — Net Asset Value Per Share Class R | | $ | 30.83 | | $ | — | |
Class Y — Net Asset Value Per Share Class Y | | $ | 34.75 | | $ | 34.79 | |
Class Z — Net Asset Value Per Share Class Z | | $ | — | | $ | 34.73 | |
Class Z-2 — Net Asset Value Per Share Class Z-2 | | $ | 34.74 | | $ | — | |
See Notes to Financial Statements.
(a) At October 31, 2018, the net unrealized appreciation on investments, based on cost for federal income tax purposes of $2,337,194,209, amounted to $929,915,522 which consisted of aggregate gross unrealized appreciation of $982,166,320 and aggregate gross unrealized depreciation of $52,250,798.
(b) At October 31, 2018, the net unrealized appreciation on investments, based on cost for federal income tax purposes of $303,114,230, amounted to $12,639,427 which consisted of aggregate gross unrealized appreciation of $22,950,183 and aggregate gross unrealized depreciation of $10,310,756.
38
THE ALGER INSTITUTIONAL FUNDS
Statements of Assets and Liabilities October 31, 2018 (Continued)
| | Alger Mid Cap
Growth Institutional
Fund | | Alger Small Cap
Growth Institutional
Fund | |
ASSETS: | | | | | |
Investments in unaffiliated securities, at value (Identified cost below)* see accompanying schedules of investments | | $ | 101,803,716 | | $ | 189,541,999 | |
Investments in affiliated securities, at value (Identified cost below)** see accompanying schedules of investments | | 521,268 | | 418,446 | |
Cash and cash equivalents | | 1,396,806 | | 1,826,910 | |
Receivable for investment securities sold | | 8,160,807 | | — | |
Receivable for shares of beneficial interest sold | | 69,577 | | 110,342 | |
Dividends and interest receivable | | 50,682 | | 319,383 | |
Receivable from Investment Manager | | 396 | | — | |
Prepaid expenses | | 40,687 | | 24,122 | |
Total Assets | | 112,043,939 | | 192,241,202 | |
| | | | | |
LIABILITIES: | | | | | |
Payable for investment securities purchased | | 9,229,706 | | 131,915 | |
Payable for shares of beneficial interest redeemed | | 654,323 | | 449,906 | |
Accrued investment advisory fees | | 74,380 | | 147,280 | |
Accrued transfer agent fees | | 43,847 | | 65,140 | |
Accrued distribution fees | | 5,340 | | 4,376 | |
Accrued administrative fees | | 2,691 | | 5,000 | |
Accrued shareholder servicing fees | | 21,741 | | 33,778 | |
Accrued shareholder administrative fees | | 979 | | 1,818 | |
Accrued trustee fees | | 327 | | 619 | |
Accrued other expenses | | 68,877 | | 84,664 | |
Total Liabilities | | 10,102,211 | | 924,496 | |
NET ASSETS | | $ | 101,941,728 | | $ | 191,316,706 | |
| | | | | |
NET ASSETS CONSIST OF: | | | | | |
Paid in capital (par value of $.001 per share) | | 89,717,712 | | 99,676,262 | |
Distributable earnings | | 12,224,016 | | 91,640,444 | |
NET ASSETS | | $ | 101,941,728 | | $ | 191,316,706 | |
* Identified cost | | $ | 95,849,830 | (a) | $ | 118,230,574 | (b) |
** Identified cost | | $ | 747,040 | (a) | $ | 599,684 | (b) |
See Notes to Financial Statements.
39
THE ALGER INSTITUTIONAL FUNDS
Statements of Assets and Liabilities October 31, 2018 (Continued)
| | Alger Mid Cap | | Alger Small Cap | |
| | Growth Institutional | | Growth Institutional | |
| | Fund | | Fund | |
| | | | | |
NET ASSETS BY CLASS: | | | | | |
Class I | | $ | 79,953,575 | | $ | 132,526,081 | |
Class R | | $ | 10,672,352 | | $ | 9,238,149 | |
Class Z-2 | | $ | 11,315,801 | | $ | 49,552,476 | |
| | | | | |
SHARES OF BENEFICIAL INTEREST OUTSTANDING — NOTE 6: | | | | | |
Class I | | 2,647,603 | | 5,881,680 | |
Class R | | 386,166 | | 487,093 | |
Class Z-2 | | 372,734 | | 2,182,805 | |
| | | | | |
NET ASSET VALUE PER SHARE: | | | | | |
Class I — Net Asset Value Per Share Class I | | $ | 30.20 | | $ | 22.53 | |
Class R — Net Asset Value Per Share Class R | | $ | 27.64 | | $ | 18.97 | |
Class Z-2 — Net Asset Value Per Share Class Z-2 | | $ | 30.36 | | $ | 22.70 | |
See Notes to Financial Statements.
(a) At October 31, 2018, the net unrealized appreciation on investments, based on cost for federal income tax purposes of $96,735,655, amounted to $5,589,329 which consisted of aggregate gross unrealized appreciation of $11,642,015 and aggregate gross unrealized depreciation of $6,052,686.
(b) At October 31, 2018, the net unrealized appreciation on investments, based on cost for federal income tax purposes of $121,205,418, amounted to $68,755,027 which consisted of aggregate gross unrealized appreciation of $78,093,969 and aggregate gross unrealized depreciation of $9,338,942.
40
THE ALGER INSTITUTIONAL FUNDS
Statements of Operations for the year ended October 31, 2018
| | Alger Capital
Appreciation
Institutional Fund | | Alger Focus Equity
Fund | |
| | | | | |
INCOME: | | | | | |
Dividends (net of foreign withholding taxes*) | | $ | 35,706,544 | | $ | 1,639,144 | |
Interest from unaffiliated securities | | 1,021,889 | | 104,954 | |
Total Income | | 36,728,433 | | 1,744,098 | |
| | | | | |
EXPENSES: | | | | | |
Advisory fees — Note 3(a) | | 27,045,899 | | 1,086,202 | |
Distribution fees — Note 3(c) | | | | | |
Class A | | — | | 83,296 | |
Class C | | — | | 230,180 | |
Class R | | 3,281,657 | | — | |
Shareholder servicing fees — Note 3(k) | | 7,791,964 | | 76,284 | |
Shareholder administrative fees — Note 3(f) | | 372,432 | | 24,418 | |
Administration fees — Note 3(b) | | 1,024,187 | | 57,080 | |
Custodian fees | | 173,877 | | 65,183 | |
Interest expenses | | 13,581 | | 305 | |
Transfer agent fees and expenses — Note 3(f) | | 2,490,362 | | 95,192 | |
Printing fees | | 190,925 | | 22,514 | |
Professional fees | | 167,156 | | 48,760 | |
Registration fees | | 104,232 | | 78,953 | |
Trustee fees — Note 3(g) | | 131,934 | | 7,425 | |
Fund accounting fees | | 487,401 | | 36,543 | |
Miscellaneous | | 357,082 | | 13,128 | |
Total Expenses | | 43,632,689 | | 1,925,463 | |
Less, expense reimbursements/waivers — Note 3(a) | | (237,850 | ) | (39,559 | ) |
Net Expenses | | 43,394,839 | | 1,885,904 | |
NET INVESTMENT LOSS | | (6,666,406 | ) | (141,806 | ) |
| | | | | |
REALIZED AND UNREALIZED GAIN (LOSS) ON INVESTMENTS AND FOREIGN CURRENCY: | | | | | |
Net realized gain on unaffiliated investments | | 407,400,141 | | 16,804,990 | |
Net realized (loss) on affiliated investments | | (2,970,741 | ) | — | |
Net realized (loss) on foreign currency transactions | | (36,688 | ) | (23 | ) |
Net change in unrealized (depreciation) on unaffiliated investments | | (95,057,037 | ) | (11,375,817 | ) |
Net change in unrealized appreciation on affiliated investments | | 2,970,741 | | 1,536 | |
Net change in unrealized (depreciation) on foreign currency | | (3 | ) | — | |
Net realized and unrealized gain on investments and foreign currency | | 312,306,413 | | 5,430,686 | |
NET INCREASE IN NET ASSETS RESULTING FROM OPERATIONS | | $ | 305,640,007 | | $ | 5,288,880 | |
| | | | | | | |
|
* Foreign withholding taxes | | $ | 7,377 | | $ | — | |
See Notes to Financial Statements.
41
THE ALGER INSTITUTIONAL FUNDS
Statements of Operations for the year ended October 31, 2018 (Continued)
| | Alger Mid Cap
Growth Institutional
Fund | | Alger Small Cap
Growth Institutional
Fund | |
| | | | | |
INCOME: | | | | | |
Dividends (net of foreign withholding taxes*) | | $ | 582,366 | | $ | 645,000 | |
Interest from unaffiliated securities | | 15,741 | | 33,236 | |
Total Income | | 598,107 | | 678,236 | |
| | | | | |
EXPENSES: | | | | | |
Advisory fees — Note 3(a) | | 850,383 | | 1,699,502 | |
Distribution fees — Note 3(c) | | | | | |
Class R | | 62,587 | | 52,993 | |
Shareholder servicing fees — Note 3(k) | | 251,852 | | 373,231 | |
Shareholder administrative fees — Note 3(f) | | 11,189 | | 20,982 | |
Administration fees — Note 3(b) | | 30,770 | | 57,699 | |
Custodian fees | | 54,867 | | 52,368 | |
Interest expenses | | 432 | | 1,659 | |
Transfer agent fees and expenses — Note 3(f) | | 92,553 | | 149,072 | |
Printing fees | | 11,850 | | 24,440 | |
Professional fees | | 65,803 | | 65,693 | |
Registration fees | | 40,885 | | 43,101 | |
Trustee fees — Note 3(g) | | 4,002 | | 7,455 | |
Fund accounting fees | | 20,647 | | 33,191 | |
Miscellaneous | | 29,364 | | 45,893 | |
Total Expenses | | 1,527,184 | | 2,627,279 | |
Less, expense reimbursements/waivers — Note 3(a) | | (3,885 | ) | (7,111 | ) |
Net Expenses | | 1,523,299 | | 2,620,168 | |
NET INVESTMENT LOSS | | (925,192 | ) | (1,941,932 | ) |
| | | | | |
REALIZED AND UNREALIZED GAIN (LOSS) ON INVESTMENTS, ESCROW RECEIVABLE AND FOREIGN CURRENCY: | | | | | |
Net realized gain on unaffiliated investments and escrow receivable | | 8,171,317 | | 24,786,865 | |
Net realized (loss) on affiliated investments | | (168,176 | ) | — | |
Net realized gain on foreign currency transactions | | 604 | | 7 | |
Net change in unrealized appreciation (depreciation) on unaffiliated investments and escrow receivable | | (1,076,414 | ) | 3,408,531 | |
Net change in unrealized appreciation on affiliated investments | | 171,496 | | 2,665 | |
Net realized and unrealized gain on investments, escrow receivable and foreign currency | | 7,098,827 | | 28,198,068 | |
NET INCREASE IN NET ASSETS RESULTING FROM OPERATIONS | | $ | 6,173,635 | | $ | 26,256,136 | |
| | | | | |
|
* Foreign withholding taxes | | $ | 2,223 | | $ | 5,322 | |
See Notes to Financial Statements.
42
THE ALGER INSTITUTIONAL FUNDS
Statements of Changes in Net Assets
| | Alger Capital Appreciation Institutional Fund | |
| | For the Year
Ended October
31, 2018 | | For the Year
Ended October
31, 2017 | |
| | | | | |
Net investment loss | | $ | (6,666,406 | ) | $ | (1,862,662 | ) |
Net realized gain on investments and foreign currency | | 404,392,712 | | 263,519,037 | |
Net change in unrealized appreciation (depreciation) on investments and foreign currency | | (92,086,299 | ) | 612,149,835 | |
Net increase in net assets resulting from operations | | 305,640,007 | | 873,806,210 | |
| | | | | |
Dividends and distributions to shareholders:* | | | | | |
Class I | | (155,695,093 | ) | (19,820,400 | ) |
Class R | | (45,926,496 | ) | (4,624,888 | ) |
Class Y | | (6,401,127 | ) | — | |
Class Z-2 | | (28,017,833 | ) | (1,189,367 | ) |
Total dividends and distributions to shareholders | | (236,040,549 | ) | (25,634,655 | ) |
| | | | | |
Increase (decrease) from shares of beneficial interest transactions: | | | | | |
Class I | | (244,851,310 | ) | (1,124,431,159 | ) |
Class R | | (67,006,545 | ) | (72,815,333 | ) |
Class Y | | 68,027,078 | | 92,176,269 | |
Class Z-2 | | 17,242,397 | | 351,709,750 | |
Net decrease from shares of beneficial interest transactions — Note 6 | | (226,588,380 | ) | (753,360,473 | ) |
Total increase (decrease) | | (156,988,922 | ) | 94,811,082 | |
| | | | | |
Net Assets: | | | | | |
Beginning of period | | 3,640,822,654 | | 3,546,011,572 | |
END OF PERIOD** | | $ | 3,483,833,732 | | $ | 3,640,822,654 | |
See Notes to Financial Statements.
* For the year ended October 31, 2017, the source of distributions was from net realized gains.
** For the year ended October 31, 2017, the undistributed net investment income was $649,644.
43
THE ALGER INSTITUTIONAL FUNDS
Statements of Changes in Net Assets (Continued)
| | Alger Focus Equity Fund | |
| | For the Year
Ended October
31, 2018 | | For the Year
Ended October
31, 2017 | |
| | | | | |
Net investment loss | | $ | (141,806 | ) | $ | (15,268 | ) |
Net realized gain on investments and foreign currency | | 16,804,967 | | 8,631,002 | |
Net change in unrealized appreciation (depreciation) on investments | | (11,374,281 | ) | 20,091,300 | |
Net increase in net assets resulting from operations | | 5,288,880 | | 28,707,034 | |
| | | | | |
Dividends and distributions to shareholders: | | | | | |
Class A | | (928,906 | ) | — | |
Class C | | (741,526 | ) | — | |
Class I | | (903,457 | ) | — | |
Class Y | | (166,506 | ) | — | |
Class Z | | (2,493,828 | ) | — | |
Total dividends and distributions to shareholders | | (5,234,223 | ) | — | |
| | | | | |
Increase (decrease) from shares of beneficial interest transactions: | | | | | |
Class A | | 18,547,617 | | (7,858,588 | ) |
Class C | | 6,715,162 | | 2,099,824 | |
Class I | | 11,784,060 | | (4,667,192 | ) |
Class Y | | 56,440,501 | | 4,131,666 | |
Class Z | | 111,949,959 | | 34,166,838 | |
Net increase from shares of beneficial interest transactions — Note 6 | | 205,437,299 | | 27,872,548 | |
Total increase | | 205,491,956 | | 56,579,582 | |
| | | | | |
Net Assets: | | | | | |
Beginning of period | | 132,344,632 | | 75,765,050 | |
END OF PERIOD* | | $ | 337,836,588 | | $ | 132,344,632 | |
See Notes to Financial Statements.
* For the year ended October 31, 2017, the undistributed net investment income was $54,619.
44
THE ALGER INSTITUTIONAL FUNDS
Statements of Changes in Net Assets (Continued)
| | Alger Mid Cap Growth Institutional Fund | |
| | For the Year
Ended October
31, 2018 | | For the Year
Ended October
31, 2017 | |
| | | | | |
Net investment loss | | $ | (925,192 | ) | $ | (564,987 | ) |
Net realized gain on investments, escrow receivable and foreign currency | | 8,003,745 | | 23,865,772 | |
Net change in unrealized appreciation (depreciation) on investments and escrow receivable | | (904,918 | ) | 4,805,094 | |
Net increase in net assets resulting from operations | | 6,173,635 | | 28,105,879 | |
| | | | | |
Increase (decrease) from shares of beneficial interest transactions: | | | | | |
Class I | | (10,944,024 | ) | (18,928,722 | ) |
Class R | | (2,923,958 | ) | (3,822,468 | ) |
Class Z-2 | | 1,992,841 | | 7,301,003 | |
Net decrease from shares of beneficial interest transactions — Note 6 | | (11,875,141 | ) | (15,450,187 | ) |
Total increase (decrease) | | (5,701,506 | ) | 12,655,692 | |
| | | | | |
Net Assets: | | | | | |
Beginning of period | | 107,643,234 | | 94,987,542 | |
END OF PERIOD* | | $ | 101,941,728 | | $ | 107,643,234 | |
See Notes to Financial Statements.
* For the year ended October 31, 2017, the undistributed net investment accumulated loss was $(610,145).
45
THE ALGER INSTITUTIONAL FUNDS
Statements of Changes in Net Assets (Continued)
| | Alger Small Cap Growth Institutional Fund | |
| | For the Year
Ended October
31, 2018 | | For the Year
Ended October
31, 2017 | |
| | | | | |
Net investment loss | | $ | (1,941,932 | ) | $ | (1,374,929 | ) |
Net realized gain on investments, escrow receivable and foreign currency | | 24,786,872 | | 13,341,081 | |
Net change in unrealized appreciation on investments and escrow receivable | | 3,411,196 | | 49,808,677 | |
Net increase in net assets resulting from operations | | 26,256,136 | | 61,774,829 | |
| | | | | |
Dividends and distributions to shareholders: | | | | | |
Class I | | (3,663,266 | ) | — | |
Class R | | (360,715 | ) | — | |
Class Z-2 | | (1,861,053 | ) | — | |
Total dividends and distributions to shareholders | | (5,885,034 | ) | — | |
| | | | | |
Increase (decrease) from shares of beneficial interest transactions: | | | | | |
Class I | | (10,825,882 | ) | (38,794,988 | ) |
Class R | | (2,949,728 | ) | (5,270,974 | ) |
Class Z-2 | | (24,326,697 | ) | 7,688,642 | |
Net decrease from shares of beneficial interest transactions — Note 6 | | (38,102,307 | ) | (36,377,320 | ) |
Total increase (decrease) | | (17,731,205 | ) | 25,397,509 | |
| | | | | |
Net Assets: | | | | | |
Beginning of period | | 209,047,911 | | 183,650,402 | |
END OF PERIOD* | | $ | 191,316,706 | | $ | 209,047,911 | |
See Notes to Financial Statements.
* For the year ended October 31, 2017, the undistributed net investment accumulated loss was $(1,549,751).
46
THE ALGER INSTITUTIONAL FUNDS
Financial Highlights for a share outstanding throughout the period
Alger Capital Appreciation Institutional Fund
| | Class I | |
| | Year ended | | Year ended | | Year ended | | Year ended | | Year ended | |
| | 10/31/2018 | | 10/31/2017 | | 10/31/2016 | | 10/31/2015 | | 10/31/2014 | |
Net asset value, beginning of period | | $ | 33.96 | | $ | 26.44 | | $ | 28.48 | | $ | 29.34 | | $ | 28.21 | |
INCOME FROM INVESTMENT OPERATIONS: | | | | | | | | | | | |
Net investment income (loss)(i) | | (0.05 | ) | — | | 0.02 | | (0.02 | ) | (0.02 | ) |
Net realized and unrealized gain (loss) on investments | | 2.79 | | 7.71 | | (0.02 | ) | 2.46 | | 4.57 | |
Total from investment operations | | 2.74 | | 7.71 | | — | | 2.44 | | 4.55 | |
Dividends from net investment income | | — | | — | | — | | — | | (0.01 | ) |
Distributions from net realized gains | | (2.19 | ) | (0.19 | ) | (2.04 | ) | (3.30 | ) | (3.41 | ) |
Net asset value, end of period | | $ | 34.51 | | $ | 33.96 | | $ | 26.44 | | $ | 28.48 | | $ | 29.34 | |
Total return | | 8.46 | % | 29.38 | % | (0.08 | )% | 8.96 | % | 17.63 | % |
RATIOS/SUPPLEMENTAL DATA: | | | | | | | | | | | |
Net assets, end of period (000’s omitted) | | $ | 2,259,000 | | $ | 2,451,822 | | $ | 2,965,503 | | $ | 3,194,261 | | $ | 2,555,737 | |
Ratio of gross expenses to average net assets | | 1.15 | % | 1.14 | % | 1.12 | % | 1.12 | % | 1.16 | % |
Ratio of expense reimbursements to average net assets | | — | (ii) | — | | — | | — | | — | |
Ratio of net expenses to average net assets | | 1.15 | % | 1.14 | % | 1.12 | % | 1.12 | % | 1.16 | % |
Ratio of net investment income (loss) to average net assets | | (0.16 | )% | 0.01 | % | 0.07 | % | (0.07 | )% | (0.07 | )% |
Portfolio turnover rate | | 64.77 | % | 66.72 | % | 94.56 | % | 136.03 | %(iii) | 136.20 | %(iv) |
See Notes to Financial Statements.
(i) Amount was computed based on average shares outstanding during the period.
(ii) Amount was less than 0.005% per share.
(iii) Amount excludes redemption in kind transaction of $294,638,130.
(iv) Amount excludes redemption in kind transaction of $71,436,408.
47
THE ALGER INSTITUTIONAL FUNDS
Financial Highlights for a share outstanding throughout the period
Alger Capital Appreciation Institutional Fund
| | Class R | |
| | Year ended | | Year ended | | Year ended | | Year ended | | Year ended | |
| | 10/31/2018 | | 10/31/2017 | | 10/31/2016 | | 10/31/2015 | | 10/31/2014 | |
Net asset value, beginning of period | | $ | 30.70 | | $ | 24.03 | | $ | 26.19 | | $ | 27.35 | | $ | 26.63 | |
INCOME FROM INVESTMENT OPERATIONS: | | | | | | | | | | | |
Net investment loss(i) | | (0.19 | ) | (0.13 | ) | (0.10 | ) | (0.15 | ) | (0.14 | ) |
Net realized and unrealized gain (loss) on investments | | 2.51 | | 6.99 | | (0.02 | ) | 2.29 | | 4.27 | |
Total from investment operations | | 2.32 | | 6.86 | | (0.12 | ) | 2.14 | | 4.13 | |
Distributions from net realized gains | | (2.19 | ) | (0.19 | ) | (2.04 | ) | (3.30 | ) | (3.41 | ) |
Net asset value, end of period | | $ | 30.83 | | $ | 30.70 | | $ | 24.03 | | $ | 26.19 | | $ | 27.35 | |
Total return | | 7.96 | % | 28.78 | % | (0.57 | )% | 8.46 | % | 17.04 | % |
RATIOS/SUPPLEMENTAL DATA: | | | | | | | | | | | |
Net assets, end of period (000’s omitted) | | $ | 595,010 | | $ | 654,966 | | $ | 578,297 | | $ | 656,469 | | $ | 529,757 | |
Ratio of gross expenses to average net assets | | 1.59 | % | 1.62 | % | 1.61 | % | 1.61 | % | 1.64 | % |
Ratio of expense reimbursements to average net assets | | — | (ii) | — | | — | | — | | — | |
Ratio of net expenses to average net assets | | 1.59 | % | 1.62 | % | 1.61 | % | 1.61 | % | 1.64 | % |
Ratio of net investment loss to average net assets | | (0.60 | )% | (0.48 | )% | (0.41 | )% | (0.57 | )% | (0.55 | )% |
Portfolio turnover rate | | 64.77 | % | 66.72 | % | 94.56 | % | 136.03 | %(iii) | 136.20 | %(iv) |
See Notes to Financial Statements.
(i) Amount was computed based on average shares outstanding during the period.
(ii) Amount was less than 0.005% per share.
(iii) Amount excludes redemption in kind transaction of $294,638,130.
(iv) Amount excludes redemption in kind transaction of $71,436,408.
48
THE ALGER INSTITUTIONAL FUNDS
Financial Highlights for a share outstanding throughout the period
Alger Capital Appreciation Institutional Fund
| | Class Y | |
| | Year ended
10/31/2018 | | From 2/28/2017
(commencement of
operations) to
10/31/2017(i) | |
Net asset value, beginning of period | | $ | 34.05 | | $ | 28.85 | |
INCOME FROM INVESTMENT OPERATIONS: | | | | | |
Net investment income(ii) | | 0.08 | | 0.02 | |
Net realized and unrealized gain on investments | | 2.81 | | 5.18 | |
Total from investment operations | | 2.89 | | 5.20 | |
Distributions from net realized gains | | (2.19 | ) | — | |
Net asset value, end of period | | $ | 34.75 | | $ | 34.05 | |
Total return | | 8.90 | % | 18.02 | % |
RATIOS/SUPPLEMENTAL DATA: | | | | | |
Net assets, end of period (000’s omitted) | | $ | 166,778 | | $ | 97,889 | |
Ratio of gross expenses to average net assets | | 0.83 | % | 0.85 | % |
Ratio of expense reimbursements to average net assets | | (0.10 | )% | (0.10 | )% |
Ratio of net expenses to average net assets | | 0.73 | % | 0.75 | % |
Ratio of net investment income to average net assets | | 0.22 | % | 0.10 | % |
Portfolio turnover rate | | 64.77 | % | 66.72 | % |
See Notes to Financial Statements.
(i) Ratios have been annualized; total return has not been annualized; portfolio turnover is for the twelve months then ended.
(ii) Amount was computed based on average shares outstanding during the period.
49
THE ALGER INSTITUTIONAL FUNDS
Financial Highlights for a share outstanding throughout the period
Alger Capital Appreciation Institutional Fund
| | Class Z-2 | |
| | Year ended
10/31/2018 | | Year ended
10/31/2017 | | From 10/14/2016
(commencement of
operations) to
10/31/2016(i) | |
Net asset value, beginning of period | | $ | 34.08 | | $ | 26.44 | | $ | 26.67 | |
INCOME FROM INVESTMENT OPERATIONS: | | | | | | | |
Net investment income(ii) | | 0.06 | | 0.07 | | 0.01 | |
Net realized and unrealized gain (loss) on investments | | 2.79 | | 7.76 | | (0.24 | ) |
Total from investment operations | | 2.85 | | 7.83 | | (0.23 | ) |
Distributions from net realized gains | | (2.19 | ) | (0.19 | ) | — | |
Net asset value, end of period | | $ | 34.74 | | $ | 34.08 | | $ | 26.44 | |
Total return | | 8.80 | % | 29.83 | % | (0.86 | )% |
RATIOS/SUPPLEMENTAL DATA: | | | | | | | |
Net assets, end of period (000’s omitted) | | $ | 463,046 | | $ | 436,145 | | $ | 2,212 | |
Ratio of gross expenses to average net assets | | 0.82 | % | 0.84 | % | 3.11 | % |
Ratio of expense reimbursements to average net assets | | — | (iii) | — | | (2.16 | )% |
Ratio of net expenses to average net assets | | 0.82 | % | 0.84 | % | 0.95 | % |
Ratio of net investment income to average net assets | | 0.16 | % | 0.22 | % | 1.29 | % |
Portfolio turnover rate | | 64.77 | % | 66.72 | % | 94.56 | % |
See Notes to Financial Statements.
(i) Ratios have been annualized; total return has not been annualized; portfolio turnover is for the twelve months then ended.
(ii) Amount was computed based on average shares outstanding during the period.
(iii) Amount was less than 0.005% per share.
50
THE ALGER INSTITUTIONAL FUNDS
Financial Highlights for a share outstanding throughout the period
Alger Focus Equity Fund
| | Class A | |
| | Year ended | | Year ended | | Year ended | | Year ended | | Year ended | |
| | 10/31/2018 | | 10/31/2017 | | 10/31/2016 | | 10/31/2015 | | 10/31/2014 | |
Net asset value, beginning of period | | $ | 31.74 | | $ | 23.95 | | $ | 24.13 | | $ | 22.01 | | $ | 18.69 | |
INCOME FROM INVESTMENT OPERATIONS: | | | | | | | | | | | |
Net investment income (loss)(i) | | (0.06 | ) | 0.01 | | (0.03 | ) | (0.02 | ) | (0.04 | ) |
Net realized and unrealized gain on investments | | 3.55 | | 7.78 | | 0.12 | | 2.14 | | 3.36 | |
Total from investment operations | | 3.49 | | 7.79 | | 0.09 | | 2.12 | | 3.32 | |
Distributions from net realized gains | | (1.23 | ) | — | | (0.27 | ) | — | | — | |
Net asset value, end of period | | $ | 34.00 | | $ | 31.74 | | $ | 23.95 | | $ | 24.13 | | $ | 22.01 | |
Total return(ii) | | 11.33 | % | 32.53 | % | 0.36 | % | 9.63 | % | 17.76 | % |
RATIOS/SUPPLEMENTAL DATA: | | | | | | | | | | | |
Net assets, end of period (000’s omitted) | | $ | 43,621 | | $ | 23,693 | | $ | 25,524 | | $ | 23,961 | | $ | 5,158 | |
Ratio of gross expenses to average net assets | | 1.03 | % | 1.11 | % | 1.26 | % | 1.48 | % | 2.38 | % |
Ratio of expense reimbursements to average net assets | | — | | — | | (0.07 | )% | (0.18 | )% | (1.08 | )% |
Ratio of net expenses to average net assets | | 1.03 | % | 1.11 | % | 1.19 | % | 1.30 | % | 1.30 | % |
Ratio of net investment income (loss) to average net assets | | (0.17 | )% | 0.03 | % | (0.13 | )% | (0.08 | )% | (0.19 | )% |
Portfolio turnover rate | | 135.54 | % | 98.57 | % | 127.40 | % | 182.58 | % | 153.69 | % |
See Notes to Financial Statements.
(i) Amount was computed based on average shares outstanding during the period.
(ii) Does not reflect the effect of sales charges, if applicable.
51
THE ALGER INSTITUTIONAL FUNDS
Financial Highlights for a share outstanding throughout the period
Alger Focus Equity Fund
| | Class C | |
| | Year ended | | Year ended | | Year ended | | Year ended | | Year ended | |
| | 10/31/2018 | | 10/31/2017 | | 10/31/2016 | | 10/31/2015 | | 10/31/2014 | |
Net asset value, beginning of period | | $ | 30.59 | | $ | 23.27 | | $ | 23.62 | | $ | 21.71 | | $ | 18.58 | |
INCOME FROM INVESTMENT OPERATIONS: | | | | | | | | | | | |
Net investment loss(i) | | (0.31 | ) | (0.21 | ) | (0.20 | ) | (0.20 | ) | (0.19 | ) |
Net realized and unrealized gain on investments | | 3.42 | | 7.53 | | 0.12 | | 2.11 | | 3.32 | |
Total from investment operations | | 3.11 | | 7.32 | | (0.08 | ) | 1.91 | | 3.13 | |
Distributions from net realized gains | | (1.23 | ) | — | | (0.27 | ) | — | | — | |
Net asset value, end of period | | $ | 32.47 | | $ | 30.59 | | $ | 23.27 | | $ | 23.62 | | $ | 21.71 | |
Total return(ii) | | 10.51 | % | 31.46 | % | (0.36 | )% | 8.80 | % | 16.85 | % |
RATIOS/SUPPLEMENTAL DATA: | | | | | | | | | | | |
Net assets, end of period (000’s omitted) | | $ | 26,366 | | $ | 18,660 | | $ | 12,021 | | $ | 6,542 | | $ | 2,635 | |
Ratio of gross expenses to average net assets | | 1.80 | % | 1.90 | % | 2.03 | % | 2.25 | % | 3.14 | % |
Ratio of expense reimbursements to average net assets | | — | | — | | (0.10 | )% | (0.20 | )% | (1.09 | )% |
Ratio of net expenses to average net assets | | 1.80 | % | 1.90 | % | 1.93 | % | 2.05 | % | 2.05 | % |
Ratio of net investment loss to average net assets | | (0.93 | )% | (0.79 | )% | (0.87 | )% | (0.85 | )% | (0.94 | )% |
Portfolio turnover rate | | 135.54 | % | 98.57 | % | 127.40 | % | 182.58 | % | 153.69 | % |
See Notes to Financial Statements.
(i) Amount was computed based on average shares outstanding during the period.
(ii) Does not reflect the effect of sales charges, if applicable.
52
THE ALGER INSTITUTIONAL FUNDS
Financial Highlights for a share outstanding throughout the period
Alger Focus Equity Fund
| | Class I | |
| | Year ended | | Year ended | | Year ended | | Year ended | | Year ended | |
| | 10/31/2018 | | 10/31/2017 | | 10/31/2016 | | 10/31/2015 | | 10/31/2014 | |
Net asset value, beginning of period | | $ | 31.88 | | $ | 24.06 | | $ | 24.23 | | $ | 22.07 | | $ | 18.72 | |
INCOME FROM INVESTMENT OPERATIONS: | | | | | | | | | | | |
Net investment income (loss)(i) | | (0.05 | ) | 0.01 | | (0.02 | ) | 0.01 | | (0.01 | ) |
Net realized and unrealized gain on investments | | 3.57 | | 7.81 | | 0.12 | | 2.15 | | 3.36 | |
Total from investment operations | | 3.52 | | 7.82 | | 0.10 | | 2.16 | | 3.35 | |
Distributions from net realized gains | | (1.23 | ) | — | | (0.27 | ) | — | | — | |
Net asset value, end of period | | $ | 34.17 | | $ | 31.88 | | $ | 24.06 | | $ | 24.23 | | $ | 22.07 | |
Total return(ii) | | 11.40 | % | 32.50 | % | 0.40 | % | 9.79 | % | 17.90 | % |
RATIOS/SUPPLEMENTAL DATA: | | | | | | | | | | | |
Net assets, end of period (000’s omitted) | | $ | 37,070 | | $ | 23,952 | | $ | 22,527 | | $ | 24,487 | | $ | 12,897 | |
Ratio of gross expenses to average net assets | | 1.02 | % | 1.12 | % | 1.30 | % | 1.49 | % | 2.36 | % |
Ratio of expense reimbursements to average net assets | | (0.02 | )% | — | | (0.15 | )% | (0.34 | )% | (1.21 | )% |
Ratio of net expenses to average net assets | | 1.00 | % | 1.12 | % | 1.15 | % | 1.15 | % | 1.15 | % |
Ratio of net investment income (loss) to average net assets | | (0.13 | )% | 0.02 | % | (0.09 | )% | 0.03 | % | (0.04 | )% |
Portfolio turnover rate | | 135.54 | % | 98.57 | % | 127.40 | % | 182.58 | % | 153.69 | % |
See Notes to Financial Statements.
(i) Amount was computed based on average shares outstanding during the period.
(ii) Does not reflect the effect of sales charges, if applicable.
53
THE ALGER INSTITUTIONAL FUNDS
Financial Highlights for a share outstanding throughout the period
Alger Focus Equity Fund
| | Class Y | |
| | Year ended
10/31/2018 | | From 2/28/2017
(commencement of
operations) to
10/31/2017(i) | |
Net asset value, beginning of period | | $ | 32.33 | | $ | 26.86 | |
INCOME FROM INVESTMENT OPERATIONS: | | | | | |
Net investment income (loss)(ii) | | 0.04 | | (0.01 | ) |
Net realized and unrealized gain on investments | | 3.65 | | 5.48 | |
Total from investment operations | | 3.69 | | 5.47 | |
Distributions from net realized gains | | (1.23 | ) | — | |
Net asset value, end of period | | $ | 34.79 | | $ | 32.33 | |
Total return(iii) | | 11.78 | % | 20.36 | % |
RATIOS/SUPPLEMENTAL DATA: | | | | | |
Net assets, end of period (000’s omitted) | | $ | 57,880 | | $ | 4,319 | |
Ratio of gross expenses to average net assets | | 0.70 | % | 1.51 | % |
Ratio of expense reimbursements to average net assets | | (0.05 | )% | (0.86 | )% |
Ratio of net expenses to average net assets | | 0.65 | % | 0.65 | % |
Ratio of net investment income (loss) to average net assets | | 0.11 | % | (0.05 | )% |
Portfolio turnover rate | | 135.54 | % | 98.57 | % |
See Notes to Financial Statements.
(i) Ratios have been annualized; total return has not been annualized; portfolio turnover is for the twelve months then ended.
(ii) Amount was computed based on average shares outstanding during the period.
(iii) Does not reflect the effect of sales charges, if applicable.
54
THE ALGER INSTITUTIONAL FUNDS
Financial Highlights for a share outstanding throughout the period
Alger Focus Equity Fund
| | Class Z | |
| | Year ended
10/31/2018 | | Year ended
10/31/2017 | | Year ended
10/31/2016 | | Year ended
10/31/2015 | | Year ended
10/31/2014 | |
Net asset value, beginning of period | | $ | 32.28 | | $ | 24.30 | | $ | 24.41 | | $ | 22.17 | | $ | 18.75 | |
INCOME FROM INVESTMENT OPERATIONS: | | | | | | | | | | | |
Net investment income(i) | | 0.05 | | 0.07 | | 0.03 | | 0.07 | | 0.05 | |
Net realized and unrealized gain on investments | | 3.63 | | 7.91 | | 0.13 | | 2.17 | | 3.37 | |
Total from investment operations | | 3.68 | | 7.98 | | 0.16 | | 2.24 | | 3.42 | |
Distributions from net realized gains | | (1.23 | ) | — | | (0.27 | ) | — | | — | |
Net asset value, end of period | | $ | 34.73 | | $ | 32.28 | | $ | 24.30 | | $ | 24.41 | | $ | 22.17 | |
Total return(ii) | | 11.74 | % | 32.84 | % | 0.64 | % | 10.10 | % | 18.24 | % |
RATIOS/SUPPLEMENTAL DATA: | | | | | | | | | | | |
Net assets, end of period (000’s omitted) | | $ | 172,900 | | $ | 61,721 | | $ | 15,693 | | $ | 3,683 | | $ | 1,262 | |
Ratio of gross expenses to average net assets | | 0.71 | % | 0.84 | % | 1.05 | % | 1.50 | % | 4.78 | % |
Ratio of expense reimbursements to average net assets | | (0.02 | )% | — | | (0.12 | )% | (0.61 | )% | (3.89 | )% |
Ratio of net expenses to average net assets | | 0.69 | % | 0.84 | % | 0.93 | % | 0.89 | % | 0.89 | % |
Ratio of net investment income to average net assets | | 0.15 | % | 0.25 | % | 0.12 | % | 0.30 | % | 0.23 | % |
Portfolio turnover rate | | 135.54 | % | 98.57 | % | 127.40 | % | 182.58 | % | 153.69 | % |
See Notes to Financial Statements.
(i) Amount was computed based on average shares outstanding during the period.
(ii) Does not reflect the effect of sales charges, if applicable.
55
THE ALGER INSTITUTIONAL FUNDS
Financial Highlights for a share outstanding throughout the period
Alger Mid Cap Growth Institutional Fund
| | Class I | |
| | Year ended
10/31/2018 | | Year ended
10/31/2017 | | Year ended
10/31/2016 | | Year ended
10/31/2015 | | Year ended
10/31/2014 | |
Net asset value, beginning of period | | $ | 28.65 | | $ | 21.59 | | $ | 22.54 | | $ | 22.18 | | $ | 19.43 | |
INCOME FROM INVESTMENT OPERATIONS: | | | | | | | | | | | |
Net investment loss(i) | | (0.25 | ) | (0.13 | ) | (0.05 | ) | (0.13 | ) | (0.07 | ) |
Net realized and unrealized gain (loss) on investments | | 1.80 | | 7.19 | | (0.90 | ) | 0.49 | | 2.82 | |
Total from investment operations | | 1.55 | | 7.06 | | (0.95 | ) | 0.36 | | 2.75 | |
Net asset value, end of period | | $ | 30.20 | | $ | 28.65 | | $ | 21.59 | | $ | 22.54 | | $ | 22.18 | |
Total return | | 5.44 | % | 32.70 | % | (4.21 | )% | 1.62 | % | 14.15 | % |
RATIOS/SUPPLEMENTAL DATA: | | | | | | | | | | | |
Net assets, end of period (000’s omitted) | | $ | 79,954 | | $ | 85,890 | | $ | 81,782 | | $ | 114,984 | | $ | 132,426 | |
Ratio of gross expenses to average net assets | | 1.34 | % | 1.28 | % | 1.25 | % | 1.20 | % | 1.30 | % |
Ratio of net expenses to average net assets | | 1.34 | % | 1.28 | % | 1.25 | % | 1.20 | % | 1.30 | % |
Ratio of net investment loss to average net assets | | (0.80 | )% | (0.50 | )% | (0.24 | )% | (0.55 | )% | (0.32 | )% |
Portfolio turnover rate | | 127.57 | % | 157.49 | % | 95.75 | % | 120.97 | % | 192.15 | % |
See Notes to Financial Statements.
(i) Amount was computed based on average shares outstanding during the period.
56
THE ALGER INSTITUTIONAL FUNDS
Financial Highlights for a share outstanding throughout the period
Alger Mid Cap Growth Institutional Fund
| | Class R | |
| | Year ended
10/31/2018 | | Year ended
10/31/2017 | | Year ended
10/31/2016 | | Year ended
10/31/2015 | | Year ended
10/31/2014 | |
Net asset value, beginning of period | | $ | 26.35 | | $ | 19.96 | | $ | 20.96 | | $ | 20.74 | | $ | 18.26 | |
INCOME FROM INVESTMENT OPERATIONS: | | | | | | | | | | | |
Net investment loss(i) | | (0.36 | ) | (0.24 | ) | (0.16 | ) | (0.23 | ) | (0.16 | ) |
Net realized and unrealized gain (loss) on investments | | 1.65 | | 6.63 | | (0.84 | ) | 0.45 | | 2.64 | |
Total from investment operations | | 1.29 | | 6.39 | | (1.00 | ) | 0.22 | | 2.48 | |
Net asset value, end of period | | $ | 27.64 | | $ | 26.35 | | $ | 19.96 | | $ | 20.96 | | $ | 20.74 | |
Total return | | 4.90 | % | 32.01 | % | (4.82 | )% | 1.11 | % | 13.58 | % |
RATIOS/SUPPLEMENTAL DATA: | | | | | | | | | | | |
Net assets, end of period (000’s omitted) | | $ | 10,672 | | $ | 12,943 | | $ | 13,093 | | $ | 17,795 | | $ | 21,953 | |
Ratio of gross expenses to average net assets | | 1.82 | % | 1.81 | % | 1.82 | % | 1.74 | % | 1.80 | % |
Ratio of net expenses to average net assets | | 1.82 | % | 1.81 | % | 1.82 | % | 1.74 | % | 1.80 | % |
Ratio of net investment loss to average net assets | | (1.28 | )% | (1.04 | )% | (0.81 | )% | (1.08 | )% | (0.82 | )% |
Portfolio turnover rate | | 127.57 | % | 157.49 | % | 95.75 | % | 120.97 | % | 192.15 | % |
See Notes to Financial Statements.
(i) Amount was computed based on average shares outstanding during the period.
57
THE ALGER INSTITUTIONAL FUNDS
Financial Highlights for a share outstanding throughout the period
Alger Mid Cap Growth Institutional Fund
| | Class Z-2 | |
| | Year ended
10/31/2018 | | Year ended
10/31/2017 | | From 10/14/2016
(commencement of
operations) to
10/31/2016(i) | |
Net asset value, beginning of period | | $ | 28.72 | | $ | 21.59 | | $ | 21.95 | |
INCOME FROM INVESTMENT OPERATIONS: | | | | | | | |
Net investment income (loss)(ii) | | (0.17 | ) | (0.08 | ) | 0.04 | |
Net realized and unrealized gain (loss) on investments | | 1.81 | | 7.21 | | (0.40 | ) |
Total from investment operations | | 1.64 | | 7.13 | | (0.36 | ) |
Net asset value, end of period | | $ | 30.36 | | $ | 28.72 | | $ | 21.59 | |
Total return | | 5.74 | % | 33.02 | % | (1.64 | )% |
RATIOS/SUPPLEMENTAL DATA: | | | | | | | |
Net assets, end of period (000’s omitted) | | $ | 11,316 | | $ | 8,810 | | $ | 113 | |
Ratio of gross expenses to average net assets | | 1.08 | % | 1.14 | % | 32.21 | % |
Ratio of expense reimbursements to average net assets | | (0.03 | )% | (0.09 | )% | (31.16 | )% |
Ratio of net expenses to average net assets | | 1.05 | % | 1.05 | % | 1.05 | % |
Ratio of net investment income (loss) to average net assets | | (0.53 | )% | (0.31 | )% | 4.35 | % |
Portfolio turnover rate | | 127.57 | % | 157.49 | % | 95.75 | % |
See Notes to Financial Statements.
(i) Ratios have been annualized; total return has not been annualized; portfolio turnover is for the twelve months then ended.
(ii) Amount was computed based on average shares outstanding during the period.
58
THE ALGER INSTITUTIONAL FUNDS
Financial Highlights for a share outstanding throughout the period
Alger Small Cap Growth Institutional Fund
| | Class I | |
| | Year ended
10/31/2018 | | Year ended
10/31/2017 | | Year ended
10/31/2016 | | Year ended
10/31/2015 | | Year ended
10/31/2014 | |
Net asset value, beginning of period | | $ | 20.52 | | $ | 14.83 | | $ | 23.10 | | $ | 28.14 | | $ | 33.48 | |
INCOME FROM INVESTMENT OPERATIONS: | | | | | | | | | | | |
Net investment loss(i) | | (0.22 | ) | (0.14) | | (0.10 | ) | (0.20 | ) | (0.20 | ) |
Net realized and unrealized gain (loss) on investments | | 2.81 | | 5.83 | | (0.54 | ) | 0.42 | | 0.60 | |
Total from investment operations | | 2.59 | | 5.69 | | (0.64 | ) | 0.22 | | 0.40 | |
Distributions from net realized gains | | (0.58 | ) | — | | (7.63 | ) | (5.26 | ) | (5.74 | ) |
Net asset value, end of period | | $ | 22.53 | | $ | 20.52 | | $ | 14.83 | | $ | 23.10 | | $ | 28.14 | |
Total return | | 12.96 | % | 38.37 | % | (3.76 | )% | 0.53 | % | 1.21 | % |
RATIOS/SUPPLEMENTAL DATA: | | | | | | | | | | | |
Net assets, end of period (000’s omitted) | | $ | 132,526 | | $ | 130,527 | | $ | 129,188 | | $ | 357,189 | | $ | 659,692 | |
Ratio of gross expenses to average net assets | | 1.32 | % | 1.32 | % | 1.28 | % | 1.25 | % | 1.24 | % |
Ratio of net expenses to average net assets | | 1.32 | % | 1.32 | % | 1.28 | % | 1.25 | % | 1.24 | % |
Ratio of net investment loss to average net assets | | (1.00 | )% | (0.77 | )% | (0.67 | )% | (0.80 | )% | (0.70 | )% |
Portfolio turnover rate | | 28.20 | % | 29.70 | % | 55.08 | % | 125.72 | % | 84.10 | % |
See Notes to Financial Statements.
(i) Amount was computed based on average shares outstanding during the period.
59
THE ALGER INSTITUTIONAL FUNDS
Financial Highlights for a share outstanding throughout the period
Alger Small Cap Growth Institutional Fund
| | Class R | |
| | Year ended
10/31/2018 | | Year ended
10/31/2017 | | Year ended
10/31/2016 | | Year ended
10/31/2015 | | Year ended
10/31/2014 | |
Net asset value, beginning of period | | $ | 17.44 | | $ | 12.67 | | $ | 20.92 | | $ | 26.08 | | $ | 31.58 | |
INCOME FROM INVESTMENT OPERATIONS: | | | | | | | | | | | |
Net investment loss(i) | | (0.27 | ) | (0.19 | ) | (0.16 | ) | (0.29 | ) | (0.32 | ) |
Net realized and unrealized gain (loss) on investments | | 2.38 | | 4.96 | | (0.46 | ) | 0.39 | | 0.56 | |
Total from investment operations | | 2.11 | | 4.77 | | (0.62 | ) | 0.10 | | 0.24 | |
Distributions from net realized gains | | (0.58 | ) | — | | (7.63 | ) | (5.26 | ) | (5.74 | ) |
Net asset value, end of period | | $ | 18.97 | | $ | 17.44 | | $ | 12.67 | | $ | 20.92 | | $ | 26.08 | |
Total return | | 12.48 | % | 37.65 | % | (4.22 | )% | 0.02 | % | 0.74 | % |
RATIOS/SUPPLEMENTAL DATA: | | | | | | | | | | | |
Net assets, end of period (000’s omitted) | | $ | 9,238 | | $ | 11,253 | | $ | 12,675 | | $ | 18,577 | | $ | 31,062 | |
Ratio of gross expenses to average net assets | | 1.77 | % | 1.82 | % | 1.80 | % | 1.74 | % | 1.72 | % |
Ratio of net expenses to average net assets | | 1.77 | % | 1.82 | % | 1.80 | % | 1.74 | % | 1.72 | % |
Ratio of net investment loss to average net assets | | (1.44 | )% | (1.27 | )% | (1.20 | )% | (1.30 | )% | (1.18 | )% |
Portfolio turnover rate | | 28.20 | % | 29.70 | % | 55.08 | % | 125.72 | % | 84.10 | % |
See Notes to Financial Statements.
(i) Amount was computed based on average shares outstanding during the period.
60
THE ALGER INSTITUTIONAL FUNDS
Financial Highlights for a share outstanding throughout the period
Alger Small Cap Growth Institutional Fund
| | Class Z-2 | |
| | Year ended
10/31/2018 | | Year ended
10/31/2017 | | From 8/1/2016
(commencement
of operations) to
10/31/2016(i) | |
Net asset value, beginning of period | | $ | 20.60 | | $ | 14.84 | | $ | 15.35 | |
INCOME FROM INVESTMENT OPERATIONS: | | | | | | | |
Net investment loss(ii) | | (0.15 | ) | (0.09 | ) | (0.03 | ) |
Net realized and unrealized gain (loss) on investments | | 2.83 | | 5.85 | | (0.48 | ) |
Total from investment operations | | 2.68 | | 5.76 | | (0.51 | ) |
Distributions from net realized gains | | (0.58 | ) | — | | — | |
Net asset value, end of period | | $ | 22.70 | | $ | 20.60 | | $ | 14.84 | |
Total return | | 13.35 | % | 38.81 | % | (3.32 | )% |
RATIOS/SUPPLEMENTAL DATA: | | | | | | | |
Net assets, end of period (000’s omitted) | | $ | 49,552 | | $ | 67,268 | | $ | 41,787 | |
Ratio of gross expenses to average net assets | | 1.00 | % | 1.03 | % | 1.07 | % |
Ratio of expense reimbursements to average net assets | | (0.01 | )% | (0.04 | )% | (0.08 | )% |
Ratio of net expenses to average net assets | | 0.99 | % | 0.99 | % | 0.99 | % |
Ratio of net investment loss to average net assets | | (0.66 | )% | (0.51 | )% | (0.76 | )% |
Portfolio turnover rate | | 28.20 | % | 29.70 | % | 55.08 | % |
See Notes to Financial Statements.
(i) Ratios have been annualized; total return has not been annualized; portfolio turnover is for the twelve months then ended.
(ii) Amount was computed based on average shares outstanding during the period.
61
THE ALGER INSTITUTIONAL FUNDS
NOTES TO FINANCIAL STATEMENTS
NOTE 1 — General:
The Alger Institutional Funds (the “Trust”) is an open-end registered investment company organized as a business trust under the laws of the Commonwealth of Massachusetts. The Trust qualifies as an investment company as defined in Financial Accounting Standards Board Accounting Standards Codification 946-Financial Services — Investment Companies. The Trust operates as a series company and currently offers an unlimited number of shares of beneficial interest in four funds — Alger Capital Appreciation Institutional Fund, Alger Focus Equity Fund (formerly Alger Capital Appreciation Focus Fund), Alger Mid Cap Growth Institutional Fund and Alger Small Cap Growth Institutional Fund (collectively, the “Funds” or individually, each a “Fund”). The Funds normally invest primarily in equity securities and each has an investment objective of long-term capital appreciation.
Each Fund offers one or more of the following share classes: Class A, C, I, R, Y, Z and Z-2. Class A shares are generally subject to an initial sales charge while Class C shares are generally subject to a deferred sales charge. Class I, R, Y, Z and Z-2 shares are sold to institutional investors without an initial or deferred sales charge. Each class has identical rights to assets and earnings except that each share class bears the pro rata allocation of the Fund’s expenses other than a class expense (not including advisory or custodial fees or other expenses related to the management of the Fund’s assets).
Alger Capital Appreciation Focus Fund changed its name to Alger Focus Equity Fund effective October 15, 2018.
Effective August 1, 2018, Class C shares will automatically convert to Class A shares on the fifth business day of the month following the tenth anniversary of the purchase date of a shareholder’s Class C shares.
NOTE 2 — Significant Accounting Policies:
(a) Investment Valuation: The Funds value their financial instruments at fair value using independent dealers or pricing services under policies approved by the Trust’s Board of Trustees (“Board”). Investments are valued on each day the New York Stock Exchange (the “NYSE”) is open, as of the close of the NYSE (normally 4:00 p.m. Eastern Standard Time).
Equity securities, including traded rights, warrants and option contracts for which valuation information is readily available are valued at the last quoted sales price or official closing price as reported by an independent pricing service on the primary market or exchange on which they are traded. In the absence of quoted sales, such securities are valued at the bid price or, in the absence of a recent bid price, the equivalent as obtained from one or more of the major market makers for the securities to be valued.
Debt securities generally trade in the over-the-counter market. Debt securities with remaining maturities of more than sixty days at the time of acquisition are valued on the basis of last available bid prices or current market quotations provided by dealers or pricing services. In determining the value of a particular investment, pricing services may use certain information with respect to transactions in such investments, quotations from dealers, pricing matrixes, market transactions in comparable investments, various
62
THE ALGER INSTITUTIONAL FUNDS
NOTES TO FINANCIAL STATEMENTS (Continued)
relationships observed in the market between investments and calculated yield measures based on valuation technology commonly employed in the market for such investments. Asset-backed and mortgage-backed securities are valued by independent pricing services using models that consider estimated cash flows of each tranche of the security, establish a benchmark yield and develop an estimated tranche-specific spread to the benchmark yield based on the unique attributes of the tranche. Debt securities with a remaining maturity of sixty days or less are valued at amortized cost which approximates market value.
Securities for which market quotations are not readily available are valued at fair value, as determined in good faith pursuant to procedures established by the Board.
Securities in which the Funds invest may be traded in foreign markets that close before the close of the NYSE. Developments that occur between the close of the foreign markets and the close of the NYSE may result in adjustments to the foreign closing prices to reflect what the investment adviser, pursuant to policies established by the Board, believes to be the fair value of these securities as of the close of the NYSE. The Funds may also fair value securities in other situations, for example, when a particular foreign market is closed but the Funds are open.
Financial Accounting Standards Board Accounting Standards Codification 820 — Fair Value Measurements and Disclosures (“ASC 820”) defines fair value as the price that the Funds would receive upon selling an investment in a timely transaction to an independent buyer in the principal or most advantageous market of the investment. ASC 820 established a three-tier hierarchy to maximize the use of observable market data and minimize the use of unobservable inputs and to establish classification of fair value measurements for disclosure purposes. Inputs refer broadly to the assumptions that market participants would use in pricing the asset or liability and may be observable or unobservable. Observable inputs are based on market data obtained from sources independent of the Funds. Unobservable inputs are inputs that reflect the Funds’ own assumptions based on the best information available in the circumstances. The three-tier hierarchy of inputs is summarized in the three broad Levels listed below.
· Level 1 — quoted prices in active markets for identical investments
· Level 2 — significant other observable inputs (including quoted prices for similar investments, interest rates, prepayment speeds, credit risk, etc.)
· Level 3 — significant unobservable inputs (including the Funds’ own assumptions in determining the fair value of investments)
The Funds’ valuation techniques are generally consistent with either the market or the income approach to fair value. The market approach considers prices and other relevant information generated by market transactions involving identical or comparable assets to measure fair value. The income approach converts future amounts to a current, or discounted, single amount. These fair value measurements are determined on the basis of the value indicated by current market expectations about such future events. Inputs for Level 1 include exchange-listed prices and broker quotes in an active market. Inputs for Level 2 include the last trade price in the case of a halted security, an exchange-listed price which
63
THE ALGER INSTITUTIONAL FUNDS
NOTES TO FINANCIAL STATEMENTS (Continued)
has been adjusted for fair value factors, and prices of closely related securities. Additional Level 2 inputs include an evaluated price which is based upon a compilation of observable market information such as spreads for fixed income and preferred securities. Inputs for Level 3 include, but are not limited to, revenue multiples, earnings before interest, taxes, depreciation and amortization (“EBITDA”) multiples, discount rates, and the probabilities of success of certain outcomes. Such unobservable market information may be obtained from a company’s financial statements and from industry studies, market data, and market indicators such as benchmarks and indexes. Because of the inherent uncertainty and often limited markets for restricted securities, the values may significantly differ from the values if there was an active market.
Valuation processes are determined by a Valuation Committee (“Committee”) established by the Board and comprised of representatives of the Trust’s investment adviser. The Committee reports its fair valuation determinations to the Board which is responsible for approving valuation policy and procedures.
While the Committee meets on an as-needed basis, the Committee generally meets quarterly to review and evaluate the effectiveness of the procedures for making fair value determinations. The Committee considers, among other things, the results of quarterly back testing of the fair value model for foreign securities, pricing comparisons between primary and secondary price sources, the outcome of price challenges put to the Funds’ pricing vendor, and variances between transactional prices and the previous day’s price.
The Funds will record a change to a security’s fair value level if new inputs are available or it becomes evident that inputs previously considered for leveling have changed or are no longer relevant. Transfers between Levels 1, 2 and 3 are recognized at the end of the reporting period.
(b) Cash and Cash Equivalents: Cash and cash equivalents include U.S. dollars and overnight time deposits.
(c) Securities Transactions and Investment Income: Securities transactions are recorded on a trade date basis. Realized gains and losses from securities transactions are recorded on the identified cost basis. Dividend income is recognized on the ex-dividend date and interest income is recognized on the accrual basis.
Premiums and discounts on debt securities purchased are amortized or accreted over the lives of the respective securities.
(d) Foreign Currency Translations: The books and records of the Funds are maintained in U.S. dollars. Foreign currencies, investments and other assets and liabilities are translated into U.S. dollars at the prevailing rates of exchange on the valuation date. Purchases and sales of investment securities and income and expenses are translated into U.S. dollars at the prevailing exchange rates on the respective dates of such transactions.
Net realized gains and losses on foreign currency transactions represent net gains and losses from the disposition of foreign currencies, currency gains and losses realized between the trade dates and settlement dates of security transactions, and the difference between the
64
THE ALGER INSTITUTIONAL FUNDS
NOTES TO FINANCIAL STATEMENTS (Continued)
amount of net investment income accrued and the U.S. dollar amount actually received. The effects of changes in foreign currency exchange rates on investments in securities are included in realized and unrealized gain or loss on investments in the accompanying Statements of Operations.
(e) Lending of Fund Securities: The Funds may lend their securities to financial institutions, provided that the market value of the securities loaned will not at any time exceed one third of a Fund’s total assets, as defined in its prospectuses. The Funds earn fees on the securities loaned, which are included in interest income in the accompanying Statements of Operations. In order to protect against the risk of failure by the borrower to return the securities loaned or any delay in the delivery of such securities, the loan is collateralized by cash or securities that are maintained with Brown Brothers Harriman & Company, the Fund’s Custodian (“BBH” or the “Custodian”), in an amount equal to at least 102 percent of the current market value of U.S. loaned securities or 105 percent for non-U.S. loaned securities. The market value of the loaned securities is determined at the close of business of the Fund. Any required additional collateral is delivered to the Custodian and any excess collateral is returned to the borrower on the next business day. In the event the borrower fails to return the loaned securities when due, the Funds may take the collateral to replace the securities. If the value of the collateral is less than the purchase cost of replacement securities, the Custodian shall be responsible for any shortfall, but only to the extent that the shortfall is not due to any diminution in collateral value, as defined in the securities lending agreement. The Funds are required to maintain the collateral in a segregated account and determine its value each day until the loaned securities are returned. Cash collateral may be invested as determined by the Funds. Collateral is returned to the borrower upon settlement of the loan. There were no securities loaned as of October 31, 2018.
(f) Dividends to Shareholders: Dividends and distributions payable to shareholders are recorded by the Funds on the ex-dividend date. Dividends from net investment income, if available, and distributions from net realized gains, offset by any loss carryforward, are declared and paid annually after the end of the fiscal year in which earned.
Each class is treated separately in determining the amounts of dividends from net investment income payable to holders of its shares.
The characterization of distributions to shareholders for financial reporting purposes is determined in accordance with federal income tax rules. Therefore, the source of a Fund’s distributions may be shown in the accompanying financial statements as either from, or in excess of, net investment income, net realized gain on investment transactions or return of capital, depending on the type of book/tax differences that may exist. Capital accounts within the financial statements are adjusted for permanent book/tax differences. Reclassifications result primarily from the difference in tax treatment of net operating losses, passive foreign investment companies, and foreign currency transactions. The reclassifications are done annually at fiscal year-end and have no impact on the net asset values of the Funds and are designed to present each Fund’s capital accounts on a tax basis.
(g) Federal Income Taxes: It is each Fund’s policy to comply with the requirements of the Internal Revenue Code Subchapter M applicable to regulated investment companies and
65
THE ALGER INSTITUTIONAL FUNDS
NOTES TO FINANCIAL STATEMENTS (Continued)
to distribute all of its taxable income to its shareholders. Provided that the Funds maintain such compliance, no federal income tax provision is required. Each Fund is treated as a separate entity for the purpose of determining such compliance.
Financial Accounting Standards Board Accounting Standards Codification 740 — Income Taxes (“ASC 740”) requires the Funds to measure and recognize in their financial statements the benefit of a tax position taken (or expected to be taken) on an income tax return if such position will more likely than not be sustained upon examination based on the technical merits of the position. No tax years are currently under investigation. The Funds file income tax returns in the U.S., as well as New York State and New York City. The statute of limitations on the Funds’ tax returns remains open for the tax years 2015-2018. Management does not believe there are any uncertain tax positions that require recognition of a tax liability.
(h) Allocation Methods: The Trust accounts separately for the assets, liabilities and operations of each Fund. Expenses directly attributable to each Fund are charged to that Fund’s operations; expenses which are applicable to all Funds are allocated among them based on net assets. Income, realized and unrealized gains and losses, and expenses of each Fund are allocated among the Fund’s classes based on relative net assets, with the exception of distribution fees, transfer agency fees, and shareholder servicing and related fees.
(i) Estimates: These financial statements have been prepared in accordance with accounting principles generally accepted in the United States of America, which require using estimates and assumptions that affect the reported amounts therein. Actual results may differ from those estimates. All such estimates are of normal recurring nature.
(j) Recent Accounting Pronouncement: On August 2018, the Financial Accounting Standards Board issued Accounting Standards Update 2018-13 “Disclosure Framework - Changes to the Disclosure Requirements for Fair Value Measurement” (“ASU 2018-13”) which modifies disclosure requirements for fair value measurements principally for Level 3 securities and transfers between levels of the fair value hierarchy. ASU 2018-13 is effective for fiscal years beginning after December 15, 2019 and for interim periods within those fiscal years.
Management is currently evaluating the application of ASU 2018-13 and its impact, if any, on the Funds’ financial statements.
NOTE 3 — Investment Advisory Fees and Other Transactions with Affiliates:
(a) Investment Advisory Fees: Fees incurred by each Fund, pursuant to the provisions of the Trust’s Investment Advisory Agreement with Fred Alger Management, Inc. (“Alger Management” or the “Investment Manager”), are payable monthly and computed based on the following rates. The actual rate paid as a percentage of average daily net assets, for the year ended October 31, 2018, is set forth below under the heading “Actual Rate”:
| | Tier 1 | | Tier 2 | | Tier 3 | | Tier 4 | | Tier 5 | | Actual Rate | |
| | | | | | | | | | | | | |
Alger Capital Appreciation Institutional Fund(a) | | 0.81 | % | 0.65 | % | 0.60 | % | 0.55 | % | 0.45 | % | 0.73 | % |
66
THE ALGER INSTITUTIONAL FUNDS
NOTES TO FINANCIAL STATEMENTS (Continued)
| | Tier 1 | | Tier 2 | | Tier 3 | | Tier 4 | | Tier 5 | | Actual Rate | |
Alger Focus Equity Fund(c)(d) | | 0.52 | % | — | | — | | — | | — | | 0.52 | % |
Alger Mid Cap Growth Institutional Fund(b) | | 0.76 | % | 0.70 | % | — | | — | | — | | 0.76 | % |
Alger Small Cap Growth Institutional Fund(b) | | 0.81 | % | 0.75 | % | — | | — | | — | | 0.81 | % |
(a) Tier 1 rate is paid on assets up to 12 billion, Tier 2 rate is paid on assets between 12 billion and 13 billion, Tier 3 rate is paid on assets between 13 billion and 14 billion, Tier 4 rate is paid on assets between 14 billion and 15 billion, and Tier 5 rate is paid on assets in excess of 15 billion.
(b) Tier 1 rate is paid on assets up to 11 billion and Tier 2 rate is paid on assets in excess of 11 billion.
(c) Tier 1 rate is paid on all assets.
(d) Prior to January 1, 2018, Alger Focus Equity Fund’s Advisory Fee rate was 0.55%.
Alger Management has established expense caps for several shares classes, effective through February 28, 2019, whereby it reimburses the share classes if annualized operating expenses (excluding interest, taxes, brokerage, dividend expenses and extraordinary expenses) exceed the rates, based on average daily net assets, listed below.
Alger Management has contractually agreed to reimburse Alger Capital Appreciation Institutional Fund Class Y shares expenses (excluding interest, taxes, brokerage and extraordinary expenses) through February 28, 2019 to the extent necessary to limit the total annual fund operating expenses to the actual investment advisory fee plus incurred custody fee.
| | | | | | | | | | | | | | FEES WAIVED /
REIMBURSED FOR | |
| | | | | | | | | | | | | | THE YEAR ENDED | |
| | CLASS | | OCTOBER 31, | |
| | A | | C | | I | | Y | | Z | | Z-2 | | 2018 | |
Alger Capital Appreciation Institutional Fund | | — | | — | | — | | 0.75 | % | — | | 0.95 | % | $ | 126,050 | |
Alger Focus Equity Fund | | 1.15 | % | 1.95 | %* | 0.99 | %** | 0.65 | % | 0.68 | %** | — | | 39,559 | |
Alger Mid Cap Growth Institutional Fund | | — | | — | | — | | — | | — | | 1.05 | % | 3,885 | |
Alger Small Cap Growth Institutional Fund | | — | | — | | — | | — | | — | | 0.99 | % | 7,111 | |
| | | | | | | | | | | | | | | | |
* Prior to August 30, 2018, the expense cap was 1.90%.
** Prior to January 1, 2018, the expense cap for the Alger Focus Equity Fund Class I was 1.15% and Class Z was 0.95%.
Alger Management may, during the one-year term of the expense reimbursement contract, recoup any expenses waived or reimbursed pursuant to the expense reimbursement contract to the extent that such recoupment would not cause the expense ratio to exceed the lesser of the stated limitation in effect at the time of (i) the waiver or reimbursement and (ii) the recoupment. For the year ended October 31, 2018, the recoupments made by the Alger Focus Equity Fund to the Investment Manager was $1,195. As of October 31, 2018, the total repayments that may potentially be made by the Funds to the Investment Manager for the Alger Capital Appreciation Institutional Fund, Alger Focus Equity Fund, Alger Mid Cap
67
THE ALGER INSTITUTIONAL FUNDS
NOTES TO FINANCIAL STATEMENTS (Continued)
Growth Institutional Fund and Alger Small Cap Growth Institutional Fund are $126,050, $39,559, $3,885 and $7,111, respectively, which will expire February 28, 2019.
In addition to the fee cap, Alger Management voluntarily reduced its advisory fee for the Alger Capital Appreciation Institutional Fund by $111,800 for the year ended October 31, 2018.
(b) Administration Fees: Fees incurred by each Fund, pursuant to the provisions of the Trust’s Administration Agreement with Alger Management, are payable monthly and computed based on the average daily net assets of each Fund at the annual rate of 0.0275%.
(c) Distribution Fees:
Class A Shares: The Trust has adopted a Distribution Plan pursuant to which Class A shares of Alger Focus Equity Fund pays Fred Alger & Company, Incorporated, the Fund’s distributor (the “Distributor” or “Alger Inc.”) and an affiliate of Alger Management, a fee at the annual rate of 0.25% of the respective average daily net assets of the Class A shares of the Fund to compensate Alger Inc. for its activities and expenses incurred in distributing and servicing the Class A shares. The fees paid may be more or less than the expenses incurred by Alger Inc.
Class C Shares: The Trust has adopted a Distribution Plan pursuant to which Class C shares of Alger Focus Equity Fund pays Alger Inc. a fee at the annual rate of 1% of the average daily net assets of the Class C shares of the Fund to compensate Alger Inc. for its activities and expenses incurred in distributing and servicing the Class C shares. The fees paid may be more or less than the expenses incurred by Alger Inc.
Class R Shares: The Trust has adopted a Distribution Plan pursuant to which Class R shares of each Fund issuing such shares pays Alger Inc. a fee at the annual rate of 0.50% of the respective average daily net assets of the Class R shares of the designated Fund to compensate Alger Inc. for its activities and expenses incurred in distributing and servicing the Class R shares. The fees paid may be more or less than the expenses incurred by the Distributor.
(d) Sales Charges: Purchases and sales of shares of the Alger Focus Equity Fund may be subject to initial sales charges or contingent deferred sales charges. The contingent deferred sales charges are used by Alger Inc. to offset distribution expenses previously incurred. Sales charges do not represent expenses of the Trust. For the year ended October 31, 2018, the initial sales charges and contingent deferred sales charges imposed, all of which were retained by Alger Inc., were as follows:
| | | | CONTINGENT | |
| | INITIAL SALES | | DEFERRED SALES | |
| | CHARGES | | CHARGES | |
Alger Focus Equity Fund | | $ | 1,362 | | $ | 2,335 | |
| | | | | | | |
(e) Brokerage Commissions: During the year ended October 31, 2018, Alger Capital Appreciation Institutional Fund, Alger Focus Equity Fund, Alger Mid Cap Growth Institutional Fund and Alger Small Cap Growth Institutional Fund paid Alger Inc. commissions of $371,075, $29,218, $28,193 and $27,094, respectively, in connection with securities transactions.
68
THE ALGER INSTITUTIONAL FUNDS
NOTES TO FINANCIAL STATEMENTS (Continued)
(f) Shareholder Administrative Fees: The Trust has entered into a shareholder administrative services agreement with Alger Management to compensate Alger Management for its liaison and administrative oversight of DST Asset Manager Solutions, Inc., the transfer agent, and for other related services. The Funds compensate Alger Management at the annual rate of 0.0165% of their respective average daily net assets for the Class A and Class C shares and 0.01% of their respective average daily net assets of the Class I, Class R, Class Y, Class Z and Class Z-2 shares for these services.
Alger Management makes payments to intermediaries that provide sub-accounting services to omnibus accounts invested in the Funds. A portion of the fees paid by Alger Management to intermediaries that provide sub-accounting services are charged back to the appropriate Fund, subject to certain limitations, as approved by the Trust’s Board of Trustees. For the year ended October 31, 2018, Alger Management charged back to Alger Capital Appreciation Institutional Fund, Alger Focus Equity Fund, Alger Mid Cap Growth Institutional Fund, and Alger Small Cap Growth Institutional Fund, $1,723,008, $33,417, $60,533 and $92,794, respectively, for these services, which are included in the transfer agent fees and expenses in the accompanying Statements of Operations.
(g) Trustee Fees: From November 1, 2017 through February 28, 2018, each Independent Trustee received a fee of $27,250 for each board meeting attended, to a maximum of $109,000 per annum, paid pro rata by each fund in the Alger Fund Complex, plus travel expenses incurred for attending the meeting. The term “Alger Fund Complex” refers to the Trust, The Alger Funds, The Alger Funds II, The Alger Portfolios and Alger Global Focus Fund, each of which is a registered investment company managed by Alger Management. The Independent Trustee appointed as Chairman of the Board of Trustees receives additional compensation of $26,000 per annum paid pro rata by each fund in the Alger Fund Complex. Additionally, each member of the Audit Committee receives a fee of $2,500 for each Audit Committee meeting attended to a maximum of $10,000 per annum, paid pro rata by each fund in the Alger Fund Complex.
Effective March 1, 2018, each Independent Trustee receives a fee of $112,000 per annum, paid pro rata by each fund in the Alger Fund Complex, plus travel expenses incurred for attending the meetings. The Independent Trustee appointed as Chairman of the Board of Trustees receives additional compensation of $30,000 per annum paid pro rata by each fund in the Alger Fund Complex. Additionally, each member of the Audit Committee receives a fee of $11,000 per annum, paid pro rata by each fund in the Alger Fund Complex.
(h) Interfund Trades: The Funds engage in purchase and sale transactions with other funds advised by Alger Management. There were no interfund trades during the year ended October 31, 2018.
(i) Interfund Loans: The Funds may borrow money from other funds advised by Alger Management for temporary or emergency purposes. If a fund has borrowed from other funds and has aggregate borrowings from all sources that exceed 10% of the fund’s total assets, such fund will secure all of its loans from other funds. The interest rate charged on interfund loans is equal to the average of the overnight time deposit rate and bank loan rate available to the funds. There were no interfund loans outstanding as of October 31, 2018.
69
THE ALGER INSTITUTIONAL FUNDS
NOTES TO FINANCIAL STATEMENTS (Continued)
During the year ended October 31, 2018, Alger Capital Appreciation Institutional Fund, Alger Mid Cap Growth Institutional Fund and Alger Small Cap Growth Institutional Fund incurred interest expense of $12,513, $229 and $1,244, respectively, in connection with interfund loans.
(j) Other Transactions With Affiliates: Certain officers of the Trust are directors and officers of Alger Management and the Distributor. At October 31, 2018, Alger Management and its affiliated entities owned the following shares:
| | SHARE CLASS | |
| | A | | C | | I | | Y | | Z | | Z-2 | |
Alger Capital Appreciation Institutional Fund | | — | | — | | — | | 370 | | — | | 4,030 | |
Alger Focus Equity Fund | | 7,148 | | 7,161 | | — | | 387 | | 36,729 | | — | |
Alger Mid Cap Growth Institutional Fund | | — | | — | | — | | — | | — | | 4,556 | |
Alger Small Cap Growth Institutional Fund | | — | | — | | — | | — | | — | | 6,702 | |
(k) Shareholder Servicing Fees: The Trust has entered into a shareholder servicing agreement with Alger Inc. whereby Alger Inc. provides Class I shares and Class R shares of the Trust with ongoing servicing of shareholder accounts. As compensation for such services, the Class I shares and Class R shares of each Fund pay Alger Inc. a monthly fee at an annual rate of 0.25% of the value of the average daily net assets of those classes. The fees paid may be more or less than the expenses incurred by the Distributor.
NOTE 4 — Securities Transactions:
The following summarizes the securities transactions by the Funds other than short-term securities for the year ended October 31, 2018:
| | PURCHASES | | SALES | |
Alger Capital Appreciation Institutional Fund | | $ | 2,343,088,778 | | $ | 3,013,007,997 | |
Alger Focus Equity Fund | | 451,445,624 | | 269,650,058 | |
Alger Mid Cap Growth Institutional Fund | | 138,840,707 | | 147,353,119 | |
Alger Small Cap Growth Institutional Fund | | 57,715,122 | | 100,289,469 | |
| | | | | | | |
Transactions in foreign securities may involve certain considerations and risks not typically associated with those of U.S. companies because of, among other factors, the level of governmental supervision and regulation of foreign security markets, and the possibility of political or economic instability. Additional risks associated with investing in emerging markets include increased volatility, limited liquidity, and less stringent regulatory and legal systems.
NOTE 5 — Borrowing:
The Funds may borrow from the Custodian on an uncommitted basis. Each Fund pays the Custodian a market rate of interest, generally based upon the London Interbank Offered Rate. The Funds may also borrow from other funds advised by Alger Management, as discussed in Note 3(i). For the year ended October 31, 2018, the Funds had the following borrowings:
70
THE ALGER INSTITUTIONAL FUNDS
NOTES TO FINANCIAL STATEMENTS (Continued)
| | AVERAGE DAILY
BORROWING | | WEIGHTED AVERAGE
INTEREST RATE | |
Alger Capital Appreciation Institutional Fund | | $ | 609,913 | | 2.18 | % |
Alger Focus Equity Fund | | 8,512 | | 3.59 | |
Alger Mid Cap Growth Institutional Fund | | 16,717 | | 3.18 | |
Alger Small Cap Growth Institutional Fund | | 62,097 | | 2.67 | |
| | | | | | |
The highest amount borrowed from the Custodian and other funds during the year ended October 31, 2018, for each Fund was as follows:
| | HIGHEST BORROWING | |
Alger Capital Appreciation Institutional Fund | | $ | 27,342,195 | |
Alger Focus Equity Fund | | 410,251 | |
Alger Mid Cap Growth Institutional Fund | | 1,458,148 | |
Alger Small Cap Growth Institutional Fund | | 7,284,000 | |
| | | | |
NOTE 6 — Share Capital:
The Trust has an unlimited number of authorized shares of beneficial interest of $.001 par value which are presently divided into four series. Each series is divided into separate classes. The transactions of shares of beneficial interest were as follows:
| | FOR THE YEAR ENDED
OCTOBER 31, 2018 | | FOR THE YEAR ENDED
OCTOBER 31, 2017 | |
| | SHARES | | AMOUNT | | SHARES | | AMOUNT | |
Alger Capital Appreciation Institutional Fund | | | | | | | | | |
Class I: | | | | | | | | | |
Shares sold | | 10,006,791 | | $ | 350,703,708 | | 16,153,920 | | $ | 476,641,428 | |
Dividends reinvested | | 4,697,031 | | 152,798,034 | | 718,981 | | 19,268,689 | |
Shares redeemed | | (21,430,691 | ) | (748,353,052 | ) | (56,847,411 | ) | (1,620,341,276 | ) |
Net decrease | | (6,726,869 | ) | $ | (244,851,310 | ) | (39,974,510 | ) | $ | (1,124,431,159 | ) |
Class R: | | | | | | | | | |
Shares sold | | 2,203,506 | | $ | 69,275,136 | | 3,468,162 | | $ | 92,794,162 | |
Dividends reinvested | | 1,485,308 | | 43,341,280 | | 178,580 | | 4,344,841 | |
Shares redeemed | | (5,724,494 | ) | (179,622,961 | ) | (6,378,683 | ) | (169,954,336 | ) |
Net decrease | | (2,035,680 | ) | $ | (67,006,545 | ) | (2,731,941 | ) | $ | (72,815,333 | ) |
Class Y: | | | | | | | | | |
Shares sold | | 2,298,619 | | $ | 81,779,555 | | 2,938,772 | | $ | 94,267,571 | |
Dividends reinvested | | 182,194 | | 5,946,816 | | — | | — | |
Shares redeemed | | (555,770 | ) | (19,699,293 | ) | (63,899 | ) | (2,091,302 | ) |
Net increase | | 1,925,043 | | $ | 68,027,078 | | 2,874,873 | | $ | 92,176,269 | |
Class Z-2: | | | | | | | | | |
Shares sold | | 4,370,312 | | $ | 155,188,302 | | 17,233,735 | | $ | 490,233,250 | |
Dividends reinvested | | 855,586 | | 27,943,443 | | 44,346 | | 1,189,367 | |
Shares redeemed | | (4,697,581 | ) | (165,889,348 | ) | (4,562,899 | ) | (139,712,867 | ) |
Net increase | | 528,317 | | $ | 17,242,397 | | 12,715,182 | | $ | 351,709,750 | |
71
THE ALGER INSTITUTIONAL FUNDS
NOTES TO FINANCIAL STATEMENTS (Continued)
| | FOR THE YEAR ENDED
OCTOBER 31, 2018 | | FOR THE YEAR ENDED
OCTOBER 31, 2017 | |
| | SHARES | | AMOUNT | | SHARES | | AMOUNT | |
Alger Focus Equity Fund | | | | | | | | | |
Class A: | | | | | | | | | |
Shares sold | | 789,769 | | $ | 27,646,665 | | 238,196 | | $ | 6,398,589 | |
Shares converted from Class C | | 754 | | 27,548 | | — | | — | |
Dividends reinvested | | 28,879 | | 899,639 | | — | | — | |
Shares redeemed | | (282,909 | ) | (10,026,235 | ) | (557,255 | ) | (14,257,177 | ) |
Net increase (decrease) | | 536,493 | | $ | 18,547,617 | | (319,059 | ) | $ | (7,858,588 | ) |
Class C: | | | | | | | | | |
Shares sold | | 279,833 | | $ | 9,336,518 | | 238,598 | | $ | 5,944,197 | |
Shares converted to Class A | | (788 | ) | (27,548 | ) | — | | — | |
Dividends reinvested | | 23,852 | | 717,111 | | — | | — | |
Shares redeemed | | (100,961 | ) | (3,310,919 | ) | (145,227 | ) | (3,844,373 | ) |
Net increase | | 201,936 | | $ | 6,715,162 | | 93,371 | | $ | 2,099,824 | |
Class I: | | | | | | | | | |
Shares sold | | 566,064 | | $ | 19,821,622 | | 394,922 | | $ | 10,973,042 | |
Dividends reinvested | | 26,742 | | 838,900 | | — | | — | |
Shares redeemed | | (259,288 | ) | (8,876,462 | ) | (579,798 | ) | (15,640,234 | ) |
Net increase (decrease) | | 333,518 | | $ | 11,784,060 | | (184,876 | ) | $ | (4,667,192 | ) |
Class Y: | | | | | | | | | |
Shares sold | | 1,588,900 | | $ | 58,532,409 | | 136,508 | | $ | 4,223,668 | |
Dividends reinvested | | 130 | | 4,151 | | — | | — | |
Shares redeemed | | (59,099 | ) | (2,096,059 | ) | (2,934 | ) | (92,002 | ) |
Net increase | | 1,529,931 | | $ | 56,440,501 | | 133,574 | | $ | 4,131,666 | |
Class Z: | | | | | | | | | |
Shares sold | | 3,842,417 | | $ | 139,643,911 | | 1,675,218 | | $ | 45,981,326 | |
Dividends reinvested | | 78,423 | | 2,493,828 | | — | | — | |
Shares redeemed | | (854,082 | ) | (30,187,780 | ) | (409,196 | ) | (11,814,488 | ) |
Net increase | | 3,066,758 | | $ | 111,949,959 | | 1,266,022 | | $ | 34,166,838 | |
| | | | | | | | | |
Alger Mid Cap Growth Institutional Fund | | | | | | | | | |
Class I: | | | | | | | | | |
Shares sold | | 396,452 | | $ | 12,232,743 | | 393,700 | | $ | 9,942,979 | |
Shares redeemed | | (746,839 | ) | (23,176,767 | ) | (1,184,092 | ) | (28,871,701 | ) |
Net decrease | | (350,387 | ) | $ | (10,944,024 | ) | (790,392 | ) | $ | (18,928,722 | ) |
Class R: | | | | | | | | | |
Shares sold | | 58,079 | | $ | 1,662,159 | | 102,239 | | $ | 2,357,701 | |
Shares redeemed | | (163,200 | ) | (4,586,117 | ) | (266,903 | ) | (6,180,169 | ) |
Net decrease | | (105,121 | ) | $ | (2,923,958 | ) | (164,664 | ) | $ | (3,822,468 | ) |
Class Z-2: | | | | | | | | | |
Shares sold | | 301,202 | | $ | 9,269,628 | | 336,377 | | $ | 8,195,951 | |
Shares redeemed | | (235,237 | ) | (7,276,787 | ) | (34,849 | ) | (894,948 | ) |
Net increase | | 65,965 | | $ | 1,992,841 | | 301,528 | | $ | 7,301,003 | |
72
THE ALGER INSTITUTIONAL FUNDS
NOTES TO FINANCIAL STATEMENTS (Continued)
| | FOR THE YEAR ENDED
OCTOBER 31, 2018 | | FOR THE YEAR ENDED
OCTOBER 31, 2017 | |
| | SHARES | | AMOUNT | | SHARES | | AMOUNT | |
Alger Small Cap Growth Institutional Fund | | | | | | | | | |
Class I: | | | | | | | | | |
Shares sold | | 1,354,745 | | $ | 30,871,230 | | 1,256,731 | | $ | 22,874,804 | |
Dividends reinvested | | 172,670 | | 3,468,935 | | — | | — | |
Shares redeemed | | (2,007,574 | ) | (45,166,047 | ) | (3,607,295 | ) | (61,669,792 | ) |
Net decrease | | (480,159 | ) | $ | (10,825,882 | ) | (2,350,564 | ) | $ | (38,794,988 | ) |
Class R: | | | | | | | | | |
Shares sold | | 101,659 | | $ | 1,928,735 | | 172,015 | | $ | 2,578,445 | |
Dividends reinvested | | 20,472 | | 347,611 | | — | | — | |
Shares redeemed | | (280,406 | ) | (5,226,074 | ) | (527,393 | ) | (7,849,419 | ) |
Net decrease | | (158,275 | ) | $ | (2,949,728 | ) | (355,378 | ) | $ | (5,270,974 | ) |
Class Z-2: | | | | | | | | | |
Shares sold | | 350,581 | | $ | 8,089,851 | | 1,507,588 | | $ | 26,380,218 | |
Dividends reinvested | | 92,064 | | 1,858,797 | | — | | — | |
Shares redeemed | | (1,525,069 | ) | (34,275,345 | ) | (1,058,368 | ) | (18,691,576 | ) |
Net increase (decrease) | | (1,082,424 | ) | $ | (24,326,697 | ) | 449,220 | | $ | 7,688,642 | |
NOTE 7 — Income Tax Information:
The tax character of distributions paid during the year ended October 31, 2018 and the year ended October 31, 2017 were as follows:
| | FOR THE YEAR ENDED
OCTOBER 31, 2018 | | FOR THE YEAR ENDED
OCTOBER 31, 2017 | |
Alger Capital Appreciation Institutional Fund | | | | | |
Distributions paid from: | | | | | |
Ordinary Income | | $ | 5,942,808 | | — | |
Long-term capital gain | | 269,430,496 | | $ | 25,634,655 | |
Total distributions paid | | $ | 275,373,304 | | $ | 25,634,655 | |
| | | | | |
Alger Focus Equity Fund | | | | | |
Distributions paid from: | | | | | |
Ordinary Income | | $ | 1,047,356 | | — | |
Long-term capital gain | | 5,532,574 | | — | |
Total distributions paid | | $ | 6,579,930 | | — | |
| | | | | |
Alger Mid Cap Growth Institutional Fund | | | | | |
Distributions paid from: | | | | | |
Ordinary Income | | — | | — | |
Long-term capital gain | | — | | — | |
Total distributions paid | | — | | — | |
73
THE ALGER INSTITUTIONAL FUNDS
NOTES TO FINANCIAL STATEMENTS (Continued)
| | FOR THE YEAR ENDED | | FOR THE YEAR ENDED | |
| | OCTOBER 31, 2018 | | OCTOBER 31, 2017 | |
Alger Small Cap Growth Institutional Fund | | | | | |
Distributions paid from: | | | | | |
Ordinary Income | | — | | — | |
Long-term capital gain | | $ | 5,885,034 | | — | |
Total distributions paid | | $ | 5,885,034 | | — | |
As of October 31, 2018, the components of accumulated gains (losses) on a tax basis were as follows:
Alger Capital Appreciation Institutional Fund | | | |
Undistributed ordinary income | | — | |
Undistributed long-term gains | | $ | 358,703,754 | |
Net accumulated earnings | | 358,703,754 | |
Capital loss carryforwards | | — | |
Late year ordinary income losses | | (7,187,134 | ) |
Net unrealized appreciation | | 929,846,317 | |
Total accumulated earnings | | $ | 1,281,362,937 | |
| | | |
Alger Focus Equity Fund | | | |
Undistributed ordinary income | | $ | 1,983,887 | |
Undistributed long-term gains | | 14,981,712 | |
Net accumulated earnings | | 16,965,599 | |
Capital loss carryforwards | | — | |
Net unrealized appreciation | | 12,639,427 | |
Total accumulated earnings | | $ | 29,605,026 | |
| | | |
Alger Mid Cap Growth Institutional Fund | | | |
Undistributed ordinary income | | $ | 4,357,732 | |
Undistributed long-term gains | | 2,279,018 | |
Net accumulated earnings | | 6,636,750 | |
Capital loss carryforwards | | — | |
Net unrealized appreciation | | 5,587,266 | |
Total accumulated earnings | | $ | 12,224,016 | |
| | | |
Alger Small Cap Growth Institutional Fund | | | |
Undistributed ordinary income | | — | |
Undistributed long-term gains | | $ | 23,176,792 | |
Net accumulated earnings | | 23,176,792 | |
Capital loss carryforwards | | — | |
Late year ordinary income losses | | (291,375 | ) |
Net unrealized appreciation | | 68,755,027 | |
Total accumulated earnings | | $ | 91,640,444 | |
At October 31, 2018 the Funds, for federal income tax purposes, had no capital loss carryforwards.
74
THE ALGER INSTITUTIONAL FUNDS
NOTES TO FINANCIAL STATEMENTS (Continued)
Under the Regulated Investment Company Modernization Act of 2010, capital losses incurred by the Funds will not be subject to expiration.
The difference between book-basis and tax-basis unrealized appreciation (depreciation) is determined annually and is attributable primarily to the tax deferral of losses on wash sales, U.S. Internal Revenue Code Section 988 currency transactions, nondeductible expenses on dividends sold short, the tax treatment of partnership investments, the realization of unrealized appreciation of passive foreign investment companies, and return of capital from real estate investment trust investments.
Permanent differences, primarily from net operating losses and real estate investment trusts and partnership investments sold by the Fund, resulted in the following reclassifications among the Fund’s components of net assets at October 31, 2018.
The Funds accrue tax on unrealized gains in foreign jurisdictions that impose a foreign capital tax.
Alger Capital Appreciation Institutional Fund | | | |
Distributable earnings | | $ | (39,332,755 | ) |
Paid-in Capital | | $ | 39,332,755 | |
| | | |
Alger Focus Equity Fund | | | |
Distributable earnings | | $ | (1,345,708 | ) |
Paid-in Capital | | $ | 1,345,708 | |
| | | |
Alger Mid Cap Growth Institutional Fund | | | |
Distributable earnings | | $ | 1 | |
Paid-in Capital | | $ | (1 | ) |
| | | |
Alger Small Cap Growth Institutional Fund | | | |
Distributable earnings | | $ | 2,295,352 | |
Paid-in Capital | | $ | (2,295,352 | ) |
NOTE 8 — Fair Value Measurements
The following is a summary of the inputs used as of October 31, 2018, in valuing the Funds’ investments carried at fair value on a recurring basis. Based upon the nature, characteristics, and risks associated with their investments, the Funds have determined that presenting them by security type and sector is appropriate.
75
THE ALGER INSTITUTIONAL FUNDS
NOTES TO FINANCIAL STATEMENTS (Continued)
Alger Capital Appreciation
Institutional Fund | | TOTAL FUND | | LEVEL 1 | | LEVEL 2 | | LEVEL 3 | |
COMMON STOCKS | | | | | | | | | |
Communication Services | | $ | 406,915,513 | | $ | 406,915,513 | | — | | — | |
Consumer Discretionary | | 562,596,334 | | 562,596,334 | | — | | — | |
Consumer Staples | | 22,836,510 | | 22,836,510 | | — | | — | |
Energy | | 12,383,934 | | 12,383,934 | | — | | — | |
Financials | | 119,954,066 | | 119,954,066 | | — | | — | |
Health Care | | 694,190,442 | | 694,190,442 | | — | | — | |
Industrials | | 203,876,993 | | 203,876,993 | | — | | — | |
Information Technology | | 1,095,330,362 | | 1,093,955,939 | | — | | $ | 1,374,423 | |
Materials | | 88,064,110 | | 88,064,110 | | — | | — | |
TOTAL COMMON STOCKS | | $ | 3,206,148,264 | | $ | 3,204,773,841 | | — | | $ | 1,374,423 | |
MASTER LIMITED PARTNERSHIP | | | | | | | | | |
Financials | | 9,904,166 | | 9,904,166 | | — | | — | |
PREFERRED STOCKS | | | | | | | | | |
Health Care | | 1,219,273 | | — | | — | | 1,219,273 | |
Information Technology | | 6,335,626 | | — | | — | | 6,335,626 | |
TOTAL PREFERRED STOCKS | | $ | 7,554,899 | | — | | — | | $ | 7,554,899 | |
REAL ESTATE INVESTMENT TRUST | | | | | | | | | |
Real Estate | | 43,502,402 | | 43,502,402 | | — | | — | |
TOTAL INVESTMENTS IN SECURITIES | | $ | 3,267,109,731 | | $ | 3,258,180,409 | | — | | $ | 8,929,322 | |
Alger Focus Equity Fund | | TOTAL FUND | | LEVEL 1 | | LEVEL 2 | | LEVEL 3 | |
COMMON STOCKS | | | | | | | | | |
Communication Services | | $ | 40,191,496 | | $ | 40,191,496 | | — | | — | |
Consumer Discretionary | | 51,503,239 | | 51,503,239 | | — | | — | |
Consumer Staples | | 157,174 | | 157,174 | | — | | — | |
Financials | | 5,566,504 | | 5,566,504 | | — | | — | |
Health Care | | 64,398,299 | | 64,398,299 | | — | | — | |
Industrials | | 21,598,374 | | 21,598,374 | | — | | — | |
Information Technology | | 119,797,535 | | 119,797,535 | | — | | — | |
Materials | | 6,450,676 | | 6,450,676 | | — | | — | |
TOTAL COMMON STOCKS | | $ | 309,663,297 | | $ | 309,663,297 | | — | | — | |
MASTER LIMITED PARTNERSHIP | | | | | | | | | |
Financials | | 696,419 | | 696,419 | | — | | — | |
PREFERRED STOCKS | | | | | | | | | |
Health Care | | 241,230 | | — | | — | | $ | 241,230 | |
REAL ESTATE INVESTMENT TRUST | | | | | | | | | |
Real Estate | | 5,152,711 | | 5,152,711 | | — | | — | |
TOTAL INVESTMENTS IN SECURITIES | | $ | 315,753,657 | | $ | 315,512,427 | | — | | $ | 241,230 | |
76
THE ALGER INSTITUTIONAL FUNDS
NOTES TO FINANCIAL STATEMENTS (Continued)
Alger Mid Cap Growth Institutional | | | | | | | | | |
Fund | | TOTAL FUND | | LEVEL 1 | | LEVEL 2 | | LEVEL 3 | |
COMMON STOCKS | | | | | | | | | |
Communication Services | | $ | 9,048,530 | | $ | 9,048,530 | | — | | — | |
Consumer Discretionary | | 15,577,583 | | 15,577,583 | | — | | — | |
Consumer Staples | | 3,071,372 | | 3,071,372 | | — | | — | |
Financials | | 4,876,228 | | 4,876,228 | | — | | — | |
Health Care | | 25,314,922 | | 25,314,922 | | — | | — | |
Industrials | | 13,521,754 | | 13,521,754 | | — | | — | |
Information Technology | | 25,640,575 | | 25,569,125 | | — | | $ | 71,450 | |
Materials | | 509,862 | | 509,862 | | — | | — | |
TOTAL COMMON STOCKS | | $ | 97,560,826 | | $ | 97,489,376 | | — | | $ | 71,450 | |
PREFERRED STOCKS | | | | | | | | | |
Health Care | | 604,129 | | — | | — | | 604,129 | |
Information Technology | | 291,381 | | — | | — | | 291,381 | |
TOTAL PREFERRED STOCKS | | $ | 895,510 | | — | | — | | $ | 895,510 | |
REAL ESTATE INVESTMENT TRUST | | | | | | | | | |
Real Estate | | 2,677,810 | | 2,677,810 | | — | | — | |
RIGHTS | | | | | | | | | |
Health Care | | 1,190,838 | | — | | — | | 1,190,838 | |
SPECIAL PURPOSE VEHICLE | | | | | | | | | |
Financials | | — | * | — | | — | | — | * |
TOTAL INVESTMENTS IN SECURITIES | | $ | 102,324,984 | | $ | 100,167,186 | | — | | $ | 2,157,798 | |
Alger Small Cap Growth | | | | | | | | | |
Institutional Fund | | TOTAL FUND | | LEVEL 1 | | LEVEL 2 | | LEVEL 3 | |
COMMON STOCKS | | | | | | | | | |
Communication Services | | $ | 9,713,347 | | $ | 9,713,347 | | — | | — | |
Consumer Discretionary | | 19,144,169 | | 19,144,169 | | — | | — | |
Consumer Staples | | 1,510,336 | | 1,510,336 | | — | | — | |
Energy | | 1,460,410 | | 1,460,410 | | — | | — | |
Financials | | 4,270,016 | | 4,270,016 | | — | | — | |
Health Care | | 83,147,026 | | 83,147,026 | | — | | — | |
Industrials | | 9,073,791 | | 9,073,791 | | — | | — | |
Information Technology | | 54,563,429 | | 54,563,429 | | — | | — | |
Materials | | 3,294,701 | | 3,294,701 | | — | | — | |
TOTAL COMMON STOCKS | | $ | 186,177,225 | | $ | 186,177,225 | | — | | — | |
PREFERRED STOCKS | | | | | | | | | |
Health Care | | 868,765 | | — | | — | | $ | 868,765 | |
REAL ESTATE INVESTMENT TRUST | | | | | | | | | |
Real Estate | | 1,426,191 | | 1,426,191 | | — | | — | |
RIGHTS | | | | | | | | | |
Health Care | | 1,488,264 | ** | — | | — | ** | 1,488,264 | |
SPECIAL PURPOSE VEHICLE | | | | | | | | | |
Financials | | — | * | — | | — | | — | * |
TOTAL INVESTMENTS IN SECURITIES | | $ | 189,960,445 | | $ | 187,603,416 | | — | | $ | 2,357,029 | |
*Alger Small Cap Growth Institutional Fund’s holding of JS Kred SPV I, LLC. shares are classified as a Level 3 investment and fair valued at zero as of October 31, 2018.
**Alger Small Cap Growth Institutional Fund’s holding of Neuralstem Inc. rights is classified as a Level 2 investment and fair valued at zero as of October 31, 2018.
77
THE ALGER INSTITUTIONAL FUNDS
NOTES TO FINANCIAL STATEMENTS (Continued)
| | FAIR VALUE
MEASUREMENTS
USING SIGNIFICANT
UNOBSERVABLE
INPUTS (LEVEL 3) | |
Alger Capital Appreciation Institutional Fund | | Common Stocks | |
Opening balance at November 1, 2017 | | $ | 1,374,423 | * |
Transfers into Level 3 | | — | |
Transfers out of Level 3 | | — | |
Total gains or losses | | | |
Included in net realized gain (loss) on investments | | (36,151 | ) |
Included in net change in unrealized appreciation (depreciation) on investments | | 36,151 | |
Purchases and sales | | | |
Purchases | | — | |
Sales | | — | |
Closing balance at October 31, 2018 | | 1,374,423 | |
Net change in unrealized appreciation (depreciation) attributable to investments still held at October 31, 2018 | | $ | — | |
Alger Capital Appreciation Institutional Fund | | Corporate Bonds | |
Opening balance at November 1, 2017 | | $ | 0 | * |
Transfers into Level 3 | | — | |
Transfers out of Level 3 | | — | |
Total gains or losses | | | |
Included in net realized gain (loss) on investments | | (575 | ) |
Included in net change in unrealized appreciation (depreciation) on investments | | 575 | |
Purchases and sales | | | |
Purchases | | — | |
Sales | | — | |
Closing balance at October 31, 2018 | | — | |
Net change in unrealized appreciation (depreciation) attributable to investments still held at October 31, 2018 | | $ | — | |
Alger Capital Appreciation Institutional Fund | | Preferred Stocks | |
Opening balance at November 1, 2017 | | $ | 12,747,973 | * |
Transfers into Level 3 | | — | |
Transfers out of Level 3 | | — | |
Total gains or losses | | | |
Included in net realized gain (loss) on investments | | (2,359,928 | ) |
Included in net change in unrealized appreciation (depreciation) on investments | | (2,833,146 | ) |
Purchases and sales | | | |
Purchases | | — | |
Sales | | — | |
Closing balance at October 31, 2018 | | 7,554,899 | |
Net change in unrealized appreciation (depreciation) attributable to investments still held at October 31, 2018 | | $ | (5,193,074 | ) |
78
THE ALGER INSTITUTIONAL FUNDS
NOTES TO FINANCIAL STATEMENTS (Continued)
| | FAIR VALUE
MEASUREMENTS
USING SIGNIFICANT
UNOBSERVABLE
INPUTS (LEVEL 3) | |
Alger Capital Appreciation Institutional Fund | | Warrants | |
Opening balance at November 1, 2017 | | $ | 0 | * |
Transfers into Level 3 | | — | |
Transfers out of Level 3 | | — | |
Total gains or losses | | | |
Included in net realized gain (loss) on investments | | (574,087 | ) |
Included in net change in unrealized appreciation (depreciation) on investments | | 574,087 | |
Purchases and sales | | | |
Purchases | | — | |
Sales | | — | |
Closing balance at October 31, 2018 | | — | |
Net change in unrealized appreciation (depreciation) attributable to investments still held at October 31, 2018 | | $ | — | |
| | FAIR VALUE
MEASUREMENTS
USING SIGNIFICANT
UNOBSERVABLE
INPUTS (LEVEL 3) | |
Alger Focus Equity Fund | | Preferred Stocks | |
Opening balance at November 1, 2017 | | $ | 239,694 | |
Transfers into Level 3 | | — | |
Transfers out of Level 3 | | — | |
Total gains or losses | | | |
Included in net realized gain (loss) on investments | | — | |
Included in net change in unrealized appreciation (depreciation) on investments | | 1,536 | |
Purchases and sales | | | |
Purchases | | — | |
Sales | | — | |
Closing balance at October 31, 2018 | | 241,230 | |
Net change in unrealized appreciation (depreciation) attributable to investments still held at October 31, 2018 | | $ | 1,536 | |
79
THE ALGER INSTITUTIONAL FUNDS
NOTES TO FINANCIAL STATEMENTS (Continued)
| | FAIR VALUE
MEASUREMENTS
USING SIGNIFICANT
UNOBSERVABLE
INPUTS (LEVEL 3) | |
Alger Mid Cap Growth Institutional Fund | | Common Stocks | |
Opening balance at November 1, 2017 | | $ | 71,450 | * |
Transfers into Level 3 | | — | |
Transfers out of Level 3 | | — | |
Total gains or losses | | | |
Included in net realized gain (loss) on investments | | (2,590 | ) |
Included in net change in unrealized appreciation (depreciation) on investments | | 2,590 | |
Purchases and sales | | | |
Purchases | | — | |
Sales | | — | |
Closing balance at October 31, 2018 | | 71,450 | |
Net change in unrealized appreciation (depreciation) attributable to investments still held at October 31, 2018 | | $ | — | |
Alger Mid Cap Growth Institutional Fund | | Corporate Bonds | |
Opening balance at November 1, 2017 | | $ | 0 | * |
Transfers into Level 3 | | — | |
Transfers out of Level 3 | | — | |
Total gains or losses | | | |
Included in net realized gain (loss) on investments | | (17 | ) |
Included in net change in unrealized appreciation (depreciation) on investments | | 17 | |
Purchases and sales | | | |
Purchases | | — | |
Sales | | — | |
Closing balance at October 31, 2018 | | — | |
Net change in unrealized appreciation (depreciation) attributable to investments still held at October 31, 2018 | | $ | — | |
Alger Mid Cap Growth Institutional Fund | | Preferred Stocks | |
Opening balance at November 1, 2017 | | $ | 1,283,070 | * |
Transfers into Level 3 | | — | |
Transfers out of Level 3 | | — | |
Total gains or losses | | | |
Included in net realized gain (loss) on investments | | (155,739 | ) |
Included in net change in unrealized appreciation (depreciation) on investments | | (195,510 | ) |
Purchases and sales | | | |
Purchases | | — | |
Sales | | (36,311 | ) |
Closing balance at October 31, 2018 | | 895,510 | |
Net change in unrealized appreciation (depreciation) attributable to investments still held at October 31, 2018 | | $ | (349,598 | ) |
80
THE ALGER INSTITUTIONAL FUNDS
NOTES TO FINANCIAL STATEMENTS (Continued)
| | FAIR VALUE
MEASUREMENTS
USING SIGNIFICANT
UNOBSERVABLE
INPUTS (LEVEL 3) | |
Alger Mid Cap Growth Institutional Fund | | Rights | |
Opening balance at November 1, 2017 | | $ | 1,207,798 | |
Transfers into Level 3 | | — | |
Transfers out of Level 3 | | — | |
Total gains or losses | | | |
Included in net realized gain (loss) on investments | | — | |
Included in net change in unrealized appreciation (depreciation) on investments | | (16,960 | ) |
Purchases and sales | | | |
Purchases | | — | |
Sales | | — | |
Closing balance at October 31, 2018 | | 1,190,838 | |
Net change in unrealized appreciation (depreciation) attributable to investments still held at October 31, 2018 | | $ | (16,960 | ) |
| | Special Purpose | |
Alger Mid Cap Growth Institutional Fund | | Vehicle | |
Opening balance at November 1, 2017 | | $ | 290,165 | |
Transfers into Level 3 | | — | |
Transfers out of Level 3 | | — | |
Total gains or losses | | | |
Included in net realized gain (loss) on investments | | — | |
Included in net change in unrealized appreciation (depreciation) on investments | | (290,165 | ) |
Purchases and sales | | | |
Purchases | | — | |
Sales | | — | |
Closing balance at October 31, 2018 | | 0 | * |
Net change in unrealized appreciation (depreciation) attributable to investments still held at October 31, 2018 | | $ | (290,165 | ) |
Alger Mid Cap Growth Institutional Fund | | Warrants | |
Opening balance at November 1, 2017 | | $ | 0 | * |
Transfers into Level 3 | | — | |
Transfers out of Level 3 | | — | |
Total gains or losses | | | |
Included in net realized gain (loss) on investments | | (17,111 | ) |
Included in net change in unrealized appreciation (depreciation) on investments | | 17,111 | |
Purchases and sales | | | |
Purchases | | — | |
Sales | | — | |
Closing balance at October 31, 2018 | | — | |
Net change in unrealized appreciation (depreciation) attributable to investments still held at October 31, 2018 | | $ | — | |
81
THE ALGER INSTITUTIONAL FUNDS
NOTES TO FINANCIAL STATEMENTS (Continued)
| | FAIR VALUE
MEASUREMENTS
USING SIGNIFICANT
UNOBSERVABLE
INPUTS (LEVEL 3) | |
Alger Small Cap Growth Institutional Fund | | Preferred Stocks | |
Opening balance at November 1, 2017 | | $ | 2,784,079 | |
Transfers into Level 3 | | — | |
Transfers out of Level 3 | | — | |
Total gains or losses | | | |
Included in net realized gain (loss) on investments | | — | |
Included in net change in unrealized appreciation (depreciation) on investments | | (1,915,314 | ) |
Purchases and sales | | | |
Purchases | | — | |
Sales | | — | |
Closing balance at October 31, 2018 | | 868,765 | |
Net change in unrealized appreciation (depreciation) attributable to investments still held at October 31, 2018 | | $ | (1,915,314 | ) |
Alger Small Cap Growth Institutional Fund | | Rights | |
Opening balance at November 1, 2017 | | $ | 1,570,945 | |
Transfers into Level 3 | | — | |
Transfers out of Level 3 | | — | |
Total gains or losses | | | |
Included in net realized gain (loss) on investments | | 86,600 | |
Included in net change in unrealized appreciation (depreciation) on investments | | (82,681 | ) |
Purchases and sales | | | |
Purchases | | — | |
Sales | | (86,600 | ) |
Closing balance at October 31, 2018 | | 1,488,264 | |
Net change in unrealized appreciation (depreciation) attributable to investments still held at October 31, 2018 | | $ | (21,195 | ) |
| | Special Purpose | |
Alger Small Cap Growth Institutional Fund | | Vehicle | |
Opening balance at November 1, 2017 | | $ | 935,742 | |
Transfers into Level 3 | | — | |
Transfers out of Level 3 | | — | |
Total gains or losses | | | |
Included in net realized gain (loss) on investments | | — | |
Included in net change in unrealized appreciation (depreciation) on investments | | (935,742 | ) |
Purchases and sales | | | |
Purchases | | — | |
Sales | | — | |
Closing balance at October 31, 2018 | | 0 | * |
Net change in unrealized appreciation (depreciation) attributable to investments still held at October 31, 2018 | | $ | (935,742 | ) |
* Includes securities that are fair valued at zero.
82
THE ALGER INSTITUTIONAL FUNDS
NOTES TO FINANCIAL STATEMENTS (Continued)
The following table provides quantitative information about our Level 3 fair value measurements of our investments as of October 31, 2018. In addition to the techniques and inputs noted in the table below, according to our valuation policy we may also use other valuation techniques and methodologies when determining our fair value measurements. The table below is not intended to be all-inclusive, but rather provides information on the Level 3 inputs as they relate to our fair value measurements.
| | Fair Value
October 31, 2018 | | Valuation
Methodology | | Unobservable
Input | | Input/Range | | Weighted Average
Inputs | |
Alger Capital Appreciation InstitutionalFund | | | | | | |
Common Stocks | | $ | 1,374,423 | | Market | | Transaction Price | | N/A* | | N/A | |
| | | | Approach | | | | | | | |
Preferred Stocks | | 7,554,899 | | Market | | Time to Exit | | 3 years | | N/A | |
| | | | Approach | | Volatility | | 72% | | N/A | |
| | | | | | Market | | N/A* | | N/A | |
| | | | | | Quotation | | | | | |
Alger Focus Equity Fund | | | | | | | | |
Preferred Stocks | | $ | 241,230 | | Income | | Discount Rate | | 46.5%-51.5% | | N/A | |
| | | | Approach | | | | | | | |
Alger Mid Cap Growth Institutional Fund | | | | | | | |
Common Stocks | | $ | 71,450 | | Market | | Transaction Price | | N/A* | | N/A | |
| | | | Approach | | | | | | | |
Preferred Stocks | | 521,268 | | Income | | Discount Rate | | 46.5%-51.5% | | N/A | |
| | | | Approach | | | | | | | |
Preferred Stocks | | 374,242 | | Market | | Time to Exit | | 3 years | | N/A | |
| | | | Approach | | Volatility | | 72% | | N/A | |
| | | | | | Market | | N/A* | | N/A | |
| | | | | | Quotation | | | | | |
Rights | | 1,190,838 | | Income | | Discount Rate | | 6.07%-25.71% | | N/A | |
| | | | Approach | | | | | | | |
Special Purpose Vehicle | | 0 | | Market | | Revenue Multiple | | 4.55x-5.05x | | N/A | |
| | | | Approach | | | | | | | |
Alger Small Cap Growth Institutional Fund | | | | | | | |
Preferred Stocks | | $ | 418,446 | | Income | | Discount Rate | | 46.5%-51.5% | | N/A | |
| | | | Approach | | | | | | | |
Preferred Stocks | | 450,319 | | Market | | Time to Exit | | 3 years | | N/A | |
| | | | Approach | | Volatility | | 72% | | N/A | |
Rights | | 1,488,264 | | Income | | Discount Rate | | 6.07%-25.71% | | N/A | |
| | | | Approach | | | | | | | |
Special Purpose Vehicle | | 0 | | Market | | Revenue Multiple | | 4.55x-5.05x | | N/A | |
| | | | Approach | | | | | | | |
* The Fund utilized a market approach to fair value this security. The significant unobservable input used in the valuation model was a private sale available to the Fund at October 31, 2018.
83
THE ALGER INSTITUTIONAL FUNDS
NOTES TO FINANCIAL STATEMENTS (Continued)
The significant unobservable inputs used in the fair value measurement of the Fund’s securities are revenue and EBITDA multiples, discount rates, and the probabilities of success of certain outcomes. Significant increases and decreases in these inputs in isolation and interrelationships between those inputs could result in significantly higher or lower fair value measurements than those noted in the table above.
As of October 31, 2018, there were no transfers of securities between Level 1 and Level 2.
Certain of the Funds’ assets and liabilities are held at carrying amount or face value, which approximates fair value for financial statement purposes. As of October 31, 2018, such assets are categorized within the disclosure hierarchy as follows:
| | TOTAL FUND | | LEVEL 1 | | LEVEL 2 | | LEVEL 3 | |
Cash and Cash equivalents: | | | | | | | | | |
Alger Capital Appreciation Institutional Fund | | $ | 256,970,340 | | — | | $ | 256,970,340 | | — | |
Alger Focus Equity Fund | | 28,193,760 | | — | | 28,193,760 | | — | |
Alger Mid Cap Growth Institutional Fund | | 1,396,806 | | — | | 1,396,806 | | — | |
Alger Small Cap Growth Institutional Fund | | 1,826,910 | | — | | 1,826,910 | | — | |
| | | | | | | | | | | |
NOTE 9 — Derivatives:
Financial Accounting Standards Board Accounting Standards Codification 815 — Derivatives and Hedging (“ASC 815”) requires qualitative disclosures about objectives and strategies for using derivatives, quantitative disclosures about fair value amounts of and gains and losses on derivative instruments, and disclosures about credit-risk-related contingent features in derivative agreements.
Options— The Funds seek to capture the majority of the returns associated with equity market investments. To meet this investment goal, the Funds invest in a broadly diversified portfolio of common stocks, while also buying and selling call and put options on equities and equity indexes. The Funds purchase call options to increase their exposure to the stock market and also provide diversification of risk. The Funds purchase put options in order to protect from significant market declines that may occur over a short period of time. The Funds will write covered call and cash secured put options to generate cash flows while reducing the volatility of the Funds’ portfolios. The cash flows may be an important source of the Funds’ returns, although written call options may reduce the Funds’ ability to profit from increases in the value of the underlying security or equity portfolio. The value of a call option generally increases as the price of the underlying stock increases and decreases as the stock decreases in price. Conversely, the value of a put option generally increases as the price of the underlying stock decreases and decreases as the stock increases in price. The combination of the diversified stock portfolio and the purchase and sale of options is intended to provide the Funds with the majority of the returns associated with equity market investments but with reduced volatility and returns that are augmented with the cash flows from the sale of options.
The Funds’ option contracts were not subject to any rights of offset with any counterparty. All of the Funds’ options were exchange traded which utilize a clearing house that acts as
84
THE ALGER INSTITUTIONAL FUNDS
NOTES TO FINANCIAL STATEMENTS (Continued)
an intermediary between buyer and seller, receiving initial and maintenance margin from both, and guaranteeing performance of the option contract. There were no open derivative instruments throughout the year or as of October 31, 2018.
NOTE 10 — Principal Risks:
Alger Capital Appreciation Institutional Fund — Investing in the stock market involves risks, and may not be suitable for all investors. Growth stocks tend to be more volatile than other stocks as their prices tend to be higher in relation to their companies’ earnings and may be more sensitive to market, political, and economic developments. A significant portion of assets will be invested in technology and healthcare companies, which may be significantly affected by competition, innovation, regulation, and product obsolescence, and may be more volatile than the securities of other companies.
Alger Focus Equity Fund — Investing in the stock market involves certain risks, and may not be suitable for all investors. Growth stocks tend to be more volatile than other stocks as their prices tend to be higher in relation to their companies’ earnings and may be more sensitive to market, political, and economic developments. A significant portion of assets will be invested in technology companies, which may be significantly affected by competition, innovation, regulation, and product obsolescence, and may be more volatile than the securities of other companies. Assets may be focused in a small number of holdings, making them susceptible to risks associated with a single economic, political or regulatory event than a more diversified portfolio. Active trading may increase transaction costs, brokerage commissions, and taxes, which can lower the return on investment.
Alger Mid Cap Growth Institutional Fund — Investing in the stock market involves certain risks, and may not be suitable for all investors. Growth stocks tend to be more volatile than other stocks as their prices tend to be higher in relation to their companies’ earnings and may be more sensitive to market, political, and economic developments. A significant portion of assets will be invested in technology and healthcare companies, which may be significantly affected by competition, innovation, regulation, and product obsolescence, and may be more volatile than the securities of other companies. Investing in companies of medium capitalizations involve the risk that such issuers may have limited product lines or financial resources, lack management depth, or have limited liquidity.
Alger Small Cap Growth Institutional Fund — Investing in the stock market involves certain risks, and may not be suitable for all investors. Growth stocks tend to be more volatile than other stocks as their prices tend to be higher in relation to their companies’ earnings and may be more sensitive to market, political, and economic developments. A significant portion of assets will be invested in technology companies, which may be significantly affected by competition, innovation, regulation, and product obsolescence, and may be more volatile than the securities of other companies. Investing in companies of small capitalizations involve the risk that such issuers may have limited product lines or financial resources, lack management depth, or have limited liquidity.
85
THE ALGER INSTITUTIONAL FUNDS
NOTES TO FINANCIAL STATEMENTS (Continued)
NOTE 11 — Affiliated Securities:
The issuers of the securities listed below are deemed to be affiliates of the Funds because the Funds or their affiliates owned 5% or more of the issuer’s voting securities during all or part of the year ended October 31, 2018. Purchase and sale transactions and dividend income earned during the year were as follows:
| | | | | | | | | | | | | | Net Increase | | | |
| | Shares/ | | | | | | Shares/ | | | | | | (Decrease) | | | |
| | Par at | | | | | | Par at | | | | | | in | | Value at | |
| | October 31, | | Purchases/ | | Sales/ | | October 31, | | Interest | | Realized | | Unrealized | | October 31, | |
Security | | 2017 | | Conversion | | Conversion | | 2018 | | Income | | Gain (Loss) | | App(Dep) | | 2018 | |
Alger Capital Appreciation Institutional Fund | | | | | | | | | | | | | | | | | | | |
Common Stocks | | | | | | | | | | | | | | | | | | | |
Choicestream, Inc.* | | 124,658 | | — | | (124,658 | )* | — | | — | | $ | (36,151 | ) | $ | 36,151 | | — | |
Preferred Stocks | | | | | | | | | | | | | | | | | |
Choicestream, Inc., Series A* | | 1,074,935 | | — | | (1,074,935 | )* | — | | — | | (859,605 | ) | 859,605 | | — | |
Choicestream, Inc., Series B* | | 2,500,538 | | — | | (2,500,538 | )* | — | | — | | (1,500,323 | ) | 1,500,323 | | — | |
Warrants | | | | | | | | | | | | | | | | | |
Choicestream, Inc., 6/22/26* | | 574,662 | | — | | (574,662 | )* | — | | — | | (574,087 | ) | 574,087 | | — | |
Corporate Bonds Choicestream, Inc., 11.00%, 8/05/18* | | 574,662 | | — | | (574,622 | )* | — | | — | | (575 | ) | 575 | | — | |
Total | | | | | | | | | | — | | $ | (2,970,741 | ) | $ | 2,970,741 | | — | |
| | | | | | | | | | | | | | Net Increase | | | |
| | Shares/ | | | | | | Shares/ | | | | | | (Decrease) | | | |
| | Par at | | | | | | Par at | | | | | | in | | Value at | |
| | October 31, | | Purchases/ | | Sales/ | | October 31, | | Interest | | Realized | | Unrealized | | October 31, | |
Security | | 2017 | | Conversion | | Conversion | | 2018 | | Income | | Gain (Loss) | | App(Dep) | | 2018 | |
Alger Focus Equity Fund | | | | | | | | | | | | | | | | | | | |
Preferred Stocks | | | | | | | | | | | | | | | | | | | |
Prosetta Biosciences, Inc., Series D | | 76,825 | | — | | — | | 76,825 | | — | | — | | $ | 1,536 | | $ | 241,230 | |
Total | | | | | | | | | | — | | — | | $ | 1,536 | | $ | 241,230 | |
86
THE ALGER INSTITUTIONAL FUNDS
NOTES TO FINANCIAL STATEMENTS (Continued)
| | | | | | | | | | | | | | Net Increase | | | |
| | Shares/ | | | | | | Shares/ | | | | | | (Decrease) | | | |
| | Par at | | | | | | Par at | | | | | | in | | Value at | |
| | October 31, | | Purchases/ | | Sales/ | | October 31, | | Interest | | Realized | | Unrealized | | October 31, | |
Security | | 2017 | | Conversion | | Conversion | | 2018 | | Income | | Gain (Loss) | | App(Dep) | | 2018 | |
Alger Mid Cap Growth Institutional Fund | | | | | | | | | | | | | | | | | | | |
Common Stocks | | | | | | | | | | | | | | | | | | | |
Choicestream, Inc.* | | 8,930 | | — | | (8,930 | )* | — | | $ | — | | (2,590 | ) | $ | 2,590 | | — | |
Preferred Stocks | | | | | | | | | | | | | | | | | |
Choicestream, Inc., Series A* | | 77,008 | | — | | (77,008 | )* | — | | — | | (61,582 | ) | 61,582 | | — | |
Choicestream, Inc., Series B* | | 144,793 | | — | | (144,793 | )* | — | | — | | (86,876 | ) | 86,876 | | — | |
Prosetta Biosciences, Inc., Series D | | 166,009 | | — | | — | | 166,009 | | — | | — | | 3,320 | | $ | 521,268 | |
Warrants | | | | | | | | | | | | | | | | | |
Choicestream, Inc., 6/22/26* | | 17,128 | | — | | (17,128 | )* | — | | — | | (17,111 | ) | 17,111 | | — | |
Corporate Bonds | | | | | | | | | | | | | | | | | |
Choicestream, Inc.* | | 17,128 | | — | | (17,128 | )* | — | | — | | (17 | ) | 17 | | — | |
Total | | | | | | | | | | — | | $ | (168,176 | ) | $ | 171,496 | | $ | 521,268 | |
| | | | | | | | | | | | | | | | | | | | | |
| | | | | | | | | | | | | | Net Increase | | | |
| | Shares/ | | | | | | Shares/ | | | | | | (Decrease) | | | |
| | Par at | | | | | | Par at | | | | | | in | | Value at | |
| | October 31, | | Purchases/ | | Sales/ | | October 31, | | Interest | | Realized | | Unrealized | | October 31, | |
Security | | 2017 | | Conversion | | Conversion | | 2018 | | Income | | Gain (Loss) | | App(Dep) | | 2018 | |
Alger Small Cap Growth Institutional Fund | | | | | | | | | | | | | | | | | |
Preferred Stocks | | | | | | | | | | | | | | | | | |
Prosetta Biosciences, Inc., Series D | | 133,263 | | — | | | | 133,263 | | — | | | | $ | 2,665 | | $ | 418,446 | |
Total | | | | | | | | | | — | | | | $ | 2,665 | | $ | 418,446 | |
* The position was deemed worthless and written off due to the company being dissolved on December 20, 2017.
NOTE 12 — Subsequent Events:
Management of each Fund has evaluated events that have occurred subsequent to October 31, 2018, through the issuance date of the Financial Statements. No such events have been identified which require recognition and/or disclosure.
87
REPORT OF INDEPENDENT REGISTERED PUBLIC ACCOUNTING FIRM
To the Shareholders and the Board of Trustees of The Alger Institutional Funds:
Opinion on the Financial Statements and Financial Highlights
We have audited the accompanying statements of assets and liabilities of The Alger Institutional Funds comprised of the Alger Capital Appreciation Institutional Fund, Alger Focus Equity Fund (formerly Alger Capital Appreciation Focus Fund), Alger Mid Cap Growth Institutional Fund, and Alger Small Cap Growth Institutional Fund (collectively, the “Funds”), including the schedules of investments, as of October 31, 2018, the related statements of operations for the year then ended, the statements of changes in net assets for each of the two years in the period then ended, the financial highlights for each of the five years in the period then ended, and the related notes. In our opinion, the financial statements and financial highlights present fairly, in all material respects, the financial position of each of the funds constituting The Alger Institutional Funds as of October 31, 2018, and the results of their operations for the year then ended, the changes in their net assets for each of the two years in the period then ended, and the financial highlights for each of the five years in the period then ended in conformity with accounting principles generally accepted in the United States of America.
Basis for Opinion
These financial statements and financial highlights are the responsibility of the Funds’ management. Our responsibility is to express an opinion on the Funds’ financial statements and financial highlights based on our audits. We are a public accounting firm registered with the Public Company Accounting Oversight Board (United States) (PCAOB) and are required to be independent with respect to the Funds in accordance with the U.S. federal securities laws and the applicable rules and regulations of the Securities and Exchange Commission and the PCAOB.
We conducted our audits in accordance with the standards of the PCAOB. Those standards require that we plan and perform the audit to obtain reasonable assurance about whether the financial statements and financial highlights are free of material misstatement, whether due to error or fraud. The Funds are not required to have, nor were we engaged to perform, an audit of their internal control over financial reporting. As part of our audits we are required to obtain an understanding of internal control over financial reporting but not for the purpose of expressing an opinion on the effectiveness of the Funds’ internal control over financial reporting. Accordingly, we express no such opinion.
Our audits included performing procedures to assess the risks of material misstatement of the financial statements and financial highlights, whether due to error or fraud, and performing procedures that respond to those risks. Such procedures included examining, on a test basis, evidence regarding the amounts and disclosures in the financial statements and financial highlights. Our audits also included evaluating the accounting principles used and significant estimates made by management, as well as evaluating the overall presentation of the financial statements and financial highlights. Our procedures included confirmation of securities owned as of October 31, 2018, by correspondence with the custodian and brokers;
88
REPORT OF INDEPENDENT REGISTERED PUBLIC ACCOUNTING FIRM
when replies were not received from brokers, we performed other auditing procedures. We believe that our audits provide a reasonable basis for our opinion.
Deloitte & Touche LLP
New York, New York
December 21, 2018
We have served as the auditor of one or more investment companies within the group of investment companies since 2009.
89
THE ALGER INSTITUTIONAL FUNDS
ADDITIONAL INFORMATION (Unaudited)
Shareholder Expense Example
As a shareholder of the Fund, you incur two types of costs: transaction costs, if applicable, including sales charges (loads) and redemption fees; and ongoing costs, including management fees, distribution (12b-1) fees, if applicable, and other fund expenses. This example is intended to help you understand your ongoing costs (in dollars) of investing in the Fund and to compare these costs with the ongoing costs of investing in other mutual funds.
The example below is based on an investment of $1,000 invested at the beginning of the six-month period starting May 1, 2018 and ending October 31, 2018.
Actual Expenses
The first line for each class of shares in the table below provides information about actual account values and actual expenses. You may use the information in this line, together with the amount you invested, to estimate the expenses that you would have paid over the period. Simply divide your account value by $1,000 (for example, an $8,600 account value divided by $1,000 = 8.6), then multiply the result by the number in the first line under the heading entitled “Expenses Paid during the Six Months Ended October 31, 2018” to estimate the expenses you paid on your account during this period.
Hypothetical Example for Comparison Purposes
The second line for each class of shares in the table below provides information about hypothetical account values and hypothetical expenses based on the Fund’s actual expense ratios for each class of shares and an assumed rate of return of 5% per year before expenses, which is not the Fund’s actual return. The hypothetical account values and expenses may not be used to estimate the actual ending account balance or expenses you paid for the period. You may use this information to compare the ongoing costs of investing in the Fund and other funds. To do so, compare this 5% hypothetical example with the 5% hypothetical examples that appear in the shareholder reports of other funds.
Please note that the expenses shown in the table are meant to highlight your ongoing costs only and do not reflect any transaction costs, such as sales charges (loads) and redemption fees. Therefore, the second line under each class of shares in the table is useful in comparing ongoing costs only, and will not help you determine the relative total costs of owning different funds. In addition, if these transactional costs were included, your costs would have been higher.
90
THE ALGER INSTITUTIONAL FUNDS
ADDITIONAL INFORMATION (Unaudited) (Continued)
| | Beginning
Account
Value
May 1, 2018 | | Ending
Account
Value
October 31, 2018 | | Expenses
Paid During
the Six Months
Ended
October 31,
2018(a) | | Annualized
Expense Ratio
For the
Six Months
Ended
October 31,
2018(b) | |
Alger Capital Appreciation Institutional Fund | | | | | | | | | |
Class I | Actual | | $ | 1,000.00 | | $ | 1,020.40 | | $ | 5.86 | | 1.15 | % |
| Hypothetical(c) | | 1,000.00 | | 1,019.41 | | 5.85 | | 1.15 | |
Class R | Actual | | 1,000.00 | | 1,018.20 | | 8.09 | | 1.59 | |
| Hypothetical(c) | | 1,000.00 | | 1,017.19 | | 8.08 | | 1.59 | |
Class Y | Actual | | 1,000.00 | | 1,022.70 | | 3.72 | | 0.73 | |
| Hypothetical(c) | | 1,000.00 | | 1,021.53 | | 3.72 | | 0.73 | |
Class Z-2 | Actual | | 1,000.00 | | 1,022.10 | | 4.18 | | 0.82 | |
| Hypothetical(c) | | 1,000.00 | | 1,021.07 | | 4.18 | | 0.82 | |
| | | | | | | | | | |
Alger Focus Equity Fund | | | | | | | | | |
Class A | Actual | | $ | 1,000.00 | | $ | 970.90 | | $ | 5.12 | | 1.03 | % |
| Hypothetical(c) | | 1,000.00 | | 1,020.01 | | 5.24 | | 1.03 | |
Class C | Actual | | 1,000.00 | | 1,010.70 | | 9.12 | | 1.80 | |
| Hypothetical(c) | | 1,000.00 | | 1,016.13 | | 9.15 | | 1.80 | |
Class I | Actual | | 1,000.00 | | 1,024.90 | | 5.10 | | 1.00 | |
| Hypothetical(c) | | 1,000.00 | | 1,020.16 | | 5.09 | | 1.00 | |
Class Y | Actual | | 1,000.00 | | 1,026.50 | | 3.32 | | 0.65 | |
| Hypothetical(c) | | 1,000.00 | | 1,021.93 | | 3.31 | | 0.65 | |
Class Z | Actual | | 1,000.00 | | 1,026.60 | | 3.52 | | 0.69 | |
| Hypothetical(c) | | 1,000.00 | | 1,021.73 | | 3.52 | | 0.69 | |
| | | | | | | | | | |
Alger Mid Cap Growth Institutional Fund | | | | | | | | | |
Class I | Actual | | $ | 1,000.00 | | $ | 1,019.20 | | $ | 6.82 | | 1.34 | % |
| Hypothetical(c) | | 1,000.00 | | 1,018.45 | | 6.82 | | 1.34 | |
Class R | Actual | | 1,000.00 | | 1,016.50 | | 9.25 | | 1.82 | |
| Hypothetical(c) | | 1,000.00 | | 1,016.03 | | 9.25 | | 1.82 | |
Class Z-2 | Actual | | 1,000.00 | | 1,020.50 | | 5.35 | | 1.05 | |
| Hypothetical(c) | | 1,000.00 | | 1,019.91 | | 5.35 | | 1.05 | |
91
THE ALGER INSTITUTIONAL FUNDS
ADDITIONAL INFORMATION (Unaudited) (Continued)
| | Beginning
Account
Value
May 1, 2018 | | Ending
Account
Value
October 31, 2018 | | Expenses
Paid During
the Six Months
Ended
October 31,
2018(a) | | Annualized
Expense Ratio
For the
Six Months
Ended
October 31,
2018(b) | |
Alger Small Cap Growth Institutional Fund | | | | | | | | | |
Class I | Actual | | $ | 1,000.00 | | $ | 1,060.20 | | $ | 6.85 | | 1.32 | % |
| Hypothetical(c) | | 1,000.00 | | 1,018.55 | | 6.72 | | 1.32 | |
Class R | Actual | | 1,000.00 | | 1,058.60 | | 9.18 | | 1.77 | |
| Hypothetical(c) | | 1,000.00 | | 1,016.28 | | 9.00 | | 1.77 | |
Class Z-2 | Actual | | 1,000.00 | | 1,062.20 | | 5.15 | | 0.99 | |
| Hypothetical(c) | | 1,000.00 | | 1,020.21 | | 5.04 | | 0.99 | |
| | | | | | | | | | | | | |
(a) Expenses are equal to the annualized expense ratio of the respective share class, multiplied by the average account value over the period, multiplied by 184/365 (to reflect the one-half year period).
(b) Annualized.
(c) 5% annual return before expenses.
92
THE ALGER INSTITUTIONAL FUNDS
ADDITIONAL INFORMATION (Unaudited) (Continued)
Tax information
Alger Capital Appreciation Institutional Fund, Alger Focus Equity Fund and Alger Small Cap Growth Institutional Fund designate $269,430,496, $5,532,574 and $5,885,034, respectively, as approximate amounts of capital gain dividend for the purpose of dividends paid deduction.
In accordance with subchapter M of the Internal Revenue Code of 1986, as amended, for the year ended October 31, 2018, 100% and 77.25% of Alger Capital Appreciation Institutional Fund’s and Alger Focus Equity Fund’s dividends, respectively, qualified for the dividends deduction for corporations. For the year ended October 31, 2018, certain dividends paid by the Funds may be subject to a maximum rate of 15%, as provided by the Jobs and Growth Tax Relief Reconciliation Act of 2003. Of the distributions paid during the fiscal year, 100% of Alger Capital Appreciation Institutional Fund’s and Alger Focus Equity Fund’s dividends may be considered qualified dividend income.
Shareholders should not use the above information to prepare their tax returns. Since the Fund’s fiscal year is not the calendar year, another notification will be sent with respect to calendar year 2018. Such notification, which will reflect the amount to be used by tax payers on their federal income tax returns, will be made in conjunction with Form 1099 DIV and will be mailed in January 2019. Shareholders are advised to consult their own tax advisers with respect to the tax consequences of their investment in the Fund.
93
THE ALGER INSTITUTIONAL FUNDS
ADDITIONAL INFORMATION (Unaudited) (Continued)
Trustees and Officers of the Trust
Information about the trustees and officers of the Trust is set forth below. In the table the term “Alger Fund Complex” refers to the Trust, The Alger Portfolios, The Alger Global Focus Fund, The Alger Funds and The Alger Funds II, each of which is a registered investment company managed by Fred Alger Management, Inc. (“Alger Management”). Each Trustee serves until an event of termination, such as death or resignation, or until his or her successor is duly elected; each officer’s term of office is one year. Unless otherwise noted, the address of each person named below is 360 Park Avenue South, New York, NY 10010.
Additional information regarding the Trustees and Officers of the Trust is available in the Trust’s Statement of Additional Information.
94
THE ALGER INSTITUTIONAL FUNDS
ADDITIONAL INFORMATION (Unaudited) (Continued)
| | | | | | Number
of Funds
in the | |
| | | | | | Alger Fund | |
| | | | Trustee
and/or | | Complex
which are | |
Name, Age, Position | | | | Officer | | Overseen | |
with the Fund | | Principal Occupations | | Since | | by Trustee | |
INTERESTED TRUSTEE | | | | | | | |
| | | | | | | |
Hilary M. Alger (57) | | Director of Development, Pennsylvania Ballet 2004-2013; Associate Director of Development, College of Arts and Science and Graduate School, University of Virginia 1999-2003. | | 2003 | | 26 | |
NON-INTERESTED TRUSTEES | | | | | | | |
| | | | | | | |
Charles F. Baird, Jr. (65) | | Managing Director of North Castle Partners, a private equity securities group; Chairman of Elizabeth Arden Red Door Spas and Barry’s Bootcamp, former Chairman of Cascade Helmets, gloProfessional (makeup and skincare business), Contigo (manufacturer of mugs and water bottles), and International Fitness. | | 2000 | | 26 | |
Roger P. Cheever (73) | | Associate Vice President for Principal Gifts and Senior Associate Dean for Development in the Faculty of Arts and Sciences at Harvard University; Formerly Deputy Director of the Harvard College Fund. | | 2000 | | 26 | |
Stephen E. O’Neil (85) | | Attorney. Private Investor since 1981. Formerly of Counsel to the law firm of Kohler & Barnes. | | 1986 | | 26 | |
David Rosenberg (56) | | Associate Professor of Law since January 2006 (Assistant Professor 2000-2005), Zicklin School of Business, Baruch College, City University of New York. | | 2007 | | 26 | |
Nathan E. Saint-Amand
M.D. (80) | | Medical doctor in private practice; Member of the Board of the Manhattan Institute (non-profit policy research) since 1988; Formerly Co-Chairman, Special Projects Committee, Memorial Sloan Kettering. | | 1986 | | 26 | |
Ms. Alger is an “interested person” (as defined in the Investment Company Act) of the Trust because of her affiliations with Alger Management. No Trustee is a director of any public company except as indicated under “Principal Occupations”.
95
THE ALGER INSTITUTIONAL FUNDS
ADDITIONAL INFORMATION (Unaudited) (Continued)
Name, Age, Position with the
Fund | | Principal Occupations | | Trustee
and/or
Officer
Since | | Number
of Funds
in the
Alger Fund
Complex
which are
Overseen
by Trustee | |
OFFICERS | | | | | | | |
| | | | | | | |
Hal Liebes (54)
President | | Executive Vice President, Chief Operating Officer and Secretary of Alger Management and Alger Inc.; Director since 2006 of Alger Management, Alger Inc. and Analyst Resources, Inc. | | 2005 | | N/A | |
Tina Payne (44)
Secretary, Chief Compliance Officer | | Senior Vice President, General Counsel and Chief Compliance Officer of Alger Management since 2017. Formerly, Senior Vice President and Associate General Counsel, Cohen & Steers Capital Management, from 2007 to 2017 | | 2017 | | N/A | |
Michael D. Martins (53)
Treasurer | | Senior Vice President of Alger Management. | | 2005 | | N/A | |
Anthony S. Caputo (63)
Assistant Treasurer | | Vice President of Alger Management. | | 2007 | | N/A | |
Sergio M. Pavone (57)
Assistant Treasurer | | Vice President of Alger Management. | | 2007 | | N/A | |
Christopher E. Ullman (33)
Assistant Secretary | | Associate Counsel of Alger Management since 2016. Formerly, Associate, Legal and Compliance, BlackRock from 2015 to 2016; Compliance Associate, Bridgewater Associates, from 2013 to 2014; and full-time student from 2010 to 2013. | | 2016 | | N/A | |
96
THE ALGER INSTITUTIONAL FUNDS
ADDITIONAL INFORMATION (Unaudited) (Continued)
Investment Management Agreement Renewal and Approval
At an in-person meeting held on September 17, 2018 (Meeting), the Board of Trustees (Board) of The Alger Institutional Funds (Trust), including a majority of the trustees who are not “interested persons” (as defined in the Investment Company Act of 1940, as amended) of the Trust (Independent Trustees), reviewed and approved the continuance of the investment advisory agreement between Fred Alger Management, Inc. (Fred Alger Management) and the Trust, on behalf of each Fund (the Management Agreement), for an additional one-year period. The Independent Trustees received advice from, and met separately with, Independent Trustee counsel in considering whether to approve the continuation of the Management Agreement. The Board considered the information provided to it about the Funds together and with respect to each Fund separately as the Board deemed appropriate.
In considering the continuation of the Management Agreement, the Board reviewed and considered information provided by the Manager at the Meeting and throughout the year at meetings of the Board and its committees. The Board also reviewed and considered information provided in response to a detailed request for information submitted to the Manager by Independent Trustee counsel on behalf of the Independent Trustees in connection with the annual contract renewal process. The materials for the Meeting included a presentation and analysis of the Funds and the Manager’s services by FUSE Research Network LLC (FUSE), an independent consulting firm that has no material relationship with the Trustees, the Manager or any of its affiliates. In addition, prior to the Meeting, the Independent Trustees held a telephonic contract renewal meeting at which the Independent Trustees conferred among themselves and Independent Trustee counsel about contract renewal matters. The Board reviewed and considered all of the factors it deemed relevant in approving the continuance of the Management Agreement, including, but not limited to: (i) the nature, extent and quality of the services provided by the Manager; (ii) the investment performance of each Fund; (iii) the costs of the services provided and profits realized; (iv) the extent to which economies of scale are realized as a Fund grows; and (v) whether fee levels reflect these economies of scale for the benefit of Fund investors.
In approving the continuance of the Management Agreement, the Board, including a majority of the Independent Trustees, determined that the terms of the Management Agreement are fair and reasonable and that the continuance of the Management Agreement is in the interests of the applicable Fund and its shareholders. While attention was given to all information furnished, the following discusses some primary factors relevant to the Board’s determination.
Nature, Extent and Quality of Services
The Board reviewed and considered information regarding the nature, extent and quality of investment management services provided by the Manager to the Funds and their shareholders. This information included, among other things, the qualifications, background and experience of the professional personnel who perform services for a Fund; the structure of investment professional compensation; oversight of third-party service providers; investment performance reports and related financial information for each Fund; reports
97
THE ALGER INSTITUTIONAL FUNDS
ADDITIONAL INFORMATION (Unaudited) (Continued)
on fees and payments to intermediaries for transfer agency or shareholder services; legal and compliance matters; risk controls; pricing and other services provided by the Manager and its affiliates; and the range of management fees charged by the Manager and its affiliates to other funds and accounts, including management’s explanation of differences among accounts where relevant. The Board noted Fred Alger Management’s history of expertise in the “growth” style of investment management and management’s ongoing efforts to develop strategies and adjust portfolios to express conviction in portfolio investments, and to address areas of heightened concern in the mutual fund industry, such as liquidity risk as well as market conditions. The Board noted the length of time the Manager had provided services as an investment adviser to each Fund and also noted FUSE’s analysis that successful flagship offerings should sustain growth and maintain interest in the Manager’s investment capabilities.
The Board also reviewed and considered the benefits provided to Fund shareholders of investing in a Fund that is part of the Alger family of funds. The Board noted the financial position of the Manager and its commitment to the mutual fund business as evidenced by its work to increase the number of offerings in focused strategies. The Board also noted that certain administrative, compliance, reporting and accounting services necessary for the conduct of the Funds’ affairs are provided separately under a Fund Administration Agreement and a Shareholder Administrative Services Agreement with Fred Alger Management.
Following consideration of such information, the Board was satisfied with the nature, extent and quality of services provided by the Manager and its affiliates to the Funds and their shareholders.
Fund Performance
The Board reviewed and considered the performance results of each Fund over various time periods. The Board considered the performance returns for each Fund in comparison to the performance returns of a universe of mutual funds deemed comparable to the Fund based on various investment, operational, and pricing characteristics (Peer Universe), a group of mutual funds from within such Peer Universe deemed comparable to the Fund based primarily on investment strategy similarity (Peer Group), each as selected by FUSE, as well as the Fund’s benchmark index. Class I shares were used as the representative share class for each Fund’s performance results. It was noted that each class of a Fund would have substantially similar returns because the shares are invested in the same portfolio of securities and the returns would differ only to the extent that the classes do not have the same expenses. The Board received a description of the methodology FUSE used to select the mutual funds included in a Peer Universe and Peer Group.
The Board also reviewed and considered Fund performance reports provided and discussions that occurred with investment personnel at Board meetings throughout the year. As had been the practice at every quarterly meeting of Trustees throughout the year, representatives of the Manager discussed with the Trustees the recent performance of each Fund and the measures that the firm was in the process of instituting, or had instituted, to improve the performance of those Funds that had consistently underperformed. In
98
THE ALGER INSTITUTIONAL FUNDS
ADDITIONAL INFORMATION (Unaudited) (Continued)
expanding orally on the written materials they had provided to the Trustees, the FUSE representatives commented further on the performance of the various Funds.
A summary of each Fund’s performance results is below.
Alger Capital Appreciation Institutional Fund - The Peer Group for this Fund consisted of the Fund and 14 other large cap growth funds. The Peer Universe for this Fund included the Fund, the other funds of the Peer Group, and other large growth funds. The Board noted that the Fund’s annualized total return for the one-, five-, and 10-year periods outperformed the median of its Peer Group, and for the three-year period underperformed the median of its Peer Group. The Board noted that the Fund’s annualized total return for the one-, three-, five-, and 10-year periods outperformed the 50th percentile of its Peer Universe. The Board concluded that the Fund’s performance was acceptable.
Alger Focus Equity Fund - The Peer Group for this Fund consisted of the Fund and 15 other large cap growth funds. The Peer Universe for this Fund included the Fund, the other funds of the Peer Group, and other large cap growth funds. The Board noted that the Fund’s annualized total return for the one-, three-, five-, and 10-year periods outperformed the median of its Peer Group. The Board also noted that the Fund’s annualized total return for the one-, three-, and five-year periods outperformed the 50th percentile of its Peer Universe, and for the 10-year period underperformed the 50th percentile of its Peer Universe. The Board noted that the Fund’s rank within its Peer Universe for the 10-year period was 41/78. The Board concluded that the Fund’s performance was acceptable.
Alger Mid Cap Growth Institutional Fund - The Peer Group for this Fund consisted of the Fund and 15 other mid cap growth funds. The Peer Universe for this Fund included the Fund, the other funds of the Peer Group, and other mid cap growth funds. The Board noted that the Fund’s annualized total return for the one-, three- and five-year periods outperformed the median of its Peer Group, and for the 10-year period underperformed the median of its Peer Group. The Board also noted that the Fund’s annualized total return for the one- and five-year periods outperformed the 50th percentile of its Peer Universe, and for the three- and 10-year periods underperformed the 50th percentile of its Peer Universe. The Board noted that a new portfolio manager had been added to the Fund in January 2018. The Board concluded that the Fund’s performance was acceptable, noting the Fund’s absolute and relative outperformance for the one-year period.
Alger Small Cap Growth Institutional Fund — The Peer Group for this Fund consisted of the Fund and 15 other small cap growth funds. The Peer Universe for this Fund included the Fund, the other funds of the Peer Group, and other small cap growth funds. The Board noted that the Fund’s annualized total return for the one-, three-, and 10-year periods outperformed the median of its Peer Group, and for the five-year period underperformed the median of its Peer Group. The Board also noted that the Fund’s annualized total return for the one- and three-year periods outperformed the 50th percentile of its Peer Universe, and for the five- and 10-year periods underperformed the 50th percentile of its Peer Universe. The Board concluded that the Fund’s performance was acceptable, noting the Fund’s recent near-term performance improvements.
99
THE ALGER INSTITUTIONAL FUNDS
ADDITIONAL INFORMATION (Unaudited) (Continued)
Comparative Fees and Expenses
The Board reviewed and considered information regarding each Fund’s total expense ratio and its various components, including, as applicable, management fees, operating expenses, and Rule 12b-1 fees. The Board considered the total net expense ratio and, separately, the contractual management fee rate without the effect of fee waivers or expense reimbursements, if any (Management Rate), of each Fund in comparison to the median expense ratio and median Management Rate, respectively, of the Fund’s Peer Group. FUSE fee data is based upon information taken from each Peer Group fund’s most recent annual report, which reflects historical asset levels that may be quite different from those currently existing, particularly in a period of market volatility. While recognizing such inherent limitation and the fact that expense ratios and Management Rates generally increase as assets decline and decrease as assets grow, the Board believed the independent analysis conducted by FUSE to be an appropriate measure of comparative fees and expenses. The FUSE Management Rate includes administrative charges, and the total net expense ratio, for comparative consistency, was shown for Class I shares of each Fund and for similarly structured share classes for funds in the Peer Group with multiple classes of shares. The Board received a description of the methodology used by FUSE to select the mutual funds included in a Peer Group.
The Board noted that the Management Rate and total net expense ratio for Alger Capital Appreciation Institutional Fund were above the medians of the Peer Group. The Board concluded that the Management Rate charged to the Fund is reasonable.
The Board noted that the Management Rates for the Alger Focus Equity Fund, Alger Mid Cap Growth Institutional Fund, and Alger Small Cap Growth Institutional Fund were below the medians of their respective Peer Group and the total net expense ratios for such Funds were at or above the medians of their respective Peer Group. The Board also noted that the Alger Focus Equity Fund’s total net expense ratio reflected a fee waiver from management. The Board concluded that the Management Rates charged to such Funds are reasonable.
Profitability
The Board reviewed and considered information regarding the profits realized by Fred Alger Management and its affiliates in connection with the operation of each Fund. In this respect, the Board considered the Fund profitability analysis that addresses the overall profitability, as well as the profits, of Fred Alger Management and its affiliates in providing investment management and other services to each Fund during the year ended June 30, 2018. The Board also reviewed the profitability methodology and the changes thereto, noting that management attempts to apply its methods consistently from year to year.
The Board noted that costs incurred in establishing the infrastructure necessary for the type of mutual fund operations conducted by the Manager and its affiliates may not be fully reflected in the expenses allocated to each Fund in determining its profitability, as well as the fact that the level of profits, to a certain extent, reflected operational cost savings and efficiencies initiated by management. The Board also noted management’s expenditures related to additional regulatory and compliance requirements resulting from recent SEC and other regulatory developments.
100
THE ALGER INSTITUTIONAL FUNDS
ADDITIONAL INFORMATION (Unaudited) (Continued)
The Board also considered the extent to which the Manager and its affiliates might derive ancillary benefits from fund operations. Based upon its consideration of all these factors, the Board concluded that the level of profits realized by the Manager and its affiliates from providing services to each Fund was not excessive in view of the nature, extent and quality of services provided to each Fund.
Economies of Scale
The Board reviewed and considered the extent to which the Manager may realize economies of scale, if any, as each Fund grows larger and whether the Fund’s management fee structure reflects any economies of scale for the benefit of shareholders. The Board noted the existence of management fee breakpoints for Alger Capital Appreciation Institutional Fund, Alger Mid Cap Growth Institutional Fund, and Alger Small Cap Growth Institutional Fund, which operate to share economies of scale with a Fund’s shareholders by reducing the Fund’s effective management fees as the Fund grows in size. The Board considered the Manager’s view that the overall size of Fred Alger Management allows it to realize other economies of scale, such as with office space, purchases of technology, and other general business expenses. The Board concluded that for each Fund, to the extent economies of scale may be realized by Fred Alger Management and its affiliates, the benefits of such economies of scale would be shared with the Fund and its shareholders as the Fund grows.
Conclusion
Based on its review, consideration and evaluation of all factors it believed relevant, including the above-described factors and conclusions, the Board unanimously approved the continuation of the Management Agreement for an additional one-year period.
101
THE ALGER INSTITUTIONAL FUNDS
ADDITIONAL INFORMATION (Unaudited) (Continued)
Privacy Policy
U.S. Consumer Privacy Notice | Rev. 12/20/16 |
FACTS | | WHAT DOES ALGER DO WITH YOUR PERSONAL INFORMATION? |
| | |
Why? | | Financial companies choose how they share your personal information. Federal law gives consumers the right to limit some but not all sharing. Federal law also requires us to tell you how we collect, share, and protect your personal information. Please read this notice carefully to understand what we do. |
| | |
What? | | The types of personal information we collect and share depend on the product or service you have with us. This information can include: · Social Security number and · Account balances and · Transaction history and · Purchase history and · Assets When you are no longer our customer, we continue to share your information as described in this notice. |
| | |
How? | | All financial companies need to share personal information to run their everyday business. In the section below, we list the reasons financial companies can share personal information; the reasons Alger chooses to share; and whether you can limit this sharing. |
Reasons we can share your personal
information | | Does
Alger share? | | Can you limit
this sharing? |
For our everyday business purposes — such as to process your transactions, maintain your account(s), respond to court orders and legal investigations, or report to credit bureaus | | Yes | | No |
For our marketing purposes — to offer our products and services to you | | Yes | | No |
For joint marketing with other financial companies | | No | | We don’t share |
For our affiliates’ everyday business purposes — information about your transactions and experiences | | Yes | | No |
For our affiliates’ everyday business purposes — information about your creditworthiness | | No | | We don’t share |
For nonaffiliates to market to you | | No | | We don’t share |
Questions? Call 1-800-342-2186 | | | | |
102
THE ALGER INSTITUTIONAL FUNDS
ADDITIONAL INFORMATION (Unaudited) (Continued)
Who we are | |
| |
Who is providing this notice? | · Alger includes Fred Alger Management, Inc. and Fred Alger & Company, Incorporated as well as the following funds: The Alger Funds, The Alger Funds II, The Alger Institutional Funds, The Alger Portfolios, and Alger Global Focus Fund. |
| |
What we do | |
| |
How does Alger protect my personal information? | To protect your personal information from unauthorized access and use, we use security measures that comply with federal law. These measures include computer safeguards and secured files and buildings. |
| |
How does Alger collect my personal information? | We collect your personal information, for example, when you: · Open an account or · Make deposits or withdrawals from your account or · Give us your contact information or · Provide account information or · Pay us by check. |
| |
Why can’t I limit all sharing? | Federal law gives you the right to limit only · sharing for affiliates’ everyday business purposes — information about your credit worthiness · affiliates from using your information to market to you · sharing for nonaffiliates to market to you State laws and individual companies may give you additional rights to limit sharing. |
| |
Definitions | |
| |
Affiliates | Companies related by common ownership or control. They can be financial and nonfinancial companies. · Our affiliates include Fred Alger Management, Inc. and Fred Alger & Company, Incorporated as well as the following funds: The Alger Funds, The Alger Funds II, The Alger Institutional Funds, The Alger Portfolios, and Alger Global Focus Fund. |
| |
Nonaffiliates | Companies not related by common ownership or control. They can be financial and nonfinancial companies. |
| |
Joint marketing | A formal agreement between nonaffiliated financial companies that together market financial products or services to you. |
103
THE ALGER INSTITUTIONAL FUNDS
ADDITIONAL INFORMATION (Unaudited) (Continued)
Proxy Voting Policies
A description of the policies and procedures the Trust uses to determine how to vote proxies relating to portfolio securities and information regarding how the Fund voted proxies relating to portfolio securities during the most recent 12-month period ended June 30 are available, without charge, by calling (800) 992-3863 or online on the Funds’ website at www.alger.com or on the SEC’s website at www.sec.gov.
Fund Holdings
The Board of Trustees has adopted policies and procedures relating to disclosure of the Funds’ portfolio securities. These policies and procedures recognize that there may be legitimate business reasons for holdings to be disclosed and seek to balance those interests to protect the proprietary nature of the trading strategies and implementation thereof by the Funds.
Generally, the policies prohibit the release of information concerning portfolio holdings which have not previously been made public to individual investors, institutional investors, intermediaries that distribute the Funds’ shares and other parties which are not employed by the Investment Manager or its affiliates except when the legitimate business purposes for selective disclosure and other conditions (designed to protect the Funds) are acceptable.
The Funds make their full holdings available semi-annually in shareholder reports filed on Form N-CSR and after the first and third fiscal quarters in regulatory filings on Form N-Q. These shareholder reports and regulatory filings are filed with the SEC, as required by federal securities laws, and are generally available within sixty (60) days of the end of the Funds’ fiscal quarter. The Funds’ Forms N-CSR and N-Q are available online on the SEC’s website at www.sec.gov.
In addition, the Funds make publicly available their respective month-end top 10 holdings with a 10 day lag and their month-end full portfolios with a 60 day lag on their website www. alger.com and through other marketing communications (including printed advertising/ sales literature and/or shareholder telephone customer service centers). No compensation or other consideration is received for the non-public disclosure of portfolio holdings information.
In accordance with the foregoing, the Funds provide portfolio holdings information to service providers who provide necessary or beneficial services when such service providers need access to this information in the performance of their services and are subject to duties of confidentiality (1) imposed by law, including a duty not to trade on non-public information, and/or (2) pursuant to an agreement that confidential information is not to be disclosed or used (including trading on such information) other than as required by law. From time to time, the Funds will communicate with these service providers to confirm that they understand the Funds’ policies and procedures regarding such disclosure. This agreement must be approved by the Funds’ Chief Compliance Officer, President, Secretary or Assistant Secretary.
104
THE ALGER INSTITUTIONAL FUNDS
ADDITIONAL INFORMATION (Unaudited) (Continued)
The Board of Trustees periodically reviews a report disclosing the third parties to whom each Fund’s holdings information has been disclosed and the purpose for such disclosure, and it considers whether or not the release of information to such third parties is in the best interest of the Fund and its shareholders.
In addition to material the Funds routinely provide to shareholders, the Investment Manager may, upon request, make additional statistical information available regarding the Funds. Such information will include, but not be limited to, relative weightings and characteristics of a Fund’s portfolio versus its peers or an index (such as P/E ratio, alpha, beta, capture ratio, maximum drawdown, standard deviation, EPS forecasts, Sharpe ratio, information ratio, R-squared, and market cap analysis), security specific impact on overall portfolio performance, month-end top ten contributors to and detractors from performance, breakdown of High Unit Volume Growth holdings vs. Positive Lifecycle Change holdings, portfolio turnover, and requests of a similar nature. Please contact the Funds at (800) 9923863 to obtain such information.
105
THE ALGER INSTITUTIONAL FUNDS
360 Park Avenue South
New York, NY 10010
(800) 992-3863
www.alger.com
Investment Manager
Fred Alger Management, Inc.
360 Park Avenue South
New York, NY 10010
Distributor
Fred Alger & Company, Incorporated
360 Park Avenue South
New York, NY 10010
Transfer Agent and Dividend Disbursing Agent
DST Asset Manager Solutions, Inc.
P.O. Box 219432
Kansas City, MO 64121-9432
Custodian
Brown Brothers Harriman & Company
50 Post Office Square
Boston, MA 02110
Independent Registered Public Accounting Firm
Deloitte & Touche LLP
30 Rockefeller Plaza
New York, NY 10112
This report is submitted for the general information of the shareholders of The Alger Institutional Funds. It is not authorized for distribution to prospective investors unless accompanied by an effective Prospectus for the Trust, which contains information concerning the Trust’s investment policies, fees and expenses as well as other pertinent information.
106
(This page has been intentionally left blank.)
(This page has been intentionally left blank.)
(This page has been intentionally left blank.)
ITEM 2. CODE OF ETHICS.
(a) The Registrant has adopted a code of ethics (the “Code of Ethics”) that applies to its principal executive officer, principal financial officer, principal accounting officer or controller, or persons performing similar functions.
(b) Not applicable.
(c) The Registrant has not amended its Code of Ethics during the period covered by the shareholder report presented in Item 1 hereto.
(d) The Registrant has not granted a waiver or an implicit waiver from a provision of its Code of Ethics during the period covered by the shareholder report presented in Item 1 hereto.
(e) Not applicable.
(f) The Registrant’s Code of Ethics is attached as an Exhibit hereto.
ITEM 3. AUDIT COMMITTEE FINANCIAL EXPERT.
The Board of Trustees of the Registrant determined that Stephen E. O’Neil is an audit committee financial expert (within the meaning of that phrase specified in the instructions to Form N-CSR) on the Registrant’s audit committee. Mr. O’Neil is an “independent” trustee — i.e., he is not an interested person of the Registrant as defined in the Investment Company Act of 1940, nor has he accepted directly or indirectly any consulting, advisory or other compensatory fee from the Registrant, other than in his capacity as Trustee.
ITEM 4. PRINCIPAL ACCOUNTANT FEES AND SERVICES.
a) Audit Fees:
October 31, 2018 | | $ | 138,400 | |
October 31, 2017 | | $ | 137,500 | |
b) Audit-Related Fees: NONE
c) Tax Fees for tax advice, tax compliance and tax planning:
October 31, 2018 | | $ | 19,800 | |
October 31, 2017 | | $ | 19,400 | |
d) All Other Fees:
October 31, 2018 | | $ | 7,888 | |
October 31, 2017 | | $ | 7,808 | |
Other fees include a review and consent for Registrants registration statement filing and a review of the semi-annual financial statements.
e) 1) Audit Committee Pre-Approval Policies And Procedures:
Audit and non-audit services provided by the Registrant’s independent registered public accounting firm (the “Auditors”) on behalf the Registrant must be pre-approved by the Audit Committee. Non-audit services provided by the Auditors on behalf of the Registrant’s Investment Adviser or any entity controlling, controlled by, or under common control with the Investment Adviser must be pre-approved by the Audit Committee if such non-audit services directly relate to the operations or financial reporting of the Registrant.
2) All fees in item 4(b) through 4(d) above were approved by the Registrants’ Audit Committee.
f) Not Applicable
g) Non-Audit Fees:
October 31, 2018 | | $232,868, €94,474 | |
October 31, 2017 | | $224,414, €94,197 | |
h) The audit committee of the board of trustees has considered whether the provision of the non-audit services that were rendered to the registrant’s investment adviser and any entity controlling, controlled by, or under common control, with the adviser that provides ongoing services to the registrant that were not approved pursuant to (c)(7)(ii) of Rule 2-01 of Regulation S-X is compatible with maintaining the principle accountant’s independence.
ITEM 5. AUDIT COMMITTEE OF LISTED REGISTRANTS.
Not applicable
ITEM 6. INVESTMENTS.
(a) A Schedule of Investments in securities of unaffiliated issuers is included as part of the report to shareholders filed under Item 1 of this Form N-CSR.
ITEM 7. DISCLOSURE OF PROXY VOTING POLICIES AND PROCEDURES FOR CLOSED-END MANAGEMENT INVESTMENT COMPANIES.
Not applicable
ITEM 8. PORTFOLIO MANAGERS OF CLOSED-END MANAGEMENT INVESTMENT COMPANIES.
Not applicable
ITEM 9. PURCHASES OF EQUITY SECURITIES BY CLOSED-END MANAGEMENT INVESTMENT COMPANY AND AFFILIATED PURCHASERS.
Not applicable
ITEM 10. SUBMISSION OF MATTERS TO A VOTE OF SECURITY HOLDERS.
None
ITEM 11. CONTROLS AND PROCEDURES.
(a) The Registrant’s principal executive officer and principal financial officer have concluded that the Registrant’s disclosure controls and procedures (as defined in Rule 30a-3(c) under the Investment Company Act of 1940, as amended) are effective based on their evaluation of the disclosure controls and procedures as of a date within 90 days of the filing date of this document.
(b) No changes in the Registrant’s internal control over financial reporting occurred during the Registrant’s second fiscal half-year that materially affected, or are reasonably likely to materially affect, the Registrant’s internal control over financial reporting.
ITEM 12. Disclosure of Securities Lending Activities for Closed-End Management Investment Companies.
Not applicable.
ITEM 13. EXHIBITS.
(a) (1) Code of Ethics as Exhibit 99.CODE ETH
(a) (2) Certifications of principal executive officer and principal financial officer as required by rule 30a-2(a) under the Investment Company Act of 1940 are attached as Exhibit 99.CERT
(a) (3) Not applicable
(a) (4) Not applicable
(b) Certifications of principal executive officer and principal financial officer as required by rule 30a-2(b) under the Investment Company Act of 1940 are attached as Exhibit 99.906CERT
SIGNATURES
Pursuant to the requirements of the Securities Exchange Act of 1934 and the Investment Company Act of 1940, the registrant has duly caused this report to be signed on its behalf by the undersigned, thereunto duly authorized.
The Alger Institutional Funds | |
| | |
By: | /s/Hal Liebes | |
| | |
| Hal Liebes | |
| | |
| President | |
| | |
Date: December 20, 2018 | |
Pursuant to the requirements of the Securities Exchange Act of 1934 and the Investment Company Act of 1940, this report has been signed below by the following persons on behalf of the registrant and in the capacities and on the dates indicated.
By: | /s/Hal Liebes | |
| | |
| Hal Liebes | |
| | |
| President | |
| | |
Date: December 20, 2018 | |
| | |
By: | /s/Michael D. Martins | |
| | |
| Michael D. Martins | |
| | |
| Treasurer | |
| | |
Date: December 20, 2018 | |