OMB APPROVAL
OMB Number: 3235-0570
Expires: January 31, 2017
Estimated average burden
hours per response……20.6
UNITED STATES
SECURITIES AND EXCHANGE COMMISSION
Washington, D.C. 20549
FORM N-CSR
CERTIFIED SHAREHOLDER REPORT OF REGISTERED MANAGEMENT
INVESTMENT COMPANIES
Investment Company Act file number 811-07986
The Alger Institutional Funds
(Exact name of registrant as specified in charter)
360 Park Avenue South New York, New York 10010
(Address of principal executive offices) (Zip code)
Mr. Hal Liebes
Fred Alger Management, Inc.
360 Park Avenue South
New York, New York 10010
(Name and address of agent for service)
Registrant's telephone number, including area code: 212-806-8800
Date of fiscal year end: October 31
Date of reporting period: April 30, 2017
ITEM 1. REPORT(S) TO STOCKHOLDERS.
Table of Contents
The Alger Institutional Funds
|
| Shareholders’ Letter | 1 |
| Fund Highlights | 10 |
| Portfolio Summary | 16 |
| Schedules of Investments | 17 |
| Statements of Assets and Liabilities | 35 |
| Statements of Operations | 39 |
| Statements of Changes in Net Assets | 41 |
| Financial Highlights | 45 |
| Notes to Financial Statements | 60 |
| Additional Information | 89 |
Go Paperless With Alger Electronic Delivery Service
Alger is pleased to provide you with the ability to access regulatory materials online.
When documents such as prospectuses and annual and semi-annual reports are
available, we’ll send you an e-mail notification with a convenient link that will take you
directly to the fund information on our website. To sign up for this free service, simply
enroll at www.icsdelivery.com/alger.
Shareholders' Letter April 30, 2017
Dear Shareholders,
Economic Strength Sustains Bull Market
The strong bull market continued during the six-month period ended April 30, 2017, with the
S&P 500 Index generating a 13.32% return. Growth stocks, broadly speaking, outperformed
with the Russell 3000 Growth Index generating a 15.47% return. Small capitalization growth
equities were even stronger as illustrated by the 18.48% return of the Russell 2000 Growth
Index.
We maintain that expectations for strengthening economic growth worldwide and improving
corporate earnings have been the primary drivers of equity performance. We also believe
that ongoing innovation, including medical breakthroughs and internet-based technology,
is supporting equities.
Yet, some commentators have attributed recent equity gains to the U.S. presidential election.
Others have said it has been momentum trading. If it were either of those factors, we
believe a temporary decline of equities that occurred in March following growing concerns
over Washington’s ability to pass meaningful legislation would have been more severe. In
regard to economic factors, consider the following:
• Consumer and business confidence have risen to at or near their highest
levels in more than a decade.
• Wage growth is also accelerating. In December, hourly wages among private
employers increased 2.9%, the highest rate since the financial crisis. Wages
continued to increase during the first four months of this year.
• Corporate profits, meanwhile, are strengthening. At the end of the reporting
period, Wall Street analysts expected first quarter S&P 500 earnings per share
(EPS) to increase 12% year over year for the first quarter of 2017—the high-
est rate in five years.
• The Conference Board’s Leading Economic Index has been climbing in a
fairly steady manner since 2009 and hit a record high of 126.7 in March of
this year.
Economic Growth Extends Beyond U.S.
Investor sentiment was also supported by expectations for improving economic growth
abroad. Indeed, 2017 may be the first time since 2010 that all G-20 countries simultaneously
experience economic growth and help strengthen corporate fundamentals. The encouraging
outlook helped extend the equity rally beyond the U.S. as illustrated by the MSCI Emerging
Markets Index gaining 9.03% and the MSCI ACWI ex USA Index gaining 10.61%. A
perception that geopolitical risk, including elections in France, was moderating supported
investor sentiment. Upward revisions for earnings for both developed and emerging markets
and strengthening Purchasing Managers’ Index readings in Europe and China were also
encouraging.
Our view has consistently been that the economic recovery would be longer and stronger
than expected, but also slower in pace due to the severity and nature of the 2008/2009 bear
- 1 -
market and recession. While improving economic conditions are likely to make the Federal
Reserve more aggressive in its tightening, we don’t believe that monetary policy changes
will derail the expansion. We note that the U.S. does not typically enter into a recession
until about three years after material Fed tightening, which we maintain is just starting now.
Rising equity valuations concern some investors, but growth sectors such as Information
Technology and Health Care are trading in line or at a discount to their 20-year median
price-to-earnings (P/E) ratios.
It is also reasonable to argue that with extremely low interest rates, equity multiples should
be higher than their current levels.
Skepticism Versus Euphoria
In the face of new market highs for equities, many commentators are calling for a market
correction, with the average analyst rating for S&P 500 companies being approximately one
standard deviation below the average over the past decade. If bull markets begin in despair
and end in euphoria as we believe, then the equity market still has room to run, particularly
given strong fundamentals.
One asset class where we continue to see euphoria, however, is fixed income. Investors’
craving for fixed income exists despite the expensive valuations of bonds. Treasury bond
yields are normally tightly linked to nominal GDP growth (both averaged 6.5% over the past
50 years), but current 10-year yields are more than two percentage points below next year’s
estimated nominal GDP growth rate. Keep in mind that a one percentage point increase
in interest rates should theoretically cause an 8% decline in the price of a 10-year bond. A
historically wide disparity, meanwhile, exists between equity and bond valuations. When
considering the wide disparity, two scenarios are possible: fixed income yields will rise and
bond returns will be very disappointing or equity yields will fall (i.e. P/E ratios will rise) and
stock returns will be strong. Under both scenarios, equities would outperform.
A rotation from bonds and bond-like stocks to equities would also have implications for
active investing. Over the past few years, investors have favored bond-like equities (including
those with weak fundamentals) as an alternative to low-yielding fixed income securities.
This behavior weighed on active managers who focus on identifying strong businesses
rather than pursuing dividend quality. The fact is that rising interest rates have typically been
associated with active investing outperforming passive and we believe that may be the case
going forward. We are optimistic that we have seen the cyclical lows in interest rates and
active investing.
Navigating the Ship Forward
While we think that the economic expansion can continue, we believe that a good captain
does not simply look at calm waters and expect smooth sailing; rather, it is prudent to be
prepared for all weather conditions. As bottom-up focused growth investors, we concentrate
on building a boat or investment portfolio that we believe can sail through whatever
conditions lie ahead. Instead of changing course based on which way economic winds are
blowing (e.g. rotating to cyclical stocks when the economy is strong or to defensive stocks
when it appears to be weakening), we focus on finding companies that can take market share
and grow in both good and bad times.
The best risk management we know of is to understand our companies as well or better
than anyone else, feel confident in their growth under multiple scenarios, and let the strength
- 2 -
of their management teams and competitive advantages create value for our clients. Our
research and experience shows that there are always areas of the economy that are growing,
irrespective of where we are in market or economic cycles. For example, during the Global
Financial Crisis that occurred from the second quarter of 2008 until the second quarter of
2011, U.S. GDP was somewhat flat, but U.S. internet advertising and e-commerce grew over
30%. Companies that exploited that growth generated strong returns.
Innovation is Strong
We see many areas that seem poised to grow regardless of economic conditions. They range
from established growth industries such as cloud computing and the mobile internet to
emerging technologies such as artificial intelligence (AI).
We believe the following factors will support rapid growth of AI:
• Hardware improvements.
• Algorithm development.
• Storage efficiency.
Those factors are driving a revolution in what computers and robots can do including how
they interact with us. It has long been established that technology is increasing at an ever
faster rate, as popularized by Moore’s Law, but recent advances in the fundamentals that
drive AI are simply astounding. For example, CPU deep learning performance has increased
by 65 times in four years. These types of technological leaps are allowing computers to
actually learn on their own—an AI program named Libratus, developed at Carnegie Mellon,
recently beat some of the world’s best poker players. The truly incredible thing is not that it
won, but that it taught itself and developed its own strategy.
AI will change many industries. In health care, doctors struggle to keep up with technology
given the thousands of medical studies that are published each day. Yet, in one experiment,
not only did IBM’s AI supercomputer, Watson, recommend the same treatments for cancer
patients as oncologists 99% of the time, but incredibly it also found additional treatment
options that physicians had not identified in 30% of the cases, potentially giving patients new
hope. In transportation, cars are learning to drive themselves much more safely with Google,
for instance, achieving an error rate of 2 per 10,000 miles driven in 2016, a huge 75% drop
from the previous year. Some AI applications are already in use. It is estimated that 35%
of Amazon’s current sales are generated with its AI-curated personal recommendations.
According to a UBS survey, nearly 90% of large U.S. companies have a cognitive computing
project underway and 20% expect machine learning to have a business impact within a year.
The huge computing power needed to drive these projects forward will be aided by services
or platforms such as those from Google, Amazon, and Microsoft.
Conclusion
Finding areas of growth and companies that we believe will benefit from them, no matter
what the environment, is our passion and expertise. Regardless of economic conditions,
we believe our time-tested philosophy of focusing on Positive Dynamic Change has strong
potential for producing attractive results for our clients and partners.
- 3 -
Portfolio Matters
Alger Capital Appreciation Institutional Fund
The Alger Capital Appreciation Institutional Fund returned 14.67% for the fiscal six-month
period ended April 30, 2017, compared to the 15.23% return of the Russell 1000 Growth
Index.
During the reporting period, the largest sector weightings were Information Technology and
Consumer Discretionary. The largest sector overweight was Information Technology and
the largest underweight was Consumer Staples. The Information Technology and Financials
sectors provided the largest contributions to relative performance, while Consumer
Discretionary and Consumer Staples were among sectors that detracted from results.
Amazon.com, Inc.; Alphabet, Inc. Cl. C; Microsoft Corporation; and Comcast Corporation,
Cl. A were among top contributors to performance. Shares of Apple, Inc. also contributed
to performance. Apple performed strongly in response to continued strong sales of the
company’s iPhone.
Conversely, QUALCOMM, Inc.; Molson Coors Brewing Co., Cl. B; Palo Alto Networks,
Inc.; and Activision Blizzard, Inc. were among top detractors from performance. Shares of
Anadarko Petroleum Corp. also detracted from results. Anadarko is an independent natural
gas and oil company that engages in exploration and production. Its stock underperformed
in the earlier portion of this year. The company announced encouraging quarterly results
with healthy production growth and solid profitability; however, some investors were
disappointed in the lack of near-term news on a proposed sale of assets in Mozambique.
In addition, softening oil prices hurt the performance of energy company stocks, including
shares of Anadarko.
Alger Capital Appreciation Focus Fund
The Alger Capital Appreciation Focus Fund returned 15.78% for the fiscal six-month
period ended April 30, 2017, compared to the 15.23% return of its benchmark, the Russell
1000 Growth Index.
During the reporting period, the largest sector weightings were Information Technology and
Consumer Discretionary. The largest sector overweight was Information Technology and
the largest underweight was Consumer Staples. The Information Technology and Financials
sectors provided the largest contributions to relative performance, while Consumer
Discretionary and Consumer Staples were among sectors that detracted from results.
Amazon.com, Inc.; Alphabet. Inc., Cl. C; Honeywell International, Inc.; and Comcast
Corporation, Cl. A. were among the most important contributors to performance. Apple,
Inc. also contributed to performance. The performance of Apple shares was supported by
developments identified in the Alger Capital Appreciation Institutional Fund discussion.
Conversely, Molson Coors Brewing Company Cl. B; PVH Corp.; CVS Caremark Corp.;
Prosetta Biosciences Inc. Series D Preferred; and DexCom, Inc. were among top detractors
from results. CVS Caremark operates retail pharmacies and also serves as a third-party
administrator for prescription programs offered by employers and other entities. The shares
detracted from performance in response to CVS losing two large health-plan clients in the
company’s retail pharmacy business. As a result, the company lowered its earnings guidance.
- 4 -
Alger Mid Cap Growth Institutional Fund
The Alger Mid Cap Growth Institutional Fund returned 17.74% for the fiscal six-month
period ended April 30, 2017, compared to the 13.59% return of the Russell Midcap Growth
Index.
During the reporting period, the largest portfolio sector weightings were Information
Technology and Health Care. The largest sector overweight was Information Technology
and the largest underweight was Consumer Discretionary. The Health Care and Information
Technology sectors provided the largest contributions to relative performance, while
Consumer Discretionary and Materials were among sectors that detracted from results.
Tolero Pharmaceuticals Series B Convertible Preferred Stock; Tolero CDR; ARIAD
Pharmaceuticals, Inc.; IDEXX Laboratories, Inc.; and Broadcom Ltd. were among top
contributors to performance. Broadcom merged with Avago in early 2016 and has since
become a formidable competitor in the semiconductor industry. In addition, scale benefits
and synergies have enhanced the company’s profitability, which supported the performance
of the company’s shares during the reporting period.
Conversely, TransDigm Group Inc.; TreeHouse Foods, Inc.; Palo Alto Networks, Inc.;
Advance Auto Parts, Inc.; and WisdomTree Investments, Inc. were among top detractors from
performance. WisdomTree Investments creates and sells exchange traded funds (ETFs) in
a variety of asset classes. Investors’ preference for passive investment strategies has enabled
the company to grow its assets under management meaningfully over the last few years;
however, uneven flows into the company’s products hurt the performance of WisdomTree
shares during the first quarter. In addition, quarterly earnings were disappointing, in part due
to expenses associated with the company increasing its number of employees. Investors also
became concerned over the company’s decision to increase the portion of its compensation
from cash instead of company stock. On the positive side, in the last two years, the company
has been diversifying its products and distribution.
Alger Small Cap Growth Institutional Fund
The Alger Small Cap Growth Institutional Fund returned 20.03% for the fiscal six-month
period ended April 30, 2017, compared to the 18.48% return of the Russell 2000 Growth
Index.
During the reporting period, the largest portfolio sector weightings were Information
Technology and Health Care. The largest sector overweight was Health Care and the
largest underweight was Industrials. The Health Care and Information Technology sectors
provided the largest contributions to relative performance while Consumer Discretionary
and Materials were among sectors that detracted from results.
Tolero Pharmaceuticals Series B Convertible Preferred Stock; Cognex Corp.; TubeMogul,
Inc.; Lions Gate Entertainment Corp., Cl. A; and Medidata Solutions, Inc. were among
top contributors to performance. Cognex is a global market leader in machine-vision
and identification systems used to automate manufacturing and logistics. Scale, reach, a
continued focus on innovation, and a strong balance sheet are allowing the company to
continue to grow faster than the fragmented machine vision and automated ID market by
capturing share, moving into adjacencies, and acquiring competitors. The company also has
attractive opportunities in smartphone manufacturer’ investments in automation, including
demand for Cognex products that are being created by the Apple, Inc. “supercycle.”
- 5 -
Conversely, detracting from overall results on an absolute basis were Lions Gate Entertainment
Corp., Cl. B; TreeHouse Foods, Inc.; U.S. Silica Holdings, Inc.; and Luminex Corp. Different
holdings periods resulted in Lion’s Gate Cl. A contributing to performance and Lions Gate
Class B detracting from results. Also during the reporting period, Endologix, Inc. detracted
from performance. The company is developing the Nellix EndoVascular Aneurysm Sealing
System, which is a minimally invasive technology that addresses abdominal aortic aneurysms.
Performance of Endologix shares weakened after the FDA requested follow up data from
the company’s Nellix clinical study which will delay the potential regulatory approval of the
product. Essentially, Nellix is now a potential earnings catalyst for next year rather than in
2017.
I thank you for putting your trust in Alger.
Sincerely,

Daniel C. Chung, CFA
Chief Investment Officer
Fred Alger Management, Inc.
_______________________________
Investors cannot invest directly in an index. Index performance does not reflect the
deduction for fees, expenses or taxes.
This report and the financial statements contained herein are submitted for the general
information of shareholders of the funds. This report is not authorized for distribution to
prospective investors in a fund unless preceded or accompanied by an effective prospectus
for the fund. Fund returns represent the fiscal six-month period return of Class I shares.
The performance data quoted represent past performance, which is not an
indication or guarantee of future results.
Standardized performance results can be found on the following pages. The investment
return and principal value of an investment in a fund will fluctuate so that an investor’s shares,
when redeemed, may be worth more or less than their original cost. Current performance
may be lower or higher than the performance quoted. For performance data current to the
most recent month-end, visit us at www.alger.com, or call us at (800) 992-3863.
The views and opinions of the funds’ management in this report are as of the date of the
Shareholders’ Letter and are subject to change at any time subsequent to this date. There
is no guarantee that any of the assumptions that formed the basis for the opinions stated
herein are accurate or that they will materialize. Moreover, the information forming the
basis for such assumptions is from sources believed to be reliable; however, there is no
guarantee that such information is accurate. Any securities mentioned, whether owned in a
fund or otherwise, are considered in the context of the construction of an overall portfolio
of securities and therefore reference to them should not be construed as a recommendation
or offer to purchase or sell any such security. Inclusion of such securities in a fund and
transactions in such securities, if any, may be for a variety of reasons, including, without
limitation, in response to cash flows, inclusion in a benchmark, and risk control. The
reference to a specific security should also be understood in such context and not viewed as
- 6 -
a statement that the security is a significant holding in a fund. Please refer to the Schedule of
Investments for each fund that is included in this report for a complete list of fund holdings
as of April 30, 2017. Securities mentioned in the Shareholders’ Letter, if not found in the
Schedule of Investments, may have been held by the funds during the 12-month period.
A Word about Risk
Growth stocks tend to be more volatile than other stocks as the price of growth stocks tends
to be higher in relation to their companies’ earnings and may be more sensitive to market,
political and economic developments. Investing in the stock market involves gains and
losses and may not be suitable for all investors. Stocks of small- and mid-sized companies
are subject to greater risk than stocks of larger, more established companies owing to such
factors as limited liquidity, inexperienced management, and limited financial resources.
Funds that participate in leveraging, such as the Capital Appreciation Institutional Fund, are
subject to the risk that the cost of borrowing money to leverage will exceed the returns for
securities purchased or that the securities purchased may actually go down in value; thus, a
fund’s net asset value can decrease more quickly than if the fund had not borrowed.
A small investment in derivatives could have a potentially large impact on a fund’s
performance. When purchasing options, a fund bears the risk that if the market value of
the underlying security does not move to a level that would make exercise of the option
profitable, the option will expire unexercised. When a call option written by a fund is
exercised, the fund will not participate in any increase in the underlying security’s value
above the exercise price. When a put option written by a fund is exercised, the fund will
be required to purchase the underlying security at a price in excess of its market value. Use
of options on securities indexes is subject to the risk that trading in the options may be
interrupted if trading in certain securities included in the index is interrupted, the risk that
price movements in a fund’s portfolio securities may not correlate precisely with movements
in the level of an index, and the risk that Fred Alger Management, Inc. may not predict
correctly movements in the direction of a particular market or of the stock market generally.
Because certain options may require settlement in cash, a fund may be forced to liquidate
portfolio securities to meet settlement obligations. For a more detailed discussion of the
risks associated with these funds, please see the prospectus.
Before investing, carefully consider a fund’s investment objective, risks, charges,
and expenses. For a prospectus or a summary prospectus containing this and other
information about The Alger Institutional Funds call us at (800) 992-3863 or visit us
at www.alger.com. Read it carefully before investing.
Fred Alger & Company, Incorporated, Distributor. Member NYSE Euronext,
SIPC.
NOT FDIC INSURED. NOT BANK GUARANTEED. MAY LOSE VALUE.
Definitions:
• S&P 500 index: An index of large company stocks considered representative
of the U.S. stock market.
• Morgan Stanley Capital International (MSCI) All Country World Index
(ACWI) ex USA is an unmanaged, market capitalization-weighted index de-
signed to provide a broad measure of equity market performance throughout
the world, including both developing and emerging markets, but excluding
- 7 -
the United States.
• MSCI Emerging Markets Index: A free float-adjusted market capitalization
index designed to measure equity market performance in the global emerging
markets.
• Russell 3000 Growth Index: An index of common stocks designed to track
performance of companies with greater than average growth orientation in
general.
• Russell 1000 Growth Index: An index of common stocks designed to track
performance of large-capitalization companies with greater than average
growth orientation.
• Russell Midcap Growth Index: An index of common stocks designed to
track performance of medium-capitalization companies with greater than
average growth orientation.
• Russell 2000 Growth Index: An index of common stocks designed to track
performance of small-capitalization companies with greater than average
growth orientation.
• The Conference Board’s Leading Economic Indicator Index is based on a va-
riety of economic data and is part of the Conference Board’s analytic system
that seeks to signal peaks and troughs in the business cycle.
• The Purchasing Managers' Index (PMI) is an indicator of the economic
health of the manufacturing sector. The PMI is based on five major indi-
cators: new orders, inventory levels, production, supplier deliveries and the
employment environment.
- 8 -
| | | | | | | | | |
| FUND PERFORMANCE AS OF 3/31/17 (Unaudited) |
| AVERAGE ANNUAL TOTAL RETURNS |
| | | 1 | | 5 | | 10 | | SINCE | |
| | | YEAR | | YEARS | | YEARS | | INCEPTION | |
| Alger Capital Appreciation Class I (Inception 11/8/93) | | 15.10 | % | 12.86 | % | 9.50 | % | 11.78 | % |
| Alger Capital Appreciation Class R (Inception 1/27/03)* | | 14.55 | % | 12.32 | % | 8.96 | % | 11.22 | % |
| Alger Capital Appreciation Class Y (Inception 2/28/17) | | n/a | | n/a | | n/a | | 1.63 | % |
| Alger Capital Appreciation Class Z-2 (Inception 10/14/16) | | n/a | | n/a | | n/a | | 10.89 | % |
| Alger Capital Appreciation Focus Class A (Inception | | | | | | | | | |
| 12/31/12) | 9.86 | % | n/a | | n/a | | 14.20 | % |
| Alger Capital Appreciation Focus Class C (Inception | | | | | | | | | |
| 12/31/12) | 14.07 | % | n/a | | n/a | | 14.79 | % |
| Alger Capital Appreciation Focus Class I (Inception | | | | | | | | | |
| 11/8/93) | 15.92 | % | 12.15 | % | 7.02 | % | 8.50 | % |
| Alger Capital Appreciation Focus Class Y (Inception | | | | | | | | | |
| 2/28/17) | n/a | | n/a | | n/a | | 1.97 | % |
| Alger Capital Appreciation Focus Class Z (Inception | | | | | | | | | |
| 12/31/12) | 16.21 | % | n/a | | n/a | | 16.07 | % |
| Alger Mid Cap Growth Class I (Inception 11/8/93) | | 17.56 | % | 10.98 | % | 5.27 | % | 11.54 | % |
| Alger Mid Cap Growth Class R (Inception 1/27/03)* | | 16.85 | % | 10.39 | % | 4.72 | % | 10.98 | % |
| Alger Mid Cap Growth Class Z-2 (Inception 10/14/16) | | n/a | | n/a | | n/a | | 14.17 | % |
| Alger Small Cap Growth Class I (Inception 11/8/93) | | 27.32 | % | 8.42 | % | 5.93 | % | 8.94 | % |
| Alger Small Cap Growth Class R (Inception 1/27/03)* | | 26.65 | % | 7.88 | % | 5.41 | % | 8.41 | % |
| Alger Small Cap Growth Class Z-2 (Inception 8/1/16) | | n/a | | n/a | | n/a | | 14.66 | % |
The performance data quoted represents past performance, which is not an indication or a guarantee of future
results. The Fund’s average annual total returns include changes in share price and reinvestment of dividends
and capital gains.
* Since inception performance is calculated from 11/08/93. Performance figures prior to 1/27/03, inception of Class R shares,
are those of the Fund's Class I Shares. The performance figures prior to 1/27/03 have been reduced to reflect the higher
operating expenses of Class R shares.
- 9 -
ALGER CAPITAL APPRECIATION INSTITUTIONAL FUND
Fund Highlights Through April 30, 2017 (Unaudited)
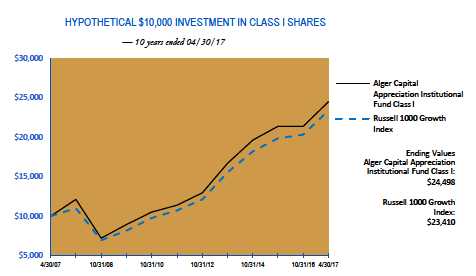
The chart above illustrates the change in value of a hypothetical $10,000 investment made in the Alger Capital
Appreciation Institutional Fund Class I shares and the Russell 1000 Growth Index (an unmanaged index of common
stocks) for the ten years ended April 30, 2017. Figures for the Alger Capital Appreciation Institutional Fund Class
I shares and the Russell 1000 Growth Index include reinvestment of dividends. Performance for the Alger Capital
Appreciation Institutional Fund Class R, Class Y and Class Z-2 shares may vary from the results shown above due
to differences in expenses the class bears. Investors cannot invest directly in any index. Index performance does not
reflect deduction for fees, expenses, or taxes.
| | | | | | | | |
| PERFORMANCE COMPARISON AS OF 4/30/17 |
| AVERAGE ANNUAL TOTAL RETURNS |
| | | | | | | | Since | |
| | 1 YEAR | | 5 YEARS | | 10 YEARS | | 11/8/1993 | |
| Class I (Inception 11/8/93) | 19.51 | % | 13.64 | % | 9.37 | % | 11.86 | % |
| Class R (Inception 1/27/03)* | 18.95 | % | 13.09 | % | 8.83 | % | 11.30 | % |
| Russell 1000 Growth Index | 19.50 | % | 13.87 | % | 8.88 | % | 8.95 | % |
| |
| |
| | | | | | | | Since | |
| | 1 YEAR | | 5 YEARS | | 10 YEARS | | 2/28/2017 | |
| Class Y (Inception 2/28/17) | n/a | | n/a | | n/a | | 4.33 | % |
| Russell 1000 Growth Index | n/a | | n/a | | n/a | | 3.47 | % |
- 10 -
ALGER CAPITAL APPRECIATION INSTITUTIONAL FUND
Fund Highlights Through April 30, 2017 (Unaudited) (Continued)
| | | | | |
| | | | | Since | |
| | 1 YEAR | 5 YEARS | 10 YEARS | 10/14/2016 | |
| Class Z-2 (Inception 10/14/16) | n/a | n/a | n/a | 13.87 | % |
| Russell 1000 Growth Index | n/a | n/a | n/a | 14.56 | % |
The performance data quoted represents past performance, which is not an indication or a guarantee of future results. The Fund’s
average annual total returns include changes in share price and reinvestment of dividends and capital gains. The chart and table above
do not reflect the deduction of taxes that a shareholder would have paid on Fund distributions or on the redemption of Fund shares.
Investment return and principal will fluctuate and the Fund’s shares, when redeemed, may be worth more or less than their original cost.
Current performance may be higher or lower than the performance quoted. For updated performance, visit us at www.alger.com or call
us at (800) 992-3863.
* Since inception performance is calculated from 11/08/93. Performance figures prior to 1/27/03, inception of Class R
shares, are those of the Fund's Class I Shares. The performance figures prior to 1/27/03 have been reduced to reflect the
higher operating expenses of Class R shares.
- 11 -
ALGER CAPITAL APPRECIATION FOCUS FUND
Fund Highlights Through April 30, 2017 (Unaudited)
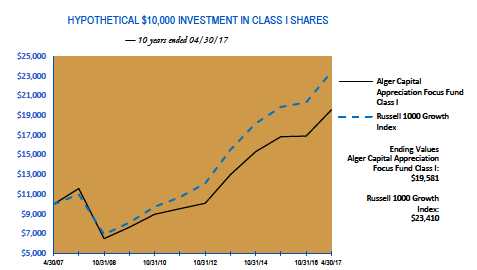
The chart above illustrates the change in value of a hypothetical $10,000 investment made in the Alger Capital
Appreciation Focus Fund Class I shares and the Russell 1000 Growth Index (an unmanaged index of common
stocks) for the ten years ended April 30, 2017. Beginning December 31, 2012 Alger Capital Appreciation Focus
Fund changed its investment strategy to invest a substantial portion of its assets in a small number of issuers. The
figures for the Alger Capital Appreciation Focus Fund Class I shares and the Russell 1000 Growth Index include
reinvestment of dividends. Performance for the Alger Capital Appreciation Focus Fund Class A, Class C, Class Y
and Class Z shares may vary from the results shown above due to differences in expenses the class bears. Investors
cannot invest directly in any index. Index performance does not reflect deduction for fees, expenses, or taxes.
- 12 -
ALGER CAPITAL APPRECIATION FOCUS FUND
Fund Highlights Through April 30, 2017 (Unaudited) (Continued)
| | | | | | | | |
| PERFORMANCE COMPARISON AS OF 4/30/17 |
| AVERAGE ANNUAL TOTAL RETURNS |
| | | | | | | | Since | |
| | 1 YEAR | | 5 YEARS | | 10 YEARS | | 11/8/1993 | |
| Class I (Inception 11/8/93) | 21.45 | % | 13.12 | % | 6.95 | % | 8.60 | % |
| Russell 1000 Growth Index | 19.50 | % | 13.87 | % | 8.88 | % | 8.95 | % |
| |
| |
| | | | | | | | Since | |
| | 1 YEAR | | 5 YEARS | | 10 YEARS | | 12/31/2012 | |
| Class A (Inception 12/31/12) | 15.11 | % | n/a | | n/a | | 14.66 | % |
| Class C (Inception 12/31/12) | 19.52 | % | n/a | | n/a | | 15.22 | % |
| Class Z (Inception 12/31/12) | 21.74 | % | n/a | | n/a | | 16.51 | % |
| Russell 1000 Growth Index | 19.50 | % | n/a | | n/a | | 16.01 | % |
| |
| |
| | | | | | | | Since | |
| | 1 YEAR | | 5 YEARS | | 10 YEARS | | 2/28/2017 | |
| Class Y (Inception 2/28/17) | n/a | | n/a | | n/a | | 4.91 | % |
| Russell 1000 Growth Index | n/a | | n/a | | n/a | | 3.47 | % |
The performance data quoted represents past performance, which is not an indication or a guarantee of future results. The Fund’s
average annual total returns include changes in share price and reinvestment of dividends and capital gains. The chart and table above
do not reflect the deduction of taxes that a shareholder would have paid on Fund distributions or on the redemption of Fund shares.
Investment return and principal will fluctuate and the Fund’s shares, when redeemed, may be worth more or less than their original cost.
Current performance may be higher or lower than the performance quoted. For updated performance, visit us at www.alger.com or call
us at (800) 992-3863.
- 13 -
ALGER MID CAP GROWTH INSTITUTIONAL FUND
Fund Highlights Through April 30, 2017 (Unaudited)
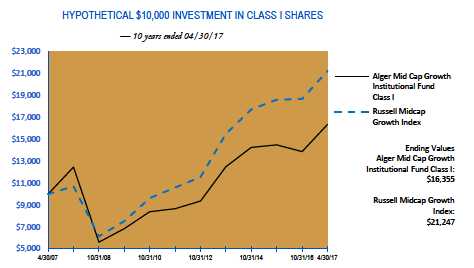
The chart above illustrates the change in value of a hypothetical $10,000 investment made in the Alger Mid Cap
Growth Institutional Fund Class I shares and the Russell Midcap Growth Index (an unmanaged index of common
stocks) for the ten years ended April 30, 2017. Figures for the Alger Mid Cap Growth Institutional Fund Class I
shares and the Russell Midcap Growth Index include reinvestment of dividends. Performance for the Alger Mid Cap
Growth Institutional Fund Class R and Class Z-2 shares may vary from the results shown above due to differences in
expenses the class bears. Investors cannot invest directly in any index. Index performance does not reflect deduction
for fees, expenses, or taxes.
| | | | | | | | |
| PERFORMANCE COMPARISON AS OF 4/30/17 |
| AVERAGE ANNUAL TOTAL RETURNS |
| | | | | | | | Since | |
| | 1 YEAR | | 5 YEARS | | 10 YEARS | | 11/8/1993 | |
| Class I (Inception 11/8/93) | 20.13 | % | 11.11 | % | 5.04 | % | 11.57 | % |
| Class R (Inception 1/27/03)* | 19.36 | % | 10.51 | % | 4.49 | % | 11.01 | % |
| Russell Midcap Growth Index | 15.83 | % | 12.28 | % | 7.83 | % | 9.40 | % |
| |
| |
| | | | | | | | Since | |
| | 1 YEAR | | 5 YEARS | | 10 YEARS | | 10/14/2016 | |
| Class Z-2 (Inception 10/14/16) | n/a | | n/a | | n/a | | 15.95 | % |
| Russell Midcap Growth Index | n/a | | n/a | | n/a | | 12.32 | % |
The performance data quoted represents past performance, which is not an indication or a guarantee of future results. The Fund’s
average annual total returns include changes in share price and reinvestment of dividends and capital gains. The chart and table above
do not reflect the deduction of taxes that a shareholder would have paid on Fund distributions or on the redemption of Fund shares.
Investment return and principal will fluctuate and the Fund’s shares, when redeemed, may be worth more or less than their original cost.
Current performance may be higher or lower than the performance quoted. For updated performance, visit us at www.alger.com or call
us at (800) 992-3863.
* Since inception performance is calculated from 11/08/93. Performance figures prior to 1/27/03, inception of Class R
shares, are those of the Fund's Class I Shares. The performance figures prior to 1/27/03 have been reduced to reflect the
higher operating expenses of Class R shares.
- 14 -
ALGER SMALL CAP GROWTH INSTITUTIONAL FUND
Fund Highlights Through April 30, 2017 (Unaudited)
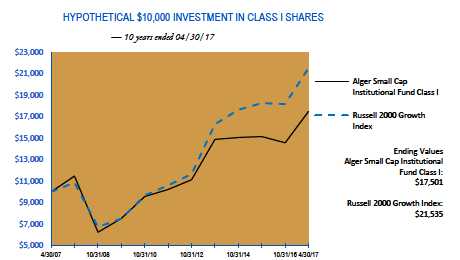
The chart above illustrates the change in value of a hypothetical $10,000 investment made in the Alger Small Cap
Growth Institutional Fund Class I shares and the Russell 2000 Growth Index (an unmanaged index of common
stocks) for the ten years ended April 30, 2017. The figures for the Alger Small Cap Growth Institutional Fund Class
I shares and the Russell 2000 Growth Index include reinvestment of dividends. Performance for the Alger Small Cap
Growth Institutional Fund Class R and Class Z-2 shares may vary from the results shown above due to differences in
expenses the class bears. Investors cannot invest directly in any index. Index performance does not reflect deduction
for fees, expenses, or taxes.
| | | | | | | | |
| PERFORMANCE COMPARISON AS OF 4/30/17 |
| AVERAGE ANNUAL TOTAL RETURNS |
| | | | | | | | Since | |
| | 1 YEAR | | 5 YEARS | | 10 YEARS | | 11/8/1993 | |
| Class I (Inception 11/8/93) | 27.69 | % | 8.83 | % | 5.76 | % | 8.96 | % |
| Class R (Inception 1/27/03)* | 26.97 | % | 8.28 | % | 5.24 | % | 8.43 | % |
| Russell 2000 Growth Index | 24.06 | % | 12.89 | % | 7.97 | % | 7.31 | % |
| |
| |
| | 1 YEAR | | 5 YEARS | | 10 YEARS | | Since 8/1/2016 | |
| Class Z-2 (Inception 8/1/16) | n/a | | n/a | | n/a | | 16.22 | % |
| Russell 2000 Growth Index | n/a | | n/a | | n/a | | 13.63 | % |
The performance data quoted represents past performance, which is not an indication or a guarantee of future results. The Fund’s
average annual total returns include changes in share price and reinvestment of dividends and capital gains. The chart and table above
do not reflect the deduction of taxes that a shareholder would have paid on Fund distributions or on the redemption of Fund shares.
Investment return and principal will fluctuate and the Fund’s shares, when redeemed, may be worth more or less than their original cost.
Current performance may be higher or lower than the performance quoted. For updated performance, visit us at www.alger.com or call
us at (800) 992-3863.
* Since inception performance is calculated from 11/08/93. Performance figures prior to 1/27/03, inception of Class R
shares, are those of the Fund's Class I Shares. The performance figures prior to 1/27/03 have been reduced to reflect the
higher operating expenses of Class R shares.
- 15 -
PORTFOLIO SUMMARY†
April 30, 2017 (Unaudited)
| | | | | | | | | | | | | |
| | | Alger Capital | | | | | | | | | | | |
| | | Appreciation Institutional | | | Alger Capital | | | Alger Mid Cap Growth | | | Alger Small Cap Growth | |
| SECTORS | | Fund | | | Appreciation Focus Fund | | | Institutional Fund | | | Institutional Fund | |
| Consumer Discretionary | | 20.1 | % | | 18.7 | % | | 16.0 | % | | 6.6 | % |
| Consumer Staples | | 3.3 | | | | 2.5 | | | 3.6 | | | 1.8 | |
| Energy | | 1.9 | | | | 2.0 | | | 1.4 | | | 2.0 | |
| Financials | | 4.9 | | | | 6.6 | | | 6.7 | | | 5.3 | |
| Health Care | | 14.7 | | | 10.9 | | | 20.6 | | | 36.8 | |
| Industrials | | 6.6 | | | | 4.5 | | | 12.3 | | | 8.1 | |
| Information Technology | | 43.1 | | | 48.3 | | | 26.7 | | | 35.2 | |
| Materials | | 1.9 | | | | 0.9 | | | 4.5 | | | 2.5 | |
| Real Estate | | 1.7 | | | | 1.0 | | | 3.4 | | | 1.0 | |
| Telecommunication Services | 1.3 | | | | 0.0 | | | 0.0 | | | 0.0 | |
| Short-Term Investments and | | | | | | | | | | | | | |
| Net Other Assets | | 0.5 | | | | 4.6 | | | 4.8 | | | 0.7 | |
| | | 100.0 | % | | 100.0 | % | | 100.0 | % | | 100.0 | % |
† Based on net assets for each Fund.
- 16 -
THE ALGER INSTITUTIONAL FUNDS |
ALGER CAPITAL APPRECIATION INSTITUTIONAL FUND
Schedule of Investments (Unaudited) April 30, 2017
| | | | | | |
| COMMON STOCKS—96.4% | | SHARES | | | | VALUE |
| AEROSPACE & DEFENSE—0.3% | | | | | | |
| General Dynamics Corp. | | 51,958 | $ 10,068,941 |
| ALTERNATIVE CARRIERS—0.6% | | | | | | |
| Level 3 Communications, Inc.* | | 308,151 | | | 18,723,255 |
| APPAREL ACCESSORIES & LUXURY GOODS—0.6% | | | | | | |
| PVH Corp. | | 192,975 | | | 19,496,264 |
| APPAREL RETAIL—0.3% | | | | | | |
| The TJX Cos., Inc. | | 130,328 | | | 10,248,994 |
| APPLICATION SOFTWARE—4.0% | | | | | | |
| Adobe Systems, Inc.* | | 283,855 | | | | 37,962,768 |
| Autodesk, Inc.* | | 403,110 | | | | 36,308,118 |
| salesforce.com, Inc.* | | 700,538 | | | | 60,330,332 |
| | | | | | 134,601,218 |
| AUTO PARTS & EQUIPMENT—0.9% | | | | | | |
| Delphi Automotive PLC. | | 355,859 | | | | 28,611,064 |
| AUTOMOTIVE RETAIL—0.0% | | | | | | |
| Carvana Co.* | | 141,678 | | | | 1,572,626 |
| BIOTECHNOLOGY—5.0% | | | | | | |
| ACADIA Pharmaceuticals, Inc.* | | 311,630 | | | | 10,698,258 |
| Alexion Pharmaceuticals, Inc.* | | 80,015 | | | | 10,224,317 |
| BioMarin Pharmaceutical, Inc.* | | 194,780 | | | | 18,667,715 |
| Celgene Corp.* | | 538,942 | | | | 66,855,755 |
| Incyte Corp.* | | 207,307 | | | | 25,764,114 |
| TESARO, Inc.* | | 43,861 | | | | 6,473,445 |
| Vertex Pharmaceuticals, Inc.* | | 220,854 | | | | 26,127,028 |
| | | | | | 164,810,632 |
| BREWERS—0.9% | | | | | | |
| Molson Coors Brewing Co., Cl. B | | 320,092 | | | 30,693,622 |
| BROADCASTING—1.7% | | | | | | |
| CBS Corp., Cl. B | | 861,290 | | | 57,327,462 |
| BUILDING PRODUCTS—0.3% | | | | | | |
| Johnson Controls International PLC. | | 267,425 | | | | 11,116,857 |
| CABLE & SATELLITE—3.2% | | | | | | |
| Charter Communications, Inc., Cl. A* | | 60,845 | | | | 21,001,260 |
| Comcast Corporation, Cl. A | | 2,216,130 | | | | 86,850,135 |
| | | | | | 107,851,395 |
| CONSTRUCTION MATERIALS—0.3% | | | | | | |
| Vulcan Materials Co. | | 86,244 | | | 10,425,175 |
| DATA PROCESSING & OUTSOURCED SERVICES—3.9% | | | | | | |
| Visa, Inc., Cl. A | | 1,436,422 | | | 131,030,415 |
| DIVERSIFIED BANKS—0.5% | | | | | | |
| JPMorgan Chase & Co. | | 207,199 | | | 18,026,313 |
| ELECTRICAL COMPONENTS & EQUIPMENT—0.5% | | | | | | |
| Rockwell Automation, Inc. | | 95,605 | | | 15,043,447 |
| FERTILIZERS & AGRICULTURAL CHEMICALS—0.5% | | | | | | |
| Monsanto Co. | | 146,554 | | | 17,089,662 |
| FINANCIAL EXCHANGES & DATA—1.7% | | | | | | |
| IntercontinentalExchange Group, Inc. | | 647,969 | | | | 39,007,734 |
- 17 -
THE ALGER INSTITUTIONAL FUNDS |
ALGER CAPITAL APPRECIATION INSTITUTIONAL FUND
Schedule of Investments (Unaudited) (Continued) April 30, 2017
| | | | | | |
| COMMON STOCKS—(CONT.) | | SHARES | | | | VALUE |
| FINANCIAL EXCHANGES & DATA—(CONT.) | | | | | | |
| S&P Global, Inc. | | 128,127 | $ | 17,193,362 |
| | | | | | 56,201,096 |
| FOOTWEAR—0.4% | | | | | | |
| NIKE, Inc., Cl. B | | 240,939 | | | 13,350,430 |
| HEALTH CARE EQUIPMENT—3.2% | | | | | | |
| Boston Scientific Corp.* | | 586,147 | | | | 15,462,558 |
| Danaher Corp. | | 289,053 | | | | 24,086,787 |
| DexCom, Inc.* | | 223,252 | | | | 17,404,726 |
| Edwards Lifesciences Corp.* | | 221,227 | | | | 24,261,965 |
| Medtronic PLC. | | 309,780 | | | | 25,739,620 |
| | | | | | 106,955,656 |
| HEALTH CARE SERVICES—0.2% | | | | | | |
| Envision Healthcare Corp.* | | 94,780 | | | | 5,310,523 |
| HOME ENTERTAINMENT SOFTWARE—0.9% | | | | | | |
| Electronic Arts, Inc.* | | 310,223 | | | 29,415,345 |
| HOME IMPROVEMENT RETAIL—1.8% | | | | | | |
| The Home Depot, Inc. | | 373,555 | | | | 58,311,936 |
| HOTELS RESORTS & CRUISE LINES—0.3% | | | | | | |
| Marriott International, Inc., Cl. A | | 122,039 | | | | 11,522,922 |
| HOUSEWARES & SPECIALTIES—0.8% | | | | | | |
| Newell Brands, Inc. | | 575,491 | | | 27,473,940 |
| HYPERMARKETS & SUPER CENTERS—0.5% | | | | | | |
| Costco Wholesale Corp. | | 96,823 | | | 17,188,019 |
| INDUSTRIAL CONGLOMERATES—3.2% | | | | | | |
| Honeywell International, Inc. | | 808,713 | | | 106,054,623 |
| INDUSTRIAL GASES—0.8% | | | | | | |
| Air Products & Chemicals, Inc. | | 181,389 | | | 25,485,154 |
| INDUSTRIAL MACHINERY—0.5% | | | | | | |
| Stanley Black & Decker, Inc. | | 118,826 | | | 16,178,160 |
| INTERNET RETAIL—7.0% | | | | | | |
| Amazon.com, Inc.* | | 228,888 | | | 211,719,111 |
| NetFlix, Inc.* | | 131,827 | | | | 20,064,070 |
| | | | | | 231,783,181 |
| INTERNET SOFTWARE & SERVICES—13.4% | | | | | | |
| Alibaba Group Holding Ltd.#* | | 419,596 | | | | 48,463,338 |
| Alphabet, Inc., Cl. C* | | 214,235 | | | 194,088,341 |
| eBay, Inc.* | | 202,681 | | | | 6,771,572 |
| Facebook, Inc., Cl. A* | | 1,103,728 | | | 165,835,132 |
| Match Group, Inc.* | | 217,241 | | | | 4,047,200 |
| Palantir Technologies, Inc., Cl. A*,@ | | 239,030 | | | | 1,453,302 |
| Yahoo! Inc.* | | 556,446 | | | | 26,826,262 |
| | | | | | 447,485,147 |
| INVESTMENT BANKING & BROKERAGE—0.8% | | | | | | |
| Morgan Stanley | | 583,566 | | | 25,309,257 |
| IT CONSULTING & OTHER SERVICES—0.7% | | | | | | |
| Cognizant Technology Solutions Corp., Cl. A* | | 367,380 | | | 22,127,297 |
- 18 -
THE ALGER INSTITUTIONAL FUNDS |
ALGER CAPITAL APPRECIATION INSTITUTIONAL FUND
Schedule of Investments (Unaudited) (Continued) April 30, 2017
| | | | | | |
| COMMON STOCKS—(CONT.) | | SHARES | | | | VALUE |
| LIFE SCIENCES TOOLS & SERVICES—0.5% | | | | | | |
| Illumina, Inc.* | | 91,597 | $ 16,932,621 |
| MANAGED HEALTH CARE—4.3% | | | | | | |
| Aetna, Inc. | | 330,665 | | | | 44,662,921 |
| Humana, Inc. | | 80,365 | | | | 17,839,423 |
| UnitedHealth Group, Inc. | | 469,544 | | | | 82,113,855 |
| | | | | | 144,616,199 |
| MOVIES & ENTERTAINMENT—2.0% | | | | | | |
| The Walt Disney Co. | | 412,444 | | | | 47,678,526 |
| Time Warner, Inc. | | 194,847 | | | | 19,342,462 |
| | | | | | 67,020,988 |
| OIL & GAS EQUIPMENT & SERVICES—0.5% | | | | | | |
| Halliburton Company | | 347,628 | | | 15,949,173 |
| OIL & GAS EXPLORATION & PRODUCTION—1.4% | | | | | | |
| Anadarko Petroleum Corp. | | 575,569 | | | | 32,818,944 |
| Pioneer Natural Resources Co. | | 69,806 | | | | 12,075,740 |
| | | | | | 44,894,684 |
| OTHER DIVERSIFIED FINANCIAL SERVICES—0.9% | | | | | | |
| Bank of America Corp. | | 1,275,398 | | | 29,767,789 |
| PHARMACEUTICALS—1.3% | | | | | | |
| Allergan PLC. | | 121,224 | | | | 29,561,684 |
| Bristol-Myers Squibb Co. | | 267,296 | | | | 14,981,941 |
| | | | | | 44,543,625 |
| RAILROADS—0.8% | | | | | | |
| Union Pacific Corp. | | 231,776 | | | 25,949,641 |
| RESTAURANTS—1.1% | | | | | | |
| McDonald's Corp. | | 116,879 | | | | 16,354,879 |
| Starbucks Corp. | | 354,322 | | | | 21,280,579 |
| | | | | | 37,635,458 |
| SEMICONDUCTOR EQUIPMENT—0.5% | | | | | | |
| Applied Materials, Inc. | | 416,367 | | | 16,908,664 |
| SEMICONDUCTORS—4.8% | | | | | | |
| Broadcom Ltd. | | 332,559 | | | | 73,432,353 |
| Microchip Technology, Inc. | | 463,041 | | | | 34,996,639 |
| Micron Technology, Inc.* | | 1,049,514 | | | | 29,040,052 |
| Microsemi Corp.* | | 348,963 | | | | 16,380,323 |
| NVIDIA Corp. | | 49,029 | | | | 5,113,725 |
| | | | | | 158,963,092 |
| SOFT DRINKS—0.7% | | | | | | |
| PepsiCo, Inc. | | 216,468 | | | 24,521,495 |
| SPECIALTY CHEMICALS—0.3% | | | | | | |
| The Sherwin-Williams Co. | | 24,691 | | | | 8,263,584 |
| SYSTEMS SOFTWARE—7.1% | | | | | | |
| Choicestream, Inc.*,@,(a) | | 124,658 | | | | – |
| Microsoft Corp. | | 2,811,649 | | | 192,485,490 |
| Red Hat, Inc.* | | 178,208 | | | | 15,696,561 |
| ServiceNow, Inc.* | | 306,431 | | | | 28,951,601 |
| | | | | | 237,133,652 |
- 19 -
THE ALGER INSTITUTIONAL FUNDS |
ALGER CAPITAL APPRECIATION INSTITUTIONAL FUND
Schedule of Investments (Unaudited) (Continued) April 30, 2017
| | | | | | | |
| COMMON STOCKS—(CONT.) | | SHARES | | | | | VALUE |
| TECHNOLOGY HARDWARE STORAGE & PERIPHERALS—7.6% | | | | | | | |
| Apple, Inc. | | 1,506,859 | $ 216,460,295 |
| Western Digital Corp. | | 427,254 | | | | | 38,055,514 |
| | | | | | 254,515,809 |
| TOBACCO—1.2% | | | | | | | |
| Philip Morris International, Inc. | | 352,221 | | | 39,040,176 |
| TRADING COMPANIES & DISTRIBUTORS—1.0% | | | | | | | |
| HD Supply Holdings, Inc.* | | 609,802 | | | | | 24,575,020 |
| United Rentals, Inc.* | | 81,348 | | | | | 8,920,622 |
| | | | | | 33,495,642 |
| WIRELESS TELECOMMUNICATION SERVICES—0.7% | | | | | | | |
| T-Mobile US, Inc.* | | 334,130 | | | 22,476,925 |
| TOTAL COMMON STOCKS | | | | | | | |
| (Cost $2,491,882,697) | | | | | 3,209,519,245 |
| PREFERRED STOCKS—0.4% | | SHARES | | | | | VALUE |
| INTERNET SOFTWARE & SERVICES—0.2% | | | | | | | |
| Palantir Technologies, Inc., Cl. B*,@ | | 974,841 | | | | | 5,927,033 |
| Palantir Technologies, Inc., Cl. D*,@ | | 127,007 | | | | | 772,203 |
| | | | | | | | 6,699,236 |
| PHARMACEUTICALS—0.2% | | | | | | | |
| Intarcia Therapeutics, Inc., Series DD*,@ | | 111,655 | | | | | 6,344,237 |
| SYSTEMS SOFTWARE—0.0% | | | | | | | |
| Choicestream, Inc., Cl. A*,@,(a) | | 1,074,935 | | | | | – |
| Choicestream, Inc., Cl. B*,@,(a) | | 2,500,538 | | | | | – |
| | | | | | | | – |
| TOTAL PREFERRED STOCKS | | | | | | | |
| (Cost $13,252,335) | | | | | | | 13,043,473 |
| WARRANTS—0.0% | | SHARES | | | | | VALUE |
| SYSTEMS SOFTWARE—0.0% | | | | | | | |
| Choicestream, Inc., 6/22/26*@,(a) | | 574,662 | | | | | – |
| (Cost $574,087) | | | | | | | – |
| MASTER LIMITED PARTNERSHIP—1.0% | | SHARES | | | | | VALUE |
| ASSET MANAGEMENT & CUSTODY BANKS—1.0% | | | | | | | |
| The Blackstone Group LP. | | 1,043,306 | | | 32,175,557 |
| (Cost $29,617,983) | | | | | | | 32,175,557 |
| REAL ESTATE INVESTMENT TRUST—1.7% | | SHARES | | | | | VALUE |
| SPECIALIZED—1.7% | | | | | | | |
| Crown Castle International Corp. | | 340,742 | | | | | 32,234,193 |
| Equinix, Inc. | | 61,113 | | | | | 25,526,900 |
| | | | | | 57,761,093 |
| TOTAL REAL ESTATE INVESTMENT TRUST | | | | | | | |
| (Cost $53,476,937) | | | | | | | 57,761,093 |
- 20 -
THE ALGER INSTITUTIONAL FUNDS |
ALGER CAPITAL APPRECIATION INSTITUTIONAL FUND
Schedule of Investments (Unaudited) (Continued) April 30, 2017
| | | | | | |
| | | PRINCIPAL | | | | |
| CORPORATE BONDS—0.0% | | AMOUNT | | | | VALUE |
| SYSTEMS SOFTWARE—0.0% | | | | | | |
| Choicestream, Inc., 11.00%, 8/05/18@,(a) | | 574,662 | | | $ | – |
| (Cost $575) | | | | | | – |
| Total Investments | | | | | | |
| (Cost $2,588,804,614)(b) | | 99.5 | % | | 3,312,499,368 |
| Other Assets in Excess of Liabilities | | 0.5 | % | | 17,828,156 |
| NET ASSETS | | 100.0 | % | $ | 3,330,327,524 |
# American Depositary Receipts.
(a) Deemed an affiliate of the Alger fund complex during the year for purposes of Section 2(a)(3) of the Investment
Company Act of 1940. See Affiliated Securities in Notes to Financial Statements.
(b) At April 30, 2017, the net unrealized appreciation on investments, based on cost for federal income tax purposes
of $2,638,574,490, amounted to $673,924,878 which consisted of aggregate gross unrealized appreciation of
$732,367,529 and aggregate gross unrealized depreciation of $58,442,651.
* Non-income producing security.
@ Restricted security - Investment in security not registered under the Securities Act of 1933. The investment is deemed
to not be liquid and may be sold only to qualified buyers.
| | | | | | | | | |
| | | | | % of net assets | | | | % of net assets | |
| | Acquisition | | | (Acquisition | | | Market | as of | |
| Security | Date(s) | | Cost | Date) | | | Value | 4/30/2017 | |
| Choicestream, Inc. | 03/14/14 | $ | 36,151 | 0.00 | % | $ | 0 | 0.00 | % |
| Choicestream, Inc., 11.00%, | | | | | | | | | |
| 8/05/18 | 08/04/16 | | 575 | 0.00 | % | | 0 | 0.00 | % |
| Choicestream, Inc., 6/22/26 | 08/04/16 | | 574,087 | 0.02 | % | | 0 | 0.00 | % |
| Choicestream, Inc., Cl. A | 12/17/13 | | 859,605 | 0.03 | % | | 0 | 0.00 | % |
| Choicestream, Inc., Cl. B | 07/10/14 | | 1,500,323 | 0.05 | % | | 0 | 0.00 | % |
| Intarcia Therapeutics, Inc., Series | | | | | | | | | |
| DD | 03/27/14 | | 3,616,505 | 0.14 | % | | 6,344,237 | 0.19 | % |
| Palantir Technologies, Inc., Cl. A | 10/07/14 | | 1,555,368 | 0.05 | % | | 1,453,302 | 0.04 | % |
| Palantir Technologies, Inc., Cl. B | 10/07/14 | | 6,437,297 | 0.22 | % | | 5,927,033 | 0.18 | % |
| Palantir Technologies, Inc., Cl. D | 10/14/14 | | 838,605 | 0.03 | % | | 772,203 | 0.02 | % |
| Total | | | | | | $ | 14,496,775 | 0.43 | % |
| | | | | | | | | | |
See Notes to Financial Statements.
- 21 -
THE ALGER INSTITUTIONAL FUNDS | ALGER CAPITAL APPRECIATION FOCUS FUND
Schedule of Investments (Unaudited) April 30, 2017
| | | | | | |
| COMMON STOCKS—92.5% | | SHARES | | | | VALUE |
| APPAREL ACCESSORIES & LUXURY GOODS—0.7% | | | | | | |
| PVH Corp. | | 7,272 | $ | 734,690 |
| APPLICATION SOFTWARE—5.3% | | | | | | |
| Adobe Systems, Inc.* | | 10,501 | | | | 1,404,404 |
| Autodesk, Inc.* | | 22,757 | | | | 2,049,723 |
| salesforce.com, Inc.* | | 26,847 | | | | 2,312,063 |
| | | | | | | 5,766,190 |
| AUTO PARTS & EQUIPMENT—0.9% | | | | | | |
| Delphi Automotive PLC. | | 12,744 | | | | 1,024,618 |
| BIOTECHNOLOGY—4.6% | | | | | | |
| BioMarin Pharmaceutical, Inc.* | | 6,536 | | | | 626,410 |
| Celgene Corp.* | | 21,368 | | | | 2,650,701 |
| Incyte Corp.* | | 6,347 | | | | 788,805 |
| Vertex Pharmaceuticals, Inc.* | | 8,258 | | | | 976,921 |
| | | | | | | 5,042,837 |
| BREWERS—0.6% | | | | | | |
| Molson Coors Brewing Co., Cl. B | | 6,849 | | | | 656,751 |
| BROADCASTING—4.0% | | | | | | |
| CBS Corp., Cl. B | | 66,208 | | | | 4,406,804 |
| CABLE & SATELLITE—3.1% | | | | | | |
| Comcast Corporation, Cl. A | | 86,771 | | | | 3,400,555 |
| DATA PROCESSING & OUTSOURCED SERVICES—5.9% | | | | | | |
| Visa, Inc., Cl. A | | 47,257 | | | | 4,310,783 |
| WNS Holdings Ltd.#* | | 65,597 | | | | 2,100,416 |
| | | | | | | 6,411,199 |
| FINANCIAL EXCHANGES & DATA—2.5% | | | | | | |
| IntercontinentalExchange Group, Inc. | | 45,584 | | | | 2,744,157 |
| FOOD DISTRIBUTORS—0.7% | | | | | | |
| Performance Food Group Co.* | | 30,460 | | | | 758,454 |
| HOME ENTERTAINMENT SOFTWARE—1.2% | | | | | | |
| Electronic Arts, Inc.* | | 14,108 | | | | 1,337,721 |
| HOME IMPROVEMENT RETAIL—1.8% | | | | | | |
| The Home Depot, Inc. | | 12,317 | | | | 1,922,684 |
| HOTELS RESORTS & CRUISE LINES—1.0% | | | | | | |
| Norwegian Cruise Line Holdings Ltd.* | | 19,898 | | | | 1,073,099 |
| HOUSEWARES & SPECIALTIES—0.9% | | | | | | |
| Newell Brands, Inc. | | 21,355 | | | | 1,019,488 |
| INDUSTRIAL CONGLOMERATES—3.7% | | | | | | |
| Honeywell International, Inc. | | 31,224 | | | | 4,094,715 |
| INDUSTRIAL GASES—0.9% | | | | | | |
| Air Products & Chemicals, Inc. | | 7,022 | | | | 986,591 |
| INTERNET RETAIL—6.3% | | | | | | |
| Amazon.com, Inc.* | | 7,427 | | | | 6,869,901 |
| INTERNET SOFTWARE & SERVICES—12.8% | | | | | | |
| Alibaba Group Holding Ltd.#* | | 20,521 | | | | 2,370,176 |
| Alphabet, Inc., Cl. C* | | 6,967 | | | | 6,311,823 |
| Facebook, Inc., Cl. A* | | 35,332 | | | | 5,308,633 |
| | | | | | 13,990,632 |
- 22 -
THE ALGER INSTITUTIONAL FUNDS | ALGER CAPITAL APPRECIATION FOCUS FUND
Schedule of Investments (Unaudited) April 30, 2017 (Continued)
| | | | | | | |
| COMMON STOCKS—(CONT.) | | SHARES | | | | | VALUE |
| INVESTMENT BANKING & BROKERAGE—1.0% | | | | | | | |
| Morgan Stanley | | 25,009 | $ | | 1,084,640 |
| IT CONSULTING & OTHER SERVICES—0.5% | | | | | | | |
| Cognizant Technology Solutions Corp., Cl. A* | | 9,406 | | | | | 566,523 |
| MANAGED HEALTH CARE—5.0% | | | | | | | |
| Aetna, Inc. | | 17,579 | | | | | 2,374,396 |
| UnitedHealth Group, Inc. | | 17,683 | | | | | 3,092,403 |
| | | | | | | | 5,466,799 |
| OIL & GAS EQUIPMENT & SERVICES—0.4% | | | | | | | |
| Halliburton Company | | 9,199 | | | | | 422,050 |
| OIL & GAS EXPLORATION & PRODUCTION—1.6% | | | | | | | |
| Anadarko Petroleum Corp. | | 30,084 | | | | | 1,715,390 |
| OTHER DIVERSIFIED FINANCIAL SERVICES—1.5% | | | | | | | |
| Bank of America Corp. | | 68,965 | | | | | 1,609,643 |
| PHARMACEUTICALS—1.0% | | | | | | | |
| Allergan PLC. | | 4,327 | | | | | 1,055,182 |
| SEMICONDUCTORS—7.8% | | | | | | | |
| Broadcom Ltd. | | 12,309 | | | | | 2,717,950 |
| Cavium Networks, Inc.* | | 12,233 | | | | | 842,242 |
| Microchip Technology, Inc. | | 44,835 | | | | | 3,388,629 |
| Micron Technology, Inc.* | | 35,622 | | | | | 985,661 |
| Microsemi Corp.* | | 11,419 | | | | | 536,008 |
| | | | | | | | 8,470,490 |
| SYSTEMS SOFTWARE—6.7% | | | | | | | |
| Microsoft Corp. | | 90,715 | | | | | 6,210,349 |
| ServiceNow, Inc.* | | 11,795 | | | | | 1,114,392 |
| | | | | | | | 7,324,741 |
| TECHNOLOGY HARDWARE STORAGE & PERIPHERALS—8.1% | | | | | | | |
| Apple, Inc. | | 49,709 | | | | | 7,140,698 |
| Western Digital Corp. | | 18,748 | | | | | 1,669,884 |
| | | | | | | | 8,810,582 |
| TOBACCO—1.2% | | | | | | | |
| Philip Morris International, Inc. | | 11,446 | | | | | 1,268,675 |
| TRADING COMPANIES & DISTRIBUTORS—0.8% | | | | | | | |
| HD Supply Holdings, Inc.* | | 22,965 | | | | | 925,490 |
| TOTAL COMMON STOCKS | | | | | | | |
| (Cost $85,367,684) | | | | | 100,961,291 |
| PREFERRED STOCKS—0.3% | | SHARES | | | | | VALUE |
| BIOTECHNOLOGY—0.3% | | | | | | | |
| Prosetta Biosciences, Inc., Series D*,@,(a) | | 76,825 | | | | | 259,668 |
| (Cost $345,713) | | | | | | | 259,668 |
| MASTER LIMITED PARTNERSHIP—1.6% | | SHARES | | | | | VALUE |
| ASSET MANAGEMENT & CUSTODY BANKS—1.6% | | | | | | | |
| The Blackstone Group LP. | | 57,178 | | | | | 1,763,369 |
| (Cost $1,536,663) | | | | | | | 1,763,369 |
- 23 -
THE ALGER INSTITUTIONAL FUNDS | ALGER CAPITAL APPRECIATION FOCUS FUND
Schedule of Investments (Unaudited) April 30, 2017 (Continued)
| | | | | | | |
| REAL ESTATE INVESTMENT TRUST—1.0% | | SHARES | | | | | VALUE |
| SPECIALIZED—1.0% | | | | | | | |
| Crown Castle International Corp. | | 11,741 | | | $ | | 1,110,699 |
| (Cost $1,036,382) | | | | | | | 1,110,699 |
| Total Investments | | | | | | | |
| (Cost $88,286,442)(b) | | 95.4 | % | | 104,095,027 |
| Other Assets in Excess of Liabilities | | 4.6 | % | | | | 5,061,127 |
| NET ASSETS | | 100.0 | % | | $ | | 109,156,154 |
# American Depositary Receipts.
(a) Deemed an affiliate of the Alger fund complex during the year for purposes of Section 2(a)(3) of the Investment
Company Act of 1940. See Affiliated Securities in Notes to Financial Statements.
(b) At April 30, 2017, the net unrealized appreciation on investments, based on cost for federal income tax purposes
of $90,487,605, amounted to $13,607,422 which consisted of aggregate gross unrealized appreciation of
$15,928,962 and aggregate gross unrealized depreciation of $2,321,540.
* Non-income producing security.
@ Restricted security - Investment in security not registered under the Securities Act of 1933. The investment is deemed
to not be liquid and may be sold only to qualified buyers.
| | | | | | | | | |
| | | | | % of net assets | | | | % of net assets | |
| | Acquisition | | | (Acquisition | | | Market | as of | |
| Security | Date(s) | | Cost | Date) | | | Value | 4/30/2017 | |
| Prosetta Biosciences, Inc., Series D | 02/06/15 | $ | 345,713 | 0.80 | % | $ | 259,668 | 0.24 | % |
| Total | | | | | | $ | 259,668 | 0.24 | % |
| | | | | | | | | | |
See Notes to Financial Statements.
- 24 -
THE ALGER INSTITUTIONAL FUNDS | ALGER MID CAP GROWTH INSTITUTIONAL FUND
Schedule of Investments (Unaudited) April 30, 2017
| | | | | |
| COMMON STOCKS—89.3% | | SHARES | | | VALUE |
| AEROSPACE & DEFENSE—0.7% | | | | | |
| Hexcel Corp. | | 13,397 | $ | 693,295 |
| APPAREL ACCESSORIES & LUXURY GOODS—1.5% | | | | | |
| Canada Goose Holdings, Inc.* | | 4,123 | | | 69,390 |
| Lululemon Athletica, Inc.* | | 7,732 | | | 402,064 |
| PVH Corp. | | 10,483 | | | 1,059,098 |
| | | | | | 1,530,552 |
| APPAREL RETAIL—1.8% | | | | | |
| Burlington Stores, Inc.* | | 6,291 | | | 622,306 |
| Ross Stores, Inc. | | 18,183 | | | 1,181,895 |
| | | | | | 1,804,201 |
| APPLICATION SOFTWARE—2.6% | | | | | |
| Autodesk, Inc.* | | 17,484 | | | 1,574,784 |
| Mobileye NV* | | 16,375 | | | 1,013,940 |
| | | | | | 2,588,724 |
| ASSET MANAGEMENT & CUSTODY BANKS—1.0% | | | | | |
| WisdomTree Investments, Inc. | | 120,912 | | | 1,009,615 |
| AUTO PARTS & EQUIPMENT—1.5% | | | | | |
| Delphi Automotive PLC. | | 10,135 | | | 814,854 |
| WABCO Holdings, Inc.* | | 5,851 | | | 695,508 |
| | | | | | 1,510,362 |
| AUTOMOTIVE RETAIL—0.7% | | | | | |
| Advance Auto Parts, Inc. | | 4,638 | | | 659,245 |
| Carvana Co.* | | 4,255 | | | 47,231 |
| | | | | | 706,476 |
| BIOTECHNOLOGY—7.7% | | | | | |
| ACADIA Pharmaceuticals, Inc.* | | 6,928 | | | 237,838 |
| Alexion Pharmaceuticals, Inc.* | | 6,658 | | | 850,759 |
| BioMarin Pharmaceutical, Inc.* | | 8,984 | | | 861,026 |
| Bluebird Bio, Inc.* | | 7,863 | | | 699,414 |
| Clovis Oncology, Inc.* | | 13,131 | | | 760,154 |
| Exact Sciences Corp.* | | 4,195 | | | 125,892 |
| Incyte Corp.* | | 10,486 | | | 1,303,200 |
| Neurocrine Biosciences, Inc.* | | 2,790 | | | 148,986 |
| Sarepta Therapeutics, Inc.* | | 10,451 | | | 378,953 |
| Spark Therapeutics, Inc.* | | 8,236 | | | 477,441 |
| TESARO, Inc.* | | 6,335 | | | 934,983 |
| Vertex Pharmaceuticals, Inc.* | | 7,240 | | | 856,492 |
| | | | | | 7,635,138 |
| BROADCASTING—1.5% | | | | | |
| CBS Corp., Cl. B | | 11,417 | | | 759,915 |
| Nexstar Media Group, Inc. | | 10,047 | | | 693,243 |
| | | | | | 1,453,158 |
| BUILDING PRODUCTS—2.0% | | | | | |
| Fortune Brands Home & Security, Inc. | | 19,517 | | | 1,244,014 |
| Johnson Controls International PLC. | | 17,486 | | | 726,893 |
| | | | | | 1,970,907 |
| COMMUNICATIONS EQUIPMENT—0.5% | | | | | |
| Ciena Corp.* | | 21,071 | | | 482,737 |
- 25 -
THE ALGER INSTITUTIONAL FUNDS | ALGER MID CAP GROWTH INSTITUTIONAL FUND
Schedule of Investments (Unaudited) April 30, 2017 (Continued)
| | | | | |
| COMMON STOCKS—(CONT.) | | SHARES | | | VALUE |
| CONSTRUCTION & FARM MACHINERY & HEAVY | | | | | |
| TRUCKS—1.2% | | | | | |
| Allison Transmission Holdings, Inc. | | 30,741 | $ | 1,189,062 |
| CONSTRUCTION MATERIALS—0.9% | | | | | |
| Vulcan Materials Co. | | 7,334 | | | 886,534 |
| CONSUMER FINANCE—0.4% | | | | | |
| LendingClub Corp.* | | 75,306 | | | 440,540 |
| DATA PROCESSING & OUTSOURCED SERVICES—4.0% | | | | | |
| Fiserv, Inc.* | | 14,030 | | | 1,671,534 |
| FleetCor Technologies, Inc.* | | 3,905 | | | 551,152 |
| Total System Services, Inc. | | 8,192 | | | 469,483 |
| WNS Holdings Ltd.#* | | 40,405 | | | 1,293,768 |
| | | | | | 3,985,937 |
| DIVERSIFIED CHEMICALS—0.5% | | | | | |
| FMC Corporation | | 7,349 | | | 538,167 |
| ELECTRICAL COMPONENTS & EQUIPMENT—2.3% | | | | | |
| AMETEK, Inc. | | 18,073 | | | 1,033,776 |
| Rockwell Automation, Inc. | | 7,733 | | | 1,216,787 |
| | | | | | 2,250,563 |
| ELECTRONIC COMPONENTS—0.8% | | | | | |
| Universal Display Corp. | | 8,758 | | | 782,527 |
| FINANCIAL EXCHANGES & DATA—3.1% | | | | | |
| IntercontinentalExchange Group, Inc. | | 16,957 | | | 1,020,811 |
| MarketAxess Holdings, Inc. | | 5,228 | | | 1,006,495 |
| S&P Global, Inc. | | 7,842 | | | 1,052,318 |
| | | | | | 3,079,624 |
| FOOD DISTRIBUTORS—1.3% | | | | | |
| Performance Food Group Co.* | | 52,188 | | | 1,299,481 |
| GENERAL MERCHANDISE STORES—1.0% | | | | | |
| Dollar Tree, Inc.* | | 11,755 | | | 972,961 |
| HEALTH CARE EQUIPMENT—5.7% | | | | | |
| ABIOMED, Inc.* | | 9,317 | | | 1,214,191 |
| DexCom, Inc.* | | 11,226 | | | 875,179 |
| Edwards Lifesciences Corp.* | | 9,788 | | | 1,073,450 |
| IDEXX Laboratories, Inc.* | | 7,956 | | | 1,334,460 |
| Masimo Corp.* | | 11,007 | | | 1,130,859 |
| | | | | | 5,628,139 |
| HEALTH CARE SUPPLIES—0.5% | | | | | |
| Align Technology, Inc.* | | 3,317 | | | 446,535 |
| HEALTH CARE TECHNOLOGY—1.6% | | | | | |
| Agilent Technologies, Inc. | | 8,257 | | | 454,548 |
| Medidata Solutions, Inc.* | | 17,840 | | | 1,167,271 |
| | | | | | 1,621,819 |
| HOME ENTERTAINMENT SOFTWARE—1.7% | | | | | |
| Electronic Arts, Inc.* | | 17,458 | | | 1,655,368 |
| HOME FURNISHINGS—0.4% | | | | | |
| Mohawk Industries, Inc.* | | 1,723 | | | 404,543 |
| HOTELS RESORTS & CRUISE LINES—2.2% | | | | | |
| Marriott International, Inc., Cl. A | | 14,408 | | | 1,360,404 |
- 26 -
THE ALGER INSTITUTIONAL FUNDS | ALGER MID CAP GROWTH INSTITUTIONAL FUND
Schedule of Investments (Unaudited) April 30, 2017 (Continued)
| | | | | |
| COMMON STOCKS—(CONT.) | | SHARES | | | VALUE |
| HOTELS RESORTS & CRUISE LINES—(CONT.) | | | | | |
| Norwegian Cruise Line Holdings Ltd.* | | 14,711 | $ | 793,364 |
| | | | | | 2,153,768 |
| HOUSEHOLD PRODUCTS—1.0% | | | | | |
| Church & Dwight Co., Inc. | | 19,879 | | | 984,607 |
| HOUSEWARES & SPECIALTIES—1.8% | | | | | |
| Newell Brands, Inc. | | 36,323 | | | 1,734,060 |
| INDUSTRIAL GASES—1.0% | | | | | |
| Air Products & Chemicals, Inc. | | 6,732 | | | 945,846 |
| INDUSTRIAL MACHINERY—1.3% | | | | | |
| Fortive Corp. | | 10,078 | | | 637,534 |
| Stanley Black & Decker, Inc. | | 4,531 | | | 616,896 |
| | | | | | 1,254,430 |
| INTERNET SOFTWARE & SERVICES—1.9% | | | | | |
| LogMeIn, Inc. | | 4,840 | | | 546,920 |
| Match Group, Inc.* | | 53,243 | | | 991,917 |
| Palantir Technologies, Inc., Cl. A*,@ | | 12,426 | | | 75,550 |
| Q2 Holdings, Inc.* | | 6,544 | | | 249,654 |
| | | | | | 1,864,041 |
| IT CONSULTING & OTHER SERVICES—2.9% | | | | | |
| EPAM Systems, Inc.* | | 11,853 | | | 912,681 |
| Gartner, Inc.* | | 8,468 | | | 966,114 |
| InterXion Holding NV* | | 24,924 | | | 1,038,334 |
| | | | | | 2,917,129 |
| LEISURE FACILITIES—1.2% | | | | | |
| Vail Resorts, Inc. | | 6,104 | | | 1,206,517 |
| LEISURE PRODUCTS—0.3% | | | | | |
| Coach, Inc. | | 8,057 | | | 317,365 |
| LIFE SCIENCES TOOLS & SERVICES—1.2% | | | | | |
| Illumina, Inc.* | | 6,353 | | | 1,174,416 |
| MANAGED HEALTH CARE—0.4% | | | | | |
| WellCare Health Plans, Inc.* | | 2,504 | | | 384,139 |
| METAL & GLASS CONTAINERS—1.3% | | | | | |
| Ball Corp. | | 16,173 | | | 1,243,542 |
| MOVIES & ENTERTAINMENT—1.5% | | | | | |
| Viacom, Inc., Cl. B | | 35,232 | | | 1,499,474 |
| OIL & GAS EXPLORATION & PRODUCTION—1.4% | | | | | |
| Encana Corp. | | 43,785 | | | 468,500 |
| Parsley Energy, Inc., Cl. A* | | 10,831 | | | 322,655 |
| Pioneer Natural Resources Co. | | 3,262 | | | 564,293 |
| | | | | | 1,355,448 |
| PACKAGED FOODS & MEATS—1.3% | | | | | |
| Conagra Brands, Inc. | | 15,944 | | | 618,308 |
| Pinnacle Foods, Inc. | | 10,994 | | | 639,301 |
| | | | | | 1,257,609 |
| PHARMACEUTICALS—1.6% | | | | | |
| Aerie Pharmaceuticals, Inc.* | | 18,993 | | | 836,642 |
| Zoetis, Inc. | | 14,041 | | | 787,840 |
| | | | | | 1,624,482 |
- 27 -
THE ALGER INSTITUTIONAL FUNDS | ALGER MID CAP GROWTH INSTITUTIONAL FUND
Schedule of Investments (Unaudited) April 30, 2017 (Continued)
| | | | | | |
| COMMON STOCKS—(CONT.) | | SHARES | | | | VALUE |
| REGIONAL BANKS—1.9% | | | | | | |
| Citizens Financial Group, Inc. | | 18,409 | $ | | 675,794 |
| Regions Financial Corp. | | 86,858 | | | | 1,194,298 |
| | | | | | | 1,870,092 |
| RESEARCH & CONSULTING SERVICES—0.9% | | | | | | |
| Verisk Analytics, Inc., Cl. A* | | 10,769 | | | | 891,781 |
| SEMICONDUCTOR EQUIPMENT—1.4% | | | | | | |
| Lam Research Corp. | | 9,858 | | | | 1,427,931 |
| SEMICONDUCTORS—5.3% | | | | | | |
| Broadcom Ltd. | | 7,775 | | | | 1,716,798 |
| Cavium Networks, Inc.* | | 13,195 | | | | 908,476 |
| Microchip Technology, Inc. | | 5,591 | | | | 422,568 |
| Microsemi Corp.* | | 8,368 | | | | 392,794 |
| NVIDIA Corp. | | 12,274 | | | | 1,280,178 |
| Skyworks Solutions, Inc. | | 5,580 | | | | 556,549 |
| | | | | | | 5,277,363 |
| SPECIALIZED CONSUMER SERVICES—0.6% | | | | | | |
| Sotheby's* | | 12,754 | | | | 604,029 |
| SPECIALTY CHEMICALS—0.8% | | | | | | |
| WR Grace & Co. | | 12,043 | | | | 839,638 |
| SPECIALTY STORES—0.7% | | | | | | |
| Ulta Beauty, Inc.* | | 2,508 | | | | 705,852 |
| SYSTEMS SOFTWARE—3.8% | | | | | | |
| Choicestream, Inc.*,@,(a) | | 8,930 | | | | – |
| Proofpoint, Inc.* | | 11,976 | | | | 902,631 |
| Red Hat, Inc.* | | 14,939 | | | | 1,315,827 |
| ServiceNow, Inc.* | | 16,013 | | | | 1,512,908 |
| | | | | | | 3,731,366 |
| TECHNOLOGY HARDWARE STORAGE & PERIPHERALS—1.5% | | | | | | |
| Western Digital Corp. | | 16,667 | | | | 1,484,530 |
| TRADING COMPANIES & DISTRIBUTORS—2.8% | | | | | | |
| Fastenal Co. | | 18,360 | | | | 820,325 |
| HD Supply Holdings, Inc.* | | 35,957 | | | | 1,449,067 |
| United Rentals, Inc.* | | 4,937 | | | | 541,391 |
| | | | | | | 2,810,783 |
| TRUCKING—0.4% | | | | | | |
| Old Dominion Freight Line, Inc. | | 4,322 | | | | 382,583 |
| TOTAL COMMON STOCKS | | | | | | |
| (Cost $76,673,560) | | | | | | 88,509,786 |
| PREFERRED STOCKS—1.3% | | SHARES | | | | VALUE |
| BIOTECHNOLOGY—0.6% | | | | | | |
| Prosetta Biosciences, Inc., Series D*,@,(a) | | 166,009 | | | | 561,111 |
| INTERNET SOFTWARE & SERVICES—0.3% | | | | | | |
| Palantir Technologies, Inc., Cl. B*,@ | | 50,675 | | | | 308,104 |
| Palantir Technologies, Inc., Cl. D*,@ | | 6,602 | | | | 40,140 |
| | | | | | | 348,244 |
| PHARMACEUTICALS—0.4% | | | | | | |
| Intarcia Therapeutics, Inc., Series DD*,@ | | 7,588 | | | | 431,150 |
- 28 -
THE ALGER INSTITUTIONAL FUNDS | ALGER MID CAP GROWTH INSTITUTIONAL FUND
Schedule of Investments (Unaudited) April 30, 2017 (Continued)
| | | | | | |
| PREFERRED STOCKS—(CONT.) | | SHARES | | | | VALUE |
| SYSTEMS SOFTWARE—0.0% | | | | | | |
| Choicestream, Inc., Cl. A*,@,(a) | | 77,008 | | $ | | – |
| Choicestream, Inc., Cl. B*,@,(a) | | 144,793 | | | | – |
| | | | | | | – |
| TOTAL PREFERRED STOCKS | | | | | | |
| (Cost $1,519,495) | | | | | | 1,340,505 |
| WARRANTS—0.0% | | SHARES | | | | VALUE |
| SYSTEMS SOFTWARE—0.0% | | | | | | |
| Choicestream, Inc., 6/22/26@,(a) | | 17,128 | | | | – |
| (Cost $17,111) | | | | | | – |
| RIGHTS—0.9% | | SHARES | | | | VALUE |
| BIOTECHNOLOGY—0.9% | | | | | | |
| Tolero Pharmaceuticals, Inc., CDR*@,(a),(i) | | 422,928 | | | | 919,488 |
| (Cost $226,186) | | | | | | 919,488 |
| REAL ESTATE INVESTMENT TRUST—3.4% | | SHARES | | | | VALUE |
| HEALTH CARE—0.5% | | | | | | |
| Omega Healthcare Investors, Inc. | | 13,610 | | | | 449,130 |
| SPECIALIZED—2.9% | | | | | | |
| Crown Castle International Corp. | | 11,253 | | | | 1,064,534 |
| CyrusOne, Inc. | | 15,246 | | | | 833,041 |
| Lamar Advertising Co., Cl. A | | 13,925 | | | | 1,003,575 |
| | | | | | | 2,901,150 |
| TOTAL REAL ESTATE INVESTMENT TRUST | | | | | | |
| (Cost $3,285,441) | | | | | | 3,350,280 |
| | | PRINCIPAL | | | | |
| CORPORATE BONDS—0.0% | | AMOUNT | | | | VALUE |
| SYSTEMS SOFTWARE—0.0% | | | | | | |
| Choicestream, Inc., 11.00%, 8/05/18*@,(a) | | 17,128 | | | | – |
| (Cost $17) | | | | | | – |
| SPECIAL PURPOSE VEHICLE—0.3% | | SHARES | | | | VALUE |
| CONSUMER FINANCE—0.3% | | | | | | |
| JS Kred SPV I, LLC.@ | | 240,362 | | | | 273,003 |
| (Cost $240,362) | | | | | | 273,003 |
| Total Investments | | | | | | |
| (Cost $81,962,172)(b) | | 95.2 | % | | | 94,393,062 |
| Other Assets in Excess of Liabilities | | 4.8 | % | | | 4,749,351 |
| NET ASSETS | | 100.0 | % | $ | | 99,142,413 |
# American Depositary Receipts.
(a) Deemed an affiliate of the Alger fund complex during the year for purposes of Section 2(a)(3) of the Investment Company Act of
1940. See Affiliated Securities in Notes to Financial Statements.
(b) At April 30, 2017, the net unrealized appreciation on investments, based on cost for federal income tax purposes of $81,942,892,
amounted to $12,450,170 which consisted of aggregate gross unrealized appreciation of $14,538,006 and aggregate gross
unrealized depreciation of $2,087,836.
(i) Contingent deferred rights.
* Non-income producing security.
- 29 -
THE ALGER INSTITUTIONAL FUNDS | ALGER MID CAP GROWTH INSTITUTIONAL FUND
Schedule of Investments (Unaudited) April 30, 2017 (Continued)
@ Restricted security - Investment in security not registered under the Securities Act of 1933. The investment is deemed to not be liquid
and may be sold only to qualified buyers.
| | | | | | | | | |
| | | | | % of net assets | | | | % of net assets | |
| | Acquisition | | | (Acquisition | | | Market | as of | |
| Security | Date(s) | | Cost | Date) | | | Value | 4/30/2017 | |
| Choicestream, Inc. | 03/14/14 | $ | 2,590 | 0.00 | % | $ | 0 | 0.00 | % |
| Choicestream, Inc., 11.00%, | | | | | | | | | |
| 8/05/18 | 08/04/16 | | 17 | 0.00 | % | | 0 | 0.00 | % |
| Choicestream, Inc., 6/22/26 | 08/04/16 | | 17,111 | 0.02 | % | | 0 | 0.00 | % |
| Choicestream, Inc., Cl. A | 12/17/13 | | 61,582 | 0.03 | % | | 0 | 0.00 | % |
| Choicestream, Inc., Cl. B | 07/10/14 | | 86,876 | 0.05 | % | | 0 | 0.00 | % |
| Intarcia Therapeutics, Inc., Series | | | | | | | | | |
| DD | 03/27/14 | | 245,775 | 0.14 | % | | 431,150 | 0.43 | % |
| JS Kred SPV I, LLC. | 06/26/15 | | 240,362 | 0.15 | % | | 273,003 | 0.28 | % |
| Palantir Technologies, Inc., Cl. A | 10/07/14 | | 80,856 | 0.05 | % | | 75,550 | 0.08 | % |
| Palantir Technologies, Inc., Cl. B | 10/07/14 | | 334,629 | 0.22 | % | | 308,104 | 0.31 | % |
| Palantir Technologies, Inc., Cl. D | 10/14/14 | | 43,592 | 0.03 | % | | 40,140 | 0.04 | % |
| Prosetta Biosciences, Inc., Series D | 02/06/15 | | 747,041 | 0.50 | % | | 561,111 | 0.57 | % |
| Tolero Pharmaceuticals, Inc., CDR | 01/11/17 | | 149,093 | 0.10 | % | | 606,089 | 0.61 | % |
| Tolero Pharmaceuticals, Inc., CDR | 01/11/17 | | 77,093 | 0.05 | % | | 313,399 | 0.32 | % |
| Total | | | | | | $ | 2,608,546 | 2.63 | % |
See Notes to Financial Statements.
- 30 -
THE ALGER INSTITUTIONAL FUNDS | ALGER SMALL CAP GROWTH INSTITUTIONAL FUND
Schedule of Investments (Unaudited) April 30, 2017
| | | | | | |
| COMMON STOCKS—95.4% | | SHARES | | | | VALUE |
| AEROSPACE & DEFENSE—1.7% | | | | | | |
| Hexcel Corp. | | 57,970 | $ | 2,999,948 |
| APPAREL ACCESSORIES & LUXURY GOODS—0.5% | | | | | | |
| Kate Spade & Co.* | | 49,246 | | | | 856,880 |
| APPAREL RETAIL—1.5% | | | | | | |
| American Eagle Outfitters, Inc. | | 80,478 | | | | 1,133,935 |
| Burlington Stores, Inc.* | | 15,733 | | | | 1,556,308 |
| | | | | | | 2,690,243 |
| APPLICATION SOFTWARE—13.7% | | | | | | |
| ACI Worldwide, Inc.* | | 143,347 | | | | 3,080,527 |
| American Software, Inc., Cl. A | | 68,218 | | | | 748,351 |
| Blackbaud, Inc. | | 61,370 | | | | 4,934,762 |
| Ellie Mae, Inc.* | | 17,475 | | | | 1,778,256 |
| Everbridge, Inc.* | | 39,082 | | | | 907,093 |
| Guidewire Software, Inc.* | | 37,316 | | | | 2,294,561 |
| HubSpot, Inc.* | | 32,224 | | | | 2,160,619 |
| Manhattan Associates, Inc.* | | 58,017 | | | | 2,708,814 |
| Paycom Software, Inc.* | | 16,421 | | | | 989,365 |
| Tyler Technologies, Inc.* | | 31,584 | | | | 5,166,827 |
| | | | | | 24,769,175 |
| ASSET MANAGEMENT & CUSTODY BANKS—2.0% | | | | | | |
| WisdomTree Investments, Inc. | | 427,526 | | | | 3,569,842 |
| AUTOMOTIVE RETAIL—0.6% | | | | | | |
| Lithia Motors, Inc., Cl. A | | 11,001 | | | | 1,051,146 |
| BIOTECHNOLOGY—5.6% | | | | | | |
| ACADIA Pharmaceuticals, Inc.* | | 67,672 | | | | 2,323,180 |
| Bluebird Bio, Inc.* | | 6,104 | | | | 542,951 |
| Clovis Oncology, Inc.* | | 13,466 | | | | 779,547 |
| Halozyme Therapeutics, Inc.* | | 93,553 | | | | 1,304,129 |
| Incyte Corp.* | | 5,229 | | | | 649,860 |
| Ironwood Pharmaceuticals, Inc.* | | 25,470 | | | | 415,670 |
| Sarepta Therapeutics, Inc.* | | 19,705 | | | | 714,503 |
| TESARO, Inc.* | | 13,672 | | | | 2,017,851 |
| Ultragenyx Pharmaceutical, Inc.* | | 20,398 | | | | 1,313,427 |
| | | | | | | 10,061,118 |
| BREWERS—0.3% | | | | | | |
| Craft Brew Alliance, Inc.* | | 44,524 | | | | 605,526 |
| BUILDING PRODUCTS—2.2% | | | | | | |
| Masonite International Corp.* | | 48,526 | | | | 4,037,363 |
| COMMUNICATIONS EQUIPMENT—1.6% | | | | | | |
| NetScout Systems, Inc.* | | 77,943 | | | | 2,934,554 |
| CONSUMER FINANCE—2.2% | | | | | | |
| LendingClub Corp.* | | 685,775 | | | | 4,011,784 |
| DATA PROCESSING & OUTSOURCED SERVICES—1.1% | | | | | | |
| Euronet Worldwide, Inc.* | | 24,688 | | | | 2,039,723 |
| ELECTRONIC COMPONENTS—1.8% | | | | | | |
| Dolby Laboratories Inc., Cl. A | | 30,638 | | | | 1,615,542 |
| Universal Display Corp. | | 18,536 | | | | 1,656,191 |
| | | | | | | 3,271,733 |
- 31 -
THE ALGER INSTITUTIONAL FUNDS | ALGER SMALL CAP GROWTH INSTITUTIONAL FUND
Schedule of Investments (Unaudited) April 30, 2017 (Continued)
| | | | | | |
| COMMON STOCKS—(CONT.) | | SHARES | | | | VALUE |
| ELECTRONIC EQUIPMENT & INSTRUMENTS—5.1% | | | | | | |
| Cognex Corp. | | 84,044 | $ | 7,172,315 |
| FLIR Systems, Inc. | | 52,243 | | | | 1,918,885 |
| | | | | | | 9,091,200 |
| FINANCIAL EXCHANGES & DATA—0.6% | | | | | | |
| MarketAxess Holdings, Inc. | | 6,015 | | | | 1,158,008 |
| FOOD DISTRIBUTORS—1.5% | | | | | | |
| Performance Food Group Co.* | | 104,996 | | | | 2,614,400 |
| HEALTH CARE EQUIPMENT—8.6% | | | | | | |
| Abaxis, Inc. | | 65,618 | | | | 2,954,779 |
| ABIOMED, Inc.* | | 29,158 | | | | 3,799,871 |
| Cantel Medical Corp. | | 68,652 | | | | 5,108,395 |
| DexCom, Inc.* | | 13,844 | | | | 1,079,278 |
| Inogen, Inc.* | | 14,087 | | | | 1,167,671 |
| Insulet Corp.* | | 31,029 | | | | 1,346,969 |
| | | | | | 15,456,963 |
| HEALTH CARE SUPPLIES—5.7% | | | | | | |
| Meridian Bioscience, Inc. | | 91,394 | | | | 1,352,631 |
| Neogen Corp.* | | 87,068 | | | | 5,426,948 |
| Quidel Corp.* | | 143,998 | | | | 3,480,432 |
| | | | | | | 10,260,011 |
| HEALTH CARE TECHNOLOGY—6.7% | | | | | | |
| Medidata Solutions, Inc.* | | 59,800 | | | | 3,912,714 |
| Veeva Systems, Inc., Cl. A* | | 85,658 | | | | 4,592,982 |
| Vocera Communications, Inc.* | | 140,039 | | | | 3,551,389 |
| | | | | | 12,057,085 |
| HOME ENTERTAINMENT SOFTWARE—2.3% | | | | | | |
| Take-Two Interactive Software, Inc.* | | 65,126 | | | | 4,093,169 |
| HUMAN RESOURCE & EMPLOYMENT SERVICES—2.1% | | | | | | |
| WageWorks, Inc.* | | 50,525 | | | | 3,728,745 |
| INDUSTRIAL MACHINERY—2.1% | | | | | | |
| DMC Global, Inc. | | 43,254 | | | | 661,786 |
| Sun Hydraulics Corp. | | 79,507 | | | | 3,088,052 |
| | | | | | | 3,749,838 |
| INTERNET SOFTWARE & SERVICES—3.8% | | | | | | |
| Cornerstone OnDemand, Inc.* | | 20,287 | | | | 796,873 |
| NIC, Inc. | | 86,959 | | | | 1,856,575 |
| Q2 Holdings, Inc.* | | 52,453 | | | | 2,001,082 |
| Shopify, Inc., Cl. A* | | 11,876 | | | | 901,982 |
| SPS Commerce, Inc.* | | 24,817 | | | | 1,371,388 |
| | | | | | | 6,927,900 |
| IT CONSULTING & OTHER SERVICES—1.2% | | | | | | |
| InterXion Holding NV* | | 50,144 | | | | 2,088,999 |
| LEISURE FACILITIES—1.0% | | | | | | |
| Planet Fitness, Inc., Cl. A | | 83,861 | | | | 1,744,309 |
| LIFE SCIENCES TOOLS & SERVICES—4.8% | | | | | | |
| Bio-Techne Corp. | | 45,480 | | | | 4,869,999 |
| Luminex Corp. | | 87,457 | | | | 1,646,815 |
- 32 -
THE ALGER INSTITUTIONAL FUNDS | ALGER SMALL CAP GROWTH INSTITUTIONAL FUND
Schedule of Investments (Unaudited) April 30, 2017 (Continued)
| | | | | | | |
| COMMON STOCKS—(CONT.) | | SHARES | | | | | VALUE |
| LIFE SCIENCES TOOLS & SERVICES—(CONT.) | | | | | | | |
| PRA Health Sciences, Inc.* | | 33,418 | $ | | 2,137,415 |
| | | | | | | | 8,654,229 |
| MANAGED HEALTH CARE—0.7% | | | | | | | |
| HealthEquity, Inc.* | | 26,832 | | | | | 1,221,393 |
| MOVIES & ENTERTAINMENT—0.9% | | | | | | | |
| Lions Gate Entertainment Corp., Cl. A | | 33,692 | | | | | 881,720 |
| Lions Gate Entertainment Corp., Cl. B* | | 33,692 | | | | | 803,554 |
| | | | | | | | 1,685,274 |
| OIL & GAS EQUIPMENT & SERVICES—1.5% | | | | | | | |
| RPC, Inc. | | 69,636 | | | | | 1,265,286 |
| US Silica Holdings, Inc. | | 35,542 | | | | | 1,474,993 |
| | | | | | | | 2,740,279 |
| OIL & GAS EXPLORATION & PRODUCTION—0.5% | | | | | | | |
| Parsley Energy, Inc., Cl. A* | | 31,031 | | | | | 924,414 |
| PHARMACEUTICALS—2.3% | | | | | | | |
| Aerie Pharmaceuticals, Inc.* | | 37,457 | | | | | 1,649,981 |
| Pacira Pharmaceuticals, Inc.* | | 52,331 | | | | | 2,540,670 |
| | | | | | | | 4,190,651 |
| RESTAURANTS—1.6% | | | | | | | |
| Shake Shack, Inc., Cl. A* | | 41,598 | | | | | 1,411,836 |
| Wingstop, Inc. | | 52,186 | | | | | 1,535,834 |
| | | | | | | | 2,947,670 |
| SEMICONDUCTORS—2.5% | | | | | | | |
| Cavium Networks, Inc.* | | 33,896 | | | | | 2,333,739 |
| Microsemi Corp.* | | 47,503 | | | | | 2,229,791 |
| | | | | | | | 4,563,530 |
| SPECIALTY CHEMICALS—2.5% | | | | | | | |
| Balchem Corp. | | 40,399 | | | | | 3,278,783 |
| Flotek Industries, Inc.* | | 94,739 | | | | | 1,137,815 |
| | | | | | | | 4,416,598 |
| SPECIALTY STORES—0.5% | | | | | | | |
| Five Below, Inc.* | | 18,802 | | | | | 923,554 |
| SYSTEMS SOFTWARE—2.1% | | | | | | | |
| Proofpoint, Inc.* | | 50,878 | | | | | 3,834,675 |
| TOTAL COMMON STOCKS | | | | | | | |
| (Cost $134,568,531) | | | | | 171,971,929 |
| PREFERRED STOCKS—1.6% | | SHARES | | | | | VALUE |
| BIOTECHNOLOGY—0.3% | | | | | | | |
| Prosetta Biosciences, Inc., Series D*,@,(a) | | 133,263 | | | | | 450,429 |
| PHARMACEUTICALS—1.3% | | | | | | | |
| Intarcia Therapeutics, Inc., Series DD*,@ | | 41,238 | | | | | 2,343,143 |
| TOTAL PREFERRED STOCKS | | | | | | | |
| (Cost $1,935,382) | | | | | | | 2,793,572 |
| RIGHTS—0.6% | | SHARES | | | | | VALUE |
| BIOTECHNOLOGY—0.6% | | | | | | | |
| Dyax Corp.*,@ | | 21,650 | | | | | – |
| Neuralstem, Inc., 1/8/2019*,@ | | 19,260 | | | | | – |
- 33 -
THE ALGER INSTITUTIONAL FUNDS | ALGER SMALL CAP GROWTH INSTITUTIONAL FUND
Schedule of Investments (Unaudited) April 30, 2017 (Continued)
| | | | | | | |
| RIGHTS—(CONT.) | | SHARES | | | | | VALUE |
| BIOTECHNOLOGY—(CONT.) | | | | | | | |
| Tolero Pharmaceuticals, Inc., CDR*@,(a),(i) | | 528,559 | | | $ | | 1,149,140 |
| | | | | | | | 1,149,140 |
| TOTAL RIGHTS | | | | | | | |
| (Cost $285,727) | | | | | | | 1,149,140 |
| REAL ESTATE INVESTMENT TRUST—1.0% | | SHARES | | | | | VALUE |
| SPECIALIZED—1.0% | | | | | | | |
| CyrusOne, Inc. | | 32,622 | | | | | 1,782,466 |
| (Cost $1,090,753) | | | | | | | 1,782,466 |
| SPECIAL PURPOSE VEHICLE—0.5% | | SHARES | | | | | VALUE |
| CONSUMER FINANCE—0.5% | | | | | | | |
| JS Kred SPV I, LLC.@ | | 775,134 | | | | | 880,398 |
| (Cost $775,134) | | | | | | | 880,398 |
| Total Investments | | | | | | | |
| (Cost $138,655,527)(b) | | 99.1 | % | | 178,577,505 |
| Other Assets in Excess of Liabilities | | 0.9 | % | | | | 1,670,062 |
| NET ASSETS | | 100.0 | % | | $ | | 180,247,567 |
(a) Deemed an affiliate of the Alger fund complex during the year for purposes of Section 2(a)(3) of the Investment Company Act of
1940. See Affiliated Securities in Notes to Financial Statements.
(b) At April 30, 2017, the net unrealized appreciation on investments, based on cost for federal income tax purposes of $142,935,916,
amounted to $35,641,589 which consisted of aggregate gross unrealized appreciation of $43,948,217 and aggregate gross
unrealized depreciation of $8,306,628.
(i) Deferred contingent rights.
* Non-income producing security.
@ Restricted security - Investment in security not registered under the Securities Act of 1933. The investment is deemed to not be liquid
and may be sold only to qualified buyers.
| | | | | | | | | |
| | | | | % of net assets | | | | % of net assets | |
| | Acquisition | | | (Acquisition | | | Market | as of | |
| Security | Date(s) | | Cost | Date) | | | Value | 4/30/2017 | |
| Dyax Corp. | 05/01/15 | $ | 0 | 0.00 | % | $ | 0 | 0.00 | % |
| Dyax Corp. | 08/14/15 | | 0 | 0.00 | % | | 0 | 0.00 | % |
| Intarcia Therapeutics, Inc., Series | | | | | | | | | |
| DD | 03/27/14 | | 1,335,699 | 0.15 | % | | 2,343,143 | 1.30 | % |
| JS Kred SPV I, LLC. | 06/26/15 | | 775,134 | 0.15 | % | | 880,397 | 0.49 | % |
| Neuralstem, Inc. | 01/03/14 | | 0 | 0.00 | % | | 0 | 0.00 | % |
| Prosetta Biosciences, Inc., Series D | 02/06/15 | | 599,683 | 0.10 | % | | 450,429 | 0.25 | % |
| Tolero Pharmaceuticals, Inc., CDR | 01/11/17 | | 285,726 | 0.04 | % | | 1,149,140 | 0.63 | % |
| Total | | | | | | $ | 4,823,110 | 2.67 | % |
| | | | | | | | | | |
See Notes to Financial Statements.
- 34 -
THE ALGER INSTITUTIONAL FUNDS
Statement of Assets and Liabilities April 30, 2017 (Unaudited)
| | | | | | |
| | | Alger Capital | | | Alger Capital | |
| | | Appreciation | | Appreciation Focus | |
| | Institutional Fund | | | Fund | |
| |
| ASSETS: | | | | | | |
| Investments in securities, at value (Identified cost below)* | | | | | | |
| see accompanying schedules of investments | $ | 3,312,499,368 | | $ | 103,835,359 | |
| Investments in affiliated securities, at value (Identified cost | | | | | | |
| below)** see accompanying schedules of investments | | — | | | 259,668 | |
| Cash and cash equivalents | | 23,031,944 | | | 4,167,471 | |
| Foreign cash † | | 520 | | | 10 | |
| Receivable for investment securities sold | | 71,376,928 | | | 2,304,981 | |
| Receivable for shares of beneficial interest sold | | 7,765,432 | | | 1,483,027 | |
| Dividends and interest receivable | | 1,443,494 | | | 60,422 | |
| Receivable from Investment Manager | | 302 | | | — | |
| Prepaid expenses | | 338,387 | | | 43,374 | |
| Total Assets | | 3,416,456,375 | | | 112,154,312 | |
| |
| LIABILITIES: | | | | | | |
| Payable for investment securities purchased | | 66,674,344 | | | 2,834,669 | |
| Payable for shares of beneficial interest redeemed | | 15,324,967 | | | 34,877 | |
| Accrued investment advisory fees | | 1,997,220 | | | 46,150 | |
| Due to investment advisor | | — | | | 1,526 | |
| Accrued transfer agent fees | | 889,007 | | | 21,135 | |
| Accrued distribution fees | | 242,561 | | | 17,639 | |
| Accrued administrative fees | | 73,834 | | | 2,308 | |
| Accrued shareholder servicing fees | | 605,799 | | | 4,189 | |
| Accrued shareholder administrative fees | | 26,849 | | | 1,033 | |
| Accrued other expenses | | 294,270 | | | 34,632 | |
| Total Liabilities | | 86,128,851 | | | 2,998,158 | |
| NET ASSETS | $ | 3,330,327,524 | | $ | 109,156,154 | |
| |
| NET ASSETS CONSIST OF: | | | | | | |
| Paid in capital (par value of $.001 per share) | | 2,498,965,357 | | | 94,672,389 | |
| Undistributed net investment income (accumulated loss) | | (2,307,051 | ) | | (199,892 | ) |
| Undistributed net realized gain (accumulated realized loss) | | 109,974,463 | | | (1,124,929 | ) |
| Net unrealized appreciation on investments | | 723,694,755 | | | 15,808,586 | |
| NET ASSETS | $ | 3,330,327,524 | | $ | 109,156,154 | |
| * Identified cost | $ | 2,585,833,873 | | $ | 87,940,729 | |
| ** Identified cost | $ | 2,970,741 | | $ | 345,713 | |
| † Cost of foreign cash | $ | 519 | | $ | 10 | |
| See Notes to Financial Statements. | | | | | | |
- 35 -
THE ALGER INSTITUTIONAL FUNDS
Statement of Assets and Liabilities April 30, 2017 (Unaudited) (Continued)
| | | | |
| | | Alger Capital | | Alger Capital |
| | | Appreciation | Appreciation Focus |
| | Institutional Fund | | Fund |
| |
| NET ASSETS BY CLASS: | | | | |
| Class A | $ | — | $ | 21,486,175 |
| Class C | $ | — | $ | 16,927,517 |
| Class I | $ | 2,388,199,369 | $ | 21,704,568 |
| Class R | $ | 604,074,702 | $ | — |
| Class Y | $ | 8,845,206 | $ | 10,491 |
| Class Z | $ | — | $ | 49,027,403 |
| Class Z-2 | $ | 329,208,247 | $ | — |
| |
| SHARES OF BENEFICIAL INTEREST OUTSTANDING — NOTE 6: | | | |
| Class A | | — | | 774,807 |
| Class C | | — | | 630,684 |
| Class I | | 79,361,867 | | 779,178 |
| Class R | | 22,156,262 | | — |
| Class Y | | 293,789 | | 372 |
| Class Z | | — | | 1,740,436 |
| Class Z-2 | | 10,920,791 | | — |
| |
| NET ASSET VALUE PER SHARE: | | | | |
| Class A — Net Asset Value Per Share Class A | $ | — | $ | 27.73 |
| Class A — Offering Price Per Share | | | | |
| (includes a 5.25% sales charge) | $ | — | $ | 29.27 |
| Class C — Net Asset Value Per Share Class C | $ | — | $ | 26.84 |
| Class I — Net Asset Value Per Share Class I | $ | 30.09 | $ | 27.86 |
| Class R — Net Asset Value Per Share Class R | $ | 27.26 | $ | — |
| Class Y — Net Asset Value Per Share Class Y | $ | 30.11 | $ | 28.18 |
| Class Z — Net Asset Value Per Share Class Z | $ | — | $ | 28.17 |
| Class Z-2 — Net Asset Value Per Share Class Z-2 | $ | 30.15 | $ | — |
| See Notes to Financial Statements. | | | | |
- 36 -
THE ALGER INSTITUTIONAL FUNDS
Statement of Assets and Liabilities April 30, 2017 (Unaudited) (Continued)
| | | | | | |
| | | | | | Alger Small Cap | |
| | Alger Mid Cap Growth | | Growth Institutional | |
| | Institutional Fund | | | Fund | |
| |
| ASSETS: | | | | | | |
| Investments in securities, at value (Identified cost below)* | | | | | | |
| see accompanying schedules of investments | $ | 92,597,806 | | $ | 176,584,688 | |
| Investments in affiliated securities, at value (Identified cost | | | | | | |
| below)** see accompanying schedules of investments | | 1,795,256 | | | 1,992,817 | |
| Cash and cash equivalents | | 4,808,667 | | | 2,089,795 | |
| Foreign cash † | | 16 | | | 33 | |
| Receivable for investment securities sold | | 2,550,465 | | | 399,108 | |
| Receivable for shares of beneficial interest sold | | 110,719 | | | 100,736 | |
| Dividends and interest receivable | | 27,150 | | | 6,377 | |
| Receivable from Investment Manager | | 670 | | | 1,291 | |
| Receivable for escrow*** | | 314,658 | | | 393,248 | |
| Prepaid expenses | | 30,289 | | | 62,682 | |
| Total Assets | | 102,235,696 | | | 181,630,775 | |
| |
| LIABILITIES: | | | | | | |
| Payable for investment securities purchased | | 1,434,615 | | | 166,344 | |
| Payable for shares of beneficial interest redeemed | | 1,482,676 | | | 894,549 | |
| Accrued investment advisory fees | | 61,453 | | | 118,978 | |
| Accrued transfer agent fees | | 45,684 | | | 88,934 | |
| Accrued distribution fees | | 5,426 | | | 4,685 | |
| Accrued administrative fees | | 2,224 | | | 4,039 | |
| Accrued shareholder servicing fees | | 19,272 | | | 26,127 | |
| Accrued shareholder administrative fees | | 809 | | | 1,469 | |
| Accrued other expenses | | 41,124 | | | 78,083 | |
| Total Liabilities | | 3,093,283 | | | 1,383,208 | |
| NET ASSETS | $ | 99,142,413 | | $ | 180,247,567 | |
| |
| NET ASSETS CONSIST OF: | | | | | | |
| Paid in capital (par value of $.001 per share) | | 363,165,843 | | | 140,656,089 | |
| Undistributed net investment income (accumulated loss) | | (663,802 | ) | | (1,869,817 | ) |
| Undistributed net realized gain (accumulated realized loss) | | (276,027,773 | ) | | 1,243,849 | |
| Net unrealized appreciation on investments | | 12,668,145 | | | 40,217,446 | |
| NET ASSETS | $ | 99,142,413 | | $ | 180,247,567 | |
| * Identified cost | $ | 80,820,769 | | $ | 137,770,118 | |
| ** Identified cost | $ | 1,141,403 | | $ | 885,409 | |
| *** Identified cost escrow receivable | $ | 77,403 | | $ | 97,779 | |
| † Cost of foreign cash | $ | 16 | | $ | 33 | |
| See Notes to Financial Statements. | | | | | | |
- 37 -
THE ALGER INSTITUTIONAL FUNDS
Statement of Assets and Liabilities April 30, 2017 (Unaudited) (Continued)
| | | | |
| | | | | Alger Small Cap |
| | Alger Mid Cap Growth | Growth Institutional |
| | Institutional Fund | | Fund |
| |
| NET ASSETS BY CLASS: | | | | |
| Class I | $ | 81,203,062 | $ | 116,722,153 |
| Class R | $ | 12,913,616 | $ | 11,262,669 |
| Class Z-2 | $ | 5,025,735 | $ | 52,262,745 |
| |
| SHARES OF BENEFICIAL INTEREST OUTSTANDING — NOTE 6: | | | |
| Class I | | 3,195,306 | | 6,558,898 |
| Class R | | 551,256 | | 742,865 |
| Class Z-2 | | 197,507 | | 2,929,779 |
| |
| NET ASSET VALUE PER SHARE: | | | | |
| Class I — Net Asset Value Per Share Class I | $ | 25.41 | $ | 17.80 |
| Class R — Net Asset Value Per Share Class R | $ | 23.43 | $ | 15.16 |
| Class Z-2 — Net Asset Value Per Share Class Z-2 | $ | 25.45 | $ | 17.84 |
| See Notes to Financial Statements. | | | | |
- 38 -
THE ALGER INSTITUTIONAL FUNDS
Statement of Operations For the six months ended April 30, 2017 (Unaudited)
| | | | | | | |
| | | | Alger Capital | | | Alger Capital | |
| | | | Appreciation | | Appreciation Focus | |
| | | Institutional Fund | | | Fund | |
| |
| INCOME: | | | | | | | |
| Dividends (net of foreign withholding taxes*) | $ | 19,722,479 | | $ | 476,840 | |
| Interest | | | 15,552 | | | 4,847 | |
| Total Income | | | 19,738,031 | | | 481,687 | |
| |
| EXPENSES: | | | | | | | |
| Advisory fees — Note 3(a) | | | 12,335,731 | | | 223,723 | |
| Distribution fees — Note 3(c) | | | | | | | |
| Class A | | | — | | | 25,430 | |
| Class C | | | — | | | 74,130 | |
| Class R | | | 1,466,590 | | | — | |
| Shareholder servicing fees — Note 3(k) | | | 3,898,300 | | | 24,817 | |
| Shareholder administrative fees — Note 3(f) | | | 166,751 | | | 5,210 | |
| Administration fees — Note 3(b) | | | 458,565 | | | 11,187 | |
| Custodian fees | | | 93,404 | | | 17,847 | |
| Interest expenses | | | 620 | | | 239 | |
| Transfer agent fees and expenses — Note 3(f) | | | 968,906 | | | 25,412 | |
| Printing fees | | | 130,160 | | | 5,727 | |
| Professional fees | | | 100,390 | | | 22,148 | |
| Registration fees | | | 50,487 | | | 29,526 | |
| Trustee fees — Note 3(g) | | | 73,073 | | | 1,716 | |
| Fund accounting fees | | | 214,126 | | | 7,802 | |
| Miscellaneous | | | 94,701 | | | 7,103 | |
| Total Expenses | | | 20,051,804 | | | 482,017 | |
| Less, expense reimbursements/waivers — Note 3(a) | | | (2,312 | ) | | (2,022 | ) |
| Net Expenses | | | 20,049,492 | | | 479,995 | |
| NET INVESTMENT INCOME (LOSS) | | | (311,461 | ) | | 1,692 | |
| |
| REALIZED AND UNREALIZED GAIN (LOSS) ON INVESTMENTS AND FOREIGN CURRENCY: | |
| Net realized gain on investments | | | 159,088,626 | | | 2,921,487 | |
| Net realized gain on foreign currency transactions | | | 37 | | | — | |
| Net change in unrealized appreciation on investments, and | | | | | | | |
| foreign currency | | | 295,111,132 | | | 9,371,545 | |
| Net realized and unrealized gain on investments and foreign | | | | | | | |
| currency | | | 454,199,795 | | | 12,293,032 | |
| NET INCREASE IN NET ASSETS RESULTING FROM | | | | | | | |
| OPERATIONS | $ | 453,888,334 | | $ | 12,294,724 | |
| * Foreign withholding taxes | $ | (68,292 | ) | $ | — | |
| See Notes to Financial Statements. | | | | | | | |
- 39 -
THE ALGER INSTITUTIONAL FUNDS
Statement of Operations For the six months ended April 30, 2017 (Unaudited) (Continued)
| | | | | | |
| | | | | | Alger Small Cap | |
| | Alger Mid Cap Growth | | Growth Institutional | |
| | Institutional Fund | | | Fund | |
| |
| INCOME: | | | | | | |
| Dividends (net of foreign withholding taxes*) | $ | 394,546 | | $ | 702,718 | |
| Interest | | 4,515 | | | 4,248 | |
| Total Income | | 399,061 | | | 706,966 | |
| |
| EXPENSES: | | | | | | |
| Advisory fees — Note 3(a) | | 367,225 | | | 743,675 | |
| Distribution fees — Note 3(c) | | | | | | |
| Class R | | 32,662 | | | 31,364 | |
| Shareholder servicing fees — Note 3(k) | | 116,547 | | | 165,777 | |
| Shareholder administrative fees — Note 3(f) | | 4,832 | | | 9,181 | |
| Administration fees — Note 3(b) | | 13,288 | | | 25,248 | |
| Custodian fees | | 20,945 | | | 14,284 | |
| Interest expenses | | 371 | | | 1,508 | |
| Transfer agent fees and expenses — Note 3(f) | | 37,566 | | | 52,611 | |
| Printing fees | | 9,051 | | | 20,815 | |
| Professional fees | | 21,787 | | | 32,365 | |
| Registration fees | | 2,145 | | | 43,424 | |
| Trustee fees — Note 3(g) | | 2,089 | | | 4,028 | |
| Fund accounting fees | | 7,662 | | | 13,072 | |
| Miscellaneous | | 15,631 | | | 17,790 | |
| Total Expenses | | 651,801 | | | 1,175,142 | |
| Less, expense reimbursements/waivers — Note 3(a) | | (3,593 | ) | | (12,695 | ) |
| Net Expenses | | 648,208 | | | 1,162,447 | |
| NET INVESTMENT LOSS | | (249,147 | ) | | (455,481 | ) |
| |
| REALIZED AND UNREALIZED GAIN (LOSS) ON INVESTMENTS, ESCROW RECEIVABLE AND FOREIGN | |
| CURRENCY: | | | | | | |
| Net realized gain on investments | | 5,160,562 | | | 12,015,552 | |
| Net realized gain on foreign currency transactions | | — | | | 2 | |
| Net change in unrealized appreciation on investments, escrow | | | | | | |
| receivable and foreign currency | | 10,842,269 | | | 22,307,132 | |
| Net realized and unrealized gain on investments, escrow | | | | | | |
| receivable and foreign currency | | 16,002,831 | | | 34,322,686 | |
| NET INCREASE IN NET ASSETS RESULTING FROM | | | | | | |
| OPERATIONS | $ | 15,753,684 | | $ | 33,867,205 | |
| * Foreign withholding taxes | $ | 192 | | $ | — | |
| See Notes to Financial Statements. | | | | | | |
- 40 -
THE ALGER INSTITUTIONAL FUNDS
Statements of Changes in Net Assets (Unaudited)
| | | | | | | |
| | Alger Capital Appreciation Institutional Fund | |
| | | | For the | | | For the | |
| | | | Six Months Ended | | | Year Ended | |
| | | | April 30, 2017 | | | October 31, 2016 | |
| |
| Net investment loss | $ | (311,461 | ) | $ | (201,055 | ) |
| Net realized gain on investments and foreign currency | | | 159,088,663 | | | 37,343,440 | |
| Net change in unrealized appreciation (depreciation) on | | | | | | | |
| investments and foreign currency | | | 295,111,132 | | | (44,333,940 | ) |
| Net increase (decrease) in net assets resulting from operations | | | 453,888,334 | | | (7,191,555 | ) |
| |
| Dividends and distributions to shareholders from: | | | | | | | |
| Net realized gains: | | | | | | | |
| Class I | | | (19,820,400 | ) | | (229,560,756 | ) |
| Class R | | | (4,624,888 | ) | | (50,476,174 | ) |
| Class Z-2 | | | (1,189,368 | ) | | — | |
| Total dividends and distributions to shareholders | | | (25,634,656 | ) | | (280,036,930 | ) |
| |
| Increase (decrease) from shares of beneficial interest transactions: | | | | | | |
| Class I | | | (897,370,698 | ) | | 2,523,291 | |
| Class R | | | (49,026,814 | ) | | (22,254,736 | ) |
| Class Y | | | 8,616,833 | | | — | |
| Class Z-2 | | | 293,842,953 | | | 2,241,803 | |
| Net decrease from shares of beneficial interest transactions | | | | | | | |
| — Note 6(a) | | | (643,937,726 | ) | | (17,489,642 | ) |
| Total decrease | | | (215,684,048 | ) | | (304,718,127 | ) |
| |
| Net Assets: | | | | | | | |
| Beginning of period | | | 3,546,011,572 | | | 3,850,729,699 | |
| END OF PERIOD | $ | 3,330,327,524 | | $ | 3,546,011,572 | |
| Undistributed net investment income (accumulated loss) | $ | (2,307,051 | ) | $ | (1,995,590 | ) |
| See Notes to Financial Statements. | | | | | | | |
- 41 -
THE ALGER INSTITUTIONAL FUNDS
Statements of Changes in Net Assets (Unaudited) (Continued)
| | | | | | | |
| | | | Alger Capital Appreciation Focus Fund | |
| | | | For the | | | For the | |
| | | | Six Months Ended | | | Year Ended | |
| | | | April 30, 2017 | | | October 31, 2016 | |
| |
| Net investment income (loss) | $ | 1,692 | | $ | (126,586 | ) |
| Net realized gain (loss) on investments and foreign currency | | | 2,921,487 | | | (2,931,971 | ) |
| Net change in unrealized appreciation on investments and | | | | | | | |
| foreign currency | | | 9,371,545 | | | 3,016,621 | |
| Net increase (decrease) in net assets resulting from operations | | | 12,294,724 | | | (41,936 | ) |
| |
| Dividends and distributions to shareholders from: | | | | | | | |
| Net realized gains: | | | | | | | |
| Class A | | | — | | | (316,452 | ) |
| Class C | | | — | | | (87,313 | ) |
| Class I | | | — | | | (274,831 | ) |
| Class Z | | | — | | | (120,412 | ) |
| Total dividends and distributions to shareholders | | | — | | | (799,008 | ) |
| |
| Increase (decrease) from shares of beneficial interest transactions: | | | | | | |
| Class A | | | (7,009,692 | ) | | 1,889,920 | |
| Class C | | | 2,709,759 | | | 5,527,847 | |
| Class I | | | (3,792,738 | ) | | (1,671,101 | ) |
| Class Y | | | 10,000 | | | — | |
| Class Z | | | 29,179,051 | | | 12,186,549 | |
| Net increase from shares of beneficial interest transactions — | | | | | | | |
| Note 6(a) | | | 21,096,380 | | | 17,933,215 | |
| Total increase | | | 33,391,104 | | | 17,092,271 | |
| |
| Net Assets: | | | | | | | |
| Beginning of period | | | 75,765,050 | | | 58,672,779 | |
| END OF PERIOD | $ | 109,156,154 | | $ | 75,765,050 | |
| Undistributed net investment income (accumulated loss) | $ | (199,892 | ) | $ | (201,584 | ) |
| See Notes to Financial Statements. | | | | | | | |
- 42 -
THE ALGER INSTITUTIONAL FUNDS
Statements of Changes in Net Assets (Unaudited) (Continued)
| | | | | | | | |
| | | Alger Mid Cap Growth Institutional Fund | |
| | | | For the | | | | For the | |
| | | | Six Months Ended | | | | Year Ended | |
| | | | April 30, 2017 | | | | October 31, 2016 | |
| |
| Net investment loss | $ | (249,147 | ) | $ | (358,218 | ) |
| Net realized gain (loss) on investments and foreign currency | | | 5,160,562 | | | | (1,167,951 | ) |
| Net change in unrealized appreciation (depreciation) on | | | | | | | | |
| investments, escrow receivable and foreign currency | | | 10,842,269 | | | | (3,985,970 | ) |
| Net increase (decrease) in net assets resulting from operations | | | 15,753,684 | | | | (5,512,139 | ) |
| |
| Increase (decrease) from shares of beneficial interest transactions: | | | | | | | |
| Class I | | | (13,734,423 | ) | | | (28,525,268 | ) |
| Class R | | | (2,271,317 | ) | | | (3,868,604 | ) |
| Class Z-2 | | | 4,406,927 | | | | 115,000 | |
| Net decrease from shares of beneficial interest transactions | | | | | | | | |
| — Note 6(a) | | | (11,598,813 | ) | | | (32,278,872 | ) |
| Total increase (decrease) | | | 4,154,871 | | | | (37,791,011 | ) |
| |
| Net Assets: | | | | | | | | |
| Beginning of period | | | 94,987,542 | | | | 132,778,553 | |
| END OF PERIOD | $ | 99,142,413 | | $ | 94,987,542 | |
| Undistributed net investment income (accumulated loss) | $ | (663,802 | ) | $ | (414,655 | ) |
| See Notes to Financial Statements. | | | | | | | | |
- 43 -
THE ALGER INSTITUTIONAL FUNDS
Statements of Changes in Net Assets (Unaudited) (Continued)
| | | | | | | |
| | | Alger Small Cap Growth Institutional Fund | |
| | | | For the | | | For the | |
| | | | Six Months Ended | | | Year Ended | |
| | | | April 30, 2017 | | | October 31, 2016 | |
| |
| Net investment loss | $ | (455,481 | ) | $ | (1,823,495 | ) |
| Net realized gain (loss) on investments and foreign currency | | | 12,015,554 | | | (4,997,816 | ) |
| Net change in unrealized appreciation (depreciation) on | | | | | | | |
| investments, escrow receivable and foreign currency | | | 22,307,132 | | | (11,918,205 | ) |
| Net increase (decrease) in net assets resulting from operations | | | 33,867,205 | | | (18,739,516 | ) |
| |
| Dividends and distributions to shareholders from: | | | | | | | |
| Net realized gains: | | | | | | | |
| Class I | | | — | | | (112,158,310 | ) |
| Class R | | | — | | | (6,331,284 | ) |
| Total dividends and distributions to shareholders | | | — | | | (118,489,594 | ) |
| |
| Increase (decrease) from shares of beneficial interest transactions: | | | | | | |
| Class I | | | (35,158,480 | ) | | (100,429,539 | ) |
| Class R | | | (3,681,052 | ) | | 1,229,629 | |
| Class Z-2 | | | 1,569,492 | | | 44,313,480 | |
| Net decrease from shares of beneficial interest transactions | | | | | | | |
| — Note 6(a) | | | (37,270,040 | ) | | (54,886,430 | ) |
| Total decrease | | | (3,402,835 | ) | | (192,115,540 | ) |
| |
| Net Assets: | | | | | | | |
| Beginning of period | | | 183,650,402 | | | 375,765,942 | |
| END OF PERIOD | $ | 180,247,567 | | $ | 183,650,402 | |
| Undistributed net investment income (accumulated loss) | $ | (1,869,817 | ) | $ | (1,414,336 | ) |
| See Notes to Financial Statements. | | | | | | | |
- 44 -
THE ALGER INSTITUTIONAL FUNDS
Financial Highlights for a share outstanding throughout the period (Unaudited)
| | | | | | | | | | | | | | | | | | | | | | | | | | | |
| Alger Capital Appreciation | | | | | | | | | | | | | | | | | | | | | | | | | | | |
| Institutional Fund | | | | | | | | | | | | Class I | | | | | | | | | | | | |
| | | Six months | | | | | | | | | | | | | | | | | | | | | | | | |
| | | | ended | | | Year ended | | | Year ended | | | Year ended | | | Year ended | | | Year ended | |
| | | 4/30/2017 | (i) | | 10/31/2016 | | | 10/31/2015 | | | 10/31/2014 | | | 10/31/2013 | | | 10/31/2012 | |
| Net asset value, beginning of period | | $ | 26.44 | | | $ | 28.48 | | | $ | | 29.34 | | | $ | | 28.21 | | | $ | | 22.85 | | | $ | 20.88 | |
| INCOME FROM INVESTMENT | | | | | | | | | | | | | | | | | | | | | | | | | | | |
| OPERATIONS: | | | | | | | | | | | | | | | | | | | | | | | | | | | |
| Net investment income (loss)(ii) | | | 0.01 | | | | 0.02 | | | | | (0.02 | ) | | | | (0.02 | ) | | | | 0.16 | | | | 0.09 | |
| Net realized and unrealized gain (loss) | | | | | | | | | | | | | | | | | | | | | | | | | | | |
| on investments | | | 3.83 | | | | (0.02 | ) | | | | 2.46 | | | | | 4.57 | | | | | 6.21 | | | | 2.64 | |
| Total from investment operations | | | 3.84 | | | | – | | | | | 2.44 | | | | | 4.55 | | | | | 6.37 | | | | 2.73 | |
| Dividends from net investment income | – | | | | – | | | | | – | | | | | (0.01 | ) | | | | (0.17 | ) | | | – | |
| Distributions from net realized gains | | | (0.19 | ) | | | (2.04 | ) | | | | (3.30 | ) | | | | (3.41 | ) | | | | (0.84 | ) | | | (0.76 | ) |
| Net asset value, end of period | | $ | 30.09 | | | $ | 26.44 | | | $ | | 28.48 | | | $ | | 29.34 | | | $ | | 28.21 | | | $ | 22.85 | |
| Total return | | | 14.67 | % | | | (0.08 | )% | | | | 8.96 | % | | | | 17.63 | % | | | | 29.02 | % | | | 13.70 | % |
| RATIOS/SUPPLEMENTAL DATA: | | | | | | | | | | | | | | | | | | | | | | | | | | | |
| Net assets, end of period (000's | | | | | | | | | | | | | | | | | | | | | | | | | | | |
| omitted) | $ | 2,388,200 | | $ | 2,965,503 | | $ | 3,194,261 | | $ | 2,555,737 | | $ | 1,958,405 | | $ | 1,470,078 | |
| Ratio of gross expenses to average | | | | | | | | | | | | | | | | | | | | | | | | | | | |
| net assets | | | 1.13 | % | | | 1.12 | % | | | | 1.12 | % | | | | 1.16 | % | | | | 1.19 | % | | | 1.19 | % |
| Ratio of net expenses to average net | | | | | | | | | | | | | | | | | | | | | | | | | | | |
| assets | | | 1.13 | % | | | 1.12 | % | | | | 1.12 | % | | | | 1.16 | % | | | | 1.19 | % | | | 1.19 | % |
| Ratio of net investment income (loss) to | | | | | | | | | | | | | | | | | | | | | | | | | | | |
| average net assets | | | 0.07 | % | | | 0.07 | % | | | | (0.07 | )% | | | | (0.07 | )% | | | | 0.65 | % | | | 0.41 | % |
| | | | | | | | | | | | | | | | | | | | | | | | | | | | |
| Portfolio turnover rate | | | 36.53 | % | | | 94.56 | % | | 136.03%(iii) | | | 136.20 | %(iv) | | | 124.43 | % | | | 137.16 | % |
| See Notes to Financial Statements. | | | | | | | | | | | | | | | | | | | | | | | | | |
(i) Ratios have been annualized; total return and portfolio turnover rate have not been annualized.
(ii) Amount was computed based on average shares outstanding during the period.
(iii) Amount excludes redemption in kind transaction of $294,638,130. Please see note 6 to the financial statements.
(iv) Amount excludes redemption in kind transaction of $71,436,408.
- 45 -
THE ALGER INSTITUTIONAL FUNDS
Financial Highlights for a share outstanding throughout the period (Unaudited)
| | | | | | | | | | | | | | | | | | | | | | | | | | | | | |
| Alger Capital Appreciation | | | | | | | | | | | | | | | | | | | | | | | | | | | | | |
| Institutional Fund | | | | | | | | | | | | | Class R | | | | | | | | | | | |
| | | Six months | | | | | | | | | | | | | | | | | | | | | | | | | | |
| | | | ended | | | Year ended | | | Year ended | | | Year ended | | | Year ended | | | Year ended | |
| | | 4/30/2017 | (i) | | 10/31/2016 | | | 10/31/2015 | | | | | 10/31/2014 | | | 10/31/2013 | | | 10/31/2012 | |
| Net asset value, beginning of period | | $ | 24.03 | | | $ | | 26.19 | | | $ | | 27.35 | | | $ | 26.63 | | | $ | | 21.76 | | | $ | 20.01 | |
| INCOME FROM INVESTMENT | | | | | | | | | | | | | | | | | | | | | | | | | | | | | |
| OPERATIONS: | | | | | | | | | | | | | | | | | | | | | | | | | | | | | |
| Net investment income (loss)(ii) | | | (0.06 | ) | | | | (0.10 | ) | | | | (0.15 | ) | | | | | (0.14 | ) | | | | 0.04 | | | | (0.02 | ) |
| Net realized and unrealized gain (loss) | | | | | | | | | | | | | | | | | | | | | | | | | | | | | |
| on investments | | | 3.48 | | | | | (0.02 | ) | | | | 2.29 | | | | | | 4.27 | | | | | 5.87 | | | | 2.53 | |
| Total from investment operations | | | 3.42 | | | | | (0.12 | ) | | | | 2.14 | | | | | | 4.13 | | | | | 5.91 | | | | 2.51 | |
| Dividends from net investment income | – | | | | | – | | | | | – | | | | | | – | | | | | (0.20 | ) | | | – | |
| Distributions from net realized gains | | | (0.19 | ) | | | | (2.04 | ) | | | | (3.30 | ) | | | | | (3.41 | ) | | | | (0.84 | ) | | | (0.76 | ) |
| Net asset value, end of period | | $ | 27.26 | | | $ | | 24.03 | | | $ | | 26.19 | | | $ | 27.35 | | | $ | | 26.63 | | | $ | 21.76 | |
| Total return | | | 14.39 | % | | | | (0.57 | )% | | | | 8.46 | % | | | | | 17.04 | % | | | | 28.35 | % | | | 13.20 | % |
| RATIOS/SUPPLEMENTAL DATA: | | | | | | | | | | | | | | | | | | | | | | | | | | | | | |
| Net assets, end of period (000's | | | | | | | | | | | | | | | | | | | | | | | | | | | | | |
| omitted) | $ | 604,075 | | $ | 578,297 | | $ | 656,469 | | $ | 529,757 | | $ | 442,449 | | $ | 347,634 | |
| Ratio of gross expenses to average | | | | | | | | | | | | | | | | | | | | | | | | | | | | | |
| net assets | | | 1.63 | % | | | | 1.61 | % | | | | 1.61 | % | | | | | 1.64 | % | | | | 1.69 | % | | | 1.69 | % |
| Ratio of net expenses to average net | | | | | | | | | | | | | | | | | | | | | | | | | | | | | |
| assets | | | 1.63 | % | | | | 1.61 | % | | | | 1.61 | % | | | | | 1.64 | % | | | | 1.69 | % | | | 1.69 | % |
| Ratio of net investment income (loss) to | | | | | | | | | | | | | | | | | | | | | | | | | | | | | |
| average net assets | | | (0.46 | )% | | | | (0.41 | )% | | | | (0.57 | )% | | | | | (0.55 | )% | | | | 0.17 | % | | | (0.09 | )% |
| | | | | | | | | | | | | | | | | | | | | | | | | | | | | | |
| Portfolio turnover rate | | | 36.53 | % | | | | 94.56 | % | | 136.03%(iii) | | | 136.20 | %(iv) | | | | 124.43 | % | | | 137.16 | % |
| See Notes to Financial Statements. | | | | | | | | | | | | | | | | | | | | | | | | | | | |
(i) Ratios have been annualized; total return and portfolio turnover rate have not been annualized.
(ii) Amount was computed based on average shares outstanding during the period.
(iii) Amount excludes redemption in kind transaction of $294,638,130. Please see note 6 to the financial statements.
(iv) Amount excludes redemption in kind transaction of $71,436,408.
- 46 -
THE ALGER INSTITUTIONAL FUNDS
Financial Highlights for a share outstanding throughout the period (Unaudited)
| | | |
| Alger Capital Appreciation | | | |
| Institutional Fund | | Class Y | |
| | From 2/28/2017 | |
| | (commencement | |
| | of operations) to | |
| | 4/30/2017 | (i) |
| Net asset value, beginning of period | $ | 28.85 | |
| INCOME FROM INVESTMENT | | | |
| OPERATIONS: | | | |
| Net investment income(ii) | | – | |
| Net realized and unrealized gain on | | | |
| investments | | 1.26 | |
| Total from investment operations | | 1.26 | |
| Net asset value, end of period | $ | 30.11 | |
| Total return | | 4.33 | % |
| RATIOS/SUPPLEMENTAL DATA: | | | |
| Net assets, end of period (000's | | | |
| omitted) | $ | 8,845 | |
| Ratio of gross expenses to average | | | |
| net assets | | 1.32 | % |
| Ratio of expense reimbursements to | | | |
| average net assets | | (0.57 | )% |
| Ratio of net expenses to average net | | | |
| assets | | 0.75 | % |
| Ratio of net investment income (loss) to | | | |
| average net assets | | (0.09 | )% |
| Portfolio turnover rate | | 36.53 | % |
| See Notes to Financial Statements. | | |
(i) Ratios have been annualized; total return has not been annualized; portfolio turnover is for the six months then ended.
(ii) Amount was computed based on average shares outstanding during the period.
- 47 -
THE ALGER INSTITUTIONAL FUNDS
Financial Highlights for a share outstanding throughout the period (Unaudited)
| | | | | | | | | |
| Alger Capital Appreciation | | | | | | | | | |
| Institutional Fund | | | | Class Z-2 | |
| | | | Six months | | From 10/14/2016 | |
| | | | | ended | | (commencement of operations) to | |
| | | | 4/30/2017 | (i) | | 10/31/2016 | (ii) |
| Net asset value, beginning of period | | $ | 26.44 | | $ | 26.67 | |
| INCOME FROM INVESTMENT | | | | | | | | | |
| OPERATIONS: | | | | | | | | | |
| Net investment income(iii) | | | | 0.02 | | | | 0.01 | |
| Net realized and unrealized gain (loss) | | | | | | | | | |
| on investments | | | | 3.88 | | | | (0.24 | ) |
| Total from investment operations | | | | 3.90 | | | | (0.23 | ) |
| Distributions from net realized gains | | | | (0.19 | ) | | | – | |
| Net asset value, end of period | | $ | 30.15 | | $ | 26.44 | |
| Total return | | | | 14.86 | % | | | (0.86 | )% |
| RATIOS/SUPPLEMENTAL DATA: | | | | | | | | | |
| Net assets, end of period (000's | | | | | | | | | |
| omitted) | $ | 329,208 | | $ | 2,212 | |
| Ratio of gross expenses to average | | | | | | | | | |
| net assets | | | | 0.84 | % | | | 3.11 | % |
| Ratio of expense reimbursements to | | | | | | | | | |
| average net assets | | | | – | | | | (2.16 | )% |
| Ratio of net expenses to average net | | | | | | | | | |
| assets | | | | 0.84 | % | | | 0.95 | % |
| Ratio of net investment income (loss) to | | | | | | | | | |
| average net assets | | | | 0.17 | % | | | 1.29 | % |
| Portfolio turnover rate | | | | 36.53 | % | | | 94.56 | % |
| See Notes to Financial Statements. | | | | | | | |
(i) Ratios have been annualized; total return and portfolio turnover rate have not been annualized.
(ii) Ratios have been annualized; total return has not been annualized; portfolio turnover is for the twelve months then ended.
(iii) Amount was computed based on average shares outstanding during the period.
- 48 -
THE ALGER INSTITUTIONAL FUNDS
Financial Highlights for a share outstanding throughout the period (Unaudited)
| | | | | | | | | | | | | | | | | | | | | |
| Alger Capital Appreciation Focus | | | | | | | | | | | | | | | | | | | | | |
| Fund | | | | | | | | | | | | Class A | | | | | | | | | |
| | | | | | | | | | | | | | | | | | | From 12/31/2012 | |
| | | Six months ended 4/30/2017 (i) | | | | Year ended 10/31/2016 | | | | | Year ended 10/31/2015 | | | | Year ended 10/31/2014 | | | | (commencement of operations) to 10/31/2013 (ii) | |
| Net asset value, beginning of period | | $ | 23.95 | | | $ | 24.13 | | | $ | | 22.01 | | $ | | 18.69 | | $ | | 14.70 | |
| INCOME FROM INVESTMENT | | | | | | | | | | | | | | | | | | | | | |
| OPERATIONS: | | | | | | | | | | | | | | | | | | | | | |
| Net investment income (loss)(iii) | | | 0.01 | | | | (0.03 | ) | | | | (0.02 | ) | | | (0.04 | ) | | | (0.01 | ) |
| Net realized and unrealized gain on | | | | | | | | | | | | | | | | | | | | | |
| investments | | | 3.77 | | | | 0.12 | | | | | 2.14 | | | | 3.36 | | | | 4.00 | |
| Total from investment operations | | | 3.78 | | | | 0.09 | | | | | 2.12 | | | | 3.32 | | | | 3.99 | |
| Distributions from net realized gains | | | – | | | | (0.27 | ) | | | | – | | | | – | | | | – | |
| Net asset value, end of period | | $ | 27.73 | | | $ | 23.95 | | | $ | | 24.13 | | $ | | 22.01 | | $ | | 18.69 | |
| Total return(iv) | | | 15.78 | % | | | 0.36 | % | | | | 9.63 | % | | | 17.76 | % | | | 27.14 | % |
| RATIOS/SUPPLEMENTAL DATA: | | | | | | | | | | | | | | | | | | | | | |
| Net assets, end of period (000's | | | | | | | | | | | | | | | | | | | | | |
| omitted) | $ | 21,486 | | $ | 25,524 | | $ | 23,961 | | $ | | 5,158 | | $ | | 3,496 | |
| Ratio of gross expenses to average | | | | | | | | | | | | | | | | | | | | | |
| net assets | | | 1.12 | % | | | 1.26 | % | | | | 1.48 | % | | | 2.38 | % | | | 2.49 | % |
| Ratio of expense reimbursements to | | | | | | | | | | | | | | | | | | | | | |
| average net assets | | | – | | | | (0.07 | )% | | | | (0.18 | )% | | | (1.08 | )% | | | (1.19 | )% |
| Ratio of net expenses to average net | | | | | | | | | | | | | | | | | | | | | |
| assets | | | 1.12 | % | | | 1.19 | % | | | | 1.30 | % | | | 1.30 | % | | | 1.30 | % |
| Ratio of net investment income (loss) to | | | | | | | | | | | | | | | | | | | | | |
| average net assets | | | 0.11 | % | | | (0.13 | )% | | | | (0.08 | )% | | | (0.19 | )% | | | (0.09 | )% |
| Portfolio turnover rate | | | 61.65 | % | | | 127.40 | % | | | | 182.58 | % | | | 153.69 | % | | | 166.61 | % |
| See Notes to Financial Statements. | | | | | | | | | | | | | | | | | | | |
(i) Ratios have been annualized; total return and portfolio turnover rate have not been annualized.
(ii) Ratios have been annualized; total return has not been annualized; portfolio turnover is for the twelve months then ended.
(iii) Amount was computed based on average shares outstanding during the period.
(iv) Does not reflect the effect of sales charges, if applicable.
- 49 -
THE ALGER INSTITUTIONAL FUNDS
Financial Highlights for a share outstanding throughout the period (Unaudited)
| | | | | | | | | | | | | | | | | | | | | |
| Alger Capital Appreciation Focus | | | | | | | | | | | | | | | | | | | | | |
| Fund | | | | | | | | | | | | Class C | | | | | | | | | |
| | | | | | | | | | | | | | | | | | | From 12/31/2012 | |
| | | | Six months ended 4/30/2017 (i) | | | | | Year ended 10/31/2016 | | | | Year ended 10/31/2015 | | | | Year ended 10/31/2014 | | | | (commencement of operations) to 10/31/2013 (ii) | |
| Net asset value, beginning of period | | $ | 23.27 | | | $ | | 23.62 | | $ | | 21.71 | | $ | | 18.58 | | $ | | 14.70 | |
| INCOME FROM INVESTMENT | | | | | | | | | | | | | | | | | | | | | |
| OPERATIONS: | | | | | | | | | | | | | | | | | | | | | |
| Net investment loss(iii) | | | (0.09 | ) | | | | (0.20 | ) | | | (0.20 | ) | | | (0.19 | ) | | | (0.11 | ) |
| Net realized and unrealized gain on | | | | | | | | | | | | | | | | | | | | | |
| investments | | | 3.66 | | | | | 0.12 | | | | 2.11 | | | | 3.32 | | | | 3.99 | |
| Total from investment operations | | | 3.57 | | | | | (0.08 | ) | | | 1.91 | | | | 3.13 | | | | 3.88 | |
| Distributions from net realized gains | | | – | | | | | (0.27 | ) | | | – | | | | – | | | | – | |
| Net asset value, end of period | | $ | 26.84 | | | $ | | 23.27 | | $ | | 23.62 | | $ | | 21.71 | | $ | | 18.58 | |
| Total return(iv) | | | 15.34 | % | | | | (0.36 | )% | | | 8.80 | % | | | 16.85 | % | | | 26.39 | % |
| RATIOS/SUPPLEMENTAL DATA: | | | | | | | | | | | | | | | | | | | | | |
| Net assets, end of period (000's | | | | | | | | | | | | | | | | | | | | | |
| omitted) | $ | 16,928 | | $ | 12,021 | | $ | | 6,542 | | $ | | 2,635 | | $ | | 1,913 | |
| Ratio of gross expenses to average | | | | | | | | | | | | | | | | | | | | | |
| net assets | | | 1.88 | % | | | | 2.03 | % | | | 2.25 | % | | | 3.14 | % | | | 3.27 | % |
| Ratio of expense reimbursements to | | | | | | | | | | | | | | | | | | | | | |
| average net assets | | | – | | | | | (0.10 | )% | | | (0.20 | )% | | | (1.09 | )% | | | (1.22 | )% |
| Ratio of net expenses to average net | | | | | | | | | | | | | | | | | | | | | |
| assets | | | 1.88 | % | | | | 1.93 | % | | | 2.05 | % | | | 2.05 | % | | | 2.05 | % |
| Ratio of net investment income (loss) to | | | | | | | | | | | | | | | | | | | | | |
| average net assets | | | (0.72 | )% | | | | (0.87 | )% | | | (0.85 | )% | | | (0.94 | )% | | | (0.83 | )% |
| Portfolio turnover rate | | | 61.65 | % | | | | 127.40 | % | | | 182.58 | % | | | 153.69 | % | | | 166.61 | % |
| See Notes to Financial Statements. | | | | | | | | | | | | | | | | | | | |
(i) Ratios have been annualized; total return and portfolio turnover rate have not been annualized.
(ii) Ratios have been annualized; total return has not been annualized; portfolio turnover is for the twelve months then ended.
(iii) Amount was computed based on average shares outstanding during the period.
(iv) Does not reflect the effect of sales charges, if applicable.
- 50 -
THE ALGER INSTITUTIONAL FUNDS
Financial Highlights for a share outstanding throughout the period (Unaudited)
| | | | | | | | | | | | | | | | | | | | | | | | | | | |
| Alger Capital Appreciation Focus | | | | | | | | | | | | | | | | | | | | | | | | | | | |
| Fund | | | | | | | | | | | | Class I | | | | | | | | | | |
| | | Six months | | | | | | | | | | | | | | | | | | | | | | | | |
| | | | ended | | | Year ended | | | Year ended | | | Year ended | | Year ended | | | Year ended | |
| | | 4/30/2017 | (i) | | 10/31/2016 | | | 10/31/2015 | | | 10/31/2014 | | 10/31/2013 | | | 10/31/2012 | |
| Net asset value, beginning of period | | $ | 24.06 | | | $ | 24.23 | | | $ | | 22.07 | | | $ | | 18.72 | | $ | | 14.53 | | | $ | | 13.75 | |
| INCOME FROM INVESTMENT | | | | | | | | | | | | | | | | | | | | | | | | | | | |
| OPERATIONS: | | | | | | | | | | | | | | | | | | | | | | | | | | | |
| Net investment income (loss)(ii) | | | 0.01 | | | | (0.02 | ) | | | | 0.01 | | | | | (0.01 | ) | | | 0.15 | | | | | (0.03 | ) |
| Net realized and unrealized gain on | | | | | | | | | | | | | | | | | | | | | | | | | | | |
| investments | | | 3.79 | | | | 0.12 | | | | | 2.15 | | | | | 3.36 | | | | 4.04 | | | | | 0.81 | |
| Total from investment operations | | | 3.80 | | | | 0.10 | | | | | 2.16 | | | | | 3.35 | | | | 4.19 | | | | | 0.78 | |
| Distributions from net realized gains | | | – | | | | (0.27 | ) | | | | – | | | | | – | | | | – | | | | | – | |
| Net asset value, end of period | | $ | 27.86 | | | $ | 24.06 | | | $ | | 24.23 | | | $ | | 22.07 | | $ | | 18.72 | | | $ | | 14.53 | |
| Total return(iii) | | | 15.79 | % | | | 0.40 | % | | | | 9.79 | % | | | | 17.90 | % | | | 28.84 | % | | | | 5.70 | % |
| RATIOS/SUPPLEMENTAL DATA: | | | | | | | | | | | | | | | | | | | | | | | | | | | |
| Net assets, end of period (000's | | | | | | | | | | | | | | | | | | | | | | | | | | | |
| omitted) | $ | 21,705 | | $ | 22,527 | | $ | 24,487 | | $ | 12,897 | | $ | | 8,684 | | $ | 15,101 | |
| Ratio of gross expenses to average | | | | | | | | | | | | | | | | | | | | | | | | | | | |
| net assets | | | 1.15 | % | | | 1.30 | % | | | | 1.49 | % | | | | 2.36 | % | | | 2.32 | % | | | | 1.83 | % |
| Ratio of expense reimbursements to | | | | | | | | | | | | | | | | | | | | | | | | | | | |
| average net assets | | | – | | | | (0.15 | )% | | | | (0.34 | )% | | | | (1.21 | )% | | | (0.94 | )% | | | | – | |
| Ratio of net expenses to average net | | | | | | | | | | | | | | | | | | | | | | | | | | | |
| assets | | | 1.15 | % | | | 1.15 | % | | | | 1.15 | % | | | | 1.15 | % | | | 1.38 | % | | | | 1.83 | % |
| Ratio of net investment income (loss) to | | | | | | | | | | | | | | | | | | | | | | | | | | | |
| average net assets | | | 0.06 | % | | | (0.09 | )% | | | | 0.03 | % | | | | (0.04 | )% | | | 0.95 | % | | | | (0.22 | )% |
| Portfolio turnover rate | | | 61.65 | % | | | 127.40 | % | | | | 182.58 | % | | | | 153.69 | % | | | 166.61 | % | | | | 153.72 | % |
| See Notes to Financial Statements. | | | | | | | | | | | | | | | | | | | | | | | | | |
(i) Ratios have been annualized; total return and portfolio turnover rate have not been annualized.
(ii) Amount was computed based on average shares outstanding during the period.
(iii) Does not reflect the effect of sales charges, if applicable.
- 51 -
THE ALGER INSTITUTIONAL FUNDS
Financial Highlights for a share outstanding throughout the period (Unaudited)
| | | | |
| Alger Capital Appreciation Focus | | | | |
| Fund | | | Class Y | |
| | | From 2/28/2017 | |
| | | (commencement | |
| | | of operations) to | |
| | | 4/30/2017 | (i) |
| Net asset value, beginning of period | | $ | 26.86 | |
| INCOME FROM INVESTMENT | | | | |
| OPERATIONS: | | | | |
| Net investment income(ii) | | | 0.02 | |
| Net realized and unrealized gain on | | | | |
| investments | | | 1.30 | |
| Total from investment operations | | | 1.32 | |
| Net asset value, end of period | | $ | 28.18 | |
| Total return(iii) | | | 4.91 | % |
| RATIOS/SUPPLEMENTAL DATA: | | | | |
| Net assets, end of period (000's | | | | |
| omitted) | | $ | 10 | |
| Ratio of gross expenses to average | | | | |
| net assets | | | 119.59 | % |
| Ratio of expense reimbursements to | | | | |
| average net assets | | (118.94 | )% |
| Ratio of net expenses to average net | | | | |
| assets | | | 0.65 | % |
| Ratio of net investment income (loss) to | | | | |
| average net assets | | | 0.40 | % |
| Portfolio turnover rate | | | 61.65 | % |
| See Notes to Financial Statements. | | |
(i) Ratios have been annualized; total return has not been annualized; portfolio turnover is for the six months then ended.
(ii) Amount was computed based on average shares outstanding during the period.
(iii) Does not reflect the effect of sales charges, if applicable.
- 52 -
THE ALGER INSTITUTIONAL FUNDS
Financial Highlights for a share outstanding throughout the period (Unaudited)
| | | | | | | | | | | | | | | | | | | | |
| Alger Capital Appreciation Focus | | | | | | | | | | | | | | | | | | | | |
| Fund | | | | | | | | | | | Class Z | | | | | | | | | |
| | | | | | | | | | | | | | | | | | From 12/31/2012 | |
| | | | Six months ended 4/30/2017 (i) | | | | Year ended 10/31/2016 | | | | Year ended 10/31/2015 | | | | Year ended 10/31/2014 | | | | (commencement of operations) to 10/31/2013 (ii) | |
| Net asset value, beginning of period | | $ | 24.30 | | | $ | 24.41 | | $ | | 22.17 | | $ | | 18.75 | | $ | | 14.70 | |
| INCOME FROM INVESTMENT | | | | | | | | | | | | | | | | | | | | |
| OPERATIONS: | | | | | | | | | | | | | | | | | | | | |
| Net investment income(iii) | | | 0.04 | | | | 0.03 | | | | 0.07 | | | | 0.05 | | | | 0.04 | |
| Net realized and unrealized gain on | | | | | | | | | | | | | | | | | | | | |
| investments | | | 3.83 | | | | 0.13 | | | | 2.17 | | | | 3.37 | | | | 4.01 | |
| Total from investment operations | | | 3.87 | | | | 0.16 | | | | 2.24 | | | | 3.42 | | | | 4.05 | |
| Distributions from net realized gains | | | – | | | | (0.27 | ) | | | – | | | | – | | | | – | |
| Net asset value, end of period | | $ | 28.17 | | | $ | 24.30 | | $ | | 24.41 | | $ | | 22.17 | | $ | | 18.75 | |
| Total return(iv) | | | 15.93 | % | | | 0.64 | % | | | 10.10 | % | | | 18.24 | % | | | 27.55 | % |
| RATIOS/SUPPLEMENTAL DATA: | | | | | | | | | | | | | | | | | | | | |
| Net assets, end of period (000's | | | | | | | | | | | | | | | | | | | | |
| omitted) | $ | 49,027 | | $ | 15,693 | | $ | | 3,683 | | $ | | 1,262 | | $ | | 128 | |
| Ratio of gross expenses to average | | | | | | | | | | | | | | | | | | | | |
| net assets | | | 0.86 | % | | | 1.05 | % | | | 1.50 | % | | | 4.78 | % | | | 10.11 | % |
| Ratio of expense reimbursements to | | | | | | | | | | | | | | | | | | | | |
| average net assets | | | – | | | | (0.12 | )% | | | (0.61 | )% | | | (3.89 | )% | | | (9.22 | )% |
| Ratio of net expenses to average net | | | | | | | | | | | | | | | | | | | | |
| assets | | | 0.86 | % | | | 0.93 | % | | | 0.89 | % | | | 0.89 | % | | | 0.89 | % |
| Ratio of net investment income (loss) to | | | | | | | | | | | | | | | | | | | | |
| average net assets | | | 0.28 | % | | | 0.12 | % | | | 0.30 | % | | | 0.23 | % | | | 0.32 | % |
| Portfolio turnover rate | | | 61.65 | % | | | 127.40 | % | | | 182.58 | % | | | 153.69 | % | | | 166.61 | % |
| See Notes to Financial Statements. | | | | | | | | | | | | | | | | | | |
(i) Ratios have been annualized; total return and portfolio turnover rate have not been annualized.
(ii) Ratios have been annualized; total return has not been annualized; portfolio turnover is for the twelve months then ended.
(iii) Amount was computed based on average shares outstanding during the period.
(iv) Does not reflect the effect of sales charges, if applicable.
- 53 -
THE ALGER INSTITUTIONAL FUNDS
Financial Highlights for a share outstanding throughout the period (Unaudited)
| | | | | | | | | | | | | | | | | | | | | | | | | | | | | |
| Alger Mid Cap Growth Institutional | | | | | | | | | | | | | | | | | | | | | | | | | | | | | |
| Fund | | | | | | | | | | | | | Class I | | | | | | | | | | | |
| | | Six months | | | | | | | | | | | | | | | | | | | | | | | | | | |
| | | | ended | | | Year ended | | | Year ended | | | Year ended | | | Year ended | | | Year ended | |
| | | 4/30/2017 | (i) | | 10/31/2016 | | | 10/31/2015 | | | 10/31/2014 | | | 10/31/2013 | | | 10/31/2012 | |
| Net asset value, beginning of period | | $ | 21.59 | | | $ | | 22.54 | | | $ | | 22.18 | | | $ | | 19.43 | | | $ | | 14.59 | | | $ | | 13.50 | |
| INCOME FROM INVESTMENT | | | | | | | | | | | | | | | | | | | | | | | | | | | | | |
| OPERATIONS: | | | | | | | | | | | | | | | | | | | | | | | | | | | | | |
| Net investment loss(ii) | | | (0.05 | ) | | | | (0.05 | ) | | | | (0.13 | ) | | | | (0.07 | ) | | | | (0.03 | ) | | | | – | |
| Net realized and unrealized gain (loss) | | | | | | | | | | | | | | | | | | | | | | | | | | | | | |
| on investments | | | 3.87 | | | | | (0.90 | ) | | | | 0.49 | | | | | 2.82 | | | | | 4.91 | | | | | 1.09 | |
| Total from investment operations | | | 3.82 | | | | | (0.95 | ) | | | | 0.36 | | | | | 2.75 | | | | | 4.88 | | | | | 1.09 | |
| Dividends from net investment income | – | | | | | – | | | | | – | | | | | – | | | | | (0.04 | ) | | | | – | |
| Net asset value, end of period | | $ | 25.41 | | | $ | | 21.59 | | | $ | | 22.54 | | | $ | | 22.18 | | | $ | | 19.43 | | | $ | | 14.59 | |
| Total return | | | 17.74 | % | | | | (4.21 | )% | | | | 1.62 | % | | | | 14.15 | % | | | | 33.41 | % | | | | 8.10 | % |
| RATIOS/SUPPLEMENTAL DATA: | | | | | | | | | | | | | | | | | | | | | | | | | | | | | |
| Net assets, end of period (000's | | | | | | | | | | | | | | | | | | | | | | | | | | | | | |
| omitted) | $ | 81,203 | | $ | 81,782 | | $ | 114,984 | | $ | 132,426 | | $ | 157,391 | | $ | 182,087 | |
| Ratio of gross expenses to average | | | | | | | | | | | | | | | | | | | | | | | | | | | | | |
| net assets | | | 1.27 | % | | | | 1.25 | % | | | | 1.20 | % | | | | 1.30 | % | | | | 1.29 | % | | | | 1.23 | % |
| Ratio of net expenses to average net | | | | | | | | | | | | | | | | | | | | | | | | | | | | | |
| assets | | | 1.27 | % | | | | 1.25 | % | | | | 1.20 | % | | | | 1.30 | % | | | | 1.29 | % | | | | 1.23 | % |
| Ratio of net investment income (loss) to | | | | | | | | | | | | | | | | | | | | | | | | | | | | | |
| average net assets | | | (0.44 | )% | | | | (0.24 | )% | | | | (0.55 | )% | | | | (0.32 | )% | | | | (0.19 | )% | | | | 0.02 | % |
| Portfolio turnover rate | | | 65.31 | % | | | | 95.75 | % | | | | 120.97 | % | | | | 192.15 | % | | | | 153.89 | % | | | | 232.99 | % |
| See Notes to Financial Statements. | | | | | | | | | | | | | | | | | | | | | | | | | | | |
(i) Ratios have been annualized; total return and portfolio turnover rate have not been annualized.
(ii) Amount was computed based on average shares outstanding during the period.
- 54 -
THE ALGER INSTITUTIONAL FUNDS
Financial Highlights for a share outstanding throughout the period (Unaudited)
| | | | | | | | | | | | | | | | | | | | | | | | | | | | | | |
| Alger Mid Cap Growth Institutional | | | | | | | | | | | | | | | | | | | | | | | | | | | | | | |
| Fund | | | | | | | | | | | | | Class R | | | | | | | | | | | |
| | | Six months | | | | | | | | | | | | | | | | | | | | | | | | | | | |
| | | | ended | | | Year ended | | | Year ended | | | Year ended | | | Year ended | | | Year ended | |
| | | 4/30/2017 | (i) | | 10/31/2016 | | | 10/31/2015 | | | | | 10/31/2014 | | | 10/31/2013 | | | 10/31/2012 | |
| Net asset value, beginning of period | | $ | 19.96 | | | $ | | 20.96 | | | $ | | 20.74 | | | $ | 18.26 | | | $ | | 13.81 | | | $ | | 12.85 | |
| INCOME FROM INVESTMENT | | | | | | | | | | | | | | | | | | | | | | | | | | | | | | |
| OPERATIONS: | | | | | | | | | | | | | | | | | | | | | | | | | | | | | | |
| Net investment loss(ii) | | | (0.11 | ) | | | | (0.16 | ) | | | | (0.23 | ) | | | | | (0.16 | ) | | | | (0.11 | ) | | | | (0.07 | ) |
| Net realized and unrealized gain (loss) | | | | | | | | | | | | | | | | | | | | | | | | | | | | | | |
| on investments | | | 3.58 | | | | | (0.84 | ) | | | | 0.45 | | | | | | 2.64 | | | | | 4.63 | | | | | 1.03 | |
| Total from investment operations | | | 3.47 | | | | | (1.00 | ) | | | | 0.22 | | | | | | 2.48 | | | | | 4.52 | | | | | 0.96 | |
| Dividends from net investment income | – | | | | | – | | | | | – | | | | | | – | | | | | (0.07 | ) | | | | – | |
| Net asset value, end of period | | $ | 23.43 | | | $ | | 19.96 | | | $ | | 20.96 | | | $ | 20.74 | | | $ | | 18.26 | | | $ | | 13.81 | |
| Total return | | | 17.38 | % | | | | (4.82 | )% | | | | 1.11 | % | | | | | 13.58 | % | | | | 32.83 | % | | | | 7.50 | % |
| RATIOS/SUPPLEMENTAL DATA: | | | | | | | | | | | | | | | | | | | | | | | | | | | | | | |
| Net assets, end of period (000's | | | | | | | | | | | | | | | | | | | | | | | | | | | | | | |
| omitted) | $ | 12,913 | | $ | 13,093 | | $ | 17,795 | | $ | 21,953 | | $ | 23,599 | | $ | 26,661 | |
| Ratio of gross expenses to average | | | | | | | | | | | | | | | | | | | | | | | | | | | | | | |
| net assets | | | 1.87 | % | | | | 1.82 | % | | | | 1.74 | % | | | | | 1.80 | % | | | | 1.79 | % | | | | 1.76 | % |
| Ratio of net expenses to average net | | | | | | | | | | | | | | | | | | | | | | | | | | | | | | |
| assets | | | 1.87 | % | | | | 1.82 | % | | | | 1.74 | % | | | | | 1.80 | % | | | | 1.79 | % | | | | 1.76 | % |
| Ratio of net investment income (loss) to | | | | | | | | | | | | | | | | | | | | | | | | | | | | | | |
| average net assets | | | (1.05 | )% | | | | (0.81 | )% | | | | (1.08 | )% | | | | | (0.82 | )% | | | | (0.69 | )% | | | | (0.50 | )% |
| Portfolio turnover rate | | | 65.31 | % | | | | 95.75 | % | | | | 120.97 | % | | | | | 192.15 | % | | | | 153.89 | % | | | | 232.99 | % |
| See Notes to Financial Statements. | | | | | | | | | | | | | | | | | | | | | | | | | | | | |
(i) Ratios have been annualized; total return and portfolio turnover rate have not been annualized.
(ii) Amount was computed based on average shares outstanding during the period.
- 55 -
THE ALGER INSTITUTIONAL FUNDS
Financial Highlights for a share outstanding throughout the period (Unaudited)
| | | | | | | | | |
| Alger Mid Cap Growth Institutional | | | | | | | | | |
| Fund | | | Class Z-2 | |
| | | Six months | | From 10/14/2016 | |
| | | | ended | | (commencement of operations) to | |
| | | 4/30/2017 | (i) | | | 10/31/2016 | (ii) |
| Net asset value, beginning of period | $ | 21.59 | | $ | 21.95 | |
| INCOME FROM INVESTMENT | | | | | | | | | |
| OPERATIONS: | | | | | | | | | |
| Net investment income (loss)(iii) | | | (0.03 | ) | | | | 0.04 | |
| Net realized and unrealized gain (loss) | | | | | | | | | |
| on investments | | | 3.89 | | | | | (0.40 | ) |
| Total from investment operations | | | 3.86 | | | | | (0.36 | ) |
| Net asset value, end of period | $ | 25.45 | | $ | 21.59 | |
| Total return | | | 17.88 | % | | | | (1.64 | )% |
| RATIOS/SUPPLEMENTAL DATA: | | | | | | | | | |
| Net assets, end of period (000's | | | | | | | | | |
| omitted) | $ | 5,026 | | $ | 113 | |
| Ratio of gross expenses to average | | | | | | | | | |
| net assets | | | 1.25 | % | | | | 32.21 | % |
| Ratio of expense reimbursements to | | | | | | | | | |
| average net assets | | | (0.20 | )% | | | | (31.16 | )% |
| Ratio of net expenses to average net | | | | | | | | | |
| assets | | | 1.05 | % | | | | 1.05 | % |
| Ratio of net investment income (loss) to | | | | | | | | | |
| average net assets | | | (0.24 | )% | | | | 4.35 | % |
| Portfolio turnover rate | | | 65.31 | % | | | | 95.75 | % |
| See Notes to Financial Statements. | | | | | | | | |
(i) Ratios have been annualized; total return and portfolio turnover rate have not been annualized.
(ii) Ratios have been annualized; total return has not been annualized; portfolio turnover is for the twelve months then ended.
(iii) Amount was computed based on average shares outstanding during the period.
- 56 -
THE ALGER INSTITUTIONAL FUNDS
Financial Highlights for a share outstanding throughout the period (Unaudited)
| | | | | | | | | | | | | | | | | | | | | | | | | | | | | |
| Alger Small Cap Growth | | | | | | | | | | | | | | | | | | | | | | | | | | | | | |
| Institutional Fund | | | | | | | | | | | | | Class I | | | | | | | | | | | | | |
| | | Six months | | | | | | | | | | | | | | | | | | | | | | | | | | |
| | | | ended | | | Year ended | | | Year ended | | | Year ended | | | Year ended | | | Year ended | |
| | | 4/30/2017 | (i) | | 10/31/2016 | | | 10/31/2015 | | | 10/31/2014 | | | 10/31/2013 | | | 10/31/2012 | |
| Net asset value, beginning of period | | $ | 14.83 | | | $ | | 23.10 | | | $ | | 28.14 | | | $ | | 33.48 | | | $ | | 28.16 | | | $ | | 26.99 | |
| INCOME FROM INVESTMENT | | | | | | | | | | | | | | | | | | | | | | | | | | | | | |
| OPERATIONS: | | | | | | | | | | | | | | | | | | | | | | | | | | | | | |
| Net investment loss(ii) | | | (0.04 | ) | | | | (0.10 | ) | | | | (0.20 | ) | | | | (0.20 | ) | | | | (0.11 | ) | | | | (0.15 | ) |
| Net realized and unrealized gain (loss) | | | | | | | | | | | | | | | | | | | | | | | | | | | | | |
| on investments | | | 3.01 | | | | | (0.54 | ) | | | | 0.42 | | | | | 0.60 | | | | | 8.66 | | | | | 2.45 | |
| Total from investment operations | | | 2.97 | | | | | (0.64 | ) | | | | 0.22 | | | | | 0.40 | | | | | 8.55 | | | | | 2.30 | |
| Distributions from net realized gains | | | – | | | | | (7.63 | ) | | | | (5.26 | ) | | | | (5.74 | ) | | | | (3.23 | ) | | | | (1.13 | ) |
| Net asset value, end of period | | $ | 17.80 | | | $ | | 14.83 | | | $ | | 23.10 | | | $ | | 28.14 | | | $ | | 33.48 | | | $ | | 28.16 | |
| Total return | | | 20.03 | % | | | | (3.76 | )% | | | | 0.53 | % | | | | 1.21 | % | | | | 33.71 | % | | | | 8.93 | % |
| RATIOS/SUPPLEMENTAL DATA: | | | | | | | | | | | | | | | | | | | | | | | | | | | | | |
| Net assets, end of period (000's | | | | | | | | | | | | | | | | | | | | | | | | | | | | | |
| omitted) | $ | 116,722 | | $ | 129,188 | | $ | 357,189 | | $ | 659,692 | | $ | 936,554 | | $ | 929,237 | |
| Ratio of gross expenses to average | | | | | | | | | | | | | | | | | | | | | | | | | | | | | |
| net assets | | | 1.32 | % | | | | 1.28 | % | | | | 1.25 | % | | | | 1.24 | % | | | | 1.25 | % | | | | 1.23 | % |
| Ratio of net expenses to average net | | | | | | | | | | | | | | | | | | | | | | | | | | | | | |
| assets | | | 1.32 | % | | | | 1.28 | % | | | | 1.25 | % | | | | 1.24 | % | | | | 1.25 | % | | | | 1.23 | % |
| Ratio of net investment income (loss) to | | | | | | | | | | | | | | | | | | | | | | | | | | | | | |
| average net assets | | | (0.52 | )% | | | | (0.67 | | | | | (0.80 | )% | | | | (0.70 | )% | | | | (0.38 | )% | | | | (0.54 | )% |
| Portfolio turnover rate | | | 18.95 | % | | | | 55.08 | % | | | | 125.72 | % | | | | 84.10 | % | | | | 77.38 | % | | | | 72.43 | % |
| See Notes to Financial Statements. | | | | | | | | | | | | | | | | | | | | | | | | | | | |
(i) Ratios have been annualized; total return and portfolio turnover rate have not been annualized.
(ii) Amount was computed based on average shares outstanding during the period.
- 57 -
THE ALGER INSTITUTIONAL FUNDS
Financial Highlights for a share outstanding throughout the period (Unaudited)
| | | | | | | | | | | | | | | | | | | | | | | | | | | | | | |
| Alger Small Cap Growth | | | | | | | | | | | | | | | | | | | | | | | | | | | | | | |
| Institutional Fund | | | | | | | | | | | | | Class R | | | | | | | | | | | | |
| | | Six months | | | | | | | | | | | | | | | | | | | | | | | | | | | |
| | | | ended | | | Year ended | | | Year ended | | | Year ended | | | Year ended | | | Year ended | |
| | | 4/30/2017 | (i) | | 10/31/2016 | | | 10/31/2015 | | | | | 10/31/2014 | | | 10/31/2013 | | | 10/31/2012 | |
| Net asset value, beginning of period | | $ | 12.67 | | | $ | | 20.92 | | | $ | | 26.08 | | | $ | 31.58 | | | $ | | 26.85 | | | $ | | 25.91 | |
| INCOME FROM INVESTMENT | | | | | | | | | | | | | | | | | | | | | | | | | | | | | | |
| OPERATIONS: | | | | | | | | | | | | | | | | | | | | | | | | | | | | | | |
| Net investment loss(ii) | | | (0.08 | ) | | | | (0.16 | ) | | | | (0.29 | ) | | | | | (0.32 | ) | | | | (0.23 | ) | | | | (0.28 | ) |
| Net realized and unrealized gain (loss) | | | | | | | | | | | | | | | | | | | | | | | | | | | | | | |
| on investments | | | 2.57 | | | | | (0.46 | ) | | | | 0.39 | | | | | | 0.56 | | | | | 8.19 | | | | | 2.35 | |
| Total from investment operations | | | 2.49 | | | | | (0.62 | ) | | | | 0.10 | | | | | | 0.24 | | | | | 7.96 | | | | | 2.07 | |
| Distributions from net realized gains | | | – | | | | | (7.63 | ) | | | | (5.26 | ) | | | | | (5.74 | ) | | | | (3.23 | ) | | | | (1.13 | ) |
| Net asset value, end of period | | $ | 15.16 | | | $ | | 12.67 | | | $ | | 20.92 | | | $ | 26.08 | | | $ | | 31.58 | | | $ | | 26.85 | |
| Total return | | | 19.65 | % | | | | (4.22 | )% | | | | 0.02 | % | | | | | 0.74 | % | | | | 33.05 | % | | | | 8.40 | % |
| RATIOS/SUPPLEMENTAL DATA: | | | | | | | | | | | | | | | | | | | | | | | | | | | | | | |
| Net assets, end of period (000's | | | | | | | | | | | | | | | | | | | | | | | | | | | | | | |
| omitted) | $ | 11,263 | | $ | 12,675 | | $ | 18,577 | | $ | 31,062 | | $ | 41,022 | | $ | 47,507 | |
| Ratio of gross expenses to average | | | | | | | | | | | | | | | | | | | | | | | | | | | | | | |
| net assets | | | 1.84 | % | | | | 1.80 | % | | | | 1.74 | % | | | | | 1.72 | % | | | | 1.73 | % | | | | 1.73 | % |
| Ratio of net expenses to average net | | | | | | | | | | | | | | | | | | | | | | | | | | | | | | |
| assets | | | 1.84 | % | | | | 1.80 | % | | | | 1.74 | % | | | | | 1.72 | % | | | | 1.73 | % | | | | 1.73 | % |
| Ratio of net investment income (loss) to | | | | | | | | | | | | | | | | | | | | | | | | | | | | | | |
| average net assets | | | (1.07 | )% | | | | (1.20 | )% | | | | (1.30 | )% | | | | | (1.18 | )% | | | | (0.83 | )% | | | | (1.05 | )% |
| Portfolio turnover rate | | | 18.95 | % | | | | 55.08 | % | | | | 125.72 | % | | | | | 84.10 | % | | | | 77.38 | % | | | | 72.43 | % |
| See Notes to Financial Statements. | | | | | | | | | | | | | | | | | | | | | | | | | | | | |
(i) Ratios have been annualized; total return and portfolio turnover rate have not been annualized.
(ii) Amount was computed based on average shares outstanding during the period.
- 58 -
THE ALGER INSTITUTIONAL FUNDS
Financial Highlights for a share outstanding throughout the period (Unaudited)
| | | | | | | | | | | |
| Alger Small Cap Growth | | | | | | | | | | | |
| Institutional Fund | | | | Class Z-2 | |
| |
| | | | Six months | | | From 8/1/2016 | |
| | | | | ended | | | (commencement of operations) to | |
| | | | 4/30/2017 | (i) | | | | 10/31/2016 | (ii) |
| Net asset value, beginning of period | | $ | 14.84 | | | $ | 15.35 | |
| INCOME FROM INVESTMENT | | | | | | | | | | | |
| OPERATIONS: | | | | | | | | | | | |
| Net investment loss(iii) | | | | (0.02 | ) | | | | | (0.03 | ) |
| Net realized and unrealized gain (loss) | | | | | | | | | | | |
| on investments | | | | 3.02 | | | | | | (0.48 | ) |
| Total from investment operations | | | | 3.00 | | | | | | (0.51 | ) |
| Net asset value, end of period | | $ | 17.84 | | | $ | 14.84 | |
| Total return | | | | 20.22 | % | | | | | (3.32 | )% |
| RATIOS/SUPPLEMENTAL DATA: | | | | | | | | | | | |
| Net assets, end of period (000's | | | | | | | | | | | |
| omitted) | $ | 52,263 | | | | | $ | 41,787 | |
| Ratio of gross expenses to average | | | | | | | | | | | |
| net assets | | | | 1.04 | % | | | | | 1.07 | % |
| Ratio of expense reimbursements to | | | | | | | | | | | |
| average net assets | | | | (0.05 | )% | | | | | (0.08 | )% |
| Ratio of net expenses to average net | | | | | | | | | | | |
| assets | | | | 0.99 | % | | | | | 0.99 | % |
| Ratio of net investment income (loss) to | | | | | | | | | | | |
| average net assets | | | | (0.29 | )% | | | | | (0.76 | )% |
| Portfolio turnover rate | | | | 18.95 | % | | | | | 55.08 | % |
| See Notes to Financial Statements. | | | | | | | | | |
(i) Ratios have been annualized; total return and portfolio turnover rate have not been annualized.
(ii) Ratios have been annualized; total return has not been annualized; portfolio turnover is for the twelve months then ended.
(iii) Amount was computed based on average shares outstanding during the period.
- 59 -
THE ALGER INSTITUTIONAL FUNDS
NOTES TO FINANCIAL STATEMENTS (Unaudited)
NOTE 1 — General:
The Alger Institutional Funds (the “Trust”) is a diversified, open-end registered
investment company organized as a business trust under the laws of the Commonwealth
of Massachusetts. The Trust qualifies as an investment company as defined in Financial
Accounting Standards Board Accounting Standards Codification 946-Financial Services
– Investment Companies. The Trust operates as a series company and currently offers
an unlimited number of shares of beneficial interest in four funds — Alger Capital
Appreciation Institutional Fund, Alger Capital Appreciation Focus Fund, Alger Mid Cap
Growth Institutional Fund and Alger Small Cap Growth Institutional Fund (collectively,
the “Funds” or individually, each a “Fund”). The Funds normally invest primarily in equity
securities and each has an investment objective of long-term capital appreciation.
Each Fund offers one or more of the following share classes: Class A, C, I, R, Y, Z and
Z-2. Class A shares are generally subject to an initial sales charge while Class C shares are
generally subject to a deferred sales charge. Class I, R, Y, Z and Z-2 shares are sold to
institutional investors without an initial or deferred sales charge. Each class has identical
rights to assets and earnings except that each share class bears the pro rata allocation of the
Fund’s expense other than a Class Expense (not including advisory or custodial fees or other
expenses related to the management of the Fund’s assets) to a share class.
Alger Capital Appreciation Institutional Fund and Alger Capital Appreciation Focus Fund
started offering Class Y shares on February 28, 2017.
NOTE 2 — Significant Accounting Policies:
(a) Investment Valuation: The Funds value their financial instruments at fair value using
independent dealers or pricing services under policies approved by the Trust’s Board of
Trustees (“Board”). Investments are valued on each day the New York Stock Exchange (the
“NYSE”) is open, as of the close of the NYSE (normally 4:00 p.m. Eastern Standard Time).
Equity securities and option contracts for which valuation information is readily available are
valued at the last quoted sales price or official closing price as reported by an independent
pricing service on the primary market or exchange on which they are traded. In the absence
of quoted sales, such securities are valued at the bid price or, in the absence of a recent
bid price, the equivalent as obtained from one or more of the major market makers for the
securities to be valued.
The industry classifications of the Funds’ investments, as presented in the accompanying
Schedules of Investments, represent management’s belief as to the most meaningful
presentation of the classification of such investments. For Fund compliance purposes, the
Funds’ industry classifications refer to any one or more of the industry sub-classifications
used by one or more widely recognized market indexes or rating group indexes, with the
primary source being Global Industry Classification Standard (GICS).
Debt securities generally trade in the over-the-counter market. Debt securities with
remaining maturities of more than sixty days at the time of acquisition are valued on
the basis of last available bid prices or current market quotations provided by dealers
- 60 -
THE ALGER INSTITUTIONAL FUNDS
NOTES TO FINANCIAL STATEMENTS (Unaudited) (Continued)
or pricing services. In determining the value of a particular investment, pricing services
may use certain information with respect to transactions in such investments, quotations
from dealers, pricing matrixes, market transactions in comparable investments, various
relationships observed in the market between investments and calculated yield measures
based on valuation technology commonly employed in the market for such investments.
Asset-backed and mortgage-backed securities are valued by independent pricing services
using models that consider estimated cash flows of each tranche of the security, establish a
benchmark yield and develop an estimated tranche-specific spread to the benchmark yield
based on the unique attributes of the tranche. Debt securities with a remaining maturity of
sixty days or less are valued at amortized cost which approximates market value.
Securities for which market quotations are not readily available are valued at fair value, as
determined in good faith pursuant to procedures established by the Board.
Securities in which the Funds invest may be traded in foreign markets that close before the
close of the NYSE. Developments that occur between the close of the foreign markets
and the close of the NYSE may result in adjustments to the foreign closing prices to reflect
what the investment adviser, pursuant to policies established by the Board, believes to be
the fair value of these securities as of the close of the NYSE. The Funds may also fair value
securities in other situations, for example, when a particular foreign market is closed but the
Funds are open.
Financial Accounting Standards Board Accounting Standards Codification 820 – Fair Value
Measurements and Disclosures (“ASC 820”) defines fair value as the price that the Funds
would receive upon selling an investment in a timely transaction to an independent buyer
in the principal or most advantageous market of the investment. ASC 820 established a
three-tier hierarchy to maximize the use of observable market data and minimize the use of
unobservable inputs and to establish classification of fair value measurements for disclosure
purposes. Inputs refer broadly to the assumptions that market participants would use in
pricing the asset or liability and may be observable or unobservable. Observable inputs
are based on market data obtained from sources independent of the Funds. Unobservable
inputs are inputs that reflect the Funds’ own assumptions based on the best information
available in the circumstances. The three-tier hierarchy of inputs is summarized in the three
broad Levels listed below.
• Level 1 – quoted prices in active markets for identical investments
• Level 2 – significant other observable inputs (including quoted prices for similar
investments, interest rates, prepayment speeds, credit risk, etc.)
• Level 3 – significant unobservable inputs (including the Funds’ own assumptions in
determining the fair value of investments)
The Funds’ valuation techniques are generally consistent with either the market or the
income approach to fair value. The market approach considers prices and other relevant
information generated by market transactions involving identical or comparable assets
to measure fair value. The income approach converts future amounts to a current, or
discounted, single amount. These fair value measurements are determined on the basis
- 61 -
THE ALGER INSTITUTIONAL FUNDS
NOTES TO FINANCIAL STATEMENTS (Unaudited) (Continued)
of the value indicated by current market expectations about such future events. Inputs
for Level 1 include exchange-listed prices and broker quotes in an active market. Inputs
for Level 2 include the last trade price in the case of a halted security, an exchange-listed
price which has been adjusted for fair value factors, and prices of closely related securities.
Additional Level 2 inputs include an evaluated price which is based upon a compilation of
observable market information such as spreads for fixed income and preferred securities.
Inputs for Level 3 include revenue multiples, earnings before interest, taxes, depreciation
and amortization (“EBITDA”) multiples, discount rates, and the probabilities of success of
certain outcomes. Such unobservable market information may be obtained from a company’s
financial statements and from industry studies, market data, and market indicators such as
benchmarks and indexes. Because of the inherent uncertainty and often limited markets for
restricted securities, the values may significantly differ from the values if there was an active
market.
Valuation processes are determined by a Valuation Committee (“Committee”) established
by the Board and comprised of representatives of the Trust’s investment adviser. The
Committee reports its fair valuation determinations to the Board which is responsible for
approving valuation policy and procedures.
While the Committee meets on an as-needed basis, the Committee generally meets
quarterly to review and evaluate the effectiveness of the procedures for making fair value
determinations. The Committee considers, among other things, the results of quarterly
back testing of the fair value model for foreign securities, pricing comparisons between
primary and secondary price sources, the outcome of price challenges put to the Funds’
pricing vendor, and variances between transactional prices and previous mark-to-markets.
The Funds will record a change to a security’s fair value level if new inputs are available
or it becomes evident that inputs previously considered for leveling have changed or are
no longer relevant. Transfers between Levels 1, 2 and 3 are recognized at the end of the
reporting period.
(b) Cash and Cash Equivalents: Cash and cash equivalents include U.S. dollars and overnight
time deposits.
(c) Securities Transactions and Investment Income: Securities transactions are recorded on a
trade date basis. Realized gains and losses from securities transactions are recorded on the
identified cost basis. Dividend income is recognized on the ex-dividend date and interest
income is recognized on the accrual basis.
Premiums and discounts on debt securities purchased are amortized or accreted over the
lives of the respective securities.
(d) Foreign Currency Translations: The books and records of the Funds are maintained in U.S.
dollars. Foreign currencies, investments and other assets and liabilities are translated into
U.S. dollars at the prevailing rates of exchange on the valuation date. Purchases and sales
of investment securities and income and expenses are translated into U.S. dollars at the
prevailing exchange rates on the respective dates of such transactions.
- 62 -
THE ALGER INSTITUTIONAL FUNDS
NOTES TO FINANCIAL STATEMENTS (Unaudited) (Continued)
Net realized gains and losses on foreign currency transactions represent net gains and losses
from the disposition of foreign currencies, currency gains and losses realized between the
trade dates and settlement dates of security transactions, and the difference between the
amount of net investment income accrued and the U.S. dollar amount actually received.
The effects of changes in foreign currency exchange rates on investments in securities
are included in realized and unrealized gain or loss on investments in the accompanying
Statements of Operations.
(e) Lending of Fund Securities: The Funds may lend their securities to financial institutions,
provided that the market value of the securities loaned will not at any time exceed one
third of a Fund’s total assets, as defined in its prospectuses. The Funds earn fees on the
securities loaned, which are included in interest income in the accompanying Statements
of Operations. In order to protect against the risk of failure by the borrower to return the
securities loaned or any delay in the delivery of such securities, the loan is collateralized by
cash or securities that are maintained with the Custodian in an amount equal to at least 102
percent of the current market value of U.S. loaned securities or 105 percent for non-U.S.
loaned securities. The market value of the loaned securities is determined at the close of
business of the Fund. Any required additional collateral is delivered to the Custodian and
any excess collateral is returned to the borrower on the next business day. In the event the
borrower fails to return the loaned securities when due, the Funds may take the collateral
to replace the securities. If the value of the collateral is less than the purchase cost of
replacement securities, the Custodian shall be responsible for any shortfall, but only to
the extent that the shortfall is not due to any diminution in collateral value, as defined in
the securities lending agreement. The Funds are required to maintain the collateral in a
segregated account and determine its value each day until the loaned securities are returned.
Cash collateral may be invested as determined by the Funds. Collateral is returned to the
borrower upon settlement of the loan. There were no securities loaned as of April 30, 2017.
(f) Dividends to Shareholders: Dividends and distributions payable to shareholders are
recorded by the Funds on the ex-dividend date. Dividends from net investment income and
distributions from net realized gains are declared and paid annually after the end of the fiscal
year in which earned.
Each class is treated separately in determining the amounts of dividends from net investment
income payable to holders of its shares.
The characterization of distributions to shareholders for financial reporting purposes is
determined in accordance with federal income tax rules. Therefore, the source of a Fund’s
distributions may be shown in the accompanying financial statements as either from, or in
excess of, net investment income, net realized gain on investment transactions or return of
capital, depending on the type of book/tax differences that may exist. Capital accounts within
the financial statements are adjusted for permanent book/tax differences. Reclassifications
result primarily from the difference in tax treatment of net operating losses, passive foreign
investment companies, and foreign currency transactions. The reclassifications are done
annually at fiscal year end and have no impact on the net asset values of the Funds and are
designed to present each Fund’s capital accounts on a tax basis.
- 63 -
THE ALGER INSTITUTIONAL FUNDS
NOTES TO FINANCIAL STATEMENTS (Unaudited) (Continued)
(g) Federal Income Taxes: It is each Fund’s policy to comply with the requirements of the
Internal Revenue Code Subchapter M applicable to regulated investment companies and
to distribute all of its taxable income to its shareholders. Provided that the Funds maintain
such compliance, no federal income tax provision is required. Each Fund is treated as a
separate entity for the purpose of determining such compliance.
Financial Accounting Standards Board Accounting Standards Codification 740 – Income
Taxes (“ASC 740”) requires the Funds to measure and recognize in their financial statements
the benefit of a tax position taken (or expected to be taken) on an income tax return
if such position will more likely than not be sustained upon examination based on the
technical merits of the position. No tax years are currently under investigation. The Funds
file income tax returns in the U.S., as well as New York State and New York City. The
statute of limitations on the Funds’ tax returns remains open for the tax years 2013-2016.
Management does not believe there are any uncertain tax positions that require recognition
of a tax liability.
(h) Allocation Methods: The Trust accounts separately for the assets, liabilities and operations
of each Fund. Expenses directly attributable to each Fund are charged to that Fund’s
operations; expenses which are applicable to all Funds are allocated among them based on
net assets. Income, realized and unrealized gains and losses, and expenses of each Fund
are allocated among the Fund’s classes based on relative net assets, with the exception of
distribution fees, transfer agency fees, and shareholder servicing and related fees.
(i) Estimates: These financial statements have been prepared in accordance with accounting
principles generally accepted in the United States of America, which require using estimates
and assumptions that affect the reported amounts therein. These unaudited interim financial
statements reflect all adjustments which are, in the opinion of management, necessary to
present a fair statement of results for the interim period. Actual results may differ from
those estimates. All such estimates are of normal recurring nature.
NOTE 3 — Investment Advisory Fees and Other Transactions with Affiliates:
(a) Investment Advisory Fees: Fees incurred by each Fund, pursuant to the provisions of
the Trust’s Investment Advisory Agreement with Fred Alger Management, Inc. (“Alger
Management” or the “Manager”), are payable monthly and computed based on the following
rates. The actual rate paid as a percentage of average daily net assets, for the six months
ended April 30, 2017, is set forth below under the heading “Actual Rate.”
| | | | | | | | | | | | | | | | | | | | |
| | | Tier 1 | | Tier 2 | | | Tier 3 | | | Tier 4 | | | Tier 5 | | | Actual Rate | |
| Alger Capital | | | | | | | | | | | | | | | | | | | | |
| Appreciation | | | | | | | | | | | | | | | | | | | | |
| Institutional | | | | | | | | | | | | | | | | | | | | |
| Fund(a) | | 0.810 | % | 0.650 | % | | 0.600 | % | | 0.550 | % | | 0.450 | % | | 0.740 | % |
| Alger Capital | | | | | | | | | | | | | | | | | | | | |
| Appreciation | | | | | | | | | | | | | | | | | | | | |
| Focus Fund(c) | | 0.550 | | — | | | — | | | — | | | — | | | 0.550 | |
- 64 -
THE ALGER INSTITUTIONAL FUNDS
NOTES TO FINANCIAL STATEMENTS (Unaudited) (Continued)
| | | | | | | | | | |
| | | Tier 1 | | Tier 2 | | Tier 3 | Tier 4 | Tier 5 | | Actual Rate |
| Alger Mid Cap | | | | | | | | | | |
| Growth | | | | | | | | | | |
| Institutional | | | | | | | | | | |
| Fund(b) | | 0.760 | | 0.700 | | — | — | — | | 0.760 |
| Alger Small | | | | | | | | | | |
| Cap Growth | | | | | | | | | | |
| Institutional | | | | | | | | | | |
| Fund(b) | | 0.810 | | 0.750 | | — | — | — | | 0.810 |
(a) Tier 1 rate is paid on assets up to $2 billion, Tier 2 rate is paid on assets between $2 to
$3 billion, Tier 3 rate is paid on assets in between $3 to $4 billion, Tier 4 rate is paid on
assets between $4 to $5 billion, and Tier 5 rate is paid on assets in excess of $5 billion.
(b) Tier 1 rate is paid on assets up to $1 billion and Tier 2 rate is paid on assets in excess
of $1 billion.
(c) Tier 1 rate is paid on all assets.
Alger Management has established expense caps for several shares classes, effective through
February 28, 2018, whereby it reimburses the share classes if annualized operating expenses
(excluding interest, taxes, brokerage, dividend expenses and extraordinary expenses) exceed
the rates, based on average daily net assets listed below.
Also, Alger Management has contractually agreed to reimburse Alger Capital Appreciation
Institutional Fund Class Y shares expenses (excluding interest, taxes, brokerage, dividend
expenses and extraordinary expenses) through February 28, 2018 to the extent necessary
to limit the total annual fund operating expenses to the actual investment advisory fee plus
incurred custody fee. This expense reimbursement cannot be terminated.
| | | | | | | | | | | | | | |
| | | | | | | | | | | | | FEES WAIVED / | |
| | | | | | | | | | | | | REIMBURSED | |
| | | | | | | | | | | | | FOR THE YEAR | |
| | | | | CLASS | | | | | | | | | ENDED | |
| | | | | | | | | | | | | OCTOBER 31, | |
| | A | C | I | R | Y | | Z | | Z-2 | | | | 2017 | |
| Alger Capital Appreciation Institutional Fund | – | – | – | – | 0.75 | % | – | | 0.95 | % | | $ | 2,312 | |
| Alger Capital Appreciation Focus Fund | 1.15% | 1.90% | 1.15% | – | 0.65 | | 0.95 | % | – | | | | 2,022 | |
| Alger Mid Cap Growth Institutional Fund | – | – | – | – | – | | – | | 1.05 | | | | 3,593 | |
| Alger Small Cap Growth Institutional Fund | – | – | – | – | – | | – | | 0.99 | | | | 12,695 | |
Fred Alger Management, Inc. may recoup reimbursed expenses during the one-year term of
the expense reimbursement contract if the expense ratio falls below the stated limitation.
(b) Administration Fees: Fees incurred by each Fund, pursuant to the provisions of the Trust’s
Administration Agreement with Fred Alger Management, Inc., are payable monthly and
computed based on the average daily net assets of each Fund at the annual rate of 0.0275%.
(c) Distribution Fees:
Class A Shares: The Trust has adopted a Distribution Plan pursuant to which Class A shares
of Alger Capital Appreciation Focus Fund pay Fred Alger & Company, Incorporated, the
- 65 -
THE ALGER INSTITUTIONAL FUNDS
NOTES TO FINANCIAL STATEMENTS (Unaudited) (Continued)
Fund’s distributor (the “Distributor” or “Alger Inc.”) and an affiliate of Alger Management,
a fee at the annual rate of 0.25% of the respective average daily net assets of the Class A
shares of the Fund to compensate Alger Inc. for its activities and expenses incurred in
distributing and servicing the Class A shares. The fees paid may be more or less than the
expenses incurred by Alger Inc.
Class C Shares: The Trust has adopted a Distribution Plan pursuant to which Class C shares
of Alger Capital Appreciation Focus Fund pay Alger Inc. a fee at the annual rate of 1% of
the average daily net assets of the Class C shares of the Fund to compensate Alger Inc. for
its activities and expenses incurred in distributing and servicing the Class C shares. The fees
paid may be more or less than the expenses incurred by Alger Inc.
Class R Shares: The Trust has adopted a Distribution Plan pursuant to which Class R
shares of each Fund issuing such shares pay Alger Inc. a fee at the annual rate of 0.50%
of the respective average daily net assets of the Class R shares of the designated Fund to
compensate Alger Inc. for its activities and expenses incurred in distributing and servicing
the Class R shares. The fees paid may be more or less than the expenses incurred by the
Distributor.
(d) Sales Charges: Purchases and sales of shares of the Alger Capital Appreciation Focus Fund
may be subject to initial sales charges or contingent deferred sales charges. The contingent
deferred sales charges are used by Alger Inc. to offset distribution expenses previously
incurred. Sales charges do not represent expenses of the Trust. For the six months ended
April 30, 2017, the initial sales charges and contingent deferred sales charges imposed, all of
which were retained by Alger Inc., were as follows:
| | | | | | |
| | | | | | CONTINGENT | |
| | INITIAL SALES | | DEFERRED SALES | |
| | | CHARGES | | | CHARGES | |
| Alger Capital Appreciation Focus Fund | $ | 53 | | $ | 4,911 | |
(e) Brokerage Commissions: During the six months ended April 30, 2017, Alger Capital
Appreciation Institutional Fund, Alger Capital Appreciation Focus Fund, Alger Mid Cap
Growth Institutional Fund and Alger Small Cap Growth Institutional Fund paid Alger Inc.
commissions of $218,817, $15,508, $13,865 and $7,453, respectively, in connection with
securities transactions.
(f) Shareholder Administrative Fees: The Trust has entered into a shareholder administrative
services agreement with Alger Management to compensate Alger Management for its liaison
and administrative oversight of Boston Financial Data Services, Inc., the transfer agent, and
other related services. The Funds compensate Alger Management at the annual rate of
0.0165% of their respective average daily net assets for the Class A and Class C shares and
0.01% of their respective average daily net assets of the Class I, Class R, Class Z and Class
Z-2 shares for these services.
Alger Management makes payments to intermediaries that provide sub-accounting services
to omnibus accounts invested in the Funds. A portion of the fees paid by Alger Management
to intermediaries that provide sub-accounting services are charged back to the appropriate
- 66 -
THE ALGER INSTITUTIONAL FUNDS
NOTES TO FINANCIAL STATEMENTS (Unaudited) (Continued)
Fund, subject to certain limitations, as approved by the Trust’s Board of Trustees. For
the six months ended April 30, 2017, Alger Management charged back to Alger Capital
Appreciation Institutional Fund, Alger Capital Appreciation Focus Fund, Alger Mid Cap
Growth Institutional Fund, and Alger Small Cap Growth Institutional Fund, $655,671,
$12,343, $30,811 and $63,956, respectively, for these services, which are included in the
transfer agent fees and expenses in the accompanying Statements of Operations.
(g) Trustees’ Fees: Effective March 1, 2016, each Independent Trustee receives a fee of
$27,250 for each board meeting attended, to a maximum of $109,000 per annum, paid pro
rata by each fund in the Alger Fund Complex, plus travel expenses incurred for attending
the meeting. The term “Alger Fund Complex” refers to the Fund, The Alger Institutional
Funds, The Alger Funds II, The Alger Portfolios and Alger Global Fund, each of which is a
registered investment company managed by Fred Alger Management, Inc. The Independent
Trustee appointed as Chairman of the Board of Trustees receives additional compensation
of $26,000 per annum paid pro rata by each fund in the Alger Fund Complex. Additionally,
each member of the Audit Committee receives a fee of $2,500 for each Audit Committee
meeting attended to a maximum of $10,000 per annum, paid pro rata by each fund in the
Alger Fund Complex.
(h) Interfund Trades: The Funds engage in purchase and sale transactions with other funds
advised by Alger Management. For the six months ended April 30, 2017, these purchases
and sales were as follows:
| | | | | | |
| | | | | | Realized | |
| | Purchases | | Sales | | Gain/(loss) | |
| Alger Small Cap Institutional | | | | | | |
| Fund | $3,915,791 | | – | | – | |
(i) Interfund Loans: The Fund, may borrow money from other funds advised by Alger
Management for temporary or emergency purposes. If a fund has borrowed from other
funds and has aggregate borrowings from all sources that exceed 10% of the fund’s total
assets, such fund will secure all of its loans from other funds. The interest rate charged on
interfund loans is equal to the average of the overnight time deposit rate and bank loan
rate available to the funds. There were no interfund loans outstanding as of April 30, 2017.
During the six months ended April 30, 2017, Alger Capital Appreciation Institutional Fund,
Alger Capital Appreciation Focus Fund, Alger Mid Cap Growth Institutional Fund and
Alger Small Cap Growth Institutional Fund incurred interest expense of $535, $190, $72
and $963, respectively, in connection with interfund loans.
(j) Other Transactions With Affiliates: Certain officers of the Trust are directors and officers
of Alger Management and the Distributor. At April 30, 2017, Alger Management and its
affiliated entities owned the following shares:
| | | | | | | | | | | |
| | | | | SHARE CLASS | | | | | |
| | | A | | C | | Y | | Z | | Z-2 | |
| Alger Capital Appreciation Institutional Fund | — | | — | | 347 | | — | | 3,777 | |
| Alger Capital Appreciation Focus Fund | | 6,878 | | 6,880 | | 372 | | 35,366 | | — | |
- 67 -
THE ALGER INSTITUTIONAL FUNDS
NOTES TO FINANCIAL STATEMENTS (Unaudited) (Continued)
| | | | | | | | | | |
| | | | | | SHARE CLASS | | | | |
| | | A | C | Y | Z | Z-2 | |
| Alger Mid Cap Growth Institutional Fund | | | — | | — | — | | — | 4,556 | |
| Alger Small Cap Growth Institutional Fund | | | — | | — | — | | — | 6,515 | |
(k) Shareholder Servicing Fees: The Trust has entered into a shareholder servicing agreement
with Alger Inc. whereby Alger Inc. provides Class I shares and Class R shares of the Trust
with ongoing servicing of shareholder accounts. As compensation for such services, the
Class I shares and Class R shares of each Fund pay Alger Inc. a monthly fee at an annual
rate of 0.25% of the value of the average daily net assets of those classes. The fees paid
may be more or less than the expenses incurred by the Distributor.
NOTE 4 — Securities Transactions:
The following summarizes the securities transactions by the Funds other than short-term
securities for the six months ended April 30, 2017:
| | | | | | |
| | | | PURCHASES | | | SALES |
| Alger Capital Appreciation Institutional Fund | | $ | 1,208,408,517 | | $ | 1,739,679,250 |
| Alger Capital Appreciation Focus Fund | | | 68,599,963 | | | 48,936,228 |
| Alger Mid Cap Growth Institutional Fund | | | 61,444,883 | | | 68,402,105 |
| Alger Small Cap Growth Institutional Fund | | | 34,671,216 | | | 70,699,262 |
Transactions in foreign securities may involve certain considerations and risks not typically
associated with those of U.S. companies because of, among other factors, the level of
governmental supervision and regulation of foreign security markets, and the possibility
of political or economic instability. Additional risks associated with investing in emerging
markets include increased volatility, limited liquidity, and less stringent regulatory and legal
system.
NOTE 5 — Borrowing:
The Funds may borrow from their custodian on an uncommitted basis. Each Fund pays the
custodian a market rate of interest, generally based upon the London Interbank Offered
Rate. The Funds may also borrow from other funds advised by Alger Management,
as discussed in Note 3(i). For the six months ended April 30, 2017, the Funds had the
following borrowings:
| | | | | |
| | AVERAGE DAILY | WEIGHTED AVERAGE | |
| | | BORROWING | | INTEREST RATE | |
| Alger Capital Appreciation Institutional Fund | $ | 38,825 | | 1.69 | % |
| Alger Capital Appreciation Focus Fund | | 14,863 | | 1.61 | |
| Alger Mid Cap Growth Institutional Fund | | 14,125 | | 2.29 | |
| Alger Small Cap Growth Institutional Fund | | 88,389 | | 1.81 | |
The highest amount borrowed during the year ended April 30, 2017 for each Fund was as
follows:
| |
| | HIGHEST BORROWING |
| Alger Capital Appreciation Institutional Fund | $ 6,130,350 |
- 68 -
THE ALGER INSTITUTIONAL FUNDS
NOTES TO FINANCIAL STATEMENTS (Unaudited) (Continued)
| | |
| | HIGHEST BORROWING |
| Alger Capital Appreciation Focus Fund | | 304,256 |
| Alger Mid Cap Growth Institutional Fund | | 512,233 |
| Alger Small Cap Growth Institutional Fund | | 3,147,295 |
NOTE 6 — Share Capital:
(a) The Trust has an unlimited number of authorized shares of beneficial interest of $.001
par value which are presently divided into four series. Each series is divided into separate
classes. The transactions of shares of beneficial interest were as follows:
| | | | | | | | | | | | | | | | | |
| | FOR THE SIX MONTHS ENDED | | | | FOR THE YEAR ENDED | |
| | | APRIL 30, 2017 | | | | OCTOBER 31, 2016 | |
| | | SHARES | | | | | AMOUNT | | | | SHARES | | | | | AMOUNT | |
| Alger Capital Appreciation Institutional Fund | | | | | | | | | | | | | | | |
| Class I: | | | | | | | | | | | | | | | | | |
| Shares sold | | 8,950,827 | | | $ | | 248,453,671 | | | | 31,404,149 | | | $ | | 813,769,276 | |
| Dividends reinvested | | 718,981 | | | | | 19,268,689 | | | | 8,328,490 | | | | | 222,703,812 | |
| Shares redeemed | | (42,472,960 | ) | | | | (1,165,093,058 | ) | | | (39,710,653 | ) | | (1,033,949,797 | ) |
| Net increase (decrease) | | (32,803,152) | | | $ | | (897,370,698) | | | | 21,986 | | | $ | | 2,523,291 | |
| Class R: | | | | | | | | | | | | | | | | | |
| Shares sold | | 1,998,776 | | | $ | | 50,638,237 | | | | 4,897,737 | | | $ | | 116,200,047 | |
| Dividends reinvested | | 178,580 | | | | | 4,344,841 | | | | 1,958,801 | | | | | 47,814,339 | |
| Shares redeemed | | (4,086,869 | ) | | (104,009,892 | ) | | | (7,855,308 | ) | | (186,269,122 | ) |
| Net decrease | | (1,909,513 | ) | | $ | | (49,026,814 | ) | | | (998,770 | ) | | $ | | (22,254,736 | ) |
| Class Y: | | | | | | | | | | | | | | | | | |
| Shares sold | | 293,789 | | | $ | | 8,616,833 | | | | — | | | $ | | — | |
| Net increase | | 293,789 | | | $ | | 8,616,833 | | | | — | | | $ | | — | |
| Class Z-2: | | | | | | | | | | | | | | | | | |
| Shares sold | | 12,566,665 | | | $ | | 342,715,066 | | | | 83,652 | | | $ | | 2,241,803 | |
| Dividends reinvested | | 44,346 | | | | | 1,189,367 | | | | — | | | | | — | |
| Shares redeemed | | (1,773,872 | ) | | | | (50,061,480 | ) | | | — | | | | | — | |
| Net increase | | 10,837,139 | | | $ | | 293,842,953 | | | | 83,652 | | | $ | | 2,241,803 | |
- 69 -
THE ALGER INSTITUTIONAL FUNDS
NOTES TO FINANCIAL STATEMENTS (Unaudited) (Continued)
| | | | | | | | | | | | | | | |
| | FOR THE SIX MONTHS ENDED | | | | FOR THE YEAR ENDED | |
| | | APRIL 30, 2017 | | | | OCTOBER 31, 2016 | |
| | | SHARES | | | | AMOUNT | | | | SHARES | | | | AMOUNT | |
| Alger Capital Appreciation Focus Fund | | | | | | | | | | | | | | |
| Class A: | | | | | | | | | | | | | | | |
| Shares sold | | 157,291 | | $ | | 4,007,411 | | | | 739,124 | | $ | | 17,427,842 | |
| Dividends reinvested | | — | | | | — | | | | 12,944 | | | | 312,984 | |
| Shares redeemed | | (448,085 | ) | | | (11,017,103 | ) | | | (679,452 | ) | | | (15,850,906 | ) |
| Net increase (decrease) | | (290,794 | ) | $ | | (7,009,692 | ) | | | 72,616 | | $ | | 1,889,920 | |
| Class C: | | | | | | | | | | | | | | | |
| Shares sold | | 198,335 | | $ | | 4,801,177 | | | | 319,341 | | $ | | 7,354,428 | |
| Dividends reinvested | | — | | | | — | | | | 3,659 | | | | 86,524 | |
| Shares redeemed | | (84,234 | ) | | | (2,091,418 | ) | | | (83,332 | ) | | | (1,913,105 | ) |
| Net increase | | 114,101 | | $ | | 2,709,759 | | | | 239,668 | | $ | | 5,527,847 | |
| Class I: | | | | | | | | | | | | | | | |
| Shares sold | | 232,261 | | $ | | 6,130,645 | | | | 477,738 | | $ | | 11,361,669 | |
| Dividends reinvested | | — | | | | — | | | | 9,363 | | | | 227,418 | |
| Shares redeemed | | (389,251 | ) | | | (9,923,383 | ) | | | (561,466 | ) | | | (13,260,188 | ) |
| Net decrease | | (156,990 | ) | $ | | (3,792,738 | ) | | | (74,365 | ) | $ | | (1,671,101 | ) |
| Class Y: | | | | | | | | | | | | | | | |
| Shares sold | | 372 | | $ | | 10,000 | | | | — | | $ | | — | |
| Net increase | | 372 | | $ | | 10,000 | | | | — | | $ | | — | |
| Class Z: | | | | | | | | | | | | | | | |
| Shares sold | | 1,241,518 | | $ | | 32,988,434 | | | | 787,965 | | $ | | 19,023,071 | |
| Dividends reinvested | | — | | | | — | | | | 4,919 | | | | 120,412 | |
| Shares redeemed | | (146,833 | ) | | | (3,809,383 | ) | | | (298,013 | ) | | | (6,956,934 | ) |
| Net increase | | 1,094,685 | | $ | | 29,179,051 | | | | 494,871 | | $ | | 12,186,549 | |
| |
| Alger Mid Cap Growth Institutional Fund | | | | | | | | | | | | | | |
| Class I: | | | | | | | | | | | | | | | |
| Shares sold | | 207,801 | | $ | | 4,959,148 | | | | 468,253 | | $ | | 10,046,363 | |
| Shares redeemed | | (800,877 | ) | | | (18,693,571 | ) | | | (1,780,941 | ) | | | (38,571,631 | ) |
| Net decrease | | (593,076 | ) | $ | | (13,734,423 | ) | | | (1,312,688 | ) | $ | | (28,525,268 | ) |
| Class R: | | | | | | | | | | | | | | | |
| Shares sold | | 56,881 | | $ | | 1,242,615 | | | | 134,848 | | $ | | 2,706,730 | |
| Shares redeemed | | (161,576 | ) | | | (3,513,932 | ) | | | (327,778 | ) | | | (6,575,334 | ) |
| Net decrease | | (104,695 | ) | $ | | (2,271,317 | ) | | | (192,930 | ) | $ | | (3,868,604 | ) |
| Class Z-2: | | | | | | | | | | | | | | | |
| Shares sold | | 205,644 | | $ | | 4,724,477 | | | | 5,241 | | $ | | 115,000 | |
| Shares redeemed | | (13,378 | ) | | | (317,550 | ) | | | — | | | | — | |
| Net increase | | 192,266 | | $ | | 4,406,927 | | | | 5,241 | | $ | | 115,000 | |
- 70 -
THE ALGER INSTITUTIONAL FUNDS
NOTES TO FINANCIAL STATEMENTS (Unaudited) (Continued)
| | | | | | | | | | | | | | | |
| | FOR THE SIX MONTHS ENDED | | | | FOR THE YEAR ENDED | |
| | | APRIL 30, 2017 | | | | OCTOBER 31, 2016 | |
| | | SHARES | | | | AMOUNT | | | | SHARES | | | | AMOUNT | |
| Alger Small Cap Growth Institutional Fund | | | | | | | | | | | | | |
| Class I: | | | | | | | | | | | | | | | |
| Shares sold | | 460,713 | | $ | | 7,700,868 | | | | 2,557,038 | | | $ | 40,363,890 | |
| Dividends reinvested | | — | | | | — | | | | 7,154,149 | | | | 109,458,479 | |
| Shares redeemed | | (2,614,218 | ) | | | (42,859,348 | ) | | | (16,460,370 | ) | | (250,251,908 | ) |
| Net decrease | | (2,153,505 | ) | $ | | (35,158,480 | ) | | | (6,749,183) | | | $ | (100,429,539) | |
| Class R: | | | | | | | | | | | | | | | |
| Shares sold | | 127,388 | | $ | | 1,857,205 | | | | 182,259 | | | $ | 2,391,486 | |
| Dividends reinvested | | — | | | | — | | | | 449,925 | | | | 5,907,509 | |
| Shares redeemed | | (385,269 | ) | | | (5,538,257 | ) | | | (519,276 | ) | | | (7,069,366 | ) |
| Net increase (decrease) | | (257,881 | ) | $ | | (3,681,052 | ) | | | 112,908 | | | $ | 1,229,629 | |
| Class Z-2: | | | | | | | | | | | | | | | |
| Shares sold | | 755,258 | | $ | | 12,317,122 | | | | 2,959,159 | | | $ | 46,531,746 | |
| Shares redeemed | | (641,488 | ) | | | (10,747,630 | ) | | | (143,150 | ) | | | (2,218,266 | ) |
| Net increase | | 113,770 | | $ | | 1,569,492 | | | | 2,816,009 | | | $ | 44,313,480 | |
NOTE 7 — Income Tax Information:
At October 31, 2016, the Funds, for federal income tax purposes, had capital loss
carryforwards as set forth in the table below. These amounts may be applied against future
net realized gains until the earlier of their utilization or expiration.
| | | | | | | | |
| | Alger Capital | Alger Capital | | Alger Mid | | Alger Small |
| | Appreciation | Appreciation Focus | | Cap Growth | | Cap Growth |
| Expiration Dates | Institutional Fund | | Fund | Institutional Fund | Institutional Fund |
| POST ACT | | — | $ | 1,858,285 | $ | 1,083,689 | $ | 6,331,009 |
| 2017 | | — | | — | | 280,123,926 | | — |
| Total | | — | | 1,858,285 | | 281,207,615 | | 6,331,009 |
Under the Regulated Investment Company Modernization Act of 2010, capital losses
incurred by the Funds on or after January 1, 2011 (Post Act) will not be subject to expiration.
In addition, losses incurred on or after January 1, 2011 must be utilized prior to the utilization
of capital loss carryforwards above.
The difference between book-basis and tax-basis unrealized appreciation (depreciation) is
determined annually and is attributable primarily to the tax deferral of losses on wash sales,
U.S. Internal Revenue Code Section 988 currency transactions, nondeductible expenses
on dividends sold short, the tax treatment of partnerships investments, the realization of
unrealized appreciation of passive foreign investment companies, and return of capital from
real estate investment trust investments.
The Funds accrue tax on unrealized gains in foreign jurisdictions that impose a foreign
capital tax.
- 71 -
THE ALGER INSTITUTIONAL FUNDS
NOTES TO FINANCIAL STATEMENTS (Unaudited) (Continued)
NOTE 8 — Fair Value Measurements
The following is a summary of the inputs used as of April 30, 2017 in valuing the Funds’
investments carried at fair value on a recurring basis. Based upon the nature, characteristics,
and risks associated with their investments, the Funds have determined that presenting them
by security type and sector is appropriate.
| | | | | | | | | | | | | | | | | | |
| Alger Capital Appreciation | | | | | | | | | | | | | | | | | | |
| Institutional Fund | | | | TOTAL FUND | | | | LEVEL 1 | | | | LEVEL 2 | | | LEVEL 3 | |
| COMMON STOCKS | | | | | | | | | | | | | | | | | | |
| Consumer Discretionary | $ | 672,206,660 | $ | 672,206,660 | | | | | — | | | — | |
| Consumer Staples | | | | 111,443,312 | | 111,443,312 | | | | | — | | | — | |
| Energy | | | | 60,843,857 | | 60,843,857 | | | | | — | | | — | |
| Financials | | | | 129,304,455 | | 129,304,455 | | | | | — | | | — | |
| Health Care | | | | 483,169,256 | | 483,169,256 | | | | | — | | | — | |
| Industrials | | | | 217,907,311 | | 217,907,311 | | | | | — | | | — | |
| Information Technology | | | | 1,432,180,639 | | | | 1,430,727,337 | | | | | — | | 1,453,302 | * |
| Materials | | | | 61,263,575 | | 61,263,575 | | | | | — | | | — | |
| Telecommunication Services | | | | 41,200,180 | | 41,200,180 | | | | | — | | | — | |
| TOTAL COMMON STOCKS | $ | 3,209,519,245 | $ | 3,208,065,943 | | | | | — | $ | | 1,453,302 | |
| CORPORATE BONDS | | | | | | | | | | | | | | | | | | |
| Information Technology | | | | | — | | | | — | | | | | — | | | —* | |
| MASTER LIMITED PARTNERSHIP | | | | | | | | | | | | | | | | | | |
| Financials | | | | 32,175,557 | | 32,175,557 | | | | | — | | | — | |
| PREFERRED STOCKS | | | | | | | | | | | | | | | | | | |
| Health Care | | | | | 6,344,237 | | | | — | | | | | — | | 6,344,237 | |
| Information Technology | | | | | 6,699,236 | | | | — | | | | | — | | 6,699,236 | * |
| TOTAL PREFERRED STOCKS | | $ | 13,043,473 | | | | — | | | | | — | $ | | 13,043,473 | |
| REAL ESTATE INVESTMENT TRUST | | | | | | | | | | | | | | | | |
| Real Estate | | | | 57,761,093 | | 57,761,093 | | | | | — | | | — | |
| WARRANTS | | | | | | | | | | | | | | | | | | |
| Information Technology | | | | | — | | | | — | | | | | — | | | —* | |
| TOTAL INVESTMENTS IN | | | | | | | | | | | | | | | | | | |
| SECURITIES | $ | 3,312,499,368 | $ | 3,298,002,593 | | | | | — | $ | | 14,496,775 | |
*Alger Capital Appreciation Institutional Fund’s shares of Choicestream Inc. common
stock, preferred stock, corporate bonds and warrants are classified as a Level 3 investment
and are fair valued at zero as of April 30, 2017.
- 72 -
THE ALGER INSTITUTIONAL FUNDS
NOTES TO FINANCIAL STATEMENTS (Unaudited) (Continued)
| | | | | | | | | | | | | | | | |
| Alger Capital Appreciation Focus | | | | | | | | | | | | | | | | |
| Fund | | | TOTAL FUND | | | | LEVEL 1 | | | LEVEL 2 | | | LEVEL 3 | |
| COMMON STOCKS | | | | | | | | | | | | | | | | |
| Consumer Discretionary | $ 20,451,839 | $ | 20,451,839 | | | | — | | | — | |
| Consumer Staples | | | | 2,683,880 | | | 2,683,880 | | | | — | | | — | |
| Energy | | | | 2,137,440 | | | 2,137,440 | | | | — | | | — | |
| Financials | | | | 5,438,440 | | | 5,438,440 | | | | — | | | — | |
| Health Care | | | 11,564,818 | | 11,564,818 | | | | — | | | — | |
| Industrials | | | | 5,020,205 | | | 5,020,205 | | | | — | | | — | |
| Information Technology | | | 52,678,078 | | 52,678,078 | | | | — | | | — | |
| Materials | | | | 986,591 | | | 986,591 | | | | — | | | — | |
| TOTAL COMMON STOCKS | $ | 100,961,291 | | $ | | 100,961,291 | | | | — | | | — | |
| MASTER LIMITED PARTNERSHIP | | | | | | | | | | | | | | | | |
| Financials | | | | 1,763,369 | | | 1,763,369 | | | | — | | | — | |
| PREFERRED STOCKS | | | | | | | | | | | | | | | | |
| Health Care | | | | 259,668 | | | | — | | | | — | | 259,668 | |
| REAL ESTATE INVESTMENT TRUST | | | | | | | | | | | | | |
| Real Estate | | | | 1,110,699 | | | 1,110,699 | | | | — | | | — | |
| TOTAL INVESTMENTS IN | | | | | | | | | | | | | | | | |
| SECURITIES | $ | 104,095,027 | | $ | | 103,835,359 | | | | — | $ | | 259,668 | |
| |
| |
| Alger Mid Cap Growth Institutional | | | | | | | | | | | | | | | | |
| Fund | | | TOTAL FUND | | | | LEVEL 1 | | | LEVEL 2 | | | LEVEL 3 | |
| COMMON STOCKS | | | | | | | | | | | | | | | | |
| Consumer Discretionary | $ 15,907,810 | $ | 15,907,810 | | | | — | | | — | |
| Consumer Staples | | | | 3,541,697 | | | 3,541,697 | | | | — | | | — | |
| Energy | | | | 1,355,448 | | | 1,355,448 | | | | — | | | — | |
| Financials | | | | 6,399,871 | | | 6,399,871 | | | | — | | | — | |
| Health Care | | | 18,514,668 | | 18,514,668 | | | | — | | | — | |
| Industrials | | | 12,138,912 | | 12,138,912 | | | | — | | | — | |
| Information Technology | | | 26,197,653 | | 26,122,103 | | | | — | | 75,550 | * |
| Materials | | | | 4,453,727 | | | 4,453,727 | | | | — | | | — | |
| TOTAL COMMON STOCKS | $ | 88,509,786 | | $ | | 88,434,236 | | | | — | $ | | 75,550 | |
| CORPORATE BONDS | | | | | | | | | | | | | | | | |
| Information Technology | | | | — | | | | — | | | | — | | | —* | |
| PREFERRED STOCKS | | | | | | | | | | | | | | | | |
| Health Care | | | | 992,261 | | | | — | | | | — | | 992,261 | |
| Information Technology | | | | 348,244 | | | | — | | | | — | | 348,244 | * |
| TOTAL PREFERRED STOCKS | $ | 1,340,505 | | | | — | | | | — | $ | | 1,340,505 | |
| REAL ESTATE INVESTMENT TRUST | | | | | | | | | | | | | | | |
| Real Estate | | | | 3,350,280 | | | 3,350,280 | | | | — | | | — | |
| SPECIAL PURPOSE VEHICLE | | | | | | | | | | | | | | | | |
| Financials | | | | 273,003 | | | | — | | | | — | | 273,003 | |
| RIGHTS | | | | | | | | | | | | | | | | |
| Health Care | | | | 919,488 | | | | — | | | | — | | 919,488 | |
| WARRANTS | | | | | | | | | | | | | | | | |
| Information Technology | | | | — | | | | — | | | | — | | | —* | |
| TOTAL INVESTMENTS IN | | | | | | | | | | | | | | | | |
| SECURITIES | $ | 94,393,062 | | $ | | 91,784,516 | | | | — | $ | | 2,608,546 | |
- 73 -
THE ALGER INSTITUTIONAL FUNDS
NOTES TO FINANCIAL STATEMENTS (Unaudited) (Continued)
* Alger Mid Cap Growth Institutional Fund’s shares of Choicestream Inc. common stock
preferred stock, corporate bonds and warrants are classified as a Level 3 investment and are
fair valued at zero as of April 30, 2017.
| | | | | | | | | | | | | | | |
| Alger Small Cap Growth Institutional | | | | | | | | | | | | | | | |
| Fund | | | TOTAL FUND | | | | LEVEL 1 | | | LEVEL 2 | | | LEVEL 3 | |
| COMMON STOCKS | | | | | | | | | | | | | | | |
| Consumer Discretionary | $ 11,899,076 | $ | 11,899,076 | | | — | | | — | |
| Consumer Staples | | | | 3,219,926 | | | 3,219,926 | | | — | | | — | |
| Energy | | | | 3,664,693 | | | 3,664,693 | | | — | | | — | |
| Financials | | | | 8,739,634 | | | 8,739,634 | | | — | | | — | |
| Health Care | | | 61,901,450 | | 61,901,450 | | | — | | | — | |
| Industrials | | | 14,515,894 | | 14,515,894 | | | — | | | — | |
| Information Technology | | | 63,614,658 | | 63,614,658 | | | — | | | — | |
| Materials | | | | 4,416,598 | | | 4,416,598 | | | — | | | — | |
| TOTAL COMMON STOCKS | $ | 171,971,929 | | $ | | 171,971,929 | | | — | | | — | |
| PREFERRED STOCKS | | | | | | | | | | | | | | | |
| Health Care | | | | 2,793,572 | | | | — | | | — | | 2,793,572 | |
| REAL ESTATE INVESTMENT TRUST | | | | | | | | | | | | | | |
| Real Estate | | | | 1,782,466 | | | 1,782,466 | | | — | | | — | |
| RIGHTS | | | | | | | | | | | | | | | |
| Health Care | | | | 1,149,140 | | | | — | | | —* | | | 1,149,140 | ** |
| SPECIAL PURPOSE VEHICLE | | | | | | | | | | | | | | | |
| Financials | | | | 880,398 | | | | — | | | — | | 880,398 | |
| TOTAL INVESTMENTS IN | | | | | | | | | | | | | | | |
| SECURITIES | $ | 178,577,505 | | $ | | 173,754,395 | | | — | $ | | 4,823,110 | |
*Alger Small Cap Growth Institutional Fund’s holdings of Neuralstern, Inc. rights are
classified as a Level 2 investment and are fair valued at zero as of April 30, 2017.
**Alger Small Cap Growth Institutional Fund’s holdings of Dyax Corp.’s Inc. rights are
classified as a Level 3 investment and fair valued at zero as of April 30, 2017.
- 74 -
THE ALGER INSTITUTIONAL FUNDS
NOTES TO FINANCIAL STATEMENTS (Unaudited) (Continued)
| | | | |
| | | FAIR VALUE | |
| | MEASUREMENTS | |
| | USING SIGNIFICANT | |
| | UNOBSERVABLE | |
| | INPUTS (LEVEL 3) | |
| Alger Capital Appreciation Institutional Fund | Common Stocks | |
| Opening balance at November 1, 2016 | $ | 1,828,579 | |
| Transfers into Level 3 | | | – | |
| Transfers out of Level 3 | | | – | |
| Total gains or losses | | | | |
| Included in net realized gain (loss) on investments | | – | |
| Included in net unrealized gain (loss) on investments | | (375,277 | ) |
| Purchases and sales | | | | |
| Purchases | | – | |
| Sales | | – | |
| Closing balance at April 30, 2017 | | | 1,453,302 | |
| The amount of total gains or losses for the period included in net realized | | | | |
| and unrealized gain (loss) attributable to change in unrealized appreciation | | | | |
| (depreciation) relating to investments still held at 4/30/2017 | $ | (375,277 | ) |
| |
| Alger Capital Appreciation Institutional Fund | Corporate Bonds | |
| Opening balance at November 1, 2016 | $ | 574,662 | |
| Transfers into Level 3 | | | – | |
| Transfers out of Level 3 | | | – | |
| Total gains or losses | | | | |
| Included in net realized gain (loss) on investments | | – | |
| Included in net unrealized gain (loss) on investments | | (574,662 | ) |
| Purchases and sales | | | | |
| Purchases | | – | |
| Sales | | – | |
| Closing balance at April 30, 2017 | | | 0 | |
| The amount of total gains or losses for the period included in net realized | | | | |
| and unrealized gain (loss) attributable to change in unrealized appreciation | | | | |
| (depreciation) relating to investments still held at 4/30/2017 | $ | (574,662 | ) |
- 75 -
THE ALGER INSTITUTIONAL FUNDS
NOTES TO FINANCIAL STATEMENTS (Unaudited) (Continued)
| | | | |
| | | FAIR VALUE | |
| | MEASUREMENTS | |
| | USING SIGNIFICANT | |
| | UNOBSERVABLE | |
| | INPUTS (LEVEL 3) | |
| Alger Capital Appreciation Institutional Fund | Preferred Stocks | |
| Opening balance at November 1, 2016 | $ | 16,273,256 | |
| Transfers into Level 3 | | | – | |
| Transfers out of Level 3 | | | – | |
| Total gains or losses | | | | |
| Included in net realized gain (loss) on investments | | – | |
| Included in net unrealized gain (loss) on investments | | (3,229,7836 | ) |
| Purchases and sales | | | | |
| Purchases | | – | |
| Sales | | – | |
| Closing balance at April 30, 2017 | | | 13,043,473 | |
| The amount of total gains or losses for the period included in net realized | | | | |
| and unrealized gain (loss) attributable to change in unrealized appreciation | | | | |
| (depreciation) relating to investments still held at 4/30/2017 | $ | (3,229,7836 | ) |
| |
| Alger Capital Appreciation Institutional Fund | | | Warrants | |
| Opening balance at November 1, 2016 | $ | 563,169 | |
| Transfers into Level 3 | | | – | |
| Transfers out of Level 3 | | | – | |
| Total gains or losses | | | | |
| Included in net realized gain (loss) on investments | | – | |
| Included in net unrealized gain (loss) on investments | | (563,169 | ) |
| Purchases and sales | | | | |
| Purchases | | – | |
| Sales | | – | |
| Closing balance at April 30, 2017 | | | 0 | |
| The amount of total gains or losses for the period included in net realized | | | | |
| and unrealized gain (loss) attributable to change in unrealized appreciation | | | | |
| (depreciation) relating to investments still held at 4/30/2017 | $ | (563,169 | ) |
- 76 -
THE ALGER INSTITUTIONAL FUNDS
NOTES TO FINANCIAL STATEMENTS (Unaudited) (Continued)
| | | | |
| | | FAIR VALUE | |
| | MEASUREMENTS | |
| | USING SIGNIFICANT | |
| | UNOBSERVABLE | |
| | INPUTS (LEVEL 3) | |
| Alger Capital Appreciation Focus Fund | Preferred Stocks | |
| Opening balance at November 1, 2016 | $ | 310,373 | |
| Transfers into Level 3 | | | – | |
| Transfers out of Level 3 | | | – | |
| Total gains or losses | | | | |
| Included in net realized gain (loss) on investments | | – | |
| Included in net unrealized gain (loss) on investments | | (50,705 | ) |
| Purchases and sales | | | | |
| Purchases | | – | |
| Sales | | – | |
| Closing balance at April 30, 2017 | | | 259,668 | |
| The amount of total gains or losses for the period included in net realized | | | | |
| and unrealized gain (loss) attributable to change in unrealized appreciation | | | | |
| (depreciation) relating to investments still held at 4/30/2017 | $ | (50,705 | ) |
| |
| | | FAIR VALUE | |
| | MEASUREMENTS | |
| | USING SIGNIFICANT | |
| | UNOBSERVABLE | |
| | INPUTS (LEVEL 3) | |
| Alger Mid Cap Growth Institutional Fund | Common Stocks | |
| Opening balance at November 1, 2016 | $ | 95,059 | |
| Transfers into Level 3 | | | – | |
| Transfers out of Level 3 | | | – | |
| Total gains or losses | | | | |
| Included in net realized gain (loss) on investments | | – | |
| Included in net unrealized gain (loss) on investments | | (19,509 | ) |
| Purchases and sales | | | | |
| Purchases | | – | |
| Sales | | – | |
| Closing balance at April 30, 2017 | | | 75,550 | |
| The amount of total gains or losses for the period included in net realized | | | | |
| and unrealized gain (loss) attributable to change in unrealized appreciation | | | | |
| (depreciation) relating to investments still held at 4/30/2017 | $ | (19,509 | ) |
- 77 -
THE ALGER INSTITUTIONAL FUNDS
NOTES TO FINANCIAL STATEMENTS (Unaudited) (Continued)
| | | | |
| | | FAIR VALUE | |
| | MEASUREMENTS | |
| | USING SIGNIFICANT | |
| | UNOBSERVABLE | |
| | INPUTS (LEVEL 3) | |
| Alger Mid Cap Growth Institutional Fund | Corporate Bonds | |
| Opening balance at November 1, 2016 | $ | 17,128 | |
| Transfers into Level 3 | | | – | |
| Transfers out of Level 3 | | | – | |
| Total gains or losses | | | | |
| Included in net realized gain (loss) on investments | | – | |
| Included in net unrealized gain (loss) on investments | | (17,128 | ) |
| Purchases and sales | | | | |
| Purchases | | – | |
| Sales | | – | |
| Closing balance at April 30, 2017 | | | 0 | |
| The amount of total gains or losses for the period included in net realized | | | | |
| and unrealized gain (loss) attributable to change in unrealized appreciation | | | | |
| (depreciation) relating to investments still held at 4/30/2017 | $ | (17,128 | ) |
| |
| Alger Mid Cap Growth Institutional Fund | Preferred Stocks | |
| Opening balance at November 1, 2016 | $ | 2,084,875 | |
| Transfers into Level 3 | | | – | |
| Transfers out of Level 3 | | | – | |
| Total gains or losses | | | | |
| Included in net realized gain (loss) on investments | | 2,359,646 | |
| Included in net unrealized gain (loss) on investments | | 22,364 | |
| Purchases and sales | | | | |
| Purchases | | – | |
| Sales | | (3,126,380 | ) |
| Closing balance at April 30, 2017 | | | 1,340,505 | |
| The amount of total gains or losses for the period included in net realized | | | | |
| and unrealized gain (loss) attributable to change in unrealized appreciation | | | | |
| (depreciation) relating to investments still held at 4/30/2017 | $ | 2,382,010 | |
- 78 -
THE ALGER INSTITUTIONAL FUNDS
NOTES TO FINANCIAL STATEMENTS (Unaudited) (Continued)
| | | | |
| | | FAIR VALUE | |
| | MEASUREMENTS | |
| | USING SIGNIFICANT | |
| | UNOBSERVABLE | |
| | INPUTS (LEVEL 3) | |
| | Special Purpose | |
| Alger Mid Cap Growth Institutional Fund | | | Vehicle | |
| Opening balance at November 1, 2016 | $ | 249,760 | |
| Transfers into Level 3 | | | – | |
| Transfers out of Level 3 | | | – | |
| Total gains or losses | | | | |
| Included in net realized gain (loss) on investments | | – | |
| Included in net unrealized gain (loss) on investments | | 23,243 | |
| Purchases and sales | | | | |
| Purchases | | – | |
| Sales | | – | |
| Closing balance at April 30, 2017 | | | 273,003 | |
| The amount of total gains or losses for the period included in net realized | | | | |
| and unrealized gain (loss) attributable to change in unrealized appreciation | | | | |
| (depreciation) relating to investments still held at 4/30/2017 | $ | 23,243 | |
| |
| Alger Mid Cap Growth Institutional Fund | | | Rights | |
| Opening balance at November 1, 2016 | $ | – | |
| Transfers into Level 3 | | | — | |
| Transfers out of Level 3 | | | – | |
| Total gains or losses | | | | |
| Included in net realized gain (loss) on investments | | – | |
| Included in net unrealized gain (loss) on investments | | 693,302 | |
| Purchases and sales | | | | |
| Purchases | | 226,186 | |
| Sales | | – | |
| Closing balance at April 30, 2017 | | | 919,488 | |
| The amount of total gains or losses for the period included in net realized | | | | |
| and unrealized gain (loss) attributable to change in unrealized appreciation | | | | |
| (depreciation) relating to investments still held at 4/30/2017 | $ | 693,302 | |
- 79 -
THE ALGER INSTITUTIONAL FUNDS
NOTES TO FINANCIAL STATEMENTS (Unaudited) (Continued)
| | | | |
| | | FAIR VALUE | |
| | MEASUREMENTS | |
| | USING SIGNIFICANT | |
| | UNOBSERVABLE | |
| | INPUTS (LEVEL 3) | |
| Alger Mid Cap Growth Institutional Fund | | | Warrants | |
| Opening balance at November 1, 2016 | $ | 16,785 | |
| Transfers into Level 3 | | | – | |
| Transfers out of Level 3 | | | – | |
| Total gains or losses | | | | |
| Included in net realized gain (loss) on investments | | – | |
| Included in net unrealized gain (loss) on investments | | (16,785 | ) |
| Purchases and sales | | | | |
| Purchases | | – | |
| Sales | | – | |
| Closing balance at April 30, 2017 | | | 0 | |
| The amount of total gains or losses for the period included in net realized | | | | |
| and unrealized gain (loss) attributable to change in unrealized appreciation | | | | |
| (depreciation) relating to investments still held at 4/30/2017 | $ | (16,785 | ) |
| |
| |
| Alger Mid Cap Growth Institutional Fund | Escrow Receivable | |
| Opening balance at November 1, 2016 | $ | – | |
| Transfers into Level 3 | | | – | |
| Transfers out of Level 3 | | | – | |
| Total gains or losses | | | | |
| Included in net realized gain (loss) on investments | | – | |
| Included in net unrealized gain (loss) on investments | | 237,255 | |
| Purchases and sales | | | | |
| Purchases | | 77,403 | |
| Sales | | – | |
| Closing balance at April 30, 2017 | | | 314,658 | |
| The amount of total gains or losses for the period included in net realized | | | | |
| and unrealized gain (loss) attributable to change in unrealized appreciation | | | | |
| (depreciation) relating to investments still held at 4/30/2017 | $ | 237,255 | |
- 80 -
THE ALGER INSTITUTIONAL FUNDS
NOTES TO FINANCIAL STATEMENTS (Unaudited) (Continued)
| | | | |
| | | FAIR VALUE | |
| | MEASUREMENTS | |
| | USING SIGNIFICANT | |
| | UNOBSERVABLE | |
| | INPUTS (LEVEL 3) | |
| Alger Small Cap Growth Institutional Fund | Preferred Stocks | |
| Opening balance at November 1, 2016 | $ | 3,468,884 | |
| Transfers into Level 3 | | | – | |
| Transfers out of Level 3 | | | – | |
| Total gains or losses | | | | |
| Included in net realized gain (loss) on investments | | 2,938,664 | |
| Included in net unrealized gain (loss) on investments | | 293,253 | |
| Purchases and sales | | | | |
| Purchases | | – | |
| Sales | | (3,907,229 | ) |
| Closing balance at April 30, 2017 | | | 2,793,572 | |
| The amount of total gains or losses for the period included in net realized | | | | |
| and unrealized gain (loss) attributable to change in unrealized appreciation | | | | |
| (depreciation) relating to investments still held at 4/30/2017 | $ | 3,231,917 | |
| |
| Alger Small Cap Growth Institutional Fund | | | Rights | |
| Opening balance at November 1, 2016 | $ | – | |
| Transfers into Level 3 | | | – | |
| Transfers out of Level 3 | | | – | |
| Total gains or losses | | | | |
| Included in net realized gain (loss) on investments | | – | |
| Included in net unrealized gain (loss) on investments | | 863,414 | |
| Purchases and sales | | | | |
| Purchases | | 285,726 | |
| Sales | | – | |
| Closing balance at April 30, 2017 | | | 1,149,140 | |
| The amount of total gains or losses for the period included in net realized | | | | |
| and unrealized gain (loss) attributable to change in unrealized appreciation | | | | |
| (depreciation) relating to investments still held at 4/30/2017 | $ | 863,414 | |
| *Alger Small Cap Growth Fund’s Level 3 rights are fair valued at zero at the beginning and ending of | | | | |
| the period. | | | | |
- 81 -
THE ALGER INSTITUTIONAL FUNDS
NOTES TO FINANCIAL STATEMENTS (Unaudited) (Continued)
| | | | |
| | Special Purpose | |
| Alger Small Cap Growth Institutional Fund | | | Vehicle | |
| Opening balance at November 1, 2016 | $ | 805,442 | |
| Transfers into Level 3 | | | – | |
| Transfers out of Level 3 | | | – | |
| Total gains or losses | | | | |
| Included in net realized gain (loss) on investments | | – | |
| Included in net unrealized gain (loss) on investments | | 74,955 | |
| Purchases and sales | | | | |
| Purchases | | – | |
| Sales | | – | |
| Closing balance at April 30, 2017 | | | 880,397 | |
| The amount of total gains or losses for the period included in net realized | | | | |
| and unrealized gain (loss) attributable to change in unrealized appreciation | | | | |
| (depreciation) relating to investments still held at 4/30/2017 | $ | 74,955 | |
| |
| Alger Small Cap Growth Institutional Fund | Escrow Receivable | |
| Opening balance at November 1, 2016 | $ | – | |
| Transfers into Level 3 | | | – | |
| Transfers out of Level 3 | | | – | |
| Total gains or losses | | | | |
| Included in net realized gain (loss) on investments | | – | |
| Included in net unrealized gain (loss) on investments | | 295,469 | |
| Purchases and sales | | | | |
| Purchases | | 97,779 | |
| Sales | | – | |
| Closing balance at April 30, 2017 | | | 393,248 | |
| The amount of total gains or losses for the period included in net realized | | | | |
| and unrealized gain (loss) attributable to change in unrealized appreciation | | | | |
| (depreciation) relating to investments still held at 4/30/2017 | $ | 295,469 | |
The following table provides quantitative information about our Level 3 fair value
measurements of our investments as of April 30, 2017. In addition to the techniques and
inputs noted in the table below, according to our valuation policy we may also use other
valuation techniques and methodologies when determining our fair value measurements.
The table below is not intended to be all-inclusive, but rather provides information on the
Level 3 inputs as they relate to our fair value measurements.
| | | | | | | |
| | | Fair Value | Valuation | Unobservable | | | Weighted Average |
| | | April 30, 2017 | Methodology | Input | Input/Range | | Inputs |
| Alger Capital Appreciation Institutional Fund | | | | |
| Common Stocks | $ | 0 | Income | Discount Rate | 40 | % | N/A |
| | | | Approach | | | | |
| Common Stocks | | 1,453,302 | Income | Revenue Multiple | 10x | -18x | N/A |
| | | | Approach | Discount Rate | 20 | % | |
- 82 -
THE ALGER INSTITUTIONAL FUNDS
NOTES TO FINANCIAL STATEMENTS (Unaudited) (Continued)
| | | | | | | |
| | | | | Scenario | 10-50 | % | |
| | | | | Probability | | | |
| | | | | Time to Exit | 0.8-2.8 Years | | |
| Preferred Stocks | | 0 | Income | Discount Rate | 40 | % | N/A |
| | | Approach | | | | |
| Preferred Stocks | | 6,344,237 | Market | Scenario | 80 to 100% | | N/A |
| | | | Approach | Probability | | | |
| | | | | Time to Exit | 0.5-2.0 Years | | |
| | | | | Volatility | 67.8 | % | |
| Preferred Stocks | | 6,699,236 | Income | Revenue Multiple | 10x | -18x | N/A |
| | | | Approach | Discount Rate | 20 | % | |
| | | | | Scenario | 10-50 | % | |
| | | | | Probability | | | |
| | | | | Time to Exit | 0.8-2.8 Years | | |
| Warrants | | 0 | Income | Discount Rate | 40 | % | N/A |
| | | Approach | | | | |
| Corporate Bonds | | 0 | Income | Discount Rate | 40 | % | N/A |
| | | Approach | | | | |
| Alger Capital Appreciation Focus Fund | | | | | |
| Preferred Stocks | $ | 259,668 | Income | Discount Rate | 35.5-39.5% | | N/A |
| | | Approach | | | | |
| |
| Alger Mid Cap Growth Institutional Fund | | | | | |
| Common Stocks | $ | - | Income | Discount Rate | 40 | % | N/A |
| | | Approach | | | | |
| Common Stocks | | 75,550 | Income | Revenue Multiple | 10x | -18x | N/A |
| | | | Approach | Discount Rate | 20 | % | |
| | | | | Scenario | 10-50 | % | |
| | | | | Probability | | | |
| | | | | Time to Exit | 0.8-2.8 Years | | |
| Preferred Stocks | | 0 | Income | Discount Rate | 40 | % | |
| | | Approach | | | | |
| Preferred Stocks | | 561,111 | Income | Discount Rate | 35.5-39.5% | | N/A |
| | | Approach | | | | |
| Preferred Stocks | | 348,244 | Income | Revenue Multiple | 10x | -18x | N/A |
| | | | Approach | Discount Rate | 20 | % | |
| | | | | Scenario | 10-50 | % | |
| | | | | Probability | | | |
| | | | | Time to Exit | 0.8-2.8 Years | | |
| Preferred Stocks | | 431,150 | Market | Scenario | 80 to 100% | | N/A |
| | | | Approach | Probability | | | |
| | | | | Time to Exit | 0.5-2.0 Years | | |
| | | | | Volatility | 67.8 | % | |
| Special Purpose Vehicle | | 273,003 | Market | Revenue Multiple | 2.6x-3.1x | | N/A |
| | | Approach | | | | |
| Warrants | | 0 | Income | Discount Rate | 40 | % | N/A |
| | | Approach | | | | |
| Corporate Bonds | | 0 | Income | Discount Rate | 40 | % | N/A |
| | | Approach | | | | |
- 83 -
THE ALGER INSTITUTIONAL FUNDS
NOTES TO FINANCIAL STATEMENTS (Unaudited) (Continued)
| | | | | | | |
| Rights | 919,488 | Income | Discount Rate | 20.5-21.5% | | N/A | |
| | Approach | | | | | |
| Escrow Receivable | 314,658 | Income | Discount Rate | 20.5-21.5% | | N/A | |
| | Approach | | | | | |
| Alger Small Cap Growth Institutional Fund | | | | | | |
| |
| Preferred Stocks | 450,429 | Income | Discount Rate | 38.5-39.5% | | N/A | |
| | Approach | | | | | |
| Preferred Stocks | 2,343,143 | Market | Scenario | 80 to 100% | | N/A | |
| | | Approach | Probability | | | | |
| | | | Time to Exit | 0.5-2.0 Years | | | |
| | | | Volatility | 67.8 | % | | |
| Special Purpose Vehicle | 880,397 | Market | Revenue Multiple | 2.6x-3.1x | | N/A | |
| | Approach | | | | | |
| Rights | 1,149,140 | Income | Discount Rate | 20.5-21.5% | | 22 | % |
| | Approach | | | | | |
| Escrow Receivable | 393,248 | Income | Discount Rate | 20.5-21.5% | | N/A | |
| | Approach | | | | | |
The significant unobservable inputs used in the fair value measurement of the Fund’s
securities are revenue and EBITDA multiples, discount rates, and the probabilities of
success of certain outcomes. Significant increases and decreases in these inputs in isolation
and interrelationships between those inputs could result in significantly higher or lower fair
value measurements than those noted in the table above. Generally, increases in revenue and
EBITDA multiples, decreases in discount rates, and increases in the probabilities of success
results in higher fair value measurements, whereas decreases in revenues and EBITDA
multiples, increases in discount rates, and decreases in the probabilities of success results in
lower fair value measurements.
On April 30, 2017, there were no transfers of securities between Level 1 and Level 2.
Certain of the Funds’ assets and liabilities are held at carrying amount or face value, which
approximates fair value for financial statement purposes. As of April 30, 2017, such assets
are categorized within the disclosure hierarchy as follows:
| | | | | | | | | |
| | TOTAL FUND | LEVEL 1 | | LEVEL 2 | | LEVEL 3 |
| Cash, Foreign cash and Cash equivalents: | | | | | | | | | |
| Alger Capital Appreciation Institutional Fund | $ 23,032,463 | $ | 520 | $ | 23,021,944 | | | — |
| Alger Capital Appreciation Focus Fund | | 4,167,481 | | 10 | | 4,167,471 | | | — |
| Alger Mid Cap Growth Institutional Fund | | 4,808,683 | | 16 | | 4,808,667 | | | — |
| Alger Small Cap Growth Institutional Fund | | 2,089,828 | | 33 | | 2,089,795 | | | — |
NOTE 9 — Derivatives:
Financial Accounting Standards Board Accounting Standards Codification 815 – Derivatives
and Hedging (“ASC 815”) requires qualitative disclosures about objectives and strategies for
using derivatives, quantitative disclosures about fair value amounts of and gains and losses
- 84 -
THE ALGER INSTITUTIONAL FUNDS
NOTES TO FINANCIAL STATEMENTS (Unaudited) (Continued)
on derivative instruments, and disclosures about credit-risk-related contingent features in
derivative agreements.
Options— The Funds seek to capture the majority of the returns associated with equity
market investments. To meet this investment goal, the Funds invest in a broadly diversified
portfolio of common stocks, while also buying and selling call and put options on equities
and equity indexes. The Funds purchase call options to increase their exposure to the stock
market and also provide diversification of risk. The Funds purchase put options in order
to protect from significant market declines that may occur over a short period of time. The
Funds will write covered call and cash secured put options to generate cash flows while
reducing the volatility of the Funds’ portfolios. The cash flows may be an important source
of the Funds’ returns, although written call options may reduce the Funds’ ability to profit
from increases in the value of the underlying security or equity portfolio. The value of a
call option generally increases as the price of the underlying stock increases and decreases
as the stock decreases in price. Conversely, the value of a put option generally increases
as the price of the underlying stock decreases and decreases as the stock increases in price.
The combination of the diversified stock portfolio and the purchase and sale of options
is intended to provide the Funds with the majority of the returns associated with equity
market investments but with reduced volatility and returns that are augmented with the cash
flows from the sale of options. During the six months ended April 30, 2017, options were
used in accordance with these objectives.
The Funds’ option contracts were not subject to any rights of offset with any counterparty.
All of the Funds’ options were exchange traded which utilize a clearing house that acts as an
intermediary between buyer and seller, receiving initial and maintenance margin from both,
and guaranteeing performance of the option contract.
There were no open derivative instruments as of April 30, 2017.
NOTE 10 — Principal Risks:
As of April 30, 2017, the Funds invested a significant portion of their assets in securities
in the health care and information technology sectors. Changes in economic conditions
affecting such sectors would have an impact on the Funds and could affect the value, income
and/or liquidity of positions in such securities.
In the normal course of business, the Funds invest in securities and enter into transactions
where risks exist due to fluctuations in the market (market risk) or failure of the issuer
of a security to meet all its obligations (issuer credit risk). The value of securities held by
the Funds may decline in response to certain events, including those directly involving the
issuers whose securities are owned by the Funds; conditions affecting the general economy;
overall market changes; local, regional or global political, social or economic instability; and
currency and interest rate and price fluctuations. Similar to issuer credit risk, the Funds may
be exposed to counterparty credit risk, or the risk that an entity with which the Funds have
unsettled or open transactions may fail to or be unable to perform on its commitments. The
Funds manage counterparty credit risk by entering into transactions only with counterparties
that they believe have the financial resources to honor their obligations and by monitoring
- 85 -
THE ALGER INSTITUTIONAL FUNDS
NOTES TO FINANCIAL STATEMENTS (Unaudited) (Continued)
the financial stability of those counterparties. Financial assets, which potentially expose
the Funds to market, issuer and counterparty credit risks, consist principally of financial
instruments and receivables due from counterparties. The extent of the Funds’ exposure to
market, issuer and counterparty credit risks with respect to these financial assets is generally
approximated by its value recorded in the Statement of Assets and Liabilities, less any
collateral held by the Funds.
The Funds invest in companies that are not yet available in the public markets and that are
accessible only through private equity investments. The Funds may also invest in venture
capital or private equity funds, direct private equity investments and other investments that
may have limited liquidity. There may be no trading market for these securities, and their
sale or transfer may be limited or prohibited by contract or legal requirements, or may be
dependent on an exit strategy, such as an initial public offering or the sale of a business,
which may not occur, or may be dependent on managerial assistance provided by other
investors and their willingness to provide additional financial support. The securities may
be able to be liquidated, if at all, at disadvantageous prices. As a result, the Funds may be
required to hold these positions for several years, if not longer, regardless of adverse price
movements. Such positions may cause the Funds to be less liquid than would otherwise be
the case.
NOTE 11 — Affiliated Securities:
The issuers of the securities listed below are deemed to be affiliates of the Funds because
the Funds or their affiliates owned 5% or more of the issuer’s voting securities during all or
part of the six months ended April 30, 2017. Purchase and sale transactions and dividend
income earned during the period were as follows:
- 86 -
THE ALGER INSTITUTIONAL FUNDS
NOTES TO FINANCIAL STATEMENTS (Unaudited) (Continued)
| | | | | | | | | |
| | | Shares/Par | | | Shares/Par | | | | |
| | | at | | | at | | Realized | | Value at |
| | | October 31, | Purchases/ | Sales/ | April 30, | | Gain | | April 30, |
| Security | | 2016 | Conversion | Conversion | 2017 | Interest Income | (Loss) | | 2017 |
| |
| Alger Capital Appreciation Institutional Fund | | | | | | |
| Common Stocks | | | | | | | | | |
| Choicestream, Inc.* | | 124,658 | – | – | 124,658 | – | – | $ | 0 |
| Preferred Stocks | | | | | | | | | |
| Choicestream, Inc. | | | | | | | | | |
| Series A and B* | | 3,575,473 | – | – | 3,575,473 | – | – | | 0 |
| Corporate Bonds | | | | | | | | | |
| Choicestream, Inc., | | | | | | | | | |
| 11.0%, 8/05/18 | | 574,662 | – | – | 574,662 | – | – | | 0 |
| Warrants | | | | | | | | | |
| Choicestream, Inc., | | | | | | | | | |
| 6/22/26 * | 574,662 | – | – | 574,662 | – | – | | 0 |
| |
| Alger Capital Appreciation Focus Fund | | | | | | |
| Preferred Stocks | | | | | | | | | |
| Prosetta | | | | | | | | | |
| Biosciences, Inc., | | | | | | | | | |
| Series D* | | 76,825 | – | – | 76,825 | – | – | | 259,669 |
| | | | | | | | | |
| | | Shares/Par | | | Shares/Par | | | | |
| | | at | | | at | | Realized | | Value at |
| | | October 31, | Purchases/ | Sales/ | April 30, | Interest | Gain | | April 30, |
| Security | | 2016 | Conversion | Conversion | 2017 | Income | (Loss) | | 2017 |
| |
| Alger Mid Cap Growth Institutional Fund | | | | | | |
| Common Stocks | | | | | | | | | |
| Choicestream, Inc.* | | 8,930 | – | – | 8,930 | – | – | $ | 0 |
| Preferred Stocks | | | | | | | | | |
| Choicestream, Inc. | | | | | | | | | |
| Series A and B* | | 221,801 | – | – | 221,801 | – | – | | 0 |
| Prosetta Biosciences, | | | | | | | | | |
| Inc., Series D* | | 166,009 | – | – | 166,009 | – | – | | 561,110 |
| Tolero | | | | | | | | | |
| Pharmaceuticals, Inc. | | | | | | | | | |
| Series B* | | 354,870 | – | 354,870 | 0 | – | 2,359,646 | | 0 |
| Corporate Bonds | | | | | | | | | |
| Choicestream, Inc., | | | | | | | | | |
| 11.0%, 8/05/18 | | 17,128 | – | – | 17,128 | – | – | | 0 |
| Warrants | | | | | | | | | |
| Choicestream, Inc., | | | | | | | | | |
| 6/22/26 * | 17,128 | – | – | 17,128 | – | – | | 0 |
- 87 -
THE ALGER INSTITUTIONAL FUNDS
NOTES TO FINANCIAL STATEMENTS (Unaudited) (Continued)
| | | | | | | |
| Alger Small Cap Growth Institutional Fund | | | | | | |
| Preferred Stocks | | | | | | | |
| Prosetta Biosciences, | | | | | | | |
| Inc., Series D* | 133,263 | – | – | 133,263 | – | – | 450,429 |
| Tolero | | | | | | | |
| Pharmaceuticals, Inc. | | | | | | | |
| Series B* | 448,284 | – | 448,284 | – | – | 2,938,664 | – |
| * Non-income producing security. | | | | | | |
NOTE 12 — Subsequent Events:
Management of each Fund has evaluated events that have occurred subsequent to April
30, 2017 through the issuance date of the Financial Statements. No such events have been
identified which require recognition and/or disclosure.
- 88 -
THE ALGER INSTITUTIONAL FUNDS
ADDITIONAL INFORMATION (Unaudited)
Shareholder Expense Example
As a shareholder of a Fund, you incur two types of costs: transaction costs, if applicable,
including sales charges (loads) and redemption fees; and ongoing costs, including
management fees, distribution (12b-1) fees, if applicable, and other fund expenses. This
example is intended to help you understand your ongoing costs (in dollars) of investing in
the Fund and to compare these costs with the ongoing costs of investing in other mutual
funds.
The example below is based on an investment of $1,000 invested at the beginning of the
six-month period starting November 1, 2016 and ending April 30, 2017.
Actual Expenses
The first line for each class of shares in the table below provides information about actual
account values and actual expenses. You may use the information in this line, together
with the amount you invested, to estimate the expenses that you would have paid over the
period. Simply divide your account value by $1,000 (for example, an $8,600 account value
divided by $1,000 = 8.6), then multiply the result by the number in the first line under the
heading entitled “Expenses Paid during the Period” to estimate the expenses you paid on
your account during this period.
Hypothetical Example for Comparison Purposes
The second line for each class of shares in the table below provides information about
hypothetical account values and hypothetical expenses based on the Fund’s actual expense
ratios for each class of shares and an assumed rate of return of 5% per year before expenses,
which is not the Fund’s actual return. The hypothetical account values and expenses may not
be used to estimate the actual ending account balance or expenses you paid for the period.
You may use this information to compare the ongoing costs of investing in the Fund and
other funds. To do so, compare this 5% hypothetical example with the 5% hypothetical
examples that appear in the shareholder reports of other funds.
Please note that the expenses shown in the table are meant to highlight your ongoing costs
only and do not reflect any transaction costs, such as sales charges (loads) and redemption
fees. Therefore, the second line under each class of shares in the table is useful in comparing
ongoing costs only, and will not help you determine the relative total costs of owning
different funds. In addition, if these transactional costs were included, your costs would
have been higher.
- 89 -
THE ALGER INSTITUTIONAL FUNDS
ADDITIONAL INFORMATION (Unaudited) (Continued)
| | | | | | | | | | | |
| | | | | | | | | | Annualized | |
| | | | | | | | Expenses | Expense Ratio | |
| | | Beginning | | Ending | | Paid During | | For the | |
| | | | Account | | Account | | the Six Months | Six Months | |
| | | | Value | | Value | | | Ended | | Ended | |
| | | November 1, 2016 | | April 30, 2017 | | April 30, 2017(a) | April 30, 2017(b) | |
| Alger Capital Appreciation Institutional Fund | | | | | | | | | |
| Class I | Actual | $ | 1,000.00 | $ | 1,146.70 | | $ | 6.07 | | 1.13 | % |
| | Hypothetical(c) | | 1,000.00 | | 1,019.14 | | | 5.71 | | 1.13 | |
| Class R | Actual | | 1,000.00 | | 1,143.91 | | | 8.66 | | 1.63 | |
| | Hypothetical(c) | | 1,000.00 | | 1,016.71 | | | 8.15 | | 1.63 | |
| Class Y | Actual | | 1,000.00 | | 1,043.33 | | | 3.80 | | 0.75 | |
| | Hypothetical(c) | | 1,000.00 | | 1,021.08 | | | 3.76 | | 0.75 | |
| Class Z-2 | Actual | | 1,000.00 | | 1,148.60 | | | 4.47 | | 0.84 | |
| | Hypothetical(c) | | 1,000.00 | | 1,020.63 | | | 4.21 | | 0.84 | |
| | | | | | | | | | | | |
| Alger Capital Appreciation Focus Fund | | | | | | | | | | |
| Class A | Actual | $ | 1,000.00 | $ | 1,157.83 | | $ | 5.99 | | 1.12 | % |
| | Hypothetical(c) | | 1,000.00 | | 1,019.24 | | | 5.61 | | 1.12 | |
| Class C | Actual | | 1,000.00 | | 1,153.42 | | 10.04 | | 1.88 | |
| | Hypothetical(c) | | 1,000.00 | | 1,015.47 | | | 9.39 | | 1.88 | |
| Class I | Actual | | 1,000.00 | | 1,157.94 | | | 6.15 | | 1.15 | |
| | Hypothetical(c) | | 1,000.00 | | 1,019.09 | | | 5.76 | | 1.15 | |
| Class Y | Actual | | 1,000.00 | | 1,049.14 | | | 3.30 | | 0.65 | |
| | Hypothetical(c) | | 1,000.00 | | 1,021.57 | | | 3.26 | | 0.65 | |
| Class Z | Actual | | 1,000.00 | | 1,159.26 | | | 4.50 | | 0.86 | |
| | Hypothetical(c) | | 1,000.00 | | 1,020.63 | | | 4.21 | | 0.86 | |
| | | | | | | | | | | | |
| Alger Mid Cap Growth Institutional Fund | | | | | | | | | | |
| Class I | Actual | $ | 1,000.00 | $ | 1,177.40 | | $ | 6.86 | | 1.27 | % |
| | Hypothetical(c) | | 1,000.00 | | 1,018.50 | | | 6.36 | | 1.27 | |
| Class R | Actual | | 1,000.00 | | 1,173.85 | | 10.08 | | 1.87 | |
| | Hypothetical(c) | | 1,000.00 | | 1,015.52 | | | 9.35 | | 1.87 | |
| Class Z-2 | Actual | | 1,000.00 | | 1,178.79 | | | 5.62 | | 1.05 | |
| | Hypothetical(c) | | 1,000.00 | | 1,019.64 | | | 5.21 | | 1.05 | |
| | | | | | | | | | | | |
| Alger Small Cap Growth Institutional Fund | | | | | | | | | | |
| Class I | Actual | $ | 1,000.00 | $ | 1,200.27 | | $ | 7.20 | | 1.32 | % |
| | Hypothetical(c) | | 1,000.00 | | 1,018.25 | | | 6.61 | | 1.32 | |
| Class R | Actual | | 1,000.00 | | 1,196.53 | | 10.02 | | 1.84 | |
| | Hypothetical(c) | | 1,000.00 | | 1,015.67 | | | 9.20 | | 1.84 | |
| Class Z-2 | Actual | | 1,000.00 | | 1,202.16 | | | 5.41 | | 0.99 | |
| | Hypothetical(c) | | 1,000.00 | | 1,019.89 | | | 4.96 | | 0.99 | |
(a) Expenses are equal to the annualized expense ratio of the respective share class, multiplied by the average account
value over the period, multiplied by 181/365 (to reflect the one-half year period).
(b) Annualized.
(c) 5% annual return before expenses.
- 90 -
THE ALGER INSTITUTIONAL FUNDS
ADDITIONAL INFORMATION (Unaudited) (Continued)
Privacy Policy
U.S. Consumer Privacy Notice Rev. 12/20/16
| | |
| FACTS | WHAT DOES ALGER DO WITH YOUR PERSONAL INFORMATION? |
| |
| |
| Why? | Financial companies choose how they share your personal information. Federal law |
| | gives consumers the right to limit some but not all sharing. Federal law also requires us |
| | to tell you | how we collect, share, and protect your personal information. Please read this |
| | notice carefully to understand what we do. |
| What? | The types of personal information we collect and share depend on the product or service |
| | you have with us. This information can include: |
| | • | Social Security number and |
| | • | Account balances and |
| | • | Transaction history and |
| | • | Purchase history and |
| | • | Assets |
| | When you are no longer our customer, we continue to share your information as |
| | described in this notice. |
| How? | All financial companies need to share personal information to run their everyday business. |
| | In the section below, we list the reasons financial companies can share personal |
| | information; the reasons Alger chooses to share; and whether you can limit this sharing. |
| | |
| Reasons we can share your personal | Does | Can you limit |
| information | Alger share? | this sharing? |
| For our everyday business purposes — | Yes | No |
| such as to process your transactions, maintain | | |
| your account(s), respond to court orders and | | |
| legal investigations, or report to credit bureaus | | |
| For our marketing purposes — to offer our | Yes | No |
| products and services to you | | |
| For joint marketing with other financial | No | We don’t share |
| companies | | |
| For our affiliates’ everyday business | Yes | No |
| purposes — information about your | | |
| transactions and experiences | | |
| For our affiliates’ everyday business | No | We don’t share |
| purposes — information about your | | |
| creditworthiness | | |
| For nonaffiliates to market to you | No | We don’t share |
| Questions? Call 1-800-342-2186 | | |
- 91 -
THE ALGER INSTITUTIONAL FUNDS
ADDITIONAL INFORMATION (Unaudited) (Continued)
| |
| Who we are | |
| |
| Who is providing this notice? | • Alger includes Fred Alger Management, Inc. and Fred |
| | Alger & Company, Incorporated as well as the following |
| | funds: The Alger Funds, The Alger Funds II, The Alger |
| | Institutional Funds, The Alger Portfolios, and Alger |
| | Global Growth Fund. |
| |
| |
| What we do | |
| How does Alger | To protect your personal information from unauthorized |
| protect my personal | access and use, we use security measures that comply |
| information? | with federal law. These measures include computer |
| | safeguards and secured files and buildings. |
| How does Alger | We collect your personal information, for |
| collect my personal | example, when you: |
| information? | |
| | • Open an account or |
| | • Make deposits or withdrawals from your account or |
| | • Give us your contact information or |
| | • Provide account information or |
| | • Pay us by check. |
| |
| |
| Why can’t I limit all sharing? | Federal law gives you the right to limit only |
| | • sharing for affiliates’ everyday business purposes |
| | information about your credit worthiness |
| | • affiliates from using your information to market to you |
| | • sharing for nonaffiliates to market to you |
| | State laws and individual companies may give you |
| | additional rights to limit sharing. |
| |
| |
| Definitions | |
| Affiliates | Companies related by common ownership or control. |
| | They can be financial and nonfinancial companies. |
| | • Our affiliates include Fred Alger Management, Inc. |
| | and Fred Alger & Company, Incorporated as well as the |
| | following funds: The Alger Funds, The Alger Funds II, |
| | The Alger Institutional Funds, The Alger Portfolios, and |
| | Alger Global Growth Fund. |
| Nonaffiliates | Companies not related by common ownership or |
| | control. They can be financial and nonfinancial |
| | companies. |
| Joint marketing | A formal agreement between nonaffiliated financial |
| | companies that together market financial products or |
| | services to you. |
| Other important information | |
- 92 -
THE ALGER INSTITUTIONAL FUNDS
ADDITIONAL INFORMATION (Unaudited) (Continued)
Proxy Voting Policies
A description of the policies and procedures the Trust uses to determine how to vote
proxies relating to portfolio securities and information regarding how the Fund voted
proxies relating to portfolio securities during the most recent 12-month period ended June
30 are available, without charge, by calling (800) 992-3863 or online on the Funds’ website
at www.alger.com or on the SEC’s website at www.sec.gov.
Fund Holdings
The Board of Trustees has adopted policies and procedures relating to disclosure of the
Funds’ portfolio securities. These policies and procedures recognize that there may be
legitimate business reasons for holdings to be disclosed and seek to balance those interests
to protect the proprietary nature of the trading strategies and implementation thereof by
the Funds.
Generally, the policies prohibit the release of information concerning portfolio holdings
which have not previously been made public to individual investors, institutional investors,
intermediaries that distribute the Funds’ shares and other parties which are not employed
by the Manager or its affiliates except when the legitimate business purposes for selective
disclosure and other conditions (designed to protect the Funds) are acceptable.
The Funds make their full holdings available semi-annually in shareholder reports filed on
Form N-CSR and after the first and third fiscal quarters in regulatory filings on Form N-Q.
These shareholder reports and regulatory filings are filed with the SEC, as required by federal
securities laws, and are generally available within sixty (60) days of the end of the Funds’
fiscal quarter. The Funds’ Forms N-Q are available online on the SEC’s website at www.
sec.gov or may be reviewed and copied at the SEC’s Public Reference Room in Washington,
D.C. Information regarding the operation of the SEC’s Public Reference Room may be
obtained by calling 1-800-SEC-0330.
In addition, the Funds make publicly available their respective month-end top 10 holdings
with a 15 day lag and their month-end full portfolios with a 60 day lag on their website www.
alger.com and through other marketing communications (including printed advertising/
sales literature and/or shareholder telephone customer service centers). No compensation
or other consideration is received for the non-public disclosure of portfolio holdings
information.
In accordance with the foregoing, the Funds provide portfolio holdings information to
service providers who provide necessary or beneficial services when such service providers
need access to this information in the performance of their services and are subject to
duties of confidentiality (1) imposed by law, including a duty not to trade on non-public
information, and/or (2) pursuant to an agreement that confidential information is not to
be disclosed or used (including trading on such information) other than as required by law.
From time to time, the Funds will communicate with these service providers to confirm
that they understand the Funds’ policies and procedures regarding such disclosure. This
- 93 -
THE ALGER INSTITUTIONAL FUNDS
ADDITIONAL INFORMATION (Unaudited) (Continued)
agreement must be approved by the Funds’ Chief Compliance Officer, President, Secretary
or Assistant Secretary.
The Board of Trustees periodically reviews a report disclosing the third parties to whom
each Fund’s holdings information has been disclosed and the purpose for such disclosure,
and it considers whether or not the release of information to such third parties is in the best
interest of the Fund and its shareholders.
In addition to material the Funds routinely provide to shareholders, the Manager may,
upon request, make additional statistical information available regarding the Funds. Such
information will include, but not be limited to, relative weightings and characteristics of
a Fund’s portfolio versus its peers or an index (such as P/E ratio, alpha, beta, capture
ratio, maximum drawdown, standard deviation, EPS forecasts, Sharpe ratio, information
ratio, R-squared, and market cap analysis), security specific impact on overall portfolio
performance, month-end top ten contributors to and detractors from performance,
breakdown of High Unit Volume Growth holdings vs. Positive Lifecycle Change holdings,
portfolio turnover, and requests of a similar nature. Please contact the Funds at (800) 992-
3863 to obtain such information.
- 94 -
THE ALGER INSTITUTIONAL FUNDS
360 Park Avenue South
New York, NY 10010
(800) 992-3863
www.alger.com
Investment Manager
Fred Alger Management, Inc.
360 Park Avenue South
New York, NY 10010
Distributor
Fred Alger & Company, Incorporated
360 Park Avenue South
New York, NY 10010
Transfer Agent and Dividend Disbursing Agent
State Street Bank and Trust Company
c/o Boston Financial Data Services, Inc.
P.O. Box 8480
Boston, MA 02266-8480
Custodian
Brown Brothers Harriman & Company
50 Post Office Square
Boston, MA 02110
This report is submitted for the general information of the shareholders of The Alger
Institutional Funds. It is not authorized for distribution to prospective investors unless
accompanied by an effective Prospectus for the Trust, which contains information
concerning the Trust’s investment policies, fees and expenses as well as other pertinent
information.
- 95 -
(This page has been intentionally left blank.)
(This page has been intentionally left blank.)
(This page has been intentionally left blank.)
(This page has been intentionally left blank.)
(This page has been intentionally left blank.)
(This page has been intentionally left blank.)
ITEM 2. CODE OF ETHICS.
Not applicable.
ITEM 3. AUDIT COMMITTEE FINANCIAL EXPERT.
Not applicable.
ITEM 4. PRINCIPAL ACCOUNTANT FEES AND SERVICES.
Not applicable.
ITEM 5. AUDIT COMMITTEE OF LISTED REGISTRANTS.
Not applicable.
ITEM 6. INVESTMENTS.
Not applicable.
ITEM 7. DISCLOSURE OF PROXY VOTING POLICIES AND PROCEDURES FOR CLOSED-END MANAGEMENT
INVESTMENT COMPANIES.
Not applicable.
ITEM 8. PORTFOLIO MANAGERS OF CLOSED-END MANAGEMENT INVESTMENT COMPANIES.
Not applicable.
ITEM 9. PURCHASES OF EQUITY SECURITIES BY CLOSED-END MANAGEMENT INVESTMENT COMPANY
AND AFFILIATED PURCHASERS.
Not applicable.
ITEM 10. SUBMISSION OF MATTERS TO A VOTE OF SECURITY HOLDERS.
Not applicable.
ITEM 11. CONTROLS AND PROCEDURES.
(a) The Registrant’s principal executive officer and principal financial officer have concluded that
the Registrant’s disclosure controls and procedures (as defined in Rule 30a-3(c) under the
Investment Company Act of 1940, as amended) are effective based on their evaluation of the
disclosure controls and procedures as of a date within 90 days of the filing date of this document.
(b) No changes in the Registrant’s internal control over financial reporting occurred during the
Registrant’s second fiscal quarter of the period covered by this report that materially affected, or
are reasonably likely to materially affect, the Registrant’s internal control over financial reporting.
ITEM 12. EXHIBITS.
(a) (1) Not applicable
(a) (2) Certifications of principal executive officer and principal financial officer as required by rule 30a-
2(a) under the Investment Company Act of 1940 are attached as Exhibit 99.CERT
(a) (3) Not applicable
(b) Certifications of principal executive officer and principal financial officer as required by rule 30a-2(b)
under the Investment Company Act of 1940 are attached as Exhibit 99.906CERT
SIGNATURES
Pursuant to the requirements of the Securities Exchange Act of 1934 and the Investment Company
Act of 1940, the registrant has duly caused this report to be signed on its behalf by the
undersigned, thereunto duly authorized.
The Alger Institutional Funds
By: /s/Hal Liebes
Hal Liebes
President
Date: June 27, 2017
Pursuant to the requirements of the Securities Exchange Act of 1934 and the Investment Company
Act of 1940, this report has been signed below by the following persons on behalf of the registrant
and in the capacities and on the dates indicated.
By: /s/Hal Liebes
Hal Liebes
President
Date: June 27, 2017
By: /s/Michael D. Martins
Michael D. Martins
Treasurer
Date: June 27, 2017