OMB APPROVAL
OMB Number: 3235-0570
Expires: January 31, 2017
Estimated average burden
hours per response 20.6
UNITED STATES
SECURITIES AND EXCHANGE COMMISSION
Washington, D.C. 20549
FORM N-CSR
CERTIFIED SHAREHOLDER REPORT OF REGISTERED MANAGEMENT
INVESTMENT COMPANIES
Investment Company Act file number 811-07986
The Alger Institutional Funds
(Exact name of registrant as specified in charter)
360 Park Avenue South New York, New York 10010
(Address of principal executive offices) (Zip code)
Mr. Hal Liebes
Fred Alger Management, Inc.
360 Park Avenue South
New York, New York 10010
(Name and address of agent for service)
Registrant's telephone number, including area code: 212-806-8800
Date of fiscal year end: October 31
Date of reporting period: October 31, 2015
ITEM 1. REPORTS TO STOCKHOLDERS.
Table of Contents
|
| The Alger Institutional Funds |
| Shareholders’ Letter (Unaudited) | 1 |
| Fund Highlights (Unaudited) | 11 |
| Portfolio Summary (Unaudited) | 15 |
| Schedules of Investments | 16 |
| Statements of Assets and Liabilities | 39 |
| Statements of Operations | 43 |
| Statements of Changes in Net Assets | 45 |
| Financial Highlights | 49 |
| Notes to Financial Statements | 59 |
| Report of Independent Registered Public Accounting Firm | 84 |
| Additional Information (Unaudited) | 85 |
Go Paperless With Alger Electronic Delivery Service
Alger is pleased to provide you with the ability to access regulatory materials online.
When documents such as prospectuses and annual and semi-annual reports are
available, we’ll send you an e-mail notification with a convenient link that will take you
directly to the fund information on our website. To sign up for this free service, simply
enroll at www.icsdelivery.com/alger.
Shareholders' Letter October 31, 2015
Dear Shareholders,
The Importance of a Differentiated Perspective when Investing
In the aftermath of the market lows of March of 2009, commentators frequently warned
that United States equities were overdue for a catastrophic correction. In past commentaries
and shareholder letters, however, I have maintained that U.S. equities had strong potential
for generating gains, and as we have seen in the ensuing timeframe, U.S. equities have been
one of the strongest performing asset classes. We continue to believe that U.S. equities offer
attractive return potential and have appealing risk and reward dynamics. We believe that an
expanding U.S. economy, improving corporate fundamentals, strong company management,
and various international developments are likely to support equities. At the same time,
we have maintained that market dips would be opportunities for buying U.S. equities at
attractive valuations. We believe, the pundits have been wrong, and continue to be wrong,
in succumbing to a myopic view of market disruptions. This shortsightedness, which we
believe still exists today, is something that Alger’s analysts are trained to avoid.
From the market low of 2009 to October 31, 2015, the S&P 500 index had a cumulative
return of 250%. For the 12-month reporting period ended October 31 of this year, the S&P
500 generated a 5.20% gain. During the reporting period, market dips were attractive buying
opportunities, especially late in the summer, when the S&P rallied more than 10% from
the late August market low until the end of the reporting period. Foreign equity markets,
however, have been challenging. For the reporting period, the MSCI ACWI ex USA Index
generated a -4.26% return and the MSCI Emerging Markets Index declined 14.26%. We
continue to believe, however, that foreign equities have potential for generating gains over
the long term, although periods of substantial volatility will occur.
In this letter, I explain why events in the U.S. and abroad didn’t cause us to change our
outlook and how our in-depth research of industries and individual companies supported
our firm’s differentiated view of equities even as commentators increasingly opined that
markets would collapse.
Navigating Market Risk
Alger analysts focus on fundamental, research-driven stock selection and they specialize
in covering specific industries, which helps our firm keep domestic and global economic
changes and other developments in perspective. Alger’s analysts assess which companies
are likely to benefit from dynamic change and which companies are likely to fail to take
advantage of change. This philosophy, in place now for 51 years, has been our guiding
principle. In addition, our perspective isn’t limited to U.S. equities. Indeed, research from our
emerging markets and international teams helps our firm assess large-scale trends that often
drive equity markets across the globe.
Alger Research and U.S. Markets
Our perspective on declining energy prices is an example of how we assess rapid and large-
scale changes that frequently reshape the business landscape. During the reporting period,
declining oil and natural gas prices created fear that energy companies would experience
sharp declines in revenues and earnings and curtail capital expenditures. At times, investors
- 1 -
feared that the reduction in capital expenditures would also stymie economic growth or at
least extend to companies that serve the energy sector. We acknowledged that those concerns
were valid and we have, in fact, seen substantial declines in revenues for many industrial and
energy companies. Yet, throughout the reporting period, we emphasized that low fuel prices
would have a net positive impact for U.S. companies and lead to, among other things, steady
job creation that would help stimulate the U.S. economy by supporting consumer spending.
All this while lower energy prices would help reduce corporate operating costs, especially
for airlines, cruise ship operators, ink producers, paint manufacturers, and specialty chemical
providers.
Our belief in a potential shift in consumer spending was realized. During the 12-month
reporting period ended October 31, a significant decline in Americans’ spending on fuel
occurred while sales at retailers, excluding gasoline stations, climbed at a substantial rate of
4.9%, according to the U.S. Census Bureau. As a fundamental, bottom-up investment firm,
we used our knowledge of individual companies and industries to assess which corporations
had the strongest potential for benefiting from increasing consumer spending. Among
retailers, we continued to believe that leading online stores would benefit not only from
increasing consumer spending but also from capturing market share from traditional brick
and mortar companies.
The Web of Global Economics, the Federal Reserve, and Corporate Earnings
From a broader perspective, a mishmash of global and domestic developments drove
market volatility. As concerns that corporate earnings would be hurt by declining oil prices
strengthened, investors grew fearful that both a strengthening U.S. dollar and a slowdown
in economic growth in various countries, including China and Brazil, would curtail our
country’s exports. In addition, the value of U.S. multinationals’ foreign earnings could be
crimped when repatriated, thanks to the strong U.S. dollar. In Europe, fears over Greece’s
debt crisis festered along with concerns that an embargo targeting Russia in response to the
country’s intervention in the Ukraine would further hinder eurozone growth. Against that
backdrop, economic growth in the U.S. drove speculation that the Federal Reserve would
raise interest rates, thereby providing a headwind for both the economy and corporate
earnings. Fear continued in the late summer when China changed the onshore yuan’s
daily fixing calculation, which resulted in currency devaluation and misguided speculation
that the moderation of the country’s economic growth was worse than feared. Without a
doubt, those issues created a smorgasbord of fears for the financial press and pundits who
increasingly forecasted gloom and doom. As those events unfolded, however, we urged
investors to avoid overreacting to short-term disruptions and, when possible, to buy U.S.
equities during market dips.
Our Optimistic Perspective
For Alger, our best thinking comes not from listening to pundits, but instead from the
collective efforts of our more than 40-person investment team. We focus our efforts on
developing our research, improving our analysis, and understanding how change will impact
businesses. During the reporting period, we continued to serve our clients by searching
for companies across the globe with attractive potential for growing their earnings. We
reasoned that certain fears that fueled negative views of U.S. equities also created potential
opportunities and that “headline” developments were not as bad as some believed.
- 2 -
With China, we continued to believe that the country’s central bank, the People’s Bank of
China, was willing to provide additional stimulus if needed and that the country’s economy
was heading for a soft landing. Since starting its easing cycle in November of 2014, the
bank has lowered interest rates six times. It has also lowered banking reserve requirements.
China is also working to increase the role of both domestic consumption and its service
industry in fostering economic growth while the country continues to improve its global
trading infrastructure with programs such as “One Belt, One Road” and “Made in China
2025.” For the third quarter, China’s GDP grew 6.9% from the year earlier, which fell short
of the country’s goal of 7.0%. Other data, however, have been encouraging, including an
8.4% growth rate for the country’s service sector during the first nine months of the year.
We also held to our belief that central banks for Japan and the eurozone would continue
with stimulus programs, including asset purchases, or quantitative easing. While Japan’s GDP
declined marginally in the second and third quarters, we remained optimistic that stimulus,
currency weakness, and other developments such as growing corporate activism would
eventually drive expansion. Regarding the eurozone, we have maintained that conditions,
while not likely to rapidly improve, would not worsen drastically. Encouragingly, for the
second quarter of 2015, its economy expanded at a slow, but nevertheless positive, 1.5%
year-on-year rate.
During the reporting period, we also maintained that volatility in equities across the globe
was a result of investors overreacting to the potential for the Federal Reserve to raise
interest rates. We maintained that with low and sometimes negative debt yields in certain
countries, foreign investors have been flocking to U.S. bonds, which could help keep interest
rates low even as the Fed increases its benchmark rate. In our opinion, Fed rate increases,
furthermore, are likely to be gradual and modest.
Looking abroad, we continued to maintain that emerging markets and other non-U.S.
equities offered potential for attractive gains. With emerging market equities, furthermore,
we have maintained that valuations are highly attractive with the asset class trading at an
approximately 30% discount to stocks of developed markets.
The U.S. Economy and Corporate Fundamentals
Our optimism is based, in part, on the growing strength of the U.S. economy and the
strength of fundamentals among domestic businesses. Americans’ finances have been
strengthening with the national savings rate running at nearly 5.0%, which is higher than the
approximately 3% pace that existed prior to the financial crisis. At the same time, Americans’
debt service burden is relatively low at 10.1% of disposable personal income compared to
the 11.4% average since 1980 and the peak of more than 13% at the end of 2007. While
job growth has been slow, the country has added jobs every month since October of 2010
and the seasonally adjusted unemployment rate has fallen from a post-financial crisis high
of 10.0% to only 5.1%. With more Americans working and personal finances improving,
individuals are likely to increase their spending, which could support both economic growth
and corporate earnings.
Strength in the real estate market has also continued. The National Association of Home
Builders Housing Market Index, which measures sentiment toward the real estate market
among builders, climbed 10 points year over year to 64 for October. At the same time,
housing prices have climbed, with existing home prices up 6.2% year over year in September.
- 3 -
Housing starts, which are still below historical averages, have been strengthening and have
reached an annualized rate of 1.2 million units. The combination of increasing prices and
below-average housing starts implies that the real estate recovery has considerable potential
for strengthening. In addition to the real estate recovery creating new construction jobs
and supporting industries that provide trucks, equipment, and home building materials,
the resulting higher home prices can help make Americans feel richer and thereby support
consumer spending.
Other economic indicators are encouraging. According to the Institute for Supply
Management, economic activity among manufacturers has increased for 34 consecutive
months. Capital expenditures in the U.S., furthermore, have increased at an average rate of
3.25% this year despite energy companies tightening their belts. The current spending rate
is below historical averages, suggesting that potential exists for businesses to further increase
capital outlays. In a similar manner, spending on research and development among S&P
500 companies has surged, setting a 10-year record at $54.4 billion in the second quarter,
according to FactSet Research Systems Inc.
Finally, corporate fundamentals are strong with S&P 500 ex-energy earnings expected to
grow at a high single-digit annualized rate this year after stripping out the impact of currency
exchange rates. With strong fundamentals, corporations are continuing to grow their cash
balances. At the end of the second quarter, S&P 500 companies (not including financials)
held $1.43 trillion in cash, up 5.5% year over year and 3.9% quarter over quarter, according
to FactSet. High cash balances and strong fundamentals are allowing corporations to return
capital to investors at an impressive rate, with dividends and stock buybacks expected to
total $1 trillion this year, which would be an all-time record and a $64 billion increase from
last year, according to S&P Capital IQ. Mergers and acquisitions are also continuing at a
brisk pace.
The Road Ahead
We have learned in our 51 years of history that "good” television and “good” press are fueled
most easily by talking heads who forecast doom and gloom for financial markets. Fortunately,
we have also learned that the best research is done not by reading the newspaper or watching
television, but instead by doing the hard work of talking to company management, reading
voluminous company filings, understanding how a company drives revenue and profit
growth, and most importantly, by believing what our research and analysis indicates. It is
also important to have conviction that allows us to look through the next three months
and to predict what the future truly holds for a company, industry, or sector. We maintain
that well-managed companies that can capture market share with compelling products and
services have potential over the long run for generating attractive returns and are best suited
for weathering periods of market volatility. At Alger, we will continue to use our time-tested
and research-driven investment strategy to find companies, whether in the U.S. or not, that
we believe have the most potential for generating strong returns over time for our clients.
Portfolio Matters
Alger Capital Appreciation Institutional Fund
The Alger Capital Appreciation Institutional Fund returned 8.96% for the fiscal 12-month
period ended October 31, 2015, compared to the 9.18% return of the Russell 1000 Growth
Index.
- 4 -
During the period, the largest sector weightings were Information Technology and Health
Care. The largest sector overweight was Health Care and the largest sector underweight
was Consumer Staples. Relative outperformance in the Information Technology and Health
Care sectors was the most important contributor to performance, while Consumer Staples
and Utilities detracted from results.
Among the most important relative contributors were Allergan PLC.; Alphabet, Inc., Cl.
C; CVS Caremark Corp.; and Amazon.com, Inc. Regarding Alphabet, Class C shares were
held during the entire reporting period. During that timeframe, the shares generated a
positive return and supported performance. Shares of Facebook, Inc., Cl. A also supported
performance. Facebook performed strongly late in the reporting period after the company
reported continued strong user growth and said earnings and operating margins exceeded
consensus expectations, with exceptionally strong mobile advertising revenues helping to
offset the adverse impact upon foreign revenues of a strong U.S. dollar.
Conversely, detracting from overall results on a relative basis were Alphabet, Inc., Cl. A;
Yum! Brands, Inc.; The Kraft Heinz Co.; and Weatherford International PLC. Unlike Class
C shares of Alphabet, Class A shares were sold early in the reporting period. During the
shortened holding period, Class A shares declined in value. Shares of SunEdison, Inc. also
detracted from results. The company develops and operates commercial and utility-scale
solar and wind-energy projects. Its stock surrendered gains achieved during the first half
of 2015 because investors began scrutinizing the company’s debt, operating losses, and
acquisition strategy. In addition, investors grew concerned that low oil prices may make the
development of alternative energy projects less appealing.
Alger Capital Appreciation Focus Fund
The Alger Capital Appreciation Focus Fund returned 9.79% for the fiscal 12-month period
ended October 31, 2015, compared to the 9.18% return of its benchmark, the Russell 1000
Growth Index.
During the reporting period, the largest sector weightings were Information Technology and
Health Care. The largest sector overweight was Financials and the largest sector underweight
was Consumer Staples. Relative outperformance in the Information Technology and
Financials sectors was the most important contributor to performance, while Consumer
Staples and Materials detracted from results.
Among the most important relative contributors were Facebook, Inc., Cl. A; Allergan PLC.;
Alphabet, Inc., Cl. C; GrubHub, Inc.; and Visa, Inc., Cl. A. Regarding Alphabet, Class C shares
were held during the entire reporting period. During that timeframe, the shares generated
a positive return and supported performance. Shares of Facebook performed strongly in
response to developments described in the Alger Capital Appreciation Institutional Fund
discussion.
Conversely, detracting from overall results on a relative basis were Alphabet, Inc., Cl. A;
SunEdison, Inc.; PPG Industries, Inc.; Biogen, Inc.; and Yum! Brands, Inc. Unlike Class
C shares of Alphabet, Class A shares were sold early in the reporting period. During
the shortened holding period, Class A shares declined in value. Shares of SunEdison
underperformed in response to reasons described in the Alger Capital Appreciation
Institutional Fund discussion.
- 5 -
Alger Mid Cap Growth Institutional Fund
The Alger Mid Cap Growth Institutional Fund returned 1.62% for the fiscal 12-month
period ended October 31, 2015, compared to the 4.94% return of Russell Midcap Growth
Index.
During the reporting period, the largest sector weightings were Consumer Discretionary
and Information Technology. The largest sector overweight was Information Technology
and the largest sector underweight was Consumer Staples. Relative outperformance in the
Consumer Discretionary and Materials sectors was the most important contributor to
performance, while Health Care and Information Technology detracted from results.
Among the most important relative contributors were Norwegian Cruise Line Holdings
Ltd.; Rite Aid Corp.; Acuity Brands, Inc.; and Portola Pharmaceuticals, Inc. Shares of cruise
ship operator Royal Caribbean Cruises Ltd. also supported performance late in the reporting
period after the company said its quarterly earnings exceeded expectations, thanks in part
to lower fuel prices. Royal Caribbean Cruises management also raised full-year earnings
guidance and said prices and first quarter 2016 bookings are up on a year-over-year basis.
Conversely, detracting from overall results on a relative basis were Whiting Petroleum Corp.;
Salix Pharmaceuticals Ltd.; SunEdison, Inc.; La Quinta Holdings, Inc.; and Tenet Healthcare
Corp. Shares of SunEdison underperformed in response to reasons described in the Alger
Capital Appreciation Institutional Fund discussion.
Alger Small Cap Growth Institutional Fund
The Alger Small Cap Growth Institutional Fund returned 0.53% for the fiscal 12-month
period ended October 31, 2015, compared to the 3.52% return of the Russell 2000 Growth
Index.
During the period, the largest sector weightings were Information Technology and Health
Care. The largest sector overweight was Information Technology and the largest sector
underweight was Industrials. Relative outperformance in the Consumer Discretionary and
Materials sectors was the most important contributor to performance, while Industrials and
Information Technology detracted from results.
Among the most important relative contributors were Bluebird Bio, Inc.; Proofpoint, Inc.;
Ultragenyx Pharmaceutical, Inc.; and Incyte Corp. Shares of Neurocrine Biosciences, Inc.
also supported performance. The company is developing novel therapeutics for central
nervous system disorders and other health issues. Its stock performance during the early
portion of the reporting period benefited from the company achieving favorable phase 3
results for Elagolix, which is being developed for an often painful disorder of the uterus
called endometriosis. The results also supported optimism that Elagolix may be developed
for treating fibroids, or non-cancerous growths, of the uterus.
Conversely, detracting from overall results on a relative basis were GenMark Diagnostics
Inc.; Synageva BioPharma Corp.; and Adeptus Health, Inc., Cl. A. Shares of Shutterstock,
Inc. also detracted from results. Shutterstock provides an online marketplace for commercial
digital images, including photographs and videos, for corporate communications, websites,
and other markets. Its competitive position has come into question since a previously weak
competitor was acquired by deep-pocketed Adobe Systems, Inc. and relaunched. Even
though Shutterstock management has not acknowledged any negative impact from the
- 6 -
acquisition, it has lowered guidance for the year, stating that results in Europe have been
soft, which we believe indicates competitive pressures.
On behalf of our 159 employees, I thank you for putting your trust in Alger.
Sincerely,

Daniel C. Chung, CFA
Chief Investment Officer
Fred Alger Management, Inc.
_______________________________
Investors cannot invest directly in an index. Index performance does not reflect the
deduction for fees, expenses or taxes.
This report and the financial statements contained herein are submitted for the general
information of shareholders of the funds. This report is not authorized for distribution
to prospective investors in the funds unless preceded or accompanied by an effective
prospectus for the funds. Fund returns represent the fiscal period return of Class I shares.
The performance data quoted represents past performance, which is not an
indication or guarantee of future results.
Standardized performance results can be found on the following pages. The investment
return and principal value of an investment in a fund will fluctuate so that an investor’s shares,
when redeemed, may be worth more or less than their original cost. Current performance
may be lower or higher than the performance quoted. For performance data current to the
most recent month-end, visit us at www.alger.com, or call us at (800) 992-3863.
The views and opinions of the funds’ management in this report are as of the date of the
Shareholders’ Letter and are subject to change at any time subsequent to this date. There
is no guarantee that any of the assumptions that formed the basis for the opinions stated
herein are accurate or that they will materialize. Moreover, the information forming the
basis for such assumptions is from sources believed to be reliable; however, there is no
guarantee that such information is accurate. Any securities mentioned, whether owned in a
fund or otherwise, are considered in the context of the construction of an overall portfolio
of securities and therefore reference to them should not be construed as a recommendation
or offer to purchase or sell any such security. Inclusion of such securities in a fund and
transactions in such securities, if any, may be for a variety of reasons, including without
limitation, in response to cash flows, inclusion in a benchmark, and risk control. The
reference to a specific security should also be understood in such context and not viewed as
a statement that the security is a significant holding in a fund. Please refer to the Schedule of
Investments for each fund that is included in this report for a complete list of fund holdings
as of October 31, 2015. Securities mentioned in the Shareholders’ Letter, if not found in
the Schedule of Investments, may have been held by the funds during the 12-month period.
A Word about Risk
Growth stocks tend to be more volatile than other stocks as the price of growth stocks
tends to be higher in relation to their companies’ earnings and may be more sensitive
- 7 -
to market, political and economic developments. Investing in the stock market involves
gains and losses and may not be suitable for all investors. Stocks of small- and mid-sized
companies are subject to greater risk than stocks of larger, more established companies
owing to such factors as limited liquidity, inexperienced management, and limited financial
resources. Funds that participate in leveraging, such as the Capital Appreciation Institutional
Fund, are subject to the risk that borrowing money to leverage will exceed the returns for
securities purchased or that the securities purchased may actually go down in value; thus, a
fund’s net asset value can decrease more quickly than if the fund had not borrowed.
A small investment in derivatives could have a potentially large impact on a fund’s
performance. When purchasing options, a fund bears the risk that if the market value of
the underlying security does not move to a level that would make exercise of the option
profitable, the option will expire unexercised. When a call option written by a fund is
exercised, the fund will not participate in any increase in the underlying security’s value
above the exercise price. When a put option written by a fund is exercised, the fund will
be required to purchase the underlying security at a price in excess of its market value. Use
of options on securities indexes is subject to the risk that trading in the options may be
interrupted if trading in certain securities included in the index is interrupted, the risk that
price movements in a fund’s portfolio securities may not correlate precisely with movements
in the level of an index, and the risk that Fred Alger Management, Inc. may not predict
correctly movements in the direction of a particular market or of the stock market generally.
Because certain options may require settlement in cash, a fund may be forced to liquidate
portfolio securities to meet settlement obligations. For a more detailed discussion of the
risks associated with these funds, please see the prospectus.
Before investing, carefully consider a fund’s investment objective, risks, charges,
and expenses. For a prospectus containing this and other information about The
Alger Institutional Funds call us at (800) 992-3863 or visit us at www.alger.com. Read
it carefully before investing.
Fred Alger & Company, Incorporated, Distributor. Member NYSE Euronext, SIPC.
NOT FDIC INSURED. NOT BANK GUARANTEED. MAY LOSE VALUE.
- 8 -
Definitions:
• The S&P 500 is an unmanaged index generally representative of the U.S.
stock market without regard to company size.
• The MSCI Emerging Markets Index is a free float-adjusted market capital-
ization index that is designed to measure equity market performance in the
global emerging markets.
• The MSCI ACWI ex USA Index is a market capitalization-weighted index de-
signed to provide a broad measure of equity market performance throughout
the world, including both developed and emerging markets, but excluding the
United States.
• The Russell 1000 Growth Index is an unmanaged index designed to measure
the performance of the largest 1,000 companies in the Russell 3000 Index
with higher price-to-book ratios and higher forecasted growth values.
• The Russell Midcap Growth Index measures the performance of the mid-
cap segment of the U.S. equity universe. It includes those Russell Midcap
Index companies with higher price-to-book ratios and higher forecasted
growth values.
• The Russell 2000 Growth Index measures the performance of the small-cap
growth segment of the U.S. equity universe. It includes those Russell 2000
companies with higher price-to-book ratios and higher forecasted growth
values.
• FactSet Research Systems Inc. is a multinational financial data and software
company.
• S&P Capital IQ provides research, data, and analysis on capital markets and
other topics for investment managers, investment banks, private equity funds,
advisory firms, corporations and universities.
- 9 -
| | | | | | | | | |
| FUND PERFORMANCE AS OF 9/30/15 (Unaudited) |
| AVERAGE ANNUAL TOTAL RETURNS |
| | | 1 | | 5 | | 10 | | SINCE | |
| | | YEAR | | YEARS | | YEARS | | INCEPTION | |
| Alger Capital Appreciation Class I (Inception 11/8/93) | | 2.06 | % | 14.47 | % | 10.49 | % | 11.67 | % |
| Alger Capital Appreciation Class R (Inception 1/27/03)* | | 1.57 | % | 13.91 | % | 9.94 | % | 11.11 | % |
| |
| Alger Capital Appreciation Focus Class A (Inception | | | | | | | | | |
| 12/31/12) | | (3.34 | )% | n/a | | n/a | | 14.09 | % |
| Alger Capital Appreciation Focus Class C (Inception | | | | | | | | | |
| 12/31/12) | | 0.25 | % | n/a | | n/a | | 15.47 | % |
| Alger Capital Appreciation Focus Class I (Inception | | | | | | | | | |
| 11/8/93) | | 2.15 | % | 12.61 | % | 5.81 | % | 8.10 | % |
| Alger Capital Appreciation Focus Class Z (Inception | | | | | | | | | |
| 12/31/12) | | 2.41 | % | n/a | | n/a | | 16.81 | % |
| |
| Alger Mid Cap Growth Class I (Inception 11/8/93) | | (2.91 | )% | 11.20 | % | 5.33 | % | 11.57 | % |
| Alger Mid Cap Growth Class R (Inception 1/27/03)* | | (3.45 | )% | 10.62 | % | 4.80 | % | 11.01 | % |
| |
| Alger Small Cap Growth Class I (Inception 11/8/93) | | 1.28 | % | 9.38 | % | 6.45 | % | 8.71 | % |
| Alger Small Cap Growth Class R (Inception 1/27/03)* | | 0.77 | % | 8.83 | % | 5.93 | % | 8.18 | % |
The performance data quoted represents past performance, which is not an indication or a guarantee of future
results. The Fund’s average annual total returns include changes in share price and reinvestment of dividends
and capital gains.
* Since inception performance is calculated from 11/08/93. Performance figures prior to 1/27/03, inception of Class R shares,
are those of the Fund's Class I Shares. The performance figures prior to 1/27/03 have been reduced to reflect the higher
operating expenses of Class R shares.
- 10 -
ALGER CAPITAL APPRECIATION INSTITUTIONAL FUND
Fund Highlights Through October 31, 2015 (Unaudited)
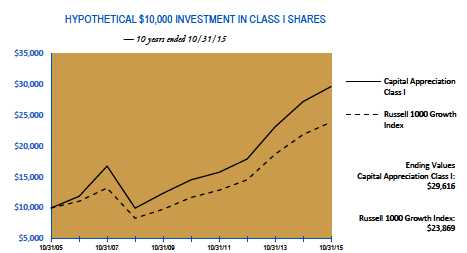
The chart above illustrates the change in value of a hypothetical $10,000 investment made in the Alger Capital
Appreciation Institutional Fund Class I shares and the Russell 1000 Growth Index (an unmanaged index of common
stocks) for the ten years ended October 31, 2015. Figures for the Alger Capital Appreciation Institutional Fund
Class I shares and the Russell 1000 Growth Index include reinvestment of dividends. Performance for the Alger
Capital Appreciation Institutional Fund Class R shares may vary from the results shown above due to differences in
expenses the class bears. Investors cannot invest directly in any index. Index performance does not reflect deduction
for fees, expenses, or taxes.
| | | | | | | | |
| PERFORMANCE COMPARISON AS OF 10/31/15 |
| AVERAGE ANNUAL TOTAL RETURNS |
| | | | | | | | Since | |
| | 1 YEAR | | 5 YEARS | | 10 YEARS | | 11/8/1993 | |
| Class I (Inception 11/8/93) | 8.96 | % | 15.28 | % | 11.47 | % | 12.02 | % |
| Class R (Inception 1/27/03)* | 8.46 | % | 14.72 | % | 10.92 | % | 11.46 | % |
| Russell 1000 Growth Index | 9.18 | % | 15.30 | % | 9.09 | % | 8.77 | % |
The performance data quoted represents past performance, which is not an indication or a guarantee of future results. The Fund’s
average annual total returns include changes in share price and reinvestment of dividends and capital gains. The chart and table above
do not reflect the deduction of taxes that a shareholder would have paid on Fund distributions or on the redemption of Fund shares.
Investment return and principal will fluctuate and the Fund’s shares, when redeemed, may be worth more or less than their original cost.
Current performance may be higher or lower than the performance quoted. For updated performance, visit us at www.alger.com or call
us at (800) 992-3863.
* Since inception performance is calculated from 11/08/93. Performance figures prior to 1/27/03, inception of Class R
shares, are those of the Fund's Class I Shares. The performance figures prior to 1/27/03 have been reduced to reflect the
higher operating expenses of Class R shares.
- 11 -
ALGER CAPITAL APPRECIATION FOCUS FUND
Fund Highlights Through October 31, 2015 (Unaudited)
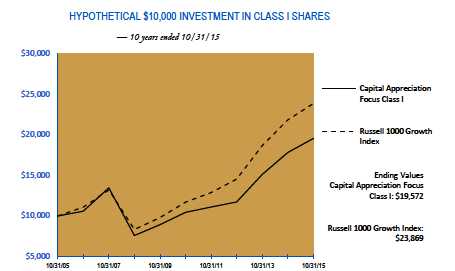
The chart above illustrates the change in value of a hypothetical $10,000 investment made in the Alger Capital
Appreciation Focus Fund Class I shares and the Russell 1000 Growth Index (an unmanaged index of common
stocks) for the ten years ended October 31, 2015. Beginning December 31, 2012 Alger Capital Appreciation Focus
Fund changed its investment strategy to invest a substantial portion of its assets in a small number of issuers. The
figures for the Alger Capital Appreciation Focus Fund Class I shares and the Russell 1000 Growth Index include
reinvestment of dividends. Performance for the Alger Capital Appreciation Focus Fund Class A, Class C and Class Z
shares may vary from the results shown above due to differences in expenses the class bears. Investors cannot invest
directly in any index. Index performance does not reflect deduction for fees, expenses, or taxes.
| | | | | | | | |
| PERFORMANCE COMPARISON AS OF 10/31/15 |
| AVERAGE ANNUAL TOTAL RETURNS |
| | | | | | | | Since | |
| | 1 YEAR | | 5 YEARS | | 10 YEARS | | 11/8/1993 | |
| Class I (Inception 11/8/93) | 9.79 | % | 13.38 | % | 6.95 | % | 8.47 | % |
| Russell 1000 Growth Index | 9.18 | % | 15.30 | % | 9.09 | % | 8.77 | % |
| |
| | | | | | | | Since | |
| | 1 YEAR | | 5 YEARS | | 10 YEARS | | 12/31/2012 | |
| Class A (Inception 12/31/12) | 3.87 | % | n/a | | n/a | | 16.90 | % |
| Class C (Inception 12/31/12) | 7.80 | % | n/a | | n/a | | 18.24 | % |
| Class Z (Inception 12/31/12) | 10.10 | % | n/a | | n/a | | 19.63 | % |
| Russell 1000 Growth Index | 9.18 | % | n/a | | n/a | | 18.42 | % |
The performance data quoted represents past performance, which is not an indication or a guarantee of future results. The Fund’s
average annual total returns include changes in share price and reinvestment of dividends and capital gains. The chart and table above
do not reflect the deduction of taxes that a shareholder would have paid on Fund distributions or on the redemption of Fund shares.
Investment return and principal will fluctuate and the Fund’s shares, when redeemed, may be worth more or less than their original cost.
Current performance may be higher or lower than the performance quoted. For updated performance, visit us at www.alger.com or call
us at (800) 992-3863.
- 12 -
ALGER MID CAP GROWTH INSTITUTIONAL FUND
Fund Highlights Through October 31, 2015 (Unaudited)
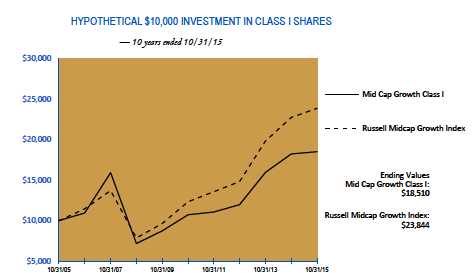
The chart above illustrates the change in value of a hypothetical $10,000 investment made in the Alger Mid Cap
Growth Institutional Fund Class I shares and the Russell Midcap Growth Index (an unmanaged index of common
stocks) for the ten years ended October 31, 2015. Figures for the Alger Mid Cap Growth Institutional Fund Class
I shares and the Russell Midcap Growth Index include reinvestment of dividends. Performance for the Alger Mid
Cap Growth Institutional Fund Class R shares may vary from the results shown above due to differences in expenses
the class bears. Investors cannot invest directly in any index. Index performance does not reflect deduction for fees,
expenses, or taxes.
| | | | | | | | |
| PERFORMANCE COMPARISON AS OF 10/31/15 |
| AVERAGE ANNUAL TOTAL RETURNS |
| | | | | | | | Since | |
| | 1 YEAR | | 5 YEARS | | 10 YEARS | | 11/8/1993 | |
| Class I (Inception 11/8/93) | 1.62 | % | 11.56 | % | 6.35 | % | 11.79 | % |
| Class R (Inception 1/27/03)* | 1.11 | % | 10.99 | % | 5.82 | % | 11.24 | % |
| Russell Midcap Growth Index | 4.94 | % | 14.10 | % | 9.08 | % | 9.41 | % |
The performance data quoted represents past performance, which is not an indication or a guarantee of future results. The Fund’s
average annual total returns include changes in share price and reinvestment of dividends and capital gains. The chart and table above
do not reflect the deduction of taxes that a shareholder would have paid on Fund distributions or on the redemption of Fund shares.
Investment return and principal will fluctuate and the Fund’s shares, when redeemed, may be worth more or less than their original cost.
Current performance may be higher or lower than the performance quoted. For updated performance, visit us at www.alger.com or call
us at (800) 992-3863.
* Since inception performance is calculated from 11/08/93. Performance figures prior to 1/27/03, inception of Class R
shares, are those of the Fund's Class I Shares. The performance figures prior to 1/27/03 have been reduced to reflect the
higher operating expenses of Class R shares.
- 13 -
ALGER SMALL CAP GROWTH INSTITUTIONAL FUND
Fund Highlights Through October 31, 2015 (Unaudited)
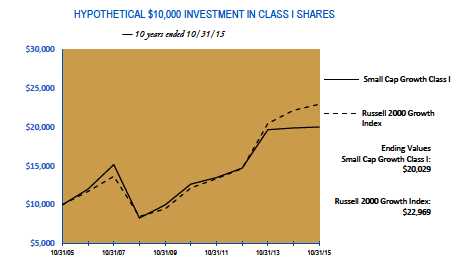
The chart above illustrates the change in value of a hypothetical $10,000 investment made in the Alger Small Cap
Growth Institutional Fund Class I shares and the Russell 2000 Growth Index (an unmanaged index of common
stocks) for the ten years ended October 31, 2015. The figures for the Alger Small Cap Growth Institutional Fund
Class I shares and the Russell 2000 Growth Index include reinvestment of dividends. Performance for the Alger
Small Cap Growth Institutional Fund Class R shares may vary from the results shown above due to differences in
expenses the class bears. Investors cannot invest directly in any index. Index performance does not reflect deduction
for fees, expenses, or taxes.
| | | | | | | | |
| PERFORMANCE COMPARISON AS OF 10/31/15 |
| AVERAGE ANNUAL TOTAL RETURNS |
| | | | | | | | Since | |
| | 1 YEAR | | 5 YEARS | | 10 YEARS | | 11/8/1993 | |
| Class I (Inception 11/8/93) | 0.53 | % | 9.61 | % | 7.19 | % | 8.89 | % |
| Class R (Inception 1/27/03)* | 0.02 | % | 9.07 | % | 6.67 | % | 8.36 | % |
| Russell 2000 Growth Index | 3.52 | % | 13.56 | % | 8.67 | % | 7.02 | % |
The performance data quoted represents past performance, which is not an indication or a guarantee of future results. The Fund’s
average annual total returns include changes in share price and reinvestment of dividends and capital gains. The chart and table above
do not reflect the deduction of taxes that a shareholder would have paid on Fund distributions or on the redemption of Fund shares.
Investment return and principal will fluctuate and the Fund’s shares, when redeemed, may be worth more or less than their original cost.
Current performance may be higher or lower than the performance quoted. For updated performance, visit us at www.alger.com or call
us at (800) 992-3863.
* Since inception performance is calculated from 11/08/93. Performance figures prior to 1/27/03, inception of Class R
shares, are those of the Fund's Class I Shares. The performance figures prior to 1/27/03 have been reduced to reflect the
higher operating expenses of Class R shares.
- 14 -
PORTFOLIO SUMMARY†
October 31, 2015 (Unaudited)
| | | | | | | | | | | | | |
| ` | | | | | | | | | | | | | |
| | | Alger Capital | | | | | | | | | | | |
| | | Appreciation Institutional | | | Alger Capital | | | Alger Mid Cap Growth | | | Alger Small Cap Growth | |
| SECTORS | | Fund | | | Appreciation Focus Fund | | | Institutional Fund | | | Institutional Fund | |
| Consumer Discretionary | | 19.3 | % | | 18.3 | % | | 24.9 | % | | 12.8 | % |
| Consumer Staples | | 5.5 | | | | 3.0 | | | 3.0 | | | 2.4 | |
| Energy | | 1.8 | | | | 1.7 | | | 0.7 | | | 1.4 | |
| Financials | | 5.7 | | | 13.5 | | | 8.5 | | | 6.7 | |
| Health Care | | 17.2 | | | 18.9 | | | 15.4 | | | 28.8 | |
| Industrials | | 9.0 | | | | 7.0 | | | 14.3 | | | 7.5 | |
| Information Technology | | 33.5 | | | 33.9 | | | 23.0 | | | 36.8 | |
| Materials | | 1.4 | | | | 1.1 | | | 3.2 | | | 3.1 | |
| Telecommunication Services | 1.1 | | | | 0.0 | | | 1.5 | | | 0.0 | |
| Utilities | | 0.4 | | | | 0.0 | | | 0.6 | | | 0.0 | |
| Short-Term Investments and | | | | | | | | | | | | | |
| Net Other Assets | | 5.1 | | | | 2.6 | | | 4.9 | | | 0.5 | |
| | | 100.0 | % | | 100.0 | % | | 100.0 | % | | 100.0 | % |
† Based on net assets for each Fund.
- 15 -
THE ALGER INSTITUTIONAL FUNDS
ALGER CAPITAL APPRECIATION INSTITUTIONAL FUND
Schedule of Investments October 31, 2015
| | | | | | |
| COMMON STOCKS—92.7% | | SHARES | | | | VALUE |
| ADVERTISING—0.0% | | | | | | |
| Choicestream, Inc.*,@,(a) | | 124,658 | $ | 52,356 |
| AEROSPACE & DEFENSE—2.7% | | | | | | |
| Honeywell International, Inc. | | 475,759 | | | | 49,136,390 |
| Lockheed Martin Corp. | | 82,314 | | | | 18,095,087 |
| The Boeing Co. | | 237,263 | | | | 35,131,532 |
| | | | | | 102,363,009 |
| AIR FREIGHT & LOGISTICS—0.5% | | | | | | |
| United Parcel Service, Inc., Cl. B | | 172,683 | | | 17,789,803 |
| AIRLINES—1.3% | | | | | | |
| Delta Air Lines, Inc. | | 614,100 | | | | 31,220,844 |
| United Continental Holdings, Inc.* | | 286,532 | | | | 17,280,745 |
| | | | | | 48,501,589 |
| ALTERNATIVE CARRIERS—0.3% | | | | | | |
| Level 3 Communications, Inc.* | | 197,409 | | | 10,057,989 |
| APPAREL ACCESSORIES & LUXURY GOODS—0.1% | | | | | | |
| Ralph Lauren Corp. | | 24,600 | | | | 2,724,942 |
| APPAREL RETAIL—0.4% | | | | | | |
| VF Corp. | | 215,880 | | | 14,576,218 |
| APPLICATION SOFTWARE—2.0% | | | | | | |
| Adobe Systems, Inc.* | | 270,554 | | | | 23,987,318 |
| salesforce.com, inc.* | | 689,634 | | | | 53,591,458 |
| | | | | | 77,578,776 |
| AUTO PARTS & EQUIPMENT—1.4% | | | | | | |
| Delphi Automotive PLC. | | 635,327 | | | | 52,852,853 |
| WABCO Holdings, Inc.* | | 14,000 | | | | 1,571,220 |
| | | | | | 54,424,073 |
| BIOTECHNOLOGY—6.1% | | | | | | |
| Biogen, Inc.* | | 123,745 | | | | 35,949,160 |
| BioMarin Pharmaceutical, Inc.* | | 112,530 | | | | 13,170,511 |
| Celgene Corp.* | | 306,690 | | | | 37,633,930 |
| Gilead Sciences, Inc. | | 568,522 | | | | 61,474,284 |
| Incyte Corp.* | | 185,598 | | | | 21,813,333 |
| Intercept Pharmaceuticals, Inc.* | | 21,126 | | | | 3,321,007 |
| Regeneron Pharmaceuticals, Inc.* | | 7,800 | | | | 4,347,642 |
| Vertex Pharmaceuticals, Inc.* | | 448,518 | | | | 55,948,135 |
| | | | | | 233,658,002 |
| BREWERS—1.5% | | | | | | |
| Anheuser-Busch InBev SA# | | 146,707 | | | | 17,506,546 |
| Molson Coors Brewing Co., Cl. B | | 455,276 | | | | 40,109,816 |
| | | | | | 57,616,362 |
| BROADCASTING—0.1% | | | | | | |
| CBS Corp., Cl. B | | 127,300 | | | | 5,921,996 |
| BUILDING PRODUCTS—0.6% | | | | | | |
| Fortune Brands Home & Security, Inc. | | 212,097 | | | | 11,099,036 |
| Lennox International, Inc. | | 84,378 | | | | 11,206,242 |
| | | | | | 22,305,278 |
- 16 -
THE ALGER INSTITUTIONAL FUNDS
ALGER CAPITAL APPRECIATION INSTITUTIONAL FUND
Schedule of Investments (Continued) October 31, 2015
| | | | | | |
| COMMON STOCKS—(CONT.) | | SHARES | | | | VALUE |
| CABLE & SATELLITE—1.6% | | | | | | |
| Comcast Corporation, Cl. A | | 1,004,620 | $ | 62,909,304 |
| COMMUNICATIONS EQUIPMENT—1.6% | | | | | | |
| Arista Networks, Inc.* | | 225,530 | | | | 14,548,940 |
| ARRIS Group, Inc.* | | 453,100 | | | | 12,804,606 |
| Cisco Systems, Inc. | | 1,150,800 | | | | 33,200,580 |
| | | | | | 60,554,126 |
| COMPUTER STORAGE & PERIPHERALS—0.2% | | | | | | |
| SanDisk Corp. | | 86,800 | | | | 6,683,600 |
| CONSUMER FINANCE—0.0% | | | | | | |
| LendingClub Corp.* | | 141,855 | | | | 2,011,504 |
| DATA PROCESSING & OUTSOURCED SERVICES—4.8% | | | | | | |
| Alliance Data Systems Corp.* | | 130,778 | | | | 38,881,607 |
| Fiserv, Inc.* | | 120,151 | | | | 11,595,773 |
| Visa, Inc., Cl. A | | 1,718,666 | | | 133,334,109 |
| | | | | | 183,811,489 |
| DRUG RETAIL—1.4% | | | | | | |
| CVS Caremark Corp. | | 271,913 | | | | 26,859,566 |
| Walgreens Boots Alliance, Inc. | | 302,793 | | | | 25,640,511 |
| | | | | | 52,500,077 |
| FOOD RETAIL—0.8% | | | | | | |
| The Kroger Co. | | 825,152 | | | 31,190,746 |
| FOOTWEAR—0.3% | | | | | | |
| NIKE, Inc., Cl. B | | 83,797 | | | 10,979,921 |
| GENERAL MERCHANDISE STORES—0.5% | | | | | | |
| Dollar General Corp. | | 253,329 | | | | 17,168,107 |
| Dollar Tree, Inc.* | | 17,321 | | | | 1,134,352 |
| | | | | | 18,302,459 |
| HEALTH CARE EQUIPMENT—1.5% | | | | | | |
| Edwards Lifesciences Corp.* | | 216,400 | | | | 34,007,260 |
| Hologic, Inc.* | | 629,348 | | | | 24,456,463 |
| Steris Corp.* | | 1,300 | | | | 97,435 |
| | | | | | 58,561,158 |
| HEALTH CARE FACILITIES—0.6% | | | | | | |
| Amsurg Corp.* | | 62,100 | | | | 4,352,589 |
| HCA Holdings, Inc.* | | 285,447 | | | | 19,635,899 |
| | | | | | 23,988,488 |
| HOME ENTERTAINMENT SOFTWARE—0.2% | | | | | | |
| Activision Blizzard, Inc. | | 261,854 | | | | 9,102,045 |
| HOME IMPROVEMENT RETAIL—1.6% | | | | | | |
| Lowe's Companies, Inc. | | 319,198 | | | | 23,566,388 |
| The Home Depot, Inc. | | 321,207 | | | | 39,714,034 |
| | | | | | 63,280,422 |
| HOTELS RESORTS & CRUISE LINES—1.7% | | | | | | |
| Ctrip.com International Ltd.#* | | 129,647 | | | | 12,053,282 |
| Norwegian Cruise Line Holdings Ltd.* | | 524,100 | | | | 33,343,242 |
| Royal Caribbean Cruises Ltd. | | 199,258 | | | | 19,597,024 |
| | | | | | 64,993,548 |
- 17 -
THE ALGER INSTITUTIONAL FUNDS
ALGER CAPITAL APPRECIATION INSTITUTIONAL FUND
Schedule of Investments (Continued) October 31, 2015
| | | | | | |
| COMMON STOCKS—(CONT.) | | SHARES | | | | VALUE |
| HOUSEWARES & SPECIALTIES—0.8% | | | | | | |
| Jarden Corp.* | | 657,127 | $ | 29,439,290 |
| INDUSTRIAL CONGLOMERATES—1.3% | | | | | | |
| Danaher Corp. | | 234,086 | | | | 21,842,565 |
| General Electric Co. | | 924,556 | | | | 26,738,159 |
| | | | | | 48,580,724 |
| INDUSTRIAL GASES—0.8% | | | | | | |
| Air Products & Chemicals, Inc. | | 228,327 | | | 31,732,886 |
| INTERNET RETAIL—5.4% | | | | | | |
| Amazon.com, Inc.* | | 274,871 | | | 172,041,759 |
| NetFlix, Inc.* | | 265,096 | | | | 28,731,104 |
| Qunar Cayman Islands Ltd.#* | | 135,200 | | | | 6,562,608 |
| | | | | | 207,335,471 |
| INTERNET SOFTWARE & SERVICES—11.8% | | | | | | |
| Alphabet, Inc., Cl. C* | | 287,319 | | | 204,229,219 |
| Facebook, Inc., Cl. A* | | 1,587,287 | | | 161,855,655 |
| GrubHub, Inc.* | | 189,592 | | | | 4,546,416 |
| LinkedIn Corp., Cl. A* | | 149,036 | | | | 35,898,301 |
| Palantir Technologies, Inc., Cl. A*,@ | | 239,030 | | | | 2,151,270 |
| Yahoo! Inc.* | | 1,325,348 | | | | 47,208,896 |
| | | | | | 455,889,757 |
| INVESTMENT BANKING & BROKERAGE—1.1% | | | | | | |
| E*TRADE Financial Corp.* | | 257,553 | | | | 7,342,836 |
| Morgan Stanley | | 1,117,130 | | | | 36,831,776 |
| | | | | | 44,174,612 |
| LIFE SCIENCES TOOLS & SERVICES—1.4% | | | | | | |
| Thermo FisherScientific,Inc. | | 407,079 | | | 53,237,792 |
| MANAGED HEALTH CARE—2.1% | | | | | | |
| Aetna, Inc. | | 42,257 | | | | 4,850,259 |
| Cigna Corp. | | 105,991 | | | | 14,207,034 |
| Humana, Inc. | | 59,964 | | | | 10,711,369 |
| UnitedHealth Group, Inc. | | 441,704 | | | | 52,023,897 |
| | | | | | 81,792,559 |
| MOVIES & ENTERTAINMENT—1.7% | | | | | | |
| The Walt Disney Co. | | 317,145 | | | | 36,072,072 |
| Time Warner, Inc. | | 413,452 | | | | 31,149,474 |
| | | | | | 67,221,546 |
| MULTI-LINE INSURANCE—0.2% | | | | | | |
| Hartford Financial Services Group, Inc. | | 138,950 | | | | 6,427,827 |
| MULTI-UTILITIES—0.3% | | | | | | |
| Sempra Energy | | 103,017 | | | 10,549,971 |
| OIL & GAS EQUIPMENT & SERVICES—0.8% | | | | | | |
| Baker Hughes, Inc. | | 403,413 | | | | 21,251,797 |
| Weatherford International PLC.* | | 1,033,000 | | | | 10,577,920 |
| | | | | | 31,829,717 |
| OIL & GAS EXPLORATION & PRODUCTION—1.0% | | | | | | |
| Anadarko Petroleum Corp. | | 237,059 | | | | 15,854,506 |
- 18 -
THE ALGER INSTITUTIONAL FUNDS
ALGER CAPITAL APPRECIATION INSTITUTIONAL FUND
Schedule of Investments (Continued) October 31, 2015
| | | | | | |
| COMMON STOCKS—(CONT.) | | SHARES | | | | VALUE |
| OIL & GAS EXPLORATION & PRODUCTION—(CONT.) | | | | | | |
| EOG Resources, Inc. | | 265,100 | $ | 22,758,835 |
| | | | | | 38,613,341 |
| OTHER DIVERSIFIED FINANCIAL SERVICES—1.1% | | | | | | |
| Bank of America Corp. | | 2,093,043 | | | | 35,121,261 |
| Citigroup, Inc. | | 143,493 | | | | 7,629,523 |
| | | | | | 42,750,784 |
| PHARMACEUTICALS—5.4% | | | | | | |
| Allergan PLC.* | | 288,710 | | | | 89,058,374 |
| Bristol-Myers Squibb Co. | | 813,940 | | | | 53,679,343 |
| Eli Lilly & Co. | | 169,900 | | | | 13,858,743 |
| Pfizer,Inc. | | 603,100 | | | | 20,396,842 |
| Shire PLC. | | 403,832 | | | | 30,574,616 |
| | | | | | 207,567,918 |
| RAILROADS—0.5% | | | | | | |
| UnionPacificCorp. | | 216,546 | | | 19,348,385 |
| REGIONAL BANKS—1.2% | | | | | | |
| Citizens Financial Group, Inc. | | 1,864,300 | | | 45,302,490 |
| RENEWABLE ELECTRICITY—0.1% | | | | | | |
| TerraForm Global, Inc., Cl. A* | | 535,300 | | | | 4,084,339 |
| RESTAURANTS—3.1% | | | | | | |
| McDonald's Corp. | | 489,894 | | | | 54,990,601 |
| Starbucks Corp. | | 517,973 | | | | 32,409,571 |
| Yum! Brands, Inc. | | 462,436 | | | | 32,791,337 |
| | | | | | 120,191,509 |
| SECURITY & ALARM SERVICES—0.5% | | | | | | |
| Tyco International PLC. | | 530,473 | | | 19,330,436 |
| SEMICONDUCTOR EQUIPMENT—0.8% | | | | | | |
| Lam Research Corp. | | 327,800 | | | | 25,106,202 |
| SunEdison, Inc.* | | 648,193 | | | | 4,731,809 |
| | | | | | | 29,838,011 |
| SEMICONDUCTORS—2.7% | | | | | | |
| Avago Technologies Ltd. | | 305,743 | | | | 37,646,135 |
| Broadcom Corp., Cl. A | | 587,987 | | | | 30,222,532 |
| NXP Semiconductors NV* | | 479,197 | | | | 37,545,085 |
| | | | | | 105,413,752 |
| SOFT DRINKS—1.2% | | | | | | |
| PepsiCo, Inc. | | 454,247 | | | 46,419,501 |
| SPECIALIZED FINANCE—0.3% | | | | | | |
| McGraw Hill Financial, Inc. | | 106,766 | | | | 9,890,802 |
| SPECIALTY CHEMICALS—0.6% | | | | | | |
| PPG Industries, Inc. | | 226,269 | | | 23,590,806 |
| SPECIALTY STORES—0.6% | | | | | | |
| Signet Jewelers Ltd. | | 145,993 | | | 22,036,183 |
| SYSTEMS SOFTWARE—4.6% | | | | | | |
| Microsoft Corp. | | 2,891,719 | | | 152,220,088 |
| ServiceNow, Inc.* | | 285,734 | | | | 23,330,181 |
| | | | | | 175,550,269 |
- 19 -
THE ALGER INSTITUTIONAL FUNDS
ALGER CAPITAL APPRECIATION INSTITUTIONAL FUND
Schedule of Investments (Continued) October 31, 2015
| | | | | | | | | |
| COMMON STOCKS—(CONT.) | | SHARES | | | | | | | VALUE |
| TECHNOLOGY HARDWARE STORAGE & PERIPHERALS—4.5% | | | | | | | | | |
| Apple, Inc. | | 1,466,921 | | $ | 175,297,060 |
| TOBACCO—0.6% | | | | | | | | | |
| Altria Group, Inc. | | 412,894 | | | | | 24,967,700 |
| TRADING COMPANIES & DISTRIBUTORS—1.6% | | | | | | | | | |
| HD Supply Holdings, Inc.* | | 1,130,156 | | | | | | | 33,667,347 |
| United Rentals, Inc.* | | 360,500 | | | | | | | 26,987,030 |
| | | | | | | | 60,654,377 |
| WIRELESS TELECOMMUNICATION SERVICES—0.8% | | | | | | | | | |
| SBA Communications Corp., Cl. A* | | 271,657 | | | | | 32,332,616 |
| TOTAL COMMON STOCKS | | | | | | | | | |
| (Cost $3,097,164,163) | | | | | | | 3,567,831,711 |
| PREFERRED STOCKS—0.4% | | SHARES | | | | | | | VALUE |
| ADVERTISING—0.0% | | | | | | | | | |
| Choicestream, Inc., Cl. A*,@,(a) | | 1,074,935 | | | | | | | 451,473 |
| Choicestream, Inc., Cl. B*,@,(a) | | 2,500,538 | | | | | | | 1,050,226 |
| | | | | | | | | | 1,501,699 |
| INTERNET SOFTWARE & SERVICES—0.3% | | | | | | | | | |
| Palantir Technologies, Inc., Cl. B*,@ | | 974,841 | | | | | | | 8,773,569 |
| Palantir Technologies, Inc., Cl. D*,@ | | 127,007 | | | | | | | 1,143,063 |
| | | | | | | | | | 9,916,632 |
| PHARMACEUTICALS—0.1% | | | | | | | | | |
| Intarcia Therapeutics, Inc.*,@ | | 111,655 | | | | | | | 4,207,160 |
| TOTAL PREFERRED STOCKS | | | | | | | | | |
| (Cost $13,252,336) | | | | | | | | | 15,625,491 |
| MASTER LIMITED PARTNERSHIP—1.2% | | SHARES | | | | | | | VALUE |
| ASSET MANAGEMENT & CUSTODY BANKS—1.2% | | | | | | | | | |
| The Blackstone Group LP. | | 1,458,262 | | | | | 48,210,142 |
| (Cost $46,895,761) | | | | | | | | | 48,210,142 |
| REAL ESTATE INVESTMENT TRUST—0.6% | | SHARES | | | | | | | VALUE |
| MORTGAGE—0.6% | | | | | | | | | |
| Blackstone Mortgage Trust, Inc., Cl. A | | 833,840 | | | | | 22,947,277 |
| (Cost $24,384,798) | | | | | | | | | 22,947,277 |
| Total Investments | | | | | | | | | |
| (Cost $3,181,697,058)(b) | | 94.9 | % | | | | 3,654,614,621 |
| Other Assets in Excess of Liabilities | | 5.1 | % | | | | 196,115,078 |
| NET ASSETS | | 100.0 | % | $ | 3,850,729,699 |
- 20 -
THE ALGER INSTITUTIONAL FUNDS
ALGER CAPITAL APPRECIATION INSTITUTIONAL FUND
Schedule of Investments (Continued) October 31, 2015
# American Depositary Receipts.
(a) Deemed an affiliate of the Alger fund complex during the year for purposes of Section 2(a)(3) of the Investment
Company Act of 1940. See Affiliated Securities in Notes to Financial Statements.
(b) At October 31, 2015, the net unrealized appreciation on investments, based on cost for federal income tax purposes
of $3,243,275,554, amounted to $411,339,067 which consisted of aggregate gross unrealized appreciation of
$510,493,266 and aggregate gross unrealized depreciation of $99,154,199.
* Non-income producing security.
@ Restricted security - Investment in security not registered under the Securities Act of 1933. The investment is deemed
to not be liquid and may be sold only to qualified buyers.
| | | | | | | | | |
| | | | | % of net assets | | | | % of net assets | |
| | Acquisition | | | (Acquisition | | | Market | as of | |
| Security | Date(s) | | Cost | Date) | | | Value | 10/31/2015 | |
| Choicestream, Inc. | 03/14/14 | $ | 36,151 | 0.00 | % | $ | 52,356 | 0.00 | % |
| Choicestream, Inc., Cl. A | 12/17/13 | | 859,605 | 0.03 | % | | 451,473 | 0.01 | % |
| Choicestream, Inc., Cl. B | 07/10/14 | | 1,500,323 | 0.05 | % | | 1,050,226 | 0.03 | % |
| Intarcia Therapeutics, Inc. | 03/27/14 | | 3,616,506 | 0.14 | % | | 4,207,160 | 0.11 | % |
| Palantir Technologies, Inc., Cl. A | 10/07/14 | | 1,555,368 | 0.05 | % | | 2,151,270 | 0.06 | % |
| Palantir Technologies, Inc., Cl. B | 10/07/14 | | 6,437,297 | 0.22 | % | | 8,773,569 | 0.23 | % |
| Palantir Technologies, Inc., Cl. D | 10/14/14 | | 838,605 | 0.03 | % | | 1,143,063 | 0.03 | % |
| Total | | | | | | $ | 17,829,117 | 0.47 | % |
| | | | | | | | | | |
Industry classifications are unaudited.
See Notes to Financial Statements.
- 21 -
THE ALGER INSTITUTIONAL FUNDS | ALGER CAPITAL APPRECIATION FOCUS FUND
Schedule of Investments October 31, 2015
| | | | | |
| COMMON STOCKS—89.9% | | SHARES | | | VALUE |
| AEROSPACE & DEFENSE—2.5% | | | | | |
| Honeywell International, Inc. | | 14,450 | $ | 1,492,396 |
| AIRLINES—1.0% | | | | | |
| Delta Air Lines, Inc. | | 11,170 | | | 567,883 |
| APPAREL RETAIL—0.6% | | | | | |
| VF Corp. | | 5,050 | | | 340,976 |
| APPLICATION SOFTWARE—2.0% | | | | | |
| salesforce.com, inc.* | | 14,820 | | | 1,151,662 |
| AUTO PARTS & EQUIPMENT—3.4% | | | | | |
| Delphi Automotive PLC. | | 16,040 | | | 1,334,368 |
| Lear Corp. | | 5,240 | | | 655,314 |
| | | | | | 1,989,682 |
| BIOTECHNOLOGY—6.7% | | | | | |
| Biogen, Inc.* | | 2,970 | | | 862,815 |
| Celgene Corp.* | | 7,320 | | | 898,237 |
| Gilead Sciences, Inc. | | 10,220 | | | 1,105,089 |
| Vertex Pharmaceuticals, Inc.* | | 8,450 | | | 1,054,053 |
| | | | | | 3,920,194 |
| BREWERS—1.1% | | | | | |
| Molson Coors Brewing Co., Cl. B | | 7,410 | | | 652,821 |
| CABLE & SATELLITE—1.9% | | | | | |
| Comcast Corporation, Cl. A | | 17,350 | | | 1,086,457 |
| DATA PROCESSING & OUTSOURCED SERVICES—5.8% | | | | | |
| Alliance Data Systems Corp.* | | 1,860 | | | 552,996 |
| Visa, Inc., Cl. A | | 37,010 | | | 2,871,236 |
| | | | | | 3,424,232 |
| DRUG RETAIL—0.9% | | | | | |
| CVS Caremark Corp. | | 5,480 | | | 541,314 |
| FOOD RETAIL—1.0% | | | | | |
| The Kroger Co. | | 14,770 | | | 558,306 |
| HEALTH CARE EQUIPMENT—0.7% | | | | | |
| DexCom, Inc.* | | 5,210 | | | 434,097 |
| HEALTH CARE FACILITIES—1.2% | | | | | |
| HCA Holdings, Inc.* | | 10,150 | | | 698,219 |
| HOTELS RESORTS & CRUISE LINES—2.0% | | | | | |
| Ctrip.com International Ltd.#* | | 3,300 | | | 306,801 |
| Norwegian Cruise Line Holdings Ltd.* | | 13,940 | | | 886,863 |
| | | | | | 1,193,664 |
| HOUSEWARES & SPECIALTIES—0.9% | | | | | |
| Jarden Corp.* | | 11,980 | | | 536,704 |
| INTERNET RETAIL—4.6% | | | | | |
| Amazon.com, Inc.* | | 4,330 | | | 2,710,147 |
| INTERNET SOFTWARE & SERVICES—13.9% | | | | | |
| Alphabet, Inc., Cl. C* | | 6,641 | | | 4,720,489 |
- 22 -
THE ALGER INSTITUTIONAL FUNDS | ALGER CAPITAL APPRECIATION FOCUS FUND
Schedule of Investments October 31, 2015 (Continued)
| | | | | |
| COMMON STOCKS—(CONT.) | | SHARES | | | VALUE |
| INTERNET SOFTWARE & SERVICES—(CONT.) | | | | | |
| Facebook, Inc., Cl. A* | | 24,960 | $ | 2,545,171 |
| Yahoo! Inc.* | | 25,400 | | | 904,748 |
| | | | | | 8,170,408 |
| INVESTMENT BANKING & BROKERAGE—1.4% | | | | | |
| Morgan Stanley | | 25,690 | | | 846,999 |
| LIFE SCIENCES TOOLS & SERVICES—2.2% | | | | | |
| Thermo FisherScientific,Inc. | | 9,750 | | | 1,275,105 |
| MANAGED HEALTH CARE—2.5% | | | | | |
| UnitedHealth Group, Inc. | | 12,250 | | | 1,442,805 |
| MOVIES & ENTERTAINMENT—0.9% | | | | | |
| Time Warner, Inc. | | 7,100 | | | 534,914 |
| OIL & GAS EQUIPMENT & SERVICES—0.6% | | | | | |
| Baker Hughes, Inc. | | 6,130 | | | 322,928 |
| OIL & GAS EXPLORATION & PRODUCTION—1.1% | | | | | |
| Anadarko Petroleum Corp. | | 9,949 | | | 665,389 |
| OTHER DIVERSIFIED FINANCIAL SERVICES—2.1% | | | | | |
| Bank of America Corp. | | 71,810 | | | 1,204,972 |
| PHARMACEUTICALS—5.0% | | | | | |
| Allergan PLC.* | | 4,290 | | | 1,323,336 |
| Bristol-Myers Squibb Co. | | 14,360 | | | 947,042 |
| Shire PLC.# | | 2,880 | | | 653,904 |
| | | | | | 2,924,282 |
| REGIONAL BANKS—3.1% | | | | | |
| Citizens Financial Group, Inc. | | 75,470 | | | 1,833,921 |
| RESTAURANTS—3.3% | | | | | |
| McDonald's Corp. | | 9,650 | | | 1,083,212 |
| Yum! Brands, Inc. | | 11,980 | | | 849,502 |
| | | | | | 1,932,714 |
| SECURITY & ALARM SERVICES—0.9% | | | | | |
| Tyco International PLC. | | 13,890 | | | 506,152 |
| SEMICONDUCTOR EQUIPMENT—0.2% | | | | | |
| SunEdison, Inc.* | | 19,340 | | | 141,182 |
| SEMICONDUCTORS—3.1% | | | | | |
| Avago Technologies Ltd. | | 5,740 | | | 706,766 |
| Broadcom Corp., Cl. A | | 9,330 | | | 479,562 |
| NXP Semiconductors NV* | | 8,080 | | | 633,068 |
| | | | | | 1,819,396 |
| SPECIALTY CHEMICALS—1.1% | | | | | |
| PPG Industries, Inc. | | 6,220 | | | 648,497 |
| SPECIALTY STORES—0.7% | | | | | |
| Signet Jewelers Ltd. | | 2,530 | | | 381,878 |
| SYSTEMS SOFTWARE—4.3% | | | | | |
| Microsoft Corp. | | 45,050 | | | 2,371,432 |
- 23 -
THE ALGER INSTITUTIONAL FUNDS | ALGER CAPITAL APPRECIATION FOCUS FUND
Schedule of Investments October 31, 2015 (Continued)
| | | | | | |
| COMMON STOCKS—(CONT.) | | SHARES | | | | VALUE |
| SYSTEMS SOFTWARE—(CONT.) | | | | | | |
| ServiceNow, Inc.* | | 2,180 | | $ | | 177,997 |
| | | | | | | 2,549,429 |
| TECHNOLOGY HARDWARE STORAGE & PERIPHERALS—4.6% | | | | | | |
| Apple, Inc. | | 22,491 | | | | 2,687,675 |
| TRADING COMPANIES & DISTRIBUTORS—2.6% | | | | | | |
| HD Supply Holdings, Inc.* | | 30,270 | | | | 901,744 |
| United Rentals, Inc.* | | 8,720 | | | | 652,779 |
| | | | | | | 1,554,523 |
| TOTAL COMMON STOCKS | | | | | | |
| (Cost $49,211,092) | | | | | | 52,741,923 |
| PREFERRED STOCKS—0.6% | | SHARES | | | | VALUE |
| BIOTECHNOLOGY—0.6% | | | | | | |
| Prosetta Biosciences, Inc.*,@,(a) | | 76,825 | | | | 345,713 |
| (Cost $345,713) | | | | | | 345,713 |
| MASTER LIMITED PARTNERSHIP—2.6% | | SHARES | | | | VALUE |
| ASSET MANAGEMENT & CUSTODY BANKS—2.6% | | | | | | |
| The Blackstone Group LP. | | 45,400 | | | | 1,500,924 |
| (Cost $1,581,183) | | | | | | 1,500,924 |
| REAL ESTATE INVESTMENT TRUST—4.3% | | SHARES | | | | VALUE |
| MORTGAGE—2.2% | | | | | | |
| Blackstone Mortgage Trust, Inc., Cl. A | | 46,110 | | | | 1,268,947 |
| SPECIALIZED—2.1% | | | | | | |
| Crown Castle International Corp. | | 14,780 | | | | 1,263,099 |
| TOTAL REAL ESTATE INVESTMENT TRUST | | | | | | |
| (Cost $2,562,197) | | | | | | 2,532,046 |
| Total Investments | | | | | | |
| (Cost $53,700,185)(b) | | 97.4 | % | | | 57,120,606 |
| Other Assets in Excess of Liabilities | | 2.6 | % | | | 1,552,173 |
| NET ASSETS | | 100.0 | % | $ | | 58,672,779 |
# American Depositary Receipts.
(a) Deemed an affiliate of the Alger fund complex during the year for purposes of Section 2(a)(3) of the Investment
Company Act of 1940. See Affiliated Securities in Notes to Financial Statements.
(b) At October 31, 2015, the net unrealized appreciation on investments, based on cost for federal income tax
purposes of $54,877,989, amounted to $2,242,617 which consisted of aggregate gross unrealized appreciation of
$4,562,828 and aggregate gross unrealized depreciation of $2,320,211.
* Non-income producing security.
- 24 -
THE ALGER INSTITUTIONAL FUNDS | ALGER CAPITAL APPRECIATION FOCUS FUND
Schedule of Investments October 31, 2015 (Continued)
@ Restricted security - Investment in security not registered under the Securities Act of 1933. The investment is deemed
to not be liquid and may be sold only to qualified buyers.
| | | | | | | | | | |
| | | | | | % of net assets | | | | % of net assets | |
| | | Acquisition | | | (Acquisition | | | Market | as of | |
| Security | | Date(s) | | Cost | Date) | | | Value | 10/31/2015 | |
| Prosetta Biosciences, Inc. | | 02/06/15 | $ | 345,713 | 0.80 | % | $ | 345,713 | 0.59 | % |
| Total | | | | | | $ | 345,713 | 0.59 | % |
| | | | | | | | | | | |
Industry classifications are unaudited.
See Notes to Financial Statements.
- 25 -
THE ALGER INSTITUTIONAL FUNDS | ALGER MID CAP GROWTH INSTITUTIONAL FUND
Schedule of Investments October 31, 2015
| | | | | |
| COMMON STOCKS—90.7% | | SHARES | | | VALUE |
| ADVERTISING—0.0% | | | | | |
| Choicestream, Inc.*,@,(a) | | 8,930 | $ | 3,751 |
| AEROSPACE & DEFENSE—1.9% | | | | | |
| Hexcel Corp. | | 32,000 | | | 1,482,240 |
| TransDigm Group, Inc.* | | 4,500 | | | 989,325 |
| | | | | | 2,471,565 |
| AIRLINES—0.9% | | | | | |
| United Continental Holdings, Inc.* | | 20,000 | | | 1,206,200 |
| APPAREL ACCESSORIES & LUXURY GOODS—2.3% | | | | | |
| Hanesbrands, Inc. | | 43,700 | | | 1,395,778 |
| PVH Corp. | | 5,800 | | | 527,510 |
| Under Armour, Inc., Cl. A* | | 11,900 | | | 1,131,452 |
| | | | | | 3,054,740 |
| APPAREL RETAIL—0.6% | | | | | |
| L Brands, Inc. | | 8,000 | | | 767,840 |
| APPLICATION SOFTWARE—1.9% | | | | | |
| ACI Worldwide, Inc.* | | 45,600 | | | 1,092,120 |
| Aspen Technology, Inc.* | | 11,200 | | | 463,568 |
| Autodesk, Inc.* | | 5,300 | | | 292,507 |
| Synchronoss Technologies, Inc.* | | 19,363 | | | 681,190 |
| | | | | | 2,529,385 |
| AUTO PARTS & EQUIPMENT—2.0% | | | | | |
| Delphi Automotive PLC. | | 21,750 | | | 1,809,383 |
| WABCO Holdings, Inc.* | | 7,500 | | | 841,725 |
| | | | | | 2,651,108 |
| AUTOMOBILE MANUFACTURERS—0.1% | | | | | |
| Tesla Motors, Inc.* | | 800 | | | 165,544 |
| AUTOMOTIVE RETAIL—1.9% | | | | | |
| Advance Auto Parts, Inc. | | 8,100 | | | 1,607,283 |
| Carmax, Inc.* | | 15,500 | | | 914,655 |
| | | | | | 2,521,938 |
| BIOTECHNOLOGY—4.9% | | | | | |
| Anacor Pharmaceuticals, Inc.* | | 3,300 | | | 370,953 |
| BioMarin Pharmaceutical, Inc.* | | 4,700 | | | 550,088 |
| Bluebird Bio, Inc.* | | 3,600 | | | 277,668 |
| Celldex Therapeutics, Inc.* | | 19,900 | | | 239,994 |
| Incyte Corp.* | | 7,800 | | | 916,734 |
| Intercept Pharmaceuticals, Inc.* | | 5,400 | | | 848,880 |
| Juno Therapeutics, Inc.* | | 2,500 | | | 129,400 |
| Portola Pharmaceuticals, Inc.* | | 19,800 | | | 942,678 |
| Ultragenyx Pharmaceutical, Inc.* | | 6,100 | | | 606,035 |
| United Therapeutics Corp.* | | 5,700 | | | 835,791 |
| Vertex Pharmaceuticals, Inc.* | | 6,300 | | | 785,862 |
| | | | | | 6,504,083 |
| BROADCASTING—0.5% | | | | | |
| CBS Corp., Cl. B | | 14,800 | | | 688,496 |
- 26 -
THE ALGER INSTITUTIONAL FUNDS | ALGER MID CAP GROWTH INSTITUTIONAL FUND
Schedule of Investments October 31, 2015 (Continued)
| | | | | |
| COMMON STOCKS—(CONT.) | | SHARES | | | VALUE |
| BUILDING PRODUCTS—3.7% | | | | | |
| Allegion PLC. | | 27,800 | $ | 1,811,726 |
| AO Smith Corp. | | 12,400 | | | 952,568 |
| Fortune Brands Home & Security, Inc. | | 24,200 | | | 1,266,386 |
| Lennox International, Inc. | | 6,600 | | | 876,546 |
| | | | | | 4,907,226 |
| CASINOS & GAMING—1.2% | | | | | |
| Penn National Gaming, Inc.* | | 92,200 | | | 1,646,692 |
| COMMUNICATIONS EQUIPMENT—3.1% | | | | | |
| Arista Networks, Inc.* | | 9,200 | | | 593,492 |
| ARRIS Group, Inc.* | | 45,100 | | | 1,274,526 |
| F5 Networks, Inc.* | | 9,500 | | | 1,046,900 |
| NetScout Systems, Inc.* | | 34,700 | | | 1,244,689 |
| | | | | | 4,159,607 |
| CONSTRUCTION MATERIALS—0.6% | | | | | |
| Vulcan Materials Co. | | 8,600 | | | 830,588 |
| CONSUMER FINANCE—0.5% | | | | | |
| LendingClub Corp.* | | 43,900 | | | 622,502 |
| DATA PROCESSING & OUTSOURCED SERVICES—4.7% | | | | | |
| Alliance Data Systems Corp.* | | 8,000 | | | 2,378,480 |
| Fiserv, Inc.* | | 20,000 | | | 1,930,200 |
| Sabre Corp. | | 15,900 | | | 466,188 |
| Vantiv, Inc., CL. A* | | 28,000 | | | 1,404,200 |
| | | | | | 6,179,068 |
| DRUG RETAIL—0.8% | | | | | |
| Rite Aid Corp.* | | 130,000 | | | 1,024,400 |
| ELECTRICAL COMPONENTS & EQUIPMENT—1.3% | | | | | |
| Acuity Brands, Inc. | | 6,200 | | | 1,355,320 |
| Hubbell, Inc., Cl. B | | 4,200 | | | 406,770 |
| | | | | | 1,762,090 |
| ENVIRONMENTAL & FACILITIES SERVICES—0.4% | | | | | |
| Stericycle, Inc.* | | 4,400 | | | 534,028 |
| FOOD RETAIL—0.8% | | | | | |
| The Kroger Co. | | 26,500 | | | 1,001,700 |
| GENERAL MERCHANDISE STORES—2.1% | | | | | |
| Burlington Stores, Inc.* | | 9,100 | | | 437,528 |
| Dollar General Corp. | | 23,100 | | | 1,565,487 |
| Dollar Tree, Inc.* | | 11,800 | | | 772,782 |
| | | | | | 2,775,797 |
| HEALTH CARE EQUIPMENT—4.3% | | | | | |
| ABIOMED, Inc.* | | 9,600 | | | 707,136 |
| DexCom, Inc.* | | 21,600 | | | 1,799,712 |
| Edwards Lifesciences Corp.* | | 7,100 | | | 1,115,765 |
| Hologic, Inc.* | | 39,600 | | | 1,538,856 |
| IDEXX Laboratories, Inc.* | | 7,300 | | | 500,926 |
| | | | | | 5,662,395 |
- 27 -
THE ALGER INSTITUTIONAL FUNDS | ALGER MID CAP GROWTH INSTITUTIONAL FUND
Schedule of Investments October 31, 2015 (Continued)
| | | | | |
| COMMON STOCKS—(CONT.) | | SHARES | | | VALUE |
| HEALTH CARE FACILITIES—2.4% | | | | | |
| Acadia Healthcare Co., Inc.* | | 16,400 | $ | 1,007,124 |
| Amsurg Corp.* | | 6,600 | | | 462,594 |
| Universal Health Services, Inc., Cl. B | | 9,800 | | | 1,196,482 |
| VCA Antech, Inc.* | | 8,300 | | | 454,591 |
| | | | | | 3,120,791 |
| HEALTH CARE SERVICES—1.3% | | | | | |
| Adeptus Health, Inc., Cl. A* | | 11,200 | | | 726,768 |
| Diplomat Pharmacy, Inc.* | | 13,900 | | | 390,729 |
| Team Health Holdings, Inc.* | | 11,300 | | | 674,271 |
| | | | | | 1,791,768 |
| HOME FURNISHING RETAIL—0.8% | | | | | |
| Williams-Sonoma, Inc. | | 15,000 | | | 1,106,250 |
| HOMEBUILDING—0.7% | | | | | |
| Toll Brothers, Inc.* | | 26,200 | | | 942,414 |
| HOTELS RESORTS & CRUISE LINES—6.0% | | | | | |
| Diamond Resorts International, Inc.* | | 71,700 | | | 2,039,148 |
| Hilton Worldwide Holdings, Inc. | | 31,700 | | | 792,183 |
| Norwegian Cruise Line Holdings Ltd.* | | 48,100 | | | 3,060,122 |
| Royal Caribbean Cruises Ltd. | | 20,900 | | | 2,055,515 |
| | | | | | 7,946,968 |
| HOUSEHOLD PRODUCTS—0.7% | | | | | |
| Church & Dwight Co., Inc. | | 11,400 | | | 981,426 |
| HOUSEWARES & SPECIALTIES—2.0% | | | | | |
| Jarden Corp.* | | 34,450 | | | 1,543,360 |
| Newell Rubbermaid, Inc. | | 26,200 | | | 1,111,666 |
| | | | | | 2,655,026 |
| INDUSTRIAL GASES—0.3% | | | | | |
| Air Products & Chemicals, Inc. | | 2,400 | | | 333,552 |
| INDUSTRIAL MACHINERY—1.4% | | | | | |
| Graco, Inc. | | 11,100 | | | 814,740 |
| Ingersoll-Rand PLC. | | 13,700 | | | 811,862 |
| NN, Inc. | | 14,000 | | | 193,200 |
| | | | | | 1,819,802 |
| INTERNET SOFTWARE & SERVICES—3.8% | | | | | |
| Cornerstone OnDemand, Inc.* | | 18,500 | | | 582,750 |
| Criteo SA#* | | 16,400 | | | 624,184 |
| Demandware, Inc.* | | 18,500 | | | 1,048,950 |
| GrubHub, Inc.* | | 24,900 | | | 597,102 |
| Hortonworks, Inc.* | | 9,100 | | | 177,086 |
| LinkedIn Corp., Cl. A* | | 6,300 | | | 1,517,481 |
| Palantir Technologies, Inc., Cl. A*,@ | | 12,426 | | | 111,834 |
| Twitter, Inc.* | | 12,600 | | | 358,596 |
| | | | | | 5,017,983 |
| INVESTMENT BANKING & BROKERAGE—1.0% | | | | | |
| TD Ameritrade Holding Corp. | | 38,000 | | | 1,309,860 |
- 28 -
THE ALGER INSTITUTIONAL FUNDS | ALGER MID CAP GROWTH INSTITUTIONAL FUND
Schedule of Investments October 31, 2015 (Continued)
| | | | | |
| COMMON STOCKS—(CONT.) | | SHARES | | | VALUE |
| MOVIES & ENTERTAINMENT—0.6% | | | | | |
| Live Nation Entertainment, Inc.* | | 30,400 | $ | 829,312 |
| OIL & GAS DRILLING—0.3% | | | | | |
| Patterson-UTI Energy, Inc. | | 29,800 | | | 443,722 |
| OIL & GAS EXPLORATION & PRODUCTION—0.4% | | | | | |
| Carrizo Oil & Gas, Inc.* | | 5,800 | | | 218,254 |
| Diamondback Energy, Inc.* | | 2,300 | | | 169,832 |
| Whiting Petroleum Corp.* | | 10,300 | | | 177,469 |
| | | | | | 565,555 |
| PACKAGED FOODS & MEATS—0.7% | | | | | |
| TreeHouse Foods, Inc.* | | 10,500 | | | 899,220 |
| PHARMACEUTICALS—0.9% | | | | | |
| Jazz Pharmaceuticals PLC.* | | 2,900 | | | 398,112 |
| Lannett Co., Inc.* | | 10,800 | | | 483,516 |
| Pacira Pharmaceuticals, Inc.* | | 6,700 | | | 334,665 |
| | | | | | 1,216,293 |
| RAILROADS—0.2% | | | | | |
| Genesee & Wyoming, Inc., Cl. A* | | 3,800 | | | 254,980 |
| REAL ESTATE SERVICES—0.7% | | | | | |
| Jones Lang LaSalle, Inc. | | 5,900 | | | 983,589 |
| REGIONAL BANKS—1.8% | | | | | |
| Citizens Financial Group, Inc. | | 46,900 | | | 1,139,670 |
| Signature Bank* | | 8,400 | | | 1,250,928 |
| | | | | | 2,390,598 |
| RENEWABLE ELECTRICITY—0.6% | | | | | |
| TerraForm Global, Inc., Cl. A*,@,(b) | | 33,544 | | | 230,346 |
| TerraForm Power, Inc., Cl. A | | 32,900 | | | 600,425 |
| | | | | | 830,771 |
| RESEARCH & CONSULTING SERVICES—2.1% | | | | | |
| CoStar Group, Inc.* | | 4,300 | | | 873,201 |
| Verisk Analytics, Inc., Cl. A* | | 26,500 | | | 1,897,665 |
| | | | | | 2,770,866 |
| RESTAURANTS—0.4% | | | | | |
| Panera Bread Co., Cl. A* | | 3,104 | | | 550,556 |
| SECURITY & ALARM SERVICES—0.7% | | | | | |
| Tyco International PLC. | | 24,900 | | | 907,356 |
| SEMICONDUCTOR EQUIPMENT—1.1% | | | | | |
| Lam Research Corp. | | 15,600 | | | 1,194,804 |
| SunEdison, Inc.* | | 38,900 | | | 283,970 |
| | | | | | 1,478,774 |
| SEMICONDUCTORS—4.6% | | | | | |
| Avago Technologies Ltd. | | 20,900 | | | 2,573,417 |
| Microsemi Corp.* | | 36,000 | | | 1,296,360 |
| NXP Semiconductors NV* | | 15,800 | | | 1,237,930 |
| Skyworks Solutions, Inc. | | 13,200 | | | 1,019,568 |
| | | | | | 6,127,275 |
- 29 -
THE ALGER INSTITUTIONAL FUNDS | ALGER MID CAP GROWTH INSTITUTIONAL FUND
Schedule of Investments October 31, 2015 (Continued)
| | | | | | |
| COMMON STOCKS—(CONT.) | | SHARES | | | | VALUE |
| SPECIALIZED CONSUMER SERVICES—0.9% | | | | | | |
| ServiceMaster Global Holdings, Inc.* | | 33,900 | $ | 1,208,535 |
| SPECIALIZED FINANCE—2.1% | | | | | | |
| McGraw Hill Financial, Inc. | | 17,200 | | | | 1,593,408 |
| Moody's Corp. | | 11,800 | | | | 1,134,688 |
| | | | | | | 2,728,096 |
| SPECIALTY CHEMICALS—2.3% | | | | | | |
| Axalta Coating Systems Ltd.* | | 34,000 | | | | 939,420 |
| PPG Industries, Inc. | | 11,300 | | | | 1,178,138 |
| The Sherwin-Williams Co. | | 3,700 | | | | 987,271 |
| | | | | | | 3,104,829 |
| SPECIALTY STORES—3.4% | | | | | | |
| Signet Jewelers Ltd. | | 11,600 | | | | 1,750,904 |
| The Michaels Cos, Inc.* | | 23,800 | | | | 556,444 |
| Tractor Supply Co. | | 11,900 | | | | 1,099,441 |
| Ulta Salon, Cosmetics & Fragrance, Inc.* | | 6,000 | | | | 1,043,760 |
| | | | | | | 4,450,549 |
| SYSTEMS SOFTWARE—2.3% | | | | | | |
| Fortinet, Inc.* | | 11,800 | | | | 405,448 |
| Proofpoint, Inc.* | | 3,500 | | | | 246,540 |
| ServiceNow, Inc.* | | 24,700 | | | | 2,016,755 |
| Tableau Software, Inc., Cl. A* | | 5,300 | | | | 444,988 |
| | | | | | | 3,113,731 |
| TECHNOLOGY HARDWARE STORAGE & PERIPHERALS—0.4% | | | | | | |
| Western Digital Corp. | | 8,500 | | | | 567,970 |
| TRADING COMPANIES & DISTRIBUTORS—1.8% | | | | | | |
| HD Supply Holdings, Inc.* | | 54,100 | | | | 1,611,639 |
| United Rentals, Inc.* | | 10,500 | | | | 786,030 |
| | | | | | | 2,397,669 |
| WIRELESS TELECOMMUNICATION SERVICES—1.5% | | | | | | |
| SBA Communications Corp., Cl. A* | | 16,500 | | | | 1,963,830 |
| TOTAL COMMON STOCKS | | | | | | |
| (Cost $114,561,122) | | | | | 120,480,659 |
| PREFERRED STOCKS—2.0% | | SHARES | | | | VALUE |
| ADVERTISING—0.0% | | | | | | |
| Choicestream, Inc., Cl. A*,@,(a) | | 77,008 | | | | 32,343 |
| Choicestream, Inc., Cl. B*,@,(a) | | 144,793 | | | | 60,813 |
| | | | | | | 93,156 |
| BIOTECHNOLOGY—1.4% | | | | | | |
| Prosetta Biosciences, Inc.*,@,(a) | | 166,009 | | | | 747,041 |
| Tolero Pharmaceuticals, Inc.*,@,(a) | | 354,870 | | | | 1,070,323 |
| | | | | | | 1,817,364 |
| INTERNET SOFTWARE & SERVICES—0.4% | | | | | | |
| Palantir Technologies, Inc., Cl. B*,@ | | 50,675 | | | | 456,075 |
| Palantir Technologies, Inc., Cl. D*,@ | | 6,602 | | | | 59,418 |
| | | | | | | 515,493 |
- 30 -
THE ALGER INSTITUTIONAL FUNDS | ALGER MID CAP GROWTH INSTITUTIONAL FUND
Schedule of Investments October 31, 2015 (Continued)
| | | | | | | |
| PREFERRED STOCKS—(CONT.) | | SHARES | | | | | VALUE |
| PHARMACEUTICALS—0.2% | | | | | | | |
| Intarcia Therapeutics, Inc.*,@ | | 7,588 | | | $ | | 285,916 |
| TOTAL PREFERRED STOCKS | | | | | | | |
| (Cost $2,589,818) | | | | | | | 2,711,929 |
| REAL ESTATE INVESTMENT TRUST—2.2% | | SHARES | | | | | VALUE |
| HEALTH CARE—0.4% | | | | | | | |
| Omega Healthcare Investors, Inc. | | 15,900 | | | | | 548,868 |
| MORTGAGE—0.5% | | | | | | | |
| Blackstone Mortgage Trust, Inc., Cl. A | | 22,200 | | | | | 610,944 |
| SPECIALIZED—1.3% | | | | | | | |
| Crown Castle International Corp. | | 20,100 | | | | | 1,717,746 |
| TOTAL REAL ESTATE INVESTMENT TRUST | | | | | | | |
| (Cost $3,107,361) | | | | | | | 2,877,558 |
| SPECIAL PURPOSE VEHICLE—0.2% | | SHARES | | | | | VALUE |
| CONSUMER FINANCE—0.2% | | | | | | | |
| JS Kred SPV I, LLC.@ | | 240,362 | | | | | 240,362 |
| (Cost $240,362) | | | | | | | 240,362 |
| Total Investments | | | | | | | |
| (Cost $120,498,663)(c) | | 95.1 | % | | 126,310,508 |
| Other Assets in Excess of Liabilities | | 4.9 | % | | | | 6,468,045 |
| NET ASSETS | | 100.0 | % | | $ | | 132,778,553 |
# American Depositary Receipts.
(a) Deemed an affiliate of the Alger fund complex during the year for purposes of Section 2(a)(3) of the Investment
Company Act of 1940. See Affiliated Securities in Notes to Financial Statements.
(b) Pursuant to Securities and Exchange Commission Rule 144A deemed illiquid until eligible for sale on January 27,
2016.
(c) At October 31, 2015, the net unrealized appreciation on investments, based on cost for federal income tax purposes
of $120,563,892, amounted to $5,746,616 which consisted of aggregate gross unrealized appreciation of
$13,767,900 and aggregate gross unrealized depreciation of $8,021,284.
* Non-income producing security.
- 31 -
THE ALGER INSTITUTIONAL FUNDS | ALGER MID CAP GROWTH INSTITUTIONAL FUND
Schedule of Investments October 31, 2015 (Continued)
@ Restricted security - Investment in security not registered under the Securities Act of 1933. The investment is deemed
to not be liquid and may be sold only to qualified buyers.
| | | | | | | | | |
| | | | | % of net assets | | | | % of net assets | |
| | Acquisition | | | (Acquisition | | | Market | as of | |
| Security | Date(s) | | Cost | Date) | | | Value | 10/31/2015 | |
| Choicestream, Inc. | 03/14/14 | $ | 2,590 | 0.00 | % | $ | 3,751 | 0.00 | % |
| Choicestream, Inc., Cl. A | 12/17/13 | | 61,582 | 0.03 | % | | 32,343 | 0.02 | % |
| Choicestream, Inc., Cl. B | 07/10/14 | | 86,876 | 0.05 | % | | 60,813 | 0.05 | % |
| Intarcia Therapeutics, Inc. | 03/27/14 | | 245,775 | 0.14 | % | | 285,916 | 0.21 | % |
| JS Kred SPV I, LLC. | 06/26/15 | | 240,362 | 0.15 | % | | 240,362 | 0.18 | % |
| Palantir Technologies, Inc., Cl. A | 10/07/14 | | 80,856 | 0.05 | % | | 111,834 | 0.09 | % |
| Palantir Technologies, Inc., Cl. B | 10/07/14 | | 334,629 | 0.22 | % | | 456,075 | 0.34 | % |
| Palantir Technologies, Inc., Cl. D | 10/14/14 | | 43,592 | 0.03 | % | | 59,418 | 0.05 | % |
| Prosetta Biosciences, Inc. | 02/06/15 | | 747,041 | 0.50 | % | | 747,041 | 0.56 | % |
| TerraForm Global, Inc., Cl. A | 06/08/15 | | 478,000 | 0.31 | % | | 230,346 | 0.18 | % |
| Tolero Pharmaceuticals, Inc. | 08/01/14 | | 705,514 | 0.45 | % | | 705,514 | 0.53 | % |
| Tolero Pharmaceuticals, Inc. | 10/31/14 | | 364,809 | 0.23 | % | | 364,809 | 0.28 | % |
| Total | | | | | | $ | 3,298,222 | 2.49 | % |
Industry classifications are unaudited.
See Notes to Financial Statements.
- 32 -
THE ALGER INSTITUTIONAL FUNDS | ALGER SMALL CAP GROWTH INSTITUTIONAL FUND
Schedule of Investments October 31, 2015
| | | | | | |
| COMMON STOCKS—95.8% | | SHARES | | | | VALUE |
| AEROSPACE & DEFENSE—1.1% | | | | | | |
| Hexcel Corp. | | 89,700 | $ | 4,154,904 |
| AIR FREIGHT & LOGISTICS—0.8% | | | | | | |
| Forward Air Corp. | | 62,650 | | | | 2,841,804 |
| APPAREL ACCESSORIES & LUXURY GOODS—1.0% | | | | | | |
| G-III Apparel Group Ltd.* | | 70,600 | | | | 3,889,354 |
| APPAREL RETAIL—0.6% | | | | | | |
| AmericanEagleOutfitters,Inc. | | 154,400 | | | | 2,359,232 |
| APPLICATION SOFTWARE—16.4% | | | | | | |
| ACI Worldwide, Inc.* | | 235,950 | | | | 5,651,002 |
| American Software, Inc., Cl. A | | 434,952 | | | | 4,449,559 |
| Blackbaud, Inc. | | 128,100 | | | | 8,030,589 |
| Ellie Mae, Inc.* | | 73,650 | | | | 5,374,977 |
| Fair Isaac Corp. | | 55,250 | | | | 5,103,442 |
| Guidewire Software, Inc.* | | 83,550 | | | | 4,865,117 |
| HubSpot, Inc.* | | 103,950 | | | | 5,392,926 |
| Manhattan Associates, Inc.* | | 91,550 | | | | 6,669,418 |
| Paycom Software, Inc.* | | 48,500 | | | | 1,843,485 |
| PROS Holdings, Inc.* | | 95,173 | | | | 2,286,055 |
| SolarWinds, Inc.* | | 97,200 | | | | 5,640,516 |
| Tyler Technologies, Inc.* | | 37,800 | | | | 6,439,608 |
| | | | | | 61,746,694 |
| ASSET MANAGEMENT & CUSTODY BANKS—0.2% | | | | | | |
| WisdomTree Investments, Inc. | | 35,002 | | | | 673,088 |
| AUTO PARTS & EQUIPMENT—1.6% | | | | | | |
| Gentherm, Inc.* | | 59,050 | | | | 2,902,898 |
| Tenneco, Inc.* | | 57,750 | | | | 3,268,073 |
| | | | | | | 6,170,971 |
| AUTOMOTIVE RETAIL—0.9% | | | | | | |
| Lithia Motors, Inc., Cl. A | | 28,300 | | | | 3,322,137 |
| BIOTECHNOLOGY—8.4% | | | | | | |
| ACADIA Pharmaceuticals, Inc.* | | 52,300 | | | | 1,821,086 |
| Amicus Therapeutics, Inc.* | | 80,550 | | | | 604,125 |
| Anacor Pharmaceuticals, Inc.* | | 20,800 | | | | 2,338,128 |
| Celldex Therapeutics, Inc.* | | 106,650 | | | | 1,286,199 |
| Clovis Oncology, Inc.* | | 20,750 | | | | 2,073,132 |
| Dyax Corp.* | | 92,050 | | | | 2,534,136 |
| Halozyme Therapeutics, Inc.* | | 116,950 | | | | 1,830,267 |
| Heron Therapeutics, Inc.* | | 63,850 | | | | 1,750,767 |
| Incyte Corp.* | | 48,050 | | | | 5,647,317 |
| Juno Therapeutics, Inc.* | | 31,650 | | | | 1,638,204 |
| Neurocrine Biosciences, Inc.* | | 50,150 | | | | 2,461,864 |
| Novavax, Inc.* | | 144,600 | | | | 976,050 |
| Portola Pharmaceuticals, Inc.* | | 40,950 | | | | 1,949,630 |
| TESARO, Inc.* | | 46,700 | | | | 2,123,449 |
| Ultragenyx Pharmaceutical, Inc.* | | 24,500 | | | | 2,434,075 |
| | | | | | 31,468,429 |
- 33 -
THE ALGER INSTITUTIONAL FUNDS | ALGER SMALL CAP GROWTH INSTITUTIONAL FUND
Schedule of Investments October 31, 2015 (Continued)
| | | | | | |
| COMMON STOCKS—(CONT.) | | SHARES | | | | VALUE |
| BUILDING PRODUCTS—1.0% | | | | | | |
| Masonite International Corp.* | | 63,150 | $ | 3,780,790 |
| CASINOS & GAMING—1.0% | | | | | | |
| Penn National Gaming, Inc.* | | 212,200 | | | | 3,789,892 |
| COMMODITY CHEMICALS—0.8% | | | | | | |
| Calgon Carbon Corp. | | 164,400 | | | | 2,827,680 |
| COMMUNICATIONS EQUIPMENT—2.2% | | | | | | |
| ARRIS Group, Inc.* | | 76,099 | | | | 2,150,558 |
| NetScout Systems, Inc.* | | 166,850 | | | | 5,984,909 |
| | | | | | | 8,135,467 |
| CONSUMER FINANCE—0.7% | | | | | | |
| PRA Group, Inc.* | | 49,800 | | | | 2,729,040 |
| DATA PROCESSING & OUTSOURCED SERVICES—2.5% | | | | | | |
| Euronet Worldwide, Inc.* | | 48,600 | | | | 3,899,664 |
| MAXIMUS, Inc. | | 63,050 | | | | 4,300,010 |
| WEX, Inc.* | | 12,285 | | | | 1,104,544 |
| | | | | | | 9,304,218 |
| EDUCATION SERVICES—0.8% | | | | | | |
| Grand Canyon Education, Inc.* | | 71,350 | | | | 2,965,306 |
| ELECTRONIC COMPONENTS—1.4% | | | | | | |
| DTS, Inc.* | | 180,600 | | | | 5,374,656 |
| ELECTRONIC EQUIPMENT MANUFACTURERS—1.8% | | | | | | |
| Cognex Corp. | | 84,747 | | | | 3,186,487 |
| FEI Co. | | 48,950 | | | | 3,533,701 |
| | | | | | | 6,720,188 |
| FOOD DISTRIBUTORS—0.8% | | | | | | |
| Performance Food Group Co.* | | 132,500 | | | | 3,017,025 |
| FOOD RETAIL—1.1% | | | | | | |
| Smart & Final Stores, Inc.* | | 274,500 | | | | 4,046,130 |
| GENERAL MERCHANDISE STORES—1.2% | | | | | | |
| Burlington Stores, Inc.* | | 93,950 | | | | 4,517,116 |
| HEALTH CARE EQUIPMENT—5.1% | | | | | | |
| Abaxis, Inc. | | 18,200 | | | | 913,822 |
| ABIOMED, Inc.* | | 43,600 | | | | 3,211,576 |
| Cantel Medical Corp. | | 113,200 | | | | 6,710,496 |
| LivaNova PLC.* | | 94,250 | | | | 6,246,890 |
| Steris Corp.* | | 26,050 | | | | 1,952,447 |
| | | | | | 19,035,231 |
| HEALTH CARE FACILITIES—2.4% | | | | | | |
| Amsurg Corp.* | | 31,200 | | | | 2,186,808 |
| Surgery Partners, Inc.* | | 118,450 | | | | 1,992,329 |
| VCA Antech, Inc.* | | 88,500 | | | | 4,847,145 |
| | | | | | | 9,026,282 |
| HEALTH CARE SERVICES—1.8% | | | | | | |
| Adeptus Health, Inc., Cl. A* | | 39,450 | | | | 2,559,910 |
- 34 -
THE ALGER INSTITUTIONAL FUNDS | ALGER SMALL CAP GROWTH INSTITUTIONAL FUND
Schedule of Investments October 31, 2015 (Continued)
| | | | | | |
| COMMON STOCKS—(CONT.) | | SHARES | | | | VALUE |
| HEALTH CARE SERVICES—(CONT.) | | | | | | |
| Diplomat Pharmacy, Inc.* | | 66,750 | $ | 1,876,342 |
| Team Health Holdings, Inc.* | | 36,250 | | | | 2,163,038 |
| | | | | | | 6,599,290 |
| HEALTH CARE SUPPLIES—3.4% | | | | | | |
| Neogen Corp.* | | 150,900 | | | | 8,156,145 |
| Quidel Corp.* | | 242,150 | | | | 4,654,123 |
| | | | | | 12,810,268 |
| HEALTH CARE TECHNOLOGY—1.8% | | | | | | |
| Medidata Solutions, Inc.* | | 90,950 | | | | 3,910,850 |
| Veeva Systems, Inc., Cl. A* | | 111,800 | | | | 2,836,366 |
| | | | | | | 6,747,216 |
| HOMEFURNISHING RETAIL—0.8% | | | | | | |
| Restoration Hardware Holdings, Inc.* | | 30,900 | | | | 3,185,481 |
| HOTELS RESORTS & CRUISE LINES—0.6% | | | | | | |
| Diamond Resorts International, Inc.* | | 83,700 | | | | 2,380,428 |
| HUMAN RESOURCE & EMPLOYMENT SERVICES—2.1% | | | | | | |
| On Assignment, Inc.* | | 91,850 | | | | 4,143,354 |
| WageWorks, Inc.* | | 78,650 | | | | 3,776,773 |
| | | | | | | 7,920,127 |
| INDUSTRIAL MACHINERY—1.5% | | | | | | |
| Proto Labs, Inc.* | | 87,900 | | | | 5,699,436 |
| INTERNET SOFTWARE & SERVICES—7.5% | | | | | | |
| comScore, Inc.* | | 37,300 | | | | 1,595,694 |
| Criteo SA#* | | 106,512 | | | | 4,053,847 |
| Cvent, Inc.* | | 131,600 | | | | 4,159,876 |
| Demandware, Inc.* | | 41,115 | | | | 2,331,220 |
| SPS Commerce, Inc.* | | 115,950 | | | | 8,327,529 |
| Stamps.com, Inc.* | | 61,900 | | | | 4,680,259 |
| Textura Corp.* | | 98,600 | | | | 2,894,896 |
| | | | | | 28,043,321 |
| INVESTMENT BANKING & BROKERAGE—0.5% | | | | | | |
| Evercore Partners, Inc., Cl. A | | 31,850 | | | | 1,719,900 |
| LEISURE FACILITIES—0.3% | | | | | | |
| Planet Fitness, Inc., Cl. A* | | 79,800 | | | | 1,303,932 |
| LIFE SCIENCES TOOLS & SERVICES—3.5% | | | | | | |
| Bio-Techne Corp. | | 75,150 | | | | 6,628,230 |
| Luminex Corp.* | | 158,450 | | | | 2,883,790 |
| PRA Health Sciences, Inc.* | | 102,000 | | | | 3,574,080 |
| | | | | | 13,086,100 |
| MANAGED HEALTH CARE—0.6% | | | | | | |
| Molina Healthcare, Inc.* | | 39,000 | | | | 2,418,000 |
| OIL & GAS EQUIPMENT & SERVICES—0.3% | | | | | | |
| RPC, Inc. | | 118,650 | | | | 1,308,710 |
| OIL & GAS EXPLORATION & PRODUCTION—1.1% | | | | | | |
| Parsley Energy, Inc., Cl. A* | | 119,150 | | | | 2,112,530 |
- 35 -
THE ALGER INSTITUTIONAL FUNDS | ALGER SMALL CAP GROWTH INSTITUTIONAL FUND
Schedule of Investments October 31, 2015 (Continued)
| | | | | | |
| COMMON STOCKS—(CONT.) | | SHARES | | | | VALUE |
| OIL & GAS EXPLORATION & PRODUCTION—(CONT.) | | | | | | |
| QEP Resources, Inc. | | 129,150 | $ | 1,996,659 |
| | | | | | | 4,109,189 |
| PACKAGED FOODS & MEATS—0.5% | | | | | | |
| TreeHouse Foods, Inc.* | | 22,650 | | | | 1,939,746 |
| PAPER PACKAGING—0.7% | | | | | | |
| Graphic Packaging Holding Co. | | 184,850 | | | | 2,617,476 |
| PHARMACEUTICALS—0.9% | | | | | | |
| Impax Laboratories, Inc.* | | 49,100 | | | | 1,700,333 |
| Lannett Co., Inc.* | | 36,650 | | | | 1,640,821 |
| | | | | | | 3,341,154 |
| REGIONAL BANKS—2.5% | | | | | | |
| Bank of the Ozarks, Inc. | | 89,650 | | | | 4,484,293 |
| Boston Private Financial Holdings, Inc. | | 229,900 | | | | 2,634,654 |
| Investors Bancorp, Inc. | | 180,800 | | | | 2,261,808 |
| | | | | | | 9,380,755 |
| RESTAURANTS—2.5% | | | | | | |
| Dave & Buster's Entertainment, Inc.* | | 68,700 | | | | 2,650,446 |
| Fiesta Restaurant Group, Inc.* | | 43,718 | | | | 1,545,868 |
| Papa John's International, Inc. | | 58,300 | | | | 4,090,911 |
| Shake Shack, Inc., Cl. A* | | 21,750 | | | | 991,148 |
| | | | | | | 9,278,373 |
| SEMICONDUCTORS—2.8% | | | | | | |
| Cavium Networks, Inc.* | | 46,000 | | | | 3,263,700 |
| Microsemi Corp.* | | 110,550 | | | | 3,980,906 |
| Monolithic Power Systems, Inc. | | 52,050 | | | | 3,248,961 |
| | | | | | 10,493,567 |
| SPECIALTY CHEMICALS—1.6% | | | | | | |
| Balchem Corp. | | 88,030 | | | | 6,012,449 |
| SPECIALTY STORES—1.5% | | | | | | |
| Five Below, Inc.* | | 111,040 | | | | 3,813,114 |
| Party City Holdco, Inc.* | | 124,750 | | | | 1,974,792 |
| | | | | | | 5,787,906 |
| SYSTEMS SOFTWARE—2.2% | | | | | | |
| Proofpoint, Inc.* | | 89,846 | | | | 6,328,752 |
| TubeMogul, Inc.* | | 159,850 | | | | 1,910,208 |
| | | | | | | 8,238,960 |
| TRADING COMPANIES & DISTRIBUTORS—1.0% | | | | | | |
| Watsco, Inc. | | 29,800 | | | | 3,666,294 |
| TOTAL COMMON STOCKS | | | | | | |
| (Cost $331,233,732) | | | | | 359,983,712 |
| PREFERRED STOCKS—0.9% | | SHARES | | | | VALUE |
| BIOTECHNOLOGY—0.5% | | | | | | |
| Prosetta Biosciences, Inc.*,@,(a) | | 133,263 | | | | 599,684 |
| Tolero Pharmaceuticals, Inc.*,@,(a) | | 448,284 | | | | 1,352,069 |
| | | | | | | 1,951,753 |
- 36 -
THE ALGER INSTITUTIONAL FUNDS | ALGER SMALL CAP GROWTH INSTITUTIONAL FUND
Schedule of Investments October 31, 2015 (Continued)
| | | | | | | |
| PREFERRED STOCKS—(CONT.) | | SHARES | | | | | VALUE |
| PHARMACEUTICALS—0.4% | | | | | | | |
| Intarcia Therapeutics, Inc.*,@ | | 41,238 | | | $ | | 1,553,848 |
| TOTAL PREFERRED STOCKS | | | | | | | |
| (Cost $3,287,452) | | | | | | | 3,505,601 |
| RIGHTS—0.0% | | SHARES | | | | | VALUE |
| BIOTECHNOLOGY—0.0% | | | | | | | |
| Neuralstem, Inc., 1/8/2019* | | 250,375 | | | | | – |
| (Cost $0) | | | | | | | – |
| REAL ESTATE INVESTMENT TRUST—2.6% | | SHARES | | | | | VALUE |
| HOTELS & RESORTS—0.7% | | | | | | | |
| Pebblebrook Hotel Trust | | 70,347 | | | | | 2,404,460 |
| SPECIALIZED—1.9% | | | | | | | |
| CyrusOne, Inc. | | 88,150 | | | | | 3,109,932 |
| Sovran Self Storage, Inc. | | 41,000 | | | | | 4,094,670 |
| | | | | | | | 7,204,602 |
| TOTAL REAL ESTATE INVESTMENT TRUST | | | | | | | |
| (Cost $8,748,671) | | | | | | | 9,609,062 |
| SPECIAL PURPOSE VEHICLE—0.2% | | SHARES | | | | | VALUE |
| CONSUMER FINANCE—0.2% | | | | | | | |
| JS Kred SPV I, LLC.@ | | 775,134 | | | | | 775,134 |
| (Cost $775,134) | | | | | | | 775,134 |
| Total Investments | | | | | | | |
| (Cost $344,044,989)(b) | | 99.5 | % | | 373,873,509 |
| Other Assets in Excess of Liabilities | | 0.5 | % | | | | 1,892,433 |
| NET ASSETS | | 100.0 | % | | $ | | 375,765,942 |
- 37 -
THE ALGER INSTITUTIONAL FUNDS | ALGER SMALL CAP GROWTH INSTITUTIONAL FUND
Schedule of Investments October 31, 2015 (Continued)
# American Depositary Receipts.
(a) Deemed an affiliate of the Alger fund complex during the year for purposes of Section 2(a)(3) of the Investment
Company Act of 1940. See Affiliated Securities in Notes to Financial Statements.
(b) At October 31, 2015, the net unrealized appreciation on investments, based on cost for federal income tax purposes
of $349,914,411, amounted to $23,959,098 which consisted of aggregate gross unrealized appreciation of
$47,312,045 and aggregate gross unrealized depreciation of $23,352,947.
* Non-income producing security.
@ Restricted security - Investment in security not registered under the Securities Act of 1933. The investment is deemed
to not be liquid and may be sold only to qualified buyers.
| | | | | | | | | | |
| | | | | | % of net assets | | | | % of net assets | |
| | | Acquisition | | | (Acquisition | | | Market | as of | |
| Security | | Date(s) | | Cost | Date) | | | Value | 10/31/2015 | |
| Intarcia Therapeutics, Inc. | | 03/27/14 | $ | 1,335,699 | 0.15 | % | $ | 1,553,848 | 0.41 | % |
| JS Kred SPV I, LLC. | | 06/26/15 | | 775,134 | 0.15 | % | | 775,134 | 0.21 | % |
| Prosetta Biosciences, Inc. | | 02/06/15 | | 599,684 | 0.10 | % | | 599,684 | 0.16 | % |
| Tolero Pharmaceuticals, Inc. | | 10/31/14 | | 1,352,069 | 0.20 | % | | 1,352,069 | 0.36 | % |
| Total | | | | | | $ | 4,280,735 | 1.14 | % |
| | | | | | | | | | | |
Industry classifications are unaudited.
See Notes to Financial Statements.
- 38 -
THE ALGER INSTITUTIONAL FUNDS
Statement of Assets and Liabilities October 31, 2015
| | | | | | |
| | | Alger Capital | | | Alger Capital | |
| | | Appreciation | | Appreciation Focus | |
| | Institutional Fund | | | Fund | |
| |
| ASSETS: | | | | | | |
| Investmentsinsecurities,atvalue(Identifiedcostbelow)* | | | | | | |
| see accompanying schedules of investments | $ | 3,653,060,566 | | $ | 56,774,893 | |
| Investmentsinaffiliatedsecurities,atvalue(Identifiedcost | | | | | | |
| below)** see accompanying schedules of investments | | 1,554,055 | | | 345,713 | |
| Cash and cash equivalents | | 150,391,781 | | | 2,286,899 | |
| Receivable for investment securities sold | | 187,245,059 | | | 1,650,494 | |
| Receivableforsharesofbeneficialinterestsold | | 14,247,765 | | | 371,412 | |
| Dividends and interest receivable | | 1,902,834 | | | 36,593 | |
| Receivable from Investment Manager | | — | | | 14,617 | |
| Prepaid expenses | | 81,734 | | | 48,532 | |
| Total Assets | | 4,008,483,794 | | | 61,529,153 | |
| |
| LIABILITIES: | | | | | | |
| Payable for investment securities purchased | | 143,264,665 | | | 2,375,662 | |
| Payableforsharesofbeneficialinterestredeemed | | 9,760,658 | | | 373,850 | |
| Accrued investment advisory fees | | 2,311,163 | | | 33,850 | |
| Accrued transfer agent fees | | 1,002,303 | | | 15,906 | |
| Accrued distribution fees | | 264,920 | | | 10,166 | |
| Accrued administrative fees | | 86,282 | | | 1,311 | |
| Accrued shareholder servicing fees | | 784,378 | | | 4,823 | |
| Accrued shareholder administrative fees | | 31,375 | | | 642 | |
| Accrued other expenses | | 248,351 | | | 40,164 | |
| Total Liabilities | | 157,754,095 | | | 2,856,374 | |
| NET ASSETS | $ | 3,850,729,699 | | $ | 58,672,779 | |
| |
| NET ASSETS CONSIST OF: | | | | | | |
| Paid in capital (par value of $.001 per share) | | 3,170,722,986 | | | 55,846,394 | |
| Undistributed net investment income (accumulated loss) | | (9,105,013 | ) | | (164,935 | ) |
| Undistributed net realized gain (accumulated realized loss) | | 216,194,163 | | | (429,100 | ) |
| Net unrealized appreciation on investments | | 472,917,563 | | | 3,420,420 | |
| NET ASSETS | $ | 3,850,729,699 | | $ | 58,672,779 | |
| *Identifiedcost | $ | 3,179,300,979 | | $ | 53,354,472 | |
| **Identifiedcost | $ | 2,396,079 | | $ | 345,713 | |
| SeeNotestoFinancialStatements. | | | | | | |
- 39 -
THE ALGER INSTITUTIONAL FUNDS
Statement of Assets and Liabilities October 31, 2015 (Continued)
| | | | |
| | | Alger Capital | | Alger Capital |
| | | Appreciation | Appreciation Focus |
| | Institutional Fund | | Fund |
| |
| NET ASSETS BY CLASS: | | | | |
| Class A | $ | — | $ | 23,961,068 |
| Class C | $ | — | $ | 6,541,956 |
| Class I | $ | 3,194,261,213 | $ | 24,486,906 |
| Class R | $ | 656,468,486 | $ | — |
| Class Z | $ | — | $ | 3,682,849 |
| |
| SHARES OF BENEFICIAL INTEREST OUTSTANDING — NOTE 6: | | | |
| Class A | | — | | 992,985 |
| Class C | | — | | 276,915 |
| Class I | | 112,143,033 | | 1,010,533 |
| Class R | | 25,064,545 | | — |
| Class Z | | — | | 150,880 |
| |
| NET ASSET VALUE PER SHARE: | | | | |
| Class A — Net Asset Value Per Share Class A | $ | — | $ | 24.13 |
| Class A — Offering Price Per Share | | | | |
| (includes a 5.25% sales charge) | $ | — | $ | 25.47 |
| Class C — Net Asset Value Per Share Class C | $ | — | $ | 23.62 |
| Class I — Net Asset Value Per Share Class I | $ | 28.48 | $ | 24.23 |
| Class R — Net Asset Value Per Share Class R | $ | 26.19 | $ | — |
| Class Z — Net Asset Value Per Share Class Z | $ | — | $ | 24.41 |
| SeeNotestoFinancialStatements. | | | | |
- 40 -
THE ALGER INSTITUTIONAL FUNDS
Statement of Assets and Liabilities October 31, 2015 (Continued)
| | | | | | |
| | | | | | Alger Small Cap | |
| | Alger Mid Cap Growth | | Growth Institutional | |
| | Institutional Fund | | | Fund | |
| |
| ASSETS: | | | | | | |
| Investmentsinsecurities,atvalue(Identifiedcostbelow)* | | | | | | |
| see accompanying schedules of investments | $ | 124,396,237 | | $ | 371,921,756 | |
| Investmentsinaffiliatedsecurities,atvalue(Identifiedcost | | | | | | |
| below)** see accompanying schedules of investments | | 1,914,271 | | | 1,951,753 | |
| Cash and cash equivalents | | 7,682,725 | | | 6,706,159 | |
| Receivable for investment securities sold | | 3,865,499 | | | 1,959,132 | |
| Receivableforsharesofbeneficialinterestsold | | 73,531 | | | 302,505 | |
| Dividends and interest receivable | | 36,261 | | | 14,007 | |
| Prepaid expenses | | 15,321 | | | 22,258 | |
| Total Assets | | 137,983,845 | | | 382,877,570 | |
| |
| LIABILITIES: | | | | | | |
| Payable for investment securities purchased | | 4,033,510 | | | 5,282,090 | |
| Payableforsharesofbeneficialinterestredeemed | | 929,056 | | | 1,122,237 | |
| Accrued investment advisory fees | | 84,805 | | | 259,781 | |
| Accrued transfer agent fees | | 55,987 | | | 228,192 | |
| Accrued distribution fees | | 7,575 | | | 7,938 | |
| Accrued administrative fees | | 3,069 | | | 8,820 | |
| Accrued shareholder servicing fees | | 27,896 | | | 80,179 | |
| Accrued shareholder administrative fees | | 1,116 | | | 3,207 | |
| Accrued other expenses | | 62,278 | | | 119,184 | |
| Total Liabilities | | 5,205,292 | | | 7,111,628 | |
| NET ASSETS | $ | 132,778,553 | | $ | 375,765,942 | |
| |
| NET ASSETS CONSIST OF: | | | | | | |
| Paid in capital (par value of $.001 per share) | | 408,236,256 | | | 237,118,372 | |
| Undistributed net investment income (accumulated loss) | | (1,080,394 | ) | | (3,790,706 | ) |
| Undistributed net realized gain (accumulated realized loss) | | (280,189,155 | ) | | 112,609,757 | |
| Net unrealized appreciation on investments | | 5,811,846 | | | 29,828,519 | |
| NET ASSETS | $ | 132,778,553 | | $ | 375,765,942 | |
| *Identifiedcost | $ | 118,530,251 | | $ | 342,093,236 | |
| **Identifiedcost | $ | 1,968,412 | | $ | 1,951,753 | |
| SeeNotestoFinancialStatements. | | | | | | |
- 41 -
THE ALGER INSTITUTIONAL FUNDS
Statement of Assets and Liabilities October 31, 2015 (Continued)
| | | | |
| | | | | Alger Small Cap |
| | Alger Mid Cap Growth | Growth Institutional |
| | Institutional Fund | | Fund |
| |
| NET ASSETS BY CLASS: | | | | |
| Class I | $ | 114,983,689 | $ | 357,188,684 |
| Class R | $ | 17,794,864 | $ | 18,577,258 |
| |
| SHARES OF BENEFICIAL INTEREST OUTSTANDING — NOTE 6: | | | |
| Class I | | 5,101,070 | | 15,461,586 |
| Class R | | 848,881 | | 887,838 |
| |
| NET ASSET VALUE PER SHARE: | | | | |
| Class I — Net Asset Value Per Share Class I | $ | 22.54 | $ | 23.10 |
| Class R — Net Asset Value Per Share Class R | $ | 20.96 | $ | 20.92 |
| SeeNotestoFinancialStatements. | | | | |
- 42 -
THE ALGER INSTITUTIONAL FUNDS
Statement of Operations For the year ended October 31, 2015
| | | | | | |
| | | Alger Capital | | | Alger Capital | |
| | | Appreciation | | Appreciation Focus | |
| | Institutional Fund | | | Fund | |
| |
| INCOME: | | | | | | |
| Dividends (net of foreign withholding taxes*) | $ | 39,078,734 | | $ | 565,581 | |
| Interest | | 36,257 | | | 1,202 | |
| Total Income | | 39,114,991 | | | 566,783 | |
| |
| EXPENSES: | | | | | | |
| Advisory fees — Note 3(a) | | 27,427,091 | | | 335,277 | |
| Distribution fees — Note 3(c) | | | | | | |
| Class A | | — | | | 56,305 | |
| Class C | | — | | | 42,076 | |
| Class R | | 3,018,360 | | | — | |
| Shareholder servicing fees — Note 3 (k) | | 9,318,994 | | | 45,277 | |
| Shareholder administrative fees — Note 3(f) | | 372,760 | | | 6,459 | |
| Administration fees — Note 3(b) | | 1,025,090 | | | 12,986 | |
| Custodian fees | | 261,721 | | | 50,210 | |
| Interest expenses | | — | | | 15 | |
| Transfer agent fees and expenses — Note 3(f) | | 1,991,247 | | | 35,949 | |
| Printing fees | | 228,408 | | | 8,450 | |
| Professional fees | | 128,385 | | | 32,316 | |
| Registration fees | | 153,105 | | | 88,914 | |
| Trustee fees — Note 3(g) | | 122,508 | | | 5,523 | |
| Fund accounting fees | | 499,460 | | | 10,326 | |
| Miscellaneous | | 229,740 | | | 5,242 | |
| Total Expenses | | 44,776,869 | | | 735,325 | |
| Less, expense reimbursements/waivers — Note 3(a) | | — | | | (126,505 | ) |
| Net Expenses | | 44,776,869 | | | 608,820 | |
| NET INVESTMENT LOSS | | (5,661,878 | ) | | (42,037 | ) |
| |
| REALIZED AND UNREALIZED GAIN (LOSS) ON INVESTMENTS, OPTIONS AND FOREIGN CURRENCY: | |
| Net realized gain on investments and purchased options | | 245,579,530 | | | 2,309,907 | |
| Net realized gain on redemption-in-kind | | 47,725,674 | | | — | |
| Net realized (loss) on foreign currency transactions | | (65,501 | ) | | — | |
| Net change in unrealized appreciation on investments, | | | | | | |
| options and foreign currency | | 25,070,288 | | | 1,268,548 | |
| Net realized and unrealized gain on investments, options, and | | | | | | |
| foreign currency | | 318,309,991 | | | 3,578,455 | |
| NET INCREASE IN NET ASSETS RESULTING FROM | | | | | | |
| OPERATIONS | $ | 312,648,113 | | $ | 3,536,418 | |
| * Foreign withholding taxes | $ | 65,225 | | $ | 15 | |
| SeeNotestoFinancialStatements. | | | | | | |
- 43 -
THE ALGER INSTITUTIONAL FUNDS
Statement of Operations For the year ended October 31, 2015 (Continued)
| | | | | | |
| | | | | | Alger Small Cap | |
| | Alger Mid Cap Growth | | Growth Institutional | |
| | Institutional Fund | | | Fund | |
| |
| INCOME: | | | | | | |
| Dividends (net of foreign withholding taxes*) | $ | 987,183 | | $ | 2,384,852 | |
| Interest | | 1,027 | | | 1,548 | |
| Total Income | | 988,210 | | | 2,386,400 | |
| |
| EXPENSES: | | | | | | |
| Advisory fees — Note 3(a) | | 1,144,128 | | | 4,363,961 | |
| Distribution fees — Note 3(c) | | | | | | |
| Class R | | 101,515 | | | 123,757 | |
| Shareholder servicing fees — Note 3(k) | | 376,359 | | | 1,346,901 | |
| Shareholder administrative fees — Note 3(f) | | 15,054 | | | 53,876 | |
| Administration fees — Note 3(b) | | 41,399 | | | 148,159 | |
| Custodian fees | | 43,648 | | | 80,200 | |
| Interest expenses | | 304 | | | 15,386 | |
| Transfer agent fees and expenses — Note 3(f) | | 87,931 | | | 351,875 | |
| Printing fees | | 14,250 | | | 55,915 | |
| Professional fees | | 48,850 | | | 57,459 | |
| Registration fees | | 4,439 | | | 94,894 | |
| Trustee fees — Note 3(g) | | 8,473 | | | 19,182 | |
| Fund accounting fees | | 17,682 | | | 70,314 | |
| Miscellaneous | | 14,536 | | | 51,132 | |
| Total Expenses | | 1,918,568 | | | 6,833,011 | |
| NET INVESTMENT LOSS | | (930,358 | ) | | (4,446,611 | ) |
| |
| REALIZED AND UNREALIZED GAIN (LOSS) ON INVESTMENTS, OPTIONS AND FOREIGN CURRENCY: | |
| Net realized gain on investments and purchased options | | 6,259,008 | | | 116,168,863 | |
| Net realized gain (loss) on foreign currency transactions | | (2,897 | ) | | — | |
| Net realized (loss) on options written | | (85,147 | ) | | — | |
| Net change in unrealized (depreciation) on investments, | | | | | | |
| options and foreign currency | | (2,097,299 | ) | | (95,572,078 | ) |
| Net change in unrealized (depreciation) on written options | | (48,165 | ) | | — | |
| Net realized and unrealized gain on investments, options, and | | | | | | |
| foreign currency | | 4,025,500 | | | 20,596,785 | |
| NET INCREASE IN NET ASSETS RESULTING FROM | | | | | | |
| OPERATIONS | $ | 3,095,142 | | $ | 16,150,174 | |
| * Foreign withholding taxes | $ | 581 | | $ | — | |
| SeeNotestoFinancialStatements. | | | | | | |
- 44 -
THE ALGER INSTITUTIONAL FUNDS
Statements of Changes in Net Assets
| | | | | | | |
| | Alger Capital Appreciation Institutional Fund | |
| | | | For the | | | For the | |
| | | | Year Ended | | | Year Ended | |
| | | | October 31, 2015 | | | October 31, 2014 | |
| |
| Net investment loss | $ | (5,661,878 | ) | $ | (4,324,715 | ) |
| Net realized gain on investments, options and foreign currency | | | 293,239,703 | | | 378,982,949 | |
| Net change in unrealized appreciation on investments, options | | | | | | | |
| and foreign currency | | | 25,070,288 | | | 56,693,910 | |
| Net increase in net assets resulting from operations | | | 312,648,113 | | | 431,352,144 | |
| |
| Dividends and distributions to shareholders from: | | | | | | | |
| Net investment income: | | | | | | | |
| Class I | | | — | | | (596,123 | ) |
| Net realized gains: | | | | | | | |
| Class I | | | (321,833,735 | ) | | (238,827,929 | ) |
| Class R | | | (64,146,416 | ) | | (56,924,364 | ) |
| Total dividends and distributions to shareholders | | | (385,980,151 | ) | | (296,348,416 | ) |
| |
| Increase(decrease)fromsharesofbeneficialinteresttransactions: | | | | | | |
| Class I | | | 693,918,464 | | | 481,567,857 | |
| Class R | | | 144,649,699 | | | 68,067,671 | |
| Netincreasefromsharesofbeneficialinteresttransactions — | | | | | | | |
| Note 6(a) | | | 838,568,163 | | | 549,635,528 | |
| Total increase | | | 765,236,125 | | | 684,639,256 | |
| |
| Net Assets: | | | | | | | |
| Beginning of period | | | 3,085,493,574 | | | 2,400,854,318 | |
| END OF PERIOD | $ | 3,850,729,699 | | $ | 3,085,493,574 | |
| Undistributed net investment income (accumulated loss) | $ | (9,105,013 | ) | $ | 575,998 | |
| SeeNotestoFinancialStatements. | | | | | | | |
- 45 -
THE ALGER INSTITUTIONAL FUNDS
Statements of Changes in Net Assets (Continued)
| | | | | | | |
| | | | Alger Capital Appreciation Focus Fund | |
| | | | For the | | | For the | |
| | | | Year Ended | | | Year Ended | |
| | | | October 31, 2015 | | | October 31, 2014 | |
| |
| Net investment loss | $ | (42,037 | ) | $ | (36,669 | ) |
| Net realized gain on investments, options and foreign currency | | | 2,309,907 | | | 3,227,165 | |
| Net change in unrealized appreciation (depreciation) on | | | | | | | |
| investments, options and foreign currency | | | 1,268,548 | | | (90,443 | ) |
| Net increase in net assets resulting from operations | | | 3,536,418 | | | 3,100,053 | |
| |
| Increase(decrease)fromsharesofbeneficialinteresttransactions: | | | | | | |
| Class A | | | 16,877,719 | | | 915,255 | |
| Class C | | | 3,632,471 | | | 385,874 | |
| Class I | | | 10,433,186 | | | 2,291,590 | |
| Class R | | | — | | | (2,761,004 | ) |
| Class Z | | | 2,241,175 | | | 1,078,955 | |
| Netincreasefromsharesofbeneficialinteresttransactions — | | | | | | | |
| Note 6(a) | | | 33,184,551 | | | 1,910,670 | |
| |
| Redemption Fees: | | | | | | | |
| Class A | | | 180 | | | 48 | |
| Total Redemption Fees — Note 6(b) | | | 180 | | | 48 | |
| Total increase | | | 36,721,149 | | | 5,010,771 | |
| |
| Net Assets: | | | | | | | |
| Beginning of period | | | 21,951,630 | | | 16,940,859 | |
| END OF PERIOD | $ | 58,672,779 | | $ | 21,951,630 | |
| Undistributed net investment income (accumulated loss) | $ | (164,935 | ) | $ | (46,575 | ) |
| SeeNotestoFinancialStatements. | | | | | | | |
- 46 -
THE ALGER INSTITUTIONAL FUNDS
Statements of Changes in Net Assets (Continued)
| | | | | | | | |
| | | Alger Mid Cap Growth Institutional Fund | |
| | | | For the | | | | For the | |
| | | | Year Ended | | | | Year Ended | |
| | | | October 31, 2015 | | | | October 31, 2014 | |
| |
| Net investment loss | $ | (930,358 | ) | $ | (637,854 | ) |
| Net realized gain on investments, options and foreign currency | | | 6,256,111 | | | | 31,779,503 | |
| Net realized gain (loss) on written options | | | (85,147 | ) | | | 5,050,424 | |
| Net change in unrealized depreciation on investments, options | | | | | | | | |
| and foreign currency | | | (2,097,299 | ) | | | (13,717,004 | ) |
| Net change in unrealized appreciation (depreciation) on written | | | | | | | | |
| options | | | (48,165 | ) | | | 55,602 | |
| Net increase in net assets resulting from operations | | | 3,095,142 | | | | 22,530,671 | |
| |
| Increase(decrease)fromsharesofbeneficialinteresttransactions: | | | | | | | |
| Class I | | | (20,175,331 | ) | | | (44,620,979 | ) |
| Class R | | | (4,520,619 | ) | | | (4,520,341 | ) |
| Netdecreasefromsharesofbeneficialinteresttransactions | | | | | | | | |
| — Note 6(a) | | | (24,695,950 | ) | | | (49,141,320 | ) |
| Total decrease | | | (21,600,808 | ) | | | (26,610,649 | ) |
| |
| Net Assets: | | | | | | | | |
| Beginning of period | | | 154,379,361 | | | | 180,990,010 | |
| END OF PERIOD | $ | 132,778,553 | | $ | 154,379,361 | |
| Undistributed net investment income (accumulated loss) | $ | (1,080,394 | ) | $ | (912,131 | ) |
| SeeNotestoFinancialStatements. | | | | | | | | |
- 47 -
THE ALGER INSTITUTIONAL FUNDS
Statements of Changes in Net Assets (Continued)
| | | | | | | |
| | | Alger Small Cap Growth Institutional Fund | |
| | | | For the | | | For the | |
| | | | Year Ended | | | Year Ended | |
| | | | October 31, 2015 | | | October 31, 2014 | |
| |
| Net investment loss | $ | (4,446,611 | ) | $ | (6,185,122 | ) |
| Net realized gain on investments, options and foreign currency | | | 116,168,863 | | | 121,181,367 | |
| Net change in unrealized depreciation on investments, options | | | | | | | |
| and foreign currency | | | (95,572,078 | ) | | (105,676,663 | ) |
| Net increase in net assets resulting from operations | | | 16,150,174 | | | 9,319,582 | |
| |
| Dividends and distributions to shareholders from: | | | | | | | |
| Net realized gains: | | | | | | | |
| Class I | | | (115,227,005 | ) | | (156,034,057 | ) |
| Class R | | | (5,978,217 | ) | | (7,135,001 | ) |
| Total dividends and distributions to shareholders | | | (121,205,222 | ) | | (163,169,058 | ) |
| |
| Increase(decrease)fromsharesofbeneficialinteresttransactions: | | | | | | |
| Class I | | | (202,968,640 | ) | | (129,906,734 | ) |
| Class R | | | (6,964,356 | ) | | (3,065,410 | ) |
| Netdecreasefromsharesofbeneficialinteresttransactions | | | | | | | |
| — Note 6(a) | | | (209,932,996 | ) | | (132,972,144 | ) |
| Total decrease | | | (314,988,044 | ) | | (286,821,620 | ) |
| |
| Net Assets: | | | | | | | |
| Beginning of period | | | 690,753,986 | | | 977,575,606 | |
| END OF PERIOD | $ | 375,765,942 | | $ | 690,753,986 | |
| Undistributed net investment income (accumulated loss) | $ | (3,790,706 | ) | $ | (6,318,821 | ) |
| SeeNotestoFinancialStatements. | | | | | | | |
- 48 -
THE ALGER INSTITUTIONAL FUNDS
Financial Highlights for a share outstanding throughout the period
| | | | | | | | | | | | | | | | | | | | | | |
| Alger Capital Appreciation | | | | | | | | | | | | | | | | | | | | | | |
| Institutional Fund | | | | | | | | | | | | | Class I | | | | | | | | | |
| | | Year ended | | | Year ended | | | Year ended | | | Year ended | | | Year ended | |
| | | 10/31/2015 | | | 10/31/2014 | | | 10/31/2013 | | | 10/31/2012 | | | 10/31/2011 | |
| Net asset value, beginning of period | | $ | 29.34 | | | $ | | 28.21 | | | $ | | 22.85 | | | $ | 20.88 | | | $ | 19.28 | |
| INCOME FROM INVESTMENT | | | | | | | | | | | | | | | | | | | | | | |
| OPERATIONS: | | | | | | | | | | | | | | | | | | | | | | |
| Net investment income (loss)(i) | | | (0.02 | ) | | | | (0.02 | ) | | | | 0.16 | | | | 0.09 | | | | (0.01 | ) |
| Net realized and unrealized gain on | | | | | | | | | | | | | | | | | | | | | | |
| investments | | | 2.46 | | | | | 4.57 | | | | | 6.21 | | | | 2.64 | | | | 1.61 | |
| Total from investment operations | | | 2.44 | | | | | 4.55 | | | | | 6.37 | | | | 2.73 | | | | 1.60 | |
| Dividends from net investment income | – | | | | | (0.01 | ) | | | | (0.17 | ) | | | – | | | | – | |
| Distributions from net realized gains | | | (3.30 | ) | | | | (3.41 | ) | | | | (0.84 | ) | | | (0.76 | ) | | | – | |
| Net asset value, end of period | | $ | 28.48 | | | $ | | 29.34 | | | $ | | 28.21 | | | $ | 22.85 | | | $ | 20.88 | |
| Total return | | | 8.96 | % | | | | 17.63 | % | | | | 29.02 | % | | | 13.70 | % | | | 8.30 | % |
| RATIOS/SUPPLEMENTAL DATA: | | | | | | | | | | | | | | | | | | | | | | |
| Net assets, end of period (000's | | | | | | | | | | | | | | | | | | | | | | |
| omitted) | $ | 3,194,261 | | $ | 2,555,737 | | $ | 1,958,405 | | $ | 1,470,078 | | $ | 1,041,609 | |
| Ratio of gross expenses to average | | | | | | | | | | | | | | | | | | | | | | |
| net assets | | | 1.12 | % | | | | 1.16 | % | | | | 1.19 | % | | | 1.19 | % | | | 1.17 | % |
| Ratio of expense reimbursements to | | | | | | | | | | | | | | | | | | | | | | |
| average net assets | | | – | | | | | – | | | | | – | | | | – | | | | – | |
| Ratio of net expenses to average net | | | | | | | | | | | | | | | | | | | | | | |
| assets | | | 1.12 | % | | | | 1.16 | % | | | | 1.19 | % | | | 1.19 | % | | | 1.17 | % |
| Ratio of net investment income (loss) to | | | | | | | | | | | | | | | | | | | | | | |
| average net assets | | | (0.07 | )% | | | | (0.07 | )% | | | | 0.65 | % | | | 0.41 | % | | | (0.04 | )% |
| | | | | | | | | | | | | | | | | | | | | | | |
| Portfolio turnover rate | | 136.03 | %(ii) | | 136.20%(iii) | | | | | 124.43 | % | | | 137.16 | % | | | 153.30 | % |
| SeeNotestoFinancialStatements. | | | | | | | | | | | | | | | | | | | | |
(i) Amount was computed based on average shares outstanding during the period.
(ii) Amount excludes redemption in kind transaction of $294,638,130. Please see note 6 to the financial statements.
(iii) Amount excludes redemption in kind transaction of $71,436,408. Please see note 6 to the financial statements.
- 49 -
THE ALGER INSTITUTIONAL FUNDS
Financial Highlights for a share outstanding throughout the period
| | | | | | | | | | | | | | | | | | | | | | | |
| Alger Capital Appreciation | | | | | | | | | | | | | | | | | | | | | | | |
| Institutional Fund | | | | | | | | | | | | | Class R | | | | | | | | | | |
| | | Year ended | | | Year ended | | | Year ended | | | Year ended | | | Year ended | |
| | | 10/31/2015 | | | 10/31/2014 | | | 10/31/2013 | | | 10/31/2012 | | | 10/31/2011 | |
| Net asset value, beginning of period | | $ | 27.35 | | | $ | | 26.63 | | | $ | | 21.76 | | | $ | 20.01 | | | $ | | 18.57 | |
| INCOME FROM INVESTMENT | | | | | | | | | | | | | | | | | | | | | | | |
| OPERATIONS: | | | | | | | | | | | | | | | | | | | | | | | |
| Net investment income (loss)(i) | | | (0.15 | ) | | | | (0.14 | ) | | | | 0.04 | | | | (0.02 | ) | | | | (0.11 | ) |
| Net realized and unrealized gain on | | | | | | | | | | | | | | | | | | | | | | | |
| investments | | | 2.29 | | | | | 4.27 | | | | | 5.87 | | | | 2.53 | | | | | 1.55 | |
| Total from investment operations | | | 2.14 | | | | | 4.13 | | | | | 5.91 | | | | 2.51 | | | | | 1.44 | |
| Dividends from net investment income | – | | | | | – | | | | | (0.20 | ) | | | – | | | | | – | |
| Distributions from net realized gains | | | (3.30 | ) | | | | (3.41 | ) | | | | (0.84 | ) | | | (0.76 | ) | | | | – | |
| Net asset value, end of period | | $ | 26.19 | | | $ | | 27.35 | | | $ | | 26.63 | | | $ | 21.76 | | | $ | | 20.01 | |
| Total return | | | 8.46 | % | | | | 17.04 | % | | | | 28.35 | % | | | 13.20 | % | | | | 7.80 | % |
| RATIOS/SUPPLEMENTAL DATA: | | | | | | | | | | | | | | | | | | | | | | | |
| Net assets, end of period (000's | | | | | | | | | | | | | | | | | | | | | | | |
| omitted) | $ | 656,469 | | $ | 529,757 | | $ | 442,449 | | $ | 347,634 | | $ | 227,260 | |
| Ratio of gross expenses to average | | | | | | | | | | | | | | | | | | | | | | | |
| net assets | | | 1.61 | % | | | | 1.64 | % | | | | 1.69 | % | | | 1.69 | % | | | | 1.68 | % |
| Ratio of expense reimbursements to | | | | | | | | | | | | | | | | | | | | | | | |
| average net assets | | | – | | | | | – | | | | | – | | | | – | | | | | – | |
| Ratio of net expenses to average net | | | | | | | | | | | | | | | | | | | | | | | |
| assets | | | 1.61 | % | | | | 1.64 | % | | | | 1.69 | % | | | 1.69 | % | | | | 1.68 | % |
| Ratio of net investment income (loss) to | | | | | | | | | | | | | | | | | | | | | | | |
| average net assets | | | (0.57 | )% | | | | (0.55 | )% | | | | 0.17 | % | | | (0.09 | )% | | | | (0.56 | )% |
| | | | | | | | | | | | | | | | | | | | | | | | |
| Portfolio turnover rate | | 136.03 | %(ii) | | 136.20%(iii) | | | | | 124.43 | % | | | 137.16 | % | | | | 153.30 | % |
| SeeNotestoFinancialStatements. | | | | | | | | | | | | | | | | | | | | | |
(i) Amount was computed based on average shares outstanding during the period.
(ii) Amount excludes redemption in kind transaction of $294,638,130. Please see note 6 to the financial statements.
(iii) Amount excludes redemption in kind transaction of $71,436,408. Please see note 6 to the financial statements.
- 50 -
THE ALGER INSTITUTIONAL FUNDS
Financial Highlights for a share outstanding throughout the period
| | | | | | | | | | | | |
| Alger Capital Appreciation Focus | | | | | | | | | | | | |
| Fund | | | | | | | Class A | | | | | |
| | | | | | | | | | From 12/31/2012 | |
| | | | Year ended | | | | Year ended | | | (commencement of operations) | |
| | | 10/31/2015 | | 10/31/2014 | | to 10/31/2013 (i) | |
| Net asset value, beginning of period | | $ | 22.01 | | $ | | 18.69 | | $ | | 14.70 | |
| INCOME FROM INVESTMENT | | | | | | | | | | | | |
| OPERATIONS: | | | | | | | | | | | | |
| Net investment loss(ii) | | | (0.02 | ) | | | (0.04 | ) | | | (0.01 | ) |
| Net realized and unrealized gain on | | | | | | | | | | | | |
| investments | | | 2.14 | | | | 3.36 | | | | 4.00 | |
| Total from investment operations | | | 2.12 | | | | 3.32 | | | | 3.99 | |
| Net asset value, end of period | | $ | 24.13 | | $ | | 22.01 | | $ | | 18.69 | |
| Total return(iii) | | | 9.63 | % | | | 17.76 | % | | | 27.14 | % |
| RATIOS/SUPPLEMENTAL DATA: | | | | | | | | | | | | |
| Net assets, end of period (000's | | | | | | | | | | | | |
| omitted) | $ | 23,961 | | $ | | 5,158 | | $ | | 3,496 | |
| Ratio of gross expenses to average | | | | | | | | | | | | |
| net assets | | | 1.48 | % | | | 2.38 | % | | | 2.49 | % |
| Ratio of expense reimbursements to | | | | | | | | | | | | |
| average net assets | | | (0.18 | )% | | | (1.08 | )% | | | (1.19 | )% |
| Ratio of net expenses to average net | | | | | | | | | | | | |
| assets | | | 1.30 | % | | | 1.30 | % | | | 1.30 | % |
| Ratio of net investment income (loss) to | | | | | | | | | | | | |
| average net assets | | | (0.08 | )% | | | (0.19 | )% | | | (0.09 | )% |
| Portfolio turnover rate | | | 182.58 | % | | | 153.69 | % | | | 166.61 | % |
| SeeNotestoFinancialStatements. | | | | | | | | | | |
(i) Ratios have been annualized; total return has not been annualized; portfolio turnover is for the twelve months then ended.
(ii) Amount was computed based on average shares outstanding during the period.
(iii) Does not reflect the effect of sales charges, if applicable.
- 51 -
THE ALGER INSTITUTIONAL FUNDS
Financial Highlights for a share outstanding throughout the period
| | | | | | | | | | | |
| Alger Capital Appreciation Focus | | | | | | | | | | | |
| Fund | | | | | | Class C | | | | | |
| | | | | | | | | From 12/31/2012 | |
| | | Year ended | | | | Year ended | | | (commencement of operations) | | |
| | 10/31/2015 | | 10/31/2014 | | to 10/31/2013 (i) | |
| Net asset value, beginning of period | $ | 21.71 | | $ | | 18.58 | | $ | | 14.70 | |
| INCOME FROM INVESTMENT | | | | | | | | | | | |
| OPERATIONS: | | | | | | | | | | | |
| Net investment loss(ii) | | (0.20 | ) | | | (0.19 | ) | | | (0.11 | ) |
| Net realized and unrealized gain on | | | | | | | | | | | |
| investments | | 2.11 | | | | 3.32 | | | | 3.99 | |
| Total from investment operations | | 1.91 | | | | 3.13 | | | | 3.88 | |
| Net asset value, end of period | $ | 23.62 | | $ | | 21.71 | | $ | | 18.58 | |
| Total return(iii) | | 8.80 | % | | | 16.85 | % | | | 26.39 | % |
| RATIOS/SUPPLEMENTAL DATA: | | | | | | | | | | | |
| Net assets, end of period (000's | | | | | | | | | | | |
| omitted) | $ | 6,542 | | $ | | 2,635 | | $ | | 1,913 | |
| Ratio of gross expenses to average | | | | | | | | | | | |
| net assets | | 2.25 | % | | | 3.14 | % | | | 3.27 | % |
| Ratio of expense reimbursements to | | | | | | | | | | | |
| average net assets | | (0.20 | )% | | | (1.09 | )% | | | (1.22 | )% |
| Ratio of net expenses to average net | | | | | | | | | | | |
| assets | | 2.05 | % | | | 2.05 | % | | | 2.05 | % |
| Ratio of net investment income (loss) to | | | | | | | | | | | |
| average net assets | | (0.85 | )% | | | (0.94 | )% | | | (0.83 | )% |
| Portfolio turnover rate | | 182.58 | % | | | 153.69 | % | | | 166.61 | % |
| SeeNotestoFinancialStatements. | | | | | | | | | | |
(i) Ratios have been annualized; total return has not been annualized; portfolio turnover is for the twelve months then ended.
(ii) Amount was computed based on average shares outstanding during the period.
(iii) Does not reflect the effect of sales charges, if applicable.
- 52 -
THE ALGER INSTITUTIONAL FUNDS
Financial Highlights for a share outstanding throughout the period
| | | | | | | | | | | | | | | | | | | | | | | |
| Alger Capital Appreciation Focus | | | | | | | | | | | | | | | | | | | | | | | |
| Fund | | | | | | | | | | | | Class I | | | | | | | | | | | |
| | | Year ended | | | Year ended | | Year ended | | | Year ended | | | Year ended | |
| | | 10/31/2015 | | | 10/31/2014 | | 10/31/2013 | | | 10/31/2012 | | | 10/31/2011 | |
| Net asset value, beginning of period | | $ | 22.07 | | | $ | | 18.72 | | $ | | 14.53 | | | $ | | 13.75 | | | $ | | 13.03 | |
| INCOME FROM INVESTMENT | | | | | | | | | | | | | | | | | | | | | | | |
| OPERATIONS: | | | | | | | | | | | | | | | | | | | | | | | |
| Net investment income (loss)(i) | | | 0.01 | | | | | (0.01 | ) | | | 0.15 | | | | | (0.03 | ) | | | | (0.04 | ) |
| Net realized and unrealized gain on | | | | | | | | | | | | | | | | | | | | | | | |
| investments | | | 2.15 | | | | | 3.36 | | | | 4.04 | | | | | 0.81 | | | | | 0.86 | |
| Total from investment operations | | | 2.16 | | | | | 3.35 | | | | 4.19 | | | | | 0.78 | | | | | 0.82 | |
| Dividends from net investment income | – | | | | | – | | | | – | | | | | – | | | | | (0.10 | ) |
| Net asset value, end of period | | $ | 24.23 | | | $ | | 22.07 | | $ | | 18.72 | | | $ | | 14.53 | | | $ | | 13.75 | |
| Total return(ii) | | | 9.79 | % | | | | 17.90 | % | | | 28.84 | % | | | | 5.70 | % | | | | 6.30 | % |
| RATIOS/SUPPLEMENTAL DATA: | | | | | | | | | | | | | | | | | | | | | | | |
| Net assets, end of period (000's | | | | | | | | | | | | | | | | | | | | | | | |
| omitted) | $ | 24,487 | | $ | 12,897 | | $ | | 8,684 | | $ | 15,101 | | $ | 16,294 | |
| Ratio of gross expenses to average | | | | | | | | | | | | | | | | | | | | | | | |
| net assets | | | 1.49 | % | | | | 2.36 | % | | | 2.32 | % | | | | 1.83 | % | | | | 1.69 | % |
| Ratio of expense reimbursements to | | | | | | | | | | | | | | | | | | | | | | | |
| average net assets | | | (0.34 | )% | | | | (1.21 | )% | | | (0.94 | )% | | | | – | | | | | – | |
| Ratio of net expenses to average net | | | | | | | | | | | | | | | | | | | | | | | |
| assets | | | 1.15 | % | | | | 1.15 | % | | | 1.38 | % | | | | 1.83 | % | | | | 1.69 | % |
| Ratio of net investment income (loss) to | | | | | | | | | | | | | | | | | | | | | | | |
| average net assets | | | 0.03 | % | | | | (0.04 | )% | | | 0.95 | % | | | | (0.22 | )% | | | | (0.27 | )% |
| Portfolio turnover rate | | | 182.58 | % | | | | 153.69 | % | | | 166.61 | % | | | | 153.72 | % | | | | 57.74 | % |
| SeeNotestoFinancialStatements. | | | | | | | | | | | | | | | | | | | | | |
(i) Amount was computed based on average shares outstanding during the period.
(ii) Does not reflect the effect of sales charges, if applicable.
- 53 -
THE ALGER INSTITUTIONAL FUNDS
Financial Highlights for a share outstanding throughout the period
| | | | | | | | | | | |
| Alger Capital Appreciation Focus | | | | | | | | | | | |
| Fund | | | | | | Class Z | | | | | |
| | | | | | | | | From 12/31/2012 | |
| | | Year ended | | | | Year ended | | | (commencement of operations) | | |
| | 10/31/2015 | | 10/31/2014 | | to 10/31/2013 (i) | |
| Net asset value, beginning of period | $ | 22.17 | | $ | | 18.75 | | $ | | 14.70 | |
| INCOME FROM INVESTMENT | | | | | | | | | | | |
| OPERATIONS: | | | | | | | | | | | |
| Net investment income(ii) | | 0.07 | | | | 0.05 | | | | 0.04 | |
| Net realized and unrealized gain on | | | | | | | | | | | |
| investments | | 2.17 | | | | 3.37 | | | | 4.01 | |
| Total from investment operations | | 2.24 | | | | 3.42 | | | | 4.05 | |
| Net asset value, end of period | $ | 24.41 | | $ | | 22.17 | | $ | | 18.75 | |
| Total return(iii) | | 10.10 | % | | | 18.24 | % | | | 27.55 | % |
| RATIOS/SUPPLEMENTAL DATA: | | | | | | | | | | | |
| Net assets, end of period (000's | | | | | | | | | | | |
| omitted) | $ | 3,683 | | $ | | 1,262 | | $ | | 128 | |
| Ratio of gross expenses to average | | | | | | | | | | | |
| net assets | | 1.50 | % | | | 4.78 | % | | | 10.11 | % |
| Ratio of expense reimbursements to | | | | | | | | | | | |
| average net assets | | (0.61 | )% | | | (3.89 | )% | | | (9.22 | )% |
| Ratio of net expenses to average net | | | | | | | | | | | |
| assets | | 0.89 | % | | | 0.89 | % | | | 0.89 | % |
| Ratio of net investment income (loss) to | | | | | | | | | | | |
| average net assets | | 0.30 | % | | | 0.23 | % | | | 0.32 | % |
| Portfolio turnover rate | | 182.58 | % | | | 153.69 | % | | | 166.61 | % |
| SeeNotestoFinancialStatements. | | | | | | | | | | |
(i) Ratios have been annualized; total return has not been annualized; portfolio turnover is for the twelve months then ended.
(ii) Amount was computed based on average shares outstanding during the period.
(iii) Does not reflect the effect of sales charges, if applicable.
- 54 -
THE ALGER INSTITUTIONAL FUNDS
Financial Highlights for a share outstanding throughout the period
| | | | | | | | | | | | | | | | | | | | | | | |
| Alger Mid Cap Growth Institutional | | | | | | | | | | | | | | | | | | | | | | | |
| Fund | | | | | | | | | | | | | Class I | | | | | | | | | | |
| | | Year ended | | | Year ended | | | Year ended | | | Year ended | | | Year ended | |
| | | 10/31/2015 | | | 10/31/2014 | | | 10/31/2013 | | | 10/31/2012 | | | 10/31/2011 | |
| Net asset value, beginning of period | | $ | 22.18 | | | $ | | 19.43 | | | $ | | 14.59 | | | $ | | 13.50 | | | $ | 13.11 | |
| INCOME FROM INVESTMENT | | | | | | | | | | | | | | | | | | | | | | | |
| OPERATIONS: | | | | | | | | | | | | | | | | | | | | | | | |
| Net investment loss(i) | | | (0.13 | ) | | | | (0.07 | ) | | | | (0.03 | ) | | | | – | | | | (0.10 | ) |
| Net realized and unrealized gain on | | | | | | | | | | | | | | | | | | | | | | | |
| investments | | | 0.49 | | | | | 2.82 | | | | | 4.91 | | | | | 1.09 | | | | 0.52 | |
| Total from investment operations | | | 0.36 | | | | | 2.75 | | | | | 4.88 | | | | | 1.09 | | | | 0.42 | |
| Dividends from net investment income | – | | | | | – | | | | | (0.04 | ) | | | | – | | | | (0.03 | ) |
| Net asset value, end of period | | $ | 22.54 | | | $ | | 22.18 | | | $ | | 19.43 | | | $ | | 14.59 | | | $ | 13.50 | |
| Total return | | | 1.62 | % | | | | 14.15 | % | | | | 33.41 | % | | | | 8.10 | % | | | 3.30 | % |
| RATIOS/SUPPLEMENTAL DATA: | | | | | | | | | | | | | | | | | | | | | | | |
| Net assets, end of period (000's | | | | | | | | | | | | | | | | | | | | | | | |
| omitted) | $ | 114,984 | | $ | 132,426 | | $ | 157,391 | | $ | 182,087 | | $ | 317,893 | |
| Ratio of gross expenses to average | | | | | | | | | | | | | | | | | | | | | | | |
| net assets | | | 1.20 | % | | | | 1.30 | % | | | | 1.29 | % | | | | 1.23 | % | | | 1.18 | % |
| Ratio of expense reimbursements to | | | | | | | | | | | | | | | | | | | | | | | |
| average net assets | | | – | | | | | – | | | | | – | | | | | – | | | | – | |
| Ratio of net expenses to average net | | | | | | | | | | | | | | | | | | | | | | | |
| assets | | | 1.20 | % | | | | 1.30 | % | | | | 1.29 | % | | | | 1.23 | % | | | 1.18 | % |
| Ratio of net investment income (loss) to | | | | | | | | | | | | | | | | | | | | | | | |
| average net assets | | | (0.55 | )% | | | | (0.32 | )% | | | | (0.19 | )% | | | | 0.02 | % | | | (0.69 | )% |
| Portfolio turnover rate | | | 120.97 | % | | | | 192.15 | % | | | | 153.89 | % | | | | 232.99 | % | | | 233.50 | % |
| SeeNotestoFinancialStatements. | | | | | | | | | | | | | | | | | | | | | |
(i) Amount was computed based on average shares outstanding during the period.
- 55 -
THE ALGER INSTITUTIONAL FUNDS
Financial Highlights for a share outstanding throughout the period
| | | | | | | | | | | | | | | | | | | | | | | | |
| Alger Mid Cap Growth Institutional | | | | | | | | | | | | | | | | | | | | | | | | |
| Fund | | | | | | | | | | | | | Class R | | | | | | | | | | | |
| | | Year ended | | | Year ended | | | Year ended | | | Year ended | | | Year ended | |
| | | 10/31/2015 | | | 10/31/2014 | | | 10/31/2013 | | | 10/31/2012 | | | 10/31/2011 | |
| Net asset value, beginning of period | | $ | 20.74 | | | $ | | 18.26 | | | $ | | 13.81 | | | $ | | 12.85 | | | $ | | 12.51 | |
| INCOME FROM INVESTMENT | | | | | | | | | | | | | | | | | | | | | | | | |
| OPERATIONS: | | | | | | | | | | | | | | | | | | | | | | | | |
| Net investment loss(i) | | | (0.23 | ) | | | | (0.16 | ) | | | | (0.11 | ) | | | | (0.07 | ) | | | | (0.17 | ) |
| Net realized and unrealized gain on | | | | | | | | | | | | | | | | | | | | | | | | |
| investments | | | 0.45 | | | | | 2.64 | | | | | 4.63 | | | | | 1.03 | | | | | 0.51 | |
| Total from investment operations | | | 0.22 | | | | | 2.48 | | | | | 4.52 | | | | | 0.96 | | | | | 0.34 | |
| Dividends from net investment income | – | | | | | – | | | | | (0.07 | ) | | | | – | | | | | – | |
| Net asset value, end of period | | $ | 20.96 | | | $ | | 20.74 | | | $ | | 18.26 | | | $ | | 13.81 | | | $ | | 12.85 | |
| Total return | | | 1.11 | % | | | | 13.58 | % | | | | 32.83 | % | | | | 7.50 | % | | | | 2.70 | % |
| RATIOS/SUPPLEMENTAL DATA: | | | | | | | | | | | | | | | | | | | | | | | | |
| Net assets, end of period (000's | | | | | | | | | | | | | | | | | | | | | | | | |
| omitted) | $ | 17,795 | | $ | 21,953 | | $ | 23,599 | | $ | 26,661 | | $ | 34,795 | |
| Ratio of gross expenses to average | | | | | | | | | | | | | | | | | | | | | | | | |
| net assets | | | 1.74 | % | | | | 1.80 | % | | | | 1.79 | % | | | | 1.76 | % | | | | 1.74 | % |
| Ratio of expense reimbursements to | | | | | | | | | | | | | | | | | | | | | | | | |
| average net assets | | | – | | | | | – | | | | | – | | | | | – | | | | | – | |
| Ratio of net expenses to average net | | | | | | | | | | | | | | | | | | | | | | | | |
| assets | | | 1.74 | % | | | | 1.80 | % | | | | 1.79 | % | | | | 1.76 | % | | | | 1.74 | % |
| Ratio of net investment income (loss) to | | | | | | | | | | | | | | | | | | | | | | | | |
| average net assets | | | (1.08 | )% | | | | (0.82 | )% | | | | (0.69 | )% | | | | (0.50 | )% | | | | (1.24 | )% |
| Portfolio turnover rate | | | 120.97 | % | | | | 192.15 | % | | | | 153.89 | % | | | | 232.99 | % | | | | 233.50 | % |
| SeeNotestoFinancialStatements. | | | | | | | | | | | | | | | | | | | | | | |
(i) Amount was computed based on average shares outstanding during the period.
- 56 -
THE ALGER INSTITUTIONAL FUNDS
Financial Highlights for a share outstanding throughout the period
| | | | | | | | | | | | | | | | | | | | | | | | |
| Alger Small Cap Growth | | | | | | | | | | | | | | | | | | | | | | | | |
| Institutional Fund | | | | | | | | | | | | | Class I | | | | | | | | | | | |
| | | Year ended | | | Year ended | | | Year ended | | | Year ended | | | Year ended | |
| | | 10/31/2015 | | | 10/31/2014 | | | 10/31/2013 | | | 10/31/2012 | | | 10/31/2011 | |
| Net asset value, beginning of period | | $ | 28.14 | | | $ | | 33.48 | | | $ | | 28.16 | | | $ | | 26.99 | | | $ | | 25.28 | |
| INCOME FROM INVESTMENT | | | | | | | | | | | | | | | | | | | | | | | | |
| OPERATIONS: | | | | | | | | | | | | | | | | | | | | | | | | |
| Net investment loss(i) | | | (0.20 | ) | | | | (0.20 | ) | | | | (0.11 | ) | | | | (0.15 | ) | | | | (0.26 | ) |
| Net realized and unrealized gain on | | | | | | | | | | | | | | | | | | | | | | | | |
| investments | | | 0.42 | | | | | 0.60 | | | | | 8.66 | | | | | 2.45 | | | | | 1.97 | |
| Total from investment operations | | | 0.22 | | | | | 0.40 | | | | | 8.55 | | | | | 2.30 | | | | | 1.71 | |
| Distributions from net realized gains | | | (5.26 | ) | | | | (5.74 | ) | | | | (3.23 | ) | | | | (1.13 | ) | | | | – | |
| Net asset value, end of period | | $ | 23.10 | | | $ | | 28.14 | | | $ | | 33.48 | | | $ | | 28.16 | | | $ | | 26.99 | |
| Total return | | | 0.53 | % | | | | 1.21 | % | | | | 33.71 | % | | | | 8.93 | % | | | | 6.80 | % |
| RATIOS/SUPPLEMENTAL DATA: | | | | | | | | | | | | | | | | | | | | | | | | |
| Net assets, end of period (000's | | | | | | | | | | | | | | | | | | | | | | | | |
| omitted) | $ | 357,189 | | $ | 659,692 | | $ | 936,554 | | $ | 929,237 | | $ | 1,119,966 | |
| Ratio of gross expenses to average | | | | | | | | | | | | | | | | | | | | | | | | |
| net assets | | | 1.25 | % | | | | 1.24 | % | | | | 1.25 | % | | | | 1.23 | % | | | | 1.18 | % |
| Ratio of expense reimbursements to | | | | | | | | | | | | | | | | | | | | | | | | |
| average net assets | | | – | | | | | – | | | | | – | | | | | – | | | | | – | |
| Ratio of net expenses to average net | | | | | | | | | | | | | | | | | | | | | | | | |
| assets | | | 1.25 | % | | | | 1.24 | % | | | | 1.25 | % | | | | 1.23 | % | | | | 1.18 | % |
| Ratio of net investment income (loss) to | | | | | | | | | | | | | | | | | | | | | | | | |
| average net assets | | | (0.80 | )% | | | | (0.70 | )% | | | | (0.38 | )% | | | | (0.54 | )% | | | | (0.94 | )% |
| Portfolio turnover rate | | | 125.72 | % | | | | 84.10 | % | | | | 77.38 | % | | | | 72.43 | % | | | | 70.57 | % |
| SeeNotestoFinancialStatements. | | | | | | | | | | | | | | | | | | | | | | |
(i) Amount was computed based on average shares outstanding during the period.
- 57 -
THE ALGER INSTITUTIONAL FUNDS
Financial Highlights for a share outstanding throughout the period
| | | | | | | | | | | | | | | | | | | | | | | | |
| Alger Small Cap Growth | | | | | | | | | | | | | | | | | | | | | | | | |
| Institutional Fund | | | | | | | | | | | | | Class R | | | | | | | | | | | |
| | | Year ended | | | Year ended | | | Year ended | | | Year ended | | | Year ended | |
| | | 10/31/2015 | | | 10/31/2014 | | | 10/31/2013 | | | 10/31/2012 | | | 10/31/2011 | |
| Net asset value, beginning of period | | $ | 26.08 | | | $ | | 31.58 | | | $ | | 26.85 | | | $ | | 25.91 | | | $ | | 24.39 | |
| INCOME FROM INVESTMENT | | | | | | | | | | | | | | | | | | | | | | | | |
| OPERATIONS: | | | | | | | | | | | | | | | | | | | | | | | | |
| Net investment loss(i) | | | (0.29 | ) | | | | (0.32 | ) | | | | (0.23 | ) | | | | (0.28 | ) | | | | (0.40 | ) |
| Net realized and unrealized gain on | | | | | | | | | | | | | | | | | | | | | | | | |
| investments | | | 0.39 | | | | | 0.56 | | | | | 8.19 | | | | | 2.35 | | | | | 1.92 | |
| Total from investment operations | | | 0.10 | | | | | 0.24 | | | | | 7.96 | | | | | 2.07 | | | | | 1.52 | |
| Distributions from net realized gains | | | (5.26 | ) | | | | (5.74 | ) | | | | (3.23 | ) | | | | (1.13 | ) | | | | – | |
| Net asset value, end of period | | $ | 20.92 | | | $ | | 26.08 | | | $ | | 31.58 | | | $ | | 26.85 | | | $ | | 25.91 | |
| Total return | | | 0.02 | % | | | | 0.74 | % | | | | 33.05 | % | | | | 8.40 | % | | | | 6.20 | % |
| RATIOS/SUPPLEMENTAL DATA: | | | | | | | | | | | | | | | | | | | | | | | | |
| Net assets, end of period (000's | | | | | | | | | | | | | | | | | | | | | | | | |
| omitted) | $ | 18,577 | | $ | 31,062 | | $ | 41,022 | | $ | 47,507 | | $ | 62,211 | |
| Ratio of gross expenses to average | | | | | | | | | | | | | | | | | | | | | | | | |
| net assets | | | 1.74 | % | | | | 1.72 | % | | | | 1.73 | % | | | | 1.73 | % | | | | 1.71 | % |
| Ratio of expense reimbursements to | | | | | | | | | | | | | | | | | | | | | | | | |
| average net assets | | | – | | | | | – | | | | | – | | | | | – | | | | | – | |
| Ratio of net expenses to average net | | | | | | | | | | | | | | | | | | | | | | | | |
| assets | | | 1.74 | % | | | | 1.72 | % | | | | 1.73 | % | | | | 1.73 | % | | | | 1.71 | % |
| Ratio of net investment income (loss) to | | | | | | | | | | | | | | | | | | | | | | | | |
| average net assets | | | (1.30 | )% | | | | (1.18 | )% | | | | (0.83 | )% | | | | (1.05 | )% | | | | (1.47 | )% |
| Portfolio turnover rate | | | 125.72 | % | | | | 84.10 | % | | | | 77.38 | % | | | | 72.43 | % | | | | 70.57 | % |
| SeeNotestoFinancialStatements. | | | | | | | | | | | | | | | | | | | | | | |
(i) Amount was computed based on average shares outstanding during the period.
- 58 -
THE ALGER INSTITUTIONAL FUNDS
NOTES TO FINANCIAL STATEMENTS
NOTE 1 — General:
The Alger Institutional Funds (the “Trust”) is a diversified, open-end registered investment
company organized as a business trust under the laws of the Commonwealth of
Massachusetts. The Trust qualifies as an investment company as defined in the Financial
Accounting Standards Board Accounting Standards Codification 946-Financial Services
– Investment Companies. The Trust operates as a series company and currently offers
an unlimited number of shares of beneficial interest in four funds — Alger Capital
Appreciation Institutional Fund, Alger Capital Appreciation Focus Fund, Alger Mid Cap
Growth Institutional Fund and Alger Small Cap Growth Institutional Fund (collectively,
the “Funds” or individually, each a “Fund”). The Funds normally invest primarily in equity
securities and each has an investment objective of long-term capital appreciation.
Each Fund offers one or more of the following share classes: Class A, C, I, R and Z. Class
A shares are generally subject to an initial sales charge while Class C shares are generally
subject to a deferred sales charge. Class I, R and Z shares are sold to institutional investors
without an initial or deferred sales charge. Each class has identical rights to assets and
earnings except that each share class bears the cost of its transfer agency and sub-transfer
agency services, and each of Classes A, C and R bears the cost of its plan of distribution.
NOTE 2 — Significant Accounting Policies:
(a) Investment Valuation: The Funds value their financial instruments at fair value using
independent dealers or pricing services under policies approved by the Trust’s Board of
Trustees (“Board”). Investments are valued on each day the New York Stock Exchange (the
“NYSE”) is open, as of the close of the NYSE (normally 4:00 p.m. Eastern Standard Time).
Equity securities and option contracts for which valuation information is readily available are
valued at the last quoted sales price or official closing price as reported by an independent
pricing service on the primary market or exchange on which they are traded. In the absence
of quoted sales, such securities are valued at the bid price or, in the absence of a recent
bid price, the equivalent as obtained from one or more of the major market makers for the
securities to be valued.
Debt securities generally trade in the over-the-counter market. Debt securities with
remaining maturities of more than sixty days at the time of acquisition are valued on
the basis of last available bid prices or current market quotations provided by dealers
or pricing services. In determining the value of a particular investment, pricing services
may use certain information with respect to transactions in such investments, quotations
from dealers, pricing matrixes, market transactions in comparable investments, various
relationships observed in the market between investments and calculated yield measures
based on valuation technology commonly employed in the market for such investments.
Asset-backed and mortgage-backed securities are valued by independent pricing services
using models that consider estimated cash flows of each tranche of the security, establish a
benchmark yield and develop an estimated tranche-specific spread to the benchmark yield
based on the unique attributes of the tranche. Debt securities with a remaining maturity of
sixty days or less are valued at amortized cost which approximates market value.
- 59 -
THE ALGER INSTITUTIONAL FUNDS
NOTES TO FINANCIAL STATEMENTS (Continued)
Securities for which market quotations are not readily available are valued at fair value, as
determined in good faith pursuant to procedures established by the Board.
Securities in which the Funds invest may be traded in foreign markets that close before the
close of the NYSE. Developments that occur between the close of the foreign markets
and the close of the NYSE may result in adjustments to the foreign closing prices to reflect
what the investment adviser, pursuant to policies established by the Board, believes to be
the fair value of these securities as of the close of the NYSE. The Funds may also fair value
securities in other situations, for example, when a particular foreign market is closed but the
Funds are open.
Financial Accounting Standards Board Accounting Standards Codification 820 – Fair Value
Measurements and Disclosures (“ASC 820”) defines fair value as the price that the Funds
would receive upon selling an investment in a timely transaction to an independent buyer
in the principal or most advantageous market of the investment. ASC 820 established a
three-tier hierarchy to maximize the use of observable market data and minimize the use of
unobservable inputs and to establish classification of fair value measurements for disclosure
purposes. Inputs refer broadly to the assumptions that market participants would use in
pricing the asset or liability and may be observable or unobservable. Observable inputs
are based on market data obtained from sources independent of the Funds. Unobservable
inputs are inputs that reflect the Funds’ own assumptions based on the best information
available in the circumstances. The three-tier hierarchy of inputs is summarized in the three
broad Levels listed below.
• Level 1 – quoted prices in active markets for identical investments
• Level 2 – significant other observable inputs (including quoted prices for similar
investments, interest rates, prepayment speeds, credit risk, etc.)
• Level 3 – significant unobservable inputs (including the Funds’ own assumptions in
determining the fair value of investments)
The Funds’ valuation techniques are generally consistent with either the market or the
income approach to fair value. The market approach considers prices and other relevant
information generated by market transactions involving identical or comparable assets
to measure fair value. The income approach converts future amounts to a current, or
discounted, single amount. These fair value measurements are determined on the basis
of the value indicated by current market expectations about such future events. Inputs
for Level 1 include exchange-listed prices and broker quotes in an active market. Inputs
for Level 2 include the last trade price in the case of a halted security, an exchange-listed
price which has been adjusted for fair value factors, and prices of closely related securities.
Additional Level 2 inputs include an evaluated price which is based upon a compilation of
observable market information such as spreads for fixed income and preferred securities.
Inputs for Level 3 include revenue multiples, earnings before interest, taxes, depreciation
and amortization (“EBITDA”) multiples, discount rates, and the probabilities of success of
certain outcomes. Such unobservable market information may be obtained from a company’s
- 60 -
THE ALGER INSTITUTIONAL FUNDS
NOTES TO FINANCIAL STATEMENTS (Continued)
financial statements and from industry studies, market data, and market indicators such as
benchmarks and indices.
Valuation processes are determined by a Valuation Committee (“Committee”) established
by the Board and comprised of representatives of the Trust’s investment advisor. The
Committee reports its fair valuation determinations to the Board which is responsible for
approving valuation policy and procedures.
While the Committee meets on an as-needed basis, the Committee formally meets
quarterly to review and evaluate the effectiveness of the procedures for making fair value
determinations. The Committee considers, among other things, the results of quarterly
back testing of the fair value model for foreign securities, pricing comparisons between
primary and secondary price sources, the outcome of price challenges put to the Funds’
pricing vendor, and variances between transactional prices and previous mark-to-markets.
The Funds will record a change to a security’s fair value level if new inputs are available
or it becomes evident that inputs previously considered for leveling have changed or are
no longer relevant. Transfers between Levels 1, 2 and 3 are recognized at the end of the
reporting period.
(b) Cash and Cash Equivalents: Cash and cash equivalents include U.S. dollars and overnight
time deposits.
(c) Securities Transactions and Investment Income: Securities transactions are recorded on a
trade date basis. Realized gains and losses from securities transactions are recorded on the
identified cost basis. Dividend income is recognized on the ex-dividend date and interest
income is recognized on the accrual basis.
(d) Foreign Currency Translations: The books and records of the Funds are maintained in U.S.
dollars. Foreign currencies, investments and other assets and liabilities are translated into
U.S. dollars at the prevailing rates of exchange on the valuation date. Purchases and sales
of investment securities and income and expenses are translated into U.S. dollars at the
prevailing exchange rates on the respective dates of such transactions.
Net realized gains and losses on foreign currency transactions represent net gains and losses
from the disposition of foreign currencies, currency gains and losses realized between the
trade dates and settlement dates of security transactions, and the difference between the
amount of net investment income accrued and the U.S. dollar amount actually received.
The effects of changes in foreign currency exchange rates on investments in securities
are included in realized and unrealized gain or loss on investments in the accompanying
Statement of Operations.
(e) Option Contracts: When a Fund writes an option, an amount equal to the premium received
by the Fund is recorded as a liability and is subsequently adjusted to the current fair value
of the option written. Premiums received from writing options that expire unexercised are
treated by the Fund on the expiration date as realized gains from investments. The difference
between the premium and the amount paid on effecting a closing purchase transaction,
including brokerage commissions, is also treated as a realized gain, or, if the premium is less
- 61 -
THE ALGER INSTITUTIONAL FUNDS
NOTES TO FINANCIAL STATEMENTS (Continued)
than the amount paid for the closing purchase transaction, as a realized loss. If a call option
is exercised, the premium is added to the proceeds from the sale of the underlying security
in determining whether the Fund has realized a gain or loss. If a put option is exercised, the
premium reduces the cost basis of the securities purchased by the Fund. The Fund as writer
of an option bears the market risk of an unfavorable change in the price of the security
underlying the written option.
The Funds may also purchase put and call options. Each Fund pays a premium which is
included in the Fund’s accompanying Statement of Assets and Liabilities as an investment
and subsequently marked to market to reflect the current value of the option. Premiums
paid for purchasing options which expire are treated as realized losses. The risk associated
with purchasing put and call options is limited to the premium paid. Premiums paid for
purchasing options which are exercised or closed are added to the amounts paid or offset
against the proceeds on the underlying security to determine the realized gain or loss.
(f) Lending of Fund Securities: The Funds may lend their securities to financial institutions,
provided that the market value of the securities loaned will not at any time exceed one
third of a Fund’s total assets, as defined in its prospectuses. The Funds earn fees on the
securities loaned, which are included in interest income in the accompanying Statements
of Operations. In order to protect against the risk of failure by the borrower to return the
securities loaned or any delay in the delivery of such securities, the loan is collateralized by
cash or securities that are maintained with the Custodian in an amount equal to at least 102
percent of the current market value of U.S. loaned securities or 105 percent for non-U.S.
loaned securities. The market value of the loaned securities is determined at the close of
business of the Fund. Any required additional collateral is delivered to the Custodian and
any excess collateral is returned to the borrower on the next business day. In the event the
borrower fails to return the loaned securities when due, the Funds may take the collateral
to replace the securities. If the value of the collateral is less than the purchase cost of
replacement securities, the Custodian shall be responsible for any shortfall, but only to
the extent that the shortfall is not due to any diminution in collateral value, as defined in
the securities lending agreement. The Funds are required to maintain the collateral in a
segregated account and determine its value each day until the loaned securities are returned.
Cash collateral may be invested as determined by the Funds. Collateral is returned to the
borrower upon settlement of the loan. There were no securities loaned as of October 31,
2015.
(g) Dividends to Shareholders: Dividends and distributions payable to shareholders are
recorded by the Funds on the ex-dividend date. Dividends from net investment income and
distributions from net realized gains are declared and paid annually after the end of the fiscal
year in which earned.
Each class is treated separately in determining the amounts of dividends from net investment
income payable to holders of its shares.
The characterization of distributions to shareholders for financial reporting purposes is
determined in accordance with federal income tax rules. Therefore, the source of a Fund’s
distributions may be shown in the accompanying financial statements as either from, or in
- 62 -
THE ALGER INSTITUTIONAL FUNDS
NOTES TO FINANCIAL STATEMENTS (Continued)
excess of, net investment income, net realized gain on investment transactions or return of
capital, depending on the type of book/tax differences that may exist. Capital accounts within
the financial statements are adjusted for permanent book/tax differences. Reclassifications
result primarily from the difference in tax treatment of net operating losses, passive foreign
investment companies, and foreign currency transactions. The reclassifications are done
annually at fiscal year end and have no impact on the net asset values of the Funds and are
designed to present each Fund’s capital accounts on a tax basis.
(h) Federal Income Taxes: It is each Fund’s policy to comply with the requirements of the
Internal Revenue Code Subchapter M applicable to regulated investment companies and
to distribute all of its taxable income to its shareholders. Provided that the Funds maintain
such compliance, no federal income tax provision is required. Each Fund is treated as a
separate entity for the purpose of determining such compliance.
Financial Accounting Standards Board Accounting Standards Codification 740 – Income
Taxes (“ASC 740”) requires the Funds to measure and recognize in their financial statements
the benefit of a tax position taken (or expected to be taken) on an income tax return
if such position will more likely than not be sustained upon examination based on the
technical merits of the position. No tax years are currently under investigation. The Funds
file income tax returns in the U.S., as well as New York State and New York City. The
statute of limitations on the Funds’ tax returns remains open for the tax years 2012-2015.
Management does not believe there are any uncertain tax positions that require recognition
of a tax liability.
(i) Allocation Methods: The Trust accounts separately for the assets, liabilities and operations
of each Fund. Expenses directly attributable to each Fund are charged to that Fund’s
operations; expenses which are applicable to all Funds are allocated among them based on
net assets. Income, realized and unrealized gains and losses, and expenses of each Fund
are allocated among the Fund’s classes based on relative net assets, with the exception of
distribution fees, transfer agency fees, and shareholder servicing and related fees.
(j) Estimates: These financial statements have been prepared in accordance with accounting
principles generally accepted in the United States of America, which require using estimates
and assumptions that affect the reported amounts therein. Actual results may differ from
those estimates. All such adjustments are of normal recurring nature.
NOTE 3 — Investment Advisory Fees and Other Transactions with Affiliates:
(a) Investment Advisory Fees: Fees incurred by each Fund, pursuant to the provisions of
the Trust’s Investment Advisory Agreement with Fred Alger Management, Inc. (“Alger
Management” or the “Manager”), are payable monthly and computed based on the following
rates. The actual rate paid as a percentage of average daily net assets, for the year ended
October 31, 2015, is set forth below under the heading “Actual Rate.”
| | | | | | | | | | | | | |
| | | Tier 1 | | | Tier 2 | | | | Tier 3 | | | Actual Rate | |
| Alger Capital Appreciation Institutional Fund(a) | 0.810 | % | | 0.650 | % | | | 0.600 | % | | 0.736 | % |
| Alger Capital Appreciation Focus Fund(b) | | 0.710 | | | 0.600 | | | | — | | | 0.710 | |
| Alger Mid Cap Growth Institutional Fund(b) | | 0.760 | | | 0.700 | | | | — | | | 0.760 | |
- 63 -
THE ALGER INSTITUTIONAL FUNDS
NOTES TO FINANCIAL STATEMENTS (Continued)
| | | | | | | |
| | | Tier 1 | | Tier 2 | Tier 3 | | Actual Rate |
| Alger Small Cap Growth Institutional Fund(b) | | 0.810 | | 0.750 | — | | 0.810 |
(a) Tier 1 rate is paid on assets up to $2 billion, Tier 2 rate is paid on assets between $2 to $4 billion, and Tier 3
rate is paid on assets in excess of $4 billion.
(b) Tier 1 rate is paid on assets up to $1 billion and Tier 2 rate is paid on assets in excess of $1 billion.
Alger Management has established expense caps for the Alger Capital Appreciation Focus
Fund Class A, Class C, Class I and Class Z shares, effective through February 28, 2016,
whereby it reimburses the share classes if annualized operating expenses (excluding interest,
taxes, brokerage, dividend expenses and extraordinary expenses) exceed the rates, based on
average daily net assets, listed below:
| | | | | | | | | | |
| | | | | | | | | | | FEES WAIVED / |
| | | | | | | | | | | REIMBURSED FOR |
| | | | CLASS | | | | | THE YEAR ENDED |
| | A | | C | | I | | Z | | | OCTOBER 31, 2015 |
| Alger Capital Appreciation Focus Fund | 1.30 | % | 2.05 | % | 1.15 | % | 0.89 | % | $ | 126,505 |
Fred Alger Management, Inc. may recoup reimbursed expenses during the one-year term of
the expense reimbursement contract if the expense ratio falls below the stated limitation.
(b) Administration Fees: Fees incurred by each Fund, pursuant to the provisions of the Trust’s
Administration Agreement with Fred Alger Management, Inc., are payable monthly and
computed based on the average daily net assets of each Fund at the annual rate of 0.0275%.
(c) Distribution Fees:
Class A Shares: The Trust has adopted a Distribution Plan pursuant to which Class A shares
of Alger Capital Appreciation Focus Fund pay Fred Alger & Company, Incorporated, the
Fund’s distributor (the “Distributor” or “Alger Inc.”) and an affiliate of Alger Management,
a fee at the annual rate of 0.25% of the respective average daily net assets of the Class A
shares of the Fund to compensate Alger Inc. for its activities and expenses incurred in
distributing and servicing the Class A shares. The fees paid may be more or less than the
expenses incurred by Alger Inc.
Class C Shares: The Trust has adopted a Distribution Plan pursuant to which Class C shares
of Alger Capital Appreciation Focus Fund pay Alger Inc. a fee at the annual rate of 1% of
the average daily net assets of the Class C shares of the Fund to compensate Alger Inc. for
its activities and expenses incurred in distributing and servicing the Class C shares. The fees
paid may be more or less than the expenses incurred by Alger Inc.
Class R Shares: The Trust has adopted a Distribution Plan pursuant to which Class R
shares of each Fund issuing such shares pay Alger Inc. a fee at the annual rate of 0.50%
of the respective average daily net assets of the Class R shares of the designated Fund to
compensate Alger Inc. for its activities and expenses incurred in distributing and servicing
the Class R shares. The fees paid may be more or less than the expenses incurred by the
Distributor.
- 64 -
THE ALGER INSTITUTIONAL FUNDS
NOTES TO FINANCIAL STATEMENTS (Continued)
(d) Sales Charges: Purchases and sales of shares of the Alger Capital Appreciation Focus
Fund may be subject to initial sales charges or contingent deferred sales charges. The
contingent deferred sales charges are used by Alger Inc. to offset distribution expenses
previously incurred. Sales charges do not represent expenses of the Trust. For the year
ended October 31, 2015, the initial sales charges and contingent deferred sales charges
imposed, all of which were retained by Alger Inc., were as follows:
| | | | | |
| | | | | CONTINGENT | |
| | INITIAL SALES | DEFERRED SALES | |
| | | CHARGES | | CHARGES | |
| Alger Capital Appreciation Focus Fund | $ | – | $ | 884 | |
(e) Brokerage Commissions: During the year ended October 31, 2015, the Alger Capital
Appreciation Institutional Fund, Alger Capital Appreciation Focus Fund, Alger Mid Cap
Growth Institutional Fund and Alger Small Cap Growth Institutional Fund paid Alger Inc.
commissions of $1,479,695, $24,921, $57,182 and $242,815, respectively, in connection with
securities transactions.
(f) Shareholder Administrative Fees: The Trust has entered into a shareholder administrative
services agreement with Alger Management to compensate Alger Management for its liaison
and administrative oversight of Boston Financial Data Services, Inc., the transfer agent, and
other related services. The Funds compensate Alger Management at the annual rate of
0.0165% of their respective average daily net assets for the Class A and Class C shares and
0.01% of the daily net assets of the Class I, Class R and Class Z shares for these services.
Alger Management makes payments to intermediaries that provide sub-accounting services
to omnibus accounts invested in the Funds. A portion of the fees paid by Alger Management
to intermediaries that provide sub-accounting services are charged back to the appropriate
Fund, subject to certain limitations, as approved by the Trust’s Board of Trustees. For
the year ended October 31, 2015, Alger Management charged back to the Alger Capital
Appreciation Institutional Fund, Alger Capital Appreciation Focus Fund, Alger Mid Cap
Growth Institutional Fund, and Alger Small Cap Growth Institutional Fund, $1,245,667,
$16,394, $78,298 and $313,760, respectively, for these services, which are included in the
transfer agent fees and expenses in the accompanying Statements of Operations.
(g) Trustee Fees: From November 1, 2014, through February 28, 2015, each Fund paid each
trustee who is not affiliated with Alger Management or its affiliates $950 for each meeting
attended, to a maximum of $3,800 per annum, plus travel expenses incurred for attending
the meeting. The Chairman of the Board received an additional annual fee of $24,300 which
was paid, pro rata, by all U.S.-registered funds managed by Alger Management. Additionally,
each member of a Fund’s audit committee received $81 from each Fund for each audit
committee meeting attended, to a maximum of $324 per annum.
Effective March 1, 2015, each Independent Trustee who is not affiliated with Alger
Management or its affiliates receives a fee of $25,875 for each meeting attended, to a
maximum of $103,500 per annum, paid pro rata by each Fund in the Alger Fund Complex,
plus travel expenses incurred for attending the meeting. The Independent Trustee appointed
as Chairman of the Board of Trustees receives additional compensation of $24,300 per
- 65 -
THE ALGER INSTITUTIONAL FUNDS
NOTES TO FINANCIAL STATEMENTS (Continued)
annum paid pro rata by each fund in the Alger Fund Complex. Additionally, each member
of the Audit Committee receives a fee of $2,500 for each meeting attended to a maximum
of $10,000 per annum, paid pro rata by each Fund in the Alger Fund Complex.
(h) Interfund Trades: During the fiscal year ended October 31, 2015, the Funds engaged in
purchase and sale transactions with funds that have a common investment advisor. For the
year ended October 31, 2015, these purchases and sales were as follows:
| | | | |
| | | Purchases | | Sales |
| Alger Capital Appreciation Institutional Fund | | – | | 600,039 |
| Alger Mid Cap Growth Institutional Fund | | 222,300 | | – |
| Alger Small Cap Growth Institutional Fund | | 616,435 | | 764,324 |
(i) Interfund Loans: The Funds, along with other funds advised by Alger Management, may
borrow money from and lend money to each other for temporary or emergency purposes.
To the extent permitted under its investment restrictions, each fund may lend uninvested
cash in an amount up to 15% of its net assets to other funds. If a fund has borrowed from
other funds and has aggregate borrowings from all sources that exceed 10% of the fund’s
total assets, such fund will secure all of its loans from other funds. The interest rate charged
on interfund loans is equal to the average of the overnight time deposit rate and bank loan
rate available to the funds. There were no interfund loans outstanding as of October 31,
2015.
During the year ended October 31, 2015, Alger Mid Cap Growth Institutional Fund and
Alger Small Cap Growth Institutional Fund incurred interest expense of $236 and $14,385,
respectively in connection with interfund loans.
(j) Other Transactions With Affiliates: Certain officers of the Trust are directors and officers
of Alger Management and the Distributor. At October 31, 2015, Alger Management and its
affiliates owned the following shares:
| | | | | | | | | |
| | | | | | SHARE CLASS | | | |
| | | A | | C | | I | R | | Z |
| Alger Capital Appreciation Focus Fund | | 35,327 | | 6,803 | | — | — | | 6,803 |
(k) Shareholder Servicing Fees: The Trust has entered into a shareholder servicing agreement
with Alger Inc. whereby Alger Inc. provides Class I shares and Class R shares of the Trust
with ongoing servicing of shareholder accounts. As compensation for such services, the
Class I shares and Class R shares of each Fund pay Alger Inc. a monthly fee at an annual
rate of 0.25% of the value of the average daily net assets of those classes. The fees paid
may be more or less than the expenses incurred by the Distributor.
NOTE 4 — Securities Transactions:
The following summarizes the securities transactions by the Funds, other than U.S.
Government securities, short-term securities, purchased options and short sales, for the
year ended October 31, 2015:
| | | | | | |
| | | | PURCHASES | | | SALES |
| Alger Capital Appreciation Institutional Fund | | $ | 5,520,775,746 | | $ | 4,854,470,700 |
- 66 -
THE ALGER INSTITUTIONAL FUNDS
NOTES TO FINANCIAL STATEMENTS (Continued)
| | | | |
| | | PURCHASES | | SALES |
| Alger Capital Appreciation Focus Fund | | 113,016,881 | | 80,080,935 |
| Alger Mid Cap Growth Institutional Fund | | 175,936,799 | | 203,667,122 |
| Alger Small Cap Growth Institutional Fund | | 672,641,930 | | 1,000,737,441 |
Transactions in foreign securities may involve certain considerations and risks not typically
associated with those of U.S. companies because of, among other factors, the level of
governmental supervision and regulation of foreign security markets, and the possibility of
political or economic instability. Additional risks associated with investing in the emerging
markets include increased volatility, limited liquidity, and less stringent regulatory and legal
system.
Written call and put options activity for the year ended October 31, 2015, was as follows:
| | | | | | | |
| | | NUMBER OF | | | | PREMIUMS | |
| | | CONTRACTS | | | | RECEIVED | |
| Alger Mid Cap Growth Institutional Fund | | | | | | | |
| Call Options outstanding at | | | | | | | |
| October 31, 2014 | | 1,334 | | | $ | 242,484 | |
| Call Options written | | 1,075 | | | | 274,381 | |
| Call Options closed | | (966 | ) | | | (180,638 | ) |
| Call Options expired | | (1,079 | ) | | | (200,436 | ) |
| Call Options exercised | | (364 | ) | | | (135,791 | ) |
| Call Options outstanding at | | | | | | | |
| October 31, 2015 | | — | | | $ | — | |
| | | | | | | |
| | | NUMBER OF | | | | PREMIUMS | |
| | | CONTRACTS | | | | RECEIVED | |
| Alger Mid Cap Growth Institutional Fund | | | | | | | |
| Put Options outstanding at | | | | | | | |
| October 31, 2014 | | 620 | | | $ | 210,252 | |
| Put Options written | | 1,526 | | | | 289,886 | |
| Put Options closed | | (1,156 | ) | | | (332,798 | ) |
| Put Options expired | | (808 | ) | | | (107,051 | ) |
| Put Options exercised | | (182 | ) | | | (60,289 | ) |
| Put Options outstanding at | | | | | | | |
| October 31, 2015 | | — | | | $ | — | |
The Alger Mid Cap Growth Institutional Fund did not enter into written option contracts
after January 31, 2015.
NOTE 5 — Borrowing:
The Funds may borrow from their custodian on an uncommitted basis. Each Fund pays the
custodian a market rate of interest, generally based upon the London Interbank Offered
Rate. The Funds may also borrow from other funds advised by Alger Management, as
discussed in Note 3(i). For the year ended October 31, 2015, the Funds had the following
borrowings:
- 67 -
THE ALGER INSTITUTIONAL FUNDS
NOTES TO FINANCIAL STATEMENTS (Continued)
| | | | | |
| | AVERAGE DAILY | WEIGHTED AVERAGE | |
| | | BORROWING | INTEREST RATE | |
| Alger Capital Appreciation Focus Fund | $ | 675 | | 2.20 | % |
| Alger Mid Cap Growth Institutional Fund | | 24,344 | | 1.25 | |
| Alger Small Cap Growth Institutional Fund | | 1,347,796 | | 1.14 | |
| |
| The highest amount borrowed during the year ended October 31, 2015 for each Fund was | |
| as follows: | | | | | |
| |
| | | | HIGHEST BORROWING | |
| Alger Capital Appreciation Focus Fund | | | $ | 246,413 | |
| Alger Mid Cap Growth Institutional Fund | | | | 1,366,000 | |
| Alger Small Cap Growth Institutional Fund | | | | 21,523,000 | |
NOTE 6 — Share Capital:
(a) The Trust has an unlimited number of authorized shares of beneficial interest of $.001
par value which are presently divided into four series. Each series is divided into two sep-
arate classes, except that the shares of Alger Capital Appreciation Focus Fund are divided
into five separate classes. The transactions of shares of beneficial interest were as follows:
| | | | | | | | | | | | | | | |
| | | FOR THE YEAR ENDED | | | | FOR THE YEAR ENDED | |
| | | OCTOBER 31, 2015 | | | | OCTOBER 31, 2014 | |
| | | SHARES | | | | AMOUNT | | | | SHARES | | | | AMOUNT | |
| Alger Capital Appreciation Institutional Fund | | | | | | | | | | | | | |
| Class I: | | | | | | | | | | | | | | | |
| Shares sold | | 50,542,053 | | $ | 1,431,830,828 | | | | 30,411,968 | | | $ | 844,102,786 | |
| Dividends reinvested | | 11,586,846 | | | | 312,381,372 | | | | 8,865,721 | | | | 231,040,701 | |
| Shares redeemed | | (37,104,435 | ) | | | (1,050,293,736) | | | | (21,579,341 | ) | | (593,575,630 | ) |
| Net increase | | 25,024,464 | | | $ | 693,918,464 | | | | 17,698,348 | | | $ | 481,567,857 | |
| Class R: | | | | | | | | | | | | | | | |
| Shares sold | | 9,057,734 | | | $ | 233,025,489 | | | | 4,691,349 | | | $ | 121,232,838 | |
| Dividends reinvested | | 2,422,309 | | | | 60,291,275 | | | | 2,185,790 | | | | 53,333,271 | |
| Shares redeemed | | (5,783,826 | ) | | (148,667,065 | ) | | | (4,123,182 | ) | | (106,498,438 | ) |
| Net increase | | 5,696,217 | | | $ | 144,649,699 | | | | 2,753,957 | | | $ | 68,067,671 | |
- 68 -
THE ALGER INSTITUTIONAL FUNDS
NOTES TO FINANCIAL STATEMENTS (Continued)
| | | | | | | | | | | | | | | |
| | | FOR THE YEAR ENDED | | | | FOR THE YEAR ENDED | |
| | | OCTOBER 31, 2015 | | | | OCTOBER 31, 2014 | |
| | | SHARES | | | | AMOUNT | | | | SHARES | | | | AMOUNT | |
| Alger Capital Appreciation Focus Fund | | | | | | | | | | | | | | |
| Class A: | | | | | | | | | | | | | | | |
| Shares sold | | 1,183,661 | | | $ | 26,976,396 | | | | 129,078 | | | $ | 2,642,832 | |
| Shares redeemed | | (425,035 | ) | | | (10,098,497 | ) | | | (81,754 | ) | | | (1,727,529 | ) |
| Net increase | | 758,626 | | | $ | 16,877,899 | | | | 47,324 | | | $ | 915,303 | |
| Class C: | | | | | | | | | | | | | | | |
| Shares sold | | 178,046 | | | $ | 4,152,257 | | | | 33,451 | | | $ | 669,390 | |
| Shares redeemed | | (22,530 | ) | | | (519,786 | ) | | | (15,025 | ) | | | (283,516 | ) |
| Net increase | | 155,516 | | | $ | 3,632,471 | | | | 18,426 | | | $ | 385,874 | |
| Class I: | | | | | | | | | | | | | | | |
| Shares sold | | 827,893 | | | $ | 19,755,163 | | | | 285,493 | | | $ | 5,688,164 | |
| Shares redeemed | | (401,861 | ) | | | (9,321,977 | ) | | | (165,006 | ) | | | (3,396,574 | ) |
| Net increase | | 426,032 | | | $ | 10,433,186 | | | | 120,487 | | | $ | 2,291,590 | |
| Class R: | | | | | | | | | | | | | | | |
| Shares redeemed | | — | | | | — | | | | (154,099 | ) | | | (2,761,004 | ) |
| Net decrease | | — | | | $ | — | | | | (154,099 | ) | | $ | (2,761,004 | ) |
| Class Z: | | | | | | | | | | | | | | | |
| Shares sold | | 119,545 | | | $ | 2,843,126 | | | | 52,938 | | | $ | 1,141,459 | |
| Shares redeemed | | (25,582 | ) | | | (601,951 | ) | | | (2,824 | ) | | | (62,504 | ) |
| Net increase | | 93,963 | | | $ | 2,241,175 | | | | 50,114 | | | $ | 1,078,955 | |
| |
| Alger Mid Cap Growth Institutional Fund | | | | | | | | | | | | | | |
| Class I: | | | | | | | | | | | | | | | |
| Shares sold | | 902,649 | | | $ | 21,241,975 | | | | 795,975 | | | $ | 16,728,049 | |
| Shares redeemed | | (1,770,784 | ) | | | (41,417,306 | ) | | | (2,927,005 | ) | | | (61,349,028 | ) |
| Net decrease | | (868,135 | ) | | $ | (20,175,331 | ) | | | (2,131,030 | ) | | $ | (44,620,979 | ) |
| Class R: | | | | | | | | | | | | | | | |
| Shares sold | | 203,467 | | | $ | 4,468,737 | | | | 284,243 | | | $ | 5,613,397 | |
| Shares redeemed | | (412,966 | ) | | | (8,989,356 | ) | | | (518,496 | ) | | | (10,133,738 | ) |
| Net decrease | | (209,499 | ) | | $ | (4,520,619 | ) | | | (234,253 | ) | | $ | (4,520,341 | ) |
| |
| Alger Small Cap Growth Institutional Fund | | | | | | | | | | | | | |
| Class I: | | | | | | | | | | | | | | | |
| Shares sold | | 2,831,473 | | | $ | 69,667,841 | | | | 5,445,065 | | | $ | 157,182,309 | |
| Dividends reinvested | | 4,775,991 | | | | 111,758,197 | | | | 5,276,199 | | | | 148,050,151 | |
| Shares redeemed | | (15,587,700 | ) | | (384,394,678 | ) | | | (15,248,951 | ) | | (435,139,194 | ) |
| Net decrease | | (7,980,236 | ) | $ | (202,968,640 | ) | | | (4,527,687 | ) | $ | (129,906,734 | ) |
| Class R: | | | | | | | | | | | | | | | |
| Shares sold | | 227,162 | | | $ | 5,071,784 | | | | 239,833 | | | $ | 6,379,542 | |
| Dividends reinvested | | 259,849 | | | | 5,532,180 | | | | 249,059 | | | | 6,502,925 | |
| Shares redeemed | | (790,204 | ) | | | (17,568,320 | ) | | | (597,008 | ) | | | (15,947,877 | ) |
| Net decrease | | (303,193 | ) | | $ | (6,964,356 | ) | | | (108,116 | ) | | $ | (3,065,410 | ) |
(b) Redemption Fee: Prior to March 1, 2015, the Alger Capital Appreciation Focus Fund
imposed a 2.00% redemption fee on certain Class A and Class C Fund shares redeemed
(including shares redeemed by exchange) within 30 days after such shares were acquired.
- 69 -
THE ALGER INSTITUTIONAL FUNDS
NOTES TO FINANCIAL STATEMENTS (Continued)
From March 1, 2015, the redemption fee was no longer imposed. The fees retained by
the Fund are included as paid-in capital on the accompanying Statement of Assets and
Liabilities.
During the year ended October 31, 2015, shares redeemed for the Class I shares of Alger
Capital Appreciation Institutional Fund include redemption-in-kind transactions of
10,621,246 valued at $307,755,100. The Fund had realized gains on these transactions of
$47,725,674.
During the year ended October 31, 2014, shares redeemed for the Class I shares of Alger
Capital Appreciation Institutional Fund include redemption-in-kind transactions of
2,746,498 valued at $71,436,408. The Fund had realized gains on these transactions of
$9,337,851.
NOTE 7 — Income Tax Information:
The tax character of distributions paid during the year ended October 31, 2015 and the
year ended October 31, 2014 were as follows:
| | | | | | |
| | FOR THE YEAR ENDED | | FOR THE YEAR ENDED | |
| | OCTOBER 31, 2015 | | OCTOBER 31, 2014 | |
| Alger Capital Appreciation Institutional Fund | | | | | | |
| Distributions paid from: | | | | | | |
| Ordinary Income | $ | 63,722,024 | | $ | 138,389,213 | |
| Long-term capital gain | | 322,258,127 | | | 157,959,204 | |
| Total distributions paid | $ | 385,980,151 | | $ | 296,348,417 | |
| |
| Alger Capital Appreciation Focus Fund | | | | | | |
| Distributions paid from: | | | | | | |
| Ordinary Income | | — | | | — | |
| Long-term capital gain | | — | | | — | |
| Total distributions paid | | — | | | — | |
| |
| Alger Mid Cap Growth Institutional Fund | | | | | | |
| Distributions paid from: | | | | | | |
| Ordinary Income | | — | | | — | |
| Long-term capital gain | | — | | | — | |
| Total distributions paid | | — | | | — | |
| |
| Alger Small Cap Growth Institutional Fund | | | | | | |
| Distributions paid from: | | | | | | |
| Ordinary Income | $ | — | | $ | 22,885,012 | |
| Long-term capital gain | | 121,205,222 | | | 140,284,046 | |
| Total distributions paid | $ | 121,205,222 | | $ | 163,169,058 | |
As of October 31, 2015 the components of accumulated gains (losses) on a tax basis were
as follows:
- 70 -
THE ALGER INSTITUTIONAL FUNDS
NOTES TO FINANCIAL STATEMENTS (Continued)
| | | |
| Alger Capital Appreciation Institutional Fund | | | |
| Undistributed ordinary income | | — | |
| Undistributed long-term gains | $ | 280,033,333 | |
| Net accumulated earnings | | 280,033,333 | |
| Capital loss carryforwards | | — | |
| Late year ordinary income losses | | (11,365,687 | ) |
| Net unrealized appreciation | | 411,339,067 | |
| Total accumulated earnings | $ | 680,006,713 | |
| |
| Alger Capital Appreciation Focus Fund | | | |
| Undistributed ordinary income | $ | — | |
| Undistributed long-term gains | | 798,945 | |
| Net accumulated earnings | | 798,945 | |
| Capital loss carryforwards | | — | |
| Late year ordinary income losses | | (215,177 | ) |
| Net unrealized appreciation | | 2,242,617 | |
| Total accumulated earnings | $ | 2,826,385 | |
| |
| Alger Mid Cap Growth Institutional Fund | | | |
| Undistributed ordinary income | | — | |
| Undistributed long-term gains | | — | |
| Net accumulated earnings | | — | |
| Capital loss carryforwards | $ | (280,123,926 | ) |
| Late year ordinary income losses | | (1,080,394 | ) |
| Net unrealized appreciation | | 5,746,617 | |
| Total accumulated losses | $ | (275,457,703 | ) |
| |
| Alger Small Cap Growth Institutional Fund | | | |
| Undistributed ordinary income | | — | |
| Undistributed long-term gains | $ | 118,488,177 | |
| Net accumulated earnings | | 118,488,177 | |
| Capital loss carryforwards | | — | |
| Late year ordinary income losses | | (3,799,705 | ) |
| Net unrealized appreciation | | 23,959,098 | |
| Total accumulated earnings | $ | 138,647,570 | |
At October 31, 2015, the Funds, for federal income tax purposes, had capital loss
carryforwards as set forth in the table below. These amounts may be applied against future
net realized gains until the earlier of their utilization or expiration.
- 71 -
THE ALGER INSTITUTIONAL FUNDS
NOTES TO FINANCIAL STATEMENTS (Continued)
| | | | | | | | |
| | Alger Capital | Alger Capital | | Alger Mid | | Alger Small |
| | Appreciation | Appreciation Focus | | Cap Growth | | Cap Growth |
| Expiration Dates | Institutional Fund | | Fund | Institutional Fund | Institutional Fund |
| 2017 | | — | | — | $ | 280,123,926 | | — |
| Total | | — | | — | | 280,123,926 | | — |
Under the Regulated Investment Company Modernization Act of 2010, capital losses
incurred by the Funds after October 31, 2011 will not be subject to expiration. In addition,
losses incurred after October 31, 2011 must be utilized prior to the utilization of capital loss
carryforwards above.
During the year ended October 31, 2015 the Alger Capital Appreciation Focus Fund, and
Alger Mid Cap Growth Institutional Fund utilized $2,828,765, and $5,674,132 of their
capital loss carryforwards, respectively.
The difference between book-basis and tax-basis unrealized appreciation (depreciation) is
determined annually and is attributable primarily to the tax deferral of losses on wash sales,
U.S. Internal Revenue Code Section 988 currency transactions, nondeductible expenses
on dividends sold short, the tax treatment of partnerships investments, the realization of
unrealized appreciation of passive foreign investment companies, and return of capital from
real estate investment trust investments.
Permanent differences, primarily from net operating losses and real estate investment trusts
and partnership investments sold by the Funds, resulted in the following reclassifications
among the Fund’s components of net assets at October 31, 2015.
The Fund accrues tax on unrealized gains in foreign jurisdictions that impose a foreign
capital tax.
| | | |
| Alger Capital Appreciation Institutional Fund | | | |
| Accumulated undistributed net investment income (accumulated loss) | $ | (4,019,133 | ) |
| Accumulated net realized gain (accumulated realized loss) | $ | (41,420,456 | ) |
| Paid-in Capital | $ | 45,439,589 | |
| |
| Alger Capital Appreciation Focus Fund | | | |
| Accumulated undistributed net investment income (accumulated loss) | $ | (76,323 | ) |
| Accumulated net realized gain (accumulated realized loss) | $ | 165,697 | |
| Paid-in Capital | $ | (89,374 | ) |
| |
| Alger Mid Cap Growth Institutional Fund | | | |
| Accumulated undistributed net investment income (accumulated loss) | $ | 762,095 | |
| Accumulated net realized gain (accumulated realized loss) | $ | 57,654 | |
| Paid-in Capital | $ | (819,749 | ) |
- 72 -
THE ALGER INSTITUTIONAL FUNDS
NOTES TO FINANCIAL STATEMENTS (Continued)
| | | |
| Alger Small Cap Growth Institutional Fund | | | |
| Accumulated undistributed net investment income (accumulated loss) | $ | 6,974,726 | |
| Accumulated net realized gain (accumulated realized loss) | $ | 380,286 | |
| Paid-in Capital | $ | (7,355,012 | ) |
NOTE 8 — Fair Value Measurements
The following is a summary of the inputs used as of October 31, 2015 in valuing the Funds’
investments carried at fair value on a recurring basis. Based upon the nature, characteristics,
and risks associated with their investments, the Funds have determined that presenting them
by security type and sector is appropriate.
- 73 -
THE ALGER INSTITUTIONAL FUNDS
NOTES TO FINANCIAL STATEMENTS (Continued)
| | | | | | | | | | | | | | | | | |
| Alger Capital Appreciation | | | | | | | | | | | | | | | | | |
| Institutional Fund | | | | TOTAL FUND | | | | LEVEL 1 | | | | | LEVEL 2 | | | LEVEL 3 |
| COMMON STOCKS | | | | | | | | | | | | | | | | | |
| Consumer Discretionary | $ | 742,818,018 | $ | 742,765,662 | | | | | — | $ | | 52,356 |
| Consumer Staples | | | | 212,694,386 | | 212,694,386 | | | | | — | | | — |
| Energy | | | | 70,443,058 | | 70,443,058 | | | | | — | | | — |
| Financials | | | | 150,558,019 | | 150,558,019 | | | | | — | | | — |
| Health Care | | | | 658,805,917 | | 628,231,301 | | 30,574,616 | | | — |
| Industrials | | | | 340,444,821 | | 340,444,821 | | | | | — | | | — |
| Information Technology | | | | 1,279,718,885 | | | | 1,277,567,615 | | | | | — | | 2,151,270 |
| Materials | | | | 55,323,692 | | 55,323,692 | | | | | — | | | — |
| Telecommunication Services | | | | 42,390,605 | | 42,390,605 | | | | | — | | | — |
| Utilities | | | | 14,634,310 | | 14,634,310 | | | | | — | | | — |
| TOTAL COMMON STOCKS | $ | 3,567,831,711 | $ | 3,535,053,469 | | $ | | | 30,574,616 | $ | | 2,203,626 |
| MASTER LIMITED PARTNERSHIP | | | | | | | | | | | | | | | | | |
| Financials | | | | 48,210,142 | | 48,210,142 | | | | | — | | | — |
| PREFERRED STOCKS | | | | | | | | | | | | | | | | | |
| Consumer Discretionary | | | | | 1,501,699 | | | | — | | | | | — | | 1,501,699 |
| Health Care | | | | | 4,207,160 | | | | — | | | | | — | | 4,207,160 |
| Information Technology | | | | | 9,916,632 | | | | — | | | | | — | | 9,916,632 |
| TOTAL PREFERRED STOCKS | | $ | 15,625,491 | | | | — | | | | | — | $ | | 15,625,491 |
| REAL ESTATE INVESTMENT TRUST | | | | | | | | | | | | | |
| Financials | | | | 22,947,277 | | 22,947,277 | | | | | — | | | — |
| TOTAL INVESTMENTS IN | | | | | | | | | | | | | | | | | |
| SECURITIES | $ | 3,654,614,621 | $ | 3,606,210,888 | | $ | | | 30,574,616 | $ | | 17,829,117 |
| |
| |
| Alger Capital Appreciation Focus | | | | | | | | | | | | | | | | | |
| Fund | | | | TOTAL FUND | | | | LEVEL 1 | | | | | LEVEL 2 | | | LEVEL 3 |
| COMMON STOCKS | | | | | | | | | | | | | | | | | |
| Consumer Discretionary | $ | 10,707,136 | $ | 10,707,136 | | | | | — | | | — |
| Consumer Staples | | | | | 1,752,441 | | | 1,752,441 | | | | | — | | | — |
| Energy | | | | | 988,317 | | | 988,317 | | | | | — | | | — |
| Financials | | | | | 3,885,892 | | | 3,885,892 | | | | | — | | | — |
| Health Care | | | | 10,694,702 | | 10,694,702 | | | | | — | | | — |
| Industrials | | | | | 4,120,954 | | | 4,120,954 | | | | | — | | | — |
| Information Technology | | | | 19,943,984 | | 19,943,984 | | | | | — | | | — |
| Materials | | | | | 648,497 | | | 648,497 | | | | | — | | | — |
| TOTAL COMMON STOCKS | | $ | 52,741,923 | | $ | | 52,741,923 | | | | | — | | | — |
| MASTER LIMITED PARTNERSHIP | | | | | | | | | | | | | | | | | |
| Financials | | | | | 1,500,924 | | | 1,500,924 | | | | | — | | | — |
| PREFERRED STOCKS | | | | | | | | | | | | | | | | | |
| Health Care | | | | | 345,713 | | | | — | | | | | — | | 345,713 |
| REAL ESTATE INVESTMENT TRUST | | | | | | | | | | | | | | | |
| Financials | | | | | 2,532,046 | | | 2,532,046 | | | | | — | | | — |
| TOTAL INVESTMENTS IN | | | | | | | | | | | | | | | | | |
| SECURITIES | | $ | 57,120,606 | | $ | | 56,774,893 | | | | | — | $ | | 345,713 |
- 74 -
THE ALGER INSTITUTIONAL FUNDS
NOTES TO FINANCIAL STATEMENTS (Continued)
| | | | | | | | | | | | | | |
| Alger Mid Cap Growth Institutional | | | | | | | | | | | | | | |
| Fund | | | TOTAL FUND | | | | LEVEL 1 | | | LEVEL 2 | | | LEVEL 3 |
| COMMON STOCKS | | | | | | | | | | | | | | |
| Consumer Discretionary | $ 33,123,791 | $ | 33,120,040 | | | — | $ | 3,751 |
| Consumer Staples | | | | 3,906,746 | | | 3,906,746 | | | — | | | — |
| Energy | | | | 1,009,277 | | | 1,009,277 | | | — | | | — |
| Financials | | | | 8,034,645 | | | 8,034,645 | | | — | | | — |
| Health Care | | | 18,295,330 | | 18,295,330 | | | — | | | — |
| Industrials | | | 19,000,306 | | 19,000,306 | | | — | | | — |
| Information Technology | | | 30,046,994 | | 29,935,160 | | | — | | 111,834 |
| Materials | | | | 4,268,969 | | | 4,268,969 | | | — | | | — |
| Telecommunication Services | | | | 1,963,830 | | | 1,963,830 | | | — | | | — |
| Utilities | | | | 830,771 | | | 600,425 | | 230,346 | | | — |
| TOTAL COMMON STOCKS | $ | 120,480,659 | | $ | | 120,134,728 | $ | | 230,346 | $ | | 115,585 |
| PREFERRED STOCKS | | | | | | | | | | | | | | |
| Consumer Discretionary | | | | 93,156 | | | | — | | | — | | 93,156 |
| Health Care | | | | 2,103,280 | | | | — | | | — | | 2,103,280 |
| Information Technology | | | | 515,493 | | | | — | | | — | | 515,493 |
| TOTAL PREFERRED STOCKS | $ | 2,711,929 | | | | — | | | — | $ | | 2,711,929 |
| REAL ESTATE INVESTMENT TRUST | | | | | | | | | | | |
| Financials | | | | 2,877,558 | | | 2,877,558 | | | — | | | — |
| SPECIAL PURPOSE VEHICLE | | | | | | | | | | | | | | |
| Financials | | | | 240,362 | | | | — | | | — | | 240,362 |
| TOTAL INVESTMENTS IN | | | | | | | | | | | | | | |
| SECURITIES | $ | 126,310,508 | | $ | | 123,012,286 | $ | | 230,346 | $ | | 3,067,876 |
| |
| |
| Alger Small Cap Growth Institutional | | | | | | | | | | | | | | |
| Fund | | | TOTAL FUND | | | | LEVEL 1 | | | LEVEL 2 | | | LEVEL 3 |
| COMMON STOCKS | | | | | | | | | | | | | | |
| Consumer Discretionary | $ 48,950,128 | $ | 48,950,128 | | | — | | | — |
| Consumer Staples | | | | 9,002,901 | | | 9,002,901 | | | — | | | — |
| Energy | | | | 5,417,899 | | | 5,417,899 | | | — | | | — |
| Financials | | | 14,502,783 | | 14,502,783 | | | — | | | — |
| Health Care | | | 104,531,970 | | 104,531,970 | | | — | | | — |
| Industrials | | | 28,063,355 | | 28,063,355 | | | — | | | — |
| Information Technology | | | 138,057,071 | | 138,057,071 | | | — | | | — |
| Materials | | | 11,457,605 | | 11,457,605 | | | — | | | — |
| TOTAL COMMON STOCKS | $ | 359,983,712 | | $ | | 359,983,712 | | | — | | | — |
| PREFERRED STOCKS | | | | | | | | | | | | | | |
| Health Care | | | | 3,505,601 | | | | — | | | — | | 3,505,601 |
| REAL ESTATE INVESTMENT TRUST | | | | | | | | | | | | | |
| Financials | | | | 9,609,062 | | | 9,609,062 | | | — | | | — |
| RIGHTS | | | | | | | | | | | | | | |
| Health Care | | | | — | | | | — | | | —* | | | — |
| SPECIAL PURPOSE VEHICLE | | | | | | | | | | | | | | |
| Financials | | | | 775,134 | | | | — | | | — | | 775,134 |
| TOTAL INVESTMENTS IN | | | | | | | | | | | | | | |
| SECURITIES | $ | 373,873,509 | | $ | | 369,592,774 | | | — | $ | | 4,280,735 |
*Small Cap Growth Institutional Fund Rights are fair valued at zero as of October 31, 2015
- 75 -
THE ALGER INSTITUTIONAL FUNDS
NOTES TO FINANCIAL STATEMENTS (Continued)
| | | |
| | | FAIR VALUE |
| | MEASUREMENTS |
| | USING SIGNIFICANT |
| | UNOBSERVABLE |
| | INPUTS (LEVEL 3) |
| Alger Capital Appreciation Institutional Fund | Common Stocks |
| Opening balance at November 1, 2014 | $ | 1,517,186 |
| Transfers into Level 3 | | | — |
| Transfers out of Level 3 | | | — |
| Total gains or losses | | | |
| Included in net realized gain (loss) on investments | | – |
| Included in net unrealized gain (loss) on investments | | 686,440 |
| Purchases and sales | | | – |
| Purchases | | – |
| Sales | | – |
| Closing balance at October 31, 2015 | | | 2,203,626 |
| The amount of total gains or losses for the period included in net realized | | | |
| and unrealized gain (loss) attributable to change in unrealized appreciation | | | |
| (depreciation) relating to investments still held at 10/31/2015 | $ | 686,440 |
| |
| Alger Capital Appreciation Institutional Fund | Preferred Stocks |
| Opening balance at November 1, 2014 | $ | 13,596,053 |
| Transfers into Level 3 | | | — |
| Transfers out of Level 3 | | | — |
| Total gains or losses | | | |
| Included in net realized gain (loss) on investments | | – |
| Included in net unrealized gain (loss) on investments | | 2,029,438 |
| Purchases and sales | | | – |
| Purchases | | – |
| Sales | | – |
| Closing balance at October 31, 2015 | | | 15,625,491 |
| The amount of total gains or losses for the period included in net realized | | | |
| and unrealized gain (loss) attributable to change in unrealized appreciation | | | |
| (depreciation) relating to investments still held at 10/31/2015 | $ | 2,029,438 |
- 76 -
THE ALGER INSTITUTIONAL FUNDS
NOTES TO FINANCIAL STATEMENTS (Continued)
| | | |
| | | FAIR VALUE |
| | MEASUREMENTS |
| | USING SIGNIFICANT |
| | UNOBSERVABLE |
| | INPUTS (LEVEL 3) |
| Alger Capital Appreciation Focus Fund | Preferred Stocks |
| Opening balance at November 1, 2014 | $ | — |
| Transfers into Level 3 | | | — |
| Transfers out of Level 3 | | | — |
| Total gains or losses | | | |
| Included in net realized gain (loss) on investments | | – |
| Included in net unrealized gain (loss) on investments | | – |
| Purchases and sales | | | – |
| Purchases | | 345,713 |
| Sales | | – |
| Closing balance at October 31, 2015 | | | 345,713 |
| The amount of total gains or losses for the period included in net realized | | | |
| and unrealized gain (loss) attributable to change in unrealized appreciation | | | |
| (depreciation) relating to investments still held at 10/31/2015 | $ | – |
| |
| | | FAIR VALUE |
| | MEASUREMENTS |
| | USING SIGNIFICANT |
| | UNOBSERVABLE |
| | INPUTS (LEVEL 3) |
| Alger Mid Cap Growth Institutional Fund | Common Stocks |
| Opening balance at November 1, 2014 | $ | 80,267 |
| Transfers into Level 3 | | | — |
| Transfers out of Level 3 | | | — |
| Total gains or losses | | | |
| Included in net realized gain (loss) on investments | | – |
| Included in net unrealized gain (loss) on investments | | 35,318 |
| Purchases and sales | | | – |
| Purchases | | – |
| Sales | | – |
| Closing balance at October 31, 2015 | | | 115,585 |
| The amount of total gains or losses for the period included in net realized | | | |
| and unrealized gain (loss) attributable to change in unrealized appreciation | | | |
| (depreciation) relating to investments still held at 10/31/2015 | $ | 35,318 |
- 77 -
THE ALGER INSTITUTIONAL FUNDS
NOTES TO FINANCIAL STATEMENTS (Continued)
| | | | |
| | | FAIR VALUE | |
| | MEASUREMENTS | |
| | USING SIGNIFICANT | |
| | UNOBSERVABLE | |
| | INPUTS (LEVEL 3) | |
| Alger Mid Cap Growth Institutional Fund | Preferred Stocks | |
| Opening balance at November 1, 2014 | $ | 803,951 | |
| Transfers into Level 3 | | | 1,070,323 | * |
| Transfers out of Level 3 | | | — | |
| Total gains or losses | | | | |
| Included in net realized gain (loss) on investments | | – | |
| Included in net unrealized gain (loss) on investments | | 90,614 | |
| Purchases and sales | | | – | |
| Purchases | | 747,041 | |
| Sales | | – | |
| Closing balance at October 31, 2015 | | | 2,711,929 | |
| The amount of total gains or losses for the period included in net realized | | | | |
| and unrealized gain (loss) attributable to change in unrealized appreciation | | | | |
| (depreciation) relating to investments still held at 10/31/2015 | $ | 90,614 | |
| *Tolero Pharmaceuticals, Inc. was changed from an observable transaction price to a mark to model. | | | | |
| |
| | Special Purpose | |
| Alger Mid Cap Growth Institutional Fund | | | Vehicle | |
| Opening balance at November 1, 2014 | $ | — | |
| Transfers into Level 3 | | | — | |
| Transfers out of Level 3 | | | — | |
| Total gains or losses | | | | |
| Included in net realized gain (loss) on investments | | – | |
| Included in net unrealized gain (loss) on investments | | – | |
| Purchases and sales | | | – | |
| Purchases | | 240,362 | |
| Sales | | – | |
| Closing balance at October 31, 2015 | | | 240,362 | |
| The amount of total gains or losses for the period included in net realized | | | | |
| and unrealized gain (loss) attributable to change in unrealized appreciation | | | | |
| (depreciation) relating to investments still held at 10/31/2015 | $ | – | |
- 78 -
THE ALGER INSTITUTIONAL FUNDS
NOTES TO FINANCIAL STATEMENTS (Continued)
| | | | |
| | | FAIR VALUE | |
| | MEASUREMENTS | |
| | USING SIGNIFICANT | |
| | UNOBSERVABLE | |
| | INPUTS (LEVEL 3) | |
| Alger Small Cap Growth Institutional Fund | Preferred Stocks | |
| Opening balance at November 1, 2014 | $ | 1,773,234 | |
| Transfers into Level 3 | | | 1,352,069 | * |
| Transfers out of Level 3 | | | — | |
| Total gains or losses | | | | |
| Included in net realized gain (loss) on investments | | – | |
| Included in net unrealized gain (loss) on investments | | (219,386 | ) |
| Purchases and sales | | | – | |
| Purchases | | 599,684 | |
| Sales | | – | |
| Closing balance at October 31, 2015 | | | 3,505,601 | |
| The amount of total gains or losses for the period included in net realized | | | | |
| and unrealized gain (loss) attributable to change in unrealized appreciation | | | | |
| (depreciation) relating to investments still held at 10/31/2015 | $ | (219,386 | ) |
| *Tolero Pharmaceuticals, Inc. was changed from an observable transaction price to a mark to model. | | | | |
| |
| | Special Purpose | |
| Alger Small Cap Growth Institutional Fund | | | Vehicle | |
| Opening balance at November 1, 2014 | $ | — | |
| Transfers into Level 3 | | | — | |
| Transfers out of Level 3 | | | — | |
| Total gains or losses | | | | |
| Included in net realized gain (loss) on investments | | – | |
| Included in net unrealized gain (loss) on investments | | – | |
| Purchases and sales | | | – | |
| Purchases | | 775,134 | |
| Sales | | – | |
| Closing balance at October 31, 2015 | | | 775,134 | |
| The amount of total gains or losses for the period included in net realized | | | | |
| and unrealized gain (loss) attributable to change in unrealized appreciation | | | | |
| (depreciation) relating to investments still held at 10/31/2015 | $ | – | |
The following table provides quantitative information about our Level 3 fair value
measurements of our investments as of October 31, 2015. In addition to the techniques
and inputs noted in the table below, according to our valuation policy we may also use other
valuation techniques and methodologies when determining our fair value measurements.
The table below is not intended to be all-inclusive, but rather provides information on the
Level 3 inputs as they relate to our fair value measurements.
- 79 -
THE ALGER INSTITUTIONAL FUNDS
NOTES TO FINANCIAL STATEMENTS (Continued)
| | | | | | |
| | | Fair Value | Valuation | Unobservable | | |
| | | October 31, 2015 | Methodology | Input | Input/Range | |
| Alger Capital Appreciation Institutional Fund | | | | |
| Common Stocks | $ | 2,203,626 | Income | Discount Rate | 22.5-40 | % |
| | | | Approach | | | |
| Preferred Stocks | | 15,625,491 | Income | Discount Rate | 10-40 | % |
| | | | Approach | | | |
| Alger Capital Appreciation Focus Fund | | | | |
| Preferred Stocks | $ | 345,713 | Income | Discount Rate | 20 | % |
| | | | Approach | | | |
| Alger Mid Cap Growth Institutional Fund | | | | |
| Common Stocks | $ | 115,585 | Income | Discount Rate | 22.5-40 | % |
| | | | Approach | | | |
| Preferred Stocks | | 2,711,929 | Income | Discount Rate | 10-40 | % |
| | | | Approach | | | |
| Special Purpose Vehicle | | 240,362 | Cost Approach | Purchase Price | Cost | |
| |
| Alger Small Cap Growth Institutional Fund | | | | |
| Preferred Stocks | $ | 3,505,601 | Income | Discount Rate | 10-20 | % |
| | | | Approach | | | |
| Special Purpose Vehicle | | 775,134 | Cost Approach | Purchase Price | Cost | |
The significant unobservable inputs used in the fair value measurement of the company’s
securities are revenue and EBITDA multiples, discount rates, and the probabilities of
success of certain outcomes. Significant increases and decreases in these inputs in isolation
and interrelationships between those inputs could result in significantly higher or lower fair
value measurements as noted in the table above.
On October 31, 2015, Alger Capital Appreciation Institutional Fund transferred $30,574,616
from Level 1 to Level 2, utilizing fair value adjusted prices rather than exchange listed prices.
Certain of the Funds’ assets and liabilities are held at carrying amount or face value, which
approximates fair value for financial statement purposes. As of October 31, 2015, such
assets are categorized within the disclosure hierarchy as follows:
| | | | | | | | | | | | |
| | | TOTAL FUND | | LEVEL 1 | | LEVEL 2 | | | LEVEL 3 |
| Cash, Foreign cash and Cash equivalents: | | | | | | | | | | | | |
| Alger Capital Appreciation Institutional Fund | $ | 150,391,781 | | | — | $ | 150,391,781 | | | | — |
| Alger Capital Appreciation Focus Fund | | | 2,286,899 | | | — | | 2,286,899 | | | | — |
| Alger Mid Cap Growth Institutional Fund | | | 7,682,725 | | | — | | 7,682,725 | | | | — |
| Alger Small Cap Growth Institutional Fund | | | 6,706,159 | | | — | | 6,706,159 | | | | — |
NOTE 9 — Derivatives:
Financial Accounting Standards Board Accounting Standards Codification 815 – Derivatives
and Hedging (“ASC 815”) requires qualitative disclosures about objectives and strategies for
using derivatives, quantitative disclosures about fair value amounts of and gains and losses
on derivative instruments, and disclosures about credit-risk-related contingent features in
derivative agreements.
- 80 -
THE ALGER INSTITUTIONAL FUNDS
NOTES TO FINANCIAL STATEMENTS (Continued)
Options— The Funds seek to capture the majority of the returns associated with equity
market investments. To meet this investment goal, the Funds invest in a broadly diversified
portfolio of common stocks, while also buying and selling call and put options on equities
and equity indices. The Funds purchase call options to increase their exposure to the stock
market and also provide diversification of risk. The Funds purchase put options in order
to protect from significant market declines that may occur over a short period of time. The
Funds will write covered call and cash secured put options to generate cash flows while
reducing the volatility of the Funds’ portfolios. The cash flows may be an important source
of the Funds’ returns, although written call options may reduce the Funds’ ability to profit
from increases in the value of the underlying security or equity portfolio. The value of a
call option generally increases as the price of the underlying stock increases and decreases
as the stock decreases in price. Conversely, the value of a put option generally increases
as the price of the underlying stock decreases and decreases as the stock increases in price.
The combination of the diversified stock portfolio and the purchase and sale of options
is intended to provide the Funds with the majority of the returns associated with equity
market investments but with reduced volatility and returns that are augmented with the cash
flows from the sale of options. During the year ended October 31, 2015, options were used
in accordance with these objectives.
The Funds’ option contracts were not subject to any rights of offset with any counterparty.
All of the Funds’ options were exchange traded which utilize a clearing house that acts as an
intermediary between buyer and seller, receiving initial and maintenance margin from both,
and guaranteeing performance of the option contract.
There were no open derivative instruments as of October 31, 2015.
For the year ended October 31, 2015, Alger Mid Cap Growth Institutional Fund had option
purchases of $1,276,338 and option sales of $918,271. The effect of derivative instruments
on the accompanying Statement of Operations for the year ended October 31, 2015 is as
follows:
| | | |
| NET REALIZED GAIN (LOSS) ON INVESTMENTS, OPTIONS | | |
| Alger Mid Cap Growth Institutional Fund | | | |
| Derivatives not accounted for as hedging instruments | | Options | |
| Purchased Options | $ | 96,674 | |
| Written Options | | (85,147 | ) |
| Total | $ | 11,527 | |
| |
| NET CHANGE IN UNREALIZED APPRECIATION (DEPRECIATION) ON INVESTMENTS, OPTIONS | |
| Alger Mid Cap Growth Institutional Fund | | | |
| Derivatives not accounted for as hedging instruments | | Options | |
| Purchased Options | $ | 48,587 | |
| Written Options | | (48,165 | ) |
| Total | $ | 422 | |
- 81 -
THE ALGER INSTITUTIONAL FUNDS
NOTES TO FINANCIAL STATEMENTS (Continued)
NOTE 10 — Principal Risks:
In the normal course of business, the Fund invests in securities and enters into transactions
where risks exist due to fluctuations in the market (market risk) or failure of the issuer
of a security to meet all its obligations (issuer credit risk). The value of securities held by
the Fund may decline in response to certain events, including those directly involving the
issuers whose securities are owned by the Fund; conditions affecting the general economy;
overall market changes; local, regional or global political, social or economic instability;
and currency and interest rate and price fluctuations. Similar to issuer credit risk, the
Fund may be exposed to counterparty credit risk, or the risk that an entity with which
the Fund has unsettled or open transactions may fail to or be unable to perform on its
commitments. The Fund manages counterparty credit risk by entering into transactions only
with counterparties that it believes has the financial resources to honor its obligations and by
monitoring the financial stability of those counterparties. Financial assets, which potentially
expose the Fund to market, issuer and counterparty credit risks, consist principally of
financial instruments and receivables due from counterparties. The extent of the Fund’s
exposure to market, issuer and counterparty credit risks with respect to these financial assets
is generally approximated by its value recorded in the Statement of Assets and Liabilities,
less any collateral held by the Fund.
NOTE 11 — Affiliated Securities:
The securities listed below are deemed to be affiliates of the Funds because the Funds or
their affiliates owned 5% or more of the company’s voting securities during all or part of the
year ended October 31, 2015. Purchase and sale transactions and dividend income earned
during the period were as follows:
| | | | | | | | |
| | Shares/Par | | | Shares/Par | | | | |
| | at | | | at | | Realized | | Value at |
| | October 31, | Purchases/ | Sales/ | October | Dividend | Gain | | October 1, |
| Security | 2014 | Conversion | Conversion | 31, 2015 | Income | (Loss) | | 2015 |
| |
| Alger Capital Appreciation Institutional Fund | | | | | | |
| Common Stocks | | | | | | | | |
| Choicestream, Inc.* | 124,658 | – | – | 124,658 | – | – | $ | 52,356 |
| Preferred Stocks | | | | | | | | |
| Choicestream, Inc.* | 3,575,473 | – | – | 3,575,473 | – | – | | 1,501,699 |
| |
| Alger Capital Appreciation Focus Fund | | | | | | |
| Preferred Stocks | | | | | | | | |
| Prosetta Biosciences, | | | | | | | | |
| Inc.* | – | 76,825 | – | 76,825 | – | – | | 345,713 |
- 82 -
THE ALGER INSTITUTIONAL FUNDS
NOTES TO FINANCIAL STATEMENTS (Continued)
| | | | | | | |
| | Shares/Par | | | Shares/Par | | | |
| | at | | | at | | Realized | Value at |
| | October 31, | Purchases/ | Sales/ | October | Dividend | Gain | October |
| Security | 2014 | Conversion | Conversion | 31, 2015 | Income | (Loss) | 31, 2015 |
| |
| Alger Mid Cap Growth Institutional Fund | | | | | |
| Common Stocks | | | | | | | |
| Choicestream, Inc.* | 8,930 | – | – | 8,930 | – | – | 3,751 |
| Preferred Stocks | | | | | | | |
| Choicestream, Inc.* | 221,801 | – | – | 221,801 | – | – | 93,156 |
| Prosetta Biosciences, | | | | | | | |
| Inc.* | – | 166,009 | – | 166,009 | – | – | 747,041 |
| Tolero | | | | | | | |
| Pharmaceuticals, Inc.* | 354,870 | – | – | 354,870 | – | – | 1,070,323 |
| |
| Alger Small Cap Growth Institutional Fund | | | | | |
| Preferred Stocks | | | | | | | |
| Prosetta Biosciences, | | | | | | | |
| Inc.* | – | 133,263 | – | 133,263 | – | – | 599,684 |
| Tolero | | | | | | | |
| Pharmaceuticals, Inc.* | 448,284 | – | – | 448,284 | – | – | 1,352,069 |
| * Non-incomeproducingsecurity. | | | | | |
NOTE 12 — Subsequent Events:
Management of each Fund has evaluated events that have occurred subsequent to October
31, 2015 through the issuance date of the Financial Statements. No such events have been
identified which require recognition and/or disclosure.
- 83 -
REPORT OF INDEPENDENT REGISTERED PUBLIC ACCOUNTING FIRM
To the Board of Trustees of The Alger Institutional Funds and the Shareholders of the
Alger Capital Appreciation Institutional Fund, Alger Capital Appreciation Focus Fund,
Alger Mid Cap Growth Institutional Fund, and Alger Small Cap Growth Institutional Fund:
We have audited the accompanying statements of assets and liabilities, including the
schedules of investments, of The Alger Institutional Funds, comprised of the Alger Capital
Appreciation Institutional Fund, Alger Capital Appreciation Focus Fund, Alger Mid Cap
Growth Institutional Fund, and Alger Small Cap Growth Institutional Fund (the “Funds”)
as of October 31, 2015, and the related statements of operations for the year then ended,
the statements of changes in net assets for each of the two years in the period then ended,
and the financial highlights for each of the periods presented. These financial statements
and financial highlights are the responsibility of the Funds' management. Our responsibility
is to express an opinion on these financial statements and financial highlights based on our
audits.
We conducted our audits in accordance with the standards of the Public Company
Accounting Oversight Board (United States). Those standards require that we plan and
perform the audit to obtain reasonable assurance about whether the financial statements and
financial highlights are free of material misstatement. The Funds are not required to have,
nor were we engaged to perform, an audit of their internal control over financial reporting.
Our audits included consideration of internal control over financial reporting as a basis for
designing audit procedures that are appropriate in the circumstances, but not for the purpose
of expressing an opinion on the effectiveness of the Funds' internal control over financial
reporting. Accordingly, we express no such opinion. An audit also includes examining, on
a test basis, evidence supporting the amounts and disclosures in the financial statements,
assessing the accounting principles used and significant estimates made by management,
as well as evaluating the overall financial statement presentation. Our procedures included
confirmation of securities owned as of October 31, 2015, by correspondence with the
custodian and brokers; when replies were not received from brokers, we performed other
auditing procedures. We believe that our audits provide a reasonable basis for our opinion.
In our opinion, the financial statements and financial highlights referred to above present
fairly, in all material respects, the financial position of each of the portfolios constituting
The Alger Institutional Funds as of October 31, 2015, the results of their operations for the
year then ended, the changes in their net assets for each of the two years in the period then
ended, and the financial highlights for each of the periods presented, in conformity with
accounting principles generally accepted in the United States of America.
Deloitte & Touche LLP
New York, New York
January 8, 2016
- 84 -
THE ALGER INSTITUTIONAL FUNDS
ADDITIONAL INFORMATION (Unaudited)
Shareholder Expense Example
As a shareholder of a Fund, you incur two types of costs: transaction costs, if applicable,
including sales charges (loads) and redemption fees; and ongoing costs, including
management fees, distribution (12b-1) fees, if applicable, and other fund expenses. This
example is intended to help you understand your ongoing costs (in dollars) of investing in
the Fund and to compare these costs with the ongoing costs of investing in other mutual
funds.
The example below is based on an investment of $1,000 invested at the beginning of the
six-month period starting May 1, 2015 and ending October 31, 2015.
Actual Expenses
The first line for each class of shares in the table below provides information about actual
account values and actual expenses. You may use the information in this line, together
with the amount you invested, to estimate the expenses that you would have paid over the
period. Simply divide your account value by $1,000 (for example, an $8,600 account value
divided by $1,000 = 8.6), then multiply the result by the number in the first line under the
heading entitled “Expenses Paid during the Period” to estimate the expenses you paid on
your account during this period.
Hypothetical Example for Comparison Purposes
The second line for each class of shares in the table below provides information about
hypothetical account values and hypothetical expenses based on the Fund’s actual expense
ratios for each class of shares and an assumed rate of return of 5% per year before expenses,
which is not the Fund’s actual return. The hypothetical account values and expenses may not
be used to estimate the actual ending account balance or expenses you paid for the period.
You may use this information to compare the ongoing costs of investing in the Fund and
other funds. To do so, compare this 5% hypothetical example with the 5% hypothetical
examples that appear in the shareholder reports of other funds.
Please note that the expenses shown in the table are meant to highlight your ongoing costs
only and do not reflect any transaction costs, such as sales charges (loads) and redemption
fees. Therefore, the second line under each class of shares in the table is useful in comparing
ongoing costs only, and will not help you determine the relative total costs of owning
different funds. In addition, if these transactional costs were included, your costs would
have been higher.
- 85 -
THE ALGER INSTITUTIONAL FUNDS
ADDITIONAL INFORMATION (Unaudited) (Continued)
| | | | | | | | | | | | |
| | | | | | | | | | | Annualized | |
| | | | | | | | Expenses | | Expense Ratio | |
| | | | | | | | Paid During | | | For the | |
| | | Beginning | | Ending | | the Six Months | | Six Months | |
| | | | Account | | Account | | | Ended | | | Ended | |
| | | | Value | | Value | | October 31, | | October 31, | |
| | | May 1, 2015 | | October 31, 2015 | | | 2015 | (a) | | 2015 | (b) |
| Alger Capital Appreciation Institutional Fund | | | | | | | | | | |
| Class I | Actual | $ | 1,000.00 | $ | 1,018.60 | | $ | 5.70 | | | 1.12 | % |
| | Hypothetical(c) | | 1,000.00 | | 1,019.56 | | | 5.70 | | | 1.12 | |
| Class R | Actual | | 1,000.00 | | 1,016.30 | | | 8.18 | | | 1.61 | |
| | Hypothetical(c) | | 1,000.00 | | 1,017.09 | | | 8.19 | | | 1.61 | |
| | | | | | | | | | | | | |
| Alger Capital Appreciation Focus Fund | | | | | | | | | | | |
| Class A | Actual | $ | 1,000.00 | $ | 1,016.00 | | $ | 6.61 | | | 1.30 | % |
| | Hypothetical(c) | | 1,000.00 | | 1,018.65 | | | 6.61 | | | 1.30 | |
| Class C | Actual | | 1,000.00 | | 1,012.00 | | 10.35 | | | 2.05 | |
| | Hypothetical(c) | | 1,000.00 | | 1,014.92 | | 10.36 | | | 2.05 | |
| Class I | Actual | | 1,000.00 | | 1,016.79 | | | 5.85 | | | 1.15 | |
| | Hypothetical(c) | | 1,000.00 | | 1,019.41 | | | 5.85 | | | 1.15 | |
| Class Z | Actual | | 1,000.00 | | 1,018.36 | | | 4.53 | | | 0.89 | |
| | Hypothetical(c) | | 1,000.00 | | 1,020.72 | | | 4.53 | | | 0.89 | |
| | | | | | | | | | | | | |
| Alger Mid Cap Growth Institutional Fund | | | | | | | | | | | |
| Class I | Actual | $ | 1,000.00 | $ | 947.06 | | $ | 5.89 | | | 1.20 | % |
| | Hypothetical(c) | | 1,000.00 | | 1,019.16 | | | 6.11 | | | 1.20 | |
| Class R | Actual | | 1,000.00 | | 945.02 | | | 8.53 | | | 1.74 | |
| | Hypothetical(c) | | 1,000.00 | | 1,016.43 | | | 8.84 | | | 1.74 | |
| | | | | | | | | | | | | |
| Alger Small Cap Growth Institutional Fund | | | | | | | | | | | |
| Class I | Actual | $ | 1,000.00 | $ | 953.76 | | $ | 6.16 | | | 1.25 | % |
| | Hypothetical(c) | | 1,000.00 | | 1,018.90 | | | 6.36 | | | 1.25 | |
| Class R | Actual | | 1,000.00 | | 950.91 | | | 8.56 | | | 1.74 | |
| | Hypothetical(c) | | 1,000.00 | | 1,016.43 | | | 8.84 | | | 1.74 | |
| | | | | | | | | | | | | |
(a) Expenses are equal to the annualized expense ratio of the respective share class, multiplied by the average account value over
the period, multiple by 184/365 (to reflect the one-half year period).
(b) Annualized.
(c) 5% annual return before expenses.
Trustees and Officers of the Trust
Information about the trustees and officers of the Trust is set forth below. In the table
the term “Alger Fund Complex” refers to the Trust, The Alger Portfolios, The Alger
Funds, Alger Global Growth Fund and The Alger Funds II, each of which is a registered
investment company managed by Fred Alger Management, Inc. (“Alger Management”).
Each Trustee serves until an event of termination, such as death or resignation, or until his
or her successor is duly elected; each officer’s term of office is one year. Unless otherwise
- 86 -
THE ALGER INSTITUTIONAL FUNDS
ADDITIONAL INFORMATION (Unaudited) (Continued)
noted, the address of each person named below is 360 Park Avenue South, New York, NY
10010.
| | | |
| | | | Number |
| | | | of Funds |
| | | | in the |
| | | | Alger Fund |
| | | Trustee | Complex |
| | | and/or | which are |
| Name, Age, Position with the | | Officer | Overseen |
| Trust | Principal Occupations | Since | by Trustee |
| INTERESTED TRUSTEE | | | |
| |
| Hilary M. Alger (54) | Director of Development, Pennsylvania Ballet | 2003 | 25 |
| | 2004-2013; Associate Director of Development, | | |
| | College of Arts and Sciences and Graduate School, | | |
| | University of Virginia 1999-2003. | | |
| NON-INTERESTED TRUSTEE | | | |
| |
| Charles F. Baird, Jr. (62) | Managing Partner of North Castle Partners, a | 2000 | 25 |
| | private equity securities group; Chairman of | | |
| | Elizabeth Arden Red Door Spas and Barry’s | | |
| | Bootcamp, former Chairman of Cascade Helmets, | | |
| | gloProfessional (makeup and skincare business), | | |
| | Contigo (manufacturer of mugs and water bottles), | | |
| | and International Fitness. | | |
| Roger P. Cheever (70) | Associate Vice President for Principal Gifts, and | 2000 | 25 |
| | Senior Associate Dean for Development in the | | |
| | Faculty of Arts and Sciences at Harvard University; | | |
| | Formerly Deputy Director of the Harvard College | | |
| | Fund. | | |
| Stephen E. O'Neil (82) | Attorney. Private Investor since 1981. Formerly of | 1986 | 25 |
| | Counsel to the law firm of Kohler & Barnes. | | |
| David Rosenberg (53) | Associate Professor of Law since January 2006 | 2007 | 25 |
| | (Assistant Professor 2000-2005), Zicklin School of | | |
| | Business, Baruch College, City University of New | | |
| | York. | | |
| Nathan E. Saint-Amand | Medical doctor in private practice; Member of the | 1986 | 25 |
| M.D. (77) | Board of the Manhattan Institute (non-profit policy | | |
| | research)since1988;FormerlyCo-Chairman,Special | | |
| | Projects Committee, Memorial Sloan Kettering. | | |
Ms. Alger is an “interested person” (as defined in the Investment Company Act) of the
Trust because of her affiliations with Alger Management. No Trustee is a director of any
public company except as indicated under “Principal Occupations”.
- 87 -
THE ALGER INSTITUTIONAL FUNDS
ADDITIONAL INFORMATION (Unaudited) (Continued)
| | | | | |
| | | | | | Number |
| | | | | | of Funds |
| | | | | | in the |
| | | | | | Alger Fund |
| | | | | Trustee | Complex |
| | | | | and/or | which are |
| Name, Age, Position with the | | | | Officer | Overseen |
| Trust | Principal Occupations | | | Since | by Trustee |
| OFFICERS | | | | | |
| |
| Hal Liebes (51) | Executive Vice President, Chief Operating Officer, | 2005 | N/A |
| President | Chief Legal Officer and Secretary of Alger | | |
| | Management and Alger Inc.; Director since 2006 of | | |
| | Alger Management, Alger Inc. and Resources. | | | | |
| Lisa A. Moss (50) | Senior Vice President since 2009, and Vice | 2006 | N/A |
| Secretary | President and Assistant General Counsel of Alger | | |
| | Management since June 2006. | | | | |
| Michael D. Martins (50) | Senior Vice President of Alger Management; | 2005 | N/A |
| Treasurer | Assistant Treasurer since 2004. | | | | |
| Anthony S. Caputo (60) | Employed by Alger Management since 1986, | 2007 | N/A |
| Assistant Treasurer | currently serving as Vice President. | | | | |
| Sergio M. Pavone (54) | Employed by Alger Management since 2002, | 2007 | N/A |
| Assistant Treasurer | currently serving as Vice President. | | | | |
| Patrick J. Murphy (45) | Senior Vice President of Alger Management since | 2014 | N/A |
| Chief Compliance Officer | 2014. | | | |
| Joshua M. Lindauer (28) | Employed by Alger Management since 2014. | | | 2014 | N/A |
| Assistant Secretary | | | | | |
The Statement of Additional Information contains additional information about the Funds’
Trustees and is available without charge upon request by calling (800) 992-3863.
- 88 -
THE ALGER INSTITUTIONAL FUNDS
ADDITIONAL INFORMATION (Unaudited) (Continued)
Investment Management Agreement Renewal
At an in-person meeting held on September 29, 2015, the Trustees, including the Independent
Trustees, unanimously approved renewal of the Investment Advisory Agreement (the
“Agreement”) between the Trust and Fred Alger Management, Inc. (“Alger Management”).
The Independent Trustees were assisted in their review by independent legal counsel and met
with such counsel in executive session separate from representatives of Alger Management.
In evaluating the Agreement, the Trustees drew on materials that they had requested and
which were provided to them in advance of the meeting by Alger Management and by
counsel. The materials covered, among other matters, (i) the nature, extent and quality
of the services provided by Alger Management under the Agreement, (ii) the investment
performance of each of the Trust’s portfolios (each a “Fund”), (iii) the costs to Alger
Management of its services and the profits realized by Alger Management and Fred Alger
& Company, Incorporated (“Alger Inc.”), from their relationship with the Trust, and (iv)
the extent to which economies of scale would be realized if and as the Funds grow and
whether the fee levels in the Agreement reflected such economies of scale. These materials
included a presentation and analysis of the Funds and Alger Management’s services by
FUSE Research Network LLC (“FUSE”), an independent consulting firm selected by the
Trust’s Chief Compliance Officer and having no other material relationship with Alger
Management or its affiliates
In deciding whether to approve renewal of the Agreement, the Trustees considered various
factors, including those enumerated above. They also considered other direct and indirect
benefits to Alger Management and its affiliates from their relationship with the Trust.
Nature, Extent and Quality of Services. In considering the nature, extent and quality of
the services provided by Alger Management pursuant to the Agreement, the Trustees relied
on their prior experience as Trustees of the Trust, their familiarity with the personnel and
resources of Alger Management and its affiliates (derived in part from quarterly meetings
with and presentations by Fund investment management and distribution personnel), and the
materials provided at the meeting. They noted that under the Agreement Alger Management
is responsible for managing the investment operations of the Funds. The Trustees reviewed
the background and experience of Alger Management's senior investment management
personnel, including the individuals currently responsible for the investment operations
of the Funds. They also considered the resources and practices of Alger Management
in managing each Fund's portfolio, as well as Alger Management's overall investment
management business. They noted especially Alger Management's established expertise
in managing portfolios of "growth" stocks and that, according to an analysis provided
by FUSE, the characteristics of each Fund had been consistent with those of a growth-
oriented fund. The Board noted that each Fund was being managed consistent with its
growth mandate. They also noted that during the year Alger Management had continued its
ongoing efforts to strengthen its investment management team, most notable by adding two
seasoned and highly accomplished portfolio managers who had begun providing services to
cetain Funds. The Trustees concluded that Alger Management's experience, resources and
strength in the areas of importance to the Funds are considerable. The Trustees considered
- 89 -
THE ALGER INSTITUTIONAL FUNDS
ADDITIONAL INFORMATION (Unaudited) (Continued)
the level and depth of Alger Management's ability to execute portfolio transactions to effect
investment decisions, including those through Alger Inc. They also noted that certain
administrative, compliance, reporting and accounting services necessary for the conduct
of the Trust's affairs are provided separately under an Administration Agreement and a
Shareholder Administrative Services Agreement with Alger Management. The Trustees also
considered the control and compliance environment at Alger Management and within the
Trust.
Investment Performance of the Portfolios. Drawing upon information provided at the
meeting by Alger Management as well as FUSE and upon reports provided to the Trustees by
Alger Management throughout the preceding year, the Trustees reviewed each Fund’s returns
for the year-to-date (at 6/30/15), second-quarter of 2015, 1-, 3- and 5-year, and longer
periods to the extent available (and its year-by-year returns), together with supplemental
performance data through 8/31/15, and compared them with benchmark and peer-group
data for the same periods. They noted that the Mid Cap, Capital Appreciation and Capital
Appreciation Focus Funds had surpassed their peer medians and benchmarks for the 3-year
(two years for the shorter-lived Capital Appreciation Focus Fund) and all shorter periods
ending 6/30/15. The Small Cap Fund’s performance had fallen well below its peer medians
and benchmark for all periods ending 6/30/15, but the Trustees suspended judgment in
light of a promising upturn as of 8/31/15, arguably due, at least in part, to an important
adjustment in the Fund’s portfolio management earlier in 2015. Representatives of Alger
Management discussed with the Trustees this and other matters pertaining to the Funds’
performance. On the basis of their review and the discussions with Alger Management, the
Trustees determined that the performance of the Funds was acceptable.
Fund Fees and Expense Ratios; Profitability to Alger Management and its Affiliates.
The Trustees reviewed each Fund's management fee and expense ratio and compared them
with those of a group of comparable funds. In order to assist the Trustees in this comparison,
FUSE had provided the Trustees with comparative information with respect to the advisory
fees and expense ratios of relevantly similar funds. That information indicated that the
advisory fees of three of the Funds were near or below the median for their comparison
groups, while the fee of the Capital Appreciation Fund was significantly above the applicable
median. That fee, in the top quartile of peer-fund fees, had been somewhat diminished by
operation of the Fund’s fee breakpoint. Of the 10 expense ratios for the Funds’ various
share classes, three were below or just above their peer medians. Two of the remaining
seven were for share classes of small asset size that suffered thereby in comparison with
their peers. Only three of the remaining five placed in the top quartile of the applicable
reference group; all three of these were for Class R Shares, whose comparatively high 12b-1
and service fee charges exceeded those of many funds in their reference groups, with the
result that the classes’ expenses were not compared solely with those of true peers. The
remaining two ratios were those of the Mid Cap Fund and Capital Appreciation Fund Class
I Shares; the Trustees noted that although these expense ratios (and the advisory fee of the
Capital Appreciation Fund) ranked high against their peers, the shareholders of both Funds
had also enjoyed high comparative returns over more than five years for most periods. The
- 90 -
THE ALGER INSTITUTIONAL FUNDS
ADDITIONAL INFORMATION (Unaudited) (Continued)
Trustees determined that such information should be taken into account in weighing the
size of the fee against the nature, extent and quality of the services provided.
The Trustees also considered fees paid to Alger Management by four other types of clients,
specifically mutual funds for which Alger Management was sub-adviser, separately managed
institutional accounts, “wrap programs,” and collective investment trusts. The Trustees
determined that in all four cases the fees were of doubtful relevance for purposes of
comparison with those of the Funds because of the differences in services provided by
Alger Management to those types of clients as opposed to the Funds, but that to the extent
that meaningful comparison was practicable, the differences in services adequately explained
the differences in the fees. The Trustees then considered the profitability of the Investment
Advisory Agreement to Alger Management and its affiliates, and the methodology used
by Alger Management in determining such profitability. The Trustees reviewed previously-
provided data on each Fund's profitability to Alger Management and its affiliates for the
year ended June 30, 2015. After discussing with representatives of Alger Management
and FUSE the expense-allocation practices used in computing the costs that formed the
bases of the profitability calculations, the Trustees turned to the profitability data provided.
After analysis and discussion, they concluded in each case that, to the extent that Alger
Management’s and its affiliates’ relationships with the Fund had been profitable, the profit
margin was not unacceptable.
Economies of Scale. On the basis of their discussions with management and their
analysis of information provided at the meeting, the Trustees determined that the nature of
the Funds and their operations is such that Alger Management is likely to realize economies
of scale in the management of each Fund at some point as (and if) it grows in size. In
that connection, they noted that the advisory fee schedules in the Agreement include fee
reductions for each Fund at specified Fund asset levels (“breakpoints”); these have the effect
of lowering the Fund’s overall management fee as the Fund grows past a breakpoint, thus
sharing with the Fund’s shareholders economies of scale achieved by Alger Management in
managing the growing Fund.
Other Benefits to Alger Management. The Trustees considered whether Alger
Management benefits in other ways from its relationship with the Trust. They noted
that Alger Management maintains soft-dollar arrangements in connection with the
Funds' brokerage transactions, reports on which are regularly supplied to the Trustees at
their quarterly meetings and summaries of which, listing commissions by Fund for the
twelve months through June 30, 2015, had been included in the materials supplied prior
to the meeting. The Trustees also noted that Alger Management receives fees from the
Funds under the Administration Agreement and the Shareholder Administrative Services
Agreement, and that Alger Inc. provides a considerable portion of the Funds' equity
brokerage and receives shareholder servicing fees from the Funds as well. The Trustees
had been provided with information regarding, and had considered, the administration fee,
shareholder administrative services fee, brokerage and shareholder servicing fee benefits in
connection with their review of the profitability to Alger Management and its affiliates of
- 91 -
THE ALGER INSTITUTIONAL FUNDS
ADDITIONAL INFORMATION (Unaudited) (Continued)
their relationships with the Funds. As to other benefits received, the Trustees decided that
none were so significant as to render Alger Management's fees excessive.
Conclusions and Determinations. At the conclusion of these discussions, each of the
Independent Trustees expressed the opinion that he had been furnished with sufficient
information to make an informed business decision with respect to renewal of the
Investment Advisory Agreement. Based on its discussions and considerations as described
above, the Board made the following conclusions and determinations in respect of each
Fund:
• The Board concluded that the nature, extent and quality of the services provided
to the Fund by Alger Management are adequate and appropriate.
• The Board determined that the Portfolio’s performance was acceptable.
• The Board concluded that the advisory fee paid to Alger Management by the
Fund was reasonable in light of comparative performance and expense and advi-
sory fee information, costs of the services provided and profits to be realized and
benefits derived or to be derived by Alger Management and its affiliates from the
relationship with the Fund. In the case of the Capital Appreciation Focus Fund,
the Trustees noted that Alger Management had voluntarily undertaken to cap
Fund expenses through expense reimbursements and fee waivers, thus in effect
lowering the fees it actually received from the Fund.
• The Board accepted Alger Management’s acknowledgement that economies of
scale were likely to be achieved in the management of the Fund and determined
that the fee breakpoints in the Agreement provided a means by which Alger Man-
agement would share the benefits of such economies with Fund shareholders.
The Board considered these conclusions and determinations and, without any one factor
being dispositive, determined with respect to each Fund that renewal of the Investment
Advisory Agreement was in the best interests of the Fund and its shareholders.
Tax Information
In accordance with subchapter M of the Internal Revenue Code of 1986, as amended, for
the year ended October 31, 2015, 37.68% of the Alger Capital Appreciation Institutional
Funds, dividends qualified for the dividends received deduction for corporations. For the
year ended October 31, 2015, certain dividends paid by the Funds may be subject to a
maximum rate of 15%, as provided by the Jobs and Growth Tax Relief Reconciliation
Act of 2003. Of the distributions paid during the fiscal year, 40.04% of the Alger Capital
Appreciation Institutional Funds, dividends may be considered qualified dividend income.
Shareholders should not use the above information to prepare their tax returns. Since the
Fund’s fiscal year is not the calendar year, another notification will be sent with respect to
calendar year 2015. Such notification, which will reflect the amount to be used by tax payers
on their federal income tax returns, will be made in conjunction with Form 1099 DIV and
will be mailed in January 2016. Shareholders are advised to consult their own tax advisers
with respect to the tax consequences of their investment in the Fund.
- 92 -
THE ALGER INSTITUTIONAL FUNDS
ADDITIONAL INFORMATION (Unaudited) (Continued)
| | | | | |
| Privacy Policy | | | | | |
| |
| U.S. Consumer Privacy Notice Rev. 01/2015 | 3/30/15 |
| FACTS | WHAT DOES ALGER DO WITH YOUR PERSONAL INFORMATION? |
| |
| |
| Why? | Financial companies choose how they share your personal information. Federal law |
| | gives consumers the right to limit some but not all sharing. Federal law also requires us |
| | to tell you how we collect, share, and protect your personal information. Please read this |
| | notice carefully to understand what we do. | | |
| What? | The types of personal information we collect and share depend on the product or service |
| | you have with us. This information can include: | | |
| | • Social Security number and | | |
| | • Account balances and | | |
| | • Transaction history and | | |
| | • Purchase history and | | |
| | • Assets | | | |
| | When you are no longer our customer, we continue to share your information as |
| | described in this notice. | | | |
| How? | Allfinancialcompaniesneedtosharepersonalinformationtoruntheireverydaybusiness. |
| | In the section below, we list the reasons financial companies can share their personal |
| | information; the reasons chooses to share; and whether you can limit this sharing. |
| |
| Reasons we can share your personal | Does | Can you limit |
| information | | | Alger share? | this sharing? |
| For our everyday business purposes — | Yes | | No |
| such as to process your transactions, maintain | | | |
| your account(s), respond to court orders and | | | |
| legal investigations, or report to credit bureaus | | | |
| For our marketing purposes — to offer our | Yes | | No |
| products and services to you | | | | |
| For joint marketing with other financial | No | | We don’t share |
| companies | | | | | |
| For our affiliates’everyday business | Yes | | No |
| purposes — information about your | | | |
| transactions and experiences | | | | |
| For our affiliates’everyday business | No | | We don’t share |
| purposes — information about your | | | |
| creditworthiness | | | | | |
| For nonaffiliates to market to you | No | | We don’t share |
| Questions? Call 1-800-342-2186 | | | |
- 93 -
THE ALGER INSTITUTIONAL FUNDS
ADDITIONAL INFORMATION (Unaudited) (Continued)
| |
| Who we are | |
| |
| Who is providing this notice? | Alger includes Fred Alger Management, Inc. and Fred |
| | Alger & Company, Incorporated as well as the following |
| | funds: The Alger Funds, The Alger Funds II, The Alger |
| | Institutional Funds, The Alger Portfolios, and Alger |
| | Global Growth Fund. |
| |
| |
| What we do | |
| How does Alger | To protect your personal information from unauthorized |
| protect my personal | access and use, we use security measures that comply |
| information? | with federal law. These measures include computer |
| | safeguardsandsecuredfilesandbuildings. |
| How does Alger | We collect your personal information, for example, |
| Collect my personal | when you: |
| information? | • Open an account or |
| | • Make deposits or withdrawals from your account or |
| | • Provide account information or |
| | • Pay us by check. |
| |
| |
| Why can’t I limit all sharing? | Federal law gives you the right to limit only |
| | • sharing foraffiliates’everydaybusinesspurposes |
| | information about your credit worthiness |
| | • affiliates fromusingyourinformationtomarkettoyou |
| | • sharing fornonaffiliatestomarkettoyou |
| | State laws and individual companies may give you |
| | additional rights to limit sharing. |
| |
| |
| Definitions | |
| Affiliates | Companies related by common ownership or control. |
| | Theycanbefinancialandnonfinancialcompanies. |
| | • Our affiliatesincludeFredAlgerManagement,Inc. |
| | and Fred Alger & Company, Incorporated as well as the |
| | following funds: The Alger Funds, The Alger Funds II, |
| | The Alger Institutional Funds, The Alger Portfolios, and |
| | Alger Global Growth Fund. |
| Nonaffiliates | Companies not related by common ownership or |
| | control.Theycanbefinancialandnonfinancial |
| | companies. |
| Joint marketing | Aformalagreementbetweennonaffiliatedfinancial |
| | companiesthattogethermarketfinancialproductsor |
| | services to you. |
| Other important inforamtion | |
- 94 -
THE ALGER INSTITUTIONAL FUNDS
ADDITIONAL INFORMATION (Unaudited) (Continued)
Proxy Voting Policies
A description of the policies and procedures the Trust uses to determine how to vote
proxies relating to portfolio securities and information regarding how the Fund voted
proxies relating to portfolio securities during the most recent 12-month period ended June
30 are available, without charge, by calling (800) 992-3863 or online on the Funds’ website
at www.alger.com or on the SEC’s website at www.sec.gov.
Fund Holdings
The Board of Trustees has adopted policies and procedures relating to disclosure of the
Funds’ portfolio securities. These policies and procedures recognize that there may be
legitimate business reasons for holdings to be disclosed and seek to balance those interests
to protect the proprietary nature of the trading strategies and implementation thereof by
the Funds.
Generally, the policies prohibit the release of information concerning portfolio holdings
which have not previously been made public to individual investors, institutional investors,
intermediaries that distribute the Funds’ shares and other parties which are not employed
by the Manager or its affiliates except when the legitimate business purposes for selective
disclosure and other conditions (designed to protect the Funds) are acceptable.
The Funds make their full holdings available semi-annually in shareholder reports filed on
Form N-CSR and after the first and third fiscal quarters in regulatory filings on Form N-Q.
These shareholder reports and regulatory filings are filed with the SEC, as required by federal
securities laws, and are generally available within sixty (60) days of the end of the Funds’
fiscal quarter. The Funds’ Forms N-Q are available online on the SEC’s website at www.
sec.gov or may be reviewed and copied at the SEC’s Public Reference Room in Washington,
D.C. Information regarding the operation of the SEC’s Public Reference Room may be
obtained by calling 1-800-SEC-0330.
In addition, the Funds make publicly available their respective month-end top 10 holdings
with a 15 day lag and their month-end full portfolios with a 60 day lag on their website www.
alger.com and through other marketing communications (including printed advertising/
sales literature and/or shareholder telephone customer service centers). No compensation
or other consideration is received for the non-public disclosure of portfolio holdings
information.
In accordance with the foregoing, the Funds provide portfolio holdings information to
service providers who provide necessary or beneficial services when such service providers
need access to this information in the performance of their services and are subject to
duties of confidentiality (1) imposed by law, including a duty not to trade on non-public
information, and/or (2) pursuant to an agreement that confidential information is not to be
disclosed or used (including trading on such information) other than as required by law. From
time to time, the Funds will communicate with these service providers to confirm that they
understand the Funds’ policies and procedures regarding such disclosure. This agreement
must be approved by the Funds’ Chief Compliance Officer, President or Secretary.
- 95 -
THE ALGER INSTITUTIONAL FUNDS
ADDITIONAL INFORMATION (Unaudited) (Continued)
The Board of Trustees periodically reviews a report disclosing the third parties to whom
each Fund’s holdings information has been disclosed and the purpose for such disclosure,
and it considers whether or not the release of information to such third parties is in the best
interest of the Fund and its shareholders.
In addition to material the Funds routinely provide to shareholders, the Manager may,
upon request, make additional statistical information available regarding the Funds. Such
information will include, but not be limited to, relative weightings and characteristics of a
Fund portfolios versus its peers or an index (such as P/E ratio, alpha, beta, capture ratio,
standard deviation, EPS forecasts, Sharpe ratio, information ratio, R-squared, and market
cap analysis), security specific impact on overall portfolio performance month-end top
ten contributors to and detractors from performance, breakdown of High Unit Volume
Growth holdings vs. Positive Lifecycle Change holdings, portfolio turnover, and requests
of a similar nature. Please contact the Funds at (800) 992-3863 to obtain such information.
- 96 -
THE ALGER INSTITUTIONAL FUNDS
360 Park Avenue South
New York, NY 10010
(800) 992-3863
www.alger.com
Investment Manager
Fred Alger Management, Inc.
360 Park Avenue South
New York, NY 10010
Distributor
Fred Alger & Company, Incorporated
360 Park Avenue South
New York, NY 10010
Transfer Agent and Dividend Disbursing Agent
State Street Bank and Trust Company
c/o Boston Financial Data Services, Inc.
P.O. Box 8480
Boston, MA 02266-8480
Custodian
Brown Brothers Harriman & Company
50 Post Office Square
Boston, MA 02110
This report is submitted for the general information of the shareholders of The Alger
Institutional Funds. It is not authorized for distribution to prospective investors unless
accompanied by an effective Prospectus for the Trust, which contains information
concerning the Trust’s investment policies, fees and expenses as well as other pertinent
information.
- 97 -
ITEM 2. CODE OF ETHICS.
(a) The Registrant has adopted a code of ethics (the "Code of Ethics") that applies to its
principal executive officer, principal financial officer, principal accounting officer or
controller, or persons performing similar functions.
(b) Not applicable.
(c) The Registrant has not amended its Code of Ethics during the period covered by the
shareholder report presented in Item 1 hereto.
(d) The Registrant has not granted a waiver or an implicit waiver from a provision of its
Code of Ethics during the period covered by the shareholder report presented in Item 1
hereto.
(e) Not applicable.
(f) The Registrant's Code of Ethics is attached as an Exhibit hereto.
ITEM 3. AUDIT COMMITTEE FINANCIAL EXPERT.
The Board of Trustees of the Registrant determined that Stephen E. O’Neil is an audit committee
financial expert (within the meaning of that phrase specified in the instructions to Form N-CSR)
on the Registrant’s audit committee. Mr. O’Neil is an “independent” trustee – i.e., he is not an
interested person of the Registrant as defined in the Investment Company Act of 1940, nor has
he accepted directly or indirectly any consulting, advisory or other compensatory fee from the
Registrant, other than in his capacity as Trustee.
ITEM 4. PRINCIPAL ACCOUNTANT FEES AND SERVICES.
| | |
| a) Audit Fees: | | |
| October 31, 2015 | $ | 131,000 |
| October 31, 2014 | $ | 126,300 |
| |
| b) Audit-Related Fees: NONE | | |
| |
| c) Tax Fees for tax advice, tax compliance and tax planning: |
| October 31, 2015 | $ | 18,800 |
| October 31, 2014 | $ | 19,600 |
| |
| d) All Other Fees: | | |
| October 31, 2015 | $ | 10,100 |
| October 31, 2014 | $ | 9,760 |
Other fees include a review and consent for Registrants registration statement filing and
a review of the semi-annual financial statements.
e) 1) Audit Committee Pre-Approval Policies And Procedures:
Audit and non-audit services provided by the Registrant’s independent registered public
accounting firm (the “Auditors”) on behalf the Registrant must be pre-approved by the
Audit Committee. Non-audit services provided by the Auditors on behalf of the
Registrant’s Investment Adviser or any entity controlling, controlled by, or under
common control with the Investment Adviser must be pre-approved by the Audit
Committee if such non-audit services directly relate to the operations or financial
reporting of the Registrant.
2) All fees in item 4(b) through 4(d) above were approved by the Registrants’ Audit
Committee.
f) Not Applicable
g) Non-Audit Fees:
| | | |
| October 31, 2015 | $ | 191,042 | €69,347 |
| October 31, 2014 | $ | 201,965 | €67,800 |
h) The audit committee of the board of trustees has considered whether the provision of the
non-audit services that were rendered to the registrant's investment adviser and any entity
controlling, controlled by, or under common control, with the adviser that provides ongoing
services to the registrant that were not approved pursuant to (c)(7)(ii) of Rule 2-01 of
Regulation S-X is compatible with maintaining the principle accountant's independence.
ITEM 5. AUDIT COMMITTEE OF LISTED REGISTRANTS.
Not applicable
ITEM 6. INVESTMENTS.
Not applicable
ITEM 7. DISCLOSURE OF PROXY VOTING POLICIES AND PROCEDURES FOR CLOSED-END MANAGEMENT
INVESTMENT COMPANIES.
Not applicable
ITEM 8. PORTFOLIO MANAGERS OF CLOSED-END MANAGEMENT INVESTMENT COMPANIES.
Not applicable
ITEM 9. PURCHASES OF EQUITY SECURITIES BY CLOSED-END MANAGEMENT INVESTMENT COMPANY
AND AFFILIATED PURCHASERS.
Not applicable
ITEM 10. SUBMISSION OF MATTERS TO A VOTE OF SECURITY HOLDERS.
None
ITEM 11. CONTROLS AND PROCEDURES.
(a) The Registrant’s principal executive officer and principal financial officer have concluded
that the Registrant’s disclosure controls and procedures (as defined in Rule 30a-3(c) under
the Investment Company Act of 1940, as amended) are effective based on their evaluation
of the disclosure controls and procedures as of a date within 90 days of the filing date of
this document.
(b) No changes in the Registrant’s internal control over financial reporting occurred during
the Registrant’s second fiscal half-year that materially affected, or are reasonably likely to
materially affect, the Registrant’s internal control over financial reporting.
ITEM 12. EXHIBITS.
(a) (1) Code of Ethics as Exhibit 99.CODE ETH
(a) (2) Certifications of principal executive officer and principal financial officer as required by
rule 30a-2(a) under the Investment Company Act of 1940 are attached as Exhibit 99.CERT
(b) Certifications of principal executive officer and principal financial officer as required by rule
30a-2(b) under the Investment Company Act of 1940 are attached as Exhibit 99.906CERT
SIGNATURES
Pursuant to the requirements of the Securities Exchange Act of 1934 and the Investment
Company Act of 1940, the registrant has duly caused this report to be signed on its behalf
by the undersigned, thereunto duly authorized.
The Alger Institutional Funds
By: /s/Hal Liebes
Hal Liebes
President
Date: December 17, 2015
Pursuant to the requirements of the Securities Exchange Act of 1934 and the Investment
Company Act of 1940, this report has been signed below by the following persons on behalf
of the registrant and in the capacities and on the dates indicated.
By: /s/Hal Liebes
Hal Liebes
President
Date: December 17, 2015
By: /s/Michael D. Martins
Michael D. Martins
Treasurer
Date: December 17, 2015
