| | OMB APPROVAL |
| | OMB Number: | 3235-0570 |
| | Expires: | January 31, 2014 |
| UNITED STATES | Estimated average burden hours per response. . . . . . . . . . . . . . . . .20.6 |
| SECURITIES AND EXCHANGE COMMISSION | |
| Washington, D.C. 20549 | |
| | | | |
FORM N-CSR
CERTIFIED SHAREHOLDER REPORT OF REGISTERED
MANAGEMENT INVESTMENT COMPANIES
Investment Company Act file number | 811-07986 |
|
The Alger Institutional Funds |
(Exact name of registrant as specified in charter) |
|
360 Park Avenue South New York, New York | | 10010 |
(Address of principal executive offices) | | (Zip code) |
|
Mr. Hal Liebes Fred Alger Management, Inc. 360 Park Avenue South New York, New York 10010 |
(Name and address of agent for service) |
|
Registrant’s telephone number, including area code: | 212-806-8800 | |
|
Date of fiscal year end: | October 31 | |
|
Date of reporting period: | October 31, 2013 | |
| | | | | | | | |
ITEM 1. REPORTS TO STOCKHOLDERS.
The Alger Institutional Funds
ANNUAL REPORT
October 31, 2013
Table of Contents
THE ALGER INSTITUTIONAL FUNDS
Shareholders’ Letter (Unaudited) | - 1 - |
Fund Highlights (Unaudited) | - 10 - |
Portfolio Summary (Unaudited) | - 19 - |
Schedules of Investments | - 20 - |
Statements of Assets and Liabilities | - 45 - |
Statements of Operations | - 49 - |
Statements of Changes in Net Assets | - 53 - |
Financial Highlights | - 57 - |
Notes to Financial Statements | - 68 - |
Report of Independent Registered Public Accounting Firm | - 89 - |
Additional Information (Unaudited) | - 90 - |
Go Paperless With Alger Electronic Delivery Service
Alger is pleased to provide you with the ability to access regulatory materials online. When documents such as prospectuses and annual and semi-annual reports are available, we’ll send you an e-mail notification with a convenient link that will take you directly to the fund information on our website. To sign up for this free service, simply enroll at www.icsdelivery.com/alger.
Shareholders’ Letter | | November 21, 2013 |
Dear Shareholders,
The strong equity rally off of 2009 lows continued during the 12-month period ended October 31, 2013, with the S&P 500 Index generating a 27.18% return. Beyond U.S. borders, the MSCI All Country World Index ex-US returned 20.80% and the MSCI Emerging Markets Index returned 6.90%. In the aftermath of the global financial crisis, we have urged our clients to avoid selling equities during periods of volatility and to use short-term market declines as buying opportunities(1). In doing so, we have reiterated our belief that strong corporate fundamentals rather than fiscal policy and investor emotions are the ultimate driver of long-term equity performance. We have further maintained that corporate fundamentals—which have been strong in the aftermath of the global financial crisis—would continue improving as the U.S. economic expansion is driven by a real estate market recovery, an increase in business spending on fixed equipment, and consumer purchases of more expensive items such as automobiles, appliances, and other home furnishings. At the same time, we have maintained that growth in non-U.S. economies would boost exports and expand operations in other countries. In this shareholder letter, we discuss how those factors have supported equity markets and, more importantly, may provide substantial support to equities in the coming year.
Fiscal and Monetary Policy Drives Volatility
As the 12-month reporting period started, investors grew fearful that Congress would fail to meet a year-end deadline for avoiding the fiscal cliff, or $110 billion in annual budget cuts and the expiration of the Bush tax cuts, the payroll tax holiday, and other tax breaks. Some economists estimated that the spending cuts, combined with the tax hikes, would reduce the nation’s gross domestic product growth by as much as 1.9 percentage points and possibly push the country back into a painful recession. Congress eventually agreed to preserve certain tax cuts while delaying the spending cuts, so that only $85 billion would be trimmed from the 2013 budget, while the full amount of the cuts would apply in 2014 and in later years. Yet, the headwind of spending cuts and higher taxes, while dampening economic growth, fell short of creating a recession, with the Bureau of Economic Analysis reporting that GDP expanded 1.1% and 2.5%, respectively, in the first and second quarters of 2013.
Fiscal policy also captured investors’ attention when political dysfunction over the nation’s debt ceiling and budget caused a government shutdown and fears that the U.S. would default on its debt. Congress and the White House eventually avoided the default with legislation authorizing continued debt issuance until early February, but not before partisan politics resulted in a short-term government shutdown. Investors who used the dysfunction to validate their concerns over the nation’s fiscal health, however, overlooked, in our view, an important point—economic growth, increased tax revenues, and spending cuts are causing the country’s deficit to decline. In January of 2012, the deficit was comparable to 6.8% of GDP. It declined to 4.0% in January of 2013 and is expected to decline to only 3.4% by January of 2014, according to data from the U.S. Census Bureau and Cornerstone Macro LP.
Fiscal policy, of course, wasn’t the only cause of jitters among investors. At times, Federal Reserve officials said that as the economy strengthens, the central bank should be
(1) See Alger Summer 2010 Market Commentary, August 4, 2010.
1
prepared to taper quantitative easing, which entails buying up to $85 billion in debt securities monthly to keep interest rates low. Not surprisingly, the comments fueled market volatility as investors feared the policy change could dampen economic growth by causing interest rates to climb. Fed officials quickly responded by emphasizing that tapering will only occur if the economy appears to be strong enough to continue growing as the stimulus is decreased. They emphasized that additional economic growth must occur prior to tapering and even then the tapering would be done judiciously.
Economy Proves Resilient
Even with tax increases, considerable government spending cuts, and slow GDP growth, many indicators pointed to continued strengthening of the U.S. economy, with the unemployment rate dropping from 7.9% in October of 2012 to 7.2% in September of 2013. Perhaps more impressive were gains in real estate, with the S&P/Case-Shiller 20-City Composite Home Price Index, which measures home prices in 20 metropolitan areas, climbing 12.8% from October of 2012 to August of 2013. In addition, the value of new residential, private-sector construction completed year to date as of August of 2013 climbed 20.5% compared to the same period in 2012, according to the U.S. Census Bureau. Construction completed on lodging climbed 26.6%; offices, 8.5%; and manufacturing facilities, 3.6%. As a result, unemployment has fallen dramatically in the construction industry after having hit a staggering post-financial crisis high of 27.1% (non-seasonally adjusted) in February of 2010. By the start of the reporting period, this rate had already declined to 12.2% and during the reporting period, declined further to a low of 8.5% in September. In another encouraging sign, consumer purchases of higher cost items grew, with sales of luxury cars during the first nine months of 2013 increasing 12% year over year while sales of inexpensive cars climbed 6.1%, according to Autodata Corp.
Corporate Fundamentals Remain Strong
Corporate fundamentals also supported investor enthusiasm. As of the end of 2012, non-financial S&P 500 companies held $1.25 trillion in cash, according to Goldman Sachs. Impressively, corporate cash levels reached $1.30 trillion by June of 2013. Free cash flow also remained strong during the reporting period. It is typically measured as free-cash-flow yield, which is the ratio of a company’s valuation to cash generated from operations that remains after capital expenditures and operating expenses. As of early October, large cap stocks (not including Financials and Utilities) had a free-cash-flow yield of 4.73% compared to the 50-year average of 3.80% (according to research firm Empirical Research Partners).
Investors benefited in many ways from corporations’ strong fundamentals, with companies greatly ramping up their dividends and stock buybacks. For the 12-month period ended in August, Russell 1000 Index companies announced $455 billion in stock buybacks, up 32% year over year. When including dividends, cash returned to investors climbed to $821 billion, exceeding the previous high of $787 billion in 2007, according to J.P. Morgan. We believe that strong business performance is likely to support corporate fundamentals, and we note that revenue growth and strong spending discipline resulted in S&P 500 earnings growing 3.73% year over year during the first quarter of 2013 and 4.04% during the second quarter, according to Goldman Sachs. Based on estimates, third quarter earnings grew 3.41% and fourth quarter earnings are expected to grow 4.63%.
Foreign Countries Generate Strong Gains
Broadly speaking, foreign equity markets generated strong results during the reporting period, with many developed markets producing noteworthy performance. Within the MSCI All Country World Index, Finland, Ireland, Spain, Japan, and the Netherlands were
2
among the top performing developed nations, with each country generating returns in excess of 30%. Even Israel, Canada, and Hong Kong, which were among the worst performing developed markets, still produced positive returns.
Within the MSCI Emerging Markets Index, Poland, Taiwan, and the Philippines performed best with double digit returns that nevertheless trailed U.S. equities as measured by the S&P 500 Index. Peru, Indonesia and Chile were the worst performers and were among a handful of countries with negative returns.
During the reporting period, economic growth in Brazil, Russia, India, and China fell short of expectations, while other countries showed encouraging signs. Japanese businesses reported strong earnings during the final months of the reporting period and the country’s second-quarter GDP growth was revised upward from 2.6% to 3.8%. Land prices during the summer months, meanwhile, increased in 66 of 150 survey areas, according to research firm ISI. In Europe, France emerged from a recession, while economic growth in the United Kingdom and Germany also accelerated. Even Ireland and Portugal showed signs of economic improvement. Broadly speaking, the common outlook for the euro zone became less negative.
Foreign countries continued to buy U.S. products, with American exports—including energy commodities—having increased. Corporations also enjoyed growing foreign demand for services for professional, business, and technical needs. An uptick in royalties and licensing also helped boost U.S. exports. As a result, from November of 2012 to August of 2013, the U.S. exported $1.87 trillion in goods and services, up from $1.82 from November 2011 to August 2012. With U.S. exports growing faster than imports, the country’s trade deficit declined from $464.83 billion during the nine-month period ended in August of 2012 to only $402.59 billion during the same period in 2013.
Reasons for Optimism
We believe that many of the factors that supported investor enthusiasm during the reporting period will continue in 2014 and that equity markets have potential for generating additional gains. On the fiscal front, next year will be the first year in which the full impact of the sequester occurs, with $110 billion in spending cuts in discretionary spending expected. It’s important to note, however, that the cuts are from 2012 spending levels, not 2013, so government spending next year will decline by only $25 billion year over year. The budget cuts, therefore, should have only a minimal, if any, impact on GDP. At the same time, data from Cornerstone Macro shows that finances for many state and local governments have been strengthening, which suggests that the public sector job market may improve. With that in mind, economic forecasts for 2014 are encouraging. J.P. Morgan expects unemployment will decline to 6.8% by the end of 2014 and GDP will grow at a modest but nevertheless positive rate of 2.7% by the end of next year.
Drivers of Economic Growth
We believe that the U.S. housing market recovery will continue, as strong demand for homes exists. Over the past few years, many Americans continued to live with relatives or friends as they felt insecure about the economy and their careers. As the job market improves and the economy strengthens, Americans living with relatives and friends are likely to become more confident in their finances and start shopping for their own homes, which could provide additional support to the ongoing recovery in the real estate market. We note that low interest rates and attractive real estate prices have increased the affordability of houses, which could entice many Americans to become homeowners and then in turn purchase household items, such as furniture and appliances.
3
Existing homeowners, meanwhile, are feeling better about their finances, with their wealth increasing as the values of their homes and equity investments climb, so we think Americans are likely to increase their spending on big ticket items, including cars. Home values and equity investments contributed to Americans’ wealth in 2009, 2010, and 2012, according to J.P. Morgan Chase. Last year was particularly noteworthy, with gains in real estate and stocks totaling $4.4 trillion. The combination of increasing wealth and pent up demand for cars and other items may drive an increase in consumer spending. Automobile data tracker Edmunds.com, for example, points out that the average age of automobiles in 2013 was 11.4 years and that it expects U.S. consumers to purchase 16.4 million cars next year, which would be the highest level since 2006, when 16.5 million cars were purchased.
Corporate Fundamentals in 2014
As noted previously, equity prices were supported during the reporting period by corporations increasing their dividends, conducting stock buybacks, and making acquisitions. With high cash balances and strong cash flow, corporations are likely to continue that trend in 2014. Goldman Sachs expects corporations to increase dividends 10% in 2014. It also estimates that corporations will increase share buybacks by 10% and cash acquisitions by 13%. All of those actions, we believe, will provide considerable support to equities. Corporations, we believe, also have built up demand for new equipment and facilities, and we expect businesses to satisfy that demand in 2014. Spending on such items stayed below 2008 levels until 2011, when S&P 500 companies spent $567 billion on capital expenditures. Capital expenditures increased in 2012 and are expected to reach $649 billion in 2013 and $672 billion in 2014 based on Goldman Sachs estimates. The increased spending, we maintain, will create attractive opportunities for providers of manufacturing equipment and other business tools to continue growing their revenues and further strengthening their fundamentals.
Global Growth may also Support Equities
Corporate fundamentals, increased corporate capital expenditures, a recovering real estate market, and an uptick in consumer spending aren’t the only things that may support the U.S. economy and equities next year. Indeed, global economic growth in 2014 is expected to strengthen, which will provide additional opportunities for U.S. exporters and companies with operations in non-U.S. markets. The International Monetary Fund (IMF) estimates that the global economy will grow 3.6% next year, up from an estimated rate of 2.9% in 2013. Impressively, the IMF says the economies of Italy and Spain are expected to switch from contracting in 2013 to expanding in 2014 and we expect the European Central Bank to continue with its accommodative policy that is providing considerable economic stimulus. Emerging market economies, in aggregate, are also expected to improve, growing 5.1% next year, up from 4.5% in 2013, according IMF estimates. We also believe that growing developed-market economies will increase their imports of products from emerging markets, which should support growth in emerging economies. Global economic expansion, furthermore, is likely to help U.S. companies grow revenues in non-U.S. markets.
The IMF also estimates that world trade volume as a percentage of global GDP is expected to increase from 2.9% to 4.9% in 2014. With ongoing improvements in U.S. energy production and other trends, American corporations are expected to be strong beneficiaries of increased world trade, with J.P. Morgan estimating that our country’s exports will increase 5.9% in 2014.
4
Fiscal and Monetary Policy
Equity investors will have to contend with concerns that Washington may fail to strike an agreement on increasing the nation’s debt ceiling in February and cause a national default on U.S. debt. As dysfunctional as Washington has been, we think such an outcome is unlikely and if it does occur, it would be short lived. Simply put, the consequences of a default would be so severe that we think our elected officials will find some type of resolution to the issue. At the same time, as the U.S. economy strengthens, the unwinding of quantitative easing by the Federal Reserve will become more likely. We think any eventual tapering will be done gradually and with great caution to avoid slamming the breaks on the slow but steady economic recovery.
The Road Ahead
Alger believes that companies undergoing Positive Dynamic Change are likely to experience earnings growth, so they offer strong potential for generating attractive long-term performance. Positive Dynamic Change can include product innovation, demographic trends, new regulations, management team changes, growing product demand, and market dominance. Encouragingly, many of the trends discussed previously, such as a strengthening real estate market, increased capital expenditures, stronger car sales, and growth of non-U.S. markets, are creating Positive Dynamic Change opportunities that can help leading companies generate strong earnings. With that in mind this is an exciting time for our firm and our clients as Alger analysts relentlessly search for companies that can benefit from the many forms of Positive Dynamic Change that are occurring across the globe.
Portfolio Matters
Alger Capital Appreciation Institutional Fund
The Alger Capital Appreciation Institutional Fund returned 29.02% for the fiscal 12-month period ended October 31, 2013, compared to the 28.29% return of the Russell 1000 Growth Index.
During the period, the largest sector weightings were Information Technology and Consumer Discretionary. The largest sector overweight was Financials and the largest sector underweight was Consumer Staples. Relative outperformance in the Information Technology and Financials sectors was the most important contributor to performance, while Consumer Staples and Materials detracted from results.
Among the most important relative contributors were Facebook, Inc.; CVS Caremark Corp.; Morgan Stanley; CBS Corp., Cl. B; and Actavis plc. Later in the reporting period, social network operator Facebook announced second-quarter revenues, margins, and earnings that significantly exceeded consensus expectations, while annual ad revenue growth had accelerated to 61%. The increased use of Facebook via mobile devices and an established track record for mobile device advertising with the company’s website helped Facebook increase ad sales and generate the strong quarterly results.
Conversely, detracting from overall results on a relative basis were Microsoft Corp.; Visa, Inc. Cl. A; Biogen Idec, Inc.; The Home Depot, Inc.; and priceline.com, Inc. During the reporting period, Microsoft generated a positive return; however, the Fund’s holding period resulted in the shares having a negative impact on relative performance.
5
Alger Capital Appreciation Focus Fund
The Alger Capital Appreciation Focus Fund returned 28.84% for the fiscal 12-month period ended October 31, 2013, compared to the 28.29% return of its benchmark, the Russell 1000 Growth Index.
Prior to December 31, 2012, the Alger Capital Appreciation Focus Fund followed different investment strategies under the name “Alger Large Cap Growth Institutional Fund” and was managed by different portfolio managers. Performance prior to December 31, 2012, reflects those management styles and does not reflect the current investment personnel and strategies of the Fund.
During the reporting period, the largest sector weightings were Information Technology and Consumer Discretionary. The largest sector overweight was Financials and the largest sector underweight was Consumer Staples. Relative outperformance in the Financials and Consumer Discretionary sectors was the most important contributor to performance, while Consumer Staples and Health Care detracted from results.
Among the most important relative contributors were Facebook, Inc.; CBS Corp., Cl. B; Morgan Stanley; CVS Caremark Corp.; and Viacom, Inc., Cl. B. Shares of Facebook performed strongly due to reasons described in the Alger Capital Appreciation Institutional Fund description.
Conversely, detracting from overall results on a relative basis were Schlumberger NV; MasterCard, Inc., Cl. A; Visa, Inc., Cl. A; American Express Company; and United Parcel Service, Inc., Cl. B. During the middle of 2013, logistics company United Parcel said overcapacity in the global freight market, slowing U.S. industrial production, and customers’ preferences for less profitable shipping services had caused the company’s earnings to fall below consensus expectations.
Alger Mid Cap Growth Institutional Fund
The Alger Mid Cap Growth Institutional Fund returned 33.41% for the fiscal 12-month period ended October 31, 2013, compared to the 33.93% return of the Russell Midcap Growth Index.
During the reporting period, the largest sector weightings were Consumer Discretionary and Information Technology. The largest sector overweight was Information Technology and the largest sector underweight was Consumer Staples. Relative outperformance in the Information Technology and Materials sectors was the most important contributor to performance, while Consumer Staples and Consumer Discretionary detracted from results.
Among the most important relative contributors were Fifth & Pacific Co., Inc.; CBS Corp., Cl. B; Tenet Healthcare Corp.; Actavis plc; and Pioneer Natural Resources Co. Shares of Facebook performed strongly due to reasons described in the Alger Capital Appreciation Institutional Fund discussion.
Conversely, detracting from overall results on a relative basis were Tesla Motors, Inc.; The Fresh Market, Inc.; The Sherwin-Williams Co.; Charter Communications, Inc., Class A; and Kansas City Southern. Shares of electric car manufacturer Tesla Motors performed strongly during the reporting period, but declined toward the end of the reporting period
6
in reaction to various fires occurring with the company’s cars and concerns over the growth of the company’s earnings. As a result, the shares during the Fund’s holding period had a negative impact on relative performance.
During the reporting period, the Fund purchased options to hedge risk associated with sectors and individual positions. It also wrote options to generate incremental income. The net results of purchasing and writing options had a positive impact on performance.
Alger Small Cap Growth Institutional Fund
The Alger Small Cap Growth Institutional Fund returned 33.71% for the fiscal 12-month period ended October 31, 2013, compared to the 39.84% return of the Russell 2000 Growth Index.
During the period, the largest sector weightings were Information Technology and Health Care. The largest sector overweight was Consumer Discretionary and the largest sector underweight was Industrials. Relative outperformance in the Consumer Discretionary and Materials sectors was the most important contributor to performance, while Health Care and Financials detracted from results.
Among the most important relative contributors were Fifth & Pacific Cos, Inc.; Tenet Healthcare Corp.; The ExOne Co.; Silicon Graphics International Corp.; and Cornerstone OnDemand, Inc. Shares of Facebook performed strongly due to reasons described in the Alger Capital Appreciation Institutional Fund description.
Conversely, detracting from overall results on a relative basis were Volcano Corp.; Cyan, Inc.; Omega Healthcare Investors, Inc.; Energy XXI (Bermuda) Ltd; and Allot Communications Ltd. Shares of Energy XXI performed poorly after the company said pipeline issues and shutting certain wells caused oil production to trail consensus expectations. The company’s oil well operations are located in the Gulf of Mexico.
As always, we strive to deliver consistently superior investment results to you, our shareholders, and we thank you for your business and continued confidence in Alger.
Respectfully submitted, | |

| |
Daniel C. Chung, CFA | |
Chief Investment Officer | |
Investors cannot invest directly in an index. Index performance does not reflect the deduction for fees, expenses or taxes.
This report and the financial statements contained herein are submitted for the general information of shareholders of the Funds. This report is not authorized for distribution to prospective investors in the Funds unless preceded or accompanied by an effective prospectus for the Funds. Fund returns represent the fiscal 12-month period return of Class I shares.
7
The performance data quoted represents past performance, which is not an indication or guarantee of future results.
Standardized performance results can be found on the following pages. The investment return and principal value of an investment in a Fund will fluctuate so that an investor’s shares, when redeemed, may be worth more or less than their original cost. Recent performance has been impacted by an unusually strong period in the U.S. equity market and there is no guarantee that such conditions will be repeated. Current performance may be lower or higher than the performance quoted. For performance data current to the most recent month-end, visit us at www.alger.com, or call us at (800) 992-3863.
The views and opinions of the Funds’ management in this report are as of the date of the Shareholders’ Letter and are subject to change at any time subsequent to this date. There is no guarantee that any of the assumptions that formed the basis for the opinions stated herein are accurate or that they will materialize. Moreover, the information forming the basis for such assumptions is from sources believed to be reliable; however, there is no guarantee that such information is accurate. Any securities mentioned, whether owned in a Fund or otherwise, are considered in the context of the construction of an overall portfolio of securities and therefore reference to them should not be construed as a recommendation or offer to purchase or sell any such security. Inclusion of such securities in a Fund and transactions in such securities, if any, may be for a variety of reasons, including without limitation, in response to cash flows, inclusion in a benchmark, and risk control. The reference to a specific security should also be understood in such context and not viewed as a statement that the security is a significant holding in a Fund. Please refer to the Schedules of Investments for each Fund that is included in this report for a complete list of Fund holdings as of October 31, 2013. Securities mentioned in the Shareholders’ Letter, if not found in the Schedule of Investments, may have been held by the Funds during the 12-month fiscal period.
A Word about Risk
Growth stocks tend to be more volatile than other stocks as the price of growth stocks tends to be higher in relation to their companies’ earnings and may be more sensitive to market, political and economic developments. Investing in the stock market involves gains and losses and may not be suitable for all investors. Stocks of small- and mid-sized companies are subject to greater risk than stocks of larger, more established companies owing to such factors as limited liquidity, inexperienced management, and limited financial resources. Funds that participate in leveraging, such as the Capital Appreciation Institutional Fund, are subject to the risk that borrowing money to leverage will exceed the returns for securities purchased or that the securities purchased may actually go down in value; thus, the Fund’s net asset value can decrease more quickly than if the Fund had not borrowed.
A small investment in derivatives could have a potentially large impact on a Fund’s performance. When purchasing options, the Fund bears the risk that if the market value of the underlying security does not move to a level that would make exercise of the option profitable, the option will expire unexercised. When a call option written by a Fund is exercised, the Fund will not participate in any increase in the underlying security’s value above the exercise price. When a put option written by a Fund is exercised, the Fund will be required to purchase the underlying security at a price in excess of its market value. Use of options on securities indexes is subject to the risk that trading in the options may be interrupted if trading in certain securities included in the index is interrupted, the risk that
8
price movements in the Fund’s portfolio securities may not correlate precisely with movements in the level of an index, and the risk that Fred Alger Management, Inc. may not predict correctly movements in the direction of a particular market or of the stock market generally. Because certain options may require settlement in cash, a Fund may be forced to liquidate portfolio securities to meet settlement obligations. Forward currency contracts are subject to currency exchange rate risks, the risk of non-performance by the contract counterparty, and the risk that Fred Alger Management, Inc. may not predict accurately future foreign exchange rates. For a more detailed discussion of the risks associated with these Funds, please see the Funds’ prospectus.
Before investing, carefully consider a fund’s investment objective, risks, charges, and expenses. For a prospectus containing this and other information about The Alger Institutional Funds call us at (800) 992-3863 or visit us at www.alger.com. Read it carefully before investing.
Fred Alger & Company, Incorporated, Distributor. Member NYSE Euronext, SIPC.
NOT FDIC INSURED. NOT BANK GUARANTEED. MAY LOSE VALUE.
Index Definitions:
· The Morgan Stanley Capital International (MSCI) Emerging Markets Index is a free float-adjusted market capitalization index that is designed to measure equity market performance in the global emerging markets.
· The MSCI ALL COUNTRY WORLD Index ex US is a market capitalization-weighted index designed to provide a broad measure of equity market performance throughout the world, including both developed and emerging markets, but excluding the United States.
· The S&P/Case-Shiller 20-City Composite Home Price Index is an index of housing prices in the U.S.
· The MSCI ALL COUNTRY WORLD Index is a free float-adjust market capitalization weighted index that is designed to measure the equity market performance of developed and emerging markets.
· The Russell 3000 Index measures the performance of the 3,000 largest U.S. companies based on the total market capitalization, which represents 98% of the U.S. Equity Market.
· The Russell 1000 Growth Index is an unmanaged index designed to measure the performance of the largest 1,000 companies in the Russell 3000 Index with higher price-to-book ratios and higher forecasted growth values.
· The Russell Midcap Growth Index measures the performance of the mid-cap segment of the U.S. equity universe. It includes those Russell Midcap Index companies with higher price-to-book ratios and higher forecasted growth values. The Russell Midcap Index measures the performance of the mid-cap segment of the U.S. equity universe.
· The Russell 2000 Growth Index measures the performance of the small-cap growth segment of the U.S. equity universe. It includes those Russell 2000 companies with higher price-to-book ratios and higher forecasted growth values. The Russell 2000 Index measures the performance of the small-cap segment of the U.S. equity universe.
· The S&P 500 Index is an unmanaged index generally representative of the U.S. stock market without regard to company size.
· The Russell 1000 Index measures the performance of the large-cap segment of the U.S. equity universe. It is a subset of the Russell 3000® Index and includes approximately 1000 of the largest securities based on a combination of their market cap and current index membership. The Russell 1000 represents approximately 92% of the U.S. market.
9
FUND PERFORMANCE AS OF 9/30/13 (Unaudited)
AVERAGE ANNUAL TOTAL RETURNS
| | 1
YEAR | | 5
YEARS | | 10
YEARS | | SINCE
INCEPTION | |
Alger Capital Appreciation Class I (Inception 11/8/93) | | 19.95 | % | 13.28 | % | 11.02 | % | 11.70 | % |
Alger Capital Appreciation Class R (Inception 1/27/03)* | | 19.32 | % | 12.71 | % | 10.45 | % | 11.14 | % |
Alger Capital Appreciation Focus Class A (Inception 12/31/12) | | n/a | | n/a | | n/a | | 14.96 | % |
Alger Capital Appreciation Focus Class C (Inception 12/31/12) | | n/a | | n/a | | n/a | | 19.61 | % |
Alger Capital Appreciation Focus Class I (Inception 11/8/93) | | 18.76 | % | 8.51 | % | 6.04 | % | 7.73 | % |
Alger Capital Appreciation Focus Class R (Inception 1/27/03)* | | 16.84 | % | 7.62 | % | 5.35 | % | 7.10 | % |
Alger Capital Appreciation Focus Class Z (Inception 12/31/12) | | n/a | | n/a | | n/a | | 21.63 | % |
Alger Mid Cap Growth Class I (Inception 11/8/93) | | 26.21 | % | 10.11 | % | 7.40 | % | 12.11 | % |
Alger Mid Cap Growth Class R (Inception 1/27/03)* | | 25.61 | % | 9.55 | % | 6.86 | % | 11.56 | % |
Alger Small Cap Growth Class I (Inception 11/8/93) | | 29.47 | % | 12.94 | % | 10.93 | % | 9.72 | % |
Alger Small Cap Growth Class R (Inception 1/27/03)* | | 28.84 | % | 12.40 | % | 10.40 | % | 9.19 | % |
The performance data quoted represents past performance, which is not an indication or a guarantee of future results. The Fund’s average annual total returns include changes in share price and reinvestment of dividends and capital gains.
* Since inception performance is calculated from 11/08/93. Performance figures prior to 1/27/03, inception of Class R shares, are those of the Fund’s Class I Shares. The performance figures prior to 1/27/03 have been adjusted to reflect the higher operating expenses of Class R shares.
10
ALGER CAPITAL APPRECIATION INSTITUTIONAL FUND
Fund Highlights Through October 31, 2013 (Unaudited)
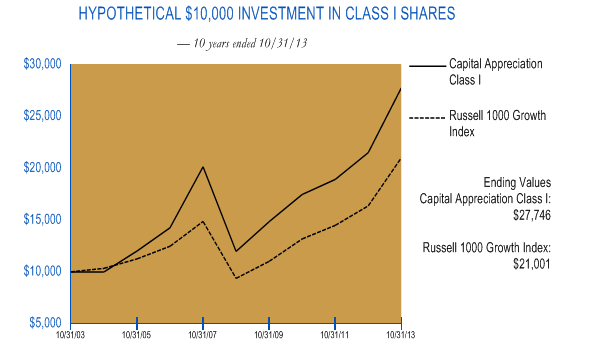
The chart above illustrates the change in value of a hypothetical $10,000 investment made in the Alger Capital Appreciation Institutional Fund Class I shares and the Russell 1000 Growth Index (an unmanaged index of common stocks) for the ten years ended October 31, 2013. Figures for the Alger Capital Appreciation Institutional Fund Class I shares and the Russell 1000 Growth Index include reinvestment of dividends. Performance for the Alger Capital Appreciation Institutional Fund Class R shares may vary from the results shown above due to differences in expenses the class bears. Investors cannot invest directly in any index. Index performance does not reflect deduction for fees, expenses, or taxes.
PERFORMANCE COMPARISON AS OF 10/31/13
AVERAGE ANNUAL TOTAL RETURNS
| | 1 YEAR | | 5 YEARS | | 10 YEARS | | Since
11/8/1993 | |
Class I (Inception 11/8/93) | | 29.02 | % | 18.30 | % | 10.74 | % | 11.90 | % |
Class R (Inception 1/27/03)* | | 28.35 | % | 17.71 | % | 10.19 | % | 11.34 | % |
Russell 1000 Growth Index | | 28.29 | % | 17.51 | % | 7.70 | % | 8.35 | % |
The performance data quoted represents past performance, which is not an indication or a guarantee of future results. The Fund’s average annual total returns include changes in share price and reinvestment of dividends and capital gains. The chart and table above do not reflect the deduction of taxes that a shareholder would have paid on Fund distributions or on the redemption of Fund shares. Investment return and principal will fluctuate and the Fund’s shares, when redeemed, may be worth more or less than their original cost. Current performance may be higher or lower than the performance quoted. For updated performance, visit us at www.alger.com or call us at (800) 992-3863.
* Since inception performance is calculated from 11/08/93. Performance figures prior to 1/27/03, inception of Class R shares, are those of the Fund’s Class I Shares. The performance figures prior to 1/27/03 have been adjusted to reflect the higher operating expenses of Class R shares.
11
ALGER CAPITAL APPRECIATION FOCUS FUND
Fund Highlights Through October 31, 2013 (Unaudited)
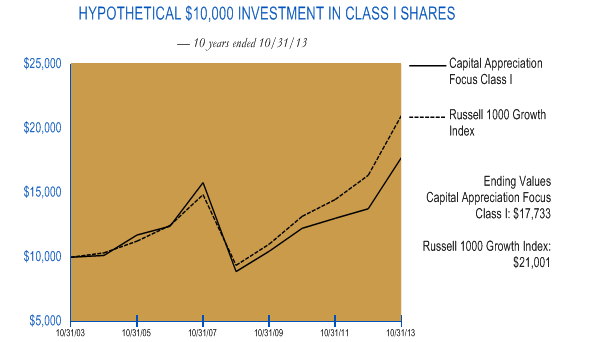
The chart above illustrates the change in value of a hypothetical $10,000 investment made in the Alger Capital Appreciation Focus Fund Class I shares and the Russell 1000 Growth Index (an unmanaged index of common stocks) for the ten years ended October 31, 2013. Beginning December 31, 2012 Alger Capital Appreciation Focus Fund changed its investment strategy to invest a substantial portion of its assets in a small number of issuers, in companies of any market capitalization, and to concentrate its holdings in fewer business sectors or industries. Its previous investment strategy did not concentrate holdings and considered securities with a market capitalization equal to or greater than the companies in the Russell 1000 Growth Index. The figures for the Alger Capital Appreciation Focus Fund Class I shares and the Russell 1000 Growth Index include reinvestment of dividends. Performance for the Alger Capital Appreciation Focus Fund Class A, Class C, Class R and Class Z shares may vary from the results shown above due to differences in expenses the class bears. Investors cannot invest directly in any index. Index performance does not reflect deduction for fees, expenses, or taxes.
PERFORMANCE COMPARISON AS OF 10/31/13
AVERAGE ANNUAL TOTAL RETURNS
| | 1 YEAR | | 5 YEARS | | 10 YEARS | | Since
11/8/1993 | |
Class I (Inception 11/8/93) | | 28.84 | % | 14.81 | % | 5.90 | % | 7.95 | % |
Class R (Inception 1/27/03)* | | 26.61 | % | 13.86 | % | 5.19 | % | 7.32 | % |
Russell 1000 Growth Index | | 28.29 | % | 17.51 | % | 7.70 | % | 8.35 | % |
| | 1 YEAR | | 5 YEARS | | 10 YEARS | | Since
12/31/2012 | |
Class A (Inception 12/31/12) | | n/a | | n/a | | n/a | | 20.50 | % |
Class C (Inception 12/31/12) | | n/a | | n/a | | n/a | | 25.39 | % |
Class Z (Inception 12/31/12) | | n/a | | n/a | | n/a | | 27.55 | % |
Russell 1000 Growth Index | | n/a | | n/a | | n/a | | 26.22 | % |
The performance data quoted represents past performance, which is not an indication or a guarantee of future results. The Fund’s average annual total returns include changes in share price and reinvestment of dividends and capital gains. The chart and table above do not reflect the deduction of taxes that a shareholder would have paid on Fund distributions or on the redemption of Fund shares. Investment return and principal will fluctuate and the Fund’s shares, when redeemed, may be worth more or less than their original cost. Current performance may be higher or lower than the performance quoted. For updated performance, visit us at www.alger.com or call us at (800) 992-3863.
12
* Since inception performance is calculated from 11/08/93. Performance figures prior to 1/27/03, inception of Class R shares, are those of the Fund’s Class I Shares. The performance figures prior to 1/27/03 have been adjusted to reflect the higher operating expenses of Class R shares.
13
ALGER MID CAP GROWTH INSTITUTIONAL FUND
Fund Highlights Through October 31, 2013 (Unaudited)
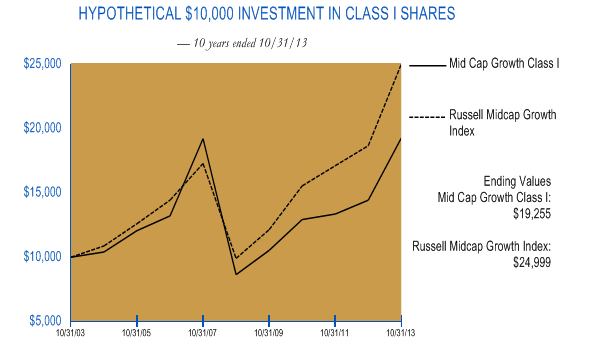
The chart above illustrates the change in value of a hypothetical $10,000 investment made in the Alger Mid Cap Growth Institutional Fund Class I shares and the Russell Midcap Growth Index (an unmanaged index of common stocks) for the ten years ended October 31, 2013. Figures for the Alger Mid Cap Growth Institutional Fund Class I shares and the Russell Midcap Growth Index include reinvestment of dividends. Performance for the Alger Mid Cap Growth Institutional Fund Class R shares may vary from the results shown above due to differences in expenses the class bears. Investors cannot invest directly in any index. Index performance does not reflect deduction for fees, expenses, or taxes.
PERFORMANCE COMPARISON AS OF 10/31/13
AVERAGE ANNUAL TOTAL RETURNS
| | 1 YEAR | | 5 YEARS | | 10 YEARS | | Since
11/8/1993 | |
Class I (Inception 11/8/93) | | 33.41 | % | 17.36 | % | 6.77 | % | 12.21 | % |
Class R (Inception 1/27/03)* | | 32.83 | % | 16.74 | % | 6.24 | % | 11.65 | % |
Russell Midcap Growth Index | | 33.93 | % | 20.32 | % | 9.60 | % | 9.38 | % |
The performance data quoted represents past performance, which is not an indication or a guarantee of future results. The Fund’s average annual total returns include changes in share price and reinvestment of dividends and capital gains. The chart and table above do not reflect the deduction of taxes that a shareholder would have paid on Fund distributions or on the redemption of Fund shares. Investment return and principal will fluctuate and the Fund’s shares, when redeemed, may be worth more or less than their original cost. Current performance may be higher or lower than the performance quoted. For updated performance, visit us at www.alger.com or call us at (800) 992-3863.
* Since inception performance is calculated from 11/08/93. Performance figures prior to 1/27/03, inception of Class R shares, are those of the Fund’s Class I Shares. The performance figures prior to 1/27/03 have been adjusted to reflect the higher operating expenses of Class R shares.
14
ALGER SMALL CAP GROWTH INSTITUTIONAL FUND
Fund Highlights Through October 31, 2013 (Unaudited)
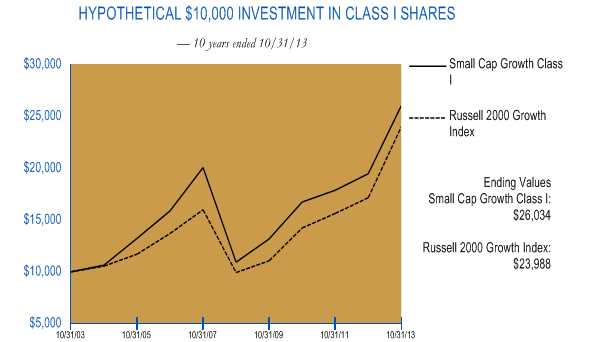
The chart above illustrates the change in value of a hypothetical $10,000 investment made in the Alger Small Cap Growth Institutional Fund Class I shares and the Russell 2000 Growth Index (an unmanaged index of common stocks) for the ten years ended October 31, 2013. The figures for the Alger Small Cap Growth Institutional Fund Class I shares and the Russell 2000 Growth Index include reinvestment of dividends. Performance for the Alger Small Cap Growth Institutional Fund Class R shares may vary from the results shown above due to differences in expenses the class bears. Investors cannot invest directly in any index. Index performance does not reflect deduction for fees, expenses, or taxes.
PERFORMANCE COMPARISON AS OF 10/31/13
AVERAGE ANNUAL TOTAL RETURNS
| | 1 YEAR | | 5 YEARS | | 10 YEARS | | Since
11/8/1993 | |
Class I (Inception 11/8/93) | | 33.71 | % | 18.95 | % | 10.04 | % | 9.72 | % |
Class R (Inception 1/27/03)* | | 33.05 | % | 18.39 | % | 9.52 | % | 9.19 | % |
Russell 2000 Growth Index | | 39.84 | % | 19.27 | % | 9.14 | % | 7.14 | % |
The performance data quoted represents past performance, which is not an indication or a guarantee of future results. The Fund’s average annual total returns include changes in share price and reinvestment of dividends and capital gains. The chart and table above do not reflect the deduction of taxes that a shareholder would have paid on Fund distributions or on the redemption of Fund shares. Investment return and principal will fluctuate and the Fund’s shares, when redeemed, may be worth more or less than their original cost. Current performance may be higher or lower than the performance quoted. For updated performance, visit us at www.alger.com or call us at (800) 992-3863.
* Since inception performance is calculated from 11/08/93. Performance figures prior to 1/27/03, inception of Class R shares, are those of the Fund’s Class I Shares. The performance figures prior to 1/27/03 have been adjusted to reflect the higher operating expenses of Class R shares.
15
PORTFOLIO SUMMARY†
October 31, 2013 (Unaudited)
SECTORS | | Alger Capital
Appreciation Institutional
Fund | | Alger Capital
Appreciation Focus Fund | | Alger Mid Cap Growth
Institutional Fund | | Alger Small Cap Growth
Institutional Fund | |
Consumer Discretionary | | 23.1 | % | 25.3 | % | 26.4 | % | 17.2 | % |
Consumer Staples | | 7.0 | | 5.9 | | 6.3 | | 3.4 | |
Energy | | 5.5 | | 6.2 | | 6.0 | | 4.1 | |
Financials | | 6.6 | | 9.8 | | 6.6 | | 7.7 | |
Health Care | | 15.1 | | 12.2 | | 12.8 | | 19.0 | |
Industrials | | 9.9 | | 10.9 | | 15.2 | | 14.9 | |
Information Technology | | 27.1 | | 24.5 | | 15.8 | | 24.3 | |
Materials | | 2.6 | | 3.4 | | 5.4 | | 4.9 | |
Telecommunication Services | | 0.6 | | 0.0 | | 2.2 | | 1.1 | |
Short-Term Investments and Net Other Assets | | 2.5 | | 1.8 | | 3.3 | | 3.4 | |
| | 100.0 | % | 100.0 | % | 100.0 | % | 100.0 | % |
† Based on net assets for each fund
16
THE ALGER INSTITUTIONAL FUNDS |
ALGER CAPITAL APPRECIATION INSTITUTIONAL FUND
Schedule of Investments‡ October 31, 2013
| | SHARES | | VALUE | |
COMMON STOCKS—95.9% | | | | | |
ADVERTISING—0.5% | | | | | |
Lamar Advertising Co., Cl. A* | | 285,200 | | $ | 13,036,492 | |
| | | | | |
AEROSPACE & DEFENSE—2.6% | | | | | |
Honeywell International, Inc. | | 314,900 | | 27,311,277 | |
The Boeing Co. | | 265,400 | | 34,634,700 | |
| | | | 61,945,977 | |
AIR FREIGHT & LOGISTICS—0.6% | | | | | |
United Parcel Service, Inc., Cl. B | | 146,100 | | 14,352,864 | |
| | | | | |
AIRLINES—0.8% | | | | | |
Copa Holdings SA, Cl. A | | 80,200 | | 11,993,108 | |
Delta Air Lines, Inc. | | 285,400 | | 7,528,852 | |
| | | | 19,521,960 | |
APPAREL ACCESSORIES & LUXURY GOODS—2.3% | | | | | |
Fossil Group, Inc.* | | 52,600 | | 6,677,044 | |
Michael Kors Holdings Ltd.* | | 151,500 | | 11,657,925 | |
PVH Corp. | | 164,920 | | 20,544,084 | |
Ralph Lauren Corp. | | 94,500 | | 15,652,980 | |
| | | | 54,532,033 | |
APPAREL RETAIL—0.5% | | | | | |
L Brands, Inc. | | 180,400 | | 11,294,844 | |
| | | | | |
APPLICATION SOFTWARE—2.0% | | | | | |
Cadence Design Systems, Inc.* | | 1,598,900 | | 20,737,733 | |
Nuance Communications, Inc.* | | 112,000 | | 1,742,720 | |
Salesforce.com, Inc.* | | 346,400 | | 18,483,904 | |
SAP AG# | | 80,100 | | 6,275,835 | |
| | | | 47,240,192 | |
ASSET MANAGEMENT & CUSTODY BANKS—0.3% | | | | | |
Waddell & Reed Financial Inc., Cl. A | | 99,700 | | 6,156,475 | |
| | | | | |
AUTO PARTS & EQUIPMENT—2.0% | | | | | |
BorgWarner, Inc. | | 82,200 | | 8,477,286 | |
Delphi Automotive PLC. | | 383,502 | | 21,936,314 | |
WABCO Holdings, Inc.* | | 212,000 | | 18,164,160 | |
| | | | 48,577,760 | |
AUTOMOBILE MANUFACTURERS—0.9% | | | | | |
General Motors Co.* | | 590,000 | | 21,800,500 | |
| | | | | |
BIOTECHNOLOGY—5.1% | | | | | |
Amgen, Inc. | | 258,200 | | 29,951,200 | |
Biogen Idec, Inc.* | | 63,200 | | 15,432,808 | |
Gilead Sciences, Inc.* | | 770,900 | | 54,726,191 | |
Pharmacyclics, Inc.* | | 102,400 | | 12,148,736 | |
Vertex Pharmaceuticals, Inc.* | | 140,700 | | 10,037,538 | |
| | | | 122,296,473 | |
| | | | | | |
17
| | SHARES | | VALUE | |
COMMON STOCKS—(CONT.) | | | | | |
BROADCASTING—0.9% | | | | | |
CBS Corp., Cl. B | | 352,340 | | $ | 20,837,388 | |
| | | | | |
CABLE & SATELLITE—2.6% | | | | | |
Comcast Corporation, Cl. A | | 666,500 | | 31,712,070 | |
DISH Network Corp. | | 339,100 | | 16,344,620 | |
Time Warner Cable, Inc. | | 120,900 | | 14,526,135 | |
| | | | 62,582,825 | |
CASINOS & GAMING—1.3% | | | | | |
Las Vegas Sands Corp. | | 453,900 | | 31,872,858 | |
| | | | | |
COMMUNICATIONS EQUIPMENT—1.0% | | | | | |
Cisco Systems, Inc. | | 268,200 | | 6,034,500 | |
QUALCOMM, Inc. | | 249,500 | | 17,332,765 | |
| | | | 23,367,265 | |
COMPUTER HARDWARE—5.2% | | | | | |
Apple, Inc. | | 219,776 | | 114,799,994 | |
NCR Corp.* | | 256,100 | | 9,360,455 | |
| | | | 124,160,449 | |
COMPUTER STORAGE & PERIPHERALS—0.7% | | | | | |
SanDisk Corp. | | 168,200 | | 11,689,900 | |
Western Digital Corp. | | 68,300 | | 4,755,729 | |
| | | | 16,445,629 | |
CONSTRUCTION & ENGINEERING—1.5% | | | | | |
Chicago Bridge & Iron Co., NV# | | 202,600 | | 15,010,634 | |
Quanta Services, Inc.* | | 694,700 | | 20,986,887 | |
| | | | 35,997,521 | |
CONSTRUCTION & FARM MACHINERY & HEAVY TRUCKS—0.1% | | | | | |
Cummins, Inc. | | 22,900 | | 2,908,758 | |
| | | | | |
CONSTRUCTION MATERIALS—0.4% | | | | | |
Eagle Materials, Inc. | | 143,600 | | 10,771,436 | |
| | | | | |
CONSUMER FINANCE—0.4% | | | | | |
American Express Co. | | 105,400 | | 8,621,720 | |
| | | | | |
DATA PROCESSING & OUTSOURCED SERVICES—3.1% | | | | | |
Alliance Data Systems Corp.* | | 66,150 | | 15,681,519 | |
MasterCard, Inc. | | 29,997 | | 21,510,849 | |
Visa, Inc., Cl. A | | 187,500 | | 36,875,625 | |
| | | | 74,067,993 | |
DEPARTMENT STORES—0.4% | | | | | |
Macy’s, Inc. | | 214,400 | | 9,885,984 | |
| | | | | |
DISTILLERS & VINTNERS—0.7% | | | | | |
Beam, Inc. | | 240,500 | | 16,185,650 | |
| | | | | |
DIVERSIFIED CHEMICALS—0.9% | | | | | |
Eastman Chemical Co. | | 276,100 | | 21,753,919 | |
| | | | | | |
18
| | SHARES | | VALUE | |
COMMON STOCKS—(CONT.) | | | | | |
DRUG RETAIL—2.0% | | | | | |
CVS Caremark Corp. | | 768,885 | | $ | 47,870,780 | |
| | | | | |
ELECTRICAL COMPONENTS & EQUIPMENT—0.6% | | | | | |
Eaton Corp., PLC. | | 222,188 | | 15,677,585 | |
| | | | | |
GENERAL MERCHANDISE STORES—0.3% | | | | | |
Dollar General Corp.* | | 112,815 | | 6,518,451 | |
| | | | | |
HEALTH CARE EQUIPMENT—1.9% | | | | | |
Covidien PLC. | | 182,040 | | 11,670,584 | |
Insulet Corp.* | | 133,500 | | 5,209,170 | |
St. Jude Medical, Inc. | | 302,000 | | 17,331,780 | |
Zimmer Holdings, Inc. | | 133,200 | | 11,651,004 | |
| | | | 45,862,538 | |
HEALTH CARE FACILITIES—1.9% | | | | | |
HCA Holdings, Inc. | | 903,424 | | 42,587,407 | |
Universal Health Services, Inc., Cl. B | | 45,410 | | 3,658,230 | |
| | | | 46,245,637 | |
HEALTH CARE SERVICES—1.0% | | | | | |
Express Scripts, Inc.* | | 392,500 | | 24,539,100 | |
| | | | | |
HOME IMPROVEMENT RETAIL—3.8% | | | | | |
Lowe’s Companies, Inc. | | 850,200 | | 42,322,956 | |
The Home Depot, Inc. | | 626,400 | | 48,790,296 | |
| | | | 91,113,252 | |
HOMEFURNISHING RETAIL—0.4% | | | | | |
Restoration Hardware Holdings, Inc.* | | 142,800 | | 9,958,872 | |
| | | | | |
HOUSEHOLD PRODUCTS—1.3% | | | | | |
The Procter & Gamble Co. | | 372,800 | | 30,103,600 | |
| | | | | |
HOUSEWARES & SPECIALTIES—0.6% | | | | | |
Jarden Corp.* | | 240,500 | | 13,314,080 | |
| | | | | |
HUMAN RESOURCE & EMPLOYMENT SERVICES—0.5% | | | | | |
Robert Half International, Inc. | | 311,700 | | 12,009,801 | |
| | | | | |
INDUSTRIAL CONGLOMERATES—0.7% | | | | | |
Danaher Corp. | | 232,200 | | 16,739,298 | |
| | | | | |
INDUSTRIAL MACHINERY—0.8% | | | | | |
Ingersoll-Rand PLC. | | 272,500 | | 18,401,925 | |
| | | | | |
INTEGRATED TELECOMMUNICATION SERVICES—0.6% | | | | | |
Verizon Communications, Inc. | | 309,100 | | 15,612,641 | |
| | | | | |
INTERNET RETAIL—3.2% | | | | | |
Amazon.com, Inc.* | | 164,200 | | 59,773,726 | |
priceline.com, Inc.* | | 16,700 | | 17,598,961 | |
| | | | 77,372,687 | |
INTERNET SOFTWARE & SERVICES—9.5% | | | | | |
eBay, Inc.* | | 790,700 | | 41,677,797 | |
Facebook, Inc.* | | 1,130,035 | | 56,795,559 | |
| | | | | | |
19
| | SHARES | | VALUE | |
COMMON STOCKS—(CONT.) | | | | | |
INTERNET SOFTWARE & SERVICES—(CONT.) | | | | | |
Google, Inc., Cl. A* | | 88,610 | | $ | 91,319,694 | |
VistaPrint NV* | | 318,463 | | 17,212,925 | |
Yahoo! Inc.* | | 619,400 | | 20,396,842 | |
| | | | 227,402,817 | |
INVESTMENT BANKING & BROKERAGE—1.4% | | | | | |
Morgan Stanley | | 1,162,650 | | 33,402,935 | |
| | | | | |
IT CONSULTING & OTHER SERVICES—0.7% | | | | | |
International Business Machines Corp. | | 87,600 | | 15,698,796 | |
| | | | | |
LEISURE PRODUCTS—0.0% | | | | | |
BRP, Inc.* | | 48,000 | | 1,289,944 | |
| | | | | |
LIFE & HEALTH INSURANCE—0.6% | | | | | |
Lincoln National Corp. | | 301,400 | | 13,686,574 | |
| | | | | |
LIFE SCIENCES TOOLS & SERVICES—0.9% | | | | | |
Thermo Fisher Scientific, Inc. | | 221,800 | | 21,687,604 | |
| | | | | |
MANAGED HEALTH CARE—0.2% | | | | | |
UnitedHealth Group, Inc. | | 85,800 | | 5,856,708 | |
| | | | | |
MOVIES & ENTERTAINMENT—1.7% | | | | | |
Viacom, Inc., Cl. B | | 482,800 | | 40,212,412 | |
| | | | | |
OFFICE ELECTRONICS—0.2% | | | | | |
Xerox Corp. | | 501,700 | | 4,986,898 | |
| | | | | |
OIL & GAS EQUIPMENT & SERVICES—3.1% | | | | | |
Halliburton Company | | 687,297 | | 36,447,360 | |
National Oilwell Varco, Inc. | | 165,500 | | 13,435,290 | |
Weatherford International Ltd.* | | 1,457,900 | | 23,967,876 | |
| | | | 73,850,526 | |
OIL & GAS EXPLORATION & PRODUCTION—2.4% | | | | | |
Anadarko Petroleum Corp. | | 263,600 | | 25,118,444 | |
Denbury Resources, Inc.* | | 677,300 | | 12,861,927 | |
Laredo Petroleum Holdings, Inc.* | | 257,100 | | 8,168,067 | |
Pioneer Natural Resources Co. | | 61,955 | | 12,687,145 | |
| | | | 58,835,583 | |
OTHER DIVERSIFIED FINANCIAL SERVICES—2.3% | | | | | |
Citigroup, Inc. | | 757,600 | | 36,955,728 | |
JPMorgan Chase & Co. | | 365,800 | | 18,853,332 | |
| | | | 55,809,060 | |
PHARMACEUTICALS—4.1% | | | | | |
Actavis plc.* | | 274,500 | | 42,432,210 | |
Bristol-Myers Squibb Co. | | 362,800 | | 19,054,256 | |
Eli Lilly & Co. | | 213,600 | | 10,641,552 | |
Pfizer, Inc. | | 862,930 | | 26,474,692 | |
| | | | 98,602,710 | |
| | | | | | |
20
| | SHARES | | VALUE | |
COMMON STOCKS—(CONT.) | | | | | |
RESTAURANTS—1.7% | | | | | |
McDonald’s Corp. | | 231,400 | | $ | 22,334,728 | |
Starbucks Corp. | | 129,600 | | 10,504,080 | |
Yum! Brands, Inc. | | 107,100 | | 7,242,102 | |
| | | | 40,080,910 | |
SECURITY & ALARM SERVICES—1.1% | | | | | |
Tyco International Ltd. | | 750,855 | | 27,443,750 | |
| | | | | |
SEMICONDUCTOR EQUIPMENT—1.3% | | | | | |
ASML Holding NV# | | 159,277 | | 15,073,975 | |
Lam Research Corp.* | | 283,200 | | 15,357,936 | |
| | | | 30,431,911 | |
SEMICONDUCTORS—2.2% | | | | | |
Micron Technology, Inc.* | | 729,490 | | 12,897,383 | |
NXP Semiconductor NV* | | 975,000 | | 41,067,000 | |
| | | | 53,964,383 | |
SOFT DRINKS—2.1% | | | | | |
PepsiCo, Inc. | | 400,300 | | 33,661,227 | |
The Coca-Cola Co. | | 426,400 | | 16,872,648 | |
| | | | 50,533,875 | |
SPECIALTY CHEMICALS—1.3% | | | | | |
Rockwood Holdings, Inc. | | 419,355 | | 26,524,204 | |
The Sherwin-Williams Co. | | 30,100 | | 5,658,800 | |
| | | | 32,183,004 | |
SPECIALTY STORES—0.0% | | | | | |
Tiffany & Co. | | 500 | | 39,585 | |
| | | | | |
SYSTEMS SOFTWARE—1.2% | | | | | |
Microsoft Corp. | | 838,475 | | 29,640,091 | |
| | | | | |
TOBACCO—0.9% | | | | | |
Philip Morris International, Inc. | | 253,105 | | 22,556,718 | |
| | | | | |
TRADING COMPANIES & DISTRIBUTORS—0.6% | | | | | |
MRC Global, Inc.* | | 133,700 | | 3,736,915 | |
United Rentals, Inc.* | | 160,000 | | 10,334,400 | |
| | | | 14,071,315 | |
TOTAL COMMON STOCKS
(Cost $1,921,811,389) | | | | 2,303,823,321 | |
| | | | | |
MASTER LIMITED PARTNERSHIP—1.2% | | | | | |
ASSET MANAGEMENT & CUSTODY BANKS—1.2% | | | | | |
Blackstone Group LP. | | 1,064,300 | | 27,969,804 | |
(Cost $19,117,156) | | | | 27,969,804 | |
| | | | | | |
21
| | SHARES | | VALUE | |
REAL ESTATE INVESTMENT TRUST—0.4% | | | | | |
RESIDENTIAL—0.4% | | | | | |
American Homes 4 Rent, Cl. A* | | 601,635 | | $ | 9,313,310 | |
(Cost $9,024,525) | | | | 9,313,310 | |
| | | | | |
Total Investments
(Cost $1,949,953,070)(a) | | 97.5 | % | 2,341,106,435 | |
Other Assets in Excess of Liabilities | | 2.5 | % | 59,747,883 | |
| | | | | |
NET ASSETS | | 100 .0 | % | $ | 2,400,854,318 | |
‡ | | Securities classified as Level 1 for ASC 820 disclosure purposes based on valuation inputs unless otherwise noted. |
* | | Non-income producing security. |
# | | American Depositary Receipts. |
(a) | | At October 31, 2013, the net unrealized appreciation on investments, based on cost for federal income tax purposes of $1,963,875,916, amounted to $377,230,519 which consisted of aggregate gross unrealized appreciation of $398,686,765 and aggregate gross unrealized depreciation of $21,456,246. |
Industry classifications are unaudited.
See Notes to Financial Statements.
22
THE ALGER INSTITUTIONAL FUNDS | ALGER CAPITAL APPRECIATION FOCUS FUND
Schedule of Investments‡ October 31, 2013
| | SHARES | | VALUE | |
COMMON STOCKS—94.8% | | | | | |
AEROSPACE & DEFENSE—4.5% | | | | | |
Honeywell International, Inc. | | 3,990 | | $ | 346,053 | |
The Boeing Co. | | 3,260 | | 425,430 | |
| | | | 771,483 | |
AIRLINES—1.8% | | | | | |
Copa Holdings SA, Cl. A | | 1,990 | | 297,585 | |
| | | | | |
APPAREL ACCESSORIES & LUXURY GOODS—3.3% | | | | | |
PVH Corp. | | 3,240 | | 403,607 | |
Ralph Lauren Corp. | | 900 | | 149,076 | |
| | | | 552,683 | |
APPLICATION SOFTWARE—2.5% | | | | | |
Cadence Design Systems, Inc.* | | 17,910 | | 232,293 | |
Salesforce.com, Inc.* | | 3,470 | | 185,159 | |
| | | | 417,452 | |
AUTO PARTS & EQUIPMENT—4.0% | | | | | |
Delphi Automotive PLC. | | 4,970 | | 284,284 | |
WABCO Holdings, Inc.* | | 4,530 | | 388,130 | |
| | | | 672,414 | |
BIOTECHNOLOGY—2.9% | | | | | |
Gilead Sciences, Inc.* | | 7,000 | | 496,930 | |
| | | | | |
BROADCASTING—1.4% | | | | | |
CBS Corp., Cl. B | | 4,110 | | 243,065 | |
| | | | | |
CABLE & SATELLITE—2.2% | | | | | |
Comcast Corporation, Cl. A | | 7,880 | | 374,930 | |
| | | | | |
CASINOS & GAMING—1.9% | | | | | |
Las Vegas Sands Corp. | | 4,650 | | 326,523 | |
| | | | | |
COMPUTER HARDWARE—4.9% | | | | | |
Apple, Inc. | | 1,603 | | 837,327 | |
| | | | | |
CONSTRUCTION & ENGINEERING—2.5% | | | | | |
Chicago Bridge & Iron Co., NV# | | 1,840 | | 136,326 | |
Quanta Services, Inc.* | | 9,430 | | 284,880 | |
| | | | 421,206 | |
DATA PROCESSING & OUTSOURCED SERVICES—2.8% | | | | | |
Visa, Inc., Cl. A | | 2,460 | | 483,808 | |
| | | | | |
DIVERSIFIED CHEMICALS—1.0% | | | | | |
Eastman Chemical Co. | | 2,140 | | 168,611 | |
| | | | | |
DRUG RETAIL—2.6% | | | | | |
CVS Caremark Corp. | | 7,060 | | 439,556 | |
| | | | | |
HEALTH CARE EQUIPMENT—0.7% | | | | | |
St. Jude Medical, Inc. | | 1,990 | | 114,206 | |
| | | | | |
HEALTH CARE FACILITIES—2.7% | | | | | |
HCA Holdings, Inc. | | 9,600 | | 452,544 | |
| | | | | |
HEALTH CARE SERVICES—1.2% | | | | | |
Express Scripts, Inc.* | | 3,200 | | 200,064 | |
| | | | | | |
23
| | SHARES | | VALUE | |
COMMON STOCKS—(CONT.) | | | | | |
HOME IMPROVEMENT RETAIL—5.0% | | | | | |
Lowe’s Companies, Inc. | | 7,110 | | $ | 353,936 | |
The Home Depot, Inc. | | 6,290 | | 489,928 | |
| | | | 843,864 | |
HOUSEHOLD PRODUCTS—1.6% | | | | | |
The Procter & Gamble Co. | | 3,300 | | 266,475 | |
| | | | | |
INTERNET RETAIL—3.0% | | | | | |
Amazon.com, Inc.* | | 1,420 | | 516,923 | |
| | | | | |
INTERNET SOFTWARE & SERVICES—11.5% | | | | | |
eBay, Inc.* | | 7,040 | | 371,078 | |
Facebook, Inc.* | | 9,020 | | 453,345 | |
Google, Inc., Cl. A* | | 740 | | 762,629 | |
VistaPrint NV* | | 4,240 | | 229,172 | |
Yahoo! Inc.* | | 3,890 | | 128,098 | |
| | | | 1,944,322 | |
INVESTMENT BANKING & BROKERAGE—2.6% | | | | | |
Morgan Stanley | | 15,390 | | 442,155 | |
| | | | | |
MOVIES & ENTERTAINMENT—3.1% | | | | | |
Viacom, Inc., Cl. B | | 6,400 | | 533,056 | |
| | | | | |
OIL & GAS EQUIPMENT & SERVICES—4.1% | | | | | |
Halliburton Company | | 8,106 | | 429,861 | |
Weatherford International Ltd.* | | 16,470 | | 270,767 | |
| | | | 700,628 | |
OIL & GAS EXPLORATION & PRODUCTION—2.1% | | | | | |
Anadarko Petroleum Corp. | | 2,160 | | 205,827 | |
Pioneer Natural Resources Co. | | 740 | | 151,537 | |
| | | | 357,364 | |
OTHER DIVERSIFIED FINANCIAL SERVICES—3.8% | | | | | |
Citigroup, Inc. | | 9,430 | | 459,995 | |
JPMorgan Chase & Co. | | 3,500 | | 180,390 | |
| | | | 640,385 | |
PHARMACEUTICALS—4.7% | | | | | |
Actavis plc.* | | 2,890 | | 446,736 | |
Eli Lilly & Co. | | 2,270 | | 113,092 | |
Pfizer, Inc. | | 7,752 | | 237,831 | |
| | | | 797,659 | |
RESTAURANTS—1.4% | | | | | |
McDonald’s Corp. | | 2,470 | | 238,404 | |
| | | | | |
SECURITY & ALARM SERVICES—2.1% | | | | | |
Tyco International Ltd. | | 9,620 | | 351,611 | |
| | | | | |
SEMICONDUCTORS—2.8% | | | | | |
Micron Technology, Inc.* | | 5,560 | | 98,301 | |
NXP Semiconductor NV* | | 8,780 | | 369,813 | |
| | | | 468,114 | |
| | | | | | |
24
| | SHARES | | VALUE | |
COMMON STOCKS—(CONT.) | | | | | |
SOFT DRINKS—1.7% | | | | | |
PepsiCo, Inc. | | 3,380 | | $ | 284,224 | |
| | | | | |
SPECIALTY CHEMICALS—2.4% | | | | | |
Rockwood Holdings, Inc. | | 6,380 | | 403,535 | |
| | | | | |
TOTAL COMMON STOCKS
(Cost $13,931,908) | | | | 16,059,106 | |
| | | | | |
MASTER LIMITED PARTNERSHIP—3.4% | | | | | |
ASSET MANAGEMENT & CUSTODY BANKS—3.4% | | | | | |
Blackstone Group LP. | | 21,760 | | 571,853 | |
(Cost $456,736) | | | | 571,853 | |
| | | | | |
Total Investments
(Cost $14,388,644)(a) | | 98 .2 | % | 16,630,959 | |
Other Assets in Excess of Liabilities | | 1.8 | % | 309,900 | |
NET ASSETS | | 100.0 | % | $ | 16,940,859 | |
‡ | | Securities classified as Level 1 for ASC 820 disclosure purposes based on valuation inputs unless otherwise noted. |
* | | Non-income producing security. |
# | | American Depositary Receipts. |
(a) | | At October 31, 2013, the net unrealized appreciation on investments, based on cost for federal income tax purposes of $14,381,642, amounted to $2,249,317 which consisted of aggregate gross unrealized appreciation of $2,310,955 and aggregate gross unrealized depreciation of $61,638. |
Industry classifications are unaudited.
See Notes to Financial Statements.
25
THE ALGER INSTITUTIONAL FUNDS | ALGER MID CAP GROWTH INSTITUTIONAL FUND
Schedule of Investments‡ October 31, 2013
| | SHARES | | VALUE | |
COMMON STOCKS—95.0% | | | | | |
AEROSPACE & DEFENSE—1.2% | | | | | |
B/E Aerospace, Inc.* | | 15,900 | | $ | 1,290,444 | |
TransDigm Group, Inc. | | 6,100 | | 887,001 | |
| | | | 2,177,445 | |
AIRLINES—2.0% | | | | | |
Copa Holdings SA, Cl. A | | 12,600 | | 1,884,204 | |
Delta Air Lines, Inc. | | 66,200 | | 1,746,356 | |
| | | | 3,630,560 | |
ALTERNATIVE CARRIERS—1.0% | | | | | |
Cogent Communications Group, Inc. | | 51,200 | | 1,798,656 | |
| | | | | |
APPAREL ACCESSORIES & LUXURY GOODS—3.6% | | | | | |
Fifth & Pacific Cos, Inc.* | | 57,900 | | 1,533,771 | |
Michael Kors Holdings Ltd.* | | 14,000 | | 1,077,300 | |
PVH Corp. | | 16,000 | | 1,993,120 | |
Ralph Lauren Corp. | | 12,000 | | 1,987,680 | |
| | | | 6,591,871 | |
APPAREL RETAIL—1.9% | | | | | |
L Brands, Inc. | | 23,800 | | 1,490,118 | |
Ross Stores, Inc. | | 26,100 | | 2,018,835 | |
| | | | 3,508,953 | |
APPLICATION SOFTWARE—1.5% | | | | | |
Autodesk, Inc.* | | 15,100 | | 602,641 | |
Cadence Design Systems, Inc.* | | 60,200 | | 780,794 | |
Nuance Communications, Inc.* | | 32,300 | | 502,588 | |
Synchronoss Technologies, Inc.* | | 23,900 | | 827,418 | |
| | | | 2,713,441 | |
ASSET MANAGEMENT & CUSTODY BANKS—1.7% | | | | | |
Affiliated Managers Group, Inc.* | | 5,500 | | 1,085,920 | |
SEI Investments, Co. | | 33,000 | | 1,095,270 | |
Waddell & Reed Financial Inc., Cl. A | | 15,200 | | 938,600 | |
| | | | 3,119,790 | |
AUTO PARTS & EQUIPMENT—2.5% | | | | | |
BorgWarner, Inc. | | 12,300 | | 1,268,499 | |
Delphi Automotive PLC. | | 32,550 | | 1,861,860 | |
WABCO Holdings, Inc.* | | 15,500 | | 1,328,040 | |
| | | | 4,458,399 | |
AUTOMOBILE MANUFACTURERS—0.3% | | | | | |
Tesla Motors, Inc.* | | 3,700 | | 591,778 | |
| | | | | |
BIOTECHNOLOGY—5.4% | | | | | |
Alexion Pharmaceuticals, Inc.* | | 18,300 | | 2,249,985 | |
BioMarin Pharmaceutical, Inc.* | | 29,300 | | 1,840,626 | |
Idenix Pharmaceuticals, Inc.* | | 163,159 | | 536,793 | |
Medivation, Inc.* | | 16,900 | | 1,011,634 | |
Portola Pharmaceuticals, Inc.* | | 47,900 | | 1,060,985 | |
| | | | | | |
26
| | SHARES | | VALUE | |
COMMON STOCKS—(CONT.) | | | | | |
BIOTECHNOLOGY—(CONT.) | | | | | |
Regeneron Pharmaceuticals, Inc.* | | 7,200 | | $ | 2,070,720 | |
Theravance, Inc.* | | 19,700 | | 721,808 | |
Vertex Pharmaceuticals, Inc.* | | 5,000 | | 356,700 | |
| | | | 9,849,251 | |
BROADCASTING—1.9% | | | | | |
CBS Corp., Cl. B | | 42,600 | | 2,519,364 | |
Sinclair Broadcast Group, Inc., CL. A | | 29,600 | | 948,976 | |
| | | | 3,468,340 | |
BUILDING PRODUCTS—1.2% | | | | | |
Lennox International, Inc. | | 27,800 | | 2,170,068 | |
| | | | | |
CABLE & SATELLITE—2.3% | | | | | |
AMC Networks, Inc.* | | 13,000 | | 911,170 | |
DISH Network Corp. | | 33,000 | | 1,590,600 | |
Liberty Global, Inc., Cl. A* | | 20,400 | | 1,598,748 | |
| | | | 4,100,518 | |
CASINOS & GAMING—1.9% | | | | | |
Melco Crown Entertainment Ltd.#* | | 18,700 | | 620,092 | |
MGM Resorts International* | | 97,500 | | 1,856,400 | |
Wynn Resorts Ltd. | | 5,800 | | 964,250 | |
| | | | 3,440,742 | |
COMMUNICATIONS EQUIPMENT—0.6% | | | | | |
ARRIS Group, Inc.* | | 55,800 | | 996,588 | |
| | | | | |
COMPUTER & ELECTRONICS RETAIL—0.7% | | | | | |
Best Buy Co., Inc. | | 27,400 | | 1,172,720 | |
| | | | | |
COMPUTER HARDWARE—0.6% | | | | | |
NCR Corp.* | | 27,800 | | 1,016,090 | |
| | | | | |
COMPUTER STORAGE & PERIPHERALS—1.3% | | | | | |
SanDisk Corp. | | 14,600 | | 1,014,700 | |
Western Digital Corp. | | 18,400 | | 1,281,192 | |
| | | | 2,295,892 | |
CONSTRUCTION & ENGINEERING—0.6% | | | | | |
Quanta Services, Inc.* | | 34,400 | | 1,039,224 | |
| | | | | |
CONSTRUCTION & FARM MACHINERY & HEAVY TRUCKS—0.5% | | | | | |
Oshkosh Corp.* | | 17,700 | | 842,343 | |
| | | | | |
CONSTRUCTION MATERIALS—0.8% | | | | | |
Eagle Materials, Inc. | | 19,900 | | 1,492,699 | |
| | | | | |
DATA PROCESSING & OUTSOURCED SERVICES—3.3% | | | | | |
Alliance Data Systems Corp.* | | 10,600 | | 2,512,836 | |
Fiserv, Inc.* | | 19,200 | | 2,010,816 | |
Paychex, Inc. | | 35,100 | | 1,483,326 | |
| | | | 6,006,978 | |
DEPARTMENT STORES—0.8% | | | | | |
Macy’s, Inc. | | 31,800 | | 1,466,298 | |
| | | | | | |
27
| | SHARES | | VALUE | |
COMMON STOCKS—(CONT.) | | | | | |
DISTILLERS & VINTNERS—1.3% | | | | | |
Beam, Inc. | | 34,800 | | $ | 2,342,040 | |
| | | | | |
DISTRIBUTORS—0.7% | | | | | |
LKQ Corp.* | | 36,400 | | 1,202,292 | |
| | | | | |
DIVERSIFIED CHEMICALS—2.2% | | | | | |
Eastman Chemical Co. | | 23,100 | | 1,820,049 | |
PPG Industries, Inc. | | 12,100 | | 2,209,218 | |
| | | | 4,029,267 | |
ELECTRICAL COMPONENTS & EQUIPMENT—1.5% | | | | | |
Eaton Corp., PLC. | | 24,000 | | 1,693,440 | |
Hubbell Inc., Cl. B | | 9,900 | | 1,064,646 | |
| | | | 2,758,086 | |
ELECTRONIC EQUIPMENT MANUFACTURERS—0.5% | | | | | |
OSI Systems, Inc.* | | 13,300 | | 968,772 | |
| | | | | |
ENVIRONMENTAL & FACILITIES SERVICES—0.8% | | | | | |
Stericycle, Inc.* | | 12,700 | | 1,475,740 | |
| | | | | |
FOOD RETAIL—0.9% | | | | | |
Whole Foods Market, Inc. | | 24,300 | | 1,534,059 | |
| | | | | |
GENERAL MERCHANDISE STORES—1.0% | | | | | |
Dollar General Corp.* | | 30,850 | | 1,782,513 | |
| | | | | |
HEALTH CARE EQUIPMENT—1.6% | | | | | |
CR Bard, Inc. | | 9,300 | | 1,266,846 | |
Edwards Lifesciences Corp.* | | 13,600 | | 886,584 | |
Thoratec Corp.* | | 18,200 | | 786,058 | |
| | | | 2,939,488 | |
HEALTH CARE SERVICES—1.0% | | | | | |
Catamaran Corp.* | | 27,010 | | 1,268,390 | |
DaVita HealthCare Partners, Inc.* | | 8,900 | | 500,269 | |
| | | | 1,768,659 | |
HEALTH CARE TECHNOLOGY—0.5% | | | | | |
Cerner Corp.* | | 17,200 | | 963,716 | |
| | | | | |
HOME FURNISHING RETAIL—0.6% | | | | | |
Bed Bath & Beyond, Inc.* | | 13,900 | | 1,074,748 | |
| | | | | |
HOME IMPROVEMENT RETAIL—0.3% | | | | | |
Lumber Liquidators Holdings, Inc.* | | 4,200 | | 479,598 | |
| | | | | |
HOMEBUILDING—0.6% | | | | | |
Lennar Corp., Cl. A | | 30,700 | | 1,091,385 | |
| | | | | |
HOMEFURNISHING RETAIL—0.7% | | | | | |
Restoration Hardware Holdings, Inc.* | | 19,100 | | 1,332,034 | |
| | | | | |
HOUSEWARES & SPECIALTIES—1.4% | | | | | |
Jarden Corp.* | | 45,000 | | 2,491,200 | |
| | | | | |
HUMAN RESOURCE & EMPLOYMENT SERVICES—0.6% | | | | | |
Robert Half International, Inc. | | 29,100 | | 1,121,223 | |
| | | | | | |
28
| | SHARES | | VALUE | |
COMMON STOCKS—(CONT.) | | | | | |
INDUSTRIAL MACHINERY—1.7% | | | | | |
Ingersoll-Rand PLC. | | 34,200 | | $ | 2,309,526 | |
Pall Corp. | | 9,700 | | 781,044 | |
| | | | 3,090,570 | |
INSURANCE BROKERS—0.8% | | | | | |
Aon PLC. | | 19,280 | | 1,524,855 | |
| | | | | |
INTERNET RETAIL—0.6% | | | | | |
TripAdvisor, Inc.* | | 13,400 | | 1,108,314 | |
| | | | | |
INTERNET SOFTWARE & SERVICES—2.2% | | | | | |
Cornerstone OnDemand, Inc.* | | 28,800 | | 1,364,256 | |
LinkedIn Corp.* | | 2,100 | | 469,707 | |
OpenTable, Inc.* | | 12,000 | | 833,760 | |
VistaPrint NV* | | 24,290 | | 1,312,874 | |
| | | | 3,980,597 | |
LEISURE FACILITIES—0.8% | | | | | |
Six Flags Entertainment Corp. | | 39,300 | | 1,478,073 | |
| | | | | |
LIFE & HEALTH INSURANCE—0.8% | | | | | |
Lincoln National Corp. | | 33,000 | | 1,498,530 | |
| | | | | |
LIFE SCIENCES TOOLS & SERVICES—0.9% | | | | | |
Charles River Laboratories International, Inc.* | | 18,800 | | 925,148 | |
Illumina, Inc.* | | 7,700 | | 720,027 | |
| | | | 1,645,175 | |
METAL & GLASS CONTAINERS—0.9% | | | | | |
Owens-Illinois, Inc.* | | 53,700 | | 1,707,123 | |
| | | | | |
OFFICE ELECTRONICS—0.5% | | | | | |
Xerox Corp. | | 84,900 | | 843,906 | |
| | | | | |
OFFICE SERVICES & SUPPLIES—0.8% | | | | | |
West Corp. | | 62,100 | | 1,367,442 | |
| | | | | |
OIL & GAS EQUIPMENT & SERVICES—1.8% | | | | | |
Cameron International Corp.*^ | | 32,250 | | 1,769,235 | |
Superior Energy Services, Inc.*^ | | 56,300 | | 1,510,529 | |
| | | | 3,279,764 | |
OIL & GAS EXPLORATION & PRODUCTION—3.2% | | | | | |
Cabot Oil & Gas Corp.^ | | 41,700 | | 1,472,844 | |
Denbury Resources, Inc.* | | 87,200 | | 1,655,928 | |
Pioneer Natural Resources Co. | | 10,600 | | 2,170,668 | |
Rosetta Resources, Inc.*^ | | 3,700 | | 221,778 | |
Whiting Petroleum Corp.*^ | | 4,400 | | 294,316 | |
| | | | 5,815,534 | |
OIL & GAS REFINING & MARKETING—1.0% | | | | | |
HollyFrontier Corp.^ | | 23,700 | | 1,091,622 | |
Tesoro Corp.^ | | 14,900 | | 728,461 | |
| | | | 1,820,083 | |
| | | | | | |
29
| | SHARES | | VALUE | |
COMMON STOCKS—(CONT.) | | | | | |
PACKAGED FOODS & MEATS—2.9% | | | | | |
ConAgra Foods, Inc. | | 95,000 | | $ | 3,021,950 | |
The Hershey Co. | | 23,100 | | 2,292,444 | |
| | | | 5,314,394 | |
PHARMACEUTICALS—3.4% | | | | | |
Actavis plc.* | | 20,600 | | 3,184,348 | |
Mylan, Inc.* | | 26,900 | | 1,018,703 | |
Zoetis, Inc. | | 60,500 | | 1,915,430 | |
| | | | 6,118,481 | |
REAL ESTATE SERVICES—0.5% | | | | | |
Jones Lang LaSalle, Inc. | | 9,400 | �� | 894,880 | |
| | | | | |
RESEARCH & CONSULTING SERVICES—1.3% | | | | | |
CoStar Group, Inc.* | | 5,800 | | 1,026,542 | |
Verisk Analytics, Inc., Cl. A* | | 18,900 | | 1,295,028 | |
| | | | 2,321,570 | |
RESTAURANTS—1.8% | | | | | |
Chipotle Mexican Grill, Inc.* | | 2,800 | | 1,475,516 | |
Dunkin’ Brands Group, Inc. | | 36,100 | | 1,721,248 | |
| | | | 3,196,764 | |
SECURITY & ALARM SERVICES—1.0% | | | | | |
Tyco International Ltd. | | 51,800 | | 1,893,290 | |
| | | | | |
SEMICONDUCTOR EQUIPMENT—1.0% | | | | | |
Lam Research Corp.* | | 34,900 | | 1,892,627 | |
| | | | | |
SEMICONDUCTORS—2.6% | | | | | |
Micron Technology, Inc.* | | 54,000 | | 954,720 | |
Microsemi Corp.* | | 68,600 | | 1,723,918 | |
NXP Semiconductor NV* | | 46,300 | | 1,950,156 | |
| | | | 4,628,794 | |
SPECIALIZED FINANCE—1.1% | | | | | |
IntercontinentalExchange, Inc.* | | 4,500 | | 867,285 | |
Moody’s Corp. | | 15,600 | | 1,102,296 | |
| | | | 1,969,581 | |
SPECIALTY CHEMICALS—1.5% | | | | | |
Rockwood Holdings, Inc. | | 34,800 | | 2,201,100 | |
The Sherwin-Williams Co. | | 2,300 | | 432,400 | |
| | | | 2,633,500 | |
SPECIALTY STORES—2.0% | | | | | |
Tiffany & Co. | | 24,698 | | 1,955,341 | |
Tractor Supply Co. | | 22,900 | | 1,633,915 | |
| | | | 3,589,256 | |
SYSTEMS SOFTWARE—1.7% | | | | | |
Check Point Software Technologies Ltd.* | | 13,800 | | 800,676 | |
CommVault Systems, Inc.* | | 7,600 | | 593,408 | |
| | | | | | |
30
| | SHARES | | VALUE | |
COMMON STOCKS—(CONT.) | | | | | |
SYSTEMS SOFTWARE—(CONT.) | | | | | |
ServiceNow, Inc.* | | 31,200 | | $ | 1,703,832 | |
| | | | 3,097,916 | |
TOBACCO—1.2% | | | | | |
Lorillard, Inc. | | 41,600 | | 2,122,016 | |
| | | | | |
TRADING COMPANIES & DISTRIBUTORS—2.0% | | | | | |
United Rentals, Inc.* | | 26,100 | | 1,685,799 | |
WW Grainger, Inc. | | 7,200 | | 1,936,584 | |
| | | | 3,622,383 | |
WIRELESS TELECOMMUNICATION SERVICES—1.2% | | | | | |
Crown Castle International Corp.* | | 28,900 | | 2,196,978 | |
| | | | | |
TOTAL COMMON STOCKS
(Cost $150,582,836) | | | | 171,955,860 | |
| | | | | |
MASTER LIMITED PARTNERSHIP—1.2% | | | | | |
INVESTMENT BANKING & BROKERAGE—1.2% | | | | | |
Apollo Global Management LLC. | | 66,000 | | 2,129,160 | |
(Cost $1,868,028) | | | | 2,129,160 | |
| | | | | |
REAL ESTATE INVESTMENT TRUST—0.5% | | | | | |
RESIDENTIAL—0.5% | | | | | |
American Homes 4 Rent, Cl. A* | | 57,500 | | 890,100 | |
(Cost $862,500) | | | | 890,100 | |
| | | | | |
| | CONTRACTS | | | |
PURCHASED OPTIONS—0.0% | | | | | |
PUT OPTIONS—0.0% | | | | | |
Hess Corp./ November/ 75*,~ | | 222 | | 4,440 | |
Hess Corp./ November/ 80*,~ | | 211 | | 17,724 | |
SM Energy Co./ November/ 75*,~(L2) | | 64 | | 640 | |
TOTAL PUT OPTIONS
(Cost $56,800) | | | | 22,804 | |
| | | | | |
CALL OPTIONS—0.0% | | | | | |
Superior Energy Services, Inc./ November/ 27.5*^(L2) | | 100 | | 2,500 | |
(Cost $4,110) | | | | 2,500 | |
| | | | | |
TOTAL PURCHASED OPTIONS
(Cost $60,910) | | | | 25,304 | |
Total Investments
(Cost $153,374,274)(a) | | 96.7 | % | 175,000,424 | |
Other Assets in Excess of Liabilities | | 3.3 | % | 5,989,586 | |
NET ASSETS | | 100.0 | % | $ | 180,990,010 | |
31
‡ | | Securities classified as Level 1 for ASC 820 disclosure purposes based on valuation inputs unless otherwise noted. |
* | | Non-income producing security. |
# | | American Depositary Receipts. |
^ | | All or a portion of this security has been pledged as collateral for written call options. |
~ | | All or a portion of this security has been pledged as collateral for written put options. |
(L2) | | Security classified as Level 2 for ASC 820 disclosure purposes based on valuation inputs. |
(a) | | At October 31, 2013, the net unrealized appreciation on investments, based on cost for federal income tax purposes of $153,870,800, amounted to $21,129,624 which consisted of aggregate gross unrealized appreciation of $25,080,163 and aggregate gross unrealized depreciation of $3,950,539. |
32
| | CONTRACTS | | SHARES
SUBJECT
TO PUT/
CALL | | VALUE | |
PUT OPTIONS WRITTEN | | | | | | | |
Cabot Oil & Gas Corp./ December/ 37.5 | | (33 | ) | (3,300 | ) | $ | (9,405 | ) |
Cabot Oil & Gas Corp./ December/ 40 | | (39 | ) | (3,900 | ) | (20,592 | ) |
Cameron International Corp./ November/ 55 | | (33 | ) | (3,300 | ) | (3,795 | ) |
Cameron International Corp./ November/ 60 | | (33 | ) | (3,300 | ) | (16,764 | ) |
Cameron International Corp./ November/ 65(L2) | | (80 | ) | (8,000 | ) | (80,000 | ) |
Cameron International Corp./ November/ 67.5(L2) | | (97 | ) | (9,700 | ) | (117,370 | ) |
Cobalt International Energy, Inc./ November/ 25 | | (64 | ) | (6,400 | ) | (12,800 | ) |
Cobalt International Energy, Inc./ November/ 27.5(L2) | | (48 | ) | (4,800 | ) | (20,640 | ) |
Ensco PLC/ November/ 55 | | (33 | ) | (3,300 | ) | (495 | ) |
Ensco PLC/ November/ 57.5 | | (32 | ) | (3,200 | ) | (2,720 | ) |
Ensco PLC/ November/ 60(L2) | | (48 | ) | (4,800 | ) | (10,560 | ) |
Hess Corp./ November/ 70 | | (50 | ) | (5,000 | ) | (350 | ) |
Hess Corp./ November/ 72.5 | | (97 | ) | (9,700 | ) | (873 | ) |
Hess Corp./ November/ 77.5 | | (241 | ) | (24,100 | ) | (7,471 | ) |
Hess Corp./ November/ 82.5 | | (130 | ) | (13,000 | ) | (26,910 | ) |
HollyFrontier Corp./ November/ 45 | | (33 | ) | (3,300 | ) | (2,310 | ) |
HollyFrontier Corp./ November/ 46 | | (32 | ) | (3,200 | ) | (3,680 | ) |
HollyFrontier Corp./ November/ 47 | | (32 | ) | (3,200 | ) | (4,320 | ) |
HollyFrontier Corp./ November/ 48 | | (16 | ) | (1,600 | ) | (3,120 | ) |
Rosetta Resources, Inc./ November/ 55(L2) | | (25 | ) | (2,500 | ) | (1,000 | ) |
SM Energy Co./ November/ 70 | | (31 | ) | (3,100 | ) | (155 | ) |
SM Energy Co./ November/ 80(L2) | | (49 | ) | (4,900 | ) | (980 | ) |
SM Energy Co./ November/ 85 | | (33 | ) | (3,300 | ) | (3,300 | ) |
Superior Energy Services, Inc./ November/ 27.5(L2) | | (129 | ) | (12,900 | ) | (11,610 | ) |
Tesoro Corp./ November/ 50 | | (16 | ) | (1,600 | ) | (3,472 | ) |
Weatherford International Ltd/ November/ 16 | | (94 | ) | (9,400 | ) | (3,290 | ) |
Weatherford International Ltd/ November/ 17 | | (94 | ) | (9,400 | ) | (8,460 | ) |
Whiting Petroleum Corp./ November/ 62.5 | | (147 | ) | (14,700 | ) | (6,615 | ) |
Whiting Petroleum Corp./ November/ 65 | | (98 | ) | (9,800 | ) | (11,760 | ) |
Whiting Petroleum Corp./ November/ 67.5 | | (113 | ) | (11,300 | ) | (22,487 | ) |
Whiting Petroleum Corp./ November/ 70 | | (43 | ) | (4,300 | ) | (18,017 | ) |
TOTAL PUT OPTIONS WRITTEN
(Premiums Received $(476,800)) | | | | | | (435,321 | ) |
CALL OPTIONS WRITTEN | | | | | | | |
Cabot Oil & Gas Corp./ December/ 32.5 | | (32 | ) | (3,200 | ) | (9,888 | ) |
Cabot Oil & Gas Corp./ December/ 35 | | (40 | ) | (4,000 | ) | (6,800 | ) |
Cabot Oil & Gas Corp./ November/ 35 | | (32 | ) | (3,200 | ) | (3,360 | ) |
Cameron International Corp./ November/ 60 | | (27 | ) | (2,700 | ) | (297 | ) |
Cameron International Corp./ November/ 62.5 | | (32 | ) | (3,200 | ) | (320 | ) |
HollyFrontier Corp./ November/ 41 | | (65 | ) | (6,500 | ) | (35,945 | ) |
HollyFrontier Corp./ November/ 42 | | (32 | ) | (3,200 | ) | (14,496 | ) |
| | | | | | | | |
33
| | CONTRACTS | | SHARES
SUBJECT
TO PUT/
CALL | | VALUE | |
CALL OPTIONS WRITTEN | | | | | | | |
HollyFrontier Corp./ November/ 43 | | (31 | ) | (3,100 | ) | $ | (10,788 | ) |
HollyFrontier Corp./ November/ 44 | | (31 | ) | (3,100 | ) | (8,835 | ) |
HollyFrontier Corp./ November/ 45 | | (78 | ) | (7,800 | ) | (15,210 | ) |
Rosetta Resources, Inc./ November/ 50(L2) | | (25 | ) | (2,500 | ) | (24,750 | ) |
Superior Energy Services, Inc./ November/ 22.5(L2) | | (63 | ) | (6,300 | ) | (24,570 | ) |
Superior Energy Services, Inc./ November/ 25 | | (284 | ) | (28,400 | ) | (51,120 | ) |
Tesoro Corp./ November/ 44(L2) | | (33 | ) | (3,300 | ) | (17,325 | ) |
Tesoro Corp./ November/ 46 | | (65 | ) | (6,500 | ) | (25,350 | ) |
Tesoro Corp./ November/ 47 | | (33 | ) | (3,300 | ) | (10,230 | ) |
Tesoro Corp./ November/ 48 | | (16 | ) | (1,600 | ) | (4,208 | ) |
Whiting Petroleum Corp./ November/ 65 | | (43 | ) | (4,300 | ) | (11,825 | ) |
TOTAL CALL OPTIONS WRITTEN
(Premiums Received $(226,400)) | | | | | | (275,317 | ) |
| | | | | | | |
TOTAL OPTIONS WRITTEN
(Premiums Received $(703,200)) | | | | | | $ | (710,638 | ) |
(‡) | Securities classified as Level 1 for ASC 820 disclosure purposes based on valuation inputs unless otherwise noted. |
(L2) | Security classified as Level 2 for ASC 820 disclosure purposes based on valuation inputs. |
Industry classifications are unaudited.
See Notes to Financial Statements.
34
THE ALGER INSTITUTIONAL FUNDS | ALGER SMALL CAP GROWTH INSTITUTIONAL FUND
Schedule of Investments‡ October 31, 2013
| | SHARES | | VALUE | |
COMMON STOCKS—93.8% | | | | | |
AEROSPACE & DEFENSE—1.4% | | | | | |
Esterline Technologies Corp.* | | 50,325 | | $ | 4,034,052 | |
Hexcel Corp.* | | 220,250 | | 9,318,778 | |
| | | | 13,352,830 | |
AIR FREIGHT & LOGISTICS—0.9% | | | | | |
HUB Group, Inc., Cl. A* | | 242,950 | | 8,923,554 | |
| | | | | |
AIRLINES—0.6% | | | | | |
Alaska Air Group, Inc. | | 77,200 | | 5,454,952 | |
| | | | | |
ALTERNATIVE CARRIERS—1.1% | | | | | |
Cogent Communications Group, Inc. | | 304,450 | | 10,695,328 | |
| | | | | |
APPAREL ACCESSORIES & LUXURY GOODS—1.2% | | | | | |
Fifth & Pacific Cos, Inc.* | | 446,100 | | 11,817,189 | |
| | | | | |
APPAREL RETAIL—2.0% | | | | | |
ANN, Inc.* | | 220,600 | | 7,800,416 | |
DSW, Inc., Cl. A | | 80,750 | | 7,079,353 | |
The Children’s Place Retail Stores, Inc.* | | 93,250 | | 5,090,517 | |
| | | | 19,970,286 | |
APPLICATION SOFTWARE—3.9% | | | | | |
Aspen Technology, Inc.* | | 282,950 | | 10,817,179 | |
BroadSoft, Inc.* | | 135,114 | | 4,420,930 | |
Cadence Design Systems, Inc.* | | 541,900 | | 7,028,443 | |
Synchronoss Technologies, Inc.* | | 264,200 | | 9,146,604 | |
Ultimate Software Group, Inc.* | | 46,850 | | 7,237,388 | |
| | | | 38,650,544 | |
ASSET MANAGEMENT & CUSTODY BANKS—1.4% | | | | | |
Financial Engines, Inc. | | 165,400 | | 9,240,898 | |
WisdomTree Investments, Inc.* | | 312,852 | | 4,348,643 | |
| | | | 13,589,541 | |
AUTO PARTS & EQUIPMENT—1.5% | | | | | |
American Axle & Manufacturing Holdings, Inc.* | | 318,550 | | 5,928,215 | |
Dana Holding Corp. | | 109,900 | | 2,154,040 | |
Tenneco, Inc.* | | 118,700 | | 6,299,409 | |
| | | | 14,381,664 | |
BIOTECHNOLOGY—6.0% | | | | | |
ACADIA Pharmaceuticals, Inc.* | | 231,650 | | 5,265,404 | |
Acorda Therapeutics, Inc.* | | 169,050 | | 5,174,620 | |
Aegerion Pharmaceuticals, Inc.* | | 52,150 | | 4,319,063 | |
Alkermes PLC.* | | 257,700 | | 9,068,463 | |
Celldex Therapeutics, Inc.* | | 139,100 | | 3,186,781 | |
Cepheid, Inc.* | | 188,150 | | 7,661,468 | |
Cubist Pharmaceuticals, Inc.* | | 120,950 | | 7,498,900 | |
Orexigen Therapeutics, Inc.* | | 581,000 | | 2,835,280 | |
Portola Pharmaceuticals, Inc.* | | 176,650 | | 3,912,798 | |
Synageva BioPharma Corp.* | | 99,200 | | 5,039,360 | |
| | | | | | |
35
| | SHARES | | VALUE | |
COMMON STOCKS—(CONT.) | | | | | |
BIOTECHNOLOGY—(CONT.) | | | | | |
Theravance, Inc.* | | 134,850 | | $ | 4,940,904 | |
| | | | 58,903,041 | |
BROADCASTING—1.0% | | | | | |
Nexstar Broadcasting Group, Inc. | | 211,350 | | 9,381,827 | |
| | | | | |
BUILDING PRODUCTS—1.2% | | | | | |
AO Smith Corp. | | 234,350 | | 12,104,178 | |
| | | | | |
COMMUNICATIONS EQUIPMENT—2.7% | | | | | |
ARRIS Group, Inc.* | | 301,000 | | 5,375,860 | |
Aruba Networks, Inc.* | | 428,550 | | 8,039,598 | |
Finisar Corp.* | | 291,400 | | 6,705,114 | |
Ruckus Wireless, Inc.* | | 438,800 | | 6,362,600 | |
| | | | 26,483,172 | |
CONSTRUCTION & ENGINEERING—0.8% | | | | | |
Primoris Services Corp. | | 320,450 | | 8,344,518 | |
| | | | | |
CONSTRUCTION MATERIALS—0.9% | | | | | |
Eagle Materials, Inc. | | 123,250 | | 9,244,982 | |
| | | | | |
CONSUMER FINANCE—0.6% | | | | | |
Portfolio Recovery Associates, Inc.* | | 104,800 | | 6,230,360 | |
| | | | | |
DATA PROCESSING & OUTSOURCED SERVICES—2.0% | | | | | |
MAXIMUS, Inc. | | 193,050 | | 9,353,273 | |
WEX, Inc.* | | 113,535 | | 10,598,492 | |
| | | | 19,951,765 | |
EDUCATION SERVICES—1.1% | | | | | |
Grand Canyon Education, Inc.* | | 233,400 | | 11,032,818 | |
| | | | | |
ELECTRICAL COMPONENTS & EQUIPMENT—1.0% | | | | | |
Acuity Brands, Inc. | | 99,900 | | 10,040,949 | |
| | | | | |
ELECTRONIC COMPONENTS—0.4% | | | | | |
Belden, Inc. | | 53,900 | | 3,625,314 | |
| | | | | |
ELECTRONIC EQUIPMENT MANUFACTURERS—2.4% | | | | | |
Cognex Corp. | | 160,100 | | 5,003,125 | |
Control4 Corp.* | | 139,150 | | 2,289,017 | |
FEI Co. | | 82,150 | | 7,317,922 | |
OSI Systems, Inc.* | | 116,800 | | 8,507,712 | |
| | | | 23,117,776 | |
FOOD DISTRIBUTORS—1.0% | | | | | |
United Natural Foods, Inc.* | | 136,414 | | 9,746,780 | |
| | | | | |
FOOD RETAIL—0.5% | | | | | |
The Fresh Market, Inc.* | | 93,150 | | 4,742,267 | |
| | | | | |
FOOTWEAR—0.5% | | | | | |
Wolverine World Wide, Inc. | | 84,050 | | 4,853,047 | |
| | | | | |
FOREST PRODUCTS—0.8% | | | | | |
Louisiana-Pacific Corp.* | | 448,000 | | 7,620,480 | |
| | | | | | |
36
| | SHARES | | VALUE | |
COMMON STOCKS—(CONT.) | | | | | |
HEALTH CARE EQUIPMENT—3.4% | | | | | |
Insulet Corp.* | | 293,250 | | $ | 11,442,615 | |
NxStage Medical, Inc.* | | 382,050 | | 5,069,803 | |
Thoratec Corp.* | | 172,550 | | 7,452,435 | |
Wright Medical Group, Inc.* | | 335,521 | | 9,116,106 | |
| | | | 33,080,959 | |
HEALTH CARE FACILITIES—1.0% | | | | | |
Healthsouth Corp. | | 284,300 | | 9,981,773 | |
| | | | | |
HEALTH CARE SERVICES—1.1% | | | | | |
Team Health Holdings, Inc.* | | 246,500 | | 10,707,960 | |
| | | | | |
HEALTH CARE SUPPLIES—2.3% | | | | | |
Align Technology, Inc.* | | 172,800 | | 9,859,968 | |
Endologix, Inc.* | | 554,200 | | 10,014,394 | |
TearLab Corp.* | | 228,600 | | 2,384,298 | |
| | | | 22,258,660 | |
HEALTH CARE TECHNOLOGY—1.5% | | | | | |
athenahealth, Inc.* | | 69,150 | | 9,232,216 | |
HMS Holdings Corp.* | | 248,400 | | 5,248,692 | |
| | | | 14,480,908 | |
HOME FURNISHINGS—0.3% | | | | | |
Ethan Allen Interiors, Inc. | | 105,700 | | 2,815,848 | |
| | | | | |
HOME IMPROVEMENT RETAIL—1.1% | | | | | |
Lumber Liquidators Holdings, Inc.* | | 56,350 | | 6,434,606 | |
Tile Shop Holdings, Inc.* | | 177,250 | | 3,957,993 | |
| | | | 10,392,599 | |
HOMEBUILDING—0.7% | | | | | |
Taylor Morrison Home Corp., Cl. A* | | 309,650 | | 6,886,616 | |
| | | | | |
HOMEFURNISHING RETAIL—0.9% | | | | | |
Pier 1 Imports, Inc. | | 428,450 | | 8,946,036 | |
| | | | | |
HUMAN RESOURCE & EMPLOYMENT SERVICES—1.2% | | | | | |
On Assignment, Inc.* | | 347,050 | | 11,726,820 | |
| | | | | |
INDUSTRIAL MACHINERY—5.0% | | | | | |
Actuant Corp., Cl. A | | 259,460 | | 9,745,318 | |
Chart Industries, Inc.* | | 53,000 | | 5,695,910 | |
Middleby Corp.* | | 38,750 | | 8,821,437 | |
RBC Bearings, Inc.* | | 87,550 | | 6,022,565 | |
The ExOne Co.* | | 158,950 | | 8,158,903 | |
Watts Water Technologies, Inc. | | 180,900 | | 10,452,402 | |
| | | | 48,896,535 | |
INTERNET SOFTWARE & SERVICES—6.9% | | | | | |
Cornerstone OnDemand, Inc.* | | 201,230 | | 9,532,265 | |
DealerTrack Holdings, Inc.* | | 247,850 | | 9,244,805 | |
Demandware, Inc.* | | 140,250 | | 6,935,362 | |
E2open, Inc.* | | 310,350 | | 6,982,875 | |
| | | | | | |
37
| | SHARES | | VALUE | |
COMMON STOCKS—(CONT.) | | | | | |
INTERNET SOFTWARE & SERVICES—(CONT.) | | | | | |
Millennial Media, Inc.* | | 339,700 | | $ | 2,388,091 | |
OpenTable, Inc.* | | 98,100 | | 6,815,988 | |
SPS Commerce, Inc.* | | 52,400 | | 3,571,060 | |
Textura Corp.* | | 150,550 | | 5,770,582 | |
Trulia, Inc.* | | 206,950 | | 8,271,792 | |
VistaPrint NV* | | 149,450 | | 8,077,772 | |
| | | | 67,590,592 | |
INVESTMENT BANKING & BROKERAGE—0.3% | | | | | |
FXCM, Inc. | | 153,400 | | 2,514,226 | |
| | | | | |
IT CONSULTING & OTHER SERVICES—1.1% | | | | | |
InterXion Holding NV* | | 280,850 | | 6,307,891 | |
ServiceSource International, Inc.* | | 395,450 | | 4,278,769 | |
| | | | 10,586,660 | |
LEISURE FACILITIES—1.8% | | | | | |
Life Time Fitness, Inc.* | | 167,995 | | 7,630,333 | |
Six Flags Entertainment Corp. | | 273,800 | | 10,297,618 | |
| | | | 17,927,951 | |
LEISURE PRODUCTS—1.0% | | | | | |
Brunswick Corp. | | 207,700 | | 9,373,501 | |
| | | | | |
LIFE SCIENCES TOOLS & SERVICES—1.2% | | | | | |
Charles River Laboratories International, Inc.* | | 149,550 | | 7,359,355 | |
PAREXEL International Corp.* | | 99,442 | | 4,545,494 | |
| | | | 11,904,849 | |
MANAGED HEALTH CARE—0.8% | | | | | |
Molina Healthcare, Inc.* | | 236,400 | | 7,479,696 | |
| | | | | |
METAL & GLASS CONTAINERS—0.6% | | | | | |
Berry Plastics Group, Inc.* | | 313,350 | | 6,292,068 | |
| | | | | |
MOVIES & ENTERTAINMENT—0.8% | | | | | |
Lions Gate Entertainment Corp.* | | 225,750 | | 7,806,435 | |
| | | | | |
OIL & GAS EQUIPMENT & SERVICES—0.6% | | | | | |
Bristow Group, Inc. | | 70,350 | | 5,661,064 | |
| | | | | |
OIL & GAS EXPLORATION & PRODUCTION—3.5% | | | | | |
Approach Resources, Inc.* | | 169,950 | | 4,784,092 | |
Berry Petroleum Co., Cl. A | | 145,390 | | 6,942,373 | |
Kodiak Oil & Gas Corp.* | | 374,750 | | 4,860,507 | |
Nothern Oil and Gas, Inc.* | | 544,750 | | 8,950,243 | |
Rosetta Resources, Inc.* | | 137,650 | | 8,250,741 | |
| | | | 33,787,956 | |
PACKAGED FOODS & MEATS—1.9% | | | | | |
B&G Foods, Inc. | | 265,650 | | 8,992,252 | |
Hain Celestial Group, Inc.* | | 114,817 | | 9,556,219 | |
| | | | 18,548,471 | |
| | | | | | |
38
| | SHARES | | VALUE | |
COMMON STOCKS—(CONT.) | | | | | |
PHARMACEUTICALS—1.7% | | | | | |
Auxilium Pharmaceuticals, Inc.* | | 235,100 | | $ | 4,046,071 | |
Questcor Pharmaceuticals, Inc. | | 99,900 | | 6,130,863 | |
ViroPharma, Inc.* | | 156,900 | | 6,090,858 | |
| | | | 16,267,792 | |
REAL ESTATE SERVICES—0.8% | | | | | |
Jones Lang LaSalle, Inc. | | 78,600 | | 7,482,720 | |
| | | | | |
REGIONAL BANKS—1.0% | | | | | |
Synovus Financial Corp. | | 3,175,850 | | 10,321,513 | |
| | | | | |
RESEARCH & CONSULTING SERVICES—1.0% | | | | | |
CoStar Group, Inc.* | | 57,405 | | 10,160,111 | |
| | | | | |
RESTAURANTS—1.8% | | | | | |
Buffalo Wild Wings, Inc.* | | 50,350 | | 7,178,903 | |
Domino’s Pizza, Inc. | | 156,700 | | 10,508,302 | |
| | | | 17,687,205 | |
SEMICONDUCTORS—3.4% | | | | | |
Applied Micro Circuits Corporation* | | 412,200 | | 4,806,252 | |
Cypress Semiconductor Corp. | | 653,900 | | 6,068,192 | |
Intersil Corp. | | 458,650 | | 5,118,534 | |
Microsemi Corp.* | | 395,350 | | 9,935,145 | |
Semtech Corp.* | | 231,550 | | 7,203,521 | |
| | | | 33,131,644 | |
SPECIALIZED CONSUMER SERVICES—0.6% | | | | | |
Sotheby’s | | 113,200 | | 5,875,080 | |
| | | | | |
SPECIALTY CHEMICALS—2.6% | | | | | |
Chemtura Corp.* | | 378,350 | | 9,269,575 | |
Cytec Industries, Inc. | | 93,300 | | 7,752,297 | |
PolyOne Corp. | | 268,700 | | 8,141,610 | |
| | | | 25,163,482 | |
SPECIALTY STORES—0.9% | | | | | |
Five Below, Inc.* | | 182,540 | | 8,809,380 | |
| | | | | |
SYSTEMS SOFTWARE—1.5% | | | | | |
CommVault Systems, Inc.* | | 111,950 | | 8,741,056 | |
Cyan, Inc.* | | 309,250 | | 1,456,568 | |
FleetMatics Group PLC.* | | 154,650 | | 4,910,137 | |
| | | | 15,107,761 | |
THRIFTS & MORTGAGE FINANCE—0.8% | | | | | |
MGIC Investment Corp.* | | 913,100 | | 7,432,634 | |
| | | | | |
TRADING COMPANIES & DISTRIBUTORS—0.8% | | | | | |
Beacon Roofing Supply, Inc.* | | 224,650 | | 7,797,601 | |
| | | | | |
TRUCKING—1.0% | | | | | |
Swift Transportation Co.* | | 470,150 | | 10,244,569 | |
| | | | | |
TOTAL COMMON STOCKS
(Cost $689,115,934) | | | | 917,388,837 | |
| | | | | | |
39
| | SHARES | | VALUE | |
MASTER LIMITED PARTNERSHIP—0.9% | | | | | |
ASSET MANAGEMENT & CUSTODY BANKS—0.9% | | | | | |
Fortress Investment Group LLC, Cl. A | | 1,069,112 | | $ | 8,820,174 | |
(Cost $6,176,569) | | | | 8,820,174 | |
| | | | | |
REAL ESTATE INVESTMENT TRUST—1.9% | | | | | |
OFFICE—0.7% | | | | | |
Dupont Fabros Technology, Inc. | | 295,450 | | 7,341,932 | |
| | | | | |
RESIDENTIAL—0.4% | | | | | |
American Homes 4 Rent, Cl. A* | | 249,350 | | 3,859,938 | |
| | | | | |
SPECIALIZED—0.8% | | | | | |
Sovran Self Storage, Inc. | | 101,150 | | 7,736,964 | |
| | | | | |
TOTAL REAL ESTATE INVESTMENT TRUST
(Cost $18,778,082) | | | | 18,938,834 | |
| | | | | |
Total Investments
(Cost $714,070,585)(a) | | 96 .6 | % | 945,147,845 | |
Other Assets in Excess of Liabilities | | 3 .4 | % | 32,427,761 | |
| | | | | |
NET ASSETS | | 100 .0 | % | $ | 977,575,606 | |
‡ | Securities classified as Level 1 for ASC 820 disclosure purposes based on valuation inputs unless otherwise noted. |
* | Non-income producing security. |
(a) | At October 31, 2013, the net unrealized appreciation on investments, based on cost for federal income tax purposes of $719,199,659, amounted to $225,948,186 which consisted of aggregate gross unrealized appreciation of $245,925,939 and aggregate gross unrealized depreciation of $19,977,753. |
Industry classifications are unaudited.
See Notes to Financial Statements.
40
THE ALGER INSTITUTIONAL FUNDS
Statement of Assets and Liabilities October 31, 2013
| | Alger Capital
Appreciation
Institutional Fund | | Alger Capital
Appreciation Focus
Fund | |
ASSETS: | | | | | |
Investments in securities, at value (Identified cost below)* see accompanying schedules of investments | | $ | 2,341,106,435 | | $ | 16,630,959 | |
Cash and cash equivalents | | 87,935,479 | | 624,379 | |
Receivable for investment securities sold | | 48,001,850 | | 303,966 | |
Receivable for shares of beneficial interest sold | | 5,454,982 | | 50,223 | |
Dividends and interest receivable | | 1,690,902 | | 11,396 | |
Receivable from Investment Manager | | — | | 13,577 | |
Prepaid expenses | | 47,121 | | 52,902 | |
Total Assets | | 2,484,236,769 | | 17,687,402 | |
| | | | | |
LIABILITIES: | | | | | |
Payable for investment securities purchased | | 77,199,200 | | 651,477 | |
Payable for shares of beneficial interest redeemed | | 3,181,554 | | 35,972 | |
Accrued investment advisory fees | | 1,563,936 | | 9,977 | |
Accrued transfer agent fees | | 509,566 | | 6,998 | |
Accrued distribution fees | | 182,681 | | 3,520 | |
Accrued administrative fees | | 54,668 | | 386 | |
Accrued shareholder servicing fees | | 496,983 | | 2,382 | |
Accrued shareholder administrative fees | | 19,879 | | 169 | |
Accrued other expenses | | 173,984 | | 35,662 | |
Total Liabilities | | 83,382,451 | | 746,543 | |
NET ASSETS | | $ | 2,400,854,318 | | $ | 16,940,859 | |
| | | | | |
NET ASSETS CONSIST OF: | | | | | |
Paid in capital (par value of $.001 per share) | | 1,727,292,110 | | 20,901,763 | |
Undistributed net investment income (accumulated loss) | | 1,214,116 | | (43,080 | ) |
Undistributed net realized gain (accumulated realized loss) | | 281,194,728 | | (6,160,139 | ) |
Net unrealized appreciation on investments | | 391,153,364 | | 2,242,315 | |
NET ASSETS | | $ | 2,400,854,318 | | $ | 16,940,859 | |
* Identified cost | | $ | 1,949,953,070 | | $ | 14,388,644 | |
See Notes to Financial Statements.
41
| | Alger Capital
Appreciation
Institutional Fund | | Alger Capital
Appreciation Focus
Fund | |
NET ASSETS BY CLASS: | | | | | |
Class A | | $ | — | | $ | 3,496,498 | |
Class C | | $ | — | | $ | 1,912,943 | |
Class I | | $ | 1,958,404,838 | | $ | 8,684,188 | |
Class R | | $ | 442,449,480 | | $ | 2,719,669 | |
Class Z | | $ | — | | $ | 127,561 | |
| | | | | |
SHARES OF BENEFICIAL INTEREST OUTSTANDING — NOTE 6: | | | | | |
Class A | | — | | 187,035 | |
Class C | | — | | 102,973 | |
Class I | | 69,420,221 | | 464,014 | |
Class R | | 16,614,371 | | 154,099 | |
Class Z | | — | | 6,803 | |
| | | | | |
NET ASSET VALUE PER SHARE: | | | | | |
Class A — Net Asset Value Per Share | | $ | — | | $ | 18.69 | |
Class A — Offering Price Per Share
(includes a 5.25% sales charge) | | $ | — | | $ | 19.73 | |
Class C — Net Asset Value Per Share | | $ | — | | $ | 18.58 | |
Class I — Net Asset Value Per Share | | $ | 28.21 | | $ | 18.72 | |
Class R — Net Asset Value Per Share | | $ | 26.63 | | $ | 17.65 | |
Class Z — Net Asset Value Per Share | | $ | — | | $ | 18.75 | |
See Notes to Financial Statements.
42
| | Alger Mid Cap Growth
Institutional Fund | | Alger Small Cap
Growth Institutional
Fund | |
ASSETS: | | | | | |
Investments in securities, at value (Identified cost below)* see accompanying schedules of investments | | $ | 175,000,424 | | $ | 945,147,845 | |
Cash and cash equivalents (a) | | 6,549,286 | | 36,701,580 | |
Receivable for investment securities sold | | 5,494,511 | | 11,885,348 | |
Receivable for shares of beneficial interest sold | | 274,657 | | 1,674,432 | |
Dividends and interest receivable | | 91,922 | | 87,638 | |
Prepaid expenses | | 14,834 | | 37,912 | |
Total Assets | | 187,425,634 | | 995,534,755 | |
| | | | | |
LIABILITIES: | | | | | |
Payable for investment securities purchased | | 4,082,062 | | 14,913,423 | |
Payable for shares of beneficial interest redeemed | | 534,558 | | 1,558,437 | |
Bank overdraft | | 768,418 | | — | |
Written options outstanding § | | 710,638 | | — | |
Accrued investment advisory fees | | 116,893 | | 677,362 | |
Accrued transfer agent fees | | 92,217 | | 381,802 | |
Accrued distribution fees | | 10,018 | | 18,212 | |
Accrued administrative fees | | 4,230 | | 22,997 | |
Accrued shareholder servicing fees | | 38,452 | | 209,064 | |
Accrued shareholder administrative fees | | 1,538 | | 8,363 | |
Accrued other expenses | | 76,600 | | 169,489 | |
Total Liabilities | | 6,435,624 | | 17,959,149 | |
NET ASSETS | | $ | 180,990,010 | | $ | 977,575,606 | |
| | | | | |
NET ASSETS CONSIST OF: | | | | | |
Paid in capital (par value of $.001 per share) | | 483,714,704 | | 588,462,649 | |
Undistributed net investment income (accumulated loss) | | (662,996 | ) | 7,347 | |
Undistributed net realized gain (accumulated realized loss) | | (323,680,411 | ) | 158,028,350 | |
Net unrealized appreciation on investments | | 21,618,713 | | 231,077,260 | |
NET ASSETS | | $ | 180,990,010 | | $ | 977,575,606 | |
* Identified cost | | $ | 153,374,274 | | $ | 714,070,585 | |
§ Written options premiums received | | $ | 703,198 | | $ | — | |
(a) Includes restricted cash held as collateral for written options | | $ | 6,549,286 | | $ | — | |
See Notes to Financial Statements.
43
| | Alger Mid Cap Growth
Institutional Fund | | Alger Small Cap
Growth Institutional
Fund | |
NET ASSETS BY CLASS: | | | | | |
Class I | | $ | 157,390,990 | | $ | 936,553,441 | |
Class R | | $ | 23,599,020 | | $ | 41,022,165 | |
| | | | | |
SHARES OF BENEFICIAL INTEREST OUTSTANDING — NOTE 6: | | | | | |
Class I | | 8,100,235 | | 27,969,509 | |
Class R | | 1,292,633 | | 1,299,147 | |
| | | | | |
NET ASSET VALUE PER SHARE: | | | | | |
Class I — Net Asset Value Per Share | | $ | 19.43 | | $ | 33.48 | |
Class R — Net Asset Value Per Share | | $ | 18.26 | | $ | 31.58 | |
See Notes to Financial Statements.
44
THE ALGER INSTITUTIONAL FUNDS
Statement of Operations For the year ended October 31, 2013
| | Alger Capital
Appreciation
Institutional Fund | | Alger Capital
Appreciation
Focus Fund | |
| | | | | |
INCOME: | | | | | |
Dividends (net of foreign withholding taxes*) | | $ | 38,353,093 | | $ | 313,475 | |
Interest | | 35,971 | | 2,125 | |
Total Income | | 38,389,064 | | 315,600 | |
| | | | | |
EXPENSES: | | | | | |
Advisory fees — Note 3(a) | | 16,666,710 | | 107,514 | |
Distribution fees — Note 3(c) | | | | | |
Class A | | — | | 3,309 | |
Class C | | — | | 11,196 | |
Class R | | 1,938,744 | | 17,423 | |
Shareholder servicing fees — Note 3(j) | | 5,200,146 | | 31,516 | |
Shareholder administrative fees — Note 3(f) | | 208,006 | | 1,673 | |
Administration fees — Note 3(b) | | 572,017 | | 4,164 | |
Custodian fees | | 138,976 | | 23,763 | |
Interest expenses | | — | | 2,507 | |
Transfer agent fees and expenses — Note 3(f) | | 1,228,768 | | 21,615 | |
Printing fees | | 127,304 | | 8,625 | |
Professional fees | | 104,085 | | 35,256 | |
Registration fees | | 87,414 | | 82,304 | |
Trustee fees — Note 3(g) | | 23,665 | | 20,049 | |
Fund accounting fees | | 292,027 | | 18,116 | |
Miscellaneous | | 166,333 | | 6,086 | |
Total Expenses | | 26,754,195 | | 395,116 | |
Less, expense reimbursements/waivers — Note 3(a) | | — | | (124,100 | ) |
Net Expenses | | 26,754,195 | | 271,016 | |
NET INVESTMENT INCOME | | 11,634,869 | | 44,584 | |
| | | | | |
REALIZED AND UNREALIZED GAIN (LOSS) ON INVESTMENTS, OPTIONS AND FOREIGN CURRENCY: | | | | | |
Net realized gain on investments and purchased options | | 310,237,666 | | 2,743,891 | |
Net realized gain (loss) on foreign currency transactions | | 3,995 | | (74 | ) |
Net change in unrealized appreciation on investments, options and foreign currency | | 212,512,645 | | 987,405 | |
Net realized and unrealized gain on investments, options, and foreign currency | | 522,754,306 | | 3,731,222 | |
NET INCREASE IN NET ASSETS RESULTING FROM OPERATIONS | | $ | 534,389,175 | | $ | 3,775,806 | |
* Foreign withholding taxes | | $ | 145,784 | | $ | 263 | |
See Notes to Financial Statements.
45
| | Alger Mid Cap Growth
Institutional Fund | | Alger Small Cap
Growth Institutional
Fund | |
| | | | | |
INCOME: | | | | | |
Dividends (net of foreign withholding taxes*) | | $ | 2,090,646 | | $ | 8,545,303 | |
Interest | | 272 | | 5,410 | |
Total Income | | 2,090,918 | | 8,550,713 | |
| | | | | |
EXPENSES: | | | | | |
Advisory fees — Note 3(a) | | 1,447,629 | | 7,920,676 | |
Distribution fees — Note 3(c) | | | | | |
Class R | | 125,469 | | 214,666 | |
Shareholder servicing fees — Note 3(j) | | 476,193 | | 2,445,107 | |
Shareholder administrative fees — Note 3(f) | | 19,047 | | 97,804 | |
Administration fees — Note 3(b) | | 52,381 | | 268,961 | |
Custodian fees | | 111,791 | | 81,100 | |
Interest expenses | | 27,662 | | 1,291 | |
Transfer agent fees and expenses — Note 3(f) | | 163,197 | | 872,427 | |
Printing fees | | 8,716 | | 117,612 | |
Professional fees | | 51,250 | | 73,958 | |
Registration fees | | 10,471 | | 93,979 | |
Trustee fees — Note 3(g) | | 20,475 | | 22,027 | |
Fund accounting fees | | 38,153 | | 143,418 | |
Miscellaneous | | 25,412 | | 103,863 | |
Total Expenses | | 2,577,846 | | 12,456,889 | |
NET INVESTMENT LOSS | | (486,928 | ) | (3,906,176 | ) |
| | | | | |
REALIZED AND UNREALIZED GAIN (LOSS) ON INVESTMENTS, OPTIONS AND FOREIGN CURRENCY: | | | | | |
Net realized gain on investments and purchased options | | 24,863,866 | | 172,601,987 | |
Net realized gain on foreign currency transactions | | 12,997 | | — | |
Net realized gain on options written | | 3,388,326 | | — | |
Net change in unrealized appreciation on investments, options and foreign currency | | 27,242,554 | | 114,674,518 | |
Net change in unrealized (depreciation) on written options | | (45,914 | ) | — | |
Net realized and unrealized gain on investments, options, and foreign currency | | 55,461,829 | | 287,276,505 | |
NET INCREASE IN NET ASSETS RESULTING FROM OPERATIONS | | $ | 54,974,901 | | $ | 283,370,329 | |
* Foreign withholding taxes | | $ | 398 | | $ | — | |
See Notes to Financial Statements.
46
THE ALGER INSTITUTIONAL FUNDS
Statements of Changes in Net Assets
| | Alger Capital Appreciation Institutional Fund | |
| | For the
Year Ended
October 31, 2013 | | For the
Year Ended
October 31, 2012 | |
| | | | | |
Net investment income | | $ | 11,634,869 | | $ | 4,960,839 | |
Net realized gain on investments, options and foreign currency | | 310,241,661 | | 64,705,558 | |
Net change in unrealized appreciation on investments, options and foreign currency | | 212,512,645 | | 117,513,584 | |
Net increase in net assets resulting from operations | | 534,389,175 | | 187,179,981 | |
| | | | | |
Dividends and distributions to shareholders from: | | | | | |
Net investment income: | | | | | |
Class I | | (10,993,807 | ) | — | |
Class R | | (3,172,074 | ) | — | |
Net realized gains: | | | | | |
Class I | | (54,567,375 | ) | (38,935,171 | ) |
Class R | | (13,535,144 | ) | (8,986,963 | ) |
Total dividends and distributions to shareholders | | (82,268,400 | ) | (47,922,134 | ) |
| | | | | |
Increase (decrease) from shares of beneficial interest transactions: | | | | | |
Class I | | 117,348,627 | | 314,532,855 | |
Class R | | 13,672,964 | | 95,051,832 | |
Net increase from shares of beneficial interest transactions — Note 6(a) | | 131,021,591 | | 409,584,687 | |
Total increase | | 583,142,366 | | 548,842,534 | |
| | | | | |
Net Assets: | | | | | |
Beginning of period | | 1,817,711,952 | | 1,268,869,418 | |
END OF PERIOD | | $ | 2,400,854,318 | | $ | 1,817,711,952 | |
Undistributed net investment income | | $ | 1,214,116 | | $ | 4,311,055 | |
See Notes to Financial Statements.
47
| | Alger Capital Appreciation Focus Fund | |
| | For the
Year Ended
October 31, 2013 | | For the
Year Ended
October 31, 2012 | |
| | | | | |
Net investment income (loss) | | $ | 44,584 | | $ | (79,403 | ) |
Net realized gain on investments, options and foreign currency | | 2,743,817 | | 831,835 | |
Net change in unrealized appreciation on investments, options and foreign currency | | 987,405 | | 318,357 | |
Net increase in net assets resulting from operations | | 3,775,806 | | 1,070,789 | |
| | | | | |
Increase (decrease) from shares of beneficial interest transactions: | | | | | |
Class A | | 3,099,905 | | — | |
Class C | | 1,608,092 | | — | |
Class I | | (8,676,045 | ) | (1,983,255 | ) |
Class R | | (2,174,733 | ) | (1,678,476 | ) |
Class Z | | 100,000 | | — | |
Net decrease from shares of beneficial interest transactions — Note 6(a) | | (6,042,781 | ) | (3,661,731 | ) |
| | | | | |
Redemption Fees: | | | | | |
Class A | | 36 | | — | |
Class C | | 156 | | — | |
Total Redemption Fees — Note 6(b) | | 192 | | — | |
Total decrease | | (2,266,783 | ) | (2,590,942 | ) |
| | | | | |
Net Assets: | | | | | |
Beginning of period | | 19,207,642 | | 21,798,584 | |
END OF PERIOD | | $ | 16,940,859 | | $ | 19,207,642 | |
Undistributed net investment income (accumulated loss) | | $ | (43,080 | ) | $ | (83,245 | ) |
See Notes to Financial Statements.
48
| | Alger Mid Cap Growth Institutional Fund | |
| | For the
Year Ended
October 31, 2013 | | For the
Year Ended
October 31, 2012 | |
| | | | | |
Net investment loss | | $ | (486,928 | ) | $ | (112,225 | ) |
Net realized gain (loss) on investments, options and foreign currency | | 28,265,189 | | (5,738,593 | ) |
Net change in unrealized appreciation on investments, options and foreign currency | | 27,196,640 | | 29,930,168 | |
Net increase in net assets resulting from operations | | 54,974,901 | | 24,079,350 | |
| | | | | |
Dividends and distributions to shareholders from: | | | | | |
Net investment income: | | | | | |
Class I | | (435,722 | ) | — | |
Class R | | (121,588 | ) | — | |
Total dividends and distributions to shareholders | | (557,310 | ) | — | |
| | | | | |
Increase (decrease) from shares of beneficial interest transactions: | | | | | |
Class I | | (72,122,712 | ) | (157,521,243 | ) |
Class R | | (10,052,605 | ) | (10,498,008 | ) |
Net decrease from shares of beneficial interest transactions — Note 6(a) | | (82,175,317 | ) | (168,019,251 | ) |
Total decrease | | (27,757,726 | ) | (143,939,901 | ) |
| | | | | |
Net Assets: | | | | | |
Beginning of period | | 208,747,736 | | 352,687,637 | |
END OF PERIOD | | $ | 180,990,010 | | $ | 208,747,736 | |
Undistributed net investment income (accumulated loss) | | $ | (662,996 | ) | $ | 418,939 | |
See Notes to Financial Statements.
49
| | Alger Small Cap Growth Institutional Fund | |
| | For the
Year Ended
October 31, 2013 | | For the
Year Ended
October 31, 2012 | |
| | | | | |
Net investment loss | | $ | (3,906,176 | ) | $ | (6,363,954 | ) |
Net realized gain on investments, options and foreign currency | | 172,601,987 | | 101,643,899 | |
Net change in unrealized appreciation on investments, options and foreign currency | | 114,674,518 | | 6,084,704 | |
Net increase in net assets resulting from operations | | 283,370,329 | | 101,364,649 | |
| | | | | |
Dividends and distributions to shareholders from: | | | | | |
Net realized gains: | | | | | |
Class I | | (101,340,447 | ) | (45,919,886 | ) |
Class R | | (5,308,914 | ) | (2,661,491 | ) |
Total dividends and distributions to shareholders | | (106,649,361 | ) | (48,581,377 | ) |
| | | | | |
Increase (decrease) from shares of beneficial interest transactions: | | | | | |
Class I | | (162,450,881 | ) | (241,363,028 | ) |
Class R | | (13,438,631 | ) | (16,853,179 | ) |
Net decrease from shares of beneficial interest transactions — Note 6(a) | | (175,889,512 | ) | (258,216,207 | ) |
Total increase (decrease) | | 831,456 | | (205,432,935 | ) |
| | | | | |
Net Assets: | | | | | |
Beginning of period | | 976,744,150 | | 1,182,177,085 | |
END OF PERIOD | | $ | 977,575,606 | | $ | 976,744,150 | |
Undistributed net investment income (accumulated loss) | | $ | 7,347 | | $ | (4,854,341 | ) |
See Notes to Financial Statements.
50
THE ALGER INSTITUTIONAL FUNDS
Financial Highlights for a share outstanding throughout the period
Alger Capital Appreciation Institutional Fund
| | Class I | |
| | Year ended
10/31/2013 | | Year ended
10/31/2012 | | Year ended
10/31/2011 | | Year ended
10/31/2010 | | Year ended
10/31/2009 | |
Net asset value, beginning of period | | $ | 22.85 | | $ | 20.88 | | $ | 19.28 | | $ | 16.41 | | $ | 13.23 | |
INCOME FROM INVESTMENT OPERATIONS: | | | | | | | | | | | |
Net investment income (loss)(i) | | 0.16 | | 0.09 | | (0.01 | ) | — | | 0.04 | |
Net realized and unrealized gain on investments | | 6.21 | | 2.64 | | 1.61 | | 2.90 | | 3.14 | |
Total from investment operations | | 6.37 | | 2.73 | | 1.60 | | 2.90 | | 3.18 | |
Dividends from net investment income | | (0.17 | ) | — | | — | | (0.03 | ) | — | |
Distributions from net realized gains | | (0.84 | ) | (0.76 | ) | — | | — | | — | |
Net asset value, end of period | | $ | 28.21 | | $ | 22.85 | | $ | 20.88 | | $ | 19.28 | | $ | 16.41 | |
Total return | | 29.02 | % | 13.70 | % | 8.30 | % | 17.70 | % | 23.90 | % |
RATIOS/SUPPLEMENTAL DATA: | | | | | | | | | | | |
Net assets, end of period (000’s omitted) | | $ | 1,958,405 | | $ | 1,470,078 | | $ | 1,041,609 | | $ | 809,468 | | $ | 632,250 | |
Ratio of gross expenses to average net assets | | 1.19 | % | 1.19 | % | 1.17 | % | 1.17 | % | 1.21 | % |
Ratio of expense reimbursements to average net assets | | — | | — | | — | | — | | — | |
Ratio of net expenses to average net assets | | 1.19 | % | 1.19 | % | 1.17 | % | 1.17 | % | 1.21 | % |
Ratio of net investment income (loss) to average net assets | | 0.65 | % | 0.41 | % | (0.04 | )% | (0.02 | )% | 0.32 | % |
Portfolio turnover rate | | 124.43 | % | 137.16 | % | 153.30 | % | 209.52 | % | 306.87 | % |
(i) Amount was computed based on average shares outstanding during the period.
See Notes to Financial Statements.
51
Alger Capital Appreciation Institutional Fund
| | Class R | |
| | Year ended
10/31/2013 | | Year ended
10/31/2012 | | Year ended
10/31/2011 | | Year ended
10/31/2010 | | Year ended
10/31/2009 | |
Net asset value, beginning of period | | $ | 21.76 | | $ | 20.01 | | $ | 18.57 | | $ | 15.86 | | $ | 12.85 | |
INCOME FROM INVESTMENT OPERATIONS: | | | | | | | | | | | |
Net investment income (loss)(i) | | 0.04 | | (0.02 | ) | (0.11 | ) | (0.10 | ) | (0.02 | ) |
Net realized and unrealized gain on investments | | 5.87 | | 2.53 | | 1.55 | | 2.81 | | 3.03 | |
Total from investment operations | | 5.91 | | 2.51 | | 1.44 | | 2.71 | | 3.01 | |
Dividends from net investment income | | (0.20 | ) | — | | — | | — | | — | |
Distributions from net realized gains | | (0.84 | ) | (0.76 | ) | — | | — | | — | |
Net asset value, end of period | | $ | 26.63 | | $ | 21.76 | | $ | 20.01 | | $ | 18.57 | | $ | 15.86 | |
Total return | | 28.35 | % | 13.20 | % | 7.80 | % | 17.10 | % | 23.30 | % |
RATIOS/SUPPLEMENTAL DATA: | | | | | | | | | | | |
Net assets, end of period (000’s omitted) | | $ | 442,449 | | $ | 347,634 | | $ | 227,260 | | $ | 171,344 | | $ | 89,676 | |
Ratio of gross expenses to average net assets | | 1.69 | % | 1.69 | % | 1.68 | % | 1.67 | % | 1.71 | % |
Ratio of expense reimbursements to average net assets | | — | | ��� | | — | | — | | — | |
Ratio of net expenses to average net assets | | 1.69 | % | 1.69 | % | 1.68 | % | 1.67 | % | 1.71 | % |
Ratio of net investment income (loss) to average net assets | | 0.17 | % | (0.09 | )% | (0.56 | )% | (0.55 | )% | (0.18 | )% |
Portfolio turnover rate | | 124.43 | % | 137.16 | % | 153.30 | % | 209.52 | % | 306.87 | % |
(i) Amount was computed based on average shares outstanding during the period.
See Notes to Financial Statements.
52
Alger Capital Appreciation Focus Fund
| | Class A | |
| | From
12/31/2012(i)
to
10/31/2013(ii) | |
Net asset value, beginning of period | | $ | 14.70 | |
INCOME FROM INVESTMENT OPERATIONS: | | | |
Net investment loss(iii) | | (0.01 | ) |
Net realized and unrealized gain on investments | | 4.00 | |
Total from investment operations | | 3.99 | |
Net asset value, end of period | | $ | 18.69 | |
Total return(iv) | | 27.14 | % |
RATIOS/SUPPLEMENTAL DATA: | | | |
Net assets, end of period (000’s omitted) | | $ | 3,496 | |
Ratio of gross expenses to average net assets | | 2.49 | % |
Ratio of expense reimbursements to average net assets | | (1.19 | )% |
Ratio of net expenses to average net assets | | 1.30 | % |
Ratio of net investment income (loss) to average net assets | | (0.09 | )% |
Portfolio turnover rate | | 166.61 | % |
(i) Commencement of operations.
(ii) Ratios have been annualized; total return has not been annualized; portfolio turnover is for the twelve months then ended.
(iii) Amount was computed based on average shares outstanding during the period.
(iv) Does not reflect the effect of sales charges, if applicable.
See Notes to Financial Statements.
53
Alger Capital Appreciation Focus Fund
| | Class C | |
| | From
12/31/2012(i)
to
10/31/2013(ii) | |
Net asset value, beginning of period | | $ | 14.70 | |
INCOME FROM INVESTMENT OPERATIONS: | | | |
Net investment loss(iii) | | (0.11 | ) |
Net realized and unrealized gain on investments | | 3.99 | |
Total from investment operations | | 3.88 | |
Net asset value, end of period | | $ | 18.58 | |
Total return(iv) | | 26.39 | % |
RATIOS/SUPPLEMENTAL DATA: | | | |
Net assets, end of period (000’s omitted) | | $ | 1,913 | |
Ratio of gross expenses to average net assets | | 3.27 | % |
Ratio of expense reimbursements to average net assets | | (1.22 | )% |
Ratio of net expenses to average net assets | | 2.05 | % |
Ratio of net investment income (loss) to average net assets | | (0.83 | )% |
Portfolio turnover rate | | 166.61 | % |
(i) Commencement of operations.
(ii) Ratios have been annualized; total return has not been annualized; portfolio turnover is for the twelve months then ended.
(iii) Amount was computed based on average shares outstanding during the period.
(iv) Does not reflect the effect of sales charges, if applicable.
See Notes to Financial Statements.
54
Alger Capital Appreciation Focus Fund
| | Class I | |
| | Year ended
10/31/2013 | | Year ended
10/31/2012 | | Year ended
10/31/2011 | | Year ended
10/31/2010 | | Year ended
10/31/2009 | |
Net asset value, beginning of period | | $ | 14.53 | | $ | 13.75 | | $ | 13.03 | | $ | 11.17 | | $ | 9.48 | |
INCOME FROM INVESTMENT OPERATIONS: | | | | | | | | | | | |
Net investment income (loss)(i) | | 0.15 | | (0.03 | ) | (0.04 | ) | 0.07 | | 0.04 | |
Net realized and unrealized gain on investments | | 4.04 | | 0.81 | | 0.86 | | 1.83 | | 1.65 | |
Total from investment operations | | 4.19 | | 0.78 | | 0.82 | | 1.90 | | 1.69 | |
Dividends from net investment income | | — | | — | | (0.10 | ) | (0.04 | ) | — | |
Net asset value, end of period | | $ | 18.72 | | $ | 14.53 | | $ | 13.75 | | $ | 13.03 | | $ | 11.17 | |
Total return(ii) | | 28.84 | % | 5.70 | % | 6.30 | % | 17.10 | % | 17.70 | % |
RATIOS/SUPPLEMENTAL DATA: | | | | | | | | | | | |
Net assets, end of period (000’s omitted) | | $ | 8,684 | | $ | 15,101 | | $ | 16,294 | | $ | 22,961 | | $ | 39,412 | |
Ratio of gross expenses to average net assets | | 2.32 | % | 1.83 | % | 1.69 | % | 1.36 | % | 1.37 | % |
Ratio of expense reimbursements to average net assets | | (0.94 | )% | — | | — | | — | | — | |
Ratio of net expenses to average net assets | | 1.38 | % | 1.83 | % | 1.69 | % | 1.36 | % | 1.37 | % |
Ratio of net investment income (loss) to average net assets | | 0.95 | % | (0.22 | )% | (0.27 | )% | 0.56 | % | 0.46 | % |
Portfolio turnover rate | | 166.61 | % | 153.72 | % | 57.74 | % | 58.73 | % | 87.57 | % |
(i) Amount was computed based on average shares outstanding during the period.
(ii) Does not reflect the effect of sales charges, if applicable.
See Notes to Financial Statements.
55
Alger Capital Appreciation Focus Fund
| | Class R | |
| | Year ended
10/31/2013 | | Year ended
10/31/2012 | | Year ended
10/31/2011 | | Year ended
10/31/2010 | | Year ended
10/31/2009 | |
Net asset value, beginning of period | | $ | 13.94 | | $ | 13.28 | | $ | 12.59 | | $ | 10.83 | | $ | 9.24 | |
INCOME FROM INVESTMENT OPERATIONS: | | | | | | | | | | | |
Net investment loss(i) | | (0.14 | ) | (0.13 | ) | (0.13 | ) | (0.02 | ) | — | |
Net realized and unrealized gain on investments | | 3.85 | | 0.79 | | 0.84 | | 1.78 | | 1.59 | |
Total from investment operations | | 3.71 | | 0.66 | | 0.71 | | 1.76 | | 1.59 | |
Dividends from net investment income | | — | | — | | (0.02 | ) | — | | — | |
Net asset value, end of period | | $ | 17.65 | | $ | 13.94 | | $ | 13.28 | | $ | 12.59 | | $ | 10.83 | |
Total return(ii) | | 26.61 | % | 5.00 | % | 5.70 | % | 16.30 | % | 17.20 | % |
RATIOS/SUPPLEMENTAL DATA: | | | | | | | | | | | |
Net assets, end of period (000’s omitted) | | $ | 2,720 | | $ | 4,107 | | $ | 5,505 | | $ | 6,110 | | $ | 5,933 | |
Ratio of gross expenses to average net assets | | 3.02 | % | 2.53 | % | 2.40 | % | 2.05 | % | 1.89 | % |
Ratio of expense reimbursements to average net assets | | (0.24 | )% | — | | — | | — | | — | |
Ratio of net expenses to average net assets | | 2.78 | % | 2.53 | % | 2.40 | % | 2.05 | % | 1.89 | % |
Ratio of net investment income (loss) to average net assets | | (0.89 | )% | (0.91 | )% | (0.99 | )% | (0.16 | )% | (0.03 | )% |
Portfolio turnover rate | | 166.61 | % | 153.72 | % | 57.74 | % | 58.73 | % | 87.57 | % |
(i) Amount was computed based on average shares outstanding during the period.
(ii) Does not reflect the effect of sales charges, if applicable.
See Notes to Financial Statements.
56
Alger Capital Appreciation Focus Fund
| | Class Z | |
| | From
12/31/2012(i)
to
10/31/2013(ii) | |
Net asset value, beginning of period | | $ | 14.70 | |
INCOME FROM INVESTMENT OPERATIONS: | | | |
Net investment income(iii) | | 0.04 | |
Net realized and unrealized gain on investments | | 4.01 | |
Total from investment operations | | 4.05 | |
Net asset value, end of period | | $ | 18.75 | |
Total return(iv) | | 27.55 | % |
RATIOS/SUPPLEMENTAL DATA: | | | |
Net assets, end of period (000’s omitted) | | $ | 128 | |
Ratio of gross expenses to average net assets | | 10.11 | % |
Ratio of expense reimbursements to average net assets | | (9.22 | )% |
Ratio of net expenses to average net assets | | 0.89 | % |
Ratio of net investment income (loss) to average net assets | | 0.32 | % |
Portfolio turnover rate | | 166.61 | % |
(i) Commencement of operations.
(ii) Ratios have been annualized; total return has not been annualized; portfolio turnover is for the twelve months then ended.
(iii) Amount was computed based on average shares outstanding during the period.
(iv) Does not reflect the effect of sales charges, if applicable.
See Notes to Financial Statements.
57
Alger Mid Cap Growth Institutional Fund
| | Class I | |
| | Year ended
10/31/2013 | | Year ended
10/31/2012 | | Year ended
10/31/2011 | | Year ended
10/31/2010 | | Year ended
10/31/2009 | |
Net asset value, beginning of period | | $ | 14.59 | | $ | 13.50 | | $ | 13.11 | | $ | 10.68 | | $ | 8.76 | |
INCOME FROM INVESTMENT OPERATIONS: | | | | | | | | | | | |
Net investment income (loss)(i) | | (0.03 | ) | — | | (0.10 | ) | 0.01 | | (0.04 | ) |
Net realized and unrealized gain on investments | | 4.91 | | 1.09 | | 0.52 | | 2.42 | | 1.96 | |
Total from investment operations | | 4.88 | | 1.09 | | 0.42 | | 2.43 | | 1.92 | |
Dividends from net investment income | | (0.04 | ) | — | | (0.03 | ) | — | | — | |
Net asset value, end of period | | $ | 19.43 | | $ | 14.59 | | $ | 13.50 | | $ | 13.11 | | $ | 10.68 | |
Total return | | 33.41 | % | 8.10 | % | 3.30 | % | 22.80 | % | 21.80 | % |
RATIOS/SUPPLEMENTAL DATA: | | | | | | | | | | | |
Net assets, end of period (000’s omitted) | | $ | 157,391 | | $ | 182,087 | | $ | 317,893 | | $ | 737,099 | | $ | 872,936 | |
Ratio of gross expenses to average net assets | | 1.29 | % | 1.23 | % | 1.18 | % | 1.12 | % | 1.17 | % |
Ratio of expense reimbursements to average net assets | | — | | — | | — | | — | | — | |
Ratio of net expenses to average net assets | | 1.29 | % | 1.23 | % | 1.18 | % | 1.12 | % | 1.17 | % |
Ratio of net investment income (loss) to average net assets | | (0.19 | )% | 0.02 | % | (0.69 | )% | 0.07 | % | (0.44 | )% |
Portfolio turnover rate | | 153.89 | % | 232.99 | % | 233.50 | % | 193.69 | % | 297.99 | % |
(i) Amount was computed based on average shares outstanding during the period.
See Notes to Financial Statements.
58
Alger Mid Cap Growth Institutional Fund
| | Class R | |
| | Year ended
10/31/2013 | | Year ended
10/31/2012 | | Year ended
10/31/2011 | | Year ended
10/31/2010 | | Year ended
10/31/2009 | |
Net asset value, beginning of period | | $ | 13.81 | | $ | 12.85 | | $ | 12.51 | | $ | 10.24 | | $ | 8.45 | |
INCOME FROM INVESTMENT OPERATIONS: | | | | | | | | | | | |
Net investment loss(i) | | (0.11 | ) | (0.07 | ) | (0.17 | ) | (0.05 | ) | (0.08 | ) |
Net realized and unrealized gain on investments | | 4.63 | | 1.03 | | 0.51 | | 2.32 | | 1.87 | |
Total from investment operations | | 4.52 | | 0.96 | | 0.34 | | 2.27 | | 1.79 | |
Dividends from net investment income | | (0.07 | ) | — | | — | | — | | — | |
Net asset value, end of period | | $ | 18.26 | | $ | 13.81 | | $ | 12.85 | | $ | 12.51 | | $ | 10.24 | |
Total return | | 32.83 | % | 7.50 | % | 2.70 | % | 22.20 | % | 21.00 | % |
RATIOS/SUPPLEMENTAL DATA: | | | | | | | | | | | |
Net assets, end of period (000’s omitted) | | $ | 23,599 | | $ | 26,661 | | $ | 34,795 | | $ | 50,016 | | $ | 50,919 | |
Ratio of gross expenses to average net assets | | 1.79 | % | 1.76 | % | 1.74 | % | 1.65 | % | 1.68 | % |
Ratio of expense reimbursements to average net assets | | — | | — | | — | | — | | — | |
Ratio of net expenses to average net assets | | 1.79 | % | 1.76 | % | 1.74 | % | 1.65 | % | 1.68 | % |
Ratio of net investment income (loss) to average net assets | | (0.69 | )% | (0.50 | )% | (1.24 | )% | (0.46 | )% | (0.96 | )% |
Portfolio turnover rate | | 153.89 | % | 232.99 | % | 233.50 | % | 193.69 | % | 297.99 | % |
(i) Amount was computed based on average shares outstanding during the period.
See Notes to Financial Statements.
59
Alger Small Cap Growth Institutional Fund
| | Class I | |
| | Year ended
10/31/2013 | | Year ended
10/31/2012 | | Year ended
10/31/2011 | | Year ended
10/31/2010 | | Year ended
10/31/2009 | |
Net asset value, beginning of period | | $ | 28.16 | | $ | 26.99 | | $ | 25.28 | | $ | 19.90 | | $ | 16.52 | |
INCOME FROM INVESTMENT OPERATIONS: | | | | | | | | | | | |
Net investment loss(i) | | (0.11 | ) | (0.15 | ) | (0.26 | ) | (0.22 | ) | (0.16 | ) |
Net realized and unrealized gain on investments | | 8.66 | | 2.45 | | 1.97 | | 5.60 | | 3.54 | |
Total from investment operations | | 8.55 | | 2.30 | | 1.71 | | 5.38 | | 3.38 | |
Distributions from net realized gains | | (3.23 | ) | (1.13 | ) | — | | — | | — | |
Net asset value, end of period | | $ | 33.48 | | $ | 28.16 | | $ | 26.99 | | $ | 25.28 | | $ | 19.90 | |
Total return | | 33.71 | % | 8.93 | % | 6.80 | % | 27.00 | % | 20.50 | % |
RATIOS/SUPPLEMENTAL DATA: | | | | | | | | | | | |
Net assets, end of period (000’s omitted) | | $ | 936,554 | | $ | 929,237 | | $ | 1,119,966 | | $ | 1,104,866 | | $ | 968,776 | |
Ratio of gross expenses to average net assets | | 1.25 | % | 1.23 | % | 1.18 | % | 1.23 | % | 1.32 | % |
Ratio of expense reimbursements to average net assets | | — | | — | | — | | — | | — | |
Ratio of net expenses to average net assets | | 1.25 | % | 1.23 | % | 1.18 | % | 1.23 | % | 1.32 | % |
Ratio of net investment income (loss) to average net assets | | (0.38 | )% | (0.54 | )% | (0.94 | )% | (0.94 | )% | (0.94 | )% |
Portfolio turnover rate | | 77.38 | % | 72.43 | % | 70.57 | % | 61.40 | % | 90.49 | % |
(i) Amount was computed based on average shares outstanding during the period.
See Notes to Financial Statements.
60
Alger Small Cap Growth Institutional Fund
| | Class R | |
| | Year ended
10/31/2013 | | Year ended
10/31/2012 | | Year ended
10/31/2011 | | Year ended
10/31/2010 | | Year ended
10/31/2009 | |
Net asset value, beginning of period | | $ | 26.85 | | $ | 25.91 | | $ | 24.39 | | $ | 19.30 | | $ | 16.08 | |
INCOME FROM INVESTMENT OPERATIONS: | | | | | | | | | | | |
Net investment loss(i) | | (0.23 | ) | (0.28 | ) | (0.40 | ) | (0.31 | ) | (0.22 | ) |
Net realized and unrealized gain on investments | | 8.19 | | 2.35 | | 1.92 | | 5.40 | | 3.44 | |
Total from investment operations | | 7.96 | | 2.07 | | 1.52 | | 5.09 | | 3.22 | |
Distributions from net realized gains | | (3.23 | ) | (1.13 | ) | — | | — | | — | |
Net asset value, end of period | | $ | 31.58 | | $ | 26.85 | | $ | 25.91 | | $ | 24.39 | | $ | 19.30 | |
Total return | | 33.05 | % | 8.40 | % | 6.20 | % | 26.40 | % | 20.10 | % |
RATIOS/SUPPLEMENTAL DATA: | | | | | | | | | | | |
Net assets, end of period (000’s omitted) | | $ | 41,022 | | $ | 47,507 | | $ | 62,211 | | $ | 68,071 | | $ | 51,707 | |
Ratio of gross expenses to average net assets | | 1.73 | % | 1.73 | % | 1.71 | % | 1.69 | % | 1.73 | % |
Ratio of expense reimbursements to average net assets | | — | | — | | — | | — | | — | |
Ratio of net expenses to average net assets | | 1.73 | % | 1.73 | % | 1.71 | % | 1.69 | % | 1.73 | % |
Ratio of net investment income (loss) to average net assets | | (0.83 | )% | (1.05 | )% | (1.47 | )% | (1.40 | )% | (1.35 | )% |
Portfolio turnover rate | | 77.38 | % | 72.43 | % | 70.57 | % | 61.40 | % | 90.49 | % |
(i) Amount was computed based on average shares outstanding during the period.
See Notes to Financial Statements.
61
THE ALGER INSTITUTIONAL FUNDS
NOTES TO FINANCIAL STATEMENTS
NOTE 1 — General:
The Alger Institutional Funds (the “Trust”), is a diversified, open-end registered investment company organized as a business trust under the laws of the Commonwealth of Massachusetts. The Trust operates as a series company and currently issues an unlimited number of shares of beneficial interest in four funds — Alger Capital Appreciation Institutional Fund, Alger Capital Appreciation Focus Fund (formerly the Alger Large Cap Growth Institutional Fund), Alger Mid Cap Growth Institutional Fund and Alger Small Cap Growth Institutional Fund (collectively, the “Funds” or individually, each a “Fund”). The Funds normally invest primarily in equity securities and each has an investment objective of long-term capital appreciation.
Each Fund offers one or more of the following share classes: Class A, C, I, R and Z. Class A shares are generally subject to an initial sales charge while Class C shares are generally subject to a deferred sales charge. Class I, R and Z shares are sold to institutional investors without an initial or deferred sales charge. Each class has identical rights to assets and earnings except that each share class bears the cost of its transfer agency and sub-transfer agency services and each of Classes A, C and R bears the cost of its plan of distribution.
The Alger Large Cap Growth Institutional Fund changed its name to Alger Capital Appreciation Focus Fund effective December 31, 2012. Its investment objective to seek long-term capital appreciation did not change. The Fund also started offering Class A, C and Z shares on December 31, 2012.
NOTE 2 — Significant Accounting Policies:
(a) Investment Valuation: The Funds value their financial instruments at fair value using independent dealers or pricing services under policies approved by the Board of Trustees. Investments are valued on each day the New York Stock Exchange (the “NYSE”) is open, as of the close of the NYSE (normally 4:00 p.m. Eastern time).
Equity securities and option contracts for which valuation information is readily available are valued at the last reported sales price or official closing price as reported by an independent pricing service on the primary market or exchange on which they are traded. In the absence of reported sales, such securities are valued at the bid price or, in the absence of a recent bid price, the equivalent as obtained from one or more of the major market makers for the securities to be valued.
Debt securities generally trade in the over-the-counter market. Debt securities with remaining maturities of more than sixty days at the time of acquisition are valued on the basis of last available bid prices or current market quotations provided by dealers or pricing services. In determining the value of a particular investment, pricing services may use certain information with respect to transactions in such investments, quotations from dealers, pricing matrixes, market transactions in comparable investments, various relationships observed in the market between investments and calculated yield measures based on valuation technology commonly employed in the market for such investments. Asset-backed and mortgage-backed securities are valued by independent pricing services
62
THE ALGER INSTITUTIONAL FUNDS
NOTES TO FINANCIAL STATEMENTS (Continued)
using models that consider estimated cash flows of each tranche of the security, establish a benchmark yield and develop an estimated tranche-specific spread to the benchmark yield based on the unique attributes of the tranche. Debt securities with a remaining maturity of sixty days or less are valued at amortized cost which approximates market value.
Securities for which market quotations are not readily available are valued at fair value, as determined in good faith pursuant to procedures established by the Board of Trustees.
Securities in which the Funds invest may be traded in foreign markets that close before the close of the NYSE. Developments that occur between the close of the foreign markets and the close of the NYSE may result in adjustments to the foreign closing prices to reflect what the investment adviser, pursuant to policies established by the Board of Trustees, believes to be the fair value of these securities as of the close of the NYSE. The Funds may also fair value securities in other situations, for example, when a particular foreign market is closed but the Fund is open.
Financial Accounting Standards Board Accounting Standards Codification 820 — Fair Value Measurements and Disclosures (“ASC 820”) defines fair value as the price that the Funds would receive upon selling an investment in a timely transaction to an independent buyer in the principal or most advantageous market of the investment. ASC 820 established a three-tier hierarchy to maximize the use of observable market data and minimize the use of unobservable inputs and to establish classification of fair value measurements for disclosure purposes. Inputs refer broadly to the assumptions that market participants would use in pricing the asset or liability and may be observable or unobservable. Observable inputs are based on market data obtained from sources independent of the Funds. Unobservable inputs are inputs that reflect the Funds’ own assumptions based on the best information available in the circumstances. The three-tier hierarchy of inputs is summarized in the three broad Levels listed below.
· Level 1 — quoted prices in active markets for identical investments
· Level 2 — significant other observable inputs (including quoted prices for similar investments, interest rates, prepayment speeds, credit risk, etc.)
· Level 3 — significant unobservable inputs (including the Funds’ own assumptions in determining the fair value of investments)
The Funds’ valuation techniques are generally consistent with the market approach whereby prices and other relevant information generated by market transactions involving identical or comparable assets are used to measure fair value. Inputs for Level 1 include exchange-listed prices and broker quotes in an active market. Inputs for Level 2 include the last trade price in the case of a halted security, an exchange-listed price which has been adjusted for fair value factors, and prices of closely related securities. Additional Level 2 inputs include an evaluated price which is based upon a compilation of observable market information such as spreads for fixed income and preferred securities. Valuation techniques for Level 3 securities include using the income approach whereby future amounts are converted, or discounted, to a current single amount. These fair value measurements are determined on the basis of the value indicated by current market
63
THE ALGER INSTITUTIONAL FUNDS
NOTES TO FINANCIAL STATEMENTS (Continued)
expectations about such future events. Inputs for Level 3 include unobservable market information which can include cash flows, income and expenses, and other information obtained from a company’s financial statements, or from market indicators such as benchmarks and indices.
Valuation processes are determined by a Valuation Committee (“Committee”) established by the Trust’s Board of Trustees (“Board”) and comprised of representatives of the Trust’s investment advisor. The Committee reports its fair valuation determinations to the Board which is responsible for approving valuation policy and procedures.
While the Committee meets on an as needed basis, the Committee formally meets quarterly to review and evaluate the effectiveness of the procedures for making fair value determinations. The Committee considers, among other things, the results of quarterly back testing of the fair value model for foreign securities, pricing comparisons between primary and secondary price sources, the outcome of price challenges put to the Funds’ pricing vendor, and variances between transactional prices and previous mark-to-markets.
The Funds will record a change to a security’s fair value level if new inputs are available or it becomes evident that inputs previously considered for leveling have changed or are no longer relevant. Transfers between Levels 1 and 2 are recognized at the end of the reporting period, and transfers into and out of Level 3 are recognized during the reporting period.
(b) Cash and Cash Equivalents: Cash and cash equivalents include U.S. dollars, foreign cash and overnight time deposits.
(c) Securities Transactions and Investment Income: Securities transactions are recorded on a trade date basis. Realized gains and losses from securities transactions are recorded on the identified cost basis. Dividend income is recognized on the ex-dividend date and interest income is recognized on the accrual basis.
(d) Foreign Currency Translations: The books and records of the Funds are maintained in U.S. dollars. Foreign currencies, investments and other assets and liabilities are translated into U.S. dollars at the prevailing rates of exchange on the valuation date. Purchases and sales of investment securities and income and expenses are translated into U.S. dollars at the prevailing exchange rates on the respective dates of such transactions.
Net realized gains and losses on foreign currency transactions represent net gains and losses from the disposition of foreign currencies, currency gains and losses realized between the trade dates and settlement dates of security transactions, and the difference between the amount of net investment income accrued and the U.S. dollar amount actually received. The effects of changes in foreign currency exchange rates on investments in securities are included in realized and unrealized gain or loss on investments in the Statement of Operations.
(e) Option Contracts: When a Fund writes an option, an amount equal to the premium received by the Fund is recorded as a liability and is subsequently adjusted to the current fair value of the option written. Premiums received from writing options that expire unexercised are treated by the Fund on the expiration date as realized gains from investments. The difference between the premium and the amount paid on effecting a
64
THE ALGER INSTITUTIONAL FUNDS
NOTES TO FINANCIAL STATEMENTS (Continued)
closing purchase transaction, including brokerage commissions, is also treated as a realized gain, or, if the premium is less than the amount paid for the closing purchase transaction, as a realized loss. If a call option is exercised, the premium is added to the proceeds from the sale of the underlying security in determining whether the Fund has realized a gain or loss. If a put option is exercised, the premium reduces the cost basis of the securities purchased by the Fund. The Fund as writer of an option bears the market risk of an unfavorable change in the price of the security underlying the written option.
The Funds may also purchase put and call options. Each Fund pays a premium which is included in the Fund’s Statement of Assets and Liabilities as an investment and subsequently marked to market to reflect the current value of the option. Premiums paid for purchasing options which expire are treated as realized losses. The risk associated with purchasing put and call options is limited to the premium paid. Premiums paid for purchasing options which are exercised or closed are added to the amounts paid or offset against the proceeds on the underlying security to determine the realized gain or loss.
(f) Dividends to Shareholders: Dividends and distributions payable to shareholders are recorded by the Funds on the ex-dividend date. Dividends from net investment income and distributions from net realized gains are declared and paid annually after the end of the fiscal year in which earned.
Each class is treated separately in determining the amounts of dividends from net investment income payable to holders of its shares.
The characterization of distributions to shareholders for financial reporting purposes is determined in accordance with federal income tax rules. Therefore, the source of a Fund’s distributions may be shown in the accompanying financial statements as either from, or in excess of, net investment income, net realized gain on investment transactions or return of capital, depending on the type of book/tax differences that may exist. Capital accounts within the financial statements are adjusted for permanent book/tax differences. Reclassifications result primarily from the difference in tax treatment of net operating losses, passive foreign investment companies, and foreign currency transactions. The reclassifications are done annually at fiscal year end and have no impact on the net asset values of the Funds and are designed to present each Fund’s capital accounts on a tax basis.
(g) Federal Income Taxes: It is each Fund’s policy to comply with the requirements of the Internal Revenue Code Subchapter M applicable to regulated investment companies and to distribute all of its taxable income to its shareholders. Provided that the Funds maintain such compliance, no federal income tax provision is required. Each Fund is treated as a separate entity for the purpose of determining such compliance.
Financial Accounting Standards Board Accounting Standards Codification 740 — Income Taxes (“ASC 740”) requires the Funds to measure and recognize in their financial statements the benefit of a tax position taken (or expected to be taken) on an income tax return if such position will more likely than not be sustained upon examination based on the technical merits of the position. No tax years are currently under investigation. The Funds file income tax returns in the U.S. Federal jurisdiction, as well as the New York State and New York City jurisdictions. The statute of limitations on the Funds’ tax
65
THE ALGER INSTITUTIONAL FUNDS
NOTES TO FINANCIAL STATEMENTS (Continued)
returns remains open for the tax years 2009-2013. Management does not believe there are any uncertain tax positions that require recognition of a tax liability.
(h) Allocation Methods: The Trust accounts separately for the assets, liabilities and operations of each Fund. Expenses directly attributable to each Fund are charged to that Fund’s operations; expenses which are applicable to all Funds are allocated among them based on net assets. Income, realized and unrealized gains and losses, and expenses of each Fund are allocated among the Fund’s classes based on relative net assets, with the exception of distribution fees, transfer agency fees, and shareholder servicing and related fees.
(i) Estimates: These financial statements have been prepared in accordance with accounting principles generally accepted in the United States of America, which require using estimates and assumptions that affect the reported amounts therein. Actual results may differ from those estimates.
NOTE 3 — Investment Advisory Fees and Other Transactions with Affiliates:
(a) Investment Advisory Fees: Effective November 1, 2012, the investment advisory fees were was changed to tiered fee’s rate based on net assets of each Fund. The fees incurred by each Fund, pursuant to the provisions of the Trust’s Investment Advisory Agreement with Fred Alger Management, Inc. (“Alger Management” or the “Manager”), are payable monthly and computed based on the following rates. The actual rate paid as a percentage of average daily net assets, for the year ended October 31, 2013, is set forth below under the heading “Actual Rate.”
| | Tier 1 | | Tier 2 | | Tier 3 | | Actual Rate | |
Alger Capital Appreciation Institutional Fund(a) | | 0.810 | % | 0.650 | % | 0.600 | % | 0.800 | % |
Alger Capital Appreciation Focus Fund(b) | | 0.710 | | 0.600 | | — | | 0.710 | |
Alger Mid Cap Growth Institutional Fund(b) | | 0.760 | | 0.700 | | — | | 0.760 | |
Alger Small Cap Growth Institutional Fund(b) | | 0.810 | | 0.750 | | — | | 0.810 | |
(a) Tier 1 rate is paid on assets up to $2 billion, Tier 2 rate is paid on assets between $2 and $4 billion and Tier 3 rate is paid on assets in excess of $4 billion.
(b) Tier 1 rate is paid on assets up to $1 billion and Tier 2 rate is paid on assets in excess of $1 billion.
Alger Management has established an expense cap for the Alger Capital Appreciation Focus Fund Class A, Class C, Class I and Class Z shares, effective through February 28, 2014, whereby it reimburses the share classes if annualized operating expenses (excluding interest, taxes, brokerage, and extraordinary expenses) exceed the rates, based on average daily net assets, listed below:
66
THE ALGER INSTITUTIONAL FUNDS
NOTES TO FINANCIAL STATEMENTS (Continued)
| | CLASS | | FEES WAIVED /
REIMBURSED FOR
THE YEAR ENDED | |
| | A | | C | | I | | Z | | OCTOBER 31, 2013 | |
Alger Capital Appreciation Focus Fund | | 1.30 | % | 2.05 | % | 1.15 | % | 0.89 | % | $ | 115,733 | |
| | | | | | | | | | | | |
Alger Management voluntarily reduced its advisory fee for the Alger Capital Appreciation Focus Fund. For the period ended October 31, 2013, Alger Management voluntarily reimbursed the Alger Capital Appreciation Focus Fund $8,367.
(b) Administration Fees: Fees incurred by each Fund, pursuant to the provisions of the Trust’s Administration Agreement with Fred Alger Management, Inc., are payable monthly and computed based on the average daily net assets of each Fund at the annual rate of 0.0275%.
(c) Distribution Fees:
Class A Shares: The Trust has adopted a Distribution Plan pursuant to which Class A shares of Alger Capital Appreciation Focus Fund pay Fred Alger & Company, Incorporated, the Fund’s distributor (the “Distributor” or “Alger Inc.”) and an affiliate of Alger Management, a fee at the annual rate of 0.25% of the respective average daily net assets of the Class A shares of the Fund to compensate Alger Inc. for its activities and expenses incurred in distributing the Class A shares. The fees charged may be more or less than the expenses incurred by Alger Inc.
Class C Shares: The Trust has adopted a Distribution Plan pursuant to which Class C shares of Alger Capital Appreciation Focus Fund pay Alger Inc. a fee at the annual rate of 1% of the average daily net assets of the Class C shares of the Fund to compensate Alger Inc. for its activities and expenses incurred in distributing the Class C shares. The fees charged may be more or less than the expenses incurred by Alger Inc.
Class R Shares: The Trust has adopted a Distribution Plan pursuant to which Class R shares of each Fund pay Alger Inc. a fee at the annual rate of 0.50% of the respective average daily net assets of the Class R shares of the designated Fund to compensate Alger Inc. for its activities and expenses incurred in distributing the Class R shares. The fees charged may be more or less than the expenses incurred by the Distributor.
(d) Sales Charges: Purchases of shares of the Alger Capital Appreciation Focus may be subject to initial sales charges or contingent deferred sales charges. The contingent deferred sales charges are used by Alger Inc. to offset distribution expenses previously incurred. Sales charges do not represent expenses of the Trust. For the year ended October 31, 2013, the initial sales charges and contingent deferred sales charges imposed, all of which were retained by Fred Alger & Company, Incorporated, the Fund’s distributor were approximately $0 and $500, respectively.
(e) Brokerage Commissions: During the year ended October 31, 2013, the Alger Capital Appreciation Institutional Fund, Alger Capital Appreciation Focus Fund, Alger Mid Cap Growth Institutional Fund and Alger Small Cap Growth Institutional Fund paid Alger Inc. commissions of $1,484,686, $9,510, $138,975 and $626,880, respectively, in connection with securities transactions.
67
THE ALGER INSTITUTIONAL FUNDS
NOTES TO FINANCIAL STATEMENTS (Continued)
(f) Shareholder Administrative Fees: The Trust has entered into a shareholder administrative services agreement with Alger Management to compensate Alger Management for its liaison and administrative oversight of Boston Financial Data Services, Inc., the transfer agent, and other related services. The Funds compensate Alger Management at the annual rate of 0.0165% of their respective average daily net assets for the Class A and Class C shares and 0.01% of the daily net assets of the Class I, Class R and Class Z shares for these services.
Alger Management makes payments to intermediaries that provide sub-accounting services to omnibus accounts held by the Funds. A portion of the fees paid by Alger Management to intermediaries that provide sub-accounting services are charged back to the appropriate Fund, subject to certain limitations, as approved by the Trust’s Board of Trustees. For the year ended October 31, 2013, Alger Management charged back to the Alger Capital Appreciation Institutional Fund, Alger Capital Appreciation Focus Fund, Alger Mid Cap Growth Institutional Fund, and Alger Small Cap Growth Institutional Fund, $685,891, $7,726, $142,921 and $555,339, respectively, for these services, which are included in the transfer agent fees and expenses in the Statements of Operations.
(g) Trustee Fees: From November 1, 2012, through February 28, 2013, each Fund paid each trustee who is not affiliated with Alger Management or its affiliates $750 for each meeting attended, to a maximum of $3,000 per annum, plus travel expenses incurred for attending the meeting. The Chairman of the Board received an additional annual fee of $15,000 which was paid, pro rata, by all U.S.-registered funds managed by Alger Management. Additionally, each member of a Fund’s audit committee received $75 from the Fund for each audit committee meeting attended, to a maximum of $300 per annum.
Effective March 1, 2013, each Fund pays each trustee who is not affiliated with Alger Management or its affiliates $880 for each meeting attended, to a maximum of $3,520 per annum, plus travel expenses incurred for attending the meeting. The Chairman of the Board receives an additional annual fee of $22,500 which is paid, pro rata, by all U.S.-registered funds managed by Alger Management. Additionally, each member of a Fund’s audit committee receives $75 from the Fund for each audit committee meeting attended, to a maximum of $300 per annum.
(h) Interfund Loans: The Funds, along with other funds advised by Alger Management, may borrow money from and lend money to each other for temporary or emergency purposes. To the extent permitted under its investment restrictions, each fund may lend uninvested cash in an amount up to 15% of its net assets to other funds. If a fund has borrowed from other funds and has aggregate borrowings from all sources that exceed 10% of the fund’s total assets, such fund will secure all of its loans from other funds. The interest rate charged on interfund loans is equal to the average of the overnight time deposit rate and bank loan rate available to the funds. There were no interfund loans outstanding during the year ended October 31, 2013.
During the year ended October 31, 2013, Alger Capital Appreciation Focus Fund, Alger Mid Cap Growth Institutional Fund and Alger Small Cap Growth Institutional Fund incurred interest expenses of $2,390, $13,125 and $1,289, respectively, in connection with interfund loans.
68
THE ALGER INSTITUTIONAL FUNDS
NOTES TO FINANCIAL STATEMENTS (Continued)
(i) Other Transactions With Affiliates: Certain officers of the Trust are directors and officers of Alger Management and the Distributor. At October 31, 2013, Alger Management and its affiliates owned the following shares:
| | SHARE CLASS | |
| | A | | C | | I | | R | | Z | |
Alger Capital Appreciation Focus Fund | | 6,803 | | 6,803 | | — | | — | | 6,803 | |
(j) Shareholder Servicing Fees: The Trust has entered into a shareholder servicing agreement with Alger Inc. whereby Alger Inc. provides Class I shares and Class R shares of the Trust with ongoing servicing of shareholder accounts. As compensation for such services, the Class I shares and Class R shares of each Fund pay Alger Inc. a monthly fee at an annual rate of 0.25% of the value of the average daily net assets of those classes. The fees charged may be more or less than the expenses incurred by the Distributor.
NOTE 4 — Securities Transactions:
The following summarizes the securities transactions by the Funds, other than U.S. Government and short-term securities, for the year ended October 31, 2013:
| | PURCHASES | | SALES | |
Alger Capital Appreciation Institutional Fund | | $ | 2,612,978,149 | | $ | 2,514,224,905 | |
Alger Capital Appreciation Focus Fund | | 24,680,676 | | 30,447,752 | |
Alger Mid Cap Growth Institutional Fund | | 288,601,622 | | 371,625,714 | |
Alger Small Cap Growth Institutional Fund | | 737,684,200 | | 1,045,022,574 | |
| | | | | | | |
Written call and put options activity for the year ended October 31, 2013, was as follows:
| | NUMBER OF
CONTRACTS | | PREMIUMS
RECEIVED | |
Alger Mid Cap Growth Institutional Fund | | | | | |
Call Options outstanding at October 31, 2012 | | 1,203 | | $ | 242,293 | |
Call Options written | | 9,754 | | 2,315,082 | |
Call Options closed | | (4,531 | ) | (1,024,239 | ) |
Call Options expired | | (1,870 | ) | (319,493 | ) |
Call Options exercised | | (3,594 | ) | (987,243 | ) |
Call Options outstanding at October 31, 2013 | | 962 | | $ | 226,400 | |
69
THE ALGER INSTITUTIONAL FUNDS
NOTES TO FINANCIAL STATEMENTS (Continued)
| | NUMBER OF
CONTRACTS | | PREMIUMS
RECEIVED | |
Alger Mid Cap Growth Institutional Fund | | | | | |
Put Options outstanding at October 31, 2012 | | 1,239 | | $ | 214,975 | |
Put Options written | | 15,580 | | 3,235,760 | |
Put Options closed | | (5,690 | ) | (1,194,723 | ) |
Put Options expired | | (5,030 | ) | (855,622 | ) |
Put Options exercised | | (4,056 | ) | (923,590 | ) |
Put Options outstanding at October 31, 2013 | | 2,043 | | $ | 476,800 | |
As of October 31, 2013, Alger Mid Cap Growth Institutional Fund had portfolio securities and cash valued at $9,936,581, segregated as collateral for written options.
NOTE 5 — Borrowings:
The Funds may borrow from their custodian on an uncommitted basis. Each Fund pays the custodian a market rate of interest, generally based upon the London Interbank Offered Rate. The Funds may also borrow from other funds advised by Alger Management, as discussed in Note 3(h). For the year ended October 31, 2013, the Funds had the following borrowings:
| | AVERAGE DAILY
BORROWING | | WEIGHTED AVERAGE
INTEREST RATE | |
Alger Capital Appreciation Focus Fund | | $ | 219,547 | | 1.15 | % |
Alger Mid Cap Growth Institutional Fund | | 1,876,457 | | 1.50 | |
Alger Small Cap Growth Institutional Fund | | 116,237 | | 1.09 | |
| | | | | | |
The highest amount borrowed during the year ended October 31, 2013 for each Fund was as follows:
| | HIGHEST BORROWING | |
Alger Capital Appreciation Focus Fund | | $ | 5,150,000 | |
Alger Mid Cap Growth Institutional Fund | | 7,636,000 | |
Alger Small Cap Growth Institutional Fund | | 14,370,000 | |
| | | | |
NOTE 6 — Share Capital:
(a)The Trust has an unlimited number of authorized shares of beneficial interest of $.001 par value which are presently divided into four series. Each series is divided into two separate classes, except that the shares of Alger Capital Appreciation Focus Fund are divided into five separate classes. The transactions of shares of beneficial interest were as follows:
70
THE ALGER INSTITUTIONAL FUNDS
NOTES TO FINANCIAL STATEMENTS (Continued)
| | FOR THE YEAR ENDED
OCTOBER 31, 2013 | | FOR THE YEAR ENDED
OCTOBER 31, 2012 | |
| | SHARES | | AMOUNT | | SHARES | | AMOUNT | |
Alger Capital Appreciation Institutional Fund | | | | | | | | | |
Class I: | | | | | | | | | |
Shares sold | | 21,503,033 | | $ | 527,135,572 | | 27,268,813 | | $ | 599,933,680 | |
Dividends reinvested | | 2,816,247 | | 63,309,222 | | 1,899,304 | | 37,169,382 | |
Shares redeemed | | (19,231,001 | ) | (473,096,167 | ) | (14,726,747 | ) | (322,570,207 | ) |
Net increase | | 5,088,279 | | $ | 117,348,627 | | 14,441,370 | | $ | 314,532,855 | |
Class R: | | | | | | | | | |
Shares sold | | 4,781,638 | | $ | 110,376,397 | | 7,643,232 | | $ | 159,404,194 | |
Dividends reinvested | | 723,239 | | 15,412,221 | | 434,479 | | 8,133,448 | |
Shares redeemed | | (4,868,905 | ) | (112,115,654 | ) | (3,456,723 | ) | (72,485,810 | ) |
Net increase | | 635,972 | | $ | 13,672,964 | | 4,620,988 | | $ | 95,051,832 | |
| | | | | | | | | |
Alger Capital Appreciation Focus Fund | | | | | | | | | |
Class A: | | | | | | | | | |
Shares sold | | 199,296 | | $ | 3,306,697 | | — | | $ | — | |
Shares redeemed | | (12,261 | ) | (206,756 | ) | — | | — | |
Net increase | | 187,035 | | $ | 3,099,941 | | — | | $ | — | |
Class C: | | | | | | | | | |
Shares sold | | 107,823 | | $ | 1,688,349 | | — | | $ | — | |
Shares redeemed | | (4,851 | ) | (80,101 | ) | — | | — | |
Net increase | | 102,972 | | $ | 1,608,248 | | — | | $ | — | |
Class I: | | | | | | | | | |
Shares sold | | 192,409 | | $ | 3,158,003 | | 638,850 | | $ | 9,262,473 | |
Shares redeemed | | (767,418 | ) | (11,834,048 | ) | (784,518 | ) | (11,245,728 | ) |
Net decrease | | (575,009 | ) | $ | (8,676,045 | ) | (145,668 | ) | $ | (1,983,255 | ) |
Class R: | | | | | | | | | |
Shares sold | | 64,547 | | $ | 983,773 | | 107,333 | | $ | 1,487,495 | |
Shares redeemed | | (205,150 | ) | (3,158,506 | ) | (227,020 | ) | (3,165,971 | ) |
Net decrease | | (140,603 | ) | $ | (2,174,733 | ) | (119,687 | ) | $ | (1,678,476 | ) |
Class Z: | | | | | | | | | |
Shares sold | | 6,803 | | $ | 100,000 | | — | | $ | — | |
Net increase | | 6,803 | | $ | 100,000 | | — | | $ | — | |
71
THE ALGER INSTITUTIONAL FUNDS
NOTES TO FINANCIAL STATEMENTS (Continued)
| | FOR THE YEAR ENDED
OCTOBER 31, 2013 | | FOR THE YEAR ENDED
OCTOBER 31, 2012 | |
| | SHARES | | AMOUNT | | SHARES | | AMOUNT | |
Alger Mid Cap Growth Institutional Fund | | | | | | | | | |
Class I: | | | | | | | | | |
Shares sold | | 1,854,152 | | $ | 31,626,662 | | 3,127,646 | | $ | 43,915,977 | |
Dividends reinvested | | 23,607 | | 360,006 | | — | | — | |
Shares redeemed | | (6,258,073 | ) | (104,109,380 | ) | (14,186,588 | ) | (201,437,220 | ) |
Net decrease | | (4,380,314 | ) | $ | (72,122,712 | ) | (11,058,942 | ) | $ | (157,521,243 | ) |
Class R: | | | | | | | | | |
Shares sold | | 316,600 | | $ | 4,998,890 | | 551,108 | | $ | 7,360,055 | |
Dividends reinvested | | 5,780 | | 83,178 | | — | | — | |
Shares redeemed | | (960,803 | ) | (15,134,673 | ) | (1,328,452 | ) | (17,858,063 | ) |
Net decrease | | (638,423 | ) | $ | (10,052,605 | ) | (777,344 | ) | $ | (10,498,008 | ) |
| | | | | | | | | |
Alger Small Cap Growth Institutional Fund | | | | | | | | | |
Class I: | | | | | | | | | |
Shares sold | | 6,783,858 | | $ | 199,141,335 | | 7,589,293 | | $ | 210,556,809 | |
Dividends reinvested | | 3,718,319 | | 96,639,117 | | 1,691,801 | | 43,496,198 | |
Shares redeemed | | (15,532,917 | ) | (458,231,333 | ) | (17,778,509 | ) | (495,416,035 | ) |
Net decrease | | (5,030,740 | ) | $ | (162,450,881 | ) | (8,497,415 | ) | $ | (241,363,028 | ) |
Class R: | | | | | | | | | |
Shares sold | | 292,760 | | $ | 8,142,955 | | 367,848 | | $ | 9,839,818 | |
Dividends reinvested | | 195,542 | | 4,812,278 | | 97,573 | | 2,402,238 | |
Shares redeemed | | (958,711 | ) | (26,393,864 | ) | (1,096,876 | ) | (29,095,235 | ) |
Net decrease | | (470,409 | ) | $ | (13,438,631 | ) | (631,455 | ) | $ | (16,853,179 | ) |
(b)Redemption Fee: The Alger Capital Appreciation Focus Fund Class A and Class C may impose a 2.00% redemption fee on Fund shares redeemed (including shares redeemed by exchange) within 30 days after such shares were acquired. The fees retained by the Fund are included as paid-in capital on the Statement of Assets and Liabilities.
NOTE 7 — Income Tax Information:
The tax character of distributions paid during the year ended October 31, 2013 and the year ended October 31, 2012 were as follows:
| | FOR THE YEAR ENDED
OCTOBER 31, 2013 | | FOR THE YEAR ENDED
OCTOBER 31, 2012 | |
Alger Capital Appreciation Institutional Fund | | | | | |
Distributions paid from: | | | | | |
Ordinary Income | | $ | 40,475,461 | | $ | 34,779,651 | |
Long-term capital gain | | 41,792,939 | | 13,142,483 | |
Total distributions paid | | $ | 82,268,400 | | $ | 47,922,134 | |
72
THE ALGER INSTITUTIONAL FUNDS
NOTES TO FINANCIAL STATEMENTS (Continued)
| | FOR THE YEAR ENDED
OCTOBER 31, 2013 | | FOR THE YEAR ENDED
OCTOBER 31, 2012 | |
Alger Capital Appreciation Focus Fund | | | | | |
Distributions paid from: | | | | | |
Ordinary Income | | — | | — | |
Long-term capital gain | | — | | — | |
Total distributions paid | | — | | — | |
| | | | | |
Alger Mid Cap Growth Institutional Fund | | | | | |
Distributions paid from: | | | | | |
Ordinary Income | | 557,310 | | — | |
Long-term capital gain | | — | | — | |
Total distributions paid | | $ | 557,310 | | — | |
| | | | | |
Alger Small Cap Growth Institutional Fund | | | | | |
Distributions paid from: | | | | | |
Ordinary Income | | — | | — | |
Long-term capital gain | | 106,649,362 | | 48,581,377 | |
Total distributions paid | | $ | 106,649,362 | | $ | 48,581,377 | |
| | | | | | | |
As of October 31, 2013 the components of accumulated gains (losses) on a tax basis were as follows:
Alger Capital Appreciation Institutional Fund | | | | |
Undistributed ordinary income | | $ | 138,376,874 | |
Undistributed long-term gains | | $ | 157,954,816 | |
Net accumulated earnings | | 296,331,690 | |
Capital loss carryforwards | | — | |
Net unrealized appreciation | | 377,230,519 | |
Total accumulated earnings | | $ | 673,562,209 | |
Alger Capital Appreciation Focus Fund | | | |
Undistributed ordinary income | | — | |
Undistributed long-term gains | | — | |
Net accumulated earnings | | — | |
Capital loss carryforwards | | (6,156,871 | ) |
Late year ordinary income losses | | (53,350 | ) |
Net unrealized appreciation | | 2,249,317 | |
Total accumulated losses | | $ | (3,960,904 | ) |
| | | | |
73
THE ALGER INSTITUTIONAL FUNDS
NOTES TO FINANCIAL STATEMENTS (Continued)
Alger Mid Cap Growth Institutional Fund | | | |
Undistributed ordinary income | | — | |
Undistributed long-term gains | | — | |
Net accumulated earnings | | — | |
Capital loss carryforwards | | (323,089,650 | ) |
Late year ordinary income losses | | (757,231 | ) |
Net unrealized appreciation | | 21,122,186 | |
Total accumulated losses | | $ | (302,724,695 | ) |
| | | | |
Alger Small Cap Growth Institutional Fund | | | | |
Undistributed ordinary income | | $ | 22,883,112 | |
Undistributed long-term gains | | 140,281,659 | |
Net accumulated earnings | | 163,164,771 | |
Capital loss carryforwards | | — | |
Net unrealized appreciation | | 225,948,186 | |
Total accumulated earnings | | $ | 389,112,957 | |
At October 31, 2013, the Funds, for federal income tax purposes, had capital loss carryforwards which expire as set forth in the table below. These amounts may be applied against future net realized gains until the earlier of their utilization or expiration.
Expiration Dates | | Alger Capital
Appreciation
Institutional Fund | | Alger Capital
Appreciation
Focus Fund | | Alger Mid Cap
Growth
Institutional Fund | | Alger Small Cap
Growth
Institutional Fund | |
2016 | | — | | $ | 1,941,988 | | $ | 1,051,020 | | — | |
2017 | | — | | 4,214,883 | | 322,038,630 | | — | |
Total | | — | | 6,156,871 | | 323,089,650 | | — | |
| | | | | | | | | | | |
Under the Regulated Investment Company Modernization Act of 2010, capital losses incurred by the Funds after October 31, 2011 will not be subject to expiration (“POST ACT”). In addition, losses incurred after October 31, 2011 must be utilized prior to the utilization of capital loss carryforwards above.
During the year ended October 31, 2013 the Alger Capital Appreciation Focus Fund, and Alger Mid Cap Growth Institutional Fund utilized $2,711,009, and $17,308,818 of their capital loss carryforwards, respectively.
The difference between book-basis and tax-basis unrealized appreciation (depreciation) is determined annually and is attributable primarily to the tax deferral of losses on wash sales, 988 currency transactions, nondeductible expenses on dividends sold short, the tax treatment of partnerships investments, the realization of unrealized appreciation of passive foreign investment companies, and return of capital from real estate investment trust investments.
Permanent differences, primarily from net operating losses and real estate investment trusts and partnership investments sold by the Funds, resulted in the following reclassifications among each Fund’s components of net assets at October 31, 2013:
74
THE ALGER INSTITUTIONAL FUNDS
NOTES TO FINANCIAL STATEMENTS (Continued)
Alger Capital Appreciation Institutional Fund | | | | |
Accumulated undistributed net investment income (accumulated loss) | | $ | (565,927 | ) |
Accumulated net realized gain (accumulated realized loss) | | $ | 565,927 | |
Paid-in Capital | | $ | — | |
Alger Capital Appreciation Focus Fund | | | | |
Accumulated undistributed net investment income (accumulated loss) | | $ | (4,420 | ) |
Accumulated net realized gain (accumulated realized loss) | | $ | 4,420 | |
Paid-in Capital | | $ | — | |
Alger Mid Cap Growth Institutional Fund | | | | |
Accumulated undistributed net investment income (accumulated loss) | | $ | (37,697 | ) |
Accumulated net realized gain (accumulated realized loss) | | $ | 37,697 | |
Paid-in Capital | | $ | — | |
Alger Small Cap Growth Institutional Fund | | | | |
Accumulated undistributed net investment income (accumulated loss) | | $ | 8,767,864 | |
Accumulated net realized gain (accumulated realized loss) | | $ | (8,767,864 | ) |
Paid-in Capital | | $ | — | |
NOTE 8 — Fair Value Measurements:
The major categories of securities and their respective fair value inputs are detailed in each Fund’s Schedule of Investments. The following is a summary of the inputs used as of October 31, 2013 in valuing the Funds’ investments carried at fair value on a recurring basis. Based upon the nature, characteristics, and risks associated with their investments, the Funds have determined that presenting them by security type and sector is appropriate.
Alger Capital Appreciation
Institutional Fund | | TOTAL FUND | | LEVEL 1 | | LEVEL 2 | | LEVEL 3 | |
COMMON STOCKS | | | | | | | | | |
Consumer Discretionary | | $ | 554,320,877 | | $ | 554,320,877 | | — | | — | |
Consumer Staples | | 167,250,623 | | 167,250,623 | | — | | — | |
Energy | | 132,686,109 | | 132,686,109 | | — | | — | |
Financials | | 117,676,764 | | 117,676,764 | | — | | — | |
Health Care | | 365,090,770 | | 365,090,770 | | — | | — | |
Industrials | | 239,070,754 | | 239,070,754 | | — | | — | |
Information Technology | | 647,406,424 | | 647,406,424 | | — | | — | |
Materials | | 64,708,359 | | 64,708,359 | | — | | — | |
Telecommunication Services | | 15,612,641 | | 15,612,641 | | — | | — | |
TOTAL COMMON STOCKS | | $ | 2,303,823,321 | | $ | 2,303,823,321 | | — | | — | |
75
THE ALGER INSTITUTIONAL FUNDS
NOTES TO FINANCIAL STATEMENTS (Continued)
Alger Capital Appreciation
Institutional Fund | | TOTAL FUND | | LEVEL 1 | | LEVEL 2 | | LEVEL 3 | |
MASTER LIMITED PARTNERSHIP | | | | | | | | | |
Financials | | $ | 27,969,804 | | $ | 27,969,804 | | — | | — | |
REAL ESTATE INVESTMENT TRUST | | | | | | | | | |
Financials | | 9,313,310 | | 9,313,310 | | — | | — | |
TOTAL INVESTMENTS IN SECURITIES | | $ | 2,341,106,435 | | $ | 2,341,106,435 | | — | | — | |
Alger Capital Appreciation Focus
Fund | | TOTAL FUND | | LEVEL 1 | | LEVEL 2 | | LEVEL 3 | |
COMMON STOCKS | | | | | | | | | |
Consumer Discretionary | | 4,301,862 | | 4,301,862 | | — | | — | |
Consumer Staples | | 990,255 | | 990,255 | | — | | — | |
Energy | | 1,057,992 | | 1,057,992 | | — | | — | |
Financials | | 1,082,540 | | 1,082,540 | | — | | — | |
Health Care | | 2,061,403 | | 2,061,403 | | — | | — | |
Industrials | | 1,841,885 | | 1,841,885 | | — | | — | |
Information Technology | | 4,151,023 | | 4,151,023 | | — | | — | |
Materials | | 572,146 | | 572,146 | | — | | — | |
TOTAL COMMON STOCKS | | $ | 16,059,106 | | $ | 16,059,106 | | — | | — | |
MASTER LIMITED PARTNERSHIP | | | | | | | | | |
Financials | | 571,853 | | 571,853 | | — | | — | |
TOTAL INVESTMENTS IN SECURITIES | | $ | 16,630,959 | | $ | 16,630,959 | | — | | — | |
Alger Mid Cap Growth Institutional
Fund | | TOTAL FUND | | LEVEL 1 | | LEVEL 2 | | LEVEL 3 | |
COMMON STOCKS | | | | | | | | | |
Consumer Discretionary | | 47,625,796 | | 47,625,796 | | — | | — | |
Consumer Staples | | 11,312,509 | | 11,312,509 | | — | | — | |
Energy | | 10,915,381 | | 10,915,381 | | — | | — | |
Financials | | 9,007,636 | | 9,007,636 | | — | | — | |
Health Care | | 23,284,770 | | 23,284,770 | | — | | — | |
Industrials | | 27,509,944 | | 27,509,944 | | — | | — | |
Information Technology | | 28,441,601 | | 28,441,601 | | — | | — | |
Materials | | 9,862,589 | | 9,862,589 | | — | | — | |
Telecommunication Services | | 3,995,634 | | 3,995,634 | | — | | — | |
TOTAL COMMON STOCKS | | $ | 171,955,860 | | $ | 171,955,860 | | — | | — | |
MASTER LIMITED PARTNERSHIP | | | | | | | | | |
Financials | | 2,129,160 | | 2,129,160 | | — | | — | |
PURCHASED OPTIONS | | | | | | | | | |
Energy | | 25,304 | | 22,164 | | 3,140 | | — | |
REAL ESTATE INVESTMENT TRUST | | | | | | | | | |
Financials | | 890,100 | | 890,100 | | — | | — | |
TOTAL INVESTMENTS IN SECURITIES | | $ | 175,000,424 | | $ | 174,997,284 | | $ | 3,140 | | — | |
| | | | | | | | | | | | |
76
THE ALGER INSTITUTIONAL FUNDS
NOTES TO FINANCIAL STATEMENTS (Continued)
Alger Mid Cap Growth Institutional
Fund | | TOTAL FUND | | LEVEL 1 | | LEVEL 2 | | LEVEL 3 | |
SECURITIES SOLD SHORT | | | | | | | | | |
OPTIONS WRITTEN | | | | | | | | | |
Energy | | $ | 710,638 | | $ | 401,833 | | $ | 308,805 | | — | |
| | | | | | | | | | | | |
Alger Small Cap Growth Institutional
Fund | | TOTAL FUND | | LEVEL 1 | | LEVEL 2 | | LEVEL 3 | |
COMMON STOCKS | | | | | | | | | |
Consumer Discretionary | | 167,957,482 | | 167,957,482 | | — | | — | |
Consumer Staples | | 33,037,518 | | 33,037,518 | | — | | — | |
Energy | | 39,449,020 | | 39,449,020 | | — | | — | |
Financials | | 47,570,994 | | 47,570,994 | | — | | — | |
Health Care | | 185,065,638 | | 185,065,638 | | — | | — | |
Industrials | | 147,046,617 | | 147,046,617 | | — | | — | |
Information Technology | | 238,245,228 | | 238,245,228 | | — | | — | |
Materials | | 48,321,012 | | 48,321,012 | | — | | — | |
Telecommunication Services | | 10,695,328 | | 10,695,328 | | — | | — | |
TOTAL COMMON STOCKS | | $ | 917,388,837 | | $ | 917,388,837 | | — | | — | |
MASTER LIMITED PARTNERSHIP | | | | | | | | | |
Financials | | 8,820,174 | | 8,820,174 | | — | | — | |
REAL ESTATE INVESTMENT TRUST | | | | | | | | | |
Financials | | 18,938,834 | | 18,938,834 | | — | | — | |
TOTAL INVESTMENTS IN SECURITIES | | $ | 945,147,845 | | $ | 945,147,845 | | — | | — | |
On October 31, 2013 there were no transfers of securities between Level 1 and Level 2.
Certain of the Fund’s assets and liabilities are held at carrying amount or face value, which approximates fair value for financial statement purposes. As of October 31, 2013, such assets are categorized within the disclosure hierarchy as follows:
| | TOTAL FUND | | LEVEL 1 | | LEVEL 2 | | LEVEL 3 | |
Cash and cash equivalents: | | | | | | | | | |
Alger Capital Appreciation Institutional Fund | | 87,935,479 | | 87,935,479 | | — | | — | |
Alger Capital Appreciation Focus Fund | | 624,379 | | 624,379 | | — | | — | |
Alger Mid Cap Growth Institutional Fund | | 6,549,286 | | 6,549,286 | | — | | — | |
Alger Small Cap Growth Institutional Fund | | 36,701,580 | | 36,701,580 | | — | | — | |
Total | | $ | 131,810,724 | | $ | 131,810,724 | | — | | — | |
Bank overdraft: | | | | | | | | | |
Alger Mid Cap Growth Institutional Fund | | 768,418 | | — | | $ | 768,418 | | — | |
Total | | $ | 768,418 | | — | | $ | 768,418 | | — | |
| | | | | | | | | | | | |
77
THE ALGER INSTITUTIONAL FUNDS
NOTES TO FINANCIAL STATEMENTS (Continued)
NOTE 9 — Derivatives:
Financial Accounting Standards Board Accounting Standards Codification 815 — Derivatives and Hedging (“ASC 815”) requires qualitative disclosures about objectives and strategies for using derivatives, quantitative disclosures about fair value amounts of and gains and losses on derivative instruments, and disclosures about credit-risk-related contingent features in derivative agreements.
Forward currency contracts—In connection with portfolio purchases and sales of securities denominated in foreign currencies, the Funds may enter into forward currency contracts. Additionally, each Fund may enter into such contracts to economically hedge certain other foreign currency denominated investments. These contracts are valued at the current cost of covering or offsetting such contracts, and the related realized and unrealized foreign exchange gains and losses are included in the Statement of Operations. In the event that counterparties fail to settle these currency contracts or the related foreign security trades, a Fund could be exposed to foreign currency fluctuations.
Options—The Funds seek to capture the majority of the returns associated with equity market investments. To meet this investment goal, the Funds invest in a broadly diversified portfolio of common stocks, while also buying and selling call and put options on equities and equity indices. The Funds purchase call options to increase their exposure to the stock market and also provide diversification of risk. The Funds purchase put options in order to protect from significant market declines that may occur over a short period of time. The Funds will write covered call and cash secured put options to generate cash flows while reducing the volatility of the Funds’ portfolios. The cash flows may be an important source of the Funds’ returns, although written call options may reduce the Funds’ ability to profit from increases in the value of the underlying security or equity portfolio. The value of a call option generally increases as the price of the underlying stock increases and decreases as the stock decreases in price. Conversely, the value of a put option generally increases as the price of the underlying stock decreases and decreases as the stock increases in price. The combination of the diversified stock portfolio and the purchase and sale of options is intended to provide the Funds with the majority of the returns associated with equity market investments but with reduced volatility and returns that are augmented with the cash flows from the sale of options. During the year ended October 31, 2013, options were used in accordance with these objectives.
The fair values of derivative instruments as of October 31, 2013 are as follows:
78
THE ALGER INSTITUTIONAL FUNDS
NOTES TO FINANCIAL STATEMENTS (Continued)
Alger Mid Cap Growth Institutional Fund
| | ASSET DERIVATIVES 2013 | | LIABILITY DERIVATIVES 2013 | |
Derivatives not accounted
for as hedging instruments | | Balance Sheet
Location | | Fair Value | | Balance Sheet
Location | | Fair Value | |
Purchased Put Options | | Investments in Securities, at value | | $ | 22,804 | | — | | — | |
Purchased Call Options | | Investments in Securities, at value | | 2,500 | | — | | — | |
Written Put Options | | — | | — | | Written Options Outstanding, at value | | $ | 435,321 | |
Written Call Options | | — | | — | | Written Options Outstanding, at value | | 275,317 | |
Total | | | | $ | 25,304 | | | | $ | 710,638 | |
For the year ended October 31, 2013, Alger Mid Cap Growth Institutional Fund had option purchases of $2,392,927 and option sales of $6,375,636. The effect of derivative instruments on the Statement of Operations for the year ended October 31, 2013 is as follows:
NET REALIZED GAIN ON INVESTMENTS AND OPTIONS
Alger Mid Cap Growth Institutional Fund
Derivatives not accounted for as hedging instruments | | Options | |
Purchased Options | | $ | 84,352 | |
Written Options | | 3,388,326 | |
Total | | $ | 3,472,678 | |
NET CHANGE IN UNREALIZED APPRECIATION ON INVESTMENTS, OPTIONS
Alger Mid Cap Growth Institutional Fund
Derivatives not accounted for as hedging instruments | | Options | |
Purchased Options | | $ | (30,622 | ) |
Written Options | | (45,914 | ) |
Total | | $ | (76,536 | ) |
NOTE 10 — Recent Accounting Pronouncements:
In December 2011, the FASB issued ASU 2011-11, Balance Sheet (Topic 210): Disclosures about Offsetting Assets and Liabilities (“ASU 2011-11”), which provides guidance regarding balance sheet offsetting disclosures. The amendments in ASU 2011-11 require an entity to disclose information about offsetting and related arrangements to enable users of its financial statements to understand the effects of those arrangements on its financial position. Entities are required to disclose gross information and net information about both instruments and transactions eligible for offset in the statement of assets and liabilities and transactions subject to an agreement similar to a master netting arrangement. The objective of ASU 2011-11 is to facilitate comparison between those
79
THE ALGER INSTITUTIONAL FUNDS
NOTES TO FINANCIAL STATEMENTS (Continued)
entities that prepare their financial statements on the basis of GAAP and those entities that prepare their financial statements on the basis of IFRS. In January 2013, the FASB issued ASU No. 2013-01, Clarifying the Scope of Disclosures about Offsetting Assets and Liabilities, which narrows the scope required by the new disclosures of ASU 2011-11. The new guidance is effective for annual reporting periods beginning on or after January 1, 2013. Management is currently evaluating the impact that this guidance will have on its financial statements.
In June 2013, the FASB issued ASU 2013-08, Financial Services — Investment Companies (Topic 946): Amendments to the Scope, Measurement, and Disclosure Requirements (“ASU 2013-08”). The amendments in ASU 2013-08 include an accounting update that modifies the criteria used in defining an investment company under GAAP and sets forth certain measurement and disclosure requirements. This update requires an investment company to measure noncontrolling interests in another investment company at fair value and requires an entity to disclose the fact that it is an investment company, and provide information about changes, if any, in its status as an investment company. An entity will also need to include disclosures around financial support that has been provided or is contractually required to be provided to any of its investees. The new guidance is effective for annual reporting periods beginning on or after January 1, 2014. The Funds do not believe that this will have a material impact on the financial statements.
NOTE 11 — Subsequent Events:
Management of each Fund has evaluated events that have occurred subsequent to October 31, 2013 through the issuance date of the Financial Statements. No such events have been identified which require recognition and/or disclosure other than the liquidation of the Alger Capital Appreciation Focus Fund Class R shares effective November 25, 2013.
80
REPORT OF INDEPENDENT REGISTERED PUBLIC ACCOUNTING FIRM
To the Shareholders and Board of Trustees of
The Alger Institutional Funds:
We have audited the accompanying statements of assets and liabilities, including the schedules of investments, of The Alger Institutional Funds, comprised of the Alger Capital Appreciation Institutional Fund, Alger Capital Appreciation Focus Fund (formerly Alger Large Cap Growth Institutional Fund), Alger Mid Cap Growth Institutional Fund, and Alger Small Cap Growth Institutional Fund (the “Funds”) as of October 31, 2013, and the related statements of operations for the year then ended, the statements of changes in net assets for each of the two years in the period then ended, and the financial highlights for each of the five years in the period then ended. These financial statements and financial highlights are the responsibility of the Funds’ management. Our responsibility is to express an opinion on these financial statements and financial highlights based on our audits.
We conducted our audits in accordance with the standards of the Public Company Accounting Oversight Board (United States). Those standards require that we plan and perform the audit to obtain reasonable assurance about whether the financial statements and financial highlights are free of material misstatement. The Funds are not required to have, nor were we engaged to perform, an audit of their internal control over financial reporting. Our audits included consideration of internal control over financial reporting as a basis for designing audit procedures that are appropriate in the circumstances, but not for the purpose of expressing an opinion on the effectiveness of the Funds’ internal control over financial reporting. Accordingly, we express no such opinion. An audit also includes examining, on a test basis, evidence supporting the amounts and disclosures in the financial statements, assessing the accounting principles used and significant estimates made by management, as well as evaluating the overall financial statement presentation. Our procedures included confirmation of securities owned as of October 31, 2013, by correspondence with the custodian and brokers; where replies were not received from brokers, we performed other auditing procedures. We believe that our audits provide a reasonable basis for our opinion.
In our opinion, the financial statements and financial highlights referred to above, present fairly, in all material respects, the financial position of each of the portfolios constituting The Alger Institutional Funds as of October 31, 2013, the results of their operations for the year then ended, the changes in their net assets for each of the two years in the period then ended, and the financial highlights for each of the five years in the period then ended, in conformity with accounting principles generally accepted in the United States of America.
Deloitte & Touche LLP
New York, New York
December 23, 2013
81
THE ALGER INSTITUTIONAL FUNDS
ADDITIONAL INFORMATION (Unaudited)
Expense Example
As a shareholder of a Fund, you incur two types of costs: transaction costs, if applicable, including sales charges (loads) and redemption fees; and ongoing costs, including management fees, distribution (12b-1) fees, if applicable, and other fund expenses. This example is intended to help you understand your ongoing costs (in dollars) of investing in the Fund and to compare these costs with the ongoing costs of investing in other mutual funds.
The example below is based on an investment of $1,000 invested at the beginning of the six-month period starting May 1, 2013 and ending October 31, 2013.
Actual Expenses
The first line for each class of shares in the table below provides information about actual account values and actual expenses. You may use the information in this line, together with the amount you invested, to estimate the expenses that you would have paid over the period. Simply divide your account value by $1,000 (for example, an $8,600 account value divided by $1,000 = 8.6), then multiply the result by the number in the first line under the heading entitled “Expenses Paid during the Period” to estimate the expenses you paid on your account during this period.
Hypothetical Example for Comparison Purposes
The second line for each class of shares in the table below provides information about hypothetical account values and hypothetical expenses based on the Fund’s actual expense ratios for each class of shares and an assumed rate of return of 5% per year before expenses, which is not the Fund’s actual return. The hypothetical account values and expenses may not be used to estimate the actual ending account balance or expenses you paid for the period. You may use this information to compare the ongoing costs of investing in the Fund and other funds. To do so, compare this 5% hypothetical example with the 5% hypothetical examples that appear in the shareholder reports of other funds.
Please note that the expenses shown in the table are meant to highlight your ongoing costs only and do not reflect any transaction costs, such as sales charges (loads) and redemption fees. Therefore, the second line under each class of shares in the table is useful in comparing ongoing costs only, and will not help you determine the relative total costs of owning different funds. In addition, if these transactional costs were included, your costs would have been higher.
82
| | | | | | | | | Annualized | |
| | | | | | | Expenses | | Expense Ratio | |
| | | Beginning | | Ending | | Paid During | | For the | |
| | | Account | | Account | | the Six Months | | Six Months | |
| | | Value | | Value | | Ended | | Ended | |
| | | May 1, 2013 | | October 31, 2013 | | October 31, 2013(a) | | October 31, 2013(b) | |
Alger Capital Appreciation Institutional Fund | | | | | | | | | |
Class I | Actual | | $ | 1,000.00 | | $ | 1,153.78 | | $ | 6.46 | | 1.19 | % |
| Hypothetical(c) | | 1,000.00 | | 1,019.21 | | 6.06 | | 1.19 | |
Class R | Actual | | 1,000.00 | | 1,150.82 | | 9.16 | | 1.69 | |
| Hypothetical(c) | | 1,000.00 | | 1,016.69 | | 8.59 | | 1.69 | |
| | | | | | | | | | |
Alger Capital Appreciation Focus Fund | | | | | | | | | |
Class A | Actual | | $ | 1,000.00 | | $ | 1,169.59 | | $ | 7.11 | | 1.30 | % |
| Hypothetical(c) | | 1,000.00 | | 1,018.65 | | 6.61 | | 1.30 | |
Class C | Actual | | 1,000.00 | | 1,165.62 | | 11.14 | | 2.05 | |
| Hypothetical(c) | | 1,000.00 | | 1,014.92 | | 10.36 | | 2.05 | |
Class I | Actual | | 1,000.00 | | 1,170.73 | | 7.55 | | 1.38 | |
| Hypothetical(c) | | 1,000.00 | | 1,018.25 | | 7.02 | | 1.38 | |
Class R | Actual | | 1,000.00 | | 1,159.70 | | 15.09 | | 2.78 | |
| Hypothetical(c) | | 1,000.00 | | 1,011.16 | | 14.05 | | 2.78 | |
Class Z | Actual | | 1,000.00 | | 1,171.88 | | 4.87 | | 0.89 | |
| Hypothetical(c) | | 1,000.00 | | 1,020.72 | | 4.53 | | 0.89 | |
| | | | | | | | | | |
Alger Mid Cap Growth Institutional Fund | | | | | | | | | |
Class I | Actual | | $ | 1,000.00 | | $ | 1,140.26 | | $ | 6.96 | | 1.29 | % |
| Hypothetical(c) | | 1,000.00 | | 1,018.70 | | 6.56 | | 1.29 | |
Class R | Actual | | 1,000.00 | | 1,137.69 | | 9.64 | | 1.79 | |
| Hypothetical(c) | | 1,000.00 | | 1,016.18 | | 9.10 | | 1.79 | |
| | | | | | | | | | |
Alger Small Cap Growth Institutional Fund | | | | | | | | | |
Class I | Actual | | $ | 1,000.00 | | $ | 1,174.26 | | $ | 6.85 | | 1.25 | % |
| Hypothetical(c) | | 1,000.00 | | 1,018.90 | | 6.36 | | 1.25 | |
Class R | Actual | | 1,000.00 | | 1,171.80 | | 9.47 | | 1.73 | |
| Hypothetical(c) | | 1,000.00 | | 1,016.48 | | 8.79 | | 1.73 | |
83
(a) Expenses are equal to the annualized expense ratio of the respective share class, multiplied by the average account value over the period, multiple by 184/365 (to reflect the one-half year period).
(b) Annualized.
(c) 5% annual return before expenses.
Trustees and Officers of the Trust
Information about the trustees and officers of the Trust is set forth below. In the table the term “Alger Fund Complex” refers to the Trust, The Alger Funds, The Alger Portfolios, Alger Global Growth Fund and The Alger Funds II, each of which is a registered investment company managed by Fred Alger Management, Inc. (“Alger Management”). Each Trustee serves until an event of termination, such as death or resignation, or until his or her successor is duly elected; each officer’s term of office is one year. Unless otherwise noted, the address of each person named below is 360 Park Avenue South, New York, NY 10010.
84
Name, Age, Position with the
Fund | | Principal Occupations | | Trustee
and/or
Officer
Since | | Number of
Funds in
the Alger
Fund
Complex
which are
Overseen
by Trustee |
INTERESTED TRUSTEE | | | | | | |
| | | | | | |
Hilary M. Alger (52) | | Director of Development, Pennsylvania Ballet since 2004; Associate Director of Development, College of Arts and Sciences and Graduate School, University of Virginia 1999-2003. | | 2003 | | 25 |
NON-INTERESTED TRUSTEE | | | | | | |
| | | | | | |
Charles F. Baird, Jr. (60) | | Managing Partner of North Castle Partners, a private equity securities group; Chairman of Leiner Health Products, Enzymatic Therapy and Caleel & Hayden (skincare business); former Chairman of Elizabeth Arden Day Spas, Naked Juice, Equinox (fitness company) and EAS (manufacturer of nutritional products). Formerly Managing Director of AEA Investors, Inc. | | 2000 | | 25 |
Roger P. Cheever (68) | | Associate Vice President for Principal Gifts, and Senior Associate Dean for Development in the Faculty of Arts and Sciences at Harvard University; Formerly Deputy Director of the Harvard College Fund. | | 2000 | | 25 |
Lester L. Colbert Jr. (79) | | Private investor since 1988; Formerly Chairman of the Board, President and Chief Executive Officer of Xidex Corporation (manufacturer of computer information media). | | 2000 | | 25 |
Stephen E. O’Neil (81) | | Attorney. Private Investor since 1981. Formerly of Counsel to the law firm of Kohler & Barnes. | | 1986 | | 25 |
David Rosenberg (51) | | Associate Professor of Law since January 2006 (Assistant Professor 2000-2005), Zicklin School of Business, Baruch College, City University of New York. | | 2007 | | 25 |
Nathan E. Saint-Amand M.D. (76) | | Medical doctor in private practice; Member of the Board of the Manhattan Institute (non-profit policy research) since 1988; Formerly Co-Chairman, Special Projects Committee, Memorial Sloan Kettering. | | 1986 | | 25 |
85
Name, Age, Position with the
Fund | | Principal Occupations | | Trustee
and/or
Officer
Since | | Number of
Funds in
the Alger
Fund
Complex
which are
Overseen
by Trustee |
OFFICERS | | | | | | |
| | | | | | |
Hal Liebes (49) President | | Executive Vice President, Chief Operating Officer, Chief Legal Officer and Secretary of Alger Management and Alger Inc.; Director since 2006 of Alger Management, Alger Inc. and Resources. | | 2005 | | N/A |
Lisa A. Moss (48) Secretary | | Senior Vice President since 2009, and Vice President and Assistant General Counsel of Alger Management since June 2006. | | 2006 | | N/A |
Michael D. Martins (48) Treasurer | | Senior Vice President of Alger Management; Assistant Treasurer since 2004. | | 2005 | | N/A |
Anthony S. Caputo (58) Assistant Treasurer | | Employed by Alger Management since 1986, currently serving as Vice President. | | 2007 | | N/A |
Sergio M. Pavone (52) Assistant Treasurer | | Employed by Alger Management since 2002, currently serving as Vice President. | | 2007 | | N/A |
Barry J. Mullen (60) Chief Compliance Officer | | Senior Vice President and Chief Compliance officer for Alger Management since May 2006. | | 2006 | | N/A |
Steven B. Levine (27) Assistant Secretary | | Paralegal at Alger Management since 2012. Senior Paralegal at the Dreyfus Corporation from 2008 — 2012. | | 2012 | | N/A |
Ms. Alger is an “interested person” (as defined in the Investment Company Act) of the Fund because of her affiliations with Alger Management. No Trustee is a director of any public company except as indicated under “Principal Occupations”.
The Statement of Additional Information contains additional information about the Fund’s Trustees and is available without charge upon request by calling (800) 992-3863.
86
Investment Management Agreement Renewal
At an in-person meeting held on September 24, 2013, the Trustees, including the Independent Trustees, unanimously approved renewal of the Investment Advisory Agreement (the “Agreement”) between the Trust and Fred Alger Management, Inc. (“Alger Management”). The Independent Trustees were assisted in their review by independent legal counsel and met with such counsel in executive session separate from representatives of Alger Management.
In evaluating the Agreement, the Trustees drew on materials that they had requested and which were provided to them in advance of the meeting by Alger Management and by counsel. The materials covered, among other matters, (i) the nature, extent and quality of the services provided by Alger Management under the Agreement, (ii) the investment performance of each of the Trust’s portfolios (each a “Fund”), (iii) the costs to Alger Management of its services and the profits realized by Alger Management and Fred Alger & Company, Incorporated (“Alger Inc.”) from their relationship with the Trust, and (iv) the extent to which economies of scale would be realized if and as the Funds grow and whether the fee levels in the Agreement reflect these economies of scale. These materials included an analysis of the Funds and Alger Management’s services by FUSE Research Network LLC (“FUSE”), an independent consulting firm selected by the Trust’s Chief Compliance Officer and having no other material relationship with Alger Management or its affiliates. FUSE’s specialties include, among other things, assistance to fund trustees and directors in their review of advisory contracts pursuant to section 15(c) of the Investment Company Act of 1940, as amended. At the September meeting of the Trustees, senior FUSE personnel reviewed with the Trustees a presentation covering all of the Funds.
In deciding whether to approve renewal of the Agreement, the Trustees considered various factors, including those enumerated above. They also considered other direct and indirect benefits to Alger Management and its affiliates from their relationship with the Trust.
Nature, Extent and Quality of Services. In considering the nature, extent and quality of the services provided by Alger Management pursuant to the Agreement, the Trustees relied on their prior experience as Trustees of the Trust, their familiarity with the personnel and resources of Alger Management and its affiliates, and the materials provided at the meeting. They noted that under the Agreement Alger Management is responsible for managing the investment operations of the Funds. The Trustees reviewed the background and experience of Alger Management’s senior investment management personnel, including the individuals currently responsible for the investment operations of the Funds. They also considered the resources and practices of Alger Management in managing each Fund’s portfolio, as well as Alger Management’s overall investment management business. They noted especially Alger Management’s established expertise in managing portfolios of “growth” stocks and that, according to an analysis provided by FUSE, the characteristics of each Fund had been consistent with those of a fund that holds itself out to investors as growth-oriented. The Trustees concluded that Alger Management’s experience, resources and strength in the areas of importance to the Funds are considerable. The Trustees considered the level and depth of Alger Management’s
87
ability to execute portfolio transactions to effect investment decisions, including those through Alger Inc. They also noted that certain administrative, compliance, reporting and accounting services necessary for the conduct of the Trust’s affairs are provided under a separate Administration Agreement with Alger Management. The Trustees also considered the control and compliance environment at Alger Management and within the Trust.
Investment Performance of the Funds. Drawing upon information provided at the meeting by Alger Management as well as FUSE and upon reports provided to the Trustees by Alger Management throughout the preceding year, the Trustees reviewed each Fund’s returns for the year-to-date (at 6/30/13), second-quarter of 2013, 1-, 3- and 5-year, and longer periods to the extent available (and its year-by-year returns), together with supplemental data through 8/31/13, and compared them with benchmark and peer-group data for the same periods. They noted that the performance of each of the Mid Cap, Capital Appreciation and Small Cap Funds for the year ended 6/30/13 had surpassed the median for its FUSE peer group, while falling short of the applicable bench mark. (The Capital Appreciation Focus Fund had been constituted in its present form at 12/31/12, so that its performance commenced only in the year-to-date period.) The Mid Cap Fund also generally performed well against its peers in the year-to-date and second-quarter of 2013 periods, but the other three Funds failed against their peer medians and benchmarks in those more recent periods. Relative performance for the longer 3- and 5-year periods was generally similar to that of the shorter terms for the Small Cap Fund but was generally inferior with respect to its peers in the case of the Mid Cap Fund, whose near-term performance against its peers therefore marked an improvement. The Trustees noted that the Capital Appreciation strategy had strong long-term performance, while the Small Cap strategy had consistently outperformed its benchmark in the past. Representatives of Alger Management discussed with the Trustees measures that the firm had instituted or was in the process of instituting to improve the performance of the Funds that had underperformed. On the basis of their review and the discussions with Alger Management, the Trustees determined that the performance of the Funds was acceptable.
Fund Fees and Expense Ratios; Profitability to Alger Management and its Affiliates. The Trustees reviewed each Fund’s management fee and expense ratio and compared them with a group of comparable funds. In order to assist the Trustees in this comparison, FUSE had provided the Trustees with comparative information with respect to the advisory fees and expense ratios of relevantly similar funds. That information indicated that the fees of three of the Funds were near, at or below the median for their comparison groups, while the fee of the Capital Appreciation Fund was significantly above the applicable median. That fee, just barely in the top quartile of peer-fund fees, and its associated expense ratios were expected to fall somewhat by operation of the Fund’s fee breakpoint if and as Fund assets grow. Of the 11 expense ratios for the Funds’ various share classes, three were below their peer medians. Five of the remaining eight were for Funds of small asset size that suffered thereby in comparison with their peers. Only three of the remaining eight placed in the top quartile of the applicable reference group; all of these three were for Class R Shares, whose comparatively high 12b-1 and service fee charges exceeded those of many funds in their reference groups with the result that the Classes’ expenses were not compared solely with those of true peers. The Trustees determined that such information should be taken into account in weighing the
88
size of the fee against the nature, extent and quality of the services provided. The Trustees also considered fees paid to Alger Management by three other types of clients, specifically mutual funds for which Alger Management was sub-adviser, separately managed institutional accounts, and wrap programs. The Trustees determined that in all three cases the fees were of doubtful relevance for purposes of comparison with those of the Funds because of the differences in services provided by Alger Management to those types of clients as opposed to the Funds, but that to the extent that meaningful comparison was practicable, the differences in services adequately explained the differences in the fees. The Trustees then considered the profitability of the Investment Advisory Agreement to Alger Management and its affiliates, and the methodology used by Alger Management in determining such profitability. The Trustees reviewed previously-provided data on each Fund’s profitability to Alger Management and its affiliates for the year ended June 30, 2013. After discussing with representatives of the Adviser and FUSE the expense-allocation practices used in computing the costs that formed the bases of the profitability calculations, the Trustees turned to the profitability data provided. After analysis and discussion, they concluded in each case that, to the extent that Alger Management’s and its affiliates’ relationships with the Fund had been profitable, the profit margin was not unacceptable.
Economies of Scale. On the basis of their discussions with management and their analysis of information provided at the meeting, the Trustees determined that the nature of the Funds and their operations is such that Alger Management is likely to realize economies of scale in the management of each Fund at some point as (and if) it grows in size. In that connection they noted that in 2012 they and Alger Management had revised the advisory fee schedules in the Agreement to reflect fee reductions for each Fund at specified Fund asset levels (“breakpoints”) in the expectation that such a measure would have the effect of lowering a Fund’s overall management fee as the Fund grew past a breakpoint, thus sharing with the Fund’s shareholders the economies of scale achieved by Alger Management in managing the growing Fund.
Other Benefits to Alger Management. The Trustees considered whether Alger Management benefits in other ways from its relationship with the Trust. They noted that Alger Management maintains soft-dollar arrangements in connection with the Funds’ brokerage transactions, reports on which are regularly supplied to the Trustees at their quarterly meetings and summaries of which, listing commissions by Fund for the twelve months through June 30, 2013, had been included in the materials supplied prior to the meeting. The Trustees also noted that Alger Management receives fees from the Funds under the Administration Agreement and the Shareholder Administrative Services Agreement and that Alger Inc. provides a considerable portion of the Funds’ equity brokerage and receives shareholder servicing fees from the Funds as well. The Trustees had been provided with information regarding, and had considered, the administration fee, shareholder administrative services fee, brokerage and shareholder servicing fee benefits in connection with their review of the profitability to Alger Management and its affiliates of their relationships with the Funds. As to other benefits received, the Trustees decided that none were so significant as to render Alger Management’s fees excessive.
Conclusions and Determinations. At the conclusion of these discussions, each of the Independent Trustees expressed the opinion that he had been furnished with sufficient information to make an informed business decision with respect to renewal of the
89
Investment Advisory Agreement. Based on its discussions and considerations as described above, the Board made the following conclusions and determinations in respect of each Fund:
· The Board concluded that the nature, extent and quality of the services provided to the Fund by Alger Management are adequate and appropriate.
· The Board determined that the Fund’s performance was acceptable.
· The Board concluded that the advisory fee paid to Alger Management by the Fund was reasonable in light of comparative performance and expense and advisory fee information, costs of the services provided and profits to be realized and benefits derived or to be derived by Alger Management and its affiliates from the relationship with the Fund. In the case of the Capital Appreciation Focus Fund, the Trustees noted that Alger Management had voluntarily undertaken to cap Fund expenses through expense reimbursements and fee waivers, thus in effect lowering the fees it actually received from the Fund.
· The Board accepted Alger Management’s acknowledgement that economies of scale were likely to be achieved in the management of the Fund and determined that the recently-adopted fee breakpoints provided a means by which Alger Management would share the benefits of such economies with Fund shareholders.
The Board considered these conclusions and determinations and, without any one factor being dispositive, determined with respect to each Fund that renewal of the Investment Advisory Agreement was in the best interests of the Fund and its shareholders.
Tax Information
In accordance with subchapter M of the Internal Revenue Code of 1986, as amended, for the year ended October 31, 2013, 55.59% of the Alger Capital Appreciation Institutional Fund and 100% of the Alger Mid Cap Growth Institutional Fund’s dividends qualified for the dividends received deduction for corporations. For the year ended October 31, 2013, certain dividends paid by the Funds may be subject to a maximum rate of 15%, as provided by the Jobs and Growth Tax Relief Reconciliation Act of 2003. Of the distributions paid during the fiscal year, 70.37% of the Alger Capital Appreciation Institutional Fund and 100% of the Alger Mid Cap Growth Institutional Fund’s dividends may be considered qualified dividend income.
Shareholders should not use the above information to prepare their tax returns. Since the Funds’ fiscal year is not the calendar year, another notification will be sent with respect to calendar year 2013. Such notification, which will reflect the amount to be used by tax payers on their federal income tax returns, will be made in conjunction with Form 1099 DIV and will be mailed in January 2014. Shareholders are advised to consult their own tax advisers with respect to the tax consequences of their investment in the Funds.
90
Privacy Policy
U.S. Consumer Privacy Notice Rev. 01/2011 | 3/31/11 |
FACTS | | WHAT DOES ALGER DO WITH YOUR PERSONAL INFORMATION? |
Why? | | Financial companies choose how they share your personal information, which, under Federal law, means personally identifiable information. Federal law gives consumers the right to limit some but not all sharing. Federal law also requires us to tell you how we collect, share, and protect your personal information. Please read this notice carefully to understand what we do. |
What? | | The types of personal information we collect and share depend on the product or service you have with us. This information can include: · Social Security number · account balances, transaction history and credit information |
How? | | All financial companies need to share customers’ personal information to run their everyday business. In the section below, we list the reasons financial companies can share their customers’ personal information; the reasons Alger chooses to share; and whether you can limit this sharing. |
Reasons we can share your personal
information | | Does
Alger share? | | Can you limit
this sharing? |
For our everyday business purposes — such as to process your transactions, maintain your account(s), respond to court orders and legal investigations, or report to credit bureaus | | Yes | | No |
For our marketing purposes — with service providers we use to offer our products and services to you | | Yes | | No |
For joint marketing with other financial companies | | No | | We don’t share |
For our affiliates’ everyday business purposes—information about your transactions and experiences | | Yes | | No |
For our affiliates’ everyday business purposes—information about your creditworthiness | | No | | We don’t share |
For nonaffiliates to market to you — for all credit card accounts | | No | | We don’t share |
For nonaffiliates to market to you — for accounts and services endorsed by another organization | | No | | We don’t share |
For nonaffiliates to market to you — for accounts other than credit card accounts and Sponsored Accounts, such as insurance, investments, deposit and lending | | No | | We don’t share |
91
Who we are | | |
| | |
Who is providing this notice? | | Alger includes Fred Alger Management, Inc. and Fred Alger & Company, Incorporated as well as the following funds: The Alger Funds, The Alger Funds II, The Alger Institutional Funds, The Alger Portfolios, and Alger Global Growth Fund. |
| | |
What we do | | |
| | |
How does Alger protect my personal information? | | To protect your personal information from unauthorized access and use, we use security measures that comply with federal law. These measures include computer safeguards and secured files and buildings. For more information visit alger.com. |
| | |
How does Alger collect my personal information? | | We collect your personal information, for example, when you: · open an account or perform transactions · seek advice about your investments We also collect your personal information from others, such as credit bureaus, affiliates, or other companies. |
| | |
Why can’t I limit all sharing? | | Federal law gives you the right to limit some but not all sharing related to: · sharing for affiliates’ everyday business purposes — information about your creditworthiness · affiliates from using your information to market to you · sharing for nonaffiliates to market to you State laws and individual companies may give you additional rights to limit sharing. |
| | |
Definitions | | |
| | |
Affiliates | | Companies related by common ownership or control. They can be financial and nonfinancial companies. · Our affiliates include Fred Alger Management, Inc. and Fred Alger & Company, Incorporated as well as the following funds: The Alger Funds, The Alger Funds II, The Alger Institutional Funds, The Alger Portfolios, and Alger Global Growth Fund. |
| | |
Nonaffiliates | | Companies not related by common ownership or control. They can be financial and nonfinancial companies |
| | |
Joint marketing | | A formal agreement between nonaffiliated financial companies that together market financial products or services to you. |
92
Proxy Voting Policies
A description of the policies and procedures the Trust uses to determine how to vote proxies relating to portfolio securities and information regarding how the Fund voted proxies relating to portfolio securities during the most recent 12-month period ended June 30 are available, without charge, by calling (800) 992-3863 or online on the Funds’ website at www.alger.com or on the SEC’s website at www.sec.gov.
Fund Holdings
The Board of Trustees has adopted policies and procedures relating to disclosure of the Funds’ portfolio securities. These policies and procedures recognize that there may be legitimate business reasons for holdings to be disclosed and seek to balance those interests to protect the proprietary nature of the trading strategies and implementation thereof by the Funds.
Generally, the policies prohibit the release of information concerning portfolio holdings which have not previously been made public to individual investors, institutional investors, intermediaries that distribute the Funds’ shares and other parties which are not employed by the Manager or its affiliates except when the legitimate business purposes for selective disclosure and other conditions (designed to protect the Funds) are acceptable.
The Funds make their full holdings available semi-annually in shareholder reports filed on Form N-CSR and after the first and third fiscal quarters in regulatory filings on Form N-Q. These shareholder reports and regulatory filings are filed with the SEC, as required by federal securities laws, and are generally available within sixty (60) days of the end of the Funds’ fiscal quarter. The Funds’ Forms N-Q are available online on the SEC’s website at www.sec.gov or may be reviewed and copied at the SEC’s Public Reference Room in Washington, D.C. Information regarding the operation of the SEC’s Public Reference Room may be obtained by calling 1-800-SEC-0330.
In addition, the Funds make publicly available their respective month-end top 10 holdings with a 15 day lag and their month-end full portfolios with a 60 day lag on their website www.alger.com and through other marketing communications (including printed advertising/sales literature and/or shareholder telephone customer service centers). No compensation or other consideration is received for the non-public disclosure of portfolio holdings information.
In accordance with the foregoing, the Funds provide portfolio holdings information to service providers who provide necessary or beneficial services when such service providers need access to this information in the performance of their services and are subject to duties of confidentiality (1) imposed by law, including a duty not to trade on non-public information, and/or (2) pursuant to an agreement that confidential information is not to be disclosed or used (including trading on such information) other than as required by law. From time to time, the Funds will communicate with these service providers to confirm that they understand the Funds’ policies and procedures regarding such disclosure. This agreement must be approved by the Funds’ Chief Compliance Officer.
93
The Board of Trustees periodically reviews a report disclosing the third parties to whom each Fund’s holdings information has been disclosed and the purpose for such disclosure, and it considers whether or not the release of information to such third parties is in the best interest of the Fund and its shareholders.
In addition to material the Funds routinely provide to shareholders, the Manager may, upon request, make additional statistical information available regarding the Funds. Such information will include, but not be limited to, relative weightings and characteristics of Fund portfolios versus their respective index and security specific impact on overall portfolio performance. Please contact the Funds at (800) 992-3863 to obtain such information.
94
(This page has been intentionally left blank.)
95
(This page has been intentionally left blank.)
96
(This page has been intentionally left blank.)
97
(This page has been intentionally left blank.)
98
(This page has been intentionally left blank.)
99
(This page has been intentionally left blank.)
100
THE ALGER INSTITUTIONAL FUNDS
360 Park Avenue South
New York, NY 10010
(800) 992-3863
www.alger.com
Investment Manager
Fred Alger Management, Inc.
360 Park Avenue South
New York, NY 10010
Distributor
Fred Alger & Company, Incorporated
360 Park Avenue South
New York, NY 10010
Transfer Agent and Dividend Disbursing Agent
Boston Financial Data Services, Inc.
P.O. Box 8480
Boston, MA 02266
This report is submitted for the general information of the shareholders of The Alger Institutional Funds. It is not authorized for distribution to prospective investors unless accompanied by an effective Prospectus for the Trust, which contains information concerning the Trust’s investment policies, fees and expenses as well as other pertinent information.
101

ITEM 2. CODE OF ETHICS.
(a) The Registrant has adopted a code of ethics (the “Code of Ethics”) that applies to its principal executive officer, principal financial officer, principal accounting officer or controller, or persons performing similar functions.
(b) Not applicable.
(c) The Registrant has not amended its Code of Ethics during the period covered by the shareholder report presented in Item 1 hereto.
(d) The Registrant has not granted a waiver or an implicit waiver from a provision of its Code of Ethics during the period covered by the shareholder report presented in Item 1 hereto.
(e) Not applicable.
(f) The Registrant’s Code of Ethics is attached as an Exhibit hereto.
ITEM 3. AUDIT COMMITTEE FINANCIAL EXPERT.
The Board of Trustees of the Registrant determined that Stephen E. O’Neil is an audit committee financial expert (within the meaning of that phrase specified in the instructions to Form N-CSR) on the Registrant’s audit committee. Mr. O’Neil is an “independent” trustee — i.e., he is not an interested person of the Registrant as defined in the Investment Company Act of 1940, nor has he accepted directly or indirectly any consulting, advisory or other compensatory fee from the Registrant, other than in his capacity as Trustee.
ITEM 4. PRINCIPAL ACCOUNTANT FEES AND SERVICES.
a) Audit Fees:
October 31, 2013 | | $ | 121,300 | |
October 31, 2012 | | $ | 115,600 | |
b) Audit-Related Fees: NONE
c) Tax Fees for tax advice, tax compliance and tax planning:
October 31, 2013 | | $ | 19,600 | |
October 31, 2012 | | $ | 20,830 | |
d) All Other Fees:
October 31, 2013 | | $ | 9,370 | |
October 31, 2012 | | $ | 8,920 | |
Other fees include a review and consent for Registrants registration statement filing and a review of the semi-annual financial statements.
e) 1) Audit Committee Pre-Approval Policies And Procedures:
Audit and non-audit services provided by the Registrant’s independent registered public accounting firm (the “Auditors”) on behalf the Registrant must be pre-approved by the Audit Committee. Non-audit services provided by the Auditors on behalf of the Registrant’s Investment Adviser or any entity controlling, controlled by, or under common control with the Investment Adviser must be pre-approved by the Audit Committee if such non-audit services directly relate to the operations or financial reporting of the Registrant.
2) All fees in item 4(b) through 4(d) above were approved by the Registrants’ Audit Committee.
f) Not Applicable
g) Non-Audit Fees:
October 31, 2013 | | $190,902, €69,272, and £26,800 | |
October 31, 2012 | | $221,557 and €42,600 | |
h) The audit committee of the board of trustees has considered whether the provision of the non-audit services that were rendered to the registrant’s investment adviser and any entity controlling, controlled by, or under common control, with the adviser that provides ongoing services to the registrant that were not approved pursuant to (c)(7)(ii) of Rule 2-01 of Regulation S-X is compatible with maintaining the principle accountant’s independence.
ITEM 5. AUDIT COMMITTEE OF LISTED REGISTRANTS.
Not applicable
ITEM 6. INVESTMENTS.
Not applicable
ITEM 7. DISCLOSURE OF PROXY VOTING POLICIES AND PROCEDURES FOR CLOSED-END MANAGEMENT INVESTMENT COMPANIES.
Not applicable
ITEM 8. PORTFOLIO MANAGERS OF CLOSED-END MANAGEMENT INVESTMENT COMPANIES.
Not applicable
ITEM 9. PURCHASES OF EQUITY SECURITIES BY CLOSED-END MANAGEMENT INVESTMENT COMPANY AND AFFILIATED PURCHASERS.
Not applicable
ITEM 10. SUBMISSION OF MATTERS TO A VOTE OF SECURITY HOLDERS.
None
ITEM 11. CONTROLS AND PROCEDURES.
(a) The Registrant’s principal executive officer and principal financial officer have concluded that the Registrant’s disclosure controls and procedures (as defined in Rule 30a-3(c) under the Investment Company Act of 1940, as amended) are effective based on their evaluation of the disclosure controls and procedures as of a date within 90 days of the filing date of this document.
(b) No changes in the Registrant’s internal control over financial reporting occurred during the Registrant’s second fiscal half-year that materially affected, or are reasonably likely to materially affect, the Registrant’s internal control over financial
reporting.
ITEM 12. EXHIBITS.
(a) (1) Code of Ethics as Exhibit 99.CODE ETH
(a) (2) Certifications of principal executive officer and principal financial officer as required by rule 30a-2(a) under the Investment Company Act of 1940 are attached as Exhibit 99.CERT
(b) Certifications of principal executive officer and principal financial officer as required by rule 30a-2(b) under the Investment Company Act of 1940 are attached as Exhibit 99.906CERT
SIGNATURES
Pursuant to the requirements of the Securities Exchange Act of 1934 and the Investment Company Act of 1940, the registrant has duly caused this report to be signed on its behalf by the undersigned, thereunto duly authorized.
The Alger Institutional Funds | |
| |
By: | /s/Hal Liebes | |
| | |
| Hal Liebes | |
| | |
| President | |
| | |
Date: December 17, 2013 | |
Pursuant to the requirements of the Securities Exchange Act of 1934 and the Investment Company Act of 1940, this report has been signed below by the following persons on behalf of the registrant and in the capacities and on the dates indicated.
By: | /s/Hal Liebes | |
| | |
| Hal Liebes | |
| | |
| President | |
| | |
Date: December 17, 2013 | |
| | |
By: | /s/Michael D. Martins | |
| | |
| Michael D. Martins | |
| | |
| Treasurer | |
| |
Date: December 17, 2013 | |