| | OMB APPROVAL |
| | OMB Number: | 3235-0570 |
| | Expires: | August 31, 2011 |
| UNITED STATES | Estimated average burden hours per response. . . . . . . . . . . . . . . 18.9 |
| SECURITIES AND EXCHANGE COMMISSION | |
| Washington, D.C. 20549 | |
| | | | |
FORM N-CSR
CERTIFIED SHAREHOLDER REPORT OF REGISTERED
MANAGEMENT INVESTMENT COMPANIES
Investment Company Act file number | 811-07986 |
|
The Alger Institutional Funds |
(Exact name of registrant as specified in charter) |
|
111 Fifth Avenue New York, New York | | 10003 |
(Address of principal executive offices) | | (Zip code) |
|
Mr. Hal Liebes Fred Alger Management, Inc. 111 Fifth Avenue New York, New York 10003 |
(Name and address of agent for service) |
|
Registrant’s telephone number, including area code: | 212-806-8800 | |
|
Date of fiscal year end: | October 31 | |
|
Date of reporting period: | October 31, 2010 | |
| | | | | | | | |
ITEM 1. REPORTS TO STOCKHOLDERS.
The Alger
Institutional Funds
ANNUAL REPORT | |
October 31, 2010 | |
Table of Contents
THE ALGER INSTITUTIONAL FUNDS
Letter to Our Shareholders (Unaudited) | 1 |
| |
Fund Highlights (Unaudited) | 10 |
| |
Portfolio Summary (Unaudited) | 14 |
| |
Schedules of Investments | 15 |
| |
Statements of Assets and Liabilities | 36 |
| |
Statements of Operations | 38 |
| |
Statements of Changes in Net Assets | 40 |
| |
Financial Highlights | 42 |
| |
Notes to Financial Statements | 50 |
| |
Report of Independent Registered Public Accounting Firm | 64 |
| |
Additional Information (Unaudited) | 65 |
Go Paperless With Alger Electronic Delivery Service
Alger is pleased to provide you with the ability to access regulatory materials online. When documents such as prospectuses and annual and semi-annual reports are available, we’ll send you an e-mail notification with a convenient link that will take you directly to the fund information on our website. To sign up for this free service, simply enroll at www.icsdelivery.com/alger.
Dear Shareholders, | | December 3, 2010 |
Equities Rally on Corporate Earnings
Sometimes the strongest drivers of market performance receive the least amount of media attention. That was clearly the case during the 12-month period ended October 31, 2010. As the period progressed, soothsayers of gloom increasingly basked in the limelight of the media to discuss the possibility of the U.S. slipping into a double-dip recession. Other pundits discussed persistently high unemployment and the possibility of America being hit with deflation. Yet as the media embraced an increasingly negative economic outlook, corporations continued to announce strong quarterly results, continuing a trend of surprisingly resilient earnings, high levels of free cash flow, and strong incremental profit margins. The markets, we believe, responded to these fundamentals of investing with the S&P 500 Index posting a 16.52% return for the reporting period.
During the 12-month period, mid and small cap equities outperformed large cap stocks while growth stocks outperformed value. The Russell Midcap Index posted a 27.71% return, compared to the 26.58% return of the small cap Russell 2000 Index and to the 17.67% return of the large cap Russell 1000 Index. Among small caps, the Russell 2000 Growth Index return of 28.67% outpaced the 24.43% return of the Russell 2000 Value Index. In mid caps, growth returned 28.03% as measured by the Russell Midcap Growth Index, outpacing the 27.49% return of the Russell Midcap Value Index. In the large cap category, the Russell 1000 Growth Index posted a 19.65% return, substantially outperforming the 15.71% return of the Russell 1000 Value Index.
Market Volatility Thrives
Despite solid market gains for the 12-month period, volatility thrived with the S&P 500 Index declining 11.4% during the second quarter of 2010. Volatility was driven, in large part, by fears of a slowing U.S. economic recovery. The country’s unemployment rate lingered at or above 9.5% and weakness in real estate persisted, despite mortgage rates dropping to record low levels. Investors’ concerns over health care reform, proposed regulations of financial firms, and the military conflict in Afghanistan also drove volatility. In Europe, meanwhile, the sovereign debt crisis lingered, even as countries such as Ireland, Portugal, Greece, and Spain launched austerity programs to improve their ability to make bond payments.
The volatility was no surprise to the Alger investment team. Indeed, in the later portion of 2009 and in August of this year, we conveyed our belief that ongoing market volatility would create opportunities to purchase attractively valued growth companies during market dips and that equities would advance in the foreseeable future. Our summer observation was timely as the S&P 500 gained 8.92% in September. Our forecast for long-term market gains, meanwhile, is also on track, with the S&P 500 index having gained 80.96% from the market low of March 9, 2009.
1
Corporations Produce Strong Earnings
Against the backdrop of a challenging economy, corporations generated strong earnings during the 12-month period. Many companies continued to benefit from cost cutting measures, improvements in operating efficiency, and growing revenues from overseas markets. In the process, they produced strong levels of free cash flow and they accumulated impressive amounts of cash. Indeed, by the end of March, non-financial corporations held $1.8 trillion in liquid assets, which is comparable to the combined amount of stimulus spending approved by Congress and the White House in 2008 and 2009.
What is even more encouraging is that manufacturers and other corporations started using their cash to make strategic acquisitions, launch share buyback programs, increase dividends, and engage in capital expenditures. This continuation of increased corporate spending in capital expenditures, sales initiatives, and marketing activities is a strong positive for many industries and a reminder that while the U.S. economy is no longer dominated by manufacturing companies, the sector is far from irrelevant. Additionally, business spending on PCs, data storage equipment, and software continued to strengthen during the 12-month period. Encouragingly, our analysts’ research suggests that equipment orders for leading machinery, industrial, and engineering companies will continue to be in the “recovery mode.”
Throughout the reporting period, we maintained that U.S. equity valuations were highly attractive. This view was supported by those who would know best: the CEOs and boards of corporate America. With historically low interest rates and corporations’ deep coffers, U.S. companies have been making investments in something they know better than anyone: their own equities. So far this year, for example, corporations have announced nearly $243 billion in share buybacks, compared to $125 billion for all of last year, according to data from equity research firm Birinyi Associates, Inc.
An increase in merger and acquisition activity also supports our view that equities are attractively valued. Deals announced during the first 11 months of 2010 had a total value of $2.08 trillion, up from $1.70 trillion for the first 11 months of 2009, according to Bloomberg data. Of particular interest was the bidding war between Hewlett-Packard Co. and Dell Inc. for storage specialist 3Par during the third quarter. Hewlett-Packard won with a bid exceeding $2.35 billion. Other deals included Intel Corp.’s acquisition of security-software maker McAfee Inc. and consumer-goods company Unilever’s acquisition of hair care products company Alberto-Culver Co.
Some analysts have said that deals are being completed at excessively high valuations. For example, Hewlett-Packard paid about 10 times the value of 3Par’s estimated annual sales to acquire the company, according to investment banking firm Kaufman Bros. By comparison, EMC Corp. and NetApp Inc., two of the leading (but also large) storage specialists trade at three to four times their sales.
2
Yet, we maintain that viewing recent deal valuations as excessive fails to consider the adverse impacts upon companies that fail to execute in high growth markets. When considering such adverse impact, the strategic significance of acquisitions of high growth companies like 3Par becomes clear. By failing to internally develop capabilities or to make acquisitions, the “missed opportunity” for HP or Dell is not simply slower growth, but the “enhanced risk” that the new high growth market served by 3Par will erode either company’s present business in data storage, for example. Winners and losers today are created faster than ever, and in this competitive landscape, sitting still is not an option. While technology as a tool is a primary agent for the transmission of “creative destruction” within an industry at a faster and more devastating pace than ever before, this phenomenon occurs in every industry today. Indeed, retailers like Barnes & Noble, Inc. or Mervyn’s department stores and media giants such as newspaper publishers and radio broadcasters that failed to respond aggressively to the rise of new forms of competition for their goods, services and advertising platforms suffered from a serious decline in their core business and they missed strong growth opportunities. Thus, the value of entry and of position at the table of a high growth market is both future growth opportunities and, likely, the ability to manage (but not avoid) the decline of a core business.
Finally, on the financial ledgers, corporate America looks not only strong, but willing to share with stakeholders. The benefits of large cash balances were reflected in dividends. Many companies implemented dividends and a flurry of other companies with dividend programs said they will increase the amount that they pay. In fact, some 37% of S&P 500 companies either started dividend payments in 2010 or announced that they will increase their dividends, according to data from FactSet. Dividend payments, of course, will help stimulate the economy by increasing income for shareholders. Perhaps more importantly, dividends will begin to compete for investing dollars with the paltry bond yields in the market today. Why own a 10-year bond yielding 2.4% when you can own stock with a 2% dividend and earnings or free cash flow yields of 8%, 9%, or 10%?
Investors Look to the Fed
Strong corporate earnings clearly drove equity gains during the 12-month period, but stocks also received additional support from expectations that the Federal Reserve would roll out additional stimulus. As the 12-month period progressed, continuing weakness in real estate, the labor market and GDP growth caused the expectations to grow, helping the S&P 500 climb 3.7% in October.
The Road Ahead
Going forward, we believe uncertainty over economic growth will continue to drive equity market volatility, while the sovereign debt crisis in Europe may also provoke angst among investors. Yet, we are encouraged to observe that European countries are pushing forward with austerity programs to improve their ability to service debt and that the European Financial Stability Facility (the Facility), which was created to assist in the crisis, has received preliminary credit ratings of AAA from Moody’s Investors Service Inc, Standard & Poor’s [a division of McGraw-Hill Companies], and Fitch Inc. The Facility currently has 440 billion euros in assets while the
3
International Monetary Fund has earmarked an additional 750 billion euros to assist governments that may be in danger of defaulting.
Domestically, we also expect investors to remain concerned about high rates of unemployment and weakness in real estate. We note, however, that job creation and improvements in real estate often occur in the later stages of economic recoveries, so while we would like to see those areas strengthen, we do not believe they point to a decline in the health of the U.S. At the same time, pockets of improvement in real estate exist. In Jacksonville, Florida, for example, vacancy rates for office and industrial properties declined during the third quarter, while in Manhattan, residential sales climbed. We also note that on both sides of the Atlantic, central bankers remain highly vigilant and, we are confident, ready to act to support the recovery today and for quite a while.
Robust emerging markets growth, meanwhile, may help lift the U.S. economy and markets. China may lead the process with its gross domestic product for this year expected to grow 10.5%, according to the International Monetary Fund. Strong growth won’t be limited to China: The IMF expects overall GDP for emerging markets to grow 6.5% this year. India, Brazil, and other emerging markets similarly support our long-held view that “global growth” is an investable theme for U.S. equity investors.
In closing, we continue to believe that research is the cornerstone of superior portfolio management, regardless of economic conditions. We believe our proven and disciplined process for identifying companies experiencing Positive Dynamic Change will continue to produce superior long-term investment results for our clients.
Portfolio Matters
Alger Capital Appreciation Institutional Fund
The Alger Capital Appreciation Institutional Fund returned 17.69% for the 12-month period ended October 31, 2010, compared to the Russell 3000 Growth Index return of 20.31%.
During the period, the largest sector weightings in the Fund were in Information Technology and Health Care sectors. The largest sector overweight for the period was in Information Technology and the largest sector underweight for the period was in Consumer Staples. Relative outperformance in the Materials and Information Technology sectors was the most important contributor to performance, while sectors that detracted from the portfolio included Health Care and Consumer Staples.
Among the most important contributors to relative performance were Skyworks Solutions Inc., Patriot Coal Corp., Cliffs Natural Resources Inc., Seagate Technology PLC, and Focus Media Holding Ltd. Conversely, detracting from overall results on a relative basis were Hewlett-Packard Co., Brocade Communications Systems Inc., International Business Machines Corp., Baxter International Inc., and Oracle Corp.
4
Alger Large Cap Growth Institutional Fund
The Alger Large Cap Growth Institutional Fund returned 17.09% for the 12-month period ended October 31, 2010, compared to the 19.65% return of the Russell 1000 Growth Index.
During the period, the largest portfolio weightings in the Fund were in the Information Technology and Health Care sectors. The largest sector overweight for the period was in Financials and the largest sector underweight for the period was in Consumer Discretionary. Relative outperformance in the Materials and Utilities sectors was the most important contributor to performance. Sectors that detracted from performance included Financials and Consumer Discretionary.
Among the most important relative contributors were Burlington Northern, Potash Corporation of Saskatchewan Inc., Carnival Corp., The Boeing Co., and Cognizant Technology Solutions Corp. Conversely, detracting from overall results on a relative basis were Exxon Mobil Corp., Transocean Inc., International Business Machines Corp., Caterpillar Inc., and Baxter International Inc.
Alger Mid Cap Growth Institutional Fund
The Alger Mid Cap Growth Institutional Fund returned 22.75% for the 12-month period ended October 31, 2010, compared to the 28.03% return of the Russell Midcap Growth Index.
During the period, the largest sector weightings for the Fund were in Information Technology and Consumer Discretionary. The largest sector overweight for the period was in Information Technology and the largest sector underweight for the period was in Consumer Staples. Relative outperformance in the Information Technology and Energy sectors was the most important contributor to performance. Sectors that detracted from performance included Industrials and Health Care.
Among the most important contributors to relative performance were Skyworks Solutions Inc., Cliffs Natural Resources Inc., OpenTable Inc., NetFlix Inc., and Human Genome Sciences Inc. Conversely, detracting from overall results on a relative basis were Duoyuan Global Water Inc., NuVasive Inc., Brocade Communications Systems Inc. Select Medical Holdings Corporation, and SmartHeat Inc.
Alger Small Cap Growth Institutional Fund
For the 12-month period ended October 31, 2010, the Alger Small Cap Growth Institutional Fund returned 27.04%, compared to 28.67% return of the Russell 2000 Growth Index.
During the period, the largest sector weightings in the Alger Small Cap Growth Institutional Fund were in Information Technology and Health Care. The largest sector overweight for the period was in Industrials and the largest sector underweight for the period was in Information Technology. Relative outperformance in the
5
Industrials and Energy sectors was the most important contributor to performance. Sectors that detracted from performance included Financials and Health Care.
Among the most important contributors to relative performance were BE Aerospace Inc., Dollar Thrifty Automotive Group Inc., VanceInfo Technologies Inc., Informatica Corp., and OpenTable Inc. Conversely, detracting from overall results on a relative basis were InterMune Inc., Brocade Communications Systems Inc., Sykes Enterprises Inc., VeriFone Systems Inc., and PMI Group Inc.
Respectfully submitted,

Daniel C. Chung, CFA
Chief Investment Officer
Investors cannot invest directly in an index. Index performance does not reflect the deduction for fees, expenses or taxes.
This report and the financial statements contained herein are submitted for the general information of shareholders of the Fund. This report is not authorized for distribution to prospective investors in the Funds unless proceeded or accompanied by an effective prospectus for the Funds. Funds returns represent the fiscal 12-month period return of Class I shares. The performance data quoted represents past performance, which is not an indication or guarantee of future results. Standardized performance results can be found on the following pages. The investment return and principal value of an investment in a fund will fluctuate so that an investor’s shares, when redeemed, may be worth more or less than their original cost. Current performance may be lower or higher than the performance quoted. Recent performance has been impacted by an unusually strong period in the U.S. equity market and there is no g uarantee that such conditions will be repeated. For performance data current to the most recent month-end, visit us at www.alger.com, or call us at (800) 992-3863.
The views and opinions of the Funds’ management in this report are as of the date of the Shareholders letter and are subject to change at any time subsequent to this date. There is no guarantee that any of the assumptions that formed the basis for the opinions stated herein are accurate or that they will materialize. Moreover, the information forming the basis for such assumptions is from sources believed to be reliable; however, there is no guarantee that such information is accurate. Any securities mentioned, whether owned in a fund or otherwise, are considered in the context of the construction of an overall portfolio of securities and therefore reference to them should not be construed as a recommendation or offer to purchase or sell any such security. Inclusion of such securities in a fund and transactions in such securities, if any, may be for a variety of reasons, including without limitation, in re sponse to cash flows, inclusion in a benchmark, and risk control. The reference to a
6
specific security should also be understood in such context and not viewed as a statement that the security is a significant holding in a portfolio. Please refer to the Schedules of Investments for each fund that is included in this report for a complete list of fund holdings as of October 31, 2010. Securities mentioned in the Shareholders Letter, if not found in the Schedule of Investments, may have been held by the Funds during the fiscal period.
A Word about Risk
Growth stocks tend to be more volatile than other stocks as the price of growth stocks tends to be higher in relation to their companies’ earnings and may be more sensitive to market, political and economic developments. Investing in the stock market involves gains and losses and may not be suitable for all investors. Stocks of small and mid-sized companies are subject to greater risk than stocks of larger, more established companies owing to such factors as limited liquidity, inexperienced management, and limited financial resources. Funds that participate in leveraging, such as the Capital Appreciation Institutional Fund, are subject to the risk that borrowing money to leverage will exceed the returns for securities purchased or that the securities purchased may actually go down in value; thus, the Funds’ net asset value can decrease more quickly than if the Funds had not borrowed. For a more detail ed discussion of the risks associated with these Funds, please see the Funds’ Prospectus.
Before investing, carefully consider a fund’s investment objective, risks, charges, and expenses. For a prospectus or a summary prospectus containing this and other information about The Alger Institutional Funds call us at (800) 992-3863 or visit us at www.alger.com. Read it carefully before investing.
Fred Alger & Company, Incorporated, Distributor. Member NYSE Euronext, SIPC.
NOT FDIC INSURED. NOT BANK GUARANTEED. MAY LOSE VALUE.
Definitions:
· Standard & Poor’s 500 Index (S&P 500 Index) is an index of 500 leading companies in leading industries in the United States.
· The Russell 3000 Index measures the performance of the 3,000 largest U.S. companies based on the total market capitalization, which represents 99% of the U.S. Equity Market. The Russell 3000 Growth Index is an unmanaged index designed to measure the performance of those Russell 3000 Index companies with higher price-to-book ratios and higher forecasted growth values.
· The Russell 1000 Index measures the performance of the large-cap segment of the U.S. equity universe. It is a subset of the Russell 3000 Index and includes approximately 1,000 of the largest securities based on a combination of their market cap and current index membership. The Russell 1000 represents approximately 92% of the Russell 3000 Index. The Russell 1000 Growth Index is an unmanaged index designed to measure the performance of the largest 1,000 companies in the Russell 3000 Index with higher price-to-book ratios and higher
7
forecasted growth values. The Russell 1000 Value Index measures the performance of the large-cap value segment of the U.S. equity universe. It includes those Russell 1000 companies with lower price-to-book ratios and lower expected growth values.
· The Russell Midcap Index measures the performance of the mid-cap segment of the U.S. equity universe. The Russell Midcap Index is a subset of the Russell 1000 Index. It includes approximately 800 of the smallest securities based on a combination of their market cap and current index membership. The Russell Midcap Growth Index measures the performance of the mid-cap growth segment of the U.S. equity universe. It includes those Russell Midcap Index companies with higher price-to-book ratios and higher forecasted growth values. The Russell Midcap Value Index measures the performance of the mid-cap value segment of the U.S. equity universe. It includes those Russell Midcap Index companies with lower price-to-book ratios and lower forecasted growth valu es.
· The Russell 2500 Index measures the performance of the small to mid-cap segment of the U.S. equity universe, commonly referred to as “smid” cap. The Russell 2500 Index is a subset of the Russell 3000 Index. The Russell 2500 Growth Index measures the performance of the small to mid-cap growth segment of the U.S. equity universe. It includes those Russell 2500 companies with higher price-to-book ratios and higher forecasted growth values. The Russell 2500. Growth Index is an unmanaged index designed to measure the performance of the 2,500 smallest companies in the Russell 3000 Index with higher price-to-book ratios and higher forecasted growth values. The Russell 2500 Value Index measures the performance of the small to mid-cap value segment of the U.S. equi ty universe. It includes those Russell 2500 companies with lower price-to-book ratios and lower forecasted growth values.
· The Russell 2000 Index measures the performance of the small-cap segment of the U.S. equity universe. The Russell 2000 Index is a subset of the Russell 3000 Index representing approximately 8% of the total market capitalization of that index. The Russell 2000 Growth Index measures the performance of the small-cap growth segment of the U.S. equity universe. It includes those Russell 2000 companies with higher price-to-book ratios and higher forecasted growth values. The Russell 2000 Value Index measures the performance of small-cap value segment of the U.S. equity universe. It includes those Russell 2000 companies with lower price-to-book ratios and lower forecasted growth values.
· Observations of buying opportunities during market dips were provided in the Annual Report to Alger Institutional Fund Shareholders, October 31, 2009.
· Bond values are subject to interest rate movements; their market values tend to fall when interest rates rise and to rise when interest rates fall. Bond values may also decline as a result of an issue’s falling credit rating or actual default, and bonds that are backed by assets are subject to prepayment risk; thus the average life of the security may be less than maturity.
· Birinyi Associates, Inc. is a stock market research firm.
· FactSet is a firm that provides market data and analytics to investment firms.
· Bloomberg is a financial publisher and provider of financial data.
8
· Moody’s Investors Service, Standard & Poor’s and Fitch Ratings are credit rating agencies.
· The following companies represented the stated percentage of firm wide assets as of October 31, 2010: Hewlett-Packard, 2.11%; Dell, 0.00%; 3Par, 0.00%; McAfee, 0.00%; Intel, 0.07%; Unilever, 0.00%; Alberto-Culver, 0.00%; Barnes & Noble, Inc., 0.00%; Mervyn’s, 0.00%; EMC Corp., 0.78% and NetApp Inc., 0.13%.
FUND PERFORMANCE AS OF 9/30/10 (Unaudited)
AVERAGE ANNUAL TOTAL RETURNS
| | 1 YEAR | | 5 YEARS | | 10 YEARS | | SINCE
INCEPTION | |
Alger Capital Appreciation Class I (Inception 11/8/93) | | 8.33 | % | 6.66 | % | (0.82 | )% | 10.86 | % |
Alger Capital Appreciation Class R* (Inception 1/27/03) | | 7.75 | % | 6.11 | % | (1.32 | )% | 10.30 | % |
| | | | | | | | | |
Alger Large Cap Growth Class I (Inception 11/8/93) | | 9.91 | % | (0.59 | )% | (2.94 | )% | 6.80 | % |
Alger Large Cap Growth Class R* (Inception 1/27/03) | | 9.17 | % | (1.12 | )% | (3.44 | )% | 6.26 | % |
| | | | | | | | | |
Alger Mid Cap Growth Class I (Inception 11/8/93) | | 11.47 | % | (0.23 | )% | 0.52 | % | 11.68 | % |
Alger Mid Cap Growth Class R* (Inception 1/27/03) | | 10.95 | % | (0.71 | )% | 0.03 | % | 11.13 | % |
| | | | | | | | | |
Alger Small Cap Growth Class I (Inception 11/8/93) | | 15.74 | % | 3.60 | % | (0.42 | )% | 8.51 | % |
Alger Small Cap Growth Class R* (Inception 1/27/03) | | 15.26 | % | 3.11 | % | (0.89 | )% | 7.99 | % |
The performance data quoted represents past performance, which is not an indication or a guarantee of future results. The Fund’s average annual total returns include changes in share price and reinvestment of dividends and capital gains.
* | Performance figures prior to 1/27/03, inception of Class R shares, are those of the Fund’s Class I Shares. The performance figures prior to 1/27/03 have been adjusted to reflect the higher operating expenses of Class R shares. |
9
ALGER CAPITAL APPRECIATION INSTITUTIONAL FUND
Fund Highlights Through October 31, 2010 (Unaudited)
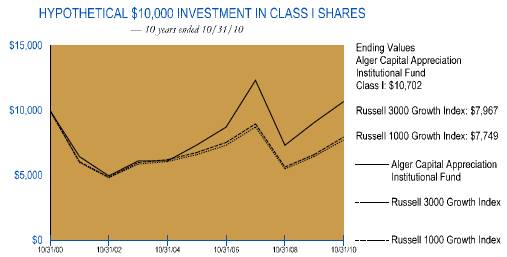
The chart above illustrates the change in value of a hypothetical $10,000 investment made in the Alger Capital Appreciation Institutional Fund Class I shares and the Russell 3000 Growth Index (an unmanaged index of common stocks) for the ten years ended October 31, 2010. Figures for the Alger Capital Appreciation Institutional Fund Class I shares and the Russell 3000 Growth Index include reinvestment of dividends. Performance for the Alger Capital Appreciation Institutional Fund Class R shares may vary from the results shown above due to differences in expenses the class bears.
PERFORMANCE COMPARISON AS OF 10/31/10
AVERAGE ANNUAL TOTAL RETURNS
| | 1 YEAR | | 5 YEARS | | 10 YEARS | | SINCE
INCEPTION | |
Class I (Inception 11/8/93) | | 17.69 | % | 7.79 | % | 0.68 | % | 11.08 | % |
Class R* (Inception 1/27/03) | | 17.09 | % | 7.24 | % | 0.17 | % | 10.52 | % |
Russell 3000 Growth Index | | 20.31 | % | 3.28 | % | (2.25 | )% | 6.63 | % |
Russell 1000 Growth Index | | 19.65 | % | 3.21 | % | (2.52 | )% | 6.92 | % |
The performance data quoted represents past performance, which is not an indication or a guarantee of future results. The Fund’s average annual total returns include changes in share price and reinvestment of dividends and capital gains. The chart and table above do not reflect the deduction of taxes that a shareholder would have paid on Fund distributions or on the redemption of Fund shares. Investment return and principal will fluctuate and the Fund’s shares, when redeemed, may be worth more or less than their original cost. Current performance may be higher or lower than the performance quoted. For performance current to the most recent month end, visit us at www.alger.com or call us at (800) 992-3863.
* | Performance figures prior to 1/27/03, inception of Class R shares, are those of the Fund’s Class I Shares. The performance figures prior to 1/27/03 have been adjusted to reflect the higher operating expenses of Class R shares. |
10
ALGER LARGE CAP GROWTH INSTITUTIONAL FUND
Fund Highlights Through October 31, 2010 (Unaudited)
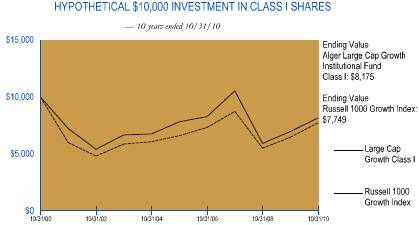
The chart above illustrates the change in value of a hypothetical $10,000 investment made in the Alger Large Cap Growth Institutional Fund Class I shares and the Russell 1000 Growth Index (an unmanaged index of common stocks) for the ten years ended October 31, 2010. The figures for the Alger Large Cap Growth Institutional Fund Class I shares and the Russell 1000 Growth Index include reinvestment of dividends. Performance for the Alger Large Cap Growth Institutional Fund Class R shares may vary from the results shown above due to differences in expenses the class bears.
PERFORMANCE COMPARISON AS OF 10/31/10
AVERAGE ANNUAL TOTAL RETURNS
| | 1 YEAR | | 5 YEARS | | 10 YEARS | | SINCE
INCEPTION | |
Class I (Inception 11/8/93) | | 17.09 | % | 0.87 | % | (1.99 | )% | 7.06 | % |
Class R* (Inception 1/27/03) | | 16.25 | % | 0.32 | % | (2.51 | )% | 6.51 | % |
Russell 1000 Growth Index | | 19.65 | % | 3.21 | % | (2.52 | )% | 6.92 | % |
The performance data quoted represents past performance, which is not an indication or a guarantee of future results. The Fund’s average annual total returns include changes in share price and reinvestment of dividends and capital gains. The chart and table above do not reflect the deduction of taxes that a shareholder would have paid on Fund distributions or on the redemption of Fund shares. Investment return and principal will fluctuate and the Fund’s shares, when redeemed, may be worth more or less than their original cost. Current performance may be higher or lower than the performance quoted. For performance current to the most recent month end, visit us at www.alger.com or call us at (800) 992-3863.
* | Performance figures prior to 1/27/03, inception of Class R shares, are those of the Fund’s Class I Shares. The performance figures prior to 1/27/03 have been adjusted to reflect the higher operating expenses of Class R shares. |
11
ALGER MID CAP GROWTH INSTITUTIONAL FUND
Fund Highlights Through October 31, 2010 (Unaudited)
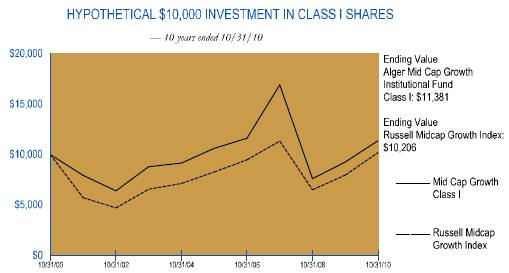
The chart above illustrates the change in value of a hypothetical $10,000 investment made in the Alger Mid Cap Growth Institutional Fund Class I shares and the Russell Midcap Growth Index (an unmanaged index of common stocks) for the ten years ended October 31, 2010 Figures for the Alger Mid Cap Growth Institutional Fund Class I shares and the Russell Midcap Growth Index include reinvestment of dividends. Performance for the Alger Mid Cap Growth Institutional Fund Class R shares may vary from the results shown above due to differences in expenses the class bears.
PERFORMANCE COMPARISON AS OF 10/31/10
AVERAGE ANNUAL TOTAL RETURNS
| | 1 YEAR | | 5 YEARS | | 10 YEARS | | SINCE
INCEPTION | |
Class I (Inception 11/8/93) | | 22.75 | % | 1.39 | % | 1.30 | % | 11.86 | % |
Class R* (Inception 1/27/03) | | 22.17 | % | 0.89 | % | 0.80 | % | 11.31 | % |
Russell Midcap Growth Index | | 28.03 | % | 4.28 | % | 0.20 | % | 8.06 | % |
The performance data quoted represents past performance, which is not an indication or a guarantee of future results. The Fund’s average annual total returns include changes in share price and reinvestment of dividends and capital gains. The chart and table above do not reflect the deduction of taxes that a shareholder would have paid on Fund distributions or on the redemption of Fund shares. Investment return and principal will fluctuate and the Fund’s shares, when redeemed, may be worth more or less than their original cost. Current performance may be higher or lower than the performance quoted. For performance current to the most recent month end, visit us at www.alger.com or call us at (800) 992-3863.
* | Performance figures prior to 1/27/03, inception of Class R shares, are those of the Fund’s Class I Shares. The performance figures prior to 1/27/03 have been adjusted to reflect the higher operating expenses of Class R shares. |
12
ALGER SMALL CAP GROWTH INSTITUTIONAL FUND
Fund Highlights Through October 31, 2010 (Unaudited)
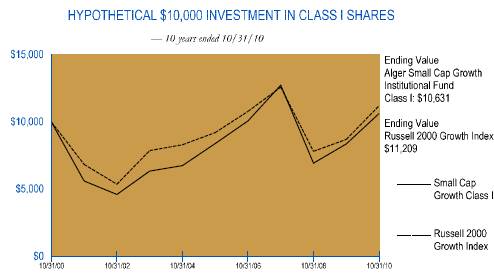
The chart above illustrates the change in value of a hypothetical $10,000 investment made in the Alger Small Cap Growth Institutional Fund Class I shares and the Russell 2000 Growth Index (an unmanaged index of common stocks) for the ten years ended October 31, 2010. The figures for the Alger Small Cap Growth Institutional Fund Class I shares and the Russell 2000 Growth Index include reinvestment of dividends. Performance for the Alger Small Cap Growth Institutional Fund Class R shares may vary from the results shown above due to differences in expenses the class bears.
PERFORMANCE COMPARISON AS OF 10/31/10
AVERAGE ANNUAL TOTAL RETURNS
| | 1 YEAR | | 5 YEARS | | 10 YEARS | | SINCE
INCEPTION | |
Class I (Inception 11/8/93) | | 27.04 | % | 4.83 | % | 0.61 | % | 8.67 | % |
Class R* (Inception 1/27/03) | | 26.37 | % | 4.32 | % | 0.14 | % | 8.15 | % |
Russell 2000 Growth Index | | 28.67 | % | 3.99 | % | 1.15 | % | 5.17 | % |
The performance data quoted represents past performance, which is not an indication or a guarantee of future results. The Fund’s average annual total returns include changes in share price and reinvestment of dividends and capital gains. The chart and table above do not reflect the deduction of taxes that a shareholder would have paid on Fund distributions or on the redemption of Fund shares. Investment return and principal will fluctuate and the Fund’s shares, when redeemed, may be worth more or less than their original cost. Current performance may be higher or lower than the performance quoted. For performance current to the most recent month end, visit us at www.alger.com or call us at (800) 992-3863.
* | Performance figures prior to 1/27/03, inception of Class R shares, are those of the Fund’s Class I Shares. The performance figures prior to 1/27/03 have been adjusted to reflect the higher operating expenses of Class R shares. |
13
PORTFOLIO SUMMARY*
October 31, 2010 (Unaudited)
SECTORS | | Alger Capital
Appreciation
Institutional Fund | | Alger Large Cap
Growth
Institutional Fund | | Alger Mid Cap
Growth
Institutional Fund | | Alger Small Cap
Growth
Institutional Fund | |
Consumer Discretionary | | 12.6 | % | 10.4 | % | 19.1 | % | 19.0 | % |
Consumer Staples | | 4.8 | | 9.5 | | 1.4 | | 2.7 | |
Energy | | 10.3 | | 8.5 | | 7.9 | | 4.1 | |
Financials | | 5.3 | | 6.6 | | 8.5 | | 3.5 | |
Health Care | | 9.6 | | 11.0 | | 15.3 | | 17.4 | |
Industrials | | 15.3 | | 11.9 | | 15.8 | | 19.0 | |
Information Technology | | 34.1 | | 31.7 | | 25.0 | | 24.5 | |
Materials | | 5.5 | | 4.5 | | 4.6 | | 4.5 | |
Telecommunication Services | | 0.0 | | 0.5 | | 1.3 | | 1.4 | |
Utilities | | 0.0 | | 0.9 | | 0.0 | | 1.1 | |
Short-Term Investments and Net Other Assets | | 2.5 | | 4.5 | | 1.1 | | 2.8 | |
| | 100.0 | % | 100.0 | % | 100.0 | % | 100.0 | % |
* Based on net assets for each Fund.
14
THE ALGER INSTITUTIONAL FUNDS |
ALGER CAPITAL APPRECIATION INSTITUTIONAL FUND
Schedule of Investments‡ October 31, 2010
| | SHARES | | VALUE | |
COMMON STOCKS—97.5% | | | | | |
ADVERTISING—1.8% | | | | | |
Focus Media Holding Ltd.#* | | 719,800 | | $ | 17,815,050 | |
| | | | | |
AEROSPACE & DEFENSE—1.1% | | | | | |
Goodrich Corp. | | 25,500 | | 2,092,785 | |
United Technologies Corp. | | 110,600 | | 8,269,562 | |
| | | | 10,362,347 | |
AIR FREIGHT & LOGISTICS—3.0% | | | | | |
FedEx Corp. | | 109,900 | | 9,640,428 | |
United Parcel Service Inc., Cl. B | | 307,800 | | 20,727,252 | |
| | | | 30,367,680 | |
AIRLINES—0.9% | | | | | |
United Continental Holdings Inc.* | | 305,100 | | 8,860,104 | |
| | | | | |
APPLICATION SOFTWARE—1.5% | | | | | |
Adobe Systems Inc. * | | 225,100 | | 6,336,565 | |
Mentor Graphics Corp. * | | 522,300 | | 5,640,840 | |
Nice Systems Ltd. #* | | 91,700 | | 3,071,033 | |
| | | | 15,048,438 | |
AUTO PARTS & EQUIPMENT—1.0% | | | | | |
Johnson Controls Inc. | | 46,100 | | 1,619,032 | |
Lear Corp. * | | 92,700 | | 8,194,680 | |
| | | | 9,813,712 | |
BIOTECHNOLOGY—1.7% | | | | | |
Celgene Corp. * | | 65,500 | | 4,065,585 | |
Cephalon Inc. * | | 82,500 | | 5,481,300 | |
Human Genome Sciences Inc. * | | 256,900 | | 6,905,472 | |
| | | | 16,452,357 | |
COAL & CONSUMABLE FUELS—1.4% | | | | | |
Peabody Energy Corp. | | 266,200 | | 14,081,980 | |
| | | | | |
COMMODITY CHEMICALS—0.5% | | | | | |
Celanese Corp. | | 143,900 | | 5,130,035 | |
| | | | | |
COMMUNICATIONS EQUIPMENT—3.4% | | | | | |
Cisco Systems Inc. * | | 546,700 | | 12,481,161 | |
Qualcomm Inc. | | 457,600 | | 20,651,488 | |
| | | | 33,132,649 | |
COMPUTER HARDWARE—10.7% | | | | | |
Apple Inc. * | | 170,900 | | 51,418,683 | |
Hewlett-Packard Co. | | 1,276,600 | | 53,693,796 | |
| | | | 105,112,479 | |
COMPUTER STORAGE & PERIPHERALS—1.6% | | | | | |
EMC Corp.* | | 724,000 | | 15,211,240 | |
| | | | | |
CONSTRUCTION & FARM MACHINERY & HEAVY TRUCKS—2.1% | | | | | |
ArvinMeritor Inc. * | | 335,400 | | 5,560,932 | |
Caterpillar Inc. | | 115,400 | | 9,070,440 | |
Cummins Inc. | | 63,100 | | 5,559,110 | |
| | | | 20,190,482 | |
| | | | | | |
15
| | SHARES | | VALUE | |
COMMON STOCKS—(CONT.) | | | | | |
DATA PROCESSING & OUTSOURCED SERVICES—1.2% | | | | | |
Mastercard Inc. | | 48,700 | | $ | 11,690,922 | |
| | | | | |
DEPARTMENT STORES—0.5% | | | | | |
Kohl’s Corp.* | | 101,900 | | 5,217,280 | |
| | | | | |
DIVERSIFIED CHEMICALS—0.3% | | | | | |
Dow Chemical Co., /The | | 95,200 | | 2,935,016 | |
| | | | | |
DIVERSIFIED METALS & MINING—1.9% | | | | | |
Cliffs Natural Resources Inc. | | 169,900 | | 11,077,480 | |
Freeport-McMoRan Copper & Gold Inc. | | 78,700 | | 7,451,316 | |
| | | | 18,528,796 | |
DRUG RETAIL—0.5% | | | | | |
CVS Caremark Corp. | | 155,200 | | 4,674,624 | |
| | | | | |
ELECTRICAL COMPONENTS & EQUIPMENT—0.1% | | | | | |
Emerson Electric Co. | | 18,300 | | 1,004,670 | |
| | | | | |
ENVIRONMENTAL & FACILITIES SERVICES—0.5% | | | | | |
Republic Services Inc. | | 155,400 | | 4,632,474 | |
| | | | | |
FERTILIZERS & AGRICULTURAL CHEMICALS—1.3% | | | | | |
CF Industries Holdings Inc. | | 45,400 | | 5,562,862 | |
Mosaic Co., /The | | 98,600 | | 7,213,576 | |
| | | | 12,776,438 | |
FOOTWEAR—0.5% | | | | | |
NIKE Inc., Cl. B | | 60,800 | | 4,951,552 | |
| | | | | |
GOLD—1.1% | | | | | |
Goldcorp Inc. | | 173,700 | | 7,745,283 | |
Yamana Gold Inc. | | 273,100 | | 3,001,369 | |
| | | | 10,746,652 | |
HEALTH CARE EQUIPMENT—1.6% | | | | | |
Covidien PLC | | 329,540 | | 13,138,760 | |
Insulet Corp. * | | 133,500 | | 2,129,325 | |
| | | | 15,268,085 | |
HEALTH CARE FACILITIES—1.0% | | | | | |
Universal Health Services Inc., Cl. B | | 246,600 | | 10,177,182 | |
| | | | | |
HEALTH CARE SERVICES—1.2% | | | | | |
Medco Health Solutions Inc.* | | 231,700 | | 12,171,201 | |
| | | | | |
HOME ENTERTAINMENT SOFTWARE—1.0% | | | | | |
Activision Blizzard Inc. | | 863,400 | | 9,903,198 | |
| | | | | |
HOME IMPROVEMENT RETAIL—1.0% | | | | | |
Lowe’s Companies, Inc. | | 441,100 | | 9,408,663 | |
| | | | | |
HOTELS RESORTS & CRUISE LINES—1.6% | | | | | |
Carnival Corp. | | 101,600 | | 4,386,072 | |
Wyndham Worldwide Corporation | | 397,500 | | 11,428,125 | |
| | | | 15,814,197 | |
HOUSEHOLD APPLIANCES—0.4% | | | | | |
Stanley Black & Decker Inc. | | 60,800 | | 3,767,776 | |
| | | | | | |
16
| | SHARES | | VALUE | |
COMMON STOCKS—(CONT.) | | | | | |
HUMAN RESOURCE & EMPLOYMENT SERVICES—0.5% | | | | | |
Towers Watson & Co. | | 96,170 | | $ | 4,945,061 | |
| | | | | |
HYPERMARKETS & SUPER CENTERS—0.9% | | | | | |
Wal-Mart Stores Inc. | | 159,210 | | 8,624,406 | |
| | | | | |
INDUSTRIAL CONGLOMERATES—1.9% | | | | | |
3M Co. | | 97,700 | | 8,228,294 | |
Tyco International Ltd. | | 262,300 | | 10,040,844 | |
| | | | 18,269,138 | |
INDUSTRIAL MACHINERY—2.6% | | | | | |
Flowserve Corp. | | 68,500 | | 6,850,000 | |
Illinois Tool Works Inc. | | 120,100 | | 5,488,570 | |
Ingersoll-Rand PLC | | 341,500 | | 13,424,365 | |
| | | | 25,762,935 | |
INTEGRATED OIL & GAS—2.3% | | | | | |
Chevron Corp. | | 144,800 | | 11,961,928 | |
ConocoPhillips | | 183,200 | | 10,882,080 | |
| | | | 22,844,008 | |
INTERNET RETAIL—2.4% | | | | | |
Amazon.com Inc. * | | 85,900 | | 14,185,526 | |
Expedia Inc. | | 294,300 | | 8,519,985 | |
| | | | 22,705,511 | |
INTERNET SOFTWARE & SERVICES—6.6% | | | | | |
Google Inc., Cl. A * | | 43,000 | | 26,358,570 | |
GSI Commerce Inc. * | | 570,250 | | 13,925,505 | |
IAC/InterActiveCorp. * | | 149,800 | | 4,179,420 | |
Sina Corp. * | | 88,530 | | 4,984,239 | |
VistaPrint Ltd. * | | 150,900 | | 6,348,363 | |
Yahoo! Inc. * | | 544,700 | | 8,992,997 | |
| | | | 64,789,094 | |
INVESTMENT BANKING & BROKERAGE—0.9% | | | | | |
Lazard Ltd., Cl. A | | 134,500 | | 4,963,050 | |
Morgan Stanley | | 164,900 | | 4,101,063 | |
| | | | 9,064,113 | |
IT CONSULTING & OTHER SERVICES—0.7% | | | | | |
International Business Machines Corp. | | 45,100 | | 6,476,360 | |
| | | | | |
LEISURE PRODUCTS—1.6% | | | | | |
Phillips-Van Heusen Corp. | | 256,800 | | 15,752,112 | |
| | | | | |
LIFE & HEALTH INSURANCE—0.9% | | | | | |
MetLife Inc. | | 215,900 | | 8,707,247 | |
| | | | | |
LIFE SCIENCES TOOLS & SERVICES—1.0% | | | | | |
Thermo Fisher Scientific Inc.* | | 197,700 | | 10,165,734 | |
| | | | | |
MANAGED HEALTH CARE—0.4% | | | | | |
Aetna Inc. | | 60,000 | | 1,791,600 | |
WellPoint Inc. * | | 33,100 | | 1,798,654 | |
| | | | 3,590,254 | |
| | | | | | |
17
| | SHARES | | VALUE | |
COMMON STOCKS—(CONT.) | | | | | |
METAL & GLASS CONTAINERS—0.4% | | | | | |
Ball Corp. | | 63,400 | | $ | 4,080,424 | |
| | | | | |
MOVIES & ENTERTAINMENT—0.7% | | | | | |
Walt Disney Co., /The | | 199,300 | | 7,196,723 | |
| | | | | |
OIL & GAS EQUIPMENT & SERVICES—2.5% | | | | | |
Halliburton Company | | 121,500 | | 3,870,990 | |
National Oilwell Varco Inc. | | 176,400 | | 9,483,264 | |
Schlumberger Ltd. | | 162,900 | | 11,385,081 | |
| | | | 24,739,335 | |
OIL & GAS EXPLORATION & PRODUCTION—4.1% | | | | | |
Concho Resources Inc., /Restricted *,(L2),(a) | | 161,985 | | 10,444,976 | |
Devon Energy Corp. | | 165,900 | | 10,786,818 | |
Nexen Inc. | | 514,100 | | 10,945,189 | |
Plains Exploration & Production Co. * | | 248,600 | | 6,928,482 | |
| | | | 39,105,465 | |
OTHER DIVERSIFIED FINANCIAL SERVICES—1.6% | | | | | |
BM&F Bovespa SA | | 551,500 | | 4,620,693 | |
JPMorgan Chase & Co. | | 280,200 | | 10,543,926 | |
| | | | 15,164,619 | |
PHARMACEUTICALS—2.7% | | | | | |
Abbott Laboratories | | 145,700 | | 7,477,324 | |
Allergan Inc. | | 71,700 | | 5,191,797 | |
Auxilium Pharmaceuticals Inc. * | | 137,400 | | 3,400,650 | |
Pfizer Inc. | | 450,000 | | 7,830,000 | |
Teva Pharmaceutical Industries Ltd. # | | 41,900 | | 2,174,610 | |
| | | | 26,074,381 | |
PROPERTY & CASUALTY INSURANCE—0.7% | | | | | |
Travelers Cos., Inc., /The | | 124,800 | | 6,888,960 | |
| | | | | |
RAILROADS—1.3% | | | | | |
CSX Corp. | | 175,800 | | 10,802,910 | |
Union Pacific Corp. | | 23,900 | | 2,095,552 | |
| | | | 12,898,462 | |
REAL ESTATE SERVICES—0.4% | | | | | |
CB Richard Ellis Group, Inc.* | | 209,400 | | 3,842,490 | |
| | | | | |
RESEARCH & CONSULTING SERVICES—0.3% | | | | | |
Verisk Analytic Inc., Cl. A* | | 114,100 | | 3,401,321 | |
| | | | | |
RESTAURANTS—1.1% | | | | | |
McDonald’s Corp. | | 143,700 | | 11,175,549 | |
| | | | | |
SEMICONDUCTOR EQUIPMENT—1.2% | | | | | |
Lam Research Corp.* | | 259,499 | | 11,882,459 | |
| | | | | |
SEMICONDUCTORS—4.1% | | | | | |
Applied Micro Circuits Corporation * | | 156,800 | | 1,578,976 | |
Broadcom Corp., Cl. A | | 84,800 | | 3,454,752 | |
Marvell Technology Group Ltd. * | | 749,960 | | 14,481,728 | |
NXP Semiconductor NV * | | 118,300 | | 1,560,377 | |
ON Semiconductor Corp. * | | 133,000 | | 1,020,110 | |
| | | | | | |
18
| | SHARES | | VALUE | |
COMMON STOCKS—(CONT.) | | | | | |
SEMICONDUCTORS—(CONT.) | | | | | |
Skyworks Solutions Inc. * | | 402,400 | | $ | 9,218,984 | |
Texas Instruments Inc. | | 298,400 | | 8,823,688 | |
| | | | 40,138,615 | |
SOFT DRINKS—2.3% | | | | | |
Coca-Cola Co., /The | | 113,800 | | 6,978,216 | |
PepsiCo Inc. | | 252,800 | | 16,507,840 | |
| | | | 23,486,056 | |
SPECIALIZED FINANCE—0.8% | | | | | |
CME Group Inc. | | 27,229 | | 7,886,880 | |
| | | | | |
SYSTEMS SOFTWARE—2.1% | | | | | |
Oracle Corp. | | 708,400 | | 20,826,960 | |
| | | | | |
TOBACCO—1.1% | | | | | |
Philip Morris International Inc. | | 182,650 | | 10,685,025 | |
| | | | | |
TRUCKING—1.0% | | | | | |
Hertz Global Holdings Inc.* | | 831,900 | | 9,417,108 | |
| | | | | |
TOTAL COMMON STOCKS
(Cost $909,494,974) | | | | 955,834,084 | |
| | | | | |
Total Investments
(Cost $909,494,974)(b) | | 97.5 | % | 955,834,084 | |
Other Assets in Excess of Liabilities | | 2.5 | | 24,977,700 | |
| | | | | |
NET ASSETS | | 100.0 | % | $ | 980,811,784 | |
‡ | Securities classified as Level 1 for ASC 820 disclosure purposes based on valuation inputs unless otherwise noted. |
| |
* | Non-income producing security. |
# | American Depository Receipts. |
(a) | Restricted Security - Investment in security pending registration under the Securities Act of 1933. The investment is deemed to be illiquid and may be sold only to qualified institutional buyers. Security was acquired on October 7, 2010 for a cost of $7,337,921 and represents 1.1% of the net assets of the Fund. |
(b) | At October 31, 2010, the net unrealized appreciation on investments, based on cost for federal income tax purposes of $914,788,184 amounted to $41,045,900 which consisted of aggregate gross unrealized appreciation of $76,829,447 and aggregate gross unrealized depreciation of $35,783,547. |
(L2) | Security classified as Level 2 for ASC 820 disclosure purposes based on valuation inputs. |
Industry classifications are unaudited.
See Notes to Financial Statements.
19
THE ALGER INSTITUTIONAL FUNDS | ALGER LARGE CAP GROWTH INSTITUTIONAL FUND
Schedule of Investments‡ October 31, 2010
| | SHARES | | VALUE | |
COMMON STOCKS—95.5% | | | | | |
AEROSPACE & DEFENSE—3.0% | | | | | |
Boeing Co., /The | | 2,550 | | $ | 180,132 | |
General Dynamics Corp. | | 3,600 | | 245,232 | |
Lockheed Martin Corp. | | 2,900 | | 206,741 | |
United Technologies Corp. | | 3,600 | | 269,171 | |
| | | | 901,276 | |
AIR FREIGHT & LOGISTICS—2.1% | | | | | |
FedEx Corp. | | 3,550 | | 311,406 | |
United Parcel Service Inc., Cl. B | | 4,450 | | 299,663 | |
| | | | 611,069 | |
AIRLINES—0.5% | | | | | |
Delta Air Lines Inc.* | | 9,650 | | 134,039 | |
| | | | | |
APPLICATION SOFTWARE—1.4% | | | | | |
Adobe Systems Inc. * | | 10,600 | | 298,390 | |
Salesforce.com Inc. * | | 900 | | 104,463 | |
| | | | 402,853 | |
ASSET MANAGEMENT & CUSTODY BANKS—0.6% | | | | | |
BlackRock Inc. | | 1,100 | | 188,089 | |
| | | | | |
BIOTECHNOLOGY—1.5% | | | | | |
Celgene Corp. * | | 4,050 | | 251,384 | |
Gilead Sciences Inc. * | | 4,800 | | 190,416 | |
| | | | 441,800 | |
COAL & CONSUMABLE FUELS—1.0% | | | | | |
Peabody Energy Corp. | | 5,650 | | 298,885 | |
| | | | | |
COMMUNICATIONS EQUIPMENT—3.6% | | | | | |
Cisco Systems Inc. * | | 25,750 | | 587,872 | |
Qualcomm Inc. | | 10,050 | | 453,556 | |
| | | | 1,041,428 | |
COMPUTER HARDWARE—7.0% | | | | | |
Apple Inc. * | | 4,700 | | 1,414,088 | |
Hewlett-Packard Co. | | 14,450 | | 607,767 | |
| | | | 2,021,855 | |
COMPUTER STORAGE & PERIPHERALS—1.5% | | | | | |
EMC Corp.* | | 20,150 | | 423,352 | |
| | | | | |
CONSTRUCTION & FARM MACHINERY & HEAVY TRUCKS—0.5% | | | | | |
Deere & Co. | | 1,900 | | 145,920 | |
| | | | | |
CONSUMER FINANCE—0.5% | | | | | |
American Express Co. | | 3,700 | | 153,402 | |
| | | | | |
DATA PROCESSING & OUTSOURCED SERVICES—2.0% | | | | | |
Mastercard Inc. | | 1,400 | | 336,084 | |
Visa Inc., Cl. A | | 3,150 | | 246,236 | |
| | | | 582,320 | |
DEPARTMENT STORES—1.0% | | | | | |
Kohl’s Corp.* | | 5,700 | | 291,840 | |
| | | | | | |
20
| | SHARES | | VALUE | |
COMMON STOCKS—(CONT.) | | | | | |
DIVERSIFIED CHEMICALS—0.7% | | | | | |
EI Du Pont de Nemours & Co. | | 4,350 | | $ | 205,668 | |
| | | | | |
DIVERSIFIED METALS & MINING—1.2% | | | | | |
Cliffs Natural Resources Inc. | | 3,650 | | 237,980 | |
Freeport-McMoRan Copper & Gold Inc. | | 1,250 | | 118,350 | |
| | | | 356,330 | |
DRUG RETAIL—1.6% | | | | | |
CVS Caremark Corp. | | 7,700 | | 231,924 | |
Walgreen Co. | | 6,900 | | 233,772 | |
| | | | 465,696 | |
ELECTRIC UTILITIES—0.9% | | | | | |
Southern Co. | | 6,650 | | 251,836 | |
| | | | | |
ENVIRONMENTAL & FACILITIES SERVICES—0.9% | | | | | |
Republic Services Inc. | | 8,850 | | 263,819 | |
| | | | | |
FERTILIZERS & AGRICULTURAL CHEMICALS—1.1% | | | | | |
Monsanto Co. | | 3,050 | | 181,231 | |
Potash Corporation of Saskatchewan Inc. | | 900 | | 130,581 | |
| | | | 311,812 | |
FOOTWEAR—0.5% | | | | | |
NIKE Inc., Cl. B | | 1,700 | | 138,448 | |
| | | | | |
GENERAL MERCHANDISE STORES—0.8% | | | | | |
Target Corp. | | 4,250 | | 220,745 | |
| | | | | |
GOLD—0.9% | | | | | |
Goldcorp Inc. | | 6,000 | | 267,540 | |
| | | | | |
HEALTH CARE EQUIPMENT—1.8% | | | | | |
Covidien PLC | | 6,850 | | 273,110 | |
Stryker Corp. | | 2,600 | | 128,674 | |
Zimmer Holdings Inc. * | | 2,400 | | 113,856 | |
| | | | 515,640 | |
HEALTH CARE SERVICES—1.2% | | | | | |
Medco Health Solutions Inc.* | | 6,400 | | 336,192 | |
| | | | | |
HOME ENTERTAINMENT SOFTWARE—1.6% | | | | | |
Activision Blizzard Inc. | | 25,500 | | 292,485 | |
Electronic Arts Inc. * | | 11,650 | | 184,653 | |
| | | | 477,138 | |
HOME IMPROVEMENT RETAIL—1.0% | | | | | |
Lowe’s Companies, Inc. | | 13,600 | | 290,088 | |
| | | | | |
HOTELS RESORTS & CRUISE LINES—1.0% | | | | | |
Carnival Corp. | | 6,700 | | 289,239 | |
| | | | | |
HOUSEHOLD APPLIANCES—0.6% | | | | | |
Stanley Black & Decker Inc. | | 2,600 | | 161,122 | |
| | | | | |
HOUSEHOLD PRODUCTS—1.3% | | | | | |
Procter & Gamble Co., /The | | 5,900 | | 375,063 | |
| | | | | |
HYPERMARKETS & SUPER CENTERS—1.6% | | | | | |
Wal-Mart Stores Inc. | | 8,500 | | 460,445 | |
| | | | | | |
21
| | SHARES | | VALUE | |
COMMON STOCKS—(CONT.) | | | | | |
INDUSTRIAL CONGLOMERATES—2.1% | | | | | |
3M Co. | | 3,700 | | $ | 311,614 | |
Tyco International Ltd. | | 7,700 | | 294,756 | |
| | | | 606,370 | |
INDUSTRIAL GASES—0.6% | | | | | |
Praxair Inc. | | 1,900 | | 173,546 | |
| | | | | |
INDUSTRIAL MACHINERY—1.7% | | | | | |
Danaher Corp. | | 5,400 | | 234,144 | |
Illinois Tool Works Inc. | | 5,450 | | 249,065 | |
| | | | 483,209 | |
INTEGRATED OIL & GAS—3.4% | | | | | |
Chevron Corp. | | 6,500 | | 536,965 | |
Exxon Mobil Corp. | | 6,600 | | 438,702 | |
| | | | 975,667 | |
INTEGRATED TELECOMMUNICATION SERVICES—0.5% | | | | | |
Verizon Communications Inc. | | 4,900 | | 159,103 | |
| | | | | |
INTERNET RETAIL—1.6% | | | | | |
Amazon.com Inc. * | | 2,450 | | 404,593 | |
Expedia Inc. | | 2,550 | | 73,823 | |
| | | | 478,416 | |
INTERNET SOFTWARE & SERVICES—5.3% | | | | | |
eBay Inc. * | | 10,950 | | 326,419 | |
Google Inc., Cl. A * | | 1,502 | | 920,710 | |
Yahoo! Inc. * | | 17,950 | | 296,355 | |
| | | | 1,543,484 | |
INVESTMENT BANKING & BROKERAGE—1.0% | | | | | |
Charles Schwab Corp., /The | | 9,850 | | 151,690 | |
Goldman Sachs Group Inc., /The | | 950 | | 152,903 | |
| | | | 304,593 | |
IT CONSULTING & OTHER SERVICES—2.4% | | | | | |
Cognizant Technology Solutions Corp., Cl. A * | | 2,800 | | 182,532 | |
International Business Machines Corp. | | 3,550 | | 509,780 | |
| | | | 692,312 | |
LEISURE PRODUCTS—0.5% | | | | | |
Coach Inc. | | 2,950 | | 147,500 | |
| | | | | |
LIFE & HEALTH INSURANCE—1.0% | | | | | |
Aflac Inc. | | 2,650 | | 148,109 | |
MetLife Inc. | | 3,750 | | 151,237 | |
| | | | 299,346 | |
LIFE SCIENCES TOOLS & SERVICES—0.8% | | | | | |
Thermo Fisher Scientific Inc.* | | 4,700 | | 241,674 | |
| | | | | |
MANAGED HEALTH CARE—0.7% | | | | | |
UnitedHealth Group Inc. | | 5,600 | | 201,880 | |
| | | | | |
MOVIES & ENTERTAINMENT—1.7% | | | | | |
Viacom Inc., Cl. B | | 6,150 | | 237,328 | |
| | | | | | |
22
| | SHARES | | VALUE | |
COMMON STOCKS—(CONT.) | | | | | |
MOVIES & ENTERTAINMENT—(CONT.) | | | | | |
Walt Disney Co., /The | | 7,650 | | $ | 276,241 | |
| | | | 513,569 | |
OIL & GAS EQUIPMENT & SERVICES—1.7% | | | | | |
Schlumberger Ltd. | | 5,950 | | 415,845 | |
Weatherford International Ltd. * | | 4,150 | | 69,762 | |
| | | | 485,607 | |
OIL & GAS EXPLORATION & PRODUCTION—2.4% | | | | | |
Devon Energy Corp. | | 6,300 | | 409,626 | |
Nexen Inc. | | 13,650 | | 290,609 | |
| | | | 700,235 | |
OTHER DIVERSIFIED FINANCIAL SERVICES—1.4% | | | | | |
Bank of America Corp. | | 8,100 | | 92,664 | |
JPMorgan Chase & Co. | | 7,800 | | 293,513 | |
| | | | 386,177 | |
PACKAGED FOODS & MEATS—0.8% | | | | | |
Kraft Foods Inc., Cl. A | | 7,250 | | 233,958 | |
| | | | | |
PERSONAL PRODUCTS—0.2% | | | | | |
Avon Products Inc. | | 2,350 | | 71,558 | |
| | | | | |
PHARMACEUTICALS—5.0% | | | | | |
Abbott Laboratories | | 5,350 | | 274,562 | |
Allergan Inc. | | 3,000 | | 217,230 | |
Johnson & Johnson | | 4,800 | | 305,615 | |
Pfizer Inc. | | 15,900 | | 276,660 | |
Roche Holding AG # | | 4,150 | | 152,513 | |
Teva Pharmaceutical Industries Ltd. # | | 4,700 | | 243,930 | |
| | | | 1,470,510 | |
PROPERTY & CASUALTY INSURANCE—0.6% | | | | | |
Travelers Cos., Inc., /The | | 2,950 | | 162,840 | |
| | | | | |
RAILROADS—1.1% | | | | | |
CSX Corp. | | 5,200 | | 319,540 | |
| | | | | |
RESTAURANTS—1.1% | | | | | |
McDonald’s Corp. | | 4,150 | | 322,746 | |
| | | | | |
SEMICONDUCTORS—3.3% | | | | | |
Broadcom Corp., Cl. A | | 5,650 | | 230,181 | |
Intel Corp. | | 15,200 | | 305,064 | |
Marvell Technology Group Ltd. * | | 17,150 | | 331,166 | |
Texas Instruments Inc. | | 3,050 | | 90,189 | |
| | | | 956,600 | |
SOFT DRINKS—2.9% | | | | | |
Coca-Cola Co., /The | | 5,700 | | 349,524 | |
PepsiCo Inc. | | 7,600 | | 496,279 | |
| | | | 845,803 | |
SPECIALIZED FINANCE—1.0% | | | | | |
CME Group Inc. | | 1,012 | | 293,126 | |
| | | | | | |
23
| | SHARES | | VALUE | |
COMMON STOCKS—(CONT.) | | | | | |
SPECIALIZED REITS—0.5% | | | | | |
Weyerhaeuser Company | | 8,267 | | $ | 134,091 | |
| | | | | |
SPECIALTY STORES—0.6% | | | | | |
Staples Inc. | | 8,650 | | 177,066 | |
| | | | | |
SYSTEMS SOFTWARE—3.6% | | | | | |
Microsoft Corp. | | 20,200 | | 538,128 | |
Oracle Corp. | | 17,000 | | 499,800 | |
| | | | 1,037,928 | |
TOBACCO—1.1% | | | | | |
Philip Morris International Inc. | | 5,400 | | 315,900 | |
| | | | | |
TOTAL COMMON STOCKS
(Cost $26,571,527) | | | | 27,759,303 | |
| | | | | |
Total Investments
(Cost $26,571,527)(a) | | 95.5 | % | 27,759,303 | |
Other Assets in Excess of Liabilities | | 4.5 | | 1,311,572 | |
| | | | | |
NET ASSETS | | 100.0 | % | $ | 29,070,875 | |
‡ Securities classified as Level 1 for ASC 820 disclosure purposes based on valuation inputs unless otherwise noted.
* Non-income producing security.
# American Depository Receipts.
(a) At October 31, 2010, the net unrealized appreciation on investments, based on cost for federal income tax purposes of $26,601,684 amounted to $1,157,619 which consisted of aggregate gross unrealized appreciation of $2,832,222 and aggregate gross unrealized depreciation of $1,674,603.
Industry classifications are unaudited.
See Notes to Financial Statements.
24
THE ALGER INSTITUTIONAL FUNDS | ALGER MID CAP GROWTH INSTITUTIONAL FUND
Schedule of Investments‡ October 31, 2010
| | SHARES | | VALUE | |
COMMON STOCKS—96.9% | | | | | |
ADVERTISING—0.8% | | | | | |
Focus Media Holding Ltd.#* | | 262,500 | | $ | 6,496,875 | |
| | | | | |
AEROSPACE & DEFENSE—1.9% | | | | | |
Goodrich Corp. | | 186,600 | | 15,314,262 | |
| | | | | |
AIRLINES—0.8% | | | | | |
United Continental Holdings Inc.* | | 213,400 | | 6,197,136 | |
| | | | | |
APPAREL RETAIL—2.9% | | | | | |
Chico’s FAS Inc. | | 482,500 | | 4,689,900 | |
J Crew Group Inc. * | | 186,900 | | 5,978,931 | |
TJX Cos., Inc. | | 174,300 | | 7,998,627 | |
Urban Outfitters Inc. * | | 126,100 | | 3,880,097 | |
| | | | 22,547,555 | |
APPLICATION SOFTWARE—5.6% | | | | | |
Adobe Systems Inc. * | | 558,900 | | 15,733,035 | |
Informatica Corp. * | | 157,000 | | 6,388,330 | |
Intuit Inc. * | | 125,200 | | 6,009,600 | |
Nice Systems Ltd. #* | | 261,300 | | 8,750,937 | |
Salesforce.com Inc. * | | 61,000 | | 7,080,270 | |
| | | | 43,962,172 | |
ASSET MANAGEMENT & CUSTODY BANKS—2.2% | | | | | |
BlackRock Inc. | | 44,300 | | 7,574,857 | |
T. Rowe Price Group Inc. | | 182,900 | | 10,108,883 | |
| | | | 17,683,740 | |
BIOTECHNOLOGY—4.2% | | | | | |
Alexion Pharmaceuticals Inc. * | | 41,100 | | 2,807,130 | |
Cephalon Inc. * | | 60,200 | | 3,999,688 | |
China Nuokang Bio-Pharmaceutical Inc. #* | | 735,262 | | 3,418,968 | |
Human Genome Sciences Inc. * | | 375,400 | | 10,090,752 | |
Metabolix Inc. * | | 960,468 | | 13,408,133 | |
| | | | 33,724,671 | |
BROADCASTING & CABLE TV—1.0% | | | | | |
Discovery Communications Inc., Series C* | | 205,900 | | 8,001,274 | |
| | | | | |
COAL & CONSUMABLE FUELS—1.0% | | | | | |
Patriot Coal Corp.* | | 574,700 | | 7,752,703 | |
| | | | | |
COMMUNICATIONS EQUIPMENT—0.7% | | | | | |
Finisar Corp.* | | 326,500 | | 5,553,765 | |
| | | | | |
COMPUTER & ELECTRONICS RETAIL—0.5% | | | | | |
GameStop Corp., Cl. A* | | 216,100 | | 4,248,526 | |
| | | | | |
COMPUTER HARDWARE—0.6% | | | | | |
Teradata Corp.* | | 117,800 | | 4,636,608 | |
| | | | | |
COMPUTER STORAGE & PERIPHERALS—1.5% | | | | | |
NetApp Inc. * | | 151,300 | | 8,056,725 | |
Seagate Technology PLC * | | 281,000 | | 4,116,650 | |
| | | | 12,173,375 | |
CONSTRUCTION & ENGINEERING—1.7% | | | | | |
Aecom Technology Corp. * | | 299,300 | | 7,928,457 | |
| | | | | | |
25
| | SHARES | | VALUE | |
COMMON STOCKS—(CONT.) | | | | | |
CONSTRUCTION & ENGINEERING—(CONT.) | | | | | |
Chicago Bridge & Iron Co., NV #* | | 213,500 | | $ | 5,382,335 | |
| | | | 13,310,792 | |
CONSTRUCTION & FARM MACHINERY & HEAVY TRUCKS—1.2% | | | | | |
Bucyrus International Inc. | | 52,200 | | 3,557,952 | |
Westport Innovations Inc. * | | 331,300 | | 6,003,156 | |
| | | | 9,561,108 | |
DATA PROCESSING & OUTSOURCED SERVICES—1.5% | | | | | |
Echo Global Logistics Inc. * | | 258,285 | | 3,667,647 | |
Fiserv Inc. * | | 146,800 | | 8,003,536 | |
| | | | 11,671,183 | |
DIVERSIFIED METALS & MINING—2.8% | | | | | |
Cliffs Natural Resources Inc. | | 224,100 | | 14,611,320 | |
Ivanhoe Mines Ltd. * | | 82,100 | | 1,976,147 | |
Walter Energy, Inc. | | 68,600 | | 6,034,056 | |
| | | | 22,621,523 | |
ELECTRICAL COMPONENTS & EQUIPMENT—2.6% | | | | | |
AMETEK Inc. | | 164,800 | | 8,907,440 | |
General Cable Corp. * | | 414,800 | | 11,589,512 | |
| | | | 20,496,952 | |
ENVIRONMENTAL & FACILITIES SERVICES—0.9% | | | | | |
Stericycle Inc.* | | 97,900 | | 7,023,346 | |
| | | | | |
GOLD—1.8% | | | | | |
Yamana Gold Inc. | | 1,258,600 | | 13,832,014 | |
| | | | | |
HEALTH CARE EQUIPMENT—2.5% | | | | | |
Insulet Corp. * | | 147,000 | | 2,344,650 | |
Intuitive Surgical Inc. * | | 11,400 | | 2,997,630 | |
Mindray Medical International Ltd. # | | 214,100 | | 6,204,618 | |
NuVasive Inc. * | | 295,500 | | 7,742,100 | |
| | | | 19,288,998 | |
HEALTH CARE FACILITIES—2.2% | | | | | |
Community Health Systems Inc. * | | 127,400 | | 3,832,192 | |
Select Medical Holdings Corp. * | | 424,200 | | 3,173,016 | |
Universal Health Services Inc., Cl. B | | 203,200 | | 8,386,064 | |
VCA Antech Inc. * | | 92,600 | | 1,914,042 | |
| | | | 17,305,314 | |
HOME ENTERTAINMENT SOFTWARE—1.5% | | | | | |
Activision Blizzard Inc. | | 1,002,000 | | 11,492,940 | |
| | | | | |
HOME FURNISHING RETAIL—0.8% | | | | | |
Bed Bath & Beyond Inc.* | | 134,500 | | 5,904,550 | |
| | | | | |
HOMEBUILDING—0.9% | | | | | |
Lennar Corp., Cl. A | | 489,000 | | 7,095,390 | |
| | | | | |
HOTELS RESORTS & CRUISE LINES—6.2% | | | | | |
Ctrip.com International Ltd. #* | | 230,100 | | 11,981,307 | |
Home Inns & Hotels Management Inc. #* | | 152,700 | | 7,812,132 | |
Interval Leisure Group * | | 398,000 | | 5,711,300 | |
Morgans Hotel Group Co. * | | 252,800 | | 2,040,096 | |
| | | | | | |
26
| | SHARES | | VALUE | |
COMMON STOCKS—(CONT.) | | | | | |
HOTELS RESORTS & CRUISE LINES—(CONT.) | | | | | |
Orient-Express Hotels Ltd., Cl. A * | | 413,900 | | $ | 5,239,974 | |
Royal Caribbean Cruises Ltd. * | | 226,500 | | 8,955,810 | |
Wyndham Worldwide Corporation | | 269,700 | | 7,753,875 | |
| | | | 49,494,494 | |
HOUSEHOLD APPLIANCES—0.5% | | | | | |
Stanley Black & Decker Inc. | | 61,600 | | 3,817,352 | |
| | | | | |
INDUSTRIAL CONGLOMERATES—0.5% | | | | | |
McDermott International Inc.* | | 271,600 | | 4,190,788 | |
| | | | | |
INDUSTRIAL MACHINERY—3.9% | | | | | |
Duoyuan Global Water Inc. #* | | 67,899 | | 849,416 | |
Flowserve Corp. | | 102,600 | | 10,260,000 | |
SmartHeat Inc. * | | 876,800 | | 5,690,432 | |
SPX Corp. | | 202,100 | | 13,552,826 | |
| | | | 30,352,674 | |
INTERNET RETAIL—2.0% | | | | | |
Expedia Inc. | | 251,000 | | 7,266,450 | |
NetFlix Inc. * | | 46,700 | | 8,102,450 | |
| | | | 15,368,900 | |
INTERNET SOFTWARE & SERVICES—3.4% | | | | | |
GSI Commerce Inc. * | | 229,000 | | 5,592,180 | |
OpenTable Inc. * | | 247,100 | | 15,159,585 | |
Yahoo! Inc. * | | 356,300 | | 5,882,513 | |
| | | | 26,634,278 | |
INVESTMENT BANKING & BROKERAGE—0.9% | | | | | |
Greenhill & Co., Inc. | | 93,100 | | 7,231,077 | |
| | | | | |
IT CONSULTING & OTHER SERVICES—1.7% | | | | | |
Cognizant Technology Solutions Corp., Cl. A* | | 200,600 | | 13,077,114 | |
| | | | | |
LEISURE PRODUCTS—2.0% | | | | | |
Coach Inc. | | 174,800 | | 8,740,000 | |
Polo Ralph Lauren Corp., Cl. A | | 70,700 | | 6,849,416 | |
| | | | 15,589,416 | |
LIFE SCIENCES TOOLS & SERVICES—0.9% | | | | | |
ICON PLC#* | | 376,059 | | 7,276,742 | |
| | | | | |
MANAGED HEALTH CARE—0.5% | | | | | |
Aetna Inc. | | 123,400 | | 3,684,724 | |
| | | | | |
OIL & GAS DRILLING—1.3% | | | | | |
Helmerich & Payne Inc. | | 91,800 | | 3,927,204 | |
Nabors Industries Ltd. * | | 286,800 | | 5,994,120 | |
| | | | 9,921,324 | |
OIL & GAS EQUIPMENT & SERVICES—1.4% | | | | | |
Cameron International Corp. * | | 153,300 | | 6,706,875 | |
National Oilwell Varco Inc. | | 76,550 | | 4,115,328 | |
| | | | 10,822,203 | |
OIL & GAS EXPLORATION & PRODUCTION—4.3% | | | | | |
Concho Resources Inc., /Restricted *,(L2),(a) | | 198,500 | | 12,799,504 | |
| | | | | | |
27
| | SHARES | | VALUE | |
COMMON STOCKS—(CONT.) | | | | | |
OIL & GAS EXPLORATION & PRODUCTION—(CONT.) | | | | | |
Nexen Inc. | | 598,957 | | $ | 12,751,795 | |
Plains Exploration & Production Co. * | | 308,200 | | 8,589,534 | |
| | | | 34,140,833 | |
OTHER DIVERSIFIED FINANCIAL SERVICES—1.6% | | | | | |
BM&F Bovespa SA | | 1,505,887 | | 12,616,939 | |
| | | | | |
PACKAGED FOODS & MEATS—0.5% | | | | | |
McCormick & Co., Inc. | | 82,700 | | 3,656,994 | |
| | | | | |
PHARMACEUTICALS—4.3% | | | | | |
Auxilium Pharmaceuticals Inc. * | | 229,800 | | 5,687,550 | |
Medicis Pharmaceutical Corp., Cl. A | | 176,069 | | 5,238,053 | |
Mylan Inc. * | | 648,300 | | 13,173,456 | |
Optimer Pharmaceuticals Inc. * | | 631,674 | | 5,931,419 | |
Shire PLC # | | 50,900 | | 3,568,090 | |
| | | | 33,598,568 | |
RAILROADS—1.0% | | | | | |
CSX Corp. | | 121,700 | | 7,478,465 | |
| | | | | |
REAL ESTATE MANAGEMENT & DEVELOPMENT—0.8% | | | | | |
BR Malls Participacoes SA | | 622,840 | | 5,950,817 | |
| | | | | |
REAL ESTATE SERVICES—1.2% | | | | | |
CB Richard Ellis Group, Inc. * | | 399,500 | | 7,330,825 | |
E-House China Holdings Ltd. # | | 107,200 | | 1,791,312 | |
| | | | 9,122,137 | |
RESEARCH & CONSULTING SERVICES—1.3% | | | | | |
Verisk Analytic Inc., Cl. A* | | 341,700 | | 10,186,077 | |
| | | | | |
RESTAURANTS—1.5% | | | | | |
Darden Restaurants Inc. | | 132,800 | | 6,070,288 | |
McCormick & Schmick’s Seafood Restaurants Inc. * | | 615,976 | | 5,500,666 | |
| | | | 11,570,954 | |
SEMICONDUCTOR EQUIPMENT—1.7% | | | | | |
Lam Research Corp.* | | 287,200 | | 13,150,888 | |
| | | | | |
SEMICONDUCTORS—6.2% | | | | | |
Altera Corp. | | 352,700 | | 11,007,767 | |
Applied Micro Circuits Corporation * | | 748,300 | | 7,535,381 | |
Atheros Communications Inc. * | | 150,735 | | 4,678,814 | |
Marvell Technology Group Ltd. * | | 550,900 | | 10,637,879 | |
Netlogic Microsystems Inc. * | | 225,200 | | 6,769,512 | |
Skyworks Solutions Inc. * | | 389,700 | | 8,928,027 | |
| | | | 49,557,380 | |
SPECIALIZED FINANCE—1.8% | | | | | |
CME Group Inc. | | 35,400 | | 10,253,610 | |
IntercontinentalExchange Inc. * | | 34,300 | | 3,940,041 | |
| | | | 14,193,651 | |
SYSTEMS SOFTWARE—0.5% | | | | | |
Red Hat Inc.* | | 94,200 | | 3,980,892 | |
| | | | | | |
28
| | SHARES | | VALUE | |
COMMON STOCKS—(CONT.) | | | | | |
THRIFTS & MORTGAGE FINANCE—0.0% | | | | | |
Ocwen Financial Corp.* | | 14,400 | | $ | 124,272 | |
| | | | | |
TOBACCO—0.9% | | | | | |
ITC Ltd.* | | 1,971,500 | | 7,561,309 | |
| | | | | |
TOTAL COMMON STOCKS
(Cost $733,636,638) | | | | 762,248,034 | |
| | | | | |
CONVERTIBLE PREFERRED STOCK—0.7% | | | | | |
BIOTECHNOLOGY—0.7% | | | | | |
Merrimack Pharmaceuticals Inc., Cl. B, /Restricted *,(L3),(b) | | 586,714 | | 3,395,901 | |
Merrimack Pharmaceuticals Inc., Cl. C, /Restricted *,(L3),(c) | | 611,759 | | 2,294,096 | |
| | | | 5,689,997 | |
TOTAL CONVERTIBLE PREFERRED STOCK
(Cost $5,689,997) | | | | 5,689,997 | |
| | | | | | |
| | PRINCIPAL
AMOUNT | | | |
CONVERTIBLE CORPORATE BONDS—1.3% | | | | | |
WIRELESS TELECOMMUNICATION SERVICES—1.3% | | | | | |
SBA Communications Corp., 4.00%, 10/1/14(L2)
(Cost $8,920,564) | | 7,266,000 | | 10,590,195 | |
| | | | | |
Total Investments
(Cost $748,247,199)(d) | | 98.9 | % | 778,528,226 | |
Other Assets in Excess of Liabilities | | 1.1 | | 8,587,183 | |
| | | | | |
NET ASSETS | | 100.0 | % | $ | 787,115,409 | |
| | | | | | |
‡ | Securities classified as Level 1 for ASC 820 disclosure purposes based on valuation inputs unless otherwise noted. |
| |
* | Non-income producing security. |
# | American Depository Receipts. |
(a) | Restricted Security - Investment in security pending registration under the Securities Act of 1933. The investment is deemed to be illiquid and may be sold only to qualified institutional buyers. Security was acquired on October 7, 2010 for a cost of $8,992,050 and represents 1.6% of the net assets of the Fund. |
(b) | Restricted Security - Investment in security not registered under the Securities Act of 1933. The investment is deemed to be illiquid and may be sold only to qualified institutional buyers. Security was acquired on August 25, 2010 for a cost of $3,395,901 and represents 0.4% of the net assets of the Fund. |
(c) | Restricted Security - Investment in security not registered under the Securities Act of 1933. The investment is deemed to be illiquid and may be sold only to qualified institutional buyers. Security was acquired on August 25, 2010 for a cost of $2,294,096 and represents 0.3% of the net assets of the Fund. |
(d) | At October 31, 2010, the net unrealized appreciation on investments, based on cost for federal income tax purposes of $752,314,231 amounted to $26,213,995 which consisted of aggregate gross unrealized appreciation of $74,346,616 and aggregate gross unrealized depreciation of $48,132,621. |
(L2) | Security classified as Level 2 for ASC 820 disclosure purposes based on valuation inputs. |
(L3) | Security classified as Level 3 for ASC 820 disclosure purposes based on valuation inputs. |
Industry classifications are unaudited.
See Notes to Financial Statements.
29
THE ALGER INSTITUTIONAL FUNDS | ALGER SMALL CAP GROWTH INSTITUTIONAL FUND
Schedule of Investments‡ October 31, 2010
| | SHARES | | VALUE | |
COMMON STOCKS—97.2% | | | | | |
AEROSPACE & DEFENSE—2.4% | | | | | |
AAR Corp. * | | 152,550 | | $ | 3,362,202 | |
BE Aerospace Inc. * | | 283,955 | | 10,438,186 | |
Esterline Technologies Corp. * | | 232,375 | | 14,044,745 | |
| | | | 27,845,133 | |
AIRLINES—0.9% | | | | | |
Airtran Holdings Inc.* | | 1,466,290 | | 10,850,546 | |
| | | | | |
APPAREL RETAIL—2.9% | | | | | |
Aeropostale Inc. * | | 227,125 | | 5,537,308 | |
AnnTaylor Stores Corp. * | | 600,050 | | 13,981,164 | |
Childrens Place Retail Stores Inc., /The * | | 257,700 | | 11,354,261 | |
Coldwater Creek Inc. * | | 1,079,550 | | 3,638,084 | |
| | | | 34,510,817 | |
APPLICATION SOFTWARE—9.0% | | | | | |
Cadence Design Systems, Inc. * | | 1,105,150 | | 9,360,621 | |
Concur Technologies Inc. * | | 214,900 | | 11,093,138 | |
Informatica Corp. * | | 301,950 | | 12,286,345 | |
Nice Systems Ltd. #* | | 424,655 | | 14,221,695 | |
Pegasystems Inc. | | 177,586 | | 4,803,701 | |
QLIK Technologies Inc. * | | 335,450 | | 8,376,187 | |
Solera Holdings Inc. | | 289,200 | | 13,896,059 | |
Taleo Corp., Cl. A * | | 338,100 | | 9,700,089 | |
Ultimate Software Group Inc. * | | 268,300 | | 11,102,254 | |
VanceInfo Technologies Inc. #* | | 312,750 | | 11,374,718 | |
| | | | 106,214,807 | |
AUTO PARTS & EQUIPMENT—1.2% | | | | | |
Dana Holding Corp.* | | 963,650 | | 13,635,648 | |
| | | | | |
BIOTECHNOLOGY—2.2% | | | | | |
Acorda Therapeutics Inc. * | | 129,250 | | 3,494,920 | |
Cubist Pharmaceuticals Inc. * | | 198,200 | | 4,614,096 | |
Incyte Corp., Ltd. * | | 207,050 | | 3,449,453 | |
Savient Pharmaceuticals Inc. * | | 408,800 | | 5,073,208 | |
United Therapeutics Corp. * | | 145,330 | | 8,719,800 | |
| | | | 25,351,477 | |
CASINOS & GAMING—0.7% | | | | | |
WMS Industries Inc.* | | 196,450 | | 8,571,114 | |
| | | | | |
COAL & CONSUMABLE FUELS—0.8% | | | | | |
Patriot Coal Corp.* | | 653,900 | | 8,821,111 | |
| | | | | |
COMMERCIAL PRINTING—0.3% | | | | | |
Warnaco Group Inc., /The* | | 62,900 | | 3,340,619 | |
| | | | | |
COMMODITY CHEMICALS—0.5% | | | | | |
STR Holdings Inc.* | | 240,650 | | 5,980,153 | |
| | | | | |
COMMUNICATIONS EQUIPMENT—3.3% | | | | | |
Acme Packet Inc. * | | 127,300 | | 5,034,715 | |
Aruba Networks Inc. * | | 545,450 | | 11,950,809 | |
Finisar Corp. * | | 699,450 | | 11,897,645 | |
| | | | | | |
30
| | SHARES | | VALUE | |
COMMON STOCKS—(CONT.) | | | | | |
COMMUNICATIONS EQUIPMENT—(CONT.) | | | | | |
Riverbed Technology Inc. * | | 178,050 | | $ | 10,244,997 | |
| | | �� | 39,128,166 | |
COMPUTER STORAGE & PERIPHERALS—0.8% | | | | | |
QLogic Corp. * | | 339,900 | | 5,972,043 | |
Smart Technologies Inc., Cl. A * | | 268,100 | | 3,482,619 | |
| | | | 9,454,662 | |
CONSTRUCTION & ENGINEERING—0.7% | | | | | |
Aecom Technology Corp.* | | 323,700 | | 8,574,813 | |
| | | | | |
DATA PROCESSING & OUTSOURCED SERVICES—1.0% | | | | | |
Wright Express Corp.* | | 312,685 | | 11,791,351 | |
| | | | | |
DISTRIBUTORS—1.1% | | | | | |
LKQ Corp.* | | 610,740 | | 13,277,488 | |
| | | | | |
DIVERSIFIED CHEMICALS—0.3% | | | | | |
Solutia Inc.* | | 215,700 | | 3,906,327 | |
| | | | | |
EDUCATION SERVICES—1.2% | | | | | |
American Public Education Inc. * | | 240,700 | | 6,729,972 | |
Grand Canyon Education, Inc. * | | 362,700 | | 6,822,387 | |
| | | | 13,552,359 | |
ELECTRIC UTILITIES—1.1% | | | | | |
ITC Holdings Corp. | | 215,385 | | 13,485,255 | |
| | | | | |
ELECTRICAL COMPONENTS & EQUIPMENT—2.2% | | | | | |
GrafTech International Ltd. * | | 722,700 | | 11,902,869 | |
Woodward Governor Co. | | 453,550 | | 14,214,257 | |
| | | | 26,117,126 | |
ENVIRONMENTAL & FACILITIES SERVICES—2.7% | | | | | |
Clean Harbors, Inc. * | | 148,950 | | 10,500,975 | |
Tetra Tech Inc. * | | 331,350 | | 6,978,231 | |
Waste Connections Inc. | | 355,600 | | 14,487,144 | |
| | | | 31,966,350 | |
FOOD DISTRIBUTORS—0.6% | | | | | |
United Natural Foods Inc.* | | 209,600 | | 7,495,296 | |
| | | | | |
FOREST PRODUCTS—0.6% | | | | | |
Louisiana-Pacific Corp.* | | 941,450 | | 7,286,823 | |
| | | | | |
GOLD—0.4% | | | | | |
Gammon Gold Inc.* | | 686,750 | | 4,690,503 | |
| | | | | |
HEALTH CARE EQUIPMENT—4.2% | | | | | |
Arthrocare Corp. * | | 196,900 | | 5,371,432 | |
Insulet Corp. * | | 666,250 | | 10,626,687 | |
MAKO Surgical Corp. * | | 470,892 | | 5,076,216 | |
NuVasive Inc. * | | 216,380 | | 5,669,156 | |
Sirona Dental Systems Inc. * | | 216,850 | | 8,164,403 | |
Thoratec Corp. * | | 315,050 | | 10,283,231 | |
Wright Medical Group Inc. * | | 356,850 | | 4,760,379 | |
| | | | 49,951,504 | |
| | | | | | |
31
| | SHARES | | VALUE | |
COMMON STOCKS—(CONT.) | | | | | |
HEALTH CARE FACILITIES—1.6% | | | | | |
LifePoint Hospitals Inc. * | | 331,700 | | $ | 11,251,264 | |
Select Medical Holdings Corp. * | | 930,250 | | 6,958,270 | |
| | | | 18,209,534 | |
HEALTH CARE SERVICES—1.7% | | | | | |
Catalyst Health Solutions, Inc. * | | 311,700 | | 11,797,845 | |
Gentiva Health Services Inc. * | | 374,650 | | 8,721,852 | |
| | | | 20,519,697 | |
HEALTH CARE SUPPLIES—0.6% | | | | | |
AGA Medical Holdings Inc.* | | 350,100 | | 7,264,575 | |
| | | | | |
HEALTH CARE TECHNOLOGY—1.7% | | | | | |
MedAssets Inc. * | | 444,550 | | 8,241,957 | |
Medidata Solutions Inc. * | | 621,700 | | 11,582,271 | |
| | | | 19,824,228 | |
HOME FURNISHING RETAIL—1.1% | | | | | |
Williams-Sonoma Inc. | | 396,550 | | 12,836,324 | |
| | | | | |
HOME FURNISHINGS—0.3% | | | | | |
Ethan Allen Interiors Inc. | | 217,350 | | 3,297,200 | |
| | | | | |
HOTELS RESORTS & CRUISE LINES—1.9% | | | | | |
Gaylord Entertainment Co. * | | 374,000 | | 12,469,159 | |
Interval Leisure Group * | | 715,116 | | 10,261,915 | |
| | | | 22,731,074 | |
HOUSEWARES & SPECIALTIES—1.1% | | | | | |
Tupperware Brands Corp. | | 274,850 | | 12,316,029 | |
| | | | | |
HUMAN RESOURCE & EMPLOYMENT SERVICES—1.1% | | | | | |
Towers Watson & Co. | | 240,500 | | 12,366,510 | |
| | | | | |
INDUSTRIAL MACHINERY—3.3% | | | | | |
Actuant Corp., Cl. A | | 639,210 | | 14,363,048 | |
Clarcor Inc. | | 267,000 | | 10,589,220 | |
RBC Bearings Inc. * | | 417,390 | | 13,907,435 | |
| | | | 38,859,703 | |
INTERNET RETAIL—1.3% | | | | | |
Shutterfly Inc.* | | 497,400 | | 14,971,739 | |
| | | | | |
INTERNET SOFTWARE & SERVICES—4.0% | | | | | |
GSI Commerce Inc. * | | 481,722 | | 11,763,651 | |
LogMeIn, Inc. * | | 314,650 | | 12,501,045 | |
OpenTable Inc. * | | 220,500 | | 13,527,675 | |
VistaPrint Ltd. * | | 217,990 | | 9,170,839 | |
| | | | 46,963,210 | |
INVESTMENT BANKING & BROKERAGE—1.0% | | | | | |
Greenhill & Co., Inc. | | 156,200 | | 12,132,054 | |
| | | | | |
IT CONSULTING & OTHER SERVICES—0.4% | | | | | |
SRA International, Inc. Cl. A* | | 217,400 | | 4,350,174 | |
| | | | | |
LEISURE FACILITIES—0.8% | | | | | |
Life Time Fitness Inc.* | | 250,845 | | 9,063,030 | |
| | | | | | |
32
| | SHARES | | VALUE | |
COMMON STOCKS—(CONT.) | | | | | |
LEISURE PRODUCTS—0.6% | | | | | |
Carter’s Inc. * | | 184,750 | | $ | 4,600,275 | |
Vera Bradley Inc. * | | 93,100 | | 2,546,285 | |
| | | | 7,146,560 | |
LIFE SCIENCES TOOLS & SERVICES—1.9% | | | | | |
Bruker Corp. * | | 732,250 | | 10,976,428 | |
Parexel International Corp. * | | 525,792 | | 11,304,528 | |
| | | | 22,280,956 | |
MANAGED HEALTH CARE—1.0% | | | | | |
Amerigroup Corp.* | | 281,850 | | 11,761,601 | |
| | | | | |
METAL & GLASS CONTAINERS—0.8% | | | | | |
Silgan Holdings Inc. | | 277,050 | | 9,350,438 | |
| | | | | |
OFFICE SERVICES & SUPPLIES—0.3% | | | | | |
American Reprographics Co.* | | 431,000 | | 3,068,720 | |
| | | | | |
OIL & GAS EQUIPMENT & SERVICES—1.2% | | | | | |
Cal Dive International Inc. * | | 803,650 | | 4,066,469 | |
Dril-Quip Inc. * | | 83,820 | | 5,791,962 | |
Lufkin Industries Inc. | | 78,200 | | 3,820,070 | |
| | | | 13,678,501 | |
OIL & GAS EXPLORATION & PRODUCTION—2.1% | | | | | |
Kodiak Oil & Gas Corp. * | | 1,650,350 | | 6,799,441 | |
Mariner Energy Inc. * | | 212,200 | | 5,288,024 | |
Quicksilver Resources Inc. * | | 318,550 | | 4,768,694 | |
Rosetta Resources Inc. * | | 216,750 | | 5,182,493 | |
SM Energy Co. | | 71,850 | | 2,994,708 | |
| | | | 25,033,360 | |
PACKAGED FOODS & MEATS—2.1% | | | | | |
Diamond Foods, Inc. | | 178,700 | | 7,898,540 | |
Flowers Foods Inc. | | 300,850 | | 7,665,658 | |
Hain Celestial Group Inc. * | | 336,415 | | 8,319,543 | |
| | | | 23,883,741 | |
PHARMACEUTICALS—2.5% | | | | | |
Auxilium Pharmaceuticals Inc. * | | 361,230 | | 8,940,443 | |
Eurand NV * | | 153,992 | | 1,687,752 | |
Medicis Pharmaceutical Corp., Cl. A | | 329,100 | | 9,790,724 | |
Optimer Pharmaceuticals Inc. * | | 890,812 | | 8,364,725 | |
| | | | 28,783,644 | |
PUBLISHING—0.8% | | | | | |
Valassis Communications Inc.* | | 298,350 | | 9,845,550 | |
| | | | | |
RAILROADS—1.2% | | | | | |
Genesee & Wyoming Inc., Cl. A* | | 297,900 | | 13,771,917 | |
| | | | | |
REGIONAL BANKS—1.5% | | | | | |
Investors Bancorp, Inc. * | | 594,550 | | 7,134,600 | |
Signature Bank * | | 223,000 | | 9,419,520 | |
| | | | 16,554,120 | |
REINSURANCE—0.5% | | | | | |
Platinum Underwriters Holdings Ltd. | | 135,500 | | 5,833,275 | |
| | | | | | |
33
| | SHARES | | VALUE | |
COMMON STOCKS—(CONT.) | | | | | |
RESEARCH & CONSULTING SERVICES—1.9% | | | | | |
FTI Consulting Inc. * | | 165,960 | | $ | 5,884,942 | |
ICF International Inc. * | | 324,000 | | 8,300,880 | |
Resources Connection Inc. | | 495,300 | | 8,018,907 | |
| | | | 22,204,729 | |
RESTAURANTS—1.7% | | | | | |
Cheesecake Factory Inc., /The * | | 341,950 | | 9,957,583 | |
McCormick & Schmick’s Seafood Restaurants Inc. * | | 649,267 | | 5,797,954 | |
Sonic Corp. * | | 507,700 | | 4,508,376 | |
| | | | 20,263,913 | |
SECURITY & ALARM SERVICES—1.3% | | | | | |
Geo Group Inc., /The* | | 577,600 | | 14,815,440 | |
| | | | | |
SEMICONDUCTOR EQUIPMENT—1.3% | | | | | |
Novellus Systems Inc.* | | 514,800 | | 15,037,308 | |
| | | | | |
SEMICONDUCTORS—4.7% | | | | | |
Applied Micro Circuits Corporation * | | 932,150 | | 9,386,751 | |
Atheros Communications Inc. * | | 326,535 | | 10,135,646 | |
Mellanox Technologies Ltd. * | | 377,450 | | 8,688,899 | |
Monolithic Power Systems Inc. * | | 471,400 | | 7,575,398 | |
Netlogic Microsystems Inc. * | | 287,000 | | 8,627,220 | |
Skyworks Solutions Inc. * | | 490,613 | | 11,239,944 | |
| | | | 55,653,858 | |
SPECIALIZED CONSUMER SERVICES—1.2% | | | | | |
Sotheby’s | | 319,550 | | 14,009,072 | |
| | | | | |
SPECIALTY CHEMICALS—1.9% | | | | | |
Kraton Performance Polymers Inc. * | | 266,500 | | 8,650,590 | |
Rockwood Holdings Inc. * | | 377,850 | | 12,816,671 | |
| | | | 21,467,261 | |
SPECIALTY STORES—1.1% | | | | | |
Ulta Salon, Cosmetics & Fragrance, Inc.* | | 403,050 | | 12,369,605 | |
| | | | | |
THRIFTS & MORTGAGE FINANCE—0.5% | | | | | |
Ocwen Financial Corp.* | | 699,750 | | 6,038,843 | |
| | | | | |
TRUCKING—0.7% | | | | | |
Dollar Thrifty Automotive Group Inc.* | | 185,900 | | 8,625,760 | |
| | | | | |
WIRELESS TELECOMMUNICATION SERVICES—1.4% | | | | | |
Syniverse Holdings Inc.* | | 549,650 | | 16,758,829 | |
| | | | | |
TOTAL COMMON STOCKS
(Cost $995,825,884) | | | | 1,139,741,530 | |
| | | | | |
Total Investments
(Cost $995,825,884)(a) | | 97.2 | % | 1,139,741,530 | |
Other Assets in Excess of Liabilities | | 2.8 | | 33,194,982 | |
| | | | | |
NET ASSETS | | 100.0 | % | $ | 1,172,936,512 | |
34
‡ | | Securities classified as Level 1 for ASC 820 disclosure purposes based on valuation inputs unless otherwise noted. |
| | |
* | | Non-income producing security. |
# | | American Depository Receipts. |
(a) | | At October 31, 2010, the net unrealized appreciation on investments, based on cost for federal income tax purposes of $996,426,897 amounted to $143,314,633 which consisted of aggregate gross unrealized appreciation of $200,722,403 and aggregate gross unrealized depreciation of $57,407,770. |
Industry classifications are unaudited.
See Notes to Financial Statements.
35
THE ALGER INSTITUTIONAL FUNDS
Statements of Assets and Liabilities October 31, 2010
| | Alger Capital
Appreciation
Institutional Fund | | Alger Large Cap
Growth
Institutional Fund | |
ASSETS: | | | | | |
Investments in securities, at value (identified cost)* see accompanying schedules of investments | | $ | 955,834,084 | | $ | 27,759,303 | |
Cash and cash equivalents | | 29,479,209 | | 1,267,128 | |
Receivable for investment securities sold | | 17,663,541 | | 258,489 | |
Receivable for shares of beneficial interest sold | | 6,316,689 | | 206,837 | |
Dividends and interest receivable | | 550,573 | | 21,918 | |
Prepaid expenses | | 103,219 | | 27,559 | |
Total Assets | | 1,009,947,315 | | 29,541,234 | |
LIABILITIES: | | | | | |
Payable for investment securities purchased | | 22,001,382 | | 382,649 | |
Payable for shares of beneficial interest redeemed | | 6,035,437 | | 25,930 | |
Accrued investment advisory fees | | 666,172 | | 17,138 | |
Accrued transfer agent fees | | 24,858 | | 4,646 | |
Accrued distribution fees | | 71,303 | | 2,558 | |
Accrued administrative fees | | 22,617 | | 664 | |
Accrued shareholder servicing fees | | 213,833 | | 6,276 | |
Accrued other expenses | | 99,929 | | 30,498 | |
Total Liabilities | | 29,135,531 | | 470,359 | |
NET ASSETS | | $ | 980,811,784 | | $ | 29,070,875 | |
Net Assets Consist of: | | | | | |
Paid in capital (par value of $.001 per share) | | 978,612,262 | | 40,245,220 | |
Undistributed net investment income | | 128,267 | | 179,383 | |
Undistributed net realized gain (accumulated realized loss) | | (44,267,855 | ) | (12,541,503 | ) |
Net unrealized appreciation on investments | | 46,339,110 | | 1,187,775 | |
NET ASSETS | | $ | 980,811,784 | | $ | 29,070,875 | |
Net Assets By Class | | | | | |
Class I | | $ | 809,467,631 | | $ | 22,961,153 | |
Class R | | $ | 171,344,153 | | $ | 6,109,722 | |
Shares Of Beneficial Interest Outstanding—Note 6 | | | | | |
Class I | | 41,990,993 | | 1,762,581 | |
Class R | | 9,226,775 | | 485,170 | |
Net Asset Value Per Share | | | | | |
Class I | | $ | 19.28 | | $ | 13.03 | |
Class R | | $ | 18.57 | | $ | 12.59 | |
*Identified cost | | $ | 909,494,974 | | $ | 26,571,527 | |
See Notes to Financial Statements.
36
THE ALGER INSTITUTIONAL FUNDS
Statements of Assets and Liabilities October 31, 2010
| | Alger Mid Cap
Growth
Institutional Fund | | Alger Small Cap
Growth
Institutional Fund | |
ASSETS: | | | | | |
Investments in securities, at value (identified cost)* see accompanying schedules of investments | | $ | 778,528,226 | | $ | 1,139,741,530 | |
Cash and cash equivalents | | 21,662,047 | | 30,198,556 | |
Receivable for investment securities sold | | 14,123,372 | | 6,290,357 | |
Receivable for shares of beneficial interest sold | | 1,085,162 | | 3,187,189 | |
Dividends and interest receivable | | 67,676 | | 111,122 | |
Prepaid expenses | | 88,812 | | 120,780 | |
Total Assets | | 815,555,295 | | 1,179,649,534 | |
LIABILITIES: | | | | | |
Payable for investment securities purchased | | 23,009,663 | | 1,975,671 | |
Payable for shares of beneficial interest redeemed | | 4,562,342 | | 3,280,477 | |
Accrued investment advisory fees | | 505,576 | | 797,662 | |
Accrued transfer agent fees | | 20,130 | | 168,392 | |
Accrued distribution fees | | 21,172 | | 28,494 | |
Accrued administrative fees | | 18,294 | | 27,081 | |
Accrued shareholder servicing fees | | 172,960 | | 256,040 | |
Accrued other expenses | | 129,749 | | 179,205 | |
Total Liabilities | | 28,439,886 | | 6,713,022 | |
NET ASSETS | | $ | 787,115,409 | | $ | 1,172,936,512 | |
Net Assets Consist of: | | | | | |
Paid in capital (par value of $.001 per share) | | 1,235,383,196 | | 1,108,629,238 | |
Undistributed net investment income | | 225,701 | | 72,431 | |
Undistributed net realized gain (accumulated realized loss) | | (478,774,513 | ) | (79,680,803 | ) |
Net unrealized appreciation on investments | | 30,281,025 | | 143,915,646 | |
NET ASSETS | | $ | 787,115,409 | | $ | 1,172,936,512 | |
Net Assets By Class | | | | | |
Class I | | $ | 737,099,364 | | $ | 1,104,865,290 | |
Class R | | $ | 50,016,045 | | $ | 68,071,222 | |
Shares Of Beneficial Interest Outstanding—Note 6 | | | | | |
Class I | | 56,214,072 | | 43,712,910 | |
Class R | | 3,997,656 | | 2,790,477 | |
Net Asset Value Per Share | | | | | |
Class I | | $ | 13.11 | | $ | 25.28 | |
Class R | | $ | 12.51 | | $ | 24.39 | |
*Identified cost | | $ | 748,247,199 | | $ | 995,825,884 | |
See Notes to Financial Statements.
37
THE ALGER INSTITUTIONAL FUNDS
Statements of Operations
For the year ended October 31, 2010
| | Alger Capital
Appreciation
Institutional Fund | | Alger Large Cap
Growth
Institutional Fund | |
INCOME | | | | | |
Dividends (net of foreign withholding taxes*) | | $ | 10,260,508 | | $ | 774,990 | |
Interest | | 14,234 | | 107 | |
Total Income | | 10,274,742 | | 775,097 | |
EXPENSES | | | | | |
Advisory fees—Note 3(a) | | 7,280,444 | | 287,154 | |
Distribution fees—Note3(b): | | | | | |
Class R | | 677,249 | | 29,656 | |
Shareholder servicing fees—Note 3(e) | | 2,247,051 | | 101,111 | |
Administrative fees—Note 3(a) | | 247,175 | | 11,122 | |
Custodian fees | | 97,390 | | 37,249 | |
Interest expenses | | — | | 2,872 | |
Transfer agent fees and expenses—Note 3(d) | | 158,755 | | 28,402 | |
Printing fees | | 118,360 | | 7,425 | |
Professional fees | | 44,160 | | 25,445 | |
Registration fees | | 113,350 | | 31,918 | |
Trustee fees—Note 3(f) | | 20,649 | | 17,923 | |
Miscellaneous | | 160,859 | | 10,699 | |
Total Expenses | | 11,165,442 | | 590,976 | |
NET INVESTMENT INCOME (LOSS) | | (890,700 | ) | 184,121 | |
REALIZED AND UNREALIZED GAIN (LOSS) ON INVESTMENTS AND FOREIGN CURRENCY | | | | | |
Net realized gain on investments | | 101,637,334 | | 3,578,613 | |
Net realized loss on foreign currency transactions | | (388,611 | ) | — | |
Net change in unrealized appreciation (depreciation) on investments and foreign currency | | 31,598,335 | | 1,434,610 | |
Net realized and unrealized gain on investments and foreign currency | | 132,847,058 | | 5,013,223 | |
NET INCREASE IN NET ASSETS RESULTING FROM OPERATIONS | | $ | 131,956,358 | | $ | 5,197,344 | |
*Foreign withholding taxes | | $ | 44,010 | | $ | 1,073 | |
See Notes to Financial Statements.
38
THE ALGER INSTITUTIONAL FUNDS
Statements of Operations
For the year ended October 31, 2010
| | Alger Mid Cap
Growth
Institutional Fund | | Alger Small Cap
Growth
Institutional Fund | |
INCOME | | | | | |
Dividends (net of foreign withholding taxes*) | | $ | 10,725,720 | | $ | 3,389,521 | |
Interest | | (121,803 | ) | 8,372 | |
Total Income | | 10,603,917 | | 3,397,893 | |
EXPENSES | | | | | |
Advisory fees—Note 3(a) | | 6,754,626 | | 9,549,892 | |
Distribution fees—Note3(b): | | | | | |
Class R | | 261,361 | | 312,667 | |
Shareholder servicing fees—Note 3(e) | | 2,221,916 | | 2,947,498 | |
Administrative fees—Note 3(a) | | 244,411 | | 324,225 | |
Custodian fees | | 138,850 | | 77,360 | |
Interest expenses | | 6,105 | | 1,070 | |
Transfer agent fees and expenses—Note 3(d) | | 107,424 | | 886,286 | |
Printing fees | | 135,280 | | 293,720 | |
Professional fees | | 47,850 | | 51,450 | |
Registration fees | | 132,622 | | 143,027 | |
Trustee fees—Note 3(f) | | 21,835 | | 21,793 | |
Miscellaneous | | 175,437 | | 209,299 | |
Total Expenses | | 10,247,717 | | 14,818,287 | |
NET INVESTMENT INCOME (LOSS) | | 356,200 | | (11,420,394 | ) |
REALIZED AND UNREALIZED GAIN (LOSS) ON INVESTMENTS AND FOREIGN CURRENCY | | | | | |
Net realized gain on investments | | 140,493,742 | | 92,906,785 | |
Net realized gain on redemption-in-kind | | — | | 9,448,915 | |
Net realized loss on foreign currency transactions | | (218,759 | ) | — | |
Net change in unrealized appreciation (depreciation) on investments and foreign currency | | 36,648,897 | | 172,896,159 | |
Net realized and unrealized gain on investments and foreign currency | | 176,923,880 | | 275,251,859 | |
NET INCREASE IN NET ASSETS RESULTING FROM OPERATIONS | | $ | 177,280,080 | | $ | 263,831,465 | |
*Foreign withholding taxes | | $ | 75,831 | | $ | 7,405 | |
See Notes to Financial Statements.
39
THE ALGER INSTITUTIONAL FUNDS
Statements of Changes in Net Assets
| | Alger Capital Appreciation Institutional
Fund | |
| | For the
Year Ended
October 31, 2010 | | For the
Year Ended
October 31, 2009 | |
Net investment income (loss) | | $ | (890,700 | ) | $ | 1,411,789 | |
Net realized gain (loss) on investments and foreign currency | | 101,248,723 | | (26,872,941 | ) |
Net change in unrealized appreciation on investments and foreign currency | | 31,598,335 | | 151,801,667 | |
Net increase in net assets resulting from operations | | 131,956,358 | | 126,340,515 | |
Dividends and distributions to shareholders from: | | | | | |
Net investment income | | | | | |
Class I | | (1,279,828 | ) | — | |
Total dividends and distributions to shareholders | | (1,279,828 | ) | — | |
Increase (decrease) from shares of beneficial interest transactions: | | | | | |
Class I | | 65,815,020 | | 110,204,995 | |
Class R | | 62,394,146 | | 20,767,606 | |
Net increase (decrease) from shares of beneficial interest transactions—Note 6 | | 128,209,166 | | 130,972,601 | |
Total increase (decrease) | | 258,885,696 | | 257,313,116 | |
Net Assets: | | | | | |
Beginning of period | | 721,926,088 | | 464,612,972 | |
END OF PERIOD | | $ | 980,811,784 | | $ | 721,926,088 | |
Undistributed net investment income (accumulated loss) | | $ | 128,267 | | $ | 1,412,311 | |
See Notes to Financial Statements.
40
| | Alger Large Cap Growth Institutional
Fund | | Alger Mid Cap Growth Institutional
Fund | | Alger Small Cap Growth Institutional
Fund | |
| | For the
Year Ended
October 31, 2010 | | For the
Year Ended
October 31, 2009 | | For the
Year Ended
October 31, 2010 | | For the
Year Ended
October 31, 2009 | | For the
Year Ended
October 31, 2010 | | For the
Year Ended
October 31, 2009 | |
Net investment income (loss) | | $ | 184,121 | | $ | 149,148 | | $ | 356,200 | | $ | (3,952,932 | ) | $ | (11,420,394 | ) | $ | (7,511,300 | ) |
Net realized gain (loss) on investments and foreign currency | | 3,578,613 | | (3,618,992 | ) | 140,274,983 | | (251,223,862 | ) | 102,355,700 | | (93,926,865 | ) |
Net change in unrealized appreciation on investments and foreign currency | | 1,434,610 | | 12,233,784 | | 36,648,897 | | 415,716,107 | | 172,896,159 | | 260,838,132 | |
Net increase in net assets resulting from operations | | 5,197,344 | | 8,763,940 | | 177,280,080 | | 160,539,314 | | 263,831,465 | | 159,399,967 | |
Dividends and distributions to shareholders from: | | | | | | | | | | | | | |
Net investment income | | | | | | | | | | | | | |
Class I | | (150,594 | ) | — | | — | | — | | — | | — | |
Total dividends and distributions to shareholders | | (150,594 | ) | — | | — | | — | | — | | — | |
Increase (decrease) from shares of beneficial interest transactions: | | | | | | | | | | | | | |
Class I | | (20,603,532 | ) | 11,139,323 | | (303,170,480 | ) | (160,675,767 | ) | (113,843,842 | ) | 183,192,236 | |
Class R | | (717,668 | ) | (84,562 | ) | (10,849,685 | ) | 1,572,053 | | 2,465,726 | | 4,315,508 | |
Net increase (decrease) from shares of beneficial interest transactions—Note 6 | | (21,321,200 | ) | 11,054,761 | | (314,020,165 | ) | (159,103,714 | ) | (111,378,116 | ) | 187,507,744 | |
Total increase (decrease) | | (16,274,450 | ) | 19,818,701 | | (136,740,085 | ) | 1,435,600 | | 152,453,349 | | 346,907,711 | |
Net Assets: | | | | | | | | | | | | | |
Beginning of period | | 45,345,325 | | 25,526,624 | | 923,855,494 | | 922,419,894 | | 1,020,483,163 | | 673,575,452 | |
END OF PERIOD | | $ | 29,070,875 | | $ | 45,345,325 | | $ | 787,115,409 | | $ | 923,855,494 | | $ | 1,172,936,512 | | $ | 1,020,483,163 | |
Undistributed net investment income (accumulated loss) | | $ | 179,383 | | $ | 148,047 | | $ | 225,701 | | $ | (6,928 | ) | $ | 72,431 | | $ | 59,813 | |
41
THE ALGER INSTITUTIONAL FUNDS
Financial Highlights for a share outstanding throughout the period
Alger Capital Appreciation Institutional Fund
| | Class I | |
| | Year ended
10/31/2010 | | Year ended
10/31/2009 | | Year ended
10/31/2008 | | Year ended
10/31/2007 | | Year ended
10/31/2006 | |
Net asset value, beginning of period | | $ | 16.41 | | $ | 13.23 | | $ | 22.27 | | $ | 15.77 | | $ | 13.28 | |
INCOME FROM INVESTMENT OPERATIONS: | | | | | | | | | | | |
Net investment income (loss)(i) | | 0.00 | | 0.04 | | (0.04 | ) | (0.06 | ) | (0.06 | ) |
Net realized and unrealized gain (loss) on investments | | 2.90 | | 3.14 | | (9.00 | ) | 6.56 | | 2.55 | |
Total from investment operations | | 2.90 | | 3.18 | | (9.04 | ) | 6.50 | | 2.49 | |
Dividends from net investment income | | (0.03 | ) | — | | — | | — | | — | |
Net asset value, end of period | | $ | 19.28 | | $ | 16.41 | | $ | 13.23 | | $ | 22.27 | | $ | 15.77 | |
Total return | | 17.7 | % | 23.9 | % | (40.6 | )% | 41.3 | % | 18.7 | % |
RATIOS/SUPPLEMENTAL DATA: | | | | | | | | | | | |
Net assets, end of period (000’s omitted) | | $ | 809,468 | | $ | 632,250 | | $ | 411,056 | | $ | 537,928 | | $ | 165,422 | |
Ratio of gross expenses to average net assets | | 1.17 | % | 1.21 | % | 1.18 | % | 1.23 | % | 1.27 | % |
Ratio of expense reimbursements to average net assets | | 0.00 | % | 0.00 | % | 0.00 | % | 0.00 | % | 0.00 | % |
Ratio of net expenses to average net assets | | 1.17 | % | 1.21 | % | 1.18 | % | 1.23 | % | 1.27 | % |
Ratio of net investment income (loss) to average net assets | | (0.02 | )% | 0.32 | % | (0.21 | )% | (0.33 | )% | (0.38 | )% |
Portfolio turnover rate | | 209.52 | % | 306.87 | % | 291.85 | % | 232.13 | % | 225.25 | % |
See Notes to Financial Statements.
(i) Amount was computed based on average shares outstanding during the period.
42
THE ALGER INSTITUTIONAL FUNDS
Financial Highlights for a share outstanding throughout the period
Alger Capital Appreciation Institutional Fund
| | Class R | |
| | Year ended
10/31/2010 | | Year ended
10/31/2009 | | Year ended
10/31/2008 | | Year ended
10/31/2007 | | Year ended
10/31/2006 | |
Net asset value, beginning of period | | $ | 15.86 | | $ | 12.85 | | $ | 21.75 | | $ | 15.47 | | $ | 13.09 | |
INCOME FROM INVESTMENT OPERATIONS: | | | | | | | | | | | |
Net investment loss(i) | | (0.10 | ) | (0.02 | ) | (0.13 | ) | (0.16 | ) | (0.15 | ) |
Net realized and unrealized gain (loss) on investments | | 2.81 | | 3.03 | | (8.77 | ) | 6.44 | | 2.53 | |
Total from investment operations | | 2.71 | | 3.01 | | (8.90 | ) | 6.28 | | 2.38 | |
Net asset value, end of period | | $ | 18.57 | | $ | 15.86 | | $ | 12.85 | | $ | 21.75 | | $ | 15.47 | |
Total return | | 17.1 | % | 23.3 | % | (40.9 | )% | 40.6 | % | 18.2 | % |
RATIOS/SUPPLEMENTAL DATA: | | | | | | | | | | | |
Net assets, end of period (000’s omitted) | | $ | 171,344 | | $ | 89,676 | | $ | 53,557 | | $ | 39,442 | | $ | 5,969 | |
Ratio of gross expenses to average net assets | | 1.67 | % | 1.71 | % | 1.68 | % | 1.72 | % | 1.79 | % |
Ratio of expense reimbursements to average net assets | | 0.00 | % | 0.00 | % | 0.00 | % | 0.00 | % | 0.00 | % |
Ratio of net expenses to average net assets | | 1.67 | % | 1.71 | % | 1.68 | % | 1.72 | % | 1.79 | % |
Ratio of net investment income (loss) to average net assets | | (0.55 | )% | (0.18 | )% | (0.70 | )% | (0.86 | )% | (0.90 | )% |
Portfolio turnover rate | | 209.52 | % | 306.87 | % | 291.85 | % | 232.13 | % | 225.25 | % |
See Notes to Financial Statements.
(i) Amount was computed based on average shares outstanding during the period.
43
THE ALGER INSTITUTIONAL FUNDS
Financial Highlights for a share outstanding throughout the period
Alger Large Cap Growth Institutional Fund
| | Class I | |
| | Year ended
10/31/2010 | | Year ended
10/31/2009 | | Year ended
10/31/2008 | | Year ended
10/31/2007 | | Year ended
10/31/2006 | |
Net asset value, beginning of period | | $ | 11.17 | | $ | 9.48 | | $ | 16.87 | | $ | 13.25 | | $ | 12.56 | |
INCOME FROM INVESTMENT OPERATIONS: | | | | | | | | | | | |
Net investment income (loss)(i) | | 0.07 | | 0.04 | | (0.01 | ) | (0.03 | ) | (0.01 | ) |
Net realized and unrealized gain (loss) on investments | | 1.83 | | 1.65 | | (7.38 | ) | 3.65 | | 0.74 | |
Total from investment operations | | 1.90 | | 1.69 | | (7.39 | ) | 3.62 | | 0.73 | |
Dividends from net investment income | | (0.04 | ) | — | | — | | — | | (0.04 | ) |
Net asset value, end of period | | $ | 13.03 | | $ | 11.17 | | $ | 9.48 | | $ | 16.87 | | $ | 13.25 | |
Total return | | 17.1 | % | 17.7 | % | (43.8 | )% | 27.3 | % | 5.8 | % |
RATIOS/SUPPLEMENTAL DATA: | | | | | | | | | | | |
Net assets, end of period (000’s omitted) | | $ | 22,961 | | $ | 39,412 | | $ | 20,415 | | $ | 52,127 | | $ | 106,335 | |
Ratio of gross expenses to average net assets | | 1.36 | % | 1.37 | % | 1.23 | % | 1.32 | % | 1.21 | % |
Ratio of expense reimbursements to average net assets | | 0.00 | % | 0.00 | % | 0.00 | % | 0.00 | % | 0.00 | % |
Ratio of net expenses to average net assets | | 1.36 | % | 1.37 | % | 1.23 | % | 1.32 | % | 1.21 | % |
Ratio of net investment income (loss) to average net assets | | 0.56 | % | 0.46 | % | 0.04 | % | (0.19 | )% | (0.08 | )% |
Portfolio turnover rate | | 58.73 | % | 87.57 | % | 187.80 | % | 192.18 | % | 322.72 | % |
See Notes to Financial Statements.
(i) Amount was computed based on average shares outstanding during the period.
44
THE ALGER INSTITUTIONAL FUNDS
Financial Highlights for a share outstanding throughout the period
Alger Large Cap Growth Institutional Fund
| | Class R | |
| | Year ended
10/31/2010 | | Year ended
10/31/2009 | | Year ended
10/31/2008 | | Year ended
10/31/2007 | | Year ended
10/31/2006 | |
Net asset value, beginning of period | | $ | 10.83 | | $ | 9.24 | | $ | 16.52 | | $ | 13.04 | | $ | 12.39 | |
INCOME FROM INVESTMENT OPERATIONS: | | | | | | | | | | | |
Net investment loss(i) | | (0.02 | ) | 0.00 | | (0.08 | ) | (0.10 | ) | (0.08 | ) |
Net realized and unrealized gain (loss) on investments | | 1.78 | | 1.59 | | (7.20 | ) | 3.58 | | 0.73 | |
Total from investment operations | | 1.76 | | 1.59 | | (7.28 | ) | 3.48 | | 0.65 | |
Net asset value, end of period | | $ | 12.59 | | $ | 10.83 | | $ | 9.24 | | $ | 16.52 | | $ | 13.04 | |
Total return | | 16.3 | % | 17.2 | % | (44.1 | )% | 26.7 | % | 5.3 | % |
RATIOS/SUPPLEMENTAL DATA: | | | | | | | | | | | |
Net assets, end of period (000’s omitted) | | $ | 6,110 | | $ | 5,933 | | $ | 5,112 | | $ | 8,747 | | $ | 5,372 | |
Ratio of gross expenses to average net assets | | 2.05 | % | 1.89 | % | 1.73 | % | 1.81 | % | 1.71 | % |
Ratio of expense reimbursements to average net assets | | 0.00 | % | 0.00 | % | 0.00 | % | 0.00 | % | 0.00 | % |
Ratio of net expenses to average net assets | | 2.05 | % | 1.89 | % | 1.73 | % | 1.81 | % | 1.71 | % |
Ratio of net investment income (loss) to average net assets | | (0.16 | )% | (0.03 | )% | (0.55 | )% | (0.72 | )% | (0.59 | )% |
Portfolio turnover rate | | 58.73 | % | 87.57 | % | 187.80 | % | 192.18 | % | 322.72 | % |
See Notes to Financial Statements.
(i) Amount was computed based on average shares outstanding during the period.
45
THE ALGER INSTITUTIONAL FUNDS
Financial Highlights for a share outstanding throughout the period
Alger Mid Cap Growth Institutional Fund
| | Class I | |
| | Year ended
10/31/2010 | | Year ended
10/31/2009 | | Year ended
10/31/2008 | | Year ended
10/31/2007 | | Year ended
10/31/2006 | |
Net asset value, beginning of period | | $ | 10.68 | | $ | 8.76 | | $ | 23.24 | | $ | 17.29 | | $ | 17.57 | |
INCOME FROM INVESTMENT OPERATIONS: | | | | | | | | | | | |
Net investment income (loss)(i) | | 0.01 | | (0.04 | ) | (0.09 | ) | (0.11 | ) | (0.09 | ) |
Net realized and unrealized gain (loss) on investments | | 2.42 | | 1.96 | | (10.85 | ) | 7.44 | | 1.69 | |
Total from investment operations | | 2.43 | | 1.92 | | (10.94 | ) | 7.33 | | 1.60 | |
Distributions from net realized gains | | — | | — | | (3.54 | ) | (1.38 | ) | (1.88 | ) |
Net asset value, end of period | | $ | 13.11 | | $ | 10.68 | | $ | 8.76 | | $ | 23.24 | | $ | 17.29 | |
Total return | | 22.8 | % | 21.8 | % | (55.0 | )% | 45.5 | % | 9.5 | % |
RATIOS/SUPPLEMENTAL DATA: | | | | | | | | | | | |
Net assets, end of period (000’s omitted) | | $ | 737,099 | | $ | 872,936 | | $ | 882,046 | | $ | 2,032,326 | | $ | 1,349,500 | |
Ratio of gross expenses to average net assets | | 1.12 | % | 1.17 | % | 1.11 | % | 1.17 | % | 1.13 | % |
Ratio of expense reimbursements to average net assets | | 0.00 | % | 0.00 | % | 0.00 | % | 0.00 | % | 0.00 | % |
Ratio of net expenses to average net assets | | 1.12 | % | 1.17 | % | 1.11 | % | 1.17 | % | 1.13 | % |
Ratio of net investment income (loss) to average net assets | | 0.07 | % | (0.44 | )% | (0.56 | )% | (0.54 | )% | (0.54 | )% |
Portfolio turnover rate | | 193.69 | % | 297.99 | % | 324.49 | % | 274.32 | % | 253.59 | % |
See Notes to Financial Statements.
(i) Amount was computed based on average shares outstanding during the period.
46
THE ALGER INSTITUTIONAL FUNDS
Financial Highlights for a share outstanding throughout the period
Alger Mid Cap Growth Institutional Fund
| | Class R | |
| | Year ended
10/31/2010 | | Year ended
10/31/2009 | | Year ended
10/31/2008 | | Year ended
10/31/2007 | | Year ended
10/31/2006 | |
Net asset value, beginning of period | | $ | 10.24 | | $ | 8.45 | | $ | 22.64 | | $ | 16.95 | | $ | 17.34 | |
INCOME FROM INVESTMENT OPERATIONS: | | | | | | | | | | | |
Net investment loss(i) | | (0.05 | ) | (0.08 | ) | (0.16 | ) | (0.20 | ) | (0.18 | ) |
Net realized and unrealized gain (loss) on investments | | 2.32 | | 1.87 | | (10.49 | ) | 7.27 | | 1.67 | |
Total from investment operations | | 2.27 | | 1.79 | | (10.65 | ) | 7.07 | | 1.49 | |
Distributions from net realized gains | | — | | — | | (3.54 | ) | (1.38 | ) | (1.88 | ) |
Net asset value, end of period | | $ | 12.51 | | $ | 10.24 | | $ | 8.45 | | $ | 22.64 | | $ | 16.95 | |
Total return | | 22.2 | % | 21.0 | % | (55.3 | )% | 44.7 | % | 9.0 | % |
RATIOS/SUPPLEMENTAL DATA: | | | | | | | | | | | |
Net assets, end of period (000’s omitted) | | $ | 50,016 | | $ | 50,919 | | $ | 40,374 | | $ | 69,877 | | $ | 43,355 | |
Ratio of gross expenses to average net assets | | 1.65 | % | 1.68 | % | 1.61 | % | 1.67 | % | 1.63 | % |
Ratio of expense reimbursements to average net assets | | 0.00 | % | 0.00 | % | 0.00 | % | 0.00 | % | 0.00 | % |
Ratio of net expenses to average net assets | | 1.65 | % | 1.68 | % | 1.61 | % | 1.67 | % | 1.63 | % |
Ratio of net investment income (loss) to average net assets | | (0.46 | )% | (0.96 | )% | (1.05 | )% | (1.04 | )% | (1.05 | )% |
Portfolio turnover rate | | 193.69 | % | 297.99 | % | 324.49 | % | 274.32 | % | 253.59 | % |
See Notes to Financial Statements.
(i) Amount was computed based on average shares outstanding during the period.
47
THE ALGER INSTITUTIONAL FUNDS
Financial Highlights for a share outstanding throughout the period
Alger Small Cap Growth Institutional Fund
| | Class I | |
| | Year ended
10/31/2010 | | Year ended
10/31/2009 | | Year ended
10/31/2008 | | Year ended
10/31/2007 | | Year ended
10/31/2006 | |
Net asset value, beginning of period | | $ | 19.90 | | $ | 16.52 | | $ | 30.30 | | $ | 23.98 | | $ | 19.97 | |
INCOME FROM INVESTMENT OPERATIONS: | | | | | | | | | | | |
Net investment loss(i) | | (0.22 | ) | (0.16 | ) | (0.23 | ) | (0.21 | ) | (0.16 | ) |
Net realized and unrealized gain (loss) on investments | | 5.60 | | 3.54 | | (13.55 | ) | 6.53 | | 4.17 | |
Total from investment operations | | 5.38 | | 3.38 | | (13.78 | ) | 6.32 | | 4.01 | |
Net asset value, end of period | | $ | 25.28 | | $ | 19.90 | | $ | 16.52 | | $ | 30.30 | | $ | 23.98 | |
Total return | | 27.0 | % | 20.5 | % | (45.5 | )% | 26.4 | % | 20.1 | % |
RATIOS/SUPPLEMENTAL DATA: | | | | | | | | | | | |
Net assets, end of period (000’s omitted) | | $ | 1,104,866 | | $ | 968,776 | | $ | 634,542 | | $ | 894,802 | | $ | 305,843 | |
Ratio of gross expenses to average net assets | | 1.23 | % | 1.32 | % | 1.27 | % | 1.33 | % | 1.31 | % |
Ratio of expense reimbursements to average net assets | | 0.00 | % | 0.00 | % | 0.00 | % | (0.03 | )% | 0.00 | % |
Ratio of net expenses to average net assets | | 1.23 | % | 1.32 | % | 1.27 | % | 1.30 | % | 1.31 | % |
Ratio of net investment income (loss) to average net assets | | (0.94 | )% | (0.94 | )% | (0.97 | )% | (0.78 | )% | (0.74 | )% |
Portfolio turnover rate | | 61.40 | % | 90.49 | % | 62.68 | % | 67.53 | % | 88.67 | % |
See Notes to Financial Statements.
(i) Amount was computed based on average shares outstanding during the period.
48
THE ALGER INSTITUTIONAL FUNDS
Financial Highlights for a share outstanding throughout the period
Alger Small Cap Growth Institutional Fund
| | Class R | |
| | Year ended
10/31/2010 | | Year ended
10/31/2009 | | Year ended
10/31/2008 | | Year ended
10/31/2007 | | Year ended
10/31/2006 | |
Net asset value, beginning of period | | $ | 19.30 | | $ | 16.08 | | $ | 29.64 | | $ | 23.58 | | $ | 19.74 | |
INCOME FROM INVESTMENT OPERATIONS: | | | | | | | | | | | |
Net investment loss(i) | | (0.31 | ) | (0.22 | ) | (0.35 | ) | (0.35 | ) | (0.28 | ) |
Net realized and unrealized gain (loss) on investments | | 5.40 | | 3.44 | | (13.21 | ) | 6.41 | | 4.12 | |
Total from investment operations | | 5.09 | | 3.22 | | (13.56 | ) | 6.06 | | 3.84 | |
Net asset value, end of period | | $ | 24.39 | | $ | 19.30 | | $ | 16.08 | | $ | 29.64 | | $ | 23.58 | |
Total return | | 26.4 | % | 20.1 | % | (45.8 | )% | 25.7 | % | 19.5 | % |
RATIOS/SUPPLEMENTAL DATA: | | | | | | | | | | | |
Net assets, end of period (000’s omitted) | | $ | 68,071 | | $ | 51,707 | | $ | 39,033 | | $ | 47,042 | | $ | 8,018 | |
Ratio of gross expenses to average net assets | | 1.69 | % | 1.73 | % | 1.77 | % | 1.86 | % | 1.83 | % |
Ratio of expense reimbursements to average net assets | | 0.00 | % | 0.00 | % | 0.00 | % | (0.03 | )% | 0.00 | % |
Ratio of net expenses to average net assets | | 1.69 | % | 1.73 | % | 1.77 | % | 1.83 | % | 1.83 | % |
Ratio of net investment income (loss) to average net assets | | (1.40 | )% | (1.35 | )% | (1.47 | )% | (1.32 | )% | (1.26 | )% |
Portfolio turnover rate | | 61.40 | % | 90.49 | % | 62.68 | % | 67.53 | % | 88.67 | % |
See Notes to Financial Statements.
(i) Amount was computed based on average shares outstanding during the period.
49
THE ALGER INSTITUTIONAL FUNDS
NOTES TO FINANCIAL STATEMENTS
NOTE 1 — General:
The Alger Institutional Funds (the “Trust”), is a diversified, open-end registered investment company organized as a business trust under the laws of the Commonwealth of Massachusetts. The Trust operates as a series company and currently issues an unlimited number of shares of beneficial interest in four funds — Alger Capital Appreciation Institutional Fund, Alger Large Cap Growth Institutional Fund, Alger Mid Cap Growth Institutional Fund and Alger Small Cap Growth Institutional Fund (collectively, the “Funds” or individually, each a “Fund”). The Funds normally invest primarily in equity securities and each has an investment objective of long-term capital appreciation.
Each Fund offers Class I and Class R shares. Each class has identical rights to assets and earnings except that only Class R shares have a plan of distribution and bear the related expenses.
NOTE 2 — Significant Accounting Policies:
(a) Investment Valuation: The Funds value their financial instruments at fair value using independent dealers or pricing services under policies approved by the Board. Investments of the Funds are valued on each day the New York Stock Exchange (the “NYSE”) is open, as of the close of the NYSE (normally 4:00 p.m. Eastern time).
Equity securities and option contracts for which such information is readily available are valued at the last reported sales price or official closing price as reported by an independent pricing service on the primary market or exchange on which they are traded. In the absence of reported sales, securities are valued at a price within the bid and ask price or, in the absence of a recent bid or ask price, the equivalent as obtained from one or more of the major market makers for the securities to be valued.
Debt securities generally trade in the over-the-counter market. Securities with remaining maturities of more than sixty days at the time of acquisition are valued on the basis of last available bid prices or current market quotations provided by dealers or pricing services. In determining the value of a particular investment, pricing services may use certain information with respect to transactions in such investments, quotations from dealers, pricing matrixes, market transactions in comparable investments, various relationships observed in the market between investments and calculated yield measures based on valuation technology commonly employed in the market for such investments. Asset-backed and mortgage-backed securities are valued by independent pricing services using models that consider estimated cash flows of each tranche of the security, establish a benchmark yield and develop an estimated tranc he specific spread to the benchmark yield based on the unique attributes of the tranche.
Securities for which market quotations are not readily available are valued at fair value, as determined in good faith pursuant to procedures established by the Board of Trustees.
Securities in which the Funds invest may be traded in foreign markets that close before the close of the NYSE. Developments that occur between the close of the foreign
50
THE ALGER INSTITUTIONAL FUNDS
NOTES TO FINANCIAL STATEMENTS (Continued)
markets and the close of the NYSE may result in adjustments to the closing prices to reflect what the investment adviser, pursuant to policies established by the Board of Trustees, believes to be the fair value of these securities as of the close of the NYSE. The Funds may also fair value securities in other situations, for example, when a particular foreign market is closed but the Fund is open.
Financial Accounting Standards Board Accounting Standards Codification 820 — Fair Value Measurements and Disclosures (“ASC 820”) defines fair value as the price that the Funds would receive upon selling an investment in a timely transaction to an independent buyer in the principal or most advantageous market of the investment. ASC 820 established a three-tier hierarchy to maximize the use of observable market data and minimize the use of unobservable inputs and to establish classification of fair value measurements for disclosure purposes. Inputs refer broadly to the assumptions that market participants would use in pricing the asset or liability and may be observable or unobservable. Observable inputs are based on market data obtained from sources independent of the Funds. Unobservable inputs are inputs that reflect the Funds’ own assumptions based on the best information available in the c ircumstances. The three-tier hierarchy of inputs is summarized in the three broad Levels listed below.
· Level 1 — quoted prices in active markets for identical investments
· Level 2 — significant other observable inputs (including quoted prices for similar investments, interest rates, prepayment speeds, credit risk, etc.)
· Level 3 — significant unobservable inputs (including the Funds’ own assumptions in determining the fair value of investments)
The Funds’ valuation techniques are consistent with the market approach whereby prices and other relevant information generated by market transactions involving identical or comparable assets are used to measure fair value. Inputs for Level 1 include exchange listed prices and broker quotes in an active market. Inputs for Level 2 include the last trade price in the case of a halted security, a broker quote in an inactive market, an exchange listed price which has been adjusted for fair value factors, and prices of closely related securities. Additional Level 2 inputs include an evaluated price which is based upon a compilation of observable market information such as spreads for fixed income and preferred securities. Inputs for Level 3 include derived prices from unobservable market information which can include cash flows and other information obtained from a company’s financial sta tements, or from market indicators such as benchmarks and indices.
(b) Cash and Cash Equivalents: Cash and cash equivalents include U.S. denominated dollars and short-term securities maturing in sixty days or less. Such short-term securities are valued at amortized cost which approximates market value.
(c) Securities Transactions and Investment Income: Securities transactions are recorded on a trade date basis. Realized gains and losses from securities transactions are recorded on the identified cost basis. Dividend income is recognized on the ex-dividend date and interest income is recognized on the accrual basis.
51
THE ALGER INSTITUTIONAL FUNDS
NOTES TO FINANCIAL STATEMENTS (Continued)
(d) Foreign Currency Translations: The books and records of the Funds are maintained in U.S. dollars. Foreign currencies, investments and other assets and liabilities are translated into U.S. dollars at the prevailing rates of exchange on the valuation date. Purchases and sales of investment securities and income and expenses are translated into U.S. dollars at the prevailing exchange rates on the respective dates of such transactions.
Net realized gains and losses on foreign currency transactions represent net gains and losses from the disposition of foreign currencies, currency gains and losses realized between the trade dates and settlement dates of security transactions, and the difference between the amount of net investment income accrued and the U.S. dollar amount actually received. The effects of changes in foreign currency exchange rates on investments in securities are included in realized and unrealized gain or loss on investments in the Statement of Operations.
(e) Dividends to Shareholders: Dividends and distributions payable to shareholders are recorded by the Funds on the ex-dividend date. Dividends from net investment income and distributions from net realized gains are declared and paid annually after the end of the fiscal year in which earned.
The characterization of distributions to shareholders for financial reporting purposes is determined in accordance with federal income tax rules. Therefore, the source of the Fund’s distributions may be shown in the accompanying financial statements as either from, or in excess of net investment income, net realized gain on investment transactions or return of capital, depending on the type of book/tax differences that may exist. Capital accounts within the financial statements are adjusted for permanent book/tax differences. Reclassifications result primarily from the difference in tax treatment of net operating losses, passive foreign investment companies, and foreign currency transactions. The reclassifications are done annually at fiscal year end and have no impact on the net asset value of the Fund and are designed to present the Fund’s capital accounts on a tax basis.
(f) Federal Income Taxes: It is each Fund’s policy to comply with the requirements of the Internal Revenue Code Subchapter M applicable to regulated investment companies and to distribute all of its taxable income to its shareholders. Provided that the Funds maintain such compliance, no federal income tax provision is required. Each Fund is treated as a separate entity for the purpose of determining such compliance.
Financial Accounting Standards Board Accounting Standards Codification 740 — Income Taxes (“ASC 740”) requires the Funds to measure and recognize in their financial statements the benefit of a tax position taken (or expected to be taken) on an income tax return if such position will more likely than not be sustained upon examination based on the technical merits of the position. No tax years are currently under investigation. The Funds file income tax returns in the U.S. Federal jurisdiction, as well as the New York State and New York City jurisdictions. Based upon their review of tax positions for the Funds’ open tax years of 2007-2010 in these jurisdictions, the Funds have determined that ASC 740 did not have a material impact on the Funds’ financial statements for the year ended October 31, 2010.
52
THE ALGER INSTITUTIONAL FUNDS
NOTES TO FINANCIAL STATEMENTS (Continued)
(g) Allocation Methods: The Trust accounts separately for the assets, liabilities and operations of each Fund. Expenses directly attributable to each Fund are charged to that Fund’s operations; expenses which are applicable to all Funds are allocated among them based on net assets. Income, realized and unrealized gains and losses, and expenses of each Fund are allocated among the Fund’s classes based on relative net assets, with the exception of distribution fees and transfer agency fees.
(h) Estimates: These financial statements have been prepared in accordance with accounting principles generally accepted in the United States of America, which require using estimates and assumptions that affect the reported amounts therein. Actual results may differ from those estimates.
NOTE 3 — Investment Advisory Fees and Other Transactions with Affiliates:
(a) Investment Advisory and Administration Fees: Fees incurred by each Fund, pursuant to the provisions of its Investment Advisory Agreement and its Administration Agreement with Fred Alger Management, Inc. (Alger Management), are payable monthly and computed based on the value of the average daily net assets of each Fund, at the following rates:
| | Advisory
Fee | | Administration
Fee | |
Alger Capital Appreciation Institutional Fund | | .81 | % | .0275 | % |
Alger Large Cap Growth Institutional Fund | | .71 | | .0275 | |
Alger Mid Cap Growth Institutional Fund | | .76 | | .0275 | |
Alger Small Cap Growth Institutional Fund | | .81 | | .0275 | |
(b) Distribution Fees: Class R Shares: The Funds have adopted a Distribution Plan pursuant to which Class R shares of each Fund pay Fred Alger & Company, Incorporated, the Trust’s distributor (the “Distributor” or “Alger Inc.”) and an affiliate of Alger Management, a fee at the annual rate of 0.50% of the respective average daily net assets of the Class R shares of the designated Fund to compensate the Distributor for its activities and expenses incurred in distributing the Class R shares. The fees charged may be more or less than the expenses incurred by the Distributor.
(c) Brokerage Commissions: During the year ended October 31, 2010, the Alger Capital Appreciation Institutional Fund, Alger Large Cap Growth Institutional Fund, Alger Mid Cap Growth Institutional Fund and Alger Small Cap Growth Institutional Fund paid the Alger Inc. commissions of $1,915,280, $23,351, $2,032,198 and $815,753, respectively, in connection with securities transactions.
(d) Shareholder Administrative Fees: The Trust has entered into a shareholder administrative services agreement with Alger Management, to compensate Alger Management on a per account basis for its liaison and administrative oversight of Boston Financial Data Services, Inc. (“BFDS”) the transfer agent, and other related services. Effective June 1, 2010 the Fund compensates Alger Management at the annual rate of 0.01% of the average daily net assets for these services. From November 1, 2009 through October 31, 2010, the Alger Capital Appreciation Institutional Fund, Alger Large Cap Growth Institutional Fund, Alger Mid Cap Growth Institutional Fund and Alger Small Cap Growth
53
THE ALGER INSTITUTIONAL FUNDS
NOTES TO FINANCIAL STATEMENTS (Continued)
Institutional Fund incurred fees of $46,968, $1,481, $38,792 and $133,664, respectively, for these services provided by Alger Management, which are included in the transfer agent fees and expenses in the Statement of Operations.
(e) Shareholder Servicing Fees: The Trust has entered into a shareholder servicing agreement with Alger Inc. whereby Alger Inc. provides the Trust with ongoing servicing of shareholder accounts. As compensation for such services, each Fund pays Alger Inc. a monthly fee at an annual rate of 0.25% of the value of its average daily net assets. The fees charged may be more or less than the expenses incurred by the Distributor.
(f) Trustee Fees: From November 1, 2009 through February 8, 2010 the Fund paid each trustee who is not affiliated with Alger Management or its affiliates $500 for each meeting attended, to a maximum of $2,000 per annum, plus travel expenses incurred for attending the meeting. The chairman of the Board of Trustees received an additional annual fee of $10,000 paid, pro rata, by all funds managed by Alger Management. Additionally, each member of the audit committee received an additional $50 for each audit committee meeting attended, to a maximum of $200 per annum.
Effective February 9, 2010 the Fund pays each trustee who is not affiliated with Alger Management or its affiliates $750 for each meeting attended, to a maximum of $3,000 per annum. The Chairman of the Board of Trustees receives an additional annual fee of $15,000 which is paid, pro rata, by all funds managed by Alger Management. Additionally, each member of the audit committee receives an additional $75 from each Fund for each audit committee meeting attended, to a maximum of $300 per annum.
(g) Interfund Loans: The Funds, along with other funds advised by Alger Management, may borrow money from and lend money to each other for temporary or emergency purposes. To the extent permitted under its investment restrictions, each fund may lend uninvested cash in an amount up to 15% of its net assets to other funds, and each fund may borrow in an amount up to 10% of its net assets from other funds. If a fund has borrowed from other funds and has aggregate borrowings from all sources that exceed 10% of the fund’s total assets, such fund will secure all of its loans from other funds. The interest rate charged on interfund loans is equal to the average of the overnight time deposit rate and bank loan rate available to the funds.
During the year ended October 31, 2010, Alger Large Cap Growth Institutional Fund, Alger Mid Cap Growth Institutional Fund and Alger Small Cap Growth Institutional Fund incurred interest expense of $2,609, $5,309 and $1,068, respectively, in connection with interfund loans.
(h) Other Transactions With Affiliates: Certain officers of the Trust are directors and officers of Alger Management and the Distributor.
NOTE 4 — Securities Transactions:
The following summarizes the securities transactions by the Funds, other than short-term securities, for the year ended October 31, 2010:
54
THE ALGER INSTITUTIONAL FUNDS
NOTES TO FINANCIAL STATEMENTS (Continued)
| | PURCHASES | | SALES | |
Alger Capital Appreciation Institutional Fund | | $ | 1,883,119,628 | | $ | 1,758,757,468 | |
Alger Large Cap Growth Institutional Fund | | 22,948,822 | | 45,466,800 | |
Alger Mid Cap Growth Institutional Fund | | 1,662,858,274 | | 1,987,976,130 | |
Alger Small Cap Growth Institutional Fund | | 692,028,404 | | 795,942,312 | |
| | | | | | | |
NOTE 5 — Borrowings:
The Funds may borrow from their custodian on an uncommitted basis. Each Fund pays the custodian a market rate of interest, generally based upon the London Inter-Bank Offer Rate. The Funds may also borrow from other funds advised by Alger Management, as discussed in Note 3 (g). For the year ended October 31, 2010, the Funds had the following borrowings:
| | AVERAGE DAILY
BORROWING | | WEIGHTED AVERAGE
INTEREST RATE | |
Alger Large Cap Growth Institutional Fund | | $ | 233,203 | | 1.21 | % |
Alger Mid Cap Growth Institutional Fund | | 474,609 | | 1.27 | |
Alger Small Cap Growth Institutional Fund | | 89,824 | | 1.17 | |
| | | | | | |
The highest amount borrowed during the year ended October 31, 2010 for each Fund was as follows:
| | Highest Borrowing | |
Alger Large Cap Growth Institutional Fund | | $ | 13,900,000 | |
Alger Mid Cap Growth Institutional Fund | | 11,800,000 | |
Alger Small Cap Growth Institutional Fund | | 32,750,000 | |
| | | | |
NOTE 6 — Share Capital:
The Trust has an unlimited number of authorized shares of beneficial interest of $.001 par value which are presently divided into four series. Each series is divided into two separate classes. The transactions of shares of beneficial interest were as follows:
| | FOR THE YEAR ENDED
OCTOBER 31, 2010 | | FOR THE YEAR ENDED
OCTOBER 31, 2009 | |
| | SHARES | | AMOUNT | | SHARES | | AMOUNT | |
Alger Capital Appreciation Institutional Fund | | | | | | | | | |
Class I: | | | | | | | | | |
Shares sold | | 19,473,961 | | $ | 352,937,591 | | 16,446,402 | | $ | 232,156,222 | |
Dividends reinvested | | 66,060 | | 1,200,314 | | — | | — | |
Shares redeemed | | (16,081,225 | ) | (288,322,885 | ) | (8,984,090 | ) | (121,951,227 | ) |
Net increase | | 3,458,796 | | $ | 65,815,020 | | 7,462,312 | | $ | 110,204,995 | |
Class R: | | | | | | | | | |
Shares sold | | 5,268,214 | | $ | 91,995,788 | | 2,990,070 | | $ | 40,590,323 | |
Shares redeemed | | (1,696,170 | ) | (29,601,642 | ) | (1,501,721 | ) | (19,822,717 | ) |
Net increase | | 3,572,044 | | $ | 62,394,146 | | 1,488,349 | | $ | 20,767,606 | |
55
THE ALGER INSTITUTIONAL FUNDS
NOTES TO FINANCIAL STATEMENTS (Continued)
| | FOR THE YEAR ENDED
OCTOBER 31, 2010 | | FOR THE YEAR ENDED
OCTOBER 31, 2009 | |
| | SHARES | | AMOUNT | | SHARES | | AMOUNT | |
Alger Large Cap Growth Institutional Fund | | | | | | | | | |
Class I: | | | | | | | | | |
Shares sold | | 777,982 | | $ | 9,369,072 | | 2,958,754 | | $ | 25,717,486 | |
Dividends reinvested | | 9,295 | | 111,911 | | — | | — | |
Shares redeemed | | (2,552,508 | ) | (30,084,515 | ) | (1,584,526 | ) | (14,578,163 | ) |
Net increase (decrease) | | (1,765,231 | ) | $ | (20,603,532 | ) | 1,374,228 | | $ | 11,139,323 | |
Class R: | | | | | | | | | |
Shares sold | | 110,668 | | $ | 1,296,682 | | 239,711 | | $ | 2,125,392 | |
Shares redeemed | | (173,294 | ) | (2,014,350 | ) | (245,364 | ) | (2,209,954 | ) |
Net decrease | | (62,626 | ) | $ | (717,668 | ) | (5,653 | ) | $ | (84,562 | ) |
| | | | | | | | | |
Alger Mid Cap Growth Institutional Fund | | | | | | | | | |
Class I: | | | | | | | | | |
Shares sold | | 15,997,853 | | $ | 192,249,971 | | 35,609,288 | | $ | 308,744,989 | |
Shares redeemed | | (41,542,288 | ) | (495,420,451 | ) | (54,506,231 | ) | (469,420,756 | ) |
Net decrease | | (25,544,435 | ) | $ | (303,170,480 | ) | (18,896,943 | ) | $ | (160,675,767 | ) |
Class R: | | | | | | | | | |
Shares sold | | 1,296,391 | | $ | 14,963,925 | | 2,664,061 | | $ | 22,313,098 | |
Shares redeemed | | (2,270,655 | ) | (25,813,610 | ) | (2,471,521 | ) | (20,741,045 | ) |
Net increase (decrease) | | (974,264 | ) | $ | (10,849,685 | ) | 192,540 | | $ | 1,572,053 | |
| | | | | | | | | |
Alger Small Cap Growth Institutional Fund | | | | | | | | | |
Class I: | | | | | | | | | |
Shares sold | | 20,108,242 | | $ | 459,585,650 | | 26,159,300 | | $ | 455,501,592 | |
Shares redeemed | | (25,069,150 | ) | (573,429,492 | ) | (15,905,263 | ) | (272,309,356 | ) |
Net increase (decrease) | | (4,960,908 | ) | $ | (113,843,842 | ) | 10,254,037 | | $ | 183,192,236 | |
Class R: | | | | | | | | | |
Shares sold | | 930,438 | | $ | 20,803,418 | | 990,808 | | $ | 16,206,954 | |
Shares redeemed | | (819,511 | ) | (18,337,692 | ) | (738,750 | ) | (11,891,446 | ) |
Net increase | | 110,927 | | $ | 2,465,726 | | 252,058 | | $ | 4,315,508 | |
During the year ended October 31, 2010, shares redeemed for the Alger Small Cap Growth Institutional Fund included a redemption-in-kind of 1,732,850 Class I shares valued at $38,781,182.
During the year ended October 31, 2009, shares redeemed for the Alger Mid Cap Growth Institutional Fund included a redemption-in-kind of 1,609,811 Class I shares valued at $14,037,554 and 10,318 Class R shares valued at $86,468.
NOTE 7 — Income Tax Information:
The tax character of distributions paid, during the years ended October 31, 2010 and the year ended October 31, 2009 were as follows:
56
THE ALGER INSTITUTIONAL FUNDS
NOTES TO FINANCIAL STATEMENTS (Continued)
| | FOR THE YEAR ENDED
OCTOBER 31, 2010 | | FOR THE YEAR ENDED
OCTOBER 31, 2009 | |
Alger Capital Appreciation Institutional Fund | | | | | |
Distributions paid from: | | | | | |
Ordinary Income | | $ | 1,279,828 | | — | |
Long-term capital gain | | — | | — | |
Total distributions paid | | $ | 1,279,828 | | — | |
| | | | | |
Alger Large Cap Growth Institutional Fund | | | | | |
Distributions paid from: | | | | | |
Ordinary Income | | 150,594 | | — | |
Long-term capital gain | | — | | — | |
Total distributions paid | | $ | 150,594 | | — | |
| | | | | |
Alger Mid Cap Growth Institutional Fund | | | | | |
Distributions paid from: | | | | | |
Ordinary Income | | — | | — | |
Long-term capital gain | | — | | — | |
Total distributions paid | | — | | — | |
| | | | | |
Alger Small Cap Growth Institutional Fund | | | | | |
Distributions paid from: | | | | | |
Ordinary Income | | — | | — | |
Long-term capital gain | | — | | — | |
Total distributions paid | | — | | — | |
As of October 31, 2010, the components of accumulated gains and losses on a tax basis were as follows:
Capital Appreciation Fund | | | |
Undistributed ordinary income | | — | |
Undistributed long-term gains | | — | |
Net accumulated earnings | | — | |
Capital loss carryforwards | | $ | (38,846,382 | ) |
Net unrealized appreciation | | 41,045,900 | |
Total accumulated gains | | $ | 2,199,518 | |
| | | |
Large Cap Growth Fund | | | |
Undistributed ordinary income | | 179,383 | |
Undistributed long-term gains | | — | |
Net accumulated earnings | | 179,383 | |
Capital loss carryforwards | | (12,511,347 | ) |
Net unrealized appreciation | | 1,157,619 | |
Total accumulated losses | | $ | (11,174,345 | ) |
57
THE ALGER INSTITUTIONAL FUNDS
NOTES TO FINANCIAL STATEMENTS (Continued)
Mid Cap Growth Fund | | | |
Undistributed ordinary income | | 1,898,328 | |
Undistributed long-term gains | | — | |
Net accumulated earnings | | 1,898,328 | |
Capital loss carryforwards | | (476,380,107 | ) |
Net unrealized appreciation | | 26,213,995 | |
Total accumulated losses | | $ | (448,267,784 | ) |
| | | |
Small Cap Growth Fund | | | |
Undistributed ordinary income | | — | |
Undistributed long-term gains | | — | |
Net accumulated earnings | | — | |
Capital loss carryforwards | | (79,007,358 | ) |
Net unrealized appreciation | | 143,314,633 | |
Total accumulated gains | | $ | 64,307,275 | |
At October 31, 2010, the Funds, for federal income tax purposes, had capital loss carryforwards which expire as set forth in the table below. These amounts may be applied against future net realized gains until the earlier of their utilization or expiration.
Expiration Dates | | Alger Capital
Appreciation
Institutional Fund | | Alger Large Cap
Growth
Institutional Fund | | Alger Mid Cap
Growth
Institutional Fund | | Alger Small Cap
Growth
Institutional Fund | |
2011 | | — | | $ | 2,775,036 | | — | | — | |
2016 | | — | | 5,521,428 | | $ | 154,341,477 | | — | |
2017 | | $ | 38,846,382 | | 4,214,883 | | 322,038,630 | | $ | 79,007,358 | |
Total | | 38,846,382 | | 12,511,347 | | 476,380,107 | | 79,007,358 | |
| | | | | | | | | | | | | |
The difference between book-basis and tax-basis unrealized appreciation (depreciation) is determined annually and is attributable primarily to the tax deferral of losses on wash sales, the tax treatment of premium/discount on debt securities, the tax treatment of partnerships investments, the realization of unrealized appreciation of Passive Foreign Investment Companies, and return of capital from Real Estate Investment Trust investments.
Permanent differences, primarily from net operating losses and real estate investment trusts and partnership investments sold by the Portfolios, resulted in the following reclassifications among the Portfolio’s components of net assets at October 31, 2010:
Capital Appreciation Fund | | | |
Accumulated Undistributed Net Investment Income | | $ | 886,484 | |
Accumulated Net Realized Gain | | $ | 974,613 | |
Paid-in Capital | | $ | (1,861,097 | ) |
58
THE ALGER INSTITUTIONAL FUNDS
NOTES TO FINANCIAL STATEMENTS (Continued)
Large Cap Growth Fund | | | |
Accumulated Undistributed Net Investment Income | | $ | (2,191 | ) |
Accumulated Net Realized Gain | | $ | 29,551 | |
Paid-in Capital | | $ | (27,360 | ) |
| | | |
Mid Cap Growth Fund | | | |
Accumulated Undistributed Net Investment Income | | $ | (123,571 | ) |
Accumulated Net Realized Gain | | $ | 1,594,408 | |
Paid-in Capital | | $ | (1,470,837 | ) |
| | | |
Small Cap Growth Fund | | | |
Accumulated Undistributed Net Investment Income | | $ | 11,433,012 | |
Accumulated Net Realized Loss | | $ | (9,478,428 | ) |
Paid-in Capital | | $ | (1,954,584 | ) |
NOTE 8 — Fair Value Measurements:
The major categories of securities and their respective fair value inputs are detailed in each Fund’s Schedule of Investments. The following is a summary of the inputs used as of October 31, 2010 in valuing the Funds’ investments carried at fair value:
Alger Capital Appreciation Institutional
Fund | | TOTAL FUND | | LEVEL 1 | | LEVEL 2 | | LEVEL 3 | |
COMMON STOCKS | | | | | | | | | |
Consumer Discretionary | | $ | 123,618,125 | | $ | 123,618,125 | | — | | — | |
Consumer Staples | | 47,470,111 | | 47,470,111 | | — | | — | |
Energy | | 100,770,788 | | 90,325,812 | | 10,444,976 | | — | |
Financials | | 51,554,309 | | 51,554,309 | | — | | — | |
Health Care | | 93,899,194 | | 93,899,194 | | — | | — | |
Industrials | | 150,111,782 | | 150,111,782 | | — | | — | |
Information Technology | | 334,212,414 | | 334,212,414 | | — | | — | |
Materials | | 54,197,361 | | 54,197,361 | | — | | — | |
TOTAL COMMON STOCKS | | $ | 955,834,084 | | $ | 945,389,108 | | $ | 10,444,976 | | — | |
TOTAL INVESTMENTS IN SECURITIES | | $ | 955,834,084 | | $ | 945,389,108 | | $ | 10,444,976 | | — | |
59
THE ALGER INSTITUTIONAL FUNDS
NOTES TO FINANCIAL STATEMENTS (Continued)
Alger Large Cap Growth Institutional
Fund | | TOTAL FUND | | LEVEL 1 | | LEVEL 2 | | LEVEL 3 | |
COMMON STOCKS | | | | | | | | | |
Consumer Discretionary | | $ | 3,030,779 | | $ | 3,030,779 | | — | | — | |
Consumer Staples | | 2,768,423 | | 2,768,423 | | — | | — | |
Energy | | 2,460,394 | | 2,460,394 | | — | | — | |
Financials | | 1,921,664 | | 1,921,664 | | — | | — | |
Health Care | | 3,207,696 | | 3,207,696 | | — | | — | |
Industrials | | 3,465,242 | | 3,465,242 | | — | | — | |
Information Technology | | 9,179,270 | | 9,179,270 | | — | | — | |
Materials | | 1,314,896 | | 1,314,896 | | — | | — | |
Telecommunication Services | | 159,103 | | 159,103 | | — | | — | |
Utilities | | 251,836 | | 251,836 | | — | | — | |
TOTAL COMMON STOCKS | | $ | 27,759,303 | | $ | 27,759,303 | | — | | — | |
TOTAL INVESTMENTS IN SECURITIES | | $ | 27,759,303 | | $ | 27,759,303 | | — | | — | |
Alger Mid Cap Growth Institutional
Fund | | TOTAL FUND | | LEVEL 1 | | LEVEL 2 | | LEVEL 3 | |
COMMON STOCKS | | | | | | | | | |
Consumer Discretionary | | $ | 150,135,286 | | $ | 150,135,286 | | — | | — | |
Consumer Staples | | 11,218,303 | | 11,218,303 | | — | | — | |
Energy | | 62,637,063 | | 49,837,559 | | 12,799,504 | | — | |
Financials | | 66,922,633 | | 66,922,633 | | — | | — | |
Health Care | | 114,879,017 | | 114,879,017 | | — | | — | |
Industrials | | 124,111,600 | | 124,111,600 | | — | | — | |
Information Technology | | 195,890,595 | | 195,890,595 | | — | | — | |
Materials | | 36,453,537 | | 36,453,537 | | — | | — | |
TOTAL COMMON STOCKS | | $ | 762,248,034 | | $ | 749,448,530 | | $ | 12,799,504 | | — | |
CONVERTIBLE CORPORATE BONDS | | | | | | | | | |
Telecommunication Services | | $ | 10,590,195 | | — | | $ | 10,590,195 | | — | |
CONVERTIBLE PREFERRED STOCK | | | | | | | | | |
Health Care | | $ | 5,689,997 | | — | | — | | $ | 5,689,997 | |
TOTAL INVESTMENTS IN SECURITIES | | $ | 778,528,226 | | $ | 749,448,530 | | $ | 23,389,699 | | $ | 5,689,997 | |
60
THE ALGER INSTITUTIONAL FUNDS
NOTES TO FINANCIAL STATEMENTS (Continued)
Alger Small Cap Growth Institutional
Fund | | TOTAL FUND | | LEVEL 1 | | LEVEL 2 | | LEVEL 3 | |
COMMON STOCKS | | | | | | | | | |
Consumer Discretionary | | $ | 222,397,522 | | $ | 222,397,522 | | — | | — | |
Consumer Staples | | 31,379,037 | | 31,379,037 | | — | | — | |
Energy | | 47,532,972 | | 47,532,972 | | — | | — | |
Financials | | 40,558,292 | | 40,558,292 | | — | | — | |
Health Care | | 203,947,216 | | 203,947,216 | | — | | — | |
Industrials | | 222,407,366 | | 222,407,366 | | — | | — | |
Information Technology | | 288,593,536 | | 288,593,536 | | — | | — | |
Materials | | 52,681,505 | | 52,681,505 | | — | | — | |
Telecommunication Services | | 16,758,829 | | 16,758,829 | | — | | — | |
Utilities | | 13,485,255 | | 13,485,255 | | — | | — | |
TOTAL COMMON STOCKS | | $ | 1,139,741,530 | | $ | 1,139,741,530 | | — | | — | |
TOTAL INVESTMENTS IN SECURITIES | | $ | 1,139,741,530 | | $ | 1,139,741,530 | | — | | — | |
| | FAIR VALUE
MEASUREMENTS
USING SIGNIFICANT
UNOBSERVABLE
INPUTS (LEVEL3) | |
Alger Mid Cap Growth Institutional Fund | | Trading Securities | |
Opening balance at November 1, 2009 | | $ | — | |
Net realized and unrealized gain (loss) on investments, foreign currency and options | | | |
Purchases, issuances, and settlements | | 5,689,997 | |
Transfers in and/ or out of level 3 | | | |
Closing balance at October 31, 2010 | | 5,689,997 | |
The amount of net realized and unrealized gain (loss) on investments, foreign currency and options for the period attributable to change in unrealized appreciation (depreciation) relating to investments still held at October 31, 2010 | | $ | — | |
NOTE 9 — Derivatives:
Financial Accounting Standards Board Accounting Standards Codification 815 — Derivatives and Hedging (“ASC 815”) requires qualitative disclosures about objectives and strategies for using derivatives, quantitative disclosures about fair value amounts of and gains and losses on derivative instruments, and disclosures about credit-risk-related contingent features in derivative agreements.
Forward currency contracts—In connection with portfolio purchases and sales of securities denominated in foreign currencies, the Funds may enter into forward currency contracts. Additionally, each Fund may enter into such contracts to economically hedge certain other foreign currency denominated investments. These contracts are valued at the current cost of covering or offsetting such contracts, and the related realized and unrealized foreign exchange gains and losses are included in the statement of operations. In the event that counterparties fail to settle these currency contracts or the related foreign security trades, a Fund could be exposed to foreign currency fluctuations.
61
THE ALGER INSTITUTIONAL FUNDS
NOTES TO FINANCIAL STATEMENTS (Continued)
Options—The Funds seek to capture the majority of the returns associated with equity market investments. To meet this investment goal, the Funds invest in a broadly diversified portfolio of common stocks, while also buying and selling call and put options on equities and equity indices. The Funds purchase call options to increase their exposure to stock market risk and also provide diversification of risk. The Funds purchase put options in order to protect from significant market declines that may occur over a short period of time. The Funds will write covered call and cash secured put options to generate cash flows while reducing the volatility of the Funds’ portfolio. The cash flows may be an important source of the Funds’ return, although written call options may reduce the Funds’ ability to profit from increases in the value of the underlying security or equity portfoli o. The value of a call option generally increases as the price of the underlying stock increases and decreases as the stock decreases in price. Conversely, the value of a put option generally increases as the price of the underlying stock decreases and decreases as the stock increases in price. The combination of the diversified stock portfolio and the purchase and sale of options is intended to provide the Funds with the majority of the returns associated with equity market investments but with reduced volatility and returns that are augmented with the cash flows from the sale of options.
There were no derivative transactions for the year ended October 31, 2010.
NOTE 10 — Litigation:
In October 2006, Alger Management, the Distributor and Alger Shareholder Services, Inc. entered into a settlement with the office of the New York State Attorney General, and in January 2007, the Manager and Distributor entered into a settlement with the Securities and Exchange Commission (the “SEC”) in connection with practices in the mutual fund industry identified as “market timing” and “late trading.” As part of these settlements, without admitting or denying liability, the firms consented to the payment of $30 million to reimburse fund shareholders; a fine of $10 million; and certain other remedial measures including a reduction in management fees of $1 million per year for five years. The $40 million was paid into an SEC Fair Fund for distribution to investors.
On August 31, 2005, the West Virginia Securities Commissioner (the “WVSC”), in an ex parte Summary Order to Cease and Desist and Notice of Right to Hearing, concluded that the Manager and the Distributor had violated the West Virginia Uniform Securities Act (the “WVUSA”), and ordered the Manager and the Distributor to cease and desist from further violations of the WVUSA by engaging in the market-timing-related conduct described in the order. The ex parte order provided notice of their right to a hearing with respect to the violations of law asserted by the WVSC. Other firms unaffiliated with the Manager were served with similar orders. The Manager and the Distributor intend to request a hearing for the purpose of seeking to vacate or modify the order.
In addition, in 2003 and 2004 several purported class actions and shareholder derivative suits were filed against various parties in the mutual fund industry, including the Manager, certain mutual funds managed by the Manager (the “Alger Mutual Funds”), and certain current and former Alger Mutual Fund trustees and officers, alleging wrongful conduct related to market-timing and late-trading by mutual fund shareholders. These cases were transferred to the U.S. District Court of Maryland by the Judicial Panel on Multidistrict
62
THE ALGER INSTITUTIONAL FUNDS
NOTES TO FINANCIAL STATEMENTS (Continued)
Litigation for consolidated pre-trial proceedings under the caption number 1:04-MD-15863 (JFM). After a number of the claims in the Alger lawsuits, including all claims against Alger Mutual Funds and their independent trustees, were dismissed by the court, the Alger-related class and derivative suits were settled. A Final Judgment and Order approving the settlement was entered on October 25, 2010. No appeals from the Final Judgment and Order were filed within the allotted time limit. The settlement was paid by insurance, and had no financial impact on the Alger Mutual Funds.
NOTE 11 — Recent Accounting Pronouncements:
On January 21, 2010, the FASB issued Accounting Standards Update (ASU) 2010-06. The ASU amends ASC 820 to add new requirements for disclosures about transfers into and out of Levels 1 and 2 and separate disclosures about purchases, sales, issuances, and settlements relating to Level 3 measurements. It also clarifies existing fair value disclosures about the level of disaggregation and about inputs and valuation techniques used to measure fair value. The application of ASU 2010-06 is required for fiscal years and interim periods beginning after December 15, 2009. The implications of ASU 2010-06 is not expected to have a material impact on the financial statements of the Funds.
NOTE 12 — Subsequent Events:
Management of the Fund has evaluated events that have occurred subsequent to October 31, 2010. No such events have been identified which require recognition and disclosure.
63
REPORT OF INDEPENDENT REGISTERED PUBLIC ACCOUNTING FIRM
To the Shareholders and Board of Trustees of
The Alger Institutional Funds:
We have audited the accompanying statements of assets and liabilities, including the schedules of investments, of The Alger Institutional Funds (the “Funds”) comprising the Alger Capital Appreciation Institutional Fund, Alger Large Cap Growth Institutional Fund, Alger Mid Cap Growth Institutional Fund, and Alger Small Cap Growth Institutional Fund as of October 31, 2010, and the related statements of operations for the year then ended, the statements of changes in net assets for each of the two years in the period then ended, and the financial highlights for each of the two years in the period then ended. These financial statements and financial highlights are the responsibility of the Funds’ management. Our responsibility is to express an opinion on these financial statements and financial highlights based on our audits. The Funds’ financial highlights for the respective periods ended October 31, 2008 were audited by other auditors, whose reports dated December 16, 2008, expressed unqualified opinions on such financial highlights.
We conducted our audits in accordance with the standards of the Public Company Accounting Oversight Board (United States). Those standards require that we plan and perform the audit to obtain reasonable assurance about whether the financial statements and financial highlights are free of material misstatement. The Funds are not required to have, nor were we engaged to perform, an audit of their internal control over financial reporting. Our audits included consideration of internal control over financial reporting as a basis for designing audit procedures that are appropriate in the circumstances, but not for the purpose of expressing an opinion on the effectiveness of the Funds’ internal control over financial reporting. Accordingly, we express no such opinion. An audit also includes examining, on a test basis, evidence supporting the amounts and disclosures in the financial statements, assessing the acco unting principles used and significant estimates made by management, as well as evaluating the overall financial statement presentation. Our procedures included confirmation of securities owned as of October 31, 2010, by correspondence with the custodian and brokers; where replies were not received from brokers, we performed other auditing procedures. We believe that our audits provide a reasonable basis for our opinion.
In our opinion, the financial statements and financial highlights referred to above, present fairly, in all material respects, the financial position of each of the portfolios constituting The Alger Institutional Funds as of October 31, 2010, the results of their operations, and the changes in their net assets and the financial highlights for each of the two years in the period then ended, in conformity with accounting principles generally accepted in the United States of America.
Deloitte & Touche LLP
New York, New York
December 27, 2010
64
THE ALGER INSTITUTIONAL FUNDS
ADDITIONAL INFORMATION (Unaudited)
Shareholder Expense Example
As a shareholder of the Fund, you incur two types of costs: transaction costs, if applicable, including sales charges (loads) and redemption fees; and ongoing costs, including management fees, distribution (12b-1) fees, if applicable, and other fund expenses. This example is intended to help you understand your ongoing costs (in dollars) of investing in the Fund and to compare these costs with the ongoing costs of investing in other mutual funds.
The example below is based on an investment of $1,000 invested at the beginning of the six-month period starting May 1, 2010 and ending October 31, 2010.
Actual Expenses
The first line for each class of shares in the table below provides information about actual account values and actual expenses. You may use the information in this line, together with the amount you invested, to estimate the expenses that you would have paid over the period. Simply divide your account value by $1,000 (for example, an $8,600 account value divided by $1,000 = 8.6), then multiply the result by the number in the first line under the heading entitled “Expenses Paid During the Period” to estimate the expenses you paid on your account during this period.
Hypothetical Example for Comparison Purposes
The second line for each class of shares in the table below provides information about hypothetical account values and hypothetical expenses based on the Fund’s actual expense ratios for each class of shares and an assumed rate of return of 5% per year before expenses, which is not the Fund’s actual return. The hypothetical account values and expenses may not be used to estimate the actual ending account balance or expenses you paid for the period. You may use this information to compare the ongoing costs of investing in the Fund and other funds. To do so, compare this 5% hypothetical example with the 5% hypothetical examples that appear in the shareholder reports of other funds.
Please note that the expenses shown in the table are meant to highlight your ongoing costs only and do not reflect any transaction costs, such as sales charges (loads) and redemption fees. Therefore, the second line under each class of shares in the table is useful in comparing ongoing costs only, and will not help you determine the relative total costs of owning different funds. In addition, if these transactional costs were included, your costs would have been higher.
65
| | Beginning
Account
Value
May 1, 2010 | | Ending
Account
Value
October 31, 2010 | | Expenses
Paid During
the Six Months
Ended
October 31,
2010(a) | | Ratio of
Expenses to
Average
Net Assets
For the
Six Months
Ended
October 31,
2010(b) | |
Alger Capital Appreciation Institutional Fund | | | | | | | | | |
Class I | | Actual | | $ | 1,000.00 | | $ | 1,011.01 | | $ | (5.91 | ) | 1.17 | % |
| | Hypothetical(c) | | 1,000.00 | | 980.67 | | (5.82 | ) | 1.17 | |
Class R | | Actual | | 1,000.00 | | 1,008.14 | | (8.47 | ) | 1.67 | |
| | Hypothetical(c) | | 1,000.00 | | 983.23 | | (8.36 | ) | 1.67 | |
| | | | | | | | | | | |
Alger Large Cap Growth Institutional Fund | | | | | | | | | |
Class I | | Actual | | $ | 1,000.00 | | $ | 1,027.60 | | $ | (6.95 | ) | 1.36 | % |
| | Hypothetical(c) | | 1,000.00 | | 981.65 | | (6.79 | ) | 1.36 | |
Class R | | Actual | | 1,000.00 | | 1,023.58 | | (10.45 | ) | 2.05 | |
| | Hypothetical(c) | | 1,000.00 | | 985.13 | | (10.25 | ) | 2.05 | |
| | | | | | | | | | | |
Alger Mid Cap Growth Institutional Fund | | | | | | | | | |
Class I | | Actual | | $ | 1,000.00 | | $ | 1,014.71 | | $ | (5.69 | ) | 1.12 | % |
| | Hypothetical(c) | | 1,000.00 | | 980.45 | | (5.60 | ) | 1.12 | |
Class R | | Actual | | 1,000.00 | | 1,012.14 | | (8.37 | ) | 1.65 | |
| | Hypothetical(c) | | 1,000.00 | | 983.11 | | (8.25 | ) | 1.65 | |
| | | | | | | | | | | |
Alger Small Cap Growth Institutional Fund | | | | | | | | | |
Class I | | Actual | | $ | 1,000.00 | | $ | 1,005.97 | | $ | (6.23 | ) | 1.23 | % |
| | Hypothetical(c) | | 1,000.00 | | 981.01 | | (6.15 | ) | 1.23 | |
Class R | | Actual | | 1,000.00 | | 1,003.29 | | (8.53 | ) | 1.69 | |
| | Hypothetical(c) | | 1,000.00 | | 983.31 | | (8.45 | ) | 1.69 | |
(a) | | Expenses are equal to the annualized expense ratio of the respective share class, multiplied by the average account value over the period, multiplied by 184/365 (to reflect the one-half year period). |
(b) | | Annualized. |
(c) | | 5% annual return before expenses. |
Tax Information
In accordance with subchapter M of the Internal Revenue Code of 1986, as amended, for the year ended October 31, 2010, 100.00%, and 100.00% of the Alger Large Cap Institutional Growth Fund, and Alger Mid Cap Growth Institutional Fund’s ordinary dividend qualified for the dividends received deduction for corporations. For the year ended October 31, 2010, certain dividends paid by the Funds may be subject to a maximum rate of 15%, as provided by the Jobs and Growth Tax Relief Reconciliation Act of 2003. Of the distributions paid during the fiscal year, the following represents the maximum amount that may be considered qualified dividend income:
Alger Large Cap Growth Institutional Fund | | $ | 646,061 | |
Alger Capital Appreciation Institutional Fund | | $ | 3,324,751 | |
66
Shareholders should not use the above information to prepare their tax returns. Since the Fund’s fiscal year is not the calendar year, another notification will be sent with respect to calendar year 2010. Such notification, which will reflect the amount to be used by tax payers on their federal income tax returns, will be made in conjunction with Form 1099 DIV and will be mailed in January 2011. Shareholders are advised to consult their own tax advisers with respect to the tax consequences of their investment in the Fund.
Trustees and Officers of the Fund
Information about the trustees and officers of the Fund is set forth below. In the table the term “Alger Fund Complex” refers to the Fund, The Alger Funds, The Alger Portfolios, Alger China-U.S. Growth Fund and The Alger Funds II, each of which is a registered investment company managed by Fred Alger Management, Inc. (“Alger Management”). Each Trustee serves until an event of termination, such as death or resignation, or until his successor is duly elected; each officer’s term of office is one year. Unless otherwise noted, the address of each person named below is 111 Fifth Avenue, New York, NY 10003.
Name, Age, Position with the
Fund | | Principal Occupations | | Trustee
and/or
Officer
Since | | Number of
Funds in
the Alger
Fund
Complex
which are
Overseen
by Trustee |
INTERESTED TRUSTEE | | | | | | |
| | | | | | |
Hilary M. Alger (49) | | Director of Development, Pennsylvania Ballet since 2004; Associate Director of Development, College of Arts and Sciences and Graduate School, University of Virginia 1999-2003. | | 2003 | | 27 |
| | | | | | |
NON-INTERESTED TRUSTEE | | | | | | |
| | | | | | |
Charles F. Baird, Jr. (57) | | Managing Partner of North Castle Partners, a private equity securities group; Chairman of Leiner Health Products, Enzymatic Therapy and Caleel & Hayden (skincare business); former Chairman of Elizabeth Arden Day Spas, Naked Juice, Equinox (fitness company) and EAS (manufacturer of nutritional products). Formerly Managing Director of AEA Investors, Inc. | | 2000 | | 27 |
| | | | | | |
Roger P. Cheever (65) | | Associate Vice President for Principal Gifts, and Senior Associate Dean for Development in the Faculty of Arts and Sciences at Harvard University; Formerly Deputy Director of the Harvard College Fund. | | 2000 | | 27 |
| | | | | | |
Lester L. Colbert Jr. (76) | | Private investor since 1988; Formerly Chairman of the Board, President and Chief Executive Officer of Xidex Corporation (manufacturer of computer information | | 2000 | | 27 |
67
| | media). | | | | |
| | | | | | |
Stephen E. O’Neil (78) | | Attorney. Private Investor since 1981. Formerly of Counsel to the law firm of Kohler & Barnes. | | 1986 | | 27 |
| | | | | | |
David Rosenberg (48) | | Associate Professor of Law since January 2006 (Assistant Professor 2000-2005), Zicklin School of Business, Baruch College, City University of New York. | | 2007 | | 27 |
| | | | | | |
Nathan E. Saint-Amand M.D. (73) | | Medical doctor in private practice; Member of the Board of the Manhattan Institute (non-profit policy research) since 1988; Formerly Co-Chairman, Special Projects Committee, Memorial Sloan Kettering. | | 1986 | | 27 |
Name, Age, Position with the
Fund | | Principal Occupations | | Trustee
and/or
Officer
Since | | Number of
Funds in
the Alger
Fund
Complex
which are
Overseen
by Trustee |
OFFICERS | | | | | | |
| | | | | | |
Dan C. Chung (48)
President | | Chief Investment Officer and Director since 2001, and Chief Executive Officer since 2006, of Alger Management; President since 2003 of Alger Associates, Inc. (“Associates”); President and Director since 2003 of Fred Alger International Advisory S.A. (“International”); President since 2003 and Director since 2003 of Analysts Resources, Inc. (“Resources”); Formerly Trustee of the Trust from 2001 to 2007. | | 2001 | | N/A |
| | | | | | |
Michael D. Martins (45)
Treasurer | | Senior Vice President of Alger Management; Assistant Treasurer since 2004. | | 2005 | | N/A |
| | | | | | |
Hal Liebes (46)
Secretary | | Executive Vice President, Chief Legal Officer, Chief Operating Officer and Secretary of Alger Management; Director since 2006 of International and Resources. | | 2005 | | N/A |
| | | | | | |
Lisa A. Moss (45)
Assistant Secretary | | Senior Vice President since 2009, and Vice President and Assistant General Counsel of Alger Management since June 2006. Formerly Director of Merrill Lynch Investment Managers, L.P. from 2005-2006. | | 2006 | | N/A |
| | | | | | |
Anthony S. Caputo (55)
Assistant Treasurer | | Employed by Alger Management since 1986, currently serving as Vice President. | | 2007 | | N/A |
68
Sergio M. Pavone (49)
Assistant Treasurer | | Employed by Alger Management since 2002, currently serving as Vice President. | | 2007 | | N/A |
| | | | | | |
Barry J. Mullen (57)
Chief Compliance Officer | | Senior Vice President and Director of Compliance of Alger Management since May 2006. Formerly Director of BlackRock, Inc. from 2004-2006. | | 2006 | | N/A |
Ms. Alger is an “interested person” (as defined in the Investment Company Act) of the Fund because of her affiliations with Alger Management. No Trustee is a director of any public company except as indicated under “Principal Occupations”.
The Statement of Additional Information contains additional information about the Fund’s Trustees and is available without charge upon request by calling (800) 992-3863.
Investment Management Agreement Renewal
At an in-person meeting held on September 14, 2010, the Trustees, including the Independent Trustees, unanimously approved renewal of the Investment Advisory Agreement (the “Agreement”) between the Trust and Alger Management. The Independent Trustees were assisted in their review by independent legal counsel and met with such counsel in executive session separate from representatives of Alger Management.
In evaluating the Agreement, the Trustees drew on materials that they had requested and which were provided to them in advance of the meeting by Alger Management and by counsel. The materials covered, among other matters, (i) the nature, extent and quality of the services provided by Alger Management under the Agreement, (ii) the investment performance of each of the Trust’s portfolios (each a “Fund”), (iii) the costs to Alger Management of its services and the profits realized by Alger Management and Alger Inc. from their relationship with the Trust, and (iv) the extent to which economies of scale would be realized if and as the Funds grow and whether the fee levels in the Agreement reflect these economies of scale. These materials included an analysis of the Funds and Alger Management’s services by FUSE Research Network LLC (“FUSE”), an independent consulting firm having no other relationship with Alger Management, whose specialties include assistance to fund trustees and directors in their review of advisory contracts pursuant to section 15(c) of the 1940 Act. At the meeting, senior FUSE personnel provided a presentation to the Trustees based on the FUSE materials.
In deciding whether to approve renewal of the Agreement, the Trustees considered various factors, including those enumerated above. They also considered other direct and indirect benefits to Alger Management and its affiliates from their relationship with the Trust.
Nature, Extent and Quality of Services. In considering the nature, extent and quality of the services provided by Alger Management pursuant to the Agreement, the Trustees relied on their prior experience as Trustees of the Trust, their familiarity with the personnel and resources of Alger Management and its affiliates, and the materials provided at the meeting. They noted that under the Agreement Alger Management is responsible for managing the investment operations of the Funds. They also noted that
69
administrative, compliance, reporting and accounting services necessary for the conduct of the Trust’s affairs are provided under the separate Administration Agreement with Alger Management. The Trustees reviewed the background and experience of Alger Management’s senior investment management personnel, including the individuals currently responsible for the investment operations of the Funds. They also considered the resources, operational structures and practices of Alger Management in managing each Fund’s portfolio, as well as Alger Management’s overall investment management business. They noted especially Alger Management’s history of expertise in managing portfolios of “growth” stocks and that, according to an analysis provided by FUSE, the characteristics of each Fund had been consistent with those of a fund that holds itself out to investors as growth-oriented. Th e Trustees concluded that Alger Management’s experience, resources and strength in the areas of importance to the Funds are considerable. The Trustees considered the level and depth of Alger Management’s ability to execute portfolio transactions to effect investment decisions, including those through Alger Inc. The Trustees also considered the enhanced control and compliance environment at Alger Management and within the Trust.
Investment Performance of the Funds. Drawing upon information provided at the meeting by Alger Management as well as FUSE and upon reports provided to the Trustees by Alger Management throughout the preceding year, the Trustees reviewed each Fund’s returns for the year-to-date (at 6/30/10), second-quarter, and 1-, 3-, 5-, and 10-year periods to the extent available (and its year-by-year returns), together with supplemental data through 8/31/10, and compared them with benchmark and peer-group data for the same periods. They noted that the performance of the Funds varied. The Small Cap Fund had generally surpassed its benchmark and the median for its FUSE peer group through 6/30/10 for the year-to-date, 1-, 3, and 5-year periods, while the SMid Cap (year-to-date, 1- and 3-year periods only) and Mid Cap Funds had failed to do so for any of those periods. The Large Cap Fund had not outperformed its benchmark for any of those periods but had periodically equaled or surpassed the median for its peers. While the Capital Appreciation Fund had underperformed its benchmark and peer median for the first half of 2010, it had matched the median for its peer group for the 1-year period through 6/30/10 and outperformed both peer median and benchmark for the 3- and 5-year periods. Representatives of Alger Management discussed with the Trustees measures that the firm was in the process of instituting to improve the performance of the Funds that had consistently fallen short of their peers and benchmarks.
Fund Fees and Expense Ratios; Profitability to Alger Management and its Affiliates. The Trustees considered the profitability of the Investment Advisory Agreement to Alger Management and its affiliates, and the methodology used by Alger Management in determining such profitability. The Trustees reviewed previously-provided data on each Fund’s profitability to Alger Management and its affiliates for the year ended June 30, 2010. In addition, the Trustees reviewed each Fund’s management fee and expense ratio and compared them with a group of comparable funds. In order to assist the Trustees in this comparison, FUSE had provided the Trustees with comparative information with respect to fees paid, and expense ratios incurred, by similar funds. That information indicated that while the fees of three of the Funds were below or virtually at the median, the fees of the Capital Appreciation and Mid Cap Funds were above the
70
median and the expense ratios of all of the Funds were above the median. In the latter cases, the Trustees determined that such information should be taken into account in weighing the size of the fee against the nature, extent and quality of the services provided. The Trustees also considered fees paid to Alger Management by other types of clients, specifically mutual funds for which Alger Management was sub-adviser and Alger Management’s institutional clients. The Trustees determined that in both cases the fees were of doubtful relevance for purposes of comparison with those of the Funds because of the significant differences in services provided by Alger Management to those types of clients as opposed to the Funds, but that to the extent that meaningful comparison was practicable, the differences in services adequately explained the differences in the fees. After discussing with representatives of the A dviser and FUSE the methodologies used in computing the costs that formed the bases of the profitability calculations, the Trustees turned to the profitability data provided. After analysis and discussion, they concluded that, to the extent that Alger Management’s and its affiliates’ relationships with the Funds had been profitable to either or both of those entities, the profit margin in each case was not unacceptable.
Economies of Scale. On the basis of their discussions with management and their analysis of information provided at the meeting, the Trustees determined that the nature of the Funds and their operations is such that Alger Management is likely to realize economies of scale in the management of the Funds at some point as each grows in size, but that adoption of breakpoints in one or more advisory fees, while possibly appropriate at a later date, could await further analysis of the sources and potential scale of the economies and the fee structure that would best reflect them. Accordingly, the Trustees requested that Alger Management address this topic with the Trustees at future meetings.
Other Benefits to Alger Management. The Trustees considered whether Alger Management benefits in other ways from its relationship with the Trust. They noted that Alger Management maintains soft-dollar arrangements in connection with the Funds’ brokerage transactions, reports on which are regularly supplied to the Trustees at their quarterly meetings and summaries of which, listing commissions by Fund for the twelve months through June 30, 2010, had been included in the materials supplied prior to the meeting. The Trustees also noted that Alger Inc. provides a substantial portion of the Funds’ equity brokerage and receives shareholder servicing fees from the Funds as well. The Trustees had been provided with information regarding, and had considered, the brokerage and shareholder servicing fee benefits in connectio n with their review of the profitability to Alger Management and its affiliates of their relationships with the Funds. As to other benefits received, the Trustees decided that none were so significant as to render Alger Management’s fees excessive.
Conclusions and Determinations. At the conclusion of these discussions, each of the Independent Trustees expressed the opinion that he had been furnished with sufficient information to make an informed business decision with respect to renewal of the Investment Advisory Agreement. Based on its discussions and considerations as described above, the Board made the following conclusions and determinations:
71
· The Board concluded that the nature, extent and quality of the services provided to each Fund by Alger Management are adequate and appropriate.
· The Board determined that the Funds’ overall performance was acceptable.
· The Board concluded that each advisory fee paid to Alger Management was reasonable in light of comparative performance and expense and advisory fee information, costs of the services provided and profits to be realized and benefits derived or to be derived by Alger Management from the relationship with the Fund.
· The Board determined that there were not at this time significant economies of scale to be realized by Alger Management in managing the Funds’ assets but that, to the extent that material economies of scale should be realized in the future, the Board would seek to ensure that they were shared with the applicable Fund.
The Board considered these conclusions and determinations and, without any one factor being dispositive, determined with respect to each Fund that renewal of the Investment Advisory Agreement was in the best interests of the Fund and its shareholders.
Privacy Policy
Your Privacy Is Our Priority
At Fred Alger & Company, Incorporated (“Alger Inc.”) we value the confidence you have placed in us. In trusting us with your assets, you provide us with personal and financial data. Alger is committed to maintaining the confidentiality of the personal nonpublic information (“personal information”) entrusted to us by our customers. Your privacy is very important to us, and we are dedicated to safeguarding your personal information as we serve your financial needs.
Our Privacy Policy
We believe you should know about Alger’s Privacy Policy and how we collect and protect your personal information. This Privacy Policy (“Policy”) describes our practices and policy for collecting, sharing and protecting the personal information of our prospective, current and former customers. The Policy is applicable to Alger and its affiliate, Fred Alger Management, Inc., as well as the following funds: The Alger Funds, The Alger Institutional Funds, The Alger Portfolios, Alger China-U.S. Growth Fund and The Alger Funds II. We are proud of our Policy and hope you will take a moment to read about it.
Information We Collect
The type of personal information we collect and use varies depending on the Alger products or services you select.
We collect personal information that enables us to serve your financial needs, develop and offer new products and services, and fulfill legal and regulatory requirements. Depending on the products or services you request, we obtain personal information about you from the following sources:
72
· Information, such as your name, address and social security number, provided on applications and other forms we receive from you or your representative;
· Information from your communications with Alger employees or from your representative, which may be provided to us by telephone, in writing or through Internet transactions; and
· Information about your transactions, such as the purchase and redemption of fund shares, account balances and parties to the transactions, which we receive from our affiliates or other third parties.
Sharing of Personal Information
We may share your personal information with our affiliates so that they may process and service your transactions.
However, Alger never sells customer lists to any third party. Further, we do not disclose personal information to nonaffiliated third parties, except as required by law or as permitted by law to service your account, such as follows:
· To third-party service providers that assist us in servicing your accounts (e.g. securities clearinghouses);
· To governmental agencies and law enforcement officials (e.g. valid subpoenas, court orders); and
· To financial institutions that perform marketing services on our behalf or with whom we have joint marketing agreements that provide for the confidentiality of personal information.
Our Security Practices
We protect your personal information by maintaining physical, electronic and procedural safeguards. When you visit Alger’s Internet sites your information is protected by our systems that utilize 128-bit data encryption, Secure Socket Layer (SSL) protocol, user names, passwords and other precautions. We have implemented safeguards to ensure that access to customer information is limited to employees, such as customer service representatives, who require such information to carry out their job responsibilities. Our employees are aware of their strict responsibility to respect the confidentiality of your personal information.
Thank you for choosing to invest with Alger. We value your relationship with us and assure you we will abide by our policy to protect your information.
Proxy Voting Policies
A description of the policies and procedures the Trust uses to determine how to vote proxies relating to portfolio securities and the proxy voting record is available, without charge, by calling (800) 992-3863 or online on the Funds’ website at http://www.alger.com or on the SEC’s website at http://www.sec.gov.
73
Fund Holdings
The Funds’ most recent month end portfolio holdings are available approximately sixty days after month end on the Funds’ website at www.alger.com. The Funds also file their complete schedule of portfolio holdings with the SEC for the first and third quarter of each fiscal year on Form N-Q. The Funds’ Forms N-Q are available online on the SEC’s website at http://www.sec.gov or may be reviewed and copied at the SEC’s Public Reference Room in Washington, D.C. Information regarding the operation of the SEC’s Public Reference Room may be obtained by calling 1-800-SEC-0330. A copy of the most recent quarterly holdings may also be obtained from the Funds by calling (800) 992-3863.
74
THE ALGER INSTITUTIONAL FUNDS
111 Fifth Avenue
New York, NY 10003
(800) 992-3863
www.alger.com
Investment Manager
Fred Alger Management, Inc.
111 Fifth Avenue
New York, NY 10003
Distributor
Fred Alger & Company, Incorporated
111 Fifth Avenue
New York, NY 10003
Transfer Agent and Dividend Disbursing Agent
Boston Financial Data Services, Inc.
P.O. Box 8480
Boston, MA 02266
This report is submitted for the general information of the shareholders of The Alger Institutional Funds. It is not authorized for distribution to prospective investors unless accompanied by an effective Prospectus for the Trust, which contains information concerning the Trust’s investment policies, fees and expenses as well as other pertinent information.
(This page has been intentionally left blank.)
(This page has been intentionally left blank.)

AIFAR
ITEM 2. CODE OF ETHICS.
(a) The Registrant has adopted a code of ethics (the “Code of Ethics”) that applies to its principal executive officer, principal financial officer, principal accounting officer or controller, or persons performing similar functions.
(b) Not applicable.
(c) The Registrant has amended its Code of Ethics during the period covered by the shareholder report presented in Item 1 hereto whereby the code further clarifies instances when exceptions may be granted by the Chief Compliance Officer or the General Counsel.
(d) The Registrant has not granted a waiver or an implicit waiver from a provision of its Code of Ethics during the period covered by the shareholder report presented in Item 1 hereto.
(e) Not applicable.
(f) The Registrant’s Code of Ethics is attached as an Exhibit hereto.
ITEM 3. AUDIT COMMITTEE FINANCIAL EXPERT.
The Board of Trustees of the Registrant determined that Stephen E. O’Neil is an audit committee financial expert (within the meaning of that phrase specified in the instructions to Form N-CSR) on the Registrant’s audit committee. Mr. O’Neil is an “independent” trustee — i.e., he is not an interested person of the Registrant as defined in the Investment Company Act of 1940, nor has he accepted directly or indirectly any consulting, advisory or other compensatory fee from the Registrant, other than in his capacity as Trustee.
ITEM 4. PRINCIPAL ACCOUNTANT FEES AND SERVICES.
a) Audit Fees:
October 31, 2010 | | $ | 103,000 | |
October 31, 2009 | | $ | 103,000 | |
b) Audit-Related Fees: NONE
c) Tax Fees for tax advice, tax compliance and tax planning:
October 31, 2010 | | $ | 22,874 | |
October 31, 2009 | | $ | 14,600 | |
d) All Other Fees:
October 31, 2010 | | $ | 6,000 | |
October 31, 2009 | | $ | 6,000 | |
Other fees include a review and consent for Registrants registration statement filing and a review of the semi-annual financial statements.
e) 1) Audit Committee Pre-Approval Policies And Procedures:
Audit and non-audit services provided by the Registrant’s independent registered public accounting firm (the “Auditors”) on behalf the Registrant must be pre-approved by the Audit Committee. Non-audit services provided by the Auditors on behalf of the Registrant’s Investment Adviser or any entity controlling, controlled by, or under common control with the Investment Adviser must be pre-approved by the Audit Committee if such non-audit services directly relate to the operations or financial reporting of the Registrant.
2) All fees in item 4(b) through 4(d) above were approved by the Registrants’ Audit Committee.
f) Not Applicable
g) Non-Audit Fees:
October 31, 2010 | | $189,420 and €73,916 | |
October 31, 2009 | | $145,700 | |
h) The audit committee of the board of trustees has considered whether the provision of the non-audit services that were rendered to the registrant’s investment adviser and any entity controlling, controlled by, or under common control, with the adviser that provides ongoing services to the registrant that were not approved pursuant to (c)(7)(ii) of Rule 2-01 of Regulation S-X is compatible with maintaining the principle accountant’s independence.
ITEM 5. AUDIT COMMITTEE OF LISTED REGISTRANTS.
Not applicable
ITEM 6. INVESTMENTS.
Not applicable
ITEM 7. DISCLOSURE OF PROXY VOTING POLICIES AND PROCEDURES FOR CLOSED-END MANAGEMENT INVESTMENT COMPANIES.
Not applicable
ITEM 8. PORTFOLIO MANAGERS OF CLOSED-END MANAGEMENT INVESTMENT COMPANIES.
Not applicable
ITEM 9. PURCHASES OF EQUITY SECURITIES BY CLOSED-END MANAGEMENT INVESTMENT COMPANY AND AFFILIATED PURCHASERS.
Not applicable
ITEM 10. SUBMISSION OF MATTERS TO A VOTE OF SECURITY HOLDERS.
None
ITEM 11. CONTROLS AND PROCEDURES.
(a) The Registrant’s principal executive officer and principal financial officer have concluded that the Registrant’s disclosure controls and procedures (as defined in Rule 30a-3(c) under the Investment Company Act of 1940, as amended) are effective based on their evaluation of the disclosure controls and procedures as of a date within 90 days of the filing date of this document.
(b) No changes in the Registrant’s internal control over financial reporting occurred during the Registrant’s second fiscal half-year that materially affected, or are
reasonably likely to materially affect, the Registrant’s internal control over financial reporting.
ITEM 12. EXHIBITS.
(a) (1) Code of Ethics as Exhibit 99.CODE ETH
(a) (2) Certifications of principal executive officer and principal financial officer as required by rule 30a-2(a) under the Investment Company Act of 1940 are attached as Exhibit 99.CERT
(b) Certifications of principal executive officer and principal financial officer as required by rule 30a-2(b) under the Investment Company Act of 1940 are attached as Exhibit 99.906CERT
SIGNATURES
Pursuant to the requirements of the Securities Exchange Act of 1934 and the Investment Company Act of 1940, the registrant has duly caused this report to be signed on its behalf by the undersigned, thereunto duly authorized.
The Alger Institutional Funds
By: | /s/Dan C. Chung | |
| | |
| Dan C. Chung | |
| | |
| President | |
| | |
Date: December 16, 2010 | |
Pursuant to the requirements of the Securities Exchange Act of 1934 and the Investment Company Act of 1940, this report has been signed below by the following persons on behalf of the registrant and in the capacities and on the dates indicated.
By: | /s/Dan C. Chung | |
| | |
| Dan C. Chung | |
| | |
| President | |
| | |
Date: December 16, 2010 | |
By: | /s/Michael D. Martins | |
| | |
| Michael D. Martins | |
| | |
| Treasurer | |
| | |
Date: December 16, 2010 | |