| | OMB APPROVAL |
| | OMB Number: | 3235-0570 |
| | Expires: | January 31, 2014 |
| UNITED STATES | Estimated average burden hours per response. . . . . . . . . . . . . . . . .20.6 |
| SECURITIES AND EXCHANGE COMMISSION | |
| Washington, D.C. 20549 | |
| | | | |
FORM N-CSR
CERTIFIED SHAREHOLDER REPORT OF REGISTERED
MANAGEMENT INVESTMENT COMPANIES
Investment Company Act file number | 811-07986 |
|
The Alger Institutional Funds |
(Exact name of registrant as specified in charter) |
|
360 Park Avenue South New York, New York | | 10010 |
(Address of principal executive offices) | | (Zip code) |
|
Mr. Hal Liebes Fred Alger Management, Inc. 360 Park Avenue South New York, New York 10010 |
(Name and address of agent for service) |
|
Registrant’s telephone number, including area code: | 212-806-8800 | |
|
Date of fiscal year end: | October 31 | |
|
Date of reporting period: | October 31, 2012 | |
| | | | | | | | |
ITEM 1. REPORTS TO STOCKHOLDERS.
| The Alger Institutional Funds | | |
| | | |
| ANNUAL REPORT | | |
| October 31, 2012 | | |
Table of Contents
THE ALGER INSTITUTIONAL FUNDS
Shareholders’ Letter (Unaudited) | 1 |
| |
Fund Highlights (Unaudited) | 11 |
| |
Portfolio Summary (Unaudited) | 15 |
| |
Schedules of Investments | 16 |
| |
Statements of Assets and Liabilities | 42 |
| |
Statements of Operations | 44 |
| |
Statements of Changes in Net Assets | 46 |
| |
Financial Highlights | 48 |
| |
Notes to Financial Statements | 56 |
| |
Report of Independent Registered Public Accounting Firm | 73 |
| |
Additional Information (Unaudited) | 74 |
Go Paperless With Alger Electronic Delivery Service
Alger is pleased to provide you with the ability to access regulatory materials online. When documents such as prospectuses and annual and semi-annual reports are available, we’ll send you an e-mail notification with a convenient link that will take you directly to the fund information on our website. To sign up for this free service, simply enroll at www.icsdelivery.com/alger.
Shareholders’ Letter | November 29, 2012 |
Dear Shareholders,
Thomas Edison accumulated over 1,000 patents during his lifetime, a result, in large part, of his legendary work ethic. He exhibited a skill for identifying and pursuing rewarding opportunities and possessed the following keen insight into why many individuals fail to capitalize on opportunities: “Opportunity is missed by most people because it is dressed in overalls and looks like work.” His insight is highly relevant to investors because equity markets, we believe, are providing attractive opportunities. Yet, many investors continue to reduce their U.S. equity exposure and by holding cash and bond investments with zero real return potential, sit on the sidelines. We aren’t surprised as these are indeed difficult economic times and the equity market is challenging.
In our Spring 2012 Market Update commentary(1), we said that markets were due for yet another pullback after a 12% rally earlier in the year brought the S&P 500 Index above 1400 for the first time since the 2008 Financial Crisis. We believed that markets would focus on macroeconomic concerns in China and Europe, deceleration of the U.S. economy, and uncertainty over political elections. In the commentary, we also advised our readers that, in our opinion, such volatility could provide yet another buying opportunity in U.S. equities. In the days following the publication of our commentary, investors apparently became focused on China, the euro zone, and other concerns, causing the S&P 500 to drop 9.58% from May 3 to June 1. For the near term, the selloff in May and June was shorter lived than many investors, including our firm, expected. Low trading volumes and, more importantly, hope for significant stimulus from the U.S. Federal Reserve, the European Central Bank, and other authorities allowed equity markets to recover, with the S&P 500 again climbing above 1400 and gaining 14.29% for the year-to-date period ended October 31, 2012. For the one-year reporting period ended on that date, the S&P climbed 15.21%.
Corporate Fundamentals and Second Quarter Results
Alger believes corporate fundamentals ultimately drive market performance. Companies, of course, operate within the broader economic environment of the U.S. and the global marketplace. 2012 is, in fact, a key point in this market cycle following the Financial Crisis. While corporate America continues to “outperform” the broader economy, the slowing economy and uncertainty among consumers and businesses regarding the economy are having a negative influence. In the second quarter, we saw a continuation of challenges to revenue growth across many industries. Economic concerns caused consumers and businesses to act in a predictable fashion: Individuals became apprehensive about spending and businesses became cautious over hiring employees and making capital outlays. Corporate revenues reflect that trend—on a year-over-year basis, total second-quarter 2012 revenue for S&P 500 companies declined 3.71%, according to J.P. Morgan. It was the first quarterly decline since the depths of the subprime mortgage crisis. For the quarter, 274 companies issued negative revenue surprises, the highest level since the first quarter of 2009, according to FactSet. During the second quarter of 2012, 52% of S&P 500 companies revised revenue guidance downward, while 48% revised guidance upward. This was a continuation, slightly moderated, from the first quarter of 2012, when 60% revised downward. However, the easy growth in revenues and earnings is clearly gone, especially when comparing recent results to the second quarter of 2011, when only 35% of S&P 500 companies revised downward. Unlike quarterly earnings and revenues during
1
the post-2008 Financial Crisis recession, more recent results reflect stronger economic conditions. As a result, corporations now have harder comparables to beat when evaluating results on a year-over-year basis. Moderating GDP growth is also expected to make it harder for corporations to generate substantial revenue and earnings growth.
This backdrop of a slow growth economy, however, is one in which we believe our investment philosophy is well equipped to thrive. Our fundamental investment strategy keeps us focused on finding compelling investment opportunities among companies that are best suited to excel in these challenging times of slow economic growth and increasing concerns over fiscal policy. By conducting in-depth research, we believe that we have potential to find companies that can grow earnings and revenues by gaining market share. As dedicated, long-term growth investors, furthermore, we are attuned to the investment opportunities that challenging economies offer to companies capitalizing on innovation and change.
A Closer Look at Certain Sectors
A closer look at the results announced by companies in a couple of sectors highlights many of the points we’ve made over the years in Alger market commentaries. No broad “average” or single statement, of course, can summarize the results of a sector as broad as Consumer Discretionary, so we will instead give an overview of typical earnings reports for the quarter. Warnaco Group, Coach Inc., and Starbucks Corporation were among companies that announced softness in customer spending. Warnaco has brands such as Speedo and Calvin Klein and it reported weak second-quarter results for Europe and the U.S. Even with positive performance in Asia and Latin America, its net revenues declined 5% on a year-over-year basis, which was in line with Warnaco’s expectations. Warnaco management warned that it is balancing its expectations for new product launches with its outlook for a muted consumer environment in North America and a softening global macroeconomic environment. Fashion accessory leader Coach, Inc. also reported disappointing same-store sales in the U.S., where traffic to its factory outlet stores declined and discounts were required to entice customers to spend. Coach’s strong Asia results, fortunately, helped the company increase year-over-year sales 12%. Starbucks, meanwhile, said it is bracing for a decline in consumer spending and it lowered its earnings-per-share guidance to $0.44 to $0.45 from prior guidance of $0.46 to $0.47. For the fiscal quarter ended July 1, Starbucks said it generated a 13% net revenue increase and noted that same-store sales in China grew only 12%, compared to 18% in the prior quarter. Economic softness in Europe, meanwhile, pressured results of many companies such as PVH Corp., which offers Calvin Klein and Tommy Hilfiger merchandise, and Ralph Lauren Corporation, which offers clothing and home decorating accessories. Ralph Lauren management noted that “the outlook for consumer spending and global economic growth remains challenging and we are planning our business accordingly.” After a multiyear run of double-digit growth in revenues and earnings, Ralph Lauren’s growth may be in the mid-single digits for this year.
Encouragingly, many companies generated strong bottom-line results, or at least results better than many feared. We have commented before that this economic recovery is marked by strong corporate cost controls, resulting in an excellent level of profitability and cash flow in well-managed companies. That’s continued even as top-line revenue growth moderates (overall revenue growth for the consumer sector was 5% in the second quarter). For example, discount clothing retailer TJX Companies generated a 24% increase in net income, even though net sales increased only 9%, and restaurant operator Brinker
2
International, Inc. grew net revenues only 1.5%, but managed to increase net income approximately 12%. For the overall sector, bottom-line results, as measured by net income, increased less than 1% on a year-over-year basis, which makes the strong earnings of companies such as Brinker International and TJX even more noteworthy.
One bright spot has been the U.S. housing industry. In our Summer 2011 Commentary, we reasoned that the real estate market was close to bottoming. At the time, we believed that increasing affordability of homes would eventually support a recovery in housing. Since then, homebuilder stock prices, broadly speaking, have increased. Looking ahead, we believe that the U.S. housing recovery will be a multiyear trend. Just as the downturn took four to five years to finally bottom, so will the recovery, we believe, take time to unfold. Approximately 750,000 residential units, including multifamily properties, are being constructed on an annualized basis, which is a very depressed level compared to the typical levels of about 1.5 million new homes built prior to 2008. In some of the most depressed locations, new home building has been down 70% or 80% from peak, and even with a potential 20% to 30% increase over the next few years, would still be well below peak levels. With extraordinarily low mortgage rates and improving, but still poor, availability of bank financing, we see a long runway for recovery. Second-quarter earnings among publicly traded homebuilders were excellent. We continue to like this area of the U.S. economy, though we believe that the stocks are due for a pause with many trading at five-year highs as of the publication of this letter.
Reasons for Optimism
In addition to the Consumer Discretionary examples discussed above, many companies have preserved profitability by cutting costs as revenues moderate. Even with the year-over-year second-quarter revenue decline of the S&P 500, earnings grew, granted the increase was less than 1%. Also during the second quarter, only 38% of S&P 500 companies had earnings misses, even though 52% of companies reported revenue misses. In comparison, the highest number of earnings misses since the first quarter of 2009 was 39%, which occurred in the last quarter of 2011. For that quarter, however, an impressive 64% of companies missed revenue targets.
In our assessment, corporate fundamentals remain surprisingly strong, amidst a truly difficult global environment. The caution instilled in corporate management means that earnings and margins, while trimmed in many cases, have remained surprisingly healthy when considering the economic background in the U.S. and around the world. With no wage pressures, moderating input costs, and sufficient production capacity, slowing revenue growth is simply not having a devastating impact on corporate earnings or cash flow, which is contrary to the previous forecasts of many pundits. At Alger, we continue to maintain—and we believe the second quarter illustrates this point—that strong corporate earnings are a durable, not cyclical, aspect of the post-2008 Financial Crisis period. The economy and corporate revenues, granted, are struggling against a headwind of weak employment growth in the U.S., but we remind readers that unemployment is highly bifurcated between college- and non-college educated individuals.
In April, we reported that we were anticipating a weak job market and noted that significant uncertainty would linger over how equity markets may react to decelerating corporate earnings. Here, the market has been, in our view, exceedingly resilient in the face of slowing growth and lack of any real progress on Europe and U.S. fiscal policy. In particular, despite the media’s and equity markets’ fixation on every word, movement, or meeting by European regulators and politicians, and the lack of any substantive action by
3
such actors to address the worsening economic issues in Greece, Spain, Italy, and other troubled countries in Europe, the markets have responded quite favorably.
It’s clear to us that we have an unusual combination of factors driving a reasonable, though not broad-based or high-volume, rally off of market lows of June. First, in July, European Central Bank President Mario Draghi raised global market expectations that the organization may engage in extensive bond buying, or in other words, European style quantitative easing. Second, fear of a collapse of the euro and the euro-zone economic fallout has created yet another flight to safety that has caused U.S. Treasury yields to fall to impressively low levels. The low rates are widely recognized as likely being negative after factoring inflation. As a result, we think U.S. equities have benefitted, albeit ever so slightly, from investors shunning additional Treasury buys while fleeing European and emerging markets exposure.
Going Forward
We are pleased by equities’ resiliency, though guessing stocks’ direction based on the actions of regulatory and political leaders in Europe leaves us, as we were in April, uneasy. While we would like to think that June represented a short-term bottom for U.S. equities, we continue to think that investors will retest those lows sometime because of macroeconomic issues and a lack of clarity over government fiscal policies. However, the data we have gathered and the fundamentals that we have observed in the second quarter are, in our view, an extremely helpful guide to current conditions and conditions in 2013.
We now have even greater conviction that any dip, in particular any occurring in the next few months, should be aggressively bought. The current resiliency of the markets shows not, as some would suggest, that markets purely move with macro factors or with the statements of politicians in Europe, but with corporate fundamentals, which we believe are solid in the U.S. Corporate and, increasingly, consumer balance sheets in the U.S. have healthy levels of cash and are underinvested. But that cash hoard, in our view, is increasingly being used in a most sensible way at a time when some investors, including noted bond manager Bill Gross of PIMCO, say equities are losing their appeal. In his August investment outlook, Gross claimed, “The cult of equity is dying” and “investors’ impressions of stocks for the long run or any run have mellowed as well.” The statement is an about-face for Gross, who two years ago said equities were likely to outperform bonds.
We are encouraged to see companies either starting to pay dividends or increasing dividends. Many companies are also buying back stock at an aggressive rate. The result, we believe, may be to put a fundamental floor on the U.S. stock market. We are highly encouraged by what we’ve seen in corporate fundamentals and market reactions. Regulators across the world are raising the rhetoric about slowing economic growth and in many parts of the world, such as China and Brazil, policies are clearly moving to a simulative stance. In other parts, like Europe, it’s mostly rhetoric that is supporting equity market gains, but we think stimulus from policymakers is likely. We maintain that it is not time to sell equities as some suggest. Rather, it is time to buy if you have a time horizon that goes beyond a year, and buy more on market dips if you already own equities. Clearly, we believe that it is time to embrace equities and the rigorous work of conducting in-depth, fundamental research that potentially can uncover attractive opportunities. And it’s time to diversify away from a likely losing asset class that is offering historically low yields: U.S. Treasuries.
4
Portfolio Matters
Alger Capital Appreciation Institutional Fund
The Alger Capital Appreciation Institutional Fund returned 13.68% for the 12-month period ended October 31, 2012, compared to the Russell 1000 Growth Index return of 13.02%.
During the period, the largest sector weightings were Information Technology and Consumer Discretionary. The largest sector overweight was Financials and the largest sector underweight was Consumer Staples. Relative outperformance in the Information Technology and Industrials sectors was the most important contributor to performance, while Energy and Consumer Staples detracted from results. Among the most important relative contributors were Lowe’s Companies, Inc.; Apple, Inc.; CVS Caremark Corp.; Express Scripts, Inc.; and Pfizer, Inc.
Express Scripts, Inc. is a pharmacy benefits manager that also conducts web-based fulfillment of prescription orders. Its stock performed strongly late in the reporting period after the company announced that better-than-expected savings from its acquisition of Medco Health Solutions, Inc. and strength with its generic business drove strong second-quarter results.
Conversely, detracting from relative performance were Focus Media Holding Ltd.; Wal-Mart Stores, Inc.; Baker Hughes, Inc.; Microsoft Corp.; and Abercrombie & Fitch Co., Cl. A. Stock of oilfield services provider Baker Hughes underperformed during the period after the company reported supply chain issues, including a shortage of supply facilities, transportation issues, and a lack of raw materials. The issues reduced utilization of the company’s services and increased costs. Fears that macroeconomic concerns in China and Europe would reduce oil demand also detracted from the stock’s performance.
Alger Large Cap Growth Institutional Fund
The Alger Large Cap Growth Institutional Fund returned 5.67% for the 12-month period ended October 31, 2012, compared to the 13.02% return of the Russell 1000 Growth Index.
During the period, the largest sector weightings were Information Technology and Consumer Discretionary. The largest sector overweight was Financials and the largest sector underweight was Consumer Staples. Relative outperformance in the Financials and Utilities sectors was the most important contributor to performance, while Information Technology and Consumer Discretionary detracted from results. Among the most important relative contributors were Express Scripts, Inc.; eBay, Inc.; Pfizer, Inc.; Lowe’s Companies, Inc.; and ASML Holding N.V.
Express Scripts, Inc. is a pharmacy benefits manager that also conducts web-based fulfillment of prescription orders. Its stock performed strongly late in the reporting period after the company announced that better-than-expected savings from its acquisition of Medco Health Solutions, Inc. and strength with its generic business drove strong second-quarter results.
Conversely, detracting from relative performance were NetApp, Inc.; The Home Depot, Inc.; Wal-Mart Stores, Inc.; Informatica Corp.; and Peabody Energy Corp.
NetApp provides enterprise network storage and data management solutions, including network attached storage, or NAS. The company has major exposure to Europe, which is
5
experiencing economic deceleration that hurt NetApp’s earnings and caused shares of the company to perform poorly. In addition, management has expressed concerns over expectations that U.S. corporate and government defense spending on data storage will moderate next year.
Alger Mid Cap Growth Institutional Fund
The Alger Mid Cap Growth Institutional Fund returned 8.07% for the 12-month period ended October 31, 2012, compared to the 9.09% return of the Russell Midcap Growth Index.
During the period, the largest sector weightings were Information Technology and Consumer Discretionary. The largest sector overweight was Financials and the largest sector underweight was Consumer Staples. Relative outperformance in the Industrials and Consumer Discretionary sectors was the most important contributor to performance, while Materials and Information Technology detracted from results.
Among the most important relative contributors were SBA Communications Corp.; Lennar Corp., Cl A; Spirit AeroSystems Holdings, Inc., Cl A; and SPX Corp. Shares of SBA Communications performed strongly as investors anticipated that demand for wireless telecommunications capacity would increase as smartphone usage grows. SBA can potentially benefit from increased capacity demand because it leases antenna tower space for wireless communication networks.
Conversely, detracting from relative performance were Metabolix, Inc.; Allscripts Healthcare Solutions, Inc.; Groupon, Inc.; and Nabors Industries Ltd.
Allscripts provides software that hospitals and physicians use for electronic medical records, revenue cycle management, and practice management. In April, the company preannounced disappointing fundamental results, including lower-than-expected bookings, weak sales, and an unfavorable sales mix. Rather than commit to using Allscripts products, a number of prospects opted to wait for the company to introduce new software versions and better integrate its offerings.
During the reporting period, the Fund purchased options to hedge risk associated with sectors and individual positions. It also wrote options to generate incremental income. The net results of purchasing and writing options did not have a meaningful impact on performance.
Alger Small Cap Growth Institutional Fund
For the 12-month period ended October 31, 2012, the Alger Small Cap Growth Institutional Fund returned 8.93%, compared to the 9.70% return of the Russell 2000 Growth Index.
During the period, the largest sector weightings in the Fund were Information Technology and Health Care. The largest sector overweight was Information Technology and the largest sector underweight was Health Care. Relative outperformance in the Information Technology and Consumer Staples sectors was the most important contributor to performance, while Industrials and Health Care detracted from results.
6
Among the most important relative contributors were Mellanox Technologies Ltd.; United Rentals, Inc.; Solutia, Inc.; Hain Celestial Group, Inc.; and Catalyst Health Solutions, Inc.
Mellanox Technologies, which provides components that facilitate data transmission between servers and storage systems, generated strong performance during the third quarter, having announced strong earnings growth driven by greater-than-anticipated product adoption. We believe that demand for Mellanox products was driven by high performance computing customers, increasing need for data storage systems, and the popularity of Web 2.0 platforms such as Facebook.
Conversely, detracting from relative performance were LogMeIn, Inc.; RF Micro Devices, Inc.; Shutterfly, Inc.; Pharmacyclics, Inc.; and AAR Corp. LogMeIn offers products that provide remote access to computers and connectivity among Internet-enabled devices. We believe that it has potential to benefit from the proliferation of wireless devices. Weaker-than-expected demand for its products in Europe caused revenues to miss expectations.
As always, we strive to deliver consistently superior investment results for you, our shareholders, and we thank you for your business and your continued confidence in Alger.
Respectfully submitted,

Daniel C. Chung, CFA
Chief Investment Officer
(1) For more details, see Alger commentary titled “Spring 2012 Market Update.”
J.P. Morgan is a bank that provides research and market data to investors. PIMCO is an asset management firm. FactSet provides financial data and analytics to the global investment community.
As of October 31, 2012, the following holdings represented the noted percentages of firm wide assets under management: The Warnaco Group, 0.00%; Coach Inc., 0.00%; Starbucks Corporation, 0.14%; PVH Corp., 0.77%; Ralph Lauren Corporation, 0.41%; TJX Companies, 0.05%; and Brinker International, Inc., 0.00%. Positions in those companies may or may not have been held by Funds discussed in this report.
Investors cannot invest directly in an index. Index performance does not reflect the deduction for fees, expenses or taxes.
This report and the financial statements contained herein are submitted for the general information of shareholders of the Funds. This report is not authorized for distribution to prospective investors in a Fund unless preceded or accompanied by an effective prospectus for the Fund. Fund returns represent the fiscal 12-month period return of Class I shares.
7
The performance information quoted represents past performance, which is not an indication or guarantee of future results.
Standardized performance results can be found on the following pages. The investment return and principal value of an investment in a Fund will fluctuate so that an investor’s shares, when redeemed, may be worth more or less than their original cost. Current performance may be lower or higher than the performance quoted. For performance data current to the most recent month-end, visit us at www.alger.com, or call us at (800) 992-3863.
The views and opinions of the Funds’ management in this report are as of the date of the Shareholders’ letter and are subject to change at any time subsequent to this date. There is no guarantee that any of the assumptions that formed the basis for the opinions stated herein are accurate or that they will materialize. Moreover, the information forming the basis for such assumptions is from sources believed to be reliable; however, there is no guarantee that such information is accurate. Any securities mentioned, whether owned in a Fund or otherwise, are considered in the context of the construction of an overall portfolio of securities and therefore reference to them should not be construed as a recommendation or offer to purchase or sell any such security. Inclusion of such securities in a Fund and transactions in such securities, if any, may be for a variety of reasons, including without limitation, in response to cash flows, inclusion in a benchmark, and risk control. The reference to a specific security should also be understood in such context and not viewed as a statement that the security is a significant holding in a Fund. Please refer to the Schedules of Investments for each Fund that is included in this report for a complete list of Fund holdings as of October 31, 2012. Securities mentioned in the Shareholders’ Letter, if not found in the Schedule of Investments, may have been held by the Funds during the fiscal period.
A Word about Risk
Growth stocks tend to be more volatile than other stocks as the price of growth stocks tends to be higher in relation to their companies’ earnings and may be more sensitive to market, political and economic developments. Investing in the stock market involves gains and losses and may not be suitable for all investors. Stocks of small and mid-sized companies are subject to greater risk than stocks of larger, more established companies owing to such factors as limited liquidity, inexperienced management, and limited financial resources. Funds that participate in leveraging, such as the Capital Appreciation Institutional Fund, are subject to the risk that borrowing money to leverage will exceed the returns for securities purchased or that the securities purchased may actually go down in value; thus, the Funds’ net asset values can decrease more quickly than if the Funds had not borrowed.
A small investment in derivatives could have a potentially large impact on a Fund’s performance. When purchasing options, the Fund bears the risk that if the market value of the underlying security does not move to a level that would make exercise of the option profitable, the option will expire unexercised. When a call option written by a Fund is exercised, the Fund will not participate in any increase in the underlying security’s value above the exercise price. When a put option written by a Fund is exercised, the Fund will be required to purchase the underlying security at a price in excess of its market value. Use of options on securities indexes is subject to the risk that trading in the options may be interrupted if trading in certain securities included in the index is interrupted, the risk that
8
price movements in the Fund’s portfolio securities may not correlate precisely with movements in the level of an index, and the risk that Fred Alger Management, Inc. may not predict correctly movements in the direction of a particular market or of the stock market generally. Because certain options may require settlement in cash, a Fund may be forced to liquidate portfolio securities to meet settlement obligations. Forward currency contracts are subject to currency exchange rate risks, the risk of non-performance by the contract counterparty, and the risk that Fred Alger Management, Inc. may not predict accurately future foreign exchange rates. For a more detailed discussion of the risks associated with these Funds, please see the Funds’ prospectus.
Before investing, carefully consider a Fund’s investment objective, risks, charges, and expenses. For a prospectus or a summary prospectus containing this and other information about The Alger Institutional Funds call us at (800) 992-3863 or visit us at www.alger.com. Read it carefully before investing.
Fred Alger & Company, Incorporated, Distributor. Member NYSE Euronext, SIPC.
NOT FDIC INSURED. NOT BANK GUARANTEED. MAY LOSE VALUE.
Definitions:
· Standard & Poor’s is a credit rating agency and provider of financial data.
· The Russell 3000 Index measures the performance of the 3,000 largest U.S. companies based on the total market capitalization, which represents 98% of the U.S. Equity Market.
· The Russell 1000 Growth Index is an unmanaged index designed to measure the performance of the largest 1,000 companies in the Russell 3000 Index with higher price-to-book ratios and higher forecasted growth values.
· The Russell Midcap Growth Index measures the performance of the mid-cap growth segment of the U.S. equity universe. It includes those Russell Midcap Index companies with higher price-to-book ratios and higher forecasted growth values. The Russell Midcap Index measures the performance of the mid-cap segment of the U.S. equity universe.
· The Russell 2000 Growth Index measures the performance of the small-cap growth segment of the U.S. equity universe. It includes those Russell 2000 companies with higher price-to-book ratios and higher forecasted growth values. The Russell 2000 Index measures the performance of the small-cap segment of the U.S. equity universe.
· The Standard & Poor’s 500 Index is an index of large-company common stocks and is considered to be representative of the U.S. stock market.
9
FUND PERFORMANCE AS OF 9/30/12 (Unaudited)
AVERAGE ANNUAL TOTAL RETURNS
| | 1 YEAR | | 5 YEARS | | 10 YEARS | |
Alger Capital Appreciation Class I (Inception 11/8/93) | | 30.79 | % | 3.16 | % | 10.89 | % |
Alger Capital Appreciation Class R* (Inception 1/27/03) | | 30.19 | % | 2.64 | % | 10.34 | % |
| | | | | | | |
Alger Large Cap Growth Class I (Inception 11/8/93) | | 22.20 | % | (1.31 | )% | 6.37 | % |
Alger Large Cap Growth Class R* (Inception 1/27/03) | | 21.36 | % | (1.90 | )% | 5.79 | % |
| | | | | | | |
Alger Mid Cap Growth Class I (Inception 11/8/93) | | 27.07 | % | (3.97 | )% | 7.97 | % |
Alger Mid Cap Growth Class R* (Inception 1/27/03) | | 26.40 | % | (4.46 | )% | 7.43 | % |
| | | | | | | |
Alger Small Cap Growth Class I (Inception 11/8/93) | | 28.26 | % | 1.12 | % | 11.21 | % |
Alger Small Cap Growth Class R* (Inception 1/27/03) | | 27.63 | % | 0.63 | % | 10.69 | % |
The performance data quoted represents past performance, which is not an indication or a guarantee of future results. The Fund’s average annual total returns include changes in share price and reinvestment of dividends and capital gains.
* Performance figures prior to 1/27/03, inception of Class R shares, are those of the Fund’s Class I Shares. The performance figures prior to 1/27/03 have been adjusted to reflect the higher operating expenses of Class R shares.
10
ALGER CAPITAL APPRECIATION INSTITUTIONAL FUND
Fund Highlights Through October 31, 2012 (Unaudited)
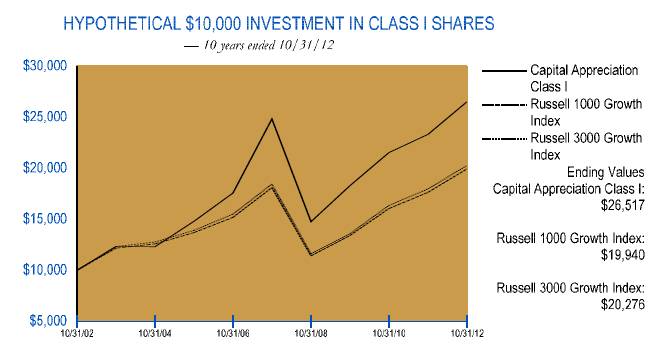
The chart above illustrates the change in value of a hypothetical $10,000 investment made in the Alger Capital Appreciation Institutional Fund Class I shares, the Russell 1000 Growth Index (an unmanaged index of common stocks) and the Russell 3000 Growth Index (an unmanaged index of common stocks) for the ten years ended October 31, 2012. Figures for the Alger Capital Appreciation Institutional Fund Class I shares, the Russell 1000 Growth Index and the Russell 3000 Growth Index include reinvestment of dividends. Performance for the Alger Capital Appreciation Institutional Fund Class R shares may vary from the results shown above due to differences in expenses the class bears. Investors cannot invest directly in any index. Index performance does not reflect deduction for fees, expenses, or taxes.
PERFORMANCE COMPARISON AS OF 10/31/12
AVERAGE ANNUAL TOTAL RETURNS
| | 1 YEAR | | 5 YEARS | | 10 YEARS | | Since
11/8/1993 | |
Class I (Inception 11/8/93) | | 13.68 | % | 1.32 | % | 10.24 | % | 11.07 | % |
Class R* (Inception 1/27/03) | | 13.16 | % | 0.81 | % | 9.69 | % | 10.51 | % |
Russell 1000 Growth Index | | 13.02 | % | 1.95 | % | 7.15 | % | 7.39 | % |
Russell 3000 Growth Index | | 12.76 | % | 1.90 | % | 7.32 | % | 7.12 | % |
The performance data quoted represents past performance, which is not an indication or a guarantee of future results. The Fund’s average annual total returns include changes in share price and reinvestment of dividends and capital gains. The chart and table above do not reflect the deduction of taxes that a shareholder would have paid on Fund distributions or on the redemption of Fund shares. Investment return and principal will fluctuate and the Fund’s shares, when redeemed, may be worth more or less than their original cost. Current performance may be higher or lower than the performance quoted. For updated performance, visit us at www.alger.com or call us at (800) 992-3863.
* Performance figures prior to 1/27/03, inception of Class R shares, are those of the Fund’s Class I Shares. The performance figures prior to 1/27/03 have been adjusted to reflect the higher operating expenses of Class R shares.
11
ALGER LARGE CAP GROWTH INSTITUTIONAL FUND
Fund Highlights Through October 31, 2012 (Unaudited)
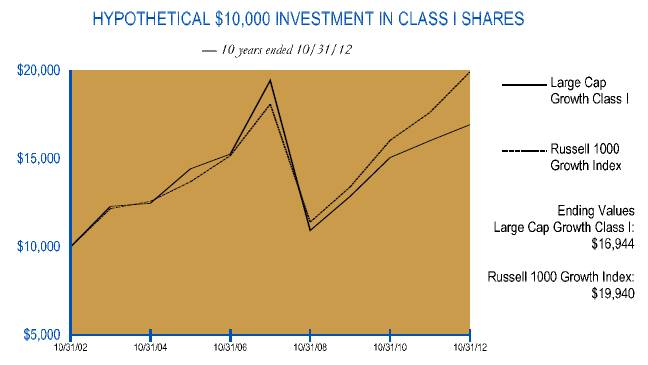
The chart above illustrates the change in value of a hypothetical $10,000 investment made in the Alger Large Cap Growth Institutional Fund Class I shares and the Russell 1000 Growth Index (an unmanaged index of common stocks) for the ten years ended October 31, 2012. The figures for the Alger Large Cap Growth Institutional Fund Class I shares and the Russell 1000 Growth Index include reinvestment of dividends. Performance for the Alger Large Cap Growth Institutional Fund Class R shares may vary from the results shown above due to differences in expenses the class bears. Investors cannot invest directly in any index. Index performance does not reflect deduction for fees, expenses, or taxes.
PERFORMANCE COMPARISON AS OF 10/31/12
AVERAGE ANNUAL TOTAL RETURNS
| | 1 YEAR | | 5 YEARS | | 10 YEARS | | Since
11/8/1993 | |
Class I (Inception 11/8/93) | | 5.67 | % | (2.72 | )% | 5.41 | % | 6.95 | % |
Class R* (Inception 1/27/03) | | 4.97 | % | (3.31 | )% | 4.83 | % | 6.39 | % |
Russell 1000 Growth Index | | 13.02 | % | 1.95 | % | 7.15 | % | 7.39 | % |
The performance data quoted represents past performance, which is not an indication or a guarantee of future results. The Fund’s average annual total returns include changes in share price and reinvestment of dividends and capital gains. The chart and table above do not reflect the deduction of taxes that a shareholder would have paid on Fund distributions or on the redemption of Fund shares. Investment return and principal will fluctuate and the Fund’s shares, when redeemed, may be worth more or less than their original cost. Current performance may be higher or lower than the performance quoted. For performance current to the most recent month end, visit us at www.alger.com or call us at (800) 992-3863.
* Performance figures prior to 1/27/03, inception of Class R shares, are those of the Fund’s Class I Shares. The performance figures prior to 1/27/03 have been adjusted to reflect the higher operating expenses of Class R shares.
12
ALGER MID CAP GROWTH INSTITUTIONAL FUND
Fund Highlights Through October 31, 2012 (Unaudited)
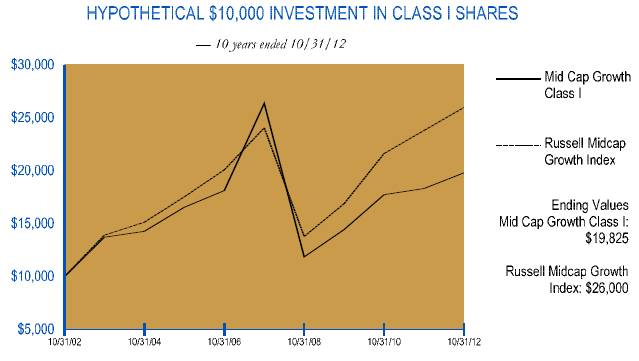
The chart above illustrates the change in value of a hypothetical $10,000 investment made in the Alger Mid Cap Growth Institutional Fund Class I shares and the Russell Midcap Growth Index (an unmanaged index of common stocks) for the ten years ended October 31, 2012. Figures for the Alger Mid Cap Growth Institutional Fund Class I shares and the Russell Midcap Growth Index include reinvestment of dividends. Performance for the Alger Mid Cap Growth Institutional Fund Class R shares may vary from the results shown above due to differences in expenses the class bears. Investors cannot invest directly in any index. Index performance does not reflect deduction for fees, expenses, or taxes.
PERFORMANCE COMPARISON AS OF 10/31/12
AVERAGE ANNUAL TOTAL RETURNS
| | 1 YEAR | | 5 YEARS | | 10 YEARS | | Since
11/8/1993 | |
Class I (Inception 11/8/93) | | 8.07 | % | (5.56 | )% | 7.08 | % | 11.19 | % |
Class R* (Inception 1/27/03) | | 7.47 | % | (6.06 | )% | 6.54 | % | 10.64 | % |
Russell Midcap Growth Index | | 9.09 | % | 1.55 | % | 10.03 | % | 8.22 | % |
The performance data quoted represents past performance, which is not an indication or a guarantee of future results. The Fund’s average annual total returns include changes in share price and reinvestment of dividends and capital gains. The chart and table above do not reflect the deduction of taxes that a shareholder would have paid on Fund distributions or on the redemption of Fund shares. Investment return and principal will fluctuate and the Fund’s shares, when redeemed, may be worth more or less than their original cost. Current performance may be higher or lower than the performance quoted. For performance current to the most recent month end, visit us at www.alger.com or call us at (800) 992-3863.
* Performance figures prior to 1/27/03, inception of Class R shares, are those of the Fund’s Class I Shares. The performance figures prior to 1/27/03 have been adjusted to reflect the higher operating expenses of Class R shares.
13
ALGER SMALL CAP GROWTH INSTITUTIONAL FUND
Fund Highlights Through October 31, 2012 (Unaudited)
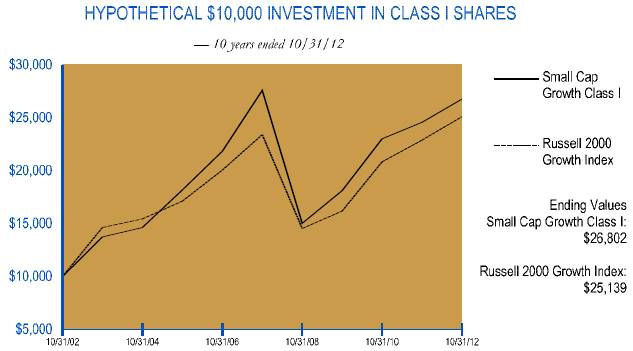
The chart above illustrates the change in value of a hypothetical $10,000 investment made in the Alger Small Cap Growth Institutional Fund Class I shares and the Russell 2000 Growth Index (an unmanaged index of common stocks) for the ten years ended October 31, 2012. The figures for the Alger Small Cap Growth Institutional Fund Class I shares and the Russell 2000 Growth Index include reinvestment of dividends. Performance for the Alger Small Cap Growth Institutional Fund Class R shares may vary from the results shown above due to differences in expenses the class bears. Investors cannot invest directly in any index. Index performance does not reflect deduction for fees, expenses, or taxes.
PERFORMANCE COMPARISON AS OF 10/31/12
AVERAGE ANNUAL TOTAL RETURNS
| | 1 YEAR | | 5 YEARS | | 10 YEARS | | Since
11/8/1993 | |
Class I (Inception 11/8/93) | | 8.93 | % | (0.60 | )% | 10.36 | % | 8.59 | % |
Class R* (Inception 1/27/03) | | 8.40 | % | (1.07 | )% | 9.84 | % | 8.06 | % |
Russell 2000 Growth Index | | 9.70 | % | 1.41 | % | 9.66 | % | 5.65 | % |
The performance data quoted represents past performance, which is not an indication or a guarantee of future results. The Fund’s average annual total returns include changes in share price and reinvestment of dividends and capital gains. The chart and table above do not reflect the deduction of taxes that a shareholder would have paid on Fund distributions or on the redemption of Fund shares. Investment return and principal will fluctuate and the Fund’s shares, when redeemed, may be worth more or less than their original cost. Current performance may be higher or lower than the performance quoted. For performance current to the most recent month end, visit us at www.alger.com or call us at (800) 992-3863.
* Performance figures prior to 1/27/03, inception of Class R shares, are those of the Fund’s Class I Shares. The performance figures prior to 1/27/03 have been adjusted to reflect the higher operating expenses of Class R shares.
14
PORTFOLIO SUMMARY*
October 31, 2012 (Unaudited)
SECTORS | | Alger Capital
Appreciation
Institutional Fund | | Alger Large Cap
Growth
Institutional Fund | | Alger Mid Cap
Growth
Institutional Fund | | Alger Small Cap
Growth
Institutional Fund | |
Consumer Discretionary | | 16.9 | % | 16.8 | % | 21.6 | % | 19.4 | % |
Consumer Staples | | 7.0 | | 6.3 | | 4.2 | | 3.7 | |
Energy | | 4.8 | | 4.7 | | 6.1 | | 5.3 | |
Exchange Traded Funds | | 0.0 | | 0.0 | | 0.2 | | 0.0 | |
Financials | | 9.4 | | 8.1 | | 11.4 | | 9.0 | |
Health Care | | 11.2 | | 13.5 | | 12.6 | | 17.3 | |
Industrials | | 11.9 | | 10.8 | | 14.2 | | 16.1 | |
Information Technology | | 28.2 | | 33.0 | | 18.4 | | 21.7 | |
Materials | | 3.6 | | 2.8 | | 6.5 | | 4.7 | |
Telecommunication Services | | 2.4 | | 1.4 | | 2.6 | | 0.6 | |
Utilities | | 0.0 | | 0.0 | | 1.0 | | 1.3 | |
Short-Term Investments and Net Other Assets | | 4.6 | | 2.6 | | 1.2 | | 0.9 | |
| | 100.0 | % | 100.0 | % | 100.0 | % | 100.0 | % |
* Based on net assets for each Fund.
15
THE ALGER INSTITUTIONAL FUNDS |
ALGER CAPITAL APPRECIATION INSTITUTIONAL FUND
Schedule of Investments‡ October 31, 2012
| | SHARES | | VALUE | |
COMMON STOCKS—91.5% | | | | | |
ADVERTISING—0.5% | | | | | |
Focus Media Holding Ltd.# | | 353,700 | | $ | 8,340,246 | |
| | | | | |
AEROSPACE & DEFENSE—3.0% | | | | | |
General Dynamics Corp. | | 136,800 | | 9,313,344 | |
Honeywell International, Inc. | | 617,000 | | 37,785,079 | |
Precision Castparts Corp. | | 50,900 | | 8,809,263 | |
| | | | 55,907,686 | |
AIR FREIGHT & LOGISTICS—1.0% | | | | | |
FedEx Corp. | | 128,500 | | 11,820,715 | |
United Parcel Service, Inc., Cl. B | | 87,800 | | 6,431,350 | |
| | | | 18,252,065 | |
AIRLINES—0.5% | | | | | |
Delta Air Lines, Inc.* | | 927,000 | | 8,927,010 | |
| | | | | |
APPAREL ACCESSORIES & LUXURY GOODS—1.3% | | | | | |
PVH Corp. | | 137,100 | | 15,079,629 | |
Ralph Lauren Corp. | | 53,700 | | 8,253,153 | |
| | | | 23,332,782 | |
APPAREL RETAIL—0.2% | | | | | |
Limited Brands, Inc. | | 72,800 | | 3,486,392 | |
| | | | | |
APPLICATION SOFTWARE—2.6% | | | | | |
Cadence Design Systems, Inc. * | | 1,489,300 | | 18,854,538 | |
Citrix Systems, Inc. * | | 116,000 | | 7,169,960 | |
QLIK Technologies, Inc. * | | 255,400 | | 4,701,914 | |
Salesforce.com, Inc. * | | 103,500 | | 15,108,930 | |
Workday, Inc. * | | 12,100 | | 586,850 | |
| | | | 46,422,192 | |
ASSET MANAGEMENT & CUSTODY BANKS—0.3% | | | | | |
Affiliated Managers Group, Inc.* | | 45,100 | | 5,705,150 | |
| | | | | |
AUTO PARTS & EQUIPMENT—1.3% | | | | | |
Delphi Automotive PLC * | | 268,500 | | 8,441,640 | |
TRW Automotive Holdings Corp. * | | 98,600 | | 4,585,886 | |
WABCO Holdings, Inc. * | | 172,100 | | 10,079,897 | |
| | | | 23,107,423 | |
BIOTECHNOLOGY—1.0% | | | | | |
Gilead Sciences, Inc. * | | 176,000 | | 11,820,160 | |
Merrimack Pharmaceuticals, Inc. * | | 381,910 | | 2,360,204 | |
Vertex Pharmaceuticals, Inc. * | | 71,600 | | 3,453,984 | |
| | | | 17,634,348 | |
BROADCASTING & CABLE TV—0.9% | | | | | |
CBS Corp., Cl. B | | 337,640 | | 10,939,536 | |
Scripps Networks Interactive, Inc. | | 94,400 | | 5,731,968 | |
| | | | 16,671,504 | |
CABLE & SATELLITE—1.7% | | | | | |
Sirius XM Radio, Inc. * | | 7,190,810 | | 20,134,268 | |
Time Warner Cable, Inc. | | 112,100 | | 11,110,231 | |
| | | | 31,244,499 | |
| | | | | | |
16
| | SHARES | | VALUE | |
COMMON STOCKS—(CONT.) | | | | | |
CASINOS & GAMING—0.8% | | | | | |
Las Vegas Sands Corp. | | 318,500 | | $ | 14,791,140 | |
| | | | | |
COMMUNICATIONS EQUIPMENT—2.6% | | | | | |
Cisco Systems, Inc. | | 593,400 | | 10,170,876 | |
F5 Networks, Inc. * | | 121,000 | | 9,980,080 | |
QUALCOMM, Inc. | | 462,400 | | 27,085,080 | |
| | | | 47,236,036 | |
COMPUTER HARDWARE—7.9% | | | | | |
Apple, Inc. | | 237,600 | | 141,395,759 | |
| | | | | |
COMPUTER STORAGE & PERIPHERALS—0.9% | | | | | |
EMC Corp.* | | 699,500 | | 17,081,790 | |
| | | | | |
CONSTRUCTION & ENGINEERING—0.8% | | | | | |
KBR, Inc. | | 80,600 | | 2,245,516 | |
Quanta Services, Inc. * | | 473,300 | | 12,272,669 | |
| | | | 14,518,185 | |
CONSTRUCTION & FARM MACHINERY & HEAVY TRUCKS—1.4% | | | | | |
Caterpillar, Inc. | | 60,796 | | 5,156,109 | |
Cummins, Inc. | | 7,500 | | 701,850 | |
Joy Global, Inc. | | 141,000 | | 8,805,450 | |
Volvo AB # | | 777,600 | | 10,497,600 | |
| | | | 25,161,009 | |
CONSUMER FINANCE—1.8% | | | | | |
Capital One Financial Corp. | | 538,300 | | 32,389,511 | |
| | | | | |
DATA PROCESSING & OUTSOURCED SERVICES—0.9% | | | | | |
Mastercard, Inc. | | 36,397 | | 16,776,469 | |
| | | | | |
DIVERSIFIED BANKS—1.0% | | | | | |
Wells Fargo & Co. | | 524,200 | | 17,660,298 | |
| | | | | |
DIVERSIFIED CHEMICALS—1.2% | | | | | |
Eastman Chemical Co. | | 161,100 | | 9,543,564 | |
PPG Industries, Inc. | | 103,700 | | 12,141,196 | |
| | | | 21,684,760 | |
DIVERSIFIED METALS & MINING—0.4% | | | | | |
Freeport-McMoRan Copper & Gold, Inc. | | 205,700 | | 7,997,616 | |
| | | | | |
DRUG RETAIL—1.5% | | | | | |
CVS Caremark Corp. | | 598,885 | | 27,788,264 | |
| | | | | |
ELECTRICAL COMPONENTS & EQUIPMENT—0.9% | | | | | |
Cooper Industries PLC, CL. A | | 223,400 | | 16,741,596 | |
| | | | | |
ELECTRONIC MANUFACTURING SERVICES—0.2% | | | | | |
IPG Photonics Corp.* | | 58,200 | | 3,089,256 | |
| | | | | |
FERTILIZERS & AGRICULTURAL CHEMICALS—0.2% | | | | | |
CF Industries Holdings, Inc. | | 13,300 | | 2,729,027 | |
| | | | | |
FOOTWEAR—0.4% | | | | | |
NIKE, Inc., Cl. B | | 73,400 | | 6,707,292 | |
| | | | | | |
17
| | SHARES | | VALUE | |
COMMON STOCKS—(CONT.) | | | | | |
GENERAL MERCHANDISE STORES—2.0% | | | | | |
Dollar General Corp. * | | 566,245 | | $ | 27,530,832 | |
Target Corp. | | 142,200 | | 9,065,250 | |
| | | | 36,596,082 | |
HEALTH CARE EQUIPMENT—1.1% | | | | | |
Covidien PLC | | 297,740 | | 16,360,813 | |
Insulet Corp. * | | 133,500 | | 2,831,535 | |
| | | | 19,192,348 | |
HEALTH CARE FACILITIES—0.8% | | | | | |
HCA Holdings, Inc. | | 303,000 | | 8,608,230 | |
Universal Health Services, Inc., Cl. B | | 125,310 | | 5,186,581 | |
| | | | 13,794,811 | |
HEALTH CARE SERVICES—2.1% | | | | | |
Express Scripts, Inc.* | | 615,200 | | 37,859,408 | |
| | | | | |
HOME IMPROVEMENT RETAIL—1.1% | | | | | |
Lowe’s Companies, Inc. | | 604,400 | | 19,570,472 | |
| | | | | |
HOTELS RESORTS & CRUISE LINES—1.5% | | | | | |
Royal Caribbean Cruises Ltd. | | 344,000 | | 11,582,480 | |
Ryman Hospitality Properties * | | 338,800 | | 13,216,588 | |
Wyndham Worldwide Corporation | | 64,900 | | 3,270,960 | |
| | | | 28,070,028 | |
HOUSEHOLD PRODUCTS—0.9% | | | | | |
Procter & Gamble Co., /The | | 244,900 | | 16,956,876 | |
| | | | | |
HUMAN RESOURCE & EMPLOYMENT SERVICES—0.0% | | | | | |
Towers Watson & Co. | | 10,370 | | 556,973 | |
| | | | | |
INDUSTRIAL MACHINERY—1.2% | | | | | |
Stanley Black & Decker, Inc. | | 305,500 | | 21,171,150 | |
| | | | | |
INTEGRATED TELECOMMUNICATION SERVICES—1.2% | | | | | |
Verizon Communications, Inc. | | 491,800 | | 21,953,952 | |
| | | | | |
INTERNET RETAIL—1.8% | | | | | |
Amazon.com, Inc.* | | 143,900 | | 33,502,798 | |
| | | | | |
INTERNET SOFTWARE & SERVICES—6.5% | | | | | |
eBay, Inc. * | | 678,400 | | 32,759,936 | |
Equinix, Inc. * | | 78,300 | | 14,126,103 | |
Facebook, Inc. * | | 175,400 | | 3,703,571 | |
Google, Inc., Cl. A * | | 74,910 | | 50,921,570 | |
Rackspace Hosting, Inc. * | | 5,900 | | 375,771 | |
Sina Corp. * | | 258,900 | | 14,143,707 | |
VistaPrint NV * | | 68,963 | | 2,101,303 | |
| | | | 118,131,961 | |
INVESTMENT BANKING & BROKERAGE—0.8% | | | | | |
Morgan Stanley | | 802,500 | | 13,947,450 | |
| | | | | |
IT CONSULTING & OTHER SERVICES—4.1% | | | | | |
Accenture Ltd. | | 131,700 | | 8,877,897 | |
Cognizant Technology Solutions Corp., Cl. A * | | 161,100 | | 10,737,315 | |
| | | | | | |
18
| | SHARES | | VALUE | |
COMMON STOCKS—(CONT.) | | | | | |
IT CONSULTING & OTHER SERVICES—(CONT.) | | | | | |
Gartner, Inc. * | | 5,300 | | $ | 245,973 | |
International Business Machines Corp. | | 279,300 | | 54,332,229 | |
| | | | 74,193,414 | |
LEISURE PRODUCTS—0.6% | | | | | |
Michael Kors Holdings Ltd.* | | 196,800 | | 10,762,992 | |
| | | | | |
LIFE & HEALTH INSURANCE—0.8% | | | | | |
Prudential Financial, Inc. | | 259,200 | | 14,787,360 | |
| | | | | |
LIFE SCIENCES TOOLS & SERVICES—0.2% | | | | | |
Thermo Fisher Scientific, Inc. | | 67,800 | | 4,139,868 | |
| | | | | |
MANAGED HEALTH CARE—1.6% | | | | | |
UnitedHealth Group, Inc. | | 518,400 | | 29,030,400 | |
| | | | | |
MOVIES & ENTERTAINMENT—1.2% | | | | | |
News Corp., Cl. A | | 611,000 | | 14,615,120 | |
Viacom, Inc., Cl. B | | 134,500 | | 6,895,815 | |
| | | | 21,510,935 | |
MULTI-LINE INSURANCE—0.1% | | | | | |
American International Group, Inc.* | | 52,400 | | 1,830,332 | |
| | | | | |
OIL & GAS DRILLING—0.1% | | | | | |
Rowan Cos Plc* | | 79,900 | | 2,533,629 | |
| | | | | |
OIL & GAS EQUIPMENT & SERVICES—1.7% | | | | | |
Halliburton Company | | 550,900 | | 17,788,561 | |
National Oilwell Varco, Inc. | | 112,500 | | 8,291,250 | |
Weatherford International Ltd. * | | 487,400 | | 5,507,620 | |
| | | | 31,587,431 | |
OIL & GAS EXPLORATION & PRODUCTION—2.6% | | | | | |
Anadarko Petroleum Corp. | | 346,400 | | 23,835,784 | |
Chesapeake Energy Corp. | | 327,500 | | 6,635,150 | |
Denbury Resources, Inc. * | | 446,800 | | 6,849,444 | |
Pioneer Natural Resources Co. | | 78,155 | | 8,257,076 | |
| | | | 45,577,454 | |
OIL & GAS REFINING & MARKETING—0.1% | | | | | |
Valero Energy Corp. | | 79,000 | | 2,298,900 | |
| | | | | |
OTHER DIVERSIFIED FINANCIAL SERVICES—0.3% | | | | | |
Citigroup, Inc. | | 73,100 | | 2,733,209 | |
JPMorgan Chase & Co. | | 45,500 | | 1,896,440 | |
| | | | 4,629,649 | |
PAPER PRODUCTS—0.4% | | | | | |
International Paper Co. | | 200,500 | | 7,183,915 | |
| | | | | |
PHARMACEUTICALS—4.4% | | | | | |
Bristol-Myers Squibb Co. | | 392,200 | | 13,040,650 | |
Eli Lilly & Co. | | 289,400 | | 14,073,522 | |
Johnson & Johnson | | 284,350 | | 20,137,667 | |
Pfizer, Inc. | | 1,074,300 | | 26,717,841 | |
| | | | | | |
19
| | SHARES | | VALUE | |
COMMON STOCKS—(CONT.) | | | | | |
PHARMACEUTICALS—(CONT.) | | | | | |
Sanofi # | | 176,600 | | $ | 7,743,910 | |
| | | | 81,713,590 | |
RAILROADS—1.0% | | | | | |
CSX Corp. | | 850,510 | | 17,409,940 | |
| | | | | |
REGIONAL BANKS—0.5% | | | | | |
Zions Bancorporation | | 434,700 | | 9,333,009 | |
| | | | | |
RESEARCH & CONSULTING SERVICES—0.4% | | | | | |
Verisk Analytics, Inc., Cl. A* | | 138,600 | | 7,068,600 | |
| | | | | |
RESTAURANTS—1.0% | | | | | |
McDonald’s Corp. | | 169,200 | | 14,686,560 | |
Starbucks Corp. | | 95,800 | | 4,397,220 | |
| | | | 19,083,780 | |
SECURITY & ALARM SERVICES—0.9% | | | | | |
ADT Corp., /The * | | 179,927 | | 7,468,770 | |
Tyco International Ltd. | | 359,855 | | 9,669,304 | |
| | | | 17,138,074 | |
SEMICONDUCTOR EQUIPMENT—1.5% | | | | | |
ASML Holding NV # | | 280,100 | | 15,397,097 | |
Lam Research Corp. * | | 321,300 | | 11,374,020 | |
| | | | 26,771,117 | |
SEMICONDUCTORS—1.0% | | | | | |
Avago Technologies Ltd. | | 165,400 | | 5,463,162 | |
Broadcom Corp., Cl. A * | | 313,100 | | 9,873,609 | |
Skyworks Solutions, Inc. * | | 148,300 | | 3,470,220 | |
| | | | 18,806,991 | |
SOFT DRINKS—2.7% | | | | | |
Coca-Cola Co., /The | | 649,700 | | 24,155,846 | |
PepsiCo, Inc. | | 348,500 | | 24,130,140 | |
| | | | 48,285,986 | |
SPECIALIZED FINANCE—0.4% | | | | | |
IntercontinentalExchange, Inc.* | | 52,300 | | 6,851,300 | |
| | | | | |
SPECIALTY CHEMICALS—1.4% | | | | | |
Celanese Corp. | | 195,600 | | 7,430,844 | |
Cytec Industries, Inc. | | 28,700 | | 1,975,134 | |
LyondellBasell Industries NV | | 199,300 | | 10,640,627 | |
Rockwood Holdings, Inc. | | 139,300 | | 6,393,870 | |
| | | | 26,440,475 | |
SPECIALTY STORES—0.4% | | | | | |
Dick’s Sporting Goods, Inc. | | 146,000 | | 7,300,000 | |
| | | | | |
TOBACCO—1.9% | | | | | |
Philip Morris International, Inc. | | 390,005 | | 34,538,843 | |
| | | | | |
TRADING COMPANIES & DISTRIBUTORS—0.8% | | | | | |
United Rentals, Inc. * | | 233,100 | | 9,477,846 | |
| | | | | | |
20
| | SHARES | | VALUE | |
COMMON STOCKS—(CONT.) | | | | | |
TRADING COMPANIES & DISTRIBUTORS—(CONT.) | | | | | |
WESCO International, Inc. * | | 71,200 | | $ | 4,619,456 | |
| | | | 14,097,302 | |
WIRELESS TELECOMMUNICATION SERVICES—1.2% | | | | | |
SBA Communications Corp. * | | 153,000 | | 10,194,390 | |
Vodafone Group PLC # | | 417,300 | | 11,358,906 | |
| | | | 21,553,296 | |
TOTAL COMMON STOCKS
(Cost $1,490,213,114) | | | | 1,660,542,196 | |
| | | | | |
MASTER LIMITED PARTNERSHIP —1.1% | | | | | |
ASSET MANAGEMENT & CUSTODY BANKS—0.8% | | | | | |
Blackstone Group LP | | 599,700 | | 9,211,392 | |
Carlyle Group LP, /The | | 228,900 | | 5,949,111 | |
| | | | 15,160,503 | |
OIL & GAS STORAGE & TRANSPORTATION—0.3% | | | | | |
Plains All American Pipeline LP | | 114,000 | | 5,173,320 | |
| | | | | |
TOTAL MASTER LIMITED PARTNERSHIP
(Cost $17,649,578) | | | | 20,333,823 | |
| | | | | |
| | PRINCIPAL
AMOUNT | | | |
CONVERTIBLE CORPORATE BONDS—0.2% | | | | | |
HOMEBUILDING—0.2% | | | | | |
Lennar Corp., 3.25%, 11/15/21(L2)(a)
(Cost $1,982,000) | | 1,982,000 | | 3,474,694 | |
| | | | | |
| | SHARES | | | |
REAL ESTATE INVESTMENT TRUST—2.6% | | | | | |
MORTGAGE—2.0% | | | | | |
American Capital Agency Corp. | | 790,900 | | 26,115,518 | |
Two Harbors Investment Corp. | | 958,100 | | 11,430,133 | |
| | | | 37,545,651 | |
RESIDENTIAL—0.4% | | | | | |
Home Properties, Inc. | | 127,700 | | 7,762,883 | |
| | | | | |
SPECIALIZED—0.2% | | | | | |
American Tower Corp., Cl. A | | 53,200 | | 4,005,428 | |
| | | | | |
TOTAL REAL ESTATE INVESTMENT TRUST
(Cost $45,179,264) | | | | 49,313,962 | |
| | | | | |
Total Investments
(Cost $1,555,023,956)(b) | | 95.4 | % | 1,733,664,675 | |
Other Assets in Excess of Liabilities | | 4.6 | | 84,047,277 | |
| | | | | |
NET ASSETS | | 100.0 | % | $ | 1,817,711,952 | |
‡ | Securities classified as Level 1 for ASC 820 disclosure purposes based on valuation inputs unless otherwise noted. |
21
* | Non-income producing security. |
# | American Depositary Receipts. |
(a) | Pursuant to Securities and Exchange Commission Rule 144A, these securities may be sold prior to their maturity only to qualified institutional buyers. These securities are deemed to be liquid and represent 0.2% of the net assets of the Fund. |
(b) | At October 31, 2012, the net unrealized appreciation on investments, based on cost for federal income tax purposes of $1,584,416,518, amounted to $149,248,157 which consisted of aggregate gross unrealized appreciation of $196,179,429 and aggregate gross unrealized depreciation of $46,931,272. |
(L2) | Security classified as Level 2 for ASC 820 disclosure purposes based on valuation inputs. |
Industry classifications are unaudited.
See Notes to Financial Statements.
22
THE ALGER INSTITUTIONAL FUNDS | ALGER LARGE CAP GROWTH INSTITUTIONAL FUND
Schedule of Investments‡ October 31, 2012
| | SHARES | | VALUE | |
COMMON STOCKS—95.9% | | | | | |
AEROSPACE & DEFENSE—2.6% | | | | | |
Boeing Co., /The | | 2,650 | | $ | 186,666 | |
Precision Castparts Corp. | | 1,750 | | 302,872 | |
| | | | 489,538 | |
AIR FREIGHT & LOGISTICS—1.2% | | | | | |
FedEx Corp. | | 1,100 | | 101,189 | |
United Parcel Service, Inc., Cl. B | | 1,800 | | 131,850 | |
| | | | 233,039 | |
APPAREL ACCESSORIES & LUXURY GOODS—0.5% | | | | | |
Ralph Lauren Corp. | | 650 | | 99,899 | |
| | | | | |
APPAREL RETAIL—1.9% | | | | | |
Inditex SA | | 750 | | 95,695 | |
Limited Brands, Inc. | | 3,900 | | 186,771 | |
TJX Cos., Inc. | | 2,200 | | 91,586 | |
| | | | 374,052 | |
APPLICATION SOFTWARE—4.0% | | | | | |
Citrix Systems, Inc. * | | 5,100 | | 315,230 | |
Informatica Corp. * | | 3,600 | | 97,704 | |
Intuit, Inc. | | 2,050 | | 121,811 | |
Salesforce.com, Inc. * | | 1,650 | | 240,867 | |
| | | | 775,612 | |
ASSET MANAGEMENT & CUSTODY BANKS—0.8% | | | | | |
T. Rowe Price Group, Inc. | | 2,300 | | 149,362 | |
| | | | | |
AUTO PARTS & EQUIPMENT—0.7% | | | | | |
Delphi Automotive PLC* | | 4,550 | | 143,052 | |
| | | | | |
BIOTECHNOLOGY—0.5% | | | | | |
Alexion Pharmaceuticals, Inc.* | | 1,000 | | 90,380 | |
| | | | | |
BROADCASTING & CABLE TV—2.3% | | | | | |
CBS Corp., Cl. B | | 9,350 | | 302,940 | |
Discovery Communications, Inc., Series A * | | 2,400 | | 141,648 | |
| | | | 444,588 | |
CASINOS & GAMING—1.0% | | | | | |
Las Vegas Sands Corp. | | 4,150 | | 192,726 | |
| | | | | |
COMMUNICATIONS EQUIPMENT—2.6% | | | | | |
Cisco Systems, Inc. | | 7,400 | | 126,836 | |
QUALCOMM, Inc. | | 6,450 | | 377,809 | |
| | | | 504,645 | |
COMPUTER HARDWARE—10.9% | | | | | |
Apple, Inc. | | 2,900 | | 1,725,789 | |
Teradata Corp. * | | 5,150 | | 351,797 | |
| | | | 2,077,586 | |
COMPUTER STORAGE & PERIPHERALS—0.9% | | | | | |
EMC Corp.* | | 7,300 | | 178,266 | |
| | | | | |
CONSTRUCTION & ENGINEERING—0.5% | | | | | |
Quanta Services, Inc.* | | 4,050 | | 105,017 | |
| | | | | | |
23
| | SHARES | | VALUE | |
COMMON STOCKS—(CONT.) | | | | | |
CONSTRUCTION & FARM MACHINERY & HEAVY TRUCKS—1.0% | | | | | |
Volvo AB# | | 14,350 | | $ | 193,725 | |
| | | | | |
CONSUMER FINANCE—1.7% | | | | | |
American Express Co. | | 2,050 | | 114,739 | |
Capital One Financial Corp. | | 3,400 | | 204,577 | |
| | | | 319,316 | |
DATA PROCESSING & OUTSOURCED SERVICES—1.1% | | | | | |
Mastercard, Inc. | | 450 | | 207,419 | |
| | | | | |
DIVERSIFIED BANKS—1.0% | | | | | |
Wells Fargo & Co. | | 5,650 | | 190,349 | |
| | | | | |
ENVIRONMENTAL & FACILITIES SERVICES—1.3% | | | | | |
Stericycle, Inc.* | | 2,550 | | 241,638 | |
| | | | | |
FERTILIZERS & AGRICULTURAL CHEMICALS—1.3% | | | | | |
CF Industries Holdings, Inc. | | 500 | | 102,595 | |
Monsanto Co. | | 1,650 | | 142,016 | |
| | | | 244,611 | |
FOOD RETAIL—0.7% | | | | | |
Whole Foods Market, Inc. | | 1,500 | | 142,095 | |
| | | | | |
GENERAL MERCHANDISE STORES—3.3% | | | | | |
Dollar General Corp. * | | 7,050 | | 342,770 | |
Target Corp. | | 4,500 | | 286,875 | |
| | | | 629,645 | |
HEALTH CARE DISTRIBUTORS—2.2% | | | | | |
AmerisourceBergen Corp., Cl. A | | 5,350 | | 211,004 | |
Cardinal Health, Inc. | | 5,200 | | 213,876 | |
| | | | 424,880 | |
HEALTH CARE EQUIPMENT—0.7% | | | | | |
Covidien PLC | | 2,500 | | 137,375 | |
| | | | | |
HEALTH CARE FACILITIES—1.0% | | | | | |
HCA Holdings, Inc. | | 6,750 | | 191,768 | |
| | | | | |
HEALTH CARE SERVICES—2.0% | | | | | |
Express Scripts, Inc.* | | 6,250 | | 384,625 | |
| | | | | |
HOME IMPROVEMENT RETAIL—0.5% | | | | | |
Home Depot, Inc., /The | | 1,650 | | 101,277 | |
| | | | | |
HOMEBUILDING—1.0% | | | | | |
Lennar Corp., Cl. A | | 5,200 | | 194,844 | |
| | | | | |
HOUSEHOLD PRODUCTS—2.0% | | | | | |
Procter & Gamble Co., /The | | 5,400 | | 373,896 | |
| | | | | |
HYPERMARKETS & SUPER CENTERS—0.7% | | | | | |
Costco Wholesale Corp. | | 1,450 | | 142,724 | |
| | | | | |
INDUSTRIAL MACHINERY—1.8% | | | | | |
Pall Corp. | | 5,400 | | 339,984 | |
| | | | | |
INTEGRATED TELECOMMUNICATION SERVICES—1.4% | | | | | |
Verizon Communications, Inc. | | 6,200 | | 276,768 | |
| | | | | | |
24
| | SHARES | | VALUE | |
COMMON STOCKS—(CONT.) | | | | | |
INTERNET RETAIL—1.7% | | | | | |
Amazon.com, Inc.* | | 1,400 | | $ | 325,948 | |
| | | | | |
INTERNET SOFTWARE & SERVICES—7.4% | | | | | |
eBay, Inc. * | | 8,100 | | 391,148 | |
Facebook, Inc. * | | 4,950 | | 104,519 | |
Google, Inc., Cl. A * | | 950 | | 645,781 | |
LinkedIn Corp. * | | 900 | | 96,237 | |
Yahoo! Inc. * | | 11,450 | | 192,475 | |
| | | | 1,430,160 | |
INVESTMENT BANKING & BROKERAGE—1.6% | | | | | |
Goldman Sachs Group, Inc., /The | | 1,250 | | 152,988 | |
Morgan Stanley | | 8,500 | | 147,730 | |
| | | | 300,718 | |
IT CONSULTING & OTHER SERVICES—3.8% | | | | | |
Cognizant Technology Solutions Corp., Cl. A * | | 2,250 | | 149,963 | |
International Business Machines Corp. | | 3,000 | | 583,590 | |
| | | | 733,553 | |
LIFE & HEALTH INSURANCE—1.0% | | | | | |
Prudential Financial, Inc. | | 3,500 | | 199,675 | |
| | | | | |
MANAGED HEALTH CARE—0.5% | | | | | |
UnitedHealth Group, Inc. | | 1,700 | | 95,200 | |
| | | | | |
MOTORCYCLE MANUFACTURERS—0.6% | | | | | |
Harley-Davidson, Inc. | | 2,350 | | 109,886 | |
| | | | | |
MOVIES & ENTERTAINMENT—1.5% | | | | | |
News Corp., Cl. A | | 11,650 | | 278,668 | |
| | | | | |
OIL & GAS EQUIPMENT & SERVICES—2.0% | | | | | |
Halliburton Company | | 8,400 | | 271,236 | |
National Oilwell Varco, Inc. | | 1,450 | | 106,865 | |
| | | | 378,101 | |
OIL & GAS EXPLORATION & PRODUCTION—2.7% | | | | | |
Anadarko Petroleum Corp. | | 4,000 | | 275,240 | |
Pioneer Natural Resources Co. | | 2,300 | | 242,995 | |
| | | | 518,235 | |
PACKAGED FOODS & MEATS—0.8% | | | | | |
Hershey Co., /The | | 2,100 | | 144,585 | |
| | | | | |
PAPER PRODUCTS—1.0% | | | | | |
International Paper Co. | | 5,300 | | 189,899 | |
| | | | | |
PHARMACEUTICALS—6.6% | | | | | |
Eli Lilly & Co. | | 4,900 | | 238,287 | |
Johnson & Johnson | | 6,800 | | 481,575 | |
Pfizer, Inc. | | 11,750 | | 292,223 | |
Watson Pharmaceuticals, Inc. * | | 2,900 | | 249,255 | |
| | | | 1,261,340 | |
RAILROADS—1.1% | | | | | |
CSX Corp. | | 10,700 | | 219,029 | |
| | | | | | |
25
| | SHARES | | VALUE | |
COMMON STOCKS—(CONT.) | | | | | |
RESEARCH & CONSULTING SERVICES—1.3% | | | | | |
Verisk Analytics, Inc., Cl. A* | | 5,000 | | $ | 255,000 | |
| | | | | |
RESTAURANTS—1.8% | | | | | |
Chipotle Mexican Grill, Inc. * | | 800 | | 203,624 | |
Yum! Brands, Inc. | | 2,000 | | 140,220 | |
| | | | 343,844 | |
SEMICONDUCTOR EQUIPMENT—1.8% | | | | | |
ASML Holding NV# | | 6,450 | | 354,557 | |
| | | | | |
SEMICONDUCTORS—0.5% | | | | | |
Broadcom Corp., Cl. A* | | 2,900 | | 91,452 | |
| | | | | |
SOFT DRINKS—1.1% | | | | | |
PepsiCo, Inc. | | 3,000 | | 207,720 | |
| | | | | |
SPECIALIZED FINANCE—0.5% | | | | | |
IntercontinentalExchange, Inc.* | | 750 | | 98,250 | |
| | | | | |
SPECIALTY CHEMICALS—0.5% | | | | | |
Celanese Corp. | | 2,600 | | 98,774 | |
| | | | | |
TOBACCO—1.0% | | | | | |
Philip Morris International, Inc. | | 2,150 | | 190,404 | |
| | | | | |
TOTAL COMMON STOCKS
(Cost $17,165,023) | | | | 18,419,699 | |
| | | | | |
MASTER LIMITED PARTNERSHIP —1.0% | | | | | |
ASSET MANAGEMENT & CUSTODY BANKS—1.0% | | | | | |
KKR & Co., LP | | 12,700 | | 191,134 | |
| | | | | |
TOTAL MASTER LIMITED PARTNERSHIP
(Cost $184,652) | | | | 191,134 | |
| | | | | |
REAL ESTATE INVESTMENT TRUST—0.5% | | | | | |
RESIDENTIAL—0.5% | | | | | |
Camden Property Trust
(Cost $107,975) | | 1,550 | | 101,727 | |
| | | | | |
Total Investments
(Cost $17,457,650)(a) | | 97.4 | % | 18,712,560 | |
Other Assets in Excess of Liabilities | | 2.6 | | 495,082 | |
| | | | | |
NET ASSETS | | 100.0 | % | $ | 19,207,642 | |
‡ | Securities classified as Level 1 for ASC 820 disclosure purposes based on valuation inputs unless otherwise noted. |
26
* | Non-income producing security. |
# | American Depositary Receipts. |
(a) | At October 31, 2012, the net unrealized appreciation on investments, based on cost for federal income tax purposes of $17,493,618, amounted to $1,218,942 which consisted of aggregate gross unrealized appreciation of $1,785,147 and aggregate gross unrealized depreciation of $566,205. |
Industry classifications are unaudited.
See Notes to Financial Statements.
27
THE ALGER INSTITUTIONAL FUNDS | ALGER MID CAP GROWTH INSTITUTIONAL FUND
Schedule of Investments‡ October 31, 2012
| | SHARES | | VALUE | |
COMMON STOCKS—94.0% | | | | | |
AEROSPACE & DEFENSE—1.5% | | | | | |
Triumph Group, Inc. | | 48,500 | | $ | 3,172,870 | |
| | | | | |
AIRLINES—1.0% | | | | | |
Delta Air Lines, Inc.* | | 213,600 | | 2,056,968 | |
| | | | | |
ALTERNATIVE CARRIERS—0.8% | | | | | |
TW Telecom, Inc.* | | 65,100 | | 1,658,097 | |
| | | | | |
APPAREL ACCESSORIES & LUXURY GOODS—2.5% | | | | | |
PVH Corp. | | 27,400 | | 3,013,726 | |
Ralph Lauren Corp. | | 13,800 | | 2,120,922 | |
| | | | 5,134,648 | |
APPAREL RETAIL—2.3% | | | | | |
Limited Brands, Inc. | | 55,100 | | 2,638,739 | |
Ross Stores, Inc. | | 35,200 | | 2,145,440 | |
| | | | 4,784,179 | |
APPLICATION SOFTWARE—3.7% | | | | | |
Cadence Design Systems, Inc. * | | 164,500 | | 2,082,570 | |
Citrix Systems, Inc. * | | 49,500 | | 3,059,595 | |
QLIK Technologies, Inc. * | | 48,000 | | 883,680 | |
Splunk, Inc. * | | 39,785 | | 1,115,969 | |
Tangoe, Inc. * | | 54,200 | | 700,264 | |
Workday, Inc. * | | 1,400 | | 67,900 | |
| | | | 7,909,978 | |
ASSET MANAGEMENT & CUSTODY BANKS—1.6% | | | | | |
Affiliated Managers Group, Inc. * | | 8,700 | | 1,100,550 | |
T. Rowe Price Group, Inc. | | 32,600 | | 2,117,044 | |
| | | | 3,217,594 | |
AUTO PARTS & EQUIPMENT—0.8% | | | | | |
Delphi Automotive PLC* | | 55,250 | | 1,737,060 | |
| | | | | |
BIOTECHNOLOGY—4.9% | | | | | |
Alexion Pharmaceuticals, Inc. * | | 27,700 | | 2,503,526 | |
Idenix Pharmaceuticals, Inc. * | | 135,209 | | 481,344 | |
Medivation, Inc. * | | 38,800 | | 1,983,456 | |
Merrimack Pharmaceuticals, Inc. * | | 446,033 | | 2,756,484 | |
Onyx Pharmaceuticals, Inc. * | | 7,750 | | 607,290 | |
Vertex Pharmaceuticals, Inc. * | | 40,400 | | 1,948,896 | |
| | | | 10,280,996 | |
BROADCASTING & CABLE TV—2.5% | | | | | |
CBS Corp., Cl. B | | 89,700 | | 2,906,280 | |
Discovery Communications, Inc., Series C * | | 20,800 | | 1,139,424 | |
Scripps Networks Interactive, Inc. | | 20,100 | | 1,220,472 | |
| | | | 5,266,176 | |
BUILDING PRODUCTS—0.5% | | | | | |
Owens Corning* | | 33,000 | | 1,108,470 | |
| | | | | |
CABLE & SATELLITE—1.2% | | | | | |
Charter Communications, Inc. * | | 13,700 | | 1,060,517 | |
| | | | | | |
28
| | SHARES | | VALUE | |
COMMON STOCKS—(CONT.) | | | | | |
CABLE & SATELLITE—(CONT.) | | | | | |
Sirius XM Radio, Inc. * | | 519,400 | | $ | 1,454,320 | |
| | | | 2,514,837 | |
CHEMICALS—0.1% | | | | | |
Metabolix, Inc.* | | 100,216 | | 133,287 | |
| | | | | |
COMMUNICATIONS EQUIPMENT—2.6% | | | | | |
Ciena Corp. * | | 48,400 | | 600,644 | |
F5 Networks, Inc. * | | 25,200 | | 2,078,496 | |
JDS Uniphase Corp. * | | 113,100 | | 1,095,939 | |
Motorola Solutions, Inc. | | 33,800 | | 1,746,784 | |
| | | | 5,521,863 | |
COMPUTER HARDWARE—1.0% | | | | | |
Teradata Corp.* | | 29,300 | | 2,001,483 | |
| | | | | |
CONSTRUCTION & ENGINEERING—1.1% | | | | | |
Quanta Services, Inc. * | | 43,900 | | 1,138,327 | |
TPI - Triunfo Participacoes e Investimentos SA | | 210,000 | | 1,152,455 | |
| | | | 2,290,782 | |
DATA PROCESSING & OUTSOURCED SERVICES—0.5% | | | | | |
Paychex, Inc. | | 32,300 | | 1,047,489 | |
| | | | | |
DISTILLERS & VINTNERS—1.2% | | | | | |
Beam, Inc. | | 46,300 | | 2,572,428 | |
| | | | | |
DISTRIBUTORS—0.9% | | | | | |
LKQ Corp.* | | 85,600 | | 1,788,184 | |
| | | | | |
DIVERSIFIED CHEMICALS—2.0% | | | | | |
Eastman Chemical Co. | | 22,600 | | 1,338,824 | |
PPG Industries, Inc. | | 24,000 | | 2,809,920 | |
| | | | 4,148,744 | |
EDUCATION SERVICES—0.6% | | | | | |
Anhanguera Educacional Participacoes SA | | 71,500 | | 1,252,812 | |
| | | | | |
ELECTRIC UTILITIES—1.0% | | | | | |
ITC Holdings Corp. | | 26,600 | | 2,117,892 | |
| | | | | |
ELECTRONIC MANUFACTURING SERVICES—0.5% | | | | | |
Trimble Navigation Ltd.* | | 22,050 | | 1,040,319 | |
| | | | | |
ENVIRONMENTAL & FACILITIES SERVICES—2.1% | | | | | |
Clean Harbors, Inc. * | | 21,000 | | 1,225,350 | |
Stericycle, Inc. *,^ | | 21,900 | | 2,075,244 | |
Tetra Tech, Inc. * | | 42,600 | | 1,105,044 | |
| | | | 4,405,638 | |
FERTILIZERS & AGRICULTURAL CHEMICALS—1.0% | | | | | |
CF Industries Holdings, Inc. | | 10,300 | | 2,113,457 | |
| | | | | |
FOOD RETAIL—1.4% | | | | | |
Fresh Market, Inc., /The* | | 52,816 | | 2,995,195 | |
| | | | | |
GENERAL MERCHANDISE STORES—2.8% | | | | | |
Dollar General Corp. * | | 89,100 | | 4,332,042 | |
| | | | | | |
29
| | SHARES | | VALUE | |
COMMON STOCKS—(CONT.) | | | | | |
GENERAL MERCHANDISE STORES—(CONT.) | | | | | |
Family Dollar Stores, Inc. | | 26,800 | | $ | 1,767,728 | |
| | | | 6,099,770 | |
HEALTH CARE DISTRIBUTORS—1.3% | | | | | |
Cardinal Health, Inc. | | 67,100 | | 2,759,823 | |
| | | | | |
HEALTH CARE FACILITIES—0.6% | | | | | |
Tenet Healthcare Corporation* | | 50,750 | | 1,197,700 | |
| | | | | |
HEALTH CARE SERVICES—1.1% | | | | | |
Catamaran Corp. * | | 40,260 | | 1,898,662 | |
HMS Holdings Corp. * | | 13,000 | | 300,170 | |
| | | | 2,198,832 | |
HEALTH CARE TECHNOLOGY—0.7% | | | | | |
Agilent Technologies, Inc. | | 42,200 | | 1,518,778 | |
| | | | | |
HOMEBUILDING—2.2% | | | | | |
Lennar Corp., Cl. A | | 70,600 | | 2,645,382 | |
Standard Pacific Corp. * | | 290,900 | | 2,007,210 | |
| | | | 4,652,592 | |
HOTELS RESORTS & CRUISE LINES—2.1% | | | | | |
Royal Caribbean Cruises Ltd. | | 68,100 | | 2,292,927 | |
Wyndham Worldwide Corporation | | 43,000 | | 2,167,200 | |
| | | | 4,460,127 | |
HUMAN RESOURCE & EMPLOYMENT SERVICES—1.3% | | | | | |
Robert Half International, Inc. | | 98,800 | | 2,656,732 | |
| | | | | |
INDUSTRIAL MACHINERY—3.1% | | | | | |
Pall Corp. | | 48,000 | | 3,022,080 | |
SPX Corp. | | 49,300 | | 3,381,487 | |
| | | | 6,403,567 | |
INTERNET SOFTWARE & SERVICES—2.7% | | | | | |
Equinix, Inc. * | | 5,300 | | 956,173 | |
LinkedIn Corp. * | | 9,800 | | 1,047,914 | |
OpenTable, Inc. * | | 47,600 | | 2,235,772 | |
Yelp, Inc. * | | 59,100 | | 1,424,310 | |
| | | | 5,664,169 | |
LEISURE PRODUCTS—1.8% | | | | | |
Fifth & Pacific Cos, Inc. * | | 210,200 | | 2,307,996 | |
Michael Kors Holdings Ltd. * | | 26,700 | | 1,460,223 | |
| | | | 3,768,219 | |
LIFE & HEALTH INSURANCE—0.7% | | | | | |
Lincoln National Corp. | | 57,400 | | 1,422,946 | |
| | | | | |
LIFE SCIENCES TOOLS & SERVICES—0.5% | | | | | |
Illumina, Inc.* | | 21,900 | | 1,040,469 | |
| | | | | |
MANAGED HEALTH CARE—0.6% | | | | | |
Cigna Corp. | | 24,200 | | 1,234,200 | |
| | | | | |
METAL & GLASS CONTAINERS—0.6% | | | | | |
Crown Holdings, Inc.* | | 30,300 | | 1,158,975 | |
| | | | | | |
30
| | SHARES | | VALUE | |
COMMON STOCKS—(CONT.) | | | | | |
MOTORCYCLE MANUFACTURERS—0.6% | | | | | |
Harley-Davidson, Inc. | | 26,000 | | $ | 1,215,760 | |
| | | | | |
OIL & GAS EQUIPMENT & SERVICES—2.4% | | | | | |
Cameron International Corp. *,^ | | 35,650 | | 1,805,316 | |
Core Laboratories NV | | 8,900 | | 922,574 | |
Superior Energy Services, Inc. * | | 108,500 | | 2,205,805 | |
| | | | 4,933,695 | |
OIL & GAS EXPLORATION & PRODUCTION—3.7% | | | | | |
Cabot Oil & Gas Corp. ^ | | 34,400 | | 1,616,112 | |
Denbury Resources, Inc. *,^ | | 166,000 | | 2,544,780 | |
Pioneer Natural Resources Co. ^ | | 33,700 | | 3,560,405 | |
| | | | 7,721,297 | |
PACKAGED FOODS & MEATS—1.6% | | | | | |
ConAgra Foods, Inc. | | 39,600 | | 1,102,464 | |
Hershey Co., /The | | 30,600 | | 2,106,810 | |
| | | | 3,209,274 | |
PAPER PRODUCTS—0.8% | | | | | |
International Paper Co. | | 47,700 | | 1,709,091 | |
| | | | | |
PHARMACEUTICALS—2.9% | | | | | |
Questcor Pharmaceuticals, Inc. | | 71,850 | | 1,830,738 | |
Vivus, Inc. * | | 19,600 | | 292,040 | |
Warner Chilcott PLC, Cl. A | | 113,300 | | 1,312,014 | |
Watson Pharmaceuticals, Inc. * | | 30,000 | | 2,578,500 | |
| | | | 6,013,292 | |
PROPERTY & CASUALTY INSURANCE—0.2% | | | | | |
Fidelity National Financial, Inc. | | 23,500 | | 503,135 | |
| | | | | |
RAILROADS—0.8% | | | | | |
Kansas City Southern^ | | 19,600 | | 1,577,016 | |
| | | | | |
REAL ESTATE MANAGEMENT & DEVELOPMENT—0.8% | | | | | |
BR Properties SA | | 125,100 | | 1,637,829 | |
| | | | | |
REAL ESTATE SERVICES—0.9% | | | | | |
Jones Lang LaSalle, Inc. | | 23,000 | | 1,788,020 | |
| | | | | |
REGIONAL BANKS—1.5% | | | | | |
SVB Financial Group * | | 18,800 | | 1,063,892 | |
Zions Bancorporation | | 97,000 | | 2,082,590 | |
| | | | 3,146,482 | |
RESEARCH & CONSULTING SERVICES—0.7% | | | | | |
CoStar Group, Inc.* | | 18,700 | | 1,550,230 | |
| | | | | |
RESTAURANTS—0.8% | | | | | |
Chipotle Mexican Grill, Inc.* | | 6,600 | | 1,679,898 | |
| | | | | |
SEMICONDUCTOR EQUIPMENT—1.0% | | | | | |
Lam Research Corp.* | | 56,100 | | 1,985,940 | |
| | | | | |
SEMICONDUCTORS—3.1% | | | | | |
Avago Technologies Ltd. | | 64,000 | | 2,113,920 | |
Skyworks Solutions, Inc. * | | 121,700 | | 2,847,780 | |
| | | | | | |
31
| | SHARES | | VALUE | |
COMMON STOCKS—(CONT.) | | | | | |
SEMICONDUCTORS—(CONT.) | | | | | |
Xilinx, Inc. | | 46,600 | | $ | 1,526,616 | |
| | | | 6,488,316 | |
SPECIALIZED FINANCE—1.1% | | | | | |
Moody’s Corp. | | 46,900 | | 2,258,704 | |
| | | | | |
SPECIALTY CHEMICALS—2.0% | | | | | |
Celanese Corp. | | 40,500 | | 1,538,595 | |
Rockwood Holdings, Inc. | | 59,300 | | 2,721,870 | |
| | | | 4,260,465 | |
SPECIALTY STORES—0.5% | | | | | |
Dick’s Sporting Goods, Inc. | | 20,700 | | 1,035,000 | |
| | | | | |
SYSTEMS SOFTWARE—3.3% | | | | | |
CommVault Systems, Inc. * | | 34,900 | | 2,180,203 | |
Fortinet, Inc. * | | 69,700 | | 1,350,089 | |
Red Hat, Inc. * | | 40,300 | | 1,981,551 | |
Sourcefire, Inc. * | | 31,700 | | 1,356,443 | |
| | | | 6,868,286 | |
TRADING COMPANIES & DISTRIBUTORS—2.1% | | | | | |
Beacon Roofing Supply, Inc. * | | 33,500 | | 1,083,390 | |
United Rentals, Inc. * | | 26,800 | | 1,089,688 | |
WW Grainger, Inc. | | 11,200 | | 2,255,792 | |
| | | | 4,428,870 | |
WIRELESS TELECOMMUNICATION SERVICES—1.8% | | | | | |
SBA Communications Corp.* | | 55,600 | | 3,704,628 | |
| | | | | |
TOTAL COMMON STOCKS
(Cost $201,339,549) | | | | 196,223,573 | |
| | | | | |
MASTER LIMITED PARTNERSHIP —1.0% | | | | | |
ASSET MANAGEMENT & CUSTODY BANKS—1.0% | | | | | |
KKR & Co., LP | | 140,600 | | 2,116,030 | |
| | | | | |
TOTAL MASTER LIMITED PARTNERSHIP
(Cost $2,454,973) | | | | 2,116,030 | |
| | | | | |
| | CONTRACTS | | | |
PURCHASED OPTIONS—0.2% | | | | | |
PUT OPTIONS—0.2% | | | | | |
Cabot Oil & Gas Corp./ November/ 43*,~ | | 108 | | 2,700 | |
Cabot Oil & Gas Corp./ November/ 45*,~(L2) | | 74 | | 4,440 | |
iShares Russell 2000 Index Fund/ November/ 82* | | 1,752 | | 306,600 | |
(Cost $313,018) | | | | 313,740 | |
| | | | | |
TOTAL PUT OPTIONS
(Cost $313,018) | | | | 313,740 | |
| | | | | |
CALL OPTIONS—0.0% | | | | | |
SPDR S&P 500 ETF Trust/ November/ 146*,^ | | 111 | | 3,663 | |
SPDR S&P 500 ETF Trust/ November/ 148*,^ | | 111 | | 1,665 | |
| | | | | | |
32
| | CONTRACTS | | VALUE | |
PURCHASED OPTIONS—(CONT.) | | | | | |
SPDR S&P 500 ETF Trust/ November/ 150* | | 74 | | $ | 518 | |
(Cost $11,552) | | | | 5,846 | |
| | | | | |
TOTAL CALL OPTIONS
(Cost $11,552) | | | | 5,846 | |
| | | | | |
TOTAL PURCHASED OPTIONS
(Cost $324,570) | | | | 319,586 | |
| | | | | |
| | SHARES | | | |
REAL ESTATE INVESTMENT TRUST—3.6% | | | | | |
RESIDENTIAL—3.0% | | | | | |
American Campus Communities, Inc. | | 24,300 | | 1,101,033 | |
AvalonBay Communities, Inc. | | 19,100 | | 2,589,196 | |
Camden Property Trust | | 41,300 | | 2,710,519 | |
| | | | 6,400,748 | |
SPECIALIZED—0.6% | | | | | |
Extra Space Storage, Inc. | | 34,900 | | 1,203,701 | |
| | | | | |
TOTAL REAL ESTATE INVESTMENT TRUST
(Cost $7,760,950) | | | | 7,604,449 | |
| | | | | |
Total Investments
(Cost $211,880,042)(a) | | 98.8 | % | 206,263,638 | |
Other Assets in Excess of Liabilities | | 1.2 | | 2,484,098 | |
| | | | | |
NET ASSETS | | 100.0 | % | $ | 208,747,736 | |
‡ | Securities classified as Level 1 for ASC 820 disclosure purposes based on valuation inputs unless otherwise noted. |
^ | All or a portion of this security has been pledged as collateral for written call options. |
~ | All or a portion of this security has been pledged as collateral for written put options. |
* | Non-income producing security. |
(a) | At October 31, 2012, the net unrealized depreciation on investments, based on cost for federal income tax purposes of $213,652,340, amounted to $7,388,702 which consisted of aggregate gross unrealized appreciation of $12,613,431 and aggregate gross unrealized depreciation of $20,002,133. |
(L2) | Security classified as Level 2 for ASC 820 disclosure purposes based on valuation inputs. |
Industry classifications are unaudited.
See Notes to Financial Statements.
33
| | CONTRACTS | | SHARES
SUBJECT
TO PUT/
CALL | | VALUE | |
PUT OPTIONS WRITTEN | | | | | | | |
Cabot Oil & Gas Corp./ November/ 44 | | 192 | | 19,200 | | $ | 6,528 | |
Cabot Oil & Gas Corp./ November/ 46 | | 185 | | 18,500 | | 18,500 | |
Cabot Oil & Gas Corp./ November/ 47 | | 37 | | 3,700 | | 4,995 | |
Cabot Oil & Gas Corp./ November/ 48 | | 37 | | 3,700 | | 7,585 | |
Cameron International Corp./ November/ 52.5 | | 74 | | 7,400 | | 18,500 | |
Cameron International Corp./ November/ 55 | | 37 | | 3,700 | | 23,310 | |
Denbury Resources, Inc./ November/ 16(L2) | | 185 | | 18,500 | | 15,725 | |
Denbury Resources, Inc./ November/ 17(L2) | | 223 | | 22,300 | | 27,875 | |
Ensco PLC/ November/ 57.5 | | 37 | | 3,700 | | 5,069 | |
Kansas City Southern/ November/ 80 | | 74 | | 7,400 | | 12,210 | |
Pioneer Natural Resources Co./ November/ 110(L2) | | 18 | | 1,800 | | 12,060 | |
Pioneer Natural Resources Co./ November/ 115(L2) | | 18 | | 1,800 | | 17,100 | |
Valero Energy Corp./ November/ 29 | | 61 | | 6,100 | | 5,856 | |
Valero Energy Corp./ November/ 30 | | 61 | | 6,100 | | 9,394 | |
TOTAL PUT OPTIONS WRITTEN
(Premiums Received $214,975) | | | | | | 184,707 | |
| | | | | | | |
CALL OPTIONS WRITTEN | | | | | | | |
Cabot Oil & Gas Corp./ November/ 41(L2) | | 37 | | 3,700 | | 22,200 | |
Cabot Oil & Gas Corp./ November/ 42(L2) | | 74 | | 7,400 | | 37,000 | |
Cabot Oil & Gas Corp./ November/ 43(L2) | | 74 | | 7,400 | | 30,340 | |
Cabot Oil & Gas Corp./ November/ 44 | | 37 | | 3,700 | | 13,320 | |
Cabot Oil & Gas Corp./ November/ 45 | | 37 | | 3,700 | | 9,990 | |
Cameron International Corp./ November/ 49 | | 37 | | 3,700 | | 9,990 | |
Cameron International Corp./ November/ 50 | | 37 | | 3,700 | | 6,845 | |
Denbury Resources, Inc./ November/ 15 | | 222 | | 22,200 | | 15,540 | |
Denbury Resources, Inc./ November/ 16 | | 335 | | 33,500 | | 6,700 | |
Kansas City Southern/ November/ 75(L2) | | 37 | | 3,700 | | 16,280 | |
Pioneer Natural Resources Co./ November/ 105 | | 54 | | 5,400 | | 22,626 | |
SPDR S&P 500 ETF Trust/ November/ 139 | | 37 | | 3,700 | | 11,914 | |
SPDR S&P 500 ETF Trust/ November/ 140 | | 37 | | 3,700 | | 9,546 | |
SPDR S&P 500 ETF Trust/ November/ 144 | | 111 | | 11,100 | | 8,103 | |
Stericycle, Inc./ November/ 90(L2) | | 37 | | 3,700 | | 13,690 | |
TOTAL CALL OPTIONS WRITTEN
(Premiums Received $242,293) | | | | | | 234,084 | |
TOTAL OPTIONS WRITTEN
(Premiums Received $457,268) | | | | | | $ | 418,791 | |
‡ | Securities classified as Level 1 for ASC 820 disclosure purposes based on valuation inputs unless otherwise noted. |
(L2) | Security classified as Level 2 for ASC 820 disclosure purposes based on valuation inputs. |
See Notes to Financial Statements.
34
THE ALGER INSTITUTIONAL FUNDS | ALGER SMALL CAP GROWTH INSTITUTIONAL FUND
Schedule of Investments‡ October 31, 2012
| | SHARES | | VALUE | |
COMMON STOCKS—93.6% | | | | | |
AEROSPACE & DEFENSE—1.7% | | | | | |
Esterline Technologies Corp. * | | 184,725 | | $ | 10,675,257 | |
Spirit Aerosystems Holdings, Inc., Cl. A * | | 392,750 | | 6,138,683 | |
| | | | 16,813,940 | |
AIR FREIGHT & LOGISTICS—0.8% | | | | | |
HUB Group, Inc., Cl. A* | | 267,100 | | 8,282,771 | |
| | | | | |
AIRLINES—1.1% | | | | | |
Alaska Air Group, Inc. * | | 135,100 | | 5,166,224 | |
US Airways Group, Inc. * | | 438,950 | | 5,346,411 | |
| | | | 10,512,635 | |
ALTERNATIVE CARRIERS—0.6% | | | | | |
Cogent Communications Group, Inc. | | 261,550 | | 5,678,251 | |
| | | | | |
APPAREL RETAIL—3.3% | | | | | |
ANN, Inc. * | | 308,100 | | 10,832,795 | |
Children’s Place Retail Stores, Inc., /The * | | 176,500 | | 10,312,895 | |
DSW, Inc., Cl. A | | 165,800 | | 10,377,422 | |
| | | | 31,523,112 | |
APPLICATION SOFTWARE—6.0% | | | | | |
Aspen Technology, Inc. * | | 294,000 | | 7,285,320 | |
BroadSoft, Inc. * | | 129,469 | | 4,948,305 | |
Cadence Design Systems, Inc. * | | 964,100 | | 12,205,505 | |
Nice Systems Ltd. #* | | 195,405 | | 6,506,987 | |
QLIK Technologies, Inc. * | | 442,250 | | 8,141,823 | |
Tangoe, Inc. * | | 497,850 | | 6,432,222 | |
Ultimate Software Group, Inc. * | | 117,500 | | 11,909,799 | |
| | | | 57,429,961 | |
ASSET MANAGEMENT & CUSTODY BANKS—0.7% | | | | | |
Cohen & Steers, Inc. | | 236,350 | | 6,615,436 | |
| | | | | |
AUTO PARTS & EQUIPMENT—1.2% | | | | | |
American Axle & Manufacturing Holdings, Inc. * | | 421,100 | | 4,577,357 | |
Dana Holding Corp. | | 548,300 | | 7,215,628 | |
| | | | 11,792,985 | |
BIOTECHNOLOGY—5.3% | | | | | |
Acorda Therapeutics, Inc. * | | 190,150 | | 4,554,093 | |
Alkermes PLC * | | 265,800 | | 4,925,274 | |
Cepheid, Inc. * | | 142,300 | | 4,313,113 | |
Cubist Pharmaceuticals, Inc. * | | 108,550 | | 4,656,795 | |
Idenix Pharmaceuticals, Inc. * | | 673,500 | | 2,397,660 | |
Medivation, Inc. * | | 137,600 | | 7,034,111 | |
Optimer Pharmaceuticals, Inc. * | | 320,512 | | 3,057,684 | |
Pharmacyclics, Inc. * | | 123,950 | | 7,569,626 | |
Seattle Genetics, Inc. * | | 153,850 | | 3,870,866 | |
Synageva BioPharma Corp. * | | 91,050 | | 3,849,594 | |
Theravance, Inc. * | | 209,000 | | 4,704,590 | |
| | | | 50,933,406 | |
BUILDING PRODUCTS—0.7% | | | | | |
AO Smith Corp. | | 107,250 | | 6,517,583 | |
| | | | | | |
35
| | SHARES | | VALUE | |
COMMON STOCKS—(CONT.) | | | | | |
COMMUNICATIONS EQUIPMENT—1.5% | | | | | |
Aruba Networks, Inc. * | | 151,600 | | $ | 2,754,572 | |
Ciena Corp. * | | 453,000 | | 5,621,730 | |
Finisar Corp. * | | 534,600 | | 6,158,592 | |
| | | | 14,534,894 | |
COMPUTER HARDWARE—1.4% | | | | | |
3D Systems Corp. * | | 189,750 | | 8,254,125 | |
Silicon Graphics International Corp. * | | 740,600 | | 5,717,432 | |
| | | | 13,971,557 | |
CONSTRUCTION & FARM MACHINERY & HEAVY TRUCKS—1.1% | | | | | |
Lindsay Corp. | | 146,250 | | 11,169,113 | |
| | | | | |
DATA PROCESSING & OUTSOURCED SERVICES—1.2% | | | | | |
WEX, Inc.* | | 158,035 | | 11,659,822 | |
| | | | | |
DIVERSIFIED METALS & MINING—0.4% | | | | | |
Globe Specialty Metals, Inc. | | 236,350 | | 3,552,341 | |
| | | | | |
ELECTRIC UTILITIES—1.3% | | | | | |
ITC Holdings Corp. | | 160,235 | | 12,757,911 | |
| | | | | |
ELECTRONIC COMPONENTS—0.4% | | | | | |
Universal Display Corp.* | | 115,800 | | 3,795,924 | |
| | | | | |
ELECTRONIC EQUIPMENT MANUFACTURERS—1.1% | | | | | |
Cognex Corp. | | 298,300 | | 10,876,018 | |
| | | | | |
ENVIRONMENTAL & FACILITIES SERVICES—1.8% | | | | | |
Clean Harbors, Inc. * | | 104,800 | | 6,115,080 | |
Tetra Tech, Inc. * | | 446,600 | | 11,584,804 | |
| | | | 17,699,884 | |
FOOD DISTRIBUTORS—1.0% | | | | | |
United Natural Foods, Inc.* | | 191,004 | | 10,169,053 | |
| | | | | |
FOOD RETAIL—0.7% | | | | | |
Fresh Market, Inc., /The* | | 120,950 | | 6,859,075 | |
| | | | | |
FOOTWEAR—0.7% | | | | | |
Wolverine World Wide, Inc. | | 153,400 | | 6,422,858 | |
| | | | | |
HEALTH CARE EQUIPMENT—3.6% | | | | | |
Insulet Corp. * | | 445,750 | | 9,454,357 | |
NxStage Medical, Inc. * | | 452,550 | | 5,068,560 | |
Thoratec Corp. * | | 164,200 | | 5,861,940 | |
Volcano Corp. * | | 290,600 | | 8,316,972 | |
Wright Medical Group, Inc. * | | 334,171 | | 6,790,355 | |
| | | | 35,492,184 | |
HEALTH CARE FACILITIES—1.6% | | | | | |
Healthsouth Corp. * | | 411,550 | | 9,107,602 | |
Tenet Healthcare Corporation * | | 279,050 | | 6,585,580 | |
| | | | 15,693,182 | |
HEALTH CARE SERVICES—1.9% | | | | | |
Accretive Health, Inc. * | | 576,050 | | 6,791,630 | |
HMS Holdings Corp. * | | 233,900 | | 5,400,751 | |
| | | | | | |
36
| | SHARES | | VALUE | |
COMMON STOCKS—(CONT.) | | | | | |
HEALTH CARE SERVICES—(CONT.) | | | | | |
Team Health Holdings, Inc. * | | 249,600 | | $ | 6,641,856 | |
| | | | 18,834,237 | |
HEALTH CARE SUPPLIES—1.3% | | | | | |
Align Technology, Inc. * | | 224,800 | | 5,975,184 | |
Endologix, Inc. * | | 501,300 | | 6,747,498 | |
| | | | 12,722,682 | |
HEALTH CARE TECHNOLOGY—0.6% | | | | | |
Greenway Medical Technologies* | | 328,650 | | 5,452,304 | |
| | | | | |
HOME FURNISHINGS—0.5% | | | | | |
Ethan Allen Interiors, Inc. | | 181,650 | | 5,342,327 | |
| | | | | |
HOMEFURNISHING RETAIL—1.2% | | | | | |
Pier 1 Imports, Inc. | | 553,000 | | 11,281,200 | |
| | | | | |
HOTELS RESORTS & CRUISE LINES—2.7% | | | | | |
Interval Leisure Group | | 326,916 | | 6,231,019 | |
Marriott Vacations Worldwide Corp. * | | 279,900 | | 11,011,265 | |
Ryman Hospitality Properties * | | 223,950 | | 8,736,290 | |
| | | | 25,978,574 | |
HUMAN RESOURCE & EMPLOYMENT SERVICES—0.7% | | | | | |
On Assignment, Inc.* | | 333,750 | | 6,367,950 | |
| | | | | |
INDUSTRIAL MACHINERY—3.1% | | | | | |
Actuant Corp., Cl. A | | 410,860 | | 11,602,686 | |
Barnes Group, Inc. | | 294,450 | | 6,737,016 | |
RBC Bearings, Inc. * | | 251,700 | | 12,499,421 | |
| | | | 30,839,123 | |
INTERNET RETAIL—0.3% | | | | | |
Kayak Software Corp.* | | 99,550 | | 3,298,092 | |
| | | | | |
INTERNET SOFTWARE & SERVICES—4.7% | | | | | |
comScore, Inc. * | | 579,500 | | 8,211,515 | |
Cornerstone OnDemand, Inc. * | | 364,950 | | 10,214,951 | |
DealerTrack Holdings, Inc. * | | 379,900 | | 10,382,666 | |
ExactTarget, Inc. * | | 414,100 | | 9,656,812 | |
OpenTable, Inc. * | | 164,100 | | 7,707,777 | |
| | | | 46,173,721 | |
IT CONSULTING & OTHER SERVICES—0.8% | | | | | |
InterXion Holding NV* | | 381,200 | | 8,146,244 | |
| | | | | |
LEISURE FACILITIES—2.0% | | | | | |
Life Time Fitness, Inc. * | | 192,645 | | 8,647,834 | |
Six Flags Entertainment Corp. | | 197,000 | | 11,250,670 | |
| | | | 19,898,504 | |
LEISURE PRODUCTS—2.5% | | | | | |
Brunswick Corp. | | 387,650 | | 9,144,664 | |
Fifth & Pacific Cos, Inc. * | | 734,200 | | 8,061,516 | |
Warnaco Group, Inc., /The * | | 105,550 | | 7,449,719 | |
| | | | 24,655,899 | |
| | | | | | |
37
| | SHARES | | VALUE | |
COMMON STOCKS—(CONT.) | | | | | |
LIFE SCIENCES TOOLS & SERVICES—1.2% | | | | | |
Bruker Corp. * | | 529,900 | | $ | 6,406,491 | |
PAREXEL International Corp. * | | 179,542 | | 5,510,144 | |
| | | | 11,916,635 | |
MANAGED HEALTH CARE—0.4% | | | | | |
WellCare Health Plans, Inc.* | | 90,600 | | 4,312,560 | |
| | | | | |
METAL & GLASS CONTAINERS—1.0% | | | | | |
Silgan Holdings, Inc. | | 223,400 | | 9,675,454 | |
| | | | | |
MOVIES & ENTERTAINMENT—0.9% | | | | | |
Lions Gate Entertainment Corp.* | | 523,500 | | 8,731,980 | |
| | | | | |
OIL & GAS EQUIPMENT & SERVICES—1.3% | | | | | |
Dril-Quip, Inc. * | | 97,720 | | 6,768,087 | |
Hornbeck Offshore Services, Inc. * | | 165,050 | | 5,717,332 | |
| | | | 12,485,419 | |
OIL & GAS EXPLORATION & PRODUCTION—4.0% | | | | | |
Approach Resources, Inc. * | | 144,450 | | 3,557,804 | |
Berry Petroleum Co. | | 221,790 | | 8,541,133 | |
Energy XXI Bermuda Ltd. | | 259,000 | | 8,572,900 | |
Kodiak Oil & Gas Corp. * | | 480,350 | | 4,438,434 | |
Nothern Oil and Gas, Inc. * | | 285,450 | | 4,327,422 | |
Rosetta Resources, Inc. * | | 217,950 | | 10,034,418 | |
| | | | 39,472,111 | |
PACKAGED FOODS & MEATS—2.0% | | | | | |
B&G Foods, Inc. | | 283,350 | | 8,577,005 | |
Hain Celestial Group, Inc. * | | 179,567 | | 10,378,972 | |
| | | | 18,955,977 | |
PHARMACEUTICALS—1.4% | | | | | |
Questcor Pharmaceuticals, Inc. | | 173,000 | | 4,408,040 | |
ViroPharma, Inc. * | | 154,300 | | 3,896,075 | |
Vivus, Inc. * | | 332,850 | | 4,959,465 | |
| | | | 13,263,580 | |
PRECIOUS METALS & MINERALS—0.4% | | | | | |
Hecla Mining Co. | | 629,900 | | 4,144,742 | |
| | | | | |
RAILROADS—1.3% | | | | | |
Genesee & Wyoming, Inc., Cl. A* | | 170,250 | | 12,338,018 | |
| | | | | |
REAL ESTATE SERVICES—0.7% | | | | | |
Jones Lang LaSalle, Inc. | | 89,900 | | 6,988,826 | |
| | | | | |
REGIONAL BANKS—1.5% | | | | | |
SVB Financial Group * | | 82,100 | | 4,646,039 | |
Texas Capital Bancshares, Inc. * | | 208,650 | | 9,904,616 | |
| | | | 14,550,655 | |
RESEARCH & CONSULTING SERVICES—0.9% | | | | | |
CoStar Group, Inc.* | | 109,405 | | 9,069,675 | |
| | | | | |
RESTAURANTS—1.7% | | | | | |
Cheesecake Factory, Inc., /The | | 204,400 | | 6,757,464 | |
| | | | | | |
38
| | SHARES | | VALUE | |
COMMON STOCKS—(CONT.) | | | | | |
RESTAURANTS—(CONT.) | | | | | |
Domino’s Pizza, Inc. | | 233,000 | | $ | 9,464,460 | |
| | | | 16,221,924 | |
SEMICONDUCTORS—2.9% | | | | | |
Applied Micro Circuits Corporation * | | 538,050 | | 3,120,690 | |
Cavium Networks, Inc. * | | 209,000 | | 6,934,620 | |
Cypress Semiconductor Corp. | | 476,050 | | 4,717,656 | |
Freescale Semiconductor Holdings Ltd. * | | 551,700 | | 4,932,198 | |
Microsemi Corp. * | | 468,000 | | 8,985,600 | |
| | | | 28,690,764 | |
SPECIALIZED CONSUMER SERVICES—0.4% | | | | | |
Sotheby’s | | 135,050 | | 4,204,107 | |
| | | | | |
SPECIALTY CHEMICALS—2.9% | | | | | |
Cytec Industries, Inc. | | 116,650 | | 8,027,853 | |
PolyOne Corp. | | 666,250 | | 12,612,112 | |
Rockwood Holdings, Inc. | | 174,350 | | 8,002,665 | |
| | | | 28,642,630 | |
SPECIALTY STORES—2.0% | | | | | |
Five Below, Inc. * | | 258,050 | | 8,551,777 | |
Vitamin Shoppe, Inc. * | | 198,700 | | 11,373,588 | |
| | | | 19,925,365 | |
SYSTEMS SOFTWARE—1.7% | | | | | |
CommVault Systems, Inc. * | | 214,950 | | 13,427,926 | |
Sourcefire, Inc. * | | 84,250 | | 3,605,058 | |
| | | | 17,032,984 | |
THRIFTS & MORTGAGE FINANCE—0.6% | | | | | |
Northwest Bancshares, Inc. | | 500,850 | | 5,960,115 | |
| | | | | |
TRADING COMPANIES & DISTRIBUTORS—2.2% | | | | | |
Beacon Roofing Supply, Inc. * | | 161,050 | | 5,208,357 | |
United Rentals, Inc. * | | 225,100 | | 9,152,565 | |
Watsco, Inc. | | 102,148 | | 6,981,816 | |
| | | | 21,342,738 | |
TRUCKING—0.7% | | | | | |
Avis Budget Group, Inc.* | | 400,800 | | 6,625,224 | |
| | | | | |
TOTAL COMMON STOCKS
(Cost $799,788,988) | | | | 914,296,236 | |
| | | | | |
MASTER LIMITED PARTNERSHIP —0.6% | | | | | |
ASSET MANAGEMENT & CUSTODY BANKS—0.6% | | | | | |
Fortress Investment Group LLC, Cl. A | | 1,460,712 | | 6,310,276 | |
| | | | | |
TOTAL MASTER LIMITED PARTNERSHIP
(Cost $7,647,188) | | | | 6,310,276 | |
| | | | | |
REAL ESTATE INVESTMENT TRUST—4.9% | | | | | |
MORTGAGE—2.1% | | | | | |
American Capital Mortgage Investment Corp. | | 240,850 | | 6,004,391 | |
Capstead Mortgage Corp. | | 315,400 | | 3,885,728 | |
| | | | | | |
39
| | SHARES | | VALUE | |
REAL ESTATE INVESTMENT TRUST—(CONT.) | | | | | |
Two Harbors Investment Corp. | | 890,200 | | $ | 10,620,085 | |
| | | | 20,510,204 | |
RESIDENTIAL—1.2% | | | | | |
American Campus Communities, Inc. | | 181,200 | | 8,210,172 | |
Home Properties, Inc. | | 51,300 | | 3,118,527 | |
| | | | 11,328,699 | |
SPECIALIZED—1.6% | | | | | |
Extra Space Storage, Inc. | | 252,550 | | 8,710,450 | |
LaSalle Hotel Properties | | 300,850 | | 7,202,349 | |
| | | | 15,912,799 | |
TOTAL REAL ESTATE INVESTMENT TRUST
(Cost $44,519,296) | | | | 47,751,702 | |
| | | | | |
Total Investments
(Cost $851,955,472)(a) | | 99 .1 | % | 968,358,214 | |
Other Assets in Excess of Liabilities | | 0 .9 | | 8,385,936 | |
| | | | | |
NET ASSETS | | 100.0 | % | $ | 976,744,150 | |
‡ | Securities classified as Level 1 for ASC 820 disclosure purposes based on valuation inputs unless otherwise noted. |
| |
* | Non-income producing security. |
# | American Depositary Receipts. |
(a) | At October 31, 2012, the net unrealized appreciation on investments, based on cost for federal income tax purposes of $857,741,285, amounted to $110,616,929 which consisted of aggregate gross unrealized appreciation of $165,505,136 and aggregate gross unrealized depreciation of $54,888,208. |
Industry classifications are unaudited.
See Notes to Financial Statements.
40
(This page has been intentionally left blank)
41
THE ALGER INSTITUTIONAL FUNDS
Statements of Assets and Liabilities October 31, 2012
| | Alger Capital
Appreciation
Institutional Fund | | Alger Large Cap
Growth
Institutional Fund | |
ASSETS: | | | | | |
Investments in securities, at value (identified cost*) see accompanying schedules of investments | | $ | 1,733,664,675 | | $ | 18,712,560 | |
Cash and cash equivalents# | | 54,546,121 | | 1,198,694 | |
Receivable for investment securities sold | | 47,844,442 | | 46,348 | |
Receivable for shares of beneficial interest sold | | 4,855,773 | | 29,589 | |
Dividends and interest receivable | | 2,090,894 | | 31,039 | |
Prepaid expenses | | 34,237 | | 23,980 | |
Total Assets | | 1,843,036,142 | | 20,042,210 | |
LIABILITIES: | | | | | |
Payable for investment securities purchased | | 15,867,624 | | 722,365 | |
Payable for shares of beneficial interest redeemed | | 6,946,726 | | 34,912 | |
Payable for interfund loans | | — | | — | |
Accrued investment advisory fees | | 1,352,534 | | 12,681 | |
Accrued transfer agent fees | | 372,635 | | 18,175 | |
Accrued distribution fees | | 159,579 | | 1,912 | |
Accrued administrative fees | | 45,919 | | 491 | |
Accrued shareholder servicing fees | | 434,147 | | 4,644 | |
Accrued other expenses | | 145,026 | | 39,388 | |
Total Liabilities | | 25,324,190 | | 834,568 | |
NET ASSETS | | $ | 1,817,711,952 | | $ | 19,207,642 | |
Net Assets Consist of: | | | | | |
Paid in capital (par value of $.001 per share) | | 1,596,270,519 | | 26,944,353 | |
Undistributed net investment income (accumulated loss) | | 4,311,055 | | (83,245 | ) |
Undistributed net realized gain (accumulated realized loss) | | 38,489,659 | | (8,908,376 | ) |
Net unrealized appreciation on investments | | 178,640,719 | | 1,254,910 | |
NET ASSETS | | $ | 1,817,711,952 | | $ | 19,207,642 | |
Net Assets By Class | | | | | |
Class I | | $ | 1,470,077,865 | | $ | 15,100,391 | |
Class R | | $ | 347,634,087 | | $ | 4,107,251 | |
Shares Of Beneficial Interest Outstanding—Note 6 | | | | | |
Class I | | 64,331,943 | | 1,039,023 | |
Class R | | 15,978,399 | | 294,703 | |
Net Asset Value Per Share | | | | | |
Class I | | $ | 22.85 | | $ | 14.53 | |
Class R | | $ | 21.76 | | $ | 13.94 | |
*Identified cost | | $ | 1,555,023,956 | | $ | 17,457,650 | |
**Written options premiums received | | $ | — | | $ | — | |
See Notes to Financial Statements.
42
| | Alger Mid Cap
Growth
Institutional Fund | | Alger Small Cap
Growth
Institutional Fund | |
ASSETS: | | | | | |
Investments in securities, at value (identified cost*) see accompanying schedules of investments | | $ | 206,263,638 | | $ | 968,358,214 | |
Cash and cash equivalents# | | 4,134,459 | | 9,797,202 | |
Receivable for investment securities sold | | 14,848,775 | | 2,852,931 | |
Receivable for shares of beneficial interest sold | | 224,488 | | 1,867,099 | |
Dividends and interest receivable | | 61,825 | | 134,884 | |
Prepaid expenses | | 18,015 | | 36,853 | |
Total Assets | | 225,551,200 | | 983,047,183 | |
LIABILITIES: | | | | | |
Payable for investment securities purchased | | 13,237,205 | | — | |
Written options outstanding** | | 418,791 | | — | |
Payable for shares of beneficial interest redeemed | | 1,429,374 | | 4,754,694 | |
Payable for interfund loans | | 610,000 | | — | |
Bank overdraft (#) | | 632,408 | | — | |
Accrued investment advisory fees | | 158,898 | | 738,638 | |
Accrued transfer agent fees | | 161,936 | | 354,407 | |
Accrued distribution fees | | 12,442 | | 22,355 | |
Accrued administrative fees | | 5,750 | | 25,077 | |
Accrued shareholder servicing fees | | 54,360 | | 237,093 | |
Dividends payable | | 6,391 | | — | |
Accrued other expenses | | 75,909 | | 170,769 | |
Total Liabilities | | 16,803,464 | | 6,303,033 | |
NET ASSETS | | $ | 208,747,736 | | $ | 976,744,150 | |
Net Assets Consist of: | | | | | |
Paid in capital (par value of $.001 per share) | | 565,890,021 | | 764,352,162 | |
Undistributed net investment income (accumulated loss) | | 418,939 | | (4,854,341 | ) |
Undistributed net realized gain (accumulated realized loss) | | (351,983,297 | ) | 100,843,587 | |
Net unrealized appreciation (depreciation) on investments | | (5,577,927 | ) | 116,402,742 | |
NET ASSETS | | $ | 208,747,736 | | $ | 976,744,150 | |
Net Assets By Class | | | | | |
Class I | | $ | 182,086,816 | | $ | 929,237,572 | |
Class R | | $ | 26,660,920 | | $ | 47,506,578 | |
Shares Of Beneficial Interest Outstanding—Note 6 | | | | | |
Class I | | 12,480,549 | | 33,000,249 | |
Class R | | 1,931,056 | | 1,769,556 | |
Net Asset Value Per Share | | | | | |
Class I | | $ | 14.59 | | $ | 28.16 | |
Class R | | $ | 13.81 | | $ | 26.85 | |
*Identified cost | | $ | 211,880,042 | | $ | 851,955,472 | |
**Written options premiums received | | $ | 457,268 | | $ | — | |
# Alger Mid Cap Growth Institutional Fund includes cash of $4,134,459 held as collateral for written options.
See Notes to Financial Statements.
43
THE ALGER INSTITUTIONAL FUNDS
Statements of Operations
For the year ended October 31, 2012
| | Alger Capital
Appreciation
Institutional Fund | | Alger Large Cap
Growth
Institutional Fund | |
INCOME | | | | | |
Dividends (net of foreign withholding taxes*) | | $ | 25,208,931 | | $ | 334,604 | |
Interest | | 87,612 | | 398 | |
Total Income | | 25,296,543 | | 335,002 | |
EXPENSES | | | | | |
Advisory fees—Note 3(a) | | 12,783,703 | | 147,436 | |
Distribution fees—Note3(b): | | | | | |
Class R | | 1,504,297 | | 24,044 | |
Shareholder servicing fees—Note 3(e) | | 4,103,411 | | 53,991 | |
Administrative fees—Note 3(a) | | 434,015 | | 5,711 | |
Custodian fees | | 115,512 | | 20,570 | |
Interest expenses | | — | | 59 | |
Transfer agent fees and expenses—Note 3(d) | | 686,370 | | 45,550 | |
Printing fees | | 168,667 | | 5,550 | |
Professional fees | | 73,951 | | 28,039 | |
Registration fees | | 92,537 | | 38,612 | |
Trustee fees—Note 3(f) | | 23,491 | | 18,932 | |
Miscellaneous | | 349,750 | | 25,911 | |
Total Expenses | | 20,335,704 | | 414,405 | |
NET INVESTMENT INCOME (LOSS) | | 4,960,839 | | (79,403 | ) |
REALIZED AND UNREALIZED GAIN (LOSS) ON INVESTMENTS, OPTIONS AND FOREIGN CURRENCY | | | | | |
Net realized gain on investments and purchased options | | 64,714,381 | | 832,468 | |
Net realized loss on foreign currency transactions | | (8,823 | ) | (633 | ) |
Net change in unrealized appreciation (depreciation) on investments, options and foreign currency | | 117,513,584 | | 318,357 | |
Net realized and unrealized gain on investments, options and foreign currency | | 182,219,142 | | 1,150,192 | |
NET INCREASE IN NET ASSETS RESULTING FROM OPERATIONS | | $ | 187,179,981 | | $ | 1,070,789 | |
*Foreign withholding taxes | | $ | 204,877 | | $ | 2,825 | |
See Notes to Financial Statements.
44
| | Alger Mid Cap
Growth
Institutional Fund | | Alger Small Cap
Growth
Institutional Fund | |
INCOME | | | | | |
Dividends (net of foreign withholding taxes*) | | $ | 3,654,359 | | $ | 7,696,642 | |
Interest | | 3,983 | | 8,589 | |
Total Income | | 3,658,342 | | 7,705,231 | |
EXPENSES | | | | | |
Advisory fees—Note 3(a) | | 2,221,623 | | 9,107,314 | |
Distribution fees—Note3(b): | | | | | |
Class R | | 155,391 | | 291,007 | |
Shareholder servicing fees—Note 3(e) | | 760,029 | | 2,923,335 | |
Administrative fees—Note 3(a) | | 80,387 | | 309,199 | |
Dividends on securities sold short | | 6,391 | | — | |
Custodian fees | | 76,051 | | 81,520 | |
Interest expenses | | 4,286 | | 3,343 | |
Transfer agent fees and expenses—Note 3(d) | | 255,923 | | 706,335 | |
Printing fees | | 5,068 | | 191,000 | |
Professional fees | | 40,943 | | 57,577 | |
Registration fees | | 52,128 | | 102,843 | |
Trustee fees—Note 3(f) | | 19,654 | | 21,997 | |
Miscellaneous | | 92,693 | | 273,715 | |
Total Expenses | | 3,770,567 | | 14,069,185 | |
NET INVESTMENT LOSS | | (112,225 | ) | (6,363,954 | ) |
REALIZED AND UNREALIZED GAIN (LOSS) ON INVESTMENTS, OPTIONS AND FOREIGN CURRENCY | | | | | |
Net realized gain (loss) on investments and purchased options | | (7,542,595 | ) | 101,643,899 | |
Net realized loss on foreign currency transactions | | (40,876 | ) | — | |
Net realized gain on options written | | 1,844,878 | | — | |
Net change in unrealized appreciation (depreciation) on investments, options and foreign currency | | 29,779,752 | | 6,084,704 | |
Net change in unrealized appreciation (depreciation) on written options | | 150,416 | | — | |
Net realized and unrealized gain on investments, options and foreign currency | | 24,191,575 | | 107,728,603 | |
NET INCREASE IN NET ASSETS RESULTING FROM OPERATIONS | | $ | 24,079,350 | | $ | 101,364,649 | |
*Foreign withholding taxes | | $ | 6,327 | | $ | — | |
See Notes to Financial Statements.
45
THE ALGER INSTITUTIONAL FUNDS
Statements of Changes in Net Assets
| | Alger Capital Appreciation Institutional
Fund | |
| | For the
Year Ended
October 31, 2012 | | For the
Year Ended
October 31, 2011 | |
Net investment income (loss) | | $ | 4,960,839 | | $ | (1,589,518 | ) |
Net realized gain (loss) on investments, options and foreign currency | | 64,705,558 | | 66,785,560 | |
Net change in unrealized appreciation (depreciation) on investments, options and foreign currency | | 117,513,584 | | 14,788,025 | |
Net increase in net assets resulting from operations | | 187,179,981 | | 79,984,067 | |
Dividends and distributions to shareholders from: | | | | | |
Net investment income | | | | | |
Class I | | — | | — | |
Class R | | — | | — | |
Net realized gains | | | | | |
Class I | | (38,935,171 | ) | — | |
Class R | | (8,986,963 | ) | — | |
Total dividends and distributions to shareholders | | (47,922,134 | ) | — | |
Increase (decrease) from shares of beneficial interest transactions: | | | | | |
Class I | | 314,532,855 | | 164,881,101 | |
Class R | | 95,051,832 | | 43,192,466 | |
Net increase (decrease) from shares of beneficial interest transactions—Note 6 | | 409,584,687 | | 208,073,567 | |
Total increase (decrease) | | 548,842,534 | | 288,057,634 | |
Net Assets: | | | | | |
Beginning of period | | 1,268,869,418 | | 980,811,784 | |
END OF PERIOD | | $ | 1,817,711,952 | | $ | 1,268,869,418 | |
Undistributed net investment income (accumulated loss) | | $ | 4,311,055 | | $ | — | |
See Notes to Financial Statements.
46
| | Alger Large Cap Growth Institutional
Fund | | Alger Mid Cap Growth Institutional
Fund | | Alger Small Cap Growth Institutional
Fund | |
| | For the
Year Ended
October 31, 2012 | | For the
Year Ended
October 31, 2011 | | For the
Year Ended
October 31, 2012 | | For the
Year Ended
October 31, 2011 | | For the
Year Ended
October 31, 2012 | | For the
Year Ended
October 31, 2011 | |
Net investment income (loss) | | $ | (79,403 | ) | $ | (108,363 | ) | $ | (112,225 | ) | $ | (4,548,980 | ) | $ | (6,363,954 | ) | $ | (12,258,756 | ) |
Net realized gain (loss) on investments, options and foreign currency | | 831,835 | | 2,144,219 | | (5,738,593 | ) | 134,742,835 | | 101,643,899 | | 127,490,807 | |
Net change in unrealized appreciation (depreciation) on investments, options and foreign currency | | 318,357 | | (251,222 | ) | 29,930,168 | | (65,789,120 | ) | 6,084,704 | | (33,597,608 | ) |
Net increase in net assets resulting from operations | | 1,070,789 | | 1,784,634 | | 24,079,350 | | 64,404,735 | | 101,364,649 | | 81,634,443 | |
Dividends and distributions to shareholders from: | | | | | | | | | | | | | |
Net investment income | | | | | | | | | | | | | |
Class I | | — | | (168,982 | ) | — | | (1,902,006 | ) | — | | — | |
Class R | | — | | (10,503 | ) | — | | — | | — | | — | |
Net realized gains | | | | | | | | | | | | | |
Class I | | — | | — | | — | | — | | (45,919,886 | ) | — | |
Class R | | — | | — | | — | | — | | (2,661,491 | ) | — | |
Total dividends and distributions to shareholders | | — | | (179,485 | ) | — | | (1,902,006 | ) | (48,581,377 | ) | — | |
Increase (decrease) from shares of beneficial interest transactions: | | | | | | | | | | | | | |
Class I | | (1,983,255 | ) | (7,898,934 | ) | (157,521,243 | ) | (479,440,924 | ) | (241,363,028 | ) | (61,833,473 | ) |
Class R | | (1,678,476 | ) | (978,506 | ) | (10,498,008 | ) | (17,489,577 | ) | (16,853,179 | ) | (10,560,397 | ) |
Net increase (decrease) from shares of beneficial interest transactions—Note 6 | | (3,661,731 | ) | (8,877,440 | ) | (168,019,251 | ) | (496,930,501 | ) | (258,216,207 | ) | (72,393,870 | ) |
Total increase (decrease) | | (2,590,942 | ) | (7,272,291 | ) | (143,939,901 | ) | (434,427,772 | ) | (205,432,935 | ) | 9,240,573 | |
Net Assets: | | | | | | | | | | | | | |
Beginning of period | | 21,798,584 | | 29,070,875 | | 352,687,637 | | 787,115,409 | | 1,182,177,085 | | 1,172,936,512 | |
END OF PERIOD | | $ | 19,207,642 | | $ | 21,798,584 | | $ | 208,747,736 | | $ | 352,687,637 | | $ | 976,744,150 | | $ | 1,182,177,085 | |
Undistributed net investment income (accumulated loss) | | $ | (83,245 | ) | $ | 554 | | $ | 418,939 | | $ | (825,574 | ) | $ | (4,854,341 | ) | $ | (134,200 | ) |
See Notes to Financial Statements.
47
THE ALGER INSTITUTIONAL FUNDS
Financial Highlights for a share outstanding throughout the period
Alger Capital Appreciation Institutional Fund
| | Class I | |
| | Year ended
10/31/2012 | | Year ended
10/31/2011 | | Year ended
10/31/2010 | | Year ended
10/31/2009 | | Year ended
10/31/2008 | |
Net asset value, beginning of period | | $ | 20.88 | | $ | 19.28 | | $ | 16.41 | | $ | 13.23 | | $ | 22.27 | |
INCOME FROM INVESTMENT OPERATIONS: | | | | | | | | | | | |
Net investment income (loss)(i) | | 0.09 | | (0.01 | ) | 0.00 | | 0.04 | | (0.04 | ) |
Net realized and unrealized gain (loss) on investments | | 2.64 | | 1.61 | | 2.90 | | 3.14 | | (9.00 | ) |
Total from investment operations | | 2.73 | | 1.60 | | 2.90 | | 3.18 | | (9.04 | ) |
Dividends from net investment income | | — | | — | | (0.03 | ) | — | | — | |
Distributions from net realized gains | | (0.76 | ) | — | | — | | — | | — | |
Net asset value, end of period | | $ | 22.85 | | $ | 20.88 | | $ | 19.28 | | $ | 16.41 | | $ | 13.23 | |
Total return | | 13.7 | % | 8.3 | % | 17.7 | % | 23.9 | % | (40.6 | )% |
RATIOS/SUPPLEMENTAL DATA: | | | | | | | | | | | |
Net assets, end of period (000’s omitted) | | $ | 1,470,078 | | $ | 1,041,609 | | $ | 809,468 | | $ | 632,250 | | $ | 411,056 | |
Ratio of gross expenses to average net assets | | 1.19 | % | 1.17 | % | 1.17 | % | 1.21 | % | 1.18 | % |
Ratio of expense reimbursements to average net assets | | 0.00 | % | 0.00 | % | 0.00 | % | 0.00 | % | 0.00 | % |
Ratio of net expenses to average net assets | | 1.19 | % | 1.17 | % | 1.17 | % | 1.21 | % | 1.18 | % |
Ratio of net investment income (loss) to average net assets | | 0.41 | % | (0.04 | )% | (0.02 | )% | 0.32 | % | (0.21 | )% |
Portfolio turnover rate | | 137.16 | % | 153.30 | % | 209.52 | % | 306.87 | % | 291.85 | % |
(i) Amount was computed based on average shares outstanding during the period.
See Notes to Financial Statements.
48
| | Class R | |
| | Year ended
10/31/2012 | | Year ended
10/31/2011 | | Year ended
10/31/2010 | | Year ended
10/31/2009 | | Year ended
10/31/2008 | |
Net asset value, beginning of period | | $ | 20.01 | | $ | 18.57 | | $ | 15.86 | | $ | 12.85 | | $ | 21.75 | |
INCOME FROM INVESTMENT OPERATIONS: | | | | | | | | | | | |
Net investment loss(i) | | (0.02 | ) | (0.11 | ) | (0.10 | ) | (0.02 | ) | (0.13 | ) |
Net realized and unrealized gain (loss) on investments | | 2.53 | | 1.55 | | 2.81 | | 3.03 | | (8.77 | ) |
Total from investment operations | | 2.51 | | 1.44 | | 2.71 | | 3.01 | | (8.90 | ) |
Distributions from net realized gains | | (0.76 | ) | — | | — | | — | | — | |
Net asset value, end of period | | $ | 21.76 | | $ | 20.01 | | $ | 18.57 | | $ | 15.86 | | $ | 12.85 | |
Total return | | 13.2 | % | 7.8 | % | 17.1 | % | 23.3 | % | (40.9 | )% |
RATIOS/SUPPLEMENTAL DATA: | | | | | | | | | | | |
Net assets, end of period (000’s omitted) | | $ | 347,634 | | $ | 227,260 | | $ | 171,344 | | $ | 89,676 | | $ | 53,557 | |
Ratio of gross expenses to average net assets | | 1.69 | % | 1.68 | % | 1.67 | % | 1.71 | % | 1.68 | % |
Ratio of expense reimbursements to average net assets | | 0.00 | % | 0.00 | % | 0.00 | % | 0.00 | % | 0.00 | % |
Ratio of net expenses to average net assets | | 1.69 | % | 1.68 | % | 1.67 | % | 1.71 | % | 1.68 | % |
Ratio of net investment income (loss) to average net assets | | (0.09 | )% | (0.56 | )% | (0.55 | )% | (0.18 | )% | (0.70 | )% |
Portfolio turnover rate | | 137.16 | % | 153.30 | % | 209.52 | % | 306.87 | % | 291.85 | % |
(i) Amount was computed based on average shares outstanding during the period.
See Notes to Financial Statements.
49
THE ALGER INSTITUTIONAL FUNDS
Financial Highlights for a share outstanding throughout the period
Alger Large Cap Growth Institutional Fund
| | Class I | |
| | Year ended
10/31/2012 | | Year ended
10/31/2011 | | Year ended
10/31/2010 | | Year ended
10/31/2009 | | Year ended
10/31/2008 | |
Net asset value, beginning of period | | $ | 13.75 | | $ | 13.03 | | $ | 11.17 | | $ | 9.48 | | $ | 16.87 | |
INCOME FROM INVESTMENT OPERATIONS: | | | | | | | | | | | |
Net investment income (loss)(i) | | (0.03 | ) | (0.04 | ) | 0.07 | | 0.04 | | (0.01 | ) |
Net realized and unrealized gain (loss) on investments | | 0.81 | | 0.86 | | 1.83 | | 1.65 | | (7.38 | ) |
Total from investment operations | | 0.78 | | 0.82 | | 1.90 | | 1.69 | | (7.39 | ) |
Dividends from net investment income | | — | | (0.10 | ) | (0.04 | ) | — | | — | |
Net asset value, end of period | | $ | 14.53 | | $ | 13.75 | | $ | 13.03 | | $ | 11.17 | | $ | 9.48 | |
Total return | | 5.7 | % | 6.3 | % | 17.1 | % | 17.7 | % | (43.8 | )% |
RATIOS/SUPPLEMENTAL DATA: | | | | | | | | | | | |
Net assets, end of period (000’s omitted) | | $ | 15,101 | | $ | 16,294 | | $ | 22,961 | | $ | 39,412 | | $ | 20,415 | |
Ratio of gross expenses to average net assets | | 1.83 | % | 1.69 | % | 1.36 | % | 1.37 | % | 1.23 | % |
Ratio of expense reimbursements to average net assets | | 0.00 | % | 0.00 | % | 0.00 | % | 0.00 | % | 0.00 | % |
Ratio of net expenses to average net assets | | 1.83 | % | 1.69 | % | 1.36 | % | 1.37 | % | 1.23 | % |
Ratio of net investment income (loss) to average net assets | | (0.22 | )% | (0.27 | )% | 0.56 | % | 0.46 | % | 0.04 | % |
Portfolio turnover rate | | 153.72 | % | 57.74 | % | 58.73 | % | 87.57 | % | 187.80 | % |
(i) Amount was computed based on average shares outstanding during the period.
See Notes to Financial Statements.
50
| | Class R | |
| | Year ended
10/31/2012 | | Year ended
10/31/2011 | | Year ended
10/31/2010 | | Year ended
10/31/2009 | | Year ended
10/31/2008 | |
Net asset value, beginning of period | | $ | 13.28 | | $ | 12.59 | | $ | 10.83 | | $ | 9.24 | | $ | 16.52 | |
INCOME FROM INVESTMENT OPERATIONS: | | | | | | | | | | | |
Net investment loss(i) | | (0.13 | ) | (0.13 | ) | (0.02 | ) | 0.00 | | (0.08 | ) |
Net realized and unrealized gain (loss) on investments | | 0.79 | | 0.84 | | 1.78 | | 1.59 | | (7.20 | ) |
Total from investment operations | | 0.66 | | 0.71 | | 1.76 | | 1.59 | | (7.28 | ) |
Dividends from net investment income | | — | | (0.02 | ) | — | | — | | — | |
Net asset value, end of period | | $ | 13.94 | | $ | 13.28 | | $ | 12.59 | | $ | 10.83 | | $ | 9.24 | |
Total return | | 5.0 | % | 5.7 | % | 16.3 | % | 17.2 | % | (44.1 | )% |
RATIOS/SUPPLEMENTAL DATA: | | | | | | | | | | | |
Net assets, end of period (000’s omitted) | | $ | 4,107 | | $ | 5,505 | | $ | 6,110 | | $ | 5,933 | | $ | 5,112 | |
Ratio of gross expenses to average net assets | | 2.53 | % | 2.40 | % | 2.05 | % | 1.89 | % | 1.73 | % |
Ratio of expense reimbursements to average net assets | | 0.00 | % | 0.00 | % | 0.00 | % | 0.00 | % | 0.00 | % |
Ratio of net expenses to average net assets | | 2.53 | % | 2.40 | % | 2.05 | % | 1.89 | % | 1.73 | % |
Ratio of net investment income (loss) to average net assets | | (0.91 | )% | (0.99 | )% | (0.16 | )% | (0.03 | )% | (0.55 | )% |
Portfolio turnover rate | | 153.72 | % | 57.74 | % | 58.73 | % | 87.57 | % | 187.80 | % |
(i) Amount was computed based on average shares outstanding during the period.
See Notes to Financial Statements.
51
THE ALGER INSTITUTIONAL FUNDS
Financial Highlights for a share outstanding throughout the period
Alger Mid Cap Growth Institutional Fund
| | Class I | |
| | Year ended
10/31/2012 | | Year ended
10/31/2011 | | Year ended
10/31/2010 | | Year ended
10/31/2009 | | Year ended
10/31/2008 | |
Net asset value, beginning of period | | $ | 13.50 | | $ | 13.11 | | $ | 10.68 | | $ | 8.76 | | $ | 23.24 | |
INCOME FROM INVESTMENT OPERATIONS: | | | | | | | | | | | |
Net investment income (loss)(i) | | 0.00 | | (0.10 | ) | 0.01 | | (0.04 | ) | (0.09 | ) |
Net realized and unrealized gain (loss) on investments | | 1.09 | | 0.52 | | 2.42 | | 1.96 | | (10.85 | ) |
Total from investment operations | | 1.09 | | 0.42 | | 2.43 | | 1.92 | | (10.94 | ) |
Dividends from net investment income | | — | | (0.03 | ) | — | | — | | — | |
Distributions from net realized gains | | — | | — | | — | | — | | (3.54 | ) |
Net asset value, end of period | | $ | 14.59 | | $ | 13.50 | | $ | 13.11 | | $ | 10.68 | | $ | 8.76 | |
Total return | | 8.1 | % | 3.3 | % | 22.8 | % | 21.8 | % | (55.0 | )% |
RATIOS/SUPPLEMENTAL DATA: | | | | | | | | | | | |
Net assets, end of period (000’s omitted) | | $ | 182,087 | | $ | 317,893 | | $ | 737,099 | | $ | 872,936 | | $ | 882,046 | |
Ratio of gross expenses to average net assets | | 1.23 | % | 1.18 | % | 1.12 | % | 1.17 | % | 1.11 | % |
Ratio of expense reimbursements to average net assets | | 0.00 | % | 0.00 | % | 0.00 | % | 0.00 | % | 0.00 | % |
Ratio of net expenses to average net assets | | 1.23 | % | 1.18 | % | 1.12 | % | 1.17 | % | 1.11 | % |
Ratio of net investment income (loss) to average net assets | | 0.02 | % | (0.69 | )% | 0.07 | % | (0.44 | )% | (0.56 | )% |
Portfolio turnover rate | | 232.99 | % | 233.50 | % | 193.69 | % | 297.99 | % | 324.49 | % |
(i) Amount was computed based on average shares outstanding during the period.
See Notes to Financial Statements.
52
| | Class R | |
| | Year ended
10/31/2012 | | Year ended
10/31/2011 | | Year ended
10/31/2010 | | Year ended
10/31/2009 | | Year ended
10/31/2008 | |
Net asset value, beginning of period | | $ | 12.85 | | $ | 12.51 | | $ | 10.24 | | $ | 8.45 | | $ | 22.64 | |
INCOME FROM INVESTMENT OPERATIONS: | | | | | | | | | | | |
Net investment loss(i) | | (0.07 | ) | (0.17 | ) | (0.05 | ) | (0.08 | ) | (0.16 | ) |
Net realized and unrealized gain (loss) on investments | | 1.03 | | 0.51 | | 2.32 | | 1.87 | | (10.49 | ) |
Total from investment operations | | 0.96 | | 0.34 | | 2.27 | | 1.79 | | (10.65 | ) |
Distributions from net realized gains | | — | | — | | — | | — | | (3.54 | ) |
Net asset value, end of period | | $ | 13.81 | | $ | 12.85 | | $ | 12.51 | | $ | 10.24 | | $ | 8.45 | |
Total return | | 7.5 | % | 2.7 | % | 22.2 | % | 21.0 | % | (55.3 | )% |
RATIOS/SUPPLEMENTAL DATA: | | | | | | | | | | | |
Net assets, end of period (000’s omitted) | | $ | 26,661 | | $ | 34,795 | | $ | 50,016 | | $ | 50,919 | | $ | 40,374 | |
Ratio of gross expenses to average net assets | | 1.76 | % | 1.74 | % | 1.65 | % | 1.68 | % | 1.61 | % |
Ratio of expense reimbursements to average net assets | | 0.00 | % | 0.00 | % | 0.00 | % | 0.00 | % | 0.00 | % |
Ratio of net expenses to average net assets | | 1.76 | % | 1.74 | % | 1.65 | % | 1.68 | % | 1.61 | % |
Ratio of net investment income (loss) to average net assets | | (0.50 | )% | (1.24 | )% | (0.46 | )% | (0.96 | )% | (1.05 | )% |
Portfolio turnover rate | | 232.99 | % | 233.50 | % | 193.69 | % | 297.99 | % | 324.49 | % |
(i) Amount was computed based on average shares outstanding during the period.
See Notes to Financial Statements.
53
THE ALGER INSTITUTIONAL FUNDS
Financial Highlights for a share outstanding throughout the period
Alger Small Cap Growth Institutional Fund
| | Class I | |
| | Year ended
10/31/2012 | | Year ended
10/31/2011 | | Year ended
10/31/2010 | | Year ended
10/31/2009 | | Year ended
10/31/2008 | |
Net asset value, beginning of period | | $ | 26.99 | | $ | 25.28 | | $ | 19.90 | | $ | 16.52 | | $ | 30.30 | |
INCOME FROM INVESTMENT OPERATIONS: | | | | | | | | | | | |
Net investment loss(i) | | (0.15 | ) | (0.26 | ) | (0.22 | ) | (0.16 | ) | (0.23 | ) |
Net realized and unrealized gain (loss) on investments | | 2.45 | | 1.97 | | 5.60 | | 3.54 | | (13.55 | ) |
Total from investment operations | | 2.30 | | 1.71 | | 5.38 | | 3.38 | | (13.78 | ) |
Distributions from net realized gains | | (1.13 | ) | — | | — | | — | | — | |
Net asset value, end of period | | $ | 28.16 | | $ | 26.99 | | $ | 25.28 | | $ | 19.90 | | $ | 16.52 | |
Total return | | 8.9 | % | 6.8 | % | 27.0 | % | 20.5 | % | (45.5 | )% |
RATIOS/SUPPLEMENTAL DATA: | | | | | | | | | | | |
Net assets, end of period (000’s omitted) | | $ | 929,237 | | $ | 1,119,966 | | $ | 1,104,866 | | $ | 968,776 | | $ | 634,542 | |
Ratio of gross expenses to average net assets | | 1.23 | % | 1.18 | % | 1.23 | % | 1.32 | % | 1.27 | % |
Ratio of expense reimbursements to average net assets | | 0.00 | % | 0.00 | % | 0.00 | % | 0.00 | % | 0.00 | % |
Ratio of net expenses to average net assets | | 1.23 | % | 1.18 | % | 1.23 | % | 1.32 | % | 1.27 | % |
Ratio of net investment income (loss) to average net assets | | (0.54 | )% | (0.94 | )% | (0.94 | )% | (0.94 | )% | (0.97 | )% |
Portfolio turnover rate | | 72.43 | % | 70.57 | % | 61.40 | % | 90.49 | % | 62.68 | % |
(i) Amount was computed based on average shares outstanding during the period.
See Notes to Financial Statements.
54
| | Class R | |
| | Year ended
10/31/2012 | | Year ended
10/31/2011 | | Year ended
10/31/2010 | | Year ended
10/31/2009 | | Year ended
10/31/2008 | |
Net asset value, beginning of period | | $ | 25.91 | | $ | 24.39 | | $ | 19.30 | | $ | 16.08 | | $ | 29.64 | |
INCOME FROM INVESTMENT OPERATIONS: | | | | | | | | | | | |
Net investment loss(i) | | (0.28 | ) | (0.40 | ) | (0.31 | ) | (0.22 | ) | (0.35 | ) |
Net realized and unrealized gain (loss) on investments | | 2.35 | | 1.92 | | 5.40 | | 3.44 | | (13.21 | ) |
Total from investment operations | | 2.07 | | 1.52 | | 5.09 | | 3.22 | | (13.56 | ) |
Distributions from net realized gains | | (1.13 | ) | — | | — | | — | | — | |
Net asset value, end of period | | $ | 26.85 | | $ | 25.91 | | $ | 24.39 | | $ | 19.30 | | $ | 16.08 | |
Total return | | 8.4 | % | 6.2 | % | 26.4 | % | 20.1 | % | (45.8 | )% |
RATIOS/SUPPLEMENTAL DATA: | | | | | | | | | | | |
Net assets, end of period (000’s omitted) | | $ | 47,507 | | $ | 62,211 | | $ | 68,071 | | $ | 51,707 | | $ | 39,033 | |
Ratio of gross expenses to average net assets | | 1.73 | % | 1.71 | % | 1.69 | % | 1.73 | % | 1.77 | % |
Ratio of expense reimbursements to average net assets | | 0.00 | % | 0.00 | % | 0.00 | % | 0.00 | % | 0.00 | % |
Ratio of net expenses to average net assets | | 1.73 | % | 1.71 | % | 1.69 | % | 1.73 | % | 1.77 | % |
Ratio of net investment income (loss) to average net assets | | (1.05 | )% | (1.47 | )% | (1.40 | )% | (1.35 | )% | (1.47 | )% |
Portfolio turnover rate | | 72.43 | % | 70.57 | % | 61.40 | % | 90.49 | % | 62.68 | % |
(i) Amount was computed based on average shares outstanding during the period.
See Notes to Financial Statements.
55
THE ALGER INSTITUTIONAL FUNDS
NOTES TO FINANCIAL STATEMENTS
NOTE 1 — General:
The Alger Institutional Funds (the “Trust”), is a diversified, open-end registered investment company organized as a business trust under the laws of the Commonwealth of Massachusetts. The Trust operates as a series company and currently issues an unlimited number of shares of beneficial interest in four funds — Alger Capital Appreciation Institutional Fund, Alger Large Cap Growth Institutional Fund, Alger Mid Cap Growth Institutional Fund and Alger Small Cap Growth Institutional Fund (collectively, the “Funds” or individually, each a “Fund”). The Funds normally invest primarily in equity securities and each has an investment objective of long-term capital appreciation.
Each Fund offers Class I and Class R shares. Each class has identical rights to assets and earnings except that each share class bears the cost of its transfer agency and sub-transfer agency services and Class R shares bears the cost of its plan of distribution.
NOTE 2 — Significant Accounting Policies:
(a) Investment Valuation: The Funds value their financial instruments at fair value using independent dealers or pricing services under policies approved by the Board of Trustees. Investments are valued on each day the New York Stock Exchange (the “NYSE”) is open, as of the close of the NYSE (normally 4:00 p.m. Eastern time).
Equity securities and option contracts for which valuation information is readily available are valued at the last reported sales price or official closing price as reported by an independent pricing service on the primary market or exchange on which they are traded. In the absence of reported sales, such securities are valued at a price within the bid and ask price or, in the absence of a recent bid or ask price, the equivalent as obtained from one or more of the major market makers for the securities to be valued.
Debt securities generally trade in the over-the-counter market. Debt securities with remaining maturities of more than sixty days at the time of acquisition are valued on the basis of last available bid prices or current market quotations provided by dealers or pricing services. In determining the value of a particular investment, pricing services may use certain information with respect to transactions in such investments, quotations from dealers, pricing matrixes, market transactions in comparable investments, various relationships observed in the market between investments and calculated yield measures based on valuation technology commonly employed in the market for such investments. Asset-backed and mortgage-backed securities are valued by independent pricing services using models that consider estimated cash flows of each tranche of the security, establish a benchmark yield and develop an estimated tranche-specific spread to the benchmark yield based on the unique attributes of the tranche. Debt securities with a remaining maturity of less than sixty days are valued at amortized cost which approximates market value.
Securities for which market quotations are not readily available are valued at fair value, as determined in good faith pursuant to procedures established by the Board of Trustees.
56
THE ALGER INSTITUTIONAL FUNDS
NOTES TO FINANCIAL STATEMENTS (Continued)
Securities in which the Funds invest may be traded in foreign markets that close before the close of the NYSE. Developments that occur between the close of the foreign markets and the close of the NYSE may result in adjustments to the foreign closing prices to reflect what the investment adviser, pursuant to policies established by the Board of Trustees, believes to be the fair value of these securities as of the close of the NYSE. The Funds may also fair value securities in other situations, for example, when a particular foreign market is closed but the Fund is open.
Financial Accounting Standards Board Accounting Standards Codification 820 — Fair Value Measurements and Disclosures (“ASC 820”) defines fair value as the price that the Funds would receive upon selling an investment in a timely transaction to an independent buyer in the principal or most advantageous market of the investment. ASC 820 established a three-tier hierarchy to maximize the use of observable market data and minimize the use of unobservable inputs and to establish classification of fair value measurements for disclosure purposes. Inputs refer broadly to the assumptions that market participants would use in pricing the asset or liability and may be observable or unobservable. Observable inputs are based on market data obtained from sources independent of the Funds. Unobservable inputs are inputs that reflect the Funds’ own assumptions based on the best information available in the circumstances. The three-tier hierarchy of inputs is summarized in the three broad Levels listed below.
· Level 1 – quoted prices in active markets for identical investments
· Level 2 – significant other observable inputs (including quoted prices for similar investments, interest rates, prepayment speeds, credit risk, etc.)
· Level 3 – significant unobservable inputs (including the Funds’ own assumptions in determining the fair value of investments)
The Funds’ valuation techniques are generally consistent with the market approach whereby prices and other relevant information generated by market transactions involving identical or comparable assets are used to measure fair value. Inputs for Level 1 include exchange-listed prices and broker quotes in an active market. Inputs for Level 2 include the last trade price in the case of a halted security, an exchange-listed price which has been adjusted for fair value factors, and prices of closely related securities. Additional Level 2 inputs include an evaluated price which is based upon a compilation of observable market information such as spreads for fixed income and preferred securities. Valuation techniques for Level 3 securities include using the income approach whereby future amounts are converted, or discounted, to a current single amount. These fair value measurements are determined on the basis of the value indicated by current market expectations about such future events. Inputs for Level 3 include unobservable market information which can include cash flows, income and expenses, and other information obtained from a company’s financial statements, or from market indicators such as benchmarks and indices.
Valuation processes are determined by a Valuation Committee (“Committee”) established by the Trust’s Board of Trustees (“Board”) and comprised of representatives of the
57
THE ALGER INSTITUTIONAL FUNDS
NOTES TO FINANCIAL STATEMENTS (Continued)
Trust’s investment advisor. The Committee reports its valuation determinations to the Board which is responsible for approving valuation policy and procedures.
The Committee meets quarterly to review and evaluate the effectiveness of the procedures for making fair value determinations. The Committee considers, among other things, the results of quarterly back testing of the fair value model for foreign securities, pricing comparisons between primary and secondary price sources, the outcome of price challenges put to the Funds’ pricing vendor, and variances between transactional prices and previous mark-to-markets.
The Funds will record a change to a security’s fair value level if new inputs are available or it becomes evident that inputs previously considered for leveling have changed or are no longer relevant. Transfers between Levels 1 and 2 are recognized at the end of the reporting period, and transfers into and out of Level 3 are recognized during the reporting period.
(b) Cash and Cash Equivalents: Cash and cash equivalents include U.S. dollars and overnight time deposits.
(c) Securities Transactions and Investment Income: Securities transactions are recorded on a trade date basis. Realized gains and losses from securities transactions are recorded on the identified cost basis. Dividend income is recognized on the ex-dividend date and interest income is recognized on the accrual basis.
(d) Foreign Currency Translations: The books and records of the Funds are maintained in U.S. dollars. Foreign currencies, investments and other assets and liabilities are translated into U.S. dollars at the prevailing rates of exchange on the valuation date. Purchases and sales of investment securities and income and expenses are translated into U.S. dollars at the prevailing exchange rates on the respective dates of such transactions.
Net realized gains and losses on foreign currency transactions represent net gains and losses from the disposition of foreign currencies, currency gains and losses realized between the trade dates and settlement dates of security transactions, and the difference between the amount of net investment income accrued and the U.S. dollar amount actually received. The effects of changes in foreign currency exchange rates on investments in securities are included in realized and unrealized gain or loss on investments in the Statement of Operations.
(e) Option Contracts: When a Fund writes an option, an amount equal to the premium received by the Fund is recorded as a liability and is subsequently adjusted to the current fair value of the option written. Premiums received from writing options that expire unexercised are treated by the Fund on the expiration date as realized gains from investments. The difference between the premium and the amount paid on effecting a closing purchase transaction, including brokerage commissions, is also treated as a realized gain, or, if the premium is less than the amount paid for the closing purchase transaction, as a realized loss. If a call option is exercised, the premium is added to the proceeds from the sale of the underlying security in determining whether the Fund has realized a gain or loss. If a put option is exercised, the premium reduces the cost basis of the securities
58
THE ALGER INSTITUTIONAL FUNDS
NOTES TO FINANCIAL STATEMENTS (Continued)
purchased by the Fund. The Fund as writer of an option bears the market risk of an unfavorable change in the price of the security underlying the written option.
The Funds may also purchase put and call options. Each Fund pays a premium which is included in the Fund’s Statement of Assets and Liabilities as an investment and subsequently marked to market to reflect the current value of the option. Premiums paid for purchasing options which expire are treated as realized losses. The risk associated with purchasing put and call options is limited to the premium paid. Premiums paid for purchasing options which are exercised or closed are added to the amounts paid or offset against the proceeds on the underlying security to determine the realized gain or loss.
(f) Dividends to Shareholders: Dividends and distributions payable to shareholders are recorded by the Funds on the ex-dividend date. Dividends from net investment income and distributions from net realized gains are declared and paid annually after the end of the fiscal year in which earned.
Each class is treated separately in determining the amounts of dividends from net investment income payable to holders of its shares.
The characterization of distributions to shareholders for financial reporting purposes is determined in accordance with federal income tax rules. Therefore, the source of a Fund’s distributions may be shown in the accompanying financial statements as either from, or in excess of, net investment income, net realized gain on investment transactions or return of capital, depending on the type of book/tax differences that may exist. Capital accounts within the financial statements are adjusted for permanent book/tax differences. Reclassifications result primarily from the difference in tax treatment of net operating losses, passive foreign investment companies, and foreign currency transactions. The reclassifications are done annually at fiscal year end and have no impact on the net asset values of the Funds and are designed to present each Fund’s capital accounts on a tax basis.
(g) Federal Income Taxes: It is each Fund’s policy to comply with the requirements of the Internal Revenue Code Subchapter M applicable to regulated investment companies and to distribute all of its taxable income to its shareholders. Provided that the Funds maintain such compliance, no federal income tax provision is required. Each Fund is treated as a separate entity for the purpose of determining such compliance.
Financial Accounting Standards Board Accounting Standards Codification 740 — Income Taxes (“ASC 740”) requires the Funds to measure and recognize in their financial statements the benefit of a tax position taken (or expected to be taken) on an income tax return if such position will more likely than not be sustained upon examination based on the technical merits of the position. No tax years are currently under investigation. The Funds file income tax returns in the U.S. Federal jurisdiction, as well as the New York State and New York City jurisdictions. The statute of limitations on the Funds’ tax returns remains open for the tax years 2009-2012. Management does not believe there are any uncertain tax positions that require recognition of a tax liability.
(h) Allocation Methods: The Trust accounts separately for the assets, liabilities and operations of each Fund. Expenses directly attributable to each Fund are charged to that
59
THE ALGER INSTITUTIONAL FUNDS
NOTES TO FINANCIAL STATEMENTS (Continued)
Fund’s operations; expenses which are applicable to all Funds are allocated among them based on net assets. Income, realized and unrealized gains and losses, and expenses of each Fund are allocated among the Fund’s classes based on relative net assets, with the exception of distribution fees and transfer agency fees.
(i) Estimates: These financial statements have been prepared in accordance with accounting principles generally accepted in the United States of America, which require using estimates and assumptions that affect the reported amounts therein. Actual results may differ from those estimates.
NOTE 3 — Investment Advisory Fees and Other Transactions with Affiliates:
(a) Investment Advisory and Administration Fees: Fees incurred by each Fund, pursuant to the provisions of its Investment Advisory Agreement and its Administration Agreement with Fred Alger Management, Inc. (“Alger Management” or the “Manager”), are payable monthly and computed based on the value of the average daily net assets of each Fund, at the following rates:
| | ADVISORY
FEE | | ADMINISTRATION
FEE | |
Alger Capital Appreciation Institutional Fund | | .81 | % | .0275 | % |
Alger Large Cap Growth Institutional Fund | | .71 | | .0275 | |
Alger Mid Cap Growth Institutional Fund | | .76 | | .0275 | |
Alger Small Cap Growth Institutional Fund | | .81 | | .0275 | |
(b) Distribution Fees - Class R Shares: The Trust has adopted a Distribution Plan pursuant to which Class R shares of each Fund pay Fred Alger & Company, Incorporated, the Trust’s distributor (the “Distributor” or “Alger Inc.”) and an affiliate of Alger Management, a fee at the annual rate of 0.50% of the respective average daily net assets of the Class R shares of the designated Fund to compensate the Distributor for its activities and expenses incurred in distributing the Class R shares. The fees charged may be more or less than the expenses incurred by the Distributor.
(c) Brokerage Commissions: During the year ended October 31, 2012, the Alger Capital Appreciation Institutional Fund, Alger Large Cap Growth Institutional Fund, Alger Mid Cap Growth Institutional Fund and Alger Small Cap Growth Institutional Fund paid Alger Inc. commissions of $1,617,462, $22,560, $579,076 and $979,407, respectively, in connection with securities transactions.
(d) Shareholder Administrative Fees: The Trust has entered into a shareholder administrative services agreement with Alger Management to compensate Alger Management for its liaison and administrative oversight of Boston Financial Data Services, Inc., the transfer agent, and other related services. The Funds compensate Alger Management at the annual rate of 0.01% of their average daily net assets for these services. During the year ended October 31, 2012, the Alger Capital Appreciation Institutional Fund, Alger Large Cap Growth Institutional Fund, Alger Mid Cap Growth Institutional Fund and Alger Small Cap Growth Institutional Fund incurred fees of $157,824, $2,077, $29,232 and
60
THE ALGER INSTITUTIONAL FUNDS
NOTES TO FINANCIAL STATEMENTS (Continued)
$112,436, respectively, for these services provided by Alger Management, which are included in the transfer agent fees and expenses in the Statement of Operations.
Alger Management makes payments to intermediaries that provide sub-accounting services to omnibus accounts held by the Funds. A portion of the fees paid by Alger Management to intermediaries that provide sub-accounting services are charged back to the appropriate Fund, subject to certain limitations, as approved by the Trust’s Board of Trustees. For the year ended October 31, 2012, Alger Management charged back to the Alger Capital Appreciation Institutional Fund, Alger Large Cap Growth Institutional Fund, Alger Mid Cap Growth Institutional Fund, and Alger Small Cap Growth Institutional Fund, $525,102, $14,481, $215,065 and $382,925, respectively, for these services, which are included in the transfer agent fees and expenses in the Statements of Operations.
(e) Shareholder Servicing Fees: The Trust has entered into a shareholder servicing agreement with Alger Inc. whereby Alger Inc. provides the Trust with ongoing servicing of shareholder accounts. As compensation for such services, each Fund pays Alger Inc. a monthly fee at an annual rate of 0.25% of the value of its average daily net assets. The fees charged may be more or less than the expenses incurred by the Distributor.
(f) Trustee Fees: Each Fund pays each trustee who is not affiliated with Alger Management or its affiliates $750 for each meeting attended, to a maximum of $3,000 per annum, plus travel expenses incurred for attending the meeting. The Chairman of the Board of Trustees receives an additional annual fee of $15,000 which is paid, pro rata, by all funds managed by Alger Management. Additionally, each member of a Fund’s audit committee receives $75 from the Fund for each audit committee meeting attended, to a maximum of $300 per annum.
(g) Interfund Loans: The Funds, along with other funds advised by Alger Management, may borrow money from and lend money to each other for temporary or emergency purposes. To the extent permitted under its investment restrictions, each fund may lend uninvested cash in an amount up to 15% of its net assets to other funds. If a fund has borrowed from other funds and has aggregate borrowings from all sources that exceed 10% of the fund’s total assets, such fund will secure all of its loans from other funds. The interest rate charged on interfund loans is equal to the average of the overnight time deposit rate and bank loan rate available to the funds. As of October 31, 2012, Alger Mid Cap Growth Institutional Fund borrowed $610,000 from an affiliated Fund at a rate of 1.12%, which was due within seven calendar days.
During the year ended October 31, 2012, Alger Mid Cap Growth Institutional Fund and Alger Small Cap Growth Institutional Fund incurred interest expenses of $3,602 and $3,343, respectively, in connection with interfund loans.
(h) Other Transactions With Affiliates: Certain officers of the Trust are directors and officers of Alger Management and the Distributor.
61
THE ALGER INSTITUTIONAL FUNDS
NOTES TO FINANCIAL STATEMENTS (Continued)
NOTE 4 — Securities Transactions:
The following summarizes the securities transactions by the Funds, other than U.S. Government and short-term securities, for the year ended October 31, 2012:
| | PURCHASES | | SALES | |
Alger Capital Appreciation Institutional Fund | | $ | 2,421,415,575 | | $ | 2,092,173,204 | |
Alger Large Cap Growth Institutional Fund | | 29,894,065 | | 32,407,059 | |
Alger Mid Cap Growth Institutional Fund | | 650,026,652 | | 798,311,153 | |
Alger Small Cap Growth Institutional Fund | | 792,008,844 | | 1,075,997,164 | |
| | | | | | | |
Written call and put options activity for the year ended October 31, 2012, was as follows:
| | NUMBER OF
CONTRACTS | | PREMIUMS
RECEIVED | |
Alger Mid Cap Growth Institutional Fund | | | | | |
Call Options outstanding at October 31, 2011 | | 463 | | $ | 135,583 | |
Call Options written | | 5,403 | | 1,251,850 | |
Call Options closed | | (1,346 | ) | (374,993 | ) |
Call Options expired | | (1,398 | ) | (263,258 | ) |
Call Options exercised | | (1,919 | ) | (506,889 | ) |
Call Options outstanding at October 31, 2012 | | 1,203 | | $ | 242,293 | |
| | NUMBER OF
CONTRACTS | | PREMIUMS
RECEIVED | |
Alger Mid Cap Growth Institutional Fund | | | | | |
Put Options outstanding at October 31, 2011 | | 1,293 | | $ | 329,563 | |
Put Options written | | 5,908 | | 1,168,873 | |
Put Options closed | | (1,787 | ) | (399,562 | ) |
Put Options expired | | (2,325 | ) | (523,337 | ) |
Put Options exercised | | (1,850 | ) | (360,562 | ) |
Put Options outstanding at October 31, 2012 | | 1,239 | | $ | 214,975 | |
As of October 31, 2012, Alger Mid Cap Growth Institutional Fund had portfolio securities and cash valued at $3,664,223, segregated as collateral for written options.
NOTE 5 — Borrowings:
The Funds may borrow from their custodian on an uncommitted basis. Each Fund pays the custodian a market rate of interest, generally based upon the London Interbank Offered Rate. The Funds may also borrow from other funds advised by Alger Management, as discussed in Note 3(g). For the year ended October 31, 2012, the Funds had the following borrowings:
62
THE ALGER INSTITUTIONAL FUNDS
NOTES TO FINANCIAL STATEMENTS (Continued)
| | AVERAGE DAILY
BORROWING | | WEIGHTED AVERAGE
INTEREST RATE | |
Alger Large Cap Growth Institutional Fund | | $ | 2,607 | | 2.23 | % |
Alger Mid Cap Growth Institutional Fund | | 384,242 | | 1 .31 | |
Alger Small Cap Growth Institutional Fund | | 294,877 | | 1 .12 | |
| | | | | | |
The highest amount borrowed during the year ended October 31, 2012 for each Fund was as follows:
| | HIGHEST BORROWING | |
Alger Large Cap Growth Institutional Fund | | $ | 370,207 | |
Alger Mid Cap Growth Institutional Fund | | 25,731,000 | |
Alger Small Cap Growth Institutional Fund | | 16,450,000 | |
| | | | |
NOTE 6 — Share Capital:
The Trust has an unlimited number of authorized shares of beneficial interest of $.001 par value which are presently divided into four series. Each series is divided into two separate classes. The transactions of shares of beneficial interest were as follows:
| | FOR THE YEAR ENDED
OCTOBER 31, 2012 | | FOR THE YEAR ENDED
OCTOBER 31, 2011 | |
| | SHARES | | AMOUNT | | SHARES | | AMOUNT | |
Alger Capital Appreciation Institutional Fund | | | | | | | | | |
Class I: | | | | | | | | | |
Shares sold | | 27,268,813 | | $ | 599,933,680 | | 20,110,824 | | $ | 421,647,062 | |
Dividends reinvested | | 1,899,304 | | 37,169,382 | | — | | — | |
Shares redeemed | | (14,726,747 | ) | (322,570,207 | ) | (12,211,244 | ) | (256,765,961 | ) |
Net increase | | 14,441,370 | | $ | 314,532,855 | | 7,899,580 | | $ | 164,881,101 | |
Class R: | | | | | | | | | |
Shares sold | | 7,643,232 | | $ | 159,404,194 | | 4,952,676 | | $ | 100,314,955 | |
Dividends reinvested | | 434,479 | | 8,133,448 | | — | | — | |
Shares redeemed | | (3,456,723 | ) | (72,485,810 | ) | (2,822,040 | ) | (57,122,489 | ) |
Net increase | | 4,620,988 | | $ | 95,051,832 | | 2,130,636 | | $ | 43,192,466 | |
| | | | | | | | | |
Alger Large Cap Growth Institutional Fund | | | | | | | | | |
Class I: | | | | | | | | | |
Shares sold | | 638,850 | | $ | 9,262,473 | | 601,991 | | $ | 8,363,658 | |
Dividends reinvested | | — | | — | | 6,139 | | 83,370 | |
Shares redeemed | | (784,518 | ) | (11,245,728 | ) | (1,186,020 | ) | (16,345,962 | ) |
Net decrease | | (145,668 | ) | $ | (1,983,255 | ) | (577,890 | ) | $ | (7,898,934 | ) |
Class R: | | | | | | | | | |
Shares sold | | 107,333 | | $ | 1,487,495 | | 125,947 | | $ | 1,662,036 | |
Dividends reinvested | | — | | — | | 117 | | 1,538 | |
Shares redeemed | | (227,020 | ) | (3,165,971 | ) | (196,843 | ) | (2,642,080 | ) |
Net decrease | | (119,687 | ) | $ | (1,678,476 | ) | (70,779 | ) | $ | (978,506 | ) |
63
THE ALGER INSTITUTIONAL FUNDS
NOTES TO FINANCIAL STATEMENTS (Continued)
| | FOR THE YEAR ENDED
OCTOBER 31, 2012 | | FOR THE YEAR ENDED
OCTOBER 31, 2011 | |
| | SHARES | | AMOUNT | | SHARES | | AMOUNT | |
Alger Mid Cap Growth Institutional Fund | | | | | | | | | |
Class I: | | | | | | | | | |
Shares sold | | 3,127,646 | | $ | 43,915,977 | | 9,162,719 | | $ | 132,880,088 | |
Dividends reinvested | | — | | — | | 104,528 | | 1,490,566 | |
Shares redeemed | | (14,186,588 | ) | (201,437,220 | ) | (41,941,828 | ) | (613,811,578 | ) |
Net decrease | | (11,058,942 | ) | $ | (157,521,243 | ) | (32,674,581 | ) | $ | (479,440,924 | ) |
Class R: | | | | | | | | | |
Shares sold | | 551,108 | | $ | 7,360,055 | | 1,103,541 | | $ | 15,171,863 | |
Shares redeemed | | (1,328,452 | ) | (17,858,063 | ) | (2,392,797 | ) | (32,661,440 | ) |
Net decrease | | (777,344 | ) | $ | (10,498,008 | ) | (1,289,256 | ) | $ | (17,489,577 | ) |
| | | | | | | | | |
Alger Small Cap Growth Institutional Fund | | | | | | | | | |
Class I: | | | | | | | | | |
Shares sold | | 7,589,293 | | $ | 210,556,809 | | 16,073,601 | | $ | 446,521,164 | |
Dividends reinvested | | 1,691,801 | | 43,496,198 | | — | | — | |
Shares redeemed | | (17,778,509 | ) | (495,416,035 | ) | (18,288,847 | ) | (508,354,637 | ) |
Net decrease | | (8,497,415 | ) | $ | (241,363,028 | ) | (2,215,246 | ) | $ | (61,833,473 | ) |
Class R: | | | | | | | | | |
Shares sold | | 367,848 | | $ | 9,839,818 | | 650,452 | | $ | 17,559,906 | |
Dividends reinvested | | 97,573 | | 2,402,238 | | — | | — | |
Shares redeemed | | (1,096,876 | ) | (29,095,235 | ) | (1,039,917 | ) | (28,120,303 | ) |
Net decrease | | (631,455 | ) | $ | (16,853,179 | ) | (389,465 | ) | $ | (10,560,397 | ) |
NOTE 7 — Income Tax Information:
The tax character of distributions paid, during the year ended October 31, 2012 and the year ended October 31, 2011 were as follows:
| | FOR THE YEAR ENDED
OCTOBER 31, 2012 | | FOR THE YEAR ENDED
OCTOBER 31, 2011 | |
Alger Capital Appreciation Institutional Fund | | | | | |
Distributions paid from: | | | | | |
Ordinary Income | | $ | 34,779,651 | | — | |
Long-term capital gain | | $ | 13,142,483 | | — | |
Total distributions paid | | $ | 47,922,134 | | — | |
| | | | | |
Alger Large Cap Growth Institutional Fund | | | | | |
Distributions paid from: | | | | | |
Ordinary Income | | — | | $ | 179,485 | |
Long-term capital gain | | — | | — | |
Total distributions paid | | — | | $ | 179,485 | |
| | | | | |
Alger Mid Cap Growth Institutional Fund | | | | | |
Distributions paid from: | | | | | |
Ordinary Income | | — | | $ | 1,902,006 | |
Long-term capital gain | | — | | — | |
Total distributions paid | | — | | $ | 1,902,006 | |
64
THE ALGER INSTITUTIONAL FUNDS
NOTES TO FINANCIAL STATEMENTS (Continued)
| | FOR THE YEAR ENDED
OCTOBER 31, 2012 | | FOR THE YEAR ENDED
OCTOBER 31, 2011 | |
Alger Small Cap Growth Institutional Fund | | | | | |
Distributions paid from: | | | | | |
Ordinary Income | | — | | — | |
Long-term capital gain | | $ | 48,581,377 | | — | |
Total distributions paid | | $ | 48,581,377 | | — | |
As of October 31, 2012, the components of accumulated gains (losses) on a tax basis were as follows:
Alger Capital Appreciation Institutional Fund | | | |
Undistributed ordinary income | | $ | 30,408,272 | |
Undistributed long-term gains | | $ | 41,785,004 | |
Net accumulated earnings | | $ | 72,193,276 | |
Capital loss carryforwards | | — | |
Temporary differences | | $ | (29,392,562 | ) |
Net unrealized appreciation | | $ | 178,640,719 | |
Total accumulated gains | | $ | 221,441,433 | |
| | | |
Alger Large Cap Growth Institutional Fund | | | |
Undistributed ordinary income | | — | |
Undistributed long-term gains | | — | |
Net accumulated earnings | | — | |
Capital loss carryforwards | | $ | (8,867,880 | ) |
Late year ordinary income losses | | $ | (87,773 | ) |
Temporary differences | | $ | (35,968 | ) |
Net unrealized appreciation | | $ | 1,254,910 | |
Total accumulated losses | | $ | (7,736,711 | ) |
| | | |
Alger Mid Cap Growth Institutional Fund | | | |
Undistributed ordinary income | | $ | 556,246 | |
Undistributed long-term gains | | — | |
Net accumulated earnings | | $ | 556,246 | |
Capital loss carryforwards | | $ | (350,348,306 | ) |
Temporary differences | | $ | (1,772,298 | ) |
Net unrealized depreciation | | $ | (5,577,927 | ) |
Total accumulated losses | | $ | (357,142,285 | ) |
| | | |
Alger Small Cap Growth Institutional Fund | | | |
Undistributed ordinary income | | — | |
Undistributed long-term gains | | $ | 106,646,643 | |
Net accumulated earnings | | $ | 106,646,643 | |
Capital loss carryforwards | | — | |
Late year ordinary income losses | | $ | (4,871,584 | ) |
Temporary differences | | $ | (5,785,813 | ) |
Net unrealized appreciation | | $ | 116,402,742 | |
Total accumulated gains | | $ | 212,391,988 | |
65
THE ALGER INSTITUTIONAL FUNDS
NOTES TO FINANCIAL STATEMENTS (Continued)
At October 31, 2012, the Funds, for federal income tax purposes, had capital loss carryforwards which expire as set forth in the table below. These amounts may be applied against future net realized gains until the earlier of their utilization or expiration.
Expiration Dates | | Alger Capital
Appreciation
Institutional Fund | | Alger Large Cap
Growth
Institutional Fund | | Alger Mid Cap
Growth
Institutional Fund | | Alger Small Cap
Growth
Institutional Fund | |
POST ACT | | — | | — | | $ | 9,950,305 | | — | |
2016 | | — | | $ | 4,652,997 | | 18,359,838 | | — | |
2017 | | — | | 4,214,883 | | 322,038,630 | | — | |
Total | | — | | $ | 8,867,880 | | $ | 350,348,773 | | — | |
Under the recently enacted Regulated Investment Company Modernization Act of 2010, capital losses incurred by the Funds after October 31, 2011 will not be subject to expiration (“POST ACT”). In addition, losses incurred after October 31, 2011 must be utilized prior to the utilization of capital loss carryforwards above.
The difference between book-basis and tax-basis unrealized appreciation (depreciation) is determined annually and is attributable primarily to the tax deferral of losses on wash sales, 988 currency transactions, , nondeductible expenses on dividends sold short, the tax treatment of partnerships investments, the realization of unrealized appreciation of passive foreign investment companies, and return of capital from real estate investment trust investments.
Permanent differences, primarily from net operating losses and real estate investment trusts and partnership investments sold by the Funds, resulted in the following reclassifications among each Fund’s components of net assets at October 31, 2012:
Alger Capital Appreciation Institutional Fund | | | |
Accumulated undistributed net investment income (accumulated loss) | | $ | (649,787 | ) |
Accumulated net realized gain (accumulated realized loss) | | $ | 649,787 | |
Paid-in Capital | | — | |
| | | |
Alger Large Cap Growth Institutional Fund | | | |
Accumulated undistributed net investment income (accumulated loss) | | $ | (4,396 | ) |
Accumulated net realized gain (accumulated realized loss) | | $ | 4,396 | |
Paid-in Capital | | $ | — | |
| | | |
Alger Mid Cap Growth Institutional Fund | | | |
Accumulated undistributed net investment income (accumulated loss) | | $ | 1,356,738 | |
Accumulated net realized gain (accumulated realized loss) | | $ | (1,356,738 | ) |
Paid-in Capital | | $ | — | |
| | | |
Alger Small Cap Growth Institutional Fund | | | |
Accumulated undistributed net investment income (accumulated loss) | | $ | 1,643,813 | |
Accumulated net realized gain (accumulated realized loss) | | $ | 66,214 | |
Paid-in Capital | | $ | (1,710,027 | ) |
66
THE ALGER INSTITUTIONAL FUNDS
NOTES TO FINANCIAL STATEMENTS (Continued)
NOTE 8 — Fair Value Measurements:
The major categories of securities and their respective fair value inputs are detailed in each Fund’s Schedule of Investments. The following is a summary of the inputs used as of October 31, 2012 in valuing the Funds’ investments carried at fair value on a recurring basis. Based upon the nature, characteristics, and risks associated with their investments, the Funds have determined that presenting them by security type and sector is appropriate.
Alger Capital Appreciation Institutional
Fund | | TOTAL FUND | | LEVEL 1 | | LEVEL 2 | | LEVEL 3 | |
COMMON STOCKS | | | | | | | | | |
Consumer Discretionary | | $ | 304,078,365 | | $ | 304,078,365 | | — | | — | |
Consumer Staples | | 127,569,969 | | 127,569,969 | | — | | — | |
Energy | | 81,997,414 | | 81,997,414 | | — | | — | |
Financials | | 107,134,059 | | 107,134,059 | | — | | — | |
Health Care | | 203,364,773 | | 203,364,773 | | — | | — | |
Industrials | | 216,949,590 | | 216,949,590 | | — | | — | |
Information Technology | | 509,904,985 | | 509,904,985 | | — | | — | |
Materials | | 66,035,793 | | 66,035,793 | | — | | — | |
Telecommunication Services | | 43,507,248 | | 43,507,248 | | — | | — | |
TOTAL COMMON STOCKS | | $ | 1,660,542,196 | | $ | 1,660,542,196 | | — | | — | |
CONVERTIBLE CORPORATE BONDS | | | | | | | | | |
Consumer Discretionary | | $ | 3,474,694 | | — | | $ | 3,474,694 | | — | |
MASTER LIMITED PARTNERSHIP | | | | | | | | | |
Energy | | $ | 5,173,320 | | $ | 5,173,320 | | — | | — | |
Financials | | 15,160,503 | | 15,160,503 | | — | | — | |
TOTAL MASTER LIMITED PARTNERSHIP | | $ | 20,333,823 | | $ | 20,333,823 | | — | | — | |
REAL ESTATE INVESTMENT TRUST | | | | | | | | | |
Financials | | $ | 49,313,962 | | $ | 49,313,962 | | — | | — | |
TOTAL INVESTMENTS IN SECURITIES | | $ | 1,733,664,675 | | $ | 1,730,189,981 | | $ | 3,474,694 | | — | |
Alger Large Cap Growth Institutional
Fund | | TOTAL FUND | | LEVEL 1 | | LEVEL 2 | | LEVEL 3 | |
COMMON STOCKS | | | | | | | | | |
Consumer Discretionary | | $ | 3,238,429 | | $ | 3,238,429 | | — | | — | |
Consumer Staples | | 1,201,424 | | 1,201,424 | | — | | — | |
Energy | | 896,336 | | 896,336 | | — | | — | |
Financials | | 1,257,670 | | 1,257,670 | | — | | — | |
Health Care | | 2,585,568 | | 2,585,568 | | — | | — | |
Industrials | | 2,076,970 | | 2,076,970 | | — | | — | |
Information Technology | | 6,353,250 | | 6,353,250 | | — | | — | |
Materials | | 533,284 | | 533,284 | | — | | — | |
Telecommunication Services | | 276,768 | | 276,768 | | — | | — | |
TOTAL COMMON STOCKS | | $ | 18,419,699 | | $ | 18,419,699 | | — | | — | |
67
THE ALGER INSTITUTIONAL FUNDS
NOTES TO FINANCIAL STATEMENTS (Continued)
Alger Large Cap Growth Institutional
Fund | | TOTAL FUND | | LEVEL 1 | | LEVEL 2 | | LEVEL 3 | |
MASTER LIMITED PARTNERSHIP | | | | | | | | | |
Financials | | $ | 191,134 | | $ | 191,134 | | — | | — | |
REAL ESTATE INVESTMENT TRUST | | | | | | | | | |
Financials | | $ | 101,727 | | $ | 101,727 | | — | | — | |
TOTAL INVESTMENTS IN SECURITIES | | $ | 18,712,560 | | $ | 18,712,560 | | — | | — | |
Alger Mid Cap Growth Institutional
Fund | | TOTAL FUND | | LEVEL 1 | | LEVEL 2 | | LEVEL 3 | |
COMMON STOCKS | | | | | | | | | |
Consumer Discretionary | | $ | 45,389,262 | | $ | 45,389,262 | | — | | — | |
Consumer Staples | | 8,776,897 | | 8,776,897 | | — | | — | |
Energy | | 12,654,992 | | 12,654,992 | | — | | — | |
Financials | | 13,974,710 | | 13,974,710 | | — | | — | |
Health Care | | 26,244,090 | | 26,244,090 | | — | | — | |
Industrials | | 29,651,143 | | 29,651,143 | | — | | — | |
Information Technology | | 38,527,843 | | 38,527,843 | | — | | — | |
Materials | | 13,524,019 | | 13,524,019 | | — | | — | |
Telecommunication Services | | 5,362,725 | | 5,362,725 | | — | | — | |
Utilities | | 2,117,892 | | 2,117,892 | | — | | — | |
TOTAL COMMON STOCKS | | $ | 196,223,573 | | $ | 196,223,573 | | — | | — | |
PURCHASED OPTIONS | | | | | | | | | |
Energy | | $ | 7,140 | | $ | 2,700 | | $ | 4,440 | | — | |
Exchange Traded Funds | | $ | 312,446 | | $ | 312,446 | | — | | — | |
TOTAL PURCHASED OPTIONS | | $ | 319,586 | | $ | 315,146 | | $ | 4,440 | | — | |
MASTER LIMITED PARTNERSHIP | | | | | | | | | |
Financials | | $ | 2,116,030 | | $ | 2,116,030 | | — | | — | |
REAL ESTATE INVESTMENT TRUST | | | | | | | | | |
Financials | | $ | 7,604,449 | | $ | 7,604,449 | | — | | — | |
TOTAL INVESTMENTS IN SECURITIES | | $ | 206,263,638 | | $ | 206,259,198 | | $ | 4,440 | | — | |
SECURITIES SOLD SHORT | | | | | | | | | |
OPTIONS WRITTEN | | | | | | | | | |
Energy | | $ | 347,048 | | $ | 184,748 | | $ | 162,300 | | — | |
Exchange Traded Funds | | $ | 29,563 | | $ | 29,563 | | — | | — | |
Industrials | | 42,180 | | 12,210 | | 29,970 | | — | |
TOTAL OPTIONS WRITTEN | | $ | 418,791 | | $ | 226,521 | | $ | 192,270 | | — | |
68
THE ALGER INSTITUTIONAL FUNDS
NOTES TO FINANCIAL STATEMENTS (Continued)
Alger Small Cap Growth Institutional
Fund | | TOTAL FUND | | LEVEL 1 | | LEVEL 2 | | LEVEL 3 | |
COMMON STOCKS | | | | | | | | | |
Consumer Discretionary | | $ | 189,276,927 | | $ | 189,276,927 | | — | | — | |
Consumer Staples | | 35,984,105 | | 35,984,105 | | — | | — | |
Energy | | 51,957,530 | | 51,957,530 | | — | | — | |
Financials | | 34,115,032 | | 34,115,032 | | — | | — | |
Health Care | | 168,620,770 | | 168,620,770 | | — | | — | |
Industrials | | 157,578,654 | | 157,578,654 | | — | | — | |
Information Technology | | 212,311,889 | | 212,311,889 | | — | | — | |
Materials | | 46,015,167 | | 46,015,167 | | — | | — | |
Telecommunication Services | | 5,678,251 | | 5,678,251 | | — | | — | |
Utilities | | 12,757,911 | | 12,757,911 | | — | | — | |
TOTAL COMMON STOCKS | | $ | 914,296,236 | | $ | 914,296,236 | | — | | — | |
MASTER LIMITED PARTNERSHIP | | | | | | | | | |
Financials | | $ | 6,310,276 | | $ | 6,310,276 | | — | | — | |
REAL ESTATE INVESTMENT TRUST | | | | | | | | | |
Financials | | $ | 47,751,702 | | $ | 47,751,702 | | — | | — | |
TOTAL INVESTMENTS IN SECURITIES | | $ | 968,358,214 | | $ | 968,358,214 | | — | | — | |
| | FAIR VALUE
MEASUREMENTS
USING SIGNIFICANT
UNOBSERVABLE
INPUTS (LEVEL3) | |
Alger Capital Appreciation Institutional Fund | | Convertible
Preferred Stock | |
Opening balance at November 1, 2011 | | $ | 3,475,570 | |
Transfers into Level 3 | | — | |
Transfers out of Level 3(i) | | (2,681,154 | ) |
Total gains or losses | | | |
Included in net realized gain (loss) on investments | | — | |
Included in net unrealized gain (loss) on investments | | (794,416 | ) |
Purchases, issuances, sales, and settlements | | | |
Purchases | | — | |
Issuances | | — | |
Sales | | — | |
Settlements | | — | |
Closing balance at October 31, 2012 | | — | |
The amount of total gains or losses for the period included in net realized and unrealized gain (loss) attributable to change in unrealized appreciation (depreciation) relating to investments still held at October 31, 2012 | | $ | — | |
69
THE ALGER INSTITUTIONAL FUNDS
NOTES TO FINANCIAL STATEMENTS (Continued)
| | FAIR VALUE
MEASUREMENTS
USING SIGNIFICANT
UNOBSERVABLE
INPUTS (LEVEL3) | |
Alger Mid Cap Growth Institutional Fund | | Convertible
Preferred Stock | |
Opening balance at November 1, 2011 | | $ | 10,607,090 | |
Transfers into Level 3 | | — | |
Transfers out of Level 3(i) | | (8,182,612 | ) |
Total gains or losses | | | |
Included in net realized gain (loss) on investments | | — | |
Included in net unrealized gain (loss) on investments | | (2,424,478 | ) |
Purchases, issuances, sales, and settlements | | | |
Purchases | | $ | — | |
Issuances | | — | |
Sales | | — | |
Settlements | | — | |
Closing balance at October 31, 2012 | | — | |
The amount of total gains or losses for the period included in net realized and unrealized gain (loss) attributable to change in unrealized appreciation (depreciation) relating to investments still held at October 31, 2012 | | $ | — | |
(i) Securities transferred out of Level 3 upon closing of IPO and commencement of trading.
On October 31, 2012 there were no transfers of securities between Level 1 and Level 2.
NOTE 9 — Derivatives:
Financial Accounting Standards Board Accounting Standards Codification 815 — Derivatives and Hedging (“ASC 815”) requires qualitative disclosures about objectives and strategies for using derivatives, quantitative disclosures about fair value amounts of and gains and losses on derivative instruments, and disclosures about credit-risk-related contingent features in derivative agreements.
Forward currency contracts—In connection with portfolio purchases and sales of securities denominated in foreign currencies, the Funds may enter into forward currency contracts. Additionally, each Fund may enter into such contracts to economically hedge certain other foreign currency denominated investments. These contracts are valued at the current cost of covering or offsetting such contracts, and the related realized and unrealized foreign exchange gains and losses are included in the Statement of Operations. In the event that counterparties fail to settle these currency contracts or the related foreign security trades, a Fund could be exposed to foreign currency fluctuations.
Options—The Funds seek to capture the majority of the returns associated with equity market investments. To meet this investment goal, the Funds invest in a broadly diversified portfolio of common stocks, while also buying and selling call and put options on equities and equity indices. The Funds purchase call options to increase their exposure to stock market risk and also provide diversification of risk. The Funds purchase put options in order to protect from significant market declines that may occur over a short period of time. The Funds will write covered call and cash secured put options to
70
THE ALGER INSTITUTIONAL FUNDS
NOTES TO FINANCIAL STATEMENTS (Continued)
generate cash flows while reducing the volatility of the Funds’ portfolios. The cash flows may be an important source of the Funds’ returns, although written call options may reduce the Funds’ ability to profit from increases in the value of the underlying security or equity portfolio. The value of a call option generally increases as the price of the underlying stock increases and decreases as the stock decreases in price. Conversely, the value of a put option generally increases as the price of the underlying stock decreases and decreases as the stock increases in price. The combination of the diversified stock portfolio and the purchase and sale of options is intended to provide the Funds with the majority of the returns associated with equity market investments but with reduced volatility and returns that are augmented with the cash flows from the sale of options. During the year ended October 31, 2012, options were used in accordance with these objectives.
The fair values of derivative instruments as of October 31, 2012 are as follows:
Alger Mid Cap Growth Institutional Fund
| | ASSET DERIVATIVES 2012 | | LIABILITY DERIVATIVES 2012 | |
Derivatives not accounted | | Balance Sheet | | | | Balance Sheet | | | |
for as hedging instruments | | Location | | Fair Value | | Location | | Fair Value | |
Purchased Put Options | | Investments in Securities, at value | | $ | 313,740 | | | | | |
Purchased Call Options | | Investments in Securities, at value | | 5,846 | | | | | |
Written Put Options | | — | | — | | Written options outstanding, at value | | $ | 184,707 | |
Written Call Options | | — | | — | | Written options outstanding, at value | | 234,084 | |
Total | | | | $ | 319,586 | | | | $ | 418,791 | |
For the year ended October 31, 2012, Alger Mid Cap Growth Institutional Fund had option purchases of $2,109,925 and option sales of $3,868,773. The effect of derivative instruments on the Statement of Operations for the year ended October 31, 2012 is as follows:
NET REALIZED GAIN (LOSS) ON INVESTMENTS AND OPTIONS
Alger Mid Cap Growth Institutional Fund
Derivatives not accounted for as hedging instruments | | Options | |
Purchased Options | | $ | (2,046,611 | ) |
Written Options | | 1,844,878 | |
Total | | $ | (201,733 | ) |
71
THE ALGER INSTITUTIONAL FUNDS
NOTES TO FINANCIAL STATEMENTS (Continued)
NET CHANGE IN UNREALIZED APPRECIATION ON INVESTMENTS, OPTIONS
Alger Mid Cap Growth Institutional Fund
Derivatives not accounted for as hedging instruments | | Options | |
Purchased Options | | $ | 1,043,070 | |
Written Options | | 150,782 | |
Total | | $ | 1,193,852 | |
NOTE 10 — Litigation:
On August 31, 2005, the West Virginia Securities Commissioner (the “WVSC”), in an ex parte Summary Order to Cease and Desist and Notice of Right to Hearing, concluded that the Manager and the Distributor had violated the West Virginia Uniform Securities Act (the “WVUSA”), and ordered the Manager and the Distributor to cease and desist from further violations of the WVUSA by engaging in the market-timing-related conduct described in the order. The ex parte order provided notice of their right to a hearing with respect to the violations of law asserted by the WVSC. Other firms unaffiliated with the Manager were served with similar orders. The Manager and the Distributor intend to request a hearing for the purpose of seeking to vacate or modify the order.
NOTE 11 — Recent Accounting Pronouncements:
In December 2011, the FASB issued ASU 2011-11, Balance Sheet (Topic 210): Disclosures about Offsetting Assets and Liabilities (“ASU 2011-11”), which provides guidance regarding balance sheet offsetting disclosures. The amendments in ASU 2011-11 require an entity to disclose information about offsetting and related arrangements to enable users of its financial statements to understand the effects of those arrangements on its financial position. Entities are required to disclose gross information and net information about both instruments and transactions eligible for offset in the statement of assets and liabilities and transactions subject to an agreement similar to a master netting arrangement. The objective of ASU 2011-11 is to facilitate comparison between those entities that prepare their financial statements on the basis of GAAP and those entities that prepare their financial statements on the basis of IFRS. The new guidance is effective for annual reporting periods beginning on or after January 1, 2013. The Funds do not believe that this will have a material impact on the financial statements.
NOTE 12 — Subsequent Events:
Management of each Fund has evaluated events that have occurred subsequent to October 31, 2012 through the issuance date of the Financial Statements. No such events have been identified which require recognition and disclosure.
72
REPORT OF INDEPENDENT REGISTERED PUBLIC ACCOUNTING FIRM
To the Shareholders and Board of Trustees of
The Alger Institutional Funds:
We have audited the accompanying statements of assets and liabilities, including the schedules of investments, of The Alger Institutional Funds, comprised of the Alger Capital Appreciation Institutional Fund, Alger Large Cap Growth Institutional Fund, Alger Mid Cap Growth Institutional Fund, and Alger Small Cap Growth Institutional Fund (the “Funds”) as of October 31, 2012, and the related statements of operations for the year then ended, the statements of changes in net assets for each of the two years in the period then ended, and the financial highlights for each of the four years in the period then ended. These financial statements and financial highlights are the responsibility of the Funds’ management. Our responsibility is to express an opinion on these financial statements and financial highlights based on our audits. The Funds’ financial highlights for the respective periods ended October 31, 2008 were audited by other auditors, whose report dated December 16, 2008, expressed an unqualified opinion on such financial highlights.
We conducted our audits in accordance with the standards of the Public Company Accounting Oversight Board (United States). Those standards require that we plan and perform the audit to obtain reasonable assurance about whether the financial statements and financial highlights are free of material misstatement. The Funds are not required to have, nor were we engaged to perform, an audit of their internal control over financial reporting. Our audits included consideration of internal control over financial reporting as a basis for designing audit procedures that are appropriate in the circumstances, but not for the purpose of expressing an opinion on the effectiveness of the Funds’ internal control over financial reporting. Accordingly, we express no such opinion. An audit also includes examining, on a test basis, evidence supporting the amounts and disclosures in the financial statements, assessing the accounting principles used and significant estimates made by management, as well as evaluating the overall financial statement presentation. Our procedures included confirmation of securities owned as of October 31, 2012, by correspondence with the custodian and brokers; where replies were not received from brokers, we performed other auditing procedures. We believe that our audits provide a reasonable basis for our opinion.
In our opinion, the financial statements and financial highlights referred to above, present fairly, in all material respects, the financial position of each of the portfolios constituting The Alger Institutional Funds as of October 31, 2012, the results of their operations for the year then ended, the changes in their net assets for each of the two years in the period then ended, and the financial highlights for each of the four years in the period then ended, in conformity with accounting principles generally accepted in the United States of America.
Deloitte & Touche LLP | | |
New York, New York | | |
December 21, 2012 | | |
73
THE ALGER INSTITUTIONAL FUNDS
ADDITIONAL INFORMATION (Unaudited)
Expense Example
As a shareholder of a Fund, you incur two types of costs: transaction costs, if applicable, including sales charges (loads) and redemption fees; and ongoing costs, including management fees, distribution (12b-1) fees, if applicable, and other fund expenses. This example is intended to help you understand your ongoing costs (in dollars) of investing in the Fund and to compare these costs with the ongoing costs of investing in other mutual funds.
The example below is based on an investment of $1,000 invested at the beginning of the six-month period starting May 1, 2012 and ending October 31, 2012.
Actual Expenses
The first line for each class of shares in the table below provides information about actual account values and actual expenses. You may use the information in this line, together with the amount you invested, to estimate the expenses that you would have paid over the period. Simply divide your account value by $1,000 (for example, an $8,600 account value divided by $1,000 = 8.6), then multiply the result by the number in the first line under the heading entitled “Expenses Paid During the Period” to estimate the expenses you paid on your account during this period.
Hypothetical Example for Comparison Purposes
The second line for each class of shares in the table below provides information about hypothetical account values and hypothetical expenses based on the Fund’s actual expense ratios for each class of shares and an assumed rate of return of 5% per year before expenses, which is not the Fund’s actual return. The hypothetical account values and expenses may not be used to estimate the actual ending account balance or expenses you paid for the period. You may use this information to compare the ongoing costs of investing in the Fund and other funds. To do so, compare this 5% hypothetical example with the 5% hypothetical examples that appear in the shareholder reports of other funds.
Please note that the expenses shown in the table are meant to highlight your ongoing costs only and do not reflect any transaction costs, such as sales charges (loads) and redemption fees. Therefore, the second line under each class of shares in the table is useful in comparing ongoing costs only, and will not help you determine the relative total costs of owning different funds. In addition, if these transactional costs were included, your costs would have been higher.
74
| | Beginning
Account
Value
May 1, 2012 | | Ending
Account
Value
October 31, 2012 | | Expenses
Paid During
the Six Months
Ended
October 31,
2012(a) | | Ratio of
Expenses to
Average
Net Assets
For the
Six Months
Ended
October 31,
2012(b) | |
Alger Capital Appreciation Institutional Fund | | | | | | | | | |
Class I | Actual | | $ | 1,000.00 | | $ | 1,000.44 | | $ | 6.01 | | 1.19 | % |
| Hypothetical(c) | | 1,000.00 | | 1,019.13 | | 6.06 | | 1.19 | |
Class R | Actual | | 1,000.00 | | 998.17 | | 8.49 | | 1.69 | |
| Hypothetical(c) | | 1,000.00 | | 1,016.64 | | 8.56 | | 1.69 | |
| | | | | | | | | | |
Alger Large Cap Growth Institutional Fund | | | | | | | | | |
Class I | Actual | | $ | 1,000.00 | | $ | 955.29 | | $ | 9.02 | | 1.83 | % |
| Hypothetical(c) | | 1,000.00 | | 1,015.91 | | 9.30 | | 1.83 | |
Class R | Actual | | 1,000.00 | | 952.19 | | 12.42 | | 2.53 | |
| Hypothetical(c) | | 1,000.00 | | 1,012.41 | | 12.81 | | 2.53 | |
| | | | | | | | | | |
Alger Mid Cap Growth Institutional Fund | | | | | | | | | |
Class I | Actual | | $ | 1,000.00 | | $ | 970.10 | | $ | 6.11 | | 1.23 | % |
| Hypothetical(c) | | 1,000.00 | | 1,018.94 | | 6.26 | | 1.23 | |
Class R | Actual | | 1,000.00 | | 967.09 | | 8.72 | | 1.76 | |
| Hypothetical(c) | | 1,000.00 | | 1,016.28 | | 8.93 | | 1.76 | |
| | | | | | | | | | |
Alger Small Cap Growth Institutional Fund | | | | | | | | | |
Class I | Actual | | $ | 1,000.00 | | $ | 971.37 | | $ | 6.07 | | 1.23 | % |
| Hypothetical(c) | | 1,000.00 | | 1,018.98 | | 6.22 | | 1.23 | |
Class R | Actual | | 1,000.00 | | 968.97 | | 8.56 | | 1.73 | |
| Hypothetical(c) | | 1,000.00 | | 1,016.44 | | 8.77 | | 1.73 | |
(a) | Expenses are equal to the annualized expense ratio of the respective share class, multiplied by the average account value over the period, multiplied by 184/366 (to reflect the one-half year period). |
(b) | Annualized. |
(c) | 5% annual return before expenses. |
Trustees and Officers of the Fund
Information about the trustees and officers of the Fund is set forth below. In the table the term “Alger Fund Complex” refers to the Fund, The Alger Funds, The Alger Portfolios, Alger China-U.S. Growth Fund and The Alger Funds II, each of which is a registered investment company managed by Fred Alger Management, Inc. (“Alger Management”). Each Trustee serves until an event of termination, such as death or resignation, or until his or her successor is duly elected; each officer’s term of office is one year. Unless otherwise noted, the address of each person named below is 360 Park Avenue South, New York, NY 10010.
75
Name, Age, Position with the
Fund | | Principal Occupations | | Trustee
and/or
Officer
Since | | Number of
Funds in
the Alger
Fund
Complex
which are
Overseen
by Trustee |
INTERESTED TRUSTEE | | | | | | |
| | | | | | |
Hilary M. Alger (51) | | Director of Development, Pennsylvania Ballet since 2004; Associate Director of Development, College of Arts and Sciences and Graduate School, University of Virginia 1999-2003. | | 2003 | | 25 |
| | | | | | |
NON-INTERESTED TRUSTEE | | | | | | |
| | | | | | |
Charles F. Baird, Jr. (59) | | Managing Partner of North Castle Partners, a private equity securities group; Chairman of Leiner Health Products, Enzymatic Therapy and Caleel & Hayden (skincare business); former Chairman of Elizabeth Arden Day Spas, Naked Juice, Equinox (fitness company) and EAS (manufacturer of nutritional products). Formerly Managing Director of AEA Investors, Inc. | | 2000 | | 25 |
| | | | | | |
Roger P. Cheever (67) | | Associate Vice President for Principal Gifts, and Senior Associate Dean for Development in the Faculty of Arts and Sciences at Harvard University; Formerly Deputy Director of the Harvard College Fund. | | 2000 | | 25 |
| | | | | | |
Lester L. Colbert Jr. (78) | | Private investor since 1988; Formerly Chairman of the Board, President and Chief Executive Officer of Xidex Corporation (manufacturer of computer information media). | | 2000 | | 25 |
| | | | | | |
Stephen E. O’Neil (80) | | Attorney. Private Investor since 1981. Formerly of Counsel to the law firm of Kohler & Barnes. | | 1986 | | 25 |
| | | | | | |
David Rosenberg (50) | | Associate Professor of Law since January 2006 (Assistant Professor 2000-2005), Zicklin School of Business, Baruch College, City University of New York. | | 2007 | | 25 |
| | | | | | |
Nathan E. Saint-Amand M.D. (75) | | Medical doctor in private practice; Member of the Board of the Manhattan Institute (non-profit policy research) since 1988; Formerly Co-Chairman, Special Projects Committee, Memorial Sloan Kettering. | | 1986 | | 25 |
76
Name, Age, Position with the
Fund | | Principal Occupations | | Trustee
and/or
Officer
Since | | Number of
Funds in
the Alger
Fund
Complex
which are
Overseen
by Trustee |
OFFICERS | | | | | | |
| | | | | | |
Dan C. Chung (50) President | | Chief Investment Officer and Director since 2001, and Chief Executive Officer since 2006, of Alger Management; President and Chief Executive Officer since 2003 of Alger Associates, Inc. (“Associates”); Chairman of the Board of Directors since 2006 of Alger Inc.; President since 2003 and Director since 2003 of Analysts Resources, Inc. (“Resources”); Formerly Trustee of the Trust from 2001 to 2007. | | 2001 | | N/A |
| | | | | | |
Hal Liebes (48) Secretary | | Executive Vice President, Chief Legal Officer, Chief Operating Officer and Secretary of Alger Management and Alger Inc.; Director since 2006 of Alger Management, Alger Inc. and Resources. | | 2005 | | N/A |
| | | | | | |
Lisa A. Moss (47) Assistant Secretary | | Senior Vice President since 2009, and Vice President and Assistant General Counsel of Alger Management since June 2006. | | 2006 | | N/A |
| | | | | | |
Michael D. Martins (47) Treasurer | | Senior Vice President of Alger Management; Assistant Treasurer since 2004. | | 2005 | | N/A |
| | | | | | |
Anthony S. Caputo (57) Assistant Treasurer | | Employed by Alger Management since 1986, currently serving as Vice President. | | 2007 | | N/A |
| | | | | | |
Sergio M. Pavone (51) Assistant Treasurer | | Employed by Alger Management since 2002, currently serving as Vice President. | | 2007 | | N/A |
| | | | | | |
Barry J. Mullen (59 Chief Compliance Officer | | Senior Vice President and Chief Compliance officer for Alger Management since May 2006. | | 2006 | | N/A |
Ms. Alger is an “interested person” (as defined in the Investment Company Act) of the Funds because of her affiliations with Alger Management. No Trustee is a director of any public company except as indicated under “Principal Occupations”.
The Statement of Additional Information contains additional information about the Funds’ Trustees and is available without charge upon request by calling (800) 992-3863.
77
Investment Management Agreement Renewal
At an in-person meeting held on September 13, 2012, the Trustees, including the Independent Trustees, unanimously approved renewal of the Investment Advisory Agreement (the “Agreement”) between the Trust and Fred Alger Management, Inc. (“Alger Management”), as revised to incorporate scheduled fee reductions at specified asset breakpoints. The Independent Trustees were assisted in their review by independent legal counsel and met with such counsel in executive session separate from representatives of Alger Management.
In evaluating the Agreement, the Trustees drew on materials that they had requested and which were provided to them in advance of the meeting by Alger Management and by counsel. The materials covered, among other matters, (i) the nature, extent and quality of the services provided by Alger Management under the Agreement, (ii) the investment performance of each of the Trust’s portfolios (each a “Fund”), (iii) the costs to Alger Management of its services and the profits realized by Alger Management and Fred Alger & Company, Incorporated (“Alger Inc.”) from their relationship with the Trust, and (iv) the extent to which economies of scale would be realized if and as the Funds grow and whether the fee levels in the Agreement reflect these economies of scale. These materials included an analysis of the Funds and Alger Management’s services by FUSE Research Network LLC (“FUSE”), an independent consulting firm selected by the Trust’s Chief Compliance Officer and having no other relationship with Alger Management, whose specialties include, among other things, assistance to fund trustees and directors in their review of advisory contracts pursuant to section 15(c) of the Investment Company Act of 1940, as amended. At the meeting, senior FUSE personnel reviewed with the Trustees a presentation covering all of the Funds, which was provided prior to the meeting.
In deciding whether to approve renewal of the Agreement, the Trustees considered various factors, including those enumerated above. They also considered other direct and indirect benefits to Alger Management and its affiliates from their relationship with the Trust.
Nature, Extent and Quality of Services. In considering the nature, extent and quality of the services provided by Alger Management pursuant to the Agreement, the Trustees relied on their prior experience as Trustees of the Trust, their familiarity with the personnel and resources of Alger Management and its affiliates, and the materials provided at the meeting. They noted that under the Agreement Alger Management is responsible for managing the investment operations of the Funds. They also noted that administrative, compliance, reporting and accounting services necessary for the conduct of the Trust’s affairs are provided under a separate Administration Agreement with Alger Management. The Trustees reviewed the background and experience of Alger Management’s senior investment management personnel, including the individuals currently responsible for the investment operations of the Funds. They also considered the resources, operational structures and practices of Alger Management in managing each Fund’s portfolio, as well as Alger Management’s overall investment management business. They noted especially Alger Management’s established expertise in managing portfolios of “growth” stocks and that, according to an analysis provided by FUSE, the characteristics
78
of each Fund had been consistent with those of a fund that holds itself out to investors as growth-oriented. The Trustees concluded that Alger Management’s experience, resources and strength in the areas of importance to the Funds are considerable. The Trustees considered the level and depth of Alger Management’s ability to execute portfolio transactions to effect investment decisions, including those through Alger Inc. The Trustees also considered the control and compliance environment at Alger Management and within the Trust.
Investment Performance of the Funds. Drawing upon information provided at the meeting by Alger Management as well as FUSE and upon reports provided to the Trustees by Alger Management throughout the preceding year, the Trustees reviewed each Fund’s returns for the year-to-date (at 6/30/12), second-quarter, 1-, 3- and 5-year, and since-inception periods to the extent available (and its year-by-year returns), together with supplemental data through 8/31/12, and compared them with benchmark and peer-group data for the same periods. They noted that each of the Mid Cap Fund and the Capital Appreciation Fund for the year to date through 6/30/12 had surpassed its benchmark and the median for its FUSE peer group, while the Large Cap Fund had fallen short by both measures. The Small Cap Fund had fallen short of its benchmark, but it had performed close to its peer median. Relative performance for the longer 1-, 3- and 5-year periods was generally similar to that of the shorter terms for the Large Cap Fund and, against its peers, the Capital Appreciation Fund but was generally inferior in the case of the Mid Cap Fund. The 1-year performance of the Small Cap Fund was similar to that of its shorter periods in reflecting strong performance against peers, but its 3- and 5-year periods failed in that respect. Representatives of Alger Management discussed with the Trustees measures that the firm was in the process of instituting to improve the performance of the Funds that had underperformed. It was noted, in particular, that the Large Cap Fund would soon begin operating with a substantially different investment strategy and a new portfolio manager. On the basis of their review and the discussions with Alger Management, the Trustees determined that the performance of the Funds was acceptable.
Fund Fees and Expense Ratios; Profitability to Alger Management and its Affiliates. The Trustees reviewed each Fund’s management fee and expense ratio and compared them with a group of comparable funds. In order to assist the Trustees in this comparison, FUSE had provided the Trustees with comparative information with respect to the advisory fees and expense ratios of similar funds. That information indicated that the fees of three of the Funds were near or below the median for their comparison groups, while the fee of the Capital Appreciation Fund was somewhat above the applicable median. The expense ratios of the Large Cap Fund were above the median. In the case of the Mid Cap, Small Cap and Capital Appreciation Funds, the expense ratios of their Class I Shares were near or below the applicable medians while those of the Class R Shares were above the medians. The Trustees determined that such information should be taken into account in weighing the size of the fee against the nature, extent and quality of the services provided. The Trustees also considered fees paid to Alger Management by three other types of clients, specifically mutual funds for which Alger Management was sub-adviser, separately managed institutional accounts, and wrap programs. The Trustees determined that in all three cases the fees were of doubtful relevance for purposes of comparison with those of the Funds because of the significant differences in services
79
provided by Alger Management to those types of clients as opposed to the Funds, but that to the extent that meaningful comparison was practicable, the differences in services adequately explained the differences in the fees. The Trustees then considered the profitability of the Investment Advisory Agreement to Alger Management and its affiliates, and the methodology used by Alger Management in determining such profitability. The Trustees reviewed previously-provided data on each Fund’s profitability to Alger Management and its affiliates for the year ended June 30, 2012. After discussing with representatives of the Adviser and FUSE the methodologies used in computing the costs that formed the bases of the profitability calculations, the Trustees turned to the profitability data provided. After analysis and discussion, they concluded in each case that, to the extent that Alger Management’s and its affiliates’ relationships with the Fund had been profitable, the profit margin was not unacceptable.
Economies of Scale. On the basis of their discussions with management and their analysis of information provided at the meeting, the Trustees determined that the nature of the Funds and their operations is such that Alger Management is likely to realize economies of scale in the management of each Fund at some point as (and if) it grows in size. In that connection they considered a proposal by Alger Management to revise the advisory fee schedules in the Agreement to reflect fee reductions for each Fund at specified Fund asset levels (“breakpoints”). The Trustees noted that such a measure would have the effect of lowering a Fund’s overall management fee as the Fund grew past a breakpoint, thus sharing with the Fund’s shareholders the economies of scale achieved by Alger Management in managing the growing Fund. The Trustees determined to include the proposal in their deliberations whether to renew the Agreement.
Other Benefits to Alger Management. The Trustees considered whether Alger Management benefits in other ways from its relationship with the Trust. They noted that Alger Management maintains soft-dollar arrangements in connection with the Funds’ brokerage transactions, reports on which are regularly supplied to the Trustees at their quarterly meetings and summaries of which, listing commissions by Fund for the twelve months through June 30, 2012, had been included in the materials supplied prior to the meeting. The Trustees also noted that Alger Management receives fees from the Funds under the Administration Agreement and the Shareholder Administrative Services Agreement and that Alger Inc. provides a substantial portion of the Funds’ equity brokerage and receives shareholder servicing fees from the Funds as well. The Trustees had been provided with information regarding, and had considered, the administration fee, shareholder administrative services fee, brokerage and shareholder servicing fee benefits in connection with their review of the profitability to Alger Management and its affiliates of their relationships with the Funds. As to other benefits received, the Trustees decided that none were so significant as to render Alger Management’s fees excessive.
Conclusions and Determinations. At the conclusion of these discussions, each of the Independent Trustees expressed the opinion that he had been furnished with sufficient information to make an informed business decision with respect to renewal of the Agreement as proposed to be revised to reflect fee reductions at asset breakpoints. Based on its discussions and considerations as described above, the Board made the following conclusions and determinations in respect of each Fund:
80
· The Board concluded that the nature, extent and quality of the services provided to the Fund by Alger Management are adequate and appropriate.
· The Board determined that the Fund’s performance was acceptable.
· The Board concluded that the advisory fee paid to Alger Management by the Fund was reasonable in light of comparative performance and expense and advisory fee information, costs of the services provided and profits to be realized and benefits derived or to be derived by Alger Management and its affiliates from the relationship with the Fund. In this regard the Trustees took into consideration that if Alger Management’s breakpoint proposal was accepted it would have the effect of lowering the Fund’s advisory fee when and if the Fund’s assets reached a specified breakpoint.
· The Board accepted Alger Management’s acknowledgement that economies of scale were likely to be achieved in the management of the Fund and, accordingly, accepted Alger Management’s asset breakpoint proposal as a means by which Alger Management would share the benefits of such economies with Fund shareholders.
The Board considered these conclusions and determinations and, without any one factor being dispositive, determined with respect to each Fund that renewal of the Agreement, as proposed to be revised, was in the best interests of the Fund and its shareholders.
Tax Information
In accordance with subchapter M of the Internal Revenue Code of 1986, as amended, for the year ended October 31, 2012, 33.029% of the Alger Capital Appreciation Institutional Fund’s dividend qualified for the dividends received deduction for corporations. For the year ended October 31, 2012, certain dividends paid by the Funds may be subject to a maximum rate of 15%, as provided by the Jobs and Growth Tax Relief Reconciliation Act of 2003. Of the distributions paid during the fiscal year, 38.279% of the Alger Capital Appreciation Institutional Fund’s may be considered qualified dividend income.
Shareholders should not use the above information to prepare their tax returns. Since the Funds’ fiscal year is not the calendar year, another notification will be sent with respect to calendar year 2012. Such notification, which will reflect the amount to be used by tax payers on their federal income tax returns, will be made in conjunction with Form 1099 DIV and will be mailed in January 2013. Shareholders are advised to consult their own tax advisers with respect to the tax consequences of their investment in the Funds.
81
Privacy Policy
U.S. Consumer Privacy Notice Rev. 01/2011 3/31/11
FACTS | | WHAT DOES ALGER DO WITH YOUR PERSONAL INFORMATION? |
| | |
Why? | | Financial companies choose how they share your personal information, which, under Federal law, means personally identifiable information. Federal law gives consumers the right to limit some but not all sharing. Federal law also requires us to tell you how we collect, share, and protect your personal information. Please read this notice carefully to understand what we do. |
| | |
What? | | The types of personal information we collect and share depend on the product or service you have with us. This information can include: · Social Security number · account balances, transaction history and credit information |
| | |
How? | | All financial companies need to share customers’ personal information to run their everyday business. In the section below, we list the reasons financial companies can share their customers’ personal information; the reasons Alger chooses to share; and whether you can limit this sharing. |
Reasons we can share your personal
information | | Does
Alger share? | | Can you limit
this sharing? |
| | | | |
For our everyday business purposes — such as to process your transactions, maintain your account(s), respond to court orders and legal investigations, or report to credit bureaus | | Yes | | No |
| | | | |
For our marketing purposes — with service providers we use to offer our products and services to you | | Yes | | No |
| | | | |
For joint marketing with other financial companies | | No | | We don’t share |
| | | | |
For our affiliates’ everyday business purposes—information about your transactions and experiences | | Yes | | No |
| | | | |
For our affiliates’ everyday business purposes—information about your creditworthiness | | No | | We don’t share |
| | | | |
For nonaffiliates to market to you — for all credit card accounts | | No | | We don’t share |
| | | | |
For nonaffiliates to market to you — for accounts and services endorsed by another organization | | No | | We don’t share |
| | | | |
For nonaffiliates to market to you — for accounts other than credit card accounts and Sponsored Accounts, such as insurance, investments, deposit and lending | | No | | We don’t share |
82
Who we are | | |
| | |
Who is providing this notice? | | Alger includes Fred Alger Management, Inc. and Fred Alger & Company, Incorporated as well as the following funds: The Alger Funds, The Alger Funds II, The Alger Institutional Funds, The Alger Portfolios, and Alger China-U.S. Growth Fund. |
What we do | | |
| | |
How does Alger protect my personal information? | | To protect your personal information from unauthorized access and use, we use security measures that comply with federal law. These measures include computer safeguards and secured files and buildings. For more information visit alger.com. |
| | |
How does Alger collect my personal information? | | We collect your personal information, for example, when you: · open an account or perform transactions · seek advice about your investments We also collect your personal information from others, such as credit bureaus, affiliates, or other companies. |
| | |
Why can’t I limit all sharing? | | Federal law gives you the right to limit some but not all sharing related to: · sharing for affiliates’ everyday business purposes — information about your creditworthiness · affiliates from using your information to market to you · sharing for nonaffiliates to market to you State laws and individual companies may give you additional rights to limit sharing. |
Definitions | | |
| | |
Affiliates | | Companies related by common ownership or control. They can be financial and nonfinancial companies. · Our affiliates include Fred Alger Management, Inc. and Fred Alger & Company, Incorporated as well as the following funds: The Alger Funds, The Alger Funds II, The Alger Institutional Funds, The Alger Portfolios, and Alger China-U.S. Growth Fund. |
| | |
Nonaffiliates | | Companies not related by common ownership or control. They can be financial and nonfinancial companies |
| | |
Joint marketing | | A formal agreement between nonaffiliated financial companies that together market financial products or services to you. |
83
Proxy Voting Policies
A description of the policies and procedures the Trust uses to determine how to vote proxies relating to portfolio securities and information regarding how the Funds voted proxies relating to portfolio securities during the most recent 12-month period ended June 30 are available, without charge, by calling (800) 992-3863 or online on the Funds’ website at www.alger.com or on the SEC’s website at www.sec.gov.
Fund Holdings
The Funds’ most recent month end portfolio holdings are available approximately sixty days after month end on the Funds’ website at www.alger.com. The Funds also file their complete schedule of portfolio holdings with the SEC for the first and third quarter of each fiscal year on Form N-Q. The Funds’ Forms N-Q are available online on the SEC’s website at www.sec.gov or may be reviewed and copied at the SEC’s Public Reference Room in Washington, D.C. Information regarding the operation of the SEC’s Public Reference Room may be obtained by calling 1-800-SEC-0330. A copy of the most recent quarterly holdings may also be obtained from the Funds by calling (800) 992-3863.
84
THE ALGER INSTITUTIONAL FUNDS
360 Park Avenue South
New York, NY 10010
(800) 992-3863
www.alger.com
Investment Manager
Fred Alger Management, Inc.
360 Park Avenue South
New York, NY 10010
Distributor
Fred Alger & Company, Incorporated
360 Park Avenue South
New York, NY 10010
Transfer Agent and Dividend Disbursing Agent
Boston Financial Data Services, Inc.
P.O. Box 8480
Boston, MA 02266
This report is submitted for the general information of the shareholders of The Alger Institutional Funds. It is not authorized for distribution to prospective investors unless accompanied by an effective Prospectus for the Trust, which contains information concerning the Trust’s investment policies, fees and expenses as well as other pertinent information.

AIFAR
ITEM 2. CODE OF ETHICS.
(a) The Registrant has adopted a code of ethics (the “Code of Ethics”) that applies to its principal executive officer, principal financial officer, principal accounting officer or controller, or persons performing similar functions.
(b) Not applicable.
(c) The Registrant has not amended its Code of Ethics during the period covered by the shareholder report presented in Item 1 hereto.
(d) The Registrant has not granted a waiver or an implicit waiver from a provision of its Code of Ethics during the period covered by the shareholder report presented in Item 1 hereto.
(e) Not applicable.
(f) The Registrant’s Code of Ethics is attached as an Exhibit hereto.
ITEM 3. AUDIT COMMITTEE FINANCIAL EXPERT.
The Board of Trustees of the Registrant determined that Stephen E. O’Neil is an audit committee financial expert (within the meaning of that phrase specified in the instructions to Form N-CSR) on the Registrant’s audit committee. Mr. O’Neil is an “independent” trustee — i.e., he is not an interested person of the Registrant as defined in the Investment Company Act of 1940, nor has he accepted directly or indirectly any consulting, advisory or other compensatory fee from the Registrant, other than in his capacity as Trustee.
ITEM 4. PRINCIPAL ACCOUNTANT FEES AND SERVICES.
a) Audit Fees:
October 31, 2012 | | $ | 115,600 | |
October 31, 2011 | | $ | 106,750 | |
b) Audit-Related Fees: NONE
c) Tax Fees for tax advice, tax compliance and tax planning:
October 31, 2012 | | $ | 20,830 | |
October 31, 2011 | | $ | 17,958 | |
d) All Other Fees:
October 31, 2012 | | $ | 8,920 | |
October 31, 2011 | | $ | 9,200 | |
Other fees include a review and consent for Registrants registration statement filing and a review of the semi-annual financial statements.
e) 1) Audit Committee Pre-Approval Policies And Procedures:
Audit and non-audit services provided by the Registrant’s independent registered public accounting firm (the “Auditors”) on behalf the Registrant must be pre-approved by the Audit Committee. Non-audit services provided by the Auditors on behalf of the Registrant’s Investment Adviser or any entity controlling, controlled by, or under common control with the Investment Adviser must be pre-approved by the Audit Committee if such non-audit services directly relate to the operations or financial reporting of the Registrant.
2) All fees in item 4(b) through 4(d) above were approved by the Registrants’ Audit Committee.
f) Not Applicable
g) Non-Audit Fees:
October 31, 2012 | | $221,557 and €42,600 | |
October 31, 2011 | | $183,344 and €70,575 | |
h) The audit committee of the board of trustees has considered whether the provision of the non-audit services that were rendered to the registrant’s investment adviser and any entity controlling, controlled by, or under common control, with the adviser that provides ongoing services to the registrant that were not approved pursuant to (c)(7)(ii) of Rule 2-01 of Regulation S-X is compatible with maintaining the principle accountant’s independence.
ITEM 5. AUDIT COMMITTEE OF LISTED REGISTRANTS.
Not applicable
ITEM 6. INVESTMENTS.
Not applicable
ITEM 7. DISCLOSURE OF PROXY VOTING POLICIES AND PROCEDURES FOR CLOSED-END MANAGEMENT INVESTMENT COMPANIES.
Not applicable
ITEM 8. PORTFOLIO MANAGERS OF CLOSED-END MANAGEMENT INVESTMENT COMPANIES.
Not applicable
ITEM 9. PURCHASES OF EQUITY SECURITIES BY CLOSED-END MANAGEMENT INVESTMENT COMPANY AND AFFILIATED PURCHASERS.
Not applicable
ITEM 10. SUBMISSION OF MATTERS TO A VOTE OF SECURITY HOLDERS.
None
ITEM 11. CONTROLS AND PROCEDURES.
(a) The Registrant’s principal executive officer and principal financial officer have concluded that the Registrant’s disclosure controls and procedures (as defined in Rule 30a-3(c) under the Investment Company Act of 1940, as amended) are effective based on their evaluation of the disclosure controls and procedures as of a date within 90 days of the filing date of this document.
(b) No changes in the Registrant’s internal control over financial reporting occurred during the Registrant’s second fiscal half-year that materially affected, or are reasonably likely to materially affect, the Registrant’s internal control over financial
reporting.
ITEM 12. EXHIBITS.
(a) (1) Code of Ethics as Exhibit 99.CODE ETH
(a) (2) Certifications of principal executive officer and principal financial officer as required by rule 30a-2(a) under the Investment Company Act of 1940 are attached as Exhibit 99.CERT
(b) Certifications of principal executive officer and principal financial officer as required by rule 30a-2(b) under the Investment Company Act of 1940 are attached as Exhibit 99.906CERT
SIGNATURES
Pursuant to the requirements of the Securities Exchange Act of 1934 and the Investment Company Act of 1940, the registrant has duly caused this report to be signed on its behalf by the undersigned, thereunto duly authorized.
The Alger Institutional Funds
By: | /s/Daniel C. Chung | |
| |
| Daniel C. Chung |
| |
| President |
Date: December 17, 2012
Pursuant to the requirements of the Securities Exchange Act of 1934 and the Investment Company Act of 1940, this report has been signed below by the following persons on behalf of the registrant and in the capacities and on the dates indicated.
By: | /s/Daniel C. Chung | |
| |
| Daniel C. Chung |
| |
| President |
Date: December 17, 2012
By: | /s/Michael D. Martins | |
| |
| Michael D. Martins |
| |
| Treasurer |
Date: December 17, 2012