| | OMB APPROVAL |
| | OMB Number: | 3235-0570 |
| | Expires: | January 31, 2014 |
| UNITED STATES | Estimated average burden hours per response. . . . . . . . . . . . . . . . .20.6 |
| SECURITIES AND EXCHANGE COMMISSION | |
| Washington, D.C. 20549 | |
| | | | |
FORM N-CSR
CERTIFIED SHAREHOLDER REPORT OF REGISTERED
MANAGEMENT INVESTMENT COMPANIES
Investment Company Act file number | 811-07986 |
|
The Alger Institutional Funds |
(Exact name of registrant as specified in charter) |
|
360 Park Ave South New York, New York | | 10010 |
(Address of principal executive offices) | | (Zip code) |
|
Mr. Hal Liebes Fred Alger Management, Inc. 360 Park Ave South New York, New York 10010 |
(Name and address of agent for service) |
|
Registrant’s telephone number, including area code: | 212-806-8800 | |
|
Date of fiscal year end: | October 31 | |
|
Date of reporting period: | October 31, 2011 | |
| | | | | | | | |
ITEM 1. REPORTS TO STOCKHOLDERS.
The Alger
Institutional Funds
ANNUAL REPORT | |
October 31, 2011 | |
THE ALGER INSTITUTIONAL FUNDS
Letter to Our Shareholders (Unaudited) | 1 |
| |
Fund Highlights (Unaudited) | 10 |
| |
Portfolio Summary (Unaudited) | 14 |
| |
Schedules of Investments | 15 |
| |
Statements of Assets and Liabilities | 39 |
| |
Statements of Operations | 41 |
| |
Statements of Changes in Net Assets | 43 |
| |
Financial Highlights | 45 |
| |
Notes to Financial Statements | 53 |
| |
Report of Independent Registered Public Accounting Firm | 71 |
| |
Additional Information (Unaudited) | 73 |
Go Paperless With Alger Electronic Delivery Service
Alger is pleased to provide you with the ability to access regulatory materials online. When documents such as prospectuses and annual and semi-annual reports are available, we’ll send you an e-mail notification with a convenient link that will take you directly to the fund information on our website. To sign up for this free service, simply enroll at www.icsdelivery.com/alger.
Dear Shareholders, | December 1, 2011 |
A Challenging Year
Market volatility surged during the 12-month period ended October 31, 2011, as fears grew over the euro-zone sovereign debt crisis and U.S. deficit spending. As the year progressed, political paralysis on both sides of the Atlantic fueled pessimism over elected officials’ ability to resolve both of those issues. Investors also grew increasingly cautious as the global economic recovery appeared to lose steam. For the 12-month period, the S&P 500 Index generated an 8.09% return.
For Alger, challenging times are nothing new. Over the course of our more than 45-year history, we have honed our investment strategy during both up and down markets. In doing so, we have experienced Black Monday of 1987, the Asian Crisis of 1997, the dot com bubble burst of 2000, the terrorist attacks of 2001, and the subprime mortgage crisis of 2007 to 2010. Based on our review of past crises and our view of U.S. economic fundamentals, we maintain that equity markets—while still facing various challenges—have strong potential to rally once the euro-zone crisis is resolved. We also believe that investor pessimism—as measured by an equity risk premium that has reached a 55-year high and by high free-cash-flow yields—may be excessive, especially when viewed from a historical perspective.
Government Policies Drive Market Volatility
In some ways, markets performed in a predictable fashion during the reporting period. Markets advanced when investors perceived that progress was being made on the U.S. debt ceiling debate and on the euro-zone crisis. Conversely, markets declined when it appeared that those issues were worsening. For example, during the early portion of the third quarter of 2011, concerns grew that feuding parties in Congress would fail to raise the country’s $14.3 trillion debt ceiling, which could have prompted an unpopular government shutdown and a default on U.S. debt. The nations’ leaders finally agreed shortly before an August 2 deadline to raise the debt ceiling and to cut at least $2.1 trillion from the nation’s spending. In the process, however, many investors lost confidence in Washington’s ability to tackle tough problems, including structural budget issues that have contributed to deficit spending. Investors weren’t the only ones to express disappointment. Standard & Poor’s, which had been threatening for months to downgrade its U.S. debt rating, pulled the trigger shortly after the debt ceiling agreement was announced, signaling a lack of confidence in the nation’s ability to enact meaningful budget reform.
Broadly speaking, U.S. economic headline numbers also disappointed. The U.S. Department of Commerce lowered its early second quarter GDP growth estimate of 1.3% to 1% and the International Monetary Fund lowered its 2012 U.S. GDP forecast from 2.7% to 2%. Unemployment in July and August, meanwhile, lingered at a discouragingly high rate of 9.1%. The economic slowdown didn’t go unnoticed: the Conference Board’s Consumer Confidence Index for August tumbled from 59.2 to 44.5, its lowest level in more than two years.
1
In Europe, the sovereign debt problem lingered and at times appeared to worsen, with riots in Greece sparked by new austerity measures being implemented to fulfill requirements of debt relief programs. Debate over the nature, size, and conditions of relief programs continued among leaders of European nations and organizations such as the IMF, the European Financial Stability Facility and the European Central Bank (ECB), sparking fear among investors that the crisis may grind on and send Europe and possibly other regions into an economic slowdown. Concerns grew that troubled European countries would face a funding emergency as high interest rates made issuing debt difficult.
Euro-Zone Crisis in Perspective
Estimates of the range of potential euro-zone write-downs vary considerably, but losses could be as high as 600 billion euros, according to J.P. Morgan. That amount is comparable to losses from the 1997 Asian crisis on an inflation-adjusted basis, but it is dwarfed by the $2.7 trillion in losses resulting from the U.S. subprime mortgage crisis of 2007-2010. That crisis drove U.S. equity markets down more than 40%, until markets eventually rallied. We note that in the Asian Crisis, U.S. equity markets declined approximately 20% and then rallied 33% in the three months after the issue was resolved. We believe that once the fear of the euro crisis is alleviated, a market rally is likely. While it’s hard to say how and when the euro-zone issue will be resolved, elected officials and organizations such as the ECB and the IMF are under increasing pressure to take action. In the meantime, investors’ high level of fear is currently illustrated by an equity risk premium of 6.27%, according to J.P. Morgan. The 6.27% premium, in addition to exceeding the premium during the subprime mortgage crisis, is at a 55-year high, even though the potential scope of the euro-zone crisis is considerably smaller than the subprime debacle.
Reasons for Optimism with U.S. Economy
One reason that we believe a rally is possible once the euro-zone crisis is resolved is that in many ways, the U.S. economy, despite many gloomy headline developments, is stronger than during the subprime mortgage crisis. We believe that the U.S. economy has considerable potential for expanding. In the aftermath of the mortgage crisis, U.S. corporations have consistently expanded their earnings and exhibited strong discipline with spending, which has allowed them to reduce leverage and to accumulate record levels of cash. As of the second quarter, U.S. corporations held $2 trillion in cash, which is an all-time high. Corporate earnings have also been strong, with year-over year quarterly increases having occurred for every quarter since the third quarter of 2009. With strong balance sheets, many U.S. corporations are well prepared to weather moderating GDP growth and to continue to seek attractive opportunities in emerging markets and from large scale trends, such as the increasing use of Internet-connected devices. Deep corporate coffers, furthermore, are allowing businesses to buy back stock, implement or increase dividends, and engage in mergers and acquisitions, all of which support equity valuations and serve as economic stimuli.
2
Unemployment, of course, continues to be a hurdle for the U.S. economic recovery. It is important to realize, however, that the private sector is creating jobs, granted at a discouragingly slow pace, while public employers downsize their workforces. At the same time, however, we believe that GDP growth may eventually surprise on the upside as real estate markets and industrial activity improve. So far, the languishing housing market has been a considerable drag on GDP, with well-above average inventories of homes in many markets. With large volumes of foreclosure sales, real estate values are depressed and tight lending requirements are making it difficult for many Americans to qualify for mortgages. Yet, our proprietary research also shows some glimmer of improvement, with some markets experiencing increases in prices and transaction volumes. This is particularly true with high-end real estate, but other select high-quality markets are also seeing improvements. U.S. industry, particularly automobile manufacturing, may also support GDP growth. Auto manufacturing increased 5.2% in July after having declined for three straight months following supply chain disruptions associated with the Japan disasters. Supply chain improvements since then have clearly facilitated an increase in manufacturing levels, but other factors may be involved. Indeed, demand for new cars in the U.S. has been growing among frugal consumers who have refrained from buying big ticket items. According to estimates from Edmunds.com, Americans are expected to buy only 12.6 million vehicles in 2011, down from 12.9 as estimated previously by the firm. That is a considerable decline from the 16 million to 17 million cars typically sold each year. In delaying new car purchases, consumers have allowed their autos to age considerably, with the average car in the U.S. being 11 years old, according to R. L. Polk & Co., which tracks automobile data. That is a considerable increase from 1995, when the average car was only 8.4 years old. American consumers, of course, will eventually need to replace their aging automobiles. When they do, they will provide a strong growth opportunity for the automobile industry and a boost to U.S. GDP.
Going Forward
Slowing economic growth, the euro-zone crisis, and the debt ceiling debate have clearly damaged investor sentiment. With that in mind, forecasting the timing and the scope of a possible equity rally is fraught with potential pitfalls, including uncertainty over how the U.S. will address deficit spending and the timeframe for a resolution of the euro-zone issue. We note, however, that equity valuations point to stocks being highly attractive. As of October 31, the S&P 500 price-to-earnings ratio was only 14.26 based on 2011 earnings of 87.92 per share, according to Standard & Poor’s. In comparison, the 50-year historical average P/E for the S&P 500 at the end of the third quarter was 19.11, according to Standard & Poor’s.
We remind readers that our bottom up stock selection is not based on making broad market judgments. Rather, we conduct careful analysis of companies and industry sectors. We believe our focus on companies that are best suited to respond to constant changes occurring among consumers and industries can provide our clients with attractive investment performance. We remain committed to our highly-disciplined, research-driven investment strategy that we believe helps us find the most compelling opportunities for our clients.
3
Portfolio Matters
Alger Capital Appreciation Institutional Fund
The Alger Capital Appreciation Institutional Fund returned 8.30% for the 12-month period ended October 31, 2011, compared to the Russell 3000 Growth Index return of 9.92%.
During the period, the largest sector weightings in the Fund were in the Information Technology and Industrials sectors. The largest sector overweight for the period was in Information Technology and the largest sector underweight for the period was in Consumer Staples. Relative outperformance in the Information Technology and Industrials sectors was the most important contributor to performance. Consumer Staples and Financials detracted from results.
Among the most important relative contributors were Cisco Systems, Inc.; VistaPrint NV; BlackRock, Inc.; National Oilwell Varco, Inc.; and Goodrich Corp. Shares of Goodrich performed strongly after the company agreed late in the year to be acquired by United Technologies Corp. at a substantial premium. Goodrich is a leading aerospace systems and parts manufacturer that sells equipment to aircraft producers and replacement parts to air carriers.
Conversely, detracting from overall results on a relative basis were Newfield Exploration Co.; International Business Machines Corp.; Human Genome Sciences, Inc.; Arch Coal, Inc.; and United Continental Holdings, Inc. Share performance of coal producer Arch Coal suffered after the company reported that adverse weather dampened production volumes and increased operating costs due to flooding. Additionally, as the third quarter progressed, commodities oriented companies suffered because of investor concern that a slowing global economy could result in lower commodity prices and adverse operating leverage.
Alger Large Cap Growth Institutional Fund
The Alger Large Cap Growth Institutional Fund returned 6.34% for the 12-month period ended October 31, 2011, compared to the 9.92% return of the Russell 1000 Growth Index.
During the period, the largest sector weightings in the Fund were in the Information Technology and Consumer Discretionary sectors. The largest sector overweight for the period was in Information Technology and the largest sector underweight for the period was in Consumer Discretionary. Relative outperformance in the Health Care and Information Technology sectors was the most important contributor to performance. Consumer Discretionary and Industrials detracted from results.
Among the most important relative contributors were Chevron Corp.; Cisco Systems, Inc.; Baidu, Inc.; Aetna, Inc.; and Bristol-Myers Squibb Co. Bristol-Myers Squibb, which is a global pharmaceutical company with a focus on cardiovascular disease, virology, and oncology, exceeded its second-quarter estimates across its product offerings, and it raised its annual guidance. Additionally, the company
4
benefited from positive data for Aristotle, a phase III trial comparing its stroke prevention medication to alternatives.
Conversely, detracting from overall results on a relative basis were Exxon Mobil Corp.; General Motors Co., Corning, Inc.; Citigroup, Inc.; and Caterpillar, Inc. During the third quarter, heavy construction and mining equipment manufacturer Caterpillar disclosed having poor margins, which were a result of its product mix, supply issues in Japan, and upfront costs associated with the acquisition of mining equipment manufacturer Bucyrus International Inc.
Alger Mid Cap Growth Institutional Fund
The Alger Mid Cap Growth Institutional Fund returned 3.30% for the 12-month period ended October 31, 2011, compared to the 10.08% return of the Russell Midcap Growth Index.
During the period, the largest sector weightings in the Fund were in the Information Technology and Consumer Discretionary sectors. The largest sector overweight for the period was in Information Technology and the largest sector underweight for the period was in Consumer Discretionary. Relative outperformance in the Health Care and Information Technology sectors was the most important contributor to performance. Consumer Discretionary and Industrials detracted from results.
Among the most important relative contributors were Chevron Corp.; Cisco Systems, Inc.; Baidu, Inc.; Aetna, Inc.; and Bristol-Myers Squibb Co. Bristol-Myers Squibb, which is a global pharmaceutical company with a focus on cardiovascular disease, virology, and oncology, exceeded its second-quarter estimates across its product offerings, and it raised its annual guidance. Additionally, the company benefited from positive data for Aristotle, a phase III trial comparing its stroke prevention medication to alternatives.
Conversely, detracting from overall results on a relative basis were Exxon Mobil Corp., General Motors Co., Corning, Inc.; Citigroup, Inc.; and Caterpillar, Inc. During the third quarter, heavy construction and mining equipment manufacturer Caterpillar disclosed having poor margins, which were a result of its product mix, supply issues in Japan, and upfront costs associated with the acquisition of mining equipment manufacturer Bucyrus International Inc.
Alger Small Cap Growth Institutional Fund
For the 12-month period ended October 31, 2011, the Alger Small Cap Growth Institutional Fund returned 6.76%, compared to 9.84% return of the Russell 2000 Growth Index.
During the period, the largest sector weightings in the Fund were in the Information Technology and Consumer Discretionary sectors. The largest sector overweight for the period was in Consumer Discretionary and the largest sector underweight for the period was in Health Care. Relative outperformance in the
5
Information Technology and Utilities sectors was the most important contributor to performance. Industrials and Financials detracted from results.
Among the most important relative contributors were MAKO Surgical Corp., Ulta Salon Cosmetics & Fragrance Inc.; Finisar Corp.; BroadSoft Inc.; and Tupperware Brands Corp. MAKO Surgical is a medical device company that offers robotic technology for minimally invasive orthopedic knee procedures and it is developing hip procedures. Its stock performed well, especially during the third quarter after the company provided a solid second-quarter earnings report and affirmed its timing for the launch of its hip product in the U.S.
Conversely, detracting from overall results on a relative basis were Kindred Healthcare Inc.; Quicksilver Resources, Inc.; Greenhill & Co.; Kraton Performance Polymers, Inc.; and Healthsouth Corp. Chemical company Kraton Performance Polymers, produces styrenic block copolymers for a wide range of applications, including personal care products such as rubber gloves and toothbrush grips. Its products are also used in roofing materials, adhesives, and footwear. Kraton stock performance suffered due to both ongoing economic concerns and third-quarter volume guidance that was weaker than expected as the company noted some destocking by customers.
6
As always, we strive to deliver consistently superior investment results for you, our shareholders, and we thank you for your business and your continued confidence in Alger.
Respectfully submitted,

Daniel C. Chung, CFA
Chief Investment Officer
Investors cannot invest directly in an index. Index performance does not reflect the deduction for fees, expenses or taxes.
This report and the financial statements contained herein are submitted for the general information of shareholders of the Funds. This report is not authorized for distribution to prospective investors in the Funds unless proceeded or accompanied by an effective prospectus for the Funds. Fund returns represent the fiscal 12-month period return of Class I shares.
The performance data quoted represents past performance, which is not an indication or guarantee of future results.
Standardized performance results can be found on the following pages. The investment return and principal value of an investment in a Fund will fluctuate so that an investor’s shares, when redeemed, may be worth more or less than their original cost. Current performance may be lower or higher than the performance quoted. For performance data current to the most recent month-end, visit us at www.alger.com, or call us at (800) 992-3863.
The views and opinions of the Funds’ management in this report are as of the date of the Shareholders letter and are subject to change at any time subsequent to this date. There is no guarantee that any of the assumptions that formed the basis for the opinions stated herein are accurate or that they will materialize. Moreover, the information forming the basis for such assumptions is from sources believed to be reliable; however, there is no guarantee that such information is accurate. Any securities mentioned, whether owned in a Fund or otherwise, are considered in the context of the construction of an overall portfolio of securities and therefore reference to them should not be construed as a recommendation or offer to purchase or sell any such security. Inclusion of such securities in a Fund and transactions in such securities, if any, may be for a variety of reasons, including without limitation, in response to cash flows, inclusion in a benchmark, and risk control. The reference to a specific security should also be understood in such context and not viewed as a statement that the security is a significant holding in a Fund. Please refer to the Schedules of Investments for each Fund that is included in this report for a complete list of Fund holdings as of October 31, 2011. Securities mentioned in the
7
Shareholders Letter, if not found in the Schedule of Investments, may have been held by the Funds during the fiscal period.
A Word about Risk
Growth stocks tend to be more volatile than other stocks as the price of growth stocks tends to be higher in relation to their companies’ earnings and may be more sensitive to market, political and economic developments. Investing in the stock market involves gains and losses and may not be suitable for all investors. Stocks of small and mid-sized companies are subject to greater risk than stocks of larger, more established companies owing to such factors as limited liquidity, inexperienced management, and limited financial resources. Funds that participate in leveraging, such as the Capital Appreciation Institutional Fund, are subject to the risk that borrowing money to leverage will exceed the returns for securities purchased or that the securities purchased may actually go down in value; thus, the Funds’ net asset value can decrease more quickly than if the Funds had not borrowed. For a more detailed discussion of the risks associated with these Funds, please see the Funds’ Prospectus.
Before investing, carefully consider a fund’s investment objective, risks, charges, and expenses. For a prospectus or a summary prospectus containing this and other information about The Alger Institutional Funds call us at (800) 992-3863 or visit us at www.alger.com. Read it carefully before investing.
Fred Alger & Company, Incorporated, Distributor. Member NYSE Euronext, SIPC.
NOT FDIC INSURED. NOT BANK GUARANTEED. MAY LOSE VALUE.
Definitions:
· Standard & Poor’s is a credit rating agency and provider of financial data.
· Edmunds.com provides research and publications covering the automobile industry.
· Russell 3000 Growth Index measures the performance of the broad growth segment of the U.S. equity universe. It includes those Russell 3000 Index companies with higher price-to-book ratios and higher forecasted growth values. The Russell 3000 Index measures the performance of the 3,000 largest U.S. companies based on the total market capitalization, which represents 98% of the U.S. Equity Market.
· Russell 1000 Growth Index is an unmanaged index designed to measure the performance of the largest 1,000 companies in the Russell 3000 Index with higher price-to-book ratios and higher forecasted growth values.
· Russell Midcap Growth Index measures the performance of the mid-cap growth segment of the U.S. equity universe. It includes those Russell Midcap Index companies with higher price-to-book ratios and higher
8
forecasted growth values. The Russell Midcap Index measures the performance of the mid-cap segment of the U.S. equity universe.
· Russell 2000 Growth Index measures the performance of the small-cap growth segment of the U.S. equity universe. It includes those Russell 2000 companies with higher price-to-book ratios and higher forecasted growth values. The Russell 2000 Index measures the performance of the small-cap segment of the U.S. equity universe.
· The Standard & Poor’s 500 Index is an index of large-company common stocks and is considered to be representative of the U.S. stock market.
FUND PERFORMANCE AS OF 9/30/11 (Unaudited)
AVERAGE ANNUAL TOTAL RETURNS
| | 1 YEAR | | 5 YEARS | | 10 YEARS | |
Alger Capital Appreciation Class I (Inception 11/8/93) | | 0.97 | % | 4.39 | % | 5.16 | % |
Alger Capital Appreciation Class R* (Inception 1/27/03) | | 0.45 | % | 3.85 | % | 4.63 | % |
Alger Large Cap Growth Class I (Inception 11/8/93) | | (0.37 | )% | (0.61 | )% | 1.08 | % |
Alger Large Cap Growth Class R* (Inception 1/27/03) | | (1.00 | )% | (1.18 | )% | 0.54 | % |
Alger Mid Cap Growth Class I (Inception 11/8/93) | | (6.18 | )% | (1.54 | )% | 3.06 | % |
Alger Mid Cap Growth Class R* (Inception 1/27/03) | | (6.72 | )% | (2.04 | )% | 2.54 | % |
Alger Small Cap Growth Class I (Inception 11/8/93) | | (4.17 | )% | 0.95 | % | 6.28 | % |
Alger Small Cap Growth Class R* (Inception 1/27/03) | | (4.70 | )% | 0.46 | % | 5.78 | % |
The performance data quoted represents past performance, which is not an indication or a guarantee of future results. The Fund’s average annual total returns include changes in share price and reinvestment of dividends and capital gains.
* | Performance figures prior to 1/27/03, inception of Class R shares, are those of the Fund’s Class I Shares. The performance figures prior to 1/27/03 have been adjusted to reflect the higher operating expenses of Class R shares. |
9
ALGER CAPITAL APPRECIATION INSTITUTIONAL FUND
Fund Highlights Through October 31, 2011 (Unaudited)
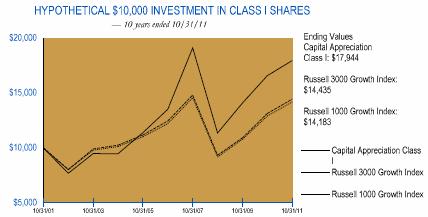
The chart above illustrates the change in value of a hypothetical $10,000 investment made in the Alger Capital Appreciation Institutional Fund Class I shares, the Russell 3000 Growth Index (an unmanaged indices of common stocks) and the Russell 1000 Growth Index (a unmanaged index of common stocks) for the ten years ended October 31, 2011. Figures for the Alger Capital Appreciation Institutional Fund Class I shares, the Russell 3000 Growth Index and the Russell 1000 Growth Index include reinvestment of dividends. Performance for the Alger Capital Appreciation Institutional Fund Class R shares may vary from the results shown above due to differences in expenses the class bears.
PERFORMANCE COMPARISON AS OF 10/31/11
AVERAGE ANNUAL TOTAL RETURNS
| | 1 YEAR | | 5 YEARS | | 10 YEARS | | Since
11/8/1993 | |
Class I (Inception 11/8/93) | | 8.30 | % | 5.82 | % | 6.02 | % | 10.92 | % |
Class R* (Inception 1/27/03) | | 7.75 | % | 5.28 | % | 5.48 | % | 10.37 | % |
Russell 3000 Growth Index | | 9.92 | % | 3.01 | % | 3.74 | % | 6.81 | % |
Russell 1000 Growth Index | | 9.92 | % | 3.04 | % | 3.56 | % | 7.09 | % |
The performance data quoted represents past performance, which is not an indication or a guarantee of future results. The Fund’s average annual total returns include changes in share price and reinvestment of dividends and capital gains. The chart and table above do not reflect the deduction of taxes that a shareholder would have paid on Fund distributions or on the redemption of Fund shares. Investment return and principal will fluctuate and the Fund’s shares, when redeemed, may be worth more or less than their original cost. Current performance may be higher or lower than the performance quoted. For performance current to the most recent month end, visit us at www.alger.com or call us at (800) 992-3863.
* | Performance figures prior to 1/27/03, inception of Class R shares, are those of the Fund’s Class I Shares. The performance figures prior to 1/27/03 have been adjusted to reflect the higher operating expenses of Class R shares. |
10
ALGER LARGE CAP GROWTH INSTITUTIONAL FUND
Fund Highlights Through October 31, 2011 (Unaudited)
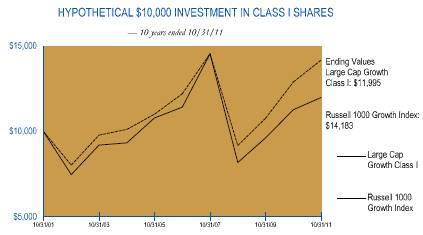
The chart above illustrates the change in value of a hypothetical $10,000 investment made in the Alger Large Cap Growth Institutional Fund Class I shares and the Russell 1000 Growth Index (an unmanaged index of common stocks) for the ten years ended October 31, 2011. The figures for the Alger Large Cap Growth Institutional Fund Class I shares and the Russell 1000 Growth Index include reinvestment of dividends. Performance for the Alger Large Cap Growth Institutional Fund Class R shares may vary from the results shown above due to differences in expenses the class bears.
PERFORMANCE COMPARISON AS OF 10/31/11
AVERAGE ANNUAL TOTAL RETURNS
| | 1 YEAR | | 5 YEARS | | 10 YEARS | | Since
11/8/1993 | |
Class I (Inception 11/8/93) | | 6.34 | % | 0.97 | % | 1.84 | % | 7.02 | % |
Class R* (Inception 1/27/03) | | 5.66 | % | 0.40 | % | 1.29 | % | 6.46 | % |
Russell 1000 Growth Index | | 9.92 | % | 3.04 | % | 3.56 | % | 7.09 | % |
The performance data quoted represents past performance, which is not an indication or a guarantee of future results. The Fund’s average annual total returns include changes in share price and reinvestment of dividends and capital gains. The chart and table above do not reflect the deduction of taxes that a shareholder would have paid on Fund distributions or on the redemption of Fund shares. Investment return and principal will fluctuate and the Fund’s shares, when redeemed, may be worth more or less than their original cost. Current performance may be higher or lower than the performance quoted. For performance current to the most recent month end, visit us at www.alger.com or call us at (800) 992-3863.
* | Performance figures prior to 1/27/03, inception of Class R shares, are those of the Fund’s Class I Shares. The performance figures prior to 1/27/03 have been adjusted to reflect the higher operating expenses of Class R shares. |
11
ALGER MID CAP GROWTH INSTITUTIONAL FUND
Fund Highlights Through October 31, 2011 (Unaudited)
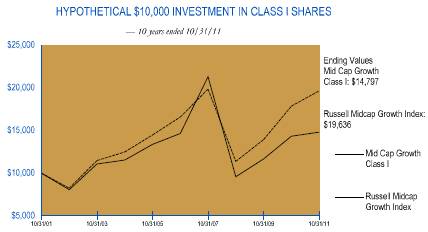
The chart above illustrates the change in value of a hypothetical $10,000 investment made in the Alger Mid Cap Growth Institutional Fund Class I shares and the Russell Midcap Growth Index (an unmanaged index of common stocks) for the ten years ended October 31, 2011. Figures for the Alger Mid Cap Growth Institutional Fund Class I shares and the Russell Midcap Growth Index include reinvestment of dividends. Performance for the Alger Mid Cap Growth Institutional Fund Class R shares may vary from the results shown above due to differences in expenses the class bears.
PERFORMANCE COMPARISON AS OF 10/31/11
AVERAGE ANNUAL TOTAL RETURNS
| | 1 YEAR | | 5 YEARS | | 10 YEARS | | Since
11/8/1993 | |
Class I (Inception 11/8/93) | | 3.30 | % | 0.22 | % | 4.00 | % | 11.37 | % |
Class R* (Inception 1/27/03) | | 2.72 | % | (0.31 | )% | 3.48 | % | 10.82 | % |
Russell Midcap Growth Index | | 10.08 | % | 3.46 | % | 6.98 | % | 8.17 | % |
The performance data quoted represents past performance, which is not an indication or a guarantee of future results. The Fund’s average annual total returns include changes in share price and reinvestment of dividends and capital gains. The chart and table above do not reflect the deduction of taxes that a shareholder would have paid on Fund distributions or on the redemption of Fund shares. Investment return and principal will fluctuate and the Fund’s shares, when redeemed, may be worth more or less than their original cost. Current performance may be higher or lower than the performance quoted. For performance current to the most recent month end, visit us at www.alger.com or call us at (800) 992-3863.
* | Performance figures prior to 1/27/03, inception of Class R shares, are those of the Fund’s Class I Shares. The performance figures prior to 1/27/03 have been adjusted to reflect the higher operating expenses of Class R shares. |
12
ALGER SMALL CAP GROWTH INSTITUTIONAL FUND
Fund Highlights Through October 31, 2011 (Unaudited)
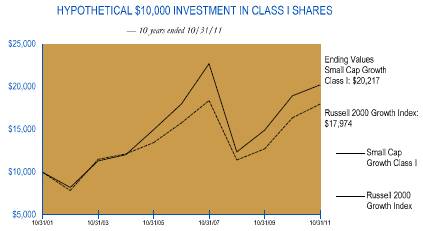
The chart above illustrates the change in value of a hypothetical $10,000 investment made in the Alger Small Cap Growth Institutional Fund Class I shares and the Russell 2000 Growth Index (an unmanaged index of common stocks) for the ten years ended October 31, 2011. The figures for the Alger Small Cap Growth Institutional Fund Class I shares and the Russell 2000 Growth Index include reinvestment of dividends. Performance for the Alger Small Cap Growth Institutional Fund Class R shares may vary from the results shown above due to differences in expenses the class bears.
PERFORMANCE COMPARISON AS OF 10/31/11
AVERAGE ANNUAL TOTAL RETURNS
| | 1 YEAR | | 5 YEARS | | 10 YEARS | | Since
11/8/1993 | |
Class I (Inception 11/8/93) | | 6.76 | % | 2.39 | % | 7.29 | % | 8.57 | % |
Class R* (Inception 1/27/03) | | 6.23 | % | 1.90 | % | 6.79 | % | 8.04 | % |
Russell 2000 Growth Index | | 9.84 | % | 2.68 | % | 6.04 | % | 5.43 | % |
The performance data quoted represents past performance, which is not an indication or a guarantee of future results. The Fund’s average annual total returns include changes in share price and reinvestment of dividends and capital gains. The chart and table above do not reflect the deduction of taxes that a shareholder would have paid on Fund distributions or on the redemption of Fund shares. Investment return and principal will fluctuate and the Fund’s shares, when redeemed, may be worth more or less than their original cost. Current performance may be higher or lower than the performance quoted. For performance current to the most recent month end, visit us at www.alger.com or call us at (800) 992-3863.
* | Performance figures prior to 1/27/03, inception of Class R shares, are those of the Fund’s Class I Shares. The performance figures prior to 1/27/03 have been adjusted to reflect the higher operating expenses of Class R shares. |
13
PORTFOLIO SUMMARY*
October 31, 2011 (Unaudited)
SECTORS | | Alger Capital
Appreciation
Institutional Fund | | Alger Large Cap
Growth
Institutional Fund | | Alger Mid Cap
Growth
Institutional Fund | | Alger Small Cap
Growth
Institutional Fund | |
Consumer Discretionary | | 15.3 | % | 10.0 | % | 18.4 | % | 16.1 | % |
Consumer Staples | | 9.0 | | 10.1 | | 2.0 | | 2.8 | |
Energy | | 10.2 | | 10.3 | | 10.2 | | 7.7 | |
Financials | | 3.0 | | 4.8 | | 5.9 | | 5.5 | |
Health Care | | 12.5 | | 7.9 | | 15.5 | | 17.5 | |
Industrials | | 12.7 | | 12.3 | | 13.6 | | 17.0 | |
Information Technology | | 28.0 | | 30.6 | | 21.8 | | 24.2 | |
Materials | | 4.2 | | 5.3 | | 7.2 | | 4.6 | |
Telecommunication Services | | 2.2 | | 0.9 | | 0.0 | | 0.5 | |
Utilities | | 0.0 | | 0.0 | | 0.0 | | 1.1 | |
Short-Term Investments and Net Other Assets | | 2.9 | | 7.8 | | 5.4 | | 3.0 | |
| | 100.0 | % | 100.0 | % | 100.0 | % | 100.0 | % |
* Based on net assets for each Fund.
14
THE ALGER INSTITUTIONAL FUNDS |
ALGER CAPITAL APPRECIATION INSTITUTIONAL FUND
Schedule of Investments‡ October 31, 2011
| | SHARES | | VALUE | |
COMMON STOCKS—96.7% | | | | | |
ADVERTISING—1.9% | | | | | |
Focus Media Holding Ltd.#* | | 869,600 | | $ | 23,635,729 | |
| | | | | |
AEROSPACE & DEFENSE—1.7% | | | | | |
Goodrich Corp. | | 95,800 | | 11,747,954 | |
United Technologies Corp. | | 119,000 | | 9,279,620 | |
| | | | 21,027,574 | |
AIR FREIGHT & LOGISTICS—1.9% | | | | | |
FedEx Corp. | | 58,300 | | 4,770,689 | |
United Parcel Service, Inc., Cl. B | | 268,800 | | 18,880,512 | |
| | | | 23,651,201 | |
APPAREL ACCESSORIES & LUXURY GOODS—1.3% | | | | | |
Hanesbrands, Inc. * | | 249,300 | | 6,574,041 | |
PVH Corp. | | 135,700 | | 10,097,437 | |
| | | | 16,671,478 | |
APPAREL RETAIL—0.8% | | | | | |
Abercrombie & Fitch Co., Cl. A | | 133,800 | | 9,954,720 | |
| | | | | |
APPLICATION SOFTWARE—1.2% | | | | | |
Adobe Systems, Inc. * | | 140,900 | | 4,143,869 | |
Nice Systems Ltd. #* | | 144,600 | | 5,170,896 | |
Salesforce.com, Inc. * | | 42,300 | | 5,633,091 | |
| | | | 14,947,856 | |
ASSET MANAGEMENT & CUSTODY BANKS—0.4% | | | | | |
Affiliated Managers Group, Inc. * | | 22,000 | | 2,037,420 | |
Blackstone Group LP | | 173,000 | | 2,544,830 | |
| | | | 4,582,250 | |
AUTO PARTS & EQUIPMENT—0.6% | | | | | |
Lear Corp. | | 158,100 | | 7,416,471 | |
| | | | | |
BIOTECHNOLOGY—1.8% | | | | | |
Dendreon Corp. * | | 319,100 | | 3,490,954 | |
Gilead Sciences, Inc. * | | 249,400 | | 10,390,004 | |
Human Genome Sciences, Inc. * | | 203,800 | | 2,090,988 | |
Pharmasset, Inc. * | | 17,500 | | 1,232,000 | |
United Therapeutics Corp. * | | 130,500 | | 5,706,765 | |
| | | | 22,910,711 | |
BROADCASTING—0.3% | | | | | |
CBS Corp., Cl. B | | 134,440 | | 3,469,896 | |
| | | | | |
CABLE & SATELLITE—0.7% | | | | | |
Comcast Corporation, Cl. A | | 378,900 | | 8,885,205 | |
| | | | | |
CASINOS & GAMING—1.0% | | | | | |
Las Vegas Sands Corp.* | | 276,500 | | 12,981,675 | |
| | | | | |
COAL & CONSUMABLE FUELS—0.8% | | | | | |
Arch Coal, Inc. | | 538,900 | | 9,818,758 | |
| | | | | |
COMMUNICATIONS EQUIPMENT—3.0% | | | | | |
Ciena Corp. * | | 329,800 | | 4,346,764 | |
Cisco Systems, Inc. | | 415,300 | | 7,695,509 | |
| | | | | | |
15
| | SHARES | | VALUE | |
COMMON STOCKS—(CONT.) | | | | | |
COMMUNICATIONS EQUIPMENT—(CONT.) | | | | | |
F5 Networks, Inc. * | | 6,800 | | $ | 706,860 | |
Finisar Corp. * | | 62,300 | | 1,276,527 | |
Juniper Networks, Inc. * | | 78,800 | | 1,928,236 | |
QUALCOMM, Inc. | | 410,900 | | 21,202,440 | |
Riverbed Technology, Inc. * | | 53,000 | | 1,461,740 | |
| | | | 38,618,076 | |
COMPUTER HARDWARE—7.1% | | | | | |
Apple, Inc. * | | 214,200 | | 86,703,876 | |
Dell, Inc. * | | 152,700 | | 2,414,187 | |
| | | | 89,118,063 | |
COMPUTER STORAGE & PERIPHERALS—1.8% | | | | | |
EMC Corp. * | | 523,900 | | 12,840,789 | |
NetApp, Inc. * | | 100,300 | | 4,108,288 | |
Seagate Technology PLC | | 395,300 | | 6,384,095 | |
| | | | 23,333,172 | |
CONSTRUCTION & ENGINEERING—0.1% | | | | | |
Chicago Bridge & Iron Co., NV# | | 49,500 | | 1,810,710 | |
| | | | | |
CONSTRUCTION & FARM MACHINERY & HEAVY TRUCKS—1.9% | | | | | |
Caterpillar, Inc. | | 96,500 | | 9,115,390 | |
Cummins, Inc. | | 33,200 | | 3,301,076 | |
Deere & Co. | | 84,600 | | 6,421,140 | |
WABCO Holdings, Inc. * | | 139,500 | | 7,004,295 | |
| | | | 25,841,901 | |
DATA PROCESSING & OUTSOURCED SERVICES—1.3% | | | | | |
Mastercard, Inc. | | 46,300 | | 16,077,212 | |
| | | | | |
DIVERSIFIED BANKS—0.7% | | | | | |
Wells Fargo & Co. | | 351,000 | | 9,094,410 | |
| | | | | |
DIVERSIFIED METALS & MINING—0.8% | | | | | |
Freeport-McMoRan Copper & Gold, Inc. | | 101,500 | | 4,086,390 | |
Molycorp, Inc. * | | 153,440 | | 5,872,149 | |
| | | | 9,958,539 | |
DRUG RETAIL—1.4% | | | | | |
CVS Caremark Corp. | | 506,800 | | 18,396,840 | |
| | | | | |
EDUCATION SERVICES—0.4% | | | | | |
New Oriental Education & Technology Group#* | | 174,000 | | 5,157,360 | |
| | | | | |
ENVIRONMENTAL & FACILITIES SERVICES—0.6% | | | | | |
Republic Services, Inc. | | 245,400 | | 6,984,084 | |
| | | | | |
FERTILIZERS & AGRICULTURAL CHEMICALS—1.0% | | | | | |
Monsanto Co. | | 80,300 | | 5,841,825 | |
Mosaic Co., /The | | 115,500 | | 6,763,680 | |
| | | | 12,605,505 | |
FOOTWEAR—1.1% | | | | | |
NIKE, Inc., Cl. B | | 73,500 | | 7,081,725 | |
| | | | | | |
16
| | SHARES | | VALUE | |
COMMON STOCKS—(CONT.) | | | | | |
FOOTWEAR—(CONT.) | | | | | |
Salvatore Ferragamo Italia SpA * | | 393,550 | | $ | 6,376,510 | |
| | | | 13,458,235 | |
GENERAL MERCHANDISE STORES—1.5% | | | | | |
Dollar General Corp. * | | 170,400 | | 6,758,064 | |
Target Corp. | | 232,300 | | 12,718,425 | |
| | | | 19,476,489 | |
HEALTH CARE EQUIPMENT—1.4% | | | | | |
Covidien PLC | | 344,240 | | 16,193,050 | |
Insulet Corp. * | | 133,500 | | 2,178,720 | |
| | | | 18,371,770 | |
HEALTH CARE FACILITIES—0.5% | | | | | |
Universal Health Services, Inc., Cl. B | | 157,500 | | 6,295,275 | |
| | | | | |
HEALTH CARE SERVICES—1.4% | | | | | |
Express Scripts, Inc.* | | 377,200 | | 17,249,356 | |
| | | | | |
HOME IMPROVEMENT RETAIL—1.5% | | | | | |
Lowe’s Companies, Inc. | | 925,400 | | 19,451,908 | |
| | | | | |
HOMEBUILDING—0.7% | | | | | |
Lennar Corp., Cl. A | | 116,400 | | 1,925,256 | |
Toll Brothers, Inc. * | | 398,000 | | 6,941,120 | |
| | | | 8,866,376 | |
HOUSEHOLD PRODUCTS—2.1% | | | | | |
Procter & Gamble Co., /The | | 410,300 | | 26,255,097 | |
| | | | | |
HUMAN RESOURCE & EMPLOYMENT SERVICES—0.4% | | | | | |
Towers Watson & Co. | | 70,370 | | 4,623,309 | |
| | | | | |
INDUSTRIAL CONGLOMERATES—1.0% | | | | | |
Tyco International Ltd. | | 268,555 | | 12,232,680 | |
| | | | | |
INDUSTRIAL MACHINERY—2.7% | | | | | |
Eaton Corp. | | 122,900 | | 5,508,378 | |
Ingersoll-Rand PLC | | 153,100 | | 4,766,003 | |
Stanley Black & Decker, Inc. | | 329,700 | | 21,051,345 | |
Timken Co. | | 91,200 | | 3,841,344 | |
| | | | 35,167,070 | |
INTEGRATED OIL & GAS—4.0% | | | | | |
ConocoPhillips | | 385,600 | | 26,857,040 | |
Royal Dutch Shell PLC # | | 339,800 | | 24,095,218 | |
| | | | 50,952,258 | |
INTERNET RETAIL—1.8% | | | | | |
Amazon.com, Inc. * | | 103,400 | | 22,076,934 | |
NetFlix, Inc. * | | 10,600 | | 870,048 | |
| | | | 22,946,982 | |
INTERNET SOFTWARE & SERVICES—6.2% | | | | | |
eBay, Inc. * | | 507,200 | | 16,144,176 | |
Google, Inc., Cl. A * | | 44,810 | | 26,556,198 | |
IAC/InterActiveCorp. * | | 347,300 | | 14,180,259 | |
| | | | | | |
17
| | SHARES | | VALUE | |
COMMON STOCKS—(CONT.) | | | | | |
INTERNET SOFTWARE & SERVICES—(CONT.) | | | | | |
VistaPrint NV * | | 472,902 | | $ | 16,513,738 | |
Yahoo! Inc. * | | 314,630 | | 4,920,813 | |
| | | | 78,315,184 | |
IT CONSULTING & OTHER SERVICES—2.8% | | | | | |
Cognizant Technology Solutions Corp., Cl. A * | | 78,000 | | 5,674,500 | |
International Business Machines Corp. | | 163,900 | | 30,260,857 | |
| | | | 35,935,357 | |
LIFE SCIENCES TOOLS & SERVICES—0.8% | | | | | |
Thermo Fisher Scientific, Inc.* | | 209,300 | | 10,521,511 | |
| | | | | |
MANAGED HEALTH CARE—3.2% | | | | | |
Aetna, Inc. | | 663,600 | | 26,384,735 | |
CIGNA Corp. | | 138,300 | | 6,132,222 | |
UnitedHealth Group, Inc. | | 150,000 | | 7,198,500 | |
| | | | 39,715,457 | |
MORTGAGE REITS—0.6% | | | | | |
Annaly Capital Management, Inc. | | 452,600 | | 7,626,310 | |
| | | | | |
MOVIES & ENTERTAINMENT—0.4% | | | | | |
Liberty Media Corp., Capital, Cl. A* | | 73,200 | | 5,623,224 | |
| | | | | |
OIL & GAS EQUIPMENT & SERVICES—4.0% | | | | | |
Baker Hughes, Inc. | | 524,805 | | 30,433,442 | |
Halliburton Company | | 371,600 | | 13,882,976 | |
National Oilwell Varco, Inc. | | 86,500 | | 6,170,045 | |
| | | | 50,486,463 | |
OIL & GAS EXPLORATION & PRODUCTION—0.8% | | | | | |
Chesapeake Energy Corp. | | 190,140 | | 5,346,737 | |
Pioneer Natural Resources Co. | | 32,300 | | 2,709,970 | |
Whitinig Petroleum Corp. * | | 58,400 | | 2,718,520 | |
| | | | 10,775,227 | |
OIL & GAS REFINING & MARKETING—0.6% | | | | | |
Marathon Petroleum Corp. | | 208,900 | | 7,499,510 | |
| | | | | |
OTHER DIVERSIFIED FINANCIAL SERVICES—0.5% | | | | | |
JPMorgan Chase & Co. | | 183,900 | | 6,392,364 | |
| | | | | |
PACKAGED FOODS & MEATS—0.7% | | | | | |
Unilever NV | | 266,200 | | 9,191,886 | |
| | | | | |
PAPER PRODUCTS—0.5% | | | | | |
International Paper Co. | | 225,800 | | 6,254,660 | |
| | | | | |
PHARMACEUTICALS—3.1% | | | | | |
Allergan, Inc. | | 28,700 | | 2,414,244 | |
Auxilium Pharmaceuticals, Inc. * | | 31,276 | | 486,655 | |
Bristol-Myers Squibb Co. | | 217,600 | | 6,873,984 | |
Johnson & Johnson | | 207,400 | | 13,354,486 | |
Pfizer, Inc. | | 732,900 | | 14,115,654 | |
Teva Pharmaceutical Industries Ltd. # | | 58,000 | | 2,369,300 | |
| | | | 39,614,323 | |
| | | | | | |
18
| | SHARES | | VALUE | |
COMMON STOCKS—(CONT.) | | | | | |
RAILROADS—0.8% | | | | | |
CSX Corp. | | 449,900 | | $ | 9,992,279 | |
| | | | | |
RESEARCH & CONSULTING SERVICES—0.6% | | | | | |
IHS, Inc., Cl. A * | | 33,600 | | 2,822,064 | |
Verisk Analytic, Inc., Cl. A * | | 146,100 | | 5,135,415 | |
| | | | 7,957,479 | |
RESIDENTIAL REITS—0.6% | | | | | |
Home Properties, Inc. | | 126,300 | | 7,439,070 | |
| | | | | |
RESTAURANTS—1.3% | | | | | |
McDonald’s Corp. | | 145,600 | | 13,518,960 | |
Starbucks Corp. | | 76,600 | | 3,243,244 | |
| | | | 16,762,204 | |
SEMICONDUCTORS—3.0% | | | | | |
Avago Technologies Ltd. | | 268,200 | | 9,057,114 | |
Broadcom Corp., Cl. A * | | 116,000 | | 4,186,440 | |
ON Semiconductor Corp. * | | 625,600 | | 4,735,792 | |
Skyworks Solutions, Inc. * | | 314,600 | | 6,232,226 | |
Taiwan Semiconductor Manufacturing Co., Ltd. # | | 531,600 | | 6,708,792 | |
Texas Instruments, Inc. | | 135,200 | | 4,154,696 | |
Xilinx, Inc. | | 78,500 | | 2,626,610 | |
| | | | 37,701,670 | |
SOFT DRINKS—3.0% | | | | | |
Coca-Cola Co., /The | | 246,300 | | 16,827,216 | |
Hansen Natural Corp. * | | 13,700 | | 1,220,533 | |
PepsiCo, Inc. | | 303,000 | | 19,073,850 | |
| | | | 37,121,599 | |
SPECIALIZED FINANCE—0.2% | | | | | |
CME Group, Inc. | | 9,300 | | 2,562,708 | |
| | | | | |
SPECIALTY CHEMICALS—1.7% | | | | | |
Celanese Corp. | | 153,600 | | 6,689,280 | |
Cytec Industries, Inc. | | 206,600 | | 9,228,822 | |
Rockwood Holdings, Inc. * | | 145,000 | | 6,675,800 | |
| | | | 22,593,902 | |
STEEL—0.1% | | | | | |
Allegheny Technologies, Inc. | | 26,300 | | 1,220,320 | |
| | | | | |
SYSTEMS SOFTWARE—1.6% | | | | | |
Oracle Corp. | | 635,900 | | 20,838,443 | |
| | | | | |
TOBACCO—1.8% | | | | | |
Philip Morris International, Inc. | | 335,505 | | 23,441,734 | |
| | | | | |
TRADING COMPANIES & DISTRIBUTORS—0.7% | | | | | |
United Rentals, Inc. * | | 299,900 | | 7,020,659 | |
WESCO International, Inc. * | | 27,600 | | 1,337,496 | |
| | | | 8,358,155 | |
TRUCKING—0.3% | | | | | |
Hertz Global Holdings, Inc.* | | 327,015 | | 3,793,374 | |
| | | | | | |
19
| | SHARES | | VALUE | |
COMMON STOCKS—(CONT.) | | | | | |
WIRELESS TELECOMMUNICATION SERVICES—2.2% | | | | | |
American Tower Corp., Cl. A * | | 194,300 | | $ | 10,705,930 | |
SBA Communications Corp. * | | 148,700 | | 5,663,983 | |
Vodafone Group PLC # | | 398,400 | | 11,091,456 | |
| | | | 27,461,369 | |
TOTAL COMMON STOCKS
(Cost $1,166,334,949) | | | | 1,227,491,983 | |
| | | | | |
CONVERTIBLE PREFERRED STOCK—0.3% | | | | | |
PHARMACEUTICALS—0.3% | | | | | |
Merrimack Pharmaceuticals, Inc., Series G*,(L3),(a)
(Cost $3,475,570) | | 496,510 | | 3,475,570 | |
| | | | | | |
| | PRINCIPAL
AMOUNT | | | |
CONVERTIBLE CORPORATE BONDS—0.1% | | | | | |
DIVERSIFIED METALS & MINING—0.1% | | | | | |
Molycorp, Inc., 3.25%, 6/15/16(L2)(b)
(Cost $1,040,000) | | 1,040,000 | | 1,010,100 | |
| | | | | |
Total Investments
(Cost $1,170,850,519)(c) | | 97.1 | % | 1,231,977,653 | |
Other Assets in Excess of Liabilities | | 2.9 | | 36,891,765 | |
| | | | | |
NET ASSETS | | 100.0 | % | $ | 1,268,869,418 | |
| | | | | | |
‡ | Securities classified as Level 1 for ASC 820 disclosure purposes based on valuation inputs unless otherwise noted. |
| |
* | Non-income producing security. |
# | American Depository Receipts. |
(a) | Restricted Security - Investment in security not registered under the Securities Act of 1933. The investment is deemed to be illiquid and may be sold only to qualified institutional buyers. Security was acquired on April 6, 2011 for a cost of $3,475,570 and represents 0.3% of the net assets of the Fund. |
(b) | Pursuant to Securities and Exchange Commission Rule 144A, these securities may be sold prior to their maturity only to qualified institutional buyers. These securities are deemed to be liquid and represent 0.1% of the net assets of the Fund. |
(c) | At October 31, 2011, the net unrealized appreciation on investments, based on cost for federal income tax purposes of $1,197,704,656, amounted to $34,272,997 which consisted of aggregate gross unrealized appreciation of $95,811,811 and aggregate gross unrealized depreciation of $61,538,814. |
(L2) | Security classified as Level 2 for ASC 820 disclosure purposes based on valuation inputs. |
(L3) | Security classified as Level 3 for ASC 820 disclosure purposes based on valuation inputs. |
Industry classifications are unaudited.
See Notes to Financial Statements.
20
THE ALGER INSTITUTIONAL FUNDS | ALGER LARGE CAP GROWTH INSTITUTIONAL FUND
Schedule of Investments‡ October 31, 2011
| | SHARES | | VALUE | |
COMMON STOCKS—92.2% | | | | | |
AEROSPACE & DEFENSE—2.5% | | | | | |
Boeing Co., /The | | 2,950 | | $ | 194,081 | |
General Dynamics Corp. | | 2,900 | | 186,151 | |
United Technologies Corp. | | 2,500 | | 194,949 | |
| | | | 575,181 | |
AIR FREIGHT & LOGISTICS—2.1% | | | | | |
FedEx Corp. | | 2,800 | | 229,123 | |
United Parcel Service, Inc., Cl. B | | 3,250 | | 228,280 | |
| | | | 457,403 | |
AIRLINES—0.5% | | | | | |
Delta Air Lines, Inc.* | | 12,550 | | 106,926 | |
| | | | | |
APPLICATION SOFTWARE—1.6% | | | | | |
Adobe Systems, Inc. * | | 6,550 | | 192,636 | |
Salesforce.com, Inc. * | | 1,200 | | 159,804 | |
| | | | 352,440 | |
ASSET MANAGEMENT & CUSTODY BANKS—1.7% | | | | | |
BlackRock, Inc. | | 1,000 | | 157,790 | |
Blackstone Group LP | | 14,650 | | 215,502 | |
| | | | 373,292 | |
AUTO PARTS & EQUIPMENT—0.8% | | | | | |
Johnson Controls, Inc. | | 5,300 | | 174,529 | |
| | | | | |
AUTOMOBILE MANUFACTURERS—0.7% | | | | | |
Ford Motor Co.* | | 12,300 | | 143,664 | |
| | | | | |
BIOTECHNOLOGY—0.8% | | | | | |
Gilead Sciences, Inc.* | | 4,400 | | 183,304 | |
| | | | | |
BREWERS—0.5% | | | | | |
Anheuser-Busch InBev NV# | | 1,950 | | 108,167 | |
| | | | | |
CABLE & SATELLITE—0.8% | | | | | |
Comcast Corporation, Cl. A | | 7,150 | | 167,668 | |
| | | | | |
CASINOS & GAMING—0.9% | | | | | |
Las Vegas Sands Corp.* | | 4,400 | | 206,580 | |
| | | | | |
COAL & CONSUMABLE FUELS—0.8% | | | | | |
Peabody Energy Corp. | | 3,900 | | 169,143 | |
| | | | | |
COMMUNICATIONS EQUIPMENT—4.4% | | | | | |
Cisco Systems, Inc. | | 10,050 | | 186,227 | |
Corning, Inc. | | 15,400 | | 220,066 | |
Juniper Networks, Inc. * | | 5,700 | | 139,479 | |
QUALCOMM, Inc. | | 7,800 | | 402,480 | |
| | | | 948,252 | |
COMPUTER HARDWARE—5.7% | | | | | |
Apple, Inc.* | | 3,150 | | 1,275,056 | |
| | | | | |
COMPUTER STORAGE & PERIPHERALS—2.1% | | | | | |
EMC Corp. * | | 11,350 | | 278,189 | |
NetApp, Inc. * | | 4,600 | | 188,416 | |
| | | | 466,605 | |
| | | | | | |
21
| | SHARES | | VALUE | |
COMMON STOCKS—(CONT.) | | | | | |
CONSTRUCTION & FARM MACHINERY & HEAVY TRUCKS—1.6% | | | | | |
Caterpillar, Inc. | | 2,300 | | $ | 217,258 | |
Cummins, Inc. | | 1,350 | | 134,231 | |
| | | | 351,489 | |
CONSUMER FINANCE—0.4% | | | | | |
American Express Co. | | 1,900 | | 96,178 | |
| | | | | |
DATA PROCESSING & OUTSOURCED SERVICES—1.0% | | | | | |
Mastercard, Inc. | | 600 | | 208,344 | |
| | | | | |
DIVERSIFIED CHEMICALS—1.5% | | | | | |
Dow Chemical Co., /The | | 5,100 | | 142,188 | |
EI Du Pont de Nemours & Co. | | 4,150 | | 199,491 | |
| | | | 341,679 | |
DIVERSIFIED METALS & MINING—1.4% | | | | | |
Cliffs Natural Resources, Inc. | | 2,050 | | 139,851 | |
Freeport-McMoRan Copper & Gold, Inc. | | 4,250 | | 171,105 | |
| | | | 310,956 | |
DRUG RETAIL—2.1% | | | | | |
CVS Caremark Corp. | | 9,200 | | 333,960 | |
Walgreen Co. | | 3,600 | | 119,520 | |
| | | | 453,480 | |
ELECTRICAL COMPONENTS & EQUIPMENT—0.8% | | | | | |
Emerson Electric Co. | | 3,450 | | 166,014 | |
| | | | | |
ENVIRONMENTAL & FACILITIES SERVICES—0.8% | | | | | |
Republic Services, Inc. | | 6,450 | | 183,567 | |
| | | | | |
FERTILIZERS & AGRICULTURAL CHEMICALS—0.9% | | | | | |
Mosaic Co., /The | | 3,350 | | 196,176 | |
| | | | | |
FOOTWEAR—0.8% | | | | | |
NIKE, Inc., Cl. B | | 1,750 | | 168,613 | |
| | | | | |
GENERAL MERCHANDISE STORES—1.0% | | | | | |
Target Corp. | | 4,000 | | 219,000 | |
| | | | | |
GOLD—0.8% | | | | | |
Goldcorp, Inc. | | 3,350 | | 163,614 | |
| | | | | |
HEALTH CARE EQUIPMENT—0.7% | | | | | |
Covidien PLC | | 3,400 | | 159,936 | |
| | | | | |
HEALTH CARE SERVICES—1.2% | | | | | |
Express Scripts, Inc.* | | 5,750 | | 262,948 | |
| | | | | |
HOME IMPROVEMENT RETAIL—1.1% | | | | | |
Lowe’s Companies, Inc. | | 11,600 | | 243,832 | |
| | | | | |
HOTELS RESORTS & CRUISE LINES—1.7% | | | | | |
Carnival Corp. | | 4,750 | | 167,248 | |
Starwood Hotels & Resorts Worldwide, Inc. | | 3,850 | | 192,923 | |
| | | | 360,171 | |
HOUSEHOLD PRODUCTS—1.4% | | | | | |
Procter & Gamble Co., /The | | 4,700 | | 300,753 | |
| | | | | | |
22
| | SHARES | | VALUE | |
COMMON STOCKS—(CONT.) | | | | | |
HYPERMARKETS & SUPER CENTERS—1.2% | | | | | |
Wal-Mart Stores, Inc. | | 4,650 | | $ | 263,748 | |
| | | | | |
INDUSTRIAL CONGLOMERATES—1.0% | | | | | |
Tyco International Ltd. | | 4,550 | | 207,253 | |
| | | | | |
INDUSTRIAL MACHINERY—1.9% | | | | | |
Eaton Corp. | | 3,100 | | 138,942 | |
Ingersoll-Rand PLC | | 2,900 | | 90,277 | |
Stanley Black & Decker, Inc. | | 2,750 | | 175,588 | |
| | | | 404,807 | |
INTEGRATED OIL & GAS—5.0% | | | | | |
Chevron Corp. | | 3,500 | | 367,675 | |
Exxon Mobil Corp. | | 5,900 | | 460,730 | |
Royal Dutch Shell PLC # | | 3,950 | | 280,095 | |
| | | | 1,108,500 | |
INTERNET RETAIL—1.6% | | | | | |
Amazon.com, Inc.* | | 1,700 | | 362,966 | |
| | | | | |
INTERNET SOFTWARE & SERVICES—5.7% | | | | | |
Baidu, Inc. #* | | 950 | | 133,171 | |
eBay, Inc. * | | 6,100 | | 194,163 | |
Google, Inc., Cl. A * | | 1,152 | | 682,720 | |
LinkedIn Corp. * | | 1,250 | | 112,375 | |
Yahoo! Inc. * | | 7,550 | | 118,082 | |
| | | | 1,240,511 | |
IT CONSULTING & OTHER SERVICES—3.2% | | | | | |
Cognizant Technology Solutions Corp., Cl. A * | | 2,400 | | 174,600 | |
International Business Machines Corp. | | 2,850 | | 526,196 | |
| | | | 700,796 | |
LIFE SCIENCES TOOLS & SERVICES—0.7% | | | | | |
Thermo Fisher Scientific, Inc.* | | 3,050 | | 153,324 | |
| | | | | |
MANAGED HEALTH CARE—0.9% | | | | | |
Aetna, Inc. | | 4,950 | | 196,812 | |
| | | | | |
MOVIES & ENTERTAINMENT—0.6% | | | | | |
Walt Disney Co., /The | | 3,900 | | 136,032 | |
| | | | | |
OIL & GAS EQUIPMENT & SERVICES—2.9% | | | | | |
Baker Hughes, Inc. | | 3,700 | | 214,563 | |
National Oilwell Varco, Inc. | | 1,500 | | 106,995 | |
Schlumberger Ltd. | | 4,250 | | 312,248 | |
| | | | 633,806 | |
OIL & GAS EXPLORATION & PRODUCTION—1.6% | | | | | |
Devon Energy Corp. | | 4,000 | | 259,800 | |
Nexen, Inc. | | 4,800 | | 81,504 | |
| | | | 341,304 | |
OTHER DIVERSIFIED FINANCIAL SERVICES—2.0% | | | | | |
BM&F Bovespa SA | | 27,250 | | 162,688 | |
Citigroup, Inc. | | 2,900 | | 91,611 | |
JPMorgan Chase & Co. | | 4,650 | | 161,634 | |
| | | | 415,933 | |
| | | | | | |
23
| | SHARES | | VALUE | |
COMMON STOCKS—(CONT.) | | | | | |
PAPER PRODUCTS—0.7% | | | | | |
International Paper Co. | | 5,300 | | $ | 146,810 | |
| | | | | |
PHARMACEUTICALS—3.6% | | | | | |
Allergan, Inc. | | 1,400 | | 117,768 | |
Johnson & Johnson | | 4,100 | | 263,998 | |
Pfizer, Inc. | | 10,150 | | 195,489 | |
Teva Pharmaceutical Industries Ltd. # | | 4,450 | | 181,783 | |
| | | | 759,038 | |
RAILROADS—1.1% | | | | | |
CSX Corp. | | 10,350 | | 229,874 | |
| | | | | |
SEMICONDUCTORS—2.4% | | | | | |
Broadcom Corp., Cl. A * | | 4,700 | | 169,622 | |
Intel Corp. | | 4,750 | | 116,565 | |
Micron Technology, Inc. * | | 11,250 | | 62,888 | |
Texas Instruments, Inc. | | 5,350 | | 164,406 | |
| | | | 513,481 | |
SOFT DRINKS—3.4% | | | | | |
Coca-Cola Co., /The | | 5,200 | | 355,264 | |
PepsiCo, Inc. | | 6,200 | | 390,290 | |
| | | | 745,554 | |
SPECIALIZED FINANCE—0.7% | | | | | |
CME Group, Inc. | | 550 | | 151,558 | |
| | | | | |
SYSTEMS SOFTWARE—4.5% | | | | | |
Check Point Software Technologies Ltd. * | | 2,400 | | 138,312 | |
Microsoft Corp. | | 9,850 | | 262,305 | |
Oracle Corp. | | 13,850 | | 453,864 | |
VMware, Inc., Cl. A * | | 1,200 | | 117,300 | |
| | | | 971,781 | |
TOBACCO—1.5% | | | | | |
Philip Morris International, Inc. | | 4,600 | | 321,402 | |
| | | | | |
WIRELESS TELECOMMUNICATION SERVICES—0.9% | | | | | |
American Tower Corp., Cl. A* | | 3,550 | | 195,605 | |
| | | | | |
TOTAL COMMON STOCKS
(Cost $19,159,302) | | | | 20,095,855 | |
| | | | | |
Total Investments
(Cost $19,159,302)(a) | | 92.2 | % | 20,095,855 | |
Other Assets in Excess of Liabilities | | 7.8 | | 1,702,729 | |
| | | | | |
NET ASSETS | | 100.0 | % | $ | 21,798,584 | |
‡ | Securities classified as Level 1 for ASC 820 disclosure purposes based on valuation inputs unless otherwise noted. |
| |
* | Non-income producing security. |
# | American Depository Receipts. |
24
(a) | At October 31, 2011, the net unrealized appreciation on investments, based on cost for federal income tax purposes of $19,167,042, amounted to $928,813 which consisted of aggregate gross unrealized appreciation of $2,167,615 and aggregate gross unrealized depreciation of $1,238,802. |
Industry classifications are unaudited.
See Notes to Financial Statements.
25
THE ALGER INSTITUTIONAL FUNDS | ALGER MID CAP GROWTH INSTITUTIONAL FUND |
Schedule of Investments‡ October 31, 2011 |
| | SHARES | | VALUE | |
COMMON STOCKS—91.2% | | | | | |
AEROSPACE & DEFENSE—2.5% | | | | | |
Spirit Aerosystems Holdings, Inc., Cl. A * | | 296,700 | | $ | 5,064,669 | |
Triumph Group, Inc. | | 63,600 | | 3,695,160 | |
| | | | 8,759,829 | |
APPAREL ACCESSORIES & LUXURY GOODS—2.5% | | | | | |
Coach, Inc. | | 83,200 | | 5,413,824 | |
PVH Corp. | | 51,400 | | 3,824,674 | |
| | | | 9,238,498 | |
APPAREL RETAIL—1.5% | | | | | |
Abercrombie & Fitch Co., Cl. A | | 36,500 | | 2,715,600 | |
Fast Retailing Co., Ltd. (L2) | | 14,000 | | 2,514,895 | |
| | | | 5,230,495 | |
APPLICATION SOFTWARE—4.8% | | | | | |
Adobe Systems, Inc. * | | 122,700 | | 3,608,607 | |
Cadence Design Systems, Inc. * | | 484,500 | | 5,363,415 | |
Informatica Corp. * | | 58,700 | | 2,670,850 | |
QLIK Technologies, Inc. * | | 117,300 | | 3,351,261 | |
SolarWinds, Inc. * | | 71,400 | | 2,060,604 | |
| | | | 17,054,737 | |
ASSET MANAGEMENT & CUSTODY BANKS—3.0% | | | | | |
Affiliated Managers Group, Inc. * | | 30,500 | | 2,824,605 | |
Blackstone Group LP | | 258,300 | | 3,799,593 | |
KKR & Co., LP | | 291,900 | | 3,934,812 | |
| | | | 10,559,010 | |
BIOTECHNOLOGY—3.3% | | | | | |
Alexion Pharmaceuticals, Inc. * | | 12,300 | | 830,373 | |
Dendreon Corp. * | | 186,000 | | 2,034,840 | |
Human Genome Sciences, Inc. * | | 230,000 | | 2,359,800 | |
Pharmasset, Inc. * | | 54,700 | | 3,850,880 | |
United Therapeutics Corp. * | | 62,000 | | 2,711,260 | |
| | | | 11,787,153 | |
BROADCASTING—1.4% | | | | | |
CBS Corp., Cl. B | | 103,100 | | 2,661,011 | |
Discovery Communications, Inc., Series C * | | 58,000 | | 2,295,060 | |
| | | | 4,956,071 | |
CASINOS & GAMING—1.1% | | | | | |
Wynn Resorts Ltd. | | 27,900 | | 3,705,120 | |
| | | | | |
CHEMICALS—1.2% | | | | | |
Metabolix, Inc.* | | 793,160 | | 4,068,911 | |
| | | | | |
COAL & CONSUMABLE FUELS—2.3% | | | | | |
Arch Coal, Inc. | | 238,400 | | 4,343,648 | |
Patriot Coal Corp. * | | 46,500 | | 584,040 | |
Peabody Energy Corp. | | 71,300 | | 3,092,281 | |
| | | | 8,019,969 | |
COMMUNICATIONS EQUIPMENT—5.2% | | | | | |
Acme Packet, Inc. * | | 145,000 | | 5,250,450 | |
Ciena Corp. * | | 213,700 | | 2,816,566 | |
| | | | | | |
26
| | SHARES | | VALUE | |
COMMON STOCKS—(CONT.) | | | | | |
COMMUNICATIONS EQUIPMENT—(CONT.) | | | | | |
Finisar Corp. * | | 76,300 | | $ | 1,563,387 | |
Juniper Networks, Inc. * | | 81,300 | | 1,989,411 | |
Polycom, Inc. * | | 101,200 | | 1,672,836 | |
Riverbed Technology, Inc. * | | 184,000 | | 5,074,720 | |
| | | | 18,367,370 | |
COMPUTER HARDWARE—0.5% | | | | | |
Teradata Corp.* | | 28,600 | | 1,706,276 | |
| | | | | |
COMPUTER STORAGE & PERIPHERALS—1.6% | | | | | |
NetApp, Inc. * | | 112,800 | | 4,620,288 | |
Seagate Technology PLC | | 68,600 | | 1,107,890 | |
| | | | 5,728,178 | |
CONSTRUCTION & ENGINEERING—1.5% | | | | | |
Aecom Technology Corp. * | | 133,700 | | 2,797,004 | |
Chicago Bridge & Iron Co., NV #,^ | | 72,300 | | 2,644,734 | |
| | | | 5,441,738 | |
CONSTRUCTION & FARM MACHINERY & HEAVY TRUCKS—0.2% | | | | | |
Westport Innovations, Inc.* | | 18,600 | | 562,650 | |
| | | | | |
CONSTRUCTION MATERIALS—0.8% | | | | | |
Anhui Conch Cement Co., Ltd.(L2) | | 818,100 | | 2,943,943 | |
| | | | | |
DISTILLERS & VINTNERS—0.7% | | | | | |
Brown-Forman Corp., Cl. B | | 33,000 | | 2,466,090 | |
| | | | | |
DIVERSIFIED METALS & MINING—3.0% | | | | | |
Cliffs Natural Resources, Inc. | | 46,300 | | 3,158,586 | |
Molycorp, Inc. * | | 108,000 | | 4,133,160 | |
Walter Energy, Inc. | | 44,600 | | 3,373,990 | |
| | | | 10,665,736 | |
DIVERSIFIED REAL ESTATE ACTIVITIES—1.0% | | | | | |
BR Malls Participacoes SA | | 318,540 | | 3,441,720 | |
| | | | | |
EDUCATION SERVICES—1.5% | | | | | |
Apollo Group, Inc., Cl. A * | | 71,600 | | 3,390,260 | |
New Oriental Education & Technology Group #* | | 58,500 | | 1,733,940 | |
| | | | 5,124,200 | |
ELECTRICAL COMPONENTS & EQUIPMENT—1.7% | | | | | |
AMETEK, Inc. | | 151,900 | | 6,003,088 | |
| | | | | |
ENVIRONMENTAL & FACILITIES SERVICES—0.7% | | | | | |
Stericycle, Inc.* | | 29,400 | | 2,457,252 | |
| | | | | |
FOOTWEAR—1.0% | | | | | |
Salvatore Ferragamo Italia SpA* | | 215,100 | | 3,485,167 | |
| | | | | |
GENERAL MERCHANDISE STORES—1.4% | | | | | |
Dollar General Corp. * | | 61,800 | | 2,450,988 | |
Family Dollar Stores, Inc. | | 42,800 | | 2,509,364 | |
| | | | 4,960,352 | |
HEALTH CARE EQUIPMENT—0.8% | | | | | |
Hospira, Inc.* | | 85,600 | | 2,692,120 | |
| | | | | | |
27
| | SHARES | | VALUE | |
COMMON STOCKS—(CONT.) | | | | | |
HEALTH CARE SERVICES—1.4% | | | | | |
HMS Holdings Corp.* | | 195,400 | | $ | 4,775,576 | |
| | | | | |
HEALTH CARE TECHNOLOGY—2.6% | | | | | |
Agilent Technologies, Inc. * | | 102,000 | | 3,781,140 | |
Allscripts Healthcare Solutions, Inc. * | | 217,200 | | 4,159,380 | |
SXC Health Solutions Corp. * | | 29,800 | | 1,395,236 | |
| | | | 9,335,756 | |
HOMEBUILDING—1.0% | | | | | |
Lennar Corp., Cl. A | | 98,900 | | 1,635,806 | |
Toll Brothers, Inc. * | | 101,200 | | 1,764,928 | |
| | | | 3,400,734 | |
HOTELS RESORTS & CRUISE LINES—1.1% | | | | | |
Orient-Express Hotels Ltd., Cl. A * | | 266,700 | | 2,274,951 | |
Royal Caribbean Cruises Ltd. | | 58,600 | | 1,741,592 | |
| | | | 4,016,543 | |
HUMAN RESOURCE & EMPLOYMENT SERVICES—0.7% | | | | | |
Robert Half International, Inc. | | 93,600 | | 2,473,848 | |
| | | | | |
INDUSTRIAL CONGLOMERATES—0.6% | | | | | |
McDermott International, Inc.* | | 201,400 | | 2,211,372 | |
| | | | | |
INDUSTRIAL MACHINERY—3.4% | | | | | |
Pall Corp. | | 62,300 | | 3,187,891 | |
SPX Corp. | | 120,700 | | 6,591,427 | |
Stanley Black & Decker, Inc. | | 39,000 | | 2,490,150 | |
| | | | 12,269,468 | |
INTERNET RETAIL—0.7% | | | | | |
NetFlix, Inc.* | | 29,600 | | 2,429,568 | |
| | | | | |
INTERNET SOFTWARE & SERVICES—2.1% | | | | | |
OpenTable, Inc.* | | 171,400 | | 7,517,604 | |
| | | | | |
IT CONSULTING & OTHER SERVICES—0.3% | | | | | |
Cognizant Technology Solutions Corp., Cl. A* | | 12,500 | | 909,375 | |
| | | | | |
LIFE SCIENCES TOOLS & SERVICES—1.6% | | | | | |
Life Technologies Corp.* | | 136,700 | | 5,559,589 | |
| | | | | |
MANAGED HEALTH CARE—2.4% | | | | | |
Aetna, Inc. | | 85,900 | | 3,415,384 | |
CIGNA Corp. | | 116,700 | | 5,174,478 | |
| | | | 8,589,862 | |
MOTORCYCLE MANUFACTURERS—1.6% | | | | | |
Harley-Davidson, Inc. | | 142,600 | | 5,547,140 | |
| | | | | |
OIL & GAS DRILLING—1.1% | | | | | |
Nabors Industries Ltd.* | | 212,900 | | 3,902,457 | |
| | | | | |
OIL & GAS EQUIPMENT & SERVICES—2.2% | | | | | |
Cameron International Corp. *,^ | | 123,650 | | 6,076,161 | |
Superior Energy Services, Inc. * | | 65,400 | | 1,839,048 | |
| | | | 7,915,209 | |
OIL & GAS EXPLORATION & PRODUCTION—3.8% | | | | | |
Brigham Exploration Co. *,^ | | 116,200 | | 4,231,423 | |
| | | | | | |
28
| | SHARES | | VALUE | |
COMMON STOCKS—(CONT.) | | | | | |
OIL & GAS EXPLORATION & PRODUCTION—(CONT.) | | | | | |
Denbury Resources, Inc. * | | 212,600 | | $ | 3,337,820 | |
Newfield Exploration Co. * | | 45,800 | | 1,843,908 | |
Pioneer Natural Resources Co. ^ | | 48,500 | | 4,069,150 | |
| | | | 13,482,301 | |
OIL & GAS REFINING & MARKETING—0.8% | | | | | |
Marathon Petroleum Corp.^ | | 76,500 | | 2,746,350 | |
| | | | | |
PACKAGED FOODS & MEATS—1.3% | | | | | |
Green Mountain Coffee Roasters, Inc. * | | 29,600 | | 1,924,592 | |
Hain Celestial Group, Inc. * | | 78,900 | | 2,647,884 | |
| | | | 4,572,476 | |
PHARMACEUTICALS—0.4% | | | | | |
Mylan, Inc.* | | 74,700 | | 1,461,879 | |
| | | | | |
REAL ESTATE SERVICES—1.1% | | | | | |
CBRE Group, Inc.* | | 212,800 | | 3,783,584 | |
| | | | | |
RESEARCH & CONSULTING SERVICES—2.3% | | | | | |
IHS, Inc., Cl. A * | | 31,800 | | 2,670,882 | |
RPX Corp. * | | 34,200 | | 532,152 | |
Verisk Analytic, Inc., Cl. A * | | 135,300 | | 4,755,795 | |
| | | | 7,958,829 | |
RESIDENTIAL REITS—0.4% | | | | | |
Home Properties, Inc. | | 26,800 | | 1,578,520 | |
| | | | | |
RESTAURANTS—1.2% | | | | | |
Chipotle Mexican Grill, Inc.* | | 13,100 | | 4,403,172 | |
| | | | | |
SEMICONDUCTORS—5.8% | | | | | |
Altera Corp. | | 119,900 | | 4,546,608 | |
Avago Technologies Ltd. | | 104,900 | | 3,542,473 | |
Cypress Semiconductor Corp. * | | 98,600 | | 1,884,246 | |
Skyworks Solutions, Inc. * | | 222,900 | | 4,415,649 | |
Xilinx, Inc. | | 166,900 | | 5,584,474 | |
| | | | 19,973,450 | |
SPECIALTY CHEMICALS—2.2% | | | | | |
Cytec Industries, Inc. | | 45,600 | | 2,036,952 | |
International Flavors & Fragrances, Inc. | | 35,200 | | 2,131,712 | |
Rockwood Holdings, Inc. * | | 75,400 | | 3,471,416 | |
| | | | 7,640,080 | |
SPECIALTY STORES—2.4% | | | | | |
L’Occitane International SA (L2) | | 2,300,900 | | 5,061,328 | |
PetSmart, Inc. | | 72,400 | | 3,399,180 | |
| | | | 8,460,508 | |
SYSTEMS SOFTWARE—1.5% | | | | | |
Fortinet, Inc. * | | 154,400 | | 3,560,464 | |
MICROS Systems, Inc. * | | 35,100 | | 1,727,622 | |
| | | | 5,288,086 | |
TOTAL COMMON STOCKS
(Cost $360,893,414) | | | | 321,629,009 | |
| | | | | | |
29
| | SHARES | | VALUE | |
CONVERTIBLE PREFERRED STOCK—3.0% | | | | | |
BIOTECHNOLOGY—3.0% | | | | | |
Merrimack Pharmaceuticals, Inc., Series B-10, *,(L3),(a) | | 115,098 | | $ | 1,240,756 | |
Merrimack Pharmaceuticals, Inc., Series B-3, *,(L3),(b) | | 11,510 | | 124,078 | |
Merrimack Pharmaceuticals, Inc., Series B-4, *,(L3),(c) | | 345,008 | | 3,719,186 | |
Merrimack Pharmaceuticals, Inc., Series B-7, *,(L3),(a) | | 115,098 | | 1,240,756 | |
Merrimack Pharmaceuticals, Inc., Series C-2, *,(L3),(d) | | 611,759 | | 4,282,314 | |
| | | | 10,607,090 | |
TOTAL CONVERTIBLE PREFERRED STOCK
(Cost $5,689,999) | | | | 10,607,090 | |
| | | | | | |
| | CONTRACTS | | | |
PURCHASED OPTIONS—0.4% | | | | | |
PUT OPTIONS—0.4% | | | | | |
Chesapeake Energy Corp./ November/ 26~ | | 370 | | 23,310 | |
SPDR S&P 500 ETF Trust/ December/ 124~ | | 1,388 | | 620,436 | |
SPDR S&P 500 ETF Trust/ November/ 118 | | 953 | | 102,924 | |
SPDR S&P 500 ETF Trust/ November/ 119 | | 693 | | 85,239 | |
SPDR S&P 500 ETF Trust/ November/ 120 | | 712 | | 99,680 | |
SPDR S&P 500 ETF Trust/ November/ 121 | | 703 | | 115,995 | |
SPDR S&P 500 ETF Trust/ November/ 124 | | 693 | | 171,864 | |
(Cost $2,268,970) | | | | 1,219,448 | |
| | | | | |
TOTAL PUT OPTIONS
(Cost $2,268,970) | | | | 1,219,448 | |
| | | | | |
CALL OPTIONS—0.0% | | | | | |
Chesapeake Energy Corp./ November/ 30
(Cost $24,058) | | 370 | | 25,160 | |
| | | | | |
TOTAL PURCHASED OPTIONS
(Cost $2,293,028) | | | | 1,244,608 | |
| | | | | |
Total Investments
(Cost $368,876,441)(e) | | 94.6 | % | 333,480,707 | |
Other Assets in Excess of Liabilities | | 5.4 | | 19,206,930 | |
| | | | | |
NET ASSETS | | 100.0 | % | $ | 352,687,637 | |
| | | | | | |
‡ | Securities classified as Level 1 for ASC 820 disclosure purposes based on valuation inputs unless otherwise noted. |
| |
^ | All or a portion of this security has been pledged as collateral for written call options. |
~ | All or a portion of this security has been pledged as collateral for written put options. |
* | Non-income producing security. |
# | American Depository Receipts. |
(a) | Restricted Security - Investment in security not registered under the Securities Act of 1933. The investment is deemed to be illiquid and may be sold only to qualified institutional buyers. Security was acquired on August 25, 2010 for a cost of $666,188 and represents 0.4% of the net assets of the Fund. |
(b) | Restricted Security - Investment in security not registered under the Securities Act of 1933. The investment is deemed to be illiquid and may be sold only to qualified institutional buyers. Security was acquired on August 25, 2010 for a cost of $66,620 and represents 0.0% of the net assets of the Fund. |
30
(c) | Restricted Security - Investment in security not registered under the Securities Act of 1933. The investment is deemed to be illiquid and may be sold only to qualified institutional buyers. Security was acquired on August 25, 2010 for a cost of $1,996,908 and represents 1.1% of the net assets of the Fund. |
(d) | Restricted Security - Investment in security not registered under the Securities Act of 1933. The investment is deemed to be illiquid and may be sold only to qualified institutional buyers. Security was acquired on August 25, 2010 for a cost of $2,294,095 and represents 1.2% of the net assets of the Fund. |
(e) | At October 31, 2011, the net unrealized depreciation on investments, based on cost for federal income tax purposes of $374,154,837, amounted to $40,674,130 which consisted of aggregate gross unrealized appreciation of $14,556,926 and aggregate gross unrealized depreciation of $55,231,056. |
(L2) | Security classified as Level 2 for ASC 820 disclosure purposes based on valuation inputs. |
(L3) | Security classified as Level 3 for ASC 820 disclosure purposes based on valuation inputs. |
Industry classifications are unaudited.
See Notes to Financial Statements.
31
| | CONTRACTS | | SHARES
SUBJECT
TO PUT/
CALL | | VALUE | |
PUT OPTIONS WRITTEN | | | | | | | |
Cameron International Corp./ November/ 50 | | 46 | | 4,600 | | $ | 11,408 | |
Cameron International Corp./ November/ 55 | | 46 | | 4,600 | | 23,000 | |
Cameron International Corp./ Novemeber/ 52.50 | | 46 | | 4,600 | | 18,860 | |
Chesapeake Energy Corp./ November/ 28 | | 370 | | 37,000 | | 49,210 | |
Pioneer Natural Resources Co./ November/ 85 | | 46 | | 4,600 | | 14,260 | |
Pioneer Natural Resources Co./ November/ 90 | | 46 | | 4,600 | | 25,760 | |
SPDR S&P 500 ETF Trust/ December/ 114 | | 693 | | 69,300 | | 124,047 | |
TOTAL PUT OPTIONS WRITTEN
(Premiums Received $329,563) | | | | | | 266,545 | |
| | | | | | | |
CALL OPTIONS WRITTEN | | | | | | | |
Brigham Exploration Co./ November/ 25 | | 140 | | 14,000 | | 158,200 | |
Brigham Exploration Co./ November/ 28 | | 46 | | 4,600 | | 38,180 | |
Cameron International Corp./ Novemeber/ 47 | | 46 | | 4,600 | | 15,640 | |
Chicago Bridge & Iron Co., NV/ November/ 37 | | 46 | | 4,600 | | 7,590 | |
Chicago Bridge & Iron Co., NV/ November/ 38 | | 46 | | 4,600 | | 4,600 | |
Marathon Petroleum Corp./ November/ 35 | | 46 | | 4,600 | | 10,810 | |
Pioneer Natural Resources Co./ November/ 75 | | 47 | | 4,700 | | 47,000 | |
Pioneer Natural Resources Co./ November/ 80 | | 46 | | 4,600 | | 28,520 | |
TOTAL CALL OPTIONS WRITTEN
(Premiums Received $135,583) | | | | | | 310,540 | |
| | | | | | | |
TOTAL OPTIONS WRITTEN
(Premiums Received $465,146) | | | | | | $ | 577,085 | |
‡ | Securities classified as Level 1 for ASC 820 disclosure purposes based on valuation inputs unless otherwise noted. |
See Notes to Financial Statements.
32
THE ALGER INSTITUTIONAL FUNDS | ALGER SMALL CAP GROWTH INSTITUTIONAL FUND |
Schedule of Investments‡ October 31, 2011 |
| | SHARES | | VALUE | |
COMMON STOCKS—97.0% | | | | | |
AEROSPACE & DEFENSE—1.9% | | | | | |
AAR Corp. | | 565,900 | | $ | 11,278,387 | |
Esterline Technologies Corp. * | | 193,575 | | 10,820,843 | |
| | | | 22,099,230 | |
AIR FREIGHT & LOGISTICS—0.9% | | | | | |
HUB Group, Inc., Cl. A* | | 341,300 | | 10,669,038 | |
| | | | | |
AIRLINES—0.4% | | | | | |
US Airways Group, Inc.* | | 825,550 | | 4,763,424 | |
| | | | | |
ALTERNATIVE CARRIERS—0.5% | | | | | |
Cogent Communications Group, Inc.* | | 381,750 | | 6,127,088 | |
| | | | | |
APPAREL ACCESSORIES & LUXURY GOODS—1.3% | | | | | |
Vera Bradley, Inc. * | | 190,900 | | 8,647,770 | |
Warnaco Group, Inc., /The * | | 148,100 | | 7,271,710 | |
| | | | 15,919,480 | |
APPAREL RETAIL—3.6% | | | | | |
ANN, Inc. * | | 532,050 | | 14,173,811 | |
Childrens Place Retail Stores, Inc., /The * | | 168,750 | | 7,922,813 | |
DSW, Inc., Cl. A | | 226,250 | | 11,841,924 | |
Express, Inc. | | 425,850 | | 9,619,952 | |
| | | | 43,558,500 | |
APPLICATION SOFTWARE—8.8% | | | | | |
BroadSoft, Inc. * | | 243,769 | | 8,775,684 | |
Cadence Design Systems, Inc. * | | 1,305,950 | | 14,456,866 | |
Concur Technologies, Inc. * | | 216,350 | | 10,064,602 | |
Nice Systems Ltd. #* | | 402,405 | | 14,390,002 | |
QLIK Technologies, Inc. * | | 416,600 | | 11,902,262 | |
RealPage, Inc. * | | 435,500 | | 11,475,425 | |
SolarWinds, Inc. * | | 262,000 | | 7,561,320 | |
Taleo Corp., Cl. A * | | 388,300 | | 12,580,920 | |
Ultimate Software Group, Inc. * | | 196,500 | | 11,825,370 | |
| | | | 103,032,451 | |
ASSET MANAGEMENT & CUSTODY BANKS—1.0% | | | | | |
Cohen & Steers, Inc. | | 219,350 | | 5,959,740 | |
Fortress Investment Group LLC, Cl. A * | | 1,706,000 | | 6,090,420 | |
| | | | 12,050,160 | |
AUTO PARTS & EQUIPMENT—1.1% | | | | | |
Dana Holding Corp.* | | 892,000 | | 12,612,880 | |
| | | | | |
BIOTECHNOLOGY—3.8% | | | | | |
Alkermes Plc * | | 207,800 | | 3,634,422 | |
Cepheid, Inc. * | | 115,300 | | 4,136,964 | |
Cubist Pharmaceuticals, Inc. * | | 278,250 | | 10,520,632 | |
Dendreon Corp. * | | 210,850 | | 2,306,699 | |
Incyte Corp., Ltd. * | | 377,800 | | 5,202,306 | |
Ironwood Pharmaceuticals, Inc. * | | 187,500 | | 2,550,000 | |
Onyx Pharmaceuticals, Inc. * | | 140,850 | | 5,764,991 | |
Optimer Pharmaceuticals, Inc. * | | 554,712 | | 7,915,740 | |
| | | | | | |
33
| | SHARES | | VALUE | |
COMMON STOCKS—(CONT.) | | | | | |
BIOTECHNOLOGY—(CONT.) | | | | | |
Seattle Genetics, Inc. * | | 154,950 | | $ | 3,408,900 | |
| | | | 45,440,654 | |
COAL & CONSUMABLE FUELS—0.6% | | | | | |
Patriot Coal Corp.* | | 567,100 | | 7,122,776 | |
| | | | | |
COMMUNICATIONS EQUIPMENT—2.1% | | | | | |
ADTRAN, Inc. | | 145,450 | | 4,887,120 | |
Aruba Networks, Inc. * | | 290,400 | | 6,879,576 | |
Ciena Corp. * | | 407,050 | | 5,364,919 | |
Finisar Corp. * | | 355,550 | | 7,285,220 | |
| | | | 24,416,835 | |
CONSUMER FINANCE—0.7% | | | | | |
First Cash Financial Services, Inc.* | | 189,750 | | 7,874,625 | |
| | | | | |
DATA PROCESSING & OUTSOURCED SERVICES—2.4% | | | | | |
Jack Henry & Associates, Inc. | | 429,900 | | 13,933,059 | |
Wright Express Corp. * | | 320,485 | | 15,024,337 | |
| | | | 28,957,396 | |
DISTRIBUTORS—1.2% | | | | | |
LKQ Corp.* | | 478,890 | | 13,974,010 | |
| | | | | |
DIVERSIFIED CHEMICALS—0.9% | | | | | |
Solutia, Inc.* | | 648,100 | | 10,531,625 | |
| | | | | |
DIVERSIFIED METALS & MINING—0.3% | | | | | |
Globe Specialty Metals, Inc. | | 199,850 | | 3,331,500 | |
| | | | | |
EDUCATION SERVICES—0.7% | | | | | |
American Public Education, Inc.* | | 229,050 | | 8,202,281 | |
| | | | | |
ELECTRIC UTILITIES—1.1% | | | | | |
ITC Holdings Corp. | | 175,785 | | 12,776,054 | |
| | | | | |
ELECTRICAL COMPONENTS & EQUIPMENT—2.2% | | | | | |
GrafTech International Ltd. * | | 735,450 | | 11,553,920 | |
Woodward Governor Co. | | 434,300 | | 14,714,083 | |
| | | | 26,268,003 | |
ELECTRONIC EQUIPMENT & INSTRUMENTS—0.7% | | | | | |
Cognex Corp. | | 233,950 | | 7,928,566 | |
| | | | | |
ELECTRONIC MANUFACTURING SERVICES—0.3% | | | | | |
Fabrinet* | | 310,550 | | 3,850,820 | |
| | | | | |
ENVIRONMENTAL & FACILITIES SERVICES—3.3% | | | | | |
Clean Harbors, Inc. * | | 261,650 | | 15,246,345 | |
Tetra Tech, Inc. * | | 479,800 | | 10,474,034 | |
Waste Connections, Inc. | | 394,450 | | 13,431,022 | |
| | | | 39,151,401 | |
FOOD DISTRIBUTORS—1.1% | | | | | |
United Natural Foods, Inc.* | | 341,200 | | 12,457,212 | |
| | | | | |
FOOD RETAIL—0.7% | | | | | |
Fresh Market, Inc., /The* | | 199,400 | | 7,976,000 | |
| | | | | | |
34
| | SHARES | | VALUE | |
COMMON STOCKS—(CONT.) | | | | | |
FOREST PRODUCTS—0.3% | | | | | |
Louisiana-Pacific Corp.* | | 520,650 | | $ | 3,462,323 | |
| | | | | |
GOLD—0.6% | | | | | |
AuRico Gold, Inc.* | | 675,950 | | 6,576,994 | |
| | | | | |
HEALTH CARE EQUIPMENT—4.3% | | | | | |
Arthrocare Corp. * | | 179,300 | | 5,405,895 | |
Insulet Corp. * | | 700,200 | | 11,427,263 | |
MAKO Surgical Corp. * | | 278,992 | | 10,727,242 | |
Sirona Dental Systems, Inc. * | | 177,000 | | 8,478,300 | |
Thoratec Corp. * | | 223,800 | | 8,170,938 | |
Volcano Corp. * | | 281,300 | | 7,012,809 | |
| | | | 51,222,447 | |
HEALTH CARE FACILITIES—1.1% | | | | | |
Healthsouth Corp. * | | 502,650 | | 8,876,799 | |
LifePoint Hospitals, Inc. * | | 103,350 | | 3,995,511 | |
| | | | 12,872,310 | |
HEALTH CARE SERVICES—2.0% | | | | | |
Catalyst Health Solutions, Inc. * | | 204,450 | | 11,238,617 | |
HMS Holdings Corp. * | | 510,950 | | 12,487,618 | |
| | | | 23,726,235 | |
HEALTH CARE SUPPLIES—0.9% | | | | | |
Align Technology, Inc.* | | 466,350 | | 10,740,041 | |
| | | | | |
HEALTH CARE TECHNOLOGY—0.7% | | | | | |
Medidata Solutions, Inc.* | | 460,100 | | 8,272,598 | |
| | | | | |
HOME FURNISHINGS—0.4% | | | | | |
Ethan Allen Interiors, Inc. | | 239,550 | | 4,743,090 | |
| | | | | |
HOTELS RESORTS & CRUISE LINES—0.9% | | | | | |
Interval Leisure Group* | | 765,166 | | 10,566,942 | |
| | | | | |
HOUSEHOLD APPLIANCES—0.5% | | | | | |
SodaStream International Ltd.* | | 189,850 | | 6,470,088 | |
| | | | | |
INDUSTRIAL MACHINERY—4.3% | | | | | |
Actuant Corp., Cl. A | | 643,660 | | 14,482,350 | |
Barnes Group, Inc. | | 600,050 | | 13,963,164 | |
CLARCOR, Inc. | | 153,450 | | 7,439,256 | |
RBC Bearings, Inc. * | | 366,250 | | 14,833,124 | |
| | | | 50,717,894 | |
INTERNET RETAIL—1.0% | | | | | |
Shutterfly, Inc.* | | 269,850 | | 11,244,650 | |
| | | | | |
INTERNET SOFTWARE & SERVICES—4.2% | | | | | |
Ancestry.com, Inc. * | | 333,400 | | 7,591,518 | |
comScore, Inc. * | | 506,150 | | 10,684,826 | |
LogMeIn, Inc. * | | 343,000 | | 13,949,809 | |
OpenTable, Inc. * | | 165,200 | | 7,245,672 | |
VistaPrint NV * | | 303,240 | | 10,589,141 | |
| | | | 50,060,966 | |
| | | | | | |
35
| | SHARES | | VALUE | |
COMMON STOCKS—(CONT.) | | | | | |
INVESTMENT BANKING & BROKERAGE—0.1% | | | | | |
Stifel Financial Corp.* | | 28,400 | | $ | 905,108 | |
| | | | | |
LEISURE FACILITIES—1.8% | | | | | |
Life Time Fitness, Inc. * | | 162,295 | | 6,999,783 | |
Six Flags Entertainment Corp. | | 391,050 | | 14,038,695 | |
| | | | 21,038,478 | |
LEISURE PRODUCTS—0.7% | | | | | |
Brunswick Corp. | | 449,150 | | 7,931,989 | |
| | | | | |
LIFE SCIENCES TOOLS & SERVICES—1.3% | | | | | |
Bruker Corp. * | | 596,700 | | 8,610,381 | |
PAREXEL International Corp. * | | 316,092 | | 6,963,507 | |
| | | | 15,573,888 | |
MANAGED HEALTH CARE—1.6% | | | | | |
Centene Corp. * | | 123,500 | | 4,341,025 | |
Healthspring, Inc. * | | 269,250 | | 14,523,345 | |
| | | | 18,864,370 | |
METAL & GLASS CONTAINERS—1.2% | | | | | |
Silgan Holdings, Inc. | | 376,700 | | 14,141,317 | |
| | | | | |
OIL & GAS EQUIPMENT & SERVICES—2.5% | | | | | |
Complete Production Services, Inc. * | | 269,850 | | 8,851,080 | |
Dril-Quip, Inc. * | | 139,970 | | 9,112,047 | |
Key Energy Services, Inc. * | | 693,800 | | 8,970,834 | |
Lufkin Industries, Inc. | | 37,400 | | 2,209,966 | |
| | | | 29,143,927 | |
OIL & GAS EXPLORATION & PRODUCTION—4.6% | | | | | |
Berry Petroleum Co. | | 136,100 | | 4,702,255 | |
Energy XXI Bermuda Ltd. * | | 346,650 | | 10,181,110 | |
Kodiak Oil & Gas Corp. * | | 711,000 | | 4,913,010 | |
Nothern Oil and Gas, Inc. * | | 268,450 | | 6,488,437 | |
Quicksilver Resources, Inc. * | | 824,100 | | 6,345,570 | |
Rosetta Resources, Inc. * | | 152,750 | | 6,772,935 | |
Stone Energy Corp. * | | 286,950 | | 6,970,016 | |
Swift Energy Co. * | | 291,350 | | 8,921,137 | |
| | | | 55,294,470 | |
PACKAGED FOODS & MEATS—1.0% | | | | | |
Hain Celestial Group, Inc.* | | 374,665 | | 12,573,757 | |
| | | | | |
PHARMACEUTICALS—1.8% | | | | | |
Medicis Pharmaceutical Corp., Cl. A | | 271,100 | | 10,380,419 | |
Salix Pharmaceuticals Ltd. * | | 133,100 | | 4,559,341 | |
Viropharma, Inc. * | | 285,400 | | 5,776,496 | |
| | | | 20,716,256 | |
RAILROADS—1.2% | | | | | |
Genesee & Wyoming, Inc., Cl. A* | | 247,700 | | 14,666,317 | |
| | | | | |
REAL ESTATE SERVICES—0.7% | | | | | |
Jones Lang LaSalle, Inc. | | 121,050 | | 7,822,251 | |
| | | | | |
REGIONAL BANKS—1.9% | | | | | |
Signature Bank * | | 250,650 | | 13,973,737 | |
| | | | | | |
36
| | SHARES | | VALUE | |
COMMON STOCKS—(CONT.) | | | | | |
REGIONAL BANKS—(CONT.) | | | | | |
Texas Capital Bancshares, Inc. * | | 356,100 | | $ | 9,970,800 | |
| | | | 23,944,537 | |
RESEARCH & CONSULTING SERVICES—0.9% | | | | | |
CoStar Group, Inc.* | | 166,005 | | 10,214,288 | |
| | | | | |
RESTAURANTS—1.0% | | | | | |
Cheesecake Factory, Inc., /The* | | 421,650 | | 11,801,984 | |
| | | | | |
SECURITY & ALARM SERVICES—0.9% | | | | | |
Geo Group, Inc., /The* | | 566,550 | | 10,328,207 | |
| | | | | |
SEMICONDUCTOR EQUIPMENT—1.1% | | | | | |
Novellus Systems, Inc.* | | 362,700 | | 12,531,285 | |
| | | | | |
SEMICONDUCTORS—3.5% | | | | | |
Inphi Corp. * | | 584,950 | | 6,457,848 | |
Mellanox Technologies Ltd. * | | 361,600 | | 11,701,376 | |
Netlogic Microsystems, Inc. * | | 228,000 | | 11,217,600 | |
RF Micro Devices, Inc. * | | 1,577,700 | | 11,580,318 | |
| | | | 40,957,142 | |
SPECIALIZED CONSUMER SERVICES—0.6% | | | | | |
Sotheby’s | | 190,250 | | 6,700,605 | |
| | | | | |
SPECIALTY CHEMICALS—1.3% | | | | | |
Cytec Industries, Inc. | | 89,150 | | 3,982,331 | |
Kraton Performance Polymers, Inc. * | | 123,050 | | 2,421,624 | |
Rockwood Holdings, Inc. * | | 226,850 | | 10,444,173 | |
| | | | 16,848,128 | |
SPECIALTY STORES—1.3% | | | | | |
Teavana Holdings, Inc. * | | 145,455 | | 3,325,101 | |
Vitamin Shoppe, Inc. * | | 309,150 | | 11,658,047 | |
| | | | 14,983,148 | |
SYSTEMS SOFTWARE—1.1% | | | | | |
Fortinet, Inc.* | | 579,950 | | 13,373,647 | |
| | | | | |
THRIFTS & MORTGAGE FINANCE—1.1% | | | | | |
Northwest Bancshares, Inc. | | 1,017,150 | | 12,683,861 | |
| | | | | |
TRADING COMPANIES & DISTRIBUTORS—1.0% | | | | | |
United Rentals, Inc.* | | 494,200 | | 11,569,222 | |
| | | | | |
TOTAL COMMON STOCKS
(Cost $1,036,058,731) | | | | 1,146,376,769 | |
| | | | | |
Total Investments
(Cost $1,036,058,731)(a) | | 97.0 | % | 1,146,376,769 | |
Other Assets in Excess of Liabilities | | 3.0 | | 35,800,316 | |
| | | | | |
NET ASSETS | | 100.0 | % | $ | 1,182,177,085 | |
‡ | Securities classified as Level 1 for ASC 820 disclosure purposes based on valuation inputs unless otherwise noted. |
37
* | Non-income producing security. |
# | American Depository Receipts. |
(a) | At October 31, 2011, the net unrealized appreciation on investments, based on cost for federal income tax purposes of $1,037,058,880, amounted to $109,317,889 which consisted of aggregate gross unrealized appreciation of $176,798,594 and aggregate gross unrealized depreciation of $67,480,705. |
Industry classifications are unaudited.
See Notes to Financial Statements.
38
THE ALGER INSTITUTIONAL FUNDS
Statements of Assets and Liabilities October 31, 2011
| | Alger Capital
Appreciation
Institutional Fund | | Alger Large Cap
Growth
Institutional Fund | |
ASSETS: | | | | | |
Investments in securities, at value (identified cost)* see accompanying schedules of investments | | $ | 1,231,977,653 | | $ | 20,095,855 | |
Cash and cash equivalents# | | 37,121,480 | | 1,559,962 | |
Receivable for investment securities sold | | 41,225,915 | | 224,380 | |
Receivable for shares of beneficial interest sold | | 4,333,776 | | 7,353 | |
Dividends and interest receivable | | 1,072,338 | | 14,281 | |
Prepaid expenses | | 128,555 | | 27,131 | |
Total Assets | | 1,315,859,717 | | 21,928,962 | |
LIABILITIES: | | | | | |
Payable for investment securities purchased | | 41,372,253 | | 26,589 | |
Payable for shares of beneficial interest redeemed | | 4,206,290 | | 21,186 | |
Accrued investment advisory fees | | 825,006 | | 12,845 | |
Accrued transfer agent fees | | 51,633 | | 9,940 | |
Accrued distribution fees | | 91,291 | | 2,253 | |
Accrued administrative fees | | 28,009 | | 498 | |
Accrued shareholder servicing fees | | 264,817 | | 4,704 | |
Accrued other expenses | | 151,000 | | 52,363 | |
Total Liabilities | | 46,990,299 | | 130,378 | |
NET ASSETS | | $ | 1,268,869,418 | | $ | 21,798,584 | |
Net Assets Consist of: | | | | | |
Paid in capital (par value of $.001 per share) | | 1,186,685,833 | | 30,606,081 | |
Undistributed net investment income | | — | | 554 | |
Undistributed net realized gain (accumulated realized loss) | | 21,056,450 | | (9,744,604 | ) |
Net unrealized appreciation on investments | | 61,127,135 | | 936,553 | |
NET ASSETS | | $ | 1,268,869,418 | | $ | 21,798,584 | |
Net Assets By Class | | | | | |
Class I | | $ | 1,041,609,372 | | $ | 16,294,227 | |
Class R | | $ | 227,260,046 | | $ | 5,504,357 | |
Shares Of Beneficial Interest Outstanding—Note 6 | | | | | |
Class I | | 49,890,573 | | 1,184,691 | |
Class R | | 11,357,411 | | 414,390 | |
Net Asset Value Per Share | | | | | |
Class I | | $ | 20.88 | | $ | 13.75 | |
Class R | | $ | 20.01 | | $ | 13.28 | |
*Identified cost | | $ | 1,170,850,519 | | $ | 19,159,302 | |
**Written options premiums received | | $ | — | | $ | — | |
See Notes to Financial Statements.
39
THE ALGER INSTITUTIONAL FUNDS
Statements of Assets and Liabilities October 31, 2011
| | Alger Mid Cap
Growth
Institutional Fund | | Alger Small Cap
Growth
Institutional Fund | |
ASSETS: | | | | | |
Investments in securities, at value (identified cost)* see accompanying schedules of investments | | $ | 333,480,707 | | $ | 1,146,376,769 | |
Cash and cash equivalents# | | 6,767,569 | | 32,647,381 | |
Receivable for investment securities sold | | 36,056,503 | | 20,925,985 | |
Receivable for shares of beneficial interest sold | | 4,643,730 | | 5,991,939 | |
Dividends and interest receivable | | 50,679 | | 91,033 | |
Prepaid expenses | | 64,482 | | 125,415 | |
Total Assets | | 381,063,670 | | 1,206,158,522 | |
LIABILITIES: | | | | | |
Payable for investment securities purchased | | 25,542,707 | | 19,276,727 | |
Written options outstanding** | | 577,085 | | — | |
Payable for shares of beneficial interest redeemed | | 1,691,100 | | 3,294,156 | |
Accrued investment advisory fees | | 218,370 | | 766,493 | |
Accrued transfer agent fees | | 95,015 | | 123,009 | |
Accrued distribution fees | | 14,134 | | 24,967 | |
Accrued administrative fees | | 7,902 | | 26,023 | |
Accrued shareholder servicing fees | | 74,706 | | 246,035 | |
Accrued other expenses | | 155,014 | | 224,027 | |
Total Liabilities | | 28,376,033 | | 23,981,437 | |
NET ASSETS | | $ | 352,687,637 | | $ | 1,182,177,085 | |
Net Assets Consist of: | | | | | |
Paid in capital (par value of $.001 per share) | | 733,909,269 | | 1,024,278,396 | |
Undistributed net investment income (accumulated loss) | | (825,574 | ) | (134,200 | ) |
Undistributed net realized gain (accumulated realized loss) | | (344,887,964 | ) | 47,714,851 | |
Net unrealized appreciation (depreciation) on investments | | (35,508,094 | ) | 110,318,038 | |
NET ASSETS | | $ | 352,687,637 | | $ | 1,182,177,085 | |
Net Assets By Class | | | | | |
Class I | | $ | 317,893,132 | | $ | 1,119,966,230 | |
Class R | | $ | 34,794,505 | | $ | 62,210,855 | |
Shares Of Beneficial Interest Outstanding—Note 6 | | | | | |
Class I | | 23,539,491 | | 41,497,664 | |
Class R | | 2,708,400 | | 2,401,012 | |
Net Asset Value Per Share | | | | | |
Class I | | $ | 13.50 | | $ | 26.99 | |
Class R | | $ | 12.85 | | $ | 25.91 | |
*Identified cost | | $ | 368,876,441 | | $ | 1,036,058,731 | |
**Written options premiums received | | $ | 465,146 | | $ | — | |
# Alger Mid Cap Growth Institutional Fund includes cash of $1,603,500 held as collateral for written options.
See Notes to Financial Statements.
40
THE ALGER INSTITUTIONAL FUNDS
Statements of Operations
For the year ended October 31, 2011
| | Alger Capital
Appreciation
Institutional Fund | | Alger Large Cap
Growth
Institutional Fund | |
INCOME | | | | | |
Dividends (net of foreign withholding taxes*) | | $ | 13,067,145 | | $ | 344,221 | |
Interest | | 25,456 | | 344 | |
Total Income | | 13,092,601 | | 344,565 | |
EXPENSES | | | | | |
Advisory fees—Note 3(a) | | 9,428,209 | | 172,775 | |
Distribution fees—Note3(b): | | | | | |
Class R | | 1,052,305 | | 29,015 | |
Shareholder servicing fees—Note 3(e) | | 3,026,339 | | 63,270 | |
Administrative fees—Note 3(a) | | 320,093 | | 6,692 | |
Custodian fees | | 123,050 | | 31,290 | |
Interest expenses | | — | | 641 | |
Transfer agent fees and expenses—Note 3(d) | | 192,384 | | 39,159 | |
Printing fees | | 106,200 | | 4,125 | |
Professional fees | | 54,890 | | 27,932 | |
Registration fees | | 135,282 | | 38,634 | |
Trustee fees—Note 3(f) | | 20,984 | | 19,036 | |
Miscellaneous | | 222,383 | | 20,359 | |
Total Expenses | | 14,682,119 | | 452,928 | |
NET INVESTMENT LOSS | | (1,589,518 | ) | (108,363 | ) |
REALIZED AND UNREALIZED GAIN (LOSS) ON INVESTMENTS, OPTIONS AND FOREIGN CURRENCY | | | | | |
Net realized gain on investments and purchased options | | 66,998,632 | | 2,149,479 | |
Net realized loss on foreign currency transactions | | (307,083 | ) | (5,260 | ) |
Net realized gain on options written | | 94,011 | | — | |
Net change in unrealized appreciation (depreciation) on investments, options and foreign currency | | 14,788,025 | | (251,222 | ) |
Net realized and unrealized gain on investments, options and foreign currency | | 81,573,585 | | 1,892,997 | |
NET INCREASE IN NET ASSETS RESULTING FROM OPERATIONS | | $ | 79,984,067 | | $ | 1,784,634 | |
*Foreign withholding taxes | | $ | 192,311 | | $ | 3,524 | |
See Notes to Financial Statements.
41
THE ALGER INSTITUTIONAL FUNDS
Statements of Operations
For the year ended October 31, 2011
| | Alger Mid Cap
Growth
Institutional Fund | | Alger Small Cap
Growth
Institutional Fund | |
INCOME | | | | | |
Dividends (net of foreign withholding taxes*) | | $ | 3,081,620 | | $ | 3,010,305 | |
Interest | | (13,391 | ) | 12,317 | |
Total Income | | 3,068,229 | | 3,022,622 | |
EXPENSES | | | | | |
Advisory fees—Note 3(a) | | 4,745,962 | | 10,202,764 | |
Distribution fees—Note3(b): | | | | | |
Class R | | 232,532 | | 348,312 | |
Shareholder servicing fees—Note 3(e) | | 1,623,619 | | 3,274,961 | |
Administrative fees—Note 3(a) | | 171,729 | | 346,390 | |
Custodian fees | | 123,023 | | 94,200 | |
Interest expenses | | 47,116 | | — | |
Transfer agent fees and expenses—Note 3(d) | | 272,098 | | 357,292 | |
Printing fees | | 78,700 | | 188,300 | |
Professional fees | | 48,905 | | 60,350 | |
Registration fees | | 109,238 | | 153,405 | |
Trustee fees—Note 3(f) | | 20,121 | | 21,156 | |
Miscellaneous | | 144,166 | | 234,248 | |
Total Expenses | | 7,617,209 | | 15,281,378 | |
NET INVESTMENT LOSS | | (4,548,980 | ) | (12,258,756 | ) |
REALIZED AND UNREALIZED GAIN (LOSS) ON INVESTMENTS, OPTIONS AND FOREIGN CURRENCY | | | | | |
Net realized gain on investments and purchased options | | 131,661,978 | | 127,485,549 | |
Net realized gain (loss) on foreign currency transactions | | (349,982 | ) | 5,258 | |
Net realized gain on options written | | 3,430,839 | | — | |
Net change in unrealized appreciation (depreciation) on investments, options and foreign currency | | (65,677,181 | ) | (33,597,608 | ) |
Net change in unrealized appreciation (depreciation) on written options | | (111,939 | ) | — | |
Net realized and unrealized gain on investments, options and foreign currency | | 68,953,715 | | 93,893,199 | |
NET INCREASE IN NET ASSETS RESULTING FROM OPERATIONS | | $ | 64,404,735 | | $ | 81,634,443 | |
*Foreign withholding taxes | | $ | 33,702 | | $ | — | |
See Notes to Financial Statements.
42
THE ALGER INSTITUTIONAL FUNDS
Statements of Changes in Net Assets
| | Alger Capital Appreciation Institutional
Fund | |
| | For the
Year Ended
October 31, 2011 | | For the
Year Ended
October 31, 2010 | |
Net investment income (loss) | | $ | (1,589,518 | ) | $ | (890,700 | ) |
Net realized gain on investments, options and foreign currency | | 66,785,560 | | 101,248,723 | |
Net change in unrealized appreciation (depreciation) on investments, options and foreign currency | | 14,788,025 | | 31,598,335 | |
Net increase in net assets resulting from operations | | 79,984,067 | | 131,956,358 | |
Dividends and distributions to shareholders from: | | | | | |
Net investment income | | | | | |
Class I | | — | | (1,279,828 | ) |
Class R | | — | | — | |
Total dividends and distributions to shareholders | | — | | (1,279,828 | ) |
Increase (decrease) from shares of beneficial interest transactions: | | | | | |
Class I | | 164,881,101 | | 65,815,020 | |
Class R | | 43,192,466 | | 62,394,146 | |
Net increase (decrease) from shares of beneficial interest transactions—Note 6 | | 208,073,567 | | 128,209,166 | |
Total increase (decrease) | | 288,057,634 | | 258,885,696 | |
Net Assets: | | | | | |
Beginning of period | | 980,811,784 | | 721,926,088 | |
END OF PERIOD | | $ | 1,268,869,418 | | $ | 980,811,784 | |
Undistributed net investment income (accumulated loss) | | $ | — | | $ | 128,267 | |
See Notes to Financial Statements.
43
| | Alger Large Cap Growth Institutional
Fund | | Alger Mid Cap Growth Institutional
Fund | | Alger Small Cap Growth Institutional
Fund | |
| | For the
Year Ended
October 31, 2011 | | For the
Year Ended
October 31, 2010 | | For the
Year Ended
October 31, 2011 | | For the
Year Ended
October 31, 2010 | | For the
Year Ended
October 31, 2011 | | For the
Year Ended
October 31, 2010 | |
Net investment income (loss) | | $ | (108,363 | ) | $ | 184,121 | | $ | (4,548,980 | ) | $ | 356,200 | | $ | (12,258,756 | ) | $ | (11,420,394 | ) |
Net realized gain on investments, options and foreign currency | | 2,144,219 | | 3,578,613 | | 134,742,835 | | 140,274,983 | | 127,490,807 | | 102,355,700 | |
Net change in unrealized appreciation (depreciation) on investments, options and foreign currency | | (251,222 | ) | 1,434,610 | | (65,789,120 | ) | 36,648,897 | | (33,597,608 | ) | 172,896,159 | |
Net increase in net assets resulting from operations | | 1,784,634 | | 5,197,344 | | 64,404,735 | | 177,280,080 | | 81,634,443 | | 263,831,465 | |
Dividends and distributions to shareholders from: | | | | | | | | | | | | | |
Net investment income | | | | | | | | | | | | | |
Class I | | (168,982 | ) | (150,594 | ) | (1,902,006 | ) | — | | — | | — | |
Class R | | (10,503 | ) | — | | — | | — | | — | | — | |
Total dividends and distributions to shareholders | | (179,485 | ) | (150,594 | ) | (1,902,006 | ) | — | | — | | — | |
Increase (decrease) from shares of beneficial interest transactions: | | | | | | | | | | | | | |
Class I | | (7,898,934 | ) | (20,603,532 | ) | (479,440,924 | ) | (303,170,480 | ) | (61,833,473 | ) | (113,843,842 | ) |
Class R | | (978,506 | ) | (717,668 | ) | (17,489,577 | ) | (10,849,685 | ) | (10,560,397 | ) | 2,465,726 | |
Net increase (decrease) from shares of beneficial interest transactions—Note 6 | | (8,877,440 | ) | (21,321,200 | ) | (496,930,501 | ) | (314,020,165 | ) | (72,393,870 | ) | (111,378,116 | ) |
Total increase (decrease) | | (7,272,291 | ) | (16,274,450 | ) | (434,427,772 | ) | (136,740,085 | ) | 9,240,573 | | 152,453,349 | |
Net Assets: | | | | | | | | | | | | | |
Beginning of period | | 29,070,875 | | 45,345,325 | | 787,115,409 | | 923,855,494 | | 1,172,936,512 | | 1,020,483,163 | |
END OF PERIOD | | $ | 21,798,584 | | $ | 29,070,875 | | $ | 352,687,637 | | $ | 787,115,409 | | $ | 1,182,177,085 | | $ | 1,172,936,512 | |
Undistributed net investment income (accumulated loss) | | $ | 554 | | $ | 179,383 | | $ | (825,574 | ) | $ | 225,701 | | $ | (134,200 | ) | $ | 72,431 | |
44
THE ALGER INSTITUTIONAL FUNDS
Financial Highlights for a share outstanding throughout the period
Alger Capital Appreciation Institutional Fund
| | Class I | |
| | Year ended
10/31/2011 | | Year ended
10/31/2010 | | Year ended
10/31/2009 | | Year ended
10/31/2008 | | Year ended
10/31/2007 | |
Net asset value, beginning of period | | $ | 19.28 | | $ | 16.41 | | $ | 13.23 | | $ | 22.27 | | $ | 15.77 | |
INCOME FROM INVESTMENT OPERATIONS: | | | | | | | | | | | |
Net investment income (loss)(i) | | (0.01 | ) | 0.00 | | 0.04 | | (0.04 | ) | (0.06 | ) |
Net realized and unrealized gain (loss) on investments | | 1.61 | | 2.90 | | 3.14 | | (9.00 | ) | 6.56 | |
Total from investment operations | | 1.60 | | 2.90 | | 3.18 | | (9.04 | ) | 6.50 | |
Dividends from net investment income | | — | | (0.03 | ) | — | | — | | — | |
Net asset value, end of period | | $ | 20.88 | | $ | 19.28 | | $ | 16.41 | | $ | 13.23 | | $ | 22.27 | |
Total return | | 8.3 | % | 17.7 | % | 23.9 | % | (40.6 | )% | 41.3 | % |
RATIOS/SUPPLEMENTAL DATA: | | | | | | | | | | | |
Net assets, end of period (000’s omitted) | | $ | 1,041,609 | | $ | 809,468 | | $ | 632,250 | | $ | 411,056 | | $ | 537,928 | |
Ratio of gross expenses to average net assets | | 1.17 | % | 1.17 | % | 1.21 | % | 1.18 | % | 1.23 | % |
Ratio of expense reimbursements to average net assets | | 0.00 | % | 0.00 | % | 0.00 | % | 0.00 | % | 0.00 | % |
Ratio of net expenses to average net assets | | 1.17 | % | 1.17 | % | 1.21 | % | 1.18 | % | 1.23 | % |
Ratio of net investment income (loss) to average net assets | | (0.04 | )% | (0.02 | )% | 0.32 | % | (0.21 | )% | (0.33 | )% |
Portfolio turnover rate | | 153.30 | % | 209.52 | % | 306.87 | % | 291.85 | % | 232.13 | % |
See Notes to Financial Statements.
(i) Amount was computed based on average shares outstanding during the period.
45
| | Class R | |
| | Year ended
10/31/2011 | | Year ended
10/31/2010 | | Year ended
10/31/2009 | | Year ended
10/31/2008 | | Year ended
10/31/2007 | |
Net asset value, beginning of period | | $ | 18.57 | | $ | 15.86 | | $ | 12.85 | | $ | 21.75 | | $ | 15.47 | |
INCOME FROM INVESTMENT OPERATIONS: | | | | | | | | | | | |
Net investment loss(i) | | (0.11 | ) | (0.10 | ) | (0.02 | ) | (0.13 | ) | (0.16 | ) |
Net realized and unrealized gain (loss) on investments | | 1.55 | | 2.81 | | 3.03 | | (8.77 | ) | 6.44 | |
Total from investment operations | | 1.44 | | 2.71 | | 3.01 | | (8.90 | ) | 6.28 | |
Net asset value, end of period | | $ | 20.01 | | $ | 18.57 | | $ | 15.86 | | $ | 12.85 | | $ | 21.75 | |
Total return | | 7.8 | % | 17.1 | % | 23.3 | % | (40.9 | )% | 40.6 | % |
RATIOS/SUPPLEMENTAL DATA: | | | | | | | | | | | |
Net assets, end of period (000’s omitted) | | $ | 227,260 | | $ | 171,344 | | $ | 89,676 | | $ | 53,557 | | $ | 39,442 | |
Ratio of gross expenses to average net assets | | 1.68 | % | 1.67 | % | 1.71 | % | 1.68 | % | 1.72 | % |
Ratio of expense reimbursements to average net assets | | 0.00 | % | 0.00 | % | 0.00 | % | 0.00 | % | 0.00 | % |
Ratio of net expenses to average net assets | | 1.68 | % | 1.67 | % | 1.71 | % | 1.68 | % | 1.72 | % |
Ratio of net investment income (loss) to average net assets | | (0.56 | )% | (0.55 | )% | (0.18 | )% | (0.70 | )% | (0.86 | )% |
Portfolio turnover rate | | 153.30 | % | 209.52 | % | 306.87 | % | 291.85 | % | 232.13 | % |
See Notes to Financial Statements.
(i) Amount was computed based on average shares outstanding during the period.
46
THE ALGER INSTITUTIONAL FUNDS
Financial Highlights for a share outstanding throughout the period
Alger Large Cap Growth Institutional Fund
| | Class I | |
| | Year ended
10/31/2011 | | Year ended
10/31/2010 | | Year ended
10/31/2009 | | Year ended
10/31/2008 | | Year ended
10/31/2007 | |
Net asset value, beginning of period | | $ | 13.03 | | $ | 11.17 | | $ | 9.48 | | $ | 16.87 | | $ | 13.25 | |
INCOME FROM INVESTMENT OPERATIONS: | | | | | | | | | | | |
Net investment income (loss)(i) | | (0.04 | ) | 0.07 | | 0.04 | | (0.01 | ) | (0.03 | ) |
Net realized and unrealized gain (loss) on investments | | 0.86 | | 1.83 | | 1.65 | | (7.38 | ) | 3.65 | |
Total from investment operations | | 0.82 | | 1.90 | | 1.69 | | (7.39 | ) | 3.62 | |
Dividends from net investment income | | (0.10 | ) | (0.04 | ) | — | | — | | — | |
Net asset value, end of period | | $ | 13.75 | | $ | 13.03 | | $ | 11.17 | | $ | 9.48 | | $ | 16.87 | |
Total return | | 6.3 | % | 17.1 | % | 17.7 | % | (43.8 | )% | 27.3 | % |
RATIOS/SUPPLEMENTAL DATA: | | | | | | | | | | | |
Net assets, end of period (000’s omitted) | | $ | 16,294 | | $ | 22,961 | | $ | 39,412 | | $ | 20,415 | | $ | 52,127 | |
Ratio of gross expenses to average net assets | | 1.69 | % | 1.36 | % | 1.37 | % | 1.23 | % | 1.32 | % |
Ratio of expense reimbursements to average net assets | | 0.00 | % | 0.00 | % | 0.00 | % | 0.00 | % | 0.00 | % |
Ratio of net expenses to average net assets | | 1.69 | % | 1.36 | % | 1.37 | % | 1.23 | % | 1.32 | % |
Ratio of net investment income (loss) to average net assets | | (0.27 | )% | 0.56 | % | 0.46 | % | 0.04 | % | (0.19 | )% |
Portfolio turnover rate | | 57.74 | % | 58.73 | % | 87.57 | % | 187.80 | % | 192.18 | % |
See Notes to Financial Statements.
(i) Amount was computed based on average shares outstanding during the period.
47
| | Class R | |
| | Year ended
10/31/2011 | | Year ended
10/31/2010 | | Year ended
10/31/2009 | | Year ended
10/31/2008 | | Year ended
10/31/2007 | |
Net asset value, beginning of period | | $ | 12.59 | | $ | 10.83 | | $ | 9.24 | | $ | 16.52 | | $ | 13.04 | |
INCOME FROM INVESTMENT OPERATIONS: | | | | | | | | | | | |
Net investment loss(i) | | (0.13 | ) | (0.02 | ) | 0.00 | | (0.08 | ) | (0.10 | ) |
Net realized and unrealized gain (loss) on investments | | 0.84 | | 1.78 | | 1.59 | | (7.20 | ) | 3.58 | |
Total from investment operations | | 0.71 | | 1.76 | | 1.59 | | (7.28 | ) | 3.48 | |
Dividends from net investment income | | (0.02 | ) | — | | — | | — | | — | |
Net asset value, end of period | | $ | 13.28 | | $ | 12.59 | | $ | 10.83 | | $ | 9.24 | | $ | 16.52 | |
Total return | | 5.7 | % | 16.3 | % | 17.2 | % | (44.1 | )% | 26.7 | % |
RATIOS/SUPPLEMENTAL DATA: | | | | | | | | | | | |
Net assets, end of period (000’s omitted) | | $ | 5,505 | | $ | 6,110 | | $ | 5,933 | | $ | 5,112 | | $ | 8,747 | |
Ratio of gross expenses to average net assets | | 2.40 | % | 2.05 | % | 1.89 | % | 1.73 | % | 1.81 | % |
Ratio of expense reimbursements to average net assets | | 0.00 | % | 0.00 | % | 0.00 | % | 0.00 | % | 0.00 | % |
Ratio of net expenses to average net assets | | 2.40 | % | 2.05 | % | 1.89 | % | 1.73 | % | 1.81 | % |
Ratio of net investment income (loss) to average net assets | | (0.99 | )% | (0.16 | )% | (0.03 | )% | (0.55 | )% | (0.72 | )% |
Portfolio turnover rate | | 57.74 | % | 58.73 | % | 87.57 | % | 187.80 | % | 192.18 | % |
See Notes to Financial Statements.
(i) Amount was computed based on average shares outstanding during the period.
48
THE ALGER INSTITUTIONAL FUNDS
Financial Highlights for a share outstanding throughout the period
Alger Mid Cap Growth Institutional Fund
| | Class I | |
| | Year ended
10/31/2011 | | Year ended
10/31/2010 | | Year ended
10/31/2009 | | Year ended
10/31/2008 | | Year ended
10/31/2007 | |
Net asset value, beginning of period | | $ | 13.11 | | $ | 10.68 | | $ | 8.76 | | $ | 23.24 | | $ | 17.29 | |
INCOME FROM INVESTMENT OPERATIONS: | | | | | | | | | | | |
Net investment income (loss)(i) | | (0.10 | ) | 0.01 | | (0.04 | ) | (0.09 | ) | (0.11 | ) |
Net realized and unrealized gain (loss) on investments | | 0.52 | | 2.42 | | 1.96 | | (10.85 | ) | 7.44 | |
Total from investment operations | | 0.42 | | 2.43 | | 1.92 | | (10.94 | ) | 7.33 | |
Dividends from net investment income | | (0.03 | ) | — | | — | | — | | — | |
Distributions from net realized gains | | — | | — | | — | | (3.54 | ) | (1.38 | ) |
Net asset value, end of period | | $ | 13.50 | | $ | 13.11 | | $ | 10.68 | | $ | 8.76 | | $ | 23.24 | |
Total return | | 3.3 | % | 22.8 | % | 21.8 | % | (55.0 | )% | 45.5 | % |
RATIOS/SUPPLEMENTAL DATA: | | | | | | | | | | | |
Net assets, end of period (000’s omitted) | | $ | 317,893 | | $ | 737,099 | | $ | 872,936 | | $ | 882,046 | | $ | 2,032,326 | |
Ratio of gross expenses to average net assets | | 1.18 | % | 1.12 | % | 1.17 | % | 1.11 | % | 1.17 | % |
Ratio of expense reimbursements to average net assets | | 0.00 | % | 0.00 | % | 0.00 | % | 0.00 | % | 0.00 | % |
Ratio of net expenses to average net assets | | 1.18 | % | 1.12 | % | 1.17 | % | 1.11 | % | 1.17 | % |
Ratio of net investment income (loss) to average net assets | | (0.69 | )% | 0.07 | % | (0.44 | )% | (0.56 | )% | (0.54 | )% |
Portfolio turnover rate | | 233.50 | % | 193.69 | % | 297.99 | % | 324.49 | % | 274.32 | % |
See Notes to Financial Statements.
(i) Amount was computed based on average shares outstanding during the period.
49
| | Class R | |
| | Year ended
10/31/2011 | | Year ended
10/31/2010 | | Year ended
10/31/2009 | | Year ended
10/31/2008 | | Year ended
10/31/2007 | |
Net asset value, beginning of period | | $ | 12.51 | | $ | 10.24 | | $ | 8.45 | | $ | 22.64 | | $ | 16.95 | |
INCOME FROM INVESTMENT OPERATIONS: | | | | | | | | | | | |
Net investment loss(i) | | (0.17 | ) | (0.05 | ) | (0.08 | ) | (0.16 | ) | (0.20 | ) |
Net realized and unrealized gain (loss) on investments | | 0.51 | | 2.32 | | 1.87 | | (10.49 | ) | 7.27 | |
Total from investment operations | | 0.34 | | 2.27 | | 1.79 | | (10.65 | ) | 7.07 | |
Distributions from net realized gains | | — | | — | | — | | (3.54 | ) | (1.38 | ) |
Net asset value, end of period | | $ | 12.85 | | $ | 12.51 | | $ | 10.24 | | $ | 8.45 | | $ | 22.64 | |
Total return | | 2.7 | % | 22.2 | % | 21.0 | % | (55.3 | )% | 44.7 | % |
RATIOS/SUPPLEMENTAL DATA: | | | | | | | | | | | |
Net assets, end of period (000’s omitted) | | $ | 34,795 | | $ | 50,016 | | $ | 50,919 | | $ | 40,374 | | $ | 69,877 | |
Ratio of gross expenses to average net assets | | 1.74 | % | 1.65 | % | 1.68 | % | 1.61 | % | 1.67 | % |
Ratio of expense reimbursements to average net assets | | 0.00 | % | 0.00 | % | 0.00 | % | 0.00 | % | 0.00 | % |
Ratio of net expenses to average net assets | | 1.74 | % | 1.65 | % | 1.68 | % | 1.61 | % | 1.67 | % |
Ratio of net investment income (loss) to average net assets | | (1.24 | )% | (0.46 | )% | (0.96 | )% | (1.05 | )% | (1.04 | )% |
Portfolio turnover rate | | 233.50 | % | 193.69 | % | 297.99 | % | 324.49 | % | 274.32 | % |
See Notes to Financial Statements.
(i) Amount was computed based on average shares outstanding during the period.
50
THE ALGER INSTITUTIONAL FUNDS
Financial Highlights for a share outstanding throughout the period
Alger Small Cap Growth Institutional Fund
| | Class I | |
| | Year ended
10/31/2011 | | Year ended
10/31/2010 | | Year ended
10/31/2009 | | Year ended
10/31/2008 | | Year ended
10/31/2007 | |
Net asset value, beginning of period | | $ | 25.28 | | $ | 19.90 | | $ | 16.52 | | $ | 30.30 | | $ | 23.98 | |
INCOME FROM INVESTMENT OPERATIONS: | | | | | | | | | | | |
Net investment loss(i) | | (0.26 | ) | (0.22 | ) | (0.16 | ) | (0.23 | ) | (0.21 | ) |
Net realized and unrealized gain (loss) on investments | | 1.97 | | 5.60 | | 3.54 | | (13.55 | ) | 6.53 | |
Total from investment operations | | 1.71 | | 5.38 | | 3.38 | | (13.78 | ) | 6.32 | |
Net asset value, end of period | | $ | 26.99 | | $ | 25.28 | | $ | 19.90 | | $ | 16.52 | | $ | 30.30 | |
Total return | | 6.8 | % | 27.0 | % | 20.5 | % | (45.5 | )% | 26.4 | % |
RATIOS/SUPPLEMENTAL DATA: | | | | | | | | | | | |
Net assets, end of period (000’s omitted) | | $ | 1,119,966 | | $ | 1,104,866 | | $ | 968,776 | | $ | 634,542 | | $ | 894,802 | |
Ratio of gross expenses to average net assets | | 1.18 | % | 1.23 | % | 1.32 | % | 1.27 | % | 1.33 | % |
Ratio of expense reimbursements to average net assets | | 0.00 | % | 0.00 | % | 0.00 | % | 0.00 | % | (0.03 | )% |
Ratio of net expenses to average net assets | | 1.18 | % | 1.23 | % | 1.32 | % | 1.27 | % | 1.30 | % |
Ratio of net investment income (loss) to average net assets | | (0.94 | )% | (0.94 | )% | (0.94 | )% | (0.97 | )% | (0.78 | )% |
Portfolio turnover rate | | 70.57 | % | 61.40 | % | 90.49 | % | 62.68 | % | 67.53 | % |
See Notes to Financial Statements.
(i) Amount was computed based on average shares outstanding during the period.
51
| | Class R | |
| | Year ended
10/31/2011 | | Year ended
10/31/2010 | | Year ended
10/31/2009 | | Year ended
10/31/2008 | | Year ended
10/31/2007 | |
Net asset value, beginning of period | | $ | 24.39 | | $ | 19.30 | | $ | 16.08 | | $ | 29.64 | | $ | 23.58 | |
INCOME FROM INVESTMENT OPERATIONS: | | | | | | | | | | | |
Net investment loss(i) | | (0.40 | ) | (0.31 | ) | (0.22 | ) | (0.35 | ) | (0.35 | ) |
Net realized and unrealized gain (loss) on investments | | 1.92 | | 5.40 | | 3.44 | | (13.21 | ) | 6.41 | |
Total from investment operations | | 1.52 | | 5.09 | | 3.22 | | (13.56 | ) | 6.06 | |
Net asset value, end of period | | $ | 25.91 | | $ | 24.39 | | $ | 19.30 | | $ | 16.08 | | $ | 29.64 | |
Total return | | 6.2 | % | 26.4 | % | 20.1 | % | (45.8 | )% | 25.7 | % |
RATIOS/SUPPLEMENTAL DATA: | | | | | | | | | | | |
Net assets, end of period (000’s omitted) | | $ | 62,211 | | $ | 68,071 | | $ | 51,707 | | $ | 39,033 | | $ | 47,042 | |
Ratio of gross expenses to average net assets | | 1.71 | % | 1.69 | % | 1.73 | % | 1.77 | % | 1.86 | % |
Ratio of expense reimbursements to average net assets | | 0.00 | % | 0.00 | % | 0.00 | % | 0.00 | % | (0.03 | )% |
Ratio of net expenses to average net assets | | 1.71 | % | 1.69 | % | 1.73 | % | 1.77 | % | 1.83 | % |
Ratio of net investment income (loss) to average net assets | | (1.47 | )% | (1.40 | )% | (1.35 | )% | (1.47 | )% | (1.32 | )% |
Portfolio turnover rate | | 70.57 | % | 61.40 | % | 90.49 | % | 62.68 | % | 67.53 | % |
See Notes to Financial Statements.
(i) Amount was computed based on average shares outstanding during the period.
52
THE ALGER INSTITUTIONAL FUNDS
NOTES TO FINANCIAL STATEMENTS
NOTE 1 — General:
The Alger Institutional Funds (the “Trust”), is a diversified, open-end registered investment company organized as a business trust under the laws of the Commonwealth of Massachusetts. The Trust operates as a series company and currently issues an unlimited number of shares of beneficial interest in four funds — Alger Capital Appreciation Institutional Fund, Alger Large Cap Growth Institutional Fund, Alger Mid Cap Growth Institutional Fund and Alger Small Cap Growth Institutional Fund (collectively, the “Funds” or individually, each a “Fund”). The Funds normally invest primarily in equity securities and each has an investment objective of long-term capital appreciation.
Each Fund offers Class I and Class R shares. Each class has identical rights to assets and earnings except that each share class bears the cost of its transfer agency and sub-transfer agency services and Class R shares bear the cost of its plan of distribution.
NOTE 2 — Significant Accounting Policies:
(a) Investment Valuation: The Funds value their financial instruments at fair value using independent dealers or pricing services under policies approved by the Board. Investments are valued on each day the New York Stock Exchange (the “NYSE”) is open, as of the close of the NYSE (normally 4:00 p.m. Eastern time).
Equity securities and option contracts for which valuation information is readily available are valued at the last reported sales price or official closing price as reported by an independent pricing service on the primary market or exchange on which they are traded. In the absence of reported sales, such securities are valued at a price within the bid and ask price or, in the absence of a recent bid or ask price, the equivalent as obtained from one or more of the major market makers for the securities to be valued.
Debt securities generally trade in the over-the-counter market. Debt securities with remaining maturities of more than sixty days at the time of acquisition are valued on the basis of last available bid prices or current market quotations provided by dealers or pricing services. In determining the value of a particular investment, pricing services may use certain information with respect to transactions in such investments, quotations from dealers, pricing matrixes, market transactions in comparable investments, various relationships observed in the market between investments and calculated yield measures based on valuation technology commonly employed in the market for such investments. Asset-backed and mortgage-backed securities are valued by independent pricing services using models that consider estimated cash flows of each tranche of the security, establish a benchmark yield and develop an estimated tranche-specific spread to the benchmark yield based on the
53
THE ALGER INSTITUTIONAL FUNDS
NOTES TO FINANCIAL STATEMENTS (Continued)
unique attributes of the tranche. Debt securities with a remaining maturity of less than sixty days are valued at amortized cost which approximates market value.
Securities for which market quotations are not readily available are valued at fair value, as determined in good faith pursuant to procedures established by the Board of Trustees.
Securities in which the Funds invest may be traded in foreign markets that close before the close of the NYSE. Developments that occur between the close of the foreign markets and the close of the NYSE may result in adjustments to the closing prices to reflect what the investment adviser, pursuant to policies established by the Board of Trustees, believes to be the fair value of these securities as of the close of the NYSE. The Funds may also fair value securities in other situations, for example, when a particular foreign market is closed but the Fund is open.
Financial Accounting Standards Board Accounting Standards Codification 820 — Fair Value Measurements and Disclosures (“ASC 820”) defines fair value as the price that the Funds would receive upon selling an investment in a timely transaction to an independent buyer in the principal or most advantageous market of the investment. ASC 820 established a three-tier hierarchy to maximize the use of observable market data and minimize the use of unobservable inputs and to establish classification of fair value measurements for disclosure purposes. Inputs refer broadly to the assumptions that market participants would use in pricing the asset or liability and may be observable or unobservable. Observable inputs are based on market data obtained from sources independent of the Funds. Unobservable inputs are inputs that reflect the Funds’ own assumptions based on the best information available in the circumstances. The three-tier hierarchy of inputs is summarized in the three broad Levels listed below.
· Level 1 — quoted prices in active markets for identical investments
· Level 2 — significant other observable inputs (including quoted prices for similar investments, interest rates, prepayment speeds, credit risk, etc.)
· Level 3 — significant unobservable inputs (including the Funds’ own assumptions in determining the fair value of investments)
The Funds’ valuation techniques are consistent with the market approach whereby prices and other relevant information generated by market transactions involving identical or comparable assets are used to measure fair value. Inputs for Level 1 include exchange listed prices and broker quotes in an active market. Inputs for Level 2 include the last trade price in the case of a halted security, a broker quote in an inactive market, an exchange listed price which has been adjusted for fair value factors, and prices of closely related securities. Additional Level 2 inputs include an evaluated price which is based upon a compilation of observable market information
54
THE ALGER INSTITUTIONAL FUNDS
NOTES TO FINANCIAL STATEMENTS (Continued)
such as spreads for fixed income and preferred securities. Inputs for Level 3 include derived prices from unobservable market information which can include cash flows and other information obtained from a company’s financial statements, or from market indicators such as benchmarks and indices.
(b) Cash and Cash Equivalents: Cash and cash equivalents include U.S. dollars and overnight time deposits.
(c) Securities Transactions and Investment Income: Securities transactions are recorded on a trade date basis. Realized gains and losses from securities transactions are recorded on the identified cost basis. Dividend income is recognized on the ex-dividend date and interest income is recognized on the accrual basis.
(d) Foreign Currency Translations: The books and records of the Funds are maintained in U.S. dollars. Foreign currencies, investments and other assets and liabilities are translated into U.S. dollars at the prevailing rates of exchange on the valuation date. Purchases and sales of investment securities and income and expenses are translated into U.S. dollars at the prevailing exchange rates on the respective dates of such transactions.
Net realized gains and losses on foreign currency transactions represent net gains and losses from the disposition of foreign currencies, currency gains and losses realized between the trade dates and settlement dates of security transactions, and the difference between the amount of net investment income accrued and the U.S. dollar amount actually received. The effects of changes in foreign currency exchange rates on investments in securities are included in realized and unrealized gain or loss on investments in the Statement of Operations.
(e) Option Contracts: When a Fund writes an option, an amount equal to the premium received by the Fund is recorded as a liability and is subsequently adjusted to the current fair value of the option written. Premiums received from writing options that expire unexercised are treated by the Fund on the expiration date as realized gains from investments. The difference between the premium and the amount paid on effecting a closing purchase transaction, including brokerage commissions, is also treated as a realized gain, or, if the premium is less than the amount paid for the closing purchase transaction, as a realized loss. If a call option is exercised, the premium is added to the proceeds from the sale of the underlying security in determining whether the Fund has realized a gain or loss. If a put option is exercised, the premium reduces the cost basis of the securities purchased by the Fund. The Fund as writer of an option bears the market risk of an unfavorable change in the price of the security underlying the written option.
The Funds may also purchase put and call options. Each Fund pays a premium which is included in the Fund’s Statement of Assets and Liabilities as an investment and subsequently marked to market to reflect the current value of the option. Premiums paid for purchasing options which expire are treated as realized losses.
55
THE ALGER INSTITUTIONAL FUNDS
NOTES TO FINANCIAL STATEMENTS (Continued)
The risk associated with purchasing put and call options is limited to the premium paid. Premiums paid for purchasing options which are exercised or closed are added to the amounts paid or offset against the proceeds on the underlying security to determine the realized gain or loss.
(f) Dividends to Shareholders: Dividends and distributions payable to shareholders are recorded by the Funds on the ex-dividend date. Dividends from net investment income and distributions from net realized gains are declared and paid annually after the end of the fiscal year in which earned.
Each class is treated separately in determining the amounts of dividends from net investment income payable to holders of its shares.
The characterization of distributions to shareholders for financial reporting purposes is determined in accordance with federal income tax rules. Therefore, the source of a Fund’s distributions may be shown in the accompanying financial statements as either from, or in excess of net investment income, net realized gain on investment transactions or return of capital, depending on the type of book/tax differences that may exist. Capital accounts within the financial statements are adjusted for permanent book/tax differences. Reclassifications result primarily from the difference in tax treatment of net operating losses, passive foreign investment companies, and foreign currency transactions. The reclassifications are done annually at fiscal year end and have no impact on the net asset value of the Fund and are designed to present the Fund’s capital accounts on a tax basis.
(g) Federal Income Taxes: It is each Fund’s policy to comply with the requirements of the Internal Revenue Code Subchapter M applicable to regulated investment companies and to distribute all of its taxable income to its shareholders. Provided that the Funds maintain such compliance, no federal income tax provision is required. Each Fund is treated as a separate entity for the purpose of determining such compliance.
Financial Accounting Standards Board Accounting Standards Codification 740 — Income Taxes (“ASC 740”) requires the Funds to measure and recognize in their financial statements the benefit of a tax position taken (or expected to be taken) on an income tax return if such position will more likely than not be sustained upon examination based on the technical merits of the position. No tax years are currently under investigation. The Funds file income tax returns in the U.S. Federal jurisdiction, as well as the New York State and New York City jurisdictions. The statute of limitations on the Fund’s tax returns remains open for the tax years 2007-2011. Management does not believe there are any uncertain tax positions that require recognition of a tax liability.
(h) Allocation Methods: The Trust accounts separately for the assets, liabilities and operations of each Fund. Expenses directly attributable to each Fund are charged to
56
THE ALGER INSTITUTIONAL FUNDS
NOTES TO FINANCIAL STATEMENTS (Continued)
that Fund’s operations; expenses which are applicable to all Funds are allocated among them based on net assets. Income, realized and unrealized gains and losses, and expenses of each Fund are allocated among the Fund’s classes based on relative net assets, with the exception of distribution fees and transfer agency fees.
(i) Estimates: These financial statements have been prepared in accordance with accounting principles generally accepted in the United States of America, which require using estimates and assumptions that affect the reported amounts therein. Actual results may differ from those estimates.
NOTE 3 — Investment Advisory Fees and Other Transactions with Affiliates:
(a) Investment Advisory and Administration Fees: Fees incurred by each Fund, pursuant to the provisions of its Investment Advisory Agreement and its Administration Agreement with Fred Alger Management, Inc. (Alger Management or the Manager), are payable monthly and computed based on the value of the average daily net assets of each Fund, at the following rates:
| | Advisory
Fee | | Administration
Fee | |
Alger Capital Appreciation Institutional Fund | | .81 | % | .0275 | % |
Alger Large Cap Growth Institutional Fund | | .71 | | .0275 | |
Alger Mid Cap Growth Institutional Fund | | .76 | | .0275 | |
Alger Small Cap Growth Institutional Fund | | .81 | | .0275 | |
(b) Distribution Fees: Class R Shares: The Trust has adopted a Distribution Plan pursuant to which Class R shares of each Fund pay Fred Alger & Company, Incorporated, the Trust’s distributor (the “Distributor” or “Alger Inc.”) and an affiliate of Alger Management, a fee at the annual rate of 0.50% of the respective average daily net assets of the Class R shares of the designated Fund to compensate the Distributor for its activities and expenses incurred in distributing the Class R shares. The fees charged may be more or less than the expenses incurred by the Distributor.
(c) Brokerage Commissions: During the year ended October 31, 2011, the Alger Capital Appreciation Institutional Fund, Alger Large Cap Growth Institutional Fund, Alger Mid Cap Growth Institutional Fund and Alger Small Cap Growth Institutional Fund paid Alger Inc. commissions of $1,158,654, $13,031, $1,095,271 and $877,707, respectively, in connection with securities transactions.
(d) Shareholder Administrative Fees: The Trust has entered into a shareholder administrative services agreement with Alger Management to compensate Alger Management for its liaison and administrative oversight of Boston Financial Data Services, Inc. the transfer agent, and other related services. The Fund’s compensate Alger Management at the annual rate of 0.01% of the average daily net assets for these services. During the year ended October 31, 2011, the Alger Capital
57
THE ALGER INSTITUTIONAL FUNDS
NOTES TO FINANCIAL STATEMENTS (Continued)
Appreciation Institutional Fund, Alger Large Cap Growth Institutional Fund, Alger Mid Cap Growth Institutional Fund and Alger Small Cap Growth Institutional Fund incurred fees of $116,398, $2,433, $62,447 and $125,960, respectively, for these services provided by Alger Management, which are included in the transfer agent fees and expenses in the Statement of Operations.
Alger Management makes payments to intermediaries that provide sub-accounting services to omnibus accounts held by the Funds. Fees paid by Alger Management to intermediaries that provide sub-accounting services are charged back to the appropriate Fund, subject to certain limitations, as approved by the Trust’s Board of Trustees. For the year ended October 31, 2011, Alger Management charged back to the Alger Capital Appreciation Institutional Fund, Alger Large Cap Growth Institutional Fund, Alger Mid Cap Growth Institutional Fund, and Alger Small Cap Growth Institutional Fund, $68,701, $9,254, $125,747 and $96,806, respectively, for these services, which are included in the transfer agent fees and expenses in the Statement’s of Operations.
(e) Shareholder Servicing Fees: The Trust has entered into a shareholder servicing agreement with Alger Inc. whereby Alger Inc. provides the Trust with ongoing servicing of shareholder accounts. As compensation for such services, each Fund pays Alger Inc. a monthly fee at an annual rate of 0.25% of the value of its average daily net assets. The fees charged may be more or less than the expenses incurred by the Distributor.
(f) Trustee Fees: Each Fund pays each trustee who is not affiliated with Alger Management or its affiliates $750 for each meeting attended, to a maximum of $3,000 per annum, plus travel expenses incurred for attending the meeting. The Chairman of the Board of Trustees receives an additional annual fee of $15,000 which is paid, pro rata, by all funds managed by Alger Management. Additionally, each member of a Fund’s audit committee receives an additional $75 from the Fund for each audit committee meeting attended, to a maximum of $300 per annum.
(g) Interfund Loans: The Funds, along with other funds advised by Alger Management, may borrow money from and lend money to each other for temporary or emergency purposes. To the extent permitted under its investment restrictions, each fund may lend uninvested cash in an amount up to 15% of its net assets to other funds. If a fund has borrowed from other funds and has aggregate borrowings from all sources that exceed 10% of the fund’s total assets, such fund will secure all of its loans from other funds. The interest rate charged on interfund loans is equal to the average of the overnight time deposit rate and bank loan rate available to the funds.
During the year ended October 31, 2011, Alger Large Cap Growth Institutional Fund and Alger Mid Cap Growth Institutional Fund incurred interest expense of $573 and $34,025, respectively, in connection with interfund loans.
58
THE ALGER INSTITUTIONAL FUNDS
NOTES TO FINANCIAL STATEMENTS (Continued)
(h) Other Transactions With Affiliates: Certain officers of the Trust are directors and officers of Alger Management and the Distributor.
NOTE 4 — Securities Transactions:
The following summarizes the securities transactions by the Funds, other than U.S. Government and short-term securities, for the year ended October 31, 2011:
| | PURCHASES | | SALES | |
Alger Capital Appreciation Institutional Fund | | $ | 1,931,887,544 | | $ | 1,725,975,981 | |
Alger Large Cap Growth Institutional Fund | | 13,464,352 | | 23,001,777 | |
Alger Mid Cap Growth Institutional Fund | | 1,431,899,484 | | 1,944,835,432 | |
Alger Small Cap Growth Institutional Fund | | 860,725,543 | | 940,387,427 | |
| | | | | | | |
Written call and put options activity for the year ended October 31, 2011, was as follows:
| | NUMBER OF
CONTRACTS | | PREMIUMS
RECEIVED | |
Alger Mid Cap Growth Institutional Fund | | | | | |
Call Options outstanding at October 31, 2010 | | — | | $ | — | |
Call Options written | | 11,390 | | 5,026,878 | |
Call Options closed | | 4,593 | | 3,414,071 | |
Call Options expired | | 5,075 | | 1,172,149 | |
Call Options exercised | | 1,259 | | 305,075 | |
Call Options outstanding at October 31, 2011 | | 463 | | $ | 135,583 | |
| | NUMBER OF
CONTRACTS | | PREMIUMS
RECEIVED | |
Alger Mid Cap Growth Institutional Fund | | | | | |
Put Options outstanding at October 31, 2010 | | — | | $ | — | |
Put Options written | | 24,920 | | 4,889,130 | |
Put Options closed | | 20,482 | | 3,624,302 | |
Put Options expired | | 733 | | 241,640 | |
Put Options exercised | | 2,412 | | 693,625 | |
Put Options outstanding at October 31, 2011 | | 1,293 | | $ | 329,563 | |
| | NUMBER OF
CONTRACTS | | PREMIUMS
RECEIVED | |
Alger Capital Appreciation Institutional Fund | | | | | |
Call Options outstanding at October 31, 2010 | | — | | $ | — | |
Call Options written | | 1,435 | | 187,935 | |
Call Options closed | | 1,435 | | 187,935 | |
Call Options expired | | — | | — | |
Call Options exercised | | — | | — | |
Call Options outstanding at October 31, 2011 | | — | | $ | — | |
59
THE ALGER INSTITUTIONAL FUNDS
NOTES TO FINANCIAL STATEMENTS (Continued)
As of October 31, 2011, Alger Mid Cap Growth Institutional Fund had portfolio securities and cash valued at $3,788,902, segregated as collateral for written options.
NOTE 5 — Borrowings:
The Funds may borrow from their custodian on an uncommitted basis. Each Fund pays the custodian a market rate of interest, generally based upon the London Inter-Bank Offer Rate. The Funds may also borrow from other funds advised by Alger Management, as discussed in Note 3(g). For the year ended October 31, 2011, the Funds had the following borrowings:
| | AVERAGE DAILY
BORROWING | | WEIGHTED AVERAGE
INTEREST RATE | |
Alger Large Cap Growth Institutional Fund | | $ | 52,827 | | 1.20 | % |
Alger Mid Cap Growth Institutional Fund | | 3,620,771 | | 1.28 | |
| | | | | | |
The highest amount borrowed during the year ended October 31, 2011 for each Fund was as follows:
| | Highest Borrowing | |
Alger Large Cap Growth Institutional Fund | | $ | 2,600,000 | |
Alger Mid Cap Growth Institutional Fund | | 35,000,000 | |
| | | | |
NOTE 6 — Share Capital:
The Trust has an unlimited number of authorized shares of beneficial interest of $.001 par value which are presently divided into four series. Each series is divided into two separate classes. The transactions of shares of beneficial interest were as follows:
| | FOR THE YEAR ENDED
OCTOBER 31, 2011 | | FOR THE YEAR ENDED
OCTOBER 31, 2010 | |
| | SHARES | | AMOUNT | | SHARES | | AMOUNT | |
Alger Capital Appreciation Institutional Fund | | | | | | | | | |
Class I: | | | | | | | | | |
Shares sold | | 20,110,824 | | $ | 421,647,062 | | 19,473,961 | | $ | 352,937,591 | |
Dividends reinvested | | — | | — | | 66,060 | | 1,200,314 | |
Shares redeemed | | (12,211,244 | ) | (256,765,961 | ) | (16,081,225 | ) | (288,322,885 | ) |
Net increase | | 7,899,580 | | $ | 164,881,101 | | 3,458,796 | | $ | 65,815,020 | |
Class R: | | | | | | | | | |
Shares sold | | 4,952,676 | | $ | 100,314,955 | | 5,268,214 | | $ | 91,995,788 | |
Shares redeemed | | (2,822,040 | ) | (57,122,489 | ) | (1,696,170 | ) | (29,601,642 | ) |
Net increase | | 2,130,636 | | $ | 43,192,466 | | 3,572,044 | | $ | 62,394,146 | |
60
THE ALGER INSTITUTIONAL FUNDS
NOTES TO FINANCIAL STATEMENTS (Continued)
| | FOR THE YEAR ENDED
OCTOBER 31, 2011 | | FOR THE YEAR ENDED
OCTOBER 31, 2010 | |
| | SHARES | | AMOUNT | | SHARES | | AMOUNT | |
Alger Large Cap Growth Institutional Fund | | | | | | | | | |
Class I: | | | | | | | | | |
Shares sold | | 601,991 | | $ | 8,363,658 | | 777,982 | | $ | 9,369,072 | |
Dividends reinvested | | 6,139 | | 83,370 | | 9,295 | | 111,911 | |
Shares redeemed | | (1,186,020 | ) | (16,345,962 | ) | (2,552,508 | ) | (30,084,515 | ) |
Net decrease | | (577,890 | ) | $ | (7,898,934 | ) | (1,765,231 | ) | $ | (20,603,532 | ) |
Class R: | | | | | | | | | |
Shares sold | | 125,947 | | $ | 1,662,036 | | 110,668 | | $ | 1,296,682 | |
Dividends reinvested | | 117 | | 1,538 | | — | | — | |
Shares redeemed | | (196,843 | ) | (2,642,080 | ) | (173,294 | ) | (2,014,350 | ) |
Net decrease | | (70,779 | ) | $ | (978,506 | ) | (62,626 | ) | $ | (717,668 | ) |
| | | | | | | | | |
Alger Mid Cap Growth Institutional Fund | | | | | | | | | |
Class I: | | | | | | | | | |
Shares sold | | 9,162,719 | | $ | 132,880,088 | | 15,997,853 | | $ | 192,249,971 | |
Dividends reinvested | | 104,528 | | 1,490,566 | | — | | — | |
Shares redeemed | | (41,941,828 | ) | (613,811,578 | ) | (41,542,288 | ) | (495,420,451 | ) |
Net decrease | | (32,674,581 | ) | $ | (479,440,924 | ) | (25,544,435 | ) | $ | (303,170,480 | ) |
Class R: | | | | | | | | | |
Shares sold | | 1,103,541 | | $ | 15,171,863 | | 1,296,391 | | $ | 14,963,925 | |
Shares redeemed | | (2,392,797 | ) | (32,661,440 | ) | (2,270,655 | ) | (25,813,610 | ) |
Net decrease | | (1,289,256 | ) | $ | (17,489,577 | ) | (974,264 | ) | $ | (10,849,685 | ) |
| | | | | | | | | |
Alger Small Cap Growth Institutional Fund | | | | | | | | | |
Class I: | | | | | | | | | |
Shares sold | | 16,073,601 | | $ | 446,521,164 | | 20,108,242 | | $ | 459,585,650 | |
Shares redeemed | | (18,288,847 | ) | (508,354,637 | ) | (25,069,150 | ) | (573,429,492 | ) |
Net decrease | | (2,215,246 | ) | $ | (61,833,473 | ) | (4,960,908 | ) | $ | (113,843,842 | ) |
Class R: | | | | | | | | | |
Shares sold | | 650,452 | | $ | 17,559,906 | | 930,438 | | $ | 20,803,418 | |
Shares redeemed | | (1,039,917 | ) | (28,120,303 | ) | (819,511 | ) | (18,337,692 | ) |
Net increase (decrease) | | (389,465 | ) | $ | (10,560,397 | ) | 110,927 | | $ | 2,465,726 | |
During the year ended October 31, 2010, shares redeemed for the Alger Small Cap Growth Institutional Fund included a redemption-in-kind of 1,732,850 Class I shares valued at $38,781,182.
NOTE 7 — Income Tax Information:
The tax character of distributions paid, during the year ended October 31, 2011 and the year ended October 31, 2010 were as follows:
61
THE ALGER INSTITUTIONAL FUNDS
NOTES TO FINANCIAL STATEMENTS (Continued)
| | FOR THE YEAR ENDED
OCTOBER 31, 2011 | | FOR THE YEAR ENDED
OCTOBER 31, 2010 | |
Alger Capital Appreciation Institutional Fund | | | | | |
Distributions paid from: | | | | | |
Ordinary Income | | — | | $ | 1,279,828 | |
Long-term capital gain | | — | | — | |
Total distributions paid | | — | | $ | 1,279,828 | |
| | | | | |
Alger Large Cap Growth Institutional Fund | | | | | |
Distributions paid from: | | | | | |
Ordinary Income | | $ | 179,485 | | $ | 150,594 | |
Long-term capital gain | | — | | — | |
Total distributions paid | | $ | 179,485 | | $ | 150,594 | |
| | | | | |
Alger Mid Cap Growth Institutional Fund | | | | | |
Distributions paid from: | | | | | |
Ordinary Income | | $ | 1,902,006 | | — | |
Long-term capital gain | | — | | — | |
Total distributions paid | | $ | 1,902,006 | | — | |
| | | | | |
Alger Small Cap Growth Institutional Fund | | | | | |
Distributions paid from: | | | | | |
Ordinary Income | | — | | — | |
Long-term capital gain | | — | | — | |
Total distributions paid | | — | | — | |
As of October 31, 2011, the components of accumulated gains (losses) on a tax basis were as follows:
Alger Capital Appreciation Institutional Fund | | | |
Undistributed ordinary income | | $ | 34,774,089 | |
Undistributed long-term gains | | $ | 13,136,499 | |
Net accumulated earnings | | $ | 47,910,588 | |
Capital loss carryforwards | | — | |
Net unrealized appreciation | | $ | 34,272,997 | |
Total accumulated gains | | $ | 82,183,585 | |
| | | |
Alger Large Cap Growth Institutional Fund | | | |
Undistributed ordinary income | | — | |
Undistributed long-term gains | | — | |
Net accumulated earnings | | — | |
Capital loss carryforwards | | $ | (9,736,311 | ) |
Net unrealized appreciation | | $ | 928,814 | |
Total accumulated losses | | $ | (8,807,497 | ) |
62
THE ALGER INSTITUTIONAL FUNDS
NOTES TO FINANCIAL STATEMENTS (Continued)
Alger Mid Cap Growth Institutional Fund | | | |
Undistributed ordinary income | | — | |
Undistributed long-term gains | | — | |
Net accumulated earnings | | — | |
Capital loss carryforwards | | $ | (340,398,468 | ) |
Net unrealized depreciation | | $ | (40,823,164 | ) |
Total accumulated losses | | $ | (381,221,632 | ) |
| | | |
Alger Small Cap Growth Institutional Fund | | | |
Undistributed ordinary income | | — | |
Undistributed long-term gains | | $ | 48,580,800 | |
Net accumulated earnings | | $ | 48,580,800 | |
Capital loss carryforwards | | — | |
Net unrealized appreciation | | $ | 109,317,889 | |
Total accumulated gains | | $ | 157,898,689 | |
At October 31, 2011, the Funds, for federal income tax purposes, had capital loss carryforwards which expire as set forth in the table below. These amounts may be applied against future net realized gains until the earlier of their utilization or expiration.
Expiration Dates | | Alger Capital
Appreciation
Institutional Fund | | Alger Large Cap
Growth
Institutional Fund | | Alger Mid Cap
Growth
Institutional Fund | | Alger Small Cap
Growth
Institutional Fund | |
2016 | | — | | $ | 5,521,428 | | $ | 18,359,838 | | — | |
2017 | | — | | 4,214,883 | | 322,038,630 | | — | |
Total | | — | | $ | 9,736,311 | | $ | 340,398,468 | | — | |
Under the recently enacted Regulated Investment Company Modernization Act of 2010, capital losses incurred by the Funds after October 31, 2011 will not be subject to expiration. In addition, losses incurred after October 31, 2011 must be utilized prior to the utilization of capital loss carryforwards above.
The difference between book-basis and tax-basis unrealized appreciation (depreciation) is determined annually and is attributable primarily to the tax deferral of losses on wash sales, the tax treatment of premium/discount on debt securities, the tax treatment of partnerships investments, the realization of unrealized appreciation of Passive Foreign Investment Companies, and return of capital from Real Estate Investment Trust investments.
Permanent differences, primarily from net operating losses and real estate investment trusts and partnership investments sold by the Portfolios, resulted in the following reclassifications among the Portfolio’s components of net assets at October 31, 2011:
63
THE ALGER INSTITUTIONAL FUNDS
NOTES TO FINANCIAL STATEMENTS (Continued)
Alger Capital Appreciation Institutional Fund | | | |
Accumulated Undistributed Net Investment Income | | $ | 1,461,251 | |
Accumulated Net Realized Loss | | $ | (1,461,255 | ) |
Paid-in Capital | | $ | 4 | |
| | | |
Alger Large Cap Growth Institutional Fund | | | |
Accumulated Undistributed Net Investment Income | | $ | 109,019 | |
Accumulated Net Realized Gain | | $ | 652,680 | |
Paid-in Capital | | $ | (761,699 | ) |
| | | |
Alger Mid Cap Growth Institutional Fund | | | |
Accumulated Undistributed Net Investment Income | | $ | 5,399,711 | |
Accumulated Net Realized Loss | | $ | (856,286 | ) |
Paid-in Capital | | $ | (4,543,425 | ) |
| | | |
Alger Small Cap Growth Institutional Fund | | | |
Accumulated Undistributed Net Investment Income | | $ | 12,052,125 | |
Accumulated Net Realized Loss | | $ | (95,153 | ) |
Paid-in Capital | | $ | (11,956,972 | ) |
NOTE 8 — Fair Value Measurements:
The major categories of securities and their respective fair value inputs are detailed in each Fund’s Schedule of Investments. The following is a summary of the inputs used as of the year ended October 31, 2011 in valuing the Funds’ investments carried at fair value:
Alger Capital Appreciation Institutional
Fund | | TOTAL FUND | | LEVEL 1 | | LEVEL 2 | | LEVEL 3 | |
COMMON STOCKS | | | | | | | | | |
Consumer Discretionary | | $ | 194,757,952 | | $ | 194,757,952 | | — | | — | |
Consumer Staples | | 114,407,156 | | 114,407,156 | | — | | — | |
Energy | | 129,532,216 | | 129,532,216 | | — | | — | |
Financials | | 37,697,112 | | 37,697,112 | | — | | — | |
Health Care | | 154,678,403 | | 154,678,403 | | — | | — | |
Industrials | | 161,439,816 | | 161,439,816 | | — | | — | |
Information Technology | | 354,885,033 | | 354,885,033 | | — | | — | |
Materials | | 52,632,926 | | 52,632,926 | | — | | — | |
Telecommunication Services | | 27,461,369 | | 27,461,369 | | — | | — | |
TOTAL COMMON STOCKS | | $ | 1,227,491,983 | | $ | 1,227,491,983 | | — | | — | |
CONVERTIBLE CORPORATE BONDS | | | | | | | | | |
Materials | | $ | 1,010,100 | | — | | $ | 1,010,100 | | — | |
CONVERTIBLE PREFERRED STOCK | | | | | | | | | |
Health Care | | $ | 3,475,570 | | — | | — | | $ | 3,475,570 | |
TOTAL INVESTMENTS IN SECURITIES | | $ | 1,231,977,653 | | $ | 1,227,491,983 | | $ | 1,010,100 | | $ | 3,475,570 | |
64
THE ALGER INSTITUTIONAL FUNDS
NOTES TO FINANCIAL STATEMENTS (Continued)
Alger Large Cap Growth Institutional
Fund | | TOTAL FUND | | LEVEL 1 | | LEVEL 2 | | LEVEL 3 | |
COMMON STOCKS | | | | | | | | | |
Consumer Discretionary | | $ | 2,183,055 | | $ | 2,183,055 | | — | | — | |
Consumer Staples | | 2,193,104 | | 2,193,104 | | — | | — | |
Energy | | 2,252,753 | | 2,252,753 | | — | | — | |
Financials | | 1,036,961 | | 1,036,961 | | — | | — | |
Health Care | | 1,715,362 | | 1,715,362 | | — | | — | |
Industrials | | 2,682,514 | | 2,682,514 | | — | | — | |
Information Technology | | 6,677,266 | | 6,677,266 | | — | | — | |
Materials | | 1,159,235 | | 1,159,235 | | — | | — | |
Telecommunication Services | | 195,605 | | 195,605 | | — | | — | |
TOTAL COMMON STOCKS | | $ | 20,095,855 | | $ | 20,095,855 | | — | | — | |
TOTAL INVESTMENTS IN SECURITIES | | $ | 20,095,855 | | $ | 20,095,855 | | — | | — | |
Alger Mid Cap Growth Institutional
Fund | | TOTAL FUND | | LEVEL 1 | | LEVEL 2 | | LEVEL 3 | |
COMMON STOCKS | | | | | | | | | |
Consumer Discretionary | | $ | 64,957,568 | | $ | 57,381,345 | | $ | 7,576,223 | | — | |
Consumer Staples | | 7,038,566 | | 7,038,566 | | — | | — | |
Energy | | 36,066,286 | | 36,066,286 | | — | | — | |
Financials | | 19,362,834 | | 19,362,834 | | — | | — | |
Health Care | | 44,201,935 | | 44,201,935 | | — | | — | |
Industrials | | 48,138,074 | | 48,138,074 | | — | | — | |
Information Technology | | 76,545,076 | | 76,545,076 | | — | | — | |
Materials | | 25,318,670 | | 22,374,727 | | 2,943,943 | | — | |
TOTAL COMMON STOCKS | | $ | 321,629,009 | | $ | 311,108,843 | | $ | 10,520,166 | | — | |
CONVERTIBLE PREFERRED STOCK | | | | | | | | | |
Health Care | | $ | 10,607,090 | | — | | — | | $ | 10,607,090 | |
PURCHASED OPTIONS | | | | | | | | | |
Energy | | $ | 48,470 | | $ | 48,470 | | — | | — | |
Financials | | $ | 1,196,138 | | $ | 1,196,138 | | — | | — | |
TOTAL PURCHASED OPTIONS | | $ | 1,244,608 | | $ | 1,244,608 | | — | | — | |
TOTAL INVESTMENTS IN SECURITIES | | $ | 333,480,707 | | $ | 312,353,451 | | $ | 10,520,166 | | $ | 10,607,090 | |
OPTIONS WRITTEN | | | | | | | | | |
Energy | | $ | 440,848 | | $ | 134,448 | | $ | 306,400 | | — | |
Financials | | $ | 124,047 | | $ | 124,047 | | — | | — | |
Industrials | | 12,190 | | 12,190 | | — | | — | |
TOTAL OPTIONS WRITTEN | | $ | 577,085 | | $ | 270,685 | | $ | 306,400 | | — | |
65
THE ALGER INSTITUTIONAL FUNDS
NOTES TO FINANCIAL STATEMENTS (Continued)
Alger Small Cap Growth Institutional
Fund | | TOTAL FUND | | LEVEL 1 | | LEVEL 2 | | LEVEL 3 | |
COMMON STOCKS | | | | | | | | | |
Consumer Discretionary | | $ | 189,748,125 | | $ | 189,748,125 | | — | | — | |
Consumer Staples | | 33,006,969 | | 33,006,969 | | — | | — | |
Energy | | 91,561,173 | | 91,561,173 | | — | | — | |
Financials | | 65,280,542 | | 65,280,542 | | — | | — | |
Health Care | | 207,428,799 | | 207,428,799 | | — | | — | |
Industrials | | 200,447,024 | | 200,447,024 | | — | | — | |
Information Technology | | 285,109,108 | | 285,109,108 | | — | | — | |
Materials | | 54,891,887 | | 54,891,887 | | — | | — | |
Telecommunication Services | | 6,127,088 | | 6,127,088 | | — | | — | |
Utilities | | 12,776,054 | | 12,776,054 | | — | | — | |
TOTAL COMMON STOCKS | | $ | 1,146,376,769 | | $ | 1,146,376,769 | | — | | — | |
TOTAL INVESTMENTS IN SECURITIES | | $ | 1,146,376,769 | | $ | 1,146,376,769 | | — | | — | |
| | FAIR VALUE
MEASUREMENTS
USING SIGNIFICANT
UNOBSERVABLE
INPUTS (LEVEL3) | |
Alger Capital Appreciation Institutional Fund | | Convertible
Preferred Stock | |
Opening balance at November 1, 2010 | | $ | — | |
Transfers into Level 3 | | — | |
Transfers out of Level 3 | | — | |
Total gains or losses | | | |
Included in net realized gain (loss) on investments | | — | |
Included in net unrealized gain (loss) on investments | | — | |
Purchases, issuances, sales, and settlements | | | |
Purchases | | 3,475,570 | |
Issuances | | — | |
Sales | | — | |
Settlements | | — | |
Closing balance at October 31, 2011 | | 3,475,570 | |
The amount of total gains or losses for the period included in net realized and unrealized gain (loss) attributable to change in unrealized appreciation (depreciation) relating to investments still held at October 31, 2011 | | $ | — | |
66
THE ALGER INSTITUTIONAL FUNDS
NOTES TO FINANCIAL STATEMENTS (Continued)
| | FAIR VALUE
MEASUREMENTS
USING SIGNIFICANT
UNOBSERVABLE
INPUTS (LEVEL3) | |
Alger Mid Cap Growth Institutional Fund | | Convertible
Preferred Stock | |
Opening balance at November 1, 2010 | �� | $ | 5,689,997 | |
Transfers into Level 3 | | — | |
Transfers out of Level 3 | | — | |
Total gains or losses | | | |
Included in net realized gain (loss) on investments | | — | |
Included in net unrealized gain (loss) on investments | | 4,917,093 | |
Purchases, issuances, sales, and settlements | | | |
Purchases | | $ | — | |
Issuances | | — | |
Sales | | — | |
Settlements | | — | |
Closing balance at October 31, 2011 | | 10,607,090 | |
The amount of total gains or losses for the period included in net realized and unrealized gain (loss) attributable to change in unrealized appreciation (depreciation) relating to investments still held at October 31, 2011 | | $ | 4,917,093 | |
For the year ended October 31, 2011, there were no significant transfers between Level 1 and Level 2.
NOTE 9 — Derivatives:
Financial Accounting Standards Board Accounting Standards Codification 815 — Derivatives and Hedging (“ASC 815”) requires qualitative disclosures about objectives and strategies for using derivatives, quantitative disclosures about fair value amounts of and gains and losses on derivative instruments, and disclosures about credit-risk-related contingent features in derivative agreements.
Forward currency contracts—In connection with portfolio purchases and sales of securities denominated in foreign currencies, the Funds may enter into forward currency contracts. Additionally, each Fund may enter into such contracts to economically hedge certain other foreign currency denominated investments. These contracts are valued at the current cost of covering or offsetting such contracts, and the related realized and unrealized foreign exchange gains and losses are included in the statement of operations. In the event that counterparties fail to settle these currency contracts or the related foreign security trades, a Fund could be exposed to foreign currency fluctuations.
Options—The Funds seek to capture the majority of the returns associated with equity market investments. To meet this investment goal, the Funds invest in a broadly diversified portfolio of common stocks, while also buying and selling call and put options on equities and equity indices. The Funds purchase call options to increase their exposure to stock market risk and also provide diversification of risk.
67
THE ALGER INSTITUTIONAL FUNDS
NOTES TO FINANCIAL STATEMENTS (Continued)
The Funds purchase put options in order to protect from significant market declines that may occur over a short period of time. The Funds will write covered call and cash secured put options to generate cash flows while reducing the volatility of the Funds’ portfolios. The cash flows may be an important source of the Funds’ return, although written call options may reduce the Funds’ ability to profit from increases in the value of the underlying security or equity portfolio. The value of a call option generally increases as the price of the underlying stock increases and decreases as the stock decreases in price. Conversely, the value of a put option generally increases as the price of the underlying stock decreases and decreases as the stock increases in price. The combination of the diversified stock portfolio and the purchase and sale of options is intended to provide the Funds with the majority of the returns associated with equity market investments but with reduced volatility and returns that are augmented with the cash flows from the sale of options. During the year ended October 31, 2011, options were used in accordance with these objectives.
The fair values of derivative instruments as of October 31, 2011 are as follows:
Alger Mid Cap Growth Institutional Fund
| | ASSET DERIVATIVES 2011 | | LIABILITY DERIVATIVES 2011 | |
Derivatives not accounted
for as hedging instruments | | Balance Sheet
Location | | Fair Value | | Balance Sheet
Location | | Fair Value | |
Purchased Put Options | | Investments in Securities, at value | | $ | 1,219,448 | | | | | |
Purchased Call Options | | Investments in Securities, at value | | 25,160 | | | | | |
Written Put Options | | — | | — | | Written options outstanding, at value | | $ | 266,545 | |
Written Call Options | | — | | — | | Written options outstanding, at value | | 310,540 | |
Total | | | | 1,244,608 | | | | $ | 577,085 | |
| | | | | | | | | | | |
68
THE ALGER INSTITUTIONAL FUNDS
NOTES TO FINANCIAL STATEMENTS (Continued)
For the year ended October 31, 2011, Alger Mid Cap Growth Institutional Fund had option purchases of $15,406,484 and option sales of $14,646,018 and Alger Capital Appreciation Institutional Fund had option purchases of $190,536 and option sales of $187,935. The effect of derivative instruments on the Statement of Operations for the year ended October 31, 2011 is as follows:
Net realized gain on investments and options |
Alger Mid Cap Growth Institutional Fund
Derivatives not accounted for as hedging instruments | | Options | |
Purchased Options | | $ | (2,363,424 | ) |
Written Options | | 3,430,839 | |
Total | | $ | 1,067,415 | |
Alger Capital Appreciation Institutional Fund
Derivatives not accounted for as hedging instruments | | Options | |
Purchased Options | | $ | — | |
Written Options | | 94,011 | |
Total | | $ | 94,011 | |
Net change in unrealized appreciation (depreciation) on investments, options |
Alger Mid Cap Growth Institutional Fund
Derivatives not accounted for as hedging instruments under Statement 133 | | Options | |
Purchased Options | | $ | (1,048,420 | ) |
Written Options | | (111,939 | ) |
Total | | (1,160,359 | ) |
| | | | |
NOTE 10 — Litigation:
On August 31, 2005, the West Virginia Securities Commissioner (the “WVSC”), in an ex parte Summary Order to Cease and Desist and Notice of Right to Hearing, concluded that the Manager and the Distributor had violated the West Virginia Uniform Securities Act (the “WVUSA”), and ordered the Manager and the Distributor to cease and desist from further violations of the WVUSA by engaging in the market-timing-related conduct described in the order. The ex parte order provided notice of their right to a hearing with respect to the violations of law asserted by the WVSC. Other firms unaffiliated with the Manager were served with similar orders. The Manager and the Distributor intend to request a hearing for the purpose of seeking to vacate or modify the order.
69
THE ALGER INSTITUTIONAL FUNDS
NOTES TO FINANCIAL STATEMENTS (Continued)
NOTE 11 — Recent Accounting Pronouncements:
The Financial Accounting Standards Board (FASB) issued Accounting Standards Update (ASU) 2011-04, Amendments to Achieve Common Fair Value Measurement and Disclosure Requirements in U.S. GAAP and IFRSs (International Financial Reporting Standards). The ASU converges fair value measurement and disclosure guidance in U.S. GAAP with the guidance in the International Accounting Standards Board’s concurrently issued IFRS 13, Fair Value Measurement. These amendments do not modify the requirements for when fair value measurements apply; rather, they generally represent clarifications on how to measure and disclose fair value under ASC 820, Fair Value Measurement. The application of ASU 2011-04 is required for fiscal years and interim periods beginning after December 15, 2011. At this time, management is evaluating the implications of ASU 2011-04.
NOTE 12 — Subsequent Events:
Management of each Fund has evaluated events that have occurred subsequent to October 31, 2011. No such events have been identified which require recognition and disclosure.
70
REPORT OF INDEPENDENT REGISTERED PUBLIC ACCOUNTING FIRM
To the Shareholders and Board of Trustees of
The Alger Institutional Funds:
We have audited the accompanying statements of assets and liabilities, including the schedules of investments, of The Alger Institutional Funds, comprised of the Alger Capital Appreciation Institutional Fund, Alger Large Cap Growth Institutional Fund, Alger Mid Cap Growth Institutional Fund, and Alger Small Cap Growth Institutional Fund (the “Funds”) as of October 31, 2011, and the related statements of operations for the year then ended, the statements of changes in net assets for each of the two years in the period then ended, and the financial highlights for each of the three years in the period then ended. These financial statements and financial highlights are the responsibility of the Funds’ management. Our responsibility is to express an opinion on these financial statements and financial highlights based on our audits. The Funds’ financial highlights for the respective periods ended October 31, 2008 were audited by other auditors, whose report dated December 16, 2008, expressed an unqualified opinion on such financial highlights.
We conducted our audits in accordance with the standards of the Public Company Accounting Oversight Board (United States). Those standards require that we plan and perform the audit to obtain reasonable assurance about whether the financial statements and financial highlights are free of material misstatement. The Funds are not required to have, nor were we engaged to perform, an audit of their internal control over financial reporting. Our audits included consideration of internal control over financial reporting as a basis for designing audit procedures that are appropriate in the circumstances, but not for the purpose of expressing an opinion on the effectiveness of the Funds’ internal control over financial reporting. Accordingly, we express no such opinion. An audit also includes examining, on a test basis, evidence supporting the amounts and disclosures in the financial statements, assessing the accounting principles used and significant estimates made by management, as well as evaluating the overall financial statement presentation. Our procedures included confirmation of securities owned as of October 31, 2011, by correspondence with the custodian and brokers; where replies were not received from brokers, we performed other auditing procedures. We believe that our audits provide a reasonable basis for our opinion.
In our opinion, the financial statements and financial highlights referred to above, present fairly, in all material respects, the financial position of each of the portfolios constituting The Alger Institutional Funds as of October 31, 2011, the results of their operations for the year then ended, the changes in their net assets for each of the two years in the period then ended, and the financial highlights for each of the three years in the period then ended, in conformity with accounting principles generally accepted in the United States of America.
71
Deloitte & Touche LLP
New York, New York
December 23, 2011
72
THE ALGER INSTITUTIONAL FUNDS
ADDITIONAL INFORMATION (Unaudited)
Expense Example
As a shareholder of a Fund, you incur two types of costs: transaction costs, if applicable, including sales charges (loads) and redemption fees; and ongoing costs, including management fees, distribution (12b-1) fees, if applicable, and other fund expenses. This example is intended to help you understand your ongoing costs (in dollars) of investing in the Fund and to compare these costs with the ongoing costs of investing in other mutual funds.
The example below is based on an investment of $1,000 invested at the beginning of the six-month period starting May 1, 2011 and ending October 31, 2011.
Actual Expenses
The first line for each class of shares in the table below provides information about actual account values and actual expenses. You may use the information in this line, together with the amount you invested, to estimate the expenses that you would have paid over the period. Simply divide your account value by $1,000 (for example, an $8,600 account value divided by $1,000 = 8.6), then multiply the result by the number in the first line under the heading entitled “Expenses Paid During the Period” to estimate the expenses you paid on your account during this period.
Hypothetical Example for Comparison Purposes
The second line for each class of shares in the table below provides information about hypothetical account values and hypothetical expenses based on the Fund’s actual expense ratios for each class of shares and an assumed rate of return of 5% per year before expenses, which is not the Fund’s actual return. The hypothetical account values and expenses may not be used to estimate the actual ending account balance or expenses you paid for the period. You may use this information to compare the ongoing costs of investing in the Fund and other funds. To do so, compare this 5% hypothetical example with the 5% hypothetical examples that appear in the shareholder reports of other funds.
Please note that the expenses shown in the table are meant to highlight your ongoing costs only and do not reflect any transaction costs, such as sales charges (loads) and redemption fees. Therefore, the second line under each class of shares in the table is useful in comparing ongoing costs only, and will not help you determine the relative total costs of owning different funds. In addition, if these transactional costs were included, your costs would have been higher.
73
| | Beginning
Account
Value
May 1, 2011 | | Ending
Account
Value
October 31, 2011 | | Expenses
Paid During
the Six Months
Ended
October 31,
2011(a) | | Ratio of
Expenses to
Average
Net Assets
For the
Six Months
Ended
October 31,
2011(b) | |
Alger Capital Appreciation Institutional Fund | | | | | | | | | |
Class I | Actual | | $ | 1,000.00 | | $ | 907.43 | | $ | 5.62 | | 1.17 | % |
| Hypothetical(c) | | 1,000.00 | | 1,019.31 | | 5.95 | | 1.17 | |
Class R | Actual | | 1,000.00 | | 905.02 | | 8.07 | | 1.68 | |
| Hypothetical(c) | | 1,000.00 | | 1,016.73 | | 8.55 | | 1.68 | |
| | | | | | | | | | |
Alger Large Cap Growth Institutional Fund | | | | | | | | | |
Class I | Actual | | $ | 1,000.00 | | $ | 929.68 | | $ | 8.23 | | 1.69 | % |
| Hypothetical(c) | | 1,000.00 | | 1,016.68 | | 8.60 | | 1.69 | |
Class R | Actual | | 1,000.00 | | 926.73 | | 11.65 | | 2.40 | |
| Hypothetical(c) | | 1,000.00 | | 1,013.11 | | 12.17 | | 2.40 | |
| | | | | | | | | | |
Alger Mid Cap Growth Institutional Fund | | | | | | | | | |
Class I | Actual | | $ | 1,000.00 | | $ | 833.44 | | $ | 5.44 | | 1.18 | % |
| Hypothetical(c) | | 1,000.00 | | 1,019.27 | | 5.99 | | 1.18 | |
Class R | Actual | | 1,000.00 | | 831.18 | | 8.01 | | 1.74 | |
| Hypothetical(c) | | 1,000.00 | | 1,016.46 | | 8.82 | | 1.74 | |
| | | | | | | | | | |
Alger Small Cap Growth Institutional Fund | | | | | | | | | |
Class I | Actual | | $ | 1,000.00 | | $ | 845.02 | | $ | 5.51 | | 1.18 | % |
| Hypothetical(c) | | 1,000.00 | | 1,019.24 | | 6.03 | | 1.18 | |
Class R | Actual | | 1,000.00 | | 842.88 | | 7.93 | | 1.71 | |
| Hypothetical(c) | | 1,000.00 | | 1,016.60 | | 8.68 | | 1.71 | |
(a) | Expenses are equal to the annualized expense ratio of the respective share class, multiplied by the average account value over the period, multiplied by 184/365 (to reflect the one-half year period). |
(b) | Annualized. |
(c) | 5% annual return before expenses. |
Trustees and Officers of the Fund
Information about the trustees and officers of the Fund is set forth below. In the table the term “Alger Fund Complex” refers to the Fund, The Alger Funds, The Alger Portfolios, Alger China-U.S. Growth Fund and The Alger Funds II, each of which is a registered investment company managed by Fred Alger Management, Inc. (“Alger Management”). Each Trustee serves until an event of termination, such as death or resignation, or until his successor is duly elected; each officer’s term of office is one year. Unless otherwise noted, the address of each person named below is 111 Fifth Avenue, New York, NY 10003.
74
Name, Age, Position with the
Fund | | Principal Occupations | | Trustee
and/or
Officer
Since | | Number of
Funds in
the Alger
Fund
Complex
which are
Overseen
by Trustee |
INTERESTED TRUSTEE | | | | | | |
| | | | | | |
Hilary M. Alger (50) | | Director of Development, Pennsylvania Ballet since 2004; Associate Director of Development, College of Arts and Sciences and Graduate School, University of Virginia 1999-2003. | | 2003 | | 25 |
| | | | | | |
NON-INTERESTED TRUSTEE | | | | | | |
| | | | | | |
Charles F. Baird, Jr. (58) | | Managing Partner of North Castle Partners, a private equity securities group; Chairman of Leiner Health Products, Enzymatic Therapy and Caleel & Hayden (skincare business); former Chairman of Elizabeth Arden Day Spas, Naked Juice, Equinox (fitness company) and EAS (manufacturer of nutritional products). Formerly Managing Director of AEA Investors, Inc. | | 2000 | | 25 |
| | | | | | |
Roger P. Cheever (66) | | Associate Vice President for Principal Gifts, and Senior Associate Dean for Development in the Faculty of Arts and Sciences at Harvard University; Formerly Deputy Director of the Harvard College Fund. | | 2000 | | 25 |
| | | | | | |
Lester L. Colbert Jr. (77) | | Private investor since 1988; Formerly Chairman of the Board, President and Chief Executive Officer of Xidex Corporation (manufacturer of computer information media). | | 2000 | | 25 |
| | | | | | |
Stephen E. O’Neil (79) | | Attorney. Private Investor since 1981. Formerly of Counsel to the law firm of Kohler & Barnes. | | 1986 | | 25 |
| | | | | | |
David Rosenberg (49) | | Associate Professor of Law since January 2006 (Assistant Professor 2000-2005), Zicklin School of Business, Baruch College, City University of New York. | | 2007 | | 25 |
| | | | | | |
Nathan E. Saint-Amand M.D. (74) | | Medical doctor in private practice; Member of the Board of the Manhattan Institute (non-profit policy research) since 1988; Formerly Co-Chairman, Special | | 1986 | | 25 |
75
| | Projects Committee, Memorial Sloan Kettering. | | | | |
Name, Age, Position with the
Fund | | Principal Occupations | | Trustee
and/or
Officer
Since | | Number of
Funds in
the Alger
Fund
Complex
which are
Overseen
by Trustee |
OFFICERS | | | | | | |
| | | | | | |
Dan C. Chung (49)
President | | Chief Investment Officer and Director since 2001, and Chief Executive Officer since 2006, of Alger Management; President and Chief Executive Officer since 2003 of Alger Associates, Inc. (“Associates”); Chairman of the Board of Directors since 2006 of Alger Inc.; President since 2003 and Director since 2003 of Analysts Resources, Inc. (“Resources”); Formerly Trustee of the Trust from 2001 to 2007. | | 2001 | | N/A |
| | | | | | |
Hal Liebes (47)
Secretary | | Executive Vice President, Chief Legal Officer, Chief Operating Officer and Secretary of Alger Management and Alger Inc.; Director since 2006 of Alger Management, Alger Inc. and Resources. | | 2005 | | N/A |
| | | | | | |
Lisa A. Moss (46)
Assistant Secretary | | Senior Vice President since 2009, and Vice President and Assistant General Counsel of Alger Management since June 2006. | | 2006 | | N/A |
| | | | | | |
Joseph P. Graham (27)
Assistant Secretary | | Employed by Alger Management since 2011. Formerly, full-time student. | | 2011 | | N/A |
| | | | | | |
Michael D. Martins (46)
Treasurer | | Senior Vice President of Alger Management; Assistant Treasurer since 2004. | | 2005 | | N/A |
| | | | | | |
Anthony S. Caputo (56)
Assistant Treasurer | | Employed by Alger Management since 1986, currently serving as Vice President. | | 2007 | | N/A |
| | | | | | |
Sergio M. Pavone (50)
Assistant Treasurer | | Employed by Alger Management since 2002, currently serving as Vice President. | | 2007 | | N/A |
| | | | | | |
Barry J. Mullen (58)
Chief Compliance Officer | | Senior Vice President and Chief Compliance officer for Alger Management since May 2006. | | 2006 | | N/A |
76
Ms. Alger is an “interested person” (as defined in the Investment Company Act) of the Fund because of her affiliations with Alger Management. No Trustee is a director of any public company except as indicated under “Principal Occupations”.
The Statement of Additional Information contains additional information about the Fund’s Trustees and is available without charge upon request by calling (800) 992-3863.
77
Investment Management Agreement Renewal
At an in-person meeting held on September 22, 2011, the Trustees, including the Independent Trustees, unanimously approved renewal of the Investment Advisory Agreement (the “Agreement”) between the Trust and Fred Alger Management, Inc. (“Alger Management”). The Independent Trustees were assisted in their review by independent legal counsel and met with such counsel in executive session separate from representatives of Alger Management.
In evaluating the Agreement, the Trustees drew on materials that they had requested and which were provided to them in advance of the meeting by Alger Management and by counsel. The materials covered, among other matters, (i) the nature, extent and quality of the services provided by Alger Management under the Agreement, (ii) the investment performance of each of the Trust’s portfolios (each a “Fund”), (iii) the costs to Alger Management of its services and the profits realized by Alger Management and Alger Inc. from their relationship with the Trust, and (iv) the extent to which economies of scale would be realized if and as the Funds grow and whether the fee levels in the Agreement reflect these economies of scale. These materials included an analysis of the Funds and Alger Management’s services by FUSE Research Network LLC (“FUSE”), an independent consulting firm selected by the Trust’s Chief Compliance Officer, having no other relationship with Alger Management, whose specialties include assistance to fund trustees and directors in their review of advisory contracts pursuant to section 15(c) of the 1940 Act. At the meeting, senior FUSE personnel provided a presentation to the Trustees based on the FUSE materials.
In deciding whether to approve renewal of the Agreement, the Trustees considered various factors, including those enumerated above. They also considered other direct and indirect benefits to Alger Management and its affiliates from their relationship with the Trust.
Nature, Extent and Quality of Services. In considering the nature, extent and quality of the services provided by Alger Management pursuant to the Agreement, the Trustees relied on their prior experience as Trustees of the Trust, their familiarity with the personnel and resources of Alger Management and its affiliates, and the materials provided at the meeting. They noted that under the Agreement Alger Management is responsible for managing the investment operations of the Funds. They also noted that administrative, compliance, reporting and accounting services necessary for the conduct of the Trust’s affairs are provided under the separate Administration Agreement with Alger Management. The Trustees reviewed the background and experience of Alger Management’s senior investment management personnel, including the individuals currently responsible for the investment operations of the Funds. They also considered the resources, operational structures and practices of Alger Management in managing each Fund’s portfolio, as
78
well as Alger Management’s overall investment management business. They noted especially Alger Management’s established expertise in managing portfolios of “growth” stocks and that, according to an analysis provided by FUSE, the characteristics of each Fund had been consistent with those of a fund that holds itself out to investors as growth-oriented. The Trustees concluded that Alger Management’s experience, resources and strength in the areas of importance to the Funds are considerable. The Trustees considered the level and depth of Alger Management’s ability to execute portfolio transactions to effect investment decisions, including those through Alger Inc. The Trustees also considered the enhanced control and compliance environment at Alger Management and within the Trust.
Investment Performance of the Funds. Drawing upon information provided at the meeting by Alger Management as well as FUSE and upon reports provided to the Trustees by Alger Management throughout the preceding year, the Trustees reviewed each Fund’s returns for the year-to-date (at 6/30/11), second-quarter, and 1-, 3-, 5-, and 10-year periods to the extent available (and its year-by-year returns), together with supplemental data through 8/31/11, and compared them with benchmark and peer-group data for the same periods. They noted that the performance of the Funds for the year to date through 6/30/11 had been good for the most part, with each of four Funds surpassing or matching the median for its FUSE peer group and the Mid Cap Fund performing close to its peer median; three Funds surpassed, matched or performed close to their benchmarks, while only the Large Cap and Mid Cap Funds failed to do so. Relative performance for the longer 1-, 3- and 5-year periods fell below peer medians and benchmarks, except that the Small Cap and Capital Appreciation Funds surpassed, matched or came close to their peer medians and benchmarks for the 3- and 5-year periods ending 6/30/11. Representatives of Alger Management discussed with the Trustees measures that the firm was in the process of instituting to improve the performance of the Funds that had consistently fallen short of their peers and benchmarks.
Fund Fees and Expense Ratios; Profitability to Alger Management and its Affiliates. The Trustees considered the profitability of the Investment Advisory Agreement to Alger Management and its affiliates, and the methodology used by Alger Management in determining such profitability. The Trustees reviewed previously-provided data on each Fund’s profitability to Alger Management and its affiliates for the year ended June 30, 2011. In addition, the Trustees reviewed each Fund’s management fee and expense ratio and compared them with a group of comparable funds. In order to assist the Trustees in this comparison, FUSE had provided the Trustees with comparative information with respect to fees paid, and expense ratios incurred, by similar funds. That information indicated that while the fees of two of the Funds were below the median for their comparison groups, the fees of the Capital Appreciation and Mid Cap Funds were above the applicable median. The expense ratios of the Large Cap Fund were above the median. In the
79
case of the Mid Cap, Small Cap and Capital Appreciation Funds, the expense ratios of their Class I Shares were below the applicable medians while those of the Class R Shares were above the medians. The Trustees determined that such information should be taken into account in weighing the size of the fee against the nature, extent and quality of the services provided. The Trustees also considered fees paid to Alger Management by other types of clients, specifically mutual funds for which Alger Management was sub-adviser and separately managed accounts. The Trustees determined that in both cases the fees were of doubtful relevance for purposes of comparison with those of the Funds because of the significant differences in services provided by Alger Management to those types of clients as opposed to the Funds, but that to the extent that meaningful comparison was practicable, the differences in services adequately explained the differences in the fees. After discussing with representatives of the Adviser and FUSE the methodologies used in computing the costs that formed the bases of the profitability calculations, the Trustees turned to the profitability data provided. After analysis and discussion, they concluded that, to the extent that Alger Management’s and its affiliates’ relationships with the Funds had been profitable to either or both of those entities, the profit margin in each case was not unacceptable.
Economies of Scale. On the basis of their discussions with management and their analysis of information provided at the meeting, the Trustees determined that the nature of the Funds and their operations is such that Alger Management is likely to realize economies of scale in the management of the Funds at some point as each grows in size, but that adoption of breakpoints in one or more advisory fees, while possibly appropriate at a later date, could await further analysis of the sources and potential scale of the economies and the fee structure that would best reflect them. Accordingly, the Trustees requested that Alger Management address this topic with the Trustees at future meetings.
Other Benefits to Alger Management. The Trustees considered whether Alger Management benefits in other ways from its relationship with the Trust. They noted that Alger Management maintains soft-dollar arrangements in connection with the Funds’ brokerage transactions, reports on which are regularly supplied to the Trustees at their quarterly meetings and summaries of which, listing commissions by Fund for the twelve months through June 30, 2011, had been included in the materials supplied prior to the meeting. The Trustees also noted that Alger Inc. provides a substantial portion of the Funds’ equity brokerage and receives shareholder servicing fees from the Funds as well. The Trustees had been provided with information regarding, and had considered, the brokerage and shareholder servicing fee benefits in connection with their review of the profitability to Alger Management and its affiliates of their relationships with the Funds. As to other benefits received, the Trustees decided that none were so significant as to render Alger Management’s fees excessive.
80
Conclusions and Determinations. At the conclusion of these discussions, each of the Independent Trustees expressed the opinion that he had been furnished with sufficient information to make an informed business decision with respect to renewal of the Investment Advisory Agreement. Based on its discussions and considerations as described above, the Board made the following conclusions and determinations:
· The Board concluded that the nature, extent and quality of the services provided to each Fund by Alger Management are adequate and appropriate.
· The Board determined that the Funds’ overall performance was acceptable.
· The Board concluded that each advisory fee paid to Alger Management was reasonable in light of comparative performance and expense and advisory fee information, costs of the services provided and profits to be realized and benefits derived or to be derived by Alger Management from the relationship with the Fund.
The Board determined that there were not at this time significant economies of scale to be realized by Alger Management in managing the Funds’ assets but that, to the extent that material economies of scale should be realized in the future, the Board would seek to ensure that they were shared with the applicable Fund.
The Board considered these conclusions and determinations and, without any one factor being dispositive, determined with respect to each Fund that renewal of the Investment Advisory Agreement was in the best interests of the Fund and its shareholders.
Tax Information
In accordance with subchapter M of the Internal Revenue Code of 1986, as amended, for the year ended October 31, 2011, 100% of the Alger Large Cap Institutional Growth Fund and Alger Mid Cap Growth Institutional Fund’s ordinary dividend qualified for the dividends received deduction for corporations. For the year ended October 31, 2011, certain dividends paid by the Funds may be subject to a maximum rate of 15%, as provided by the Jobs and Growth Tax Relief Reconciliation Act of 2003. Of the distributions paid during the fiscal year, 100% of the Alger Large Cap Institutional Growth Fund and Alger Mid Cap Growth Institutional Fund’s may be considered qualified dividend income.
Shareholders should not use the above information to prepare their tax returns. Since the Fund’s fiscal year is not the calendar year, another notification will be sent with respect to calendar year 2011. Such notification, which will reflect the amount
81
to be used by tax payers on their federal income tax returns, will be made in conjunction with Form 1099 DIV and will be mailed in January 2012. Shareholders are advised to consult their own tax advisers with respect to the tax consequences of their investment in the Fund.
82
Privacy Policy
U.S. Consumer Privacy Notice Rev. 01/2011 | 3/31/11 |
FACTS | | WHAT DOES ALGER DO WITH YOUR PERSONAL INFORMATION? |
| | |
Why? | | Financial companies choose how they share your personal information, which, under Federal law, means personally identifiable information. Federal law gives consumers the right to limit some but not all sharing. Federal law also requires us to tell you how we collect, share, and protect your personal information. Please read this notice carefully to understand what we do. |
| | |
What? | | The types of personal information we collect and share depend on the product or service you have with us. This information can include: · Social Security number · account balances, transaction history and credit information |
| | |
How? | | All financial companies need to share customers’ personal information to run their everyday business. In the section below, we list the reasons financial companies can share their customers’ personal information; the reasons Alger chooses to share; and whether you can limit this sharing. |
Reasons we can share your personal
information | | Does
Alger share? | | Can you limit
this sharing? |
| | | | |
For our everyday business purposes — such as to process your transactions, maintain your account(s), respond to court orders and legal investigations, or report to credit bureaus | | Yes | | No |
| | | | |
For our marketing purposes — with service providers we use to offer our products and services to you | | Yes | | No |
| | | | |
For joint marketing with other financial companies | | No | | We don’t share |
| | | | |
For our affiliates’ everyday business purposes—information about your transactions and experiences | | Yes | | No |
| | | | |
For our affiliates’ everyday business purposes—information about your creditworthiness | | No | | We don’t share |
| | | | |
For nonaffiliates to market to you — for all credit card accounts | | No | | We don’t share |
| | | | |
For nonaffiliates to market to you — for accounts and services endorsed by another organization | | No | | We don’t share |
| | | | |
For nonaffiliates to market to you — for accounts other than credit card accounts and Sponsored Accounts, such as insurance, investments, deposit and lending | | No | | We don’t share |
83
Who we are | | |
| | |
Who is providing this notice? | | Alger includes Fred Alger Management, Inc. and Fred Alger & Company, Incorporated as well as the following funds: The Alger Funds, The Alger Funds II, The Alger Institutional Funds, The Alger Portfolios, and Alger China-U.S. Growth Fund. |
| | |
What we do | | |
| | |
How does Alger protect my personal information? | | To protect your personal information from unauthorized access and use, we use security measures that comply with federal law. These measures include computer safeguards and secured files and buildings. For more information visit alger.com. |
| | |
How does Alger collect my personal information? | | We collect your personal information, for example, when you: · open an account or perform transactions · seek advice about your investments We also collect your personal information from others, such as credit bureaus, affiliates, or other companies. |
| | |
Why can’t I limit all sharing? | | Federal law gives you the right to limit some but not all sharing related to: · sharing for affiliates’ everyday business purposes — information about your creditworthiness · affiliates from using your information to market to you · sharing for nonaffiliates to market to you State laws and individual companies may give you additional rights to limit sharing. |
| | |
Definitions | | |
| | |
Affiliates | | Companies related by common ownership or control. They can be financial and nonfinancial companies. · Our affiliates include Fred Alger Management, Inc. and Fred Alger & Company, Incorporated as well as the following funds: The Alger Funds, The Alger Funds II, The Alger Institutional Funds, The Alger Portfolios, and Alger China-U.S. Growth Fund. |
| | |
Nonaffiliates | | Companies not related by common ownership or control. They can be financial and nonfinancial companies |
| | |
Joint marketing | | A formal agreement between nonaffiliated financial companies that together market financial products or services to you. |
84
Proxy Voting Policies
A description of the policies and procedures the Trust uses to determine how to vote proxies relating to portfolio securities and information regarding how the Funds voted proxies relating to portfolio securities during the most recent 12-month period ended June 30 are available, without charge, by calling (800) 992-3863 or online on the Funds’ website at www.alger.com or on the SEC’s website at www.sec.gov.
Fund Holdings
The Funds’ most recent month end portfolio holdings are available approximately sixty days after month end on the Funds’ website at www.alger.com. The Funds also file their complete schedule of portfolio holdings with the SEC for the first and third quarter of each fiscal year on Form N-Q. The Funds’ Forms N-Q are available online on the SEC’s website at www.sec.gov or may be reviewed and copied at the SEC’s Public Reference Room in Washington, D.C. Information regarding the operation of the SEC’s Public Reference Room may be obtained by calling 1-800-SEC-0330. A copy of the most recent quarterly holdings may also be obtained from the Funds by calling (800) 992-3863.
85
THE ALGER INSTITUTIONAL FUNDS
360 Park Avenue South
New York, NY 10010
(800) 992-3863
www.alger.com
Investment Manager
Fred Alger Management, Inc.
360 Park Avenue South
New York, NY 10010
Distributor
Fred Alger & Company, Incorporated
360 Park Avenue South
New York, NY 10010
Transfer Agent and Dividend Disbursing Agent
Boston Financial Data Services, Inc.
P.O. Box 8480
Boston, MA 02266
This report is submitted for the general information of the shareholders of The Alger Institutional Funds. It is not authorized for distribution to prospective investors unless accompanied by an effective Prospectus for the Trust, which contains information concerning the Trust’s investment policies, fees and expenses as well as other pertinent information.
(This page has been intentionally left blank.)
(This page has been intentionally left blank.)
(This page has been intentionally left blank.)
(This page has been intentionally left blank.)

AIFAR
ITEM 2. CODE OF ETHICS.
(a) The Registrant has adopted a code of ethics (the “Code of Ethics”) that applies to its principal executive officer, principal financial officer, principal accounting officer or controller, or persons performing similar functions.
(b) Not applicable.
(c) The Registrant has amended its Code of Ethics during the period covered by the shareholder report presented in Item 1 hereto with respect to the reporting requirements for violations of the code of ethics.
(d) The Registrant has not granted a waiver or an implicit waiver from a provision of its Code of Ethics during the period covered by the shareholder report presented in Item 1 hereto.
(e) Not applicable.
(f) The Registrant’s Code of Ethics is attached as an Exhibit hereto.
ITEM 3. AUDIT COMMITTEE FINANCIAL EXPERT.
The Board of Trustees of the Registrant determined that Stephen E. O’Neil is an audit committee financial expert (within the meaning of that phrase specified in the instructions to Form N-CSR) on the Registrant’s audit committee. Mr. O’Neil is an “independent” trustee — i.e., he is not an interested person of the Registrant as defined in the Investment Company Act of 1940, nor has he accepted directly or indirectly any consulting, advisory or other compensatory fee from the Registrant, other than in his capacity as Trustee.
ITEM 4. PRINCIPAL ACCOUNTANT FEES AND SERVICES.
a) Audit Fees:
October 31, 2011 | | $ | 106,750 | |
October 31, 2010 | | $ | 103,000 | |
b) Audit-Related Fees: NONE
c) Tax Fees for tax advice, tax compliance and tax planning:
October 31, 2011 | | $ | 17,958 | |
October 31, 2010 | | $ | 22,874 | |
d) All Other Fees:
October 31, 2011 | | $ | 9,200 | |
October 31, 2010 | | $ | 6,000 | |
Other fees include a review and consent for Registrants registration statement filing and a review of the semi-annual financial statements.
e) 1) Audit Committee Pre-Approval Policies And Procedures:
Audit and non-audit services provided by the Registrant’s independent registered public accounting firm (the “Auditors”) on behalf the Registrant must be pre-approved by the Audit Committee. Non-audit services provided by the Auditors on behalf of the Registrant’s Investment Adviser or any entity controlling, controlled by, or under common control with the Investment Adviser must be pre-approved by the Audit Committee if such non-audit services directly relate to the operations or financial reporting of the Registrant.
2) All fees in item 4(b) through 4(d) above were approved by the Registrants’ Audit Committee.
f) Not Applicable
g) Non-Audit Fees:
October 31, 2011 | | $183,344 and €70,575 | |
October 31, 2010 | | $189,420 and €73,916 | |
h) The audit committee of the board of trustees has considered whether the provision of the non-audit services that were rendered to the registrant’s investment adviser and any entity controlling, controlled by, or under common control, with the adviser that provides ongoing services to the registrant that were not approved pursuant to (c)(7)(ii) of Rule 2-01 of Regulation S-X is compatible with maintaining the principle accountant’s independence.
ITEM 5. AUDIT COMMITTEE OF LISTED REGISTRANTS.
Not applicable
ITEM 6. INVESTMENTS.
Not applicable
ITEM 7. DISCLOSURE OF PROXY VOTING POLICIES AND PROCEDURES FOR CLOSED-END MANAGEMENT INVESTMENT COMPANIES.
Not applicable
ITEM 8. PORTFOLIO MANAGERS OF CLOSED-END MANAGEMENT INVESTMENT COMPANIES.
Not applicable
ITEM 9. PURCHASES OF EQUITY SECURITIES BY CLOSED-END MANAGEMENT INVESTMENT COMPANY AND AFFILIATED PURCHASERS.
Not applicable
ITEM 10. SUBMISSION OF MATTERS TO A VOTE OF SECURITY HOLDERS.
None
ITEM 11. CONTROLS AND PROCEDURES.
(a) The Registrant’s principal executive officer and principal financial officer have concluded that the Registrant’s disclosure controls and procedures (as defined in Rule 30a-3(c) under the Investment Company Act of 1940, as amended) are effective based on their evaluation of the disclosure controls and procedures as of a date within 90 days of the filing date of this document.
(b) No changes in the Registrant’s internal control over financial reporting occurred during the Registrant’s second fiscal half-year that materially affected, or are reasonably likely to materially affect, the Registrant’s internal control over financial
reporting.
ITEM 12. EXHIBITS.
(a) (1) Code of Ethics as Exhibit 99.CODE ETH
(a) (2) Certifications of principal executive officer and principal financial officer as required by rule 30a-2(a) under the Investment Company Act of 1940 are attached as Exhibit 99.CERT
(b) Certifications of principal executive officer and principal financial officer as required by rule 30a-2(b) under the Investment Company Act of 1940 are attached as Exhibit 99.906CERT
SIGNATURES
Pursuant to the requirements of the Securities Exchange Act of 1934 and the Investment Company Act of 1940, the registrant has duly caused this report to be signed on its behalf by the undersigned, thereunto duly authorized.
The Alger Institutional Funds
By: | /s/Daniel C. Chung | | |
| | | |
| Daniel C. Chung | | |
| | | |
| President | | |
Pursuant to the requirements of the Securities Exchange Act of 1934 and the Investment Company Act of 1940, this report has been signed below by the following persons on behalf of the registrant and in the capacities and on the dates indicated.
By: | /s/Daniel C. Chung | | |
| | | |
| Daniel C. Chung | | |
| | | |
| President | | |
| | | |
Date: December 14, 2011 | | |
| | | |
By: | /s/Michael D. Martins | | |
| | | |
| Michael D. Martins | | |
| | | |
| Treasurer | | |
| | | |
Date: December 14, 2011 | | |