UNITED STATES
SECURITIES AND EXCHANGE COMMISSION
Washington, D.C. 20549
FORM N-CSR
CERTIFIED SHAREHOLDER REPORT OF REGISTERED
MANAGEMENT INVESTMENT COMPANIES
Investment Company Act file number | 811-7994 |
|
Western Asset Global Partners Income Fund Inc. |
(Exact name of registrant as specified in charter) |
|
620 Eighth Avenue, New York, NY | | 10018 |
(Address of principal executive offices) | | (Zip code) |
|
Robert I. Frenkel, Esq. Legg Mason & Co., LLC 100 First Stamford Place Stamford, CT 06902 |
(Name and address of agent for service) |
|
Registrant’s telephone number, including area code: | (888) 777-0102 | |
|
Date of fiscal year end: | August 31 | |
|
Date of reporting period: | August 31, 2011 | |
| | | | | | | | |
ITEM 1. REPORT TO STOCKHOLDERS.
The Annual Report to Stockholders is filed herewith.
August 31, 2011 | 
|
Annual Report
Western Asset Global Partners Income Fund Inc.
(GDF)
INVESTMENT PRODUCTS: NOT FDIC INSURED · NO BANK GUARANTEE · MAY LOSE VALUE |
II | | Western Asset Global Partners Income Fund Inc. | | | |
Fund objectives
The Fund seeks to maintain a high level of current income. Capital appreciation is a secondary objective.
What’s inside
Letter from the chairman | | II |
| | |
Investment commentary | | III |
| | |
Fund overview | | 1 |
| | |
Fund at a glance | | 8 |
| | |
Spread duration | | 9 |
| | |
Effective duration | | 10 |
| | |
Schedule of investments | | 11 |
| | |
Statement of assets and liabilities | | 35 |
| | |
Statement of operations | | 36 |
| | |
Statements of changes in net assets | | 37 |
| | |
Statement of cash flows | | 38 |
| | |
Financial highlights | | 39 |
| | |
Notes to financial statements | | 40 |
| | |
Report of independent registered public accounting firm | | 58 |
| | |
Additional information | | 59 |
| | |
Annual chief executive officer and chief financial officer certifications | | 65 |
| | |
Other shareholder communications regarding accounting matters | | 66 |
| | |
Dividend reinvestment and cash purchase plan | | 67 |
| | |
Important tax information | | 71 |
Letter from the chairman | 
|
Dear Shareholder,
We are pleased to provide the annual report of Western Asset Global Partners Income Fund Inc. for the twelve-month reporting period ended August 31, 2011. Please read on for a detailed look at prevailing economic and market conditions during the Fund’s reporting period and to learn how those conditions have affected Fund performance.
As always, we remain committed to providing you with excellent service and a full spectrum of investment choices. We also remain committed to supplementing the support you receive from your financial advisor. One way we accomplish this is through our website, www.leggmason.com/cef. Here you can gain immediate access to market and investment information, including:
· Fund prices and performance,
· Market insights and commentaries from our portfolio managers, and
· A host of educational resources.
We look forward to helping you meet your financial goals.
Sincerely,

R. Jay Gerken, CFA
Chairman, President and Chief Executive Officer
September 30, 2011
| | | Western Asset Global Partners Income Fund Inc. | | III |
Investment commentary
Economic review
Although the U.S. economy continued to grow over the twelve months ended August 31, 2011, the pace of the expansion was disappointing, which resulted in a significant shift in investor sentiment. Looking back, beginning in the fourth quarter of 2010, fears regarding moderating economic growth were replaced with optimism for a strengthening economy in 2011. However, as the reporting period progressed, weakening economic data, concerns related to the raising of the U.S. debt ceiling and the downgrading of U.S. government securities resulted in increased investor risk aversion. However, overall, investors who took on additional risk in their portfolios during the reporting period were generally rewarded.
U.S. gross domestic product (“GDP”)i growth, as reported by the U.S. Department of Commerce, has been less robust than during most other periods exiting a severe recession. Revised GDP growth was 2.3% during the fourth quarter of 2010 and 3.0% for calendar 2010 as a whole. The Commerce Department then reported that first and second quarter 2011 GDP growth were 0.4% and 1.3%, respectively. This moderation in growth during the first half of the calendar year was due to a variety of factors, including less robust export activity and a deceleration in consumer spending given higher oil and food prices.
Turning to the job market, while there was some improvement in early 2011, unemployment again moved higher from April through June. After being 9.0% or higher since April 2009, the unemployment rate fell to 8.9% in February and 8.8% in March 2011. The job market then weakened, as unemployment rose to 9.0% in April, 9.1% in May and 9.2% in June. The news was slightly better in July, with the unemployment rate easing back to 9.1%. While the rate held steady in August, the U.S. Department of Labor reported that there was zero net job growth during the month, the worst monthly result since September 2010. Additionally, as of the end of the reporting period, approximately fourteen million Americans looking for work had yet to find a job, and nearly 43% of these individuals have been out of work for more than six months.
The housing market continued to experience challenges during the reporting period. While existing-home sales moved somewhat higher toward the end of 2010 and in January 2011, according to the National Association of Realtors (“NAR”), existing-home sales declined a sharp 8.9% in February. After a 3.5% increase in March, existing-home sales fell 1.8% and 4.0% in April and May, respectively. Following a modest 0.6% increase in June, sales then fell 3.5% in July and moved 7.7% higher in August. At the end of August, the inventory of unsold homes was an 8.5 month supply at the current sales level, versus a 9.5 month supply in July. Existing-home prices were weak versus a year ago, with the NAR reporting that the median existing-home price for all housing types was $168,300 in August 2011, down 5.1% from August 2010.
Even the manufacturing sector, one of the stalwarts of the economy in recent years, softened toward the end of the reporting period. Based on the Institute for Supply Management’s PMIii, the manufacturing sector grew twenty-five consecutive months since it began expanding in August 2009 (a reading below 50 indicates a contraction, whereas a reading above 50 indicates an expansion). In January 2011, the manufacturing sector expanded at its
IV | | Western Asset Global Partners Income Fund Inc. | | | |
Investment commentary (cont’d)
fastest pace since May 2004, with a reading of 60.8 versus 58.5 for the previous month. Manufacturing activity remained strong during the next three months and was 60.4 in April. However, May’s reading fell to 53.5, partially attributed to supply disruptions triggered by the March earthquake and tsunami in Japan. Manufacturing activity then moved modestly higher in June to 55.3, before falling to 50.9 in July and 50.6 in August — the latter being the worst reading in two years. In addition, only ten of the eighteen industries tracked by the Institute for Supply Management expanded in August.
Outside of the U.S., economic news was largely dominated by the sovereign debt crisis in Europe, geopolitical events in the Middle East and Northern Africa (“MENA”), and the tragic events in Japan. Political turmoil in the MENA region caused oil prices to rise above $100 a barrel in February 2011, the first such occurrence in roughly two years. This led to concerns that higher oil prices could temper economic growth in both developed and emerging market countries. The tragedy in Japan also impacted the global economy and Japan fell back into recession in the first quarter of 2011. Elsewhere, growth forecasts for many international developed countries were revised lower as the reporting period progressed. In contrast, growth forecasts for many emerging market countries, such as China and India, remained strong.
Financial market overview
While stocks and lower-quality bonds generated strong results during the reporting period, there were several periods of heightened volatility and periodic sell-offs. These were triggered by a variety of factors, including concerns regarding the global economy, geopolitical unrest, the natural disasters in Japan and the ongoing European sovereign debt crisis. During those periods, investors tended to favor the relative safety of U.S. Treasury securities. However, in most cases these setbacks were only temporary and risk aversion was generally replaced with solid demand for riskier assets. One key exception was in July and August 2011, when concerns as to whether Congress would come to an agreement regarding the raising of the debt ceiling and Standard & Poor’s (“S&P”) downgrade of U.S. Treasuries from AAA to AA+ negatively impacted investor sentiment.
The Federal Reserve Board (“Fed”)iii took a number of actions as it sought to meet its dual mandate of fostering maximum employment and price stability. In November 2010, the Fed announced a second round of quantitative easing (often referred to as “QE2”) to help stimulate the economy, entailing the purchase of $600 billion of long-term U.S. Treasury securities by the end of the second quarter of 2011.
In June, the Fed announced that QE2 would end on schedule at the end of the month. However, given ongoing strains in the economy, it made no overtures toward reversing any of its accommodative policies, and stated it would “maintain its existing policy of reinvesting principal payments from its securities holdings” rather than seeking to reduce the size of its balance sheet.
Also, as has been the case since December 2008, the Fed kept the federal funds rateiv at a historically low range between zero and 0.25%. In addition, in August 2011, the Fed declared its intention to keep the federal funds rate between zero and 0.25% until mid-2013.
At its meeting in September 2011, after the end of the reporting period, the Fed announced its intention to purchase
| | | Western Asset Global Partners Income Fund Inc. | | V |
$400 billion of longer-term Treasury securities and to sell an equal amount of shorter-term Treasury securities by June 2012. The Fed said, “This program should put downward pressure on longer-term interest rates and help make broader financial conditions more accommodative.”
Given the economic challenges in the Eurozone, the European Central Bank (“ECB”) had not raised interest rates since July 2008. However, in April 2011, the ECB raised interest rates from 1.00% to 1.25%, and then to 1.50% in July. In other developed countries, the Bank of England kept rates on hold at 0.50% during the reporting period, as did Japan at a range of zero to 0.10%, the lowest level since 2006. Elsewhere, a number of emerging market countries, including China, India and Brazil, raised interest rates during the reporting period in an effort to ward off inflation.
Fixed-income market review
The spread sectors (non-Treasuries) began the reporting period on a positive note, as they rallied in September and October. Following a brief setback in the middle of November, triggered by the European sovereign debt crisis, most spread sectors then rallied through the end of April 2011. While the spread sectors generally posted positive results in May, they underperformed equal-durationv Treasuries. Risk aversion then increased from June through August given a host of disappointing economic data, a further escalation of the European sovereign debt crisis and the S&P rating downgrade of U.S. sovereign debt.
Both short- and long-term Treasury yields fluctuated but, overall, moved lower during the twelve months ended August 31, 2011. When the period began, two- and ten-year Treasury yields were 0.47% and 2.47%, respectively. In the beginning of the reporting period, yields initially moved higher given expectations for stronger growth in 2011 and the potential for rising inflation, with two- and ten-year Treasury yields peaking at 0.87% and 3.75%, respectively, in February 2011. Yields then declined during much of the remainder of the period due to disappointing economic data and several flights to quality. Two-year Treasuries hit their low for the reporting period of 0.19% on several occasions in August 2011. Ten-year Treasuries reached their reporting period trough of 2.07% on August 19, 2011. When the period ended on August 31, 2011, two-year Treasury yields were 0.20% and ten-year Treasury yields were 2.23%. For the twelve months ended August 31, 2011, the Barclays Capital U.S. Aggregate Indexvi returned 4.62%. In comparison, the Barclays Capital Global Aggregate Index (Hedged)vii returned 1.95% over the same time frame.
Despite a sharp decline in August 2011, the U.S. high-yield bond market produced solid results during the reporting period. The asset class posted a positive return during each month except for November 2010, June 2011 and August 2011, when risk aversion rose sharply. The high-yield market was supported by generally better-than-expected corporate profits and overall strong investor demand. All told, the Barclays Capital U.S. High Yield — 2% Issuer Cap Indexviii returned 8.32% for the twelve months ended August 31, 2011.
Despite periods of volatility, the emerging market debt asset class generated a strong return for the twelve-month reporting period. In general, emerging market debt was supported by higher commodity prices, robust growth in developing countries and solid
VI | | Western Asset Global Partners Income Fund Inc. | | | |
Investment commentary (cont’d)
demand. These factors more than offset periods of weakness triggered by concerns regarding interest rate hikes in China, geopolitical unrest and decelerating growth in many developed countries. Overall, the JPMorgan Emerging Markets Bond Index Global (“EMBI Global”)ix returned 7.49% over the twelve months ended August 31, 2011.
As always, thank you for your confidence in our stewardship of your assets.
Sincerely,
R. Jay Gerken, CFA
Chairman, President and Chief Executive Officer
September 30, 2011
All investments are subject to risk including the possible loss of principal. Past performance is no guarantee of future results. All index performance reflects no deduction for fees, expenses or taxes. Please note that an investor cannot invest directly in an index.
i | Gross domestic product (“GDP”) is the market value of all final goods and services produced within a country in a given period of time. |
ii | The Institute for Supply Management’s PMI is based on a survey of purchasing executives who buy the raw materials for manufacturing at more than 350 companies. It offers an early reading on the health of the manufacturing sector. |
iii | The Federal Reserve Board (“Fed”) is responsible for the formulation of policies designed to promote economic growth, full employment, stable prices and a sustainable pattern of international trade and payments. |
iv | The federal funds rate is the rate charged by one depository institution on an overnight sale of immediately available funds (balances at the Federal Reserve) to another depository institution; the rate may vary from depository institution to depository institution and from day to day. |
v | Duration is the measure of the price sensitivity of a fixed-income security to an interest rate change of 100 basis points. Calculation is based on the weighted average of the present values for all cash flows. |
vi | The Barclays Capital U.S. Aggregate Index is a broad-based bond index comprised of government, corporate, mortgage- and asset-backed issues, rated investment grade or higher, and having at least one year to maturity. |
vii | The Barclays Capital Global Aggregate Index (Hedged) is an index comprised of several other Barclays Capital indices that measure fixed-income performance of regions around the world. |
viii | The Barclays Capital U.S. High Yield — 2% Issuer Cap Index is an index of the 2% Issuer Cap component of the Barclays Capital U.S. Corporate High Yield Index, which covers the U.S. dollar-denominated, non-investment grade, fixed-rate, taxable corporate bond market. |
ix | The JPMorgan Emerging Markets Bond Index Global (“EMBI Global”) tracks total returns for U.S. dollar-denominated debt instruments issued by emerging market sovereign and quasi-sovereign entities: Brady bonds, loans, Eurobonds and local market instruments. |
| | Western Asset Global Partners Income Fund Inc. 2011 Annual Report | | 1 |
Fund overview
Q. What is the Fund’s investment strategy?
A. The Fund seeks to maintain a high level of current income. As a secondary objective, the Fund seeks capital appreciation. Under normal market conditions, the Fund will invest at least 33% of its total assets in securities of issuers that are, or are incorporated in or generate the majority of their revenue in, emerging market countries and at least 33% of its total assets in high-yield U.S. corporate debt securities. The Fund is also able to invest up to 33% of its total assets in a broad range of other U.S. and non-U.S. fixed-income securities, both investment grade and high-yield securities, including, but not limited to, corporate bonds, loans, mortgage- and asset-backed securities, preferred stocks and sovereign debt, derivative instruments of the foregoing securities and dollar rolls.
The Fund’s investment process assimilates top-down macroeconomic views with bottom-up credit analysts’ fundamental and relative value views regarding industry and issuer opportunities. As a firm, Western Asset Management Company (“Western Asset”), the Fund’s subadviser, aims to add value by exploiting inefficiencies in the fixed-income markets. A fundamental approach is used to identify these inefficiencies. The Fund diversifies its holdings across a range of securities, industries and maturity dates in an attempt to minimize the risk of any individual holding. We use various tools, both external and proprietary, to help identify, measure and manage portfolio risk. In particular, we look for companies that we believe have the ability to weather adverse economic conditions while providing moderate to high returns to bondholders, companies that are repositioning in the marketplace and that we believe are temporarily undervalued, and companies that demonstrate an ability to improve their financial condition where that improvement and positive trajectory have not yet been fully appreciated by rating agencies and the market. Often times, this strategy will result in a higher concentration of lower-rated securities in the portfolio versus the Barclays Capital U.S. High Yield — 2% Issuer Cap Indexi. However, no assurance can be given that markets will perform as we predict, and a risk of loss exists.
At Western Asset, we utilize a fixed-income team approach, with decisions derived from interaction among various investment management sector specialists. The sector teams are comprised of Western Asset’s senior portfolio managers, research analysts and an in-house economist. Under this team approach, management of client fixed-income portfolios will reflect a consensus of interdisciplinary views within the Western Asset organization. The portfolio managers responsible for development of investment strategy, day-to-day portfolio management, oversight and coordination of the Fund are Stephen A. Walsh, S. Kenneth Leech, Michael C. Buchanan, Keith J. Gardner and Ryan Brist.
Q. What were the overall market conditions during the Fund’s reporting period?
A. While the fixed-income market experienced periods of volatility during the twelve months ended August 31, 2011, investors who assumed greater risk were rewarded, as the spread sectors (non-Treasuries) generally outperformed U.S. Treasuries. Even though growth moderated as the reporting
2 | | Western Asset Global Partners Income Fund Inc. 2011 Annual Report | | |
Fund overview (cont’d)
period progressed, the economy continued to expand and corporate profits were often better-than-expected. Also supporting the spread sectors was overall solid demand from investors seeking incremental yields given the low rates available from short-term fixed-income securities.
While the spread sectors rallied during most of the reporting period, there were several occasions when investor risk aversion increased. These flights to quality were triggered by a number of events, including the sovereign debt crisis in Europe, concerns regarding the economy and inflation, geopolitical issues in the Middle East and Northern Africa and the tragedy in Japan. However, in most cases, risk aversion was fairly quickly replaced with a resumption of demand for riskier assets. One notable exception was toward the end of the period, as concerns regarding the raising of the U.S. debt ceiling and the subsequent Standard & Poor’s downgrade of U.S. sovereign debt caused investors to gravitate to the relative safety of U.S. Treasury securities.
The yields on two- and ten-year Treasuries began the fiscal year at 0.47% and 2.47%, respectively. Treasury yields fluctuated during the twelve-month reporting period given the aforementioned flights to quality, as well as uncertainties regarding Federal Reserve Board (“Fed”)ii monetary policy. During the fiscal year, two-year Treasury yields moved as high as 0.87% and as low as 0.19%, while ten-year Treasury yields rose as high as 3.75% and fell as low as 2.07%. On August 31, 2011, yields on two- and ten-year Treasuries were 0.20% and 2.23%, respectively.
All told, the Barclays Capital U.S. Aggregate Indexiii returned 4.62% for the twelve months ended August 31, 2011. Comparatively, riskier fixed-income securities, including high-yield bonds and emerging market debt, produced even stronger results, with the Barclays Capital U.S. High Yield — 2% Issuer Cap Index and the JPMorgan Emerging Markets Bond Index Global (“EMBI Global”)iv returning 8.32% and 7.49%, respectively, over the fiscal year.
Q. How did we respond to these changing market conditions?
A. We made a number of adjustments to the portfolio during the reporting period. We pared the Fund’s high-yield exposure as our holdings had performed well and had become less attractively valued. Conversely, we added to the Fund’s emerging market debt exposure. In particular, we increased the Fund’s exposure to local currencies in Peru, Mexico and Malaysia, as well as to Poland’s sovereign debt.
We actively participated in the new issue market by selectively purchasing high-yield corporate bonds and emerging market debt from a variety of sectors. The use of leverage was tactically managed during the reporting period. We reduced the Fund’s leverage when we felt that markets were approaching full value, and brought leverage back up as the market sold off. We ended the period with leverage at roughly 25% of the gross assets of the Fund.
During the period, the Fund employed U.S. Treasury futures to manage its yield curvev positioning and durationvi. This strategy modestly detracted from performance. Short currency forwards were utilized to hedge the Fund’s currency exposure. These short currency
| | Western Asset Global Partners Income Fund Inc. 2011 Annual Report | | 3 |
forwards were a drag on results, offsetting the gains from our positions in corresponding local currency bonds. Long currency forwards were used to a small extent to take opportunistic currency exposures. In aggregate, the use of long currency forwards was a slight detractor from performance. We utilized options on credit default swaps to manage the Fund’s high-yield exposure. The use of these instruments was beneficial for performance as they acted as a hedge when the high-yield market declined toward the end of the reporting period. We also utilized Brazil local interest rate swaps to gain additional exposure to the Brazilian local markets. This strategy did not meaningfully impact performance.
Performance review
For the twelve months ended August 31, 2011, Western Asset Global Partners Income Fund Inc. returned 9.64% based on its net asset value (“NAV”)vii and 6.58% based on its New York Stock Exchange (“NYSE”) market price per share. The Fund’s unmanaged benchmarks, the Barclays Capital U.S. High Yield — 2% Issuer Cap Index and the EMBI Global, returned 8.32% and 7.49%, respectively, for the same period. The Lipper Global Income Closed-End Funds Category Averageviii returned 10.45% over the same time frame. Please note that Lipper performance returns are based on each fund’s NAV.
During the twelve-month period, the Fund made distributions to shareholders totaling $1.14 per share. The performance table shows the Fund’s twelve-month total return based on its NAV and market price as of August 31, 2011. Past performance is no guarantee of future results.
Performance Snapshot as of August 31, 2011
Price Per Share | | 12-Month
Total Return* | |
$11.59 (NAV) | | 9.64%† | |
$12.19 (Market Price) | | 6.58%‡ | |
All figures represent past performance and are not a guarantee of future results.
* Total returns are based on changes in NAV or market price, respectively.
† Total return assumes the reinvestment of all distributions at NAV.
‡ Total return assumes the reinvestment of all distributions in additional shares in accordance with the Fund’s Dividend Reinvestment Plan.
Q. What were the leading contributors to performance?
A. Our asset allocation strategy was the largest contributor to absolute performance during the reporting period. Favoring high-yield bonds during much of the first eight months of the period was rewarded, as the asset class performed well and generally outperformed emerging market debt over that time. We later reduced the Fund’s high-yield exposure and increased its emerging market debt allocation. This was beneficial given the significant outperformance of emerging market debt over the last four months of the fiscal year.
Within our high-yield allocation, individual issuer selection was the most significant contributor to relative performance. In particular, our overweight exposures to Charter Communications Inc. and Energy Future Holdings Corp. enhanced the Fund’s results. Charter Communications, an operator of cable television systems in the U.S., offers a full range of traditional and digital
4 | | Western Asset Global Partners Income Fund Inc. 2011 Annual Report | | |
Fund overview (cont’d)
cable television services. We felt the market was not valuing Charter Communications’ business appropriately given our expectations for strong growth in its small and medium enterprise and retail data businesses. Additionally, we felt the company was well positioned to benefit from any future improvements in household re-formation in the U.S., which would, in turn, benefit its bonds. Our holding in Charter Communications was rewarded, as the company posted solid fundamental results and improving free cash flow during the period. Energy Future Holdings benefited primarily from strong balance sheet management, as well as general economic improvement. The company was able to extend the maturity of more than $15 billion of its debt, originally due from 2014 to 2017. The market responded very favorably to the company’s ability to secure extended financing through 2017.
The portfolio’s quality biases within the high-yield market also contributed to performance during the period. Relative to the Barclays Capital U.S. High Yield — 2% Issuer Cap Index, the portfolio’s overweight to lower-rated CCC-rated securities and underweight to higher-rated BB-rated securities were rewarded given the outperformance of lower-rated securities during the fiscal year as a whole. Finally, from a high-yield sector selection perspective, our slight underweight to Capital Goods1 was a positive for performance.
The Fund’s focus on select emerging market sovereign debt issuers also had a positive impact on relative performance. In particular, our overweight exposure to Argentina’s sovereign debt was beneficial. Argentina’s existing outstanding debt rallied when Argentina announced the details of a debt swap to settle claims associated with its 2001 default. The Fund’s overweight exposure to Venezuela was also rewarded. Venezuela, aided by higher oil prices, outperformed the overall EMBI Global. Furthermore, Venezuela’s sovereign debt was boosted by strong investor demand as it offered very attractive yields in a low-yield environment.
Our overweight exposure to local currencies was also additive to performance. In particular, the Fund’s overweight positions in Brazil and Mexico enhanced results as these countries outperformed the EMBI Global. Also benefiting the Fund was our underweights to the Philippines, Croatia and the Ivory Coast, all of which lagged the EMBI Global.
Our exposures to several emerging market companies also contributed to performance. In particular, overweight positions in Thailand-based Wireless Telecommunication Services firm True Move Co., Ltd. and Mexican Telecommunication Services company Axtel SAB de CV were rewarded. Both companies posted stable results over the fiscal year which, in conjunction with favorable debt maturity schedules, adequate overall liquidity levels, and relatively high yields versus much of the rest of the emerging market universe, led to strong total returns. Demand for these bonds was also generally strong given the low interest rate environment that characterized much of the reporting period.
1 Capital Goods consists of the following industries: Aerospace & Defense, Building Materials, Diversified Manufacturing, Construction Machines, Packaging and Environmental.
| | Western Asset Global Partners Income Fund Inc. 2011 Annual Report | | 5 |
Q. What were the leading detractors from performance?
A. Within high yield, the largest detractor from the Fund’s relative performance was its overweight to Transportation, which was the worst performing sector in the Barclays Capital U.S. High Yield — 2% Issuer Cap Index during the reporting period given concerns that moderating global growth would temper demand and higher energy prices would lead to smaller margin growth.
Although overall issue selection within the high-yield universe contributed to performance, several individual high-yield holdings negatively impacted performance. In particular, overweight positions in KCAD Holdings I Ltd. and CMA CGM were among the worst performing securities in the portfolio. KCAD Holdings, also known as Turbo Beta and KCA Deutag, is a global onshore and offshore oil drilling company that operates in nearly 100 countries. Even though the spread sectors were rallying, the company’s bonds declined in value at the beginning of the period. Investors were concerned about the amount of debt on its balance sheet, incurred in a 2008 leveraged buyout. The new private equity owners proved overly optimistic and have been unsuccessful at growing the business into their new capital structure. As a result, bondholders entered into discussions with management and the company agreed to restructure the balance sheet. CMA CGM, based in France, is the world’s third largest container shipping company. The firm performed poorly due to a variety of factors, including signs that global economic growth was decelerating, higher oil prices and fears related to the escalating European sovereign debt crisis. In addition, there was an overhang regarding allegations that the company engaged in illegal shipping practices from various foreign ports to Sudan.
In terms of the Fund’s emerging market exposure, the largest detractor from relative performance was our overweight exposure to Indian corporate bonds, as these holdings underperformed the EMBI Global. Our lack of exposure to smaller, higher risk countries such as Lithuania, Georgia and Uruguay also negatively impacted results. These countries saw their valuations rebound during the reporting period.
From an individual issuer perspective, an overweight to Sino-Forest Corp. was among the most significant detractors from relative performance. Sino-Forest is a Chinese tree plantation owner whose business is registered in Canada. The company came under severe pressure as the company was accused of fraud — specifically, inflating its revenue and exaggerating the value of its timberlands. In late August 2011, the Ontario Securities Commission ordered five of the company’s executives to resign their positions, including Chairman and CEO Allen Chan.
Looking for additional information?
The Fund is traded under the symbol “GDF” and its closing market price is available in most newspapers under the NYSE listings. The daily NAV is available on-line under the symbol “XGDFX” on most financial websites. Barron’s and the Wall Street Journal’s Monday edition both carry closed-end fund tables that provide additional information. In addition, the Fund issues a quarterly press release that can be found on most major financial websites as well as www.leggmason.com/cef.
6 | | Western Asset Global Partners Income Fund Inc. 2011 Annual Report | | |
Fund overview (cont’d)
In a continuing effort to provide information concerning the Fund, shareholders may call 1-888-777-0102 (toll free), Monday through Friday from 8:00 a.m. to 5:30 p.m. Eastern Time, for the Fund’s current NAV, market price and other information.
Thank you for your investment in Western Asset Global Partners Income Fund Inc. As always, we appreciate that you have chosen us to manage your assets and we remain focused on achieving the Fund’s investment goals.
Sincerely,
Western Asset Management Company
September 20, 2011
RISKS: As interest rates rise, bond prices fall, reducing the value of the Fund’s fixed-income holdings. The Fund may invest in high-yield and foreign securities, including emerging markets, which involve risks beyond those inherent in higher-rated and domestic investments. High-yield bonds involve greater credit and liquidity risks than investment grade bonds. Investing in foreign securities is subject to certain risks not associated with domestic investing, such as currency fluctuations, and changes in political and economic conditions. These risks are magnified in emerging or developing markets. Derivatives, such as options and futures, can be illiquid and harder to value, especially in declining markets. A small investment in certain derivatives may have a potentially large impact on the Fund’s performance.
Portfolio holdings and breakdowns are as of August 31, 2011 and are subject to change and may not be representative of the portfolio managers’ current or future investments. Please refer to pages 11 through 34 for a list and percentage breakdown of the Fund’s holdings.
The mention of sector breakdowns is for informational purposes only and should not be construed as a recommendation to purchase or sell any securities. The information provided regarding such sectors is not a sufficient basis upon which to make an investment decision. Investors seeking financial advice regarding the appropriateness of investing in any securities or investment strategies discussed should consult their financial professional. The Fund’s top five sector holdings (as a percentage of total investments) as of August 31, 2011 were: Sovereign Bonds (28.8%), Consumer Discretionary (14.1%), Energy (12.7%), Materials (9.3%) and Industrials (9.1%). The Fund’s portfolio composition is subject to change at any time.
All investments are subject to risk including the possible loss of principal. Past performance is no guarantee of future results. All index performance reflects no deduction for fees, expenses or taxes. Please note that an investor cannot invest directly in an index.
The information provided is not intended to be a forecast of future events, a guarantee of future results or investment advice. Views expressed may differ from those of the firm as a whole.
| | Western Asset Global Partners Income Fund Inc. 2011 Annual Report | | 7 |
i | The Barclays Capital U.S. High Yield — 2% Issuer Cap Index is an index of the 2% Issuer Cap component of the Barclays Capital U.S. Corporate High Yield Index, which covers the U.S. dollar-denominated, non-investment grade, fixed-rate, taxable corporate bond market. |
ii | The Federal Reserve Board (“Fed”) is responsible for the formulation of policies designed to promote economic growth, full employment, stable prices and a sustainable pattern of international trade and payments. |
iii | The Barclays Capital U.S. Aggregate Index is a broad-based bond index comprised of government, corporate, mortgage- and asset-backed issues, rated investment grade or higher, and having at least one year to maturity. |
iv | The JPMorgan Emerging Markets Bond Index Global (“EMBI Global”) tracks total returns for U.S. dollar-denominated debt instruments issued by emerging market sovereign and quasi-sovereign entities: Brady bonds, loans, Eurobonds and local market instruments. |
v | The yield curve is the graphical depiction of the relationship between the yield on bonds of the same credit quality but different maturities. |
vi | Duration is the measure of the price sensitivity of a fixed-income security to an interest rate change of 100 basis points. Calculation is based on the weighted average of the present values for all cash flows. |
vii | Net asset value (“NAV”) is calculated by subtracting total liabilities and outstanding preferred stock (if any) from the closing value of all securities held by the Fund (plus all other assets) and dividing the result (total investments) by the total number of the common shares outstanding. The NAV fluctuates with changes in the market prices of securities in which the Fund has invested. However, the price at which an investor may buy or sell shares of the Fund is the Fund’s market price as determined by supply of and demand for the Fund’s shares. |
viii | Lipper, Inc., a wholly-owned subsidiary of Reuters, provides independent insight on global collective investments. Returns are based on the twelve-month period ended August 31, 2011, including the reinvestment of all distributions, including returns of capital, if any, calculated among the 14 funds in the Fund’s Lipper category. |
8 | | Western Asset Global Partners Income Fund Inc. 2011 Annual Report | | |
Fund at a glance† (unaudited)
Investment breakdown (%) as a percent of total investments
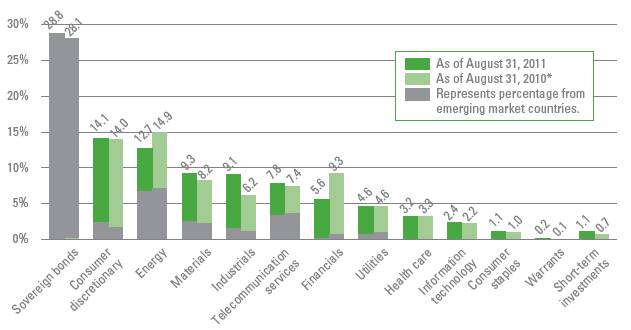
† The bar graph above represents the composition of the Fund’s investments as of August 31, 2011 and August 31, 2010 and does not include derivatives, such as futures contracts, swap contracts, written options and forward foreign currency contracts. The Fund is actively managed. As a result, the composition of the Fund’s investments is subject to change at any time.
* Prior year percentage have been restated to reflect current period classifications
| | Western Asset Global Partners Income Fund Inc. 2011 Annual Report | | 9 |
Spread duration (unaudited)
Economic Exposure — August 31, 2011
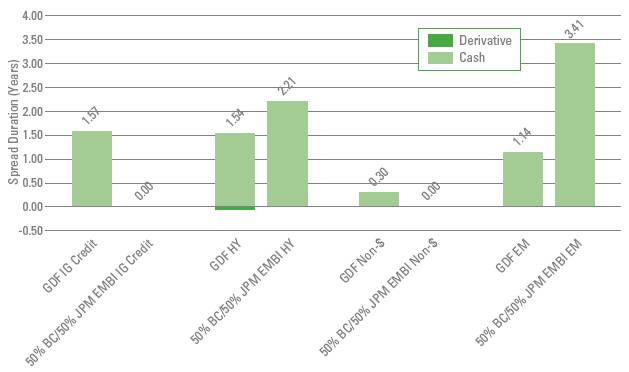
Spread duration measures the sensitivity to changes in spreads. The spread over Treasuries is the annual risk-premium demanded by investors to hold non-Treasury securities. Spread duration is quantified as the % change in price resulting from a 100 basis points change in spreads. For a security with positive spread duration, an increase in spreads would result in a price decline and a decline in spreads would result in a price increase. This chart highlights the market sector exposure of the Fund’s sectors relative to the selected benchmark sectors as of the end of the reporting period.
| |
EM | — | Emerging Markets |
GDF | — | Western Asset Global Partners Income Fund Inc. |
HY | — | High Yield |
IG Credit | — | Investment Grade Credit |
Non-$ | — | Non-U.S. Dollar |
50% BC/50% JPM EMBI | — | 50% Barclays Capital U.S. HY (2% constrained), 50% JPMorgan Emerging Markets Bond Index Global |
10 | | Western Asset Global Partners Income Fund Inc. 2011 Annual Report | | |
Effective duration (unaudited)
Interest Rate Exposure — August 31, 2011
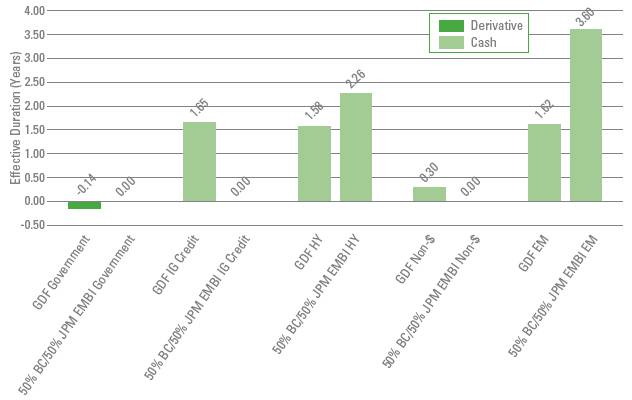
Effective duration measures the sensitivity to changes in relevant interest rates. Effective duration is quantified as the % change in price resulting from a 100 basis points change in interest rates. For a security with positive effective duration, an increase in interest rates would result in a price decline and a decline in interest rates would result in a price increase. This chart highlights the interest rate exposure of the Fund’s sectors relative to the selected benchmark sectors as of the end of the reporting period.
| |
EM | — | Emerging Markets |
GDF | — | Western Asset Global Partners Income Fund Inc. |
HY | — | High Yield |
IG Credit | — | Investment Grade Credit |
Non-$ | — | Non-U.S. Dollar |
50% BC/50% JPM EMBI | — | 50% Barclays Capital U.S. HY (2% constrained), 50% JPMorgan Emerging Markets Bond Index Global |
| | Western Asset Global Partners Income Fund Inc. 2011 Annual Report | | 11 |
Schedule of investments
August 31, 2011
Western Asset Global Partners Income Fund Inc.
Security | | Rate | | Maturity
Date | | Face
Amount† | | Value | |
Corporate Bonds & Notes — 64.2% | | | | | | | | | |
Consumer Discretionary — 11.7% | | | | | | | | | |
Auto Components — 0.3% | | | | | | | | | |
Europcar Groupe SA, Senior Notes | | 9.375 | % | 4/15/18 | | 500,000 | EUR | $ | 592,557 | (a)(b) |
Automobiles — 0.0% | | | | | | | | | |
Escrow GCB General Motors | | 7.200 | % | 1/15/11 | | 480,000 | | 6,000 | (c)(d)(e) |
Escrow GCB General Motors | | 8.375 | % | 7/15/33 | | 1,105,000 | | 13,812 | (c)(e) |
Total Automobiles | | | | | | | | 19,812 | |
Diversified Consumer Services — 0.7% | | | | | | | | | |
Odeon & UCI Finco PLC, Senior Secured Notes | | 9.000 | % | 8/1/18 | | 410,000 | GBP | 612,309 | (a) |
Service Corp. International, Senior Notes | | 7.500 | % | 4/1/27 | | 310,000 | | 291,400 | |
Sotheby’s, Senior Notes | | 7.750 | % | 6/15/15 | | 520,000 | | 553,800 | (b) |
Stonemor Operating LLC/Cornerstone Family Services of WV/Osiris Holding, Senior Notes | | 10.250 | % | 12/1/17 | | 95,000 | | 92,150 | (b) |
Total Diversified Consumer Services | | | | | | | | 1,549,659 | |
Hotels, Restaurants & Leisure — 3.6% | | | | | | | | | |
Boyd Gaming Corp., Senior Subordinated Notes | | 7.125 | % | 2/1/16 | | 100,000 | | 84,000 | (b) |
Caesars Entertainment Operating Co. Inc., Senior Notes | | 10.750 | % | 2/1/16 | | 1,414,000 | | 1,212,505 | (b) |
Caesars Entertainment Operating Co. Inc., Senior Secured Notes | | 10.000 | % | 12/15/15 | | 20,000 | | 18,850 | |
CityCenter Holdings LLC/CityCenter Finance Corp., Senior Secured Notes | | 10.750 | % | 1/15/17 | | 538,347 | | 511,430 | (a)(b)(f) |
Downstream Development Quapaw, Senior Secured Notes | | 10.500 | % | 7/1/19 | | 300,000 | | 289,500 | (a) |
El Pollo Loco Inc., Secured Notes | | 17.000 | % | 1/1/18 | | 660,000 | | 640,200 | (a) |
Enterprise Inns PLC, Senior Secured Bonds | | 6.500 | % | 12/6/18 | | 494,000 | GBP | 616,022 | |
Fiesta Restaurant Group, Secured Notes | | 8.875 | % | 8/15/16 | | 160,000 | | 159,600 | (a) |
Hoa Restaurant Group LLC/Hoa Finance Corp., Senior Secured Notes | | 11.250 | % | 4/1/17 | | 260,000 | | 252,200 | (a) |
Inn of the Mountain Gods Resort & Casino, Senior Secured Notes | | 8.750 | % | 11/30/20 | | 305,000 | | 300,425 | (a) |
Landry’s Holdings Inc., Senior Secured Notes | | 11.500 | % | 6/1/14 | | 280,000 | | 276,500 | (a) |
Landry’s Restaurants Inc., Senior Secured Notes | | 11.625 | % | 12/1/15 | | 320,000 | | 338,400 | (a)(b) |
Landry’s Restaurants Inc., Senior Secured Notes | | 11.625 | % | 12/1/15 | | 50,000 | | 52,875 | (a)(b) |
MGM Resorts International, Senior Notes | | 5.875 | % | 2/27/14 | | 360,000 | | 345,600 | |
MGM Resorts International, Senior Notes | | 6.625 | % | 7/15/15 | | 70,000 | | 63,350 | |
MGM Resorts International, Senior Secured Notes | | 10.375 | % | 5/15/14 | | 40,000 | | 44,100 | (b) |
MGM Resorts International, Senior Secured Notes | | 11.125 | % | 11/15/17 | | 95,000 | | 106,400 | (b) |
| | | | | | | | | | |
See Notes to Financial Statements.
12 | | Western Asset Global Partners Income Fund Inc. 2011 Annual Report | | |
Schedule of investments (cont’d)
August 31, 2011
Western Asset Global Partners Income Fund Inc.
Security | | Rate | | Maturity
Date | | Face
Amount† | | Value | |
Hotels, Restaurants & Leisure — continued | | | | | | | | | |
Mohegan Tribal Gaming Authority, Senior Subordinated Notes | | 8.000 | % | 4/1/12 | | 1,030,000 | | $ | 751,900 | (b) |
Mohegan Tribal Gaming Authority, Senior Subordinated Notes | | 6.875 | % | 2/15/15 | | 55,000 | | 30,112 | |
NCL Corp. Ltd., Senior Notes | | 9.500 | % | 11/15/18 | | 560,000 | | 582,400 | (a)(b) |
NCL Corp. Ltd., Senior Secured Notes | | 11.750 | % | 11/15/16 | | 480,000 | | 540,000 | (b) |
Pinnacle Entertainment Inc., Senior Notes | | 8.625 | % | 8/1/17 | | 250,000 | | 261,875 | (b) |
Seven Seas Cruises S de RL LLC, Senior Secured Notes | | 9.125 | % | 5/15/19 | | 340,000 | | 338,300 | (a) |
Snoqualmie Entertainment Authority, Senior Secured Notes | | 4.179 | % | 2/1/14 | | 290,000 | | 258,100 | (a)(g) |
Snoqualmie Entertainment Authority, Senior Secured Notes | | 9.125 | % | 2/1/15 | | 10,000 | | 9,725 | (a) |
Station Casinos Inc., Senior Notes | | 6.000 | % | 4/1/12 | | 735,000 | | 73 | (c)(e) |
Station Casinos Inc., Senior Notes | | 7.750 | % | 8/15/16 | | 185,000 | | 19 | (c)(e) |
Station Casinos Inc., Senior Subordinated Notes | | 6.500 | % | 2/1/14 | | 475,000 | | 47 | (c)(e) |
Station Casinos Inc., Senior Subordinated Notes | | 6.625 | % | 3/15/18 | | 50,000 | | 5 | (c)(e) |
Sugarhouse HSP Gaming Prop Mezz LP/ Sugarhouse HSP Gaming Finance Corp., Secured Notes | | 8.625 | % | 4/15/16 | | 313,000 | | 313,000 | (a)(b) |
Total Hotels, Restaurants & Leisure | | | | | | | | 8,397,513 | |
Household Durables — 0.3% | | | | | | | | | |
DFS Furniture Holdings PLC, Senior Secured Notes | | 9.750 | % | 7/15/17 | | 206,000 | GBP | 290,928 | (a)(b) |
DFS Furniture Holdings PLC, Senior Secured Notes | | 9.750 | % | 7/15/17 | | 130,000 | GBP | 183,595 | (a) |
Standard Pacific Corp., Senior Notes | | 8.375 | % | 1/15/21 | | 260,000 | | 224,900 | |
Total Household Durables | | | | | | | | 699,423 | |
Internet & Catalog Retail — 0.4% | | | | | | | | | |
Netflix Inc., Senior Notes | | 8.500 | % | 11/15/17 | | 360,000 | | 397,800 | (b) |
QVC Inc., Senior Secured Notes | | 7.375 | % | 10/15/20 | | 535,000 | | 577,800 | (a)(b) |
Total Internet & Catalog Retail | | | | | | | | 975,600 | |
Media — 3.8% | | | | | | | | | |
CCH II LLC/CCH II Capital Corp., Senior Notes | | 13.500 | % | 11/30/16 | | 27,381 | | 31,762 | (b) |
Cengage Learning Acquisitions Inc., Senior Notes | | 10.500 | % | 1/15/15 | | 1,090,000 | | 844,750 | (a) |
Cengage Learning Acquisitions Inc., Senior Subordinated Notes | | 13.250 | % | 7/15/15 | | 270,000 | | 198,450 | (a)(b) |
Charter Communications Inc., Senior Notes | | 6.500 | % | 4/30/21 | | 320,000 | | 314,400 | |
CSC Holdings LLC, Senior Notes | | 8.500 | % | 6/15/15 | | 210,000 | | 225,750 | (b) |
DISH DBS Corp., Senior Notes | | 6.625 | % | 10/1/14 | | 30,000 | | 31,050 | (b) |
DISH DBS Corp., Senior Notes | | 7.875 | % | 9/1/19 | | 285,000 | | 304,237 | (b) |
| | | | | | | | | | |
See Notes to Financial Statements.
| | Western Asset Global Partners Income Fund Inc. 2011 Annual Report | | 13 |
Western Asset Global Partners Income Fund Inc.
Security | | Rate | | Maturity
Date | | Face
Amount† | | Value | |
Media — continued | | | | | | | | | |
Globo Communicacoes e Participacoes SA, Bonds | | 7.250 | % | 4/26/22 | | 100,000 | | $ | 105,500 | (a) |
Good Sam Enterprises LLC, Secured Notes | | 11.500 | % | 12/1/16 | | 340,000 | | 334,900 | |
Grupo Televisa SA, Senior Bonds | | 6.625 | % | 1/15/40 | | 570,000 | | 614,296 | (b) |
LBI Media Inc., Senior Secured Notes | | 9.250 | % | 4/15/19 | | 320,000 | | 290,000 | (a) |
Musketeer GmbH, Senior Secured Notes | | 9.500 | % | 3/15/21 | | 300,000 | EUR | 432,028 | (a) |
Nara Cable Funding Ltd., Senior Secured Notes | | 8.875 | % | 12/1/18 | | 500,000 | EUR | 630,265 | (a) |
NET Servicos de Comunicacao SA, Bonds | | 7.500 | % | 1/27/20 | | 610,000 | | 712,175 | (h) |
Nielsen Finance LLC/Nielsen Finance Co., Senior Notes | | 11.500 | % | 5/1/16 | | 20,000 | | 22,850 | |
Nielsen Finance LLC/Nielsen Finance Co., Senior Notes | | 7.750 | % | 10/15/18 | | 270,000 | | 280,125 | |
Ono Finance II PLC, Senior Bonds | | 11.125 | % | 7/15/19 | | 400,000 | EUR | 501,339 | (a) |
Polish Television Holding BV, Senior Secured Bonds, step bond | | 11.250 | % | 5/15/17 | | 300,000 | EUR | 433,105 | (a)(i) |
TVN Finance Corp. III AB, Senior Notes | | 7.875 | % | 11/15/18 | | 100,000 | EUR | 137,186 | (a) |
Univision Communications Inc., Senior Notes | | 8.500 | % | 5/15/21 | | 190,000 | | 163,400 | (a) |
Univision Communications Inc., Senior Secured Notes | | 6.875 | % | 5/15/19 | | 370,000 | | 344,100 | (a) |
Univision Communications Inc., Senior Secured Notes | | 7.875 | % | 11/1/20 | | 370,000 | | 357,050 | (a) |
UPC Holding BV, Senior Notes | | 9.875 | % | 4/15/18 | | 180,000 | | 189,000 | (a)(b) |
UPCB Finance III Ltd., Senior Secured Notes | | 6.625 | % | 7/1/20 | | 550,000 | | 544,500 | (a) |
Ziggo Bond Co. BV, Senior Notes | | 8.000 | % | 5/15/18 | | 650,000 | EUR | 917,385 | (a)(b) |
Total Media | | | | | | | | 8,959,603 | |
Multiline Retail — 0.2% | | | | | | | | | |
Neiman Marcus Group Inc., Senior Secured Notes | | 7.125 | % | 6/1/28 | | 570,000 | | 515,850 | (b) |
Specialty Retail — 1.5% | | | | | | | | | |
American Greetings Corp., Senior Notes | | 7.375 | % | 6/1/16 | | 790,000 | | 811,725 | (b) |
American Greetings Corp., Senior Notes | | 7.375 | % | 6/1/16 | | 75,000 | | 74,062 | (b) |
American Greetings Corp., Senior Notes | | 7.375 | % | 6/1/16 | | 50,000 | | 49,375 | |
Edcon Proprietary Ltd., Senior Secured Notes | | 9.500 | % | 3/1/18 | | 825,000 | EUR | 933,277 | (a) |
Gymboree Corp., Senior Notes | | 9.125 | % | 12/1/18 | | 520,000 | | 452,400 | |
Michaels Stores Inc., Senior Subordinated Bonds | | 11.375 | % | 11/1/16 | | 350,000 | | 364,875 | (b) |
Michaels Stores Inc., Senior Subordinated Notes, step bond | | 0.000 | % | 11/1/16 | | 650,000 | | 666,250 | (b) |
Spencer Spirit Holdings Inc./Spencer Gifts LLC/Spirit Halloween Superstores, Senior Notes | | 11.000 | % | 5/1/17 | | 210,000 | | 207,375 | (a) |
Total Specialty Retail | | | | | | | | 3,559,339 | |
| | | | | | | | | | |
See Notes to Financial Statements.
14 | | Western Asset Global Partners Income Fund Inc. 2011 Annual Report | | |
Schedule of investments (cont’d)
August 31, 2011
Western Asset Global Partners Income Fund Inc.
Security | | Rate | | Maturity
Date | | Face
Amount† | | Value | |
Textiles, Apparel & Luxury Goods — 0.9% | | | | | | | | | |
Boardriders SA, Senior Notes | | 8.875 | % | 12/15/17 | | 700,000 | EUR | $ | 1,000,523 | (a) |
Burlington Coat Factory Warehouse Corp., Senior Notes | | 10.000 | % | 2/15/19 | | 220,000 | | 206,250 | (a) |
Empire Today LLC/Empire Today Finance Corp., Senior Secured Notes | | 11.375 | % | 2/1/17 | | 150,000 | | 141,000 | (a) |
Oxford Industries Inc., Senior Secured Notes | | 11.375 | % | 7/15/15 | | 725,000 | | 808,375 | (b) |
Total Textiles, Apparel & Luxury Goods | | | | | | | | 2,156,148 | |
Total Consumer Discretionary | | | | | | | | 27,425,504 | |
Consumer Staples — 1.1% | | | | | | | | | |
Food Products — 0.9% | | | | | | | | | |
Blue Merger Sub Inc., Senior Notes | | 7.625 | % | 2/15/19 | | 510,000 | | 508,725 | (a)(b) |
Boparan Holdings Ltd., Senior Notes | | 9.875 | % | 4/30/18 | | 400,000 | GBP | 514,586 | (a) |
Bumble Bee Acquisiton Co., Senior Secured Notes | | 9.000 | % | 12/15/17 | | 200,000 | | 195,000 | (a) |
Harmony Foods Corp., Senior Secured Notes | | 10.000 | % | 5/1/16 | | 140,000 | | 139,650 | (a)(b) |
Simmons Foods Inc., Senior Secured Notes | | 10.500 | % | 11/1/17 | | 630,000 | | 578,025 | (a)(b) |
Smithfield Foods Inc., Senior Secured Notes | | 10.000 | % | 7/15/14 | | 61,000 | | 69,235 | (b) |
Total Food Products | | | | | | | | 2,005,221 | |
Household Products — 0.0% | | | | | | | | | |
Reynolds Group DL Escrow Inc./Reynolds Group Escrow LLC, Senior Secured Notes | | 8.750 | % | 10/15/16 | | 100,000 | | 102,750 | (a)(b) |
Personal Products — 0.1% | | | | | | | | | |
Hypermarcas SA, Notes | | 6.500 | % | 4/20/21 | | 260,000 | | 253,760 | (a) |
Tobacco — 0.1% | | | | | | | | | |
Alliance One International Inc., Senior Notes | | 10.000 | % | 7/15/16 | | 150,000 | | 136,313 | (b) |
Total Consumer Staples | | | | | | | | 2,498,044 | |
Energy — 12.4% | | | | | | | | | |
Energy Equipment & Services — 1.0% | | | | | | | | | |
Complete Production Services Inc., Senior Notes | | 8.000 | % | 12/15/16 | | 425,000 | | 431,375 | (b) |
Hercules Offshore LLC, Senior Secured Notes | | 10.500 | % | 10/15/17 | | 495,000 | | 490,050 | (a)(b) |
Parker Drilling Co., Senior Notes | | 9.125 | % | 4/1/18 | | 400,000 | | 418,000 | (b) |
Precision Drilling Corp., Senior Notes | | 6.625 | % | 11/15/20 | | 90,000 | | 91,350 | |
Vantage Drilling Co., Senior Secured Notes | | 11.500 | % | 8/1/15 | | 810,000 | | 866,700 | (b) |
Total Energy Equipment & Services | | | | | | | | 2,297,475 | |
Oil, Gas & Consumable Fuels — 11.4% | | | | | | | | | |
Berry Petroleum Co., Senior Notes | | 10.250 | % | 6/1/14 | | 320,000 | | 360,000 | (b) |
Calumet Specialty Products Partners LP/Calumet Finance Corp., Senior Notes | | 9.375 | % | 5/1/19 | | 240,000 | | 232,800 | (a) |
Chesapeake Energy Corp., Senior Notes | | 7.250 | % | 12/15/18 | | 25,000 | | 27,000 | (b) |
Compagnie Generale de Geophysique-Veritas, Senior Notes | | 7.750 | % | 5/15/17 | | 420,000 | | 424,200 | (b) |
| | | | | | | | | | |
See Notes to Financial Statements.
| | Western Asset Global Partners Income Fund Inc. 2011 Annual Report | | 15 |
Western Asset Global Partners Income Fund Inc.
Security | | Rate | | Maturity
Date | | Face
Amount† | | Value | |
Oil, Gas & Consumable Fuels — continued | | | | | | | | | |
CONSOL Energy Inc., Senior Notes | | 8.250 | % | 4/1/20 | | 480,000 | | $ | 518,400 | (b) |
Corral Petroleum Holdings AB, Senior Bonds | | 15.000 | % | 9/18/11 | | 704,856 | | 676,662 | (a)(e)(f)(i) |
Crosstex Energy LP/Crosstex Energy Finance Corp., Senior Notes | | 8.875 | % | 2/15/18 | | 250,000 | | 260,000 | (b) |
Denbury Resources Inc., Senior Subordinated Notes | | 8.250 | % | 2/15/20 | | 100,000 | | 105,875 | (b) |
Dolphin Energy Ltd., Senior Secured Bonds | | 5.888 | % | 6/15/19 | | 627,356 | | 690,341 | (a)(b) |
Ecopetrol SA, Senior Notes | | 7.625 | % | 7/23/19 | | 1,000,000 | | 1,222,500 | (b) |
Energy Transfer Equity LP, Senior Notes | | 7.500 | % | 10/15/20 | | 370,000 | | 381,100 | (b) |
Enterprise Products Operating LLP, Junior Subordinated Notes | | 8.375 | % | 8/1/66 | | 250,000 | | 261,824 | (b)(g) |
Enterprise Products Operating LLP, Subordinated Notes | | 7.034 | % | 1/15/68 | | 260,000 | | 262,933 | (b)(g) |
EXCO Resources Inc., Senior Notes | | 7.500 | % | 9/15/18 | | 690,000 | | 650,325 | (b) |
KazMunaiGaz Finance Sub BV, Senior Notes | | 8.375 | % | 7/2/13 | | 1,340,000 | | 1,447,200 | (a)(b) |
MarkWest Energy Partners LP/MarkWest Energy Finance Corp., Senior Notes | | 8.750 | % | 4/15/18 | | 330,000 | | 348,975 | (b) |
Milagro Oil & Gas Inc., Secured Notes | | 10.500 | % | 5/15/16 | | 380,000 | | 326,800 | (a) |
Novatek Finance Ltd., Notes | | 6.604 | % | 2/3/21 | | 460,000 | | 483,000 | (a)(b) |
Offshore Group Investments Ltd., Senior Secured Notes | | 11.500 | % | 8/1/15 | | 140,000 | | 149,800 | (a) |
Overseas Shipholding Group Inc., Senior Notes | | 8.125 | % | 3/30/18 | | 705,000 | | 602,775 | (b) |
Pan American Energy LLC, Senior Notes | | 7.875 | % | 5/7/21 | | 470,000 | | 488,800 | (a)(b) |
Pan American Energy LLC, Senior Notes | | 7.875 | % | 5/7/21 | | 246,000 | | 255,840 | (a) |
Peabody Energy Corp., Senior Notes | | 7.875 | % | 11/1/26 | | 330,000 | | 362,175 | (b) |
Petrobras International Finance Co., Senior Notes | | 6.875 | % | 1/20/40 | | 870,000 | | 1,001,938 | (b) |
Petrobras International Finance Co., Senior Notes | | 6.750 | % | 1/27/41 | | 390,000 | | 442,650 | |
Petroleos Mexicanos, Notes | | 8.000 | % | 5/3/19 | | 4,280,000 | | 5,420,620 | (b) |
Petroleum Co. of Trinidad & Tobago Ltd., Senior Notes | | 9.750 | % | 8/14/19 | | 390,000 | | 473,850 | (a)(b) |
Petronas Capital Ltd. | | 5.250 | % | 8/12/19 | | 1,555,000 | | 1,744,118 | (a)(h) |
Petroplus Finance Ltd., Senior Notes | | 6.750 | % | 5/1/14 | | 470,000 | | 425,350 | (a) |
Plains Exploration & Production Co., Senior Notes | | 10.000 | % | 3/1/16 | | 325,000 | | 360,750 | (b) |
Plains Exploration & Production Co., Senior Notes | | 8.625 | % | 10/15/19 | | 330,000 | | 359,700 | (b) |
PT Adaro Indonesia, Senior Notes | | 7.625 | % | 10/22/19 | | 110,000 | | 122,100 | (a) |
PT Pertamina Persero, Notes | | 5.250 | % | 5/23/21 | | 570,000 | | 595,650 | (a)(b) |
Quicksilver Resources Inc., Senior Notes | | 11.750 | % | 1/1/16 | | 790,000 | | 874,925 | (b) |
Quicksilver Resources Inc., Senior Notes | | 9.125 | % | 8/15/19 | | 60,000 | | 61,800 | (b) |
| | | | | | | | | | |
See Notes to Financial Statements.
16 | | Western Asset Global Partners Income Fund Inc. 2011 Annual Report | | |
Schedule of investments (cont’d)
August 31, 2011
Western Asset Global Partners Income Fund Inc.
Security | | Rate | | Maturity
Date | | Face
Amount† | | Value | |
Oil, Gas & Consumable Fuels — continued | | | | | | | | | |
Range Resources Corp., Senior Subordinated Notes | | 8.000 | % | 5/15/19 | | 10,000 | | $ | 10,925 | (b) |
Ras Laffan Liquefied Natural Gas Co., Ltd. III, Senior Secured Bonds | | 6.750 | % | 9/30/19 | | 570,000 | | 686,137 | (a)(b) |
Reliance Holdings USA Inc., Senior Notes | | 4.500 | % | 10/19/20 | | 530,000 | | 507,198 | (a) |
SandRidge Energy Inc., Senior Notes | | 7.500 | % | 3/15/21 | | 110,000 | | 107,388 | (a)(b) |
Saratoga Resources Inc., Senior Secured Notes | | 12.500 | % | 7/1/16 | | 300,000 | | 295,500 | (a) |
Teekay Corp., Senior Notes | | 8.500 | % | 1/15/20 | | 615,000 | | 601,162 | (b) |
TNK-BP Finance SA, Senior Notes | | 7.500 | % | 7/18/16 | | 150,000 | | 168,000 | (a)(b) |
TNK-BP Finance SA, Senior Notes | | 7.875 | % | 3/13/18 | | 1,160,000 | | 1,329,592 | (a)(b) |
Whiting Petroleum Corp., Senior Subordinated Notes | | 6.500 | % | 10/1/18 | | 230,000 | | 231,150 | |
Xinergy Ltd., Senior Secured Notes | | 9.250 | % | 5/15/19 | | 330,000 | | 311,850 | (a) |
Total Oil, Gas & Consumable Fuels | | | | | | | | 26,671,678 | |
Total Energy | | | | | | | | 28,969,153 | |
Financials — 3.9% | | | | | | | | | |
Capital Markets — 0.1% | | | | | | | | | |
Goldman Sachs Group Inc., Subordinated Notes | | 6.750 | % | 10/1/37 | | 300,000 | | 285,613 | (b) |
Commercial Banks — 0.6% | | | | | | | | | |
BAC Capital Trust VI, Capital Securities, Junior Subordinated Notes | | 5.625 | % | 3/8/35 | | 300,000 | | 238,203 | (b) |
BankAmerica Institutional Capital A, Junior Subordinated Bonds | | 8.070 | % | 12/31/26 | | 620,000 | | 620,000 | (a)(b) |
Credit Agricole SA, Subordinated Notes | | 8.375 | % | 10/13/19 | | 290,000 | | 268,250 | (a)(b)(g)(j) |
NB Capital Trust II, Junior Subordinated Notes | | 7.830 | % | 12/15/26 | | 80,000 | | 78,700 | |
Royal Bank of Scotland Group PLC, Junior Subordinated Bonds | | 7.648 | % | 9/30/31 | | 200,000 | | 151,000 | (g)(j) |
Total Commercial Banks | | | | | | | | 1,356,153 | |
Consumer Finance — 0.6% | | | | | | | | | |
Ally Financial Inc., Senior Bonds | | 0.000 | % | 12/1/12 | | 400,000 | | 369,000 | (b) |
GMAC International Finance BV, Senior Bonds | | 7.500 | % | 4/21/15 | | 410,000 | EUR | 562,462 | (b) |
SLM Corp., Medium-Term Notes | | 8.000 | % | 3/25/20 | | 220,000 | | 226,607 | (b) |
SLM Corp., Medium-Term Notes, Senior Notes | | 8.450 | % | 6/15/18 | | 210,000 | | 222,632 | (b) |
Total Consumer Finance | | | | | | | | 1,380,701 | |
Diversified Financial Services — 2.2% | | | | | | | | | |
Bankrate Inc., Senior Secured Notes | | 11.750 | % | 7/15/15 | | 290,000 | | 329,150 | |
Boats Investments (Netherlands) BV, Secured Notes | | 9.031 | % | 12/15/15 | | 627,323 | EUR | 630,805 | (f)(g) |
Capital One Capital V, Junior Subordinated Notes, Cumulative Trust Preferred Securities | | 10.250 | % | 8/15/39 | | 310,000 | | 323,748 | (b) |
| | | | | | | | | | |
See Notes to Financial Statements.
| | Western Asset Global Partners Income Fund Inc. 2011 Annual Report | | 17 |
Western Asset Global Partners Income Fund Inc.
Security | | Rate | | Maturity
Date | | Face
Amount† | | Value | |
Diversified Financial Services — continued | | | | | | | | | |
Countrywide Capital III, Junior Subordinated Notes | | 8.050 | % | 6/15/27 | | 130,000 | | $ | 130,975 | |
International Lease Finance Corp., Medium-Term Notes | | 6.375 | % | 3/25/13 | | 296,000 | | 293,780 | (b) |
International Lease Finance Corp., Medium-Term Notes, Senior Notes | | 5.625 | % | 9/20/13 | | 460,000 | | 446,200 | |
International Lease Finance Corp., Senior Notes | | 8.625 | % | 9/15/15 | | 70,000 | | 71,663 | (b) |
International Lease Finance Corp., Senior Notes | | 8.875 | % | 9/1/17 | | 980,000 | | 1,006,950 | (b) |
LBI Escrow Corp., Senior Secured Notes | | 8.000 | % | 11/1/17 | | 362,880 | EUR | 555,160 | (a)(b) |
Leucadia National Corp., Senior Notes | | 7.125 | % | 3/15/17 | | 140,000 | | 143,150 | (b) |
MBNA Capital A, Junior Subordinated Notes | | 8.278 | % | 12/1/26 | | 250,000 | | 250,938 | (b) |
Residential Capital LLC, Junior Secured Notes | | 9.625 | % | 5/15/15 | | 370,000 | | 329,762 | |
Telenet Finance III Luxembourg S.C.A., Senior Secured Notes | | 6.625 | % | 2/15/21 | | 500,000 | EUR | 664,382 | (a) |
Total Diversified Financial Services | | | | | | | | 5,176,663 | |
Insurance — 0.4% | | | | | | | | | |
American International Group Inc., Senior Notes | | 8.250 | % | 8/15/18 | | 450,000 | | 508,952 | (b) |
Dai-ichi Life Insurance Co., Ltd., Subordinated Notes | | 7.250 | % | 7/25/21 | | 150,000 | | 153,103 | (a)(g)(j) |
ING Capital Funding Trust III, Junior Subordinated Bonds | | 3.846 | % | 12/31/11 | | 100,000 | | 86,439 | (g)(j) |
MetLife Capital Trust IV, Junior Subordinated Notes | | 7.875 | % | 12/15/37 | | 250,000 | | 256,250 | (a)(b) |
Total Insurance | | | | | | | | 1,004,744 | |
Total Financials | | | | | | | | 9,203,874 | |
Health Care — 3.2% | | | | | | | | | |
Health Care Equipment & Supplies — 0.3% | | | | | | | | | |
Biomet Inc., Senior Notes | | 10.000 | % | 10/15/17 | | 20,000 | | 21,050 | (b) |
Biomet Inc., Senior Toggle Notes | | 10.375 | % | 10/15/17 | | 170,000 | | 180,200 | (b)(f) |
Ontex, Senior Notes | | 9.000 | % | 4/15/19 | | 300,000 | EUR | 337,219 | (a) |
Ontex IV SA, Senior Notes | | 9.000 | % | 4/15/19 | | 200,000 | EUR | 224,812 | (a) |
Total Health Care Equipment & Supplies | | | | | | | | 763,281 | |
Health Care Providers & Services — 2.4% | | | | | | | | | |
American Renal Holdings, Senior Notes | | 9.750 | % | 3/1/16 | | 320,000 | | 304,660 | (a)(f) |
American Renal Holdings, Senior Secured Notes | | 8.375 | % | 5/15/18 | | 300,000 | | 300,750 | |
CRC Health Corp., Senior Subordinated Notes | | 10.750 | % | 2/1/16 | | 1,080,000 | | 1,085,400 | (b) |
ExamWorks Group Inc., Senior Notes | | 9.000 | % | 7/15/19 | | 210,000 | | 198,975 | (a) |
Fresenius Medical Care U.S. Finance Inc., Senior Notes | | 6.875 | % | 7/15/17 | | 750,000 | | 785,625 | |
| | | | | | | | | | |
See Notes to Financial Statements.
18 | | Western Asset Global Partners Income Fund Inc. 2011 Annual Report | | |
Schedule of investments (cont’d)
August 31, 2011
Western Asset Global Partners Income Fund Inc.
Security | | Rate | | Maturity
Date | | Face
Amount† | | Value | |
Health Care Providers & Services — continued | | | | | | | | | |
Fresenius U.S. Finance II Inc., Senior Notes | | 9.000 | % | 7/15/15 | | 160,000 | | $ | 179,200 | (a)(b) |
HCA Inc., Senior Secured Notes | | 8.500 | % | 4/15/19 | | 380,000 | | 416,100 | (b) |
HCA Inc., Senior Secured Notes | | 6.500 | % | 2/15/20 | | 240,000 | | 243,300 | |
INC Research LLC, Senior Notes | | 11.500 | % | 7/15/19 | | 160,000 | | 148,800 | (a) |
InVentiv Health Inc., Senior Notes | | 10.000 | % | 8/15/18 | | 330,000 | | 299,475 | (a) |
Labco SAS, Senior Secured Notes | | 8.500 | % | 1/15/18 | | 230,000 | EUR | 288,270 | (a) |
Tenet Healthcare Corp., Senior Secured Notes | | 10.000 | % | 5/1/18 | | 491,000 | | 542,555 | (b) |
Universal Hospital Services Inc., Senior Secured Notes | | 8.500 | % | 6/1/15 | | 635,000 | | 633,412 | (b)(f) |
US Oncology Inc. | | 9.125 | % | 8/15/17 | | 255,000 | | 3,188 | |
Vanguard Health Holdings Co., II LLC, Senior Notes | | 8.000 | % | 2/1/18 | | 250,000 | | 239,375 | (b) |
Total Health Care Providers & Services | | | | | | | | 5,669,085 | |
Pharmaceuticals — 0.5% | | | | | | | | | |
ConvaTec Healthcare E SA, Senior Notes | | 10.875 | % | 12/15/18 | | 660,000 | EUR | 848,541 | (a)(b) |
Giant Funding Corp., Senior Secured Notes | | 8.250 | % | 2/1/18 | | 100,000 | | 100,500 | (a) |
UCB SA, Subordinated Notes | | 7.750 | % | 3/18/16 | | 150,000 | EUR | 217,037 | (g)(j) |
Total Pharmaceuticals | | | | | | | | 1,166,078 | |
Total Health Care | | | | | | | | 7,598,444 | |
Industrials — 8.5% | | | | | | | | | |
Aerospace & Defense — 1.1% | | | | | | | | | |
Ducommun Inc., Senior Notes | | 9.750 | % | 7/15/18 | | 220,000 | | 222,200 | (a)(b) |
FGI Operating Co. Inc., Senior Secured Notes | | 10.250 | % | 8/1/15 | | 477,000 | | 508,005 | (b) |
Kratos Defense & Security Solutions Inc., Senior Notes | | 10.000 | % | 6/1/17 | | 50,000 | | 51,125 | (a) |
Kratos Defense & Security Solutions Inc., Senior Secured Notes | | 10.000 | % | 6/1/17 | | 500,000 | | 516,250 | (b) |
Northrop Grumman Corp., Senior Notes | | 6.875 | % | 3/15/18 | | 190,000 | | 179,550 | (a) |
Northrop Grumman Corp., Senior Notes | | 7.125 | % | 3/15/21 | | 190,000 | | 179,550 | (a) |
Triumph Group Inc., Senior Notes | | 8.625 | % | 7/15/18 | | 360,000 | | 385,200 | (b) |
Wyle Services Corp., Senior Subordinated Notes | | 10.500 | % | 4/1/18 | | 560,000 | | 557,900 | (a)(b) |
Total Aerospace & Defense | | | | | | | | 2,599,780 | |
Airlines — 1.2% | | | | | | | | | |
American Airlines Pass-Through Trust, Secured Notes | | 7.000 | % | 1/31/18 | | 178,812 | | 153,778 | (a) |
BAA SH PLC, Senior Secured Notes | | 7.125 | % | 3/1/17 | | 400,000 | GBP | 619,781 | |
Continental Airlines Inc., Pass-Through Certificates | | 7.373 | % | 12/15/15 | | 21,939 | | 21,939 | |
Continental Airlines Inc., Pass-Through Certificates | | 9.250 | % | 5/10/17 | | 4,472 | | 4,472 | |
| | | | | | | | | | |
See Notes to Financial Statements.
| | Western Asset Global Partners Income Fund Inc. 2011 Annual Report | | 19 |
Western Asset Global Partners Income Fund Inc.
Security | | Rate | | Maturity
Date | | Face
Amount† | | Value | |
Airlines — continued | | | | | | | | | |
Continental Airlines Inc., Pass-Through Certificates, Subordinated Secured Notes | | 7.339 | % | 4/19/14 | | 79,045 | | $ | 77,069 | (b) |
Continental Airlines Inc., Senior Secured Notes | | 6.750 | % | 9/15/15 | | 260,000 | | 254,800 | (a)(b) |
DAE Aviation Holdings Inc., Senior Notes | | 11.250 | % | 8/1/15 | | 950,000 | | 976,125 | (a)(b) |
Delta Air Lines, Secured Notes | | 6.375 | % | 1/2/16 | | 190,000 | | 171,000 | |
Delta Air Lines Inc., Pass-Through Certificates, Secured Notes | | 8.021 | % | 8/10/22 | | 186,432 | | 186,432 | (b) |
Delta Air Lines Inc., Pass-Through Certificates, Subordinated Secured Notes | | 9.750 | % | 12/17/16 | | 125,235 | | 128,365 | (b) |
Delta Air Lines Inc., Senior Secured Notes | | 9.500 | % | 9/15/14 | | 166,000 | | 170,980 | (a)(b) |
United Air Lines Inc., Senior Secured Notes | | 9.875 | % | 8/1/13 | | 144,000 | | 149,040 | (a)(b) |
Total Airlines | | | | | | | | 2,913,781 | |
Building Products — 0.5% | | | | | | | | | |
Ashton Woods USA LLC/Ashton Woods Finance Co., Senior Subordinated Notes, step bond | | 0.000 | % | 6/30/15 | | 174,200 | | 125,859 | (a)(e) |
Building Materials Corp. of America, Senior Notes | | 6.750 | % | 5/1/21 | | 370,000 | | 355,200 | (a)(b) |
GTL Trade Finance Inc., Senior Notes | | 7.250 | % | 10/20/17 | | 231,000 | | 256,699 | (a) |
Rearden G Holdings EINS GmbH, Senior Notes | | 7.875 | % | 3/30/20 | | 200,000 | | 208,000 | (a) |
Shea Homes LP, Senior Secured Notes | | 8.625 | % | 5/15/19 | | 220,000 | | 186,450 | (a) |
Total Building Products | | | | | | | | 1,132,208 | |
Commercial Services & Supplies — 1.1% | | | | | | | | | |
ACCO Brands Corp., Senior Secured Notes | | 10.625 | % | 3/15/15 | | 470,000 | | 516,412 | (b) |
ALBA Group PLC & Co. KG, Senior Notes | | 8.000 | % | 5/15/18 | | 180,000 | EUR | 253,076 | (a) |
Altegrity Inc., Senior Subordinated Notes | | 10.500 | % | 11/1/15 | | 50,000 | | 48,500 | (a) |
Altegrity Inc., Senior Subordinated Notes | | 11.750 | % | 5/1/16 | | 780,000 | | 752,700 | (a)(b) |
American Reprographics Co., Senior Notes | | 10.500 | % | 12/15/16 | | 370,000 | | 345,950 | |
Geo Group Inc., Senior Notes | | 7.750 | % | 10/15/17 | | 455,000 | | 480,025 | (b) |
RSC Equipment Rental Inc./RSC Holdings III LLC, Senior Notes | | 8.250 | % | 2/1/21 | | 180,000 | | 168,750 | |
Total Commercial Services & Supplies | | | | | | | | 2,565,413 | |
Construction & Engineering — 0.5% | | | | | | | | | |
Abengoa Finance SAU, Senior Notes | | 8.875 | % | 11/1/17 | | 350,000 | | 322,875 | (a) |
Odebrecht Finance Ltd., Senior Notes | | 7.000 | % | 4/21/20 | | 550,000 | | 602,250 | (a)(b) |
Odebrecht Finance Ltd., Senior Notes | | 6.000 | % | 4/5/23 | | 220,000 | | 220,000 | (a) |
Total Construction & Engineering | | | | | | | | 1,145,125 | |
Electrical Equipment — 0.2% | | | | | | | | | |
NES Rentals Holdings Inc., Senior Secured Notes | | 12.250 | % | 4/15/15 | | 400,000 | | 370,000 | (a)(b) |
| | | | | | | | | | |
See Notes to Financial Statements.
20 | | Western Asset Global Partners Income Fund Inc. 2011 Annual Report | | |
Schedule of investments (cont’d)
August 31, 2011
Western Asset Global Partners Income Fund Inc.
Security | | Rate | | Maturity
Date | | Face
Amount† | | Value | |
Industrial Conglomerates — 0.3% | | | | | | | | | |
Leucadia National Corp., Senior Notes | | 8.125 | % | 9/15/15 | | 240,000 | | $ | 258,900 | (b) |
Sinochem Overseas Capital Co., Ltd., Senior Notes | | 4.500 | % | 11/12/20 | | 370,000 | | 369,355 | (a) |
Total Industrial Conglomerates | | | | | | | | 628,255 | |
Machinery — 0.5% | | | | | | | | | |
Dematic SA, Senior Secured Notes | | 8.750 | % | 5/1/16 | | 510,000 | | 489,600 | (a)(b) |
Lonking Holdings Ltd., Senior Notes | | 8.500 | % | 6/3/16 | | 630,000 | | 601,650 | (a) |
Total Machinery | | | | | | | | 1,091,250 | |
Marine — 0.5% | | | | | | | | | |
Horizon Lines Inc., Senior Secured Notes | | 11.000 | % | 10/15/16 | | 220,000 | | 220,000 | (i) |
Horizon Lines Inc., Senior Secured Notes | | 13.000 | % | 10/15/16 | | 290,000 | | 290,000 | (i)(f) |
Navios Maritime Acquisition Corp., Senior Secured Notes | | 8.625 | % | 11/1/17 | | 50,000 | | 41,937 | (a) |
Navios Maritime Acquisition Corp./Navios Acquisition Finance U.S. Inc., Senior Secured Notes | | 8.625 | % | 11/1/17 | | 620,000 | | 520,025 | (b) |
Navios Maritime Holdings Inc./Navios Maritime Finance II U.S. Inc., Senior Notes | | 8.125 | % | 2/15/19 | | 180,000 | | 147,600 | (a) |
Total Marine | | | | | | | | 1,219,562 | |
Road & Rail — 1.5% | �� | | | | | | | | |
Florida East Coast Holdings Corp., Senior Notes | | 10.500 | % | 8/1/17 | | 547,625 | | 526,006 | (a)(f) |
Florida East Coast Industries Inc., Senior Secured Notes | | 8.125 | % | 2/1/17 | | 480,000 | | 480,000 | (a)(b) |
Jack Cooper Holdings Corp., Senior Secured Notes | | 13.250 | % | 12/15/15 | | 546,000 | | 556,920 | (a)(b) |
Kansas City Southern de Mexico, Senior Notes | | 12.500 | % | 4/1/16 | | 740,000 | | 859,510 | (b) |
Kansas City Southern de Mexico, Senior Notes | | 8.000 | % | 2/1/18 | | 85,000 | | 91,800 | |
Kansas City Southern Railway, Senior Notes | | 13.000 | % | 12/15/13 | | 49,000 | | 56,779 | (b) |
Kansas City Southern Railway, Senior Notes | | 8.000 | % | 6/1/15 | | 85,000 | | 90,738 | (b) |
Quality Distribution LLC/QD Capital Corp., Secured Notes | | 9.875 | % | 11/1/18 | | 460,000 | | 461,725 | |
RailAmerica Inc., Senior Secured Notes | | 9.250 | % | 7/1/17 | | 362,000 | | 392,770 | (b) |
Total Road & Rail | | | | | | | | 3,516,248 | |
Trading Companies & Distributors — 0.2% | | | | | | | | | |
H&E Equipment Services Inc., Senior Notes | | 8.375 | % | 7/15/16 | | 455,000 | | 453,863 | (b) |
Transportation — 0.9% | | | | | | | | | |
CMA CGM, Senior Notes | | 8.500 | % | 4/15/17 | | 1,000,000 | | 460,000 | (a)(b) |
CMA CGM, Senior Notes | | 8.875 | % | 4/15/19 | | 700,000 | EUR | 455,012 | (a) |
Hapag-Lloyd AG, Senior Notes | | 9.750 | % | 10/15/17 | | 710,000 | | 582,200 | (a)(b) |
| | | | | | | | | | |
See Notes to Financial Statements.
| | Western Asset Global Partners Income Fund Inc. 2011 Annual Report | | 21 |
Western Asset Global Partners Income Fund Inc.
Security | | Rate | | Maturity
Date | | Face
Amount† | | Value | |
Transportation — continued | | | | | | | | | |
Syncreon Global Ireland Ltd./Syncreon Global Finance US Inc., Senior Notes | | 9.500 | % | 5/1/18 | | 770,000 | | $ | 729,575 | (a)(b) |
Total Transportation | | | | | | | | 2,226,787 | |
Total Industrials | | | | | | | | 19,862,272 | |
Information Technology — 2.3% | | | | | | | | | |
Communications Equipment — 0.3% | | | | | | | | | |
Lucent Technologies Inc., Debentures | | 6.450 | % | 3/15/29 | | 880,000 | | 761,200 | (b) |
Electronic Equipment, Instruments & Components — 0.4% | | | | | | | |
NXP BV/NXP Funding LLC, Senior Secured Notes | | 9.750 | % | 8/1/18 | | 850,000 | | 898,875 | (a)(b) |
IT Services — 1.0% | | | | | | | | | |
Ceridian Corp., Senior Notes | | 12.250 | % | 11/15/15 | | 473,925 | | 440,750 | (b)(f) |
First Data Corp., Senior Notes | | 5.625 | % | 11/1/11 | | 1,500,000 | | 1,507,500 | (b) |
iGATE Corp., Senior Notes | | 9.000 | % | 5/1/16 | | 170,000 | | 161,500 | (a) |
Sterling Merger Inc., Senior Notes | | 11.000 | % | 10/1/19 | | 70,000 | | 68,688 | (a) |
Total IT Services | | | | | | | | 2,178,438 | |
Semiconductors & Semiconductor Equipment — 0.6% | | | | | | | |
CDW LLC/CDW Finance Corp., Senior Notes | | 11.000 | % | 10/12/15 | | 180,000 | | 184,500 | (b) |
CDW LLC/CDW Finance Corp., Senior Notes | | 11.500 | % | 10/12/15 | | 140,000 | | 143,500 | (f) |
Freescale Semiconductor Inc., Senior Notes | | 10.750 | % | 8/1/20 | | 80,000 | | 84,200 | |
Freescale Semiconductor Inc., Senior Secured Notes | | 9.250 | % | 4/15/18 | | 140,000 | | 148,050 | (a)(b) |
Freescale Semiconductor Inc., Senior Subordinated Notes | | 10.125 | % | 12/15/16 | | 620,000 | | 651,000 | (b) |
STATS ChipPAC Ltd., Senior Notes | | 7.500 | % | 8/12/15 | | 244,000 | | 257,420 | (a) |
Total Semiconductors & Semiconductor Equipment | | | | | | 1,468,670 | |
Total Information Technology | | | | | | | | 5,307,183 | |
Materials — 9.1% | | | | | | | | | |
Chemicals — 1.4% | | | | | | | | | |
Braskem Finance Ltd., Senior Notes | | 7.000 | % | 5/7/20 | | 540,000 | | 581,850 | (a) |
Georgia Gulf Corp., Senior Secured Notes | | 9.000 | % | 1/15/17 | | 340,000 | | 348,500 | (a)(b) |
Ineos Finance PLC, Senior Secured Notes | | 9.000 | % | 5/15/15 | | 310,000 | | 315,425 | (a) |
Kerling PLC, Senior Secured Notes | | 10.625 | % | 1/28/17 | | 268,000 | EUR | 352,259 | (a)(b) |
LBI Escrow Corp., Senior Secured Notes | | 8.000 | % | 11/1/17 | | 371,000 | | 412,737 | (a)(b) |
Solutia Inc., Senior Notes | | 8.750 | % | 11/1/17 | | 5,000 | | 5,337 | (b) |
Solutia Inc., Senior Notes | | 7.875 | % | 3/15/20 | | 310,000 | | 331,700 | (b) |
Styrolution GmbH, Senior Secured Notes | | 7.625 | % | 5/15/16 | | 500,000 | EUR | 606,922 | (a) |
Texas Petrochemical Corp. Group LLC, Senior Secured Notes | | 8.250 | % | 10/1/17 | | 210,000 | | 215,775 | (a) |
Total Chemicals | | | | | | | | 3,170,505 | |
| | | | | | | | | | |
See Notes to Financial Statements.
22 | | Western Asset Global Partners Income Fund Inc. 2011 Annual Report | | |
Schedule of investments (cont’d)
August 31, 2011
Western Asset Global Partners Income Fund Inc.
Security | | Rate | | Maturity
Date | | Face
Amount† | | Value | |
Containers & Packaging — 1.9% | | | | | | | | | |
Ardagh Packaging Finance PLC, Senior Notes | | 9.250 | % | 10/15/20 | | 1,000,000 | EUR | $ | 1,269,508 | (a) |
Berry Plastics Corp., Secured Notes | | 9.750 | % | 1/15/21 | | 350,000 | | 326,375 | (b) |
Longview Fibre Paper & Packaging Inc., Senior Secured Notes | | 8.000 | % | 6/1/16 | | 280,000 | | 278,600 | (a) |
Pretium Packaging LLC/Pretium Finance Inc., Senior Secured Notes | | 11.500 | % | 4/1/16 | | 510,000 | | 503,625 | (a)(b) |
Reynolds Group Issuer Inc./Reynolds Group Issuer LLC, Senior Notes | | 9.000 | % | 4/15/19 | | 410,000 | | 371,050 | (a)(b) |
Reynolds Group Issuer Inc./Reynolds Group Issuer LLC, Senior Notes | | 8.250 | % | 2/15/21 | | 270,000 | | 228,825 | (a) |
Reynolds Group Issuer Inc./Reynolds Group Issuer LLC, Senior Secured Notes | | 7.875 | % | 8/15/19 | | 230,000 | | 228,850 | (a) |
Rock-Tenn Co., Senior Notes | | 9.250 | % | 3/15/16 | | 200,000 | | 211,000 | (b) |
Suzano Trading Ltd., Senior Notes | | 5.875 | % | 1/23/21 | | 500,000 | | 486,250 | (a) |
Viskase Cos. Inc., Senior Secured Notes | | 9.875 | % | 1/15/18 | | 610,000 | | 619,150 | (a)(b) |
Total Containers & Packaging | | | | | | | | 4,523,233 | |
Metals & Mining — 4.4% | | | | | | | | | |
Atkore International Inc., Senior Secured Notes | | 9.875 | % | 1/1/18 | | 200,000 | | 195,500 | (a)(b) |
China Oriental Group Co., Ltd. | | 7.000 | % | 11/17/17 | | 490,000 | | 443,450 | (a) |
CSN Resources SA, Senior Bonds | | 6.500 | % | 7/21/20 | | 270,000 | | 287,887 | (a) |
CSN Resources SA, Senior Bonds | | 6.500 | % | 7/21/20 | | 250,000 | | 266,563 | (a) |
Evraz Group SA, Notes | | 8.250 | % | 11/10/15 | | 130,000 | | 137,800 | (a)(b) |
Evraz Group SA, Notes | | 6.750 | % | 4/27/18 | | 1,310,000 | | 1,273,975 | (a)(b) |
Evraz Group SA, Senior Notes | | 9.500 | % | 4/24/18 | | 540,000 | | 599,800 | (a) |
FMG Resources (August 2006) Pty Ltd., Senior Notes | | 7.000 | % | 11/1/15 | | 80,000 | | 80,200 | (a) |
Midwest Vanadium Pty Ltd., Senior Secured Notes | | 11.500 | % | 2/15/18 | | 840,000 | | 798,000 | (a)(b) |
Mirabela Nickel Ltd., Senior Notes | | 8.750 | % | 4/15/18 | | 300,000 | | 280,500 | (a) |
Novelis Inc., Senior Notes | | 8.750 | % | 12/15/20 | | 510,000 | | 539,325 | (b) |
Rio Tinto Finance USA Ltd., Senior Notes | | 9.000 | % | 5/1/19 | | 260,000 | | 355,363 | (b) |
Ryerson Holding Corp., Senior Secured Notes | | 0.000 | % | 2/1/15 | | 810,000 | | 409,050 | (b) |
Southern Copper Corp., Senior Notes | | 5.375 | % | 4/16/20 | | 200,000 | | 215,286 | (b) |
Southern Copper Corp., Senior Notes | | 6.750 | % | 4/16/40 | | 230,000 | | 244,045 | (b) |
Tempel Steel Co., Senior Secured Notes | | 12.000 | % | 8/15/16 | | 210,000 | | 210,525 | (a) |
Vale Overseas Ltd., Notes | | 8.250 | % | 1/17/34 | | 460,000 | | 600,859 | |
Vale Overseas Ltd., Notes | | 6.875 | % | 11/21/36 | | 1,757,000 | | 2,016,686 | (h) |
Vedanta Resources PLC, Senior Notes | | 8.750 | % | 1/15/14 | | 920,000 | | 933,800 | (a)(b) |
Vedanta Resources PLC, Senior Notes | | 6.750 | % | 6/7/16 | | 450,000 | | 423,000 | (a) |
Vedanta Resources PLC, Senior Notes | | 9.500 | % | 7/18/18 | | 100,000 | | 103,000 | (a) |
Total Metals & Mining | | | | | | | | 10,414,614 | |
| | | | | | | | | | |
See Notes to Financial Statements.
| | Western Asset Global Partners Income Fund Inc. 2011 Annual Report | | 23 |
Western Asset Global Partners Income Fund Inc.
Security | | Rate | | Maturity
Date | | Face
Amount† | | Value | |
Paper & Forest Products — 1.4% | | | | | | | | | |
Appleton Papers Inc., Senior Secured Notes | | 11.250 | % | 12/15/15 | | 407,000 | | $ | 398,860 | (b) |
Celulosa Arauco y Constitucion SA, Senior Notes | | 7.250 | % | 7/29/19 | | 432,000 | | 507,042 | (b) |
China Forestry Holdings Co., Ltd., Senior Secured Bonds | | 10.250 | % | 11/17/15 | | 366,000 | | 289,140 | (a)(e) |
Empresas CMPC SA, Notes | | 4.750 | % | 1/19/18 | | 250,000 | | 256,707 | (a) |
Fibria Overseas Finance Ltd., Senior Notes | | 7.500 | % | 5/4/20 | | 240,000 | | 248,400 | (a) |
Fibria Overseas Finance Ltd., Senior Notes | | 6.750 | % | 3/3/21 | | 250,000 | | 251,250 | (a)(b) |
NewPage Corp., Senior Secured Notes | | 11.375 | % | 12/31/14 | | 360,000 | | 318,600 | (b)≠ |
PE Paper Escrow GmbH, Senior Secured Notes | | 12.000 | % | 8/1/14 | | 150,000 | | 162,750 | (a) |
Sino-Forest Corp., Notes | | 6.250 | % | 10/21/17 | | 360,000 | | 108,000 | (a)(b) |
Sino-Forest Corp., Senior Bonds | | 10.250 | % | 7/28/14 | | 630,000 | | 198,450 | (a)(b) |
Verso Paper Holdings LLC, Senior Subordinated Notes | | 11.375 | % | 8/1/16 | | 480,000 | | 376,800 | |
Verso Paper Holdings LLC/Verso Paper Inc., Senior Secured Notes | | 8.750 | % | 2/1/19 | | 190,000 | | 152,475 | |
Total Paper & Forest Products | | | | | | | | 3,268,474 | |
Total Materials | | | | | | | | 21,376,826 | |
Telecommunication Services — 7.5% | | | | | | | | | |
Diversified Telecommunication Services — 4.2% | | | | | | | | | |
Axtel SAB de CV, Senior Notes | | 7.625 | % | 2/1/17 | | 1,363,000 | | 1,288,035 | (a)(b) |
Axtel SAB de CV, Senior Notes | | 7.625 | % | 2/1/17 | | 730,000 | | 688,025 | (a)(b) |
Axtel SAB de CV, Senior Notes | | 9.000 | % | 9/22/19 | | 356,000 | | 340,870 | (a) |
Cincinnati Bell Telephone Co., Senior Debentures | | 6.300 | % | 12/1/28 | | 50,000 | | 40,250 | (b) |
Cogent Communications Group Inc., Senior Secured Notes | | 8.375 | % | 2/15/18 | | 380,000 | | 397,575 | (a)(b) |
Inmarsat Finance PLC, Senior Notes | | 7.375 | % | 12/1/17 | | 580,000 | | 606,100 | (a)(b) |
Intelsat Jackson Holdings Ltd., Senior Notes | | 11.250 | % | 6/15/16 | | 150,000 | | 157,125 | |
Intelsat Jackson Holdings SA, Senior Notes | | 7.250 | % | 4/1/19 | | 590,000 | | 570,825 | (a)(b) |
Level 3 Financing Inc., Senior Notes | | 9.250 | % | 11/1/14 | | 345,000 | | 351,037 | (b) |
Primus Telecommunications Holding Inc., Senior Notes | | 10.000 | % | 4/15/17 | | 55,946 | | 53,918 | (a) |
Qtel International Finance Ltd., Senior Notes | | 4.750 | % | 2/16/21 | | 220,000 | | 225,225 | (a) |
Satelite Mexicanos SA de CV, Senior Secured Notes | | 9.500 | % | 5/15/17 | | 250,000 | | 246,563 | (a) |
Sunrise Communications Holdings SA, Senior Secured Notes | | 8.500 | % | 12/31/18 | | 156,000 | EUR | 216,251 | (a) |
Sunrise Communications International SA, Senior Secured Notes | | 7.000 | % | 12/31/17 | | 132,000 | EUR | 183,930 | (a) |
Telemar Norte Leste SA, Senior Notes | | 5.500 | % | 10/23/20 | | 380,000 | | 377,150 | (a) |
| | | | | | | | | | |
See Notes to Financial Statements.
24 | | Western Asset Global Partners Income Fund Inc. 2011 Annual Report | | |
Schedule of investments (cont’d)
August 31, 2011
Western Asset Global Partners Income Fund Inc.
Security | | Rate | | Maturity
Date | | Face
Amount† | | Value | |
Diversified Telecommunication Services — continued | | | | | | | |
TW Telecom Holdings Inc., Senior Notes | | 8.000 | % | 3/1/18 | | 380,000 | | $ | 393,300 | (b) |
UBS Luxembourg SA for OJSC Vimpel Communications, Loan Participation Notes | | 8.250 | % | 5/23/16 | | 480,000 | | 504,000 | (a) |
Vimpel Communications, Loan Participation Notes | | 8.375 | % | 4/30/13 | | 520,000 | | 552,500 | (a) |
Vimpel Communications, Notes | | 6.493 | % | 2/2/16 | | 250,000 | | 247,800 | (a) |
VIP Finance Ireland Ltd. for OJSC Vimpel Communications, Loan Participation Notes, Secured Notes | | 8.375 | % | 4/30/13 | | 248,000 | | 262,964 | (a) |
West Corp., Senior Notes | | 8.625 | % | 10/1/18 | | 370,000 | | 362,600 | |
West Corp., Senior Notes | | 7.875 | % | 1/15/19 | | 470,000 | | 451,200 | |
West Corp., Senior Subordinated Notes | | 11.000 | % | 10/15/16 | | 290,000 | | 297,975 | |
Wind Acquisition Finance SA, Senior Notes | | 11.750 | % | 7/15/17 | | 200,000 | | 208,500 | (a)(b) |
Wind Acquisition Finance SA, Senior Secured Notes | | 7.250 | % | 2/15/18 | | 200,000 | | 188,000 | (a) |
Wind Acquisition Holdings Finance SpA, Senior Notes | | 12.250 | % | 7/15/17 | | 301,168 | | 297,862 | (a)(f) |
Windstream Corp., Senior Notes | | 7.500 | % | 4/1/23 | | 270,000 | | 262,575 | |
Total Diversified Telecommunication Services | | | | | | | | 9,772,155 | |
Wireless Telecommunication Services — 3.3% | | | | | | | | | |
America Movil SAB de CV, Senior Notes | | 5.625 | % | 11/15/17 | | 340,000 | | 390,267 | |
Buccaneer Merger Sub Inc., Senior Notes | | 9.125 | % | 1/15/19 | | 425,000 | | 427,125 | (a)(b) |
Indosat Palapa Co. BV, Senior Notes | | 7.375 | % | 7/29/20 | | 540,000 | | 606,150 | (a)(b) |
MetroPCS Wireless Inc., Senior Notes | | 7.875 | % | 9/1/18 | | 290,000 | | 295,437 | |
Phones4u Finance PLC, Senior Secured Notes | | 9.500 | % | 4/1/18 | | 490,000 | GBP | 616,448 | (a) |
Phones4u Finance PLC, Senior Secured Notes | | 9.500 | % | 4/1/18 | | 100,000 | GBP | 125,806 | (a) |
Sprint Capital Corp., Senior Notes | | 8.750 | % | 3/15/32 | | 2,115,000 | | 2,178,450 | (b) |
True Move Co., Ltd. | | 10.375 | % | 8/1/14 | | 670,000 | | 703,500 | (a)(b) |
True Move Co., Ltd., Notes | | 10.750 | % | 12/16/13 | | 2,010,000 | | 2,120,550 | (a)(b) |
VimpelCom Holdings BV, Senior Notes | | 7.504 | % | 3/1/22 | | 200,000 | | 191,200 | (a) |
Total Wireless Telecommunication Services | | | | | | | | 7,654,933 | |
Total Telecommunication Services | | | | | | | | 17,427,088 | |
Utilities — 4.5% | | | | | | | | | |
Electric Utilities — 1.4% | | | | | | | | | |
AES Red Oak LLC, Secured Notes | | 9.200 | % | 11/30/29 | | 660,000 | | 678,150 | (b) |
Astoria Depositor Corp., Pass-Through Certificates | | 8.144 | % | 5/1/21 | | 420,000 | | 390,600 | (a) |
Centrais Eletricas Brasileiras SA, Senior Notes | | 6.875 | % | 7/30/19 | | 180,000 | | 208,800 | (a) |
Centrais Eletricas Brasileiras SA, Senior Notes | | 6.875 | % | 7/30/19 | | 110,000 | | 127,600 | (a) |
EEB International Ltd., Senior Bonds | | 8.750 | % | 10/31/14 | | 420,000 | | 441,000 | (a)(b) |
Majapahit Holding BV, Senior Notes | | 7.750 | % | 1/20/20 | | 280,000 | | 343,000 | (a) |
| | | | | | | | | | |
See Notes to Financial Statements.
| | Western Asset Global Partners Income Fund Inc. 2011 Annual Report | | 25 |
Western Asset Global Partners Income Fund Inc.
Security | | Rate | | Maturity
Date | | Face
Amount† | | Value | |
Electric Utilities — continued | | | | | | | | | |
Midwest Generation LLC, Pass-Through Certificates | | 8.560 | % | 1/2/16 | | 62,138 | | $ | 61,206 | |
Reliant Energy Mid-Atlantic Power Holdings LLC, Senior Notes | | 9.681 | % | 7/2/26 | | 700,000 | | 703,500 | (b) |
Texas Competitive Electric Holdings Co. LLC/TCEH Finance Inc., Senior Secured Notes | | 11.500 | % | 10/1/20 | | 430,000 | | 365,500 | (a) |
Total Electric Utilities | | | | | | | | 3,319,356 | |
Gas Utilities — 0.2% | | | | | | | | | |
Southern Natural Gas Co., Senior Notes | | 8.000 | % | 3/1/32 | | 70,000 | | 89,934 | (b) |
Suburban Propane Partners LP/Suburban Energy Finance Corp., Senior Notes | | 7.375 | % | 3/15/20 | | 330,000 | | 337,425 | (b) |
Total Gas Utilities | | | | | | | | 427,359 | |
Independent Power Producers & Energy Traders — 2.8% | | | | | | | |
AES Corp., Senior Notes | | 9.750 | % | 4/15/16 | | 500,000 | | 555,000 | (b) |
AES Gener SA, Notes | | 5.250 | % | 8/15/21 | | 250,000 | | 251,807 | (a) |
Calpine Corp., Senior Secured Notes | | 7.875 | % | 7/31/20 | | 200,000 | | 206,000 | (a)(b) |
Calpine Corp., Senior Secured Notes | | 7.500 | % | 2/15/21 | | 100,000 | | 101,500 | (a)(b) |
Calpine Corp., Senior Secured Notes | | 7.875 | % | 1/15/23 | | 620,000 | | 633,175 | (a)(b) |
Colbun SA, Senior Notes | | 6.000 | % | 1/21/20 | | 390,000 | | 412,348 | (a) |
Dynegy Inc., Bonds | | 7.670 | % | 11/8/16 | | 280,000 | | 189,000 | (b) |
Edison Mission Energy, Senior Notes | | 7.625 | % | 5/15/27 | | 200,000 | | 127,000 | (b) |
Energy Future Holdings Corp., Senior Notes | | 10.875 | % | 11/1/17 | | 1,351,000 | | 1,114,575 | (b) |
Energy Future Holdings Corp., Senior Notes | | 11.250 | % | 11/1/17 | | 550,509 | | 445,852 | (b)(f) |
First Wind Holdings Inc., Senior Secured Notes | | 10.250 | % | 6/1/18 | | 270,000 | | 259,200 | (a) |
Foresight Energy LLC/Foresight Energy Corp., Senior Notes | | 9.625 | % | 8/15/17 | | 810,000 | | 818,100 | (a)(b) |
Mirant Americas Generation LLC, Senior Notes | | 9.125 | % | 5/1/31 | | 1,530,000 | | 1,445,850 | (b) |
Total Independent Power Producers & Energy Traders | | | | 6,559,407 | |
Multi-Utilities — 0.1% | | | | | | | | | |
Empresas Publicas de Medellin ESP, Senior Notes | | 7.625 | % | 7/29/19 | | 200,000 | | 237,500 | (a) |
Total Utilities | | | | | | | | 10,543,622 | |
Total Corporate Bonds & Notes (Cost — $149,557,181) | | | | 150,212,010 | |
Collateralized Senior Loans — 1.5% | | | | | | | | | |
Consumer Discretionary — 0.7% | | | | | | | | | |
Diversified Consumer Services — 0.4% | | | | | | | | | |
Realogy Corp., Term Loan | | 13.500 | % | 10/15/17 | | 1,000,000 | | 1,010,000 | (k) |
Hotels, Restaurants & Leisure — 0.2% | | | | | | | | | |
CityCenter Holdings LLC, Term Loan | | 7.500 | % | 1/13/15 | | 100,000 | | 98,167 | (k) |
El Pollo Loco Inc., New Term Loan | | 9.250 | % | 7/14/17 | | 300,000 | | 283,500 | (k) |
Total Hotels, Restaurants & Leisure | | | | | | | | 381,667 | |
| | | | | | | | | | |
See Notes to Financial Statements.
26 | | Western Asset Global Partners Income Fund Inc. 2011 Annual Report | | |
Schedule of investments (cont’d)
August 31, 2011
Western Asset Global Partners Income Fund Inc.
Security | | Rate | | Maturity
Date | | Face
Amount† | | Value | |
Specialty Retail — 0.1% | | | | | | | | | |
BCBG Maxazria International, Term Loan B | | 9.720 | % | 5/19/15 | | 330,000 | | $ | 318,450 | (k) |
Total Consumer Discretionary | | | | | | | | 1,710,117 | |
Industrials — 0.1% | | | | | | | | | |
Marine — 0.1% | | | | | | | | | |
Trico Shipping AS, Term Loan A | | 10.000 | % | 5/12/14 | | 97,612 | | 98,099 | (k) |
Trico Shipping AS, Term Loan B | | 1.000 | % | 5/13/14 | | 97,612 | | 98,100 | (k) |
Total Industrials | | | | | | | | 196,199 | |
Information Technology — 0.1% | | | | | | | | | |
IT Services — 0.1% | | | | | | | | | |
SRA International Inc., Term Loan B | | 6.500 | % | 7/20/18 | | 250,000 | | 235,937 | (k) |
Materials — 0.2% | | | | | | | | | |
Chemicals — 0.2% | | | | | | | | | |
Kerling PLC, Term Loan | | 10.000 | % | 6/30/16 | | 300,000 | EUR | 392,165 | (k) |
Telecommunication Services — 0.3% | | | | | | | | | |
Wireless Telecommunication Services — 0.3% | | | | | | | | | |
Vodafone Americas Finance 2 Inc., Term Loan A | | 6.875 | % | 8/11/15 | | 801,708 | | 805,717 | (k) |
Utilities — 0.1% | | | | | | | | | |
Electric Utilities — 0.1% | | | | | | | | | |
Texas Competitive Electric Holdings Co. LLC, Term Loan | | 4.706 - 4.772 | % | 10/10/17 | | 323,528 | | 238,602 | (k) |
Total Collateralized Senior Loans (Cost — $3,629,293) | | | | 3,578,737 | |
Convertible Bonds & Notes — 0.5% | | | | | | | | | |
Consumer Discretionary — 0.3% | | | | | | | | | |
Diversified Consumer Services — 0.3% | | | | | | | | | |
Realogy Corp., Senior Subordinated Bonds | | 11.000 | % | 4/15/18 | | 770,000 | | 646,800 | (a)(b) |
Energy — 0.0% | | | | | | | | | |
Oil, Gas & Consumable Fuels — 0.0% | | | | | | | | | |
James River Coal Co., Senior Notes | | 3.125 | % | 3/15/18 | | 30,000 | | 22,500 | (a) |
Industrials — 0.2% | | | | | | | | | |
Marine — 0.2% | | | | | | | | | |
Horizon Lines Inc., Senior Notes | | 4.250 | % | 8/15/12 | | 680,000 | | 482,800 | (b)(e) |
Materials — 0.0% | | | | | | | | | |
Chemicals — 0.0% | | | | | | | | | |
Hercules Inc. | | 6.500 | % | 6/30/29 | | 100,000 | | 77,750 | |
Total Convertible Bonds & Notes (Cost — $1,208,577) | | | | | | 1,229,850 | |
Sovereign Bonds — 28.8% | | | | | | | | | |
Argentina — 2.7% | | | | | | | | | |
Republic of Argentina, Discount Notes | | 8.280 | % | 12/31/33 | | 1,383,142 | | 1,141,092 | (h) |
Republic of Argentina, GDP Linked Securities, Senior Bonds | | 0.000 | % | 12/15/35 | | 5,670,000 | | 1,000,755 | (g)(l) |
| | | | | | | | | | | | |
See Notes to Financial Statements.
| | Western Asset Global Partners Income Fund Inc. 2011 Annual Report | | 27 |
Western Asset Global Partners Income Fund Inc.
Security | | Rate | | Maturity
Date | | Face
Amount† | | Value | |
Argentina — continued | | | | | | | | | |
Republic of Argentina, Senior Bonds | | 7.000 | % | 9/12/13 | | 3,321,000 | | $ | 3,377,762 | |
Republic of Argentina, Senior Bonds | | 7.000 | % | 10/3/15 | | 485,000 | | 460,081 | |
Republic of Argentina, Senior Notes | | 8.750 | % | 6/2/17 | | 450,000 | | 452,250 | |
Total Argentina | | | | | | | | 6,431,940 | |
Brazil — 4.1% | | | | | | | | | |
Brazil Nota do Tesouro Nacional, Notes | | 10.000 | % | 1/1/14 | | 665,000 | BRL | 406,757 | |
Brazil Nota do Tesouro Nacional, Notes | | 10.000 | % | 1/1/17 | | 7,614,000 | BRL | 4,499,133 | |
Federative Republic of Brazil | | 7.125 | % | 1/20/37 | | 427,550 | | 569,710 | |
Federative Republic of Brazil, Collective Action Securities | | 8.000 | % | 1/15/18 | | 2,620,222 | | 3,190,121 | (h) |
Federative Republic of Brazil, Collective Action Securities | | 8.750 | % | 2/4/25 | | 685,000 | | 1,005,238 | |
Total Brazil | | | | | | | | 9,670,959 | |
Chile — 0.4% | | | | | | | | | |
Banco del Estado de Chile, Senior Notes | | 4.125 | % | 10/7/20 | | 260,000 | | 263,353 | (a) |
Corporacion Nacional del Cobre de Chile, Senior Notes | | 3.750 | % | 11/4/20 | | 250,000 | | 252,785 | (a)(b) |
Republic of Chile, Senior Notes | | 3.875 | % | 8/5/20 | | 412,000 | | 440,552 | |
Total Chile | | | | | | | | 956,690 | |
Colombia — 1.5% | | | | | | | | | |
Republic of Colombia | | 7.375 | % | 9/18/37 | | 2,150,000 | | 2,907,875 | (b)(h) |
Republic of Colombia, Senior Bonds | | 6.125 | % | 1/18/41 | | 180,000 | | 211,950 | |
Republic of Colombia, Senior Notes | | 7.375 | % | 3/18/19 | | 255,000 | | 325,763 | |
Total Colombia | | | | | | | | 3,445,588 | |
Hungary — 0.5% | | | | | | | | | |
Republic of Hungary, Senior Notes | | 6.250 | % | 1/29/20 | | 750,000 | | 782,625 | (b) |
Republic of Hungary, Senior Notes | | 6.375 | % | 3/29/21 | | 420,000 | | 436,800 | (b) |
Total Hungary | | | | | | | | 1,219,425 | |
India — 0.1% | | | | | | | | | |
ICICI Bank Ltd., Junior Subordinated Bonds | | 6.375 | % | 4/30/22 | | 186,000 | | 173,910 | (a)(g) |
ICICI Bank Ltd., Subordinated Bonds | | 6.375 | % | 4/30/22 | | 130,000 | | 121,550 | (a)(g) |
Total India | | | | | | | | 295,460 | |
Indonesia — 1.9% | | | | | | | | | |
Republic of Indonesia, Senior Bonds | | 6.875 | % | 1/17/18 | | 100,000 | | 119,500 | (a) |
Republic of Indonesia, Senior Bonds | | 10.250 | % | 7/15/22 | | 7,931,000,000 | IDR | 1,143,177 | |
Republic of Indonesia, Senior Bonds | | 11.000 | % | 9/15/25 | | 4,954,000,000 | IDR | 752,573 | |
Republic of Indonesia, Senior Bonds | | 10.250 | % | 7/15/27 | | 5,058,000,000 | IDR | 727,546 | |
Republic of Indonesia, Senior Bonds | | 6.625 | % | 2/17/37 | | 775,000 | | 931,937 | (a) |
Republic of Indonesia, Senior Bonds | | 9.750 | % | 5/15/37 | | 5,998,000,000 | IDR | 822,864 | |
Total Indonesia | | | | | | | | 4,497,597 | |
| | | | | | | | | | |
See Notes to Financial Statements.
28 | | Western Asset Global Partners Income Fund Inc. 2011 Annual Report | | |
Schedule of investments (cont’d)
August 31, 2011
Western Asset Global Partners Income Fund Inc.
Security | | Rate | | Maturity
Date | | Face
Amount† | | Value | |
Malaysia — 0.8% | | | | | | | | | |
Government of Malaysia, Senior Bonds | | 3.835 | % | 8/12/15 | | 5,360,000 | MYR | $ | 1,832,058 | |
Government of Malaysia, Senior Bonds | | 4.262 | % | 9/15/16 | | 130,000 | MYR | 45,351 | |
Total Malaysia | | | | | | | | 1,877,409 | |
Mexico — 2.0% | | | | | | | | | |
Mexican Bonos, Bonds | | 8.000 | % | 6/11/20 | | 42,129,500 | MXN | 3,918,705 | |
United Mexican States, Bonds | | 10.000 | % | 12/5/24 | | 4,800,000 | MXN | 515,416 | |
United Mexican States, Medium-Term Notes | | 5.625 | % | 1/15/17 | | 160,000 | | 184,800 | |
Total Mexico | | | | | | | | 4,618,921 | |
Panama — 0.9% | | | | | | | | | |
Republic of Panama | | 7.250 | % | 3/15/15 | | 1,807,000 | | 2,123,225 | (b) |
Peru — 1.4% | | | | | | | | | |
Republic of Peru | | 8.750 | % | 11/21/33 | | 490,000 | | 730,100 | |
Republic of Peru, Bonds | | 7.840 | % | 8/12/20 | | 1,992,000 | PEN | 845,880 | |
Republic of Peru, Bonds | | 6.550 | % | 3/14/37 | | 151,000 | | 185,352 | |
Republic of Peru, Global Senior Bonds | | 7.350 | % | 7/21/25 | | 1,200,000 | | 1,572,000 | (h) |
Total Peru | | | | | | | | 3,333,332 | |
Poland — 1.8% | | | | | | | | | |
Republic of Poland, Bonds | | 5.500 | % | 4/25/15 | | 7,345,000 | PLN | 2,609,855 | |
Republic of Poland, Senior Notes | | 6.375 | % | 7/15/19 | | 900,000 | | 1,036,350 | (b) |
Republic of Poland, Senior Notes | | 5.125 | % | 4/21/21 | | 500,000 | | 521,250 | |
Total Poland | | | | | | | | 4,167,455 | |
Russia — 2.5% | | | | | | | | | |
RSHB Capital, Loan Participation Notes, Senior Secured Bonds | | 6.299 | % | 5/15/17 | | 756,000 | | 802,305 | (a)(b) |
Russian Foreign Bond-Eurobond | | 12.750 | % | 6/24/28 | | 42,000 | | 74,655 | (a) |
Russian Foreign Bond-Eurobond, Senior Bonds | | 7.500 | % | 3/31/30 | | 4,115,238 | | 4,933,347 | (a)(h) |
Total Russia | | | | | | | | 5,810,307 | |
Sri Lanka — 0.2% | | | | | | | | | |
Sri Lanka Government International Bond, Senior Notes | | 6.250 | % | 7/27/21 | | 390,000 | | 389,809 | (a) |
Turkey — 4.0% | | | | | | | | | |
Republic of Turkey, Notes | | 6.750 | % | 5/30/40 | | 1,545,000 | | 1,707,225 | |
Republic of Turkey, Senior Bonds | | 11.875 | % | 1/15/30 | | 575,000 | | 984,687 | (h) |
Republic of Turkey, Senior Notes | | 6.875 | % | 3/17/36 | | 5,836,000 | | 6,550,910 | (b)(h) |
Total Turkey | | | | | | | | 9,242,822 | |
Venezuela — 4.0% | | | | | | | | | |
Bolivarian Republic of Venezuela | | 5.750 | % | 2/26/16 | | 5,296,000 | | 4,064,680 | (a) |
Bolivarian Republic of Venezuela | | 7.650 | % | 4/21/25 | | 233,000 | | 142,713 | |
Bolivarian Republic of Venezuela, Collective Action Securities, Global Senior Bonds | | 9.375 | % | 1/13/34 | | 1,982,000 | | 1,367,580 | |
| | | | | | | | | | |
See Notes to Financial Statements.
| | Western Asset Global Partners Income Fund Inc. 2011 Annual Report | | 29 |
Western Asset Global Partners Income Fund Inc.
Security | | Rate | | Maturity
Date | | Face
Amount† | | Value | |
Venezuela — continued | | | | | | | | | |
Bolivarian Republic of Venezuela, Collective Action Securities, Notes | | 10.750 | % | 9/19/13 | | 391,000 | | $ | 391,000 | |
Bolivarian Republic of Venezuela, Global Senior Bonds | | 8.500 | % | 10/8/14 | | 3,733,000 | | 3,387,697 | |
Total Venezuela | | | | | | | | 9,353,670 | |
Total Sovereign Bonds (Cost — $62,926,122) | | | | | | | | 67,434,609 | |
| | | | | | | | | | |
| | | | | | Shares | | | |
Common Stocks — 1.9% | | | | | | | | | |
Consumer Discretionary — 1.4% | | | | | | | | | |
Automobiles — 0.1% | | | | | | | | | |
General Motors Co. | | | | | | 6,329 | | 152,085 | * |
Media — 1.3% | | | | | | | | | |
Charter Communications Inc., Class A Shares | | | | | | 62,292 | | 3,107,125 | * |
Total Consumer Discretionary | | | | | | | | 3,259,210 | |
Energy — 0.3% | | | | | | | | | |
Energy Equipment & Services — 0.3% | | | | | | | | | |
KCAD Holdings I Ltd. | | | | | | 65,571,028 | | 660,825 | (e)(i)* |
Oil, Gas & Consumable Fuels — 0.0% | | | | | | | | | |
SemGroup Corp., Class A Shares | | | | | | 2,820 | | 64,662 | * |
Total Energy | | | | | | | | 725,487 | |
Industrials — 0.2% | | | | | | | | | |
Building Products — 0.0% | | | | | | | | | |
Ashton Woods USA LLC, Class B Membership | | | | | | 54 | | 34,830 | (e)(i) |
Nortek Inc. | | | | | | 696 | | 18,792 | * |
Total Building Products | | | | | | | | 53,622 | |
Marine — 0.2% | | | | | | | | | |
DeepOcean Group Holding AS | | | | | | 26,137 | | 405,124 | * |
Total Industrials | | | | | | | | 458,746 | |
Total Common Stocks (Cost — $3,234,658) | | | | | | | | 4,443,443 | |
| | Rate | | | | | | | |
Convertible Preferred Stocks — 1.2% | | | | | | | | | |
Financials — 1.2% | | | | | | | | | |
Diversified Financial Services — 1.2% | | | | | | | | | |
Bank of America Corp. | | 7.250 | % | | | 940 | | 837,540 | |
Citigroup Inc. | | 7.500 | % | | | 20,300 | | 1,920,583 | |
Total Convertible Preferred Stocks (Cost — $3,339,261) | | | | 2,758,123 | |
Preferred Stocks — 0.6% | | | | | | | | | |
Financials — 0.5% | | | | | | | | | |
Commercial Banks — 0.2% | | | | | | | | | |
Banesto Holdings Ltd. | | 10.500 | % | | | 19,175 | | 490,761 | (a) |
See Notes to Financial Statements.
30 | | Western Asset Global Partners Income Fund Inc. 2011 Annual Report | | |
Schedule of investments (cont’d)
August 31, 2011
Western Asset Global Partners Income Fund Inc.
Security | | Rate | | Shares | | Value | |
Consumer Finance — 0.3% | | | | | | | |
GMAC Capital Trust I | | 8.125 | % | 33,749 | | $ | 720,541 | (g) |
Thrifts & Mortgage Finance — 0.0% | | | | | | | |
Federal National Mortgage Association (FNMA) | | 8.250 | % | 4,925 | | 10,096 | *(g) |
Total Financials | | | | | | 1,221,398 | |
Industrials — 0.1% | | | | | | | |
Road & Rail — 0.1% | | | | | | | |
Jack Cooper Holdings Corp. | | 20.000 | % | 1,017 | | 96,615 | (a)(g) |
Total Preferred Stocks (Cost — $1,573,153) | | | | | | 1,318,013 | |
| | | | | | | |
| | Expiration
Date | | Notional
Amount | | | |
Purchased Options — 0.0% | | | | | | | |
Credit default swaption with BNP Paribas to sell protection on Markit CDX.NA.HY.16 Index, Call @ $102.50 | | 9/21/11 | | 28,900,000 | | 8,563 | |
Credit default swaption with BNP Paribas to sell protection on Markit CDX.NA.HY.16 Index, Call @ $102.50 | | 9/21/11 | | 9,030,000 | | 2,676 | |
Total Purchased Options (Cost — $393,390) | | | | | | 11,239 | |
| | | | | | | |
| | | | Warrants | | | |
Warrants — 0.2% | | | | | | | |
Bolivarian Republic of Venezuela, Oil-linked payment obligations | | 4/15/20 | | 9,125 | | 257,508 | *(g) |
Buffets Restaurant Holdings | | 4/28/14 | | 498 | | 5 | *(e)(i) |
Charter Communications Inc. | | 11/30/14 | | 641 | | 7,072 | * |
General Motors Co. | | 7/10/16 | | 5,754 | | 87,979 | * |
General Motors Co. | | 7/10/19 | | 5,754 | | 60,762 | * |
Jack Cooper Holdings Corp. | | 12/15/17 | | 496 | | 31,000 | * |
Jack Cooper Holdings Corp. | | 5/6/18 | | 228 | | 14,250 | * |
Nortek Inc. | | 12/7/14 | | 1,175 | | 2,350 | *(e)(i) |
SemGroup Corp. | | 11/30/14 | | 2,968 | | 16,324 | *(e) |
Total Warrants (Cost — $707,474) | | | | | | 477,250 | |
Total Investments before Short-Term Investments (Cost — $226,569,109) | | | | 231,463,274 | |
| | | | | | | | |
See Notes to Financial Statements.
| | Western Asset Global Partners Income Fund Inc. 2011 Annual Report | | 31 |
Western Asset Global Partners Income Fund Inc.
Security | Rate | | Maturity
Date | | Face
Amount† | | Value | |
Short-Term Investments — 1.1% | | | | | | | | |
U.S. Government Agencies — 0.0% | | | | | | | | |
Federal Home Loan Mortgage Corp. (FHLMC), Discount Notes (Cost — $74,971) | 0.100 - 0.120 | % | 1/10/12 | | 75,000 | | $ | 74,995 | (m)(n) |
Repurchase Agreements — 1.1% | | | | | | | | |
Morgan Stanley tri-party repurchase agreement dated 8/31/11; Proceeds at maturity — $2,446,004; (Fully collateralized by U.S. government agency obligations, 0.750% due 12/18/13; Market value — $2,494,920) (Cost — $2,446,000) | 0.060 | % | 9/1/11 | | 2,446,000 | | 2,446,000 | |
Total Short-Term Investments (Cost — $2,520,971) | | | | | | | 2,520,995 | |
Total Investments — 100.0% (Cost — $229,090,080#) | | | | | | | $233,984,269 | |
| | | | | | | | | |
† | Face amount denominated in U.S. dollars, unless otherwise noted. |
* | Non-income producing security. |
(a) | Security is exempt from registration under Rule 144A of the Securities Act of 1933. This security may be resold in transactions that are exempt from registration, normally to qualified institutional buyers. This security has been deemed liquid pursuant to guidelines approved by the Board of Trustees, unless otherwise noted. |
(b) | All or a portion of this security is pledged as collateral pursuant to the loan agreement (See Note 5). |
(c) | The coupon payment on these securities is currently in default as of August 31, 2011. |
(d) | The maturity principal is currently in default as of August 31, 2011. |
(e) | Illiquid security (unaudited). |
(f) | Payment-in-kind security for which part of the income earned may be paid as additional principal. |
(g) | Variable rate security. Interest rate disclosed is as of the most recent information available. |
(h) | All or a portion of this security is held by the counterparty as collateral for open reverse repurchase agreements. |
(i) | Security is valued in good faith in accordance with procedures approved by the Board of Trustees (See Note 1). |
(j) | Security has no maturity date. The date shown represents the next call date. |
(k) | Interest rates disclosed represent the effective rates on collateralized senior loans. Ranges in interest rates are attributable to multiple contracts under the same loan. |
(l) | The security’s interest income payments are contingent upon the performance of Argentina’s GDP. There are no principal payments over the life of the security or upon the expiration of the security. |
(m) | Rate shown represents yield-to-maturity. |
(n) | All or a portion of this security is held at the broker as collateral for open futures contracts. |
# | Aggregate cost for federal income tax purposes is $229,552,516. |
≠ | Subsequent to August 31, 2011, the issuer filed for bankruptcy. |
See Notes to Financial Statements.
32 | | Western Asset Global Partners Income Fund Inc. 2011 Annual Report | | |
Schedule of investments (cont’d)
August 31, 2011
Western Asset Global Partners Income Fund Inc.
Abbreviations used in this schedule:
BRL | — Brazilian Real |
EUR | — Euro |
GBP | — British Pound |
GDP | — Gross Domestic Product |
IDR | — Indonesian Rupiah |
MXN | — Mexican Peso |
MYR | — Malaysian Ringgit |
OJSC | — Open Joint Stock Company |
PEN | — Peruvian Nuevo Sol |
PLN | — Polish Zloty |
Schedule of Written Options
Security | | Expiration
Date | | Strike
Price | | Notional
Amount | | Value | |
Credit default swaption with BNP Paribas to buy protection on Markit CDX.NA.HY.16 Index, Call | | 9/21/11 | | $ 99.00 | | 21,900,000 | | $63,471 | |
Credit default swaption with BNP Paribas to buy protection on Markit CDX.NA.HY.16 Index, Call | | 9/21/11 | | 104.00 | | 28,900,000 | | 2,270 | |
Credit default swaption with BNP Paribas to buy protection on Markit CDX.NA.HY.16 Index, Call | | 9/21/11 | | 99.00 | | 6,830,000 | | 19,795 | |
Credit default swaption with Morgan Stanley & Co. Inc. to buy protection on Markit CDX.NA.HY.16 Index, Call | | 9/21/11 | | 103.50 | | 9,030,000 | | 1,136 | |
Total Written Options
(Premiums received — $1,006,530) | | | | | | | | $86,672 | |
See Notes to Financial Statements.
| | Western Asset Global Partners Income Fund Inc. 2011 Annual Report | | 33 |
Western Asset Global Partners Income Fund Inc.
Summary of Investments by Country** (unaudited)
United States | | 39.6 | % |
Brazil | | 6.6 | |
Mexico | | 6.2 | |
Venezuela | | 4.1 | |
Turkey | | 4.0 | |
Russia | | 3.6 | |
United Kingdom | | 3.2 | |
Argentina | | 3.1 | |
Luxembourg | | 3.0 | |
Colombia | | 2.3 | |
Indonesia | | 2.2 | |
Cayman Islands | | 2.2 | |
Netherlands | | 2.0 | |
Poland | | 1.8 | |
Malaysia | | 1.5 | |
Ireland | | 1.4 | |
Peru | | 1.4 | |
Thailand | | 1.2 | |
France | | 1.1 | |
Panama | | 1.0 | |
Chile | | 1.0 | |
Germany | | 0.9 | |
Bermuda | | 0.8 | |
Australia | | 0.6 | |
Kazakhstan | | 0.6 | |
Hungary | | 0.5 | |
Canada | | 0.4 | |
South Africa | | 0.4 | |
Belgium | | 0.3 | |
United Arab Emirates | | 0.3 | |
Qatar | | 0.3 | |
Marshall Islands | | 0.3 | |
Norway | | 0.3 | |
Mongolia | | 0.3 | |
Guernsey | | 0.2 | |
Trinidad and Tobago | | 0.2 | |
Sri Lanka | | 0.2 | |
See Notes to Financial Statements.
34 | | Western Asset Global Partners Income Fund Inc. 2011 Annual Report | | |
Schedule of investments (cont’d)
August 31, 2011
Western Asset Global Partners Income Fund Inc.
Summary of Investments by Country** (unaudited) (continued)
British Virgin Islands | | 0.2 | % |
Spain | | 0.1 | |
Italy | | 0.1 | |
India | | 0.1 | |
Singapore | | 0.1 | |
Austria | | 0.1 | |
Japan | | 0.1 | |
Sweden | | 0.1 | |
| | 100.0 | % |
** As a percentage of total investments. Please note that Fund holdings are as of August 31, 2011 and are subject to change.
See Notes to Financial Statements.
| | Western Asset Global Partners Income Fund Inc. 2011 Annual Report | | 35 |
Statement of assets and liabilities
August 31, 2011
Assets: | | | |
Investments, at value (Cost — $229,090,080) | | $233,984,269 | |
Foreign currency, at value (Cost — $1,083,906) | | 1,086,984 | |
Interest receivable | | 4,866,370 | |
Receivable for securities sold | | 612,832 | |
Deposits with brokers for swap contracts | | 60,000 | |
Unrealized appreciation on forward foreign currency contracts | | 18,438 | |
Receivable from broker — variation margin on open futures contracts | | 8,367 | |
Swaps, at value (net premiums paid — $0) | | 1,877 | |
Prepaid expenses | | 16,907 | |
Total Assets | | 240,656,044 | |
| | | |
Liabilities: | | | |
Loan payable (Note 5) | | 39,000,000 | |
Payable for open reverse repurchase agreement | | 20,269,400 | |
Payable for securities purchased | | 1,210,602 | |
Unrealized depreciation on forward foreign currency contracts | | 327,514 | |
Investment management fee payable | | 162,211 | |
Written options, at value (premiums received $1,006,530) | | 86,672 | |
Interest payable | | 70,866 | |
Deferred foreign capital gains tax | | 61,081 | |
Due to custodian | | 34,188 | |
Directors’ fees payable | | 220 | |
Accrued expenses | | 132,152 | |
Total Liabilities | | 61,354,906 | |
Total Net Assets | | $179,301,138 | |
| | | |
Net Assets: | | | |
Par value ($0.001 par value; 15,465,702 shares issued and outstanding; 100,000,000 shares authorized) | | $ 15,466 | |
Paid-in capital in excess of par value | | 205,930,092 | |
Undistributed net investment income | | 2,047,164 | |
Accumulated net realized loss on investments, futures contracts, written options and foreign currency transactions | | (34,133,044) | |
Net unrealized appreciation on investments, futures contracts, written options, swap contracts and foreign currencies | | 5,441,460 | |
Total Net Assets | | $179,301,138 | |
| | | |
Shares Outstanding | | 15,465,702 | |
| | | |
Net Asset Value | | $11.59 | |
See Notes to Financial Statements.
36 | | Western Asset Global Partners Income Fund Inc. 2011 Annual Report | | |
Statement of operations
For the Year Ended August 31, 2011
Investment Income: | | | |
Interest | | $19,837,085 | |
Dividends | | 252,922 | |
Less: Foreign taxes withheld | | (58,924) | |
Total Investment Income | | 20,031,083 | |
| | | |
Expenses: | | | |
Investment management fee (Note 2) | | 1,956,452 | |
Interest expense (Notes 3 and 5) | | 480,042 | |
Legal fees | | 184,153 | |
Commitment fees | | 166,558 | |
Audit and tax | | 75,302 | |
Shareholder reports | | 52,603 | |
Transfer agent fees | | 49,647 | |
Custody fees | | 42,928 | |
Directors’ fees | | 35,430 | |
Stock exchange listing fees | | 20,863 | |
Fund accounting fees | | 12,388 | |
Insurance | | 5,329 | |
Miscellaneous expenses | | 6,454 | |
Total Expenses | | 3,088,149 | |
Net Investment Income | | 16,942,934 | |
| | | |
Realized and Unrealized Gain (Loss) on Investments, Futures Contracts, Written Options, Swap Contracts and Foreign Currency Transactions (Notes 1, 3 and 4): | | | |
Net Realized Gain (Loss) From: | | | |
Investment transactions | | 4,107,224 | |
Futures contracts | | (597,286) | |
Written options | | 136,070 | |
Foreign currency transactions | | (495,094) | |
Net Realized Gain | | 3,150,914 | |
Change in Net Unrealized Appreciation (Depreciation) From: | | | |
Investments | | (3,273,041) | |
Futures contracts | | (730) | |
Written options | | 919,858 | |
Swap contracts | | (1,748) | |
Foreign currencies | | (572,134) | |
Change in Net Unrealized Appreciation (Depreciation) | | (2,927,795) | |
Net Gain on Investments, Futures Contracts, Written Options, Swap Contracts and Foreign Currency Transactions | | 223,119 | |
Increase in Net Assets from Operations | | $17,166,053 | |
See Notes to Financial Statements.
| | Western Asset Global Partners Income Fund Inc. 2011 Annual Report | | 37 |
Statements of changes in net assets
For the years ended August 31, | | 2011 | | 2010 | |
| | | | | |
Operations: | | | | | |
Net investment income | | $ 16,942,934 | | $ 18,383,978 | |
Net realized gain (loss) | | 3,150,914 | | (749,120) | |
Change in net unrealized appreciation (depreciation) | | (2,927,795 | ) | 23,759,430 | |
Increase in Net Assets From Operations | | 17,166,053 | | 41,394,288 | |
| | | | | |
Distributions to Shareholders From (Note 1): | | | | | |
Net investment income | | (17,586,264 | ) | (17,501,221) | |
Decrease in Net Assets From Distributions to Shareholders | | (17,586,264 | ) | (17,501,221) | |
| | | | | |
Fund Share Transactions: | | | | | |
Proceeds for shares issued on reinvestment of distributions (72,184 and 78,416 shares issued, respectively) | | 883,441 | | 888,158 | |
Increase in Net Assets From Fund Share Transactions | | 883,441 | | 888,158 | |
Increase in Net Assets | | 463,230 | | 24,781,225 | |
| | | | | |
Net Assets: | | | | | |
Beginning of year | | 178,837,908 | | 154,056,683 | |
End of year* | | $179,301,138 | | $178,837,908 | |
* Includes undistributed net investment income of: | | $2,047,164 | | $2,758,349 | |
See Notes to Financial Statements.
38 | | Western Asset Global Partners Income Fund Inc. 2011 Annual Report | | |
Statement of cash flows
For the Year Ended August 31, 2011
Increase (Decrease) in Cash:
Cash Provided from Operating Activities: | | | |
Net increase in net assets from operations | | $ | 17,166,053 | |
Adjustments to reconcile net increase in net assets resulting from operations to net cash provided by operating activities: | | | |
Purchases of portfolio securities | | (131,505,779) | |
Proceeds from sales of portfolio securities | | 132,182,236 | |
Cash paid for call options | | (393,390) | |
Net purchases, sales and maturities of short-term investments | | (857,429) | |
Net amortization (accretion) of discount and premium | | (1,889,912) | |
Increase in interest receivable | | (331,118) | |
Decrease in receivable for securities sold | | 290,169 | |
Increase in prepaid expenses | | (849) | |
Increase in deposits with brokers for swap contracts | | (60,000) | |
Increase in payable for securities purchased | | 524,294 | |
Increase in investment management fee payable | | 1,747 | |
Decrease in Directors’ fees payable | | (42) | |
Premiums received from written options | | 1,006,530 | |
Decrease in receivable from broker—variation margin | | 788 | |
Decrease in interest payable | | (15,352) | |
Decrease in accrued expenses | | (20,726) | |
Net realized gain on investments futures contracts, written options and foreign currency transactions | | (3,150,914) | |
Change in net unrealized apprectiation of investements, written options, swap contracts and forward foreign currency contracts | | 2,927,795 | |
Net cash provided by operating activities * | | 15,874,101 | |
| | | |
Cash Used in Financing Activities: | | | |
Distribution paid on common stock | | (16,702,823) | |
Increase in loan payable | | 6,000,000 | |
Decrease in payable for reverse repurchase agreements | | (4,565,835) | |
Due to custodian | | 34,188 | |
Net cash used in financing activities | | (15,234,470) | |
Net increase in cash | | 639,631 | |
Cash beginning of year | | 447,353 | |
Cash end of year | | $ | 1,086,984 | |
| | | |
Non-Cash Financing Activities: | | | |
Proceeds from reinvestment of dividends | | $ | 883,441 | |
* Included in operating expenses is cash paid for interest on borrowings of $480,042.
See Notes to Financial Statements.
| | Western Asset Global Partners Income Fund Inc. 2011 Annual Report | | 39 |
Financial highlights
For a share of capital stock outstanding throughout each year ended August 31:
| | 2011 | | 2010 | | 2009 | | 2008 | | 2007 | |
| | | | | | | | | | | |
Net asset value, beginning of year | | $11.62 | | $10.06 | | $11.36 | | $12.59 | | $12.93 | |
| | | | | | | | | | | |
Income (loss) from operations: | | | | | | | | | | | |
Net investment income | | 1.10 | | 1.21 | | 1.17 | | 1.14 | | 0.93 | |
Net realized and unrealized gain (loss) | | 0.01 | | 1.49 | | (1.33 | ) | (1.39 | ) | (0.32 | )1 |
Total income (loss) from operations | | 1.11 | | 2.70 | | (0.16 | ) | (0.25 | ) | 0.61 | |
| | | | | | | | | | | |
Less distributions from: | | | | | | | | | | | |
Net investment income | | (1.14 | ) | (1.14 | ) | (1.14 | ) | (0.98 | ) | (0.95 | ) |
Total distributions | | (1.14 | ) | (1.14 | ) | (1.14 | ) | (0.98 | ) | (0.95 | ) |
| | | | | | | | | | | |
Net asset value, end of year | | $11.59 | | $11.62 | | $10.06 | | $11.36 | | $12.59 | |
| | | | | | | | | | | |
Market price, end of year | | $12.19 | | $12.55 | | $10.23 | | $10.30 | | $11.27 | |
Total return, based on NAV2,3 | | 9.64 | % | 27.90 | % | 2.22 | % | (2.16 | )% | 4.59 | %4 |
Total return, based on Market Price3 | | 6.58 | % | 35.62 | % | 15.51 | % | 0.11 | % | 3.36 | % |
| | | | | | | | | | | |
Net assets, end of year (000s) | | $179,301 | | $178,838 | | $154,057 | | $173,700 | | $192,480 | |
| | | | | | | | | | | |
Ratios to average net assets: | | | | | | | | | | | |
Gross expenses | | 1.66 | % | 1.91 | % | 2.99 | % | 2.77 | % | 2.96 | % |
Net expenses5 | | 1.66 | | 1.91 | | 2.99 | | 2.77 | | 2.96 | 6 |
Net investment income | | 9.10 | | 10.77 | | 14.10 | | 9.38 | | 7.03 | |
| | | | | | | | | | | |
Portfolio turnover rate | | 56 | % | 65 | % | 58 | % | 46 | % | 75 | % |
| | | | | | | | | | | |
Supplemental data: | | | | | | | | | | | |
Loans Outstanding, End of Year (000s) | | $39,000 | | $33,000 | | $33,000 | | $35,000 | | $35,000 | |
Asset Coverage (000s) | | $218,301 | | $211,838 | | $187,057 | | $208,700 | | $227,480 | |
Asset Coverage for Loan Outstanding | | 560 | % | 642 | % | 567 | % | 596 | % | 650 | % |
Weighted Average Loan (000s) | | $34,085 | | $33,000 | | $33,499 | | $35,000 | | $37,657 | |
Weighted Average Interest Rate on Loans | | 0.94 | % | 1.18 | % | 2.96 | % | 4.32 | % | 5.63 | % |
1 | The investment manager fully reimbursed the Fund for losses incurred resulting from an investment transaction error. The impact of this reimbursement to net unrealized and unrealized gain was less than $0.01 per share. |
2 | Performance figures may reflect compensating balance arrangements, fee waivers and/or expense reimbursements. In the absence of compensating balance arrangements, fee waivers and/or expense reimbursements, the total return would have been lower. Past performance is no guarantee of future results. |
3 | The total return calculation assumes that distributions are reinvested in accordance with the Fund’s dividend reinvestment plan. Past performance is no guarantee of future results. |
4 | The impact of the reimbursement of the Fund for the losses incurred, resulting from an investment transaction error, to Fund’s total return was less than 0.01%. |
5 | The impact of compensating balance arrangements, if any, was less than 0.01%. |
6 | Reflects fee waivers and/or expense reimbursements. |
See Notes to Financial Statements.
40 | | Western Asset Global Partners Income Fund Inc. 2011 Annual Report | | |
Notes to financial statements
1. Organization and significant accounting policies
Western Asset Global Partners Income Fund Inc. (the “Fund”) was incorporated in Maryland on September 3, 1993 and is registered as a non-diversified, closed-end management investment company under the Investment Company Act of 1940, as amended (the “1940 Act”). The Fund seeks to maintain a high level of current income. As a secondary objective, the Fund seeks capital appreciation.
The following are significant accounting policies consistently followed by the Fund and are in conformity with U.S. generally accepted accounting principles (“GAAP”). Estimates and assumptions are required to be made regarding assets, liabilities and changes in net assets resulting from operations when financial statements are prepared. Changes in the economic environment, financial markets and any other parameters used in determining these estimates could cause actual results to differ. Subsequent events have been evaluated through the date the financial statements were issued.
(a) Investment valuation. The valuations for fixed income securities and certain derivative instruments are typically the prices supplied by independent third party pricing services, which may use market prices or broker/dealer quotations or a variety of fair valuation techniques and methodologies. Short-term fixed income securities that will mature in 60 days or less are valued at amortized cost, unless it is determined that using this method would not reflect an investment’s fair value. Futures contracts are valued daily at the settlement price established by the board of trade or exchange on which they are traded. Equity securities for which market quotations are available are valued at the last reported sales price or official closing price on the primary market or exchange on which they trade. If independent third party pricing services are unable to supply prices for a portfolio investment, or if the prices supplied are deemed by the manager to be unreliable, the market price may be determined by the manager using quotations from one or more broker/dealers. When the Fund holds securities or other assets that are denominated in a foreign currency, the Fund will normally use the currency exchange rates as of 4:00 p.m. (Eastern time). When reliable prices are not readily available, such as when the value of a security has been significantly affected by events after the close of the exchange or market on which the security is principally traded, but before the Fund calculates its net asset value, the Fund values these securities as determined in accordance with procedures approved by the Fund’s Board of Directors.
The Fund has adopted Financial Accounting Standards Board Codification Topic 820 (“ASC Topic 820”). ASC Topic 820 establishes a single definition of fair value, creates a three-tier hierarchy as a framework for measuring fair value based on inputs used to value the Fund’s investments, and requires additional disclosure about fair value. The hierarchy of inputs is summarized below.
| | Western Asset Global Partners Income Fund Inc. 2011 Annual Report | | 41 |
· | Level 1 — quoted prices in active markets for identical investments |
| |
· | Level 2 — other significant observable inputs (including quoted prices for similar investments, interest rates, prepayment speeds, credit risk, etc.) |
| |
· | Level 3 — significant unobservable inputs (including the Fund’s own assumptions in determining the fair value of investments) |
The inputs or methodology used for valuing securities are not necessarily an indication of the risk associated with investing in those securities.
The Fund uses valuation techniques to measure fair value that are consistent with the market approach and/or income approach, depending on the type of security and the particular circumstance. The market approach uses prices and other relevant information generated by market transactions involving identical or comparable securities. The income approach uses valuation techniques to discount estimated future cash flows to present value.
The following is a summary of the inputs used in valuing the Fund’s assets and liabilities carried at fair value:
Description | Quoted Prices
(Level 1) | Other Significant
Observable Inputs
(Level 2) | Significant
Unobservable
Inputs
(Level 3) | | Total | |
Long-term investments†: | | | | | | | | | | | | |
Corporate bonds & notes | | — | | | $149,025,348 | | | $1,186,662 | | | $150,212,010 | |
Collateralized senior loans | | — | | | 3,578,737 | | | — | | | 3,578,737 | |
Convertible bonds & notes | | — | | | 1,229,850 | | | — | | | 1,229,850 | |
Sovereign bonds | | — | | | 67,434,609 | | | — | | | 67,434,609 | |
Common stocks: | | | | | | | | | | | | |
Consumer discretionary | | $3,259,210 | | | — | | | — | | | 3,259,210 | |
Energy | | 64,662 | | | — | | | 660,825 | | | 725,487 | |
Industrials | | 18,792 | | | 405,124 | | | 34,830 | | | 458,746 | |
Convertible preferred stocks | | 2,758,123 | | | — | | | — | | | 2,758,123 | |
Preferred stocks: | | | | | | | | | | | | |
Financials | | 730,637 | | | 490,761 | | | — | | | 1,221,398 | |
Industrials | | — | | | 96,615 | | | — | | | 96,615 | |
Purchased options | | — | | | 11,239 | | | — | | | 11,239 | |
Warrants | | 148,741 | | | 326,154 | | | 2,355 | | | 477,250 | |
Total long-term investments | | $6,980,165 | | | $222,598,437 | | | $1,884,672 | | | $231,463,274 | |
Short-term investments† | | — | | | 2,520,995 | | | — | | | 2,520,995 | |
Total investments | | $6,980,165 | | | $225,119,432 | | | $1,884,672 | | | $233,984,269 | |
Other financial instruments: | | | | | | | | | | | | |
Forward foreign currency contracts | | — | | | $ 18,438 | | | — | | | $ 18,438 | |
Interest rate swaps | | — | | | 1,877 | | | — | | | 1,877 | |
Total other financial instruments | | — | | | $ 20,315 | | | — | | | $ 20,315 | |
Total | | $6,980,165 | | | $225,139,747 | | | $1,884,672 | | | $234,004,584 | |
42 | | Western Asset Global Partners Income Fund Inc. 2011 Annual Report | | |
Notes to financial statements (cont’d)
Description | Quoted Prices
(Level 1) | Other Significant
Observable Inputs
(Level 2) | Significant
Unobservable
Inputs
(Level 3) | | Total | |
Other financial instruments: | | | | | | | | | | | | |
Written options | | — | | | $ 86,672 | | | — | | | $ 86,672 | |
Forward foreign currency contracts | | — | | | 327,514 | | | — | | | 327,514 | |
Futures contracts | | $7,377 | | | — | | | — | | | 7,377 | |
Total | | $7,377 | | | $414,186 | | | — | | | $421,563 | |
† See Schedule of Investments for additional detailed categorizations.
The following is a reconciliation of investments in which significant unobservable inputs (Level 3) were used in determining fair value:
| | | | | | Common
Stocks | | | | | |
Investments In Securities | | Corporate
Bonds &
Notes | | Collateralized
Senior Loans | Energy | | Industrials | | Warrants | | Total | |
Balance as of August 31, 2010 | | $ 239,200 | | $745,013 | | — | | | $24,303 | | | $ 5 | | | $1,008,521 | |
Accrued premiums/ discounts | | — | | 555 | | — | | | — | | | — | | | 555 | |
Realized gain(loss)1 | | (298,725 | ) | — | | — | | | — | | | — | | | (298,725 | ) |
Change in unrealized appreciation (depreciation)2 | | 316,550 | | 31 | | $ 83,800 | | | 10,527 | | | — | | | 410,908 | |
Net purchases (sales) | | 252,975 | | (745,599 | ) | 577,025 | | | — | | | — | | | 84,401 | |
Transfers into Level 3 | | 676,662 | | — | | — | | | — | | | 2,350 | | | 679,012 | |
Transfers out of Level 3 | | — | | — | | — | | | — | | | — | | | — | |
Balance as of August 31, 2011 | | $1,186,662 | | — | | $660,825 | | | $34,830 | | | $2,355 | | | $1,884,672 | |
Net change in unrealized appreciation (depreciation) for investments in securities still held at August 31, 20112 | | — | | — | | $ 83,800 | | | $10,527 | | | — | | | $ 94,327 | |
1 | This amount is included in net realized gain (loss) from investment transactions in the accompanying Statement of Operations. |
| |
2 | This amount is included in the change in net unrealized appreciation (depreciation) in the accompanying Statement of Operations. Change in unrealized appreciation (depreciation) includes net unrealized appreciation (depreciation) resulting from changes in investment values during the reporting period and the reversal of previously recorded unrealized appreciation (depreciation) when gains or losses are realized. |
(b) Repurchase agreements. The Fund may enter into repurchase agreements with institutions that its investment adviser has determined are creditworthy. Each repurchase agreement is recorded at cost. Under the terms of a typical repurchase agreement, the Fund acquires a debt security subject to an obligation of the seller to repurchase, and of the Fund to resell, the security at an agreed-upon price and time, thereby determining the yield during the Fund’s holding period. When entering into repurchase agreements, it is the Fund’s policy that its custodian or a third party custodian, acting on the Fund’s
| | Western Asset Global Partners Income Fund Inc. 2011 Annual Report | | 43 |
behalf, take possession of the underlying collateral securities, the market value of which, at all times, at least equals the principal amount of the repurchase transaction, including accrued interest. To the extent that any repurchase transaction maturity exceeds one business day, the value of the collateral is marked-to-market and measured against the value of the agreement in an effort to ensure the adequacy of the collateral. If the counterparty defaults, the Fund generally has the right to use the collateral to satisfy the terms of the repurchase transaction. However, if the market value of the collateral declines during the period in which the Fund seeks to assert its rights or if bankruptcy proceedings are commenced with respect to the seller of the security, realization of the collateral by the Fund may be delayed or limited.
(c) Reverse repurchase agreements. The Fund may enter into reverse repurchase agreements. Under the terms of a typical reverse repurchase agreement, a Fund sells a security subject to an obligation to repurchase the security from the buyer at an agreed-upon time and price. In the event the buyer of securities under a reverse repurchase agreement files for bankruptcy or becomes insolvent, the Fund’s use of the proceeds of the agreement may be restricted pending a determination by the counterparty, or its trustee or receiver, whether to enforce the Fund’s obligation to repurchase the securities. In entering into reverse repurchase agreements, the Fund will maintain cash, U.S. government securities or other liquid debt obligations at least equal in value to its obligations with respect to reverse repurchase agreements or will take other actions permitted by law to cover its obligations.
(d) Futures contracts. The Fund uses futures contracts generally to gain exposure to, or hedge against, changes in interest rates or gain exposure to, or hedge against changes in certain asset classes. A futures contract represents a commitment for the future purchase or sale of an asset at a specified price on a specified date.
Upon entering into a futures contract, the Fund is required to deposit cash or cash equivalents with a broker in an amount equal to a certain percentage of the contract amount. This is known as the ‘‘initial margin’’ and subsequent payments (‘‘variation margin’’) are made or received by the Fund each day, depending on the daily fluctuation in the value of the contract. For certain futures, including foreign denominated futures, variation margin is not settled daily, but is recorded as a net variation margin payable or receivable. Futures contracts are valued daily at the settlement price established by the board of trade or exchange on which they are traded. The daily changes in contract value are recorded as unrealized gains or losses in the Statement of Operations and the Fund recognizes a realized gain or loss when the contract is closed.
Futures contracts involve, to varying degrees, risk of loss in excess of the amounts reflected in the financial statements. In addition, there is the risk that the Fund may not be able to enter into a closing transaction because of an illiquid secondary market.
44 | | Western Asset Global Partners Income Fund Inc. 2011 Annual Report | | |
Notes to financial statements (cont’d)
(e) Loan participations. The Fund may invest in loans arranged through private negotiation between one or more financial institutions. The Fund’s investment in any such loan may be in the form of a participation in or an assignment of the loan. In connection with purchasing participations, the Fund generally will have no right to enforce compliance by the borrower with the terms of the loan agreement related to the loan, or any rights of off-set against the borrower and the Fund may not benefit directly from any collateral supporting the loan in which it has purchased the participation.
The Fund assumes the credit risk of the borrower, the lender that is selling the participation and any other persons interpositioned between the Fund and the borrower. In the event of the insolvency of the lender selling the participation, the Fund may be treated as a general creditor of the lender and may not benefit from any off-set between the lender and the borrower.
(f) Swap agreements. The Fund invests in swaps for the purpose of managing its exposure to interest rate, credit or market risk, or for other purposes. The use of swaps involves risks that are different from those associated with ordinary portfolio transactions.
Swap contracts are marked-to-market daily and changes in value are recorded as unrealized appreciation (depreciation). Gains or losses are realized upon termination of the swap agreement. Collateral, in the form of restricted cash or securities, may be required to be held in segregated accounts with the Fund’s custodian in compliance with the terms of the swap contracts. Securities posted as collateral for swap contracts are identified in the Schedule of Investments and restricted cash, if any, is identified on the Statement of Assets and Liabilities. Risks may exceed amounts recorded in the Statement of Assets and Liabilities. These risks include changes in the returns of the underlying instruments, failure of the counterparties to perform under the contracts’ terms, and the possible lack of liquidity with respect to the swap agreements.
Payments received or made at the beginning of the measurement period are reflected as a premium or deposit, respectively, on the Statement of Assets and Liabilities. These upfront payments are amortized over the life of the swap and are recognized as realized gain or loss in the Statement of Operations. Net periodic payments received or paid by the Fund are recognized as a realized gain or loss in the Statement of Operations.
For average notional amounts of swaps held during the year ended August 31, 2011, see Note 4.
Credit default swaps
The Fund may enter into credit default swap (“CDS”) contracts for investment purposes, to manage its credit risk or to add leverage. CDS agreements involve one party making a stream of payments to another party in exchange for the right to receive a specified return in the event of a default
| | Western Asset Global Partners Income Fund Inc. 2011 Annual Report | | 45 |
by a third party, typically corporate or sovereign issuers, on a specified obligation, or in the event of a write-down, principal shortfall, interest shortfall or default of all or part of the referenced entities comprising a credit index. The Fund may use a CDS to provide protection against defaults of the issuers (i.e., to reduce risk where the Fund has exposure to an issuer) or to take an active long or short position with respect to the likelihood of a particular issuer’s default. As a seller of protection, the Fund generally receives an upfront payment or a stream of payments throughout the term of the swap provided that there is no credit event. If the Fund is a seller of protection and a credit event occurs, as defined under the terms of that particular swap agreement, the maximum potential amount of future payments (undiscounted) that the Fund could be required to make under a credit default swap agreement would be an amount equal to the notional amount of the agreement. These amounts of potential payments will be partially offset by any recovery of values from the respective referenced obligations. As a seller of protection, the Fund effectively adds leverage to its portfolio because, in addition to its total net assets, the Fund is subject to investment exposure on the notional amount of the swap. As a buyer of protection, the Fund generally receives an amount up to the notional value of the swap if a credit event occurs.
Implied spreads are the theoretical prices a lender receives for credit default protection. When spreads rise, market perceived credit risk rises and when spreads fall, market perceived credit risk falls. The implied credit spread of a particular referenced entity reflects the cost of buying/selling protection and may include upfront payments required to enter into the agreement. Wider credit spreads and decreasing market values, when compared to the notional amount of the swap, represent a deterioration of the referenced entity’s credit soundness and a greater likelihood or risk of default or other credit event occurring as defined under the terms of the agreement. Credit spreads utilized in determining the period end market value of credit default swap agreements on corporate or sovereign issues are disclosed in the Notes to Financial Statements and serve as an indicator of the current status of the payment/performance risk and represent the likelihood or risk of default for credit derivatives. For credit default swap agreements on asset-backed securities and credit indices, the quoted market prices and resulting values, particularly in relation to the notional amount of the contract as well as the annual payment rate, serve as an indication of the current status of the payment/performance risk.
The Fund’s maximum risk of loss from counterparty risk, as the protection buyer, is the fair value of the contract (this risk is mitigated by the posting of collateral by the counterparty to the Fund to cover the Fund’s exposure to the counterparty). As the protection seller, the Fund’s maximum risk is the notional amount of the contract. Credit default swaps are considered to have credit risk-related contingent features since they require payment by the
46 | | Western Asset Global Partners Income Fund Inc. 2011 Annual Report | | |
Notes to financial statements (cont’d)
protection seller to the protection buyer upon the occurrence of a defined credit event.
Entering into a CDS agreement involves, to varying degrees, elements of credit, market and documentation risk in excess of the related amounts recognized on the Statement of Assets and Liabilities. Such risks involve the possibility that there will be no liquid market for these agreements, that the counterparty to the agreement may default on its obligation to perform or disagree as to the meaning of the contractual terms in the agreement, and that there will be unfavorable changes in net interest rates.
Interest rate swaps
The Fund enters into interest rate swap contracts to manage its exposure to interest rate risk. Interest rate swaps are agreements between two parties to exchange cash flows based on a notional principal amount. The Fund may elect to pay a fixed rate and receive a floating rate, or, receive a fixed rate and pay a floating rate on a notional principal amount. Interest rate swaps are marked-to-market daily based upon quotations from market makers and the change, if any, is recorded as an unrealized gain or loss in the Statement of Operations. When a swap contract is terminated early, the Fund records a realized gain or loss equal to the difference between the original cost and the settlement amount of the closing transaction.
The risks of interest rate swaps include changes in market conditions that will affect the value of the contract or changes in the present value of the future cash flow streams and the possible inability of the counterparty to fulfill its obligations under the agreement. The Fund’s maximum risk of loss from counterparty credit risk is the discounted net value of the cash flows to be received from the counterparty over the contract’s remaining life, to the extent that that amount is positive. This risk is mitigated by the posting of collateral by the counterparty to the Fund to cover the Fund’s exposure to the counterparty.
(g) Written options. When the Fund writes an option, an amount equal to the premium received by the Fund is recorded as a liability, the value of which is marked-to-market daily to reflect the current market value of the option written. If the option expires, the premium received is recorded as a realized gain. When a written call option is exercised, the difference between the premium received plus the option exercise price and the Fund’s basis in the underlying security (in the case of a covered written call option), or the cost to purchase the underlying security (in the case of an uncovered written call option), including brokerage commission, is recognized as a realized gain or loss. When a written put option is exercised, the amount of the premium received is subtracted from the cost of the security purchased by the Fund from the exercise of the written put option to form the Fund’s basis in the underlying security purchased. The writer or buyer of an option traded on an exchange can liquidate the position before the exercise of the option by
| | Western Asset Global Partners Income Fund Inc. 2011 Annual Report | | 47 |
entering into a closing transaction. The cost of a closing transaction is deducted from the original premium received resulting in a realized gain or loss to the Fund.
The risk in writing a covered call option is that the Fund may forego the opportunity of profit if the market price of the underlying security increases and the option is exercised. The risk in writing a put option is that the Fund may incur a loss if the market price of the underlying security decreases and the option is exercised. The risk in writing an uncovered call option is that the Fund is exposed to the risk of loss if the market price of the underlying security increases. In addition, there is the risk that the Fund may not be able to enter into a closing transaction because of an illiquid secondary market.
(h) Swaptions. The Fund purchases and writes swaption contracts to manage exposure to an underlying instrument. The Fund may also purchase or write options to manage exposure to fluctuations in interest rates or to enhance yield. Swaption contracts written by the Fund represent an option that gives the purchaser the right, but not the obligation, to enter into a previously agreed upon swap contract at a future date. Swaption contracts purchased by the Fund represent an option that gives the Fund the right, but not the obligation, to enter into a previously agreed upon swap contract at a future date.
When the Fund writes a swaption, an amount equal to the premium received by the Fund is recorded as a liability, the value of which is marked-to-market daily to reflect the current market value of the swaption written. If the swaption expires, the Fund realizes a gain equal to the amount of the premium received.
When the Fund purchases a swaption, an amount equal to the premium paid by the Fund is recorded as an investment on the statement of assets and liabilities, the value of which is marked-to-market daily to reflect the current market value of the swaption purchased. If the swaption expires, the Fund realizes a loss equal to the amount of the premium paid.
Swaptions are marked-to-market daily based upon quotations from market makers. Changes in the value of the swaption are reported as unrealized gains or losses in the Statement of Operations.
(i) Forward foreign currency contracts. The Fund enters into a forward foreign currency contract to hedge against foreign currency exchange rate risk on its non-U.S. dollar denominated securities or to facilitate settlement of a foreign currency denominated portfolio transaction. A forward foreign currency contract is an agreement between two parties to buy and sell a currency at a set price with delivery and settlement at a future date. The contract is marked-to-market daily and the change in value is recorded by the Fund as an unrealized gain or loss. When a forward foreign currency contract is closed, through either delivery or offset by entering into another forward foreign currency contract, the Fund recognizes a realized gain or loss equal to
48 | | Western Asset Global Partners Income Fund Inc. 2011 Annual Report | | |
Notes to financial statements (cont’d)
the difference between the value of the contract at the time it was opened and the value of the contract at the time it is closed.
Forward foreign currency contracts involve elements of market risk in excess of the amounts reflected on the Statement of Assets and Liabilities. The Fund bears the risk of an unfavorable change in the foreign exchange rate underlying the forward foreign currency contract. Risks may also arise upon entering into these contracts from the potential inability of the counterparties to meet the terms of their contracts.
(j) Foreign currency translation. Investment securities and other assets and liabilities denominated in foreign currencies are translated into U.S. dollar amounts based upon prevailing exchange rates on the date of valuation. Purchases and sales of investment securities and income and expense items denominated in foreign currencies are translated into U.S. dollar amounts based upon prevailing exchange rates on the respective dates of such transactions.
The Fund does not isolate that portion of the results of operations resulting from fluctuations in foreign exchange rates on investments from the fluctuations arising from changes in market prices of securities held. Such fluctuations are included with the net realized and unrealized gain or loss on investments.
Net realized foreign exchange gains or losses arise from sales of foreign currencies, including gains and losses on forward foreign currency contracts, currency gains or losses realized between the trade and settlement dates on securities transactions, and the difference between the amounts of dividends, interest, and foreign withholding taxes recorded on the Fund’s books and the U.S. dollar equivalent of the amounts actually received or paid. Net unrealized foreign exchange gains and losses arise from changes in the values of assets and liabilities, other than investments in securities, on the date of valuation, resulting from changes in exchange rates.
Foreign security and currency transactions may involve certain considerations and risks not typically associated with those of U.S. dollar denominated transactions as a result of, among other factors, the possibility of lower levels of governmental supervision and regulation of foreign securities markets and the possibility of political or economic instability.
(k) Cash flow information. The Fund invests in securities and distributes dividends from net investment income and net realized gains, which are paid in cash and may be reinvested at the discretion of shareholders. These activities are reported in the Statement of Changes in Net Assets and additional information on cash receipts and cash payments are presented in the Statement of Cash Flows.
(l) Credit and market risk. The Fund invests in high-yield and emerging market instruments that are subject to certain credit and market risks. The yields
| | Western Asset Global Partners Income Fund Inc. 2011 Annual Report | | 49 |
of high-yield and emerging market debt obligations reflect, among other things, perceived credit and market risks. The Fund’s investment in securities rated below investment grade typically involve risks not associated with higher rated securities including, among others, greater risk related to timely and ultimate payment of interest and principal, greater market price volatility and less liquid secondary market trading. The consequences of political, social, economic or diplomatic changes may have disruptive effects on the market prices of investments held by the Fund. The Fund’s investment in non-U.S. dollar denominated securities may also result in foreign currency losses caused by devaluations and exchange rate fluctuations.
(m) Counterparty risk and credit-risk-related contingent features of derivative instruments. The Fund may invest in certain securities or engage in other transactions, where the Fund is exposed to counterparty credit risk in addition to broader market risks. The Fund may invest in securities of issuers, which may also be considered counterparties as trading partners in other transactions. This may increase the risk of loss in the event of default or bankruptcy by the counterparty or if the counterparty otherwise fails to meet its contractual obligations. The Fund’s investment manager attempts to mitigate counterparty risk by (i) periodically assessing the creditworthiness of its trading partners, (ii) monitoring and/or limiting the amount of its net exposure to each individual counterparty based on its assessment and (iii) requiring collateral from the counterparty for certain transactions. Market events and changes in overall economic conditions may impact the assessment of such counterparty risk by the investment manager. In addition, declines in the values of underlying collateral received may expose the Fund to increased risk of loss.
The Fund has entered into master agreements with certain of its derivative counterparties that provide for general obligations, representations, agreements, collateral, events of default or termination and credit related contingent features. The credit related contingent features include, but are not limited to, a percentage decrease in the Fund’s net assets or NAV over a specified period of time. If these credit related contingent features were triggered, the derivatives counterparty could terminate the positions and demand payment or require additional collateral.
As of August 31, 2011, the Fund held written options and forward foreign currency contracts with credit related contingent features which had a liability position of $414,186. If a contingent feature in the Master Agreements would have been triggered, the Fund would have been required to pay this amount to its derivatives counterparties.
(n) Security transactions and investment income. Security transactions are accounted for on a trade date basis. Interest income, adjusted for amortization of premium and accretion of discount, is recorded on the accrual basis. Dividend income is recorded on the ex-dividend date. Foreign dividend income is recorded on the ex-dividend date or as soon as practicable after
50 | | Western Asset Global Partners Income Fund Inc. 2011 Annual Report | | |
Notes to financial statements (cont’d)
the Fund determines the existence of a dividend declaration after exercising reasonable due diligence. The cost of investments sold is determined by use of the specific identification method. To the extent any issuer defaults or a credit event occurs that impacts the issuer, the Fund may halt any additional interest income accruals and consider the realizability of interest accrued up to the date of default or credit event.
(o) Distributions to shareholders. Distributions from net investment income for the Fund, if any, are declared and paid on a monthly basis. Distributions of net realized gains, if any, are declared at least annually. Distributions to shareholders of the Fund are recorded on the ex-dividend date and are determined in accordance with income tax regulations, which may differ from GAAP.
(p) Compensating balance arrangements. The Fund has an arrangement with its custodian bank whereby a portion of the custodian’s fees is paid indirectly by credits earned on the Fund’s cash on deposit with the bank.
(q) Federal and other taxes. It is the Fund’s policy to comply with the federal income and excise tax requirements of the Internal Revenue Code of 1986 (the “Code”), as amended, applicable to regulated investment companies. Accordingly, the Fund intends to distribute its taxable income and net realized gains, if any, to shareholders in accordance with timing requirements imposed by the Code. Therefore, no federal or state income tax provision is required in the Fund’s financial statements.
Management has analyzed the Fund’s uncertain tax positions taken on income tax returns for all open tax years and has concluded that as of August 31, 2011, no provision for income tax is required in the Fund’s financial statements. The Fund’s federal and state income and federal excise tax returns for tax years for which the applicable statutes of limitations have not expired are subject to examination by Internal Revenue Service and state departments of revenue. Under the applicable foreign tax laws, a withholding tax may be imposed on interest, dividends and capital gains at various rates.
Under the applicable foreign tax laws, a withholding tax may be imposed on interest, dividends and capital gains at various rates. Realized gains upon disposition of Indonesian securities held by the Fund are subject to capital gains tax in that country. As of August 31, 2011, there were $61,081 of capital gains tax liabilities accrued on unrealized gains.
(r) Reclassification. GAAP requires that certain components of net assets be reclassified to reflect permanent differences between financial and tax reporting. These reclassifications have no effect on net assets or net asset
| | Western Asset Global Partners Income Fund Inc. 2011 Annual Report | | 51 |
values per share. During the current year, the following reclassifications have been made:
| | Undistributed Net
Investment Income | | Accumulated Net
Realized Loss | |
(a) | | $(67,855) | | $67,855 | |
(a) Reclassifications are primarily due to foreign currency transactions treated as ordinary income for tax purposes, differences between book and tax amortization of premium on fixed income securities and losses from mortgage backed securities treated as capital losses for tax purposes.
2. Investment management agreement and other transactions with affiliates
Legg Mason Partners Fund Advisor, LLC (“LMPFA”) is the Fund’s investment manager. Western Asset Management Company (“Western Asset”) is the Fund’s subadviser. Western Asset Management Company Pte. Ltd. (“Western Singapore”), Western Asset Management Company Ltd (“Western Japan”) and Western Asset Management Company Limited (“Western Asset Limited”) serve as additional subadvisers to the Fund, under additional subadvisory agreements with Western Asset. LMPFA, Western Asset, Western Singapore, Western Japan and Western Asset Limited are wholly-owned subsidiaries of Legg Mason, Inc. (“Legg Mason”).
LMPFA provides administrative and certain oversight services to the Fund. The Fund pays LMPFA an investment management fee, calculated daily and paid monthly, at an annual rate of 1.05% of the Fund’s average weekly net assets.
LMPFA delegates to Western Asset the day-to-day portfolio management of the Fund. Western Singapore, Western Japan and Western Asset Limited do not receive any compensation from the Fund and are paid by Western Asset for their services to the Fund. For its services, LMPFA pays Western Asset 70% of the net management fee it receives from the Fund. In turn Western Asset pays Western Singapore, Western Japan and Western Asset Limited a subadvisory fee of 0.30% on assets managed by each subadvisor.
All officers and one Director of the Fund are employees of Legg Mason or its affiliates and do not receive compensation from the Fund.
3. Investments
During the year ended August 31, 2011, the aggregate cost of purchases and proceeds from sales of investments (excluding short-term investments) and U.S. Government & Agency Obligations were as follows:
| Investments | | U.S. Government &
Agency Obligations | |
Purchases | $131,302,557 | | $203,222 | | |
Sales | 131,926,884 | | 204,583 | | |
52 | | Western Asset Global Partners Income Fund Inc. 2011 Annual Report | | |
Notes to financial statements (cont’d)
At August 31, 2011, the aggregate gross unrealized appreciation and depreciation of investments for federal income tax purposes were as follows:
Gross unrealized appreciation | | $ 17,981,611 | |
Gross unrealized depreciation | | (13,549,858 | ) |
Net unrealized appreciation | | $ 4,431,753 | |
At August 31, 2011, the Fund had the following open futures contracts:
| | Number of
Contracts | | Expiration
Date | | Basis
Value | | Market
Value | | Unrealized
Loss | |
Contracts to Sell: | | | | | | | | | | | |
U.S. Treasury 5-Year Notes | | 63 | | 12/11 | | $7,713,076 | | $7,720,453 | | $(7,377) | |
During the year ended August 31, 2011, written option transactions for the Fund were as follows:
| | Number of Contracts | | Premiums |
Written options, outstanding as of August 31, 2010 | | — | | | — | |
Options written | | 75,860,000 | | | $1,280,230 | |
Options closed | | (9,200,000 | ) | | (273,700 | ) |
Written options, outstanding as of August 31, 2011 | | 66,660,000 | | | $1,006,530 | |
Transactions in reverse repurchase agreements for the Fund during the year ended August 31, 2011 were as follows:
Average Daily
Balance* | Weighted Average
Interest Rate* | Maximum Amount
Outstanding |
$22,249,227 | 0.72% | $26,343,635 |
* Averages based on the number of days that the Fund had reverse repurchase agreements outstanding.
Interest rates on reverse repurchase agreements ranged from 0.00% to 0.85% during the year ended August 31, 2011. Interest expense incurred on reverse repurchase agreements totaled $160,540.
| | Western Asset Global Partners Income Fund Inc. 2011 Annual Report | | 53 |
At August 31, 2011, the Fund had the following open reverse repurchase agreements:
Counterparty | | Rate | | Effective
Date | | Maturity
Date | | Face Amount
of Reverse
Repurchase
Agreements | |
JPMorgan Chase & Co. | | 0.75% | | 11/23/2009 | | TBD | | | $ 989,625 | |
JPMorgan Chase & Co. | | 0.10% | | 1/24/2011 | | TBD | | | 1,686,720 | |
Credit Suisse | | 0.75% | | 2/2/2011 | | TBD | | | 4,494,187 | |
Credit Suisse | | 0.75% | | 3/15/2011 | | TBD | | | 461,000 | |
Credit Suisse | | 0.75% | | 3/15/2011 | | TBD | | | 3,595,867 | |
Credit Suisse | | 0.85% | | 3/15/2011 | | TBD | | | 772,685 | |
Credit Suisse | | 0.85% | | 3/15/2011 | | TBD | | | 1,257,960 | |
Credit Suisse | | 0.65% | | 5/26/2011 | | TBD | | | 1,397,640 | |
Credit Suisse | | 0.75% | | 5/31/2011 | | 9/2/2011 | | | 3,489,116 | |
Credit Suisse | | 0.85% | | 6/10/2011 | | TBD | | | 2,124,600 | |
| | | | | | | | | $20,269,400 | |
| | | | | | | | | | | |
TBD - To Be Determined
On August 31, 2011, the total market value of underlying collateral (refer to the Schedule of Investments for positions held at the counterparty as collateral for reverse repurchase agreements) for open reverse repurchase agreements was $24,572,223.
At August 31, 2011, the Fund had the following open forward foreign currency contracts:
Foreign Currency | | Counterparty | | Local
Currency | | Market
Value | | Settlement
Date | | Unrealized
Gain (Loss) | |
Contracts to Buy: | | | | | | | | | | | |
New Russian Ruble | | JPMorgan Chase Bank | | 59,871,849 | | $2,070,581 | | 9/15/11 | | | $ (64,649 | ) |
Contracts to Sell: | | | | | | | | | | | | |
Euro | | JPMorgan Chase Bank | | 2,627,240 | | 3,773,416 | | 9/15/11 | | | (55,897 | ) |
British Pound | | Citibank, N.A. | | 1,759,613 | | 2,853,977 | | 11/16/11 | | | 17,360 | |
British Pound | | UBS AG | | 596,646 | | 967,721 | | 11/16/11 | | | (5,175 | ) |
Euro | | BNP Paribas S.A. | | 1,607,030 | | 2,306,444 | | 11/16/11 | | | (15,864 | ) |
Euro | | Citibank, N.A. | | 266,373 | | 382,305 | | 11/16/11 | | | 682 | |
Euro | | Citibank, N.A. | | 2,005,654 | | 2,878,558 | | 11/16/11 | | | (22,356 | ) |
Euro | | UBS AG | | 200,000 | | 287,044 | | 11/16/11 | | | 396 | |
Euro | | UBS AG | | 6,963,049 | | 9,993,517 | | 11/16/11 | | | (163,573 | ) |
| | | | | | | | | | (244,427 | ) |
Net unrealized loss on open forward foreign currency contracts | | | | | | $(309,076 | ) |
| | | | | | | | | | | | | |
54 | | Western Asset Global Partners Income Fund Inc. 2011 Annual Report | | |
Notes to financial statements (cont’d)
At August 31, 2011, the Fund held the following interest rate swap contracts:
Swap Counterparty | | Notional
Amount | | Termination
Date | | Payments
Made
by the
Fund | | Payments
Received
by the
Fund† | | Upfront
Premiums
Paid
(Received) | | Unrealized
Appreciation | |
Credit Suisse First Boston Inc. | | $912,398 | | 1/2/12 | | BRL-CDI‡ | | 10.510% | | — | | $1,877* | |
† Percentage shown is an annual percentage rate.
‡ Based on the Overnight Brazilian Interbank Deposit Rate. As of August 31, 2011, the Brazilian CETIP Interbank Deposit (CDI) rate was 12.39%.
* Swap contract is valued in good faith at fair value in accordance with procedures approved by the Board of Directors (See Note 1).
4. Derivative instruments and hedging activities
Financial Accounting Standards Board Codification Topic 815 requires enhanced disclosure about an entity’s derivative and hedging activities.
Below is a table, grouped by derivative type, that provides information about the fair value and the location of derivatives within the Statement of Assets and Liabilities at August 31, 2011.
| | Interest Rate
Contracts Risk | | Foreign
Exchange
Contracts Risk | | Credit
Contracts Risk | | Total | |
Purchased options2 | | — | | | — | | | $11,239 | | | $11,239 | |
Forward foreign currency contracts | | — | | | $18,438 | | | — | | | 18,438 | |
Swap contracts3 | | $1,877 | | | — | | | — | | | 1,877 | |
Total | | $1,877 | | | $18,438 | | | $11,239 | | | $31,554 | |
| | Interest Rate
Contracts Risk | | Foreign
Exchange
Contracts Risk | | Credit
Contracts Risk | | Total | |
Written options | | — | | | — | | | $86,672 | | | $ 86,672 | |
Futures contracts4 | | $7,377 | | | — | | | — | | | 7,377 | |
Forward foreign currency contracts | | — | | | $327,514 | | | — | | | 327,514 | |
Total | | $7,377 | | | $327,514 | | | $86,672 | | | $421,563 | |
1 Generally, the balance sheet location for asset derivatives is receivables/net unrealized appreciation (depreciation) and for liability derivatives is payables/net unrealized appreciation (depreciation).
2 Market value of purchased options is reported in Investments at value in the Statement of Assets and Liabilities.
3 Values include premiums paid (received) on swap contracts which are shown separately in the Statement of Assets and Liabilities.
4 Includes cumulative appreciation (depreciation) of futures contracts as reported in the footnotes. Only variation margin is reported within the receivables and/or payables of the Statement of Assets and Liabilities.
| | Western Asset Global Partners Income Fund Inc. 2011 Annual Report | | 55 |
The following tables provide information about the effect of derivatives and hedging activities on the Fund’s Statement of Operations for the year ended August 31, 2011. The first table provides additional detail about the amounts and sources of gains (losses) realized on derivatives during the period. The second table provides additional information about the change in unrealized appreciation (depreciation) resulting from the Fund’s derivatives and hedging activities during the period.
AMOUNT OF REALIZED GAIN (LOSS) ON DERIVATIVES RECOGNIZED
| | Interest Rate
Contracts Risk | | Foreign
Exchange
Contracts Risk | | Credit
Contracts Risk | | Total | |
Written options | | — | | | — | | | $136,070 | | | $ 136,070 | |
Futures contracts | | $(597,286 | ) | | — | | | — | | | (597,286 | ) |
Forward foreign currency contracts | | — | | | $(707,862 | ) | | — | | | (707,862 | ) |
Total | | $(597,286 | ) | | $(707,862 | ) | | $136,070 | | | $(1,169,078 | ) |
CHANGE IN UNREALIZED APPRECIATION (DEPRECIATION) ON DERIVATIVES RECOGNIZED
| | Interest Rate
Contracts Risk | | Foreign
Exchange
Contracts Risk | | Credit
Contracts Risk | | Total | |
Purchased options | | — | | | — | | | $(382,151 | ) | | $(382,151 | ) |
Written options | | — | | | — | | | 919,858 | | | 919,858 | |
Futures contracts | | $ (730 | ) | | — | | | — | | | (730 | ) |
Swap contracts | | (1,748 | ) | | — | | | — | | | (1,748 | ) |
Forward foreign currency contracts | | — | | | $(553,824 | ) | | — | | | (553,824 | ) |
Total | | $(2,478 | ) | | $(553,824 | ) | | $ 537,707 | | | $ (18,595 | ) |
During the year ended August 31, 2011, the volume of derivative activity for the Fund was as follows:
| | Average Market
Value | |
Purchased options | | $ 61,727 | | |
Written options | | 263,080 | | |
Futures contracts (to buy) | | 1,447,538 | | |
Futures contracts (to sell) | | 7,528,354 | | |
Forward foreign currency contracts (to buy) | | 1,424,881 | | |
Forward foreign currency contracts (to sell) | | 15,534,155 | | |
| | Average
Notional Balance | |
Interest rate swap contracts | | $912,398 | | |
| | | | |
56 | | Western Asset Global Partners Income Fund Inc. 2011 Annual Report | | |
Notes to financial statements (cont’d)
5. Loan
The Fund has a revolving credit agreement with a financial institution, which allows the Fund to borrow up to an aggregate amount of $55,000,000. The interest on the loan is calculated at a variable rate based on the one month LIBOR plus any applicable margin. To the extent of the borrowing outstanding, the Fund is required to maintain collateral in a special custody account at the Fund’s custodian on behalf of the financial institution. Interest expense related to this loan for the period ended August 31, 2011 was $204,775. In addition, the Fund paid a commitment fee on the unused portion of the credit line. For the period ended August 31, 2011, the Fund incurred a commitment fee related to this loan, in the amount of $13,016.
Prior to January 13, 2011, the Fund had a $55,000,000 credit line available pursuant to an amended and restated revolving credit and security agreement, dated November 20, 2006, among the Fund, Panterra Funding LLC (the “Lender”) and Citibank N.A. (“Citibank”) as secondary lender, for which Citibank also acts as administrative agent. This Agreement was terminated by the Fund on January 12, 2011. The loan generally bears interest at a variable rate based on the weighted average interest rates of the commercial paper or LIBOR, plus any applicable margin. Interest expense related to this loan for the period ended January 12, 2011 was $114,807. In addition, the Fund paid a commitment fee on the total credit line available, whether used or unused. For the period ended January 12, 2011, the Fund incurred a commitment fee related to this loan, in the amount of $153,542. Securities held by the Fund are subject to a lien, granted to the lenders, to the extent of the borrowing outstanding and any additional expenses.
For the year ended August 31, 2011, the Fund had an average daily loan balance outstanding of $34,084,932 and the weighted average interest rate was 0.94%. At August 31, 2011, the Fund had $39,000,000 of borrowings outstanding per the current credit agreement.
6. Distributions subsequent to August 31, 2011
On August 11, 2011, the Fund’s Board of Directors declared three distributions, each in the amount of $0.095 per share, payable on September 30, 2011, October 28, 2011 and November 25, 2011 to shareholders of record on September 23, 2011, October 21, 2011 and November 18, 2011, respectively.
7. Important tax information and distributions to shareholders
The tax character of distributions paid during the fiscal years ended August 31, were as follows:
| | 2011 | | 2010 | |
| | | | | |
Distributions Paid From: | | | | | |
Ordinary Income | | $17,586,264 | | $17,501,221 | |
| | Western Asset Global Partners Income Fund Inc. 2011 Annual Report | | 57 |
As of August 31, 2011, the components of accumulated earnings on a tax basis were as follows:
Undistributed ordinary income — net | | $ 1,874,178 | |
Capital loss carryforward* | | (33,677,985 | ) |
Other book/tax temporary differences(a) | | 180,363 | |
Unrealized appreciation (depreciation)(b) | | 4,979,024 | |
Total accumulated earnings (losses) — net | | $(26,644,420 | ) |
* During the taxable year ended August 31, 2011, the Fund utilized $ 2,138,146 of its capital loss carryover available from prior years. As of August 31, 2011, the Fund had the following net capital loss carryforwards remaining:
Year of Expiration | | Amount | |
8/31/2017 | | $ (6,744,988 | ) |
8/31/2018 | | (26,932,997 | ) |
| | $(33,677,985 | ) |
These amounts will be available to offset future taxable capital gains. Under the recently enacted Regulated Investment Company Modernization Act of 2010, the Fund will be permitted to carry forward capital losses incurred in taxable years beginning after December 22, 2010 for an unlimited period. However, any losses incurred during those future years will be required to be utilized prior to the losses incurred in pre-enactment taxable years. As a result of this ordering rule, pre-enactment capital loss carryforwards may be more likely to expire unused. Additionally, post-enactment capital losses that are carried forward will retain their character as either short-term or long-term capital losses rather than being considered all short-term as under previous law.
(a) Other book/tax temporary differences are attributable primarily to the realization for tax purposes of unrealized losses on certain futures and foreign currency contracts, differences between book/tax accrual of interest income on securities in default and book/tax differences in the timing of the deductibility of various expenses.
(b) The difference between book-basis and tax-basis unrealized appreciation (depreciation) is attributable primarily to the tax deferral of losses on wash sales and the difference between book and tax amortization methods for premiums on fixed income securities.
8. Other tax information
On December 22, 2010, President Obama signed into law the Regulated Investment Company Modernization Act of 2010 (the “Act”). The Act updates certain tax rules applicable to regulated investment companies (“RICs”). The various provisions of the Act will generally be effective for RICs with taxable years beginning after December 22, 2010. Additional information regarding the impact of the Act on the Fund, if any, will be contained within the relevant sections of the notes to the financial statements for the fiscal year ending August 31, 2012.
58 | | Western Asset Global Partners Income Fund Inc. 2011 Annual Report | | |
Report of independent registered public accounting firm
The Board of Directors and Shareholders
Western Asset Global Partners Income Fund Inc.:
We have audited the accompanying statement of assets and liabilities of Western Asset Global Partners Income Fund Inc., including the schedule of investments, as of August 31, 2011, and the related statement of operations for the year then ended, the statements of changes in net assets for each of the years in the two-year period then ended, the statement of cash flows for the year then ended, and the financial highlights for each of the years in the five-year period then ended. These financial statements and financial highlights are the responsibility of the Fund’s management. Our responsibility is to express an opinion on these financial statements and financial highlights based on our audits.
We conducted our audits in accordance with the standards of the Public Company Accounting Oversight Board (United States). Those standards require that we plan and perform the audit to obtain reasonable assurance about whether the financial statements and financial highlights are free of material misstatement. An audit includes examining, on a test basis, evidence supporting the amounts and disclosures in the financial statements. Our procedures included confirmation of securities owned as of August 31, 2011, by correspondence with the custodian and brokers or by other appropriate auditing procedures. An audit also includes assessing the accounting principles used and significant estimates made by management, as well as evaluating the overall financial statement presentation. We believe that our audits provide a reasonable basis for our opinion.
In our opinion, the financial statements and financial highlights referred to above present fairly, in all material respects, the financial position of Western Asset Global Partners Income Fund Inc. as of August 31, 2011, the results of its operations for the year then ended, the changes in its net assets for each of the years in the two-year period then ended, its cash flows for the year then ended, and the financial highlights for each of the years in the five-year period then ended, in conformity with U.S. generally accepted accounting principles.
New York, New York
October 17, 2011
| | Western Asset Global Partners Income Fund Inc. | | 59 |
Additional information (unaudited)
Information about Directors and Officers
The business and affairs of Western Asset Global Partners Income Fund Inc. (the “Fund”) are conducted by management under the supervision and subject to the direction of its Board of Directors. The business address of each Director is c/o R. Jay Gerken, 620 Eighth Avenue, New York, New York 10018. Information pertaining to the Directors and officers of the Fund is set forth below.
Independent Directors†:
Carol L. Colman | | |
Year of birth | | 1946 |
Position(s) held with Fund1 | | Director and Member of the Nominating and Audit Committees, Class II |
Term of office1 and length of time served | | Since 2003 |
Principal occupation(s) during past five years | | President, Colman Consulting Company (consulting) |
Number of portfolios in fund complex overseen by Director (including the Fund) | | 25 |
Other board memberships held by Director | | None |
| | |
Daniel P. Cronin | | |
Year of birth | | 1946 |
Position(s) held with Fund1 | | Director and Member of the Nominating and Audit Committees, Class I |
Term of office1 and length of time served | | Since 2003 |
Principal occupation(s) during past five years | | Retired; formerly, Associate General Counsel, Pfizer Inc. (prior to and including 2004) |
Number of portfolios in fund complex overseen by Director (including the Fund) | | 25 |
Other board memberships held by Director | | None |
| | |
Paolo M. Cucchi | | |
Year of birth | | 1941 |
Position(s) held with Fund1 | | Director and Member of the Nominating and Audit Committees, Class II |
Term of office1 and length of time served | | Since 2007 |
Principal occupation(s) during past five years | | Professor of French and Italian at Drew University; formerly, Vice President and Dean of College of Liberal Arts at Drew University (1984 to 2009) |
Number of portfolios in fund complex overseen by Director (including the Fund) | | 25 |
Other board memberships held by Director | | None |
60 | | Western Asset Global Partners Income Fund Inc. | | |
Additional information (unaudited) (cont’d)
Information about Directors and Officers
Independent Directors cont’d
Leslie H. Gelb | | |
Year of birth | | 1937 |
Position(s) held with Fund1 | | Director and Member of the Nominating and Audit Committees, Class II |
Term of office1 and length of time served | | Since 1994 |
Principal occupation(s) during past five years | | President Emeritus and Senior Board Fellow (since 2003), The Council on Foreign Relations; formerly, President, (prior to 2003), the Council on Foreign Relations; formerly, Columnist, Deputy Editorial Page Editor and Editor, Op-Ed Page, The New York Times |
Number of portfolios in fund complex overseen by Director (including the Fund) | | 25 |
Other board memberships held by Director | | Director of two registered investment companies advised by Blackstone Asia Advisors LLC: India Fund, Inc. and Asia Tigers Fund, Inc. (since 1994) |
| | |
William R. Hutchinson | | |
Year of birth | | 1942 |
Position(s) held with Fund1 | | Director and Member of the Nominating and Audit Committees, Class III |
Term of office1 and length of time served | | Since 2003 |
Principal occupation(s) during past five years | | President, W.R. Hutchinson & Associates Inc. (Consulting) (since 2001) |
Number of portfolios in fund complex overseen by Director (including the Fund) | | 25 |
Other board memberships held by Director | | Director (Non-Executive Chairman of the Board (since December 1, 2009)), Associated Banc Corp. (banking) (since 1994) |
| | |
Riordan Roett | | |
Year of birth | | 1938 |
Position(s) held with Fund1 | | Director and Member of the Nominating and Audit Committees, Class I |
Term of office1 and length of time served | | Since 1995 |
Principal occupation(s) during past five years | | The Sarita and Don Johnston Professor of Political Science and Director of Western Hemisphere Studies, Paul H. Nitze School of Advanced International Studies, The John Hopkins University (since 1973) |
Number of portfolios in fund complex overseen by Director (including the Fund) | | 25 |
Other board memberships held by Director | | None |
| | Western Asset Global Partners Income Fund Inc. | | 61 |
Independent Directors cont’d
Jeswald W. Salacuse | | |
Year of birth | | 1938 |
Position(s) held with Fund1 | | Director and Member of the Nominating and Audit Committees, Class III |
Term of office1 and length of time served | | Since 1992 |
Principal occupation(s) during past five years | | Henry J. Braker Professor of Commercial Law, The Fletcher School of Law and Diplomacy, Tufts University (since 1986); President and Member, Arbitration Tribunal, World Bank/ICSID (since 2004) |
Number of portfolios in fund complex overseen by Director (including the Fund) | | 25 |
Other board memberships held by Director | | Director of two registered investment companies advised by Blackstone Asia Advisors LLC; India Fund, Inc. and Asia Tigers Fund, Inc. (since 1993) |
Interested Director and Officer:
R. Jay Gerken2 | | |
Year of birth | | 1951 |
Position(s) held with Fund1 | | Director, Chairman, President and Chief Executive Officer, Class III |
Term of office1 and length of time served | | Since 2002 |
Principal occupation(s) during past five years | | Managing Director of Legg Mason & Co., LLC (“Legg Mason & Co.”) (since 2005); Officer and Trustee/Director of 159 funds associated with Legg Mason Partners Fund Advisor, LLC (“LMPFA”) or its affiliates (since 2006) and Legg Mason & Co. predecessors (prior to 2006); President and Chief Executive Officer (“CEO”) of LMPFA (since 2006); President and CEO of Smith Barney Fund Management LLC (“SBFM”) and Citi Fund Management Inc. (“CFM”) (formerly registered investment advisers) (since 2002); formerly, Chairman, President and CEO, Travelers Investment Adviser Inc. (prior to 2005) |
Number of portfolios in fund complex overseen by Director (including the Fund) | | 159 |
Other board memberships held by Director | | Former Trustee, Consulting Group Capital Markets Funds (11 funds) (prior to 2006) |
62 | | Western Asset Global Partners Income Fund Inc. | | |
Additional information (unaudited) (cont’d)
Information about Directors and Officers
Additional Officers:
Ted P. Becker | | |
Legg Mason | | |
620 Eighth Avenue, New York, NY 10018 | | |
Year of birth | | 1951 |
Position(s) held with Fund1 | | Chief Compliance Officer |
Term of office1 and length of time served | | Since 2006 |
Principal occupation(s) during past five years | | Director of Global Compliance at Legg Mason (since 2006); Chief Compliance Officer of LMPFA (since 2006); Managing Director of Compliance of Legg Mason & Co. (since 2005); Chief Compliance Officer of certain mutual funds associated with Legg Mason & Co. or its affiliates (since 2006) and Legg Mason & Co. predecessors (prior to 2006) |
| | |
Vanessa A. Williams | | |
Legg Mason | | |
100 First Stamford Place, Stamford, CT 06902 | | |
Year of birth | | 1979 |
Position(s) with Fund1 | | Identity Theft Prevention Officer |
Term of office1 and length of time served | | Since 2011 |
Principal occupation(s) during past five years | | Identity Theft Prevention Officer of certain mutual funds associated with Legg Mason & Co. or its affiliates (since 2011); Chief Anti-Money Laundering Compliance Officer of certain mutual funds associated with Legg Mason & Co. or its affiliates (since 2011); formerly, Assistant Vice President and Senior Compliance Officer of Legg Mason & Co. (2008 to 2011); formerly, Compliance Analyst of Legg Mason & Co. (2006 to 2008) and Legg Mason & Co. predecessors (prior to 2006) |
| | |
Robert I. Frenkel | | |
Legg Mason | | |
100 First Stamford Place, Stamford, CT 06902 | | |
Year of birth | | 1954 |
Position(s) held with Fund1 | | Secretary and Chief Legal Officer |
Term of office1 and length of time served | | Since 2003 |
Principal occupation(s) during past five years | | Vice President and Deputy General Counsel of Legg Mason (since 2006); Managing Director and General Counsel of Global Mutual Funds for Legg Mason & Co. (since 2006) and Legg Mason & Co. predecessors (since 1994); Secretary and Chief Legal Officer of certain mutual funds associated with Legg Mason & Co. or its affiliates (since 2006) and Legg Mason & Co. predecessors (prior to 2006) |
| | Western Asset Global Partners Income Fund Inc. | | 63 |
Additional Officers cont’d
Thomas C. Mandia | | |
Legg Mason | | |
100 First Stamford Place, Stamford, CT 06902 | | |
Year of birth | | 1962 |
Position(s) held with Fund1 | | Assistant Secretary |
Term of office1 and length of time served | | Since 2006 |
Principal occupation(s) during past five years | | Managing Director and Deputy General Counsel of Legg Mason & Co. (since 2005) and Legg Mason & Co. predecessors (prior to 2005); Secretary of LMPFA (since 2006); Assistant Secretary of certain mutual funds associated with Legg Mason & Co. or its affiliates (since 2006) and Legg Mason & Co. predecessors (prior to 2006); Secretary of SBFM and CFM (since 2002) |
| | |
Kaprel Ozsolak | | |
Legg Mason | | |
55 Water Street, New York, NY 10041 | | |
Year of birth | | 1965 |
Position(s) held with Fund1 | | Chief Financial Officer |
Term of office1 and length of time served | | Since 2007 |
Principal occupation(s) during past five years | | Director of Legg Mason & Co. (since 2005); Chief Financial Officer of certain mutual funds associated with Legg Mason & Co. or its affiliates (since 2007) and Legg Mason & Co. predecessors (prior to 2007); formerly, Treasurer of certain mutual funds associated with Legg Mason & Co. or its affiliates (prior to 2010) and Legg Mason & Co. predecessors (prior to 2005); formerly, Controller of certain mutual funds associated with Legg Mason & Co. predecessors (prior to 2004) |
| | |
Steven Frank | | |
Legg Mason | | |
55 Water Street, New York, NY 10041 | | |
Year of birth | | 1967 |
Position(s) held with Fund1 | | Treasurer |
Term of office1 and length of time served | | Since 2010 |
Principal occupation(s) during past five years | | Vice President of Legg Mason & Co. and Legg Mason & Co. predecessors (since 2002); Treasurer of certain mutual funds associated with Legg Mason & Co. or its affiliates (since 2010); formerly, Controller of certain mutual funds associated with Legg Mason & Co. or its affiliates (prior to 2010); formerly, Assistant Controller of certain mutual funds associated with Legg Mason & Co. predecessors (prior to 2005) |
64 | | Western Asset Global Partners Income Fund Inc. | | |
Additional information (unaudited) (cont’d)
Information about Directors and Officers
Additional Officers cont’d
Jeanne M. Kelly | | |
Legg Mason | | |
620 Eighth Avenue, New York, NY 10018 | | |
Year of birth | | 1951 |
Position(s) with Fund1 | | Senior Vice President |
Term of office1 and length of time served | | Since 2007 |
Principal occupation(s) during past five years | | Senior Vice President of certain mutual funds associated with Legg Mason & Co. or its affiliates (since 2007); Senior Vice President of LMPFA (since 2006); Managing Director of Legg Mason & Co. (since 2005) and Legg Mason & Co. predecessors (prior to 2005) |
† Directors who are not “interested persons” of the Fund within the meaning of Section 2(a)(19) of the 1940 Act.
1 The Fund’s Board of Directors is divided into three classes: Class I, Class II and Class III. The terms of office of the Class I, II and III Directors expire at the Annual Meetings of Stockholders in the year 2013, year 2011 and year 2012, respectively, or thereafter in each case when their respective successors are duly elected and qualified. The Fund’s executive officers are chosen each year at the first meeting of the Fund’s Board of Directors following the Annual Meeting of Stockholders, to hold office until the meeting of the Board following the next Annual Meeting of Stockholders and until their successors are duly elected and qualified.
2 Mr. Gerken is an “interested person” of the Fund as defined in the 1940 Act because Mr. Gerken is an officer of LMPFA and certain of its affiliates.
| | Western Asset Global Partners Income Fund Inc. | | 65 |
Annual chief executive officer and
chief financial officer certifications (unaudited)
The Fund’s Chief Executive Officer (“CEO”) has submitted to the NYSE the required annual certification and the Fund also has included the certifications of the Fund’s CEO and Chief Financial Officer required by Section 302 of the Sarbanes-Oxley Act in the Fund’s Form N-CSR filed with the SEC for the period of this report.
66 | | Western Asset Global Partners Income Fund Inc. | | |
Other shareholder communications regarding accounting matters (unaudited)
The Fund’s Audit Committee has established guidelines and procedures regarding the receipt, retention and treatment of complaints regarding accounting, internal accounting controls or auditing matters (collectively, “Accounting Matters”). Persons with complaints or concerns regarding Accounting Matters may submit their complaints to the Chief Compliance Officer (“CCO”). Persons who are uncomfortable submitting complaints to the CCO, including complaints involving the CCO, may submit complaints directly to the Fund’s Audit Committee Chair (together with the CCO, “Complaint Officers”). Complaints may be submitted on an anonymous basis.
The CCO may be contacted at:
Legg Mason & Co., LLC
Compliance Department
620 Eighth Avenue, 49th Floor
New York, New York 10018
Complaints may also be submitted by telephone at 1-800-742-5274. Complaints submitted through this number will be received by the CCO.
| | Western Asset Global Partners Income Fund Inc. | | 67 |
Dividend reinvestment and cash purchase plan (unaudited)
1. Each shareholder initially purchasing shares of common stock (“Shares”) of Western Asset Global Partners Income Fund Inc. (“Fund”), on or after September 6, 1996 will be deemed to have elected to be a participant in the Amended and Restated Dividend Reinvestment and Cash Purchase Plan (“Plan”), unless the shareholder specifically elects in writing (addressed to the Agent at the address below or to any nominee who holds Shares for the shareholder in its name) to receive all distributions in cash, paid by check, mailed directly to the record holder by or under the direction of American Stock Transfer & Trust Company as the Fund’s dividend-paying agent (“Agent”). A shareholder whose Shares are held in the name of a broker or nominee who does not provide an automatic reinvestment service may be required to take such Shares out of “street name” and register such Shares in the shareholder’s name in order to participate, otherwise distributions will be paid in cash to such shareholder by the broker or nominee. Each participant in the Plan is referred to herein as a “Participant.” The Agent will act as agent for each Participant, and will open accounts for each Participant under the Plan in the same name as their Shares are registered.
2. Unless the Fund declares a distribution payable only in the form of cash, the Agent will apply all distributions in the manner set forth below.
3. If, on the determination date, the market price per Share equals or exceeds the net asset value per Share on that date (such condition, a “market premium”), the Agent will receive the distribution in newly issued Shares of the Fund on behalf of Participants. If, on the determination date, the net asset value per Share exceeds the market price per Share (such condition, a “market discount”), the Agent will purchase Shares in the open-market. The determination date will be the fourth New York Stock Exchange (“NYSE”) trading day (a NYSE trading day being referred to herein as a “Trading Day”) preceding the payment date for the distribution. For purposes herein, “market price” will mean the average of the highest and lowest prices at which the Shares sell on the NYSE on the particular date, or if there is no sale on that date, the average of the closing bid and asked quotations.
4. Purchases made by the Agent will be made as soon as practicable commencing on the Trading Day following the determination date and terminating no later than 30 days after the distribution payment date except where temporary curtailment or suspension of purchase is necessary to comply with applicable provisions of federal securities law; provided, however, that such purchases will, in any event, terminate on the Trading Day prior to the “ex-dividend” date next succeeding the distribution payment date.
5. If (i) the Agent has not invested the full distribution amount in open-market purchases by the date specified in paragraph 4 above as the date on which such purchases must terminate or (ii) a market discount shifts to a market premium during the purchase period, then the Agent will cease making
68 | | Western Asset Global Partners Income Fund Inc. | | |
Dividend reinvestment and cash purchase plan (unaudited) (cont’d)
open-market purchases and will receive the uninvested portion of the distribution amount in newly issued Shares (x) in the case of (i) above, at the close of business on the date the Agent is required to terminate making open-market purchases as specified in paragraph 4 above or (y) in the case of (ii) above, at the close of business on the date such shift occurs; but in no event prior to the payment date for the distribution.
6. In the event that all or part of a distribution amount is to be paid in newly issued Shares, such Shares will be issued to Participants in accordance with the following formula: (i) if, on the valuation date, the net asset value per Share is less than or equal to the market price per Share, then the newly issued Shares will be valued at net asset value per Share on the valuation date; provided, however, that if the net asset value is less than 95% of the market price on the valuation date, then such Shares will be issued at 95% of the market price and (ii) if, on the valuation date, the net asset value per Share is greater than the market price per Share, then the newly issued Shares will be issued at the market price on the valuation date. The valuation date will be the distribution payment date, except that with respect to Shares issued pursuant to paragraph 5 above, the valuation date will be the date such Shares are issued. If a date that would otherwise be a valuation date is not a Trading Day, the valuation date will be the next preceding Trading Day.
7. Participants have the option of making additional cash payments to the Agent, monthly, in a minimum amount of $250, for investment in Shares. The Agent will use all such funds received from Participants to purchase Shares in the open market on or about the first business day of each month. To avoid unnecessary cash accumulations, and also to allow ample time for receipt and processing by the Agent, Participants should send in voluntary cash payments to be received by the Agent approximately 10 days before an applicable purchase date specified above. A Participant may withdraw a voluntary cash payment by written notice, if the notice is received by the Agent not less than 48 hours before such payment is to be invested.
8. Purchases by the Agent pursuant to paragraphs 4 and 7 above may be made on any securities exchange on which the Shares of the Fund are traded, in the over-the-counter market or in negotiated transactions, and may be on such terms as to price, delivery and otherwise as the Agent shall determine. Funds held by the Agent uninvested will not bear interest, and it is understood that, in any event, the Agent shall have no liability in connection with any inability to purchase Shares within the time periods herein provided, or with the timing of any purchases effected. The Agent shall have no responsibility as to the value of the Shares acquired for the Participant’s account. The Agent may commingle amounts of all Participants to be used for open-market purchases of Shares and the price per Share allocable to each Participant in connection with such purchases shall be the average price (including brokerage commissions) of all Shares purchased by the Agent.
| | Western Asset Global Partners Income Fund Inc. | | 69 |
9. The Agent will maintain all Participants’ accounts in the Plan and will furnish written confirmations of all transactions in each account, including information needed by Participants for personal and tax records. The Agent will hold Shares acquired pursuant to the Plan in noncertificated form in the Participant’s name or that of its nominee, and each Participant’s proxy will include those Shares purchased pursuant to the Plan. The Agent will forward to Participants any proxy solicitation material and will vote any Shares so held for Participants only in accordance with the proxy returned by Participants to the Fund. Upon written request, the Agent will deliver to Participants, without charge, a certificate or certificates for the full Shares.
10. The Agent will confirm to Participants each acquisition made for their respective accounts as soon as practicable but not later than 60 days after the date thereof. Although Participants may from time to time have an undivided fractional interest (computed to three decimal places) in a Share of the Fund, no certificates for fractional shares will be issued. Distributions on fractional shares will be credited to each Participant’s account. In the event of termination of a Participant’s account under the Plan, the Agent will adjust for any such undivided fractional interest in cash at the market value of the Fund’s Shares at the time of termination less the pro rata expense of any sale required to make such an adjustment.
11. Any share dividends or split shares distributed by the Fund on Shares held by the Agent for Participants will be credited to their respective accounts. In the event that the Fund makes available to Participants rights to purchase additional Shares or other securities, the Shares held for Participants under the Plan will be added to other Shares held by the Participants in calculating the number of rights to be issued to Participants.
12. The Agent’s service fee for handling distributions will be paid by the Fund. Participants will be charged a pro rata share of brokerage commissions on all open-market purchases.
13. Participants may terminate their accounts under the Plan by notifying the Agent in writing. Such termination will be effective immediately if notice is received by the Agent not less than 10 days prior to any distribution record date; otherwise such termination will be effective on the first Trading Day after the payment date for such distribution with respect to any subsequent distribution. The Plan may be amended or terminated by the Fund as applied to any voluntary cash payments made and any distribution paid subsequent to written notice of the change or termination sent to Participants at least 30 days prior to the record date for the distribution. The Plan may be amended or terminated by the Agent, with the Fund’s prior written consent, on at least 30 days’ written notice to Participants. Notwithstanding the preceding two sentences, the Agent or the Fund may amend or supplement the Plan at any time or times when necessary or appropriate to comply with applicable law or rules or policies of the Securities and Exchange Commission
70 | | Western Asset Global Partners Income Fund Inc. | | |
Dividend reinvestment and cash purchase plan (unaudited) (cont’d)
or any other regulatory authority. Upon any termination, the Agent will cause a certificate or certificates for the full Shares held by each Participant under the Plan and cash adjustment for any fraction to be delivered to each Participant without charge.
14. Any amendment or supplement shall be deemed to be accepted by each Participant unless, prior to the effective date thereof, the Agent receives written notice of the termination of the Participant’s account under the Plan. Any such amendment may include an appointment by the Agent in its place and stead of a successor Agent under these terms and conditions, with full power and authority to perform all or any of the acts to be performed by the Agent under these terms and conditions. Upon any such appointment of an Agent for the purpose of receiving distributions, the Fund will be authorized to pay to such successor Agent, for each Participant’s account, all distributions payable on Shares of the Fund held in each Participant’s name or under the Plan for retention or application by such successor Agent as provided in these terms and conditions.
15. In the case of Participants, such as banks, broker-dealers or other nominees, which hold Shares for others who are beneficial owners (“Nominee Holders”), the Agent will administer the Plan on the basis of the number of Shares certified from time to time by each Nominee Holder as representing the total amount registered in the Nominee Holder’s name and held for the account of beneficial owners who are to participate in the Plan.
16. The Agent shall at all times act in good faith and use its best efforts within reasonable limits to insure the accuracy of all services performed under this Agreement and to comply with applicable law, but assumes no responsibility and shall not be liable for loss or damage due to errors unless such error is caused by its negligence, bad faith, or willful misconduct or that of its employees.
17. All correspondence concerning the Plan should be directed to the Agent at 59 Maiden Lane, New York, New York 10038.
| | Western Asset Global Partners Income Fund Inc. | | 71 |
Important tax information (unaudited)
The following information is provided with respect to the distributions paid during the taxable year ended August 31, 2011:
Record date: | | Monthly | | 11/26/10 | | 12/30/10 | | Monthly | |
Payable date: | | September 2010 -
October 2010 | | 11/30/10 | | 12/31/10 | | January 2011 -
August 2011 | |
Ordinary Income: | | | | | | | | | |
Qualified dividend income for individuals | | 0.40% | | 0.34% | | 0.31% | | 0.47% | |
Dividends qualifying for the dividends received deduction for corporations | | 0.40% | | 0.34% | | 0.31% | | 0.47% | |
Please retain this information for your records.
Western Asset
Global Partners Income Fund Inc.
Directors | Western Asset Global Partners Income Fund Inc. | Independent registered public accounting firm |
Carol L. Colman | 620 Eighth Avenue | KPMG LLP |
Daniel P. Cronin | 49th Floor | 345 Park Avenue |
Paolo M. Cucchi | New York, NY 10018 | New York, NY 10154 |
Leslie H. Gelb | | |
R. Jay Gerken | Investment manager | Legal counsel |
Chairman | Legg Mason Partners Fund | Simpson Thacher & Bartlett LLP |
William R. Hutchinson | Advisor, LLC | 425 Lexington Avenue |
Riordan Roett | | New York, NY 10017 |
Jeswald W. Salacuse | Subadvisers | |
| Western Asset Management Company | New York Stock Exchange Symbol |
Officers | Western Asset Management Company Limited | GDF |
R. Jay Gerken | Western Asset Management Company Ltd | |
President and | Western Asset Management Company Pte. Ltd. | |
Chief Executive Officer | | |
Kaprel Ozsolak | Custodian | |
Chief Financial Officer | State Street Bank and Trust Company | |
Ted P. Becker | 1 Lincoln Street | |
Chief Compliance Officer | Boston, MA 02111 | |
Vanessa A. Williams | | |
Identity Theft Protection | Transfer agent | |
Officer | American Stock Transfer & Trust Company | |
Robert I. Frenkel | 59 Maiden Lane | |
Secretary and | New York, NY 10038 | |
Chief Legal Officer | | |
Thomas Mandia | | |
Assistant Secretary | | |
Steven Frank | | |
Treasurer | | |
Jeanne M. Kelly | | |
Senior Vice President | | |
Legg Mason Funds Privacy and
Security Notice
Your Privacy and the Security of Your Personal Information is Very Important to the Legg Mason Funds
This Privacy and Security Notice (the “Privacy Notice”) addresses the Legg Mason Funds’ privacy and data protection practices with respect to nonpublic personal information the Funds receive. The Legg Mason Funds include any funds sold by the Funds’ distributor, Legg Mason Investor Services, LLC, as well as Legg Mason-sponsored closed-end funds. The provisions of this Privacy Notice apply to your information both while you are a shareholder and after you are no longer invested with the Funds.
The Type of Nonpublic Personal Information the Funds Collect About You
The Funds collect and maintain nonpublic personal information about you in connection with your shareholder account. Such information may include, but is not limited to:
· Personal information included on applications or other forms;
· Account balances, transactions, and mutual fund holdings and positions;
· Online account access user IDs, passwords, security challenge question responses; and
· Information received from consumer reporting agencies regarding credit history and creditworthiness (such as the amount of an individual’s total debt, payment history, etc.).
How the Funds Use Nonpublic Personal Information About You
The Funds do not sell or share your nonpublic personal information with third parties or with affiliates for their marketing purposes, or with other financial institutions or affiliates for joint marketing purposes, unless you have authorized the Funds to do so. The Funds do not disclose any nonpublic personal information about you except as may be required to perform transactions or services you have authorized or as permitted or required by law. The Funds may disclose information about you to:
· Employees, agents, and affiliates on a “need to know” basis to enable the Funds to conduct ordinary business or comply with obligations to government regulators;
· Service providers, including the Funds’ affiliates, who assist the Funds as part of the ordinary course of business (such as printing, mailing services, or processing or servicing your account with us) or otherwise perform services on the Funds’ behalf, including companies that may perform marketing services solely for the Funds;
· The Funds’ representatives such as legal counsel, accountants and auditors; and
· Fiduciaries or representatives acting on your behalf, such as an IRA custodian or trustee of a grantor trust.
| | | | |
| | NOT PART OF THE ANNUAL REPORT | | |
| | | | |
Legg Mason Funds Privacy and
Security Notice (cont’d)
Except as otherwise permitted by applicable law, companies acting on the Funds’ behalf are contractually obligated to keep nonpublic personal information the Funds provide to them confidential and to use the information the Funds share only to provide the services the Funds ask them to perform.
The Funds may disclose nonpublic personal information about you when necessary to enforce their rights or protect against fraud, or as permitted or required by applicable law, such as in connection with a law enforcement or regulatory request, subpoena, or similar legal process. In the event of a corporate action or in the event a Fund service provider changes, the Funds may be required to disclose your nonpublic personal information to third parties. While it is the Funds’ practice to obtain protections for disclosed information in these types of transactions, the Funds cannot guarantee their privacy policy will remain unchanged.
Keeping You Informed of the Funds’ Privacy and Security Practices
The Funds will notify you annually of their privacy policy as required by federal law. While the Funds reserve the right to modify this policy at any time they will notify you promptly if this privacy policy changes.
The Funds’ Security Practices
The Funds maintain appropriate physical, electronic and procedural safeguards designed to guard your nonpublic personal information. The Funds’ internal data security policies restrict access to your nonpublic personal information to authorized employees, who may use your nonpublic personal information for Fund business purposes only.
Although the Funds strive to protect your nonpublic personal information, they cannot ensure or warrant the security of any information you provide or transmit to them, and you do so at your own risk. In the event of a breach of the confidentiality or security of your nonpublic personal information, the Funds will attempt to notify you as necessary so you can take appropriate protective steps. If you have consented to the Funds using electronic communications or electronic delivery of statements, they may notify you under such circumstances using the most current email address you have on record with them.
In order for the Funds to provide effective service to you, keeping your account information accurate is very important. If you believe that your account information is incomplete, not accurate or not current, or if you have questions about the Funds’ privacy practices, write the Funds using the contact information on your account statements, email the Funds by clicking on the Contact Us section of the Funds’ website at www.leggmason.com, or contact the Fund at 1-888-777-0102.
Revised April 2011
| | | | |
| | NOT PART OF THE ANNUAL REPORT | | |
| | | | |
Western Asset Global Partners Income Fund Inc.
Western Asset Global Partners Income Fund Inc.
620 Eighth Avenue
49th Floor
New York, NY 10018
Notice is hereby given in accordance with Section 23(c) of the Investment Company Act of 1940, as amended, that from time to time the Fund may purchase, at market prices, shares of its common stock in the open market.
The Fund files its complete schedule of portfolio holdings with the Securities and Exchange Commission (“SEC”) for the first and third quarters of each fiscal year on Form N-Q. The Fund’s Forms N-Q are available on the SEC’s website at www.sec.gov. The Fund’s Forms N-Q may be reviewed and copied at the SEC’s Public Reference Room in Washington, D.C., and information on the operation of the Public Reference Room may be obtained by calling 1-800-SEC-0330. To obtain information on Form N-Q from the Fund, shareholders can call 1-888-777-0102.
Information on how the Fund voted proxies relating to portfolio securities during the prior 12-month period ended June 30th of each year and a description of the policies and procedures that the Fund uses to determine how to vote proxies related to portfolio transactions are available (1) without charge, upon request, by calling 1-888-777-0102, (2) on the Fund’s website at www.leggmason.com/cef and (3) on the SEC’s website at www.sec.gov.
This report is transmitted to the shareholders of Western Asset Global Partners Income Fund Inc. for their information. This is not a prospectus, circular or representation intended for use in the purchase of shares of the Fund or any securities mentioned in this report.
American Stock
Transfer & Trust Company
59 Maiden Lane
New York, NY 10038
WASX010340 10/11 SR11-1498
ITEM 2. CODE OF ETHICS.
The registrant has adopted a code of ethics that applies to the registrant’s principal executive officer, principal financial officer, principal accounting officer or controller.
ITEM 3. AUDIT COMMITTEE FINANCIAL EXPERT.
The Board of Trustees of the registrant has determined that William R. Hutchinson, a member of the Board’s Audit Committee, possesses the technical attributes identified in Instruction 2(b) of Item 3 to Form N-CSR to qualify as an “audit committee financial expert,” and has designated Mr. Hutchinson as the Audit Committee’s financial expert. Mr. Hutchinson is an “independent” Trustee pursuant to paragraph (a)(2) of Item 3 to Form N-CSR.
ITEM 4. PRINCIPAL ACCOUNTANT FEES AND SERVICES.
a) Audit Fees. The aggregate fees billed in the last two fiscal years ending August 31, 2010 and August 31, 2011 (the “Reporting Periods”) for professional services rendered by the Registrant’s principal accountant (the “Auditor”) for the audit of the Registrant’s annual financial statements, or services that are normally provided by the Auditor in connection with the statutory and regulatory filings or engagements for the Reporting Periods, were $64,300 in 2010 and $82,400 in 2011.
b) Audit-Related Fees. The aggregate fees billed in the Reporting Period for assurance and related services by the Auditor that are reasonably related to the performance of the Registrant’s financial statements were $14,200 in 2010 and $0 in 2011. These services consisted of procedures performed in connection with the agreed upon procedures performed in connection with the fund’s Revolving Credit and Security Agreement for the Western Asset Global Partners Income Fund Inc.
In addition, there were no Audit-Related Fees billed in the Reporting Period for assurance and related services by the Auditor to the Registrant’s investment adviser (not including any sub-adviser whose role is primarily portfolio management and is subcontracted with or overseen by another investment adviser), and any entity controlling, controlled by or under common control with the investment adviser that provides ongoing services to the Western Asset Global Partners Income Fund Inc. (“service affiliates”), that were reasonably related to the performance of the annual audit of the service affiliates. Accordingly, there were no such fees that required pre-approval by the Audit Committee for the Reporting Periods.
(c) Tax Fees. The aggregate fees billed in the Reporting Periods for professional services rendered by the Auditor for tax compliance, tax advice and tax planning (“Tax Services”) were $3,300 in 2010 and $3,300 in 2011. These services consisted of (i) review or preparation of U.S. federal, state, local and excise tax returns; (ii) U.S. federal, state and local tax planning, advice and assistance regarding statutory, regulatory or administrative developments, and (iii) tax advice regarding tax qualification matters and/or treatment of various financial instruments held or
proposed to be acquired or held.
There were no fees billed for tax services by the Auditors to service affiliates during the Reporting Periods that required pre-approval by the Audit Committee.
d) All Other Fees. There were no other fees billed in the Reporting Periods for products and services provided by the Auditor, other than the services reported in paragraphs (a) through (c) of this Item for the Western Asset Global Partners Income Fund Inc.
All Other Fees. There were no other non-audit services rendered by the Auditor to Legg Mason Partners Fund Advisor, LLC (“LMPFA”) and any entity controlling, controlled by or under common control with LMPFA that provided ongoing services to Western Asset Global Partners Income Fund Inc. requiring pre-approval by the Audit Committee in the Reporting Period.
(e) Audit Committee’s pre-approval policies and procedures described in paragraph (c) (7) of Rule 2-01 of Regulation S-X.
(1) The Charter for the Audit Committee (the “Committee”) of the Board of each registered investment company (the “Fund”) advised by LMPFA or one of their affiliates (each, an “Adviser”) requires that the Committee shall approve (a) all audit and permissible non-audit services to be provided to the Fund and (b) all permissible non-audit services to be provided by the Fund’s independent auditors to the Adviser and any Covered Service Providers if the engagement relates directly to the operations and financial reporting of the Fund. The Committee may implement policies and procedures by which such services are approved other than by the full Committee.
The Committee shall not approve non-audit services that the Committee believes may impair the independence of the auditors. As of the date of the approval of this Audit Committee Charter, permissible non-audit services include any professional services (including tax services), that are not prohibited services as described below, provided to the Fund by the independent auditors, other than those provided to the Fund in connection with an audit or a review of the financial statements of the Fund. Permissible non-audit services may not include: (i) bookkeeping or other services related to the accounting records or financial statements of the Fund; (ii) financial information systems design and implementation; (iii) appraisal or valuation services, fairness opinions or contribution-in-kind reports; (iv) actuarial services; (v) internal audit outsourcing services; (vi) management functions or human resources; (vii) broker or dealer, investment adviser or investment banking services; (viii) legal services and expert services unrelated to the audit; and (ix) any other service the Public Company Accounting Oversight Board determines, by regulation, is impermissible.
Pre-approval by the Committee of any permissible non-audit services is not required so long as: (i) the aggregate amount of all such permissible non-audit services provided to the Fund, the Adviser and any service providers controlling, controlled by or under common control with the Adviser that provide ongoing services to the Fund
(“Covered Service Providers”) constitutes not more than 5% of the total amount of revenues paid to the independent auditors during the fiscal year in which the permissible non-audit services are provided to (a) the Fund, (b) the Adviser and (c) any entity controlling, controlled by or under common control with the Adviser that provides ongoing services to the Fund during the fiscal year in which the services are provided that would have to be approved by the Committee; (ii) the permissible non-audit services were not recognized by the Fund at the time of the engagement to be non-audit services; and (iii) such services are promptly brought to the attention of the Committee and approved by the Committee (or its delegate(s)) prior to the completion of the audit.
(2) For the Western Asset Global Partners Income Fund Inc., the percentage of fees that were approved by the audit committee, with respect to: Audit-Related Fees were 100% and 100% for 2010 and 2011; Tax Fees were 100% and 100% for 2010 and 2011; and Other Fees were 100% and 100% for 2010 and 2011.
(f) N/A
(g) Non-audit fees billed by the Auditor for services rendered to Western Asset Global Partners Income Fund Inc., LMPFA and any entity controlling, controlled by, or under common control with LMPFA that provides ongoing services to Western Asset Global Partners Income Fund Inc. during the reporting period were $0 in 2011.
(h) Yes. Western Asset Global Partners Income Fund Inc.’s Audit Committee has considered whether the provision of non-audit services that were rendered to Service Affiliates, which were not pre-approved (not requiring pre-approval), is compatible with maintaining the Accountant’s independence. All services provided by the Auditor to the Western Asset Global Partners Income Fund Inc. or to Service Affiliates, which were required to be pre-approved, were pre-approved as required.
ITEM 5. AUDIT COMMITTEE OF LISTED REGISTRANTS.
a) Registrant has a separately-designated standing Audit Committee established in accordance with Section 3(a)58(A) of the Exchange Act. The Audit Committee consists of the following Board members:
| William R. Hutchinson |
| Paolo M. Cucchi |
| Daniel P. Cronin |
| Carol L. Colman |
| Leslie H. Gelb |
| Dr. Riordan Roett |
| Jeswald W. Salacuse |
b) Not applicable
ITEM 6. SCHEDULE OF INVESTMENTS.
Included herein under Item 1.
ITEM 7. DISCLOSURE OF PROXY VOTING POLICIES AND PROCEDURES FOR CLOSED-END MANAGEMENTINVESTMENT COMPANIES
Proxy Voting Guidelines and Procedures
Legg Mason Partners Fund Advisor, LLC (“LMPFA”) delegates the responsibility for voting proxies for the fund to the subadviser through its contracts with the subadviser. The subadviser will use its own proxy voting policies and procedures to vote proxies. Accordingly, LMPFA does not expect to have proxy-voting responsibility for the fund. Should LMPFA become responsible for voting proxies for any reason, such as the inability of the subadviser to provide investment advisory services, LMPFA shall utilize the proxy voting guidelines established by the most recent subadviser to vote proxies until a new subadviser is retained.
The subadviser’s Proxy Voting Policies and Procedures govern in determining how proxies relating to the fund’s portfolio securities are voted and are provided below. Information regarding how each fund voted proxies (if any) relating to portfolio securities during the most recent 12-month period ended June 30 is available without charge (1) by calling 888-425-6432, (2) on the fund’s website at http://www.leggmason.com/individualinvestors and (3) on the SEC’s website at http://www.sec.gov.
Background
Western Asset Management Company (“WA”), Western Asset Management Company Limited (“WAML”), Western Asset Management Company Ltd (“WAMCL”) and Western Asset Management Company Pte. Ltd. (“WAMC”) (together “Western Asset”) have adopted and implemented policies and procedures that we believe are reasonably designed to ensure that proxies are voted in the best interest of clients, in accordance with our fiduciary duties and SEC Rule 206(4)-6 under the Investment Advisers Act of 1940 (“Advisers Act”). Our authority to vote the proxies of our clients is established through investment management agreements or comparable documents, and our proxy voting guidelines have been tailored to reflect these specific contractual obligations. In addition to SEC requirements governing advisers, our proxy voting policies reflect the long-standing fiduciary standards and responsibilities for ERISA accounts. Unless a manager of ERISA assets has been expressly precluded from voting proxies, the Department of Labor has determined that the responsibility for these votes lies with the Investment Manager.
In exercising its voting authority, Western Asset will not consult or enter into agreements with officers, directors or employees of Legg Mason Inc. or any of its affiliates (except that WA, WAML, WAMCL and WAMC may so consult and agree with each other) regarding the voting of any securities owned by its clients.
Policy
Western Asset’s proxy voting procedures are designed and implemented in a way that is reasonably expected to ensure that proxy matters are handled in the best interest of our clients. While the guidelines included in the procedures are intended to provide a benchmark for voting standards, each vote is ultimately cast on a case-by-case basis, taking into consideration Western Asset’s contractual obligations to our clients and all other relevant facts and circumstances at the time of the vote (such that these guidelines may be overridden to the extent Western Asset deems appropriate).
Procedures
Responsibility and Oversight
The Western Asset Compliance Department (“Compliance Department”) is responsible for administering and overseeing the proxy voting process. The gathering of proxies is coordinated through the Corporate Actions area of Investment Support (“Corporate Actions”). Research analysts and portfolio managers are responsible for determining appropriate voting positions on each proxy utilizing any applicable guidelines contained in these procedures.
Client Authority
Prior to August 1, 2003, all existing client investment management agreements (“IMAs”) will be reviewed to determine whether Western Asset has authority to vote client proxies. At account start-up, or upon amendment of an IMA, the applicable client IMA are similarly reviewed. If an agreement is silent on proxy voting, but contains an overall delegation of discretionary authority or if the account represents assets of an ERISA plan, Western Asset will assume responsibility for proxy voting. The Client Account Transition Team maintains a matrix of proxy voting authority.
Proxy Gathering
Registered owners of record, client custodians, client banks and trustees (“Proxy Recipients”) that receive proxy materials on behalf of clients should forward them to Corporate Actions. Prior to August 1, 2003, Proxy Recipients of existing clients will be reminded of the appropriate routing to Corporate Actions for proxy materials received and reminded of their responsibility to forward all proxy materials on a timely basis. Proxy Recipients for new clients (or, if Western Asset becomes aware that the applicable Proxy Recipient for an existing client has changed, the Proxy Recipient for the existing client) are notified at start-up of appropriate routing to Corporate Actions of proxy materials received and reminded of their responsibility to forward all proxy materials on a timely basis. If Western Asset personnel other than Corporate Actions receive proxy materials, they should promptly forward the materials to Corporate Actions.
Proxy Voting
Once proxy materials are received by Corporate Actions, they are forwarded to the Compliance Department for coordination and the following actions:
a. Proxies are reviewed to determine accounts impacted.
b. Impacted accounts are checked to confirm Western Asset voting authority.
c. Compliance Department staff reviews proxy issues to determine any material conflicts of interest. (See conflicts of interest section of these procedures for further information on determining material conflicts of interest.)
d. If a material conflict of interest exists, (i) to the extent reasonably practicable and permitted by applicable law, the client is promptly notified, the conflict is disclosed and Western Asset obtains the client’s proxy voting instructions, and (ii) to the extent that it is not reasonably practicable or permitted by applicable law to notify the client and obtain such instructions (e.g., the client is a mutual fund or other commingled vehicle or is an ERISA plan client), Western Asset seeks voting instructions from an independent third party.
e. Compliance Department staff provides proxy material to the appropriate research analyst or portfolio manager to obtain their recommended vote. Research analysts and portfolio managers determine votes on a case-by-case basis taking into account the voting guidelines contained in these procedures. For avoidance of doubt, depending on the best interest of each individual client, Western Asset may vote the same proxy differently for different clients. The analyst’s or portfolio manager’s basis for their decision is documented and maintained by the Compliance Department.
f. Compliance Department staff votes the proxy pursuant to the instructions received in (d) or (e) and returns the voted proxy as indicated in the proxy materials.
Timing
Western Asset personnel act in such a manner to ensure that, absent special circumstances, the proxy gathering and proxy voting steps noted above can be completed before the applicable deadline for returning proxy votes.
Recordkeeping
Western Asset maintains records of proxies voted pursuant to Section 204-2 of the Advisers Act and ERISA DOL Bulletin 94-2. These records include:
a. A copy of Western Asset’s policies and procedures.
b. Copies of proxy statements received regarding client securities.
c. A copy of any document created by Western Asset that was material to making a decision how to vote proxies.
d. Each written client request for proxy voting records and Western Asset’s written response to both verbal and written client requests.
e. A proxy log including:
1. Issuer name;
2. Exchange ticker symbol of the issuer’s shares to be voted;
3. Council on Uniform Securities Identification Procedures (“CUSIP”) number for the shares to be voted;
4. A brief identification of the matter voted on;
5. Whether the matter was proposed by the issuer or by a shareholder of the issuer;
6. Whether a vote was cast on the matter;
7. A record of how the vote was cast; and
8. Whether the vote was cast for or against the recommendation of the issuer’s management team.
Records are maintained in an easily accessible place for five years, the first two in Western Asset’s offices.
Disclosure
Part II of the WA Form ADV, the WAML Form ADV, WAMCL Form ADV and WAMC Form ADV, each, contain a description of Western Asset’s proxy policies. Prior to August 1, 2003, Western Asset will deliver Part II of its revised Form ADV to all existing clients, along with a letter identifying the new disclosure. Clients will be provided a copy of these policies and procedures upon request. In addition, upon request, clients may receive reports on how their proxies have been voted.
Conflicts of Interest
All proxies are reviewed by the Compliance Department for material conflicts of interest. Issues to be reviewed include, but are not limited to:
1. Whether Western Asset (or, to the extent required to be considered by applicable law, its affiliates) manages assets for the company or an employee group of the company or otherwise has an interest in the company;
2. Whether Western Asset or an officer or director of Western Asset or the applicable portfolio manager or analyst responsible for recommending the proxy vote (together, “Voting Persons”) is a close relative of or has a personal or business relationship with an executive, director or person who is a candidate for director of the company or is a participant in a proxy contest; and
3. Whether there is any other business or personal relationship where a Voting Person has a personal interest in the outcome of the matter before shareholders.
Voting Guidelines
Western Asset’s substantive voting decisions turn on the particular facts and circumstances of each proxy vote and are evaluated by the designated research analyst or portfolio manager. The examples outlined below are meant as guidelines to aid in the decision making process.
Guidelines are grouped according to the types of proposals generally presented to shareholders. Part I deals with proposals which have been approved and are recommended by a company’s board of directors; Part II deals with proposals submitted by shareholders for inclusion in proxy statements; Part III addresses issues relating to voting shares of investment companies; and Part IV addresses unique considerations pertaining to foreign issuers.
I. Board Approved Proposals
The vast majority of matters presented to shareholders for a vote involve proposals made by a company itself that have been approved and recommended by its board of directors. In view of the enhanced corporate governance practices currently being implemented in public companies, Western Asset generally votes in support of decisions reached by independent boards of directors. More specific guidelines related to certain board-approved proposals are as follows:
1. Matters relating to the Board of Directors
Western Asset votes proxies for the election of the company’s nominees for directors and for board-approved proposals on other matters relating to the board of directors with the following exceptions:
a. Votes are withheld for the entire board of directors if the board does not have a majority of independent directors or the board does not have nominating, audit and compensation committees composed solely of independent directors.
b. Votes are withheld for any nominee for director who is considered an independent director by the company and who has received compensation from the company other than for service as a director.
c. Votes are withheld for any nominee for director who attends less than 75% of board and committee meetings without valid reasons for absences.
d. Votes are cast on a case-by-case basis in contested elections of directors.
2. Matters relating to Executive Compensation
Western Asset generally favors compensation programs that relate executive compensation to a company’s long-term performance. Votes are cast on a case-by-case basis on board-approved proposals relating to executive compensation, except as follows:
a. Except where the firm is otherwise withholding votes for the entire board of directors, Western Asset votes for stock option plans that will result in a minimal annual dilution.
b. Western Asset votes against stock option plans or proposals that permit replacing or repricing of underwater options.
c. Western Asset votes against stock option plans that permit issuance of options with an exercise price below the stock’s current market price.
d. Except where the firm is otherwise withholding votes for the entire board of directors, Western Asset votes for employee stock purchase plans that limit the discount for shares purchased under the plan to no more than 15% of their market value, have an offering period of 27 months or less and result in dilution of 10% or less.
3. Matters relating to Capitalization
The management of a company’s capital structure involves a number of important issues, including cash flows, financing needs and market conditions that are unique to the circumstances of each company. As a result, Western Asset votes on a case-by-case basis on board-approved proposals involving changes to a company’s capitalization except where Western Asset is otherwise withholding votes for the entire board of directors.
a. Western Asset votes for proposals relating to the authorization of additional common stock.
b. Western Asset votes for proposals to effect stock splits (excluding reverse stock splits).
c. Western Asset votes for proposals authorizing share repurchase programs.
4. Matters relating to Acquisitions, Mergers, Reorganizations and Other Transactions
Western Asset votes these issues on a case-by-case basis on board-approved transactions.
5. Matters relating to Anti-Takeover Measures
Western Asset votes against board-approved proposals to adopt anti-takeover measures except as follows:
a. Western Asset votes on a case-by-case basis on proposals to ratify or approve shareholder rights plans.
b. Western Asset votes on a case-by-case basis on proposals to adopt fair price provisions.
6. Other Business Matters
Western Asset votes for board-approved proposals approving such routine business matters such as changing the company’s name, ratifying the appointment of auditors and procedural matters relating to the shareholder meeting.
a. Western Asset votes on a case-by-case basis on proposals to amend a company’s charter or bylaws.
b. Western Asset votes against authorization to transact other unidentified, substantive business at the meeting.
II. Shareholder Proposals
SEC regulations permit shareholders to submit proposals for inclusion in a company’s proxy statement. These proposals generally seek to change some aspect of a company’s corporate governance structure or to change some aspect of its business operations. Western Asset votes in accordance with the recommendation of the company’s board of directors on all shareholder proposals, except as follows:
1. Western Asset votes for shareholder proposals to require shareholder approval of shareholder rights plans.
2. Western Asset votes for shareholder proposals that are consistent with Western Asset’s proxy voting guidelines for board-approved proposals.
3. Western Asset votes on a case-by-case basis on other shareholder proposals where the firm is otherwise withholding votes for the entire board of directors.
III. Voting Shares of Investment Companies
Western Asset may utilize shares of open or closed-end investment companies to implement its investment strategies. Shareholder votes for investment companies that fall within the categories listed in Parts I and II above are voted in accordance with those guidelines.
1. Western Asset votes on a case-by-case basis on proposals relating to changes in the investment objectives of an investment company taking into account the original intent of the fund and the role the fund plays in the clients’ portfolios.
2. Western Asset votes on a case-by-case basis all proposals that would result in increases in expenses (e.g., proposals to adopt 12b-1 plans, alter investment advisory arrangements or approve fund mergers) taking into account comparable expenses for similar funds and the services to be provided.
IV. Voting Shares of Foreign Issuers
In the event Western Asset is required to vote on securities held in foreign issuers — i.e. issuers that are incorporated under the laws of a foreign jurisdiction and that are not listed on a U.S. securities exchange or the NASDAQ stock market, the following guidelines are used, which are premised on the existence of a sound corporate governance and disclosure framework. These guidelines, however, may not be appropriate under some circumstances for foreign issuers and therefore apply only where applicable.
1. Western Asset votes for shareholder proposals calling for a majority of the directors to be independent of management.
2. Western Asset votes for shareholder proposals seeking to increase the independence of board nominating, audit and compensation committees.
3. Western Asset votes for shareholder proposals that implement corporate governance standards similar to those established under U.S. federal law and the listing requirements of U.S. stock exchanges, and that do not otherwise violate the laws of the jurisdiction under which the company is incorporated.
4. Western Asset votes on a case-by-case basis on proposals relating to (1) the issuance of common stock in excess of 20% of a company’s outstanding common stock where shareholders do not have preemptive rights, or (2) the issuance of common stock in excess of 100% of a company’s outstanding common stock where shareholders have preemptive rights.
ITEM 8. PORTFOLIO MANAGERS OF CLOSED-END MANAGEMENT INVESTMENT COMPANIES.
(a)(1):
NAME AND
ADDRESS | | LENGTH OF
TIME SERVED | | PRINCIPAL OCCUPATION(S) DURING
PAST 5 YEARS |
| | | | |
S. Kenneth Leech Western Asset
385 East Colorado Blvd. Pasadena, CA 91101 | | Since 2006 | | Co-portfolio manager of the fund; Chief Investment Officer of Western Asset from 1998 to 2008; Senior Advisor/Chief Investment Officer Emeritus of Western Asset. |
| | | | |
Stephen A. Walsh Western Asset
385 East Colorado Blvd. Pasadena, CA 91101
| | Since 2006 | | Co-portfolio manager of the fund; Deputy Chief Investment Officer of Western Asset from 2000 to 2008; Chief Investment Officer of Western Asset since 2008. |
| | | | |
Keith J. Gardner Western Asset
385 East Colorado Blvd. Pasadena, CA 91101 | | Since 2006 | | Co-portfolio manager of the fund; portfolio manager and research analyst at Western Asset since 1994. |
Michael C. Buchanan Western Asset 385 East Colorado Blvd. Pasadena, CA 91101 | | Since 2006 | | Co-portfolio manager of the fund; Managing Director and head of U.S. Credit Products from 2003-2005 at Credit Suisse Asset Management |
| | | | |
Ryan K. Brist Western Asset 385 East Colorado Blvd. Pasadena, CA 91101 | | Since 2010 | | Co-portfolio manager of the fund; Head of U.S. Investment Grade Credit of Western Asset since 2009; Chief Investment Officer and Portfolio Manager at Logan Circle Partners, L.P. from 2007-2009; Co-Chief Investment Officer and Senior Portfolio Manager at Delaware Investment Advisors from 2000-2007 |
(a)(2): DATA TO BE PROVIDED BY FINANCIAL CONTROL
The following tables set forth certain additional information with respect to the fund’s portfolio managers for the fund. Unless noted otherwise, all information is provided as of August 31, 2011
Other Accounts Managed by Portfolio Managers
The table below identifies the number of accounts (other than the fund) for which the fund’s portfolio managers have day-to-day management responsibilities and the total assets in such accounts, within each of the following categories: registered investment companies, other pooled investment vehicles, and other accounts. For each category, the number of accounts and total assets in the accounts where fees are based on performance is also indicated.
Portfolio
Manager(s) | | Registered
Investment
Companies | | Other Pooled
Investment
Vehicles | | Other
Accounts |
S. Kenneth Leech‡ | | 8 registered investment companies with $1.7 billion in total assets under management | | 12 Other pooled investment vehicles with $2.0 billion in assets under management | | 37 Other accounts with $13.7 in total assets under management* |
| | | | | | |
Stephen A. Walsh‡ | | 99 registered investment companies with $153.0 billion in total assets under management | | 213 Other pooled investment vehicles with $113.7 billion in assets under management** | | 746 Other accounts with $180.0 billion in total assets under management*** |
Keith J. Gardner‡ | | 40 registered investment companies with $27.1 billion in total assets under management | | 6 Other pooled investment vehicles with $2.5 billion in assets under management | | 2 Other accounts with $0.5 billion in total assets under management |
| | | | | | |
Michael C. Buchanan‡ | | 46 registered investment Companies with $30.7 billion in total assets Under management | | 8 Other pooled investment vehicles with $4.6 billion in assets under management | | 13 Other accounts with $2.0 billion in total assets under management |
| | | | | | |
Ryan K. Brist‡ | | 12 registered investment Companies with $3.1 billion in total assets Under management | | 4 Other pooled investment vehicles with $7.0 billion in assets under management**** | | 21 Other accounts with $4.9 billion in total assets under management+ |
* | | Includes 7 accounts managed, totaling $2.4 billion, for which advisory fee is performance based. |
** | | Includes 6 accounts managed, totaling $0.9 billion, for which advisory fee is performance based. |
*** | | Includes 79 accounts managed, totaling $20.1 billion, for which advisory fee is performance based. |
**** | | Includes 1 account managed, totaling $0.5 million, for which advisory fee is performance based. |
+ | | Includes 2 accounts managed, totaling $0.3 billion, for which advisory fee is performance based. |
‡ The numbers above reflect the overall number of portfolios managed by employees of Western Asset Management Company (“Western Asset”). Mr. Leech and Mr. Walsh are involved in the management of all the Firm’s portfolios, but they are not solely responsible for particular portfolios. Western Asset’s investment discipline emphasizes a team approach that combines the efforts of groups of specialists working in different market sectors. They are responsible for overseeing implementation of Western Asset’s overall investment ideas and coordinating the work of the various sector teams. This structure ensures that client portfolios benefit from a consensus that draws on the expertise of all team members.
(a)(3): Portfolio Manager Compensation
With respect to the compensation of the portfolio managers, Western Asset’s compensation system assigns each employee a total compensation range, which is derived from annual market surveys that benchmark each role with its job function and peer universe. This method is designed to reward employees with total compensation reflective of the external market value of their skills, experience, and ability to produce desired results. Standard compensation includes competitive base salaries, generous employee benefits, and a retirement plan.
In addition, the subadviser’s employees are eligible for bonuses. These are structured to closely align the interests of employees with those of the subadviser, and are determined by the professional’s job function and pre-tax performance as measured by a formal review process. All bonuses are completely discretionary. The principal factor considered is a portfolio manager’s investment performance versus appropriate peer groups and benchmarks (e.g., a securities index and with respect to a fund, the benchmark set forth in the fund’s Prospectus to which the fund’s average annual total returns are compared or, if none, the benchmark set forth in the fund’s annual report). Performance is reviewed on a 1, 3 and 5 year basis for compensation—with 3 years having the most emphasis. The subadviser may also measure a portfolio manager’s pre-tax investment performance against other benchmarks, as it determines appropriate. Because portfolio managers are generally responsible for multiple accounts (including the funds) with similar investment strategies, they are generally compensated on the performance of the aggregate group of similar accounts, rather than a specific account. Other factors that may be considered when making bonus decisions include client service, business development, length of service to the subadviser, management or supervisory
responsibilities, contributions to developing business strategy and overall contributions to the subadviser’s business.
Finally, in order to attract and retain top talent, all professionals are eligible for additional incentives in recognition of outstanding performance. These are determined based upon the factors described above and include Legg Mason stock options and long-term incentives that vest over a set period of time past the award date.
Potential Conflicts of Interest
Conflicts of Interest
The manager, subadvisers and portfolio managers have interests which conflict with the interests of the fund. There is no guarantee that the policies and procedures adopted by the manager, the subadvisers and the fund will be able to identify or mitigate these conflicts of interest.
Some examples of material conflicts of interest include:
Allocation of Limited Time and Attention. A portfolio manager who is responsible for managing multiple funds and/or accounts may devote unequal time and attention to the management of those funds and/or accounts. A portfolio manager may not be able to formulate as complete a strategy or identify equally attractive investment opportunities for each of those funds and accounts as might be the case if he or she were to devote substantially more attention to the management of a single fund. Such a portfolio manager may make general determinations across multiple funds, rather than tailoring a unique approach for each fund. The effects of this conflict may be more pronounced where funds and/or accounts overseen by a particular portfolio manager have different investment strategies.
Allocation of Limited Investment Opportunities; Aggregation of Orders. If a portfolio manager identifies a limited investment opportunity that may be suitable for multiple funds and/or accounts, the opportunity may be allocated among these several funds or accounts, which may limit the fund’s ability to take full advantage of the investment opportunity. Additionally, a subadviser may aggregate transaction orders for multiple accounts for purpose of execution. Such aggregation may cause the price or brokerage costs to be less favorable to a particular client than if similar transactions were not being executed concurrently for other accounts. In addition, a subadviser’s trade allocation policies may result in the fund’s orders not being fully executed or being delayed in execution.
Pursuit of Differing Strategies. At times, a portfolio manager may determine that an investment opportunity may be appropriate for only some of the funds and/or accounts for which he or she exercises investment responsibility, or may decide that certain of the funds and/or accounts should take differing positions with respect to a particular security. In these cases, the portfolio manager may place separate transactions for one or more funds or accounts which may affect the market price of the security or the execution of the transaction, or both, to the detriment or benefit of one or more other funds and/or accounts. For example, a portfolio manager may determine that it would be in the interest of another account to sell a security that the fund holds long, potentially resulting in a decrease in the market value of the security held by the fund.
Cross Trades. Portfolio managers may manage funds that engage in cross trades, where one of the manager’s funds or accounts sells a particular security to another fund or account managed by the same manager. Cross trades may pose conflicts of interest because of, for example, the possibility that one account sells a security to another account at a higher price than an independent third party would pay or otherwise enters into a transaction that it would not enter into with an independent party, such as the sale of a difficult-to-obtain security.
Selection of Broker/Dealers. Portfolio managers may select or influence the selection of the brokers and dealers that are used to execute securities transactions for the funds and/or accounts that they supervise. In
addition to executing trades, some brokers and dealers provide subadvisers with brokerage and research services, These services may be taken into account in the selection of brokers and dealers whether a broker is being selected to effect a trade on an agency basis for a commission or (as is normally the case for the funds) whether a dealer is being selected to effect a trade on a principal basis. This may result in the payment of higher brokerage fees and/or execution at a less favorable price than might have otherwise been available. The services obtained may ultimately be more beneficial to certain of the manager’s funds or accounts than to others (but not necessarily to the funds that pay the increased commission or incur the less favorable execution). A decision as to the selection of brokers and dealers could therefore yield disproportionate costs and benefits among the funds and/or accounts managed.
Variation in Financial and Other Benefits. A conflict of interest arises where the financial or other benefits available to a portfolio manager differ among the funds and/or accounts that he or she manages. If the amount or structure of the investment manager’s management fee and/or a portfolio manager’s compensation differs among funds and/or accounts (such as where certain funds or accounts pay higher management fees or performance-based management fees), the portfolio manager might be motivated to help certain funds and/or accounts over others. Similarly, the desire to maintain assets under management or to enhance the portfolio manager’s performance record or to derive other rewards, financial or otherwise, could influence the portfolio manager in affording preferential treatment to those funds and/or accounts that could most significantly benefit the portfolio manager. A portfolio manager may, for example, have an incentive to allocate favorable or limited opportunity investments or structure the timing of investments to favor such funds and/or accounts. Also, a portfolio manager’s or the manager’s or a subadviser’s desire to increase assets under management could influence the portfolio manager to keep a fund open for new investors without regard to potential benefits of closing the fund to new investors. Additionally, the portfolio manager might be motivated to favor funds and/or accounts in which he or she has an ownership interest or in which the investment manager and/or its affiliates have ownership interests. Conversely, if a portfolio manager does not personally hold an investment in the fund, the portfolio manager’s conflicts of interest with respect to the fund may be more acute.
Related Business Opportunities. The investment manager or its affiliates may provide more services (such as distribution or recordkeeping) for some types of funds or accounts than for others. In such cases, a portfolio manager may benefit, either directly or indirectly, by devoting disproportionate attention to the management of funds and/or accounts that provide greater overall returns to the investment manager and its affiliates.
(a)(4): Portfolio Manager Securities Ownership
The table below identifies the dollar range of securities beneficially owned by each portfolio managers as of August 31, 2011.
Portfolio Manager(s) | | Dollar Range of
Portfolio
Securities
Beneficially
Owned |
S. Kenneth Leech | | A |
Stephen A. Walsh | | A |
Keith J. Gardner | | A |
Michael C. Buchanan | | A |
Ryan K. Brist | | A |
Dollar Range ownership is as follows: |
A: none |
B: $1 - $10,000 |
C: 10,001 - $50,000 |
D: $50,001 - $100,000 |
E: $100,001 - $500,000 |
F: $500,001 - $1 million |
G: over $1 million |
ITEM 9. PURCHASES OF EQUITY SECURITIES BY CLOSED-END MANAGEMENT INVESTMENT COMPANY AND AFFILIATED PURCHASERS.
NONE.
ITEM 10. SUBMISSION OF MATTERS TO A VOTE OF SECURITY HOLDERS.
NONE.
ITEM 11. CONTROLS AND PROCEDURES.
(a) The registrant’s principal executive officer and principal financial officer have concluded that the registrant’s disclosure controls and procedures (as defined in Rule 30a- 3(c) under the Investment Company Act of 1940, as amended (the “1940 Act”)) are effective as of a date within 90 days of the filing date of this report that includes the disclosure required by this paragraph, based on their evaluation of the disclosure controls and procedures required by Rule 30a-3(b) under the 1940 Act and 15d-15(b) under the Securities Exchange Act of 1934.
(b) There were no changes in the registrant’s internal control over financial reporting (as defined in Rule 30a-3(d) under the 1940 Act) that occurred during the registrant’s last fiscal half-year (the registrant’s second fiscal half-year in the case of an annual report) that have materially affected, or are likely to materially affect the registrant’s internal control over financial reporting.
ITEM 12. EXHIBITS.
(a) (1) Code of Ethics attached hereto.
Exhibit 99.CODE ETH
(a) (2) Certifications pursuant to section 302 of the Sarbanes-Oxley Act of 2002 attached hereto.
Exhibit 99.CERT
(b) Certifications pursuant to Section 906 of the Sarbanes-Oxley Act of 2002 attached hereto.
Exhibit 99.906CERT
SIGNATURES
Pursuant to the requirements of the Securities Exchange Act of 1934 and the Investment Company Act of 1940, the registrant has duly caused this Report to be signed on its behalf by the undersigned, there unto duly authorized.
Western Asset Global Partners Income Fund Inc.
By: | /s/ R. Jay Gerken | |
| R. Jay Gerken | |
| Chief Executive Officer of | |
| Western Asset Global Partners Income Fund Inc. | |
| | |
| | |
Date: | October 26, 2011 | |
Pursuant to the requirements of the Securities Exchange Act of 1934 and the Investment Company Act of 1940, this report has been signed below by the following persons on behalf of the registrant and in the capacities and on the dates indicated.
By: | /s/ R. Jay Gerken | |
| R. Jay Gerken | |
| Chief Executive Officer of | |
| Western Asset Global Partners Income Fund Inc. | |
| | |
| | |
Date: | October 26, 2011 | |
By: | /s/ Kaprel Ozsolak | |
| Kaprel Ozsolak | |
| Chief Financial Officer of | |
| Western Asset Global Partners Income Fund Inc. | |
| | |
Date: | October 26, 2011 | |